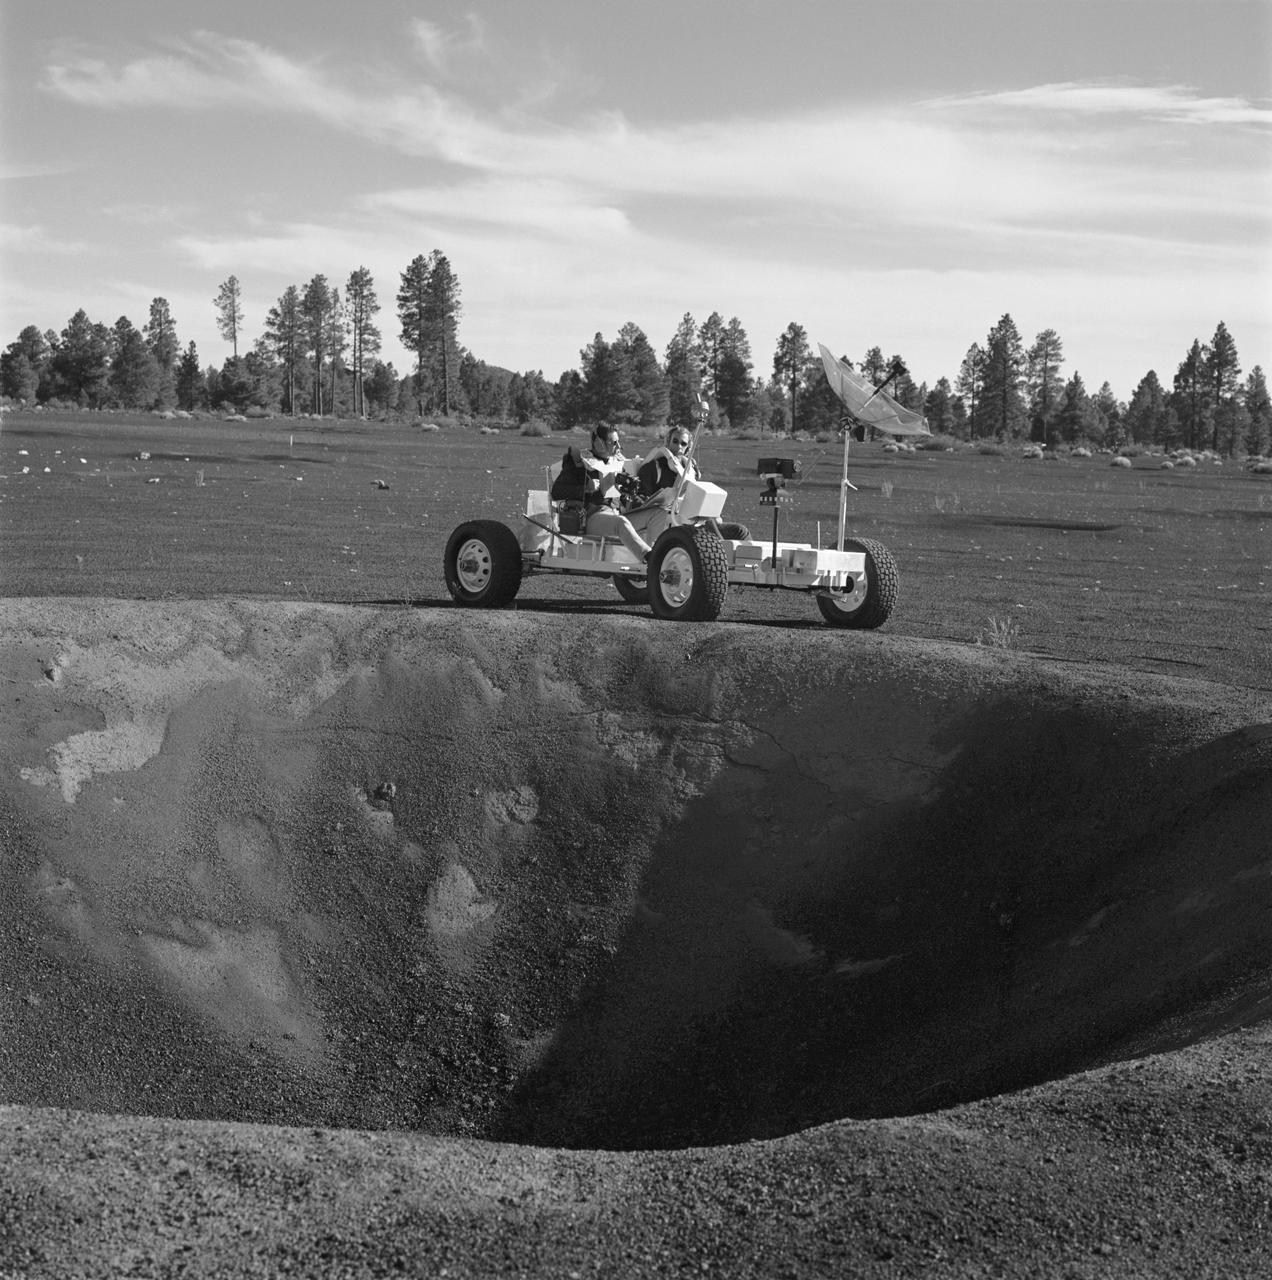
S70-53300 (2-3 Nov. 1970) --- Two Apollo 15 crew members, riding a Lunar Roving Vehicle (LRV) simulator, participate in geology training at the Cinder Lake crater field in Arizona. Astronaut David R. Scott, Apollo 15 commander, seated on the left; and to Scott's right is astronaut James B. Irwin, lunar module pilot. They have stopped at the rim of a 30-feet deep crater to look over the terrain. The simulator, called "Grover", was built by the United States Geological Survey.
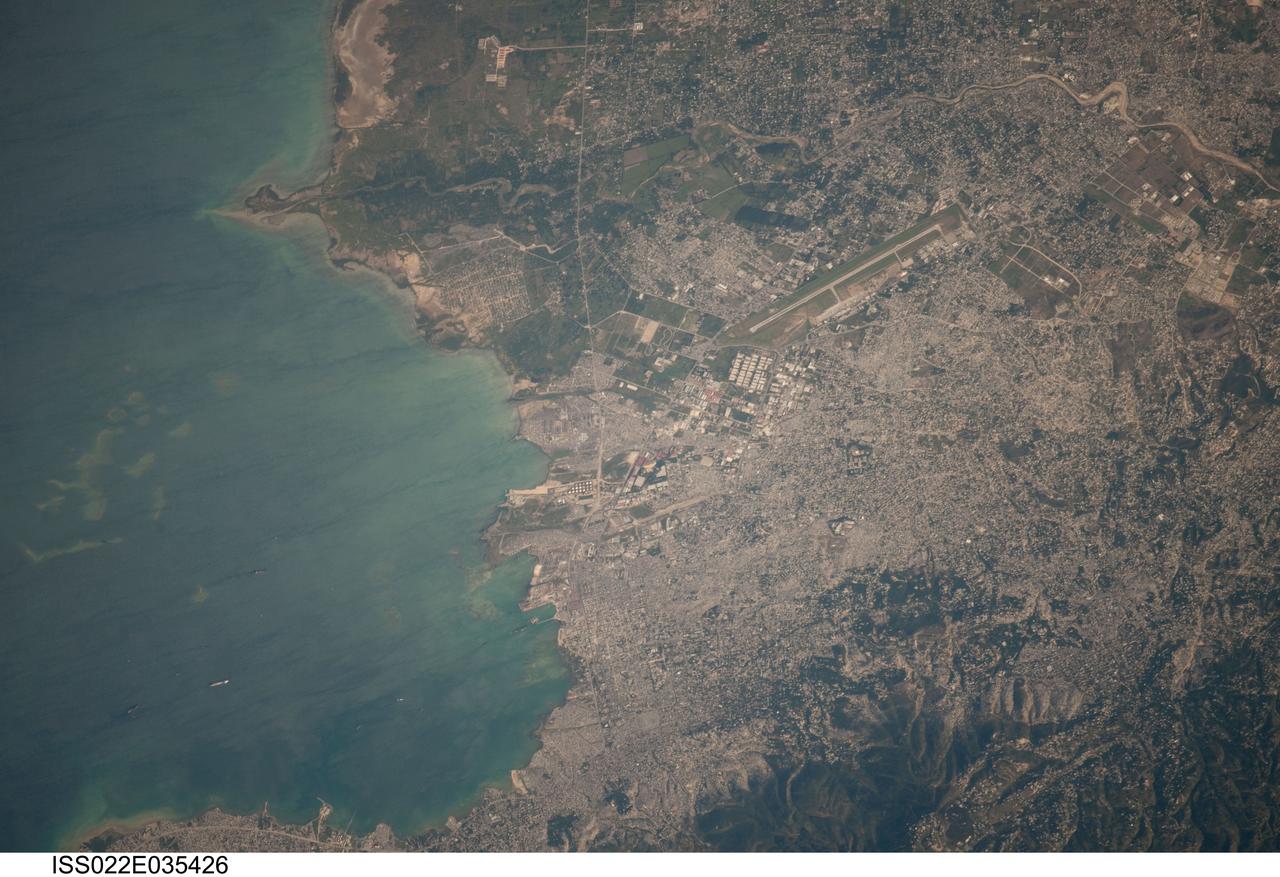
ISS022-E-035426 (22 Jan. 2010) --- Photographed from the International Space Station orbiting Earth at an altitude of 211 statute miles, this image of the Port au Prince area of Haiti from Jan. 22 is centered on the area that was heavily damaged by a magnitude 7.0 earthquake on Jan. 12. According to the United States Geological Survey (USGS) Earthquake Center, a number of tremors of varying magnitudes up to 6.0 were recorded in ensuing days. Ships can be easily delineated in the harbor. The single runway of the airport, heavily damaged by the quake, is seen near center of the frame. The airport?s control tower was destroyed and has since been rebuilt and is now in service, thanks to part of the huge world-wide aid offered to the nation

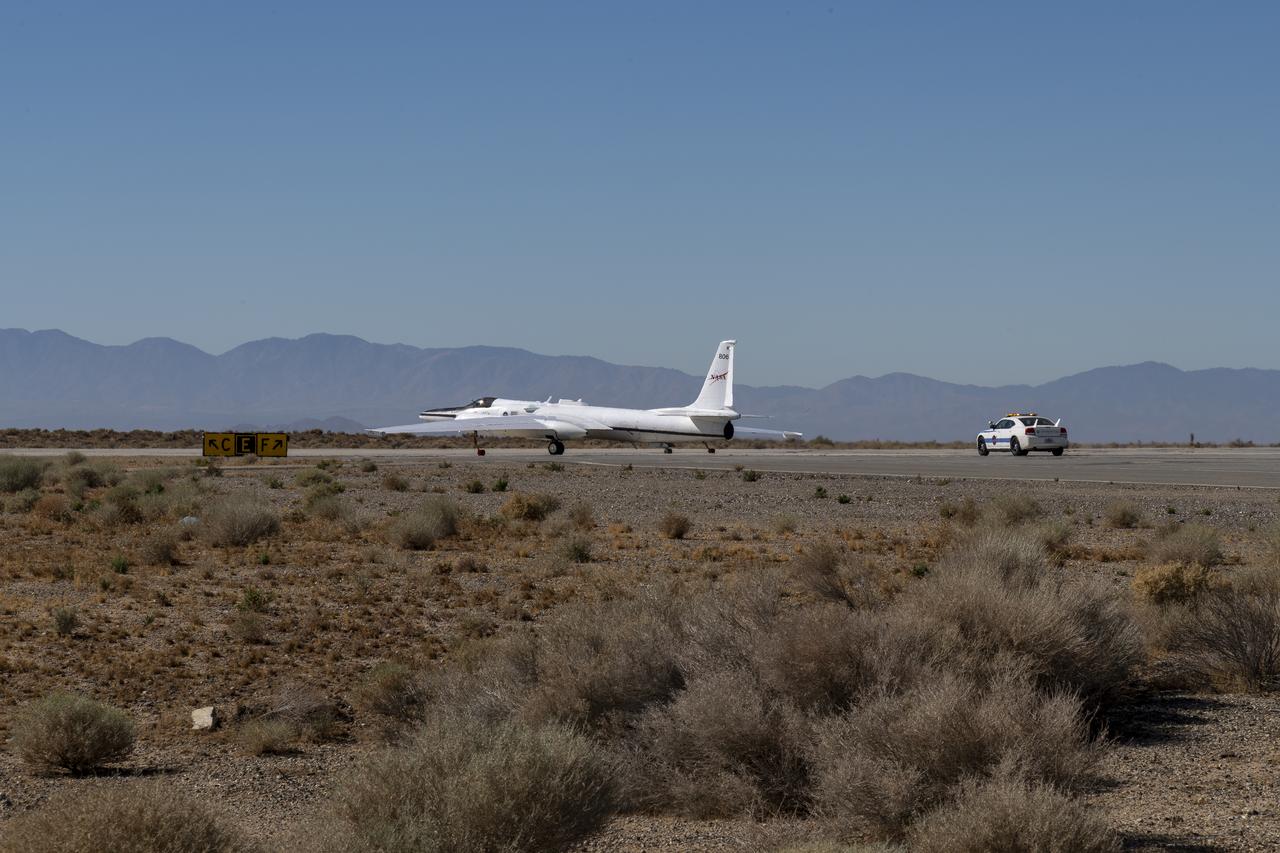
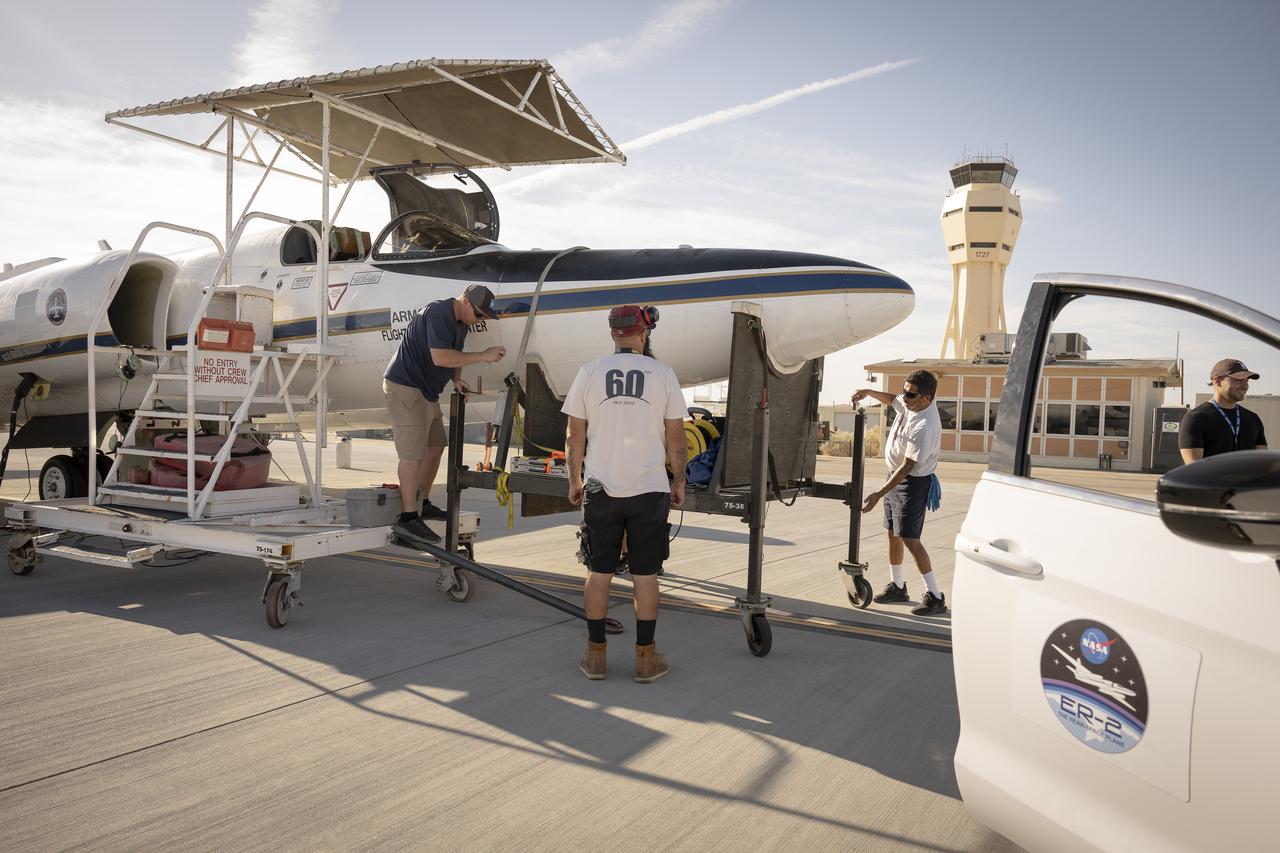
The ER-2 aircraft is parked in a hangar at NASA’s Armstrong Flight Research Center in Edwards, California, in March 2025. The plane is prepared for takeoff to support the airborne Lunar Spectral Irradiance, or air-LUSI, mission.
The ER-2 conducted over 80 flight hours in service of the Plankton, Aerosol, Cloud, ocean Ecosystem Postlaunch Airborne eXperiment (PACE-PAX) mission. The ER-2 is uniquely qualified to conduct the high-altitude scientific flights that this project required, and is based at NASA’s Armstrong Flight Research Center in Edwards, California.

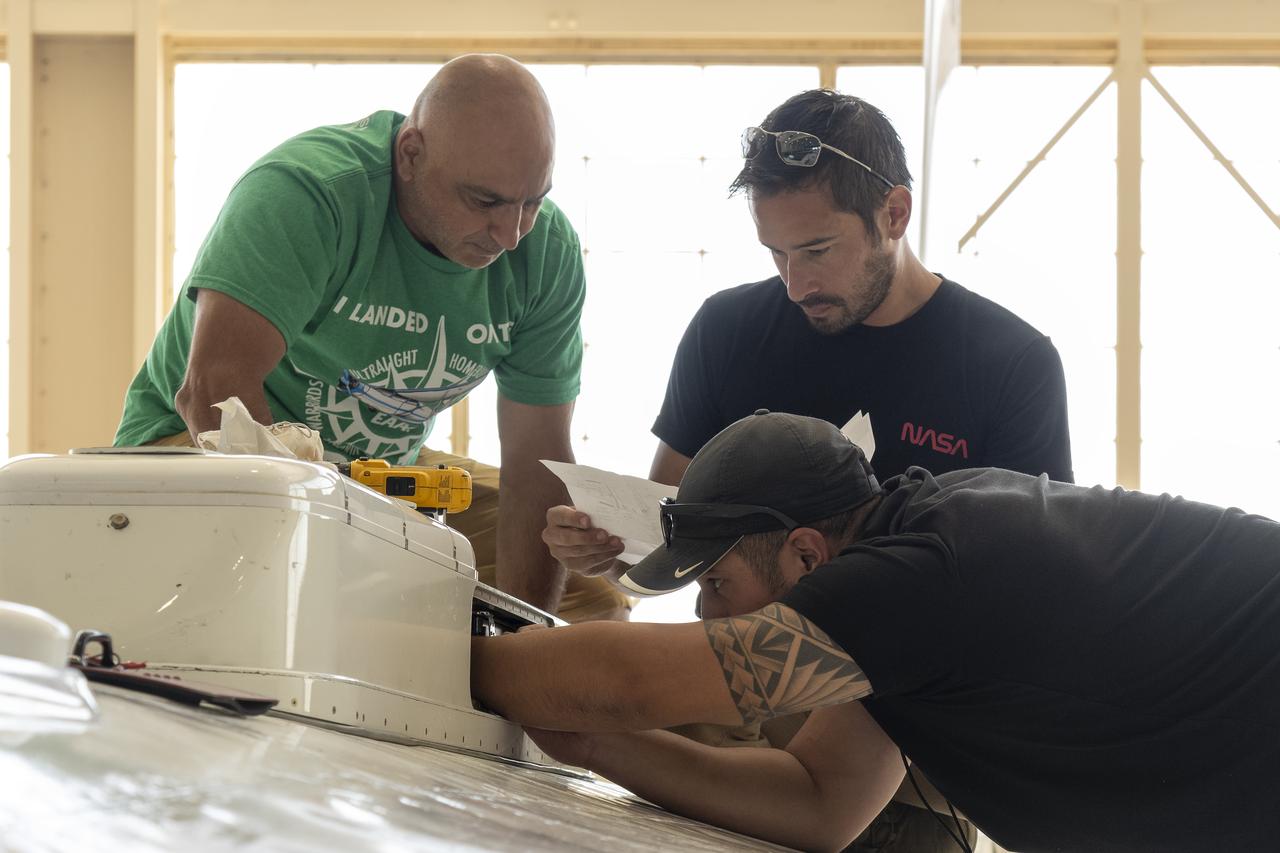
Dr. John Woodward, of the National Institute of Standards and Technology and co-investigator on the airborne Lunar Spectral Irradiance (air-LUSI) mission, prepares the instrument for upload onto the ER-2 aircraft in March 2025 at NASA’s Armstrong Flight Research Center in Edwards, California.

Francisco Rodriguez (aircraft mechanic) services liquid oxygen or LOX on the ER-2 during the Geological Earth Mapping Experiment (GEMx) research project. Experts like Rodriguez sustain a high standard of safety on airborne science aircraft like the ER-2 and science missions like GEMx. The ER-2 is based out of NASA’s Armstrong Flight Research Center in Edwards, California.
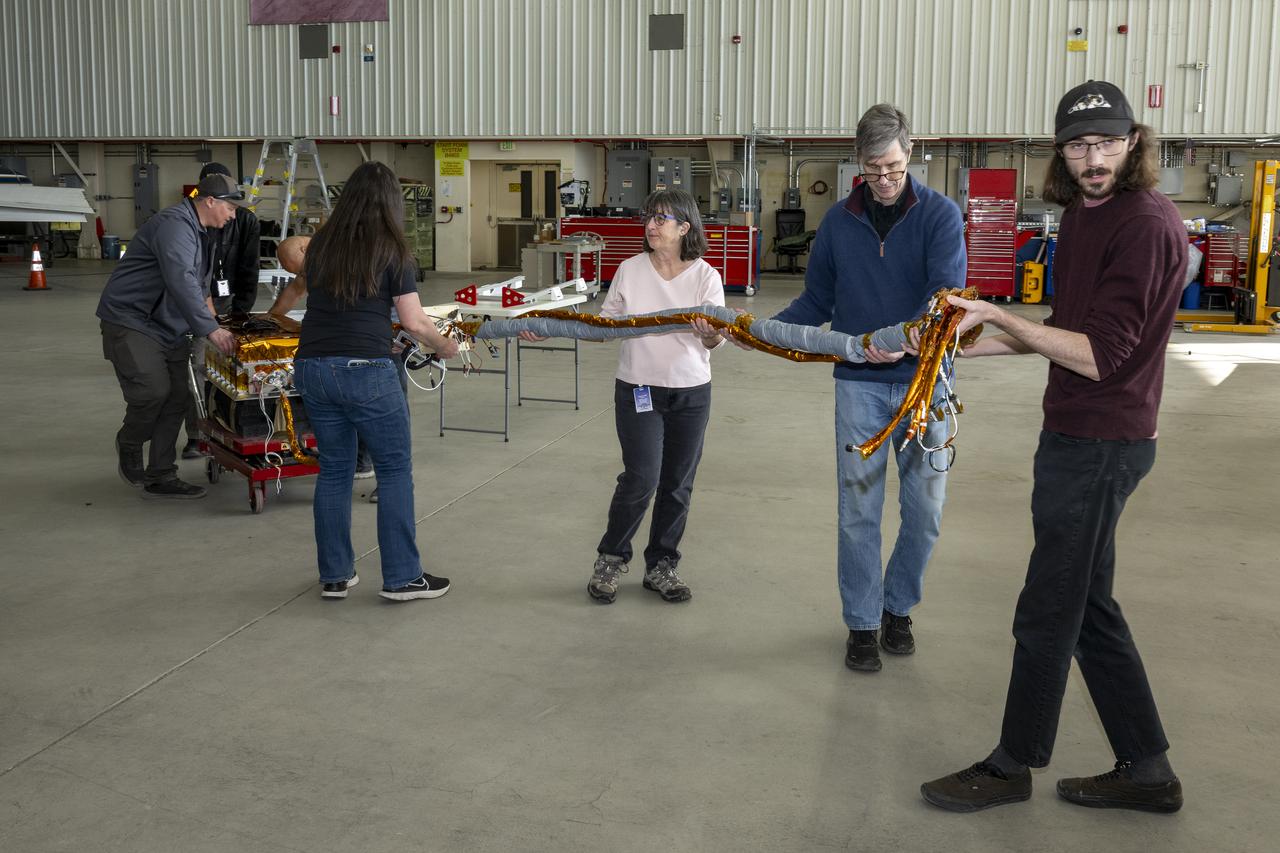
The airborne Lunar Spectral Irradiance (air-LUSI) instrument is moved across the hangar floor by robotic engineer Alexander McCafferty-Leroux ,from right to left, co-investigator Dr. John Woodward, NIST astronomer Dr. Susana Deustua, air-LUSI chief system engineer Dr. Kathleen “Kat” Scanlon, and members of the ER-2 ground crew at NASA’s Armstrong Flight Research Center in Edwards, California, in March 2025.

The ER-2 ground crew Wissam Habbal, left, and Dr. Kevin Turpie, airborne Lunar Spectral Irradiance (air-LUSI) principal investigator, guide delicate fiber optic and electric cabling into place while uploading the air-LUSI instrument onto the ER-2 aircraft in March 2025 at NASA’s Armstrong Flight Research Center in Edwards, California.
Sam Habbal (quality inspector), Darick Alvarez (aircraft mechanic), and Juan Alvarez (crew chief) work on the network “canoe” on top of the ER-2 aircraft, which provides network communication with the pilot onboard. Experts like these sustain a high standard of safety while outfitting instruments onboard science aircraft like the ER-2 and science missions like the Plankton, Aerosol, Cloud, ocean Ecosystem Postlaunch Airborne eXperiment (PACE-PAX) mission. The ER-2 is based out of NASA’s Armstrong Flight Research Center in Edwards, California.

A crew member handles liquid nitrogen servicing for NASA’s Armstrong Flight Research Center’s ER-2 aircraft at Edwards, California, on Thursday, Aug. 21, 2025. Liquid nitrogen is used to support key science instruments for extended flight durations in critical research missions, such as the Geological Earth Mapping Experiment (GEMx), which requires flights of up to eight hours at approximately 65,000 feet altitude.
Ground crew members make final preparations on NASA Armstrong Flight Research Center’s ER-2 aircraft at Edwards, California, on Thursday, Aug. 21, 2025, ahead of a high-altitude mission for the Geological Earth Mapping Experiment (GEMx). The pilot will soon board the aircraft, which can fly at altitudes up to 70,000 feet.

Crew members prepare NASA Armstrong Flight Research Center’s ER-2 aircraft for flight at Edwards, California, on Tuesday, Sept. 23, 2025, in support of the Geological Earth Mapping Experiment (GEMx). The high-altitude science aircraft operates between 20,000 and 70,000 feet. For this mission, pilots flew at approximately 65,000 feet, requiring them to wear specially designed pressure suits.

Crew members prepare NASA Armstrong Flight Research Center’s ER-2 aircraft for flight at Edwards, California, on Tuesday, Sept. 23, 2025, in support of the Geological Earth Mapping Experiment (GEMx). The high-altitude science aircraft operates between 20,000 and 70,000 feet. For this mission, pilots flew at approximately 65,000 feet, requiring them to wear specially designed pressure suits.

Ground crew members make final preparations on NASA Armstrong Flight Research Center’s ER-2 aircraft at Edwards, California, on Thursday, Aug. 21, 2025, ahead of a high-altitude mission for the Geological Earth Mapping Experiment (GEMx). The pilot will soon board the aircraft, which can fly at altitudes up to 70,000 feet.
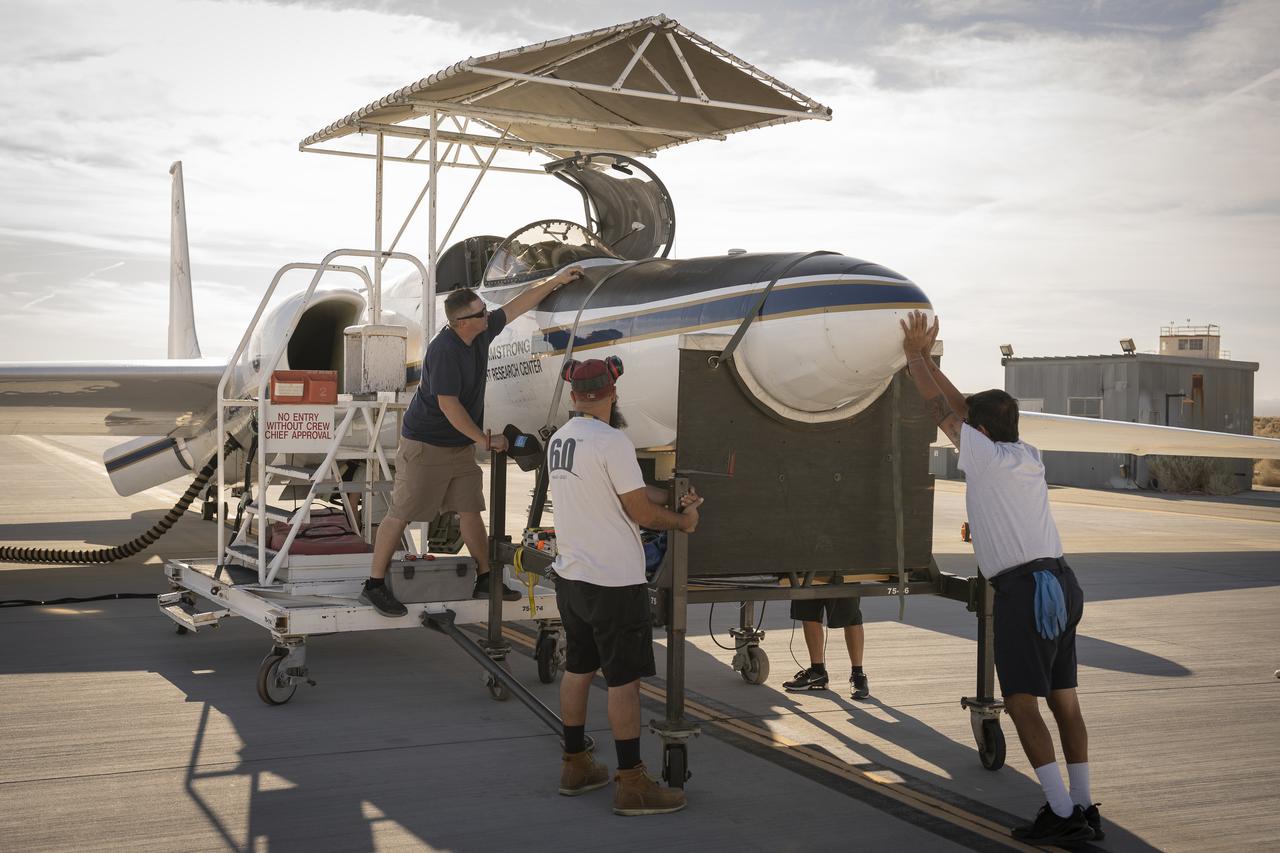
Crew members reattach the nose cone of NASA’s Armstrong Flight Research Center’s ER-2 aircraft at Edwards, California, on Thursday, Aug. 21, 2025, ahead of a mission for the Geological Earth Mapping Experiment (GEMx). The aircraft’s nose houses key science instruments used to collect data during flight.

NASA Armstrong Flight Research Center’s ER-2 aircraft taxis at Edwards, California, on Thursday, Aug. 21, 2025, ahead of a high-altitude mission supporting the Geological Earth Mapping Experiment (GEMx), which requires flights of up to eight hours at approximately 65,000 feet altitude.

Suited up and ready, ER-2 pilot Kirt Stallings waits inside the transport vehicle at Edwards, California, on Thursday, Aug. 21, 2025, moments before boarding NASA’s Armstrong Flight Research Center’s ER-2 aircraft for a high-altitude mission supporting the Geological Earth Mapping Experiment (GEMx). Through the vehicle window, the aircraft can be seen being readied for flight.

From the window of the ER-2 chase car, a crew member gives a thumbs up to the pilot as NASA Armstrong Flight Research Center’s ER-2 aircraft taxis at Edwards, California, on Thursday, Aug. 21, 2025. The gesture signals a final check before takeoff for the high-altitude mission supporting the Geological Earth Mapping Experiment (GEMx).

NASA Armstrong Flight Research Center’s ER-2 aircraft lifts off from Edwards, California, on Tuesday, Sept. 23, 2025, in support of the Geological Earth Mapping Experiment (GEMx). The high-altitude science aircraft operates between 20,000 and 70,000 feet. For this mission, pilots flew at approximately 65,000 feet, requiring them to wear specially designed pressure suits.
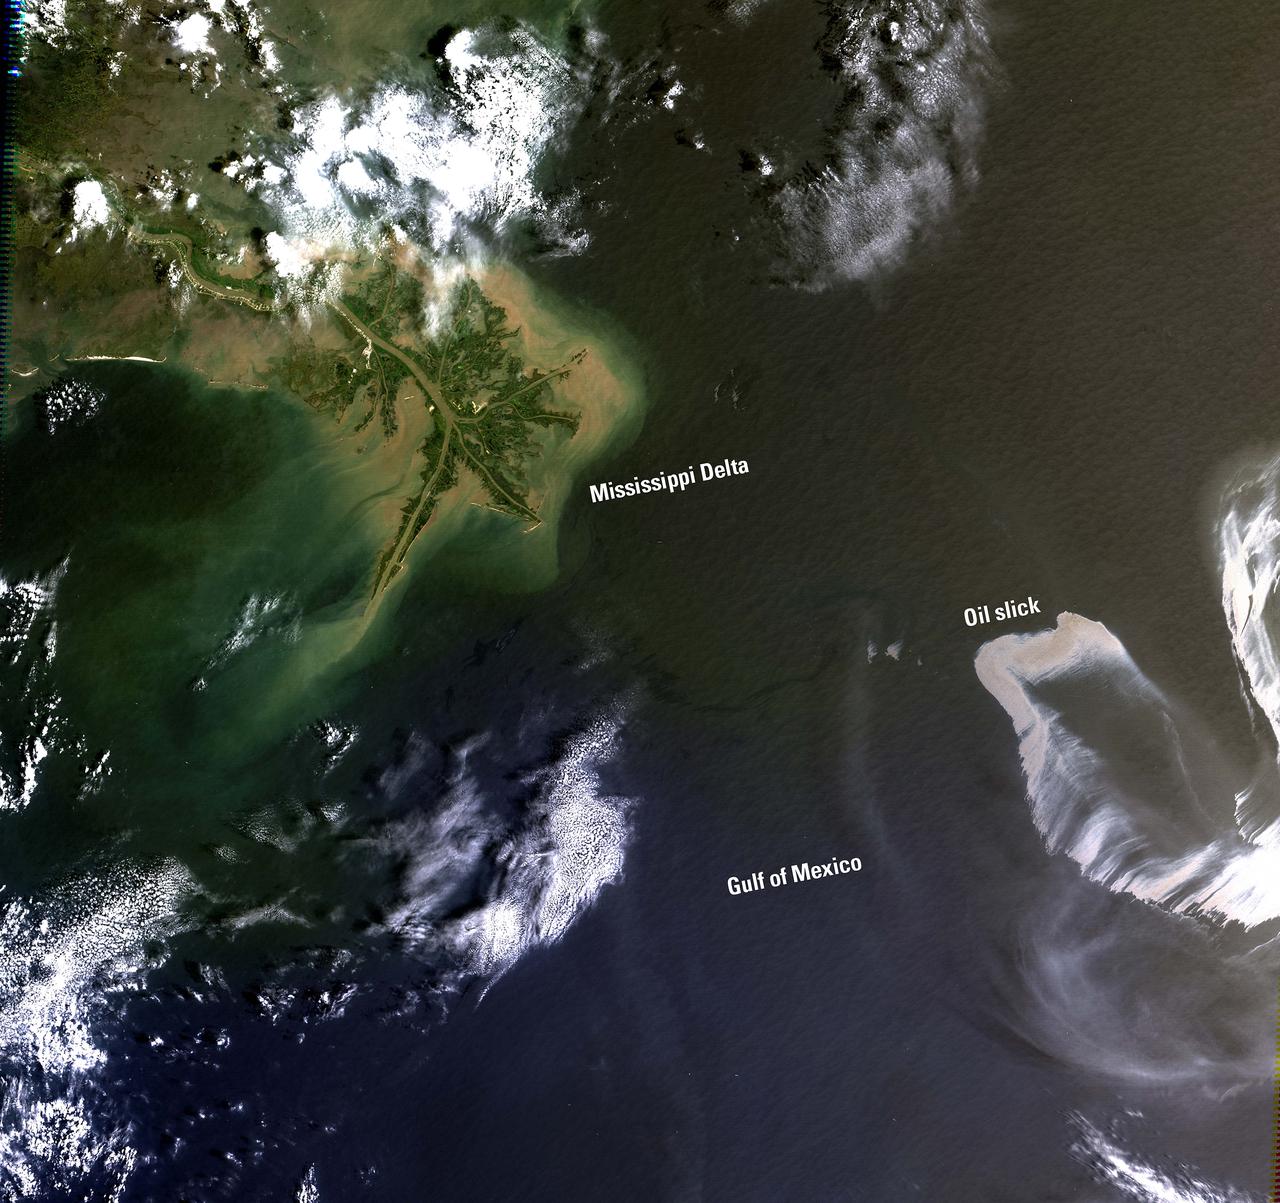
On April 20, 2010, an explosion at an oil well in the Gulf of Mexico resulted in a major oil spill. Since then, emergency response efforts have been underway to contain the growing oil slick before it reaches the southern coast of the United States. Landsat imagery, acquired by the U.S. Geological Survey on May 1 shows the extent of the oil slick. The Landsat data are being used to monitor the extent and movement of the slick. Location: LA, USA Date Taken: May 1 2010 Credit: NASA/GSFC/Landsat <b><a href="http://www.nasa.gov/centers/goddard/home/index.html" rel="nofollow">NASA Goddard Space Flight Center</a></b> enables NASA’s mission through four scientific endeavors: Earth Science, Heliophysics, Solar System Exploration, and Astrophysics. Goddard plays a leading role in NASA’s accomplishments by contributing compelling scientific knowledge to advance the Agency’s mission. <b>Follow us on <a href="http://twitter.com/NASA_GoddardPix" rel="nofollow">Twitter</a></b> <b>Join us on <a href="http://www.facebook.com/pages/Greenbelt-MD/NASA-Goddard/395013845897?ref=tsd" rel="nofollow">Facebook</a></b>
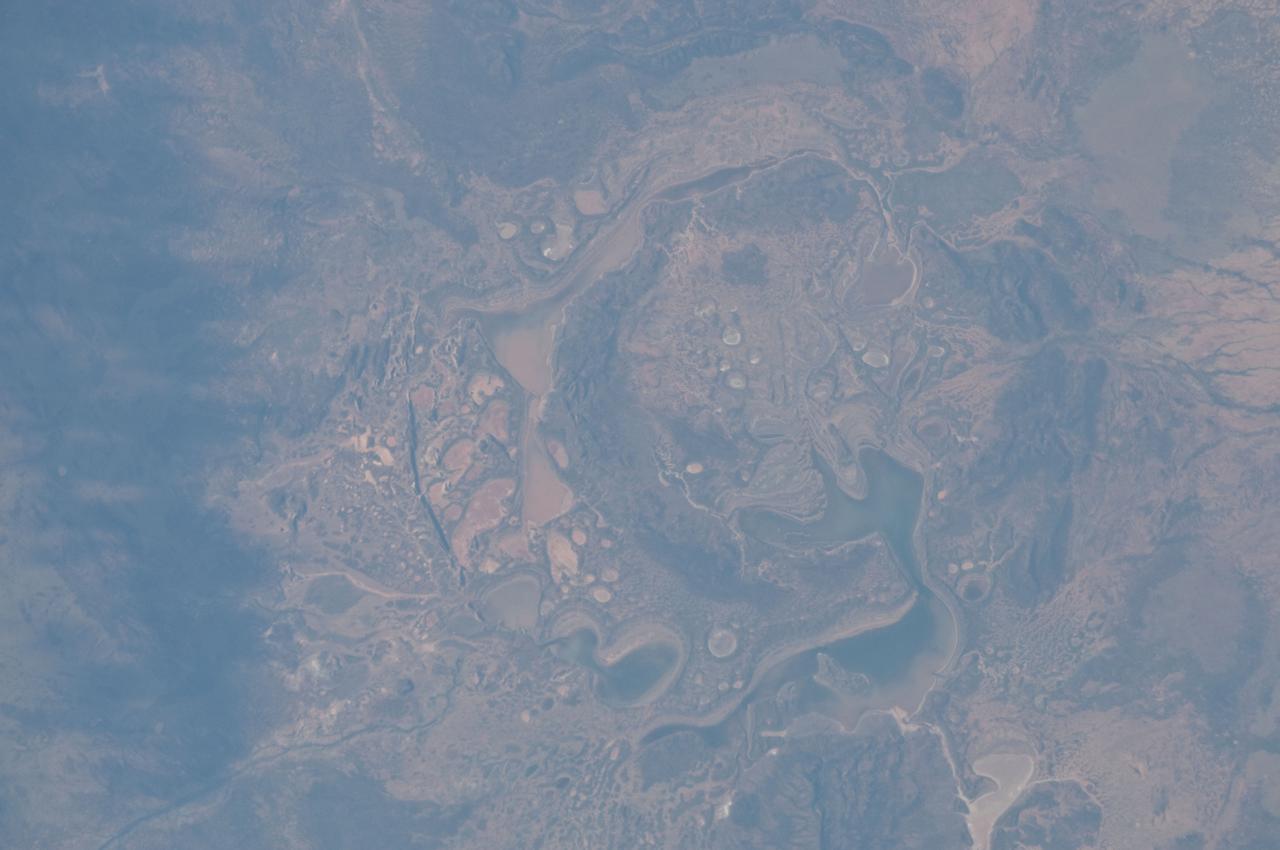
ISS028-E-014782 (6 July 2011) --- The Shoemaker (formerly Teague) Impact Structure, located in Western Australia in a drainage basin south of the Waldburg Range, presents an other-worldly appearance in this detailed photograph recorded from onboard the International Space Station on July 6. The Shoemaker impact site is approximately 30 kilometers in diameter, and is clearly defined by concentric ring structures formed in sedimentary rocks (brown to dark brown, image center) that were deformed by the impact event approximately 1630 million years ago, according to the Earth Impact Database. Several saline and ephemeral lakes?Nabberu, Teague, Shoemaker, and numerous smaller ponds?occupy the land surface between the concentric ring structures. Differences in color result from both water depth and suspended sediments, with some bright salt crusts visible around the edges of smaller ponds (image center The Teague Impact Structure was renamed Shoemaker in honor of the late Dr. Eugene M. Shoemaker, a pioneer in the field of impact crater studies and planetary geology, and founder of the Astrogeology Branch of the United States Geological Survey. The image was recorded with a digital still camera using a 200 mm lens, and is provided by the ISS Crew Earth Observations experiment and Image Science & Analysis Laboratory, Johnson Space Center.
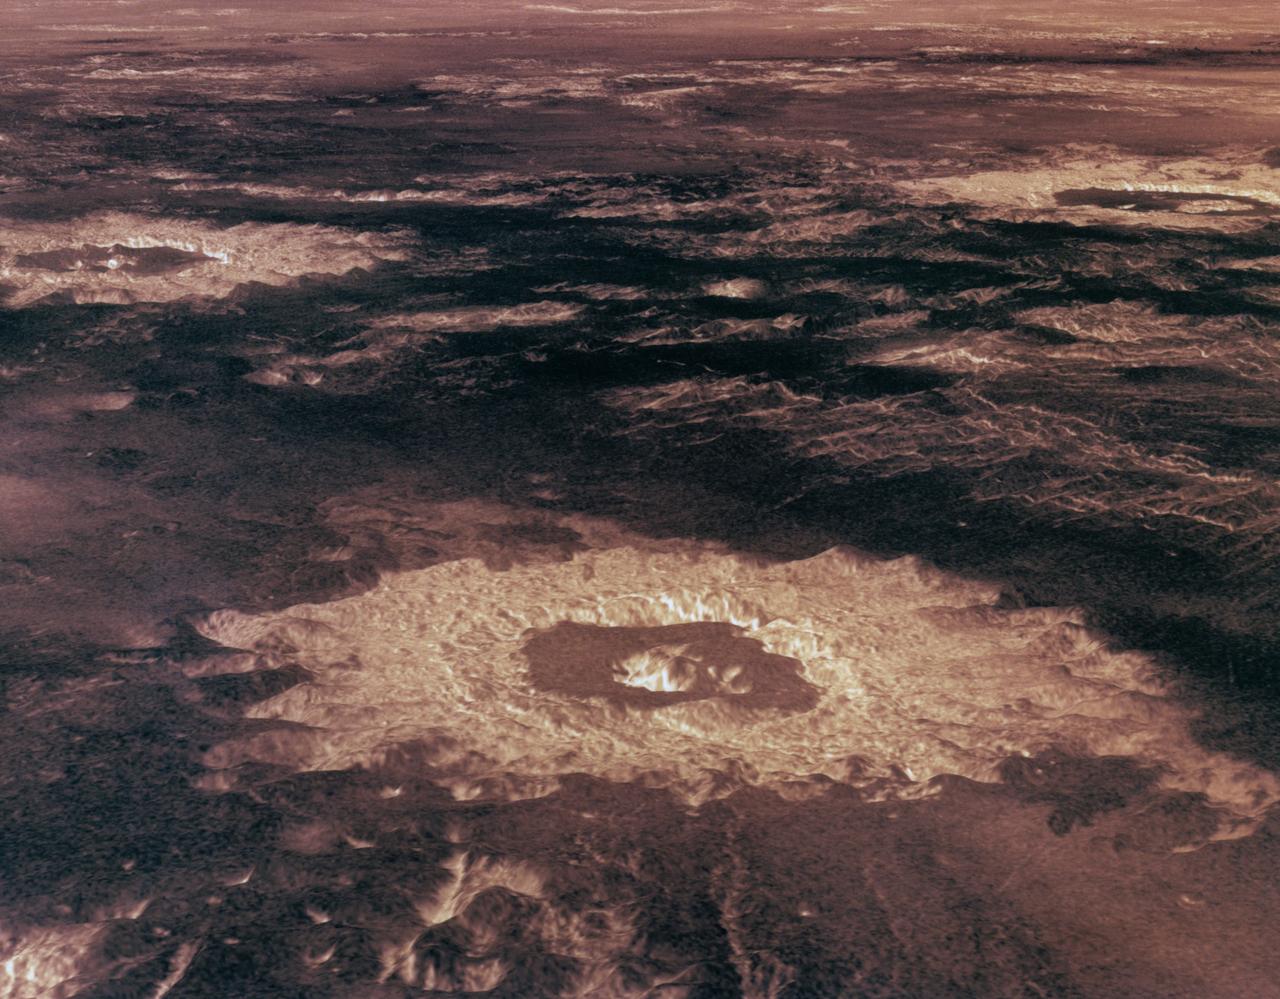
Three impact craters in three-dimensional perspective located approximately 27 degrees south latitude, 339 degrees east longitude in the northwestern portion of Lavinia Planitia. The viewpoint is located southwest of Howe Crater which appears centered in the lower portion of the image. Howe has a diameter of 37.3 kilometers (23.1 miles) located at 28.6 degrees south latitude, 337.1 degrees east longitude. Danilova, a crater with a diameter of 47.6 kilometers (29.5 miles) and located at 26.35 degrees south latitude and 337.5 east longitude, appears above and to the left of Howe in the image. Aglaonice, a crater with a diameter of 62.7 kilometers (38.9 miles) and located at 26.5 degrees south latitude and 340 degrees east longitude is on the right of Danilova. Magellan synthetic aperture radar data is combined with radar altimetry to develop a 3D map of the surface. Rays cast in a computer intersect the surface to create a 3D view. Simulated color and a digital elevation map developed by the United States (U.S.) Geological Survey is used to enhance small-scale structure. The simulated hues are based on color images recorded by the Soviet Venera 13 and 14 spacecraft. The image was processed at the Jet Propulsion Laboratory (JPL) Multimission Image Processing Laboratory and is a single frame from a video released at the JPL news conference 05-29-91. View provided by JPL with alternate number P-39146.
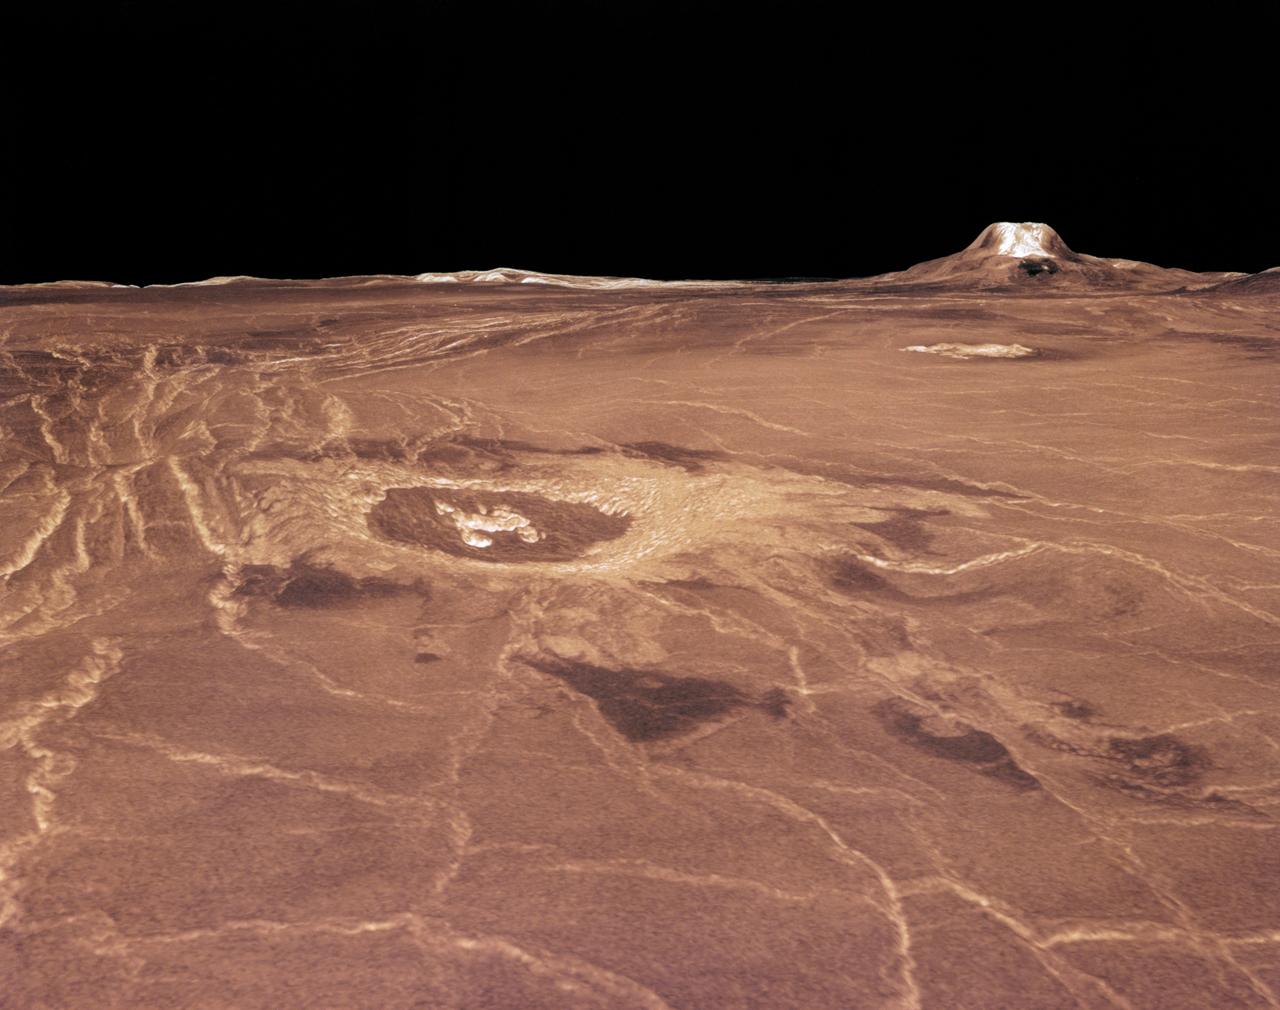
Magellan synthetic aperture radar data was used to create this three- dimensional (3D) perspective view of Venus' western Eistla Regio. This viewpoint is located at 1,310 kilometers (812 miles) southwest of Gula Mons at an elevation of 0.178 kilometers (0.48 miles). The view is of the northeast with Gula Mons appearing on the horizon. Gula Mons, a 3 kilometer (1.86 mile) high volcano, is located at approximately 22 degrees north latitude, 359 degrees east longitude. The impact crater Cunitz, named for the astronomer and mathematician Maria Cunitz, is visible in the center of the image. The crater is 48.5 kilometers (30 miles) in diameter and is 215 kilometers (133 miles) from the viewer's position. Magellan synthetic aperture radar data is combined with radar altimetry to develop a 3D map of the surface. Rays cast in a computer intersect the surface to create a 3D view. Simulated color and a digital elevation map developed by the United States (U.S.) Geological Survey is used to enhance small-scale structure. The simulated hues are based on color images recorded by the Soviet Venera 13 and 14 spacecraft. The image was produced at the Jet Propulsion Laboratory (JPL) Multimission Image Processing Laboratory and is a single frame from a video released at the JPL news conference 03-05-91. View was provided by JPL with alternate number P-38720 MGN76.
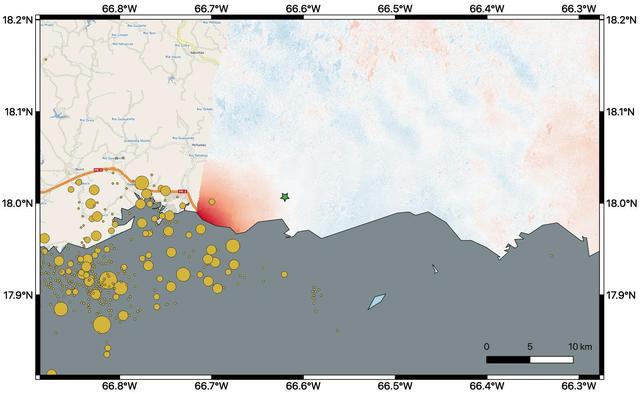
By comparing interferometric synthetic aperture radar (InSAR) data acquired on Jan. 9, 2020, with data acquired on Dec. 28, 2019, from the Copernicus Sentinel-1A satellite, NASA scientists were able to map where, how much and in what direction the ground shifted following a 6.4-magnitude earthquake off the coast of Puerto Rico. Managed by the European Space Agency (ESA), the Copernicus Sentinel-1A satellite was able to see the eastern two-thirds of the island during the Jan. 9 flyover. On the map, red indicates areas where the ground was changed, or displaced, with darker shades corresponding to more significant displacement. The scientists found that the greatest displacement from the flyover area occurred west of the city of Ponce (identified by the green star), not far from the quake's offshore epicenter. They recorded up to 5.5 inches (14 centimeters) of ground change there. The ground appeared to shift downward and slightly to the west. The epicenter of the quake and the cluster of quakes and aftershocks in the region identified by the United States Geological Survey (shown as orange circles) fall just west of the satellite's Jan. 9 track. Because of this, scientists also plan to analyze data from Sentinel-1A's forthcoming Jan. 14 flyover, which will include western Puerto Rico. https://photojournal.jpl.nasa.gov/catalog/PIA23428
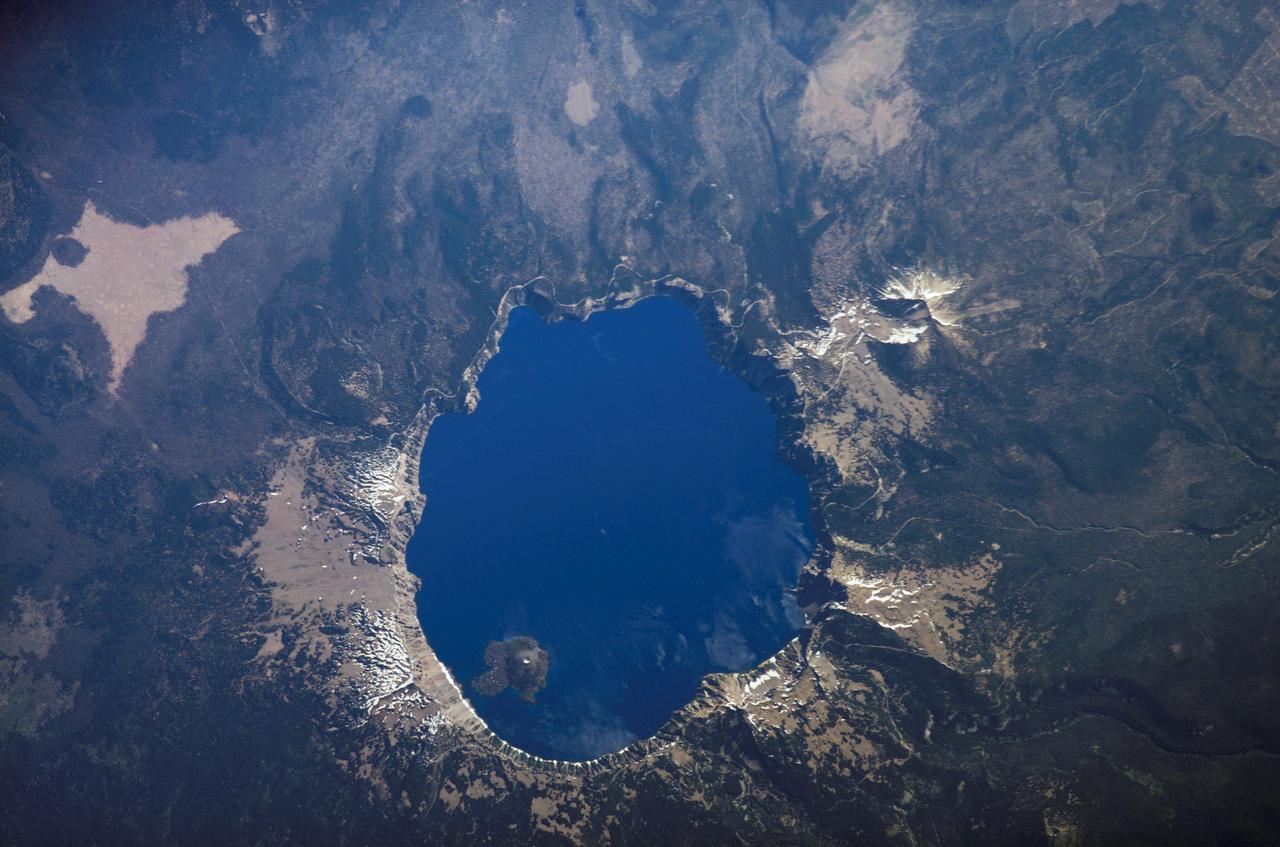
ISS013-E-54243 (19 July 2006) --- Crater Lake, Oregon is featured in this image photographed by an Expedition 13 crewmember on the International Space Station. Crater Lake is formed from the caldera (collapsed magma chamber) of a former volcano known as Mount Mazama. Part of the Cascades volcanic chain, Mount Mazama is situated between the Three Sisters volcanoes to the north and Mount Shasta to the south. While considered a dormant volcano, Crater Lake is part of the United States Geological Survey Cascades Volcano Observatory seismic monitoring network. The dark blue water coloration is typical of the 592 meter (1943 feet) deep Crater Lake; light blue-green areas to the southeast of Wizard Island (along the southern crater rim) most probably correspond to particulates either on or just below the water surface. A light dusting of snow fills the summit cone of Wizard Island. Some of the older lava flows in the area are associated with Mount Scott to the east-southeast of the Lake. Water is lost only by evaporation and seepage, and is only replenished by rainwater and snowmelt from the surrounding crater walls. These processes help maintain minimal sediment input into the lake and exceptional water clarity. The Crater Lake ecosystem is of particular interest to ecologists because of its isolation from the regional landscape, and its overall pristine quality is important to recreational users of Crater Lake National Park (447,240 visitors in 2005). The United States National Park Service maintains programs to monitor changes (both natural and human impacts) to Crater Lake.
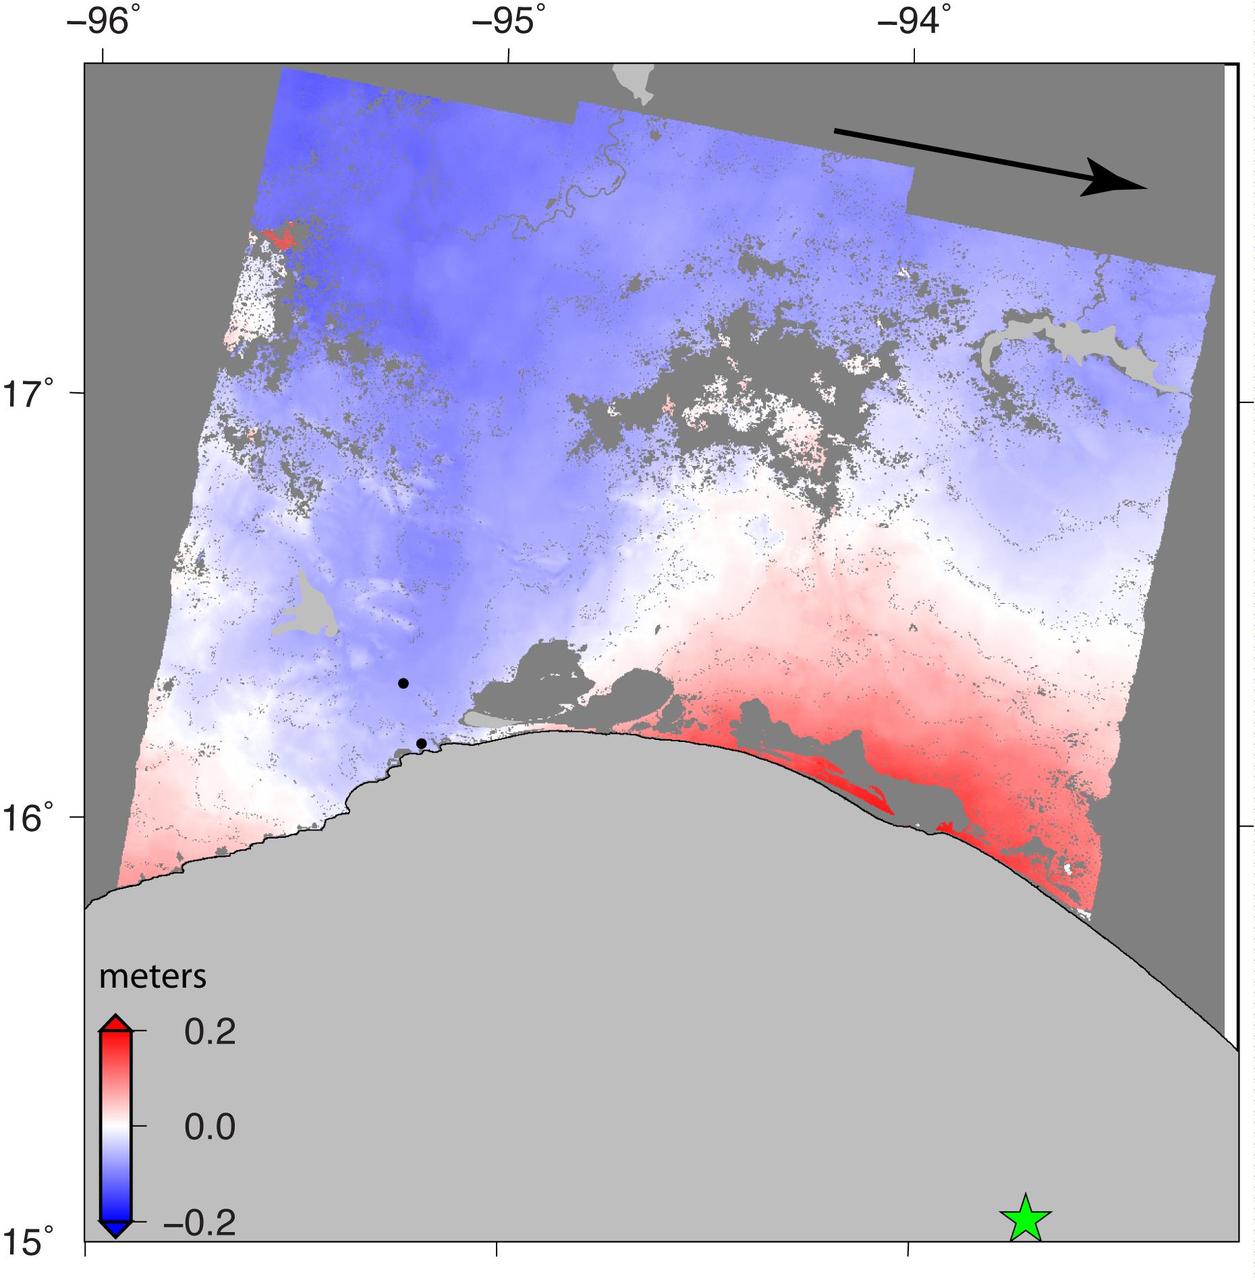
NASA and its partners are contributing important observations and expertise to the ongoing response to the Sept. 7, 2017 (local time), magnitude 8.1 Oaxaca-Chiapas earthquake in Mexico. This earthquake was the strongest in more than a century in Mexico. It has caused a significant humanitarian crisis, with widespread building damage and triggered landslides throughout the region. Scientists with the Advanced Rapid Imaging and Analysis project (ARIA), a collaboration between NASA's Jet Propulsion Laboratory in Pasadena, California; and Caltech, also in Pasadena, analyzed interferometric synthetic aperture radar images from the radar instrument on the Copernicus Sentinel-1A and Sentinel-1B satellites operated by the European Space Agency (ESA) to calculate a map of the deformation of Earth's surface caused by the quake. This false-color map shows the amount of permanent surface movement caused almost entirely by the earthquake, as viewed by the satellite, during a six-day interval between radar images acquired by the two Sentinel-1 satellites on Sept. 7 and Sept. 13, 2017. In this map, the colors of the surface displacements are proportional to the surface motion. The red tones show the areas along the coast of Chiapas and Oaxaca have moved toward the satellite by as much as 9 inches (22 centimeters) in a combination of up and eastward motion. The area in between and farther north with various shades of blue moved away from the satellite, mostly downward or westward, by as much as 6 inches (15 centimeters). Areas without color are open water or heavy vegetation, which prevent the radar from measuring change between the satellite images. Scientists use these maps to build detailed models of the fault slip at depth and associated land movements to better understand the impact on future earthquake activity. The green star shows the location of the earthquake epicenter estimated by the United States Geological Survey (USGS) National Earthquake Information Center. Map contains modified Copernicus Sentinel data 2017, processed by ESA and analyzed by the NASA-JPL/Caltech ARIA team. This research was carried out at JPL under a contract with NASA. Sentinel-1 data were accessed through the Copernicus Open Access Hub. An annotated figures is available at https://photojournal.jpl.nasa.gov/catalog/PIA21962
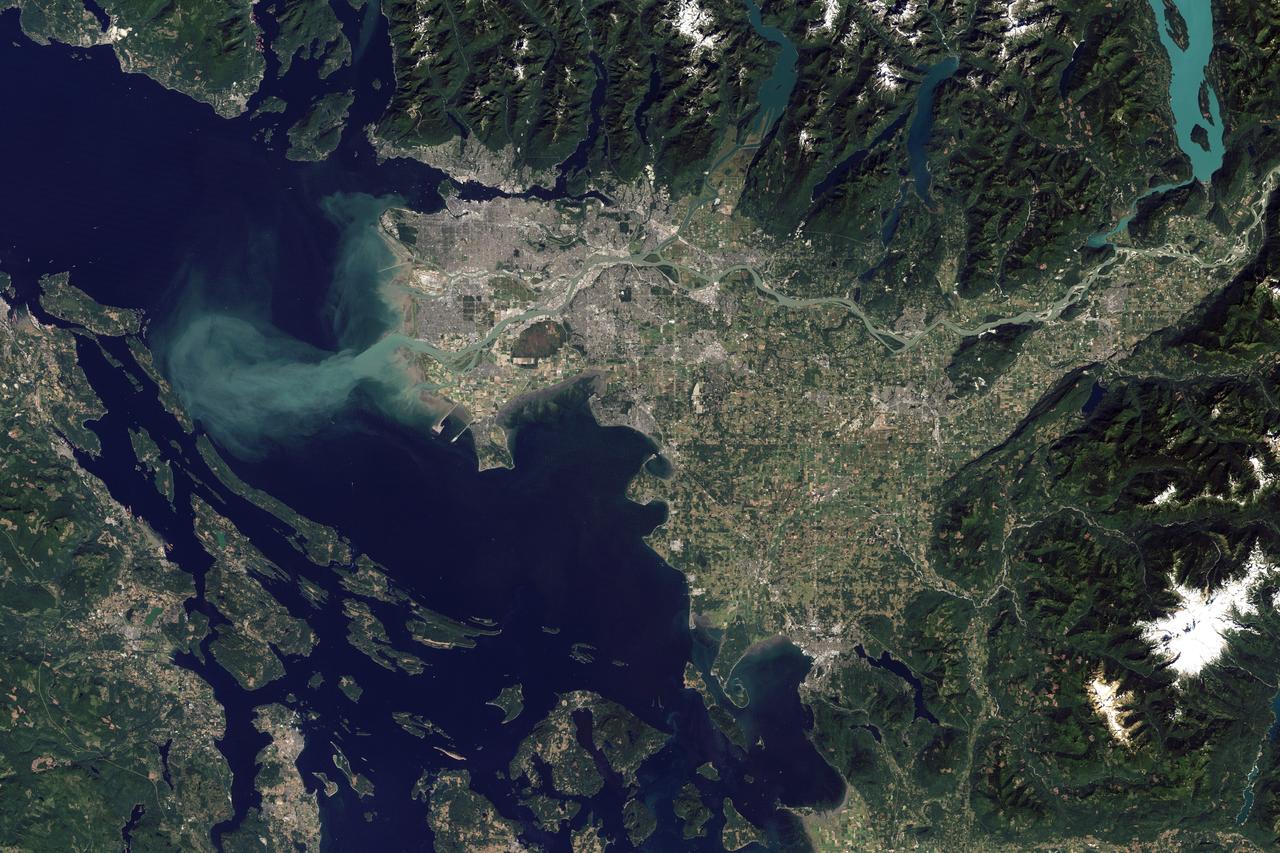
The Thematic Mapper on the Landsat 5 satellite captured this image of Vancouver on September 7, 2011. Flowing through braided channels, the Fraser River meanders toward the sea, emptying through multiple outlets. Moe info: <a href="http://earthobservatory.nasa.gov/IOTD/view.php?id=77368" rel="nofollow">earthobservatory.nasa.gov/IOTD/view.php?id=77368</a> NASA Earth Observatory image created by Robert Simmon and Jesse Allen, using Landsat data provided by the United States Geological Survey. Instrument: Landsat 5 - TM Credit: <b><a href="http://www.earthobservatory.nasa.gov/" rel="nofollow"> NASA Earth Observatory</a></b> <b><a href="http://www.nasa.gov/audience/formedia/features/MP_Photo_Guidelines.html" rel="nofollow">NASA image use policy.</a></b> <b><a href="http://www.nasa.gov/centers/goddard/home/index.html" rel="nofollow">NASA Goddard Space Flight Center</a></b> enables NASA’s mission through four scientific endeavors: Earth Science, Heliophysics, Solar System Exploration, and Astrophysics. Goddard plays a leading role in NASA’s accomplishments by contributing compelling scientific knowledge to advance the Agency’s mission. <b>Follow us on <a href="http://twitter.com/NASAGoddardPix" rel="nofollow">Twitter</a></b> <b>Like us on <a href="http://www.facebook.com/pages/Greenbelt-MD/NASA-Goddard/395013845897?ref=tsd" rel="nofollow">Facebook</a></b> <b>Find us on <a href="http://instagram.com/nasagoddard?vm=grid" rel="nofollow">Instagram</a></b>
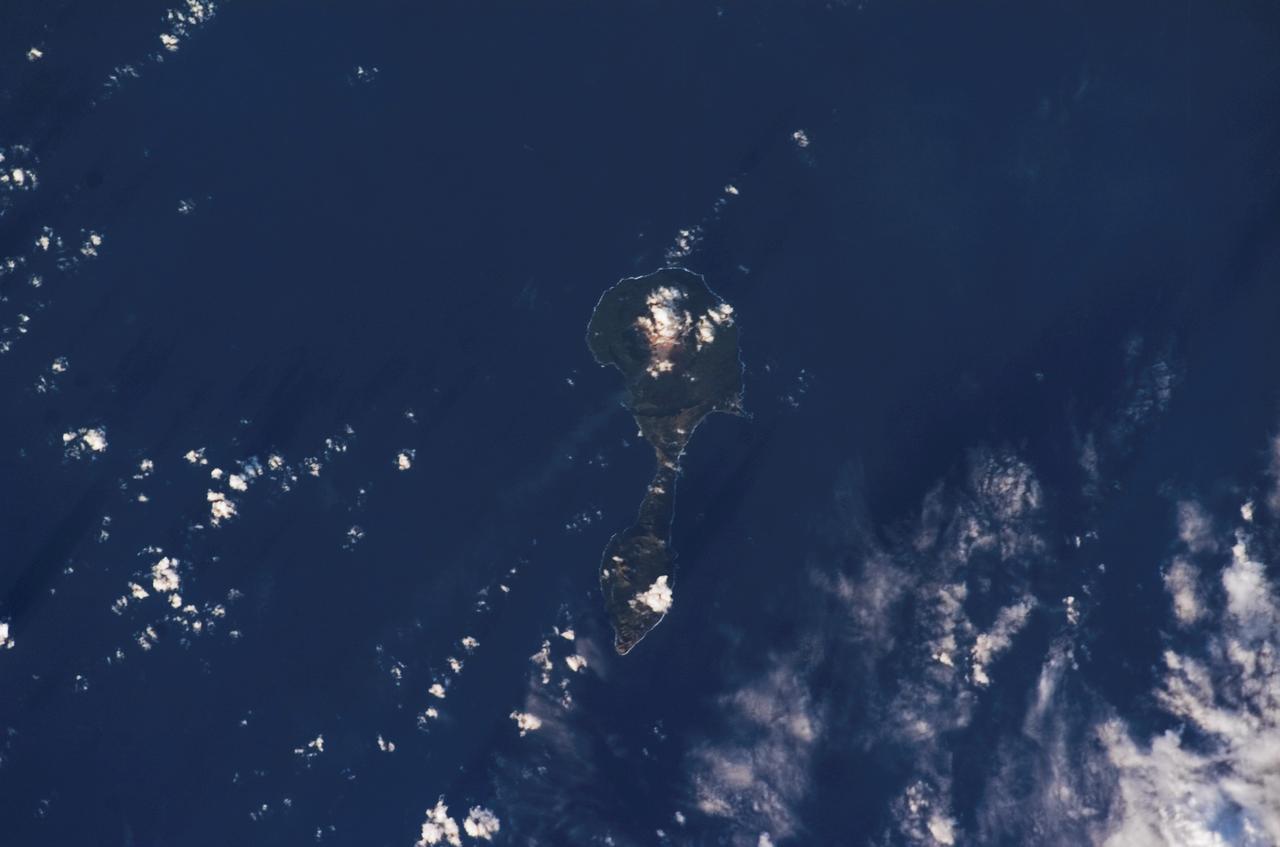
ISS014-E-11872 (11 Jan. 2007) --- Pagan Island, Northern Mariana Islands, is featured in this image photographed by an Expedition 14 crewmember on the International Space Station. According to scientists, the Mariana Islands are part a volcanic island arc -- surface volcanoes formed from magma generation as one tectonic plate is overridden (or subducted) beneath another. In the case of the Mariana Islands, the Pacific Plate is being subducted beneath the Philippine Plate along the famously deep Mariana Trench (more than 11 kilometers below sea level). Pagan Island (right) is comprised of two stratovolcanoes (tall, typically cone-shaped structures formed by layers of dense crystallized lava and less-dense ash and pumice) connected by a narrow isthmus of land. Mount Pagan, the larger of the two volcanoes, forms the northeastern portion of the island and has been the most active historically. The most recent major eruption took place in 1981, but since then numerous steam- and ash-producing events have been observed at the volcano -- the latest reported one occurring between Dec. 5-8, 2006. This image records volcanic activity on Jan. 11, 2007 that produced a thin plume (most probably steam, say NASA scientists, possibly with minor ash content) that extended westwards away from Mount Pagan. The island is sparsely populated, and monitored for volcanic activity by the United States Geological Survey and the Commonwealth of the Mariana Islands.
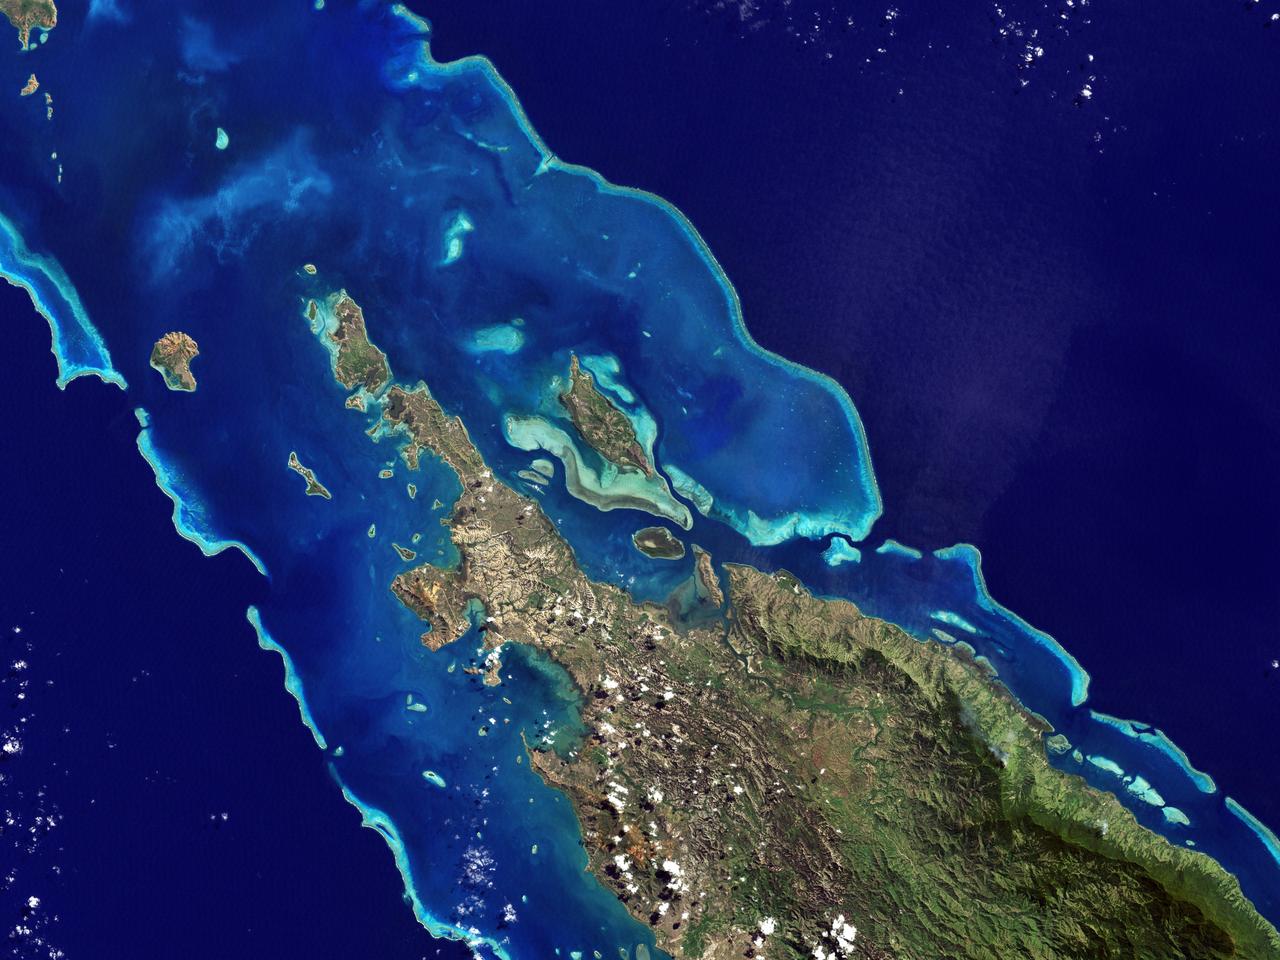
NASA image acquired May 10, 2001 In July 2008, the United Nations Educational, Scientific, and Cultural Organization (UNESCO) added 27 new areas to its list of World Heritage sites. One of those areas included the lagoons of New Caledonia. Some 1,200 kilometers (750 miles) east of Australia, this French-governed archipelago contains the world’s third-largest coral reef structure. The coral reefs enclose the waters near the islands in shallow lagoons of impressive biodiversity. On May 10, 2001, the Enhanced Thematic Mapper Plus on NASA’s Landsat 7 satellite captured this image of Île Balabio, off the northern tip of Grande Terra, New Caledonia’s main island. In this natural-color image, the islands appear in shades of green and brown—mixtures of vegetation and bare ground. The surrounding waters range in color from pale aquamarine to deep blue, and the color differences result from varying depths. Over coral reef ridges and sand bars, the water is shallowest and palest in color. Darker shades of blue characterize deeper waters. Reef-enclosed, shallow waters surround Île Balabio, and a larger, semi-enclosed lagoon appears immediately east of that island. Immediately north of Grande Terra, unenclosed, deeper waters predominate. The coral reefs around New Caledonia support an unusual diversity of species, including large numbers of predators and big fish, turtles, and the world’s third-largest dugong population. NASA image created by Jesse Allen, using Landsat data provided by the United States Geological Survey. Caption by Michon Scott. Instrument: Landsat 7 - ETM+ Credit: NASA/GSFC/Landsat <b><a href="http://www.nasa.gov/centers/goddard/home/index.html" rel="nofollow">NASA Goddard Space Flight Center</a></b> enables NASA’s mission through four scientific endeavors: Earth Science, Heliophysics, Solar System Exploration, and Astrophysics. Goddard plays a leading role in NASA’s accomplishments by contributing compelling scientific knowledge to advance the Agency’s mission. <b>Follow us on <a href="http://twitter.com/NASA_GoddardPix" rel="nofollow">Twitter</a></b> <b>Join us on <a href="http://www.facebook.com/pages/Greenbelt-MD/NASA-Goddard/395013845897?ref=tsd" rel="nofollow">Facebook</a></b>
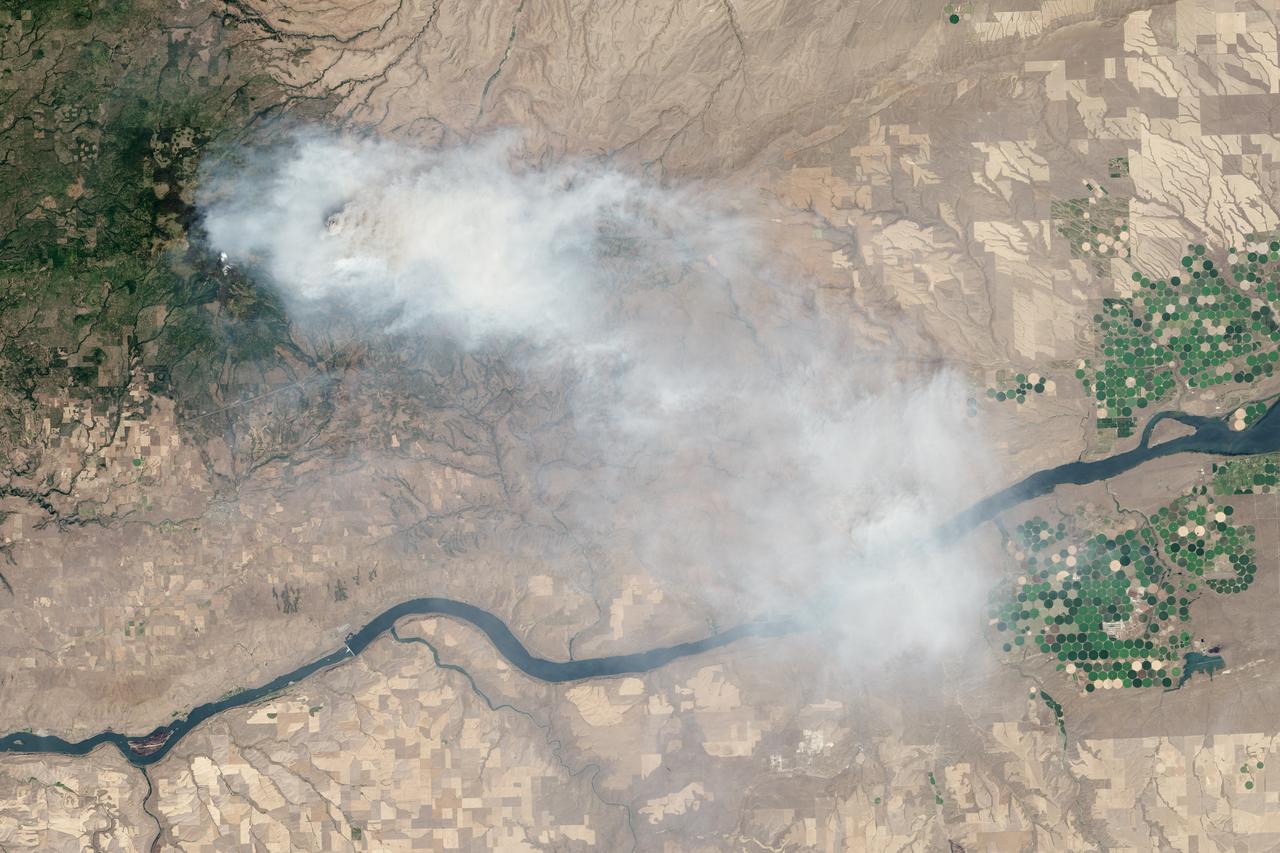
Eight major wildfires burned through forests and grasslands in the Pacific Northwest in late-July 2013, threatening homes and forcing road closings and evacuations. Many parts of Washington and Oregon faced extreme fire threats, as strong thunderstorms lined up to hit parched forests and grasslands with lightning. On July 28, 2013, the Operational Land Imager (OLI) on Landsat 8 captured these images of the Mile Marker 28 fire in the Simcoe Mountains northeast of Goldendale, Washington. Smoke blew east toward Kennewick, Pasco, and Richland. The lower image shows a closer view of smoke billowing up from the most active part of the fire. Ignited on July 24, 2013, the fire charred more than 22,000 acres (8,900 hectares) by July 30, when more than 1,000 firefighters achieved 40 percent containment. The blaze forced the evacuation of dozens of homes and the closure of US Highway 97. Through July 25, 450 wildfires had burned 10,220 acres (4,136 hectares) in Washington, while Oregon saw 603 fires that burned 63,135 acres (25,549 hectares). In all, 2.3 million acres burned across the United States by late-July, below the national average. Over the past ten years, an average of 4.2 million acres had burned in the United States by the end of each July. While coastal and western Washington receive heavy rain throughout the year, the rain shadow caused by the Cascades leaves central Washington quite dry. The mountains force moist air from the Pacific to rise, causing it to cool and condense into rain or snow on the windward side of the Cascades. So little moisture is left by the time air passes over the Cascades, that the area around Mile Marker 28 typically receives just 8 inches (20 centimeters) of precipitation per year. NASA Earth Observatory image by Jesse Allen and Robert Simmon, using Landsat data from the U.S. Geological Survey. Caption by Adam Voiland Instrument: Landsat 8 - OLI More info: <a href="http://earthobservatory.nasa.gov/IOTD/view.php?id=81738" rel="nofollow">earthobservatory.nasa.gov/IOTD/view.php?id=81738</a> Credit: <b><a href="http://www.earthobservatory.nasa.gov/" rel="nofollow"> NASA Earth Observatory</a></b> <b><a href="http://www.nasa.gov/audience/formedia/features/MP_Photo_Guidelines.html" rel="nofollow">NASA image use policy.</a></b> <b><a href="http://www.nasa.gov/centers/goddard/home/index.html" rel="nofollow">NASA Goddard Space Flight Center</a></b> enables NASA’s mission through four scientific endeavors: Earth Science, Heliophysics, Solar System Exploration, and Astrophysics. Goddard plays a leading role in NASA’s accomplishments by contributing compelling scientific knowledge to advance the Agency’s mission. <b>Follow us on <a href="http://twitter.com/NASA_GoddardPix" rel="nofollow">Twitter</a></b> <b>Like us on <a href="http://www.facebook.com/pages/Greenbelt-MD/NASA-Goddard/395013845897?ref=tsd" rel="nofollow">Facebook</a></b> <b>Find us on <a href="http://instagram.com/nasagoddard?vm=grid" rel="nofollow">Instagram</a></b>
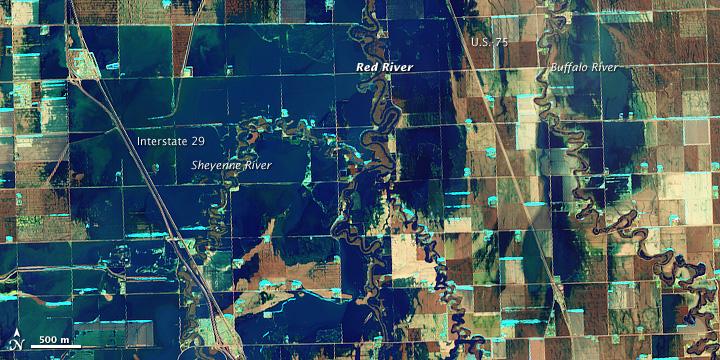
NASA Satellite image acquired March 21, 2010. To see a high res of this image go here: <a href="http://www.flickr.com/photos/gsfc/4455124807/in/photostream/">www.flickr.com/photos/gsfc/4455124807/in/photostream/</a> On March 21, 2010, the Red River crested at 36.99 feet (11.27 meters), according to the National Weather Service. The New York Times reported that the river’s crest was 1 foot (0.3 meters) below predictions and 4 feet (1 meter) below 2009’s record crest. A cold front passing through the area on March 19, 2010, slowed the rate of snowmelt feeding local rivers. That, combined with sandbags and dykes, spared the metropolitan area of Fargo, North Dakota, from serious flooding. North of town, however, agricultural fields and roads flooded. The Advanced Land Imager (ALI) on NASA’s Earth Observing-1 (EO-1) satellite captured these images of fields north of Fargo on March 21, 2010. The top image uses shortwave infrared light, and the bottom image uses visible light. Muddy waters and fallow fields blend together in the true-color image (bottom), but the false-color image (top) distinguishes better between water and land. Blue indicates water and green indicates vegetation. Fallow fields, bare ground, and paved surfaces appear in shades of brown. Cyan suggests pale water and/or sediment. Wide swaths of blue show large areas of standing water. The Sheyenne, Red, and Buffalo Rivers all flow through the area pictured here. According to The New York Times, flooding in rural areas around Fargo resulted primarily from the Red River’s failure to absorb water from the tributaries feeding it. Much of the standing water apparent in this image occurs around the Sheyenne and Buffalo Rivers. Overflowing tributaries left several inches of standing water in agricultural fields and on highways. About 10 miles (16 kilometers) north of Fargo, flooding forced the closure of Interstate 29. NASA image created by Jesse Allen, using EO-1 ALI data provided courtesy of the NASA EO-1 team and the United States Geological Survey. Caption by Michon Scott.. Instrument: EO-1 - ALI. To learn more about this image go here: <a href="http://earthobservatory.nasa.gov/NaturalHazards/view.php?id=43211" rel="nofollow">earthobservatory.nasa.gov/NaturalHazards/view.php?id=43211</a> To learn more about NASA's Goddard Space Flight Center go here: <a href="http://www.nasa.gov/centers/goddard/home/index.html" rel="nofollow">www.nasa.gov/centers/goddard/home/index.html</a>
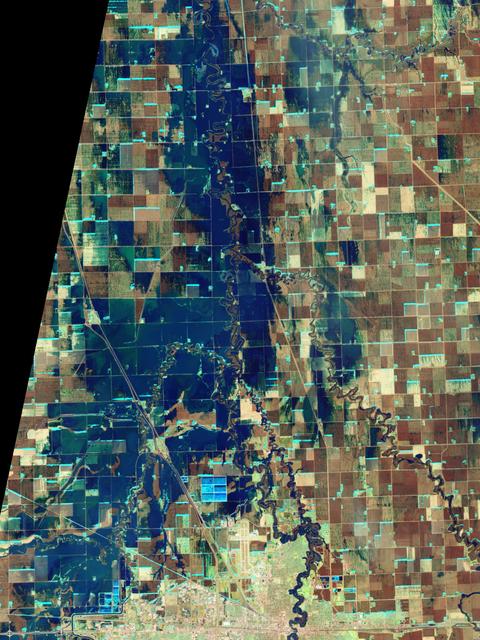
NASA Satellite image acquired March 21, 2010. To see a high res more detail of this image go here: <a href="http://www.flickr.com/photos/gsfc/4455125023/in/photostream/">www.flickr.com/photos/gsfc/4455125023/in/photostream/</a> On March 21, 2010, the Red River crested at 36.99 feet (11.27 meters), according to the National Weather Service. The New York Times reported that the river’s crest was 1 foot (0.3 meters) below predictions and 4 feet (1 meter) below 2009’s record crest. A cold front passing through the area on March 19, 2010, slowed the rate of snowmelt feeding local rivers. That, combined with sandbags and dykes, spared the metropolitan area of Fargo, North Dakota, from serious flooding. North of town, however, agricultural fields and roads flooded. The Advanced Land Imager (ALI) on NASA’s Earth Observing-1 (EO-1) satellite captured these images of fields north of Fargo on March 21, 2010. The top image uses shortwave infrared light, and the bottom image uses visible light. Muddy waters and fallow fields blend together in the true-color image (bottom), but the false-color image (top) distinguishes better between water and land. Blue indicates water and green indicates vegetation. Fallow fields, bare ground, and paved surfaces appear in shades of brown. Cyan suggests pale water and/or sediment. Wide swaths of blue show large areas of standing water. The Sheyenne, Red, and Buffalo Rivers all flow through the area pictured here. According to The New York Times, flooding in rural areas around Fargo resulted primarily from the Red River’s failure to absorb water from the tributaries feeding it. Much of the standing water apparent in this image occurs around the Sheyenne and Buffalo Rivers. Overflowing tributaries left several inches of standing water in agricultural fields and on highways. About 10 miles (16 kilometers) north of Fargo, flooding forced the closure of Interstate 29. NASA image created by Jesse Allen, using EO-1 ALI data provided courtesy of the NASA EO-1 team and the United States Geological Survey. Caption by Michon Scott. Instrument: EO-1 - ALI. To learn more about this image go here: <a href="http://earthobservatory.nasa.gov/NaturalHazards/view.php?id=43211" rel="nofollow">earthobservatory.nasa.gov/NaturalHazards/view.php?id=43211</a> To learn more about NASA's Goddard Space Flight Center go here: <a href="http://www.nasa.gov/centers/goddard/home/index.html" rel="nofollow">www.nasa.gov/centers/goddard/home/index.html</a>
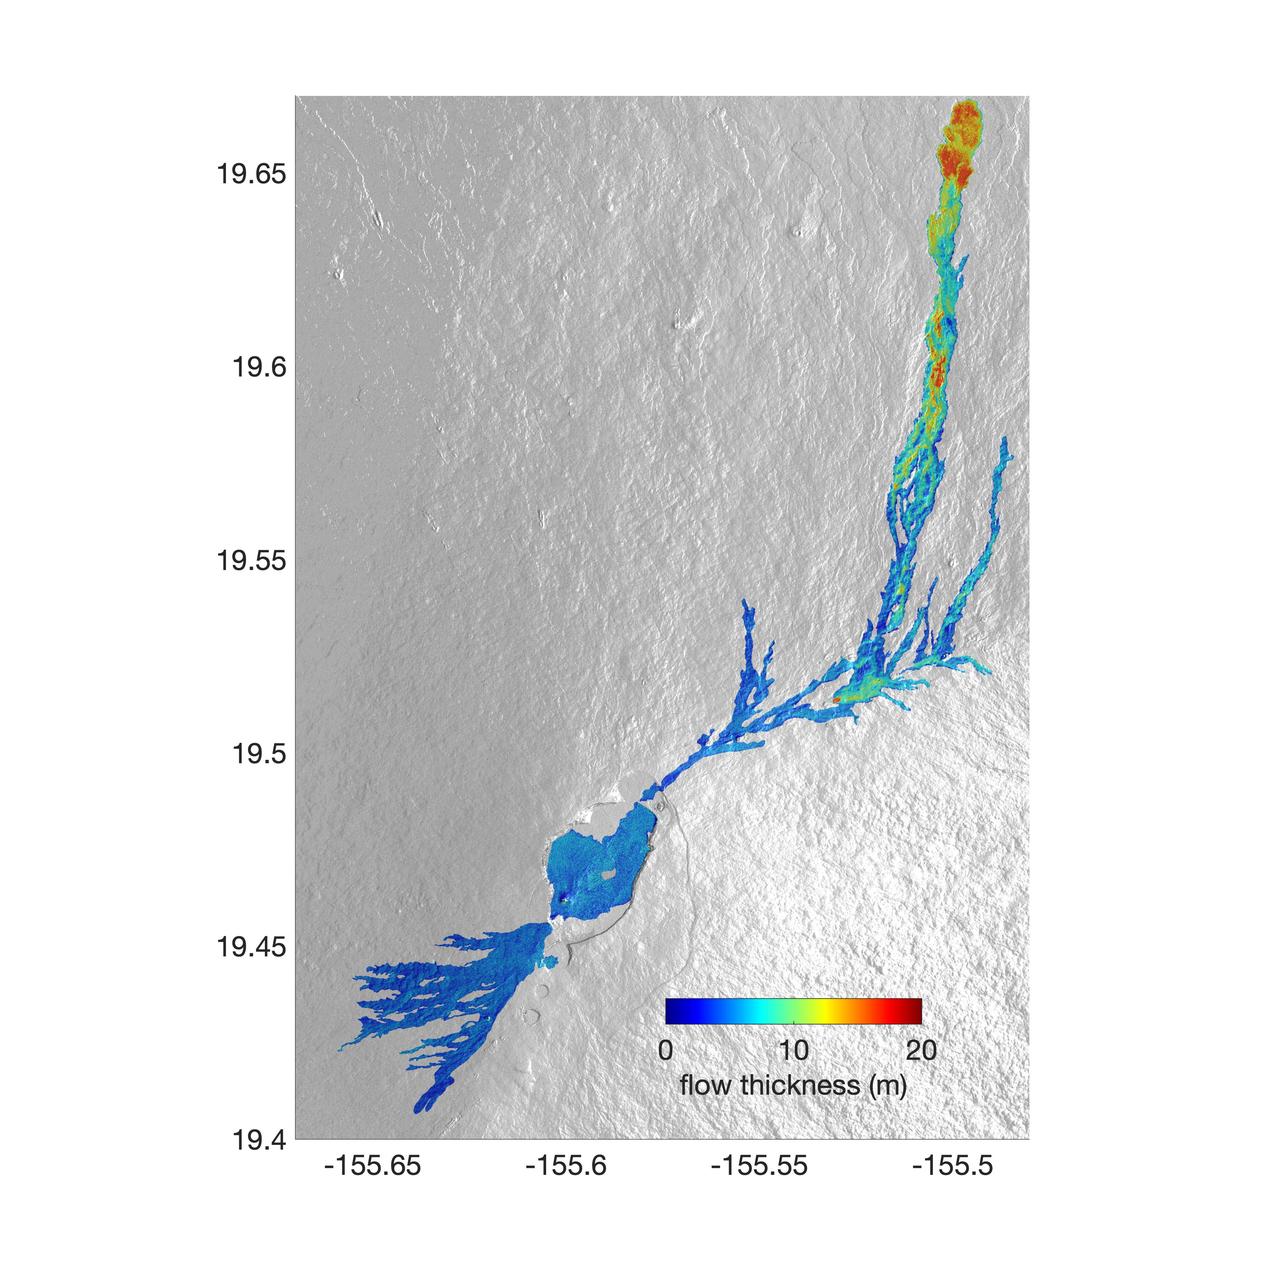
The world's largest active volcano – Hawaii's Mauna Loa – had been quiet for 38 years. But in 2022, the volcano began to stir, showing increased numbers of small earthquakes and subtle swelling of certain land surfaces in September. On November 27, fountains of lava began spurting from the mountain's Northeast Rift Zone and streams of molten rock flowed to the north. Ten days into the eruption, a NASA aircraft conducted its first flight over the erupting volcano. It carried NASA's Uninhabited Aerial Vehicle Synthetic Aperture Radar (UAVSAR) system, which was used to map the volcano's topography in fine detail with a Ka-band instrument called GLISTIN-A. Teams from NASA's Jet Propulsion Laboratory and the United States Geological Survey (USGS) used data from that sensor to map the thickness of those flows during a series of flights on December 7, 8, and 10. The map above shows the thickness of the lava flows during the flight on December 7, the day before USGS scientists noticed a significant decline in the pace of the eruption. A few days later, they declared the eruption had stopped. The map shows the thickness of the lava flows in the summit caldera, where the eruption began, and of lava flows on Mauna Loa's northeastern flank. The color variation from blue to orange indicates increasing lava flow thickness. A maximum thickness of roughly 25 meters (82 feet) is shown, though values exceeding 40 meters (131 feet) were observed in some areas. The thickening at the northern end of the flow is due to lava accumulating away from the vent, along with a flattening of the terrain at the saddle between the Mauna Loa and Mauna Kea volcanoes. By comparing to pre-eruption maps of this area's topography, including GLISTIN-A data collected in 2017, the USGS researchers were able to calculate the size and volume of the lava flow. Over the roughly 14-day eruption, Mauna Loa erupted more than 8.8 billion cubic feet (230 million cubic meters) along a lava flow that extended up to 16.5 miles (19.5 kilometers) from the vent, according to the USGS. The UAVSAR operates from a pod mounted beneath a crewed Gulfstream III jet from NASA's Armstrong Flight Research Center in California. Repeated topographic maps generated with each flight reveal the progression and thickening of lava with time – important information for scientific understanding of volcano processes and for emergency response. For the Mauna Loa science flights, the instrument suite featured an additional state-of-the-art imaging tool: the synthetic aperture radar-fusion optical short-wave infrared (SAR-Fusion Optical/SWIR) camera system. SAR-Fusion collects data over the same ground swath as GLISTIN-A to map land surface changes using optical/SWIR photogrammetry methods. GLISTIN-A was designed to provide all-weather, high-resolution surface topography not available through existing lidar or radar sensors. GLISTIN-A was originally demonstrated as a new radar technique for mapping ice surfaces. Science demonstration flights began in 2013 over alpine glaciers and sea ice in Alaska, and a floodplain in California. Its applications have since expanded to other areas, such as snow accumulation and volcano dynamics. The first time the instrument was deployed for volcano response was in 2018 during the three-month eruption of Kilauea. The success of that operation paved the way for deployment to Mauna Loa. https://photojournal.jpl.nasa.gov/catalog/PIA25526

NASA image acquired July 27, 2001 In southwestern Jordan lies an unusual landscape. Mountains of granite and sandstone rise next to valleys filled with red sand. Some of the mountains reach a height of about 1,700 meters (5,600 feet) above sea level, and many have near-vertical slopes. So alien is this landscape, it’s nicknamed “Valley of the Moon,” and it has served as the film set for a movie about Mars. Yet nomadic people have lived here for thousands of years. Declared a protected area in 1998, this unearthly landscape is Wadi Rum. The Advanced Land Imager (ALI) on NASA’s Earth Observing-1 (EO-1) satellite captured this natural-color image on July 27, 2001. The scene includes part of Wadi Rum and an adjacent area to the east. East of the protected area, fields with center-pivot irrigation make circles of green and brown (image upper right). As the earth tones throughout the image attest, the area is naturally arid, receiving little annual precipitation and supporting only sparse vegetation. Between rocky peaks, the sandy valleys range in color from beige to brick. Ancient granite rocks dating from the Precambrian underlie younger rocks, and some of these basement rocks have eroded into rugged, steep-sloped mountains. The granite mountains have risen thanks partly to crisscrossing fault lines under the park. Overlying the granite are sandstones from the Cambrian and Ordovician Periods, as well as loose sands. Lawrence of Arabia, who fought in the Arab Revolt of 1917–1918, made frequent references to Wadi Rum in his book The Seven Pillars of Wisdom. Likewise, a prominent feature of the protected area is named after the book. Several popular sites in Wadi Rum bear Lawrence of Arabia’s name, but whether he actually visited those sites is uncertain. To download the full high res go to: <a href="http://earthobservatory.nasa.gov/IOTD/view.php?id=49945" rel="nofollow">earthobservatory.nasa.gov/IOTD/view.php?id=49945</a> NASA Earth Observatory image created by Jesse Allen and Robert Simmon, using EO-1 ALI data provided courtesy of the NASA EO-1 team and the United States Geological Survey. Caption by Michon Scott. Instrument: EO-1 - ALI Credit: <b><a href="http://www.earthobservatory.nasa.gov/" rel="nofollow"> NASA Earth Observatory</a></b> <b><a href="http://www.nasa.gov/centers/goddard/home/index.html" rel="nofollow">NASA Goddard Space Flight Center</a></b> enables NASA’s mission through four scientific endeavors: Earth Science, Heliophysics, Solar System Exploration, and Astrophysics. Goddard plays a leading role in NASA’s accomplishments by contributing compelling scientific knowledge to advance the Agency’s mission. <b>Follow us on <a href="http://twitter.com/NASA_GoddardPix" rel="nofollow">Twitter</a></b> <b>Join us on <a href="http://www.facebook.com/pages/Greenbelt-MD/NASA-Goddard/395013845897?ref=tsd" rel="nofollow">Facebook</a></b>