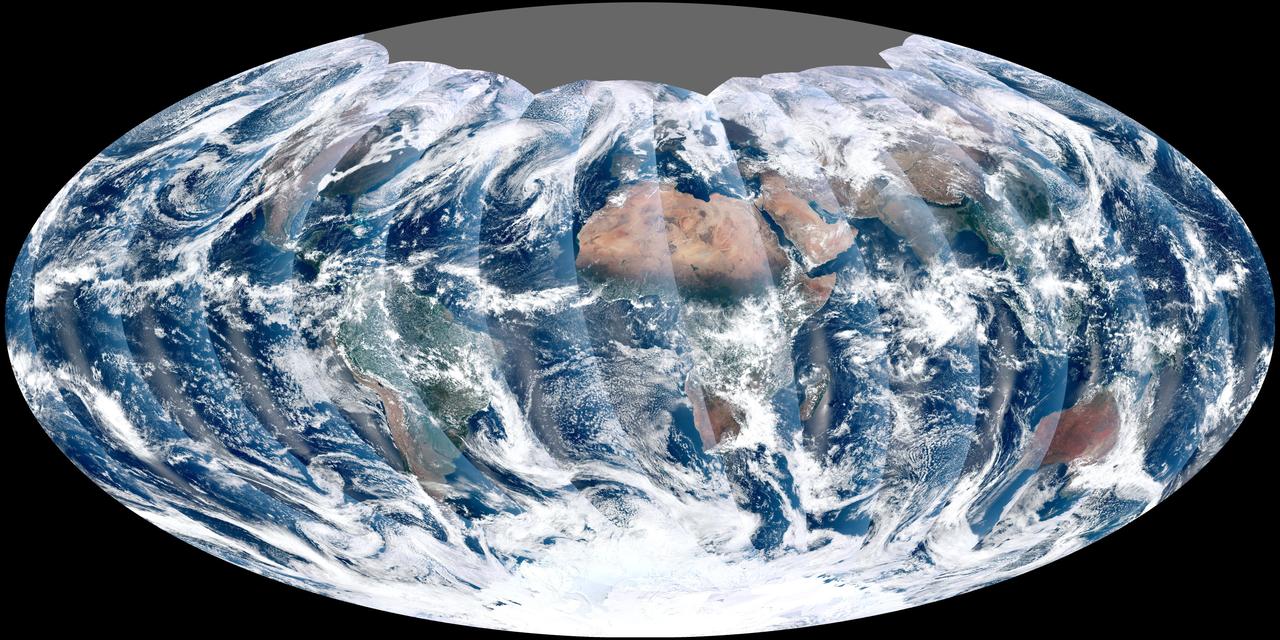
NASA acquired November 24, 2011 From its vantage 824 kilometers (512 miles) above Earth, the Visible Infrared Imager Radiometer Suite (VIIRS) on the NPOESS Preparatory Project (NPP) satellite gets a complete view of our planet every day. This image from November 24, 2011, is the first complete global image from VIIRS. The NPP satellite launched on October 28, 2011, and VIIRS acquired its first measurements on November 21. To date, the images are preliminary, used to gauge the health of the sensor as engineers continue to power it up for full operation. Rising from the south and setting in the north on the daylight side of Earth, VIIRS images the surface in long wedges measuring 3,000 kilometers (1,900 miles) across. The swaths from each successive orbit overlap one another, so that at the end of the day, the sensor has a complete view of the globe. The Arctic is missing because it is too dark to view in visible light during the winter. The NPP satellite was placed in a Sun-synchronous orbit, a unique path that takes the satellite over the equator at the same local (ground) time in every orbit. So, when NPP flies over Kenya, it is about 1:30 p.m. on the ground. When NPP reaches Gabon—about 3,000 kilometers to the west—on the next orbit, it is close to 1:30 p.m. on the ground. This orbit allows the satellite to maintain the same angle between the Earth and the Sun so that all images have similar lighting. The consistent lighting is evident in the daily global image. Stripes of sunlight (sunglint) reflect off the ocean in the same place on the left side of every swath. The consistent angle is important because it allows scientists to compare images from year to year without worrying about extreme changes in shadows and lighting. The image also shows a band of haze along the right side of every orbit swath. When light travels through the atmosphere, it bounces off particles or scatters, making the atmosphere look hazy. The scattering effect is most pronounced along the edge of the swath, where the sensor is looking at an angle through more of the atmosphere. Scientists can correct for this scattering effect, but need measurements from a range of wavelengths to do so. The degree to which light scatters depends partly on the wavelength of the light. Blue light scatters more than red light, for example, which is why the sky is blue. VIIRS measures 22 different wavelengths of light, but not all of the sensor’s detectors are operating at peak performance yet. Those measuring thermal infrared light are not yet cold enough to collect reliable measurements. Once VIIRS begins full operations, it will produce a range of measurements from ocean temperature to clouds to the locations of fires. These measurements will help extend the record from earlier sensors like the Moderate Resolution Imaging Spectroradiometer (MODIS). VIIRS is very similar to MODIS, but flies at a higher altitude to measure the whole planet without gaps. (MODIS daily measurements have gaps at the equator. See the MODIS image from November 24.) VIIRS also sees the Earth in less detail, 375 meters per pixel, compared to 250 meters per pixel for MODIS. Image by NASA’s NPP Land Product Evaluation and Testing Element. Caption by Holli Riebeek. Credit: <b><a href="http://www.earthobservatory.nasa.gov/" rel="nofollow"> NASA Earth Observatory</a></b> <b><a href="http://www.nasa.gov/audience/formedia/features/MP_Photo_Guidelines.html" rel="nofollow">NASA image use policy.</a></b> <b><a href="http://www.nasa.gov/centers/goddard/home/index.html" rel="nofollow">NASA Goddard Space Flight Center</a></b> enables NASA’s mission through four scientific endeavors: Earth Science, Heliophysics, Solar System Exploration, and Astrophysics. Goddard plays a leading role in NASA’s accomplishments by contributing compelling scientific knowledge to advance the Agency’s mission. <b>Follow us on <a href="http://twitter.com/NASA_GoddardPix" rel="nofollow">Twitter</a></b> <b>Like us on <a href="http://www.facebook.com/pages/Greenbelt-MD/NASA-Goddard/395013845897?ref=tsd" rel="nofollow">Facebook</a></b> <b>Find us on <a href="http://instagrid.me/nasagoddard/?vm=grid" rel="nofollow">Instagram</a></b>

Damaging heavy rains fell on South Carolina in the southeastern United States at the beginning of October 2015. Much of that water had, by mid October, flowed into the Atlantic Ocean bringing with it heavy loads of sediment, nutrients, and dissolved organic material. The above VIIRS image shows the runoff as it interacts with ocean currents on October 15, 2015. Credit: NASA/Goddard/SuomiNPP/VIIRS via NASA's OceanColor
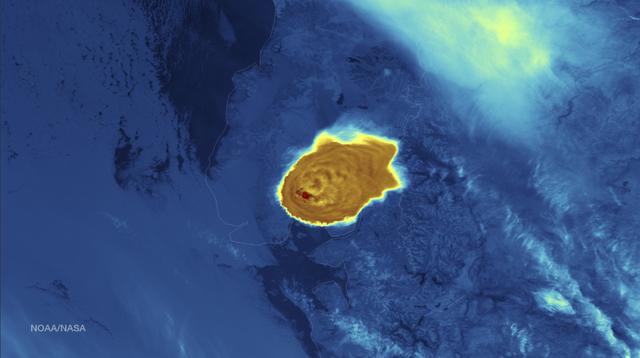
Calbuco Volcano in southern Chile has erupted for the first time since 1972, with the last major eruption occurring in 1961 that sent ash columns 12-15 kilometers high. This image was taken by the Suomi NPP satellite's VIIRS instrument in a high resolution infrared channel around 0515Z on April 23, 2015. Credit: NOAA/NASA/NPP/VIIRS
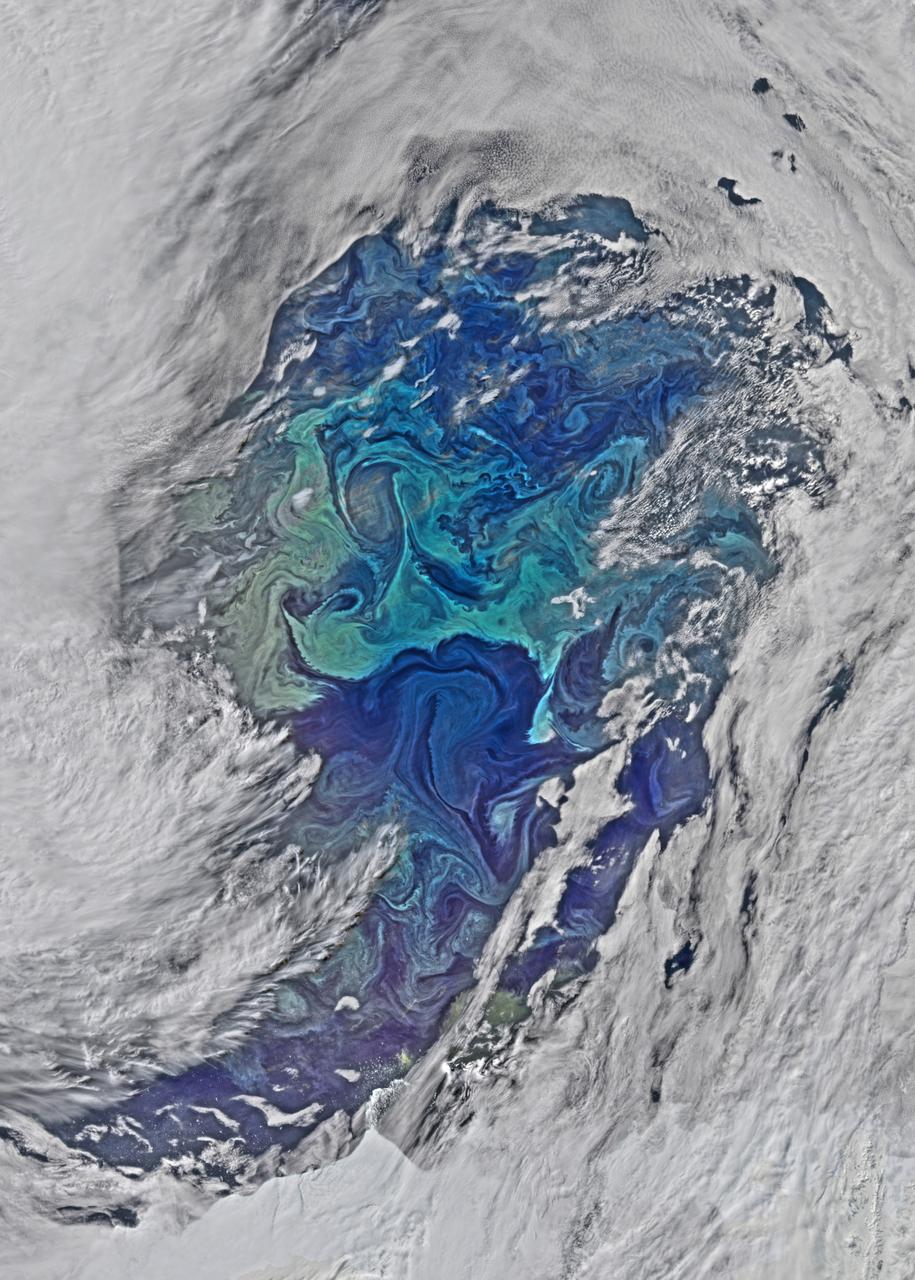
The cloud cover over the Southern Ocean occasionally parts as it did on January 1, 2015 just west of the Drake Passage where the VIIRS instrument on the Suomi NPP satellite glimpsed the above collection of ocean-color delineated eddies which have diameters ranging from a couple of kilometers to a couple of hundred kilometers. Recent studies indicate that eddy activity has been increasing in the Southern Ocean with possible implications for climate change. Credit: NASA's OceanColor/Suomi NPP/VIIRS
Freezing rain is in the forecast from Texas to the mid-Mississippi Valley and into the Carolinas with temperatures 20-40 degrees below normal across parts of the central and southern U.S. on Friday, extending February's icy grip on the eastern half of the U.S. This image from the Suomi NPP satellite's VIIRS instrument shows the snow cover left by February's series of east coast storms, taken around 1830Z on February 27, 2015. Credit: NASA/NOAA/NPP/VIIRS Via: <b><a href="http://www.earthobservatory.nasa.gov/" rel="nofollow"> NASA Earth Observatory</a></b>

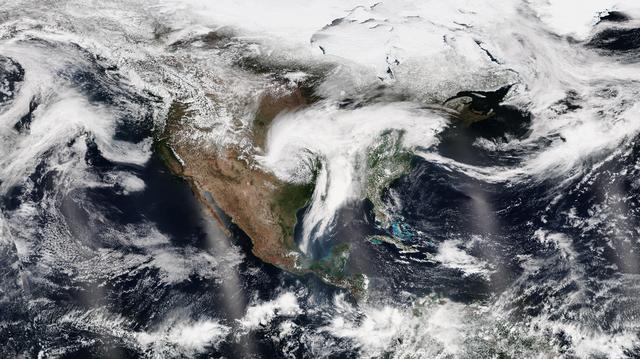
This composite image of southern Africa and the surrounding oceans was captured by six orbits of the NASA/NOAA Suomi National Polar-orbiting Partnership spacecraft on April 9, 2015, by the Visible Infrared Imaging Radiometer Suite (VIIRS) instrument. Tropical Cyclone Joalane can be seen over the Indian Ocean. Winds, tides and density differences constantly stir the oceans while phytoplankton continually grow and die. Orbiting radiometers such as VIIRS allows scientists to track this variability over time and contribute to better understanding of ocean processes that are beneficial to human survival on Earth. The image was created by the Ocean Biology Processing Group at NASA's Goddard Space Flight Center in Greenbelt, Maryland.
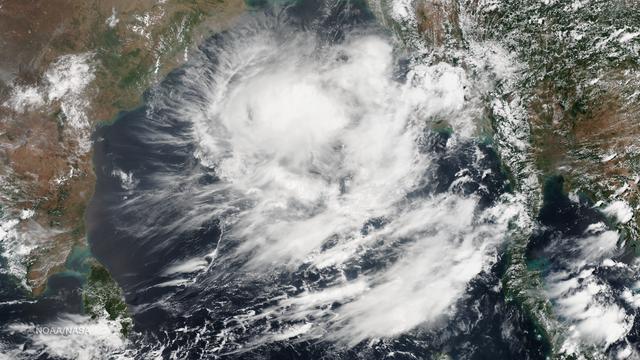
The Joint Typhoon Warning Center states that formation of a significant tropical cyclone is possible in the Bay of Bengal within the next 12 - 24 hours as of 0730Z on May 21, 2014. Along with deep convective banding associated with a consolidating low-level circulation center, warm sea surface temperatures are conducive for further development. This image was taken by the Suomi NPP satellite's VIIRS instrument in two passes, the east pass around 0615Z and the west pass around 0755Z on May 21, 2014. Credit: NASA/NOAA/NPP/VIIRS The Joint Typhoon Warning Center states that formation of a significant tropical cyclone is possible in the Bay of Bengal within the next 12 - 24 hours as of 0730Z on May 21, 2014. Along with deep convective banding associated with a consolidating low-level circulation center, warm sea surface temperatures are conducive for further development. This image was taken by the Suomi NPP satellite's VIIRS instrument in two passes, the east pass around 0615Z and the west pass around 0755Z on May 21, 2014.
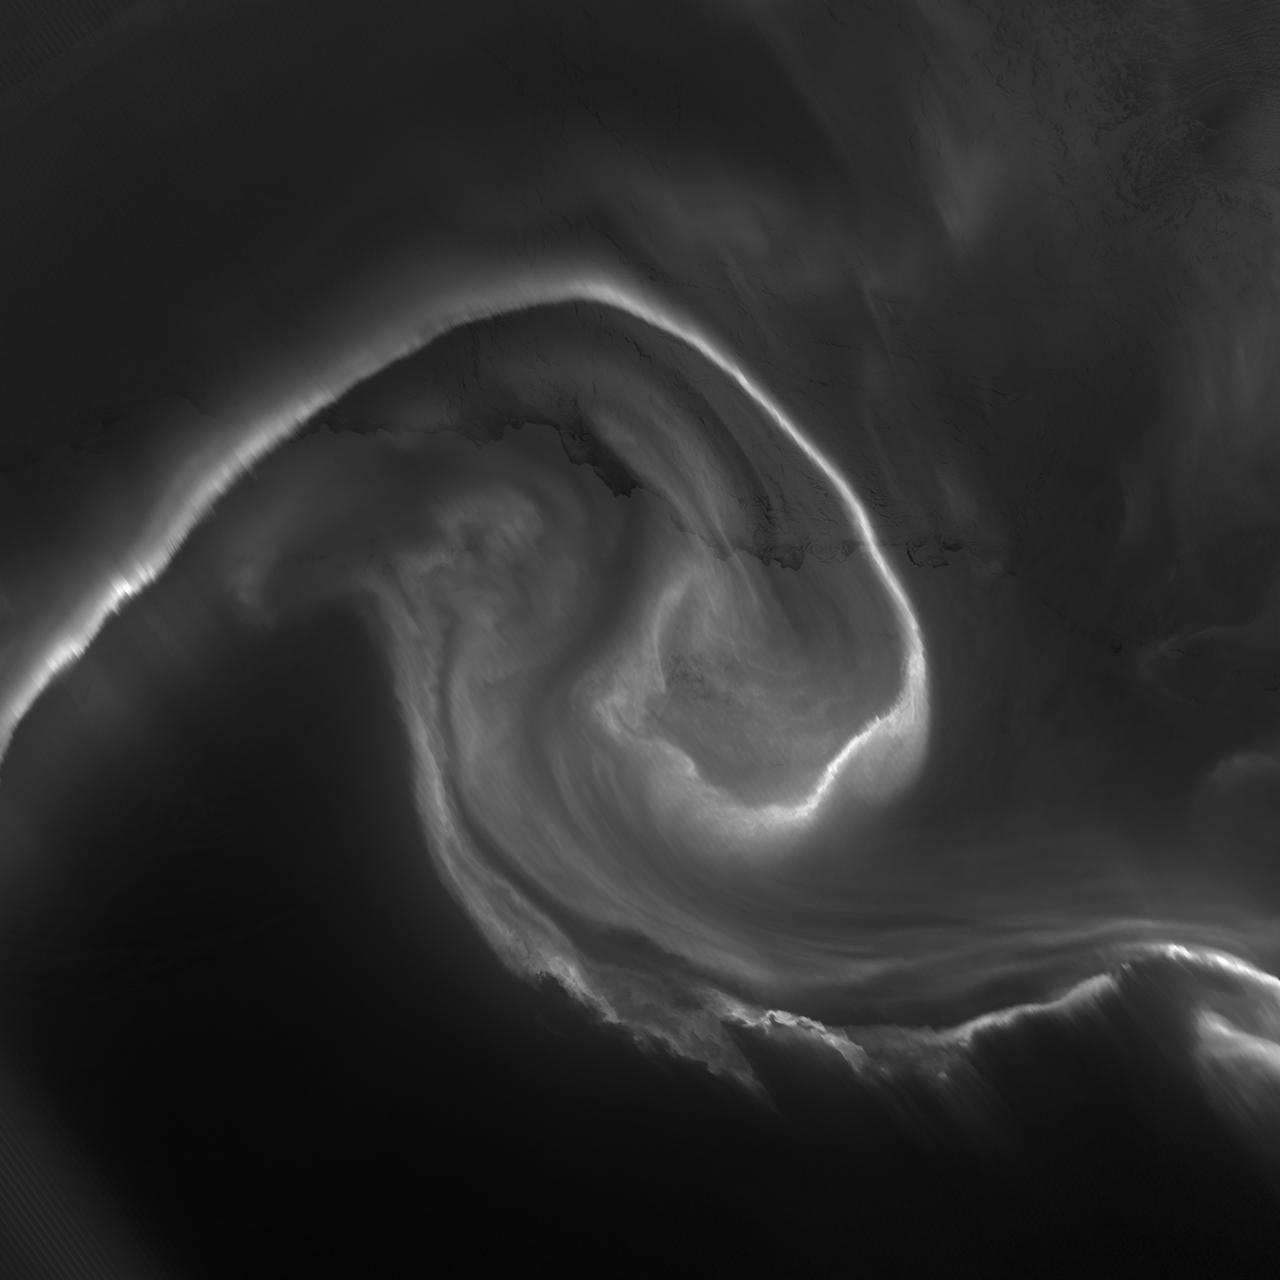
NASA acquired July 15, 2012 On July 15, 2012, the Visible Infrared Imaging Radiometer Suite (VIIRS) on the Suomi NPP satellite captured this nighttime view of the aurora australis, or “southern lights,” over Antartica’s Queen Maud Land and the Princess Ragnhild Coast. The image was captured by the VIIRS “day-night band,” which detects light in a range of wavelengths from green to near-infrared and uses filtering techniques to observe signals such as city lights, auroras, wildfires, and reflected moonlight. In the case of the image above, the sensor detected the visible auroral light emissions as energetic particles rained down from Earth’s magnetosphere and into the gases of the upper atmosphere. The slightly jagged appearance of the auroral lines is a function of the rapid dance of the energetic particles at the same time that the satellite is moving and the VIIRS sensor is scanning. The yellow box in the top image depicts the area shown in the lower close-up image. Light from the aurora was bright enough to illuminate the ice edge between the ice shelf and the Southern Ocean. At the time, Antarctica was locked in midwinter darkness and the Moon was a waning crescent that provided little light. NASA Earth Observatory image by Jesse Allen and Robert Simmon, using VIIRS Day-Night Band data from the Suomi National Polar-orbiting Partnership. Suomi NPP is the result of a partnership between NASA, the National Oceanic and Atmospheric Administration, and the Department of Defense. Caption by Mike Carlowicz. Instrument: Suomi NPP - VIIRS Credit: <b><a href="http://www.earthobservatory.nasa.gov/" rel="nofollow"> NASA Earth Observatory</a></b> <b>Click here to view all of the <a href="http://earthobservatory.nasa.gov/Features/NightLights/" rel="nofollow"> Earth at Night 2012 images </a></b> <b>Click here to <a href="http://earthobservatory.nasa.gov/NaturalHazards/view.php?id=79750" rel="nofollow"> read more </a> about this image </b> <b><a href="http://www.nasa.gov/audience/formedia/features/MP_Photo_Guidelines.html" rel="nofollow">NASA image use policy.</a></b> <b><a href="http://www.nasa.gov/centers/goddard/home/index.html" rel="nofollow">NASA Goddard Space Flight Center</a></b> enables NASA’s mission through four scientific endeavors: Earth Science, Heliophysics, Solar System Exploration, and Astrophysics. Goddard plays a leading role in NASA’s accomplishments by contributing compelling scientific knowledge to advance the Agency’s mission. <b>Follow us on <a href="http://twitter.com/NASA_GoddardPix" rel="nofollow">Twitter</a></b> <b>Like us on <a href="http://www.facebook.com/pages/Greenbelt-MD/NASA-Goddard/395013845897?ref=tsd" rel="nofollow">Facebook</a></b> <b>Find us on <a href="http://instagram.com/nasagoddard?vm=grid" rel="nofollow">Instagram</a></b>
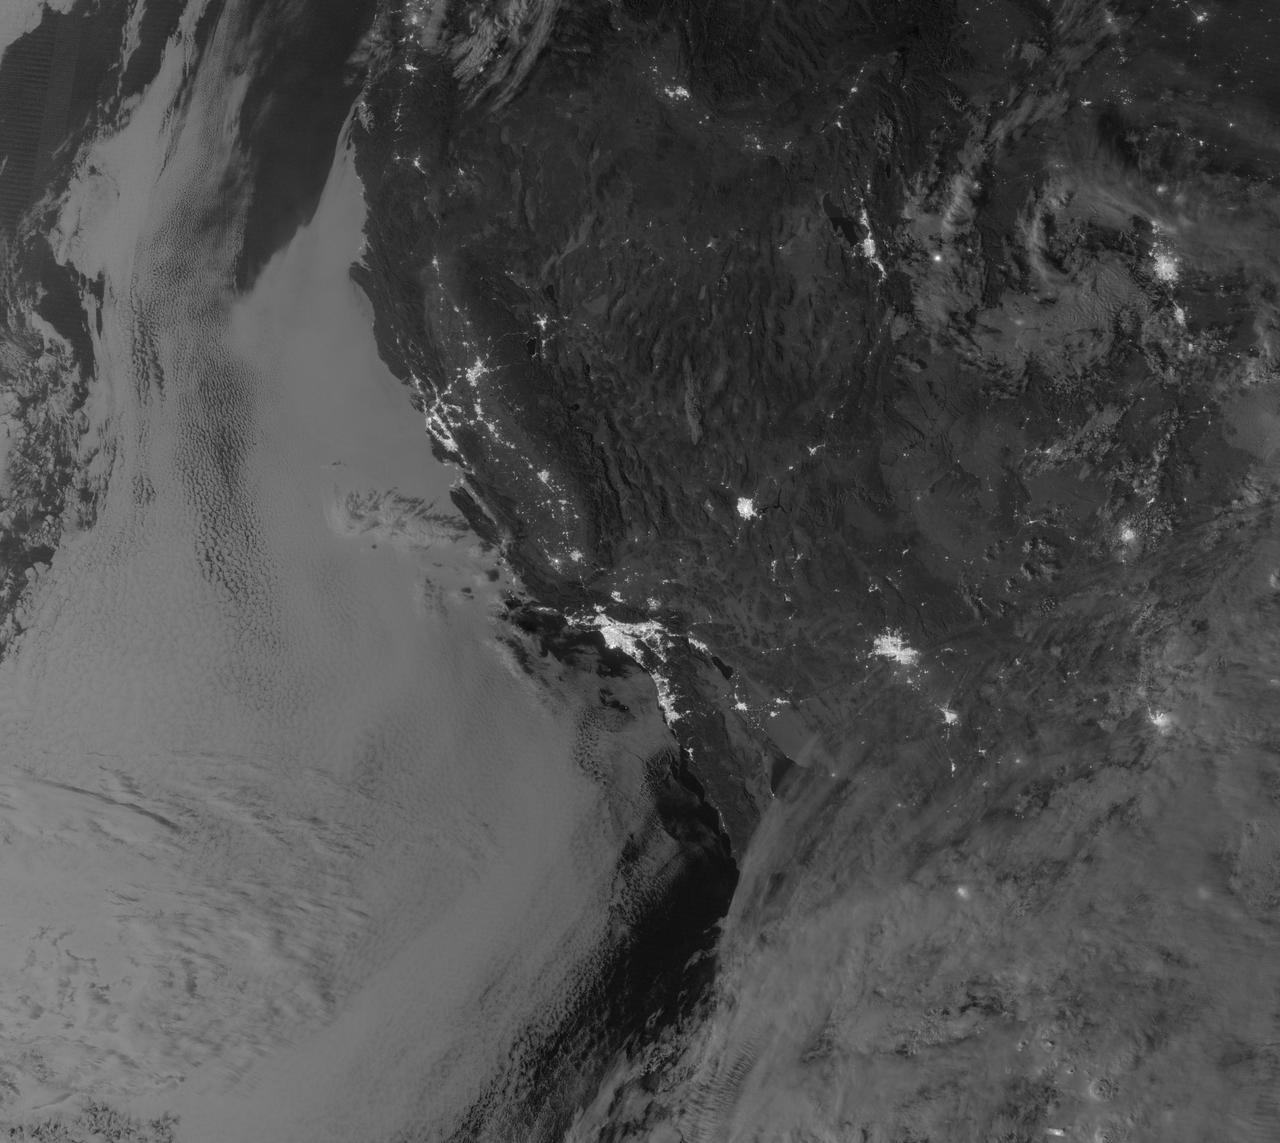
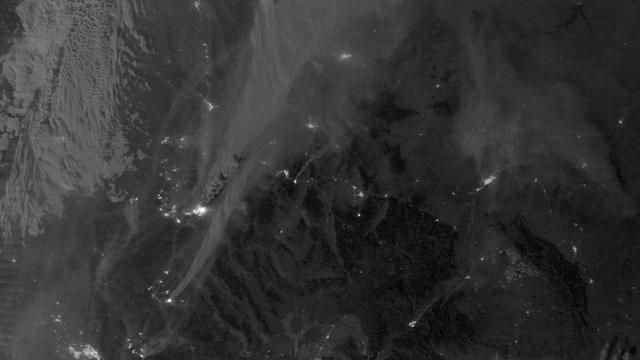
NASA image acquired September 27, 2012 On September 27, 2012, the Visible Infrared Imaging Radiometer Suite (VIIRS) on the Suomi NPP satellite captured this nighttime view of low-lying marine layer clouds along the coast of California. The image was captured by the VIIRS “day-night band,” which detects light in a range of wavelengths from green to near-infrared and uses filtering techniques to observe signals such as gas flares, auroras, wildfires, city lights, and reflected moonlight. An irregularly-shaped patch of high clouds hovers off the coast of California, and moonlight caused the high clouds to cast distinct shadows on the marine layer clouds below. VIIRS acquired the image when the Moon was in its waxing gibbous phase, meaning it was more than half-lit, but less than full. Low clouds pose serious hazards for air and ship traffic, but satellites have had difficulty detecting them in the past. To illustrate this, the second image shows the same scene in thermal infrared, the band that meteorologists generally use to monitor clouds at night. Only high clouds are visible; the low clouds do not show up at all because they are roughly the same temperature as the ground. NASA Earth Observatory image by Jesse Allen and Robert Simmon, using VIIRS Day-Night Band data from the Suomi National Polar-orbiting Partnership. Suomi NPP is the result of a partnership between NASA, the National Oceanic and Atmospheric Administration, and the Department of Defense. Caption by Adam Voiland. Instrument: Suomi NPP - VIIRS Credit: <b><a href="http://www.earthobservatory.nasa.gov/" rel="nofollow"> NASA Earth Observatory</a></b> <b>Click here to view all of the <a href="http://earthobservatory.nasa.gov/Features/NightLights/" rel="nofollow"> Earth at Night 2012 images </a></b> <b>Click here to <a href="http://earthobservatory.nasa.gov/NaturalHazards/view.php?id=79758" rel="nofollow"> read more </a> about this image </b> <b><a href="http://www.nasa.gov/audience/formedia/features/MP_Photo_Guidelines.html" rel="nofollow">NASA image use policy.</a></b> <b><a href="http://www.nasa.gov/centers/goddard/home/index.html" rel="nofollow">NASA Goddard Space Flight Center</a></b> enables NASA’s mission through four scientific endeavors: Earth Science, Heliophysics, Solar System Exploration, and Astrophysics. Goddard plays a leading role in NASA’s accomplishments by contributing compelling scientific knowledge to advance the Agency’s mission. <b>Follow us on <a href="http://twitter.com/NASA_GoddardPix" rel="nofollow">Twitter</a></b> <b>Like us on <a href="http://www.facebook.com/pages/Greenbelt-MD/NASA-Goddard/395013845897?ref=tsd" rel="nofollow">Facebook</a></b> <b>Find us on <a href="http://instagram.com/nasagoddard?vm=grid" rel="nofollow">Instagram</a></b>
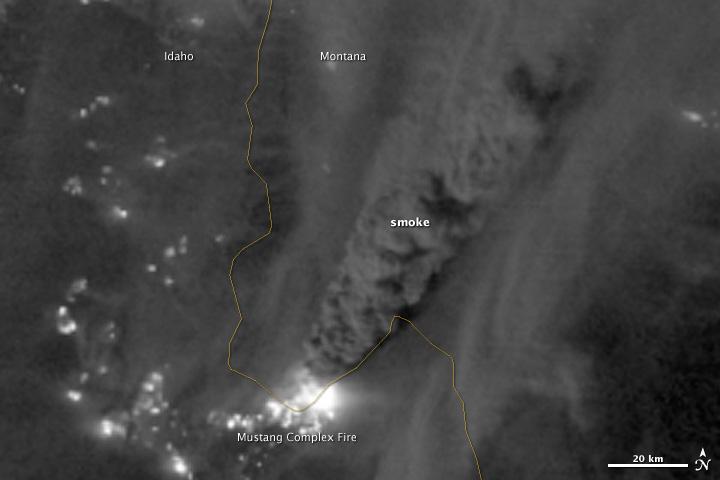
On August 29, 2012, the Visible Infrared Imaging Radiometer Suite (VIIRS) on the Suomi NPP satellite captured this nighttime view of wildfires burning in Idaho and Montana. The image was captured by the VIIRS “day-night band,” which detects light in a range of wavelengths from green to near-infrared and uses filtering techniques to observe signals such as gas flares, auroras, wildfires, city lights, and reflected moonlight. When the image was acquired, the moon was in its waxing gibbous phase, meaning it was more than half-lit, but less than full. Numerous hot spots from the Mustang Complex Fire are visible in northern Idaho. A plume of thick, billowing smoke streams west from the brightest fires near the Idaho-Montana border. The Halstead and Trinity Ridge fires are visible to the south. In addition to the fires, city lights from Boise and other smaller cities appear throughout the image. A bank of clouds is located west of the Mustang Complex, over southeastern Washington and northeastern Oregon. The Operational Line System (OLS)—an earlier generation of night-viewing sensors on the U.S. Defense Meteorological Satellite Program (DMSP) satellites—was also capable of detecting fires at night. But the VIIRS “day-night band” is far better than OLS at resolving them. Each pixel of an VIIRS image shows roughly 740 meters (0.46 miles), compared to the 3-kilometer footprint (1.86 miles) on the OLS system. NASA Earth Observatory image by Jesse Allen and Robert Simmon, using VIIRS Day-Night Band data from the Suomi National Polar-orbiting Partnership. Suomi NPP is the result of a partnership between NASA, the National Oceanic and Atmospheric Administration, and the Department of Defense. Caption by Adam Voiland. Instrument: Suomi NPP - VIIRS Credit: <b><a href="http://www.earthobservatory.nasa.gov/" rel="nofollow"> NASA Earth Observatory</a></b> <b>Click here to view all of the <a href="http://earthobservatory.nasa.gov/Features/NightLights/" rel="nofollow"> Earth at Night 2012 images </a></b> <b>Click here to <a href="http://earthobservatory.nasa.gov/NaturalHazards/view.php?id=79754" rel="nofollow"> read more </a> about this image </b> <b><a href="http://www.nasa.gov/audience/formedia/features/MP_Photo_Guidelines.html" rel="nofollow">NASA image use policy.</a></b> <b><a href="http://www.nasa.gov/centers/goddard/home/index.html" rel="nofollow">NASA Goddard Space Flight Center</a></b> enables NASA’s mission through four scientific endeavors: Earth Science, Heliophysics, Solar System Exploration, and Astrophysics. Goddard plays a leading role in NASA’s accomplishments by contributing compelling scientific knowledge to advance the Agency’s mission. <b>Follow us on <a href="http://twitter.com/NASA_GoddardPix" rel="nofollow">Twitter</a></b> <b>Like us on <a href="http://www.facebook.com/pages/Greenbelt-MD/NASA-Goddard/395013845897?ref=tsd" rel="nofollow">Facebook</a></b> <b>Find us on <a href="http://instagram.com/nasagoddard?vm=grid" rel="nofollow">Instagram</a></b>
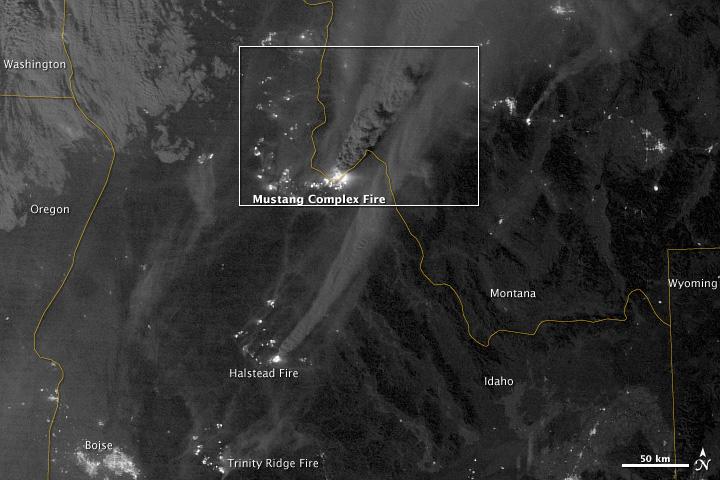
On August 29, 2012, the Visible Infrared Imaging Radiometer Suite (VIIRS) on the Suomi NPP satellite captured this nighttime view of wildfires burning in Idaho and Montana. The image was captured by the VIIRS “day-night band,” which detects light in a range of wavelengths from green to near-infrared and uses filtering techniques to observe signals such as gas flares, auroras, wildfires, city lights, and reflected moonlight. When the image was acquired, the moon was in its waxing gibbous phase, meaning it was more than half-lit, but less than full. Numerous hot spots from the Mustang Complex Fire are visible in northern Idaho. A plume of thick, billowing smoke streams west from the brightest fires near the Idaho-Montana border. The Halstead and Trinity Ridge fires are visible to the south. In addition to the fires, city lights from Boise and other smaller cities appear throughout the image. A bank of clouds is located west of the Mustang Complex, over southeastern Washington and northeastern Oregon. The Operational Line System (OLS)—an earlier generation of night-viewing sensors on the U.S. Defense Meteorological Satellite Program (DMSP) satellites—was also capable of detecting fires at night. But the VIIRS “day-night band” is far better than OLS at resolving them. Each pixel of an VIIRS image shows roughly 740 meters (0.46 miles), compared to the 3-kilometer footprint (1.86 miles) on the OLS system. NASA Earth Observatory image by Jesse Allen and Robert Simmon, using VIIRS Day-Night Band data from the Suomi National Polar-orbiting Partnership. Suomi NPP is the result of a partnership between NASA, the National Oceanic and Atmospheric Administration, and the Department of Defense. Caption by Adam Voiland. Instrument: Suomi NPP - VIIRS Credit: <b><a href="http://www.earthobservatory.nasa.gov/" rel="nofollow"> NASA Earth Observatory</a></b> <b>Click here to view all of the <a href="http://earthobservatory.nasa.gov/Features/NightLights/" rel="nofollow"> Earth at Night 2012 images </a></b> <b>Click here to <a href="http://earthobservatory.nasa.gov/NaturalHazards/view.php?id=79754" rel="nofollow"> read more </a> about this image </b> <b><a href="http://www.nasa.gov/audience/formedia/features/MP_Photo_Guidelines.html" rel="nofollow">NASA image use policy.</a></b> <b><a href="http://www.nasa.gov/centers/goddard/home/index.html" rel="nofollow">NASA Goddard Space Flight Center</a></b> enables NASA’s mission through four scientific endeavors: Earth Science, Heliophysics, Solar System Exploration, and Astrophysics. Goddard plays a leading role in NASA’s accomplishments by contributing compelling scientific knowledge to advance the Agency’s mission. <b>Follow us on <a href="http://twitter.com/NASA_GoddardPix" rel="nofollow">Twitter</a></b> <b>Like us on <a href="http://www.facebook.com/pages/Greenbelt-MD/NASA-Goddard/395013845897?ref=tsd" rel="nofollow">Facebook</a></b> <b>Find us on <a href="http://instagram.com/nasagoddard?vm=grid" rel="nofollow">Instagram</a></b>
On August 29, 2012, the Visible Infrared Imaging Radiometer Suite (VIIRS) on the Suomi NPP satellite captured this nighttime view of wildfires burning in Idaho and Montana. The image was captured by the VIIRS “day-night band,” which detects light in a range of wavelengths from green to near-infrared and uses filtering techniques to observe signals such as gas flares, auroras, wildfires, city lights, and reflected moonlight. When the image was acquired, the moon was in its waxing gibbous phase, meaning it was more than half-lit, but less than full. Numerous hot spots from the Mustang Complex Fire are visible in northern Idaho. A plume of thick, billowing smoke streams west from the brightest fires near the Idaho-Montana border. The Halstead and Trinity Ridge fires are visible to the south. In addition to the fires, city lights from Boise and other smaller cities appear throughout the image. A bank of clouds is located west of the Mustang Complex, over southeastern Washington and northeastern Oregon. The Operational Line System (OLS)—an earlier generation of night-viewing sensors on the U.S. Defense Meteorological Satellite Program (DMSP) satellites—was also capable of detecting fires at night. But the VIIRS “day-night band” is far better than OLS at resolving them. Each pixel of an VIIRS image shows roughly 740 meters (0.46 miles), compared to the 3-kilometer footprint (1.86 miles) on the OLS system. NASA Earth Observatory image by Jesse Allen and Robert Simmon, using VIIRS Day-Night Band data from the Suomi National Polar-orbiting Partnership. Suomi NPP is the result of a partnership between NASA, the National Oceanic and Atmospheric Administration, and the Department of Defense. Caption by Adam Voiland. Instrument: Suomi NPP - VIIRS Credit: <b><a href="http://www.earthobservatory.nasa.gov/" rel="nofollow"> NASA Earth Observatory</a></b> <b>Click here to view all of the <a href="http://earthobservatory.nasa.gov/Features/NightLights/" rel="nofollow"> Earth at Night 2012 images </a></b> <b>Click here to <a href="http://earthobservatory.nasa.gov/NaturalHazards/view.php?id=79754" rel="nofollow"> read more </a> about this image </b> <b><a href="http://www.nasa.gov/audience/formedia/features/MP_Photo_Guidelines.html" rel="nofollow">NASA image use policy.</a></b> <b><a href="http://www.nasa.gov/centers/goddard/home/index.html" rel="nofollow">NASA Goddard Space Flight Center</a></b> enables NASA’s mission through four scientific endeavors: Earth Science, Heliophysics, Solar System Exploration, and Astrophysics. Goddard plays a leading role in NASA’s accomplishments by contributing compelling scientific knowledge to advance the Agency’s mission. <b>Follow us on <a href="http://twitter.com/NASA_GoddardPix" rel="nofollow">Twitter</a></b> <b>Like us on <a href="http://www.facebook.com/pages/Greenbelt-MD/NASA-Goddard/395013845897?ref=tsd" rel="nofollow">Facebook</a></b> <b>Find us on <a href="http://instagram.com/nasagoddard?vm=grid" rel="nofollow">Instagram</a></b>

Behold one of the more detailed images of the Earth yet created. This Blue Marble Earth montage shown above -- created from photographs taken by the Visible/Infrared Imager Radiometer Suite (VIIRS) instrument on board the new Suomi NPP satellite -- shows many stunning details of our home planet. The Suomi NPP satellite was launched last October and renamed last week after Verner Suomi, commonly deemed the father of satellite meteorology. The composite was created from the data collected during four orbits of the robotic satellite taken earlier this month and digitally projected onto the globe. Many features of North America and the Western Hemisphere are particularly visible on a high resolution version of the image. http://photojournal.jpl.nasa.gov/catalog/PIA18033
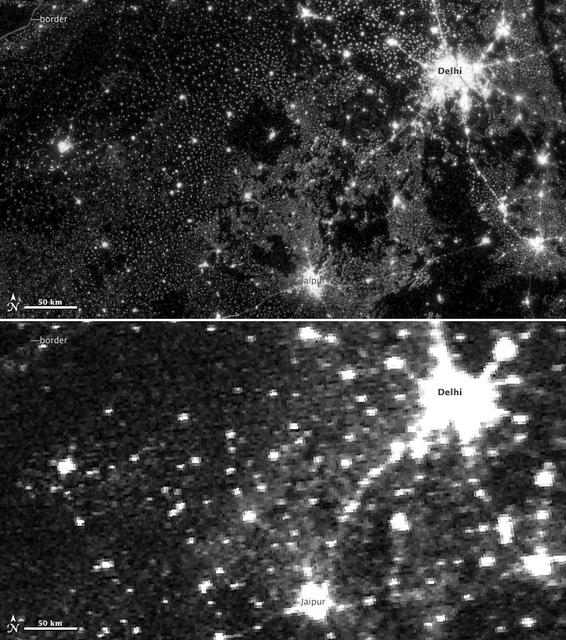
NASA image acquired November 11-12, 2012. On November 12, 2012, the Visible Infrared Imaging Radiometer Suite (VIIRS) on the Suomi NPP satellite captured the top nighttime image of city, village, and highway lights near Delhi, India. For comparison, the lower image shows the same area one night earlier, as observed by the Operational Line Scan (OLS) system on a Defense Meteorological Satellite Program (DMSP) spacecraft. Since the 1960s, the U.S. Air Force has operated DMSP in order to observe clouds and other weather variables in key wavelengths of infrared and visible light. Since 1972, the DMSP satellites have included the Operational Linescan System (OLS), which gives weather forecasters some ability to see in the dark. It has been a highly successful sensor, but it is dependent on older technology with lower resolution than most scientists would like. And for many years, DMSP data were classified. Through improved optics and “smart” sensing technology, the VIIRS “day-night band,” is ten to fifteen times better than the OLS system at resolving the relatively dim lights of human settlements and reflected moonlight. Each VIIRS pixel shows roughly 740 meters (0.46 miles) across, compared to the 3-kilometer footprint (1.86 miles) of DMSP. Beyond the resolution, the new sensor can detect dimmer light sources. And since the VIIRS measurements are fully calibrated (unlike DMSP), scientists now have the precision required to make quantitative measurements of clouds and other features. “In contrast to the Operational Line Scan system, the imagery from the new day-night band is almost like a nearsighted person putting on glasses for the first time and looking at the Earth anew,” says Steve Miller, an atmospheric scientist at Colorado State University. “VIIRS has allowed us to bring this coarse, blurry view of night lights into clearer focus. Now we can see things in such great detail and at such high precision that we’re really talking about a new kind of measurement.” Unlike a film camera that captures a photograph in one exposure, VIIRS produces an image by repeatedly scanning a scene and resolving it as millions of individual picture elements, or pixels. The day-night band goes a step further, determining on-the-fly whether to use its low, medium, or high-gain mode. If a pixel is very bright, a low-gain mode on the sensor prevents the pixel from over-saturating. If the pixel is dark, the signal will be amplified. “On a hand-held camera, there’s a nighttime setting where the shutter will stay open much longer than it would under daylight imaging conditions,” says Chris Elvidge, who leads the Earth Observation Group at NOAA’s National Geophysical Data Center. “The day-night band is similar. It increases the exposure time—the amount of time that it’s collecting photons for pixels.” NASA Earth Observatory image by Jesse Allen and Robert Simmon, using Suomi NPP VIIRS and DMSP OLS data provided courtesy of Chris Elvidge (NOAA National Geophysical Data Center). Suomi NPP is the result of a partnership between NASA, NOAA, and the Department of Defense. Caption by Mike Carlowicz. Instrument: Suomi NPP - VIIRS Credit: <b><a href="http://www.earthobservatory.nasa.gov/" rel="nofollow"> NASA Earth Observatory</a></b> <b>Click here to view all of the <a href="http://earthobservatory.nasa.gov/Features/NightLights/" rel="nofollow"> Earth at Night 2012 images </a></b> <b>Click here to <a href="http://earthobservatory.nasa.gov/NaturalHazards/view.php?id=79846" rel="nofollow"> read more </a> about this image </b> <b><a href="http://www.nasa.gov/audience/formedia/features/MP_Photo_Guidelines.html" rel="nofollow">NASA image use policy.</a></b> <b><a href="http://www.nasa.gov/centers/goddard/home/index.html" rel="nofollow">NASA Goddard Space Flight Center</a></b> enables NASA’s mission through four scientific endeavors: Earth Science, Heliophysics, Solar System Exploration, and Astrophysics. Goddard plays a leading role in NASA’s accomplishments by contributing compelling scientific
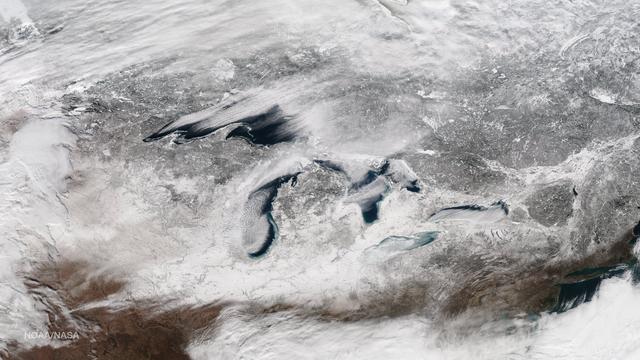
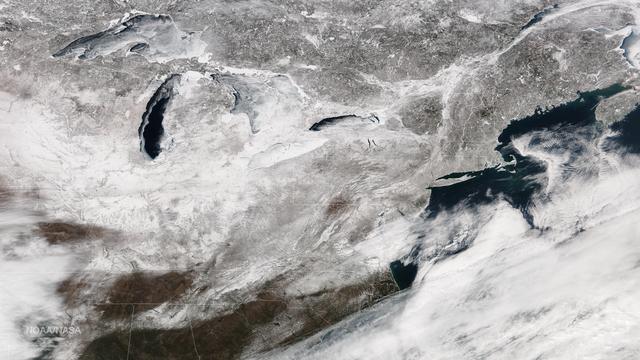
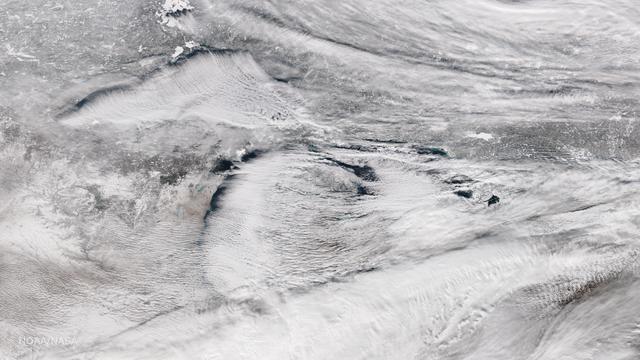
This image taken on January 13, 2015 from the Suomi NPP satellite's VIIRS instrument shows the Great Lakes and surrounding areas. The latest Great Lakes Surface Environmental Analysis (GLSEA) from the NOAA Great Lakes Environmental Research Laboratory shows total ice cover of 29.3% as of January 13th. Credit: NOAA/NASA/NPP Via <b><a href="www.nnvl.noaa.gov/" rel="nofollow"> NOAA Environmental Visualization Laboratory</a></b>
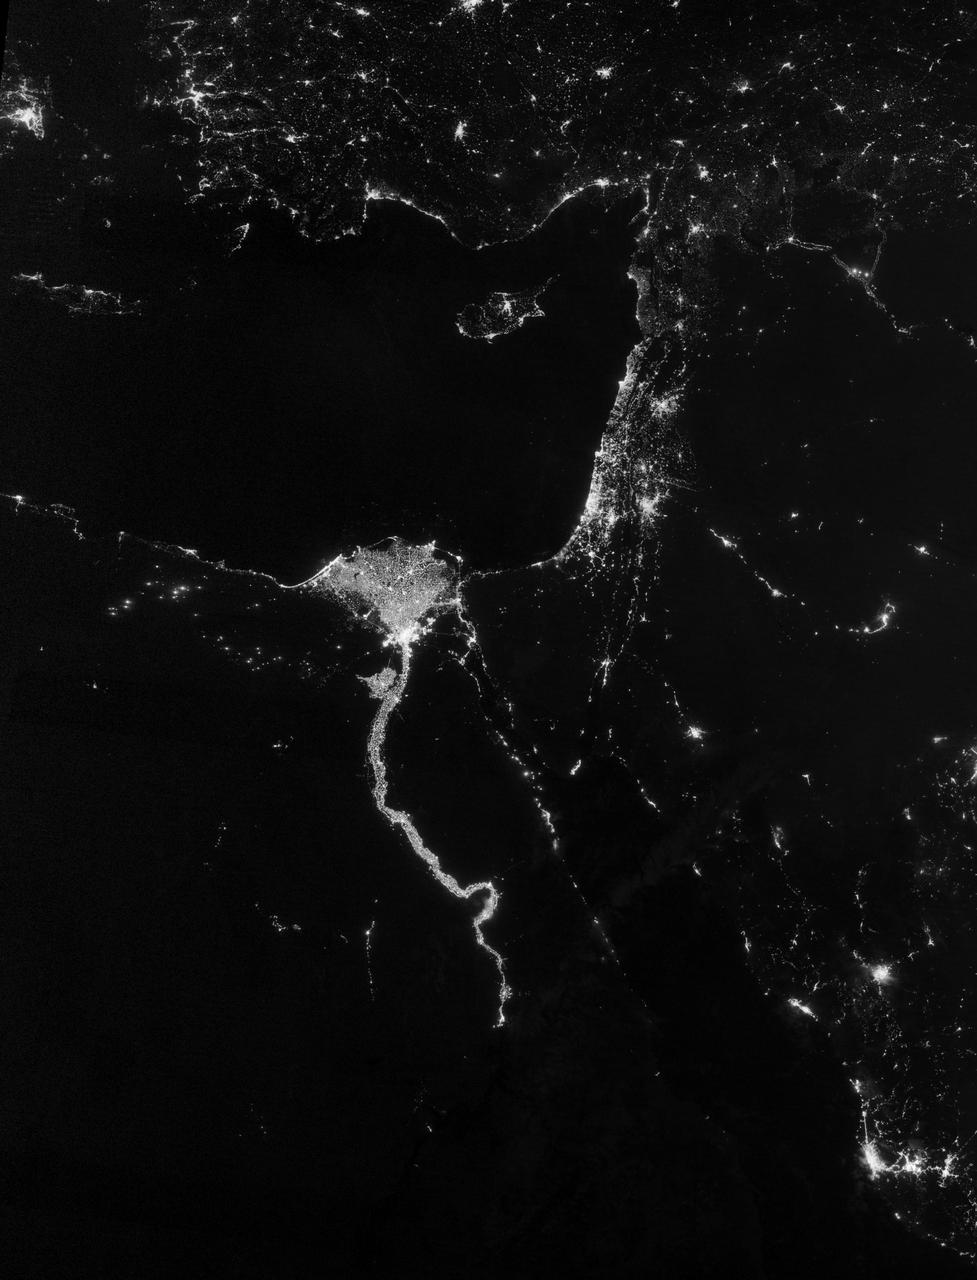
NASA image acquired October 13, 2012 The Nile River Valley and Delta comprise less than 5 percent of Egypt’s land area, but provide a home to roughly 97 percent of the country’s population. Nothing makes the location of human population clearer than the lights illuminating the valley and delta at night. On October 13, 2012, the Visible Infrared Imaging Radiometer Suite (VIIRS) on the Suomi NPP satellite captured this nighttime view of the Nile River Valley and Delta. This image is from the VIIRS “day-night band,” which detects light in a range of wavelengths from green to near-infrared and uses filtering techniques to observe signals such as gas flares, auroras, wildfires, city lights, and reflected moonlight. The city lights resemble a giant calla lily, just one with a kink in its stem near the city of Luxor. Some of the brightest lights occur around Cairo, but lights are abundant along the length of the river. Bright city lights also occur along the Suez Canal and around Tel Aviv. Away from the lights, however, land and water appear uniformly black. This image was acquired near the time of the new Moon, and little moonlight was available to brighten land and water surfaces. NASA Earth Observatory image by Jesse Allen and Robert Simmon, using VIIRS Day-Night Band data from the Suomi National Polar-orbiting Partnership. Suomi NPP is the result of a partnership between NASA, the National Oceanic and Atmospheric Administration, and the Department of Defense. Caption by Michon Scott. Instrument: Suomi NPP - VIIRS Credit: <b><a href="http://www.earthobservatory.nasa.gov/" rel="nofollow"> NASA Earth Observatory</a></b> <b>Click here to view all of the <a href="http://earthobservatory.nasa.gov/Features/NightLights/" rel="nofollow"> Earth at Night 2012 images </a></b> <b>Click here to <a href="http://earthobservatory.nasa.gov/NaturalHazards/view.php?id=79807" rel="nofollow"> read more </a> about this image </b> <b><a href="http://www.nasa.gov/audience/formedia/features/MP_Photo_Guidelines.html" rel="nofollow">NASA image use policy.</a></b> <b><a href="http://www.nasa.gov/centers/goddard/home/index.html" rel="nofollow">NASA Goddard Space Flight Center</a></b> enables NASA’s mission through four scientific endeavors: Earth Science, Heliophysics, Solar System Exploration, and Astrophysics. Goddard plays a leading role in NASA’s accomplishments by contributing compelling scientific knowledge to advance the Agency’s mission. <b>Follow us on <a href="http://twitter.com/NASA_GoddardPix" rel="nofollow">Twitter</a></b> <b>Like us on <a href="http://www.facebook.com/pages/Greenbelt-MD/NASA-Goddard/395013845897?ref=tsd" rel="nofollow">Facebook</a></b> <b>Find us on <a href="http://instagram.com/nasagoddard?vm=grid" rel="nofollow">Instagram</a></b>
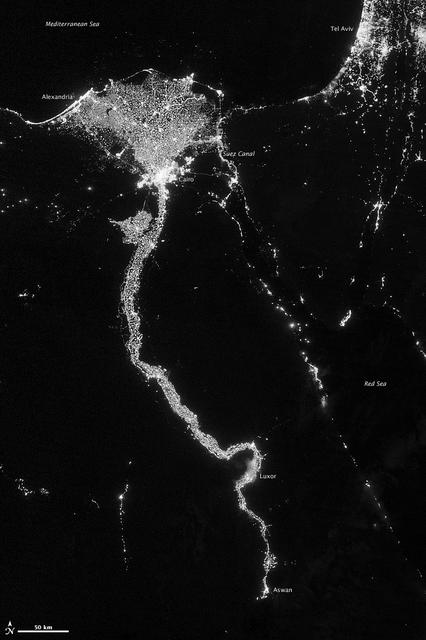
NASA image acquired October 13, 2012 The Nile River Valley and Delta comprise less than 5 percent of Egypt’s land area, but provide a home to roughly 97 percent of the country’s population. Nothing makes the location of human population clearer than the lights illuminating the valley and delta at night. On October 13, 2012, the Visible Infrared Imaging Radiometer Suite (VIIRS) on the Suomi NPP satellite captured this nighttime view of the Nile River Valley and Delta. This image is from the VIIRS “day-night band,” which detects light in a range of wavelengths from green to near-infrared and uses filtering techniques to observe signals such as gas flares, auroras, wildfires, city lights, and reflected moonlight. The city lights resemble a giant calla lily, just one with a kink in its stem near the city of Luxor. Some of the brightest lights occur around Cairo, but lights are abundant along the length of the river. Bright city lights also occur along the Suez Canal and around Tel Aviv. Away from the lights, however, land and water appear uniformly black. This image was acquired near the time of the new Moon, and little moonlight was available to brighten land and water surfaces. NASA Earth Observatory image by Jesse Allen and Robert Simmon, using VIIRS Day-Night Band data from the Suomi National Polar-orbiting Partnership. Suomi NPP is the result of a partnership between NASA, the National Oceanic and Atmospheric Administration, and the Department of Defense. Caption by Michon Scott. Instrument: Suomi NPP - VIIRS Credit: <b><a href="http://www.earthobservatory.nasa.gov/" rel="nofollow"> NASA Earth Observatory</a></b> <b>Click here to view all of the <a href="http://earthobservatory.nasa.gov/Features/NightLights/" rel="nofollow"> Earth at Night 2012 images </a></b> <b>Click here to <a href="http://earthobservatory.nasa.gov/NaturalHazards/view.php?id=79807" rel="nofollow"> read more </a> about this image </b> <b><a href="http://www.nasa.gov/audience/formedia/features/MP_Photo_Guidelines.html" rel="nofollow">NASA image use policy.</a></b> <b><a href="http://www.nasa.gov/centers/goddard/home/index.html" rel="nofollow">NASA Goddard Space Flight Center</a></b> enables NASA’s mission through four scientific endeavors: Earth Science, Heliophysics, Solar System Exploration, and Astrophysics. Goddard plays a leading role in NASA’s accomplishments by contributing compelling scientific knowledge to advance the Agency’s mission. <b>Follow us on <a href="http://twitter.com/NASA_GoddardPix" rel="nofollow">Twitter</a></b> <b>Like us on <a href="http://www.facebook.com/pages/Greenbelt-MD/NASA-Goddard/395013845897?ref=tsd" rel="nofollow">Facebook</a></b> <b>Find us on <a href="http://instagram.com/nasagoddard?vm=grid" rel="nofollow">Instagram</a></b>
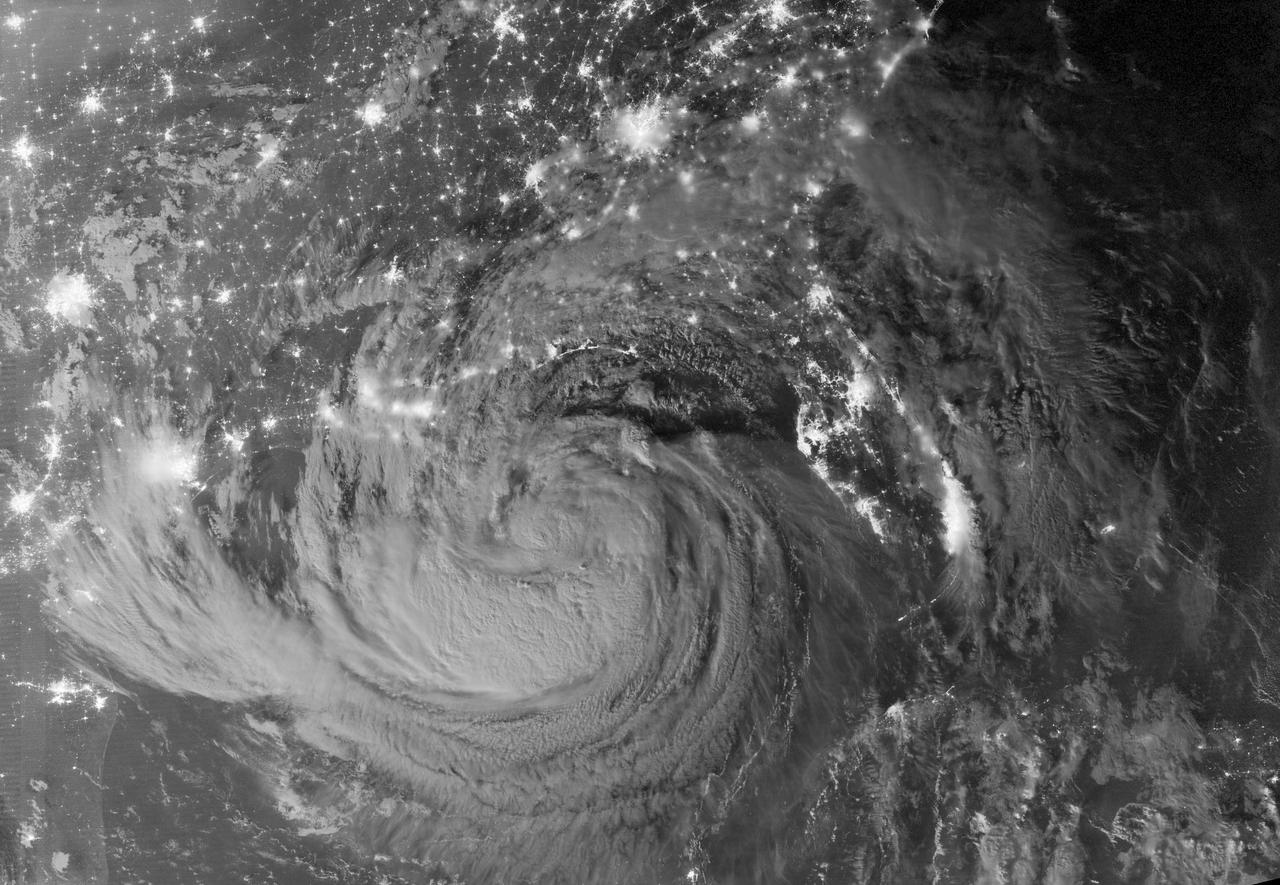
NASA image acquired August 29, 2012 1:57 a.m EDT Hurricane Isaac lit up by moonlight as it spins over the city of New Orleans, La. at 1:57 am central daylight savings time the morning of August 29, 2012. The Suomi National Polar-orbiting Partnership (NPP) satellite captured these images with its Visible Infrared Imaging Radiometer Suite (VIIRS). The "day-night band" of VIIRS detects light in a range of wavelengths from green to near-infrared and uses light intensification to enable the detection of dim signals. Suomi NPP is the result of a partnership between NASA, the National Oceanic and Atmospheric Administration and the Department of Defense. Image Credit: NASA/NOAA, Earth Observatory NASA Earth Observatory image by Jesse Allen and Robert Simmon, using VIIRS Day Night Band data. Credit: <b><a href="http://www.earthobservatory.nasa.gov/" rel="nofollow"> NASA Earth Observatory</a></b> <b><a href="http://www.nasa.gov/audience/formedia/features/MP_Photo_Guidelines.html" rel="nofollow">NASA image use policy.</a></b> <b><a href="http://www.nasa.gov/centers/goddard/home/index.html" rel="nofollow">NASA Goddard Space Flight Center</a></b> enables NASA’s mission through four scientific endeavors: Earth Science, Heliophysics, Solar System Exploration, and Astrophysics. Goddard plays a leading role in NASA’s accomplishments by contributing compelling scientific knowledge to advance the Agency’s mission. <b>Follow us on <a href="http://twitter.com/NASA_GoddardPix" rel="nofollow">Twitter</a></b> <b>Like us on <a href="http://www.facebook.com/pages/Greenbelt-MD/NASA-Goddard/395013845897?ref=tsd" rel="nofollow">Facebook</a></b> <b>Find us on <a href="http://instagrid.me/nasagoddard/?vm=grid" rel="nofollow">Instagram</a></b>
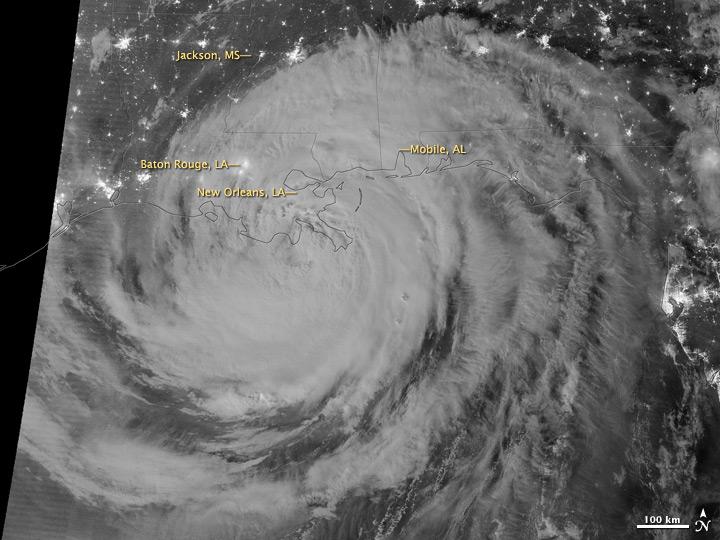
NASA image acquired August 28, 2012 Early on August 28, 2012, the Visible Infrared Imaging Radiometer Suite (VIIRS) on the Suomi-NPP satellite captured this nighttime view of Tropical Storm Isaac and the cities near the Gulf Coast of the United States. The image was acquired just after local midnight by the VIIRS “day-night band,” which detects light in a range of wavelengths from green to near-infrared and uses light intensification to enable the detection of dim signals. In this case, the clouds of Isaac were lit by moonlight. Credit: <b><a href="http://www.earthobservatory.nasa.gov/" rel="nofollow"> NASA Earth Observatory</a></b> NASA Earth Observatory image by Jesse Allen and Robert Simmon, using VIIRS Day Night Band data. <b><a href="http://www.nasa.gov/audience/formedia/features/MP_Photo_Guidelines.html" rel="nofollow">NASA image use policy.</a></b> <b><a href="http://www.nasa.gov/centers/goddard/home/index.html" rel="nofollow">NASA Goddard Space Flight Center</a></b> enables NASA’s mission through four scientific endeavors: Earth Science, Heliophysics, Solar System Exploration, and Astrophysics. Goddard plays a leading role in NASA’s accomplishments by contributing compelling scientific knowledge to advance the Agency’s mission. <b>Follow us on <a href="http://twitter.com/NASA_GoddardPix" rel="nofollow">Twitter</a></b> <b>Like us on <a href="http://www.facebook.com/pages/Greenbelt-MD/NASA-Goddard/395013845897?ref=tsd" rel="nofollow">Facebook</a></b> <b>Find us on <a href="http://instagrid.me/nasagoddard/?vm=grid" rel="nofollow">Instagram</a></b>
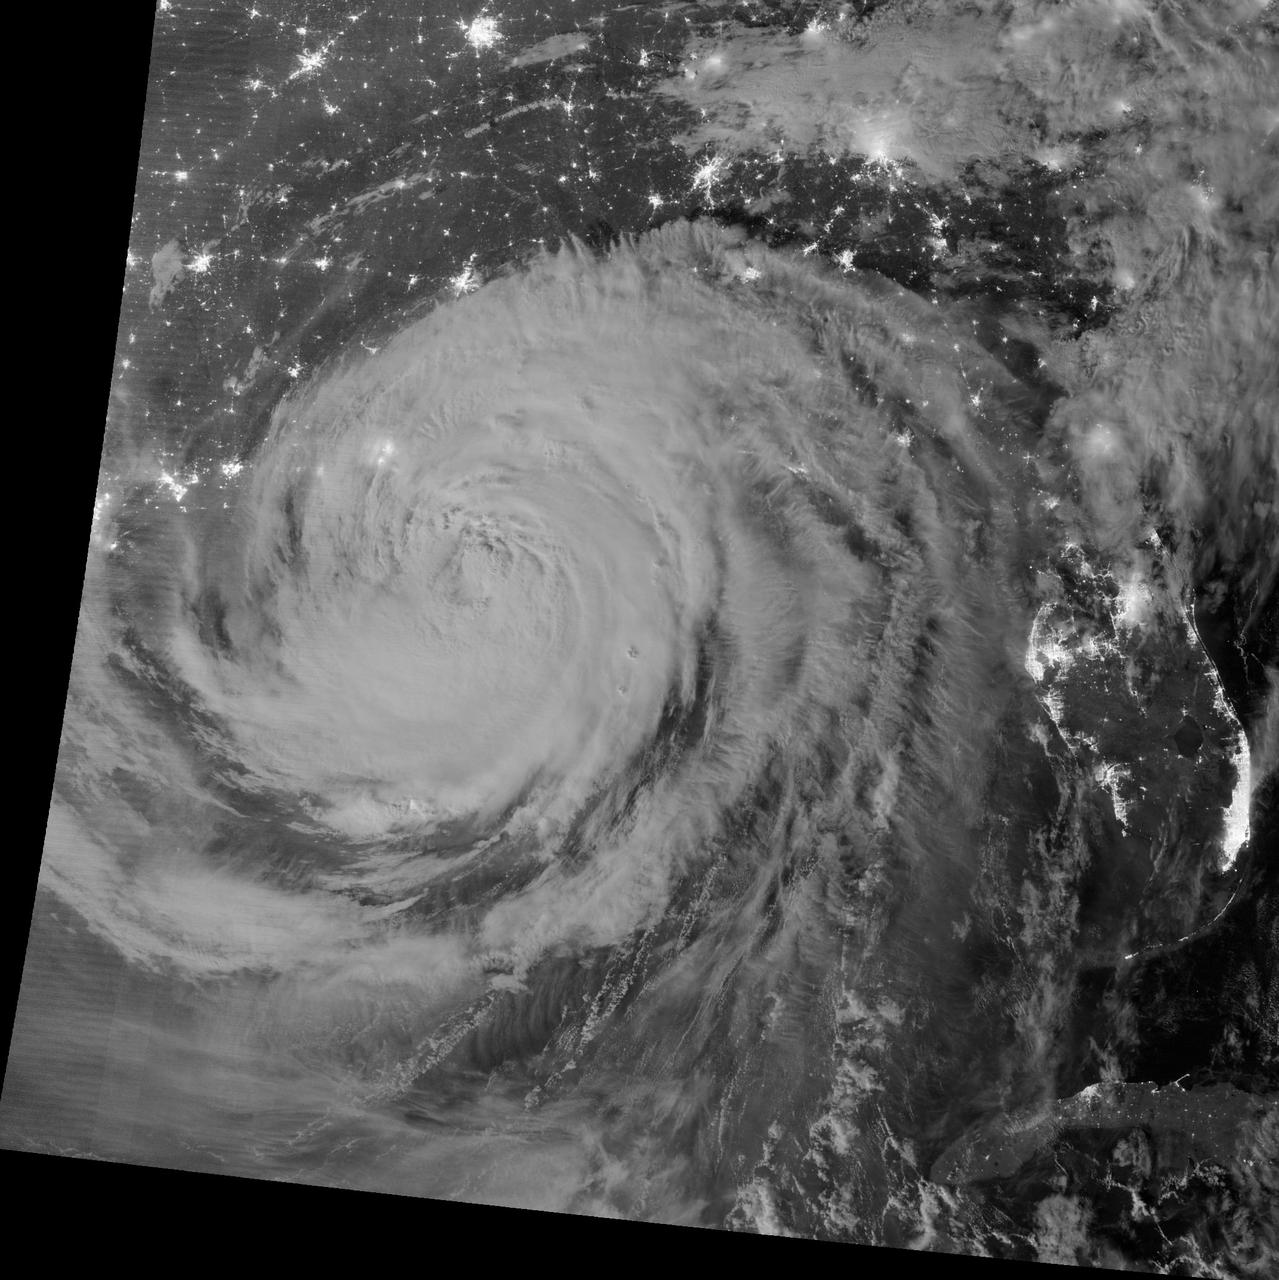
NASA image acquired August 29, 2012 1:57 a.m EDT Annotated view here: <a href="http://bit.ly/RsFT9Y" rel="nofollow">bit.ly/RsFT9Y</a> Hurricane Isaac lit up by moonlight as it spins over the city of New Orleans, La. at 1:57 am central daylight savings time the morning of August 29, 2012. The Suomi National Polar-orbiting Partnership (NPP) satellite captured these images with its Visible Infrared Imaging Radiometer Suite (VIIRS). The "day-night band" of VIIRS detects light in a range of wavelengths from green to near-infrared and uses light intensification to enable the detection of dim signals. Suomi NPP is the result of a partnership between NASA, the National Oceanic and Atmospheric Administration and the Department of Defense. Image Credit: NASA/NOAA, Earth Observatory NASA Earth Observatory image by Jesse Allen and Robert Simmon, using VIIRS Day Night Band data. Credit: <b><a href="http://www.earthobservatory.nasa.gov/" rel="nofollow"> NASA Earth Observatory</a></b> <b><a href="http://www.nasa.gov/audience/formedia/features/MP_Photo_Guidelines.html" rel="nofollow">NASA image use policy.</a></b> <b><a href="http://www.nasa.gov/centers/goddard/home/index.html" rel="nofollow">NASA Goddard Space Flight Center</a></b> enables NASA’s mission through four scientific endeavors: Earth Science, Heliophysics, Solar System Exploration, and Astrophysics. Goddard plays a leading role in NASA’s accomplishments by contributing compelling scientific knowledge to advance the Agency’s mission. <b>Follow us on <a href="http://twitter.com/NASA_GoddardPix" rel="nofollow">Twitter</a></b> <b>Like us on <a href="http://www.facebook.com/pages/Greenbelt-MD/NASA-Goddard/395013845897?ref=tsd" rel="nofollow">Facebook</a></b> <b>Find us on <a href="http://instagrid.me/nasagoddard/?vm=grid" rel="nofollow">Instagram</a></b>
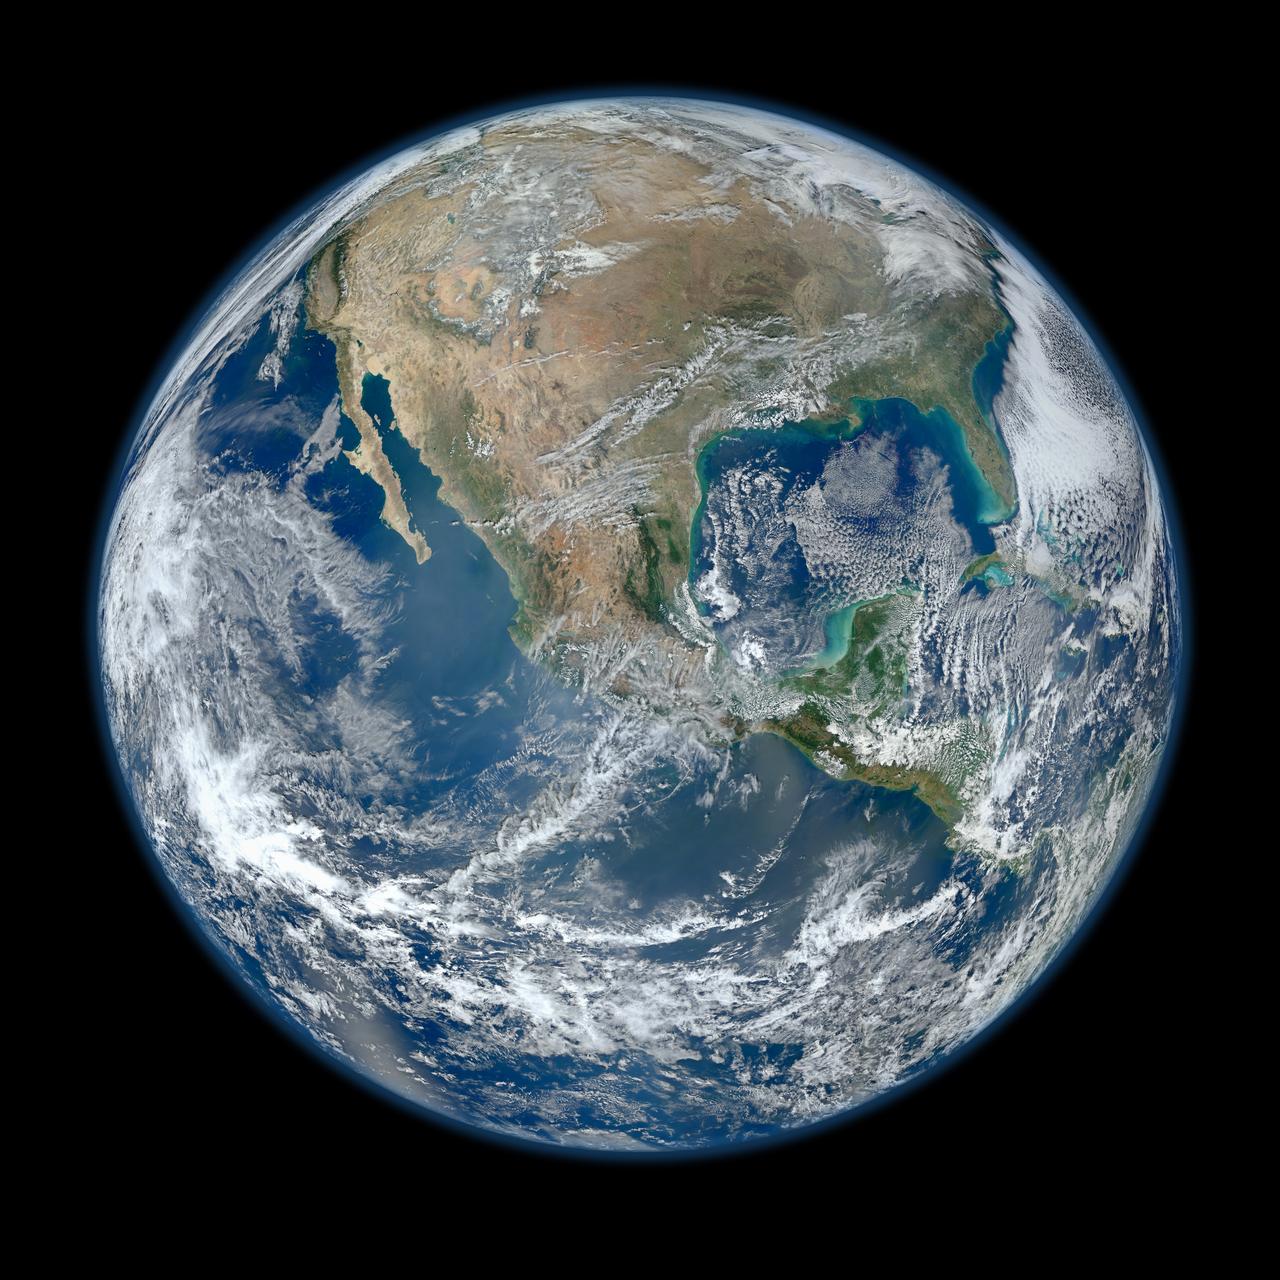
January 25, 2012 <b>*Updated February 2, 2012: According to Flickr, "The western hemisphere Blue Marble 2012 image has rocketed up to over 3.1 million views making it one of the all time most viewed images on the site after only one week."</b> A 'Blue Marble' image of the Earth taken from the VIIRS instrument aboard NASA's most recently launched Earth-observing satellite - Suomi NPP. This composite image uses a number of swaths of the Earth's surface taken on January 4, 2012. The NPP satellite was renamed 'Suomi NPP' on January 24, 2012 to honor the late Verner E. Suomi of the University of Wisconsin. Suomi NPP is NASA's next Earth-observing research satellite. It is the first of a new generation of satellites that will observe many facets of our changing Earth. Suomi NPP is carrying five instruments on board. The biggest and most important instrument is The Visible/Infrared Imager Radiometer Suite or VIIRS. To read more about NASA's Suomi NPP go to: <a href="http://www.nasa.gov/npp" rel="nofollow">www.nasa.gov/npp</a> Credit: NASA/NOAA/GSFC/Suomi NPP/VIIRS/Norman Kuring <b><a href="http://www.nasa.gov/audience/formedia/features/MP_Photo_Guidelines.html" rel="nofollow">NASA image use policy.</a></b> <b><a href="http://www.nasa.gov/centers/goddard/home/index.html" rel="nofollow">NASA Goddard Space Flight Center</a></b> enables NASA’s mission through four scientific endeavors: Earth Science, Heliophysics, Solar System Exploration, and Astrophysics. Goddard plays a leading role in NASA’s accomplishments by contributing compelling scientific knowledge to advance the Agency’s mission. <b>Follow us on <a href="http://twitter.com/NASAGoddardPix" rel="nofollow">Twitter</a></b> <b>Like us on <a href="http://www.facebook.com/pages/Greenbelt-MD/NASA-Goddard/395013845897?ref=tsd" rel="nofollow">Facebook</a></b> <b>Find us on <a href="http://instagrid.me/nasagoddard/?vm=grid" rel="nofollow">Instagram</a></b>
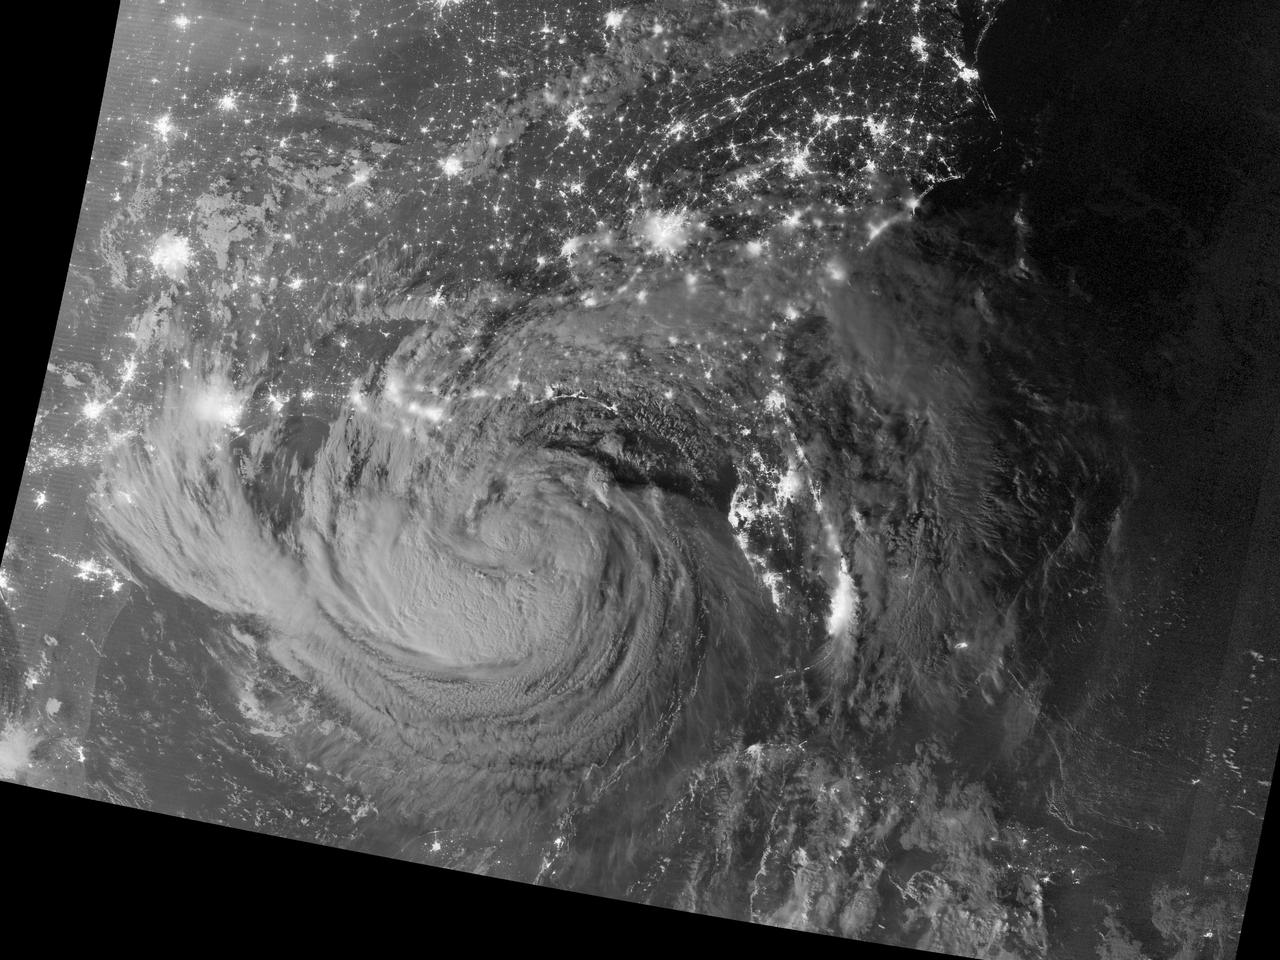
NASA image acquired August 28, 2012 Early on August 28, 2012, the Visible Infrared Imaging Radiometer Suite (VIIRS) on the Suomi-NPP satellite captured this nighttime view of Tropical Storm Isaac and the cities near the Gulf Coast of the United States. The image was acquired just after local midnight by the VIIRS “day-night band,” which detects light in a range of wavelengths from green to near-infrared and uses light intensification to enable the detection of dim signals. In this case, the clouds of Isaac were lit by moonlight. Credit: <b><a href="http://www.earthobservatory.nasa.gov/" rel="nofollow"> NASA Earth Observatory</a></b> NASA Earth Observatory image by Jesse Allen and Robert Simmon, using VIIRS Day Night Band data. Caption by Mike Carlowicz. <b><a href="http://www.nasa.gov/audience/formedia/features/MP_Photo_Guidelines.html" rel="nofollow">NASA image use policy.</a></b> <b><a href="http://www.nasa.gov/centers/goddard/home/index.html" rel="nofollow">NASA Goddard Space Flight Center</a></b> enables NASA’s mission through four scientific endeavors: Earth Science, Heliophysics, Solar System Exploration, and Astrophysics. Goddard plays a leading role in NASA’s accomplishments by contributing compelling scientific knowledge to advance the Agency’s mission. <b>Follow us on <a href="http://twitter.com/NASA_GoddardPix" rel="nofollow">Twitter</a></b> <b>Like us on <a href="http://www.facebook.com/pages/Greenbelt-MD/NASA-Goddard/395013845897?ref=tsd" rel="nofollow">Facebook</a></b> <b>Find us on <a href="http://instagrid.me/nasagoddard/?vm=grid" rel="nofollow">Instagram</a></b>
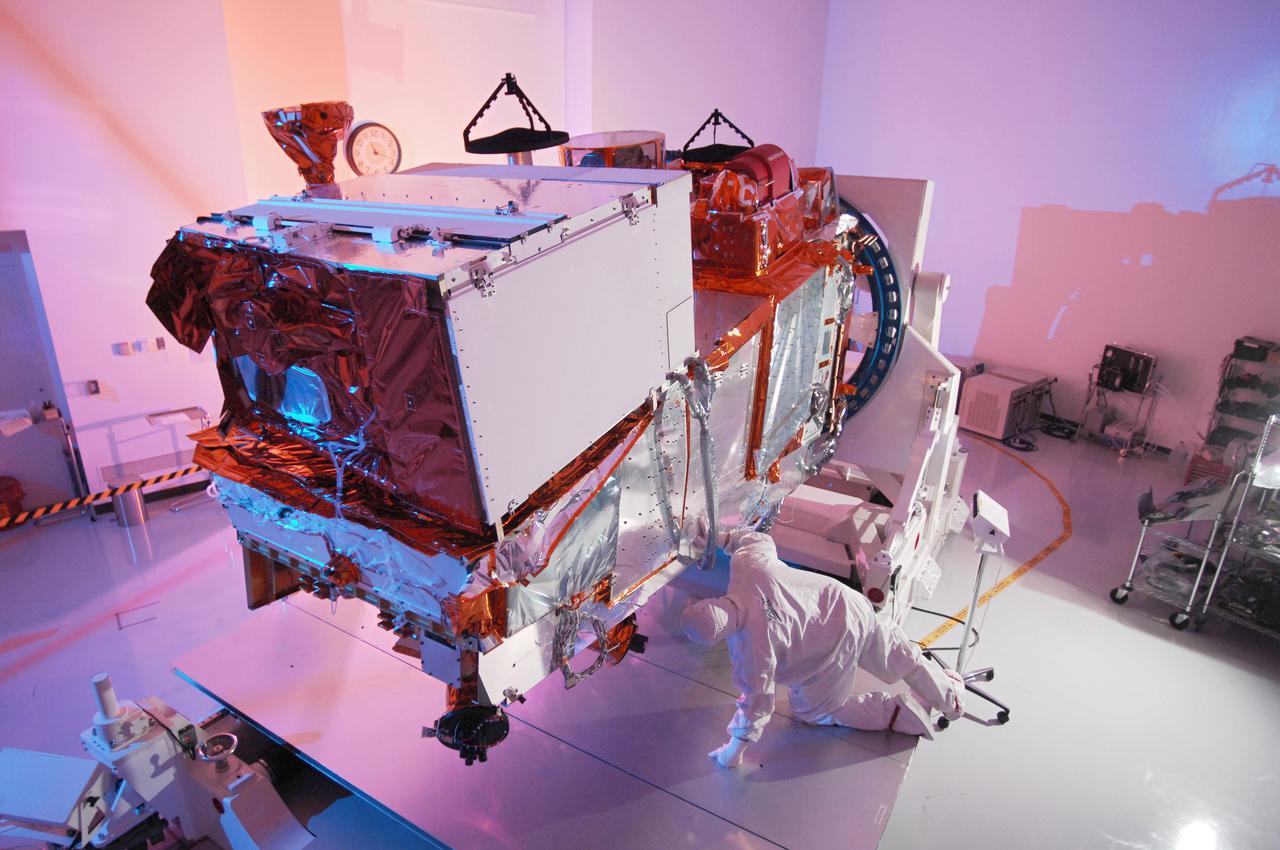
BALL AEROSPACE, Boulder, Colo. – In a cleanroom at Vandenberg Air Force Base in California, Ball Aerospace and Technologies Corp. technicians begin integration of the medium resolution Visible Infrared Imaging Radiometer Suite VIIRS into NASA’s National Polar-orbiting Operational Environmental Satellite System Preparatory Project NPP satellite. NPP is carrying five instruments on board, the biggest being VIIRS which will provide highly detailed imagery of clouds, vegetation, snow cover, dust storms, sea surface temperature and other environmental phenomena. A United Launch Alliance Delta II rocket will carry NPP into space. NPP represents a critical first step in building the next-generation of Earth-observing satellites. NPP will carry the first of the new sensors developed for this satellite fleet, now known as the Joint Polar Satellite System JPSS to be launched in 2016. NPP is the bridge between NASA's Earth Observing System EOS satellites and the forthcoming series of JPSS satellites. The mission will test key technologies and instruments for the JPSS missions. NPP is targeted to launch Oct. 27. For more information, visit http:__www.nasa.gov_NPP. Photo credit: Ball Aerospace
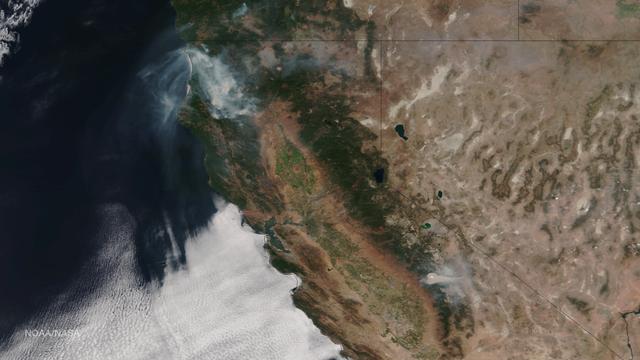
Very hot, dry and unstable conditions in California and across the Pacific Northwest add to the challenges facing firefighters as they battle blazes around the region. Cal Fire is urging Californians to be extremely cautious, especially for the next few days, as the current conditions increase the dangers authorities face. This image was taken by NASA-NOAA's Suomi NPP satellite's VIIRS instrument around 2145 UTC (5:45 p.m. EDT) on August 17, 2015. Northern California is seeing smoke from the River Complex, Route Complex, South Complex, Fork Complex and Mad River Complex fires combine over a large area of the Shasta-Trinity National Forest west of Redding, California, while the Rough Fire in Fresno County is spreading toward the Black Rock Reservoir, causing evacuations and road closures. Fires across the Pacific Northwest aren't limited to California. Please see the Suomi NPP VIIRS composites in NOAA View to see the growth and extent of fires over the past weeks. Credit: NASA/NOAA via <b><a href="www.nnvl.noaa.gov/" rel="nofollow"> NOAA Environmental Visualization Laboratory</a></b>
Suomi NPP capture this true-color image of the storms over the Midwest and US South on April 30, 2017. This images comes from the Visible Infrared Imaging Radiometer Suite (VIIRS) instrument on @NASA.NPP Credit: NASA/NOAA/NPP/VIIRS <b><a href="http://www.nasa.gov/audience/formedia/features/MP_Photo_Guidelines.html" rel="nofollow">NASA image use policy.</a></b> <b><a href="http://www.nasa.gov/centers/goddard/home/index.html" rel="nofollow">NASA Goddard Space Flight Center</a></b> enables NASA’s mission through four scientific endeavors: Earth Science, Heliophysics, Solar System Exploration, and Astrophysics. Goddard plays a leading role in NASA’s accomplishments by contributing compelling scientific knowledge to advance the Agency’s mission. <b>Follow us on <a href="http://twitter.com/NASAGoddardPix" rel="nofollow">Twitter</a></b> <b>Like us on <a href="http://www.facebook.com/pages/Greenbelt-MD/NASA-Goddard/395013845897?ref=tsd" rel="nofollow">Facebook</a></b> <b>Find us on <a href="http://instagrid.me/nasagoddard/?vm=grid" rel="nofollow">Instagram</a></b>
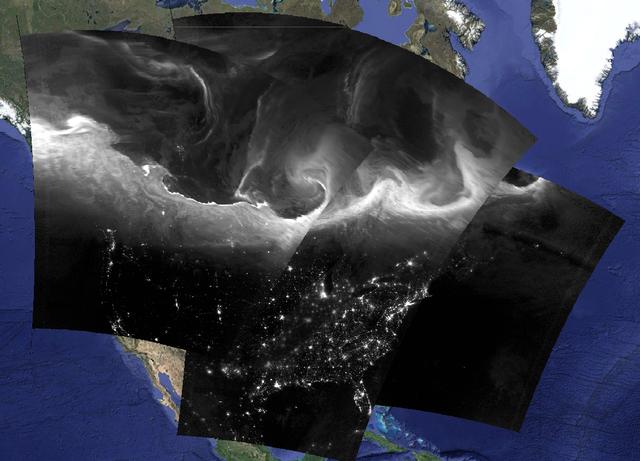
This is a composite image of Suomi NPP VIIRS Day/Night Band images show the bright and complex signature of the aurora borealis across southern Canada and the northern United States during the nighttime hours of September 8, 2015. Credit: NASA/Goddard/Suomi NPP/VIIRS/SSEC-RealEarth <b><a href="http://www.nasa.gov/audience/formedia/features/MP_Photo_Guidelines.html" rel="nofollow">NASA image use policy.</a></b> <b><a href="http://www.nasa.gov/centers/goddard/home/index.html" rel="nofollow">NASA Goddard Space Flight Center</a></b> enables NASA’s mission through four scientific endeavors: Earth Science, Heliophysics, Solar System Exploration, and Astrophysics. Goddard plays a leading role in NASA’s accomplishments by contributing compelling scientific knowledge to advance the Agency’s mission. <b>Follow us on <a href="http://twitter.com/NASAGoddardPix" rel="nofollow">Twitter</a></b> <b>Like us on <a href="http://www.facebook.com/pages/Greenbelt-MD/NASA-Goddard/395013845897?ref=tsd" rel="nofollow">Facebook</a></b> <b>Find us on <a href="http://instagrid.me/nasagoddard/?vm=grid" rel="nofollow">Instagram</a></b>
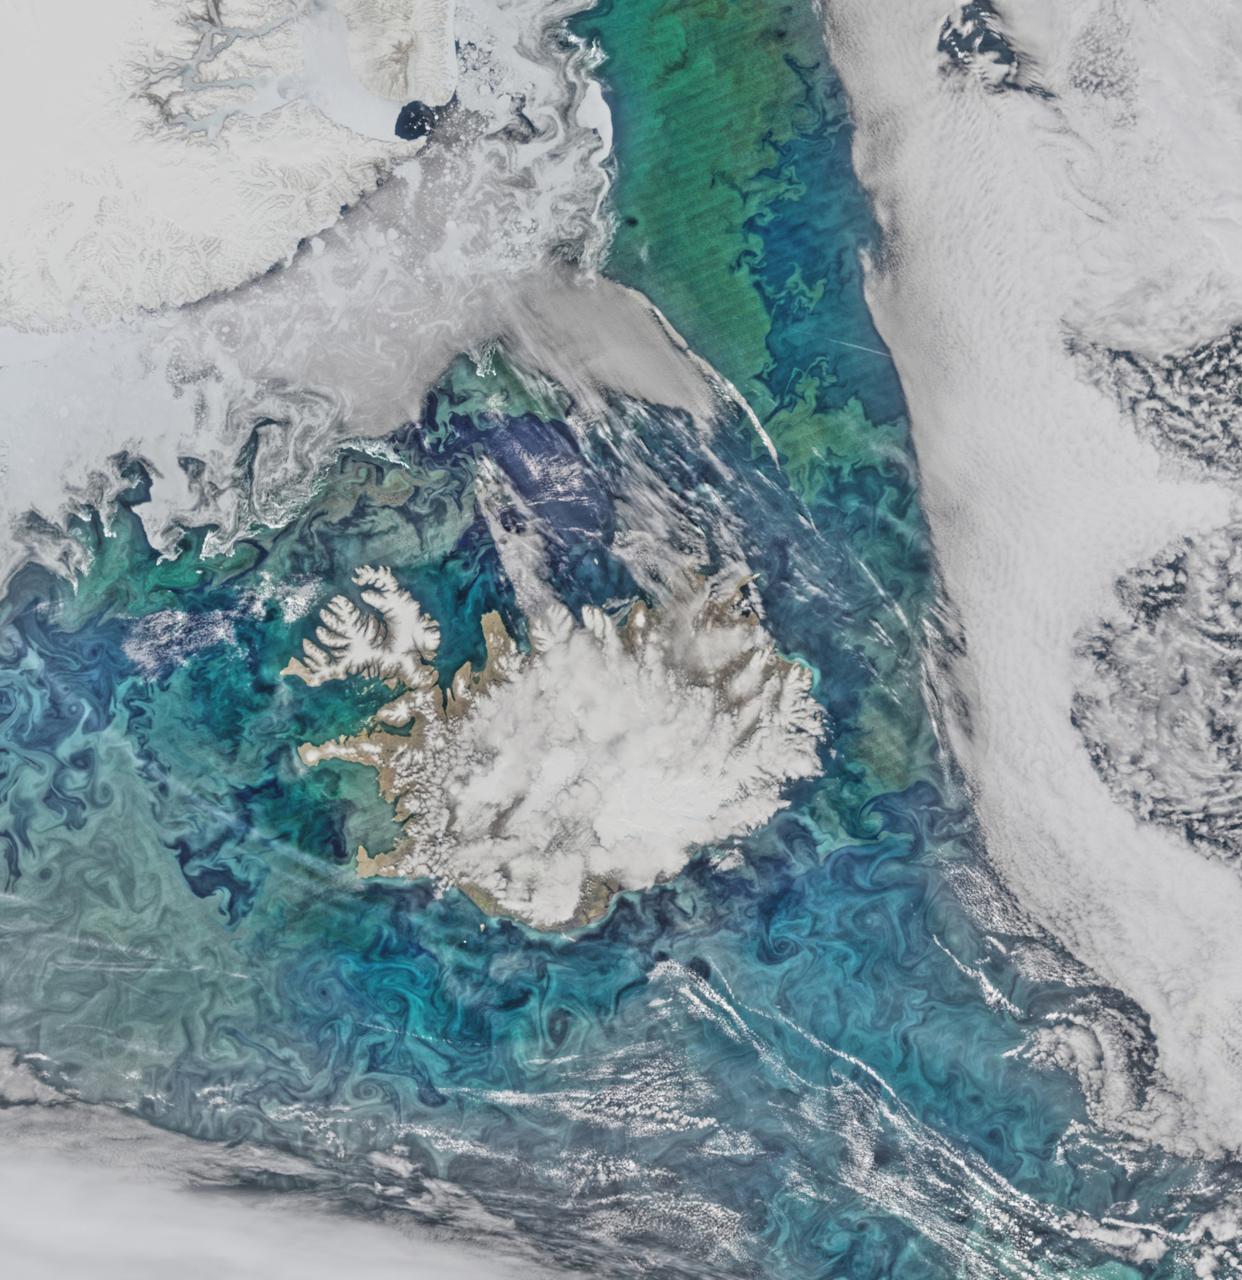
Phytoplankton communities and sea ice limn the turbulent flow field around Iceland in this Suomi-NPP/VIIRS scene collected on June 14, 2015. Credit: NASA/Goddard/Suomi NPP/VIIRS <b><a href="http://www.nasa.gov/audience/formedia/features/MP_Photo_Guidelines.html" rel="nofollow">NASA image use policy.</a></b> <b><a href="http://www.nasa.gov/centers/goddard/home/index.html" rel="nofollow">NASA Goddard Space Flight Center</a></b> enables NASA’s mission through four scientific endeavors: Earth Science, Heliophysics, Solar System Exploration, and Astrophysics. Goddard plays a leading role in NASA’s accomplishments by contributing compelling scientific knowledge to advance the Agency’s mission. <b>Follow us on <a href="http://twitter.com/NASAGoddardPix" rel="nofollow">Twitter</a></b> <b>Like us on <a href="http://www.facebook.com/pages/Greenbelt-MD/NASA-Goddard/395013845897?ref=tsd" rel="nofollow">Facebook</a></b> <b>Find us on <a href="http://instagrid.me/nasagoddard/?vm=grid" rel="nofollow">Instagram</a></b>

Calbuco Volcano in southern Chile has erupted for the first time since 1972, with the last major eruption occurring in 1961 that sent ash columns 12-15 kilometers high. This image was taken by the Suomi NPP satellite's VIIRS instrument in a high resolution infrared channel around 0515Z on April 23, 2015. Credit: NOAA/NASA/NPP/VIIRS <b><a href="http://goes.gsfc.nasa.gov/" rel="nofollow">Credit: NOAA/NASA GOES Project</a></b> <b><a href="http://www.nasa.gov/audience/formedia/features/MP_Photo_Guidelines.html" rel="nofollow">NASA image use policy.</a></b> <b><a href="http://www.nasa.gov/centers/goddard/home/index.html" rel="nofollow">NASA Goddard Space Flight Center</a></b> enables NASA’s mission through four scientific endeavors: Earth Science, Heliophysics, Solar System Exploration, and Astrophysics. Goddard plays a leading role in NASA’s accomplishments by contributing compelling scientific knowledge to advance the Agency’s mission. <b>Follow us on <a href="http://twitter.com/NASAGoddardPix" rel="nofollow">Twitter</a></b> <b>Like us on <a href="http://www.facebook.com/pages/Greenbelt-MD/NASA-Goddard/395013845897?ref=tsd" rel="nofollow">Facebook</a></b> <b>Find us on <a href="http://instagrid.me/nasagoddard/?vm=grid" rel="nofollow">Instagram</a></b>
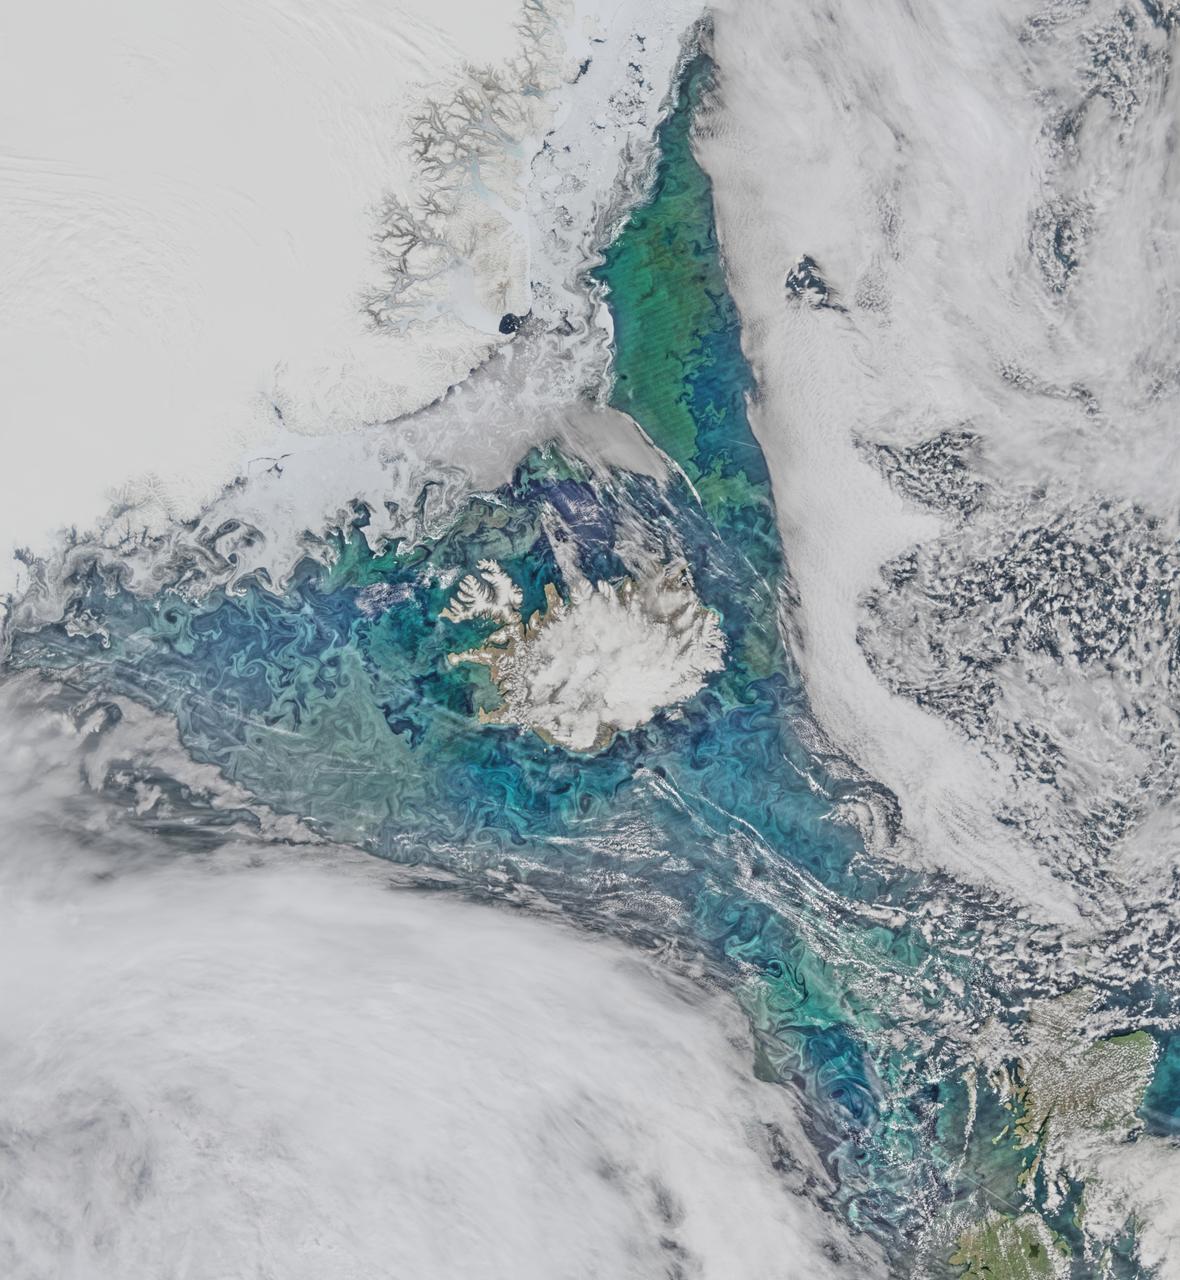
Phytoplankton communities and sea ice limn the turbulent flow field around Iceland in this Suomi-NPP/VIIRS scene collected on June 14, 2015. Credit: NASA/Goddard/Suomi NPP/VIIRS <b><a href="http://www.nasa.gov/audience/formedia/features/MP_Photo_Guidelines.html" rel="nofollow">NASA image use policy.</a></b> <b><a href="http://www.nasa.gov/centers/goddard/home/index.html" rel="nofollow">NASA Goddard Space Flight Center</a></b> enables NASA’s mission through four scientific endeavors: Earth Science, Heliophysics, Solar System Exploration, and Astrophysics. Goddard plays a leading role in NASA’s accomplishments by contributing compelling scientific knowledge to advance the Agency’s mission. <b>Follow us on <a href="http://twitter.com/NASAGoddardPix" rel="nofollow">Twitter</a></b> <b>Like us on <a href="http://www.facebook.com/pages/Greenbelt-MD/NASA-Goddard/395013845897?ref=tsd" rel="nofollow">Facebook</a></b> <b>Find us on <a href="http://instagrid.me/nasagoddard/?vm=grid" rel="nofollow">Instagram</a></b>

The cloud cover over the Southern Ocean occasionally parts as it did on January 1, 2015 just west of the Drake Passage where the VIIRS instrument on the Suomi NPP satellite glimpsed the above collection of ocean-color delineated eddies which have diameters ranging from a couple of kilometers to a couple of hundred kilometers. Recent studies indicate that eddy activity has been increasing in the Southern Ocean with possible implications for climate change. Credit: NASA's OceanColor/Suomi NPP/VIIRS <b><a href="http://www.nasa.gov/audience/formedia/features/MP_Photo_Guidelines.html" rel="nofollow">NASA image use policy.</a></b> <b><a href="http://www.nasa.gov/centers/goddard/home/index.html" rel="nofollow">NASA Goddard Space Flight Center</a></b> enables NASA’s mission through four scientific endeavors: Earth Science, Heliophysics, Solar System Exploration, and Astrophysics. Goddard plays a leading role in NASA’s accomplishments by contributing compelling scientific knowledge to advance the Agency’s mission. <b>Follow us on <a href="http://twitter.com/NASAGoddardPix" rel="nofollow">Twitter</a></b> <b>Like us on <a href="http://www.facebook.com/pages/Greenbelt-MD/NASA-Goddard/395013845897?ref=tsd" rel="nofollow">Facebook</a></b> <b>Find us on <a href="http://instagrid.me/nasagoddard/?vm=grid" rel="nofollow">Instagram</a></b>
Bands of lake effect snow drift eastward from the western Great Lakes in this true-color image captured by the NOAA/NASA Suomi NPP satellite's Visible Infrared Imaging Radiometer Suite (VIIRS) instrument on January 5, 2017. National Weather Service forecasters expect light to moderate lake effect snow showers to continue throughout the day today and into Saturday (1/7). Lake-effect snow forms when cold air passes over the warmer waters of a lake. This causes some lake water to evaporate into the air and warm it. This warmer, wetter air rises and cools as it moves away from the lake. When it cools, it releases that moisture and, if it’s cold enough, that moisture turns into snow. Although true-color images like this may appear to be photographs of Earth, they aren't. They are created by combining data from the three color channels on the VIIRS instrument sensitive to the red, green and blue (or RGB) wavelengths of light into one composite image. In addition, data from several other channels are often also included to cancel out or correct atmospheric interference that may blur parts of the image. Credit: NOAA/NASA/Suomi NPP via NOAA's Environmental Visualization Laboratory
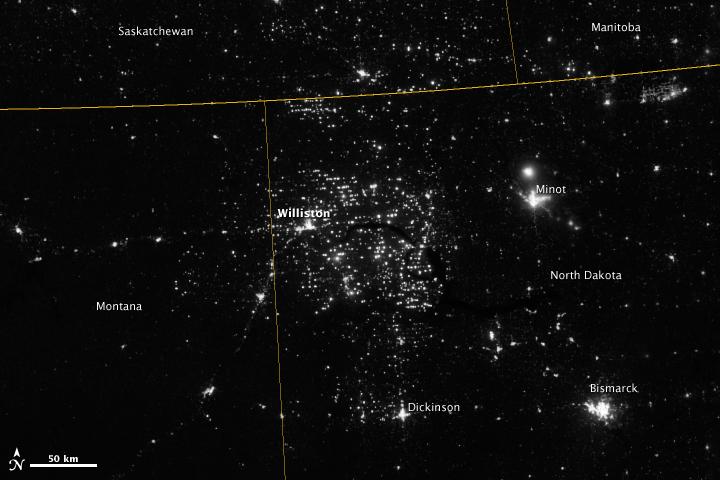
Northwestern North Dakota is one of the least-densely populated parts of the United States. Cities and people are scarce, but satellite imagery shows the area has been aglow at night in recent years. The reason: the area is home to the Bakken shale formation, a site where oil production is booming. Companies hoping to extract oil from the Bakken formation have drilled hundreds of new wells in the last few years; natural gas often bubbles up to the surface as part of the process. Lacking the infrastructure to pipe the gas away, many drillers simply burn it in a practice known as flaring. On November 12, 2012, the Visible Infrared Imaging Radiometer Suite (VIIRS) on the Suomi NPP satellite captured this nighttime view of widespread gas flaring throughout the area. Many of the specks of light are evidence of gas flaring, though others may be the lights around drilling equipment. Some of the brighter areas correspond to towns and cities including Williston, Minot, and Dickinson. The image was captured by the VIIRS “day-night band,” which detects light in a range of wavelengths from green to near-infrared and uses filtering techniques to observe signals such as gas flares, auroras, wildfires, city lights, and reflected moonlight. When VIIRS acquired the image, the moon was in its waning crescent phase, meaning it was reflecting only a small amount of light. According to the U.S. Energy Information Administration, natural gas production from the Bakken shale has increased more than 20-fold between 2007 and 2010. Gas production averaged over 485 million cubic feet per day in September 2011, compared to the 2005 average of about 160 million cubic feet per day. Due to the lack of gas pipeline and processing facilities in the region, about 29 percent of that gas is flared. NASA Earth Observatory image by Jesse Allen and Robert Simmon, using VIIRS Day-Night Band data from the Suomi National Polar-orbiting Partnership. Suomi NPP is the result of a partnership between NASA, the National Oceanic and Atmospheric Administration, and the Department of Defense. Caption by Adam Voiland. Instrument: Suomi NPP - VIIRS Credit: <b><a href="http://www.earthobservatory.nasa.gov/" rel="nofollow"> NASA Earth Observatory</a></b> <b>Click here to view all of the <a href="http://earthobservatory.nasa.gov/Features/NightLights/" rel="nofollow"> Earth at Night 2012 images </a></b> <b>Click here to <a href="http://earthobservatory.nasa.gov/NaturalHazards/view.php?id=79810" rel="nofollow"> read more </a> about this image </b> <b><a href="http://www.nasa.gov/audience/formedia/features/MP_Photo_Guidelines.html" rel="nofollow">NASA image use policy.</a></b> <b><a href="http://www.nasa.gov/centers/goddard/home/index.html" rel="nofollow">NASA Goddard Space Flight Center</a></b> enables NASA’s mission through four scientific endeavors: Earth Science, Heliophysics, Solar System Exploration, and Astrophysics. Goddard plays a leading role in NASA’s accomplishments by contributing compelling scientific knowledge to advance the Agency’s mission. <b>Follow us on <a href="http://twitter.com/NASA_GoddardPix" rel="nofollow">Twitter</a></b> <b>Like us on <a href="http://www.facebook.com/pages/Greenbelt-MD/NASA-Goddard/395013845897?ref=tsd" rel="nofollow">Facebook</a></b> <b>Find us on <a href="http://instagram.com/nasagoddard?vm=grid" rel="nofollow">Instagram</a></b>
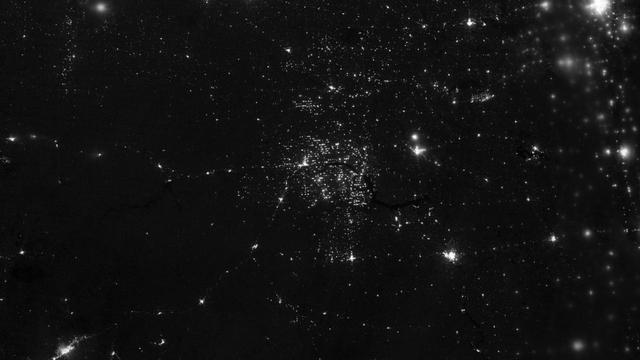
Northwestern North Dakota is one of the least-densely populated parts of the United States. Cities and people are scarce, but satellite imagery shows the area has been aglow at night in recent years. The reason: the area is home to the Bakken shale formation, a site where gas and oil production are booming. On November 12, 2012, the Visible Infrared Imaging Radiometer Suite (VIIRS) on the Suomi NPP satellite captured this nighttime view of widespread drilling throughout the area. Most of the bright specks are lights associated with drilling equipment and temporary housing near drilling sites, though a few are evidence of gas flaring. Some of the brighter areas correspond to towns and cities including Williston, Minot, and Dickinson. The image was captured by the VIIRS “day-night band,” which detects light in a range of wavelengths from green to near-infrared and uses “smart” light sensors to observe dim signals such as gas flares, auroras, wildfires, city lights, and reflected moonlight. When VIIRS acquired the image, the Moon was in its waning crescent phase, so the landscape was reflecting only a small amount of light. According to the U.S. Energy Information Administration, natural gas production from the Bakken shale has increased more than 20-fold between 2007 and 2010. Gas production averaged over 485 million cubic feet per day in September 2011, compared to the 2005 average of about 160 million cubic feet per day. Due to the lack of a gas pipeline and processing facilities in the region, about 29 percent of that gas is flared. NASA Earth Observatory image by Jesse Allen and Robert Simmon, using VIIRS Day-Night Band data from the Suomi National Polar-orbiting Partnership. Suomi NPP is the result of a partnership between NASA, the National Oceanic and Atmospheric Administration, and the Department of Defense. Caption by Adam Voiland. Instrument: Suomi NPP - VIIRS Credit: <b><a href="http://www.earthobservatory.nasa.gov/" rel="nofollow"> NASA Earth Observatory</a></b> <b>Click here to view all of the <a href="http://earthobservatory.nasa.gov/Features/NightLights/" rel="nofollow"> Earth at Night 2012 images </a></b> <b>Click here to <a href="http://earthobservatory.nasa.gov/NaturalHazards/view.php?id=79810" rel="nofollow"> read more </a> about this image </b> <b><a href="http://www.nasa.gov/audience/formedia/features/MP_Photo_Guidelines.html" rel="nofollow">NASA image use policy.</a></b> <b><a href="http://www.nasa.gov/centers/goddard/home/index.html" rel="nofollow">NASA Goddard Space Flight Center</a></b> enables NASA’s mission through four scientific endeavors: Earth Science, Heliophysics, Solar System Exploration, and Astrophysics. Goddard plays a leading role in NASA’s accomplishments by contributing compelling scientific knowledge to advance the Agency’s mission. <b>Follow us on <a href="http://twitter.com/NASA_GoddardPix" rel="nofollow">Twitter</a></b> <b>Like us on <a href="http://www.facebook.com/pages/Greenbelt-MD/NASA-Goddard/395013845897?ref=tsd" rel="nofollow">Facebook</a></b> <b>Find us on <a href="http://instagram.com/nasagoddard?vm=grid" rel="nofollow">Instagram</a></b>
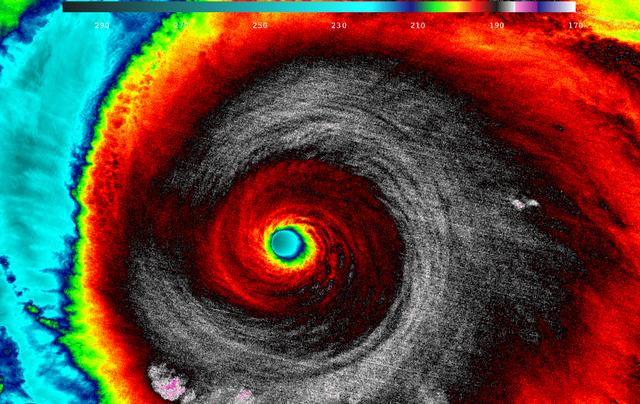
When NASA-NOAA's Suomi NPP satellite passed over Patricia on October 23 at 5:20 a.m. EDT the VIIRS instrument that flies aboard Suomi NPP looked at the storm in infrared light. Cloud top temperatures of thunderstorms around the eyewall were between 180K (-135.7F/ -93.1C) and 190 Kelvin (-117.7F/ -83.1C). Credit: UW/CIMSS/William Straka III Read more: <a href="http://www.nasa.gov/f…/goddard/patricia-eastern-pacific-2015" rel="nofollow">www.nasa.gov/f…/goddard/patricia-eastern-pacific-2015</a>
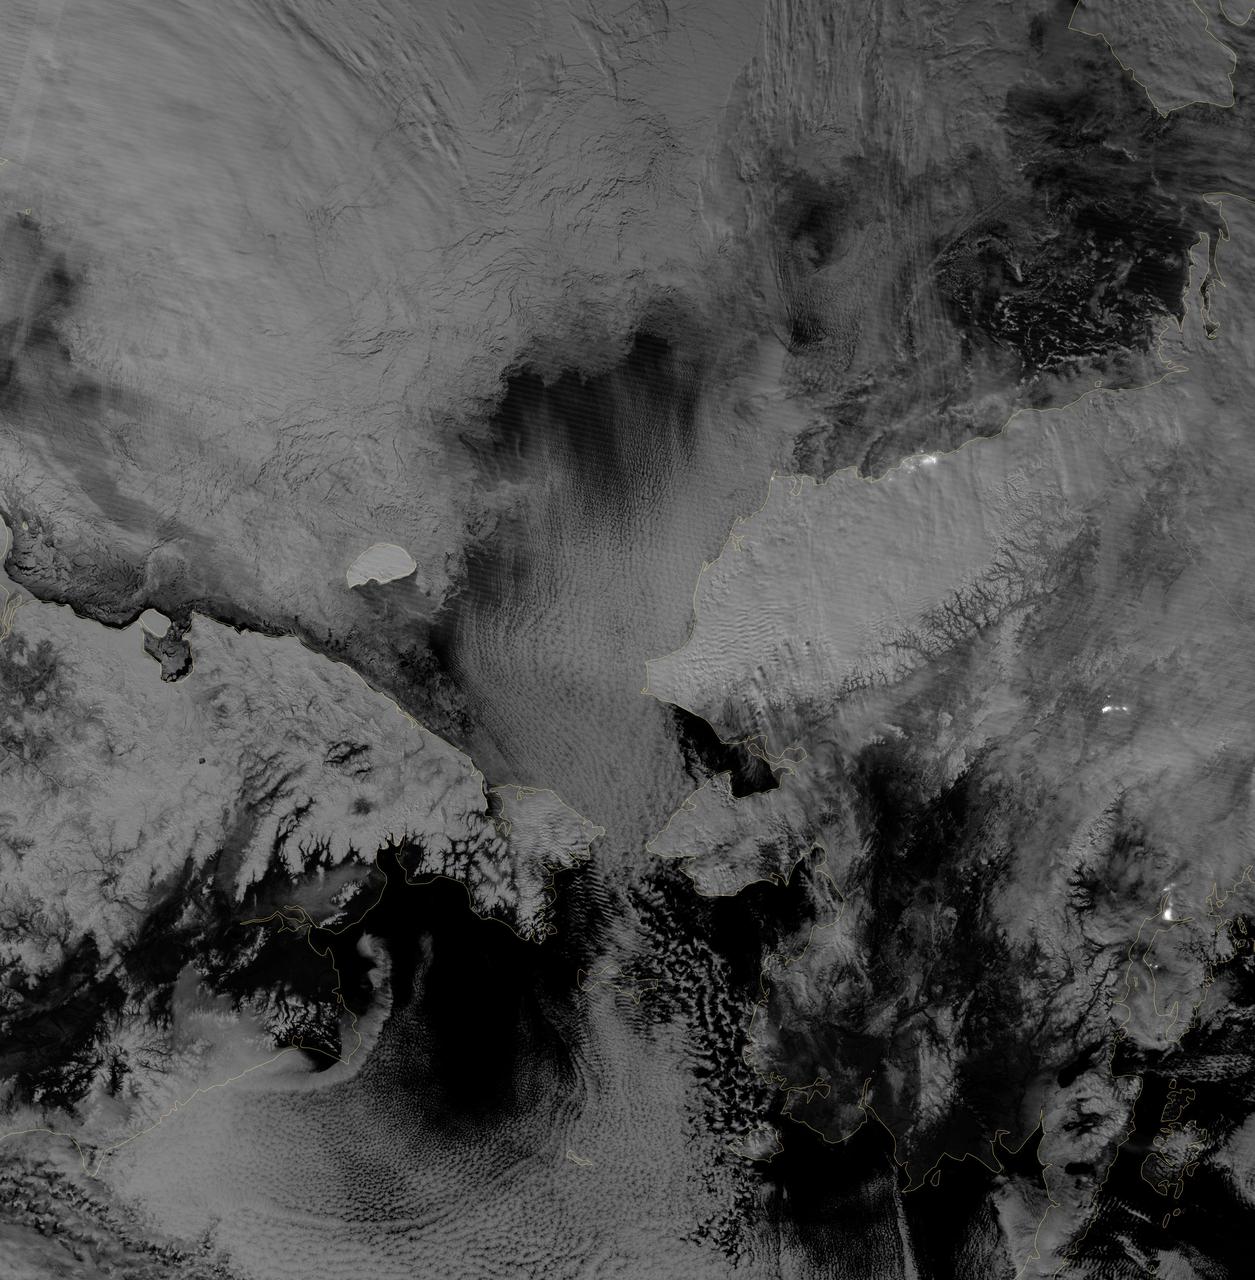
Image acquired October 30, 2012 Scientists watched the Arctic with particular interest in the summer of 2012, when Arctic sea ice set a new record low. The behavior of sea ice following such a low extent also interests scientists, but as Arctic sea ice was advancing in the autumn of 2012, so was polar darkness. Fortunately, the Visible Infrared Imaging Radiometer Suite (VIIRS) on the Suomi NPP satellite can see in the dark. The VIIRS “day-night band” detects light in a range of wavelengths from green to near-infrared and uses filtering techniques to observe signals such as gas flares, auroras, wildfires, city lights, and reflected moonlight. VIIRS acquired this nighttime view of sea ice north of Russia and Alaska on October 30, 2012. The day-night band takes advantage of moonlight, airglow (the atmosphere’s self-illumination through chemical reactions), zodiacal light (sunlight scattered by interplanetary dust), and starlight from the Milky Way. By using these dim light sources, the day-night band can detect changes in clouds, snow cover, and sea ice. The VIIRS day-night band offers a unique perspective because once polar night has descended, satellite sensors relying on visible light can no longer produce photo-like images. And although passive microwave sensors can monitor sea ice through the winter, they offer much lower resolution. Steve Miller of the Cooperative Institute for Research in the Atmosphere at Colorado State University has used the day-night band to study nighttime behavior of weather systems and sees advantages in studying the polar regions. “There’s a lot of use with these measurements as we look back at a season of record ice melt in the Arctic,” Miller says. “We can observe areas where there is ice melt and reformation, where there’s clear water and ships can pass through—especially as the ‘great darkness’ approaches with winter.” Ted Scambos of the National Snow and Ice Data Center at the University of Colorado concurs. “Things start changing rapidly in the late fall: sea ice formation and snow cover extent at the highest latitudes. This lets us see rapid-growth areas in detail.” The day-night band is also useful for following weather systems, including severe storms, which can develop and strike populous areas at night as well as day. Geostationary Operational Environmental Satellites orbit the Earth’s equator. The satellites offer uninterrupted observations of North America, but high-latitude areas such as Alaska may benefit more from polar-orbiting satellites. Miller explains, “In the high latitudes, the orbits begin to overlap considerably, which gives you a lot more passes in Alaska. If you start to look at multiple passes and stitch them together, you can get a version of a poor man’s geostationary time loop of the weather.” Day-night band imagery at high latitudes has already proven useful for tracking rapid ice movement and diagnosing Gulf of Alaska circulations. The day-night band is even useful at tracking ship movement at high latitudes. NASA Earth Observatory image by Jesse Allen and Robert Simmon, using VIIRS Day-Night Band data from the Suomi National Polar-orbiting Partnership. Suomi NPP is the result of a partnership between NASA, the National Oceanic and Atmospheric Administration, and the Department of Defense. Caption by Michon Scott. Instrument: Suomi NPP - VIIRS Credit: <b><a href="http://www.earthobservatory.nasa.gov/" rel="nofollow"> NASA Earth Observatory</a></b> <b>Click here to view all of the <a href="http://earthobservatory.nasa.gov/Features/NightLights/" rel="nofollow"> Earth at Night 2012 images </a></b> <b>Click here to <a href="http://earthobservatory.nasa.gov/NaturalHazards/view.php?id=79825" rel="nofollow"> read more </a> about this image </b> <b><a href="http://www.nasa.gov/audience/formedia/features/MP_Photo_Guidelines.html" rel="nofollow">NASA image use policy.</a></b> <b><a href="http://www.nasa.gov/centers/goddard/home/index.html" rel="nofollow">NASA Goddard Space Flight Center</a></b> enables NASA
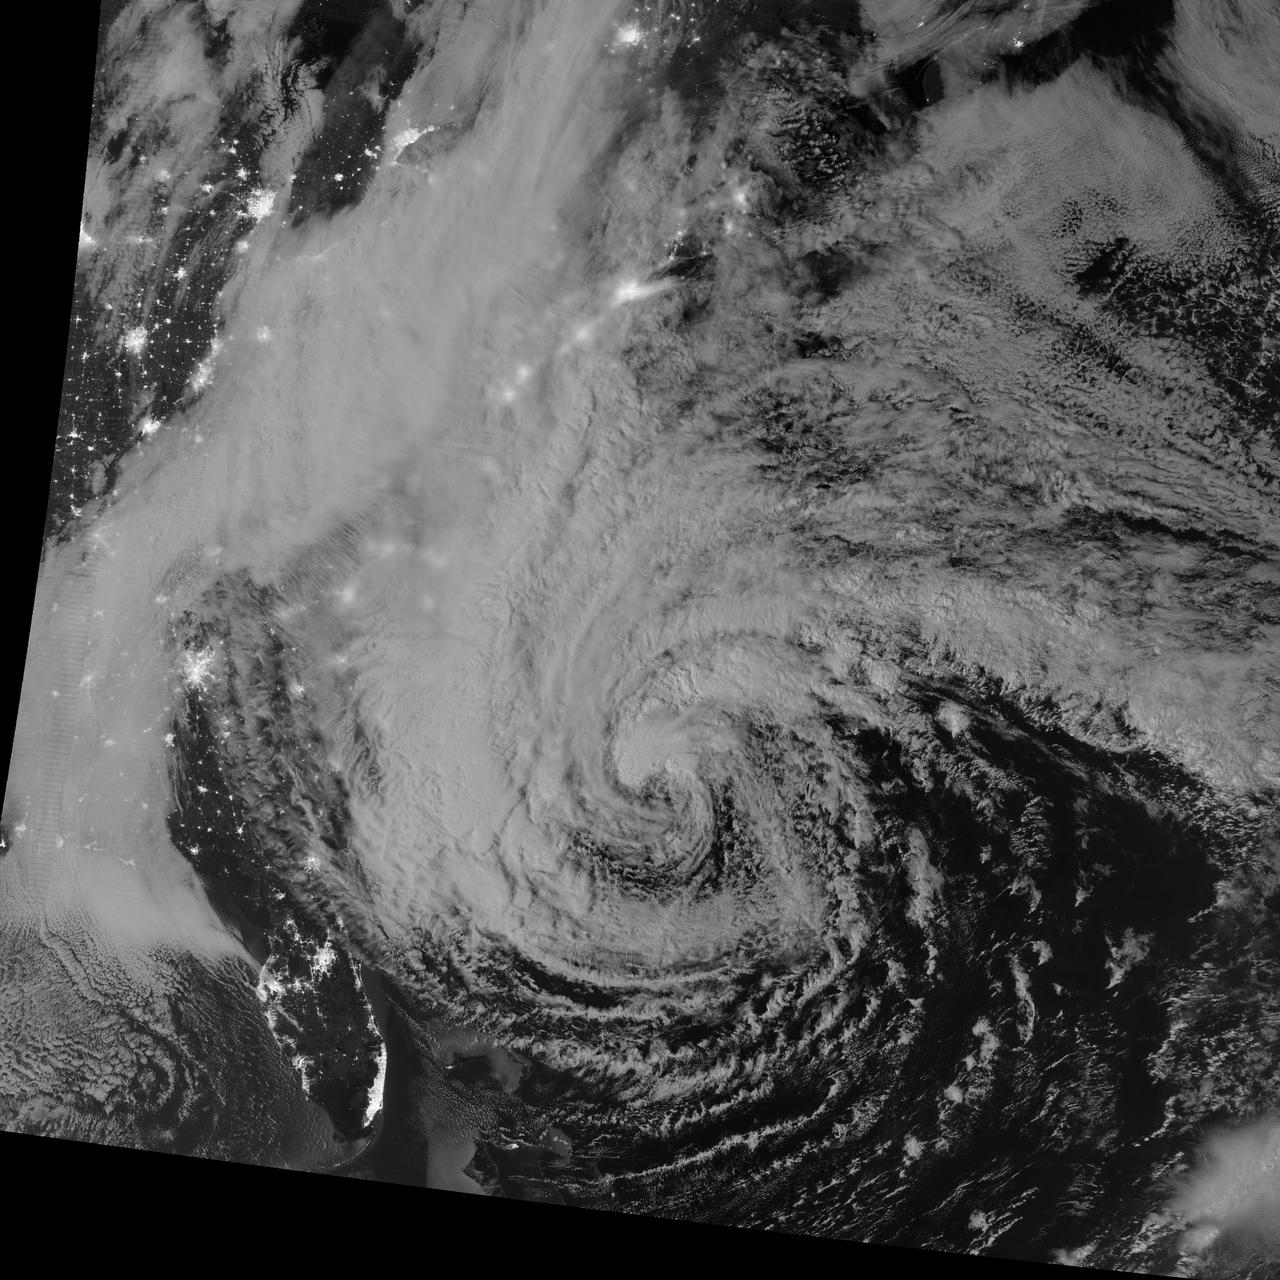
NASA image acquired October 28, 2012 <b>For the latest info from NASA on Hurricane Sandy go to: <a href="http://1.usa.gov/Ti5SgS" rel="nofollow">1.usa.gov/Ti5SgS</a></b> This image of Hurricane Sandy was acquired by the Visible Infrared Imaging Radiometer Suite (VIIRS) on the Suomi NPP satellite around 2:42 a.m. Eastern Daylight Time (06:42 Universal Time) on October 28, 2012. The storm was captured by a special “day-night band,” which detects light in a range of wavelengths from green to near-infrared and uses filtering techniques to observe dim signals such as auroras, airglow, gas flares, city lights, and reflected moonlight. In this case, the cloud tops were lit by the nearly full Moon (full occurs on October 29). Some city lights in Florida and Georgia are also visible amidst the clouds. The Suomi NPP satellite was launched one year ago today (on October 28, 2011) to extend and enhance long-term records of key environmental data monitored by NASA, the National Oceanic and Atmospheric Administration (NOAA), and the U.S. Department of Defense. NASA Earth Observatory image by Jesse Allen and Robert Simmon, using VIIRS Day-Night Band data from the Suomi National Polar-orbiting Partnership (Suomi NPP). Suomi NPP is the result of a partnership between NASA, the National Oceanic and Atmospheric Administration, and the Department of Defense. Caption by Michael Carlowicz. Instrument: Suomi NPP - VIIRS <b><a href="http://www.nasa.gov/audience/formedia/features/MP_Photo_Guidelines.html" rel="nofollow">NASA image use policy.</a></b> <b><a href="http://www.nasa.gov/centers/goddard/home/index.html" rel="nofollow">NASA Goddard Space Flight Center</a></b> enables NASA’s mission through four scientific endeavors: Earth Science, Heliophysics, Solar System Exploration, and Astrophysics. Goddard plays a leading role in NASA’s accomplishments by contributing compelling scientific knowledge to advance the Agency’s mission. <b>Follow us on <a href="http://twitter.com/NASA_GoddardPix" rel="nofollow">Twitter</a></b> <b>Like us on <a href="http://www.facebook.com/pages/Greenbelt-MD/NASA-Goddard/395013845897?ref=tsd" rel="nofollow">Facebook</a></b> <b>Find us on <a href="http://instagrid.me/nasagoddard/?vm=grid" rel="nofollow">Instagram</a></b>
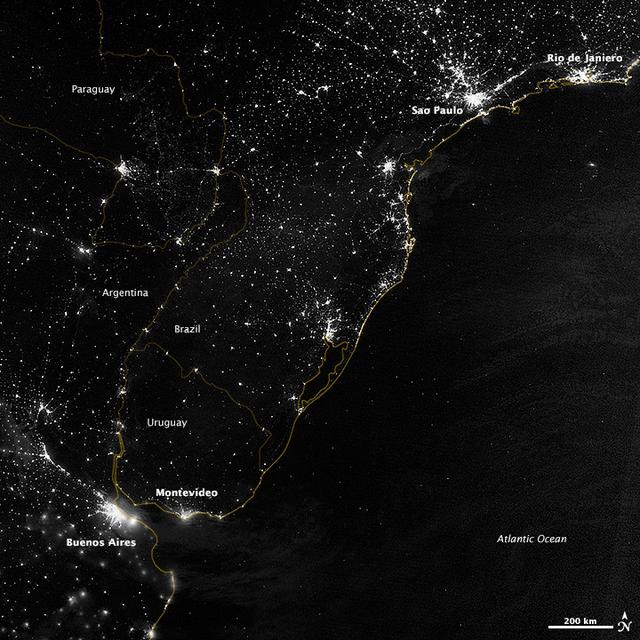
This image of part of the Atlantic coast of South America was acquired by the Suomi NPP satellite on the night of July 20, 2012. The image was made possible by the “day-night band” of the Visible Infrared Imaging Radiometer Suite (VIIRS), which detects light in a range of wavelengths from green to near-infrared and uses filtering techniques to observe dim signals such as city lights, gas flares, auroras, wildfires, and reflected moonlight. “Nothing tells us more about the spread of humans across the Earth than city lights,” says Chris Elvidge, who leads the Earth Observation Group at NOAA’s National Geophysical Data Center. Named for satellite meteorology pioneer Verner Suomi, NPP flies over any given point on Earth's surface twice each day at roughly 1:30 a.m. and p.m. The polar-orbiting satellite flies 824 kilometers (512 miles) above the surface, sending its data once per orbit to a ground station in Svalbard, Norway, and continuously to local direct broadcast users distributed around the world. Suomi NPP is managed by NASA with operational support from NOAA and its Joint Polar Satellite System, which manages the satellite's ground system. NASA Earth Observatory image by Jesse Allen and Robert Simmon, using VIIRS Day-Night Band data from the Suomi National Polar-orbiting Partnership. Suomi NPP is the result of a partnership between NASA, the National Oceanic and Atmospheric Administration, and the Department of Defense. Caption by Mike Carlowicz. Instrument: Suomi NPP - VIIRS Credit: <b><a href="http://www.earthobservatory.nasa.gov/" rel="nofollow"> NASA Earth Observatory</a></b> <b>Click here to view all of the <a href="http://earthobservatory.nasa.gov/Features/NightLights/" rel="nofollow"> Earth at Night 2012 images </a></b> <b>Click here to <a href="http://earthobservatory.nasa.gov/NaturalHazards/view.php?id=79822" rel="nofollow"> read more </a> about this image </b> <b><a href="http://www.nasa.gov/audience/formedia/features/MP_Photo_Guidelines.html" rel="nofollow">NASA image use policy.</a></b> <b><a href="http://www.nasa.gov/centers/goddard/home/index.html" rel="nofollow">NASA Goddard Space Flight Center</a></b> enables NASA’s mission through four scientific endeavors: Earth Science, Heliophysics, Solar System Exploration, and Astrophysics. Goddard plays a leading role in NASA’s accomplishments by contributing compelling scientific knowledge to advance the Agency’s mission. <b>Follow us on <a href="http://twitter.com/NASA_GoddardPix" rel="nofollow">Twitter</a></b> <b>Like us on <a href="http://www.facebook.com/pages/Greenbelt-MD/NASA-Goddard/395013845897?ref=tsd" rel="nofollow">Facebook</a></b> <b>Find us on <a href="http://instagram.com/nasagoddard?vm=grid" rel="nofollow">Instagram</a></b>
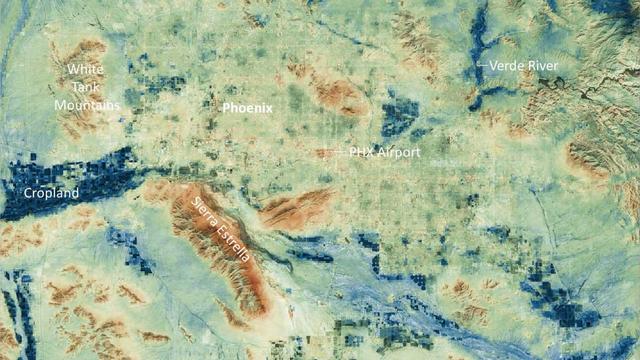
Researchers at NASA's Jet Propulsion Laboratory have created a series of maps showing land-surface temperatures in the Phoenix area in July 2023, when the city experienced a record-breaking run of hot weather. The images reveal the cumulative effect – overnight and across the month – of relentless daytime heating. The data was captured during overnight hours (around 2 a.m.) on several days in July by an instrument called the Visible Infrared Imaging Radiometer Suite (VIIRS) aboard the NOAA-NASA Suomi National Polar-orbiting Partnership (Suomi NPP) satellite managed by the National Oceanic and Atmospheric Administration and NASA. The images show how built surfaces – roads, buildings, airport runways, and the like – retain heat, sometimes hovering around 100 degrees Fahrenheit (38 degrees Celsius) for hours after sunset. From July 1 to July 19, the built surfaces in the maps grew progressively hotter, likely the combined effect of the heat wave intensifying and the cumulative heating of those human-made structures. Due to their high heat capacity, these surfaces didn't fully cool overnight before the onset of the next day's heat. At the center of the images is Phoenix's Sky Harbor International Airport, where VIIRS measured the hottest land-surface temperature within the city. The airport is also where Phoenix takes its official air temperature. By those measurements, the city experienced the hottest month on record in July, including a record 31 consecutive days in which the temperature exceeded 110 degrees Fahrenheit (43.3 degrees Celsius). The previous record was 18 days. Land-surface temperatures in cities are usually warmer than in rural and undeveloped areas because of human activities and the materials used for building. Streets – seen in these maps as a grid pattern – are often the hottest part of the built environment due to dark asphalt paving that absorbs more sunlight than lighter-colored surfaces; asphalt absorbs up to 95% of solar radiation. In the images, the mountains near Phoenix are also notably hot due to their angle to the Sun and greater soil exposure from lack of vegetation. The hot surfaces in and around the city stand in contrast to nearby irrigated surfaces such as agricultural fields, golf courses, and parks, which fell as low as 68 degrees Fahrenheit (18.9 degrees Celsius) during the night. The Verde River and other nearby waterways also were significantly cooler. VIIRS is one of five instruments aboard the NOAA-NASA Suomi NPP satellite. Short for Suomi National Polar-orbiting Partnership, the spacecraft is one of several in the Joint Polar Satellite System. The images were produced from the VNP21IMG Land Surface Temperature product, which is available at NASA's Land, Atmosphere Near-real-time Capability for EOS (LANCE). Animation available at https://photojournal.jpl.nasa.gov/catalog/PIA25868
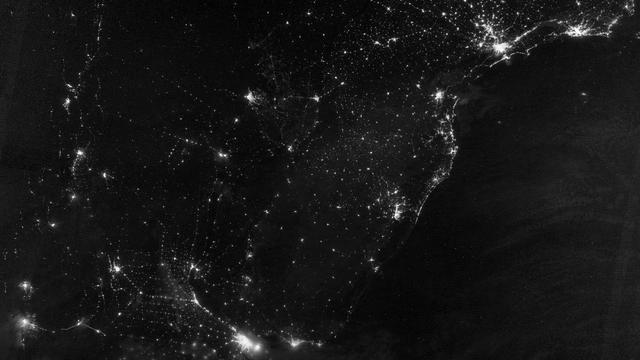
This image of part of the Atlantic coast of South America was acquired by the Suomi NPP satellite on the night of July 20, 2012. The image was made possible by the “day-night band” of the Visible Infrared Imaging Radiometer Suite (VIIRS), which detects light in a range of wavelengths from green to near-infrared and uses filtering techniques to observe dim signals such as city lights, gas flares, auroras, wildfires, and reflected moonlight. “Nothing tells us more about the spread of humans across the Earth than city lights,” says Chris Elvidge, who leads the Earth Observation Group at NOAA’s National Geophysical Data Center. Named for satellite meteorology pioneer Verner Suomi, NPP flies over any given point on Earth's surface twice each day at roughly 1:30 a.m. and p.m. The polar-orbiting satellite flies 824 kilometers (512 miles) above the surface, sending its data once per orbit to a ground station in Svalbard, Norway, and continuously to local direct broadcast users distributed around the world. Suomi NPP is managed by NASA with operational support from NOAA and its Joint Polar Satellite System, which manages the satellite's ground system. NASA Earth Observatory image by Jesse Allen and Robert Simmon, using VIIRS Day-Night Band data from the Suomi National Polar-orbiting Partnership. Suomi NPP is the result of a partnership between NASA, the National Oceanic and Atmospheric Administration, and the Department of Defense. Caption by Mike Carlowicz. Instrument: Suomi NPP - VIIRS Credit: <b><a href="http://www.earthobservatory.nasa.gov/" rel="nofollow"> NASA Earth Observatory</a></b> <b>Click here to view all of the <a href="http://earthobservatory.nasa.gov/Features/NightLights/" rel="nofollow"> Earth at Night 2012 images </a></b> <b>Click here to <a href="http://earthobservatory.nasa.gov/NaturalHazards/view.php?id=79822" rel="nofollow"> read more </a> about this image </b> <b><a href="http://www.nasa.gov/audience/formedia/features/MP_Photo_Guidelines.html" rel="nofollow">NASA image use policy.</a></b> <b><a href="http://www.nasa.gov/centers/goddard/home/index.html" rel="nofollow">NASA Goddard Space Flight Center</a></b> enables NASA’s mission through four scientific endeavors: Earth Science, Heliophysics, Solar System Exploration, and Astrophysics. Goddard plays a leading role in NASA’s accomplishments by contributing compelling scientific knowledge to advance the Agency’s mission. <b>Follow us on <a href="http://twitter.com/NASA_GoddardPix" rel="nofollow">Twitter</a></b> <b>Like us on <a href="http://www.facebook.com/pages/Greenbelt-MD/NASA-Goddard/395013845897?ref=tsd" rel="nofollow">Facebook</a></b> <b>Find us on <a href="http://instagram.com/nasagoddard?vm=grid" rel="nofollow">Instagram</a></b>
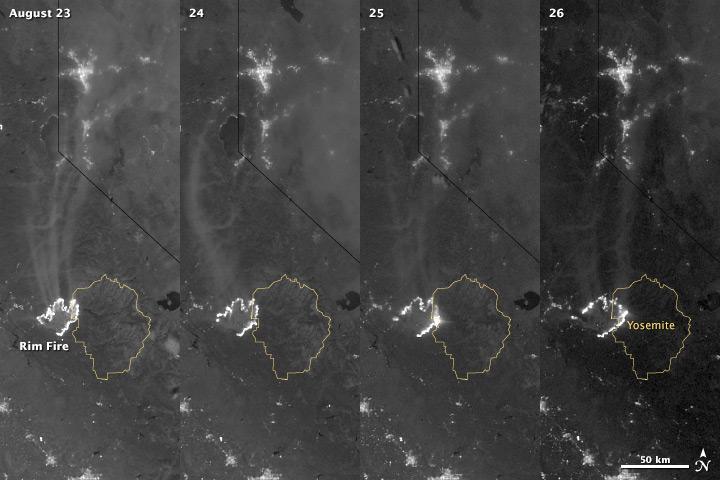
The winter of 2013 was among the driest on record for California, setting the stage for an active fire season. By August 26, the Rim Fire had made its way into the record books. At just 15 percent contained, the fire is now the 13th largest in California since records began in 1932. Apart from being large, the fire is also threatening one of the United States’ greatest natural treasures: Yosemite National Park. The Visible Infrared Imaging Radiometer Suite (VIIRS) on the Suomi NPP satellite tracked the growth of the fire between August 23 and August 26 in this series of nighttime images. The VIIRS day-night band is extremely sensitive to low light, making it possible to see the fire front from space. The brightest, most intense parts of the fire glow white, exceeding the brightness of the lights of Reno, Nevada to the north. Pale gray smoke streams north away from the fire throughout the sequence. The perimeter of the fire grows from day to day along different fronts, depending on winds and fire fighting efforts. On August 24, fire fighters focused their efforts on containing the western edge of the fire to prevent it from burning into Tuolumne City and the populated Highway 108 corridor. They also fought the eastern edge of the fire to protect Yosemite National Park. These efforts are evident in the image: Between August 23 and 24, the eastern edge of the fire held steady, and the western edge receded. The fire grew in the southeast. On the morning of August 25 fire managers reported that the fire was growing in the north and east. In the image, the most intense activity is just inside Yosemite National Park. Fire fighters reported that the Rim Fire continued to be extremely active on its eastern front on the morning of August 26, and this activity is visible in the image. By 8:00 a.m., the fire had burned 149,780 acres. The fire forced firefighters in Yosemite National Park to take measures to protect the Merced and Tuolumne Groves of Giant Sequoias, but the National Park Service reported that the trees were not in imminent danger. While parts of the park are closed, webcams show that most of the park has not been impacted. The Rim Fire started on the afternoon of August 17. It has destroyed 23 structures and threatened 4,500 other buildings. Its cause is under investigation. More details: <a href="http://1.usa.gov/18ilEAA" rel="nofollow">1.usa.gov/18ilEAA</a> NASA Earth Observatory image by Jesse Allen and Robert Simmon, using VIIRS Day Night Band data. Caption by Holli Riebeek. Instrument: Suomi NPP - VIIRS <b><a href="http://www.nasa.gov/audience/formedia/features/MP_Photo_Guidelines.html" rel="nofollow">NASA image use policy.</a></b> <b><a href="http://www.nasa.gov/centers/goddard/home/index.html" rel="nofollow">NASA Goddard Space Flight Center</a></b> enables NASA’s mission through four scientific endeavors: Earth Science, Heliophysics, Solar System Exploration, and Astrophysics. Goddard plays a leading role in NASA’s accomplishments by contributing compelling scientific knowledge to advance the Agency’s mission. <b>Follow us on <a href="http://twitter.com/NASA_GoddardPix" rel="nofollow">Twitter</a></b> <b>Like us on <a href="http://www.facebook.com/pages/Greenbelt-MD/NASA-Goddard/395013845897?ref=tsd" rel="nofollow">Facebook</a></b> <b>Find us on <a href="http://instagram.com/nasagoddard?vm=grid" rel="nofollow">Instagram</a></b>
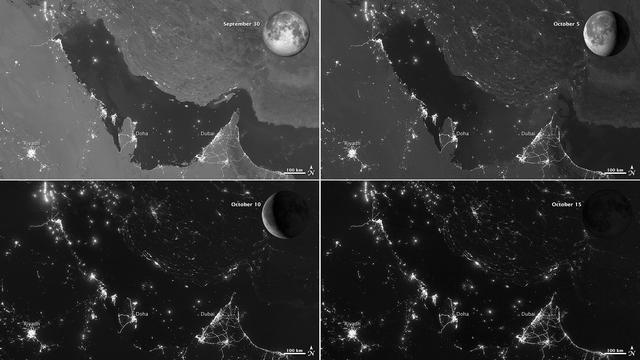
NASA images acquired October 15, 2012 The Visible Infrared Imaging Radiometer Suite (VIIRS) on the Suomi NPP satellite captured these nighttime views of the Persian Gulf region on September 30, October 5, October 10, and October 15, 2012. The images are from the VIIRS “day-night band,” which detects light in a range of wavelengths from green to near-infrared and uses filtering techniques to observe signals such as gas flares, auroras, wildfires, city lights, and reflected moonlight. Each image includes an inset of the Moon in four different phases. September 30 shows the Persian Gulf by the light of the full Moon; October 15 shows the effects of a new Moon. As the amount of moonlight decreases, some land surface features become harder to detect, but the lights from cities and ships become more obvious. Urbanization is most apparent along the northeastern coast of Saudi Arabia, in Qatar, and in the United Arab Emirates (UAE). In Qatar and UAE, major highways can even be discerned by nighttime lights. In eighteenth-century England, a small group of entrepreneurs, inventors and free thinkers—James Watt and Charles Darwin’s grandfathers among them—started a club. They named it the Lunar Society, and the “lunaticks” scheduled their dinner meetings on evenings of the full Moon. The timing wasn’t based on any kind of superstition, it was based on practicality. In the days before electricity, seeing one’s way home after dark was far easier by the light of a full Moon. In the early twenty-first century, electricity has banished the need for such careful scheduling, but the light of the full Moon still makes a difference. NASA Earth Observatory image by Jesse Allen and Robert Simmon, using VIIRS day-night band data from the Suomi National Polar-orbiting Partnership. Suomi NPP is the result of a partnership between NASA, the National Oceanic and Atmospheric Administration, and the Department of Defense. Caption by Michon Scott. Instrument: Suomi NPP - VIIRS Credit: <b><a href="http://www.earthobservatory.nasa.gov/" rel="nofollow"> NASA Earth Observatory</a></b> <b>Click here to view all of the <a href="http://earthobservatory.nasa.gov/Features/NightLights/" rel="nofollow"> Earth at Night 2012 images </a></b> <b>Click here to <a href="http://earthobservatory.nasa.gov/NaturalHazards/view.php?id=79834" rel="nofollow"> read more </a> about this image </b> <b><a href="http://www.nasa.gov/audience/formedia/features/MP_Photo_Guidelines.html" rel="nofollow">NASA image use policy.</a></b> <b><a href="http://www.nasa.gov/centers/goddard/home/index.html" rel="nofollow">NASA Goddard Space Flight Center</a></b> enables NASA’s mission through four scientific endeavors: Earth Science, Heliophysics, Solar System Exploration, and Astrophysics. Goddard plays a leading role in NASA’s accomplishments by contributing compelling scientific knowledge to advance the Agency’s mission. <b>Follow us on <a href="http://twitter.com/NASA_GoddardPix" rel="nofollow">Twitter</a></b> <b>Like us on <a href="http://www.facebook.com/pages/Greenbelt-MD/NASA-Goddard/395013845897?ref=tsd" rel="nofollow">Facebook</a></b> <b>Find us on <a href="http://instagram.com/nasagoddard?vm=grid" rel="nofollow">Instagram</a></b>
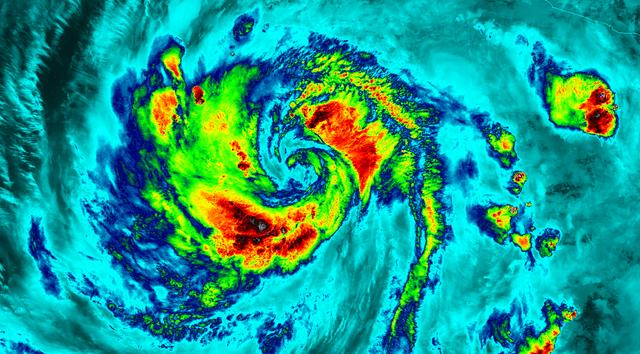
NASA-NOAA's Suomi NPP satellite flew over Hurricane Blanca in the Eastern Pacific Ocean and gathered infrared data on the storm that was false-colored to show locations of the strongest thunderstorms within the storm. The Visible Infrared Imaging Radiometer Suite or VIIRS instrument aboard the satellite gathered infrared data of the storm that was made into an image at the University of Wisconsin-Madison. The image was false-colored to show temperature. Coldest cloud top temperatures indicate higher, stronger, thunderstorms within a tropical cyclone. Those are typically the strongest storms with potential for heavy rainfall. VIIRS is a scanning radiometer that collects visible and infrared imagery and "radiometric" measurements. Basically it means that VIIRS data is used to measure cloud and aerosol properties, ocean color, sea and land surface temperature, ice motion and temperature, fires, and Earth's albedo (reflected light). The VIIRS image from June 5 at 8:11 UTC (4:11 a.m. EDT) showed two areas of coldest cloud top temperatures and strongest storms were west-southwest and east-northeast of the center of Blanca's circulation center. On June 5 at 5 a.m. EDT (0900 UTC) Blanca's maximum sustained winds were near 105 mph (165 kph) with higher gusts. The National Hurricane Center (NHC) forecast expects some strengthening during the next day or so. Weakening is forecast to begin by late Saturday. At that time, NHC placed the center of Hurricane Blanca near latitude 14.3 North, longitude 106.2 West. That puts the center about 350 miles (560 km) south-southwest of Manzanillo, Mexico and about 640 miles (1,030 km) south-southeast of Cabo San Lucas, Mexico. The estimated minimum central pressure is 968 millibars (28.59 inches). Blanca is moving toward the northwest near 10 mph (17 kph). A northwestward to north-northwestward motion at a similar forward speed is expected to continue through Saturday night. Blanca has been stirring up surf along the coast of southwestern Mexico and will reach the Pacific coast of the Baja California peninsula and the southern Gulf of California later today, June 5. These swells are likely to cause life-threatening surf and rip current conditions. On the forecast track, the center of Blanca will approach the southern Baja California peninsula on Sunday. NHC cautions that "Interests in the southern Baja California peninsula should monitor the progress of Blanca. A tropical storm or hurricane watch will likely be required for a portion of Baja California Sur later today." The NHC forecast track shows Blanca making landfall in the southeastern tip of Baja California on Sunday, June 7 and tracking north-northeast along the Baja California peninsula, for several days following. Image credit: Credits: NASA/NOAA/UW-CIMSS <b><a href="http://www.nasa.gov/audience/formedia/features/MP_Photo_Guidelines.html" rel="nofollow">NASA image use policy.</a></b> <b><a href="http://www.nasa.gov/centers/goddard/home/index.html" rel="nofollow">NASA Goddard Space Flight Center</a></b> enables NASA’s mission through four scientific endeavors: Earth Science, Heliophysics, Solar System Exploration, and Astrophysics. Goddard plays a leading role in NASA’s accomplishments by contributing compelling scientific knowledge to advance the Agency’s mission. <b>Follow us on <a href="http://twitter.com/NASAGoddardPix" rel="nofollow">Twitter</a></b> <b>Like us on <a href="http://www.facebook.com/pages/Greenbelt-MD/NASA-Goddard/395013845897?ref=tsd" rel="nofollow">Facebook</a></b> <b>Find us on <a href="http://instagrid.me/nasagoddard/?vm=grid" rel="nofollow">Instagram</a></b>
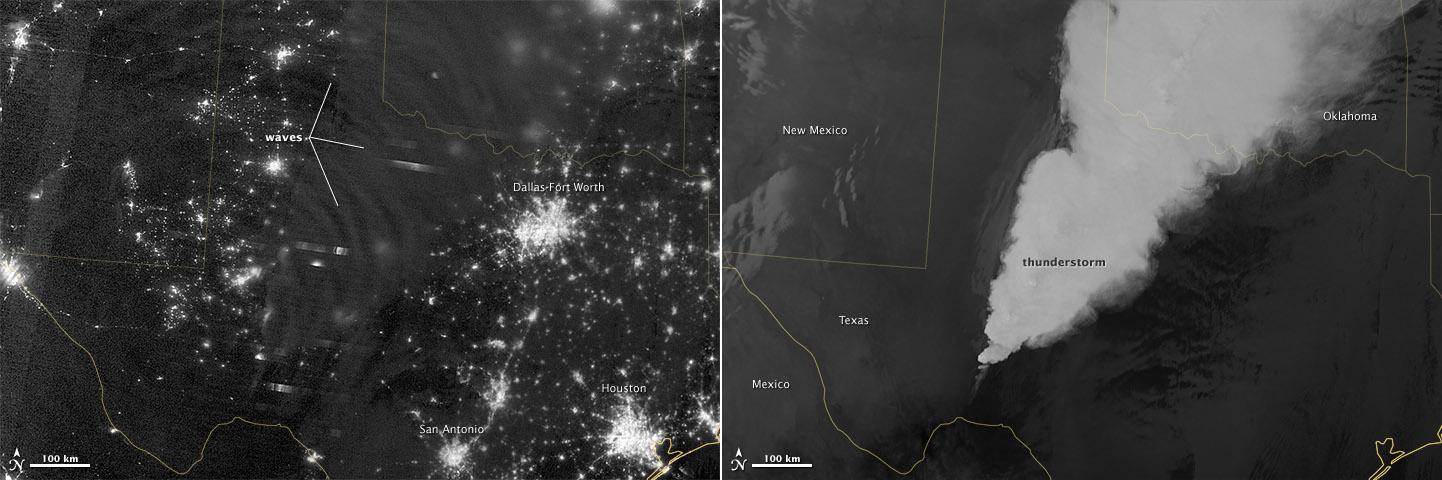
In April 2012, waves in Earth’s “airglow” spread across the nighttime skies of northern Texas like ripples in a pond. In this case, the waves were provoked by a massive thunderstorm. Airglow is a layer of nighttime light emissions caused by chemical reactions high in Earth’s atmosphere. A variety of reactions involving oxygen, sodium, ozone and nitrogen result in the production of a very faint amount of light. In fact, it’s approximately one billion times fainter than sunlight (~10-11 to 10-9 W·cm-2· sr-1). This chemiluminescence is similar to the chemical reactions that light up a glow stick or glow-in-the-dark silly putty. The “day-night band,” of the Visible Infrared Imaging Radiometer Suite (VIIRS) on the Suomi NPP satellite captured these glowing ripples in the night sky on April 15, 2012 (top image). The day-night band detects lights over a range of wavelengths from green to near-infrared and uses highly sensitive electronics to observe low light signals. (The absolute minimum signals detectable are at the levels of nightglow emission.) The lower image shows the thunderstorm as observed by a thermal infrared band on VIIRS. This thermal band, which is sensitive only to heat emissions (cold clouds appear white), is not sensitive to the subtle visible-light wave structures seen by the day-night band. Technically speaking, airglow occurs at all times. During the day it is called “dayglow,” at twilight “twilightglow,” and at night “nightglow.” There are slightly different processes taking place in each case, but in the image above the source of light is nightglow. The strongest nightglow emissions are mostly constrained to a relatively thin layer of atmosphere between 85 and 95 kilometers (53 and 60 miles) above the Earth’s surface. Little emission occurs below this layer since there’s a higher concentration of molecules, allowing for dissipation of chemical energy via collisions rather than light production. Likewise, little emission occurs above that layer because the atmospheric density is so tenuous that there are too few light-emitting reactions to yield an appreciable amount of light. Suomi NPP is in orbit around Earth at 834 kilometers (about 518 miles), well above the nightglow layer. The day-night band imagery therefore contains signals from the direction upward emission of the nightglow layer and the reflection of the downward nightglow emissions by clouds and the Earth’s surface. The presence of these nightglow waves is a graphic visualization of the usually unseen energy transfer processes that occur continuously between the lower and upper atmosphere. While nightglow is a well-known phenomenon, it’s not typically considered by Earth-viewing meteorological sensors. In fact, scientists were surprised at Suomi NPP’s ability to detect it. During the satellite’s check-out procedure, this unanticipated source of visible light was thought to indicate a problem with the sensor until scientists realized that what they were seeing was the faintest of light in the darkness of night. NASA Earth Observatory image by Jesse Allen and Robert Simmon, using VIIRS Day-Night Band data from the Suomi National Polar-orbiting Partnership. Suomi NPP is the result of a partnership between NASA, the National Oceanic and Atmospheric Administration, and the Department of Defense. Caption by Aries Keck and Steve Miller. Instrument: Suomi NPP - VIIRS Credit: <b><a href="http://www.earthobservatory.nasa.gov/" rel="nofollow"> NASA Earth Observatory</a></b> <b>Click here to view all of the <a href="http://earthobservatory.nasa.gov/Features/NightLights/" rel="nofollow"> Earth at Night 2012 images </a></b> <b>Click here to <a href="http://earthobservatory.nasa.gov/NaturalHazards/view.php?id=79817" rel="nofollow"> read more </a> about this image </b> <b><a href="http://www.nasa.gov/audience/formedia/features/MP_Photo_Guidelines.html" rel="nofollow">NASA image use policy.</a></b> <b><a href="http://www.nasa.gov/centers/goddard/home/index.html" rel="nofollow">NASA Goddard Space</a></b>
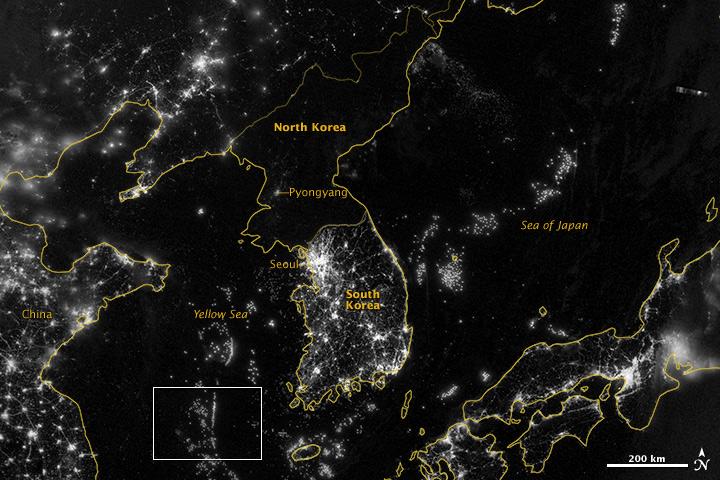
NASA image acquired September 24, 2012 City lights at night are a fairly reliable indicator of where people live. But this isn’t always the case, and the Korean Peninsula shows why. As of July 2012, South Korea’s population was estimated at roughly 49 million people, and North Korea’s population was estimated at about half that number. But where South Korea is gleaming with city lights, North Korea has hardly any lights at all—just a faint glimmer around Pyongyang. On September 24, 2012, the Visible Infrared Imaging Radiometer Suite (VIIRS) on the Suomi NPP satellite captured this nighttime view of the Korean Peninsula. This imagery is from the VIIRS “day-night band,” which detects light in a range of wavelengths from green to near-infrared and uses filtering techniques to observe signals such as gas flares, auroras, wildfires, city lights, and reflected moonlight. The wide-area image shows the Korean Peninsula, parts of China and Japan, the Yellow Sea, and the Sea of Japan. The white inset box encloses an area showing ship lights in the Yellow Sea. Many of the ships form a line, as if assembling along a watery border. Following the 1953 armistice ending the Korean War, per-capita income in South Korea rose to about 17 times the per-capital income level of North Korea, according to the U.S. Central Intelligence Agency. Worldwide, South Korea ranks 12th in electricity production, and 10th in electricity consumption, per 2011 estimates. North Korea ranks 71st in electricity production, and 73rd in electricity consumption, per 2009 estimates. NASA Earth Observatory image by Jesse Allen and Robert Simmon, using VIIRS Day-Night Band data from the Suomi National Polar-orbiting Partnership. Suomi NPP is the result of a partnership between NASA, the National Oceanic and Atmospheric Administration, and the Department of Defense. Caption by Michon Scott. Instrument: Suomi NPP - VIIRS Credit: <b><a href="http://www.earthobservatory.nasa.gov/" rel="nofollow"> NASA Earth Observatory</a></b> <b>Click here to view all of the <a href="http://earthobservatory.nasa.gov/Features/NightLights/" rel="nofollow"> Earth at Night 2012 images </a></b> <b>Click here to <a href="http://earthobservatory.nasa.gov/NaturalHazards/view.php?id=79796" rel="nofollow"> read more </a> about this image </b> <b><a href="http://www.nasa.gov/audience/formedia/features/MP_Photo_Guidelines.html" rel="nofollow">NASA image use policy.</a></b> <b><a href="http://www.nasa.gov/centers/goddard/home/index.html" rel="nofollow">NASA Goddard Space Flight Center</a></b> enables NASA’s mission through four scientific endeavors: Earth Science, Heliophysics, Solar System Exploration, and Astrophysics. Goddard plays a leading role in NASA’s accomplishments by contributing compelling scientific knowledge to advance the Agency’s mission. <b>Follow us on <a href="http://twitter.com/NASA_GoddardPix" rel="nofollow">Twitter</a></b> <b>Like us on <a href="http://www.facebook.com/pages/Greenbelt-MD/NASA-Goddard/395013845897?ref=tsd" rel="nofollow">Facebook</a></b> <b>Find us on <a href="http://instagram.com/nasagoddard?vm=grid" rel="nofollow">Instagram</a></b>
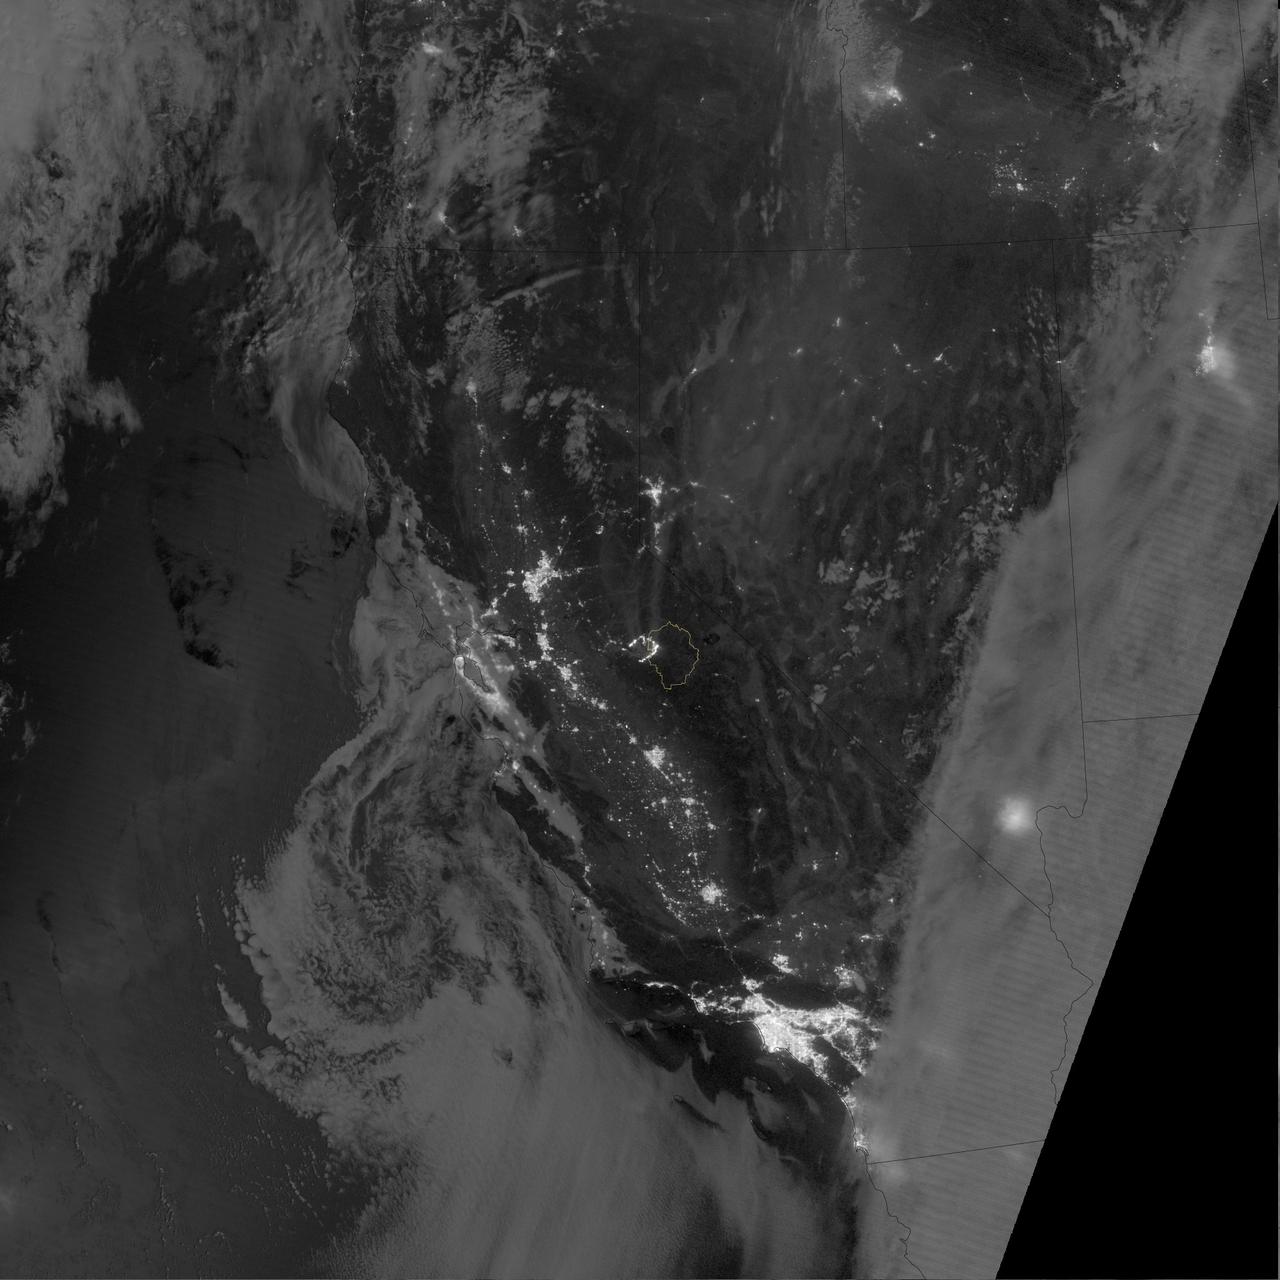
The winter of 2013 was among the driest on record for California, setting the stage for an active fire season. By August 26, the Rim Fire had made its way into the record books. At just 15 percent contained, the fire is now the 13th largest in California since records began in 1932. Apart from being large, the fire is also threatening one of the United States’ greatest natural treasures: Yosemite National Park. The Visible Infrared Imaging Radiometer Suite (VIIRS) on the Suomi NPP satellite tracked the growth of the fire between August 23 and August 26 in a series of nighttime images. The VIIRS day-night band is extremely sensitive to low light, making it possible to see the fire front from space. The brightest, most intense parts of the fire glow white, exceeding the brightness of the lights of Reno, Nevada to the north. Pale gray smoke streams north away from the fire throughout the sequence. The perimeter of the fire grows from day to day along different fronts, depending on winds and fire fighting efforts. On August 24, fire fighters focused their efforts on containing the western edge of the fire to prevent it from burning into Tuolumne City and the populated Highway 108 corridor. They also fought the eastern edge of the fire to protect Yosemite National Park. These efforts are evident in the image: Between August 23 and 24, the eastern edge of the fire held steady, and the western edge receded. The fire grew in the southeast. On the morning of August 25 fire managers reported that the fire was growing in the north and east. In the image, the most intense activity is just inside Yosemite National Park. Fire fighters reported that the Rim Fire continued to be extremely active on its eastern front on the morning of August 26, and this activity is visible in the image. By 8:00 a.m., the fire had burned 149,780 acres. The fire forced firefighters in Yosemite National Park to take measures to protect the Merced and Tuolumne Groves of Giant Sequoias, but the National Park Service reported that the trees were not in imminent danger. While parts of the park are closed, webcams show that most of the park has not been impacted. The Rim Fire started on the afternoon of August 17. It has destroyed 23 structures and threatened 4,500 other buildings. Its cause is under investigation. More details: <a href="http://1.usa.gov/18ilEAA" rel="nofollow">1.usa.gov/18ilEAA</a> NASA Earth Observatory image by Jesse Allen and Robert Simmon, using VIIRS Day Night Band data. Caption by Holli Riebeek. Instrument: Suomi NPP - VIIRS <b><a href="http://www.nasa.gov/audience/formedia/features/MP_Photo_Guidelines.html" rel="nofollow">NASA image use policy.</a></b> <b><a href="http://www.nasa.gov/centers/goddard/home/index.html" rel="nofollow">NASA Goddard Space Flight Center</a></b> enables NASA’s mission through four scientific endeavors: Earth Science, Heliophysics, Solar System Exploration, and Astrophysics. Goddard plays a leading role in NASA’s accomplishments by contributing compelling scientific knowledge to advance the Agency’s mission. <b>Follow us on <a href="http://twitter.com/NASA_GoddardPix" rel="nofollow">Twitter</a></b> <b>Like us on <a href="http://www.facebook.com/pages/Greenbelt-MD/NASA-Goddard/395013845897?ref=tsd" rel="nofollow">Facebook</a></b> <b>Find us on <a href="http://instagram.com/nasagoddard?vm=grid" rel="nofollow">Instagram</a></b>
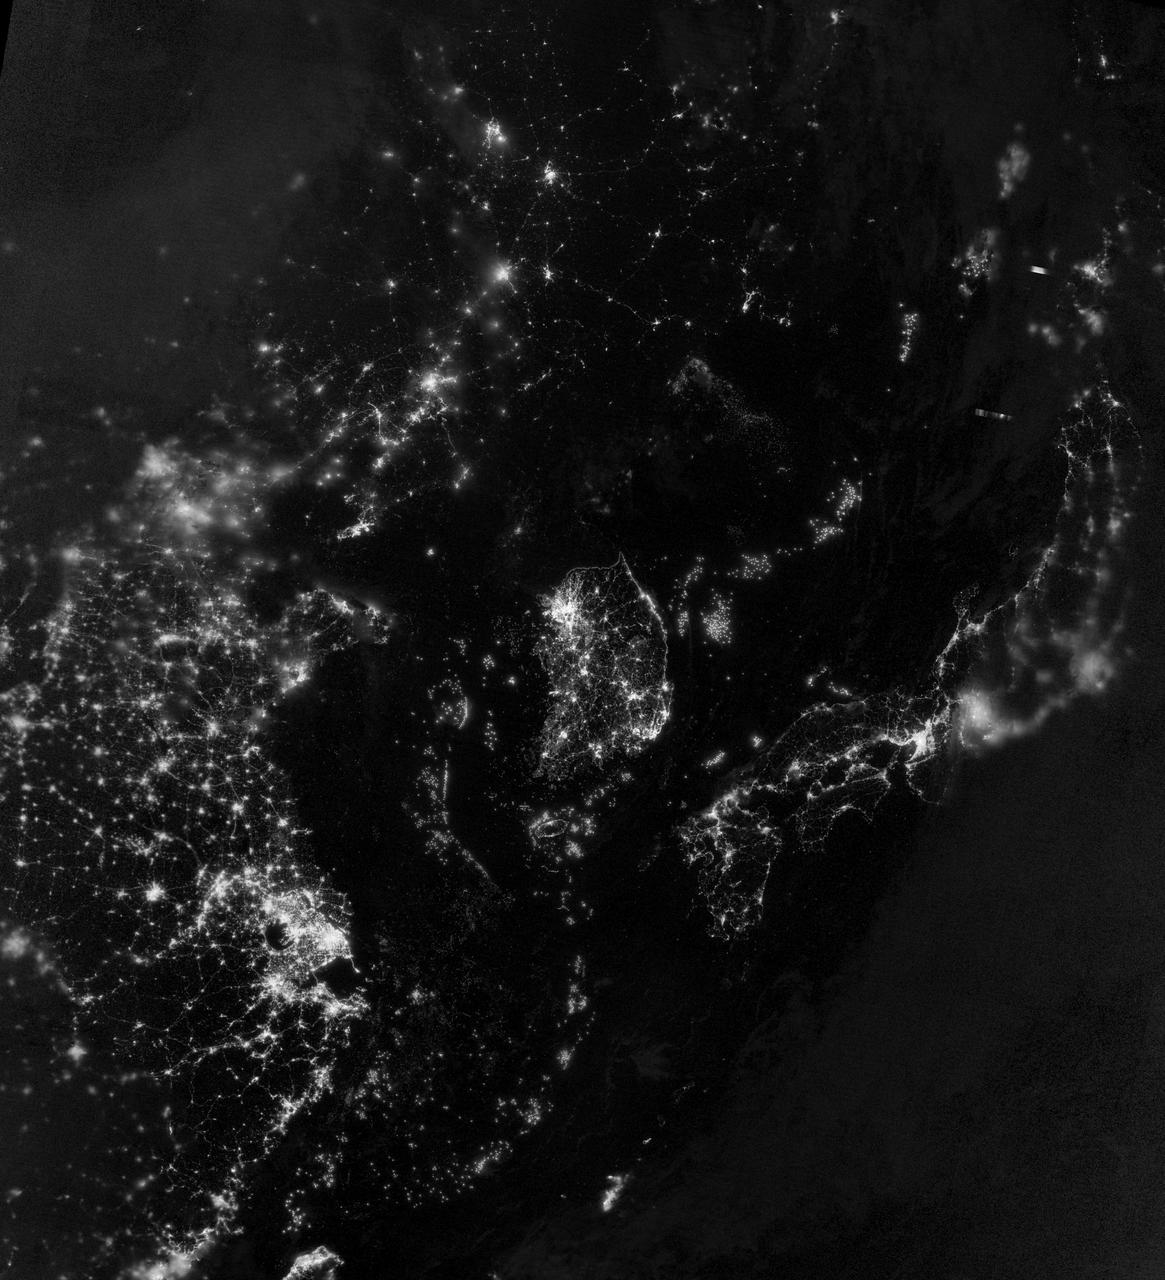
NASA image acquired September 24, 2012 City lights at night are a fairly reliable indicator of where people live. But this isn’t always the case, and the Korean Peninsula shows why. As of July 2012, South Korea’s population was estimated at roughly 49 million people, and North Korea’s population was estimated at about half that number. But where South Korea is gleaming with city lights, North Korea has hardly any lights at all—just a faint glimmer around Pyongyang. On September 24, 2012, the Visible Infrared Imaging Radiometer Suite (VIIRS) on the Suomi NPP satellite captured this nighttime view of the Korean Peninsula. This imagery is from the VIIRS “day-night band,” which detects light in a range of wavelengths from green to near-infrared and uses filtering techniques to observe signals such as gas flares, auroras, wildfires, city lights, and reflected moonlight. The wide-area image shows the Korean Peninsula, parts of China and Japan, the Yellow Sea, and the Sea of Japan. The white inset box encloses an area showing ship lights in the Yellow Sea. Many of the ships form a line, as if assembling along a watery border. Following the 1953 armistice ending the Korean War, per-capita income in South Korea rose to about 17 times the per-capital income level of North Korea, according to the U.S. Central Intelligence Agency. Worldwide, South Korea ranks 12th in electricity production, and 10th in electricity consumption, per 2011 estimates. North Korea ranks 71st in electricity production, and 73rd in electricity consumption, per 2009 estimates. NASA Earth Observatory image by Jesse Allen and Robert Simmon, using VIIRS Day-Night Band data from the Suomi National Polar-orbiting Partnership. Suomi NPP is the result of a partnership between NASA, the National Oceanic and Atmospheric Administration, and the Department of Defense. Caption by Michon Scott. Instrument: Suomi NPP - VIIRS Credit: <b><a href="http://www.earthobservatory.nasa.gov/" rel="nofollow"> NASA Earth Observatory</a></b> <b>Click here to view all of the <a href="http://earthobservatory.nasa.gov/Features/NightLights/" rel="nofollow"> Earth at Night 2012 images </a></b> <b>Click here to <a href="http://earthobservatory.nasa.gov/NaturalHazards/view.php?id=79796" rel="nofollow"> read more </a> about this image </b> <b><a href="http://www.nasa.gov/audience/formedia/features/MP_Photo_Guidelines.html" rel="nofollow">NASA image use policy.</a></b> <b><a href="http://www.nasa.gov/centers/goddard/home/index.html" rel="nofollow">NASA Goddard Space Flight Center</a></b> enables NASA’s mission through four scientific endeavors: Earth Science, Heliophysics, Solar System Exploration, and Astrophysics. Goddard plays a leading role in NASA’s accomplishments by contributing compelling scientific knowledge to advance the Agency’s mission. <b>Follow us on <a href="http://twitter.com/NASA_GoddardPix" rel="nofollow">Twitter</a></b> <b>Like us on <a href="http://www.facebook.com/pages/Greenbelt-MD/NASA-Goddard/395013845897?ref=tsd" rel="nofollow">Facebook</a></b> <b>Find us on <a href="http://instagram.com/nasagoddard?vm=grid" rel="nofollow">Instagram</a></b>
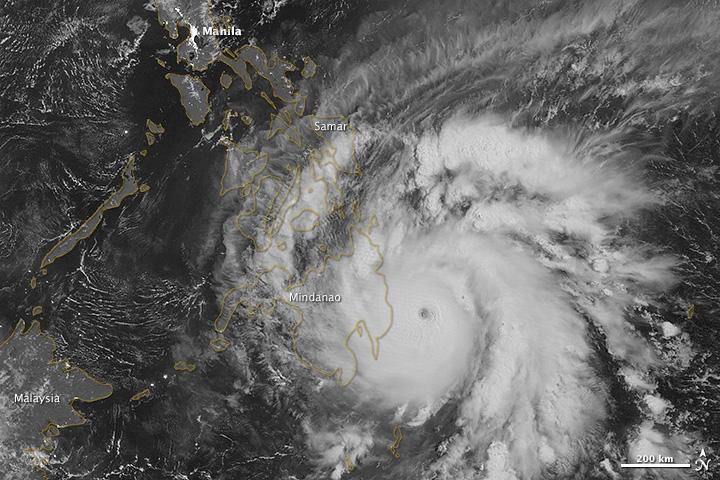
NASA image acquired December 3, 2012 As predicted, Typhoon Bopha made landfall on the Philippine island of Mindanao overnight December 3–4, 2012. Known in the Philippines as Pablo, the storm was blamed for 43 deaths and 25 injuries as of December 4, according to the Philippine Daily Inquirer. (To view the high res or to read more go to: <a href="http://1.usa.gov/XnYhVG" rel="nofollow">1.usa.gov/XnYhVG</a>) The Visible Infrared Imaging Radiometer Suite (VIIRS) on the Suomi NPP satellite acquired this image around 1:12 a.m. local time on December 4 (17:12 UTC on December 3). This image is from the VIIRS “day-night band,” which detects light in a range of wavelengths from green to near-infrared and uses filtering techniques to observe signals such as gas flares, auroras, wildfires, city lights, and reflected moonlight. Bopha remained a powerful typhoon as it made landfall on Mindanao, retaining a distinct eye and spiral shape as storm clouds stretched over the eastern part of the island. Unisys Weather reported that Bopha carried super-typhoon strength at the time it was coming ashore. William Straka, associate researcher at the Cooperative Institute for Meteorological Satellite Studies at the University of Wisconsin–Madison, estimated that the storm spanned at least 1,677 kilometers (1,042 miles). Bopha lost some strength after making landfall. On December 4 (late in the evening in the Philippines), the U.S. Navy’s Joint Typhoon Warning Center (JTWC) reported that the storm had maximum sustained winds of 95 knots (175 kilometers per hour) and gusts up to 115 knots (215 kilometers per hour)—still a fierce storm, but weakened since the previous day. The JTWC projected storm track showed Bopha continuing its movement toward the west-northwest, passing over the southern Philippines toward the South China Sea. NASA Earth Observatory image by Jesse Allen, using VIIRS day-night band data from the Suomi National Polar-orbiting Partnership. Suomi NPP is the result of a partnership between NASA, the National Oceanic and Atmospheric Administration, and the Department of Defense. Caption by Michon Scott. Instrument: Suomi NPP - VIIRS Credit: <b><a href="http://www.earthobservatory.nasa.gov/" rel="nofollow"> NASA Earth Observatory</a></b> <b><a href="http://www.nasa.gov/audience/formedia/features/MP_Photo_Guidelines.html" rel="nofollow">NASA image use policy.</a></b> <b><a href="http://www.nasa.gov/centers/goddard/home/index.html" rel="nofollow">NASA Goddard Space Flight Center</a></b> enables NASA’s mission through four scientific endeavors: Earth Science, Heliophysics, Solar System Exploration, and Astrophysics. Goddard plays a leading role in NASA’s accomplishments by contributing compelling scientific knowledge to advance the Agency’s mission. <b>Follow us on <a href="http://twitter.com/NASA_GoddardPix" rel="nofollow">Twitter</a></b> <b>Like us on <a href="http://www.facebook.com/pages/Greenbelt-MD/NASA-Goddard/395013845897?ref=tsd" rel="nofollow">Facebook</a></b> <b>Find us on <a href="http://instagrid.me/nasagoddard/?vm=grid" rel="nofollow">Instagram</a></b>

The Visible Infrared Imaging Radiometer Suite (VIIRS) on the Suomi NPP satellite captured this view of extensive sea-ice fracturing off the northern coast of Alaska. The event began in late-January and spread west toward Banks Island throughout February and March 2013. Visualizations of the Arctic often give the impression that the ice cap is a continuous sheet of stationary, floating ice. In fact, it is a collection of smaller pieces that constantly shift, crack, and grind against one another as they are jostled by winds and ocean currents. Especially during the summer—but even during the height of winter—cracks—or leads—open up between pieces of ice. That was what was happening on the left side of the animation (seen here: <a href="http://bit.ly/10kE7sh" rel="nofollow">bit.ly/10kE7sh</a>) in late January. A high-pressure weather system was parked over the region, producing warmer temperatures and winds that flowed in a southwesterly direction. That fueled the Beaufort Gyre, a wind-driven ocean current that flows clockwise. The gyre was the key force pulling pieces of ice west past Point Barrow, the northern nub of Alaska that protrudes into the Beaufort Sea. “A fracturing event in this area is not unusual because the Beaufort Gyre tends to push ice away from Banks Island and the Canadian Archipelago,” explained Walt Meier of the National Snow & Ice Data Center (NSIDC). “Point Barrow can act like a ‘pin point’ where the ice catches and fractures to the north and east.” In February, however, a series of storms passing over central Alaska exacerbated the fracturing. Strong westerly winds prompted several large pieces of ice to break away in an arc-shaped wave that moved progressively east. By the end of February, large pieces of ice had fractured all the way to the western coast of Banks Island, a distance of about 1,000 kilometers (600 miles). The data used to create the animation came from the longwave infrared (thermal) portion of the electromagnetic spectrum, so the animation illustrates how much heat the surface was emitting as VIIRS surveyed the area. Cooler areas (sea ice) appear white, while warmer areas (open water) are dark. The light gray plume near the cracks is warmer, moister air escaping from the ocean and blowing downwind. Clouds do not show up well in the VIIRS thermal band, so the storms that fueled the fracturing are not readily visible. While fracturing events are common, few events sprawl across such a large area or produce cracks as long and wide as those seen here. The age of the sea ice in this area was one of the key reasons this event became so widespread. “The region is covered almost completely by seasonal or first-year ice—ice that has formed since last September,” said Meier. “This ice is thinner and weaker than the older, multi-year ice, so it responds more readily to winds and is more easily broken up.” NASA Earth Observatory images by Jesse Allen using VIIRS day-night band data from the Suomi National Polar-orbiting Partnership. Suomi NPP is the result of a partnership between NASA, the National Oceanic and Atmospheric Administration, and the Department of Defense. Caption by Adam Voiland. Instrument: Suomi NPP - VIIRS For more info go to: <a href="http://earthobservatory.nasa.gov/IOTD/view.php?id=80752" rel="nofollow">earthobservatory.nasa.gov/IOTD/view.php?id=80752</a> Credit: <b><a href="http://www.earthobservatory.nasa.gov/" rel="nofollow"> NASA Earth Observatory</a></b> <b><a href="http://www.nasa.gov/audience/formedia/features/MP_Photo_Guidelines.html" rel="nofollow">NASA image use policy.</a></b> <b><a href="http://www.nasa.gov/centers/goddard/home/index.html" rel="nofollow">NASA Goddard Space Flight Center</a></b> enables NASA’s mission through four scientific endeavors: Earth Science, Heliophysics, Solar System Exploration, and Astrophysics. Goddard plays a leading role in NASA’s accomplishments by contributing compelling scientific knowledge to advance the Agency’s mission. <b>Follow us on <a href="http://twitter.com/NASA_GoddardPix" rel="nofollow">Twitter</a></b> <b>Like us on <a href="http://www.facebook.com/pages/Greenbelt-MD/NASA-Goddard/395013845897?ref=tsd" rel="nofollow">Facebook</a></b> <b>Find us on <a href="http://instagram.com/nasagoddard?vm=grid" rel="nofollow">Instagram</a></b>

The Visible Infrared Imaging Radiometer Suite (VIIRS) on the Suomi NPP satellite captured this view of extensive sea-ice fracturing off the northern coast of Alaska. The event began in late-January and spread west toward Banks Island throughout February and March 2013. Visualizations of the Arctic often give the impression that the ice cap is a continuous sheet of stationary, floating ice. In fact, it is a collection of smaller pieces that constantly shift, crack, and grind against one another as they are jostled by winds and ocean currents. Especially during the summer—but even during the height of winter—cracks—or leads—open up between pieces of ice. That was what was happening on the left side of the animation (seen here: <a href="http://bit.ly/10kE7sh" rel="nofollow">bit.ly/10kE7sh</a>) in late January. A high-pressure weather system was parked over the region, producing warmer temperatures and winds that flowed in a southwesterly direction. That fueled the Beaufort Gyre, a wind-driven ocean current that flows clockwise. The gyre was the key force pulling pieces of ice west past Point Barrow, the northern nub of Alaska that protrudes into the Beaufort Sea. “A fracturing event in this area is not unusual because the Beaufort Gyre tends to push ice away from Banks Island and the Canadian Archipelago,” explained Walt Meier of the National Snow & Ice Data Center (NSIDC). “Point Barrow can act like a ‘pin point’ where the ice catches and fractures to the north and east.” In February, however, a series of storms passing over central Alaska exacerbated the fracturing. Strong westerly winds prompted several large pieces of ice to break away in an arc-shaped wave that moved progressively east. By the end of February, large pieces of ice had fractured all the way to the western coast of Banks Island, a distance of about 1,000 kilometers (600 miles). The data used to create the animation came from the longwave infrared (thermal) portion of the electromagnetic spectrum, so the animation illustrates how much heat the surface was emitting as VIIRS surveyed the area. Cooler areas (sea ice) appear white, while warmer areas (open water) are dark. The light gray plume near the cracks is warmer, moister air escaping from the ocean and blowing downwind. Clouds do not show up well in the VIIRS thermal band, so the storms that fueled the fracturing are not readily visible. While fracturing events are common, few events sprawl across such a large area or produce cracks as long and wide as those seen here. The age of the sea ice in this area was one of the key reasons this event became so widespread. “The region is covered almost completely by seasonal or first-year ice—ice that has formed since last September,” said Meier. “This ice is thinner and weaker than the older, multi-year ice, so it responds more readily to winds and is more easily broken up.” NASA Earth Observatory images by Jesse Allen using VIIRS day-night band data from the Suomi National Polar-orbiting Partnership. Suomi NPP is the result of a partnership between NASA, the National Oceanic and Atmospheric Administration, and the Department of Defense. Caption by Adam Voiland. Instrument: Suomi NPP - VIIRS For more info go to: <a href="http://earthobservatory.nasa.gov/IOTD/view.php?id=80752" rel="nofollow">earthobservatory.nasa.gov/IOTD/view.php?id=80752</a> Credit: <b><a href="http://www.earthobservatory.nasa.gov/" rel="nofollow"> NASA Earth Observatory</a></b> <b><a href="http://www.nasa.gov/audience/formedia/features/MP_Photo_Guidelines.html" rel="nofollow">NASA image use policy.</a></b> <b><a href="http://www.nasa.gov/centers/goddard/home/index.html" rel="nofollow">NASA Goddard Space Flight Center</a></b> enables NASA’s mission through four scientific endeavors: Earth Science, Heliophysics, Solar System Exploration, and Astrophysics. Goddard plays a leading role in NASA’s accomplishments by contributing compelling scientific knowledge to advance the Agency’s mission. <b>Follow us on <a href="http://twitter.com/NASA_GoddardPix" rel="nofollow">Twitter</a></b> <b>Like us on <a href="http://www.facebook.com/pages/Greenbelt-MD/NASA-Goddard/395013845897?ref=tsd" rel="nofollow">Facebook</a></b> <b>Find us on <a href="http://instagram.com/nasagoddard?vm=grid" rel="nofollow">Instagram</a></b>

The Visible Infrared Imaging Radiometer Suite (VIIRS) on the Suomi NPP satellite captured this view of extensive sea-ice fracturing off the northern coast of Alaska. The event began in late-January and spread west toward Banks Island throughout February and March 2013. Visualizations of the Arctic often give the impression that the ice cap is a continuous sheet of stationary, floating ice. In fact, it is a collection of smaller pieces that constantly shift, crack, and grind against one another as they are jostled by winds and ocean currents. Especially during the summer—but even during the height of winter—cracks—or leads—open up between pieces of ice. That was what was happening on the left side of the animation (seen here: <a href="http://bit.ly/10kE7sh" rel="nofollow">bit.ly/10kE7sh</a>) in late January. A high-pressure weather system was parked over the region, producing warmer temperatures and winds that flowed in a southwesterly direction. That fueled the Beaufort Gyre, a wind-driven ocean current that flows clockwise. The gyre was the key force pulling pieces of ice west past Point Barrow, the northern nub of Alaska that protrudes into the Beaufort Sea. “A fracturing event in this area is not unusual because the Beaufort Gyre tends to push ice away from Banks Island and the Canadian Archipelago,” explained Walt Meier of the National Snow & Ice Data Center (NSIDC). “Point Barrow can act like a ‘pin point’ where the ice catches and fractures to the north and east.” In February, however, a series of storms passing over central Alaska exacerbated the fracturing. Strong westerly winds prompted several large pieces of ice to break away in an arc-shaped wave that moved progressively east. By the end of February, large pieces of ice had fractured all the way to the western coast of Banks Island, a distance of about 1,000 kilometers (600 miles). The data used to create the animation came from the longwave infrared (thermal) portion of the electromagnetic spectrum, so the animation illustrates how much heat the surface was emitting as VIIRS surveyed the area. Cooler areas (sea ice) appear white, while warmer areas (open water) are dark. The light gray plume near the cracks is warmer, moister air escaping from the ocean and blowing downwind. Clouds do not show up well in the VIIRS thermal band, so the storms that fueled the fracturing are not readily visible. While fracturing events are common, few events sprawl across such a large area or produce cracks as long and wide as those seen here. The age of the sea ice in this area was one of the key reasons this event became so widespread. “The region is covered almost completely by seasonal or first-year ice—ice that has formed since last September,” said Meier. “This ice is thinner and weaker than the older, multi-year ice, so it responds more readily to winds and is more easily broken up.” NASA Earth Observatory images by Jesse Allen using VIIRS day-night band data from the Suomi National Polar-orbiting Partnership. Suomi NPP is the result of a partnership between NASA, the National Oceanic and Atmospheric Administration, and the Department of Defense. Caption by Adam Voiland. Instrument: Suomi NPP - VIIRS For more info go to: <a href="http://earthobservatory.nasa.gov/IOTD/view.php?id=80752" rel="nofollow">earthobservatory.nasa.gov/IOTD/view.php?id=80752</a> Credit: <b><a href="http://www.earthobservatory.nasa.gov/" rel="nofollow"> NASA Earth Observatory</a></b> <b><a href="http://www.nasa.gov/audience/formedia/features/MP_Photo_Guidelines.html" rel="nofollow">NASA image use policy.</a></b> <b><a href="http://www.nasa.gov/centers/goddard/home/index.html" rel="nofollow">NASA Goddard Space Flight Center</a></b> enables NASA’s mission through four scientific endeavors: Earth Science, Heliophysics, Solar System Exploration, and Astrophysics. Goddard plays a leading role in NASA’s accomplishments by contributing compelling scientific knowledge to advance the Agency’s mission. <b>Follow us on <a href="http://twitter.com/NASA_GoddardPix" rel="nofollow">Twitter</a></b> <b>Like us on <a href="http://www.facebook.com/pages/Greenbelt-MD/NASA-Goddard/395013845897?ref=tsd" rel="nofollow">Facebook</a></b> <b>Find us on <a href="http://instagram.com/nasagoddard?vm=grid" rel="nofollow">Instagram</a></b>
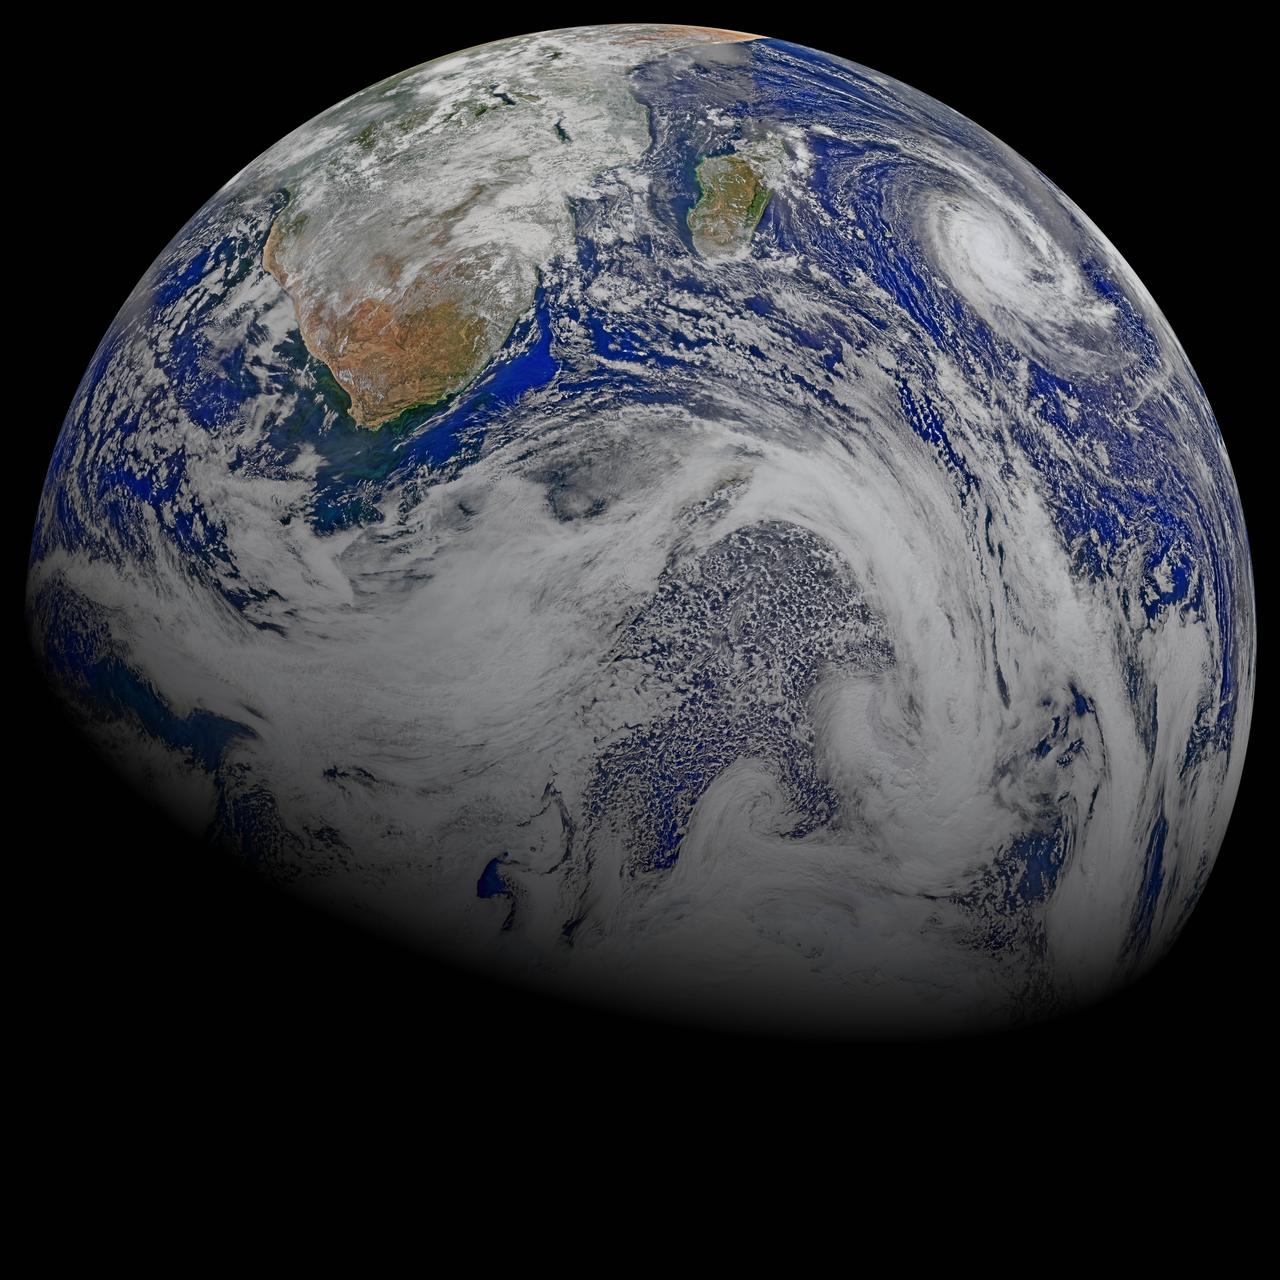
This composite image of southern Africa and the surrounding oceans was captured by six orbits of the NASA/NOAA Suomi National Polar-orbiting Partnership spacecraft on April 9, 2015, by the Visible Infrared Imaging Radiometer Suite (VIIRS) instrument. Tropical Cyclone Joalane can be seen over the Indian Ocean. Winds, tides and density differences constantly stir the oceans while phytoplankton continually grow and die. Orbiting radiometers such as VIIRS allows scientists to track this variability over time and contribute to better understanding of ocean processes that are beneficial to human survival on Earth. The image was created by the Ocean Biology Processing Group at NASA's Goddard Space Flight Center in Greenbelt, Maryland. For more information, please visit: <a href="http://oceancolor.gsfc.nasa.gov/" rel="nofollow">oceancolor.gsfc.nasa.gov/</a> and <a href="http://www.nasa.gov/npp" rel="nofollow">www.nasa.gov/npp</a> Image Credit: Ocean Biology Processing Group at NASA's Goddard Space Flight Center <b><a href="http://www.nasa.gov/audience/formedia/features/MP_Photo_Guidelines.html" rel="nofollow">NASA image use policy.</a></b> <b><a href="http://www.nasa.gov/centers/goddard/home/index.html" rel="nofollow">NASA Goddard Space Flight Center</a></b> enables NASA’s mission through four scientific endeavors: Earth Science, Heliophysics, Solar System Exploration, and Astrophysics. Goddard plays a leading role in NASA’s accomplishments by contributing compelling scientific knowledge to advance the Agency’s mission. <b>Follow us on <a href="http://twitter.com/NASAGoddardPix" rel="nofollow">Twitter</a></b> <b>Like us on <a href="http://www.facebook.com/pages/Greenbelt-MD/NASA-Goddard/395013845897?ref=tsd" rel="nofollow">Facebook</a></b> <b>Find us on <a href="http://instagrid.me/nasagoddard/?vm=grid" rel="nofollow">Instagram</a></b>
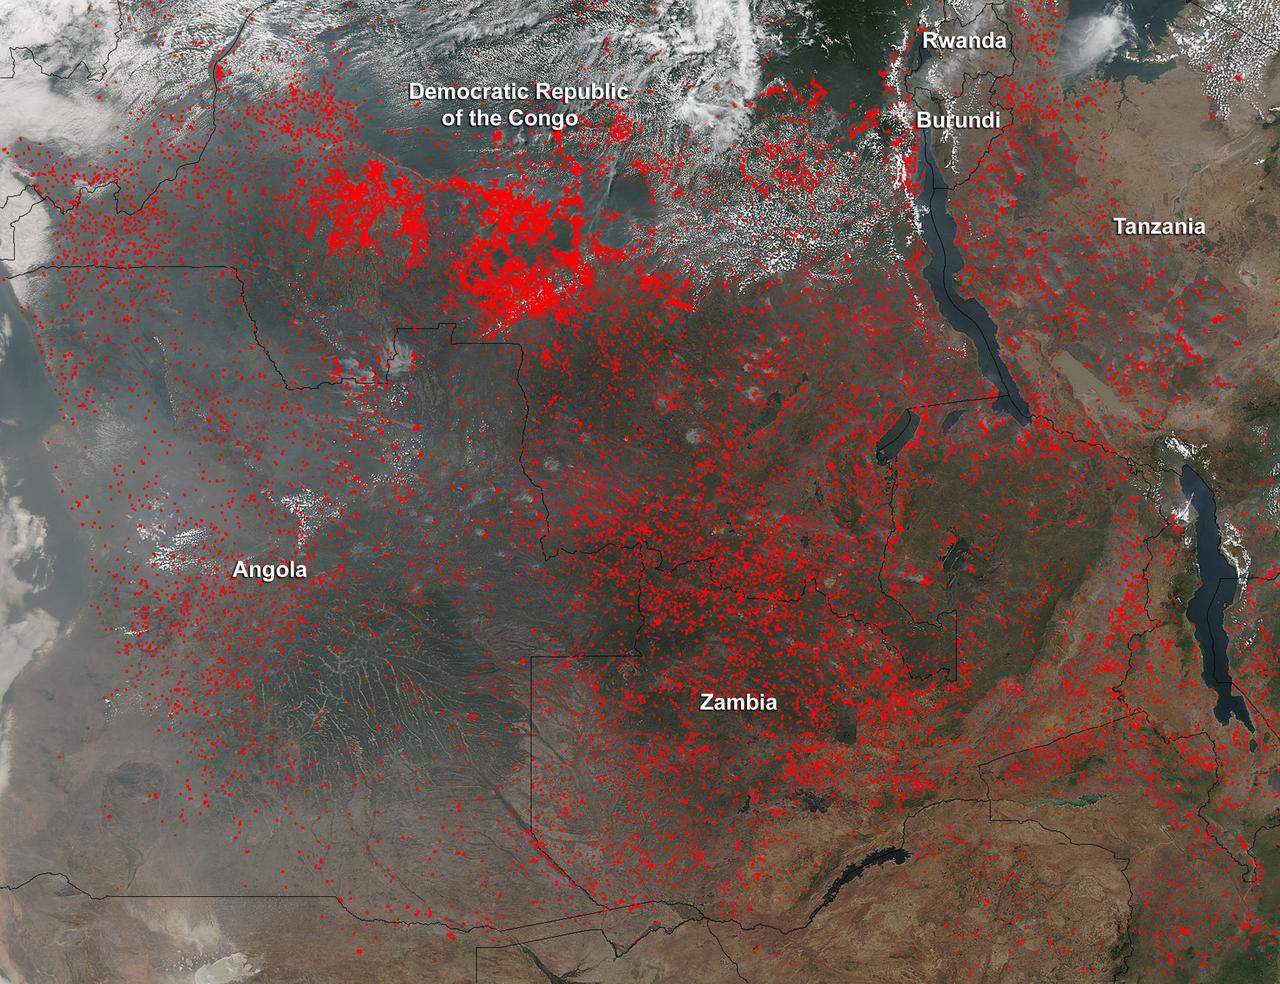
Widespread agricultural burning continues throughout central Africa. Smoke and fires in several countries were seen by the Suomi NPP satellite. Most of the fires were burning in the southern region of the Democratic Republic of the Congo, Tanzania, Zambia and Angola. NASA-NOAA's Suomi NPP satellite's Visible Infrared Imaging Radiometer Suite (VIIRS) instrument captured a look at multiple fires and smoke on August 1 at 7:55 a.m. EDT (11:55 UTC). Actively burning areas, detected by VIIRS are outlined in red. Credit: NASA/Jeff Schmaltz/NASA Goddard Rapid Response Team <b><a href="http://www.nasa.gov/audience/formedia/features/MP_Photo_Guidelines.html" rel="nofollow">NASA image use policy.</a></b> <b><a href="http://www.nasa.gov/centers/goddard/home/index.html" rel="nofollow">NASA Goddard Space Flight Center</a></b> enables NASA’s mission through four scientific endeavors: Earth Science, Heliophysics, Solar System Exploration, and Astrophysics. Goddard plays a leading role in NASA’s accomplishments by contributing compelling scientific knowledge to advance the Agency’s mission. <b>Follow us on <a href="http://twitter.com/NASAGoddardPix" rel="nofollow">Twitter</a></b> <b>Like us on <a href="http://www.facebook.com/pages/Greenbelt-MD/NASA-Goddard/395013845897?ref=tsd" rel="nofollow">Facebook</a></b> <b>Find us on <a href="http://instagrid.me/nasagoddard/?vm=grid" rel="nofollow">Instagram</a></b>
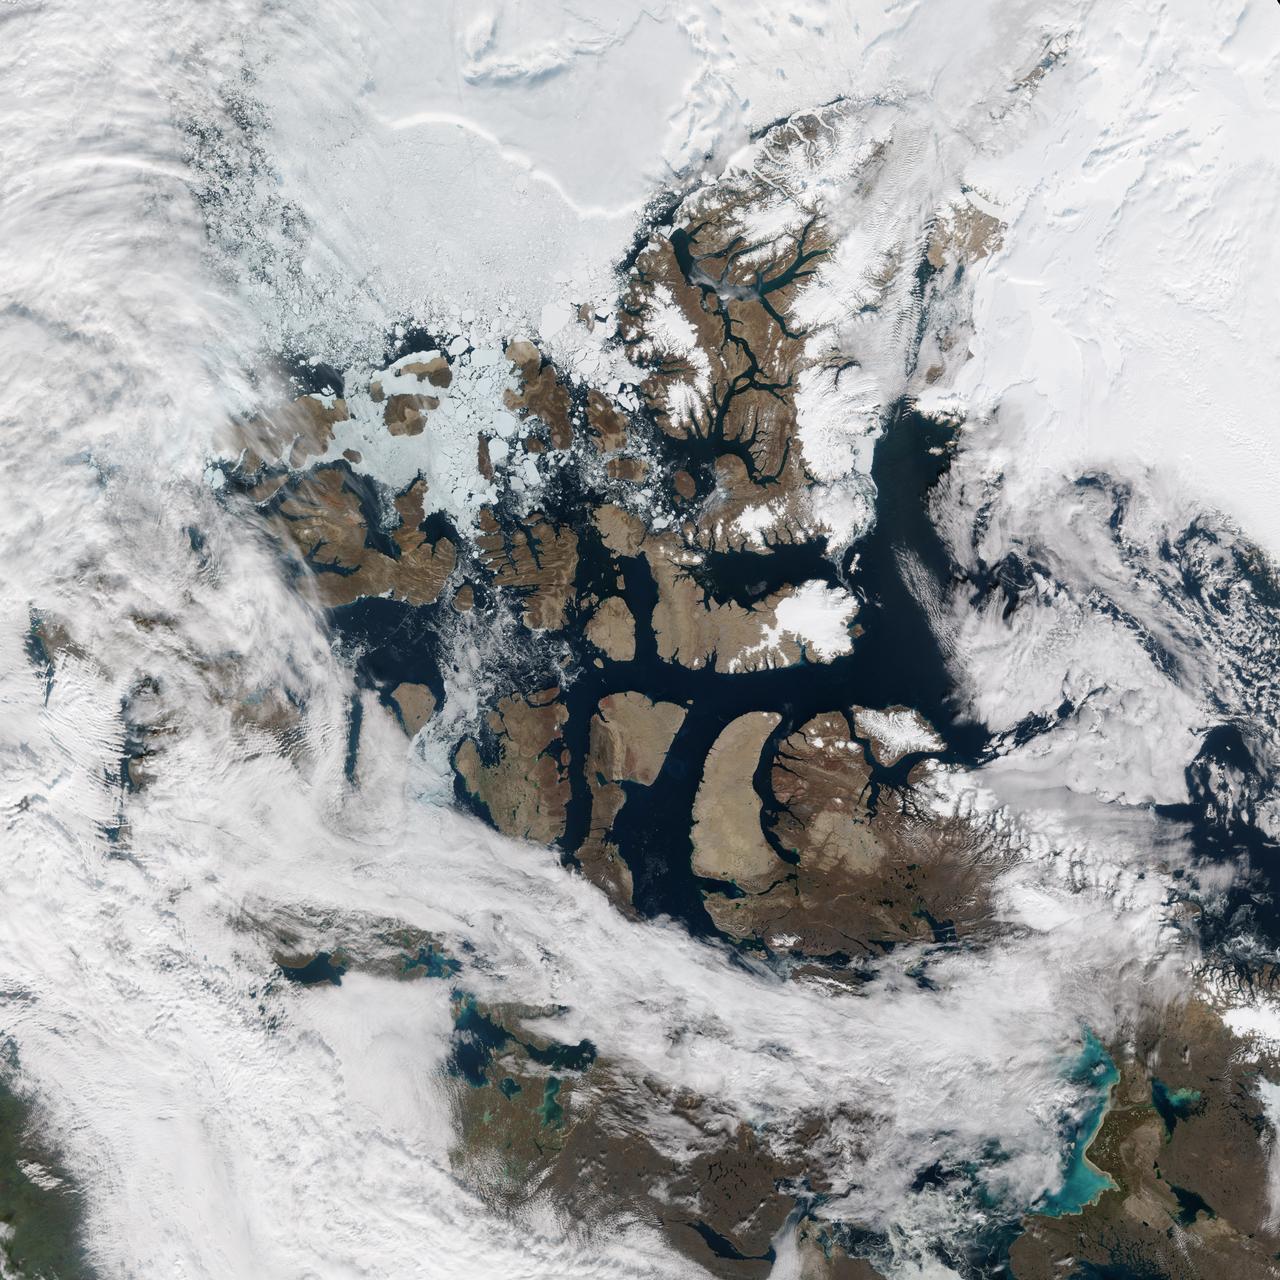
There was a time when the Northwest Passage was a sort of maritime Holy Grail, a route so desired and sought after, but so elusive. For most of the recorded history of North America, the Passage has been nearly impassable and often deadly. But with the modernization of ships and the warming of the Earth, cruising and sailing through the Canadian Archipelago from Baffin Bay to the Beaufort Sea has grown more common and easier. But it’s not necessarily easy. The top image above shows the Northwest Passage as it appeared on August 31, 2015, to the Visible Infrared Imaging Radiometer Suite (VIIRS) on the Suomi-NPP satellite. Read more: <a href="http://earthobservatory.nasa.gov/IOTD/view.php?id=86589" rel="nofollow">earthobservatory.nasa.gov/IOTD/view.php?id=86589</a> NASA Earth Observatory images by Jesse Allen, using VIIRS data from the Suomi National Polar-orbiting Partnership. Suomi NPP is the result of a partnership between NASA, the National Oceanic and Atmospheric Administration, and the Department of Defense. <b><a href="http://www.nasa.gov/audience/formedia/features/MP_Photo_Guidelines.html" rel="nofollow">NASA image use policy.</a></b> <b><a href="http://www.nasa.gov/centers/goddard/home/index.html" rel="nofollow">NASA Goddard Space Flight Center</a></b> enables NASA’s mission through four scientific endeavors: Earth Science, Heliophysics, Solar System Exploration, and Astrophysics. Goddard plays a leading role in NASA’s accomplishments by contributing compelling scientific knowledge to advance the Agency’s mission. <b>Follow us on <a href="http://twitter.com/NASAGoddardPix" rel="nofollow">Twitter</a></b> <b>Like us on <a href="http://www.facebook.com/pages/Greenbelt-MD/NASA-Goddard/395013845897?ref=tsd" rel="nofollow">Facebook</a></b> <b>Find us on <a href="http://instagrid.me/nasagoddard/?vm=grid" rel="nofollow">Instagram</a></b>
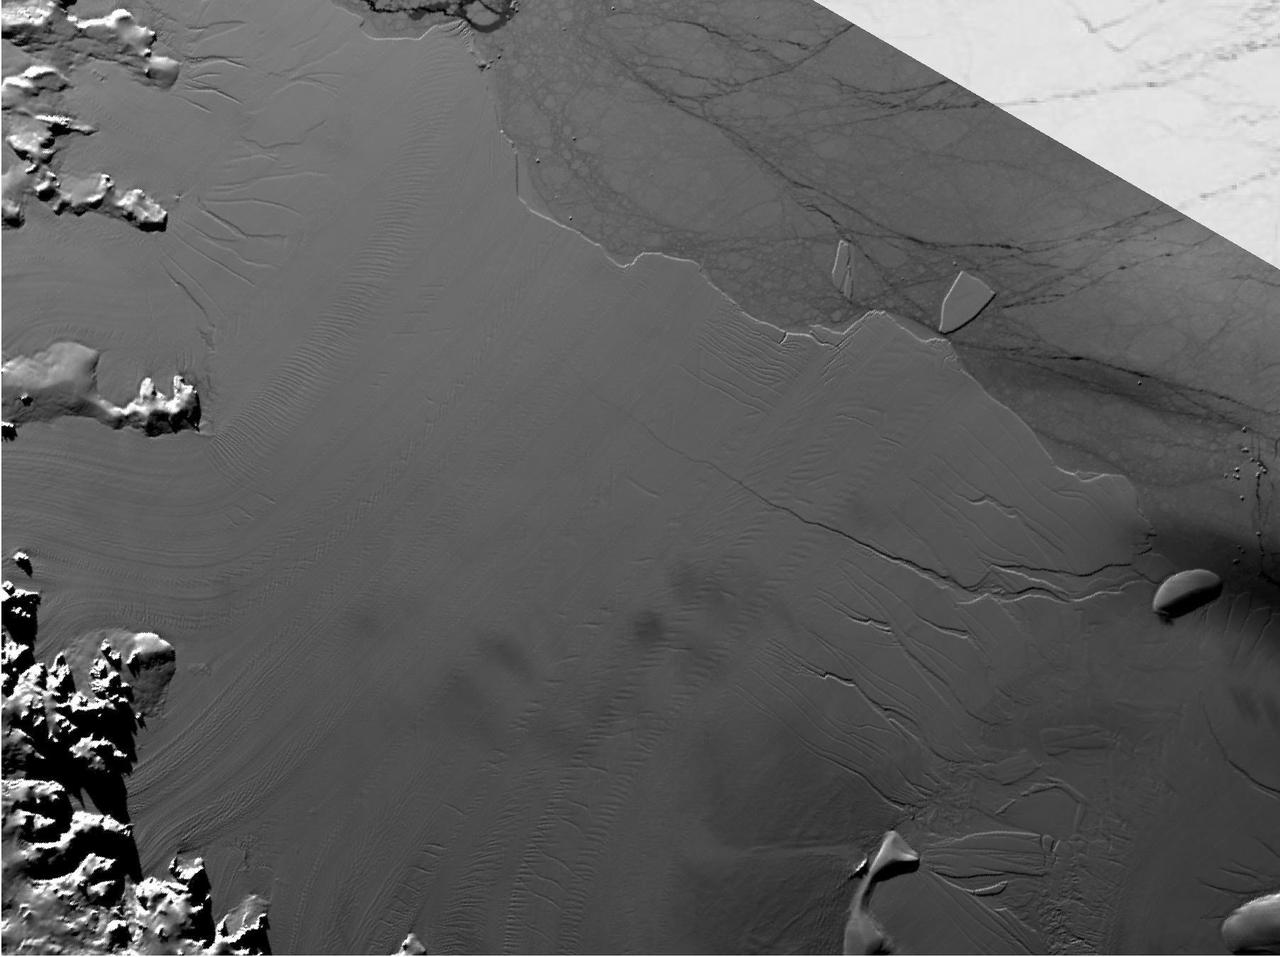
Between July 10 and 12, 2017, the Larsen C Ice Shelf in West Antarctica calved one of the largest icebergs in history (named "A-68"), weighing approximately one trillion tons. The rift in the ice shelf that spawned the iceberg has been present on the shelf since at least the beginning of the Landsat era (approximately the 1970s), but remained relatively dormant until around 2012, when it was observed actively moving through a suture zone in the ice shelf (Jansen et al., 2015). Suture zones are wide bands of ice that extend from glacier grounding lines (the boundary between a floating ice shelf and ice resting on bedrock) to the sea comprised of a frozen mixture of glacial ice and sea water, traditionally considered to be stabilizing features in ice shelves. When the Antarctic entered its annual dark period in late April, scientists knew the rift only had a few more miles to go before it completely calved the large iceberg. However, due to the lack of sunlight during the Antarctic winter, visible imagery is generally not available each year between May and August. This frame is from an animation that shows the ice shelf as imaged by the NASA/NOAA satellite Suomi NPP, which features the VIIRS (Visible Infrared Imaging Radiometer Suite) instrument. VIIRS has a day/night panchromatic band capable of collecting nighttime imagery of Earth with a spatial resolution of 2,460 feet (750 meters). An image from the Moderate Resolution Imaging Spectroradiometer (MODIS) instrument on NASA's Terra satellite shows the last cloud-free, daytime image of the ice shelf on April 6; the MODIS thermal imagery band is shown on April 29. The images from May 9 to July 14 show available cloud-free imagery from Suomi NPP. Luckily, despite several cloudy days leading up to the break, the weather mostly cleared on July 11, allowing scientists to see the newly formed iceberg on July 12. The animation is available at https://photojournal.jpl.nasa.gov/catalog/PIA21785
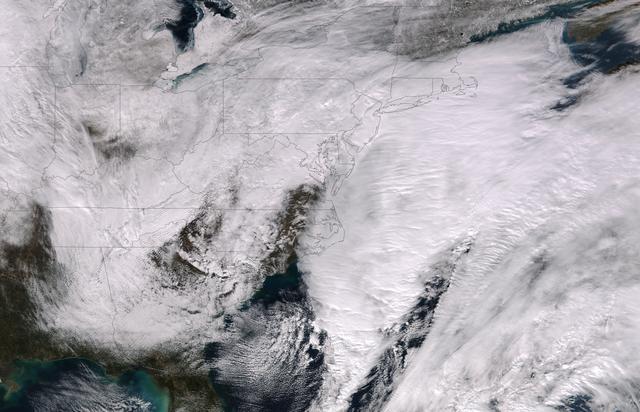
This image was taken by the Suomi NPP satellite's VIIRS instrument at 1825Z on January 26, 2015. A low pressure system currently forming off the mid-Atlantic coast will rapidly strengthen into a major nor'easter today and affect parts of the Northeast U.S. through early Wednesday. This system will be responsible for heavy to intense snowfall and strong winds, with blizzard conditions expected from eastern New Jersey to eastern Massachusetts where Blizzard Warnings are in effect. Accumulations will likely exceed one foot from eastern New Jersey through eastern Maine by late Tuesday. The heaviest snow accumulations, perhaps exceeding two feet, are forecast across portions of Connecticut, Rhode Island and Massachusetts, including the Boston area. Currently, New York City is forecast to receive 18-24 inches of snow, and Boston is forecast to receive 24-36 inches of snow. Wind gusts of 45 to 60 mph will be common from eastern New Jersey to eastern Massachusetts, leading to widespread blizzard conditions. Wind gusts up to 70 mph are possible in far eastern Massachusetts, including Cape Cod and Nantucket. Credit: NASA/NOAA/NPP/VIIRS Via: NASA/NOAA via <b><a href="www.nnvl.noaa.gov/" rel="nofollow"> NOAA Environmental Visualization Laboratory</a></b> <b><a href="http://www.nasa.gov/audience/formedia/features/MP_Photo_Guidelines.html" rel="nofollow">NASA image use policy.</a></b> <b><a href="http://www.nasa.gov/centers/goddard/home/index.html" rel="nofollow">NASA Goddard Space Flight Center</a></b> enables NASA’s mission through four scientific endeavors: Earth Science, Heliophysics, Solar System Exploration, and Astrophysics. Goddard plays a leading role in NASA’s accomplishments by contributing compelling scientific knowledge to advance the Agency’s mission. <b>Follow us on <a href="http://twitter.com/NASAGoddardPix" rel="nofollow">Twitter</a></b> <b>Like us on <a href="http://www.facebook.com/pages/Greenbelt-MD/NASA-Goddard/395013845897?ref=tsd" rel="nofollow">Facebook</a></b> <b>Find us on <a href="http://instagram.com/nasagoddard?vm=grid" rel="nofollow">Instagram</a></b>
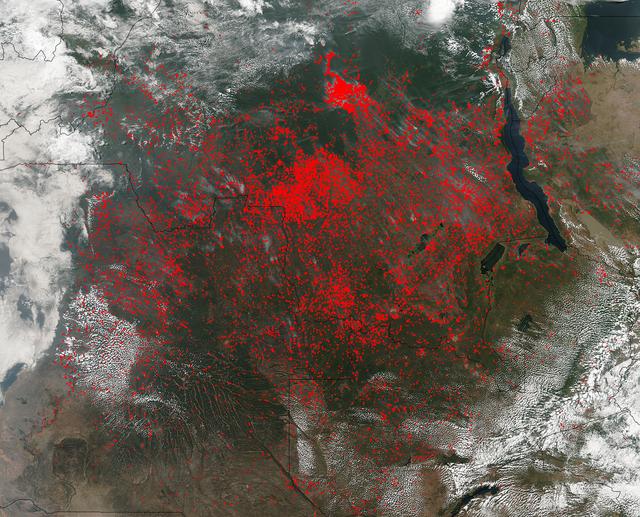
The Suomi NPP satellite's Visible Infrared Imaging Radiometer Suite (VIIRS) instrument captured a look at huge numbers of fires burning and the resulting smoke in central Africa on June 27, 2017. Actively burning areas, detected by VIIRS are outlined in red. The fires obscure most of the landscape in central Africa. June heralds the end of the crop season in this part of the world, and these fires may be intentional agricultural fires set by people to rid the area of left over crops and get it ready for the next season. So too some of these may also be lightning strike fires or they may be accidental fires which may have gotten out of control. The Suomi NPP satellite is a joint mission between NASA and NOAA. NASA image courtesy Jeff Schmaltz, MODIS Rapid Response Team <b><a href="http://www.nasa.gov/audience/formedia/features/MP_Photo_Guidelines.html" rel="nofollow">NASA image use policy.</a></b> <b><a href="http://www.nasa.gov/centers/goddard/home/index.html" rel="nofollow">NASA Goddard Space Flight Center</a></b> enables NASA’s mission through four scientific endeavors: Earth Science, Heliophysics, Solar System Exploration, and Astrophysics. Goddard plays a leading role in NASA’s accomplishments by contributing compelling scientific knowledge to advance the Agency’s mission. <b>Follow us on <a href="http://twitter.com/NASAGoddardPix" rel="nofollow">Twitter</a></b> <b>Like us on <a href="http://www.facebook.com/pages/Greenbelt-MD/NASA-Goddard/395013845897?ref=tsd" rel="nofollow">Facebook</a></b> <b>Find us on <a href="http://instagrid.me/nasagoddard/?vm=grid" rel="nofollow">Instagram</a></b>
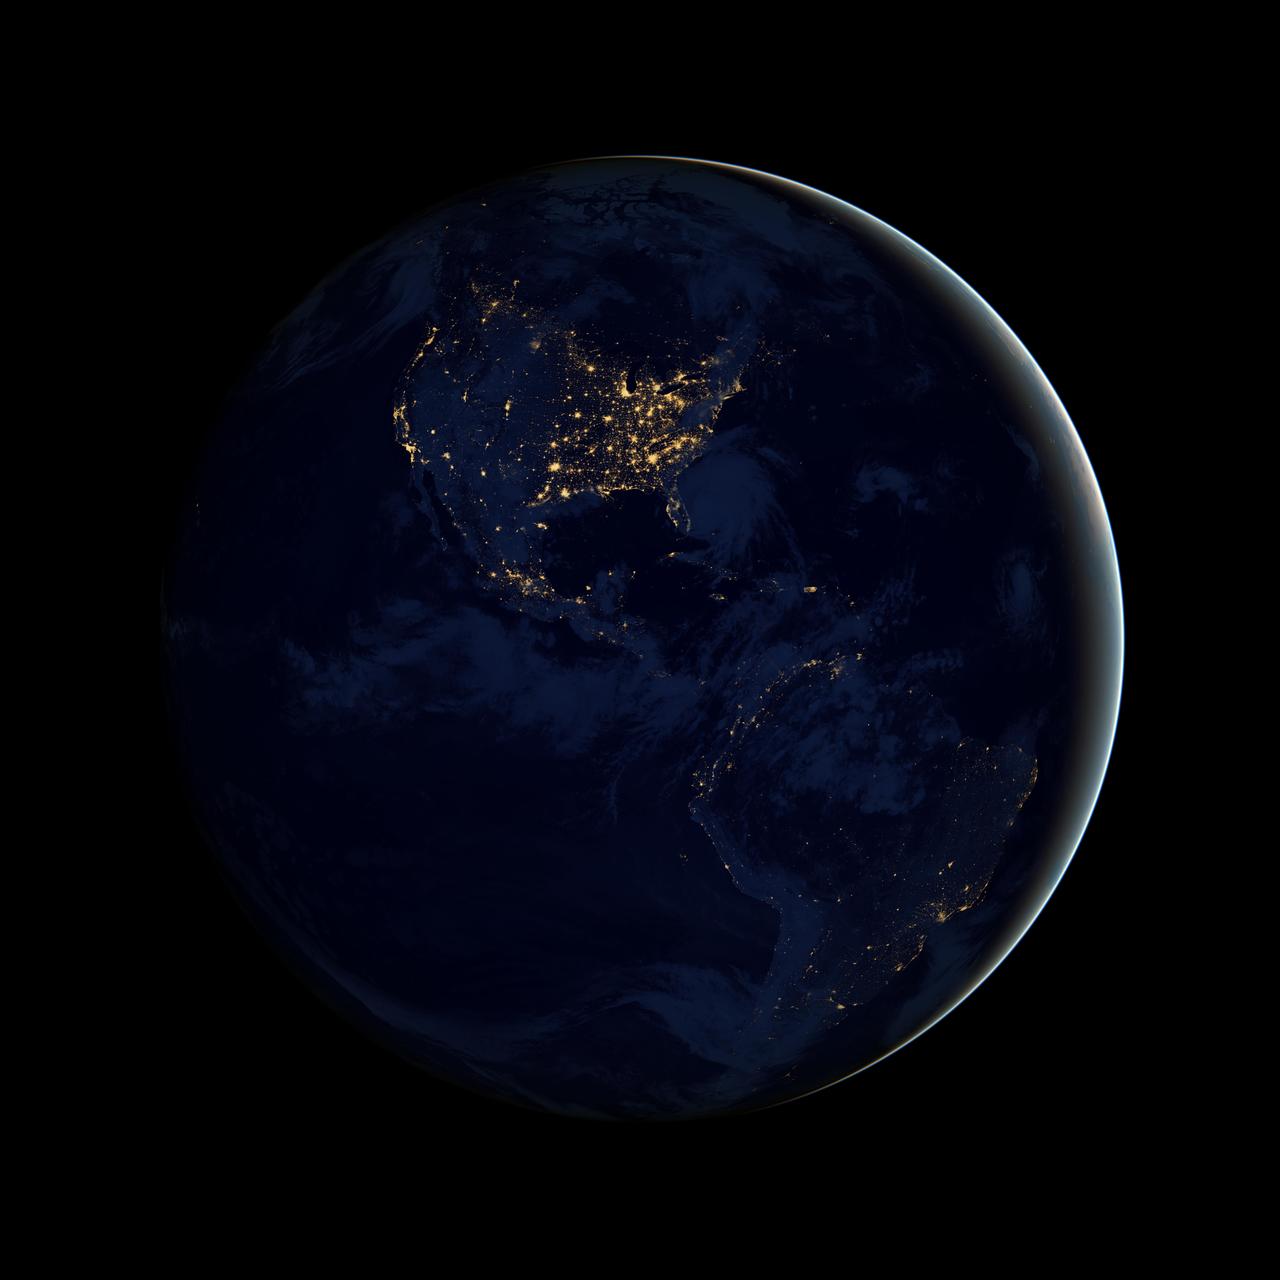
NASA image acquired April 18 - October 23, 2012 This image of North and South America at night is a composite assembled from data acquired by the Suomi NPP satellite in April and October 2012. The new data was mapped over existing Blue Marble imagery of Earth to provide a realistic view of the planet. The nighttime view was made possible by the new satellite’s “day-night band” of the Visible Infrared Imaging Radiometer Suite. VIIRS detects light in a range of wavelengths from green to near-infrared and uses filtering techniques to observe dim signals such as city lights, gas flares, auroras, wildfires, and reflected moonlight. In this case, auroras, fires, and other stray light have been removed to emphasize the city lights. “Artificial lighting is a excellent remote sensing observable and proxy for human activity,” says Chris Elvidge, who leads the Earth Observation Group at NOAA’s National Geophysical Data Center. Social scientists and demographers have used night lights to model the spatial distribution of economic activity, of constructed surfaces, and of populations. Planners and environmental groups have used maps of lights to select sites for astronomical observatories and to monitor human development around parks and wildlife refuges. Electric power companies, emergency managers, and news media turn to night lights to observe blackouts. Named for satellite meteorology pioneer Verner Suomi, NPP flies over any given point on Earth's surface twice each day at roughly 1:30 a.m. and p.m. The polar-orbiting satellite flies 824 kilometers (512 miles) above the surface, sending its data once per orbit to a ground station in Svalbard, Norway, and continuously to local direct broadcast users distributed around the world. The mission is managed by NASA with operational support from NOAA and its Joint Polar Satellite System, which manages the satellite's ground system. NASA Earth Observatory image by Robert Simmon, using Suomi NPP VIIRS data provided courtesy of Chris Elvidge (NOAA National Geophysical Data Center). Suomi NPP is the result of a partnership between NASA, NOAA, and the Department of Defense. Caption by Mike Carlowicz. Instrument: Suomi NPP - VIIRS Credit: <b><a href="http://www.earthobservatory.nasa.gov/" rel="nofollow"> NASA Earth Observatory</a></b> <b>Click here to view all of the <a href="http://earthobservatory.nasa.gov/Features/NightLights/" rel="nofollow"> Earth at Night 2012 images </a></b> <b>Click here to <a href="http://earthobservatory.nasa.gov/NaturalHazards/view.php?id=79787" rel="nofollow"> read more </a> about this image </b> <b><a href="http://www.nasa.gov/audience/formedia/features/MP_Photo_Guidelines.html" rel="nofollow">NASA image use policy.</a></b> <b><a href="http://www.nasa.gov/centers/goddard/home/index.html" rel="nofollow">NASA Goddard Space Flight Center</a></b> enables NASA’s mission through four scientific endeavors: Earth Science, Heliophysics, Solar System Exploration, and Astrophysics. Goddard plays a leading role in NASA’s accomplishments by contributing compelling scientific knowledge to advance the Agency’s mission. <b>Follow us on <a href="http://twitter.com/NASA_GoddardPix" rel="nofollow">Twitter</a></b> <b>Like us on <a href="http://www.facebook.com/pages/Greenbelt-MD/NASA-Goddard/395013845897?ref=tsd" rel="nofollow">Facebook</a></b> <b>Find us on <a href="http://instagram.com/nasagoddard?vm=grid" rel="nofollow">Instagram</a></b>
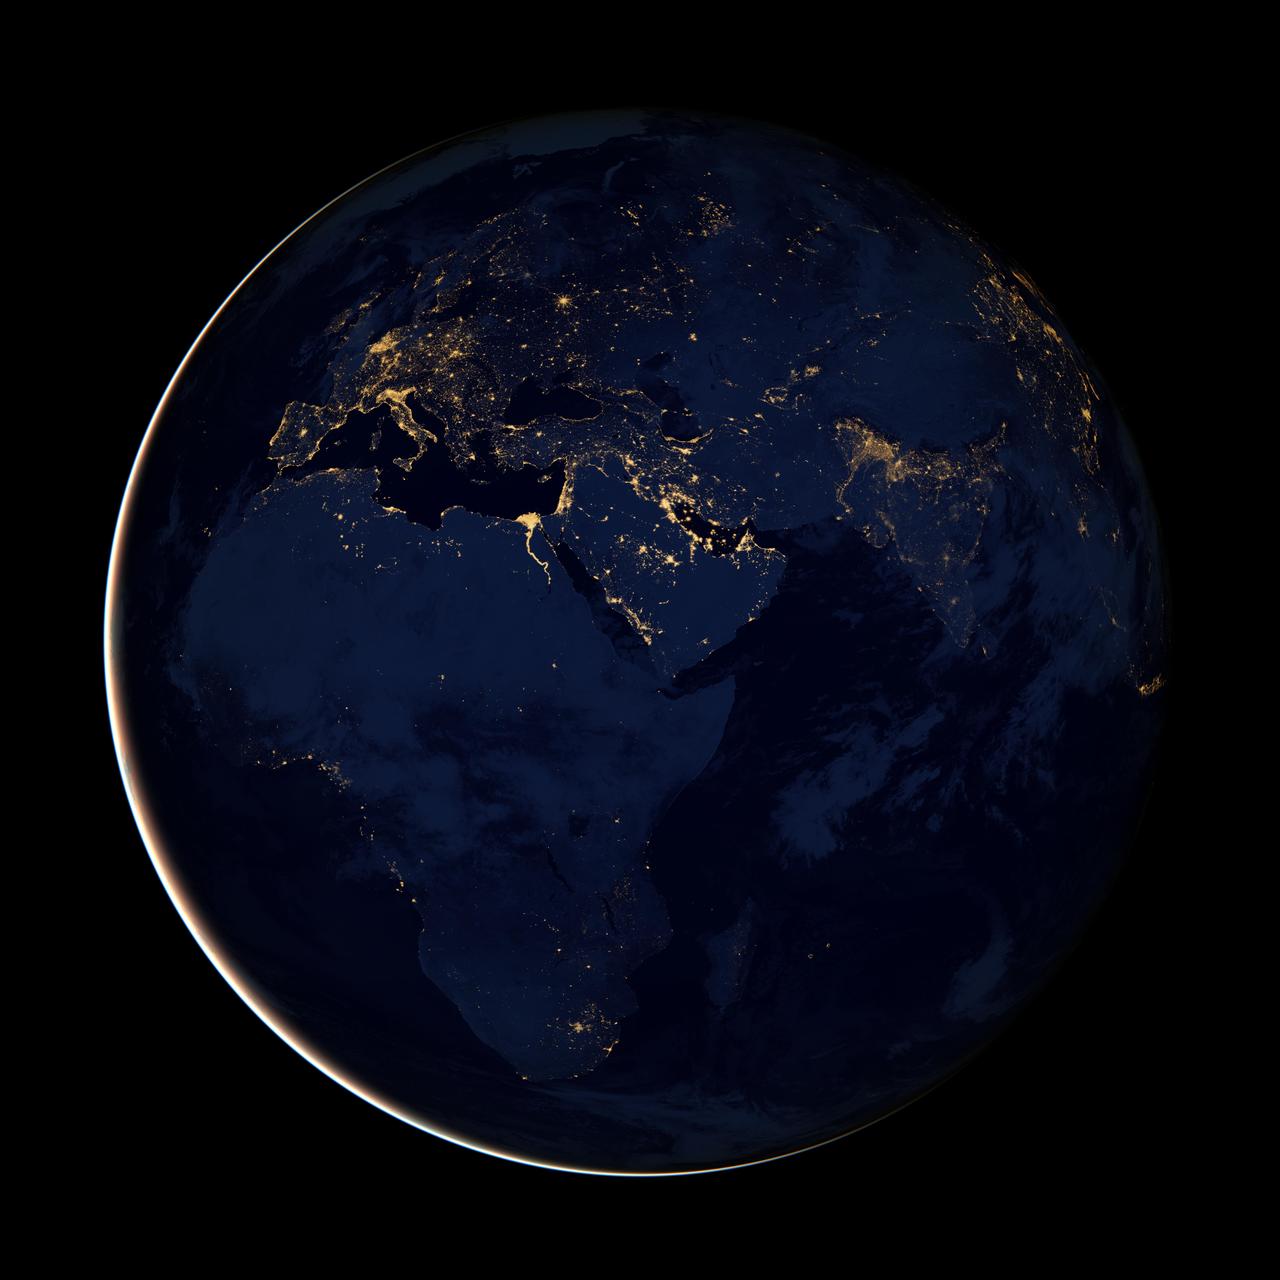
NASA image acquired April 18 - October 23, 2012 This new image of Europe, Africa, and the Middle East at night is a composite assembled from data acquired by the Suomi NPP satellite in April and October 2012. The new data was mapped over existing Blue Marble imagery of Earth to provide a realistic view of the planet. The nighttime view was made possible by the new satellite’s “day-night band” of the Visible Infrared Imaging Radiometer Suite. VIIRS detects light in a range of wavelengths from green to near-infrared and uses filtering techniques to observe dim signals such as gas flares, auroras, wildfires, city lights, and reflected moonlight. In this case, auroras, fires, and other stray light have been removed to emphasize the city lights. “Night time imagery provides an intuitively graspable view of our planet,” says William Stefanov, senior remote sensing scientist for the International Space Station program office. “They provide a fairly straightforward means to map urban versus rural areas, and to show where the major population centers are and where they are not.” Named for satellite meteorology pioneer Verner Suomi, NPP flies over any given point on Earth's surface twice each day at roughly 1:30 a.m. and p.m. The polar-orbiting satellite flies 824 kilometers (512 miles) above the surface, sending its data once per orbit to a ground station in Svalbard, Norway, and continuously to local direct broadcast users distributed around the world. The mission is managed by NASA with operational support from NOAA and its Joint Polar Satellite System, which manages the satellite's ground system. NASA Earth Observatory image by Robert Simmon, using Suomi NPP VIIRS data provided courtesy of Chris Elvidge (NOAA National Geophysical Data Center). Suomi NPP is the result of a partnership between NASA, NOAA, and the Department of Defense. Caption by Mike Carlowicz. Instrument: Suomi NPP - VIIRS Credit: <b><a href="http://www.earthobservatory.nasa.gov/" rel="nofollow"> NASA Earth Observatory</a></b> <b>Click here to view all of the <a href="http://earthobservatory.nasa.gov/Features/NightLights/" rel="nofollow"> Earth at Night 2012 images </a></b> <b>Click here to <a href="http://earthobservatory.nasa.gov/NaturalHazards/view.php?id=79793" rel="nofollow"> read more </a> about this image </b> <b><a href="http://www.nasa.gov/audience/formedia/features/MP_Photo_Guidelines.html" rel="nofollow">NASA image use policy.</a></b> <b><a href="http://www.nasa.gov/centers/goddard/home/index.html" rel="nofollow">NASA Goddard Space Flight Center</a></b> enables NASA’s mission through four scientific endeavors: Earth Science, Heliophysics, Solar System Exploration, and Astrophysics. Goddard plays a leading role in NASA’s accomplishments by contributing compelling scientific knowledge to advance the Agency’s mission. <b>Follow us on <a href="http://twitter.com/NASA_GoddardPix" rel="nofollow">Twitter</a></b> <b>Like us on <a href="http://www.facebook.com/pages/Greenbelt-MD/NASA-Goddard/395013845897?ref=tsd" rel="nofollow">Facebook</a></b> <b>Find us on <a href="http://instagram.com/nasagoddard?vm=grid" rel="nofollow">Instagram</a></b>
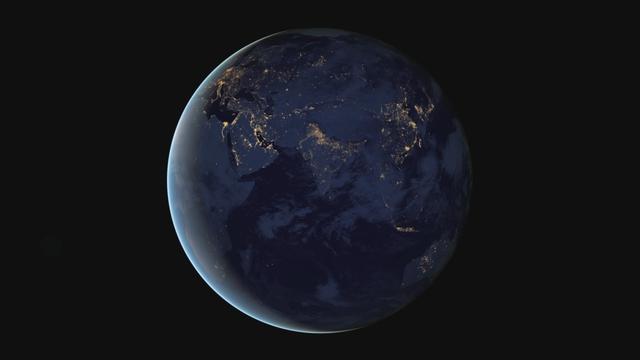
The night side of Earth twinkles with light, and the first thing to stand out is the cities. “Nothing tells us more about the spread of humans across the Earth than city lights,” asserts Chris Elvidge, a NOAA scientist who has studied them for 20 years. This new global view and animation of Earth’s city lights is a composite assembled from data acquired by the Suomi National Polar-orbiting Partnership (Suomi NPP) satellite. The data was acquired over nine days in April 2012 and thirteen days in October 2012. It took satellite 312 orbits and 2.5 terabytes of data to get a clear shot of every parcel of Earth’s land surface and islands. This new data was then mapped over existing Blue Marble imagery of Earth to provide a realistic view of the planet. The nighttime view in visible light was made possible by the new “day-night band” of Suomi NPP’s Visible Infrared Imaging Radiometer Suite. VIIRS detects light in a range of wavelengths from green to near-infrared and uses filtering techniques to observe dim signals such as city lights, auroras, wildfires, and reflected moonlight. This low-light sensor can distinguish night lights with ten to hundreds of times better light detection capability than scientists had before. Named for satellite meteorology pioneer Verner Suomi, NPP flies over any given point on Earth&rsquos surface twice each day at roughly 1:30 a.m. and 1:30 p.m. The polar-orbiting satellite flies 824 kilometers (512 miles) above the surface as it circles the planet 14 times a day. Data is sent once per orbit to a ground station in Svalbard, Norway, and continuously to local direct broadcast users around the world. The mission is managed by NASA with operational support from NOAA and its Joint Polar Satellite System, which manages the satellite's ground system. NASA Earth Observatory image and animation by Robert Simmon, using Suomi NPP VIIRS data provided courtesy of Chris Elvidge (NOAA National Geophysical Data Center). Suomi NPP is the result of a partnership between NASA, NOAA, and the Department of Defense. Caption by Mike Carlowicz. Instrument: Suomi NPP - VIIRS Credit: <b><a href="http://www.earthobservatory.nasa.gov/" rel="nofollow"> NASA Earth Observatory</a></b> <b>Click here to view all of the <a href="http://earthobservatory.nasa.gov/Features/NightLights/" rel="nofollow"> Earth at Night 2012 images </a></b> <b>Click here to <a href="http://earthobservatory.nasa.gov/NaturalHazards/view.php?id=79803" rel="nofollow"> read more </a> about this image </b> <b><a href="http://www.nasa.gov/audience/formedia/features/MP_Photo_Guidelines.html" rel="nofollow">NASA image use policy.</a></b> <b><a href="http://www.nasa.gov/centers/goddard/home/index.html" rel="nofollow">NASA Goddard Space Flight Center</a></b> enables NASA’s mission through four scientific endeavors: Earth Science, Heliophysics, Solar System Exploration, and Astrophysics. Goddard plays a leading role in NASA’s accomplishments by contributing compelling scientific knowledge to advance the Agency’s mission. <b>Follow us on <a href="http://twitter.com/NASA_GoddardPix" rel="nofollow">Twitter</a></b> <b>Like us on <a href="http://www.facebook.com/pages/Greenbelt-MD/NASA-Goddard/395013845897?ref=tsd" rel="nofollow">Facebook</a></b> <b>Find us on <a href="http://instagram.com/nasagoddard?vm=grid" rel="nofollow">Instagram</a></b>
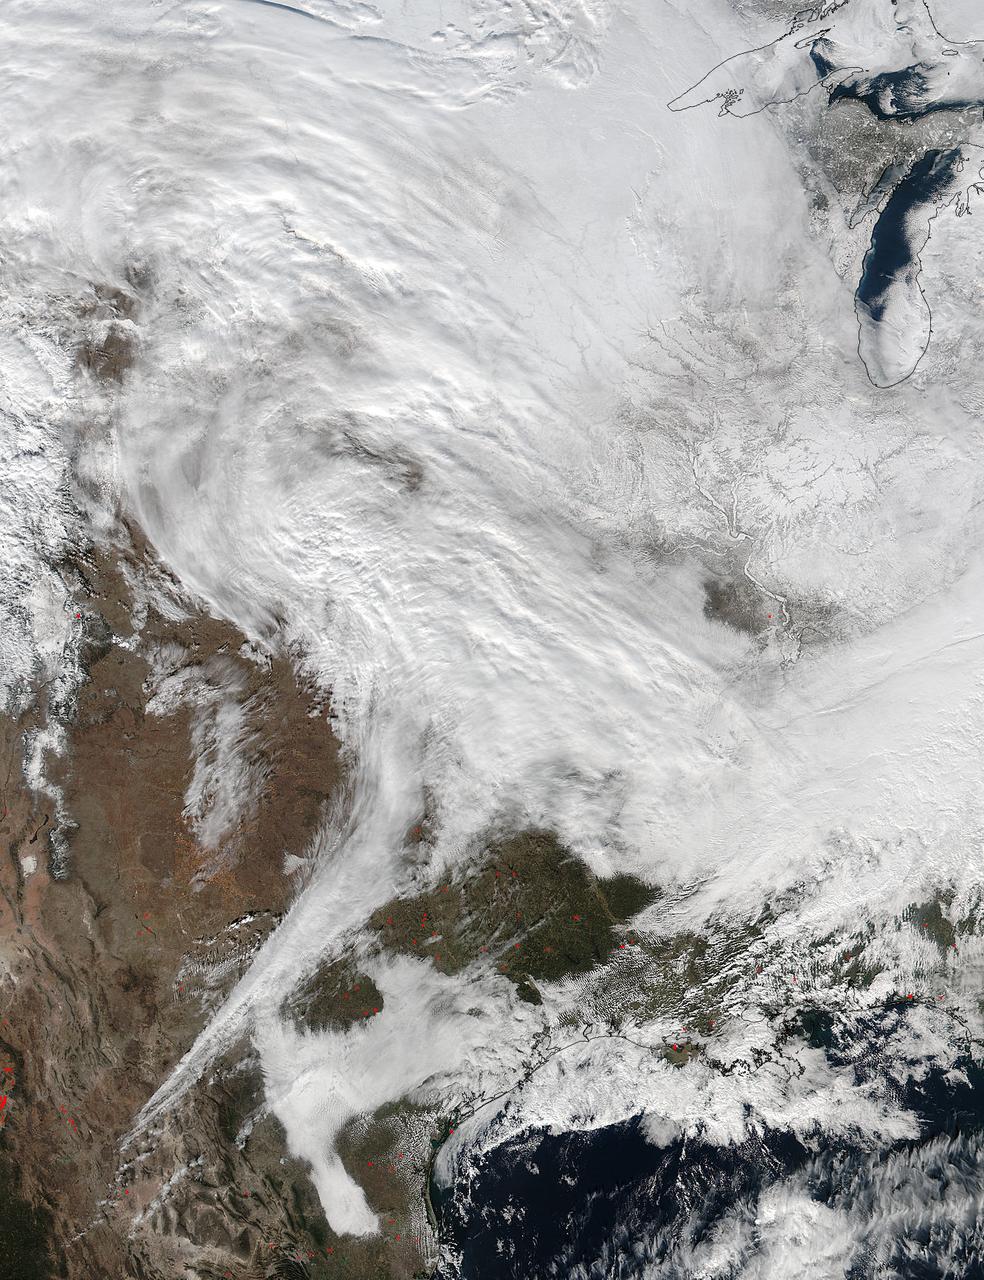
On Jan. 20 at 2:30 p.m. EST the VIIRS instrument aboard NASA-NOAA's Suomi NPP captured this image of the winter storm moving through the central U.S. Credits: NASA Goddard Rapid Response The low pressure area from the Eastern Pacific Ocean moved into the western U.S. and tracked across the four corners region into Texas where NASA-NOAA's Suomi NPP satellite observed the clouds associated with the storm. The Visible Infrared Imaging Radiometer Suite (VIIRS) instrument aboard Suomi NPP satellite captured the visible image on January 20, 2016 at 19:30 UTC (2:30 p.m. EST) when the storm was over the central U.S. In the image, snow cover is visible in the Rockies and southern Great Lakes states. VIIRS collects visible and infrared imagery and global observations of land, atmosphere, cryosphere and oceans. That low pressure system located over the south central United States on Jan. 21 is expected to track east across the Tennessee Valley and will give way to a deepening coastal low pressure area. The National Weather Service said "This latter feature takes over and becomes a dominant force in setting up heavy snow bands over the Mid-Atlantic and very gusty winds." The storm system is expected to bring an increased risk of severe weather from far southeastern Texas across southern Louisiana/Mississippi, and into the far western Florida Panhandle on Thursday, Jan. 21. That threat for severe weather will move east as the low pressure area continues heading in that direction. The National Weather Service Weather Prediction Center in College Park, Maryland said "A potentially crippling winter storm is anticipated for portions of the mid-Atlantic Friday into early Saturday. Snowfall may approach two feet for some locations, including the Baltimore and Washington, D.C. metro areas. Farther north, there is uncertainty in snowfall for the New York City-to-Boston corridor. Farther south, significant icing is likely for portions of Kentucky and North Carolina." <b><a href="http://www.nasa.gov/audience/formedia/features/MP_Photo_Guidelines.html" rel="nofollow">NASA image use policy.</a></b> <b><a href="http://www.nasa.gov/centers/goddard/home/index.html" rel="nofollow">NASA Goddard Space Flight Center</a></b> enables NASA’s mission through four scientific endeavors: Earth Science, Heliophysics, Solar System Exploration, and Astrophysics. Goddard plays a leading role in NASA’s accomplishments by contributing compelling scientific knowledge to advance the Agency’s mission. <b>Follow us on <a href="http://twitter.com/NASAGoddardPix" rel="nofollow">Twitter</a></b> <b>Like us on <a href="http://www.facebook.com/pages/Greenbelt-MD/NASA-Goddard/395013845897?ref=tsd" rel="nofollow">Facebook</a></b> <b>Find us on <a href="http://instagram.com/nasagoddard?vm=grid" rel="nofollow">Instagram</a></b>
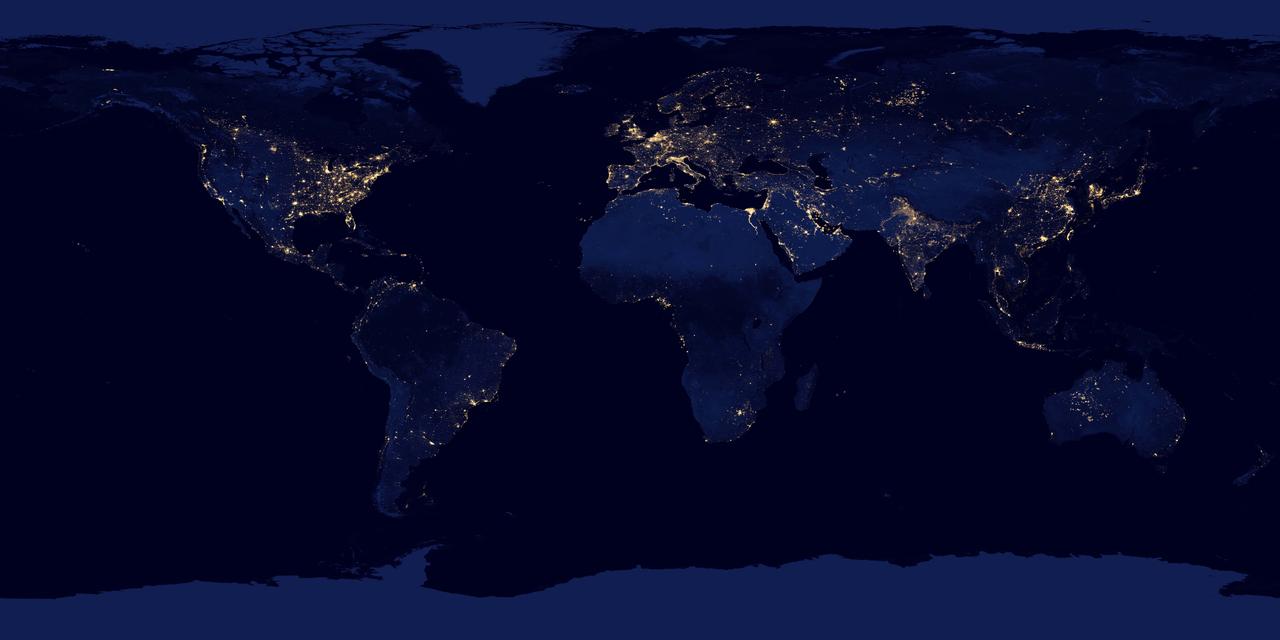
NASA image acquired April 18 - October 23, 2012 This new image of the Earth at night is a composite assembled from data acquired by the Suomi National Polar-orbiting Partnership (Suomi NPP) satellite over nine days in April 2012 and thirteen days in October 2012. It took 312 orbits and 2.5 terabytes of data to get a clear shot of every parcel of Earth’s land surface and islands. The nighttime view of Earth in visible light was made possible by the “day-night band” of the Visible Infrared Imaging Radiometer Suite. VIIRS detects light in a range of wavelengths from green to near-infrared and uses filtering techniques to observe dim signals such as gas flares, auroras, wildfires, city lights, and reflected moonlight. In this case, auroras, fires, and other stray light have been removed to emphasize the city lights. Named for satellite meteorology pioneer Verner Suomi, NPP flies over any given point on Earth’s surface twice each day at roughly 1:30 a.m. and 1:30 p.m. The spacecraft flies 824 kilometers (512 miles) above the surface in a polar orbit, circling the planet about 14 times a day. Suomi NPP sends its data once per orbit to a ground station in Svalbard, Norway, and continuously to local direct broadcast users distributed around the world. The mission is managed by NASA with operational support from NOAA and its Joint Polar Satellite System, which manages the satellite's ground system. NASA Earth Observatory image by Robert Simmon, using Suomi NPP VIIRS data provided courtesy of Chris Elvidge (NOAA National Geophysical Data Center). Suomi NPP is the result of a partnership between NASA, NOAA, and the Department of Defense. Caption by Mike Carlowicz. Instrument: Suomi NPP - VIIRS Credit: <b><a href="http://www.earthobservatory.nasa.gov/" rel="nofollow"> NASA Earth Observatory</a></b> <b>Click here to view all of the <a href="http://earthobservatory.nasa.gov/Features/NightLights/" rel="nofollow"> Earth at Night 2012 images </a></b> <b>Click here to <a href="http://earthobservatory.nasa.gov/NaturalHazards/view.php?id=79765" rel="nofollow"> read more </a> about this image </b> <b><a href="http://www.nasa.gov/audience/formedia/features/MP_Photo_Guidelines.html" rel="nofollow">NASA image use policy.</a></b> <b><a href="http://www.nasa.gov/centers/goddard/home/index.html" rel="nofollow">NASA Goddard Space Flight Center</a></b> enables NASA’s mission through four scientific endeavors: Earth Science, Heliophysics, Solar System Exploration, and Astrophysics. Goddard plays a leading role in NASA’s accomplishments by contributing compelling scientific knowledge to advance the Agency’s mission. <b>Follow us on <a href="http://twitter.com/NASA_GoddardPix" rel="nofollow">Twitter</a></b> <b>Like us on <a href="http://www.facebook.com/pages/Greenbelt-MD/NASA-Goddard/395013845897?ref=tsd" rel="nofollow">Facebook</a></b> <b>Find us on <a href="http://instagram.com/nasagoddard?vm=grid" rel="nofollow">Instagram</a></b>

The night side of Earth twinkles with light, and the first thing to stand out is the cities. “Nothing tells us more about the spread of humans across the Earth than city lights,” asserts Chris Elvidge, a NOAA scientist who has studied them for 20 years. This new global view and animation of Earth’s city lights is a composite assembled from data acquired by the Suomi National Polar-orbiting Partnership (Suomi NPP) satellite. The data was acquired over nine days in April 2012 and thirteen days in October 2012. It took satellite 312 orbits and 2.5 terabytes of data to get a clear shot of every parcel of Earth’s land surface and islands. This new data was then mapped over existing Blue Marble imagery of Earth to provide a realistic view of the planet. The nighttime view in visible light was made possible by the new “day-night band” of Suomi NPP’s Visible Infrared Imaging Radiometer Suite. VIIRS detects light in a range of wavelengths from green to near-infrared and uses filtering techniques to observe dim signals such as city lights, auroras, wildfires, and reflected moonlight. This low-light sensor can distinguish night lights with ten to hundreds of times better light detection capability than scientists had before. Named for satellite meteorology pioneer Verner Suomi, NPP flies over any given point on Earth&rsquos surface twice each day at roughly 1:30 a.m. and 1:30 p.m. The polar-orbiting satellite flies 824 kilometers (512 miles) above the surface as it circles the planet 14 times a day. Data is sent once per orbit to a ground station in Svalbard, Norway, and continuously to local direct broadcast users around the world. The mission is managed by NASA with operational support from NOAA and its Joint Polar Satellite System, which manages the satellite's ground system. NASA Earth Observatory image and animation by Robert Simmon, using Suomi NPP VIIRS data provided courtesy of Chris Elvidge (NOAA National Geophysical Data Center). Suomi NPP is the result of a partnership between NASA, NOAA, and the Department of Defense. Caption by Mike Carlowicz. Instrument: Suomi NPP - VIIRS Credit: <b><a href="http://www.earthobservatory.nasa.gov/" rel="nofollow"> NASA Earth Observatory</a></b> <b>Click here to view all of the <a href="http://earthobservatory.nasa.gov/Features/NightLights/" rel="nofollow"> Earth at Night 2012 images </a></b> <b>Click here to <a href="http://earthobservatory.nasa.gov/NaturalHazards/view.php?id=79803" rel="nofollow"> read more </a> about this image </b> <b><a href="http://www.nasa.gov/audience/formedia/features/MP_Photo_Guidelines.html" rel="nofollow">NASA image use policy.</a></b> <b><a href="http://www.nasa.gov/centers/goddard/home/index.html" rel="nofollow">NASA Goddard Space Flight Center</a></b> enables NASA’s mission through four scientific endeavors: Earth Science, Heliophysics, Solar System Exploration, and Astrophysics. Goddard plays a leading role in NASA’s accomplishments by contributing compelling scientific knowledge to advance the Agency’s mission. <b>Follow us on <a href="http://twitter.com/NASA_GoddardPix" rel="nofollow">Twitter</a></b> <b>Like us on <a href="http://www.facebook.com/pages/Greenbelt-MD/NASA-Goddard/395013845897?ref=tsd" rel="nofollow">Facebook</a></b> <b>Find us on <a href="http://instagram.com/nasagoddard?vm=grid" rel="nofollow">Instagram</a></b>
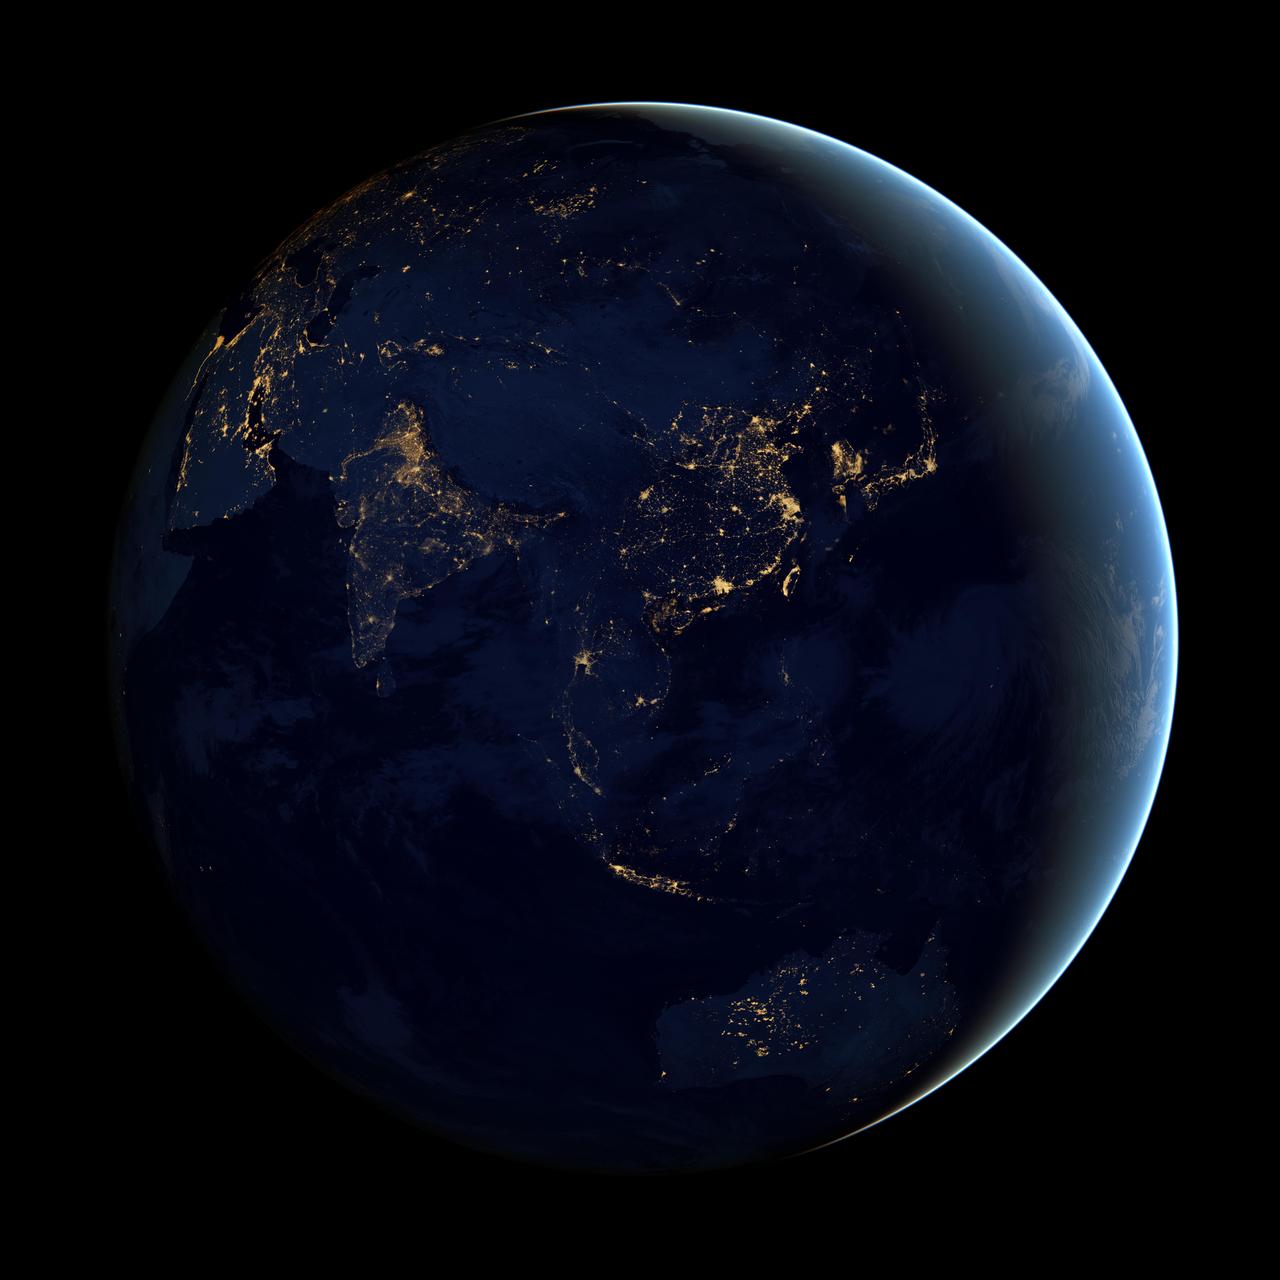
NASA image acquired April 18 - October 23, 2012 This image of Asia and Australia at night is a composite assembled from data acquired by the Suomi NPP satellite in April and October 2012. The new data was mapped over existing Blue Marble imagery of Earth to provide a realistic view of the planet. The nighttime view was made possible by the new satellite’s “day-night band” of the Visible Infrared Imaging Radiometer Suite. VIIRS detects light in a range of wavelengths from green to near-infrared and uses filtering techniques to observe dim signals such as city lights, gas flares, auroras, wildfires, and reflected moonlight. In this case, auroras, fires, and other stray light have been removed to emphasize the city lights. “Night time imagery provides an intuitively graspable view of our planet,” says William Stefanov, a scientist in NASA’s International Space Station program office who has worked with similar images from astronauts. “City lights are an excellent means to track urban and suburban growth, which feeds into planning for energy use and urban hazards, for studying urban heat islands, and for initializing climate models.” Named for satellite meteorology pioneer Verner Suomi, NPP flies over any given point on Earth's surface twice each day at roughly 1:30 a.m. and p.m. The polar-orbiting satellite flies 824 kilometers (512 miles) above the surface, sending its data once per orbit to a ground station in Svalbard, Norway, and continuously to local direct broadcast users distributed around the world. The mission is managed by NASA with operational support from NOAA and its Joint Polar Satellite System, which manages the satellite's ground system. NASA Earth Observatory image by Robert Simmon, using Suomi NPP VIIRS data provided courtesy of Chris Elvidge (NOAA National Geophysical Data Center). Suomi NPP is the result of a partnership between NASA, NOAA, and the Department of Defense. Caption by Mike Carlowicz. Instrument: Suomi NPP - VIIRS Credit: <b><a href="http://www.earthobservatory.nasa.gov/" rel="nofollow"> NASA Earth Observatory</a></b> <b>Click here to view all of the <a href="http://earthobservatory.nasa.gov/Features/NightLights/" rel="nofollow"> Earth at Night 2012 images </a></b> <b>Click here to <a href="http://earthobservatory.nasa.gov/NaturalHazards/view.php?id=79790" rel="nofollow"> read more </a> about this image </b> <b><a href="http://www.nasa.gov/audience/formedia/features/MP_Photo_Guidelines.html" rel="nofollow">NASA image use policy.</a></b> <b><a href="http://www.nasa.gov/centers/goddard/home/index.html" rel="nofollow">NASA Goddard Space Flight Center</a></b> enables NASA’s mission through four scientific endeavors: Earth Science, Heliophysics, Solar System Exploration, and Astrophysics. Goddard plays a leading role in NASA’s accomplishments by contributing compelling scientific knowledge to advance the Agency’s mission. <b>Follow us on <a href="http://twitter.com/NASAGoddardPix" rel="nofollow">Twitter</a></b> <b>Like us on <a href="http://www.facebook.com/pages/Greenbelt-MD/NASA-Goddard/395013845897?ref=tsd" rel="nofollow">Facebook</a></b> <b>Find us on <a href="http://instagram.com/nasagoddard?vm=grid" rel="nofollow">Instagram</a></b>
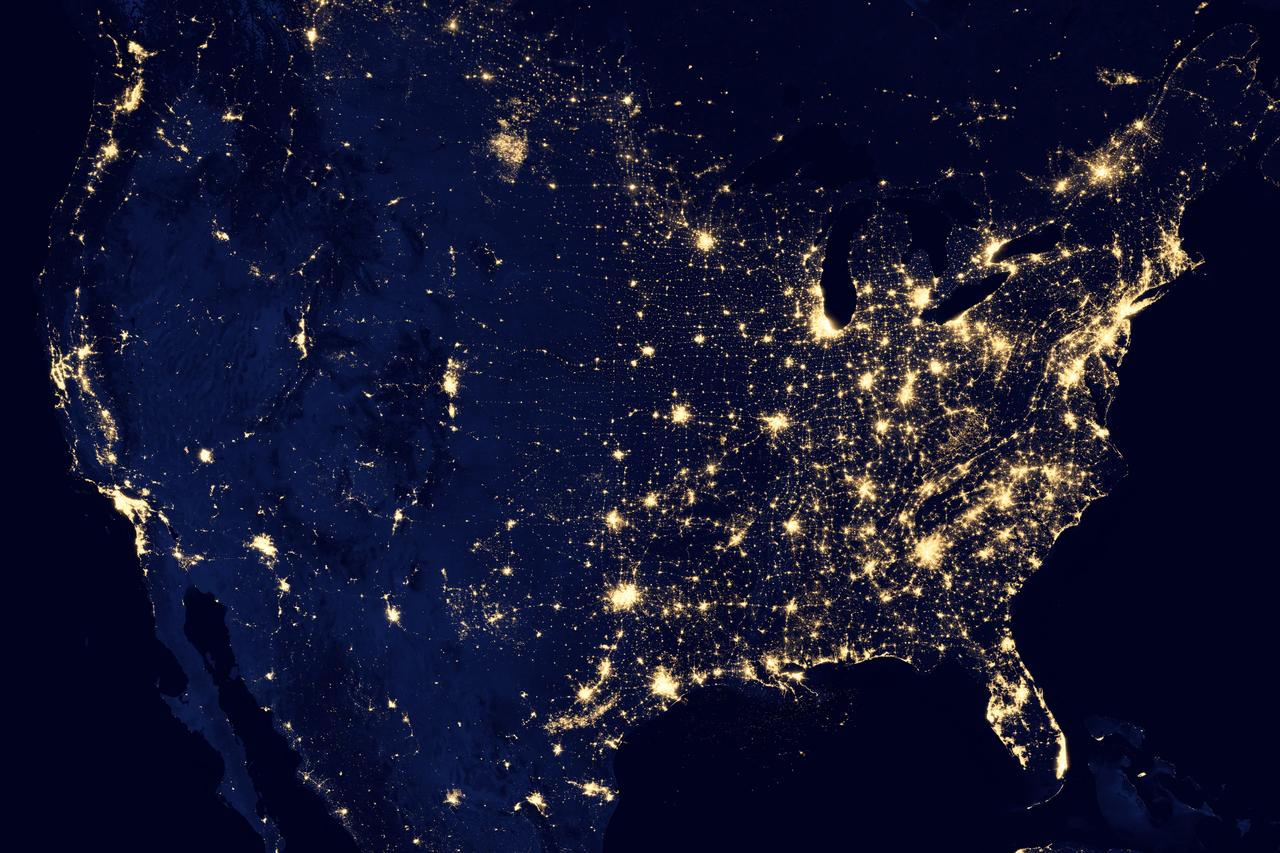
NASA image acquired April 18 - October 23, 2012 This image of the United States of America at night is a composite assembled from data acquired by the Suomi NPP satellite in April and October 2012. The image was made possible by the new satellite’s “day-night band” of the Visible Infrared Imaging Radiometer Suite (VIIRS), which detects light in a range of wavelengths from green to near-infrared and uses filtering techniques to observe dim signals such as city lights, gas flares, auroras, wildfires, and reflected moonlight. “Nighttime light is the most interesting data that I’ve had a chance to work with,” says Chris Elvidge, who leads the Earth Observation Group at NOAA’s National Geophysical Data Center. “I’m always amazed at what city light images show us about human activity.” His research group has been approached by scientists seeking to model the distribution of carbon dioxide emissions from fossil fuels and to monitor the activity of commercial fishing fleets. Biologists have examined how urban growth has fragmented animal habitat. Elvidge even learned once of a study of dictatorships in various parts of the world and how nighttime lights had a tendency to expand in the dictator’s hometown or province. Named for satellite meteorology pioneer Verner Suomi, NPP flies over any given point on Earth's surface twice each day at roughly 1:30 a.m. and p.m. The polar-orbiting satellite flies 824 kilometers (512 miles) above the surface, sending its data once per orbit to a ground station in Svalbard, Norway, and continuously to local direct broadcast users distributed around the world. Suomi NPP is managed by NASA with operational support from NOAA and its Joint Polar Satellite System, which manages the satellite's ground system. NASA Earth Observatory image by Robert Simmon, using Suomi NPP VIIRS data provided courtesy of Chris Elvidge (NOAA National Geophysical Data Center). Suomi NPP is the result of a partnership between NASA, NOAA, and the Department of Defense. Caption by Mike Carlowicz. Instrument: Suomi NPP - VIIRS Credit: <b><a href="http://www.earthobservatory.nasa.gov/" rel="nofollow"> NASA Earth Observatory</a></b> <b>Click here to view all of the <a href="http://earthobservatory.nasa.gov/Features/NightLights/" rel="nofollow"> Earth at Night 2012 images </a></b> <b>Click here to <a href="http://earthobservatory.nasa.gov/NaturalHazards/view.php?id=79800" rel="nofollow"> read more </a> about this image </b> <b><a href="http://www.nasa.gov/audience/formedia/features/MP_Photo_Guidelines.html" rel="nofollow">NASA image use policy.</a></b> <b><a href="http://www.nasa.gov/centers/goddard/home/index.html" rel="nofollow">NASA Goddard Space Flight Center</a></b> enables NASA’s mission through four scientific endeavors: Earth Science, Heliophysics, Solar System Exploration, and Astrophysics. Goddard plays a leading role in NASA’s accomplishments by contributing compelling scientific knowledge to advance the Agency’s mission. <b>Follow us on <a href="http://twitter.com/NASA_GoddardPix" rel="nofollow">Twitter</a></b> <b>Like us on <a href="http://www.facebook.com/pages/Greenbelt-MD/NASA-Goddard/395013845897?ref=tsd" rel="nofollow">Facebook</a></b> <b>Find us on <a href="http://instagram.com/nasagoddard?vm=grid" rel="nofollow">Instagram</a></b>
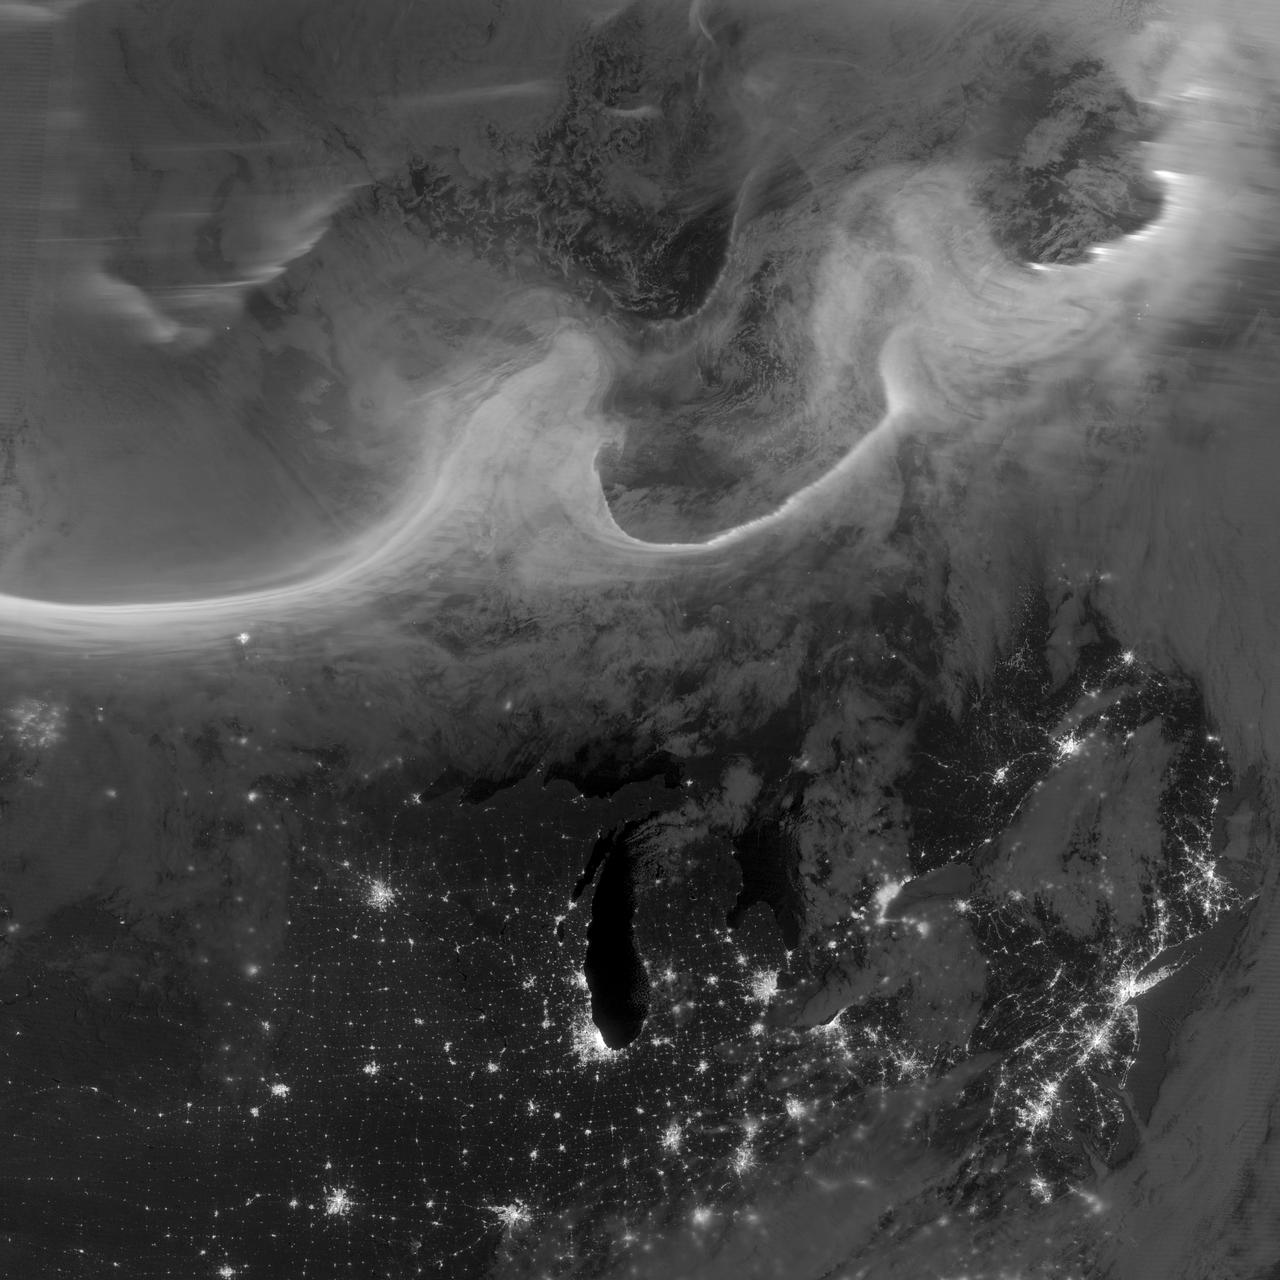
Overnight on October 4-5, 2012, a mass of energetic particles from the atmosphere of the Sun were flung out into space, a phenomenon known as a coronal mass ejection. Three days later, the storm from the Sun stirred up the magnetic field around Earth and produced gorgeous displays of northern lights. NASA satellites track such storms from their origin to their crossing of interplanetary space to their arrival in the atmosphere of Earth. Using the “day-night band” (DNB) of the Visible Infrared Imaging Radiometer Suite (VIIRS), the Suomi National Polar-orbiting Partnership (Suomi NPP) satellite acquired this view of the aurora borealis early on the morning of October 8, 2012. The northern lights stretch across Canada’s Quebec and Ontario provinces in the image, and are part of the auroral oval that expanded to middle latitudes because of a geomagnetic storm. The DNB sensor detects dim light signals such as auroras, airglow, gas flares, city lights, and reflected moonlight. In the case of the image above, the sensor detected the visible light emissions as energetic particles rained down from Earth’s magnetosphere and into the gases of the upper atmosphere. The images are similar to those collected by the Operational Linescan System flown on U.S. Defense Meteorological Satellite Program (DMSP) satellites for the past three decades. “When I first saw images like this as a graduate student, I was immediately struck by the fluid dynamic characteristics of the aurora,” said Tom Moore, a space physicist at NASA's Goddard Space Flight Center. “Viewing the aurora in this way makes it immediately clear that space weather is an interaction of fluids from the Sun with those of the Earth's upper atmosphere. The electrodynamics make for important differences between plasmas and ordinary fluids, but familiar behaviors (for example, waves and vortices) are still very apparent. It makes me wonder at the ability of apparently empty space to behave like a fluid.” Auroras typically occur when solar flares and coronal mass ejections—or even an active solar wind stream—disturb and distort the magnetosphere, the cocoon of space protected by Earth’s magnetic field. The collision of solar particles and pressure into our planet’s magnetosphere accelerates particles trapped in the space around Earth (such as in the radiation belts). Those particles are sent crashing down into Earth’s upper atmosphere—at altitudes of 100 to 400 kilometers (60 to 250 miles)—where they excite oxygen and nitrogen molecules and release photons of light. The results are rays, sheets, and curtains of dancing light in the sky. Auroras are a beautiful expression of the connection between Sun and Earth, but not all of the connections are benign. Auroras are connected to geomagnetic storms, which can distort radio communications (particularly high frequencies), disrupt electric power systems on the ground, and give slight but detectable doses of radiation to flight crews and passengers on high-latitude airplane flights and on spacecraft. The advantage of images like those from VIIRS and DMSP is resolution, according to space physicist Patrick Newell of the Johns Hopkins University Applied Physics Laboratory. “You can see very fine detail in the aurora because of the low altitude and the high resolution of the camera,” he said. Most aurora scientists prefer to use images from missions dedicated to aurora studies (such as Polar, IMAGE, and ground-based imagers), which can offer many more images of a storm (rather than one per orbit) and can allow researchers to calculate the energy moving through the atmosphere. There are no science satellites flying right now that provide such a view, though astronauts regularly photograph and film auroras from the International Space Station. NASA Earth Observatory image by Jesse Allen and Robert Simmon, using VIIRS Day-Night Band data from the Suomi National Polar-orbiting Partnership (Suomi NPP) and the University of Wisconsin's Community Satellite Processing Package. Suomi NPP is the result of a partnership between NASA, the National Oceanic and Atmospheric Administration, and the Department of Defense. Caption by Mike Carlowicz. Instrument: Suomi NPP - VIIRS Credit: <b><a href="http://www.earthobservatory.nasa.gov/" rel="nofollow"> NASA Earth Observatory</a></b> <b><a href="http://www.nasa.gov/audience/formedia/features/MP_Photo_Guidelines.html" rel="nofollow">NASA image use policy.</a></b> <b><a href="http://www.nasa.gov/centers/goddard/home/index.html" rel="nofollow">NASA Goddard Space Flight Center</a></b> enables NASA’s mission through four scientific endeavors: Earth Science, Heliophysics, Solar System Exploration, and Astrophysics. Goddard plays a leading role in NASA’s accomplishments by contributing compelling scientific knowledge to advance the Agency’s mission. <b>Follow us on <a href="http://twitter.com/NASA_GoddardPix" rel="nofollow">Twitter</a></b> <b>Like us on <a href="http://www.facebook.com/pages/Greenbelt-MD/NASA-Goddard/395013845897?ref=tsd" rel="nofollow">Facebook</a></b> <b>Find us on <a href="http://instagrid.me/nasagoddard/?vm=grid" rel="nofollow">Instagram</a></b>
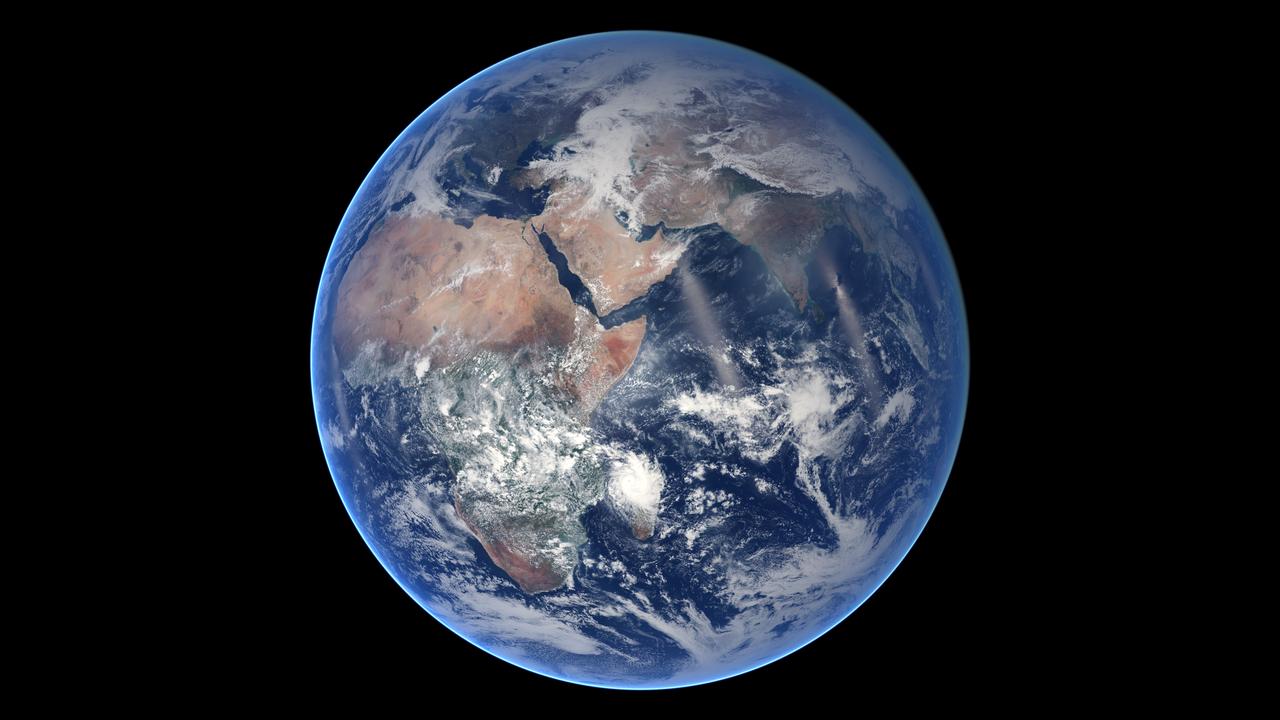
Of all the planets NASA has explored, none have matched the dynamic complexity of our own. Earth is constantly changing, and NASA are working constantly to explore and understand the planet on scales from local to global. Though Earth science has been a key part of NASA’s mission since the agency was founded in 1958, this year has been one of the peaks. Two new Earth-observing satellites have already been launched and put to work: the Global Precipitation Measurement (GPM) and the Orbiting Carbon Observatory 2 (OCO-2). Three more missions are set to take off in the next six months: the wind-measuring ISS-RapidScat, the ISS Cloud-Aerosol Transport System (CATS), and the Soil Moisture Active Passive (SMAP). And research planes have been flying over polar ice, hurricanes, boreal forests, and pollution plumes. All of these new efforts complement an existing fleet of Earth-observing satellites. In visible light and many invisible wavelengths, NASA and its science partners are observing the entire planet every day. The image above was captured on March 30, 2014, by the Visible Infrared Imaging Radiometer Suite (VIIRS) on the Suomi NPP satellite. The composite image of the eastern hemisphere was compiled from eight orbits of the satellite and ten imaging channels, then stitched together to blend the edges of each satellite pass. Read more: <a href="http://earthobservatory.nasa.gov/IOTD/view.php?id=84214&eocn=home&eoci=iotd_title" rel="nofollow">earthobservatory.nasa.gov/IOTD/view.php?id=84214&eocn...</a> NASA Earth Observatory image by Robert Simmon, using Suomi NPP VIIRS imagery from NOAA's Environmental Visualization Laboratory. Suomi NPP is the result of a partnership between NASA, NOAA and the Department of Defense. Caption by Mike Carlowicz. Credit: <b><a href="http://www.earthobservatory.nasa.gov/" rel="nofollow"> NASA Earth Observatory</a></b> <b><a href="http://www.nasa.gov/audience/formedia/features/MP_Photo_Guidelines.html" rel="nofollow">NASA image use policy.</a></b> <b><a href="http://www.nasa.gov/centers/goddard/home/index.html" rel="nofollow">NASA Goddard Space Flight Center</a></b> enables NASA’s mission through four scientific endeavors: Earth Science, Heliophysics, Solar System Exploration, and Astrophysics. Goddard plays a leading role in NASA’s accomplishments by contributing compelling scientific knowledge to advance the Agency’s mission. <b>Follow us on <a href="http://twitter.com/NASAGoddardPix" rel="nofollow">Twitter</a></b> <b>Like us on <a href="http://www.facebook.com/pages/Greenbelt-MD/NASA-Goddard/395013845897?ref=tsd" rel="nofollow">Facebook</a></b> <b>Find us on <a href="http://instagram.com/nasagoddard?vm=grid" rel="nofollow">Instagram</a></b>
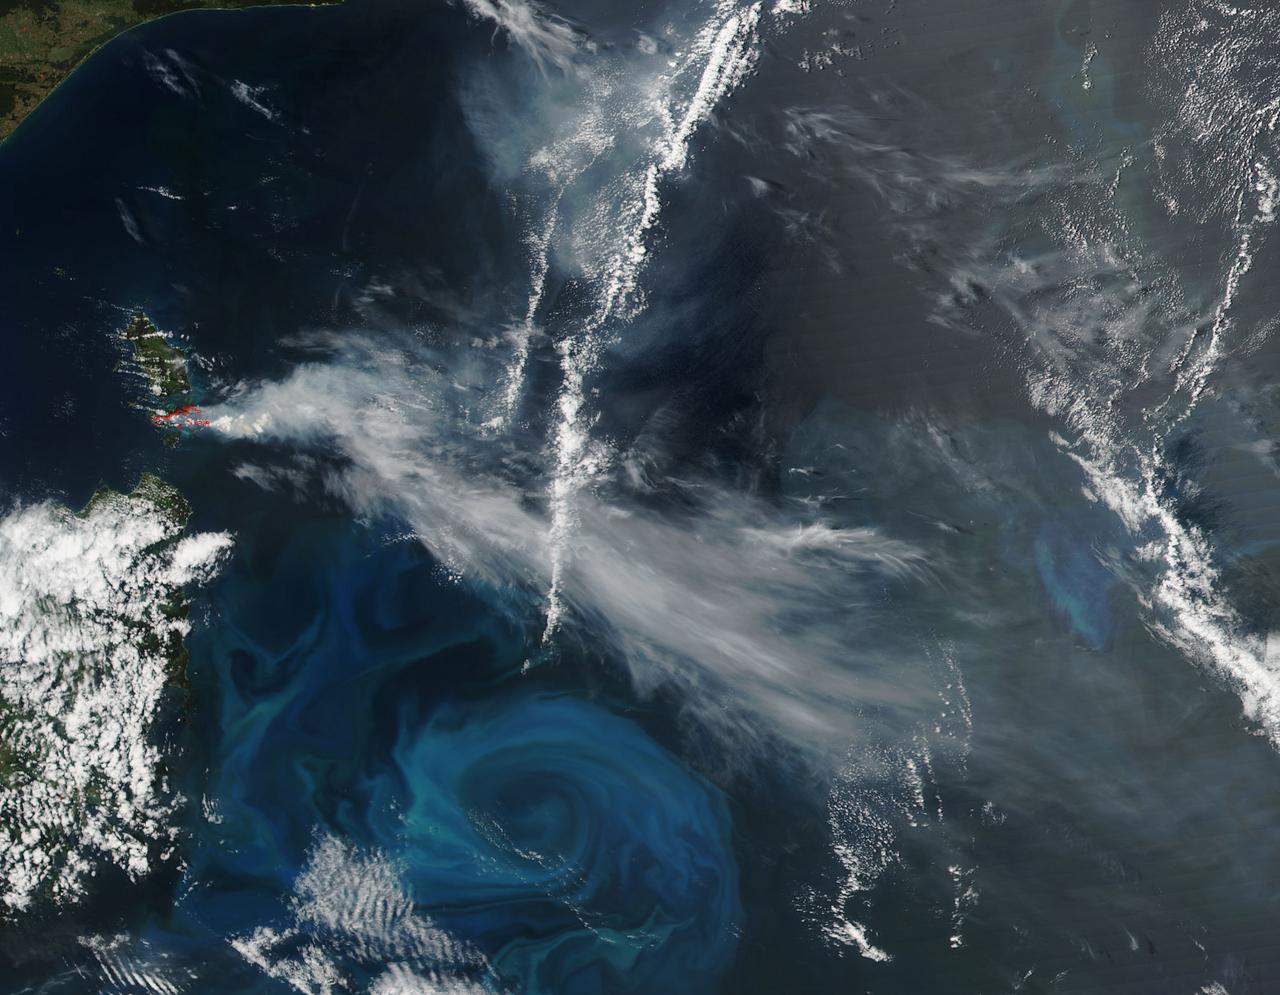
NASA-NOAA's Suomi NPP satellite passed over Australia's Cape Barren Island and captured an image of phytoplankton and smoke from fires that resembled an eye and eyebrow. The Tasmanian Fire Service reported that a vegetation fire near Thunder and Lightning Bay, Cape Barren Island started on December 4 and was still blazing on December 8. Cape Barren Island is one of a trail of islands in the Bass Strait of the South Pacific Ocean, between southeastern Australia and Tasmania. This natural-color satellite image from Dec. 7 was collected by the Visible Infrared Imaging Radiometer Suite (VIIRS) instrument that flies aboard NASA-NOAA's Suomi NPP satellite. The red dots in the image represent heat signatures from the fires as detected by VIIRS. A light grey stream of smoke was blowing to the southeast in what could be seen as the "eyebrow" to the "eye" or swirl of blue and green phytoplankton below it. Phytoplankton are tiny microscopic plant-like organisms that form the base of the marine food chain. Like land plants, phytoplankton contain chlorophyll which is used in photosynthesis to turn sunlight into chemical energy. The chlorophyll gives the phytoplankton their green color, which is visible from space when large numbers of the organism group together. NASA image courtesy MODIS Rapid Response Team #nasagoddard #earth #smoke #Phytoplankton #science b><a href="http://www.nasa.gov/audience/formedia/features/MP_Photo_Guidelines.html" rel="nofollow">NASA image use policy.</a> <b><a href="http://www.nasa.gov/centers/goddard/home/index.html" rel="nofollow">NASA Goddard Space Flight Center</a></b> enables NASA’s mission through four scientific endeavors: Earth Science, Heliophysics, Solar System Exploration, and Astrophysics. Goddard plays a leading role in NASA’s accomplishments by contributing compelling scientific knowledge to advance the Agency’s mission. <b>Follow us on <a href="http://twitter.com/NASAGoddardPix" rel="nofollow">Twitter</a></b> <b>Like us on <a href="http://www.facebook.com/pages/Greenbelt-MD/NASA-Goddard/395013845897?ref=tsd" rel="nofollow">Facebook</a></b> <b>Find us on <a href="http://instagrid.me/nasagoddard/?vm=grid" rel="nofollow">Instagram</a></b>
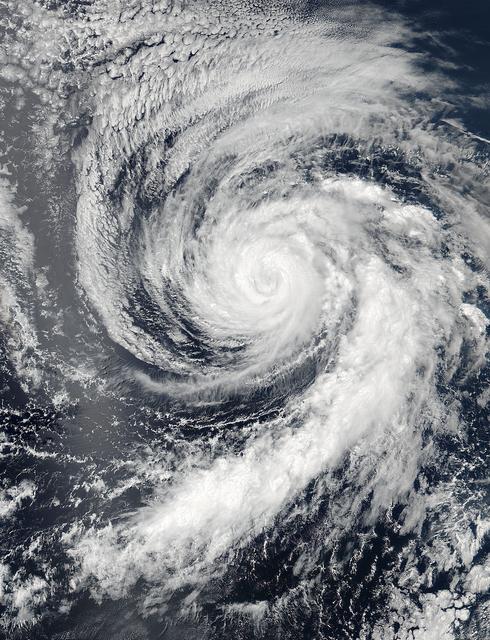
Hurricane Celia is currently in the Eastern Pacific Ocean, but once it passes west of 140 degrees west longitude, warnings on the system will be issued by NOAA's Central Pacific Hurricane Center. On July 11 at 22:05 UTC (6:05 p.m. EDT) the Visible Infrared Imaging Radiometer Suite (VIIRS) instrument aboard NASA-NOAA-DOD's Suomi NPP satellite captured a visible light image of Hurricane Celia that showed a cloud-filled eye with powerful bands of thunderstorms wrapping around the low level center. The VIIRS image also showed a large band of thunderstorms that extended to the south, wrapping into the storms' eastern quadrant. At 5 a.m. EDT (0900 UTC) on July 12 the center of Hurricane Celia was located near 16.2 north latitude and 127.9 west longitude. That's about 1,260 miles (2,025 km) west-southwest of the southern tip of Baja California, Mexico. It was moving to the west-northwest at 10 mph (17 kph) and NOAA's National Hurricane Center (NHC) expects Celia to turn toward the northwest later today, with this motion continuing Tuesday night and Wednesday. Maximum sustained winds were near 100 mph (155 kph). NHC forecasts weakening over the next two days and Celia could weaken to a tropical storm on Wednesday. Read more: NASA Sees Hurricane Celia Headed for Central Pacific Credit: NASA/Goddard/Jeff Schmaltz/MODIS Land Rapid Response Team <b><a href="http://www.nasa.gov/audience/formedia/features/MP_Photo_Guidelines.html" rel="nofollow">NASA image use policy.</a></b> <b><a href="http://www.nasa.gov/centers/goddard/home/index.html" rel="nofollow">NASA Goddard Space Flight Center</a></b> enables NASA’s mission through four scientific endeavors: Earth Science, Heliophysics, Solar System Exploration, and Astrophysics. Goddard plays a leading role in NASA’s accomplishments by contributing compelling scientific knowledge to advance the Agency’s mission. <b>Follow us on <a href="http://twitter.com/NASAGoddardPix" rel="nofollow">Twitter</a></b> <b>Like us on <a href="http://www.facebook.com/pages/Greenbelt-MD/NASA-Goddard/395013845897?ref=tsd" rel="nofollow">Facebook</a></b> <b>Find us on <a href="http://instagrid.me/nasagoddard/?vm=grid" rel="nofollow">Instagram</a></b>
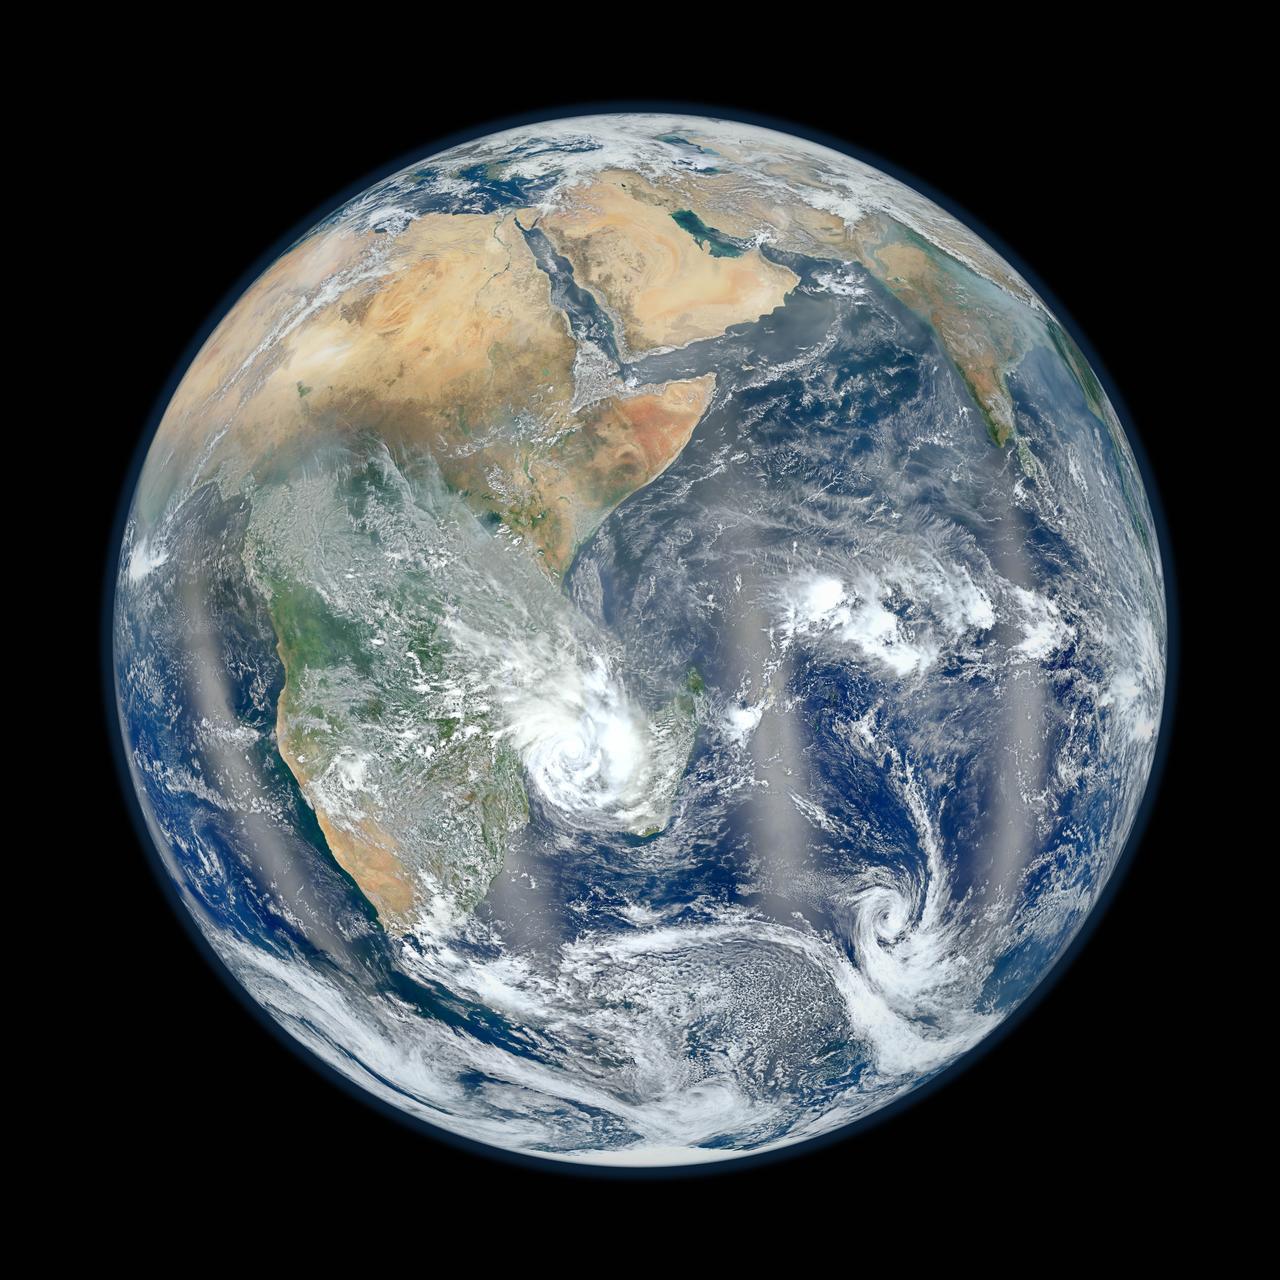
February 2, 2012 <b>Go here to view an image that explains how composite images like these are created: <a href="http://www.flickr.com/photos/gsfc/6803619953">www.flickr.com/photos/gsfc/6803619953</a></b> Responding to public demand, NASA scientists created a companion image to the wildly popular 'Blue Marble' released last week (January 25, 2012). <a href="http://www.flickr.com/photos/gsfc/6760135001">www.flickr.com/photos/gsfc/6760135001</a> The new image is a composite of six separate orbits taken on January 23, 2012 by the Suomi National Polar-orbiting Partnership satellite. Both of these new 'Blue Marble' images are images taken by a new instrument flying aboard Suomi NPP, the Visible Infrared Imaging Radiometer Suite (VIIRS). Compiled by NASA Goddard scientist Norman Kuring, this image has the perspective of a viewer looking down from 7,918 miles (about 12,742 kilometers) above the Earth's surface from a viewpoint of 10 degrees South by 45 degrees East. The four vertical lines of 'haze' visible in this image shows the reflection of sunlight off the ocean, or 'glint,' that VIIRS captured as it orbited the globe. Suomi NPP is the result of a partnership between NASA, NOAA and the Department of Defense. Credit: NASA/NOAA For more information about Suomi NPP go to: <a href="http://www.nasa.gov/npp" rel="nofollow">www.nasa.gov/npp</a> <b><a href="http://www.nasa.gov/audience/formedia/features/MP_Photo_Guidelines.html" rel="nofollow">NASA image use policy.</a></b> <b><a href="http://www.nasa.gov/centers/goddard/home/index.html" rel="nofollow">NASA Goddard Space Flight Center</a></b> enables NASA’s mission through four scientific endeavors: Earth Science, Heliophysics, Solar System Exploration, and Astrophysics. Goddard plays a leading role in NASA’s accomplishments by contributing compelling scientific knowledge to advance the Agency’s mission. <b>Follow us on <a href="http://twitter.com/NASA_GoddardPix" rel="nofollow">Twitter</a></b> <b>Like us on <a href="http://www.facebook.com/pages/Greenbelt-MD/NASA-Goddard/395013845897?ref=tsd" rel="nofollow">Facebook</a></b> <b>Find us on <a href="http://instagrid.me/nasagoddard/?vm=grid" rel="nofollow">Instagram</a></b>
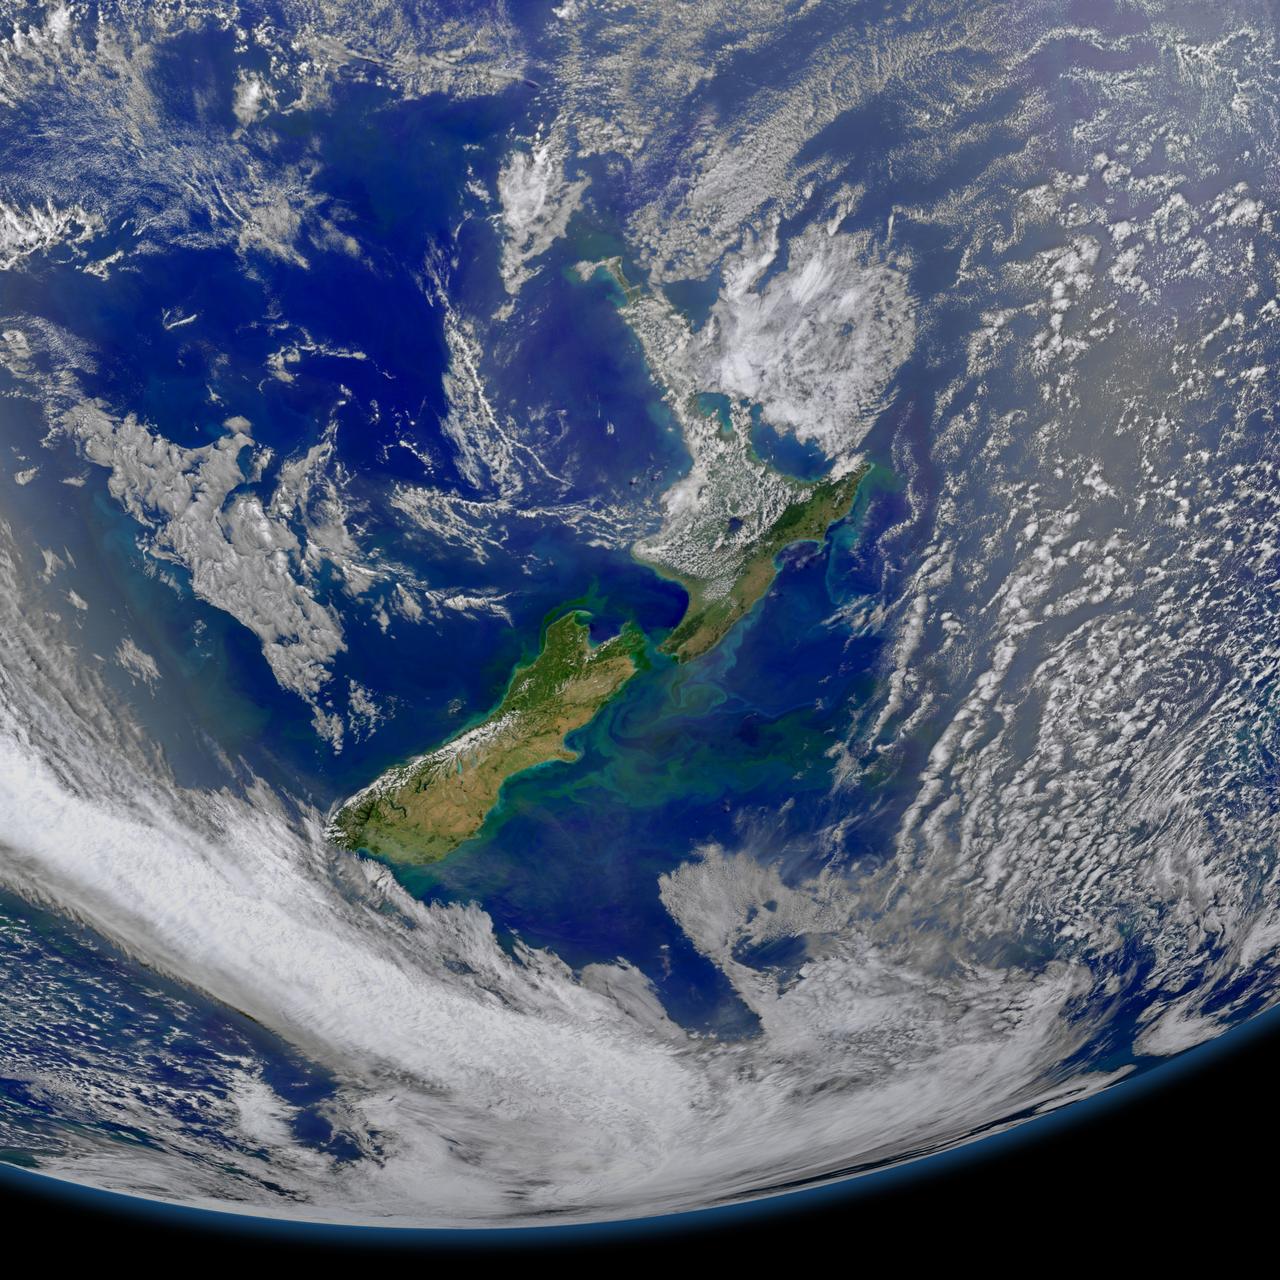
This image taken from the Suomi NPP satellite's VIIRS instrument of New Zealand was collected on January 9, 2015 when the phytoplankton were blooming — particularly to the east of the islands and along the Chatham Rise. Derived from the Greek words phyto (plant) and plankton (made to wander or drift), phytoplankton are microscopic organisms that live in watery environments, both salty and fresh. Credit: NASA/Goddard/NPP <b><a href="http://www.nasa.gov/audience/formedia/features/MP_Photo_Guidelines.html" rel="nofollow">NASA image use policy.</a></b> <b><a href="http://www.nasa.gov/centers/goddard/home/index.html" rel="nofollow">NASA Goddard Space Flight Center</a></b> enables NASA’s mission through four scientific endeavors: Earth Science, Heliophysics, Solar System Exploration, and Astrophysics. Goddard plays a leading role in NASA’s accomplishments by contributing compelling scientific knowledge to advance the Agency’s mission. <b>Follow us on <a href="http://twitter.com/NASAGoddardPix" rel="nofollow">Twitter</a></b> <b>Like us on <a href="http://www.facebook.com/pages/Greenbelt-MD/NASA-Goddard/395013845897?ref=tsd" rel="nofollow">Facebook</a></b> <b>Find us on <a href="http://instagram.com/nasagoddard?vm=grid" rel="nofollow">Instagram</a></b>
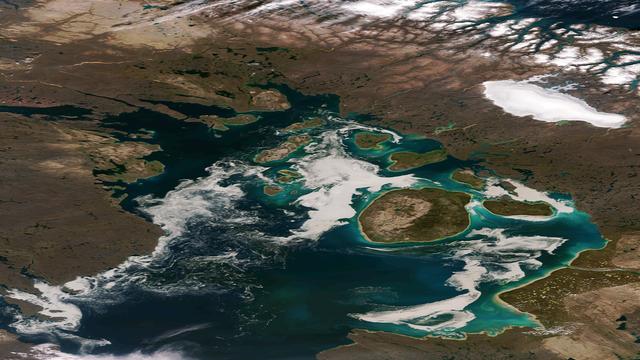
The remnants of sea ice along the Northwestern Passage in northern Canada are seen swirling with the blue green of phytoplankton in this image from the Suomi NPP VIIRS sensor, acquired on August 11, 2013. NASA/NOAA <b><a href="http://www.nasa.gov/audience/formedia/features/MP_Photo_Guidelines.html" rel="nofollow">NASA image use policy.</a></b> <b><a href="http://www.nasa.gov/centers/goddard/home/index.html" rel="nofollow">NASA Goddard Space Flight Center</a></b> enables NASA’s mission through four scientific endeavors: Earth Science, Heliophysics, Solar System Exploration, and Astrophysics. Goddard plays a leading role in NASA’s accomplishments by contributing compelling scientific knowledge to advance the Agency’s mission. <b>Follow us on <a href="http://twitter.com/NASA_GoddardPix" rel="nofollow">Twitter</a></b> <b>Like us on <a href="http://www.facebook.com/pages/Greenbelt-MD/NASA-Goddard/395013845897?ref=tsd" rel="nofollow">Facebook</a></b> <b>Find us on <a href="http://instagram.com/nasagoddard?vm=grid" rel="nofollow">Instagram</a></b>
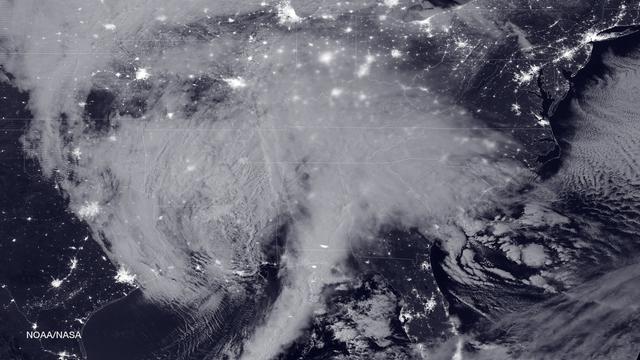
NASA and NOAA satellites are tracking the large winter storm that is expected to bring heavy snowfall to the U.S. mid-Atlantic region on Jan. 22 and 23. NASA-NOAA's Suomi NPP satellite snapped this image of the approaching blizzard around 2:35 a.m. EST on Jan. 22, 2016 using the Visible Infrared Imaging Radiometer Suite (VIIRS) instrument's Day-Night band. Image Credit: NOAA/NASA <b><a href="http://www.nasa.gov/audience/formedia/features/MP_Photo_Guidelines.html" rel="nofollow">NASA image use policy.</a></b> <b><a href="http://www.nasa.gov/centers/goddard/home/index.html" rel="nofollow">NASA Goddard Space Flight Center</a></b> enables NASA’s mission through four scientific endeavors: Earth Science, Heliophysics, Solar System Exploration, and Astrophysics. Goddard plays a leading role in NASA’s accomplishments by contributing compelling scientific knowledge to advance the Agency’s mission. <b>Follow us on <a href="http://twitter.com/NASAGoddardPix" rel="nofollow">Twitter</a></b> <b>Like us on <a href="http://www.facebook.com/pages/Greenbelt-MD/NASA-Goddard/395013845897?ref=tsd" rel="nofollow">Facebook</a></b> <b>Find us on <a href="http://instagrid.me/nasagoddard/?vm=grid" rel="nofollow">Instagram</a></b>

Taken on October 22, 2015 at 0400 UTC by the Suomi NPP satellite's VIIRS sensor, this colorized infrared image shows the extremely large eye of Typhoon Champi. With a diameter of 60 nautical miles, the eye of the storm is larger than the state of Rhode Island. Typhoon Champi is currently 700 nautical miles south of Tokyo, Japan with 110mph sustained winds, and is moving northeast with no threat to land. Credit: NASA/NOAA via <b><a href="www.nnvl.noaa.gov/" rel="nofollow"> NOAA Environmental Visualization Laboratory</a></b> <b><a href="http://www.nasa.gov/audience/formedia/features/MP_Photo_Guidelines.html" rel="nofollow">NASA image use policy.</a></b> <b><a href="http://www.nasa.gov/centers/goddard/home/index.html" rel="nofollow">NASA Goddard Space Flight Center</a></b> enables NASA’s mission through four scientific endeavors: Earth Science, Heliophysics, Solar System Exploration, and Astrophysics. Goddard plays a leading role in NASA’s accomplishments by contributing compelling scientific knowledge to advance the Agency’s mission. <b>Follow us on <a href="http://twitter.com/NASAGoddardPix" rel="nofollow">Twitter</a></b> <b>Like us on <a href="http://www.facebook.com/pages/Greenbelt-MD/NASA-Goddard/395013845897?ref=tsd" rel="nofollow">Facebook</a></b> <b>Find us on <a href="http://instagrid.me/nasagoddard/?vm=grid" rel="nofollow">Instagram</a></b>

The spring bloom in the Gulf of Alaska was well underway on April 12, 2017, when the Aqua/MODIS and Suomi-NPP/VIIRS data from which the above image was created were collected. Credit: NASA/Goddard/NPP <b><a href="http://www.nasa.gov/audience/formedia/features/MP_Photo_Guidelines.html" rel="nofollow">NASA image use policy.</a></b> <b><a href="http://www.nasa.gov/centers/goddard/home/index.html" rel="nofollow">NASA Goddard Space Flight Center</a></b> enables NASA’s mission through four scientific endeavors: Earth Science, Heliophysics, Solar System Exploration, and Astrophysics. Goddard plays a leading role in NASA’s accomplishments by contributing compelling scientific knowledge to advance the Agency’s mission. <b>Follow us on <a href="http://twitter.com/NASAGoddardPix" rel="nofollow">Twitter</a></b> <b>Like us on <a href="http://www.facebook.com/pages/Greenbelt-MD/NASA-Goddard/395013845897?ref=tsd" rel="nofollow">Facebook</a></b> <b>Find us on <a href="http://instagrid.me/nasagoddard/?vm=grid" rel="nofollow">Instagram</a></b>
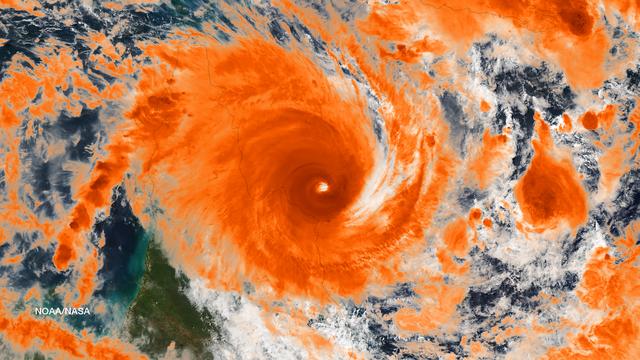
Residents of the northeast coast of Queensland, Australia are facing high winds, dangerous tides and very heavy rain between Cape Melville and Cooktown. These hazards will migrate southward for the next few days as the center of the storm remains close to the coast. This image was taken by the Suomi NPP satellite's VIIRS instrument around 0335Z on April11, 2014. Credit: NASA/NOAA via <b><a href="www.nnvl.noaa.gov/" rel="nofollow"> NOAA Environmental Visualization Laboratory</a></b> <b><a href="http://www.nasa.gov/audience/formedia/features/MP_Photo_Guidelines.html" rel="nofollow">NASA image use policy.</a></b> <b><a href="http://www.nasa.gov/centers/goddard/home/index.html" rel="nofollow">NASA Goddard Space Flight Center</a></b> enables NASA’s mission through four scientific endeavors: Earth Science, Heliophysics, Solar System Exploration, and Astrophysics. Goddard plays a leading role in NASA’s accomplishments by contributing compelling scientific knowledge to advance the Agency’s mission. <b>Follow us on <a href="http://twitter.com/NASAGoddardPix" rel="nofollow">Twitter</a></b> <b>Like us on <a href="http://www.facebook.com/pages/Greenbelt-MD/NASA-Goddard/395013845897?ref=tsd" rel="nofollow">Facebook</a></b> <b>Find us on <a href="http://instagram.com/nasagoddard?vm=grid" rel="nofollow">Instagram</a></b>
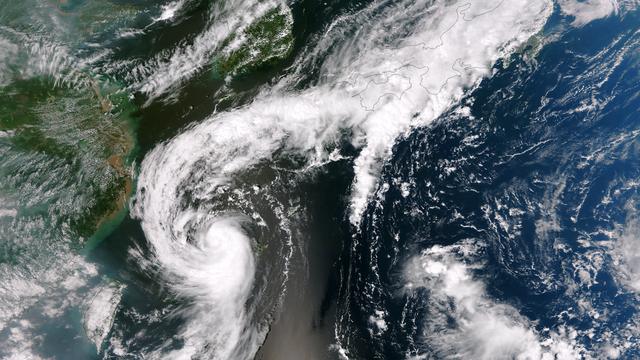
The outflow from Tropical Storm Toraji spawned tornadoes that caused injuries and property damage in Koshigaya, Saitama Prefecture, Japan, just northeast of Tokyo, on September 2, 2013. This image was taken by the Suomi NPP satellite's VIIRS instrument around 0425Z on September 2, 2013. Credit: NASA/NOAA <b><a href="http://www.nasa.gov/audience/formedia/features/MP_Photo_Guidelines.html" rel="nofollow">NASA image use policy.</a></b> <b><a href="http://www.nasa.gov/centers/goddard/home/index.html" rel="nofollow">NASA Goddard Space Flight Center</a></b> enables NASA’s mission through four scientific endeavors: Earth Science, Heliophysics, Solar System Exploration, and Astrophysics. Goddard plays a leading role in NASA’s accomplishments by contributing compelling scientific knowledge to advance the Agency’s mission. <b>Follow us on <a href="http://twitter.com/NASA_GoddardPix" rel="nofollow">Twitter</a></b> <b>Like us on <a href="http://www.facebook.com/pages/Greenbelt-MD/NASA-Goddard/395013845897?ref=tsd" rel="nofollow">Facebook</a></b> <b>Find us on <a href="http://instagram.com/nasagoddard?vm=grid" rel="nofollow">Instagram</a></b>
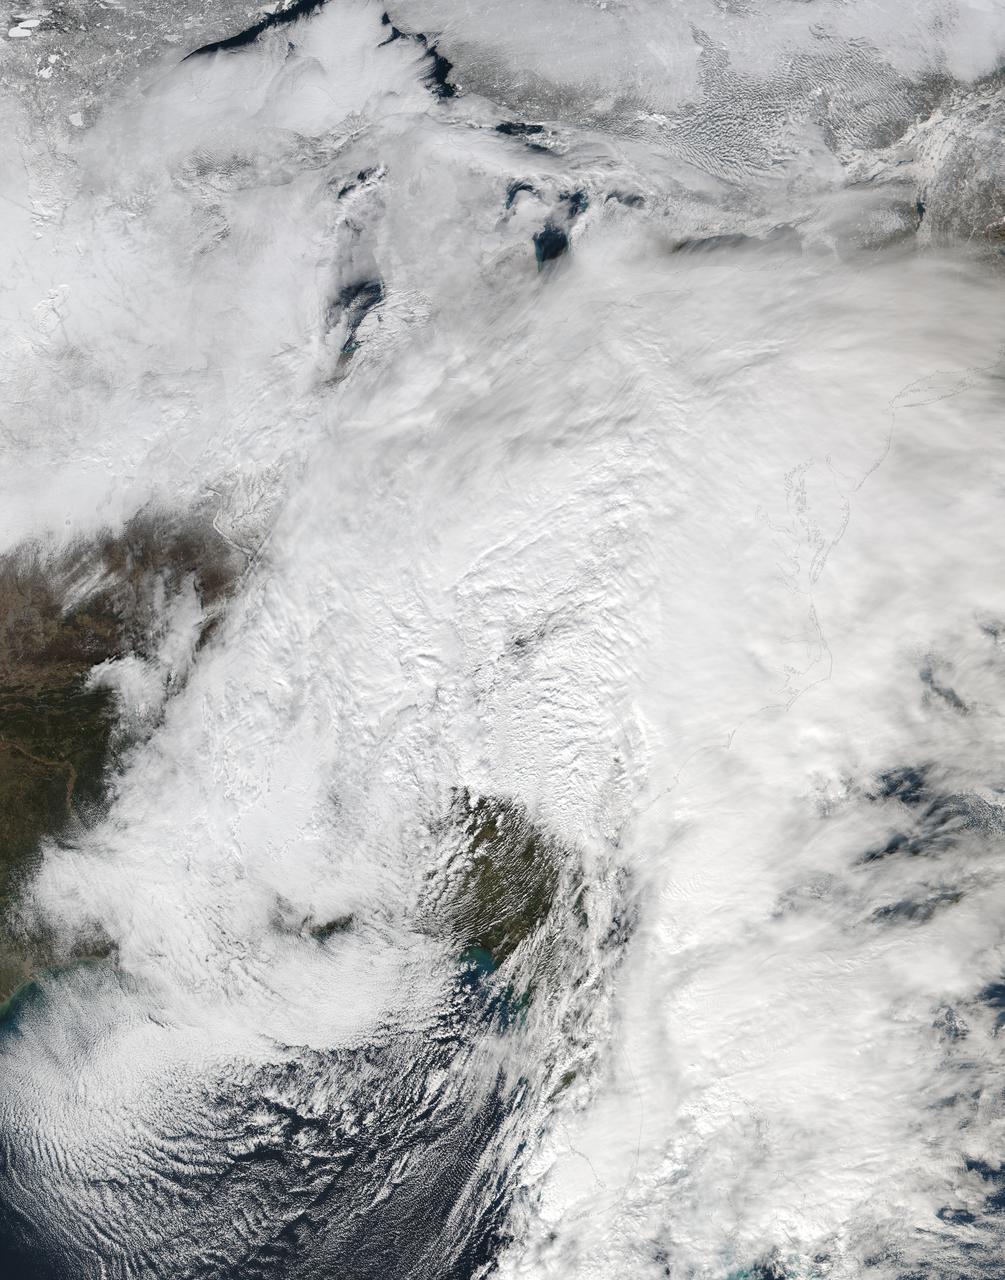
NASA-NOAA's Suomi NPP satellite passed over the large low pressure area on January 22 at 1855 UTC (1:55 p.m. EST) that stretched from New England south to Florida. Credit: Credits: NASA/NOAA/Goddard Rapid Response Team Credit: NASA/Goddard/Suomi NPP/VIIRS <b><a href="http://www.nasa.gov/audience/formedia/features/MP_Photo_Guidelines.html" rel="nofollow">NASA image use policy.</a></b> <b><a href="http://www.nasa.gov/centers/goddard/home/index.html" rel="nofollow">NASA Goddard Space Flight Center</a></b> enables NASA’s mission through four scientific endeavors: Earth Science, Heliophysics, Solar System Exploration, and Astrophysics. Goddard plays a leading role in NASA’s accomplishments by contributing compelling scientific knowledge to advance the Agency’s mission. <b>Follow us on <a href="http://twitter.com/NASAGoddardPix" rel="nofollow">Twitter</a></b> <b>Like us on <a href="http://www.facebook.com/pages/Greenbelt-MD/NASA-Goddard/395013845897?ref=tsd" rel="nofollow">Facebook</a></b> <b>Find us on <a href="http://instagrid.me/nasagoddard/?vm=grid" rel="nofollow">Instagram</a></b>
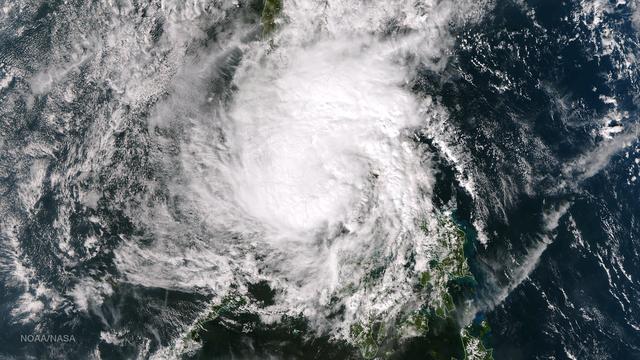
Tropical Storm Hagupit's low level circulation center is being obscured by its deep central convection and intensities are hard to pinpoint as the storm interacts with land. Once clear over the waters of the South China Sea Hagupit is forecast to continue weakening as it approaches the southern coast of Vietnam. This image was taken by the Suomi NPP satellite's VIIRS instrument around 0510Z on December 8, 2014. NASA/NOAA/NPP Credit: NASA/NOAA via <b><a href="www.nnvl.noaa.gov/" rel="nofollow"> NOAA Environmental Visualization Laboratory</a></b> <b><a href="http://www.nasa.gov/audience/formedia/features/MP_Photo_Guidelines.html" rel="nofollow">NASA image use policy.</a></b> <b><a href="http://www.nasa.gov/centers/goddard/home/index.html" rel="nofollow">NASA Goddard Space Flight Center</a></b> enables NASA’s mission through four scientific endeavors: Earth Science, Heliophysics, Solar System Exploration, and Astrophysics. Goddard plays a leading role in NASA’s accomplishments by contributing compelling scientific knowledge to advance the Agency’s mission. <b>Follow us on <a href="http://twitter.com/NASAGoddardPix" rel="nofollow">Twitter</a></b> <b>Like us on <a href="http://www.facebook.com/pages/Greenbelt-MD/NASA-Goddard/395013845897?ref=tsd" rel="nofollow">Facebook</a></b> <b>Find us on <a href="http://instagram.com/nasagoddard?vm=grid" rel="nofollow">Instagram</a></b>
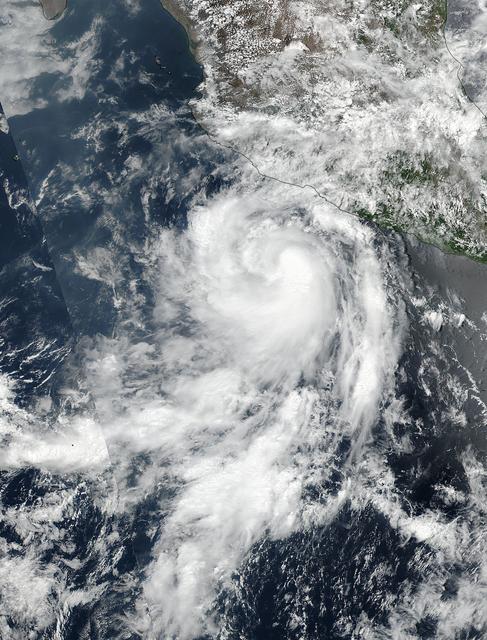
The fourth tropical cyclone of the Eastern Pacific Ocean season formed on June 25 and by June 26 it was already a hurricane. NASA-NOAA's Suomi NPP satellite passed over Dora on June 25 when it was a tropical storm and the next day it became the first hurricane of the season. Tropical Depression Dora developed around 11 p.m. EDT on Saturday, June 24 about 180 miles (290 km) south of Acapulco, Mexico. By 5 a.m. EDT on June 25, the depression had strengthened into a tropical storm and was named Dora. At 19:36 UTC (3:36 p.m. EDT), the Visible Infrared Imaging Radiometer Suite (VIIRS) instrument aboard NASA-NOAA's Suomi NPP satellite provided a visible-light image of the storm. The VIIRS imagery showed well-defined convective spiral bands of thunderstorms with a developing central dense overcast or CDO cloud feature. Seven and a half hours later, Dora showed signs of better organization. At 11 p.m. EDT, the National Hurricane Center or NHC noted "Dora's cloud pattern has continued to quickly improve this evening. Several well-defined spiral bands wrap around the center and the CDO has become more symmetric and expanded since the previous advisory." At 5 a.m. EDT on Monday, June 26, Dora became the first hurricane of the Eastern Pacific Ocean hurricane season. Satellite data indicate that maximum sustained winds have increased to near 80 mph (130 kph) with higher gusts. The NHC said the eye of Hurricane Dora was located near latitude 16.7 degrees North and longitude 105.3 degrees West. That's about 170 miles (275 km) south-southwest of Manzanillo, Mexico. Dora was moving toward the west-northwest near 13 mph (20 kph), and the NHC forecast said that general motion with some decrease in forward speed is expected over the next 48 hours. On the forecast track, the center of Dora is expected to remain offshore of the coast of southwestern Mexico. Some strengthening is likely today before weakening is forecast to begin on Tuesday, June 27. For updated forecasts, visit: <a href="http://www.nhc.noaa.gov" rel="nofollow">www.nhc.noaa.gov</a>. Credit: NASA/NOAA <b><a href="http://www.nasa.gov/audience/formedia/features/MP_Photo_Guidelines.html" rel="nofollow">NASA image use policy.</a></b> <b><a href="http://www.nasa.gov/centers/goddard/home/index.html" rel="nofollow">NASA Goddard Space Flight Center</a></b> enables NASA’s mission through four scientific endeavors: Earth Science, Heliophysics, Solar System Exploration, and Astrophysics. Goddard plays a leading role in NASA’s accomplishments by contributing compelling scientific knowledge to advance the Agency’s mission. <b>Follow us on <a href="http://twitter.com/NASAGoddardPix" rel="nofollow">Twitter</a></b> <b>Like us on <a href="http://www.facebook.com/pages/Greenbelt-MD/NASA-Goddard/395013845897?ref=tsd" rel="nofollow">Facebook</a></b> <b>Find us on <a href="http://instagrid.me/nasagoddard/?vm=grid" rel="nofollow">Instagram</a></b>

Using the “day-night band” (DNB) of the Visible Infrared Imaging Radiometer Suite (VIIRS), the Suomi National Polar-orbiting Partnership (Suomi NPP) satellite acquired this view of the aurora borealis on March 18, 2015. The northern lights stretch across Canada’s Quebec, Ontario, Manitoba, Nunavut, and Newfoundland provinces in the image, and are part of the auroral oval that expanded to middle latitudes because of a geomagnetic storm on March 17, 2015. The DNB sensor detects dim light signals such as auroras, airglow, gas flares, city lights, and reflected moonlight. In the case of the image above, the sensor detected the visible light emissions as energetic particles rained down from Earth’s magnetosphere and into the gases of the upper atmosphere. The images are similar to those collected by the Operational Linescan System flown on U.S. Defense Meteorological Satellite Program (DMSP) satellites for the past three decades. Auroras typically occur when solar flares and coronal mass ejections—or even an active solar wind stream—disturb and distort the magnetosphere, the cocoon of space protected by Earth’s magnetic field. The collision of solar particles and pressure into our planet’s magnetosphere accelerates particles trapped in the space around Earth (such as in the radiation belts). Those particles are sent crashing down into Earth’s upper atmosphere—at altitudes of 100 to 400 kilometers (60 to 250 miles)—where they excite oxygen and nitrogen molecules and release photons of light. The results are rays, sheets, and curtains of dancing light in the sky. Read more: <a href="http://earthobservatory.nasa.gov/NaturalHazards/view.php?id=85556&eocn=home&eoci=nh" rel="nofollow">earthobservatory.nasa.gov/NaturalHazards/view.php?id=8555...</a> NASA Earth Observatory image by Jesse Allen, using VIIRS day-night band data from the Suomi National Polar-orbiting Partnership. Suomi NPP is the result of a partnership between NASA, the National Oceanic and Atmospheric Administration, and the Department of Defense. Caption by Mike Carlowicz and Adam Voiland. Credit: <b><a href="http://www.earthobservatory.nasa.gov/" rel="nofollow"> NASA Earth Observatory</a></b> <b><a href="http://www.nasa.gov/audience/formedia/features/MP_Photo_Guidelines.html" rel="nofollow">NASA image use policy.</a></b> <b><a href="http://www.nasa.gov/centers/goddard/home/index.html" rel="nofollow">NASA Goddard Space Flight Center</a></b> enables NASA’s mission through four scientific endeavors: Earth Science, Heliophysics, Solar System Exploration, and Astrophysics. Goddard plays a leading role in NASA’s accomplishments by contributing compelling scientific knowledge to advance the Agency’s mission. <b>Follow us on <a href="http://twitter.com/NASAGoddardPix" rel="nofollow">Twitter</a></b> <b>Like us on <a href="http://www.facebook.com/pages/Greenbelt-MD/NASA-Goddard/395013845897?ref=tsd" rel="nofollow">Facebook</a></b> <b>Find us on <a href="http://instagrid.me/nasagoddard/?vm=grid" rel="nofollow">Instagram</a></b>
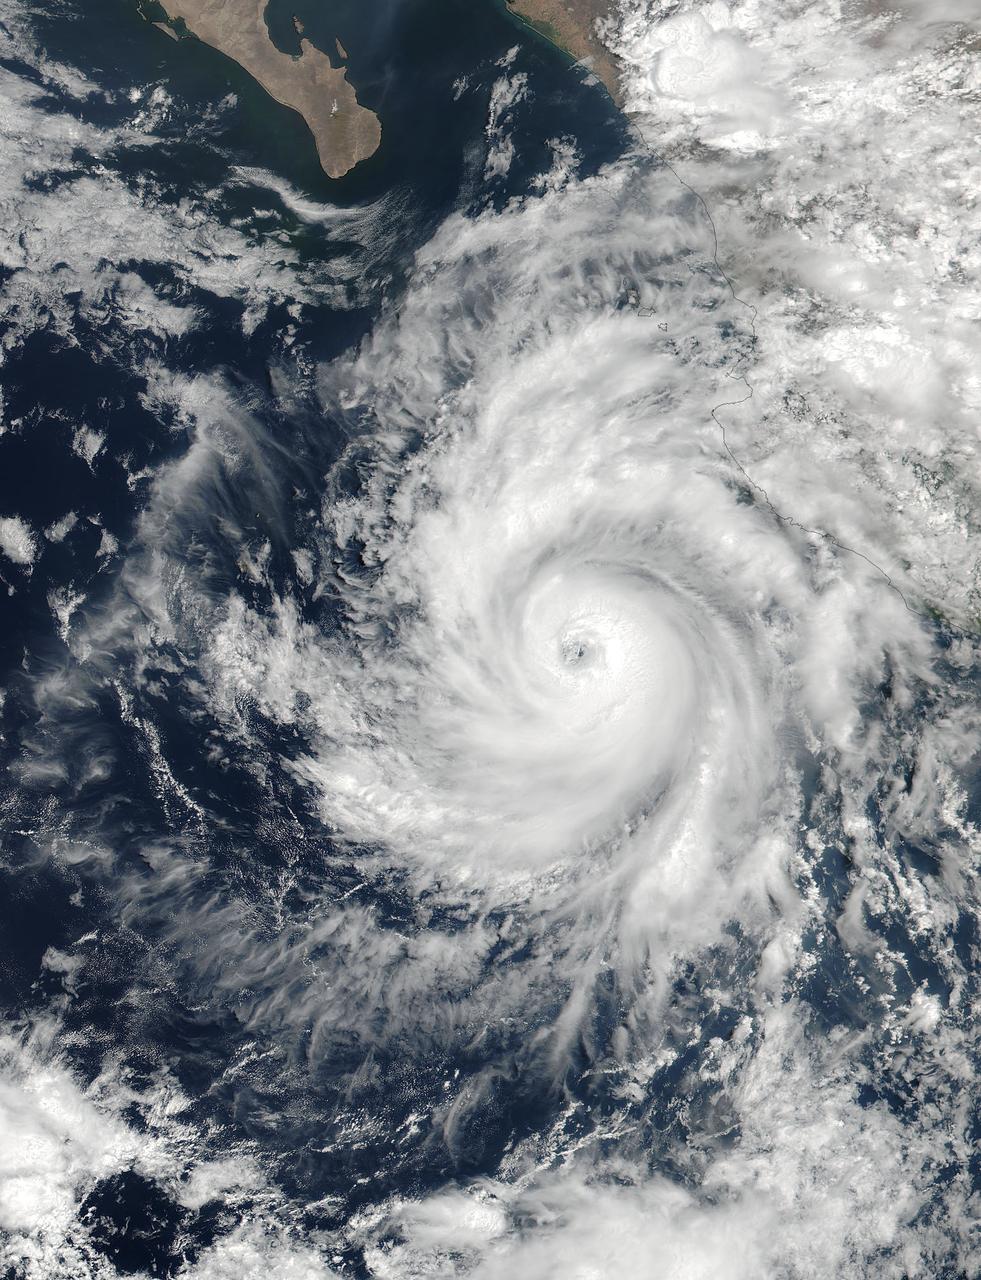
At 19:36 UTC (3:36 p.m. EDT) on June 26, the Visible Infrared Imaging Radiometer Suite (VIIRS) instrument aboard NASA-NOAA's Suomi NPP satellite provided a visible-light image of Hurricane Dora. The VIIRS imagery showed a small hurricane with a visible pinhole eye surrounded by a thick band of powerful thunderstorms. That strength didn't last long as Dora moved over cooler waters and began to weaken early on June 27. Dora appeared degraded in satellite imagery as strong convection and thunderstorms were diminishing, although the storm still maintained a visible eye. At 11 a.m. EDT (1500 UTC) on Tuesday, June 27, Dora's maximum sustained winds have decreased slightly to near 75 mph (120 kph) with higher gusts. Dora is a small tropical cyclone, as hurricane-force winds extended outward up to 15 miles (30 km) from the center. The NHC said the eye of Hurricane Dora was located near latitude 19.3 degrees north and longitude 110.2 degrees west. That's about 250 miles (400 km) south of the southern tip of Baja California, Mexico. Dora was moving toward the west-northwest near 13 mph (20 kph). The NHC said the center of Dora is expected to pass just north of Socorro Island later today, and remain well south of the Baja California Peninsula. Ocean swells generated by Dora are affecting portions of the coast of southwest Mexico and are expected to spread northwestward and begin affecting portions of the coast of the southern Baja California peninsula through Wednesday, June 28. Dora is moving over sea surface temperatures cooler than 26.6 degrees Celsius or 80 degrees Fahrenheit, which is the threshold to maintain a tropical cyclone. Temperatures cooler than that weaken tropical cyclones. The NHC said that the waters beneath Dora will continue to cool for the next couple of days so Dora is expected to weaken to a tropical storm later today, June 27, and degenerate to a remnant low pressure area over the next two days. For updated forecasts, visit: <a href="http://www.nhc.noaa.gov" rel="nofollow">www.nhc.noaa.gov</a>. Credit: NASA/NOAA <b><a href="http://www.nasa.gov/audience/formedia/features/MP_Photo_Guidelines.html" rel="nofollow">NASA image use policy.</a></b> <b><a href="http://www.nasa.gov/centers/goddard/home/index.html" rel="nofollow">NASA Goddard Space Flight Center</a></b> enables NASA’s mission through four scientific endeavors: Earth Science, Heliophysics, Solar System Exploration, and Astrophysics. Goddard plays a leading role in NASA’s accomplishments by contributing compelling scientific knowledge to advance the Agency’s mission. <b>Follow us on <a href="http://twitter.com/NASAGoddardPix" rel="nofollow">Twitter</a></b> <b>Like us on <a href="http://www.facebook.com/pages/Greenbelt-MD/NASA-Goddard/395013845897?ref=tsd" rel="nofollow">Facebook</a></b> <b>Find us on <a href="http://instagrid.me/nasagoddard/?vm=grid" rel="nofollow">Instagram</a></b>
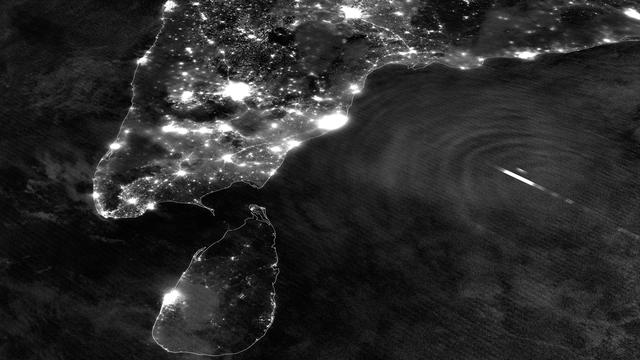
Tropical Cyclone Mahasen is moving north through the Indian Ocean along a track that places landfall along the Bangladesh coast on May 16th around 1200Z. On May 13, 2013 the Suomi NPP satellite caught an interesting glimpse of the storm as it moved off the eastern coast of India. The VIIRS Day-Night Band was able to resolve lightning flashes towards the center of the storm, along with mesopheric gravity waves emanating outwards like ripples in a pond. These gravity waves are of particular interest to air traffic controllers so assist in identifying areas of turbulence. Since the moon was in a new phase, the lights and other surface features of India and Sri Lanka are clearly visible, though the clouds of TC Mahasen are not - a tradeoff that occurs as the amount of moonlight cycles throughout the month. Credit: NASA/NOAA <b><a href="http://www.nasa.gov/audience/formedia/features/MP_Photo_Guidelines.html" rel="nofollow">NASA image use policy.</a></b> <b><a href="http://www.nasa.gov/centers/goddard/home/index.html" rel="nofollow">NASA Goddard Space Flight Center</a></b> enables NASA’s mission through four scientific endeavors: Earth Science, Heliophysics, Solar System Exploration, and Astrophysics. Goddard plays a leading role in NASA’s accomplishments by contributing compelling scientific knowledge to advance the Agency’s mission. <b>Follow us on <a href="http://twitter.com/NASA_GoddardPix" rel="nofollow">Twitter</a></b> <b>Like us on <a href="http://www.facebook.com/pages/Greenbelt-MD/NASA-Goddard/395013845897?ref=tsd" rel="nofollow">Facebook</a></b> <b>Find us on <a href="http://instagram.com/nasagoddard?vm=grid" rel="nofollow">Instagram</a></b>
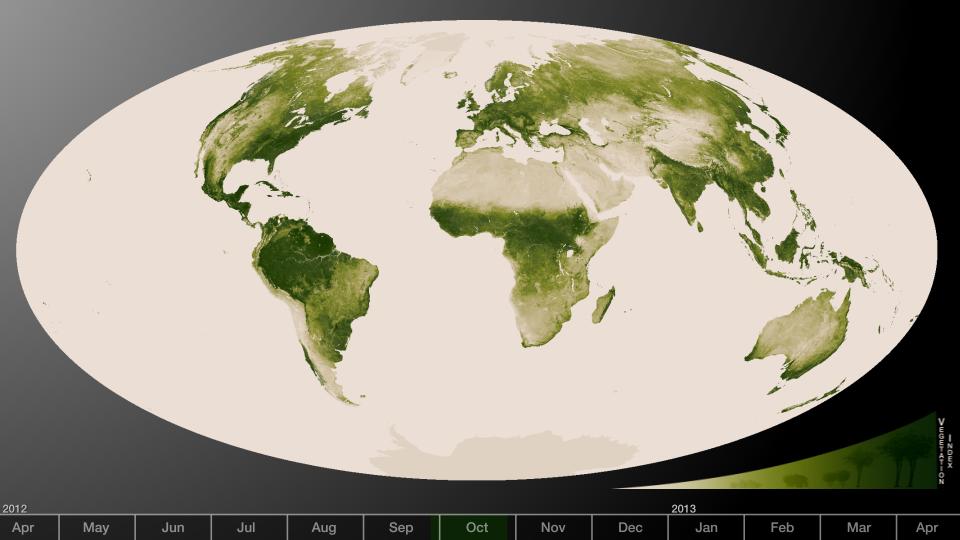
Subtle vegetation changes are visible in this year-long visualization. Large-scale patterns vary with seasons, but the local variations in green are also sensitive precipitation, drought and fire. High values of Normalized Difference Vegetation Index, or NDVI, represent dense green functioning vegetation and low NDVI values represent sparse green vegetation or vegetation under stress from limiting conditions, such as drought. The visualization was created from a year’s worth of data from April 2012 to April 2013. The information was sent back to Earth from the Visible-Infrared Imager/Radiometer Suite (VIIRS) instrument aboard the Suomi National Polar-orbiting Partnership or Suomi NPP satellite, a partnership between NASA and the National Oceanic and Atmospheric Administration, or NOAA. Credit: NASA/NOAA To read more go to: <a href="http://www.nasa.gov/mission_pages/NPP/news/vegetation.html" rel="nofollow">www.nasa.gov/mission_pages/NPP/news/vegetation.html</a> <b><a href="http://www.nasa.gov/audience/formedia/features/MP_Photo_Guidelines.html" rel="nofollow">NASA image use policy.</a></b> <b><a href="http://www.nasa.gov/centers/goddard/home/index.html" rel="nofollow">NASA Goddard Space Flight Center</a></b> enables NASA’s mission through four scientific endeavors: Earth Science, Heliophysics, Solar System Exploration, and Astrophysics. Goddard plays a leading role in NASA’s accomplishments by contributing compelling scientific knowledge to advance the Agency’s mission. <b>Follow us on <a href="http://twitter.com/NASA_GoddardPix" rel="nofollow">Twitter</a></b> <b>Like us on <a href="http://www.facebook.com/pages/Greenbelt-MD/NASA-Goddard/395013845897?ref=tsd" rel="nofollow">Facebook</a></b> <b>Find us on <a href="http://instagram.com/nasagoddard?vm=grid" rel="nofollow">Instagram</a></b>
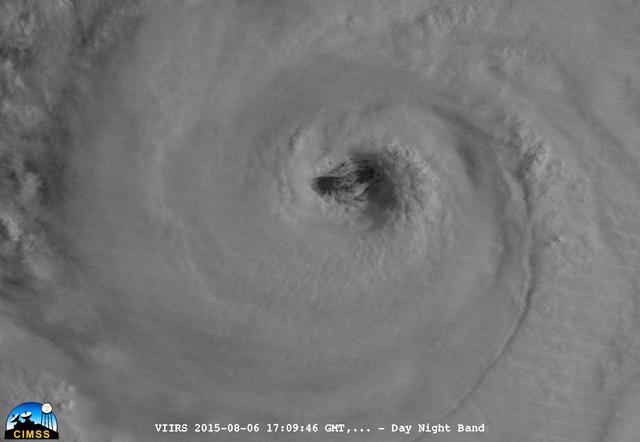
On August 6, 2015, NASA-NOAA's Suomi NPP satellite passed over powerful Typhoon Soudelor when it was headed toward Taiwan. The Visible Infrared Imaging Radiometer Suite (VIIRS) instrument aboard NASA-NOAA's Suomi satellite captured this night-time infrared close-up image of Soudelor's eye. At 1500 UTC (11 a.m. EDT) on August 6, 2015, Typhoon Soudelor had maximum sustained winds near 90 knots (103.6 mph/166.7 kph). It was centered near 21.3 North latitude and 127.5 East longitude, about 324 nautical miles (372.9 miles/600 km) south of Kadena Air Base, Okinawa, Japan. It was moving to the west at 10 knots (11.5 mph/18.5 kph). Credit: UWM/CIMSS/SSEC, William Straka III <b><a href="http://www.nasa.gov/audience/formedia/features/MP_Photo_Guidelines.html" rel="nofollow">NASA image use policy.</a></b> <b><a href="http://www.nasa.gov/centers/goddard/home/index.html" rel="nofollow">NASA Goddard Space Flight Center</a></b> enables NASA’s mission through four scientific endeavors: Earth Science, Heliophysics, Solar System Exploration, and Astrophysics. Goddard plays a leading role in NASA’s accomplishments by contributing compelling scientific knowledge to advance the Agency’s mission. <b>Follow us on <a href="http://twitter.com/NASAGoddardPix" rel="nofollow">Twitter</a></b> <b>Like us on <a href="http://www.facebook.com/pages/Greenbelt-MD/NASA-Goddard/395013845897?ref=tsd" rel="nofollow">Facebook</a></b> <b>Find us on <a href="http://instagrid.me/nasagoddard/?vm=grid" rel="nofollow">Instagram</a></b>
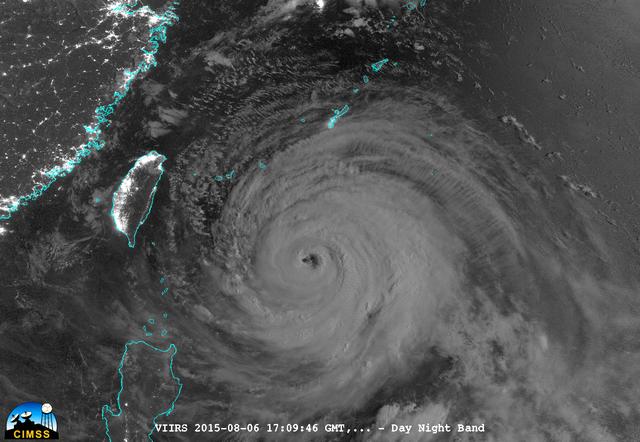
On August 6, 2015, NASA-NOAA's Suomi NPP satellite passed over powerful Typhoon Soudelor at night when it was headed toward Taiwan. The Visible Infrared Imaging Radiometer Suite (VIIRS) instrument aboard NASA-NOAA's Suomi satellite captured this night-time infrared image of the storm. At 1500 UTC (11 a.m. EDT) on August 6, 2015, Typhoon Soudelor had maximum sustained winds near 90 knots (103.6 mph/166.7 kph). It was centered near 21.3 North latitude and 127.5 East longitude, about 324 nautical miles (372.9 miles/600 km) south of Kadena Air Base, Okinawa, Japan. It was moving to the west at 10 knots (11.5 mph/18.5 kph). Taiwan is located west (left) of the powerful typhoon in this image. Credit: UWM/CIMSS/SSEC, William Straka III <b><a href="http://www.nasa.gov/audience/formedia/features/MP_Photo_Guidelines.html" rel="nofollow">NASA image use policy.</a></b> <b><a href="http://www.nasa.gov/centers/goddard/home/index.html" rel="nofollow">NASA Goddard Space Flight Center</a></b> enables NASA’s mission through four scientific endeavors: Earth Science, Heliophysics, Solar System Exploration, and Astrophysics. Goddard plays a leading role in NASA’s accomplishments by contributing compelling scientific knowledge to advance the Agency’s mission. <b>Follow us on <a href="http://twitter.com/NASAGoddardPix" rel="nofollow">Twitter</a></b> <b>Like us on <a href="http://www.facebook.com/pages/Greenbelt-MD/NASA-Goddard/395013845897?ref=tsd" rel="nofollow">Facebook</a></b> <b>Find us on <a href="http://instagrid.me/nasagoddard/?vm=grid" rel="nofollow">Instagram</a></b>
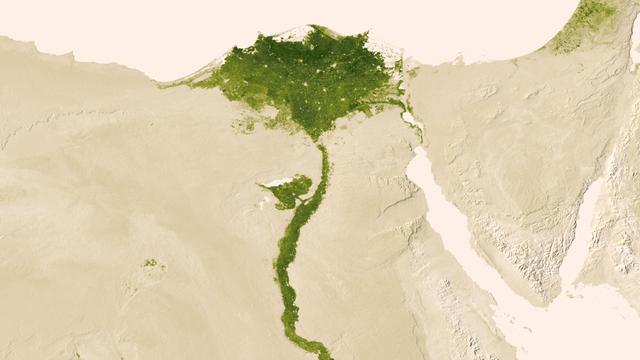
Urbanized areas of northern Egypt are visible amidst the deserts of Egypt. The image captured July 9-15, 2012 also shows the Nile River which provides life-sustaining water to the region. The image was created from the Visible-Infrared Imager/Radiometer Suite (VIIRS) instrument aboard the Suomi National Polar-orbiting Partnership or Suomi NPP satellite, a partnership between NASA and the National Oceanic and Atmospheric Administration, or NOAA. Credit: NASA/NOAA To read more go to: <a href="http://www.nasa.gov/mission_pages/NPP/news/vegetation.html" rel="nofollow">www.nasa.gov/mission_pages/NPP/news/vegetation.html</a> <b><a href="http://www.nasa.gov/audience/formedia/features/MP_Photo_Guidelines.html" rel="nofollow">NASA image use policy.</a></b> <b><a href="http://www.nasa.gov/centers/goddard/home/index.html" rel="nofollow">NASA Goddard Space Flight Center</a></b> enables NASA’s mission through four scientific endeavors: Earth Science, Heliophysics, Solar System Exploration, and Astrophysics. Goddard plays a leading role in NASA’s accomplishments by contributing compelling scientific knowledge to advance the Agency’s mission. <b>Follow us on <a href="http://twitter.com/NASA_GoddardPix" rel="nofollow">Twitter</a></b> <b>Like us on <a href="http://www.facebook.com/pages/Greenbelt-MD/NASA-Goddard/395013845897?ref=tsd" rel="nofollow">Facebook</a></b> <b>Find us on <a href="http://instagram.com/nasagoddard?vm=grid" rel="nofollow">Instagram</a></b>
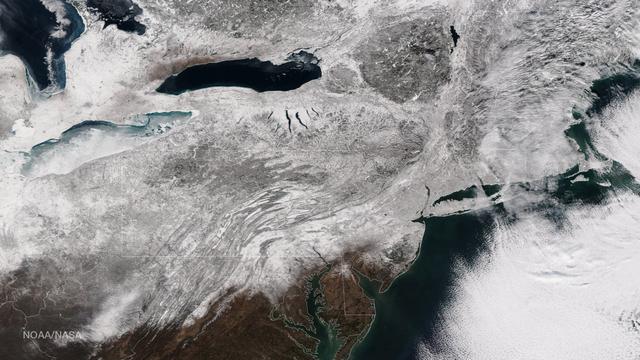
As the storm moves offshore and the skies clear over the Northeast United States, the extent of snowfall from the blizzard is shown in this image from the Suomi NPP satellite imagery, taken on January 28, 2015 at 1:50 EST. Portions of Suffolk County, New York and parts of eastern and southern New England, including areas in and around Portland, Maine, Boston, Massachusetts, and Providence, Rhode Island, received more than 20 inches of snowfall. Up to 36 inches of snow were reported in Auburn, Hudson and Lunenburg, Massachusetts. Credit: NASA/NOAA/NPP/VIIRS Via: <b><a href="www.nnvl.noaa.gov/" rel="nofollow"> NOAA Environmental Visualization Laboratory</a></b> <b><a href="http://www.nasa.gov/audience/formedia/features/MP_Photo_Guidelines.html" rel="nofollow">NASA image use policy.</a></b> <b><a href="http://www.nasa.gov/centers/goddard/home/index.html" rel="nofollow">NASA Goddard Space Flight Center</a></b> enables NASA’s mission through four scientific endeavors: Earth Science, Heliophysics, Solar System Exploration, and Astrophysics. Goddard plays a leading role in NASA’s accomplishments by contributing compelling scientific knowledge to advance the Agency’s mission. <b>Follow us on <a href="http://twitter.com/NASAGoddardPix" rel="nofollow">Twitter</a></b> <b>Like us on <a href="http://www.facebook.com/pages/Greenbelt-MD/NASA-Goddard/395013845897?ref=tsd" rel="nofollow">Facebook</a></b> <b>Find us on <a href="http://instagram.com/nasagoddard?vm=grid" rel="nofollow">Instagram</a></b>
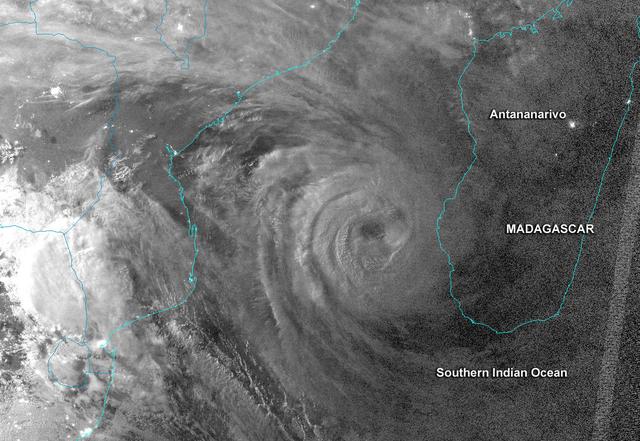
This night-time image revealed Cyclone Haruna's massive eye before it made landfall in southwestern Madagascar. This image was taken from the VIIRS instrument that flies aboard the NASA-NOAA Suomi NPP satellite. The image was taken on Feb. 20 at 2242 UTC (5:42 p.m. EST/U.S.) and shows a clear eye, surrounded by very powerful thunderstorms. The bright lights of the Capital city of Antananarivo are seen in this image. The capital city lies about 300 nautical miles northwest of the storm's center. Haruna's center made landfall near Manombo, Madagascar around 0600 UTC (1 a.m. EST/U.S.) and its eye became cloud-filled quickly. For the entire storm history, visit NASA's Hurricane Page: <a href="http://www.nasa.gov/mission_pages/hurricanes/archives/2013/h2013_Haruna.html" rel="nofollow">www.nasa.gov/mission_pages/hurricanes/archives/2013/h2013...</a> Text: Credit: Univ.of Wisconsin/NASA/NOAA <b><a href="http://www.nasa.gov/audience/formedia/features/MP_Photo_Guidelines.html" rel="nofollow">NASA image use policy.</a></b> <b><a href="http://www.nasa.gov/centers/goddard/home/index.html" rel="nofollow">NASA Goddard Space Flight Center</a></b> enables NASA’s mission through four scientific endeavors: Earth Science, Heliophysics, Solar System Exploration, and Astrophysics. Goddard plays a leading role in NASA’s accomplishments by contributing compelling scientific knowledge to advance the Agency’s mission. <b>Follow us on <a href="http://twitter.com/NASA_GoddardPix" rel="nofollow">Twitter</a></b> <b>Like us on <a href="http://www.facebook.com/pages/Greenbelt-MD/NASA-Goddard/395013845897?ref=tsd" rel="nofollow">Facebook</a></b> <b>Find us on <a href="http://instagram.com/nasagoddard?vm=grid" rel="nofollow">Instagram</a></b>
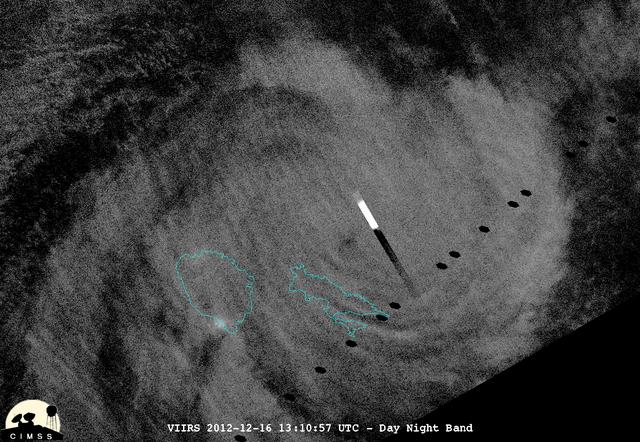
This night-time view of Cyclone Evan was taken from the Visible Infrared Imaging Radiometer Suite (VIIRS) on NASA/NOAA's Suomi National Polar-orbiting Partnership on Dec. 16, 2012. The rectangular bright object in the image is a lightning flash. "Because of the scan time as compared to how quickly lightning flashes, you get a nice streak in the data," said William Straka, of the University of Wisconsin-Madison, who provided this image. On Dec. 17 at 0900 UTC (4 a.m. EST), Cyclone Evan had maximum sustained winds near 115 knots (132 mph/213 kph). Evan was a Category 4 cyclone on the Saffir-Simpson Scale and was battering Fiji. Image Credit: NASA/NOAA/UWM/William Straka Text Credit: NASA Goddard/Rob Gutro <b><a href="http://www.nasa.gov/audience/formedia/features/MP_Photo_Guidelines.html" rel="nofollow">NASA image use policy.</a></b> <b><a href="http://www.nasa.gov/centers/goddard/home/index.html" rel="nofollow">NASA Goddard Space Flight Center</a></b> enables NASA’s mission through four scientific endeavors: Earth Science, Heliophysics, Solar System Exploration, and Astrophysics. Goddard plays a leading role in NASA’s accomplishments by contributing compelling scientific knowledge to advance the Agency’s mission. <b>Follow us on <a href="http://twitter.com/NASA_GoddardPix" rel="nofollow">Twitter</a></b> <b>Like us on <a href="http://www.facebook.com/pages/Greenbelt-MD/NASA-Goddard/395013845897?ref=tsd" rel="nofollow">Facebook</a></b> <b>Find us on <a href="http://instagrid.me/nasagoddard/?vm=grid" rel="nofollow">Instagram</a></b>

On August 6, 2015, NASA-NOAA's Suomi NPP satellite passed over powerful Typhoon Soudelor when it was headed toward Taiwan. The Visible Infrared Imaging Radiometer Suite (VIIRS) instrument aboard NASA-NOAA's Suomi satellite captured an infrared image of the typhoon. The infrared image that showed there were some thunderstorms within the typhoon with very cold cloud top temperatures, colder than -63F/-53C. Temperatures that cold stretch high into the troposphere and are capable of generating heavy rain. Credit: UWM/CIMSS/SSEC, William Straka III <b><a href="http://www.nasa.gov/audience/formedia/features/MP_Photo_Guidelines.html" rel="nofollow">NASA image use policy.</a></b> <b><a href="http://www.nasa.gov/centers/goddard/home/index.html" rel="nofollow">NASA Goddard Space Flight Center</a></b> enables NASA’s mission through four scientific endeavors: Earth Science, Heliophysics, Solar System Exploration, and Astrophysics. Goddard plays a leading role in NASA’s accomplishments by contributing compelling scientific knowledge to advance the Agency’s mission. <b>Follow us on <a href="http://twitter.com/NASAGoddardPix" rel="nofollow">Twitter</a></b> <b>Like us on <a href="http://www.facebook.com/pages/Greenbelt-MD/NASA-Goddard/395013845897?ref=tsd" rel="nofollow">Facebook</a></b> <b>Find us on <a href="http://instagrid.me/nasagoddard/?vm=grid" rel="nofollow">Instagram</a></b>

The InciWeb Incident Information System is following 18 fires in Alaska that are contributing, along with 49 uncontrolled fires under surveillance by the Canadian Wildland Fire Information System, to vast areas of visible smoke throughout Canadian provinces and stretching into northern U.S. states. This image from the Suomi NPP satellite's VIIRS instrument was taken from NOAA View on June 28, 2015. The smoke from these fires can also be seen in NOAA View as Aerosol Optical Thickness, a measure of how aerosols, such as smoke from wildfires, scatter and absorb sunlight. <b><a href="http://goes.gsfc.nasa.gov/" rel="nofollow">Credit: NOAA/NASA GOES Project</a></b> <b><a href="http://www.nasa.gov/audience/formedia/features/MP_Photo_Guidelines.html" rel="nofollow">NASA image use policy.</a></b> <b><a href="http://www.nasa.gov/centers/goddard/home/index.html" rel="nofollow">NASA Goddard Space Flight Center</a></b> enables NASA’s mission through four scientific endeavors: Earth Science, Heliophysics, Solar System Exploration, and Astrophysics. Goddard plays a leading role in NASA’s accomplishments by contributing compelling scientific knowledge to advance the Agency’s mission. <b>Follow us on <a href="http://twitter.com/NASAGoddardPix" rel="nofollow">Twitter</a></b> <b>Like us on <a href="http://www.facebook.com/pages/Greenbelt-MD/NASA-Goddard/395013845897?ref=tsd" rel="nofollow">Facebook</a></b> <b>Find us on <a href="http://instagrid.me/nasagoddard/?vm=grid" rel="nofollow">Instagram</a></b>
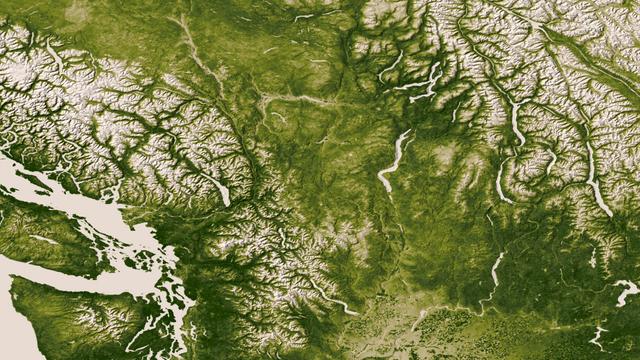
The Rocky, Cascade, and Coast Mountain Ranges dominate the landscape of the Pacific Northwest in this image created June 11-17, 2012 from the Visible-Infrared Imager/Radiometer Suite (VIIRS) instrument aboard the Suomi National Polar-orbiting Partnership or Suomi NPP satellite, a partnership between NASA and the National Oceanic and Atmospheric Administration, or NOAA. Potato and other agriculture can be seen in the bottom center of the image, as the Rockies transition to the plains of Idaho. High values of Normalized Difference Vegetation Index, or NDVI, represent dense green functioning vegetation and low NDVI values represent sparse green vegetation or vegetation under stress from limiting conditions, such as drought. Credit: NASA/NOAA To read more go to: <a href="http://www.nasa.gov/mission_pages/NPP/news/vegetation.html" rel="nofollow">www.nasa.gov/mission_pages/NPP/news/vegetation.html</a> <b><a href="http://www.nasa.gov/audience/formedia/features/MP_Photo_Guidelines.html" rel="nofollow">NASA image use policy.</a></b> <b><a href="http://www.nasa.gov/centers/goddard/home/index.html" rel="nofollow">NASA Goddard Space Flight Center</a></b> enables NASA’s mission through four scientific endeavors: Earth Science, Heliophysics, Solar System Exploration, and Astrophysics. Goddard plays a leading role in NASA’s accomplishments by contributing compelling scientific knowledge to advance the Agency’s mission. <b>Follow us on <a href="http://twitter.com/NASA_GoddardPix" rel="nofollow">Twitter</a></b> <b>Like us on <a href="http://www.facebook.com/pages/Greenbelt-MD/NASA-Goddard/395013845897?ref=tsd" rel="nofollow">Facebook</a></b> <b>Find us on <a href="http://instagram.com/nasagoddard?vm=grid" rel="nofollow">Instagram</a></b>
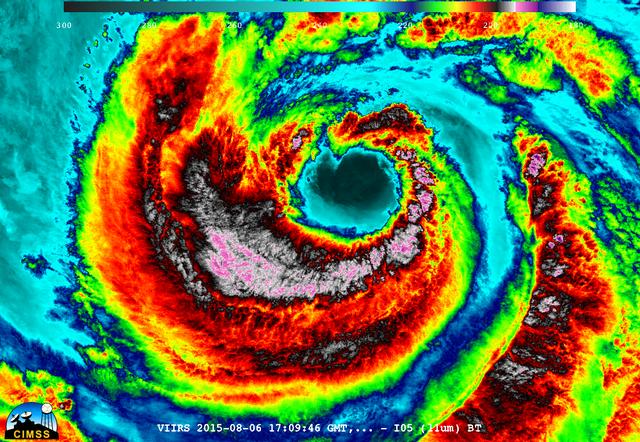
On August 6, 2015, NASA-NOAA's Suomi NPP satellite passed over powerful Typhoon Soudelor when it was headed toward Taiwan. The Visible Infrared Imaging Radiometer Suite (VIIRS) instrument aboard NASA-NOAA's Suomi satellite captured this night-time infrared close-up image of Soudelor's eye. The infrared image that showed there were some thunderstorms within the typhoon with very cold cloud top temperatures, colder than -63F/-53C. Temperatures that cold stretch high into the troposphere and are capable of generating heavy rain. At 1500 UTC (11 a.m. EDT) on August 6, 2015, Typhoon Soudelor had maximum sustained winds near 90 knots (103.6 mph/166.7 kph). It was centered near 21.3 North latitude and 127.5 East longitude, about 324 nautical miles (372.9 miles/600 km) south of Kadena Air Base, Okinawa, Japan. It was moving to the west at 10 knots (11.5 mph/18.5 kph). Credit: UWM/CIMSS/SSEC, William Straka III <b><a href="http://www.nasa.gov/audience/formedia/features/MP_Photo_Guidelines.html" rel="nofollow">NASA image use policy.</a></b> <b><a href="http://www.nasa.gov/centers/goddard/home/index.html" rel="nofollow">NASA Goddard Space Flight Center</a></b> enables NASA’s mission through four scientific endeavors: Earth Science, Heliophysics, Solar System Exploration, and Astrophysics. Goddard plays a leading role in NASA’s accomplishments by contributing compelling scientific knowledge to advance the Agency’s mission. <b>Follow us on <a href="http://twitter.com/NASAGoddardPix" rel="nofollow">Twitter</a></b> <b>Like us on <a href="http://www.facebook.com/pages/Greenbelt-MD/NASA-Goddard/395013845897?ref=tsd" rel="nofollow">Facebook</a></b> <b>Find us on <a href="http://instagrid.me/nasagoddard/?vm=grid" rel="nofollow">Instagram</a></b>
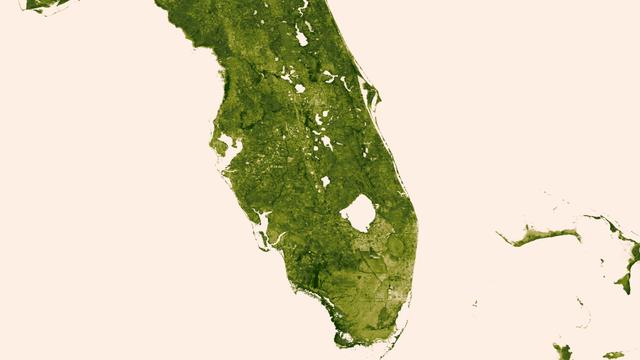
A "river of grass" extending south of Lake Okeechobee shows how the area was modified by man with visible areas of dense agriculture, urban sprawl and water conservation areas delineated by a series of waterways that crisscross Southern Florida. The image was created March 18-24, 2013 from the Visible-Infrared Imager/Radiometer Suite (VIIRS) instrument aboard the Suomi National Polar-orbiting Partnership or Suomi NPP satellite, a partnership between NASA and the National Oceanic and Atmospheric Administration, or NOAA. Credit: NASA/NOAA To read more go to: <a href="http://www.nasa.gov/mission_pages/NPP/news/vegetation.html" rel="nofollow">www.nasa.gov/mission_pages/NPP/news/vegetation.html</a> <b><a href="http://www.nasa.gov/audience/formedia/features/MP_Photo_Guidelines.html" rel="nofollow">NASA image use policy.</a></b> <b><a href="http://www.nasa.gov/centers/goddard/home/index.html" rel="nofollow">NASA Goddard Space Flight Center</a></b> enables NASA’s mission through four scientific endeavors: Earth Science, Heliophysics, Solar System Exploration, and Astrophysics. Goddard plays a leading role in NASA’s accomplishments by contributing compelling scientific knowledge to advance the Agency’s mission. <b>Follow us on <a href="http://twitter.com/NASA_GoddardPix" rel="nofollow">Twitter</a></b> <b>Like us on <a href="http://www.facebook.com/pages/Greenbelt-MD/NASA-Goddard/395013845897?ref=tsd" rel="nofollow">Facebook</a></b> <b>Find us on <a href="http://instagram.com/nasagoddard?vm=grid" rel="nofollow">Instagram</a></b>

This February 8, 2016 composite image reveals the complex distribution of phytoplankton in one of Earth's eastern boundary upwelling systems — the California Current. Recent work suggests that our warming climate my be increasing the intensity of upwelling in such regions with possible repercussions for the species that comprise those ecosystems. NASA's OceanColor Web is supported by the Ocean Biology Processing Group (OBPG) at NASA's Goddard Space Flight Center. Our responsibilities include the collection, processing, calibration, validation, archive and distribution of ocean-related products from a large number of operational, satellite-based remote-sensing missions providing ocean color, sea surface temperature and sea surface salinity data to the international research community since 1996. Credit: NASA/Goddard/Suomin-NPP/VIIRS <b><a href="http://www.nasa.gov/audience/formedia/features/MP_Photo_Guidelines.html" rel="nofollow">NASA image use policy.</a></b> <b><a href="http://www.nasa.gov/centers/goddard/home/index.html" rel="nofollow">NASA Goddard Space Flight Center</a></b> enables NASA’s mission through four scientific endeavors: Earth Science, Heliophysics, Solar System Exploration, and Astrophysics. Goddard plays a leading role in NASA’s accomplishments by contributing compelling scientific knowledge to advance the Agency’s mission. <b>Follow us on <a href="http://twitter.com/NASAGoddardPix" rel="nofollow">Twitter</a></b> <b>Like us on <a href="http://www.facebook.com/pages/Greenbelt-MD/NASA-Goddard/395013845897?ref=tsd" rel="nofollow">Facebook</a></b> <b>Find us on <a href="http://instagrid.me/nasagoddard/?vm=grid" rel="nofollow">Instagram</a></b>
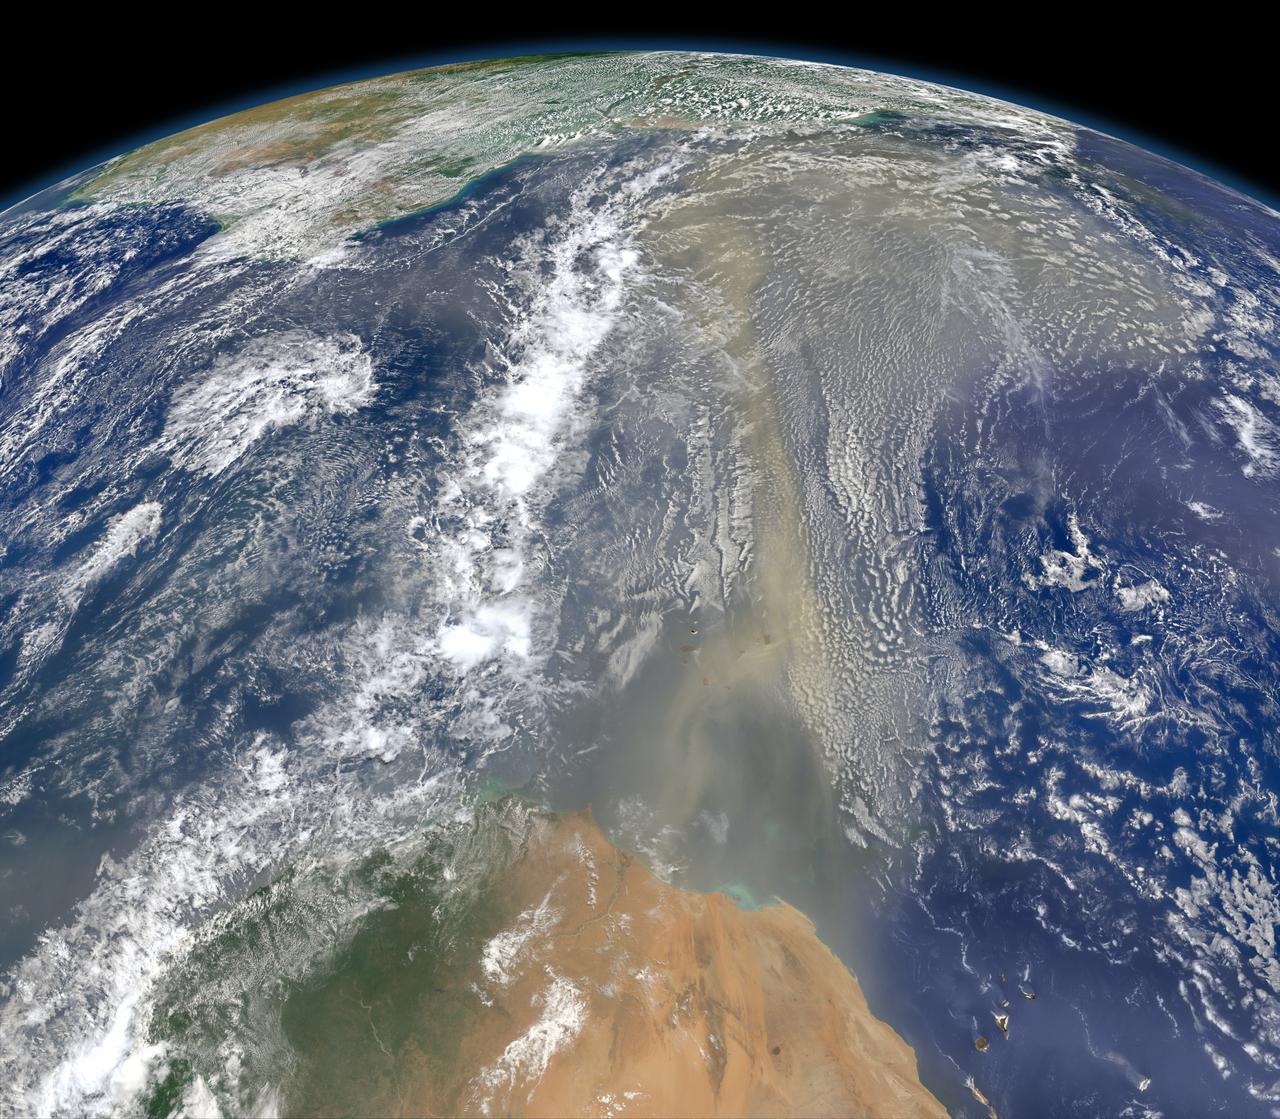
A piece of Africa—actually lots of them—began to arrive in the Americas in June 2014. On June 23, a lengthy river of dust from western Africa began to push across the Atlantic Ocean on easterly winds. A week later, the influx of dust was affecting air quality as far away as the southeastern United States. This composite image, made with data from the Visible Infrared Imaging Radiometer Suite (VIIRS) on Suomi NPP, shows dust heading west toward South America and the Gulf of Mexico on June 25, 2014. The dust flowed roughly parallel to a line of clouds in the intertropical convergence zone, an area near the equator where the trade winds come together and rain and clouds are common. In imagery captured by the Moderate Resolution Imaging Spectroradiometer (MODIS), the dust appeared to be streaming from Mauritania, Senegal, and Western Sahara, though some of it may have originated in countries farther to the east. Saharan dust has a range of impacts on ecosystems downwind. Each year, dust events like the one pictured here deliver about 40 million tons of dust from the Sahara to the Amazon River Basin. The minerals in the dust replenish nutrients in rainforest soils, which are continually depleted by drenching, tropical rains. Research focused on peat soils in the Everglades show that African dust has been arriving regularly in South Florida for thousands of years as well. In some instances, the impacts are harmful. Infusion of Saharan dust, for instance, can have a negative impact on air quality in the Americas. And scientists have linked African dust to outbreaks of certain types of toxic algal blooms in the Gulf of Mexico and southern Florida. Read more: <a href="http://1.usa.gov/1snkzmS" rel="nofollow">1.usa.gov/1snkzmS</a> NASA images by Norman Kuring, NASA’s Ocean Color web. Caption by Adam Voiland. Credit: <b><a href="http://www.earthobservatory.nasa.gov/" rel="nofollow"> NASA Earth Observatory</a></b> <b><a href="http://www.nasa.gov/audience/formedia/features/MP_Photo_Guidelines.html" rel="nofollow">NASA image use policy.</a></b> <b><a href="http://www.nasa.gov/centers/goddard/home/index.html" rel="nofollow">NASA Goddard Space Flight Center</a></b> enables NASA’s mission through four scientific endeavors: Earth Science, Heliophysics, Solar System Exploration, and Astrophysics. Goddard plays a leading role in NASA’s accomplishments by contributing compelling scientific knowledge to advance the Agency’s mission. <b>Follow us on <a href="http://twitter.com/NASAGoddardPix" rel="nofollow">Twitter</a></b> <b>Like us on <a href="http://www.facebook.com/pages/Greenbelt-MD/NASA-Goddard/395013845897?ref=tsd" rel="nofollow">Facebook</a></b> <b>Find us on <a href="http://instagram.com/nasagoddard?vm=grid" rel="nofollow">Instagram</a></b>

The U.S. National Weather Service called it a “a crippling and historic winter blizzard.” In late January 2015, transportation systems from Trenton to Portland were shut down, and more than 35 million people hunkered down for extreme snowfall and biting winds. For those in New England, it turned out to be a monstrous storm. For the Mid-Atlantic region, not so much. Vast swaths of Massachusetts, Connecticut, Rhode Island, New Hampshire, Maine, and Long Island (NY) were blanketed with 15 to 25 inches (40 to 60 centimeters) of snow as of midday on January 27, 2015, and snow was expected to continue into January 28. Sustained winds reached gale force, with hurricane-force gusts along the coastlines. Storm surges sent ice and water into the streets of Scituate and Nantucket, Massachusetts. Many New England towns, including the city of Boston, were expected to approach all-time snowfall records. The Visible Infrared Imaging Radiometer Suite on the Suomi NPP satellite acquired these nighttime images at 1:45 am US eastern standard time (06:45 Universal Time) on January 27, 2015. The top image, lit by moonlight and city lights, shows a nor'easter off the coast of the East Coast of the United States. City lights are blurred somewhat by the cloud cover. The second image shows the same scene in longwave infrared radiation, with brighter shades representing the colder temperatures of snow-producing clouds. NASA Earth Observatory image by Jesse Allen, using VIIRS data from the Suomi National Polar-orbiting Partnership. Read more: <a href="http://earthobservatory.nasa.gov/IOTD/view.php?id=85166&eocn=home&eoci=iotd_title" rel="nofollow">earthobservatory.nasa.gov/IOTD/view.php?id=85166&eocn...</a> Via: <b><a href="http://www.earthobservatory.nasa.gov/" rel="nofollow"> NASA Earth Observatory</a></b> <b><a href="http://www.nasa.gov/audience/formedia/features/MP_Photo_Guidelines.html" rel="nofollow">NASA image use policy.</a></b> <b><a href="http://www.nasa.gov/centers/goddard/home/index.html" rel="nofollow">NASA Goddard Space Flight Center</a></b> enables NASA’s mission through four scientific endeavors: Earth Science, Heliophysics, Solar System Exploration, and Astrophysics. Goddard plays a leading role in NASA’s accomplishments by contributing compelling scientific knowledge to advance the Agency’s mission. <b>Follow us on <a href="http://twitter.com/NASAGoddardPix" rel="nofollow">Twitter</a></b> <b>Like us on <a href="http://www.facebook.com/pages/Greenbelt-MD/NASA-Goddard/395013845897?ref=tsd" rel="nofollow">Facebook</a></b> <b>Find us on <a href="http://instagram.com/nasagoddard?vm=grid" rel="nofollow">Instagram</a></b>

The U.S. National Weather Service called it a “a crippling and historic winter blizzard.” In late January 2015, transportation systems from Trenton to Portland were shut down, and more than 35 million people hunkered down for extreme snowfall and biting winds. For those in New England, it turned out to be a monstrous storm. For the Mid-Atlantic region, not so much. Vast swaths of Massachusetts, Connecticut, Rhode Island, New Hampshire, Maine, and Long Island (NY) were blanketed with 15 to 25 inches (40 to 60 centimeters) of snow as of midday on January 27, 2015, and snow was expected to continue into January 28. Sustained winds reached gale force, with hurricane-force gusts along the coastlines. Storm surges sent ice and water into the streets of Scituate and Nantucket, Massachusetts. Many New England towns, including the city of Boston, were expected to approach all-time snowfall records. The Visible Infrared Imaging Radiometer Suite on the Suomi NPP satellite acquired these nighttime images at 1:45 am US eastern standard time (06:45 Universal Time) on January 27, 2015. The top image, lit by moonlight and city lights, shows a nor'easter off the coast of the East Coast of the United States. City lights are blurred somewhat by the cloud cover. The second image shows the same scene in longwave infrared radiation, with brighter shades representing the colder temperatures of snow-producing clouds. NASA Earth Observatory image by Jesse Allen, using VIIRS data from the Suomi National Polar-orbiting Partnership. Read more: <a href="http://earthobservatory.nasa.gov/IOTD/view.php?id=85166&eocn=home&eoci=iotd_title" rel="nofollow">earthobservatory.nasa.gov/IOTD/view.php?id=85166&eocn...</a> Via: <b><a href="http://www.earthobservatory.nasa.gov/" rel="nofollow"> NASA Earth Observatory</a></b> <b><a href="http://www.nasa.gov/audience/formedia/features/MP_Photo_Guidelines.html" rel="nofollow">NASA image use policy.</a></b> <b><a href="http://www.nasa.gov/centers/goddard/home/index.html" rel="nofollow">NASA Goddard Space Flight Center</a></b> enables NASA’s mission through four scientific endeavors: Earth Science, Heliophysics, Solar System Exploration, and Astrophysics. Goddard plays a leading role in NASA’s accomplishments by contributing compelling scientific knowledge to advance the Agency’s mission. <b>Follow us on <a href="http://twitter.com/NASAGoddardPix" rel="nofollow">Twitter</a></b> <b>Like us on <a href="http://www.facebook.com/pages/Greenbelt-MD/NASA-Goddard/395013845897?ref=tsd" rel="nofollow">Facebook</a></b> <b>Find us on <a href="http://instagram.com/nasagoddard?vm=grid" rel="nofollow">Instagram</a></b>