VIMS Iapetus Two Shooter
VIMS Shows Iapetus Surface Composition
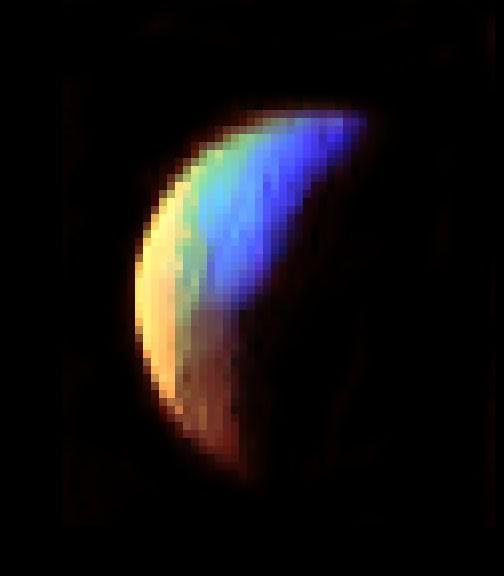
![These six infrared images of Saturn's moon Titan represent some of the clearest, most seamless-looking global views of the icy moon's surface produced so far. The views were created using 13 years of data acquired by the Visual and Infrared Mapping Spectrometer (VIMS) instrument on board NASA's Cassini spacecraft. The images are the result of a focused effort to smoothly combine data from the multitude of different observations VIMS made under a wide variety of lighting and viewing conditions over the course of Cassini's mission. Previous VIMS maps of Titan (for example, PIA02145) display great variation in imaging resolution and lighting conditions, resulting in obvious seams between different areas of the surface. With the seams now gone, this new collection of images is by far the best representation of how the globe of Titan might appear to the casual observer if it weren't for the moon's hazy atmosphere, and it likely will not be superseded for some time to come. Observing the surface of Titan in the visible region of the spectrum is difficult, due to the globe enshrouding haze that envelops the moon. This is primarily because small particles called aerosols in Titan's upper atmosphere strongly scatter visible light. But Titan's surface can be more readily imaged in a few infrared "windows" -- infrared wavelengths where scattering and absorption is much weaker. This is where the VIMS instrument excelled, parting the haze to obtain clear images of Titan's surface. (For comparison, Figure 1 shows Titan as it appears in visible light, as does PIA11603.) Making mosaics of VIMS images of Titan has always been a challenge because the data were obtained over many different flybys with different observing geometries and atmospheric conditions. One result is that very prominent seams appear in the mosaics that are quite difficult for imaging scientists to remove. But, through laborious and detailed analyses of the data, along with time consuming hand processing of the mosaics, the seams have been mostly removed. This is an update to the work previously discussed in PIA20022. Any full color image is comprised of three color channels: red, green and blue. Each of the three color channels combined to create these views was produced using a ratio between the brightness of Titan's surface at two different wavelengths (1.59/1.27 microns [red], 2.03/1.27 microns [green] and 1.27/1.08 microns [blue]). This technique (called a "band-ratio" technique) reduces the prominence of seams, as well as emphasizing subtle spectral variations in the materials on Titan's surface. For example, the moon's equatorial dune fields appear a consistent brown color here. There are also bluish and purplish areas that may have different compositions from the other bright areas, and may be enriched in water ice. For a map of Titan with latitudes, longitudes and labeled surface features, see PIA20713. It is quite clear from this unique set of images that Titan has a complex surface, sporting myriad geologic features and compositional units. The VIMS instrument has paved the way for future infrared instruments that could image Titan at much higher resolution, revealing features that were not detectable by any of Cassini's instruments. https://photojournal.jpl.nasa.gov/catalog/PIA21923](https://images-assets.nasa.gov/image/PIA21923/PIA21923~medium.jpg)
These six infrared images of Saturn's moon Titan represent some of the clearest, most seamless-looking global views of the icy moon's surface produced so far. The views were created using 13 years of data acquired by the Visual and Infrared Mapping Spectrometer (VIMS) instrument on board NASA's Cassini spacecraft. The images are the result of a focused effort to smoothly combine data from the multitude of different observations VIMS made under a wide variety of lighting and viewing conditions over the course of Cassini's mission. Previous VIMS maps of Titan (for example, PIA02145) display great variation in imaging resolution and lighting conditions, resulting in obvious seams between different areas of the surface. With the seams now gone, this new collection of images is by far the best representation of how the globe of Titan might appear to the casual observer if it weren't for the moon's hazy atmosphere, and it likely will not be superseded for some time to come. Observing the surface of Titan in the visible region of the spectrum is difficult, due to the globe enshrouding haze that envelops the moon. This is primarily because small particles called aerosols in Titan's upper atmosphere strongly scatter visible light. But Titan's surface can be more readily imaged in a few infrared "windows" -- infrared wavelengths where scattering and absorption is much weaker. This is where the VIMS instrument excelled, parting the haze to obtain clear images of Titan's surface. (For comparison, Figure 1 shows Titan as it appears in visible light, as does PIA11603.) Making mosaics of VIMS images of Titan has always been a challenge because the data were obtained over many different flybys with different observing geometries and atmospheric conditions. One result is that very prominent seams appear in the mosaics that are quite difficult for imaging scientists to remove. But, through laborious and detailed analyses of the data, along with time consuming hand processing of the mosaics, the seams have been mostly removed. This is an update to the work previously discussed in PIA20022. Any full color image is comprised of three color channels: red, green and blue. Each of the three color channels combined to create these views was produced using a ratio between the brightness of Titan's surface at two different wavelengths (1.59/1.27 microns [red], 2.03/1.27 microns [green] and 1.27/1.08 microns [blue]). This technique (called a "band-ratio" technique) reduces the prominence of seams, as well as emphasizing subtle spectral variations in the materials on Titan's surface. For example, the moon's equatorial dune fields appear a consistent brown color here. There are also bluish and purplish areas that may have different compositions from the other bright areas, and may be enriched in water ice. For a map of Titan with latitudes, longitudes and labeled surface features, see PIA20713. It is quite clear from this unique set of images that Titan has a complex surface, sporting myriad geologic features and compositional units. The VIMS instrument has paved the way for future infrared instruments that could image Titan at much higher resolution, revealing features that were not detectable by any of Cassini's instruments. https://photojournal.jpl.nasa.gov/catalog/PIA21923
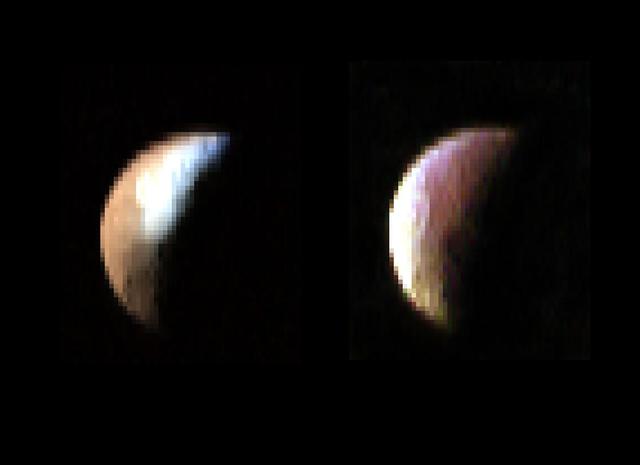
Cassini made a close flyby of Saturn's moon Iapetus on Sept. 10, 2007, and the visual and infrared mapping spectrometer obtained these images during that event. These two images show a higher resolution version of the equatorial region shown in PIA10010. The equatorial region includes the equatorial bulge which shows no differences in these compositions compared to surrounding regions. The color image on the right shows the results of mapping for three components of Iapetus' surface: carbon dioxide that is trapped or adsorbed in the surface (red), water in the form of ice (green), and a newly-discovered effect due to trace amount of dark particles in the ice creating what scientists call Rayleigh scattering (blue). The Rayleigh scattering effect is the main reason why the Earth's sky appears blue. There is a complex transition zone from the dark region, on the right, which is high in carbon dioxide, to the more ice-rich region on the left. Some crater floors are filled with carbon dioxide-rich dark material. As the ice becomes cleaner to the left, the small dark particles become more scattered and increase the Rayleigh scattering effect, again indicative of less than 2 percent dark sub-0.5-micron particles. The visual and infrared mapping spectrometer is like a digital camera, but instead of using three colors, it makes images in 352 colors, or wavelengths, from the ultraviolet to the near-infrared. The many wavelengths produce a continuous spectrum in each pixel, and these spectra measure how light is absorbed by different materials. By analyzing the absorptions expressed in each pixel, a map of the composition at each location on the moon can be constructed. http://photojournal.jpl.nasa.gov/catalog/PIA10011
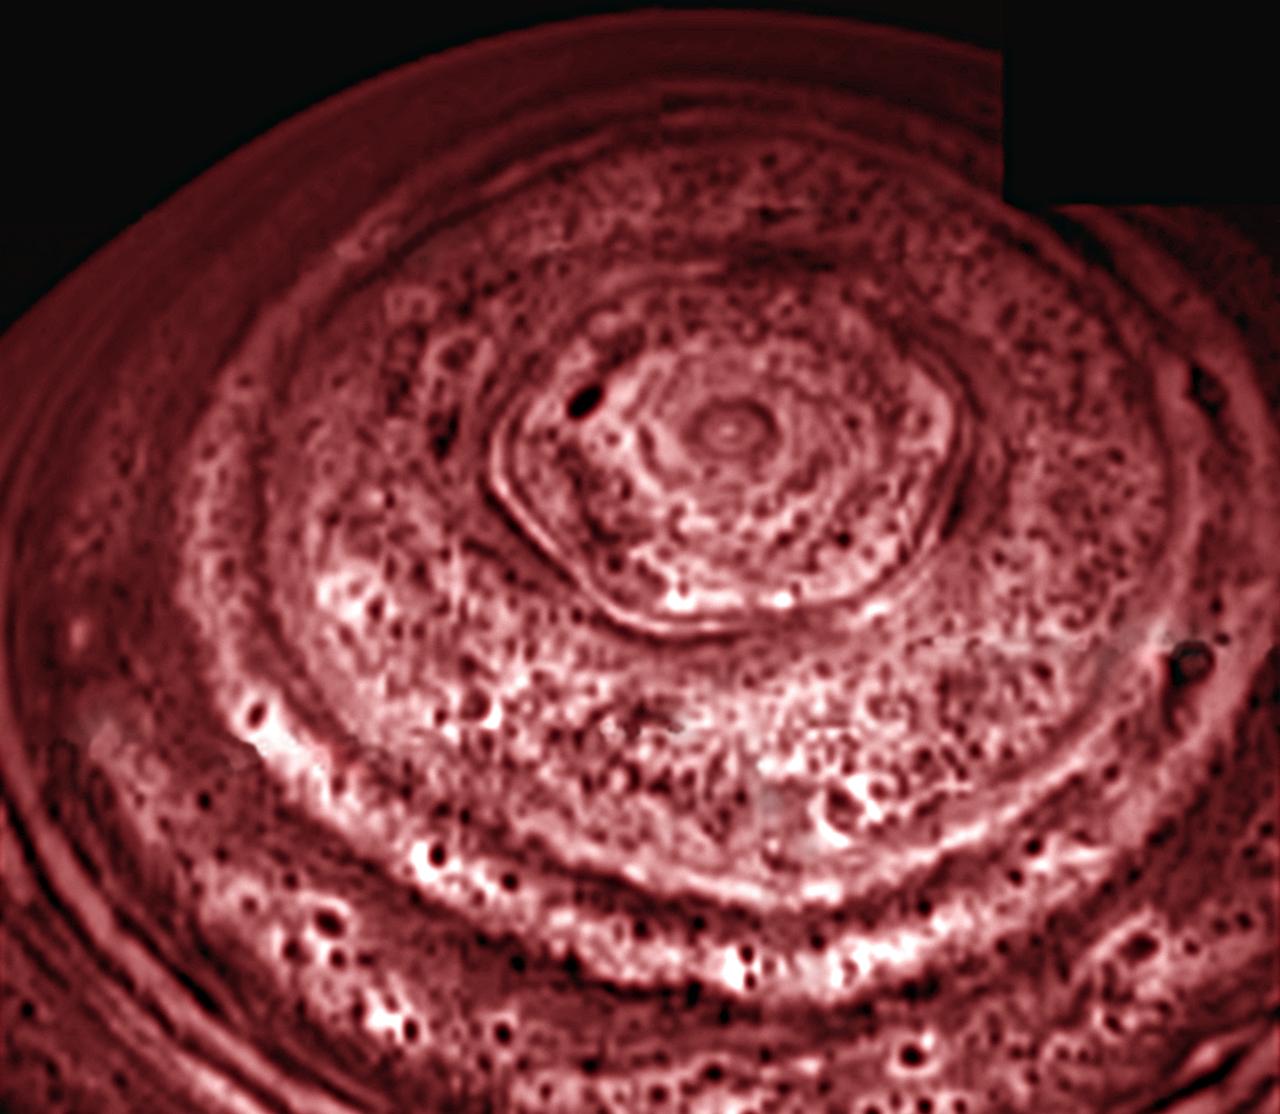
A bizarre six-sided feature encircling the north pole of Saturn has been spied by the VIMS on NASA Cassini spacecraft. This image is one of the first clear images ever taken of the north polar region as seen from a unique polar perspective
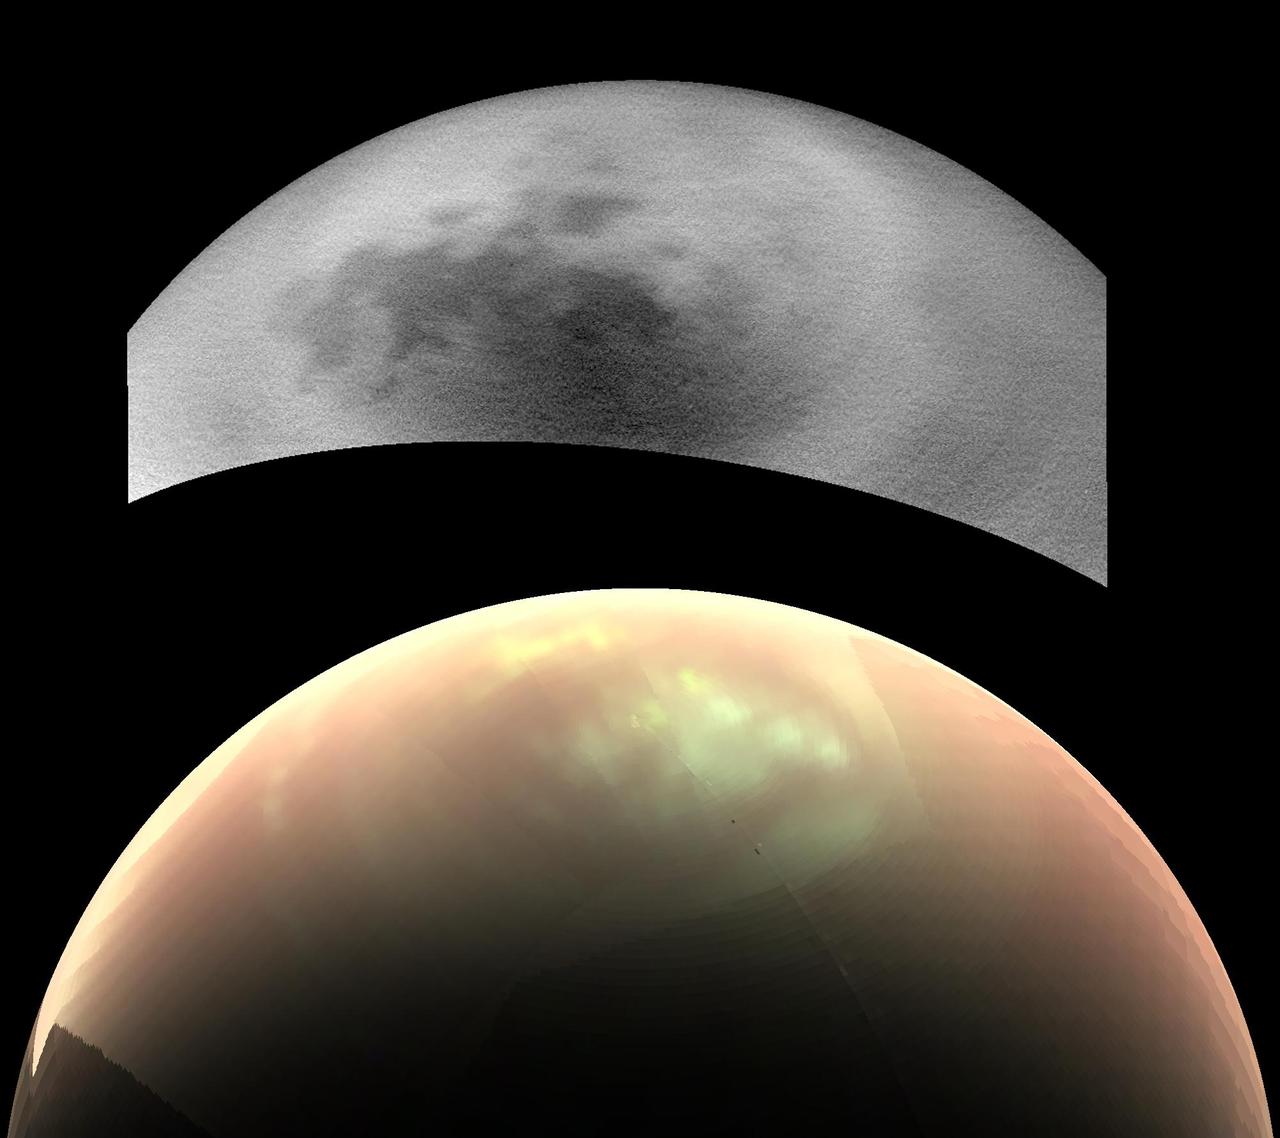
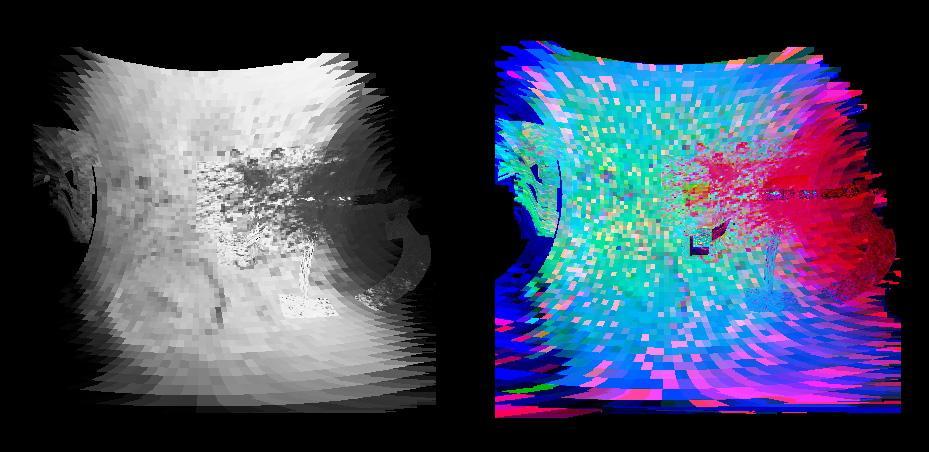
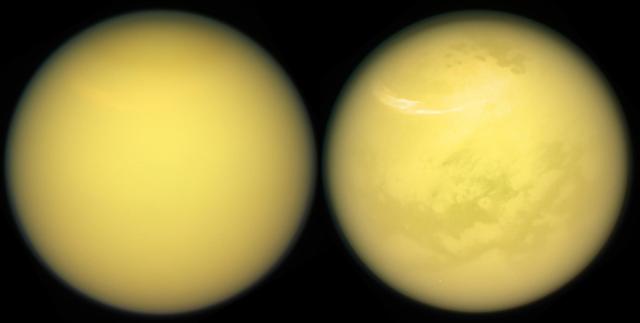
This comparison of two views from NASA's Cassini spacecraft, taken fairly close together in time, illustrates a peculiar mystery: Why would clouds on Saturn's moon Titan be visible in some images, but not in others? In the top view, a near-infrared image from Cassini's imaging cameras, the skies above Saturn's moon Titan look relatively cloud free. But in the bottom view, at longer infrared wavelengths, Cassini sees a large field of bright clouds. Even though these views were taken at different wavelengths, researchers would expect at least a hint of the clouds to show up in the upper image. Thus they have been trying to understand what's behind the difference. As northern summer approaches on Titan, atmospheric models have predicted that clouds will become more common at high northern latitudes, similar to what was observed at high southern latitudes during Titan's late southern summer in 2004. Cassini's Imaging Science Subsystem (ISS) and Visual and Infrared Mapping Spectrometer (VIMS) teams have been observing Titan to document changes in weather patterns as the seasons change, and there is particular interest in following the onset of clouds in the north polar region where Titan's lakes and seas are concentrated. Cassini's "T120" and "T121" flybys of Titan, on June 7 and July 25, 2016, respectively, provided views of high northern latitudes over extended time periods -- more than 24 hours during both flybys. Intriguingly, the ISS and VIMS observations appear strikingly different from each other. In the ISS observations (monochrome image at top), surface features are easily identifiable and only a few small, isolated clouds were detected. In contrast, the VIMS observations (color image at bottom) suggest widespread cloud cover during both flybys. The observations were made over the same time period, so differences in illumination geometry or changes in the clouds themselves are unlikely to be the cause for the apparent discrepancy: VIMS shows persistent atmospheric features over the entire observation period and ISS consistently detects surface features with just a few localized clouds. The answer to what could be causing the discrepancy appears to lie with Titan's hazy atmosphere, which is much easier to see through at the longer infrared wavelengths that VIMS is sensitive to (up to 5 microns) than at the shorter, near-infrared wavelength used by ISS to image Titan's surface and lower atmosphere (0.94 microns). High, thin cirrus clouds that are optically thicker than the atmospheric haze at longer wavelengths, but optically thinner than the haze at the shorter wavelength of the ISS observations, could be detected by VIMS and simultaneously lost in the haze to ISS -- similar to trying to see a thin cloud layer on a hazy day on Earth. This phenomenon has not been seen again since July 2016, but Cassini has several more opportunities to observe Titan over the last months of the mission in 2017, and scientists will be watching to see if and how the weather changes. These two images were taken as part of the T120 flyby on June 7 (VIMS) and 8 (ISS), 2016. The distance to Titan was about 28,000 miles (45,000 kilometers) for the VIMS image and about 398,000 miles (640,000 kilometers) for the ISS image. The VIMS image has been processed to enhance the visibility of the clouds; in this false-color view, clouds appear nearly white, atmospheric haze is pink, and surface areas would appear green. http://photojournal.jpl.nasa.gov/catalog/PIA21054

This composite image shows an infrared view of Saturn's moon Titan from NASA's Cassini spacecraft, acquired during the mission's "T-114" flyby on Nov. 13, 2015. The spacecraft's visual and infrared mapping spectrometer (VIMS) instrument made these observations, in which blue represents wavelengths centered at 1.3 microns, green represents 2.0 microns, and red represents 5.0 microns. A view at visible wavelengths (centered around 0.5 microns) would show only Titan's hazy atmosphere (as in PIA14909). The near-infrared wavelengths in this image allow Cassini's vision to penetrate the haze and reveal the moon's surface. During this Titan flyby, the spacecraft's closest-approach altitude was 6,200 miles (10,000 kilometers), which is considerably higher than those of typical flybys, which are around 750 miles (1,200 kilometers). The high flyby allowed VIMS to gather moderate-resolution views over wide areas (typically at a few kilometers per pixel). The view looks toward terrain that is mostly on the Saturn-facing hemisphere of Titan. The scene features the parallel, dark, dune-filled regions named Fensal (to the north) and Aztlan (to the south), which form the shape of a sideways letter "H." Several places on the image show the surface at higher resolution than elsewhere. These areas, called subframes, show more detail because they were acquired near closest approach. They have finer resolution, but cover smaller areas than data obtained when Cassini was farther away from Titan. Near the limb at left, above center, is the best VIMS view so far of Titan's largest confirmed impact crater, Menrva (first seen by the RADAR instrument in PIA07365). Similarly detailed subframes show eastern Xanadu, the basin Hotei Regio, and channels within bright terrains east of Xanadu. (For Titan maps with named features see http://planetarynames.wr.usgs.gov/Page/TITAN/target.) Due to the changing Saturnian seasons, in this late northern spring view, the illumination is significantly changed from that seen by VIMS during the "T-9" flyby on December 26, 2005 (PIA02145). The sun has moved higher in the sky in Titan's northern hemisphere, and lower in the sky in the south, as northern summer approaches. This change in the sun's angle with respect to Titan's surface has made high southern latitudes appear darker, while northern latitudes appear brighter. http://photojournal.jpl.nasa.gov/catalog/PIA20016
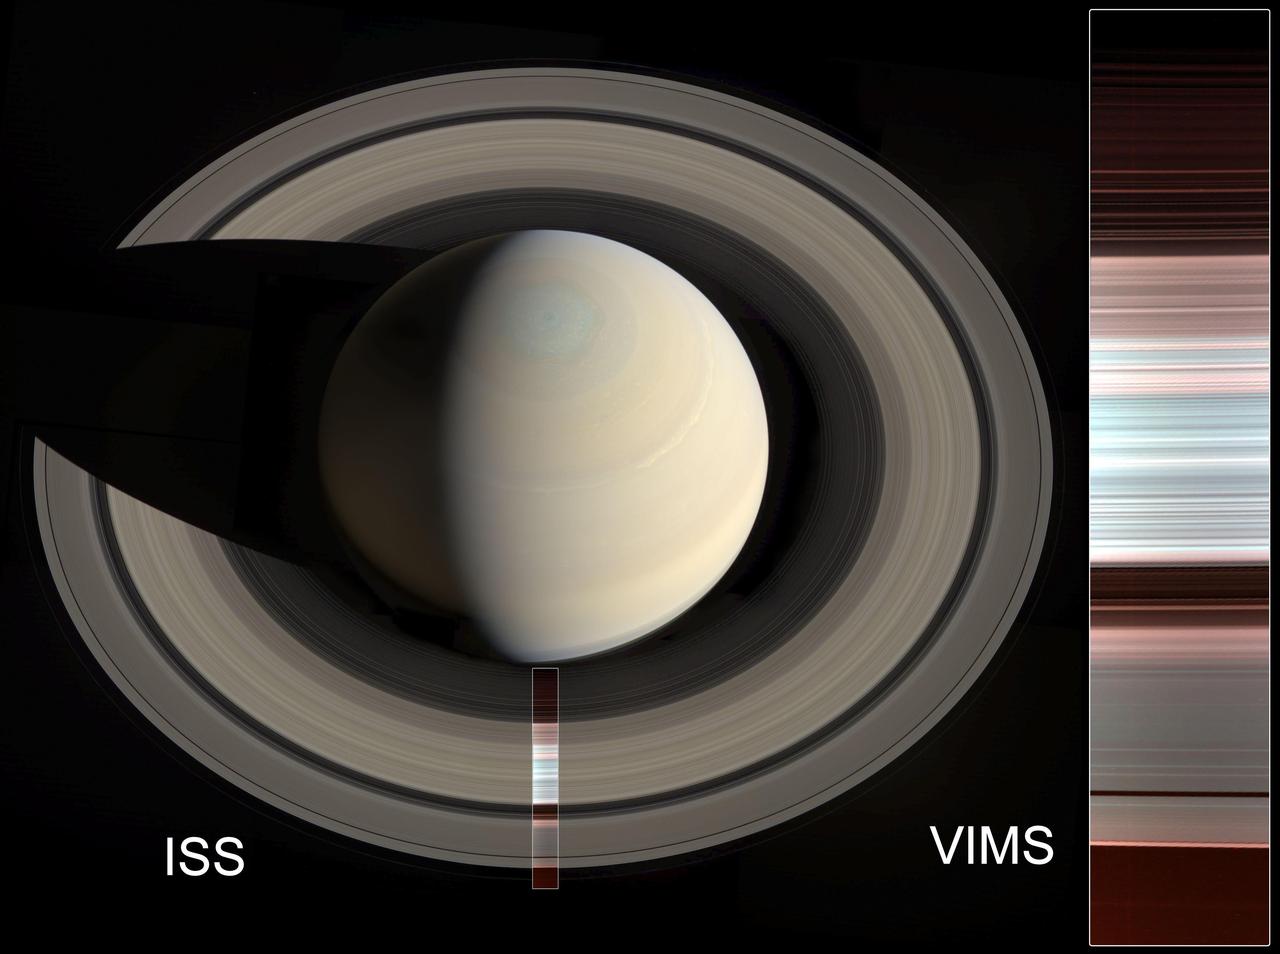
The false-color image at right shows spectral mapping of Saturn's A, B and C rings, captured by Cassini's Visible and Infrared Mapping Spectrometer (VIMS). It displays an infrared view of the rings, rather than an image in visible light. The blue-green areas are the regions with the purest water ice and/or largest grain size (primarily the A and B rings), while the reddish color indicates increasing amounts of non-icy material and/or smaller grain sizes (primarily in the C ring and Cassini Division). At left, the same image is overlaid on a natural-color mosaic of Saturn taken by Cassini's Imaging Science Subsystem. https://photojournal.jpl.nasa.gov/catalog/PIA23170
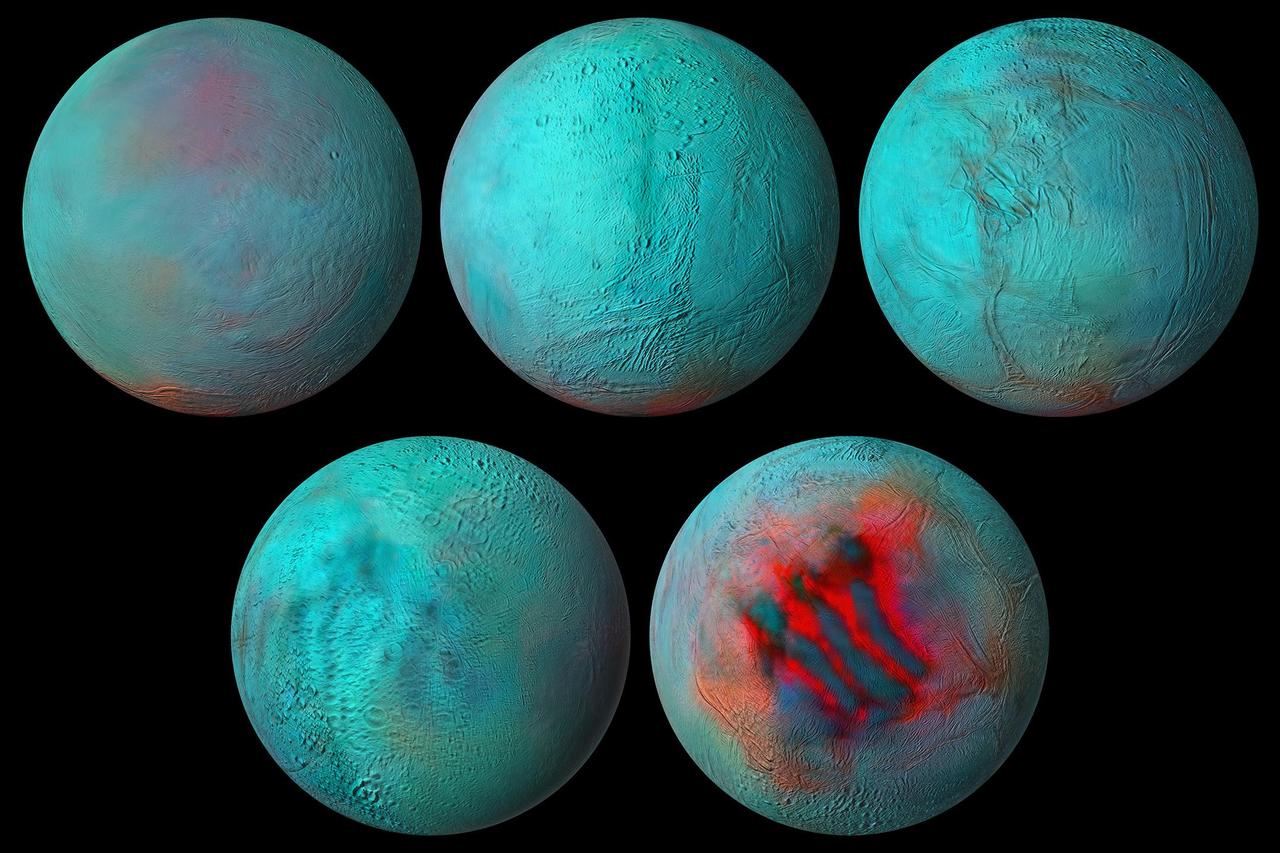
New composite images made from NASA's Cassini spacecraft data are the most detailed global infrared views ever produced of Saturn's moon Enceladus. And data used to build those images provides strong evidence that the northern hemisphere of the moon has been resurfaced with ice from its interior. During Cassini's 13-year exploration of the Saturn system, the spacecraft's Visible and Infrared Mapping Spectrometer (VIMS) collected light — both visible to the human eye and infrared light — reflected off the planet, its rings, and its 10 major icy moons. VIMS then separated light into its various wavelengths, information that tells scientists more about the makeup of the material reflecting it. Combined with detailed images captured by Cassini's Imaging Science Subsystem, the VIMS data was used to make the new global spectral map of Enceladus. It shows that infrared signals correlate with the geologic activity known to be ongoing at the south pole, where plumes of ice grains and vapor shoot out from an ocean that lies under the icy crust. The so-called "tiger stripe" gashes, where the plumes originate, are seen here. But some of the same infrared features are also seen in the northern hemisphere. That tells scientists not just that the northern area is covered with fresh ice but that the same kind of geologic activity, a resurfacing of the landscape, has occurred in both hemispheres. The resurfacing in the north may be due to icy jets, or a more gradual movement of ice through fractures in the crust, from the subsurface ocean to the surface. Movie available at https://photojournal.jpl.nasa.gov/catalog/PIA24023
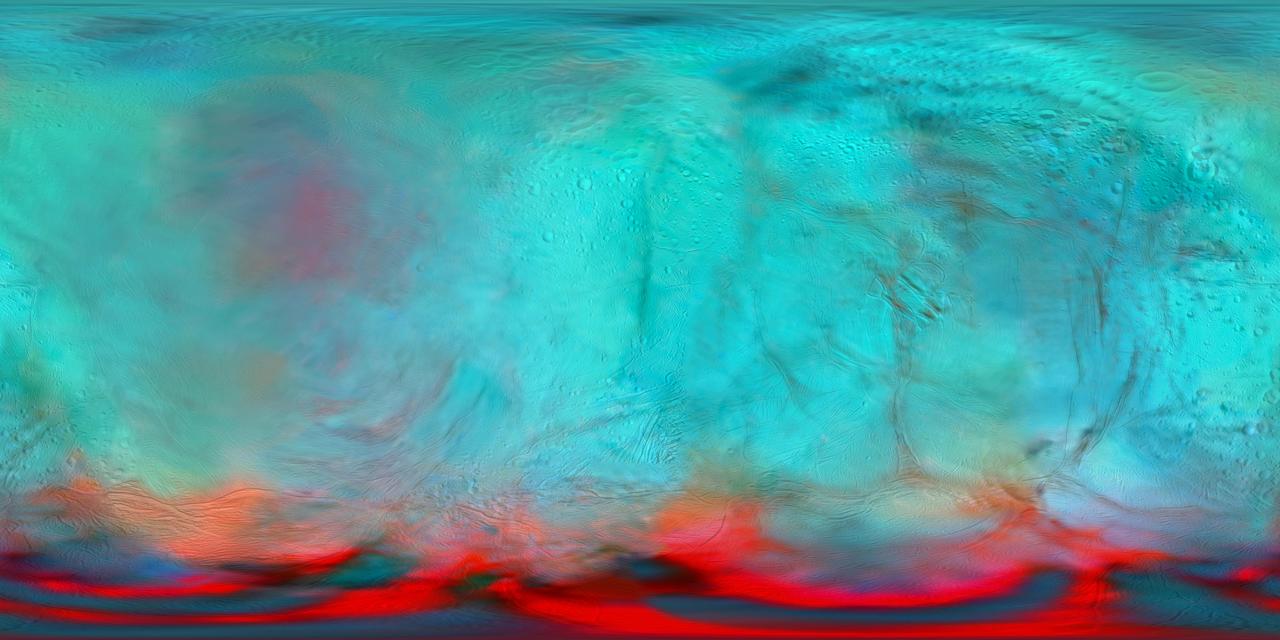
This infrared global map of Saturn's icy moon Enceladus was created using images acquired by NASA's Cassini spacecraft. It is a companion to the global views presented in PIA24023. It combines infrared maps obtained by the spacecraft's Visual and Infrared Mapping Spectrometer (VIMS), published by Robidel et al. (2020), and the visible map from the Imaging Science Subsystem (ISS), published by Bland et al. (2018). The colors used in this map represent infrared data collected by the VIMS instrument. The red color channel corresponds to a ratio of Enceladus' brightness observed at 3.1 microns divided by its brightness at 1.65 microns; the green channel corresponds to the brightness at 2.0 microns; and the blue channel corresponds to the brightness at 1.8 microns. These colors highlight the location of fresh crystalline ice, indicated by a red tint. Researchers also superimposed a high-resolution map of the moon's surface taken with the ISS camera (clear filter images), in order to show geologic features. All seams and spurious artifacts were removed to produce a globally smooth image used in the orthographic views published in PIA24023. This map is an equirectangular projection center at 0° longitude. The mean radius of Enceladus used for the projection of this map is 252.1 km (corresponding to a scale of 200 meters per pixel at the equator). References: - Robidel et al. (2020) - https://doi.org/10.1016/j.icarus.2020.113848 - Bland et al (2018) - https://doi.org/10.1029/2018EA000399 More information about Cassini can be found here: https://solarsystem.nasa.gov/cassini. https://photojournal.jpl.nasa.gov/catalog/PIA24027
These two views of Saturn's moon Titan exemplify how NASA's Cassini spacecraft has revealed the surface of this fascinating world. Cassini carried several instruments to pierce the veil of hydrocarbon haze that enshrouds Titan. The mission's imaging cameras also have several spectral filters sensitive to specific wavelengths of infrared light that are able to make it through the haze to the surface and back into space. These "spectral windows" have enable the imaging cameras to map nearly the entire surface of Titan. In addition to Titan's surface, images from both the imaging cameras and VIMS have provided windows into the moon's ever-changing atmosphere, chronicling the appearance and movement of hazes and clouds over the years. A large, bright and feathery band of summer clouds can be seen arcing across high northern latitudes in the view at right. These views were obtained with the Cassini spacecraft narrow-angle camera on March 21, 2017. Images taken using red, green and blue spectral filters were combined to create the natural-color view at left. The false-color view at right was made by substituting an infrared image (centered at 938 nanometers) for the red color channel. The views were acquired at a distance of approximately 613,000 miles (986,000 kilometers) from Titan. Image scale is about 4 miles (6 kilometers) per pixel. https://photojournal.jpl.nasa.gov/catalog/PIA21624
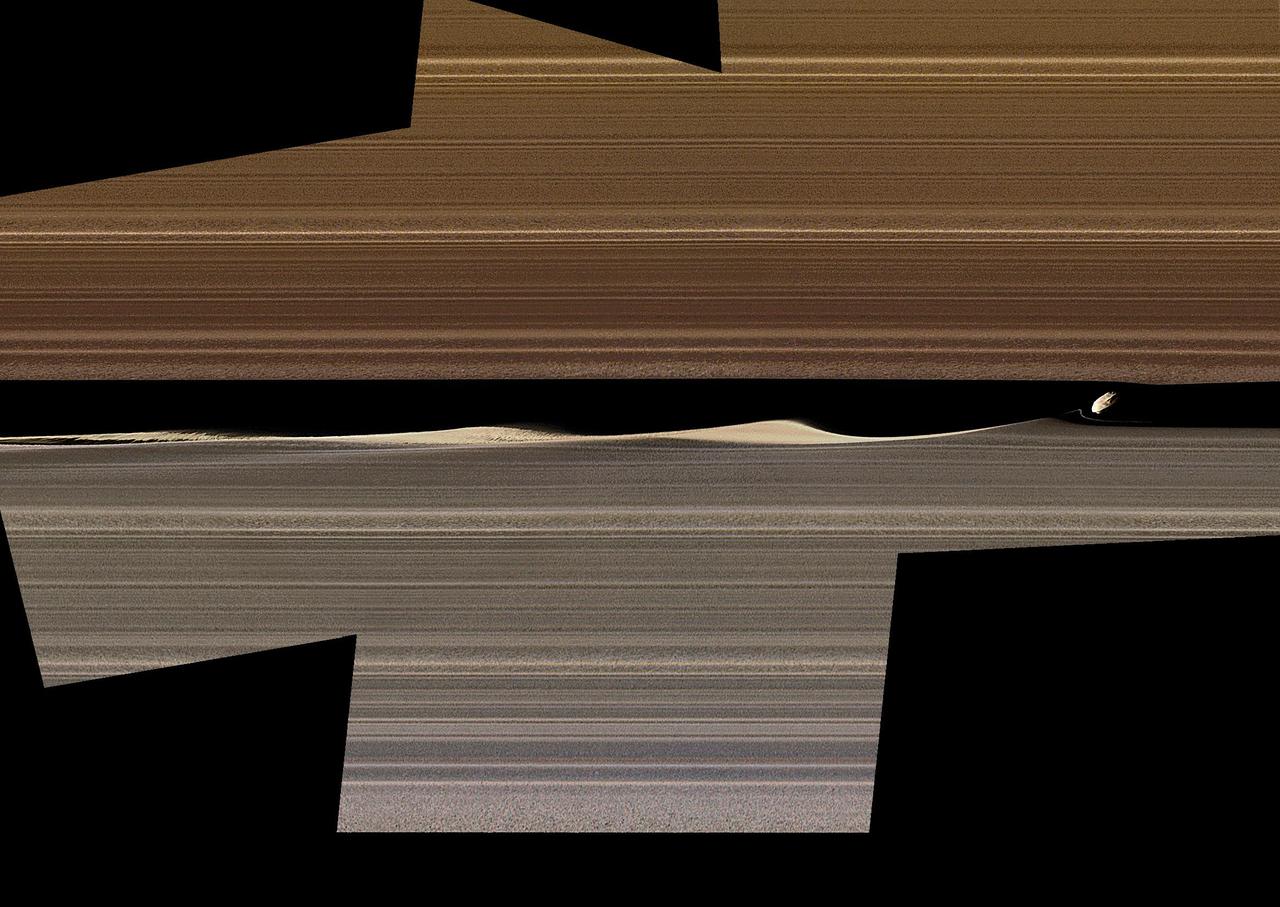
This enhanced-color image mosaic shows Daphnis, one of the moons embedded in Saturn's rings, in the Keeler gap on the sunlit side of the rings. Daphnis is seen kicking up three waves in the gap's outer edge. Three wave crests of diminishing sizes trail the moon. In each successive crest, the shape of the wave changes as the ring particles within the crest interact and collide with each other. A thin strand of ring material to the lower left of Daphnis is newly visible in this image, and there are intricate features that also hadn't been previously observed in the third wave crest downstream (see Figure 1). Cassini was at a very shallow angle above the rings (only about 15 degrees) when this image was taken. The resulting foreshortening makes it difficult to tell the difference in this image between features representing vertical structure and those representing radial, or outward from Saturn, structure within the ring plane. Nonetheless, Cassini imaging scientists have determined that the waves in the gap are largely vertical; compare this to the shadows that they were seen to cast during equinox (see PIA11547, PIA11653, PIA11655 and PIA11656). The thin strand of material is also probably vertical. Daphnis itself is actually five times smaller than the width of the gap, but it looks bigger here because of the foreshortening. The color in this image comes from using Imaging Science Subsystem images obtained by applying different filters to "paint" color onto the black-and-white version of this view previously released as PIA17212. The color of the ring region outward of the Keeler Gap (the "trans-Keeler region," in the lower portion of this image) is noticeably different from the color inward from the gap (upper portion of this image). In visible light, this color difference sharply coincides with the gap, while near-infrared Visible and Infrared Mapping Spectrometer (VIMS) images show some bleeding of the trans-Keeler region into the region inward from the gap. The reasons for the sharp change in color are mysterious, but they probably have more to do with a change in particle sizes and other properties than with a change in composition. The images in this mosaic were taken in visible light, using the Cassini spacecraft narrow-angle camera at a distance of approximately 17,000 miles (28,000 kilometers) from Daphnis and at a Sun-Daphnis-spacecraft angle, or phase angle, of 71 degrees (for the color images, 58 degrees). Image scale is 550 feet (170 meters) per pixel. The image was produced by Tilmann Denk at Freie Universität in Berlin. https://photojournal.jpl.nasa.gov/catalog/PIA23167