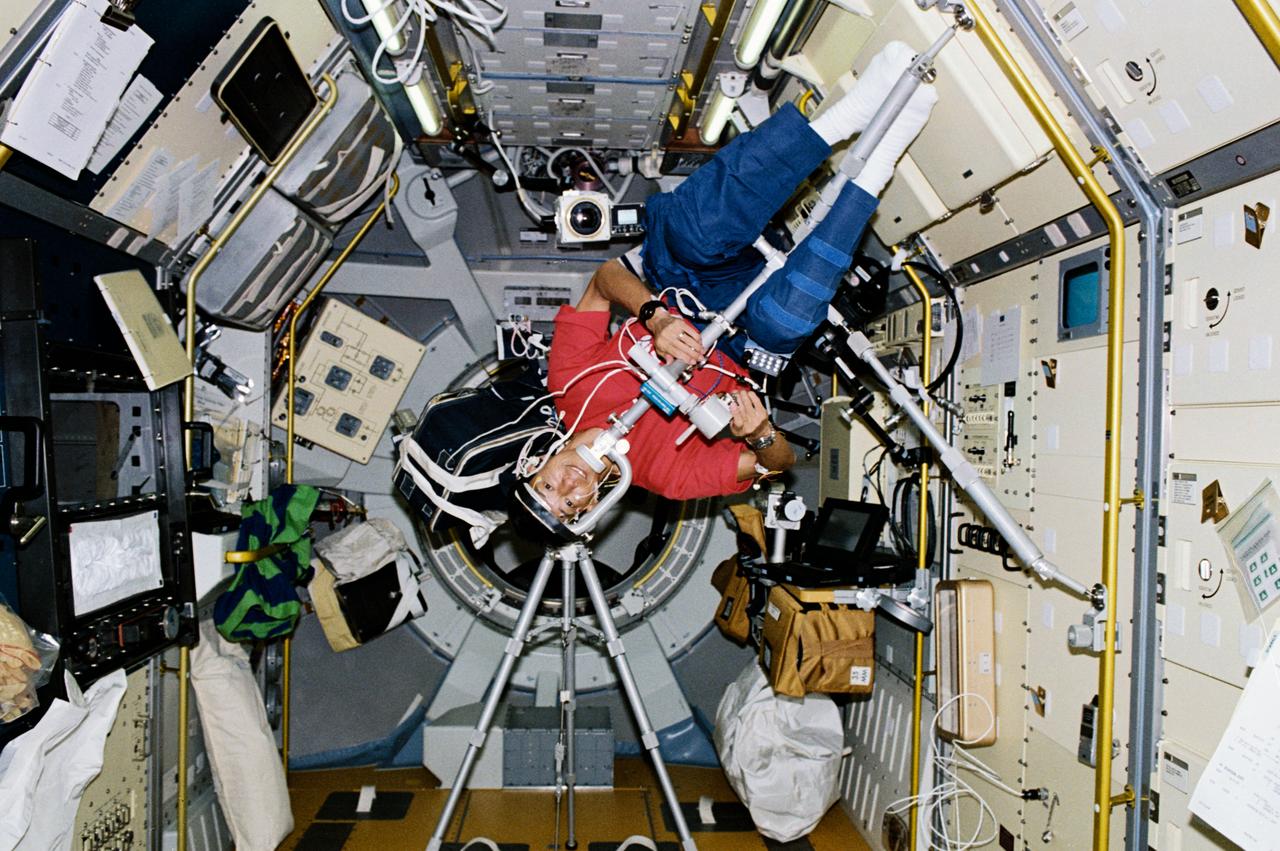
STS047-204-006 (12 - 20 Sept 1992) --- Dr. Mamoru Mohri, payload specialist representing Japan's National Space Development Agency (NASDA), participates in an experiment designed to learn more about Space Adaptation Syndrome (SAS). The experiment is titled, "Comparative Measurement of Visual Stability in Earth and Cosmic Space." During the experiment, Dr. Mohri tracked a flickering light target while eye movements and neck muscle tension were measured. This 45-degree angle position was one of four studied during the eight-day Spacelab-J mission.
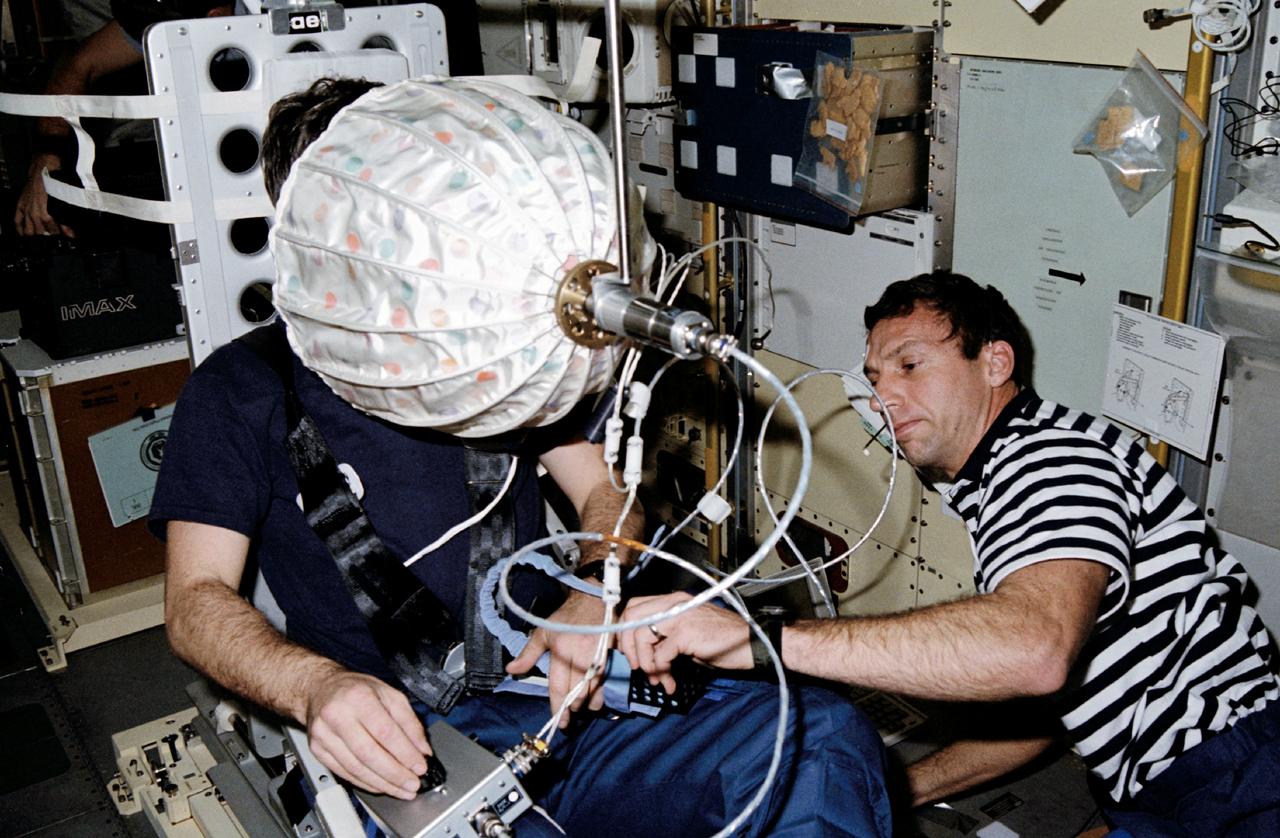
STS042-203-024 (22-30 Jan. 1992) --- Astronaut David C. Hilmers (right), STS-42 mission specialist, assists European Space Agency (ESA) payload specialist Ulf Merbold with the visual stimulator experiment on the Space Shuttle Discovery's middeck. This particular test is part of an ongoing study of the Space Adaptation Syndrome (SAS). Seated in a stationary mini-sled, Merbold (or any other subject for this test) stares at an umbrella-shaped rotating dome with a pattern of colored dots on its interior. While observing the rotating dome, the subject turns a knob to indicate his perception of body rotation. The strength of circular vection is calculated by comparing the signals from the dome and the knob. The greater the false sense of circular vection, the more the subject is relying on visual information instead of otolith information.
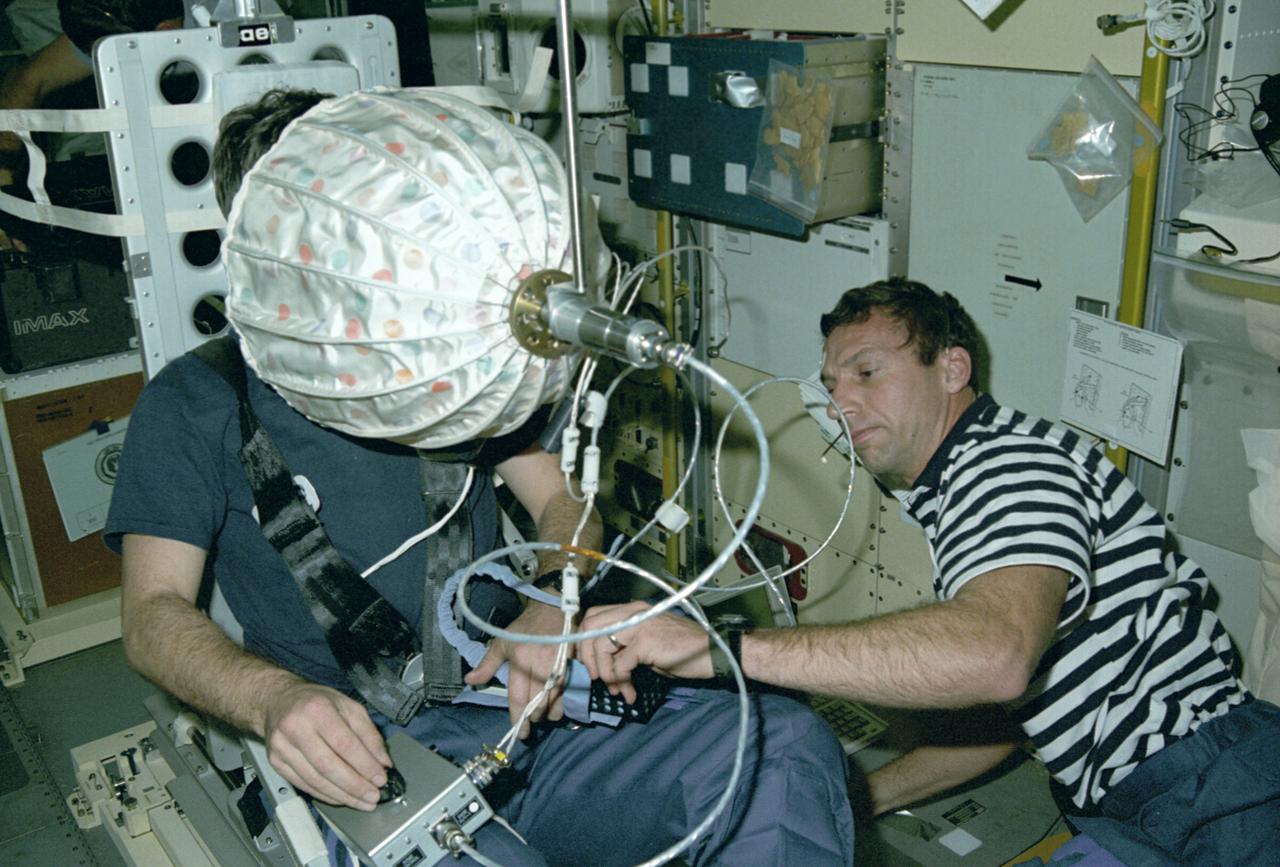
Astronaut Ulf Merbold on the stationary seat of the mini-sled, stares into an umbrella-shaped rotating dome with colored dots. Astronaut Merbold, assisted by astronaut David Hilmer, are conducting the Visual Simulator Experiment, a space physiology experiment. The Visual Stimulator Experiment measures the relative importance of visual and vestibular information in determining body orientation. When a person looks at a rotating visual field, a false sensation of self-rotation, called circularvection, results. In weightlessness, circularvection should increase immediately and may continue to increase as the nervous system comes to rely more on visual than vestibular cues. As Astronaut Merbold stares into the rotating dome with a pattern of colored dots and its interior, he turns a knob to indicate his perception of body rotation. The strength of circularvection is calculated by comparing signals from the dome and the knob. The greater the false sense of circularvection, the more the subject is relying on visual information instead of otolith information. The IML-1 mission was the first in a series of Shuttle flights dedicated to fundamental materials and life sciences research with the international partners. The participating space agencies included: NASA, the 14-nation European Space Agency (ESA), the Canadian Space Agency (CSA), the French National Center of Space Studies (CNES), the German Space Agency and the German Aerospace Research Establishment (DAR/DLR), and the National Space Development Agency of Japan (NASDA). Managed by the Marshall Space Flight Center, IML-1 was launched on January 22, 1992 aboard the Space Shuttle Orbiter Discovery (STS-42 mission).
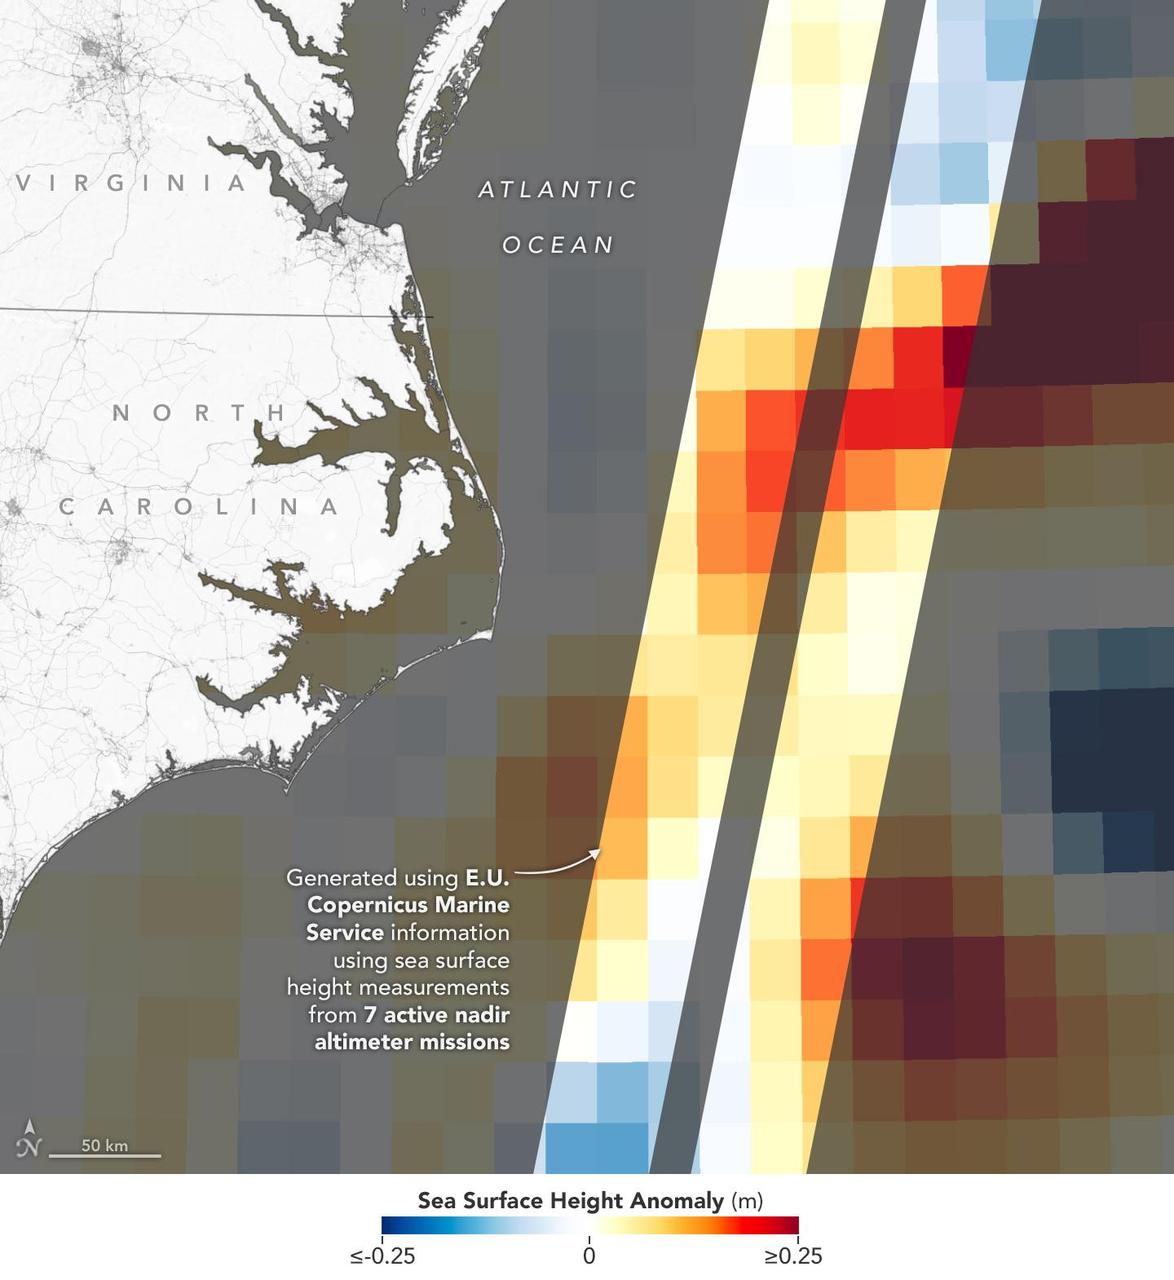
This visualization shows sea surface height measurements of the Gulf Stream off the coast of North Carolina and Virginia. The data was collected on Jan. 21, 2023, by seven satellites currently in operation. The information, provided by the Copernicus Marine Service of ESA (European Space Agency), comes from radar instruments called Earth-facing altimeters. In the visualization, red and orange areas represent sea levels that are higher than the global average, while shades of blue represent sea levels that are lower than average. An altimeter – widely used to measure sea level from space – works by bouncing radar signals off the ocean's surface directly beneath the instrument. It records both the time the signal takes to travel from a satellite to Earth and back, as well as the strength of the return signal. The spatial resolution offered by these instruments – shown in the composite image that's been modified so that different sea levels appear as different colors – is in contrast to the spatial resolution offered by a new instrument called the Ka-band Radar Interferometer (KaRIn), which is 10 times greater. KaRIn launched on board the Surface Water and Ocean Topography (SWOT) satellite on Dec. 16, 2022. SWOT is now in a six-month period called commissioning, calibration and validation. This is when engineers on the mission check out the performance of the satellite's systems and science instruments before the planned start of science operations in July 2023. Led by NASA and the French space agency Centre National d'Études Spatiales (CNES), SWOT will measure the height of water on over 90% of Earth's surface, providing a high-definition survey of our planet's water for the first time. The satellite's measurements of freshwater bodies and the ocean will provide insights into how the ocean influences climate change; how a warming world affects lakes, rivers, and reservoirs; and how communities can better prepare for floods and other disasters. https://photojournal.jpl.nasa.gov/catalog/PIA25773
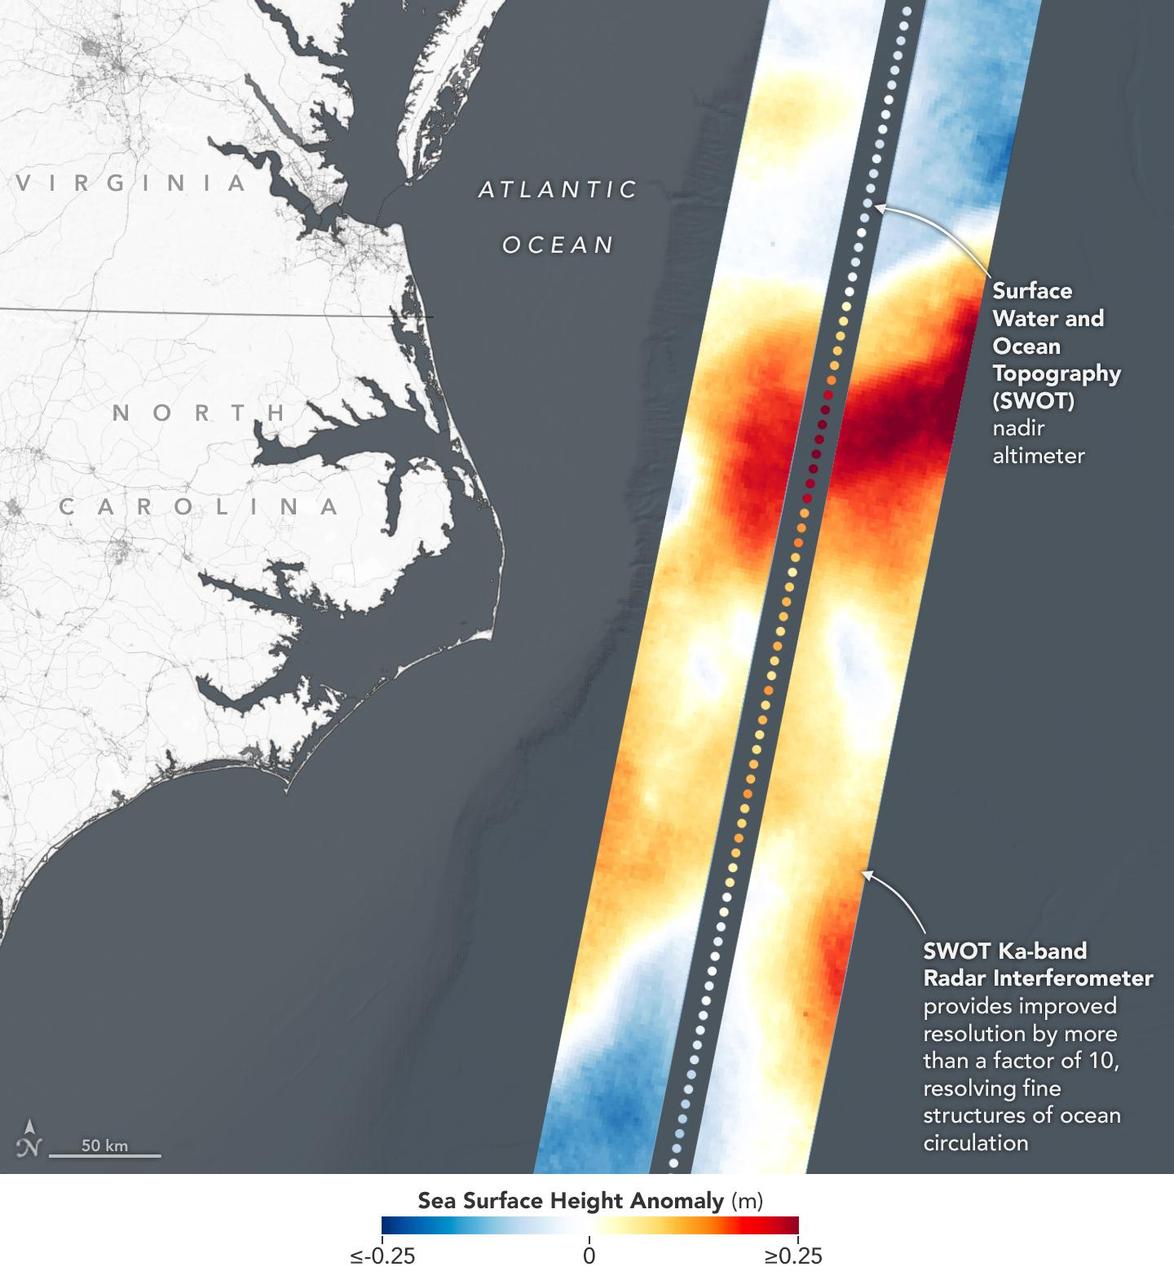
This visualization shows sea surface height measurements in the Gulf Stream off the coast of North Carolina and Virginia. The data was collected on Jan. 21, 2023, by an instrument on the Surface Water and Ocean Topography (SWOT) satellite called the Ka-band Radar Interferometer (KaRIn). KaRIn's two antennas acquired data that was mapped as two wide, colored strips spanning a total of 75 miles (120 kilometers) across. In the visualization, red and orange areas represent sea levels that are higher than the global average, while shades of blue represent sea levels that are lower than average. The spatial resolution of SWOT ocean measurements is 10 times greater than the composite of sea surface height data gathered over the same area by seven other satellites that same day. KaRIn is the scientific heart of the SWOT mission. It's a radar instrument with one antenna at each end of a boom that's 33 feet (10 meters) long. This enables KaRIn to look off to either side of a center line directly below the satellite as the instrument bounces microwave signals off of Earth's surface. The returning radar signals arrive at each antenna slightly out of step, or phase, from one another. When these signals are combined with other information about the antennas and the satellite's altitude, scientists will be able to map the height of water on Earth's surface with never-before-seen clarity. Led by NASA and the French space agency Centre National d'Études Spatiales (CNES), SWOT will measure the height of water on over 90% of Earth's surface, providing a high-definition survey of our planet's water for the first time. The satellite's measurements of freshwater bodies and the ocean will provide insights into how the ocean influences climate change; how a warming world affects lakes, rivers, and reservoirs; and how communities can better prepare for disasters like floods. Launched on Dec. 16, 2022, from Vandenberg Space Force Base in central California, SWOT is now in a six-month period called commissioning, calibration and validation. This is when engineers on the mission check out the satellite's systems and science instruments to ensure data accuracy before the start of science operations in July. https://photojournal.jpl.nasa.gov/catalog/PIA25772
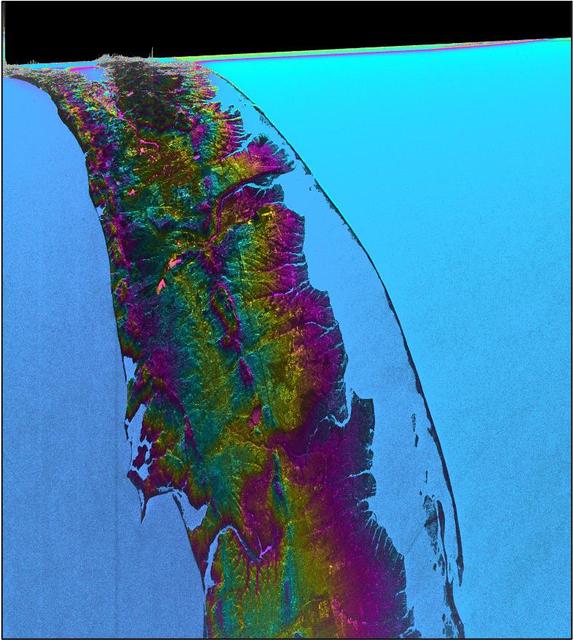
This visualization shows water features on New York's Long Island – shown as bright pink splotches nestled within the landscape. Purple, yellow, green, and dark blue shades represent different land elevations, while the surrounding ocean is a lighter blue. The data was collected on Jan. 21, 2023, by an instrument on the Surface Water and Ocean Topography (SWOT) satellite called the Ka-band Radar Interferometer (KaRIn). KaRIn is the scientific heart of the SWOT mission. It's a radar instrument with one antenna at each end of a boom that’s 33 feet (10 meters) long. This enables KaRIn to look off to either side of a center line directly below the satellite as the instrument bounces microwave signals off of Earth's surface. The returning radar signals arrive at each antenna slightly out of step, or phase, from one another. When these signals are combined with other information about the antennas and the satellite's altitude, scientists will be able to map the height of water on Earth's surface with never-before-seen clarity. This initial inland image is a tantalizing indication of how SWOT can measure details of smaller lakes, ponds, and rivers in ways that satellites could not before. Such data will be used to produce an extraordinary accounting of the freshwater on Earth's surface in ways useful to researchers, policymakers, and water resource managers. Led by NASA and the French space agency Centre National d'Études Spatiales (CNES), SWOT will measure the height of water on over 90% of Earth's surface, providing a high-definition survey of our planet's water for the first time. The satellite's measurements of freshwater bodies and the ocean will provide insights into how the ocean influences climate change; how a warming world affects lakes, rivers, and reservoirs; and how communities can better prepare for floods and other disasters. Launched on Dec. 16, 2022, from Vandenberg Space Force Base in central California, SWOT is now in a six-month period called commissioning, calibration and validation. This is when engineers on the mission check out the satellite's systems and science instruments to ensure data accuracy before the start of science operations in July. https://photojournal.jpl.nasa.gov/catalog/PIA25774
One concern about human adaptation to space is how returning from the microgravity of orbit to Earth can affect an astronaut's ability to fly safely. There are monitors and infrared video cameras to measure eye movements without having to affect the crew member. A computer screen provides moving images which the eye tracks while the brain determines what it is seeing. A video camera records movement of the subject's eyes. Researchers can then correlate perception and response. Test subjects perceive different images when a moving object is covered by a mask that is visible or invisible (above). Early results challenge the accepted theory that smooth pursuit -- the fluid eye movement that humans and primates have -- does not involve the higher brain. NASA results show that: Eye movement can predict human perceptual performance, smooth pursuit and saccadic (quick or ballistic) movement share some signal pathways, and common factors can make both smooth pursuit and visual perception produce errors in motor responses.
New Moon. By the modern definition, New Moon occurs when the Moon and Sun are at the same geocentric ecliptic longitude. The part of the Moon facing us is completely in shadow then. Pictured here is the traditional New Moon, the earliest visible waxing crescent, which signals the start of a new month in many lunar and lunisolar calendars. NASA's Lunar Reconnaissance Orbiter (LRO) has been in orbit around the Moon since the summer of 2009. Its laser altimeter (LOLA) and camera (LROC) are recording the rugged, airless lunar terrain in exceptional detail, making it possible to visualize the Moon with unprecedented fidelity. This is especially evident in the long shadows cast near the terminator, or day-night line. The pummeled, craggy landscape thrown into high relief at the terminator would be impossible to recreate in the computer without global terrain maps like those from LRO. To download, learn more about this visualization, or to see what the Moon will look like at any hour in 2015, visit <a href="http://svs.gsfc.nasa.gov/goto?4236" rel="nofollow">svs.gsfc.nasa.gov/goto?4236</a> <b><a href="http://www.nasa.gov/audience/formedia/features/MP_Photo_Guidelines.html" rel="nofollow">NASA image use policy.</a></b> <b><a href="http://www.nasa.gov/centers/goddard/home/index.html" rel="nofollow">NASA Goddard Space Flight Center</a></b> enables NASA’s mission through four scientific endeavors: Earth Science, Heliophysics, Solar System Exploration, and Astrophysics. Goddard plays a leading role in NASA’s accomplishments by contributing compelling scientific knowledge to advance the Agency’s mission. <b>Follow us on <a href="http://twitter.com/NASAGoddardPix" rel="nofollow">Twitter</a></b> <b>Like us on <a href="http://www.facebook.com/pages/Greenbelt-MD/NASA-Goddard/395013845897?ref=tsd" rel="nofollow">Facebook</a></b> <b>Find us on <a href="http://instagram.com/nasagoddard?vm=grid" rel="nofollow">Instagram</a></b>
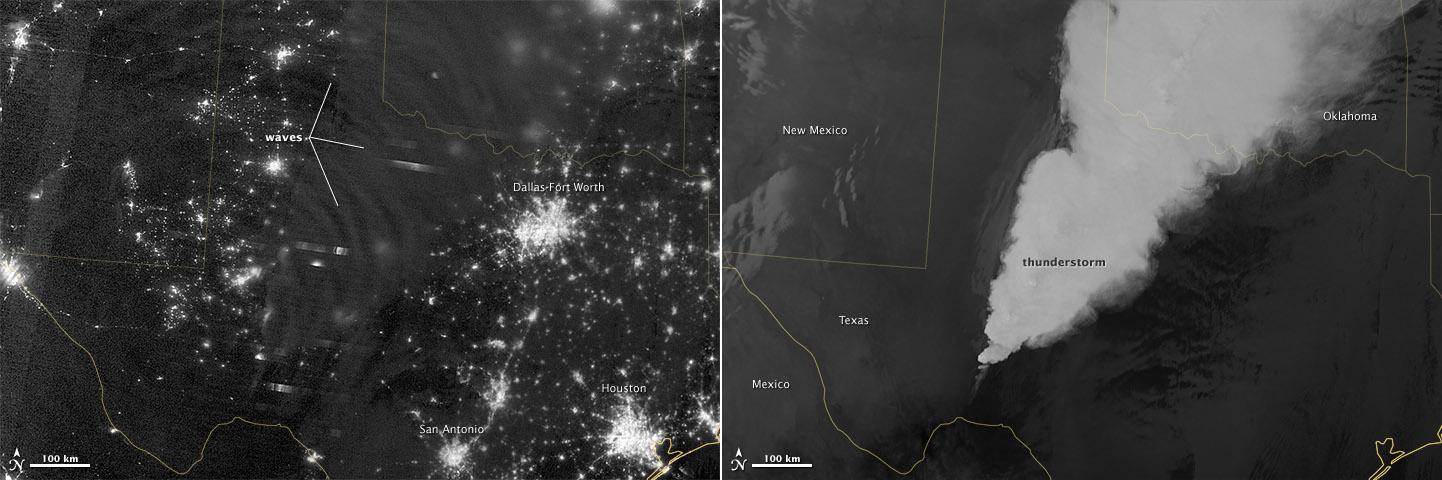
In April 2012, waves in Earth’s “airglow” spread across the nighttime skies of northern Texas like ripples in a pond. In this case, the waves were provoked by a massive thunderstorm. Airglow is a layer of nighttime light emissions caused by chemical reactions high in Earth’s atmosphere. A variety of reactions involving oxygen, sodium, ozone and nitrogen result in the production of a very faint amount of light. In fact, it’s approximately one billion times fainter than sunlight (~10-11 to 10-9 W·cm-2· sr-1). This chemiluminescence is similar to the chemical reactions that light up a glow stick or glow-in-the-dark silly putty. The “day-night band,” of the Visible Infrared Imaging Radiometer Suite (VIIRS) on the Suomi NPP satellite captured these glowing ripples in the night sky on April 15, 2012 (top image). The day-night band detects lights over a range of wavelengths from green to near-infrared and uses highly sensitive electronics to observe low light signals. (The absolute minimum signals detectable are at the levels of nightglow emission.) The lower image shows the thunderstorm as observed by a thermal infrared band on VIIRS. This thermal band, which is sensitive only to heat emissions (cold clouds appear white), is not sensitive to the subtle visible-light wave structures seen by the day-night band. Technically speaking, airglow occurs at all times. During the day it is called “dayglow,” at twilight “twilightglow,” and at night “nightglow.” There are slightly different processes taking place in each case, but in the image above the source of light is nightglow. The strongest nightglow emissions are mostly constrained to a relatively thin layer of atmosphere between 85 and 95 kilometers (53 and 60 miles) above the Earth’s surface. Little emission occurs below this layer since there’s a higher concentration of molecules, allowing for dissipation of chemical energy via collisions rather than light production. Likewise, little emission occurs above that layer because the atmospheric density is so tenuous that there are too few light-emitting reactions to yield an appreciable amount of light. Suomi NPP is in orbit around Earth at 834 kilometers (about 518 miles), well above the nightglow layer. The day-night band imagery therefore contains signals from the direction upward emission of the nightglow layer and the reflection of the downward nightglow emissions by clouds and the Earth’s surface. The presence of these nightglow waves is a graphic visualization of the usually unseen energy transfer processes that occur continuously between the lower and upper atmosphere. While nightglow is a well-known phenomenon, it’s not typically considered by Earth-viewing meteorological sensors. In fact, scientists were surprised at Suomi NPP’s ability to detect it. During the satellite’s check-out procedure, this unanticipated source of visible light was thought to indicate a problem with the sensor until scientists realized that what they were seeing was the faintest of light in the darkness of night. NASA Earth Observatory image by Jesse Allen and Robert Simmon, using VIIRS Day-Night Band data from the Suomi National Polar-orbiting Partnership. Suomi NPP is the result of a partnership between NASA, the National Oceanic and Atmospheric Administration, and the Department of Defense. Caption by Aries Keck and Steve Miller. Instrument: Suomi NPP - VIIRS Credit: <b><a href="http://www.earthobservatory.nasa.gov/" rel="nofollow"> NASA Earth Observatory</a></b> <b>Click here to view all of the <a href="http://earthobservatory.nasa.gov/Features/NightLights/" rel="nofollow"> Earth at Night 2012 images </a></b> <b>Click here to <a href="http://earthobservatory.nasa.gov/NaturalHazards/view.php?id=79817" rel="nofollow"> read more </a> about this image </b> <b><a href="http://www.nasa.gov/audience/formedia/features/MP_Photo_Guidelines.html" rel="nofollow">NASA image use policy.</a></b> <b><a href="http://www.nasa.gov/centers/goddard/home/index.html" rel="nofollow">NASA Goddard Space</a></b>
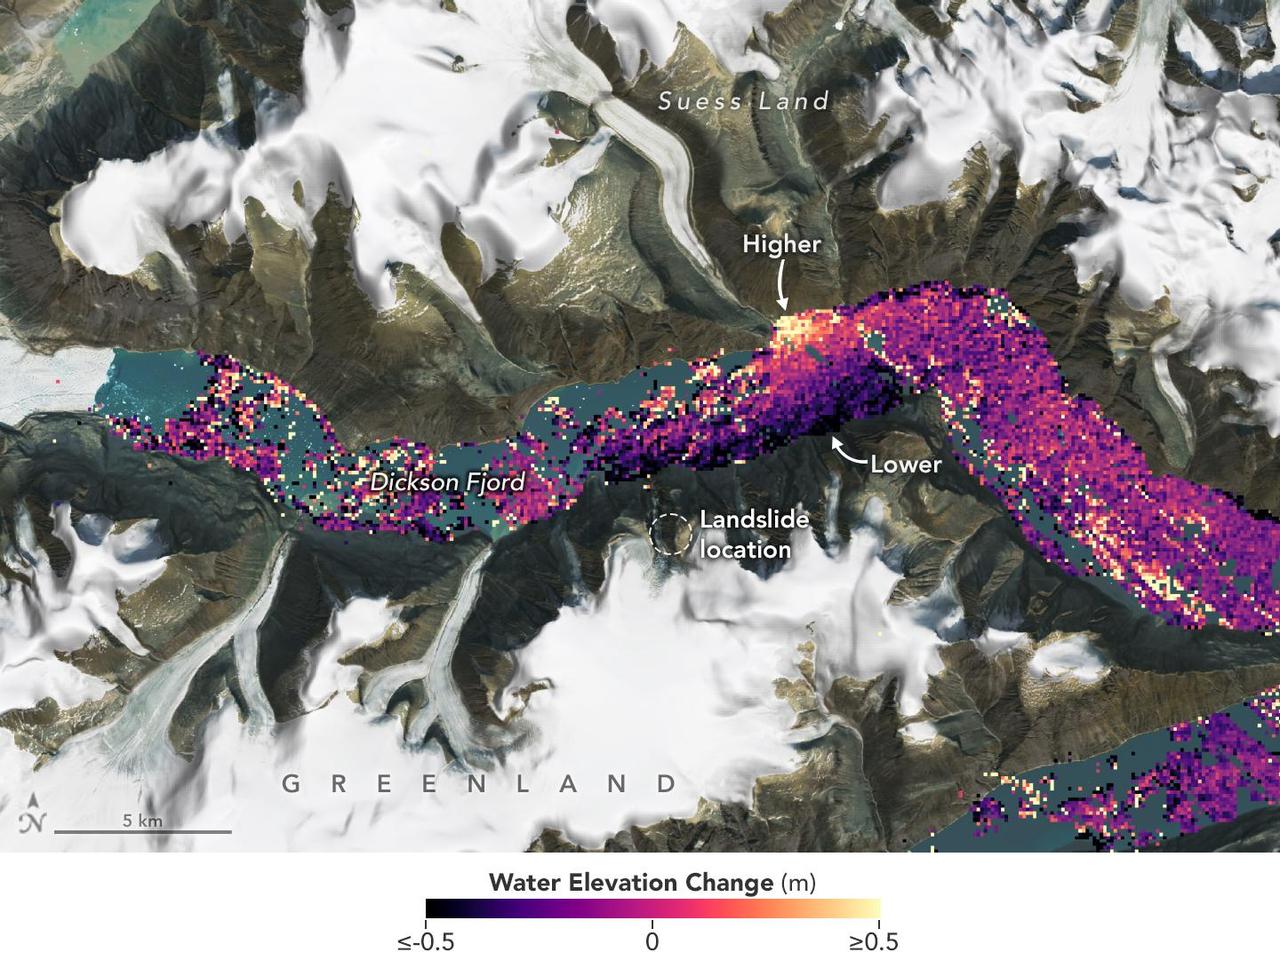
A visualization based on data from the international SWOT satellite mission shows the unique contours of a tsunami that sloshed within the steep walls of a fjord in Greenland in September 2023. Triggered by a massive landslide, the tsunami generated a seismic rumble that reverberated around the world for nine days. Short for Surface Water and Ocean Topography, SWOT collected water elevation measurements in the Dickson Fjord on Sept. 17, 2023, the day after the initial landslide and tsunami. The data was compared with measurements made under normal conditions a few weeks prior, on Aug. 6, 2023. Colors toward the lighter end of the scale indicate higher water levels, and darker colors indicate lower-than-normal levels. The data suggest that water levels at some points along the north side of the fjord were as much as 4 feet (1.2 meters) higher than on the south. In a September 2024 paper in Science, researchers traced a seismic signal back to the tsunami, which began when more than 880 million cubic feet of rock and ice (25 million cubic meters) fell into the Dickson Fjord. Part of a network of channels on Greenland's eastern coast, the fjord is about 1,772 feet (540 meters) deep and 1.7 miles (2.7 kilometers) wide, with walls taller than 6,000 feet (1,830 meters). Far from the open ocean, in a confined space, the energy of the tsunami's motion had limited opportunity to dissipate, so the wave moved back and forth about every 90 seconds for nine days. It caused tremors recorded on seismic instruments thousands of miles away. Launched in December 2022 from Vandenberg Space Force Base in central California, SWOT is now in its operations phase, collecting data that will be used for research and other purposes. https://photojournal.jpl.nasa.gov/catalog/PIA26420
New Moon. By the modern definition, New Moon occurs when the Moon and Sun are at the same geocentric ecliptic longitude. The part of the Moon facing us is completely in shadow then. Pictured here is the traditional New Moon, the earliest visible waxing crescent, which signals the start of a new month in many lunar and lunisolar calendars. This marks the first time that accurate shadows at this level of detail are possible in such a computer simulation. The shadows are based on the global elevation map being developed from measurements by the Lunar Orbiter Laser Altimeter (LOLA) aboard the Lunar Reconnaissance Orbiter (LRO). LOLA has already taken more than 10 times as many elevation measurements as all previous missions combined. The Moon always keeps the same face to us, but not exactly the same face. Because of the tilt and shape of its orbit, we see the Moon from slightly different angles over the course of a month. When a month is compressed into 12 seconds, as it is in this animation, our changing view of the Moon makes it look like it's wobbling. This wobble is called libration. The word comes from the Latin for "balance scale" (as does the name of the zodiac constellation Libra) and refers to the way such a scale tips up and down on alternating sides. The sub-Earth point gives the amount of libration in longitude and latitude. The sub-Earth point is also the apparent center of the Moon's disk and the location on the Moon where the Earth is directly overhead. The Moon is subject to other motions as well. It appears to roll back and forth around the sub-Earth point. The roll angle is given by the position angle of the axis, which is the angle of the Moon's north pole relative to celestial north. The Moon also approaches and recedes from us, appearing to grow and shrink. The two extremes, called perigee (near) and apogee (far), differ by more than 10%. The most noticed monthly variation in the Moon's appearance is the cycle of phases, caused by the changing angle of the Sun as the Moon orbits the Earth. The cycle begins with the waxing (growing) crescent Moon visible in the west just after sunset. By first quarter, the Moon is high in the sky at sunset and sets around midnight. The full Moon rises at sunset and is high in the sky at midnight. The third quarter Moon is often surprisingly conspicuous in the daylit western sky long after sunrise. Celestial north is up in these images, corresponding to the view from the northern hemisphere. The descriptions of the print resolution stills also assume a northern hemisphere orientation. To adjust for southern hemisphere views, rotate the images 180 degrees, and substitute "north" for "south" in the descriptions. Credit: <a href="http://svs.gsfc.nasa.gov/index.html" rel="nofollow">NASA/Goddard Space Flight Center Scientific Visualization Studio</a> <b><a href="http://www.nasa.gov/centers/goddard/home/index.html" rel="nofollow">NASA Goddard Space Flight Center</a></b> enables NASA’s mission through four scientific endeavors: Earth Science, Heliophysics, Solar System Exploration, and Astrophysics. Goddard plays a leading role in NASA’s accomplishments by contributing compelling scientific knowledge to advance the Agency’s mission. <b>Follow us on <a href="http://twitter.com/NASA_GoddardPix" rel="nofollow">Twitter</a></b> <b>Join us on <a href="http://www.facebook.com/pages/Greenbelt-MD/NASA-Goddard/395013845897?ref=tsd" rel="nofollow">Facebook</a></b> <b>Find us on <a href="http://web.stagram.com/n/nasagoddard/?vm=grid" rel="nofollow">Instagram</a></b>