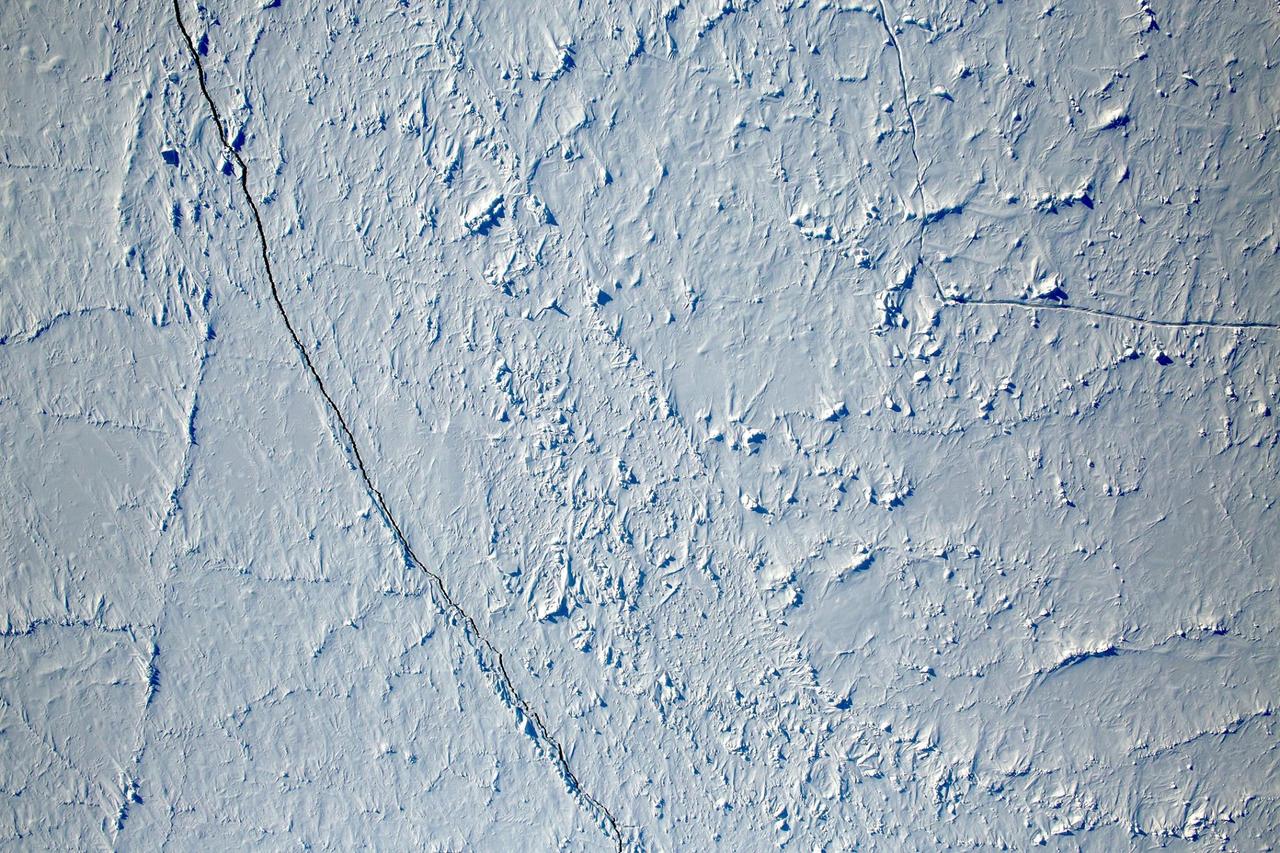
Want to know what the North Pole looked like yesterday afternoon? Well, our friends from NASA Operation IceBridge brought us this view from 500 meters about the North Pole. So what are you seeing? That's sea ice, with a few ridges and a bit of snow cover, and with a few small cracks, almost leads in the ice. Credit: NASA/Goddard/Operation IceBridge/Eric Fraim
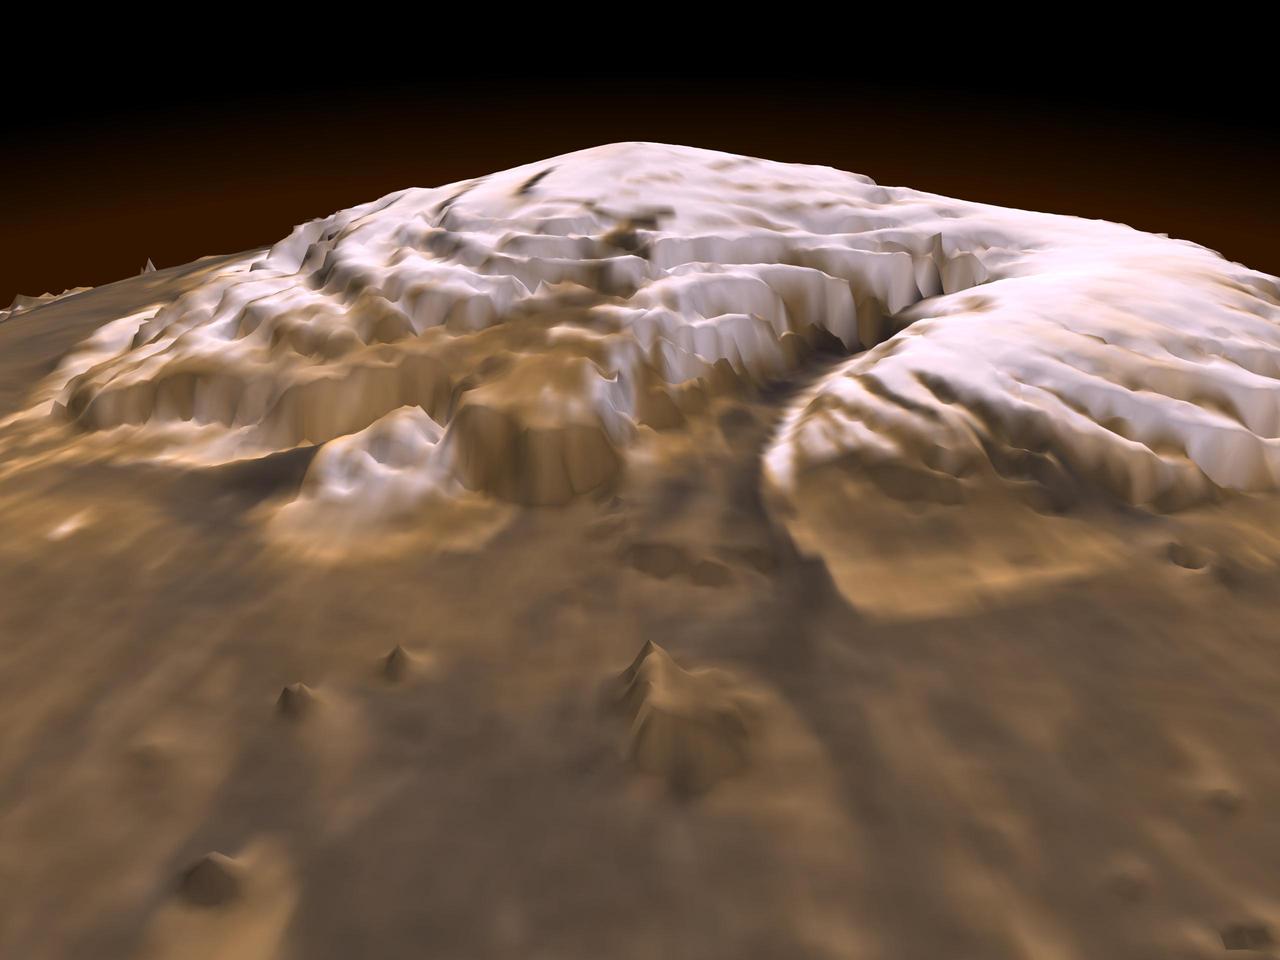
Laser Provides First 3-D View of Mars North Pole
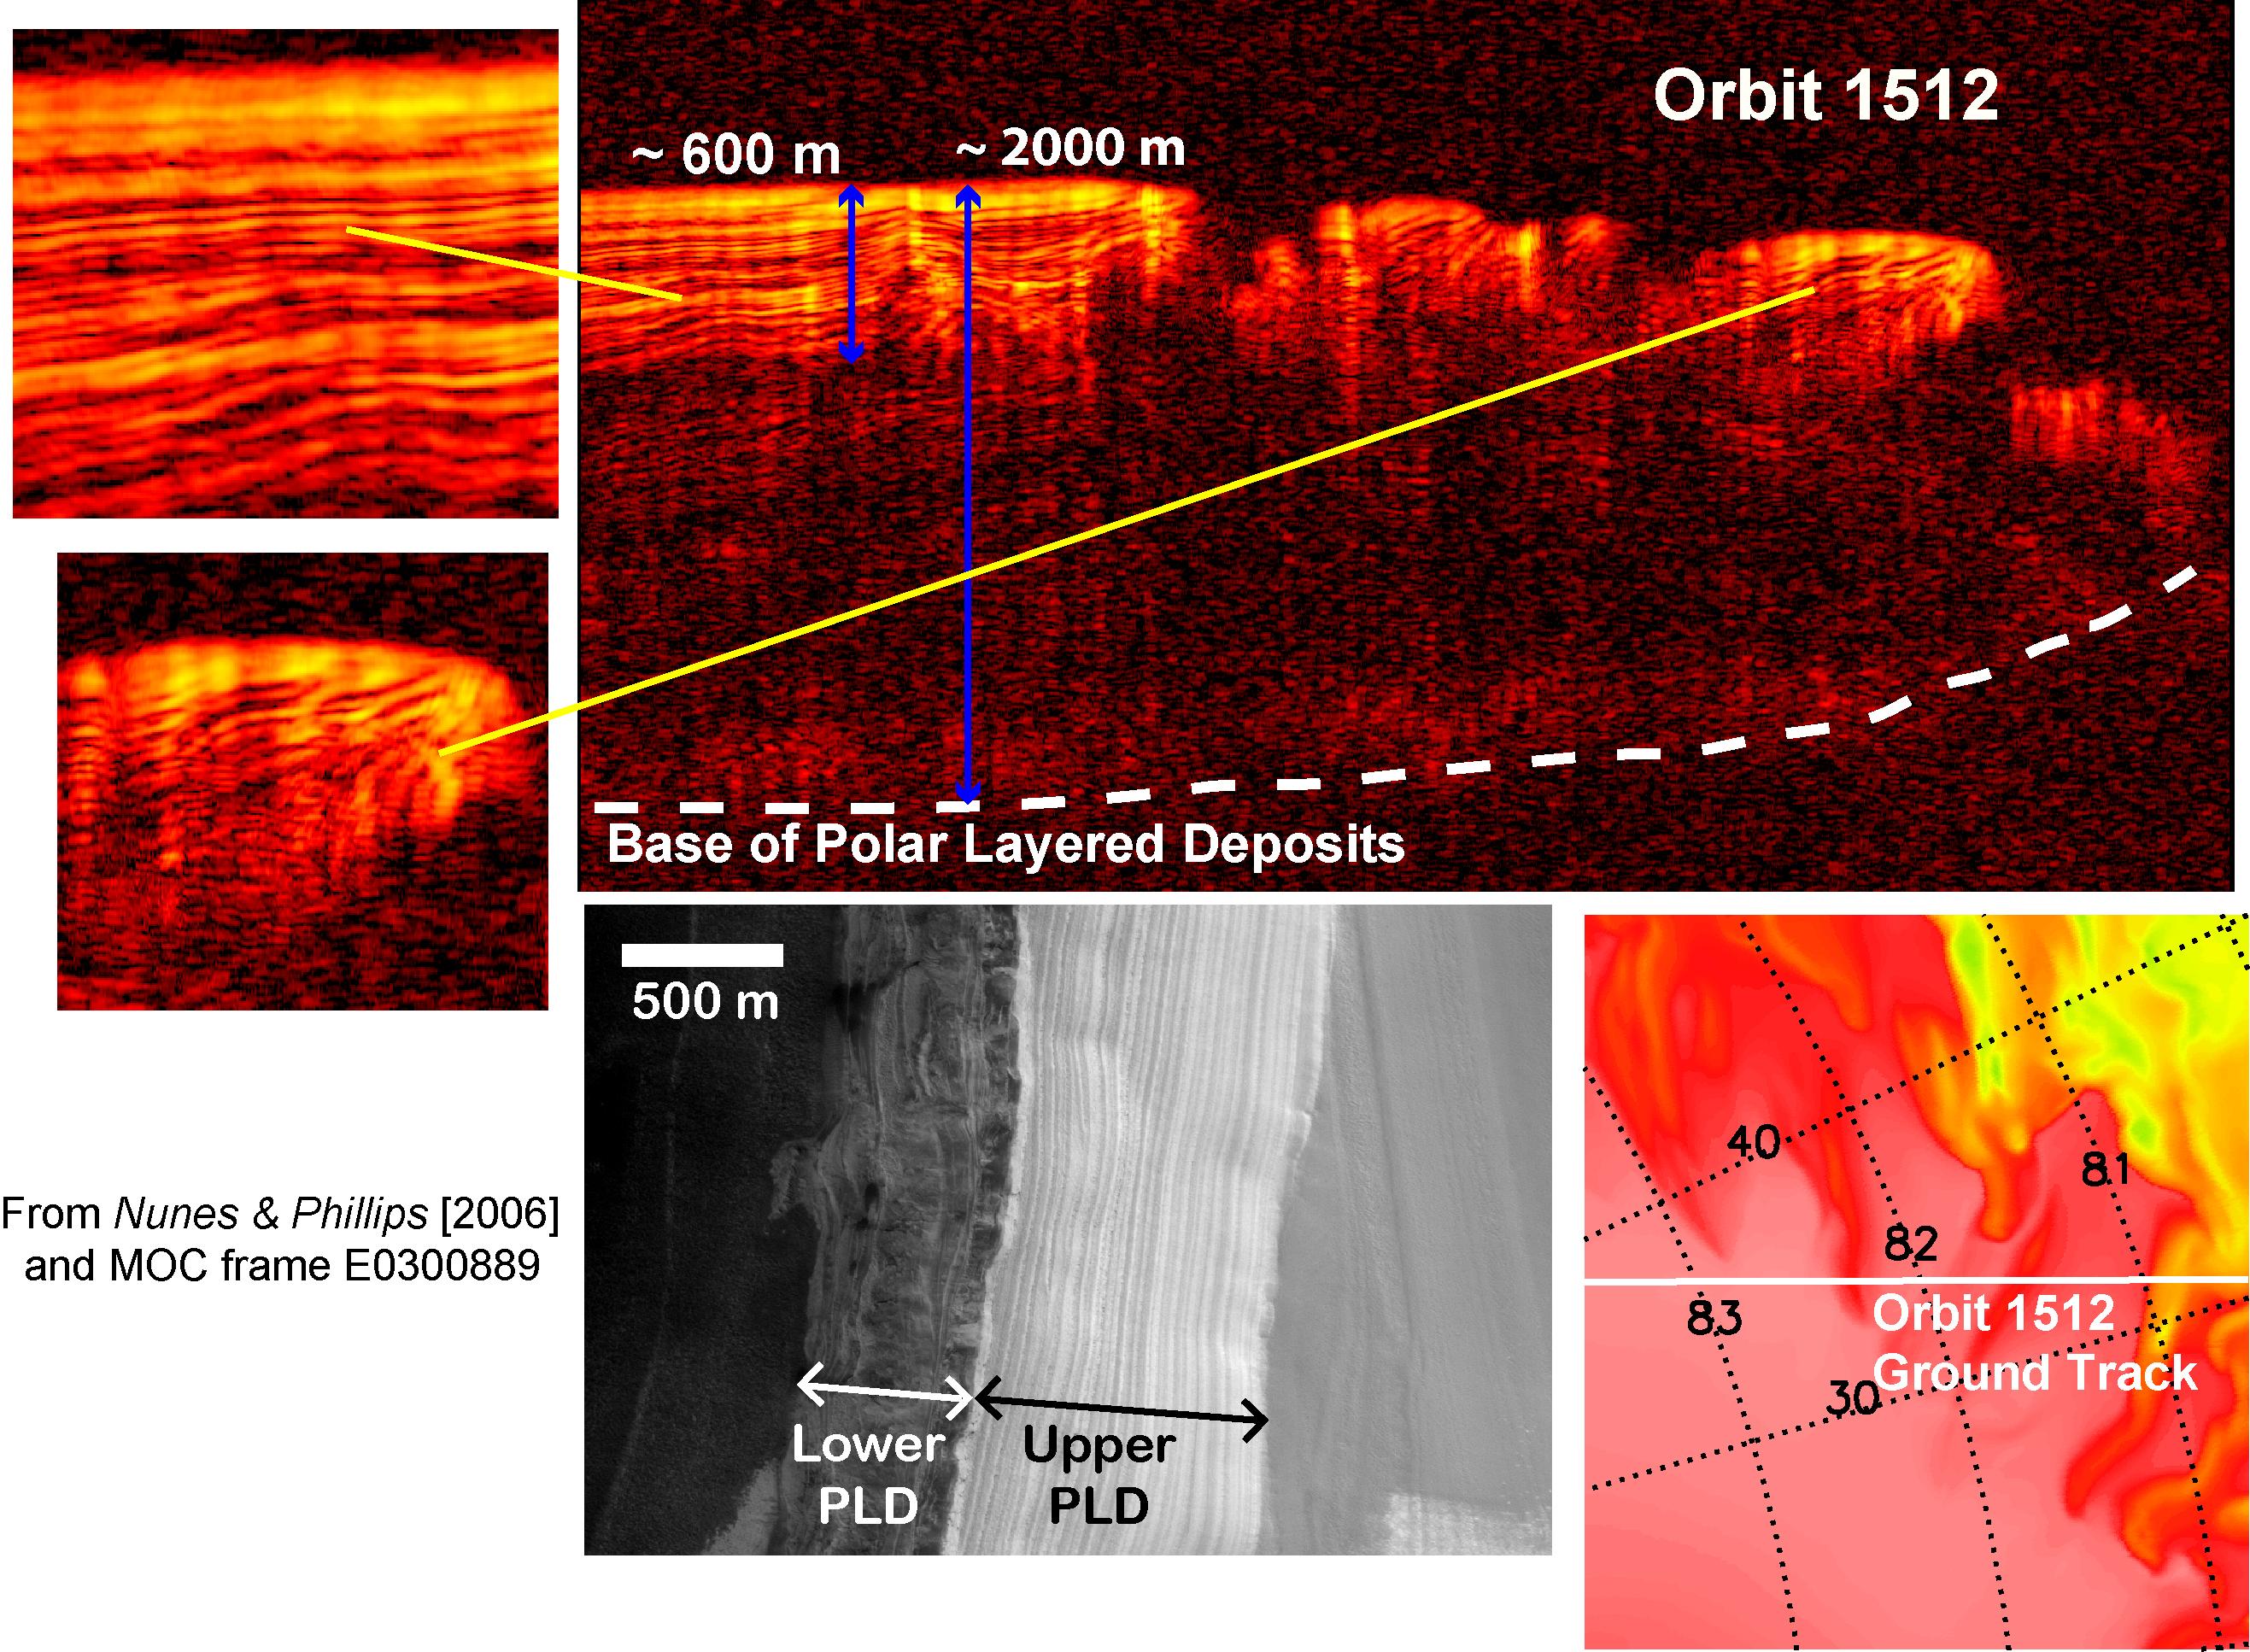
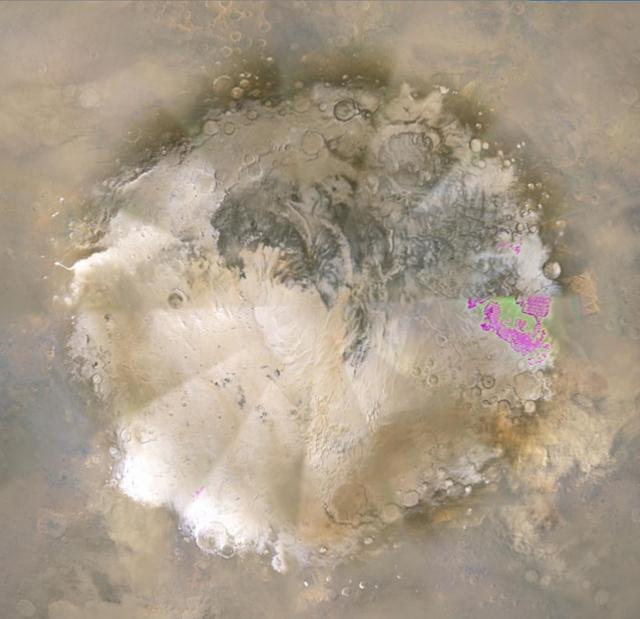
Interpreting Radar View near Mars North Pole, Orbit 1512
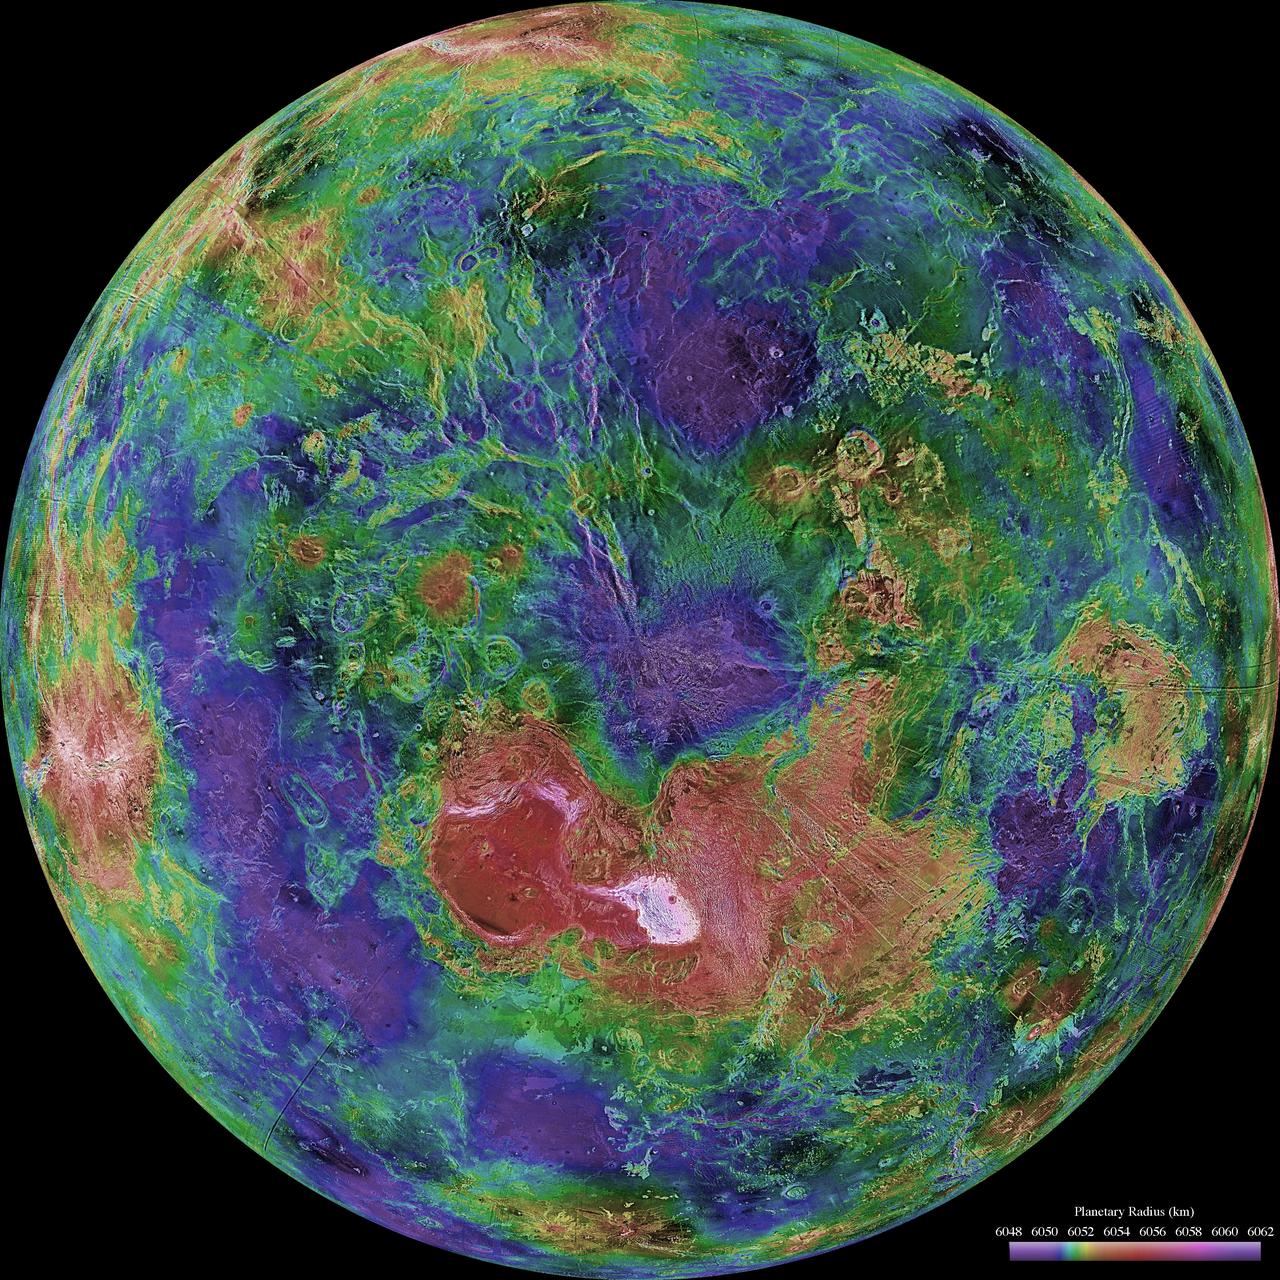
The hemispheric view of Venus, as revealed by more than a decade of radar investigations culminating in the 1990-1994 Magellan mission, is centered on the North Pole. The Magellan spacecraft imaged more than 98% of Venus at a resolution of about 100 meters; the effective resolution of this image is about 3 km. A mosaic of the Magellan images (most with illumination from the west) forms the image base. Gaps in the Magellan coverage were filled with images from the Earth-based Arecibo radar in a region centered roughly on 0 degree latitude and longitude, and with a neutral tone elsewhere (primarily near the south pole). The composite image was processed to improve contrast and to emphasize small features, and was color-coded to represent elevation. Gaps in the elevation data from the Magellan radar altimeter were filled with altimetry from the Venera spacecraft and the U.S. Pioneer Venus missions. An orthographic projection was used, simulating a distant view of one hemisphere of the planet. The Magellan mission was managed for NASA by Jet Propulsion Laboratory (JPL), Pasadena, CA. Data processed by JPL, the Massachusetts Institute of Technology, Cambridge, MA, and the U.S. Geological Survey, Flagstaff, AZ. http://photojournal.jpl.nasa.gov/catalog/PIA00007

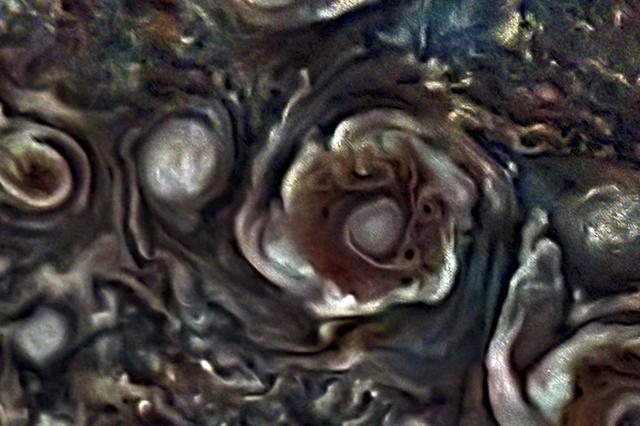
Storm systems and weather activity unlike anything encountered in the solar system are on view in these color images of Jupiter's north polar region from NASA's Juno spacecraft. Two versions of the image have been contrast-enhanced differently to bring out detail near the dark terminator and near the bright limb. The JunoCam instrument took the images to create this color view on August 27, when the spacecraft was about 48,000 miles (78,000 kilometers) above the polar cloud tops. A wavy boundary is visible halfway between the grayish region at left (closer to the pole and the nightside shadow) and the lighter-colored area on the right. The wavy appearance of the boundary represents a Rossby wave -- a north-south meandering of a predominantly east-west flow in an atmospheric jet. This may be caused by a difference in temperature between air to the north and south of this boundary, as is often the case with such waves in Earth's atmosphere. The polar region is filled with a variety of discrete atmospheric features. Some of these are ovals, but the larger and brighter features have a "pinwheel" shape reminiscent of the shape of terrestrial hurricanes. Tracking the motion and evolution of these features across multiple orbits will provide clues about the dynamics of the Jovian atmosphere. This image also provides the first example of cloud shadowing on Jupiter: near the top of the image, a high cloud feature is seen past the normal boundary between day and night, illuminated above the cloud deck below. While subtle color differences are visible in the image, some of these are likely the result of scattered light within the JunoCam optics. Work is ongoing to characterize these effects. http://photojournal.jpl.nasa.gov/catalog/PIA21031
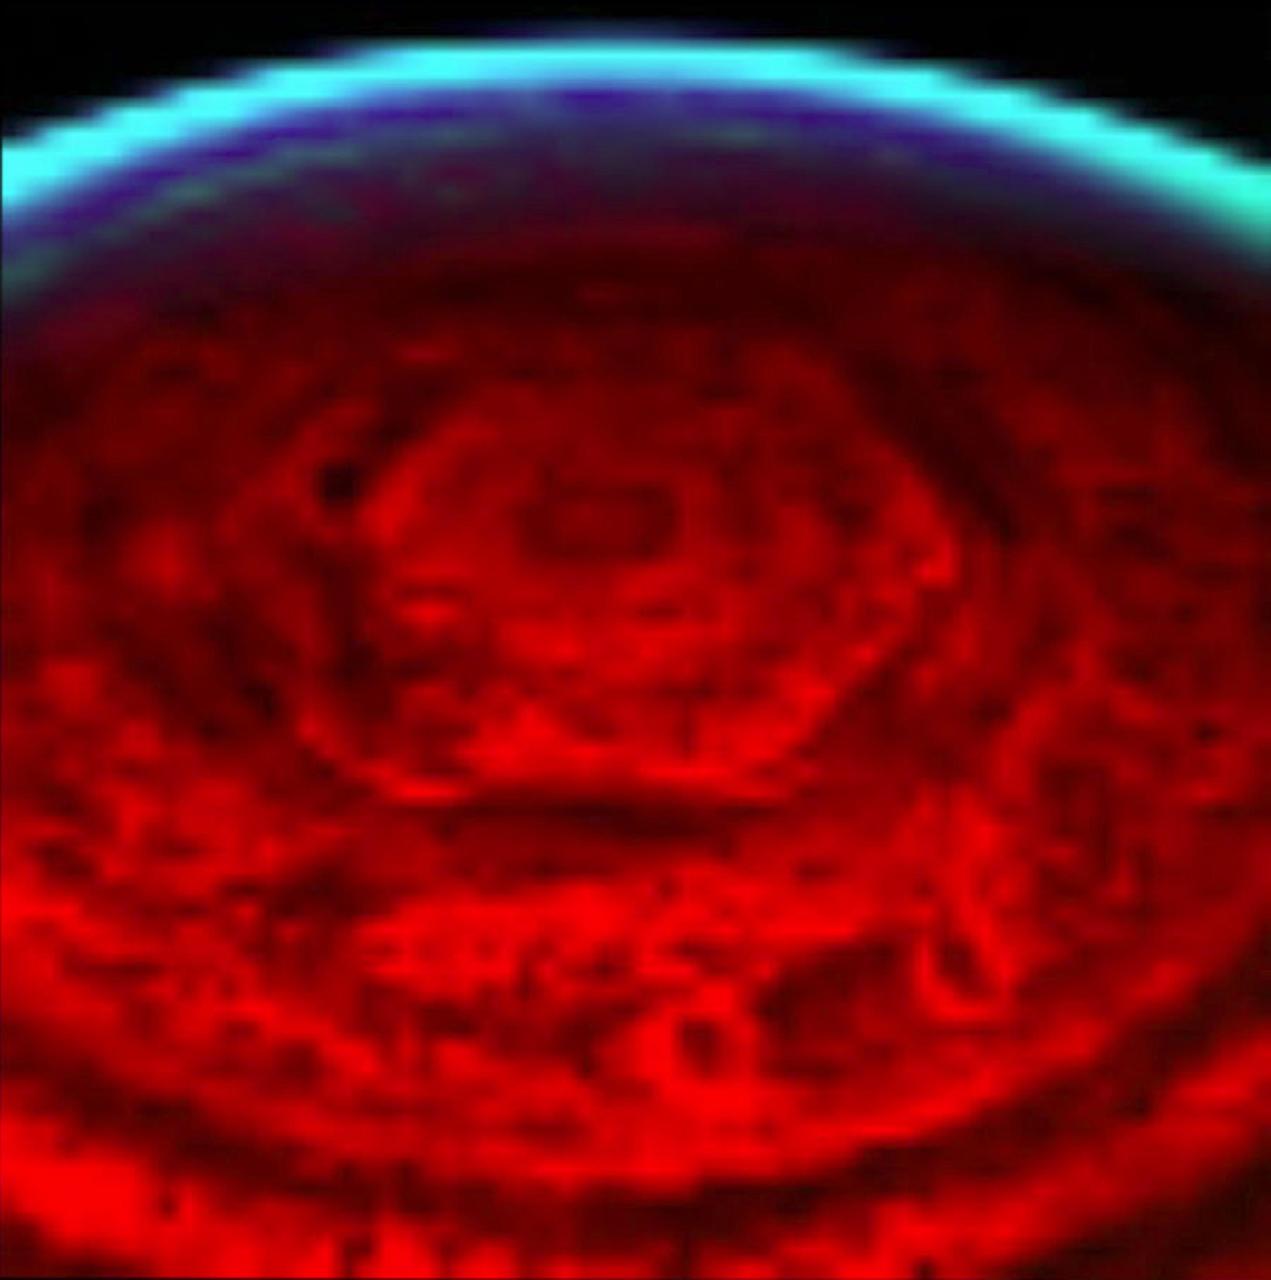
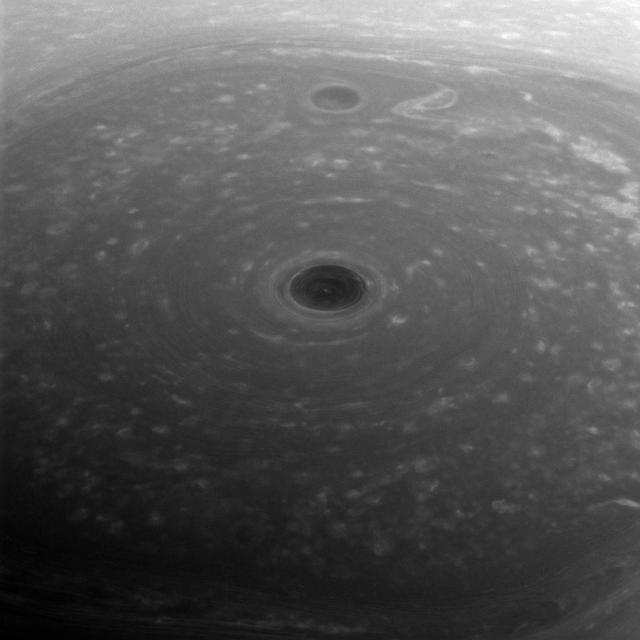
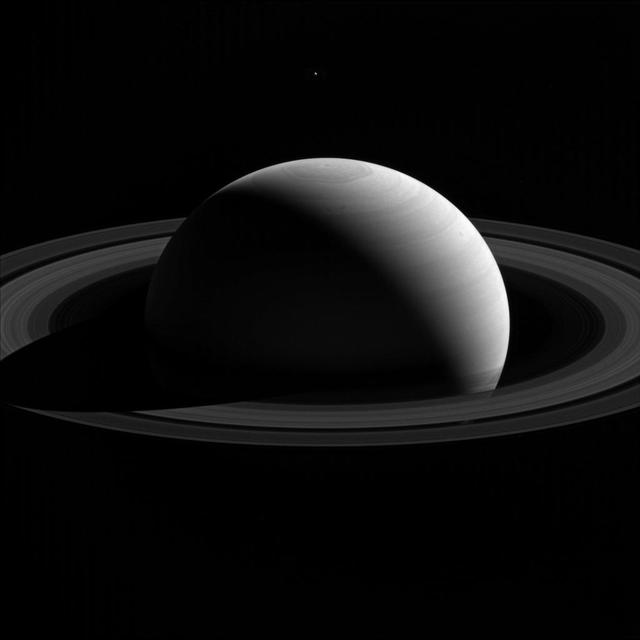
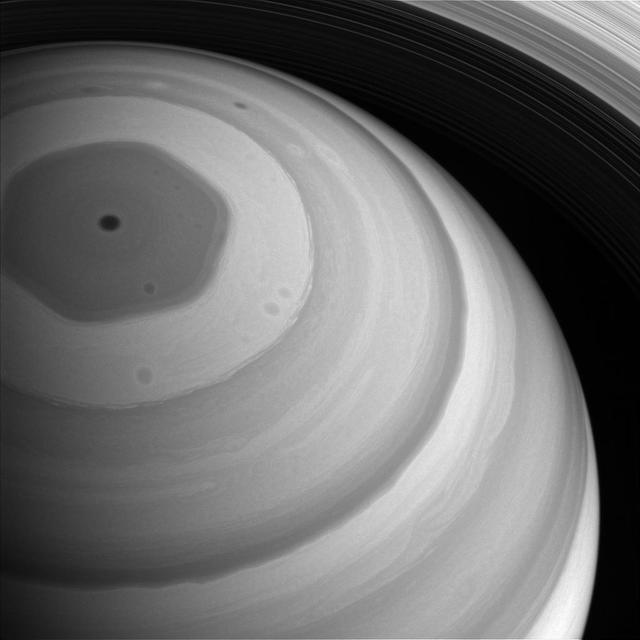
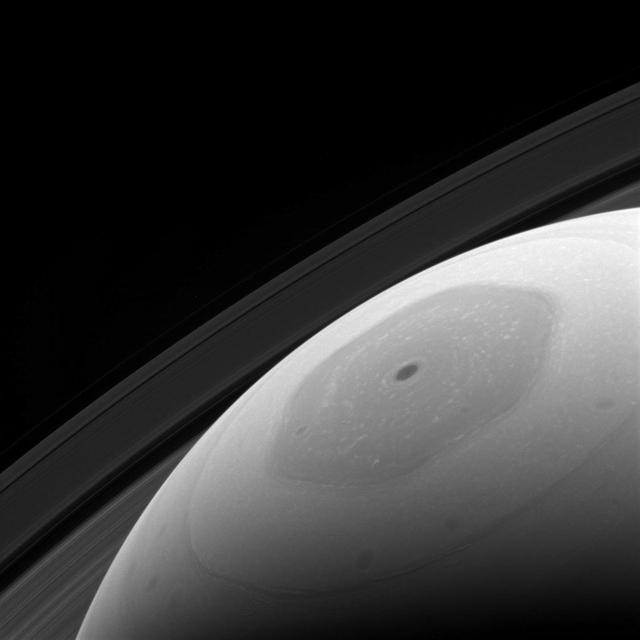
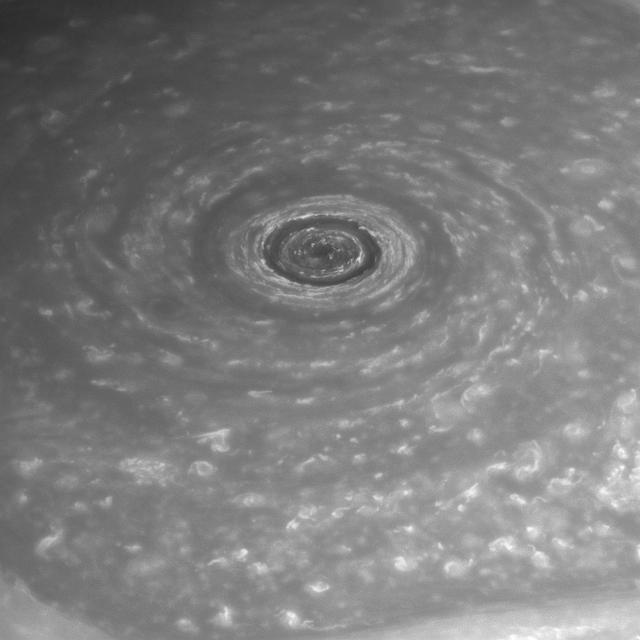
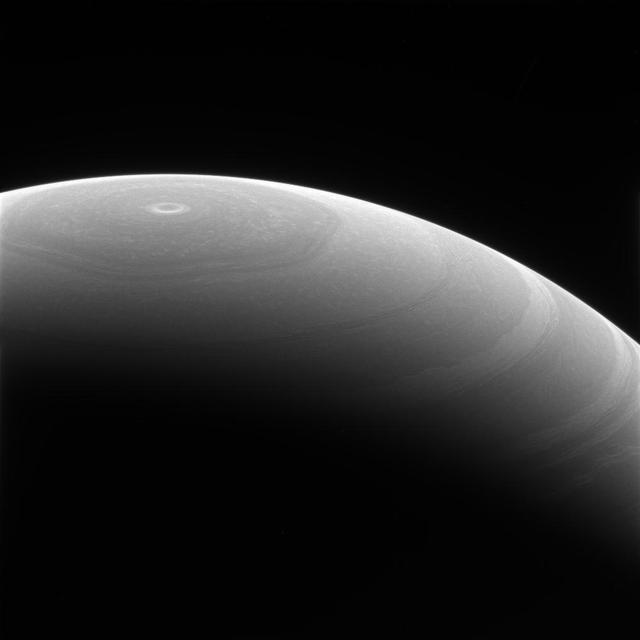
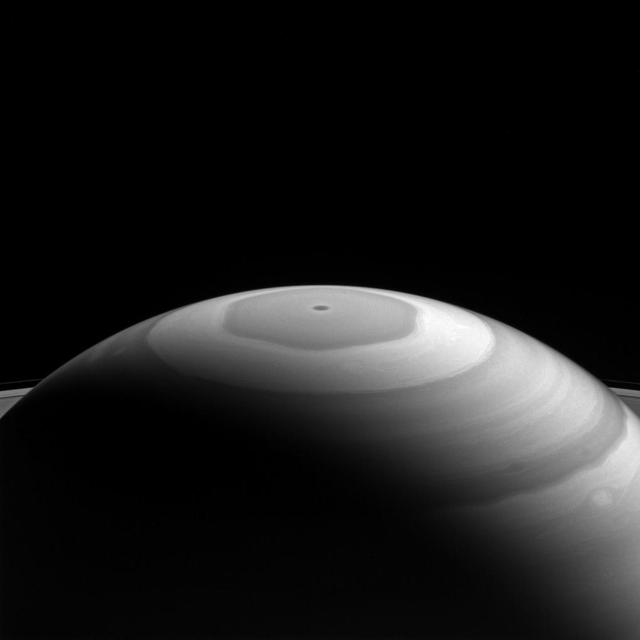
This nighttime view of Saturn north pole clearly shows a bizarre six-sided hexagon feature encircling the entire north pole. This is one of the first clear images taken of the north polar region ever acquired from a unique polar perspective
This nighttime view of Saturn north pole reveals a dynamic, active planet at least 75 kilometers 47 miles below the normal cloud tops seen in visible light. Clearly revealed is the bizarre six-sided hexagon feature present at the north pole
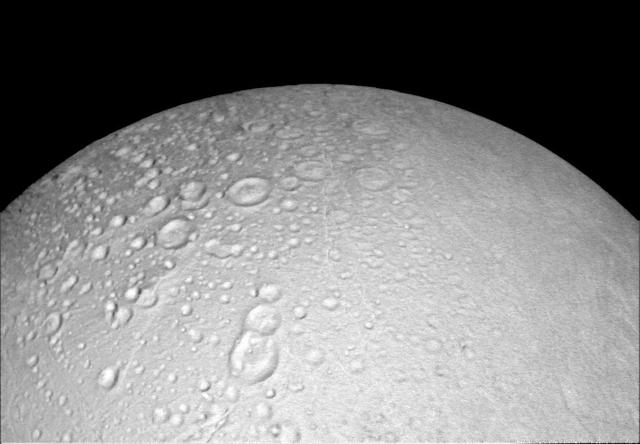
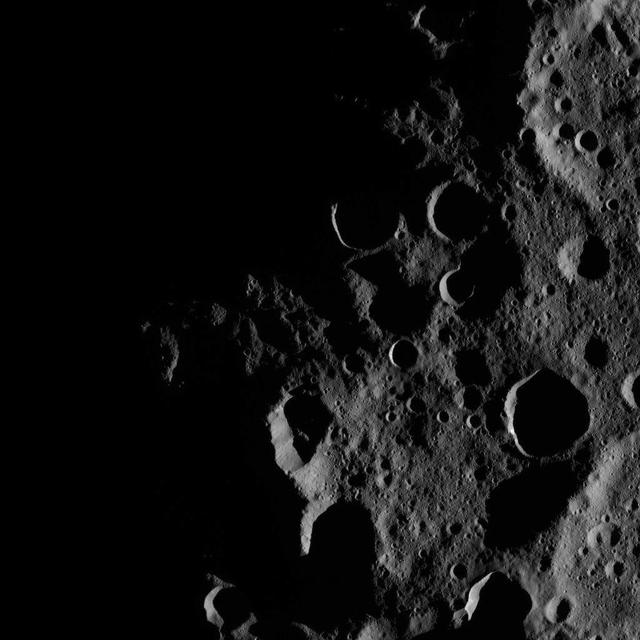
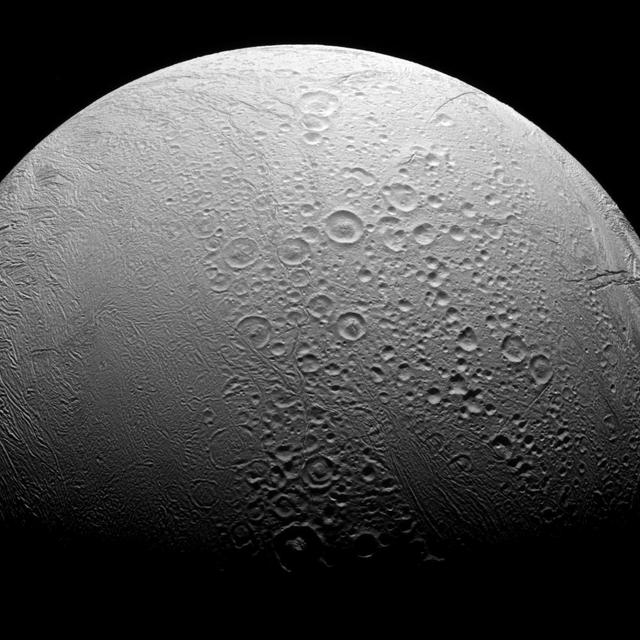
This view from NASA's Cassini spacecraft shows battered terrain around the north pole of Saturn's icy moon Enceladus. Craters crowd and overlap each other, each one recording an impact in the moon's distant past. The moon's north pole lies approximately at the top of this view from Cassini's wide-angle camera. A companion view from the narrow-angle camera (PIA19660) shows the pole at a resolution about ten times higher. North on Enceladus is up. The image was taken in visible light by Cassini on Oct. 14, 2015. The view was acquired at a distance of approximately 4,000 miles (6,000 kilometers) from Enceladus and at a Sun-Enceladus-spacecraft, or phase, angle of 8 degrees. Image scale is 1,093 feet (333 meters) per pixel. http://photojournal.jpl.nasa.gov/catalog/PIA20010
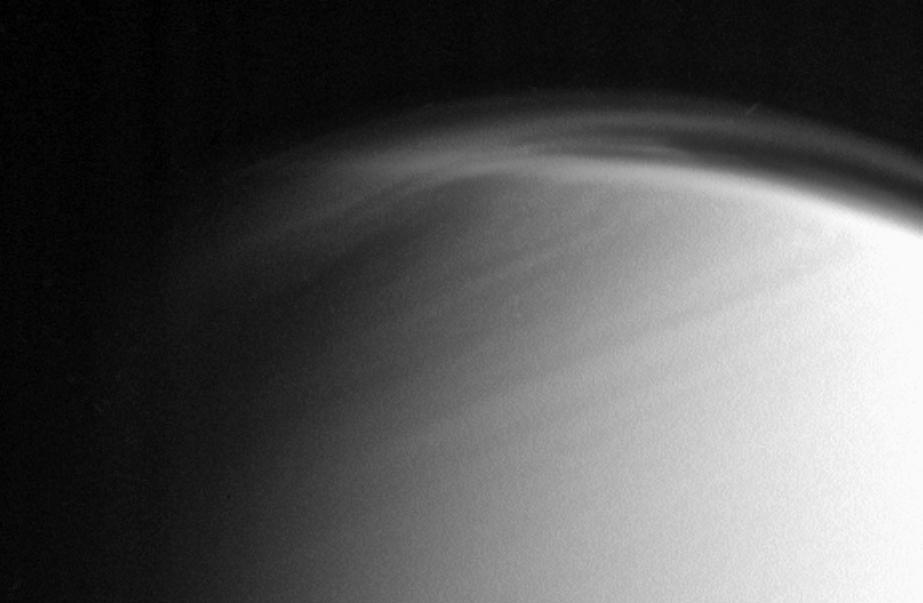
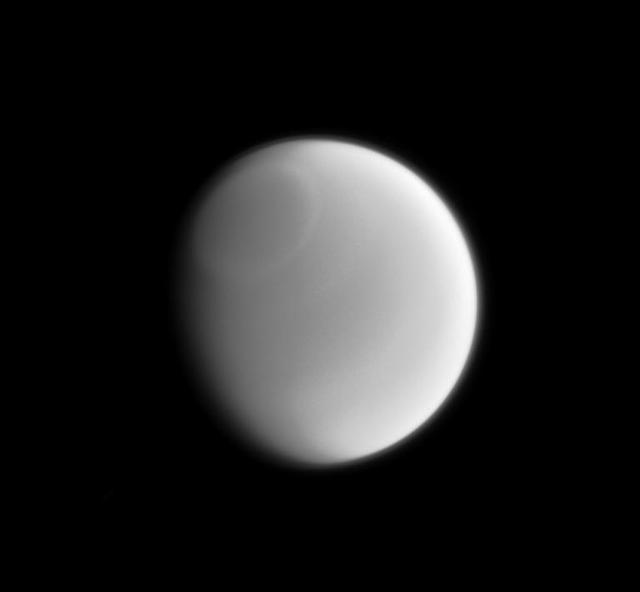
The complex and dynamic atmosphere of Titan displays multiple haze layers near the north pole in this view, which also provides an excellent look at the detached stratospheric haze layer that surrounds the moon at lower latitudes
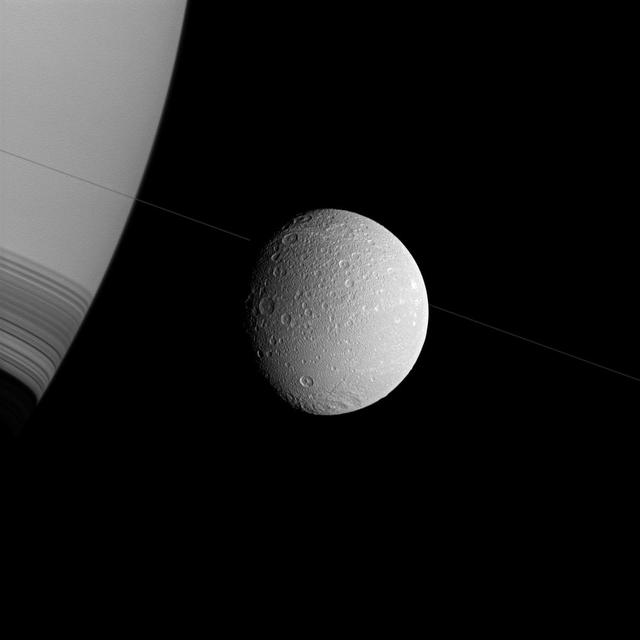
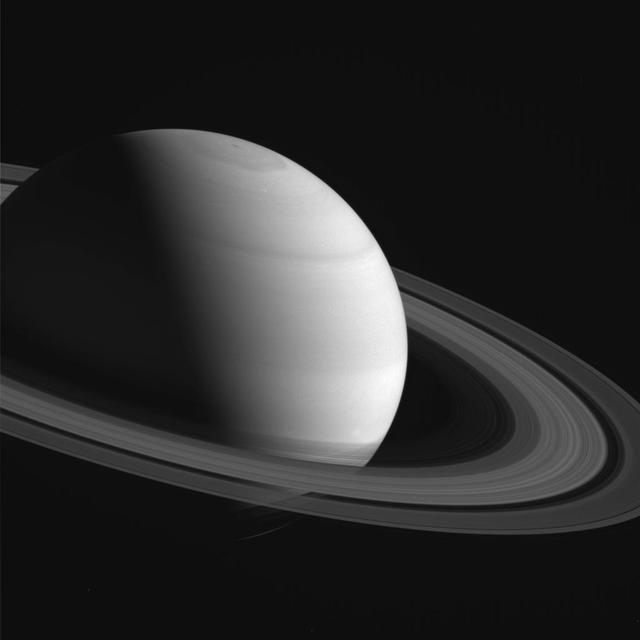
Saturn and Dione appear askew in this view from NASA Cassini spacecraft, with the north poles rotated to the right, as if they were threaded along on the thin diagonal line of the planet rings.
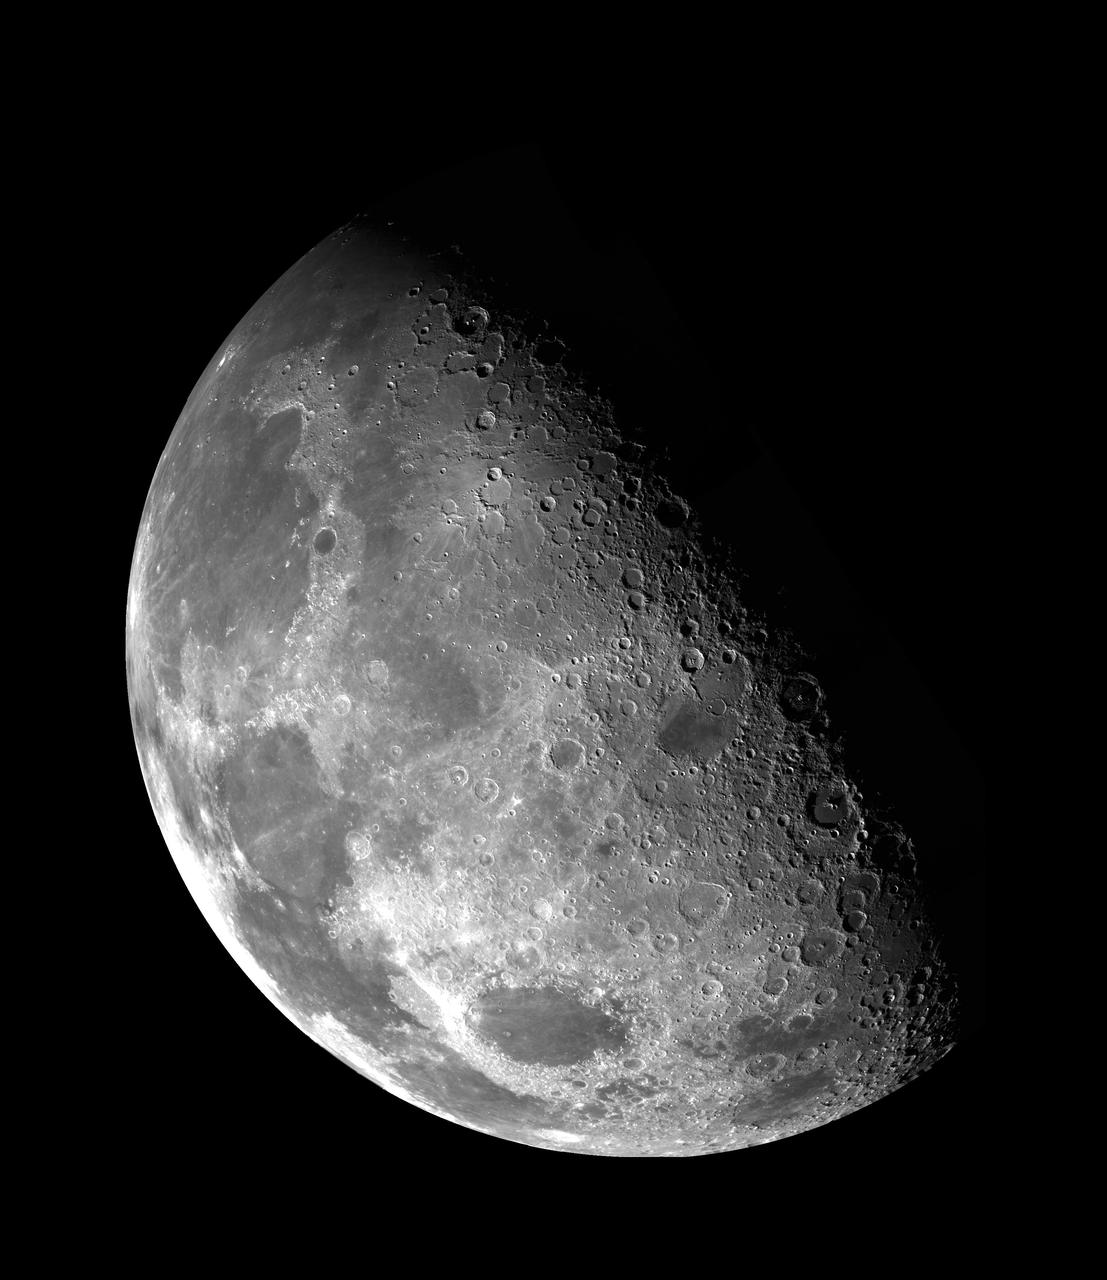
This view of the Moon north pole is a mosaic assembled from 18 images taken by NASA's Galileo imaging system through a green filter as the spacecraft flew by on December 7, 1992. http://photojournal.jpl.nasa.gov/catalog/PIA00130
Only a sharp and careful eye can make out the subtle variations in Titan clouds when viewed in visible light by NASA Cassini spacecraft. This infrared image clearly reveals a band around the Titan north pole.
These turbulent clouds are on top of the world at Saturn. NASA's Cassini spacecraft captured this view of Saturn's north pole on April 26, 2017 - the day it began its Grand Finale -- as it approached the planet for its first daring dive through the gap between the planet and its rings. Although the pole is still bathed in sunlight at present, northern summer solstice on Saturn occurred on May 24, 2017, bringing the maximum solar illumination to the north polar region. Now the Sun begins its slow descent in the northern sky, which eventually will plunge the north pole into Earth-years of darkness. Cassini's long mission at Saturn enabled the spacecraft to see the Sun rise over the north, revealing that region in great detail for the first time. This view looks toward the sunlit side of the rings from about 44 degrees above the ring plane. The image was taken with the Cassini spacecraft wide-angle camera using a spectral filter which preferentially admits wavelengths of near-infrared light centered at 752 nanometers. The view was obtained at a distance of approximately 166,000 miles (267,000 kilometers) from Saturn. Image scale is about 10 miles (16 kilometers) per pixel. https://photojournal.jpl.nasa.gov/catalog/PIA21343
An illusion of perspective, Saturn's moon Tethys seems to hang above the planet's north pole in this view from NASA's Cassini spacecraft. Tethys (660 miles or 1,062 kilometers across) is actually farther away than Saturn in this image. Lacking visual clues about distance, our brains place the moon above Saturn's north pole. Tethys, like all of Saturn's major moons and its ring system, orbits almost exactly in the planet's equatorial plane. This view looks toward the sunlit side of the rings from about 17 degrees above the ring plane. The image was taken with the Cassini spacecraft's wide-angle camera on Jan. 26, 2015 using a spectral filter which preferentially admits wavelengths of near-infrared light centered at 752 nanometers. The view was acquired at a distance of approximately 2.1 million miles (3.4 million kilometers) from Saturn. Image scale on Saturn is 120 miles (200 kilometers) per pixel. Tethys has been brightened by a factor of three relative to Saturn to enhance its visibility. http://photojournal.jpl.nasa.gov/catalog/PIA20488
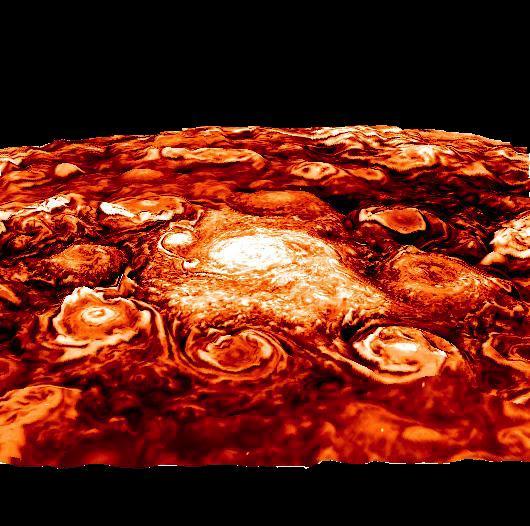
This computer-generated image is based on an infrared image of Jupiter's north polar region that was acquired on February 2, 2017, by the Jovian Infrared Auroral Mapper (JIRAM) instrument aboard Juno during the spacecraft's fourth pass over Jupiter. The image shows the structure of the cyclonic pattern observed over Jupiter's North pole: a central cyclone surrounded by eight circumpolar cyclones with diameters ranging from 2,500 to 2,900 miles (4,000 to 4,600 kilometers) across. JIRAM is able to collect images in the infrared wavelengths around 5 micrometers (µm) by measuring the intensity of the heat coming out of the planet. The heat from a planet that is radiated into space is called the radiance. This image is an enhancement of the original JIRAM image. In order to give the picture a 3-D shape, the enhancement starts from the idea that where the radiance has its highest value, there are no clouds and JIRAM can see deeper into the atmosphere. Consequently, all the other areas of the image are originally shaded more or less by clouds of different thickness. Then, to create these pictures, the originals have been inverted to give the thicker clouds the whitish color and the third dimension as the clouds we normally see here in the Earth's atmosphere. https://photojournal.jpl.nasa.gov/catalog/PIA22336
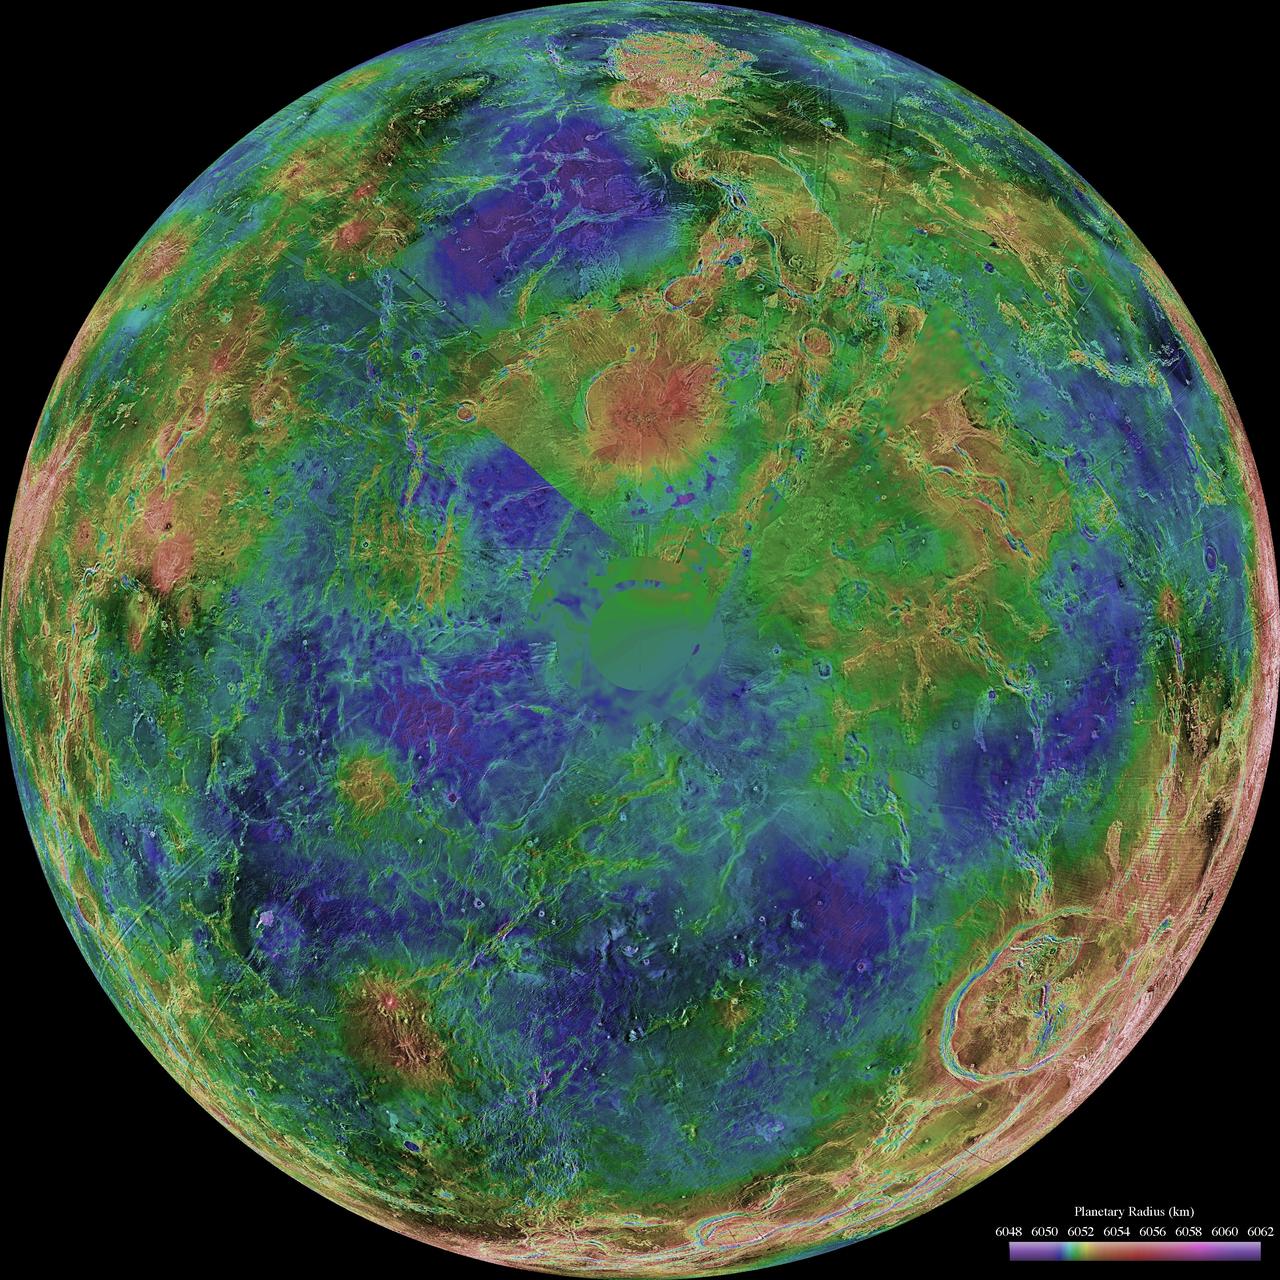
This hemispheric view of Venus, as revealed by more than a decade of radar investigations culminating in the 1990-1994 Magellan mission, is centered on the North Pole. NASA Magellan spacecraft imaged more than 98% of Venus. http://photojournal.jpl.nasa.gov/catalog/PIA00008
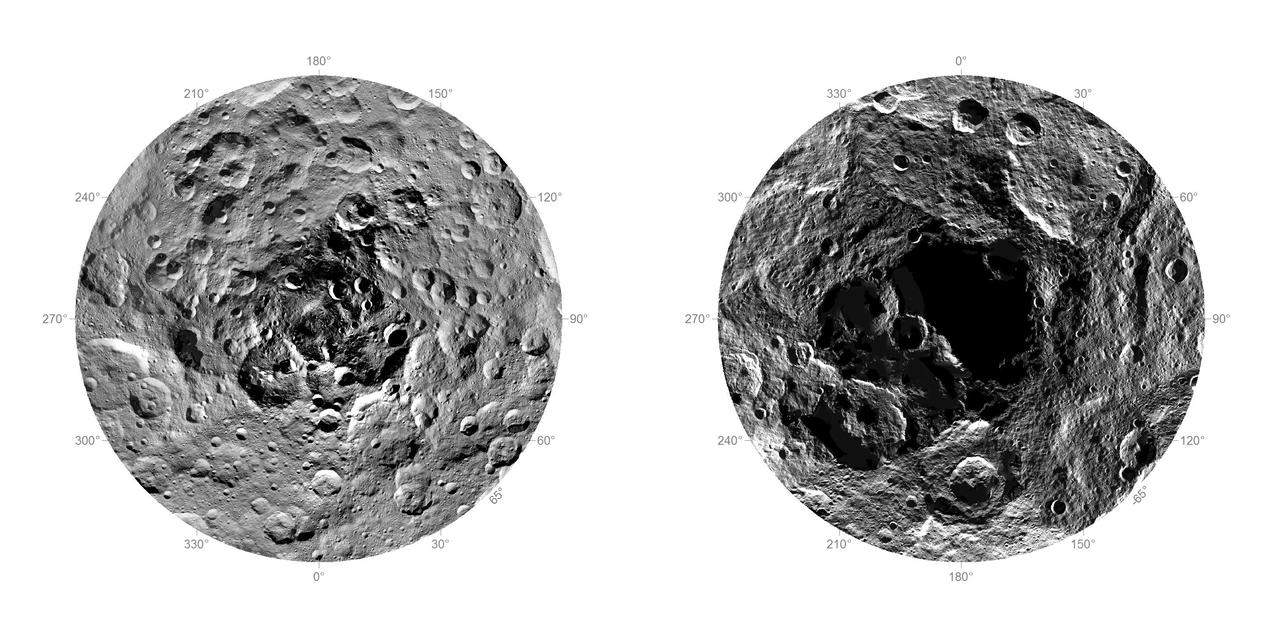
Researchers from NASA's Dawn mission have composed the first comprehensive views of the north (left) and south pole regions (right) of dwarf planet Ceres, using images obtained by the Dawn spacecraft. The images were taken between Aug. 17 and Oct. 23, 2015, from an altitude of 915 miles (1,470 kilometers). The region around the south pole appears black in this view because this area has been in shade ever since Dawn's arrival on March 6, 2015, and is therefore not visible. At the north polar region, craters Jarovit, Ghanan and Asari are visible, as well as the mountain Ysolo Mons. Near the south pole, craters Attis and Zadeni can be seen. Detailed maps of the polar regions allow researchers to study the craters in this area and compare them to those covering other parts of Ceres. Variations in shape and complexity can point to different surface compositions. In addition, the bottoms of some craters located close to the poles receive no sunlight throughout Ceres' orbit around the sun. Scientists want to investigate whether surface ice can be found there. http://photojournal.jpl.nasa.gov/catalog/PIA20126
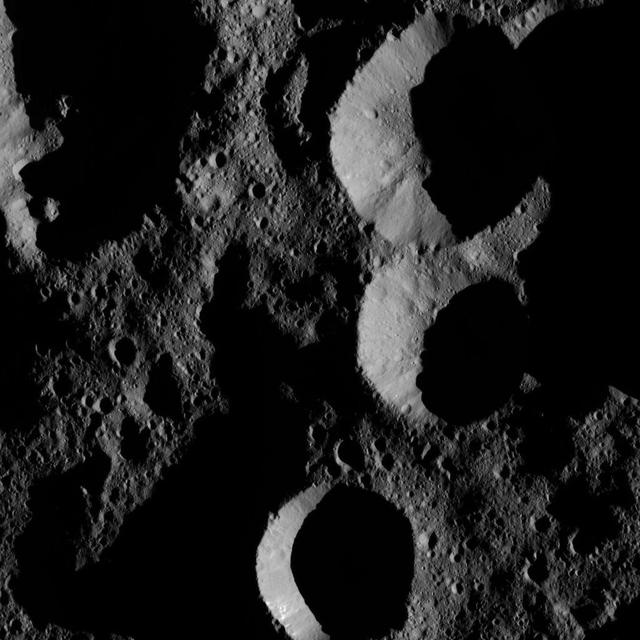
NASA's Dawn spacecraft obtained this view of shadowed craters near Ceres' north pole. Ceres has only a modest tilt of a few degrees to its rotational axis, so its polar regions do not experience drastic changes in the sun's angle and length of day like Earth's extreme north and south. The image is centered at approximately 73 degrees north latitude, 246 degrees east longitude. Dawn took this image on May 28, 2016, from its low-altitude mapping orbit, at a distance of about 240 miles (385 kilometers) above the surface. The image resolution is 120 feet (35 meters) per pixel. http://photojournal.jpl.nasa.gov/catalog/PIA20875
This frame from a video demonstrates how NASA Wide-field Infrared Survey Explorer surveys asteroids and comets in the solar system. Perspective shown here is looking down from high above Earth North Pole, a kind of bird eye view of the solar system.

Titan atmosphere makes Saturn largest moon look like a fuzzy orange ball in this natural color view from NASA Cassini spacecraft. Titan north polar hood is visible at top, and a faint blue haze also can be detected above the south pole at bottom.
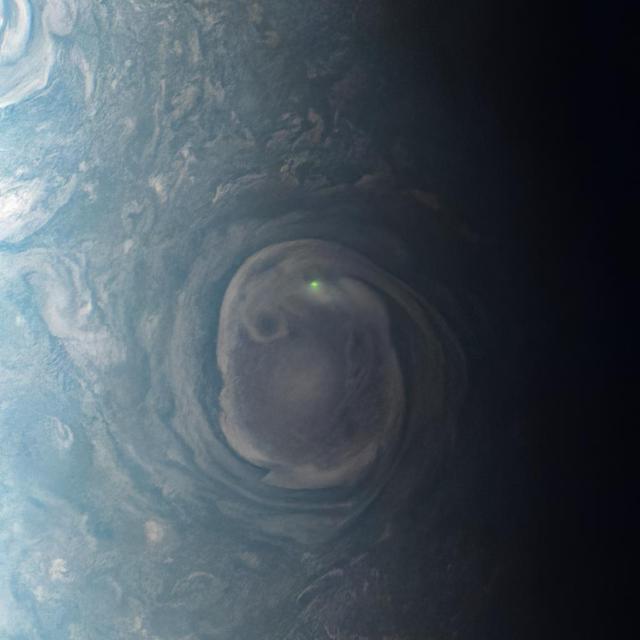
In this view of a vortex near Jupiter's north pole, NASA's Juno mission observed the glow from a bolt of lightning. On Earth, lightning bolts originate from water clouds, and happen most frequently near the equator, while on Jupiter lightning likely also occurs in clouds containing an ammonia-water solution, and can be seen most often near the poles. In the coming months, Juno's orbits will repeatedly take it close to Jupiter as the spacecraft passes over the giant planet's night side, which will provide even more opportunities for Juno's suite of science instruments to catch lightning in the act. Juno captured this view as Juno completed its 31st close flyby of Jupiter on Dec. 30, 2020. In 2022, Citizen scientist Kevin M. Gill processed the image from raw data from the JunoCam instrument aboard the spacecraft. At the time the raw image was taken, Juno was about 19,900 miles (32,000 kilometers) above Jupiter's cloud tops, at a latitude of about 78 degrees as it approached the planet. https://photojournal.jpl.nasa.gov/catalog/PIA25020
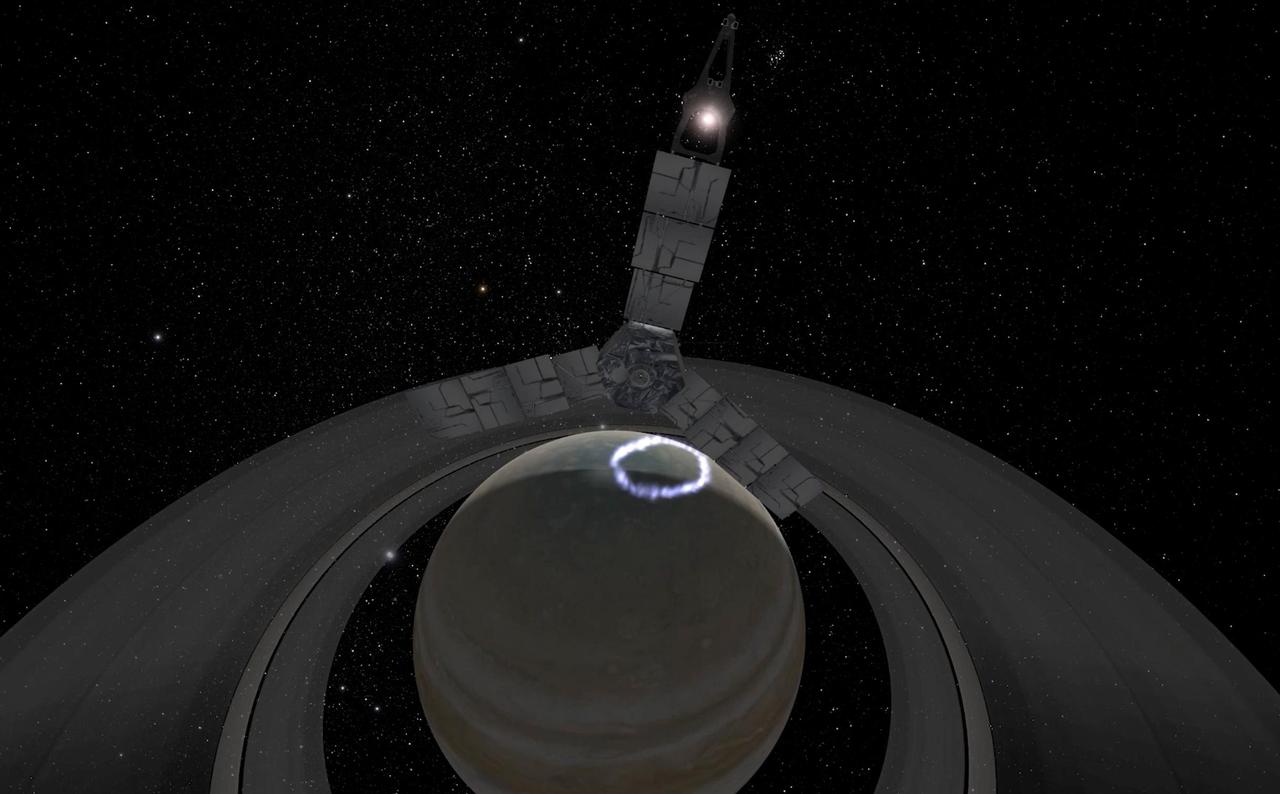
Juno's 53-day orbit has presented the opportunity to observe Jupiter's dark side. This animation is an artist's rendition of Juno's inbound -- over Jupiter's north pole -- approach to Perijove 17 (which occurred on Dec. 21, 2018). During the flyby the SRU obtained the closest view of Jupiter's aurora with a visible light imager to date. Animation available at https://photojournal.jpl.nasa.gov/catalog/PIA22962

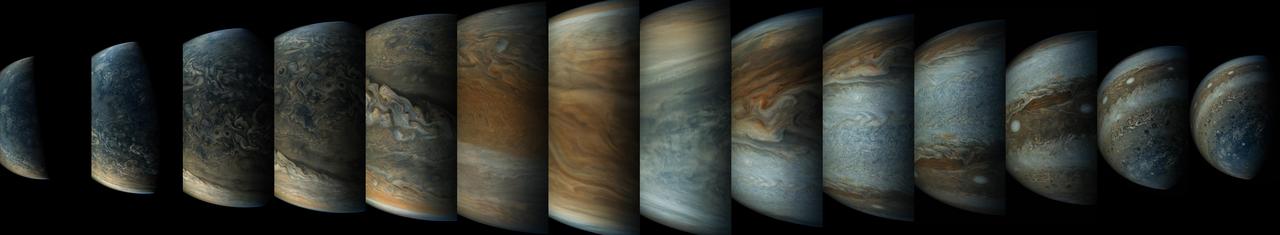
This sequence of color-enhanced images shows how quickly the viewing geometry changes for NASA's Juno spacecraft as it swoops by Jupiter. The images were obtained by JunoCam. Once every 53 days, Juno swings close to Jupiter, speeding over its clouds. In just two hours, the spacecraft travels from a perch over Jupiter's north pole through its closest approach (perijove), then passes over the south pole on its way back out. This sequence shows 11 color-enhanced images from Perijove 8 (Sept. 1, 2017) with the south pole on the left (11th image in the sequence) and the north pole on the right (first image in the sequence). The first image on the right shows a half-lit globe of Jupiter, with the north pole approximately at the upper center of the image close to the terminator -- the dividing line between night and day. As the spacecraft gets closer to Jupiter, the horizon moves in and the range of visible latitudes shrinks. The second and third images in this sequence show the north polar region rotating away from the spacecraft's field of view while the first of Jupiter's lighter-colored bands comes into view. The fourth through the eighth images display a blue-colored vortex in the mid-southern latitudes near Points of Interest "Collision of Colours," "Sharp Edge," "Caltech, by Halka," and "Structure01." The Points of Interest are locations in Jupiter's atmosphere that were identified and named by members of the general public. Additionally, a darker, dynamic band can be seen just south of the vortex. In the ninth and tenth images, the south polar region rotates into view. The final image on the left displays Jupiter's south pole in the center. From the start of this sequence of images to the end, roughly 1 hour and 35 minutes elapsed. https://photojournal.jpl.nasa.gov/catalog/PIA21967 . - Enhanced image by Kevin M. Gill (CC-BY) based on images provided courtesy of NASA/JPL-Caltech/SwRI/MSSS
This image captures the day-night boundary, or terminator, in the north polar region of Ceres. The north pole itself, which lies just slightly left of center in this view, is barely sunlit, even though the local time at its location is 11:06 a.m. The north polar region is densely cratered, and some crater floors remain in permanent shadow. Some of those permanently shadowed craters contain bright deposits, as described in a 2016 Nature Astronomy study by scientists on NASA's Dawn mission. The best example of these bright deposits was found by Dawn in an unnamed and geologically young, 4-mile- (6-kilometer-) wide crater located at 86.2 degrees north latitude, 80.0 degrees east longitude (the small, sharply defined crater just right of center). This picture was obtained by the Dawn spacecraft on October 17, 2016, from an altitude of about 923 miles (1,486 kilometers). The image is located at 89 degrees north latitude, 86 degrees east longitude. http://photojournal.jpl.nasa.gov/catalog/PIA21397
This JunoCam image depicts one of the eight circumpolar cyclones that surround a central cyclone at the gas giant's north pole. The data from this view of one of Jupiter's circumpolar cyclones was collected during Juno's 29th perijove (PJ) pass on Sept. 16, 2020, and processed by citizen scientist Gerald Eichstädt. https://photojournal.jpl.nasa.gov/catalog/PIA24238
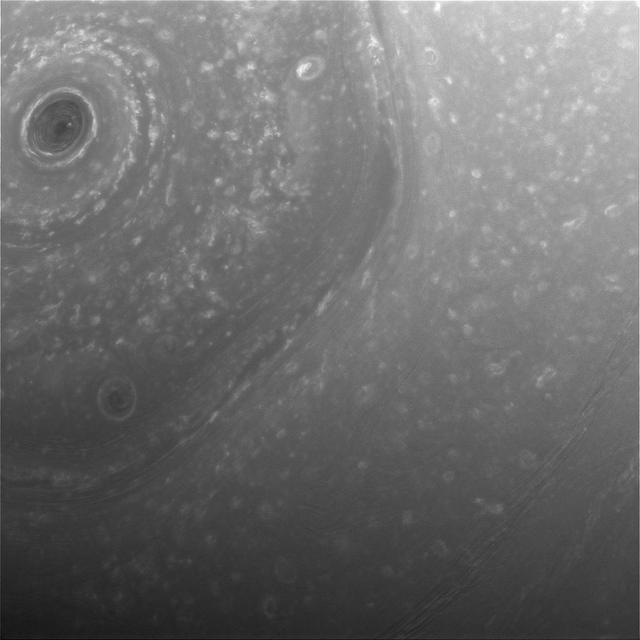
This view from NASA's Cassini spacecraft was obtained about half a day before its first close pass by the outer edges of Saturn's main rings during its penultimate mission phase. The view shows part of the giant, hexagon-shaped jet stream around the planet's north pole. Each side of the hexagon is about as wide as Earth. A circular storm lies at the center, at the pole (see PIA14944). The image was taken with the Cassini spacecraft wide-angle camera on Dec. 3, 2016, at a distance of about 240,000 miles (390,000 kilometers) from Saturn. Image scale is 14 miles (23 kilometers) per pixel. http://photojournal.jpl.nasa.gov/catalog/PIA21052
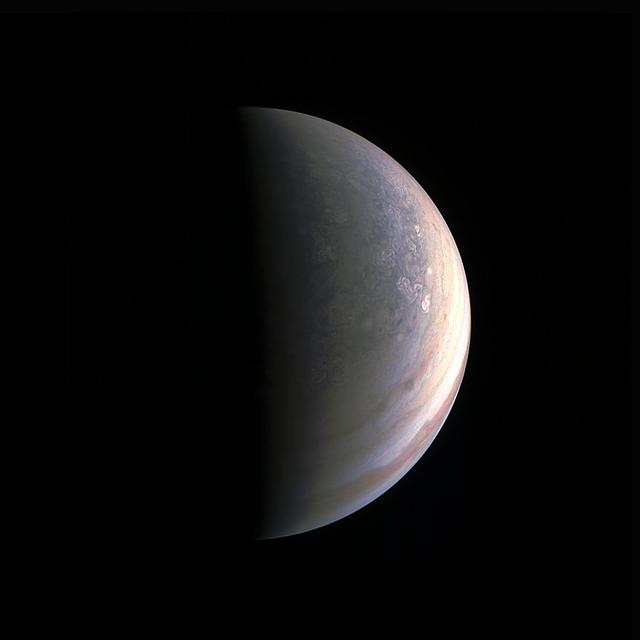
As NASA's Juno spacecraft closed in on Jupiter for its Aug. 27, 2016 pass, its view grew sharper and fine details in the north polar region became increasingly visible. The JunoCam instrument obtained this view on August 27, about two hours before closest approach, when the spacecraft was 120,000 miles (195,000 kilometers) away from the giant planet (i.e., for Jupiter's center). Unlike the equatorial region's familiar structure of belts and zones, the poles are mottled with rotating storms of various sizes, similar to giant versions of terrestrial hurricanes. Jupiter's poles have not been seen from this perspective since the Pioneer 11 spacecraft flew by the planet in 1974. http://photojournal.jpl.nasa.gov/catalog/PIA21030
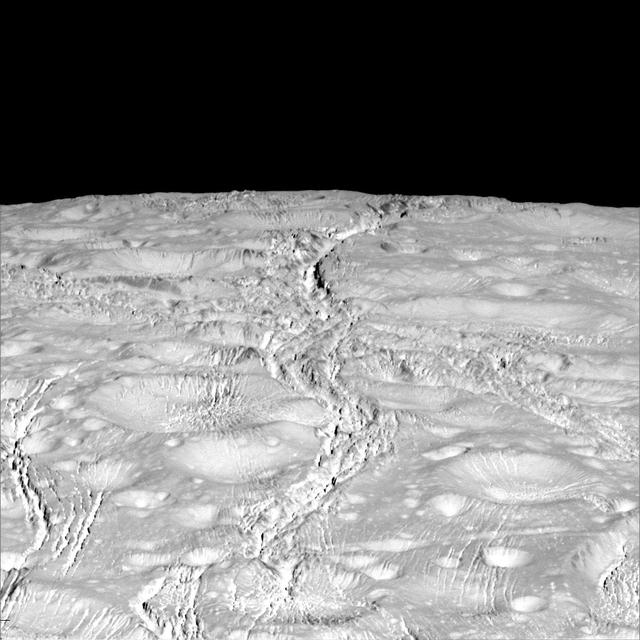
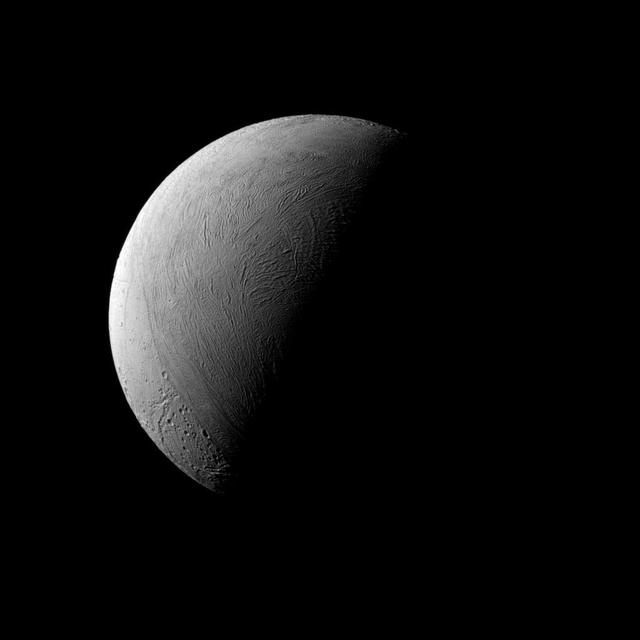
NASA's Cassini spacecraft zoomed by Saturn's icy moon Enceladus on Oct. 14, 2015, capturing this stunning image of the moon's north pole. A companion view from the wide-angle camera (PIA20010) shows a zoomed out view of the same region for context. Scientists expected the north polar region of Enceladus to be heavily cratered, based on low-resolution images from the Voyager mission, but high-resolution Cassini images show a landscape of stark contrasts. Thin cracks cross over the pole -- the northernmost extent of a global system of such fractures. Before this Cassini flyby, scientists did not know if the fractures extended so far north on Enceladus. North on Enceladus is up. The image was taken in visible green light with the Cassini spacecraft narrow-angle camera. The view was acquired at a distance of approximately 4,000 miles (6,000 kilometers) from Enceladus and at a Sun-Enceladus-spacecraft, or phase, angle of 9 degrees. Image scale is 115 feet (35 meters) per pixel. http://photojournal.jpl.nasa.gov/catalog/PIA19660
Sunlight truly has come to Saturn's north pole. The whole northern region is bathed in sunlight in this view from late 2016, feeble though the light may be at Saturn's distant domain in the solar system. The hexagon-shaped jet-stream is fully illuminated here. In this image, the planet appears darker in regions where the cloud deck is lower, such the region interior to the hexagon. Mission experts on Saturn's atmosphere are taking advantage of the season and Cassini's favorable viewing geometry to study this and other weather patterns as Saturn's northern hemisphere approaches Summer solstice. This view looks toward the sunlit side of the rings from about 51 degrees above the ring plane. The image was taken with the Cassini spacecraft wide-angle camera on Sept. 9, 2016 using a spectral filter which preferentially admits wavelengths of near-infrared light centered at 728 nanometers. The view was obtained at a distance of approximately 750,000 miles (1.2 million kilometers) from Saturn. Image scale is 46 miles (74 kilometers) per pixel. http://photojournal.jpl.nasa.gov/catalog/PIA20513
This sequence of enhanced-color images shows how quickly the viewing geometry changes for NASA's Juno spacecraft as it swoops by Jupiter. The images were obtained by JunoCam. Once every 53 days the Juno spacecraft swings close to Jupiter, speeding over its clouds. In just two hours, the spacecraft travels from a perch over Jupiter's north pole through its closest approach (perijove), then passes over the south pole on its way back out. This sequence shows 14 enhanced-color images. The first image on the left shows the entire half-lit globe of Jupiter, with the north pole approximately in the center. As the spacecraft gets closer to Jupiter, the horizon moves in and the range of visible latitudes shrinks. The third and fourth images in this sequence show the north polar region rotating away from our view while a band of wavy clouds at northern mid-latitudes comes into view. By the fifth image of the sequence the band of turbulent clouds is nicely centered in the image. The seventh and eighth images were taken just before the spacecraft was at its closest point to Jupiter, near Jupiter's equator. Even though these two pictures were taken just four minutes apart, the view is changing quickly. As the spacecraft crossed into the southern hemisphere, the bright "south tropical zone" dominates the ninth, 10th and 11th images. The white ovals in a feature nicknamed Jupiter's "String of Pearls" are visible in the 12th and 13th images. In the 14th image Juno views Jupiter's south poles. Citizen scientists Gerald Eichstädt and Seán Doran created this image using data from the spacecraft's JunoCam imager. https://photojournal.jpl.nasa.gov/catalog/PIA21645
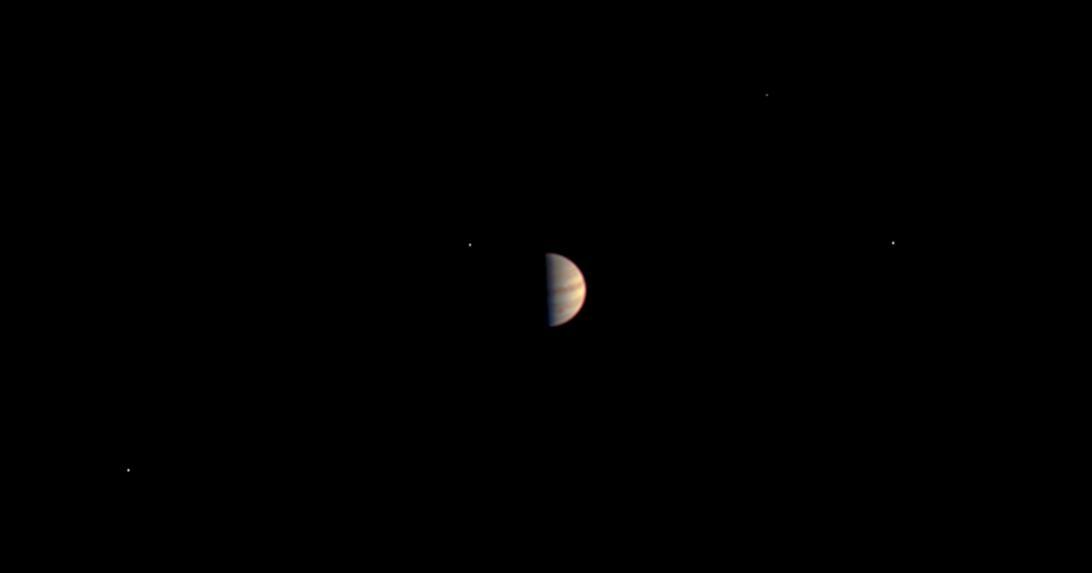
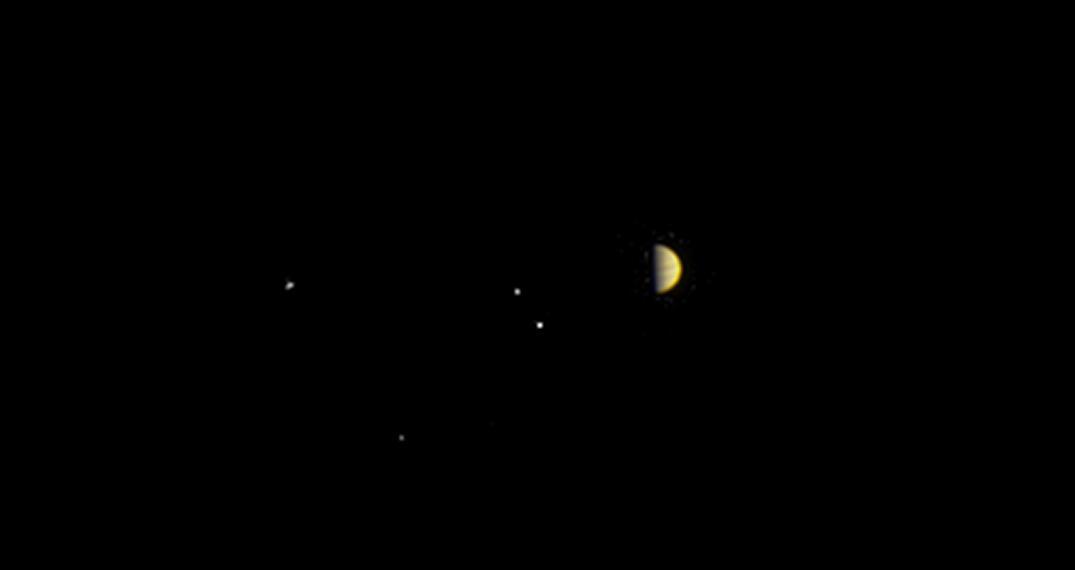
This is the final view taken by the JunoCam instrument on NASA's Juno spacecraft before Juno's instruments were powered down in preparation for orbit insertion. Juno obtained this color view on June 29, 2016, at a distance of 3.3 million miles (5.3 million kilometers) from Jupiter. The spacecraft is approaching over Jupiter's north pole, providing an unprecedented perspective on the Jupiter system, including its four large moons. http://photojournal.jpl.nasa.gov/catalog/PIA20706
Saturn hexagonal polar jet stream is the shining feature of almost every view of the north polar region of Saturn. The region, in shadow for the first part of NASA's Cassini mission, now enjoys full sunlight, which enables Cassini scientists to directly image it in reflected light. Although the sunlight falling on the north pole of Saturn is enough to allow us to image and study the region, it does not provide much warmth. In addition to being low in the sky (just like summer at Earth's poles), the sun is nearly ten times as distant from Saturn as from Earth. This results in the sunlight being only about 1 percent as intense as at our planet. This view looks toward Saturn from about 31 degrees above the ring plane. The image was taken with the Cassini spacecraft wide-angle camera on Jan. 22, 2017 using a spectral filter which preferentially admits wavelengths of near-infrared light centered at 939 nanometers. The view was obtained at a distance of approximately 560,000 miles (900,000 kilometers) from Saturn. Image scale is 33 miles (54 kilometers) per pixel. https://photojournal.jpl.nasa.gov/catalog/PIA21327
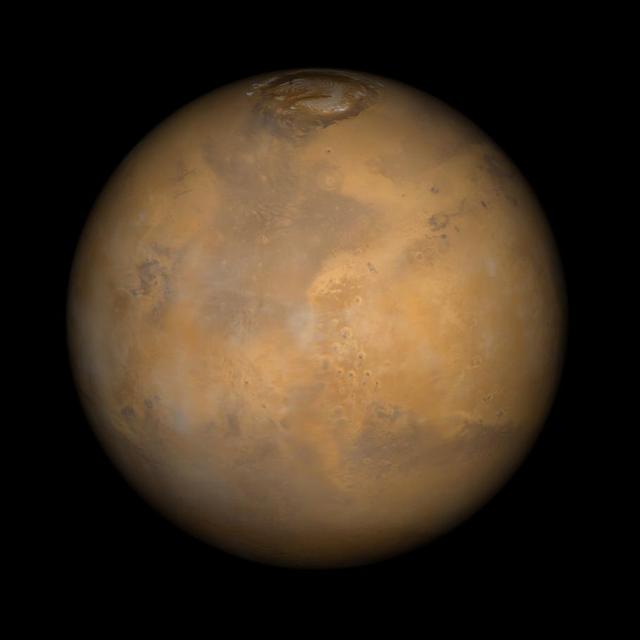
Somewhere down there sits the Mars Pathfinder lander and Sojourner rover. This Mars Global Surveyor Mars Orbiter Camera view of the red planet shows the region that includes Ares Vallis and the Chryse Plains upon which both Mars Pathfinder and the Viking 1 landed in 1997 and 1976, respectively. Acidalia Planitia is the dark surface that dominates the center left. The Pathfinder site is immediately south of Acidalia, just left of center in this view. Also shown--the north polar cap is at the top, and Arabia Terra and Sinus Meridiani are to the right. The bluish-white features are clouds. This is a color composite of 9 red and 9 blue image strips taken by the Mars Global Surveyor Mars Orbiter Camera on 9 successive orbits from pole-to-pole during the calibration phase of the mission in March 1999. The color is computer-enhanced and is not shown as it would actually appear to the human eye. http://photojournal.jpl.nasa.gov/catalog/PIA02000
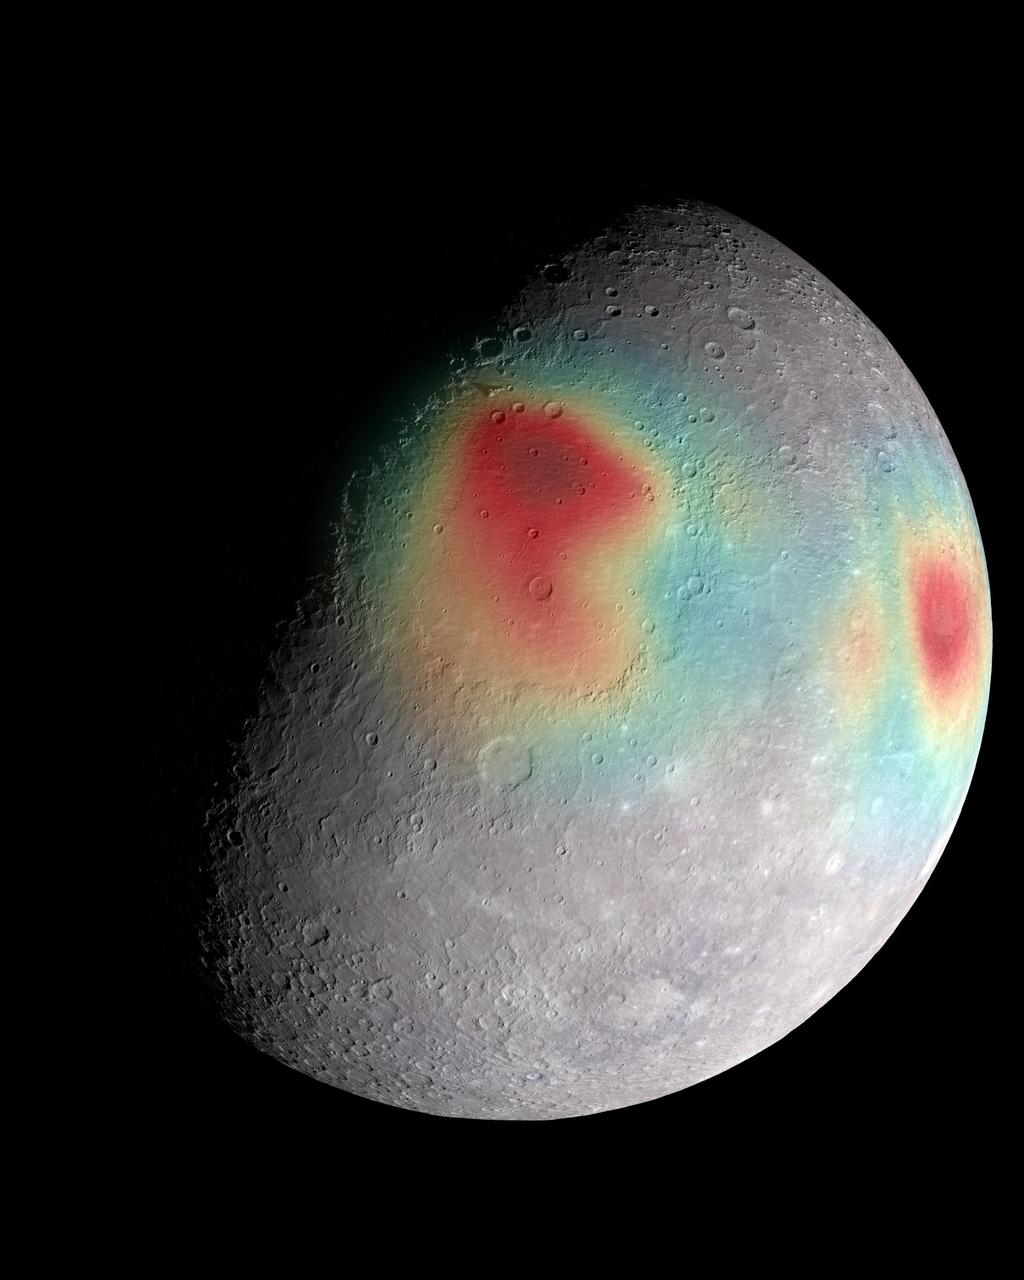
Analysis of radio tracking data have enabled maps of the gravity field of Mercury to be derived. In this image, overlain on a mosaic obtained by MESSENGER's Mercury Dual Imaging System and illuminated with a shape model determined from stereo-photoclinometry, Mercury's gravity anomalies are depicted in colors. Red tones indicate mass concentrations, centered on the Caloris basin (center) and the Sobkou region (right limb). Such large-scale gravitational anomalies are signatures of subsurface structure and evolution. The north pole is near the top of the sunlit area in this view. http://photojournal.jpl.nasa.gov/catalog/PIA19285
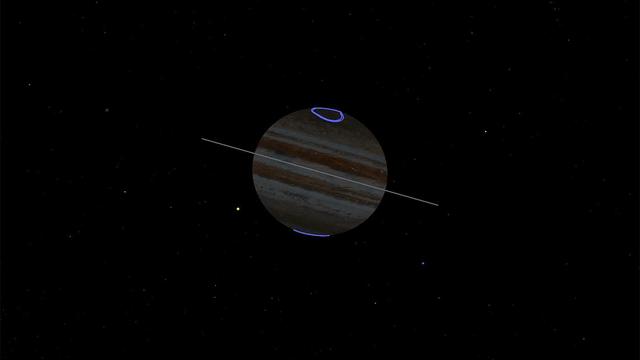
This animated gif depicts the point of view of NASA's Juno spacecraft during its eclipse-free approach to the gas giant Nov. 3, 2019. The Sun is depicted as the yellow dot rising up just to left of the planet. Located at the north and south poles, the gas giant's auroras are shown in purple. Jupiter's tenuous rings are shown gray. Animation available at https://photojournal.jpl.nasa.gov/catalog/PIA23465

This animation shows the overlap of the field of view of Juno's Stellar Reference Unit (SRU) star camera (in yellow) and Juno's Microwave Radiometer (MWR) Antenna-1 beam (in red). The animation depicts Juno flying over Jupiter's North pole where the planet's massive northern aurora is located. Juno observes Jupiter's lightning using multiple instruments which detect lightning at different parts of its spectrum. Animation avaiable at https://photojournal.jpl.nasa.gov/catalog/PIA22967
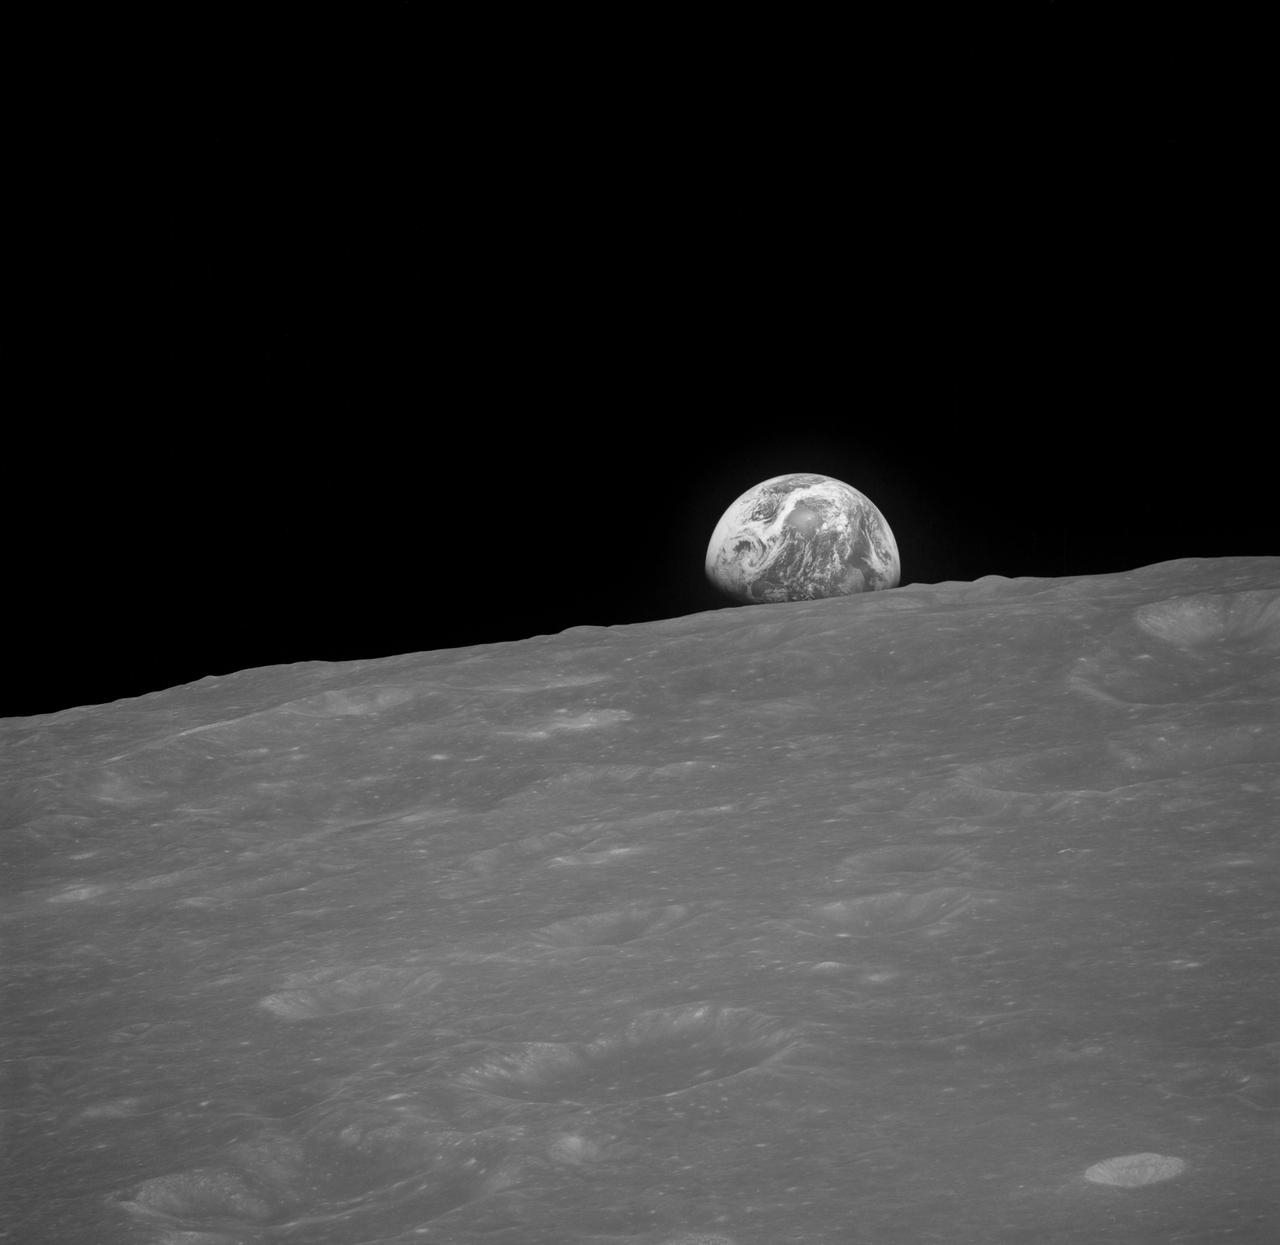
AS08-13-2329 (Dec. 1968) --- The Earth rising is about five degrees above the lunar horizon in this black and white telephoto view photographed from the Apollo 8 spacecraft near 110 degrees east longitude. The horizon, about 570 kilometers (350 statute miles) from the spacecraft, is near the eastern limb of the Moon as viewed from Earth. On Earth, 240,000 statute miles away, the sunset terminator crosses Africa. The South Pole is in the white area near the left end of the terminator. North and South America are under clouds.
NASA's Juno spacecraft obtained this color view on June 28, 2016, at a distance of 3.9 million miles (6.2 million kilometers) from Jupiter. As Juno nears its destination, features on the giant planet are increasingly visible, including the Great Red Spot. The spacecraft is approaching over Jupiter's north pole, providing a unique perspective on the Jupiter system, including its four large moons. The scene was captured by the mission's imaging camera, called JunoCam, which is designed to acquire high resolution views of features in Jupiter's atmosphere from very close to the planet. http://photojournal.jpl.nasa.gov/catalog/PIA20705
This half-lit view of Enceladus bears a passing resemblance to similar views of Earth's own natural satellite, but the similarities end there. Earth's rocky moon is covered in dark, volcanic basins and brighter, mountainous highlands -- both exceedingly ancient. The surface of icy Enceladus is uniformly bright, far brighter than Earth's moon. Large areas of Enceladus' surface are characterized by youthful (on geologic timescales), wrinkled terrains. Although the north pole of Enceladus (313 miles or 504 kilometers across) was dark when Cassini arrived at Saturn, the march of the seasons at Saturn have brought sunlight to the north and taken it from the south. This view looks toward the leading hemisphere of Enceladus. North on Encealdus is up. The image was taken in visible light with the Cassini spacecraft narrow-angle camera on Sept. 8, 2015. The view was acquired at a distance of approximately 80,000 miles (129,000 kilometers) from Enceladus. Image scale is 2,530 feet (772 meters) per pixel. http://photojournal.jpl.nasa.gov/catalog/PIA18351
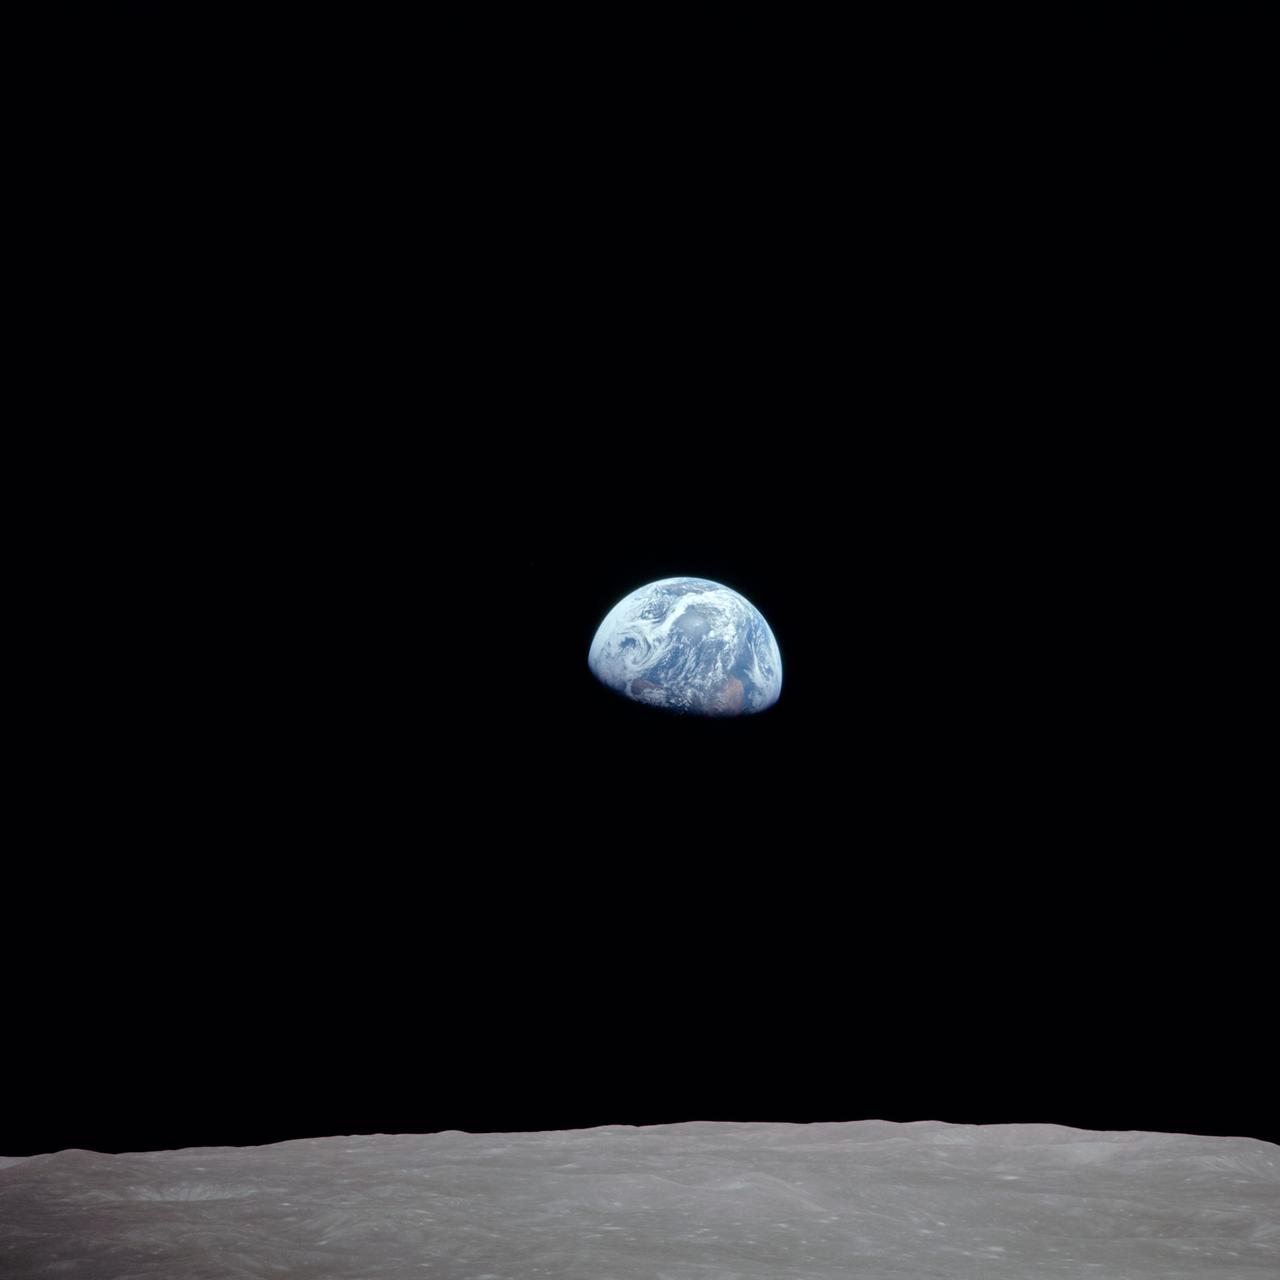
AS08-14-2384 (Dec. 1968)--- The rising Earth is about five degrees above the lunar horizon in this photograph--one of a pair taken within a short time of each other --from the Apollo 8 spacecraft . The horizon, about 570 kilometers (350 statute miles) from the spacecraft, is near the eastern limb of the Moon as viewed from Earth. Width of the view at the horizon is about 150 kilometers (95 statute miles). On the Earth 240,000 statute miles away, the sunset terminator crosses Africa. The South Pole is in the white area near the left end of the terminator. North and South America are almost totally under clouds. However, part of North America is visible at the top (western) part of the planet.
Enceladus is a world divided. To the north, we see copious amounts of craters and evidence of the many impacts the moon has suffered in its history. However, to the south we see a smoother body with wrinkles due to geologic activity. Most solar system bodies lacking an atmosphere are heavily cratered like Enceladus' (313 miles or 504 kilometers across) northern region. However, the geologic activity in the south, including the famous plume above the moon's south pole, can erase craters and leave a younger, smoother-looking surface. This view looks toward the anti-Saturn hemisphere of Enceladus. North on Enceladus is up and rotated 4 degrees to the right. The image was taken in visible light with the Cassini spacecraft narrow-angle camera on Nov. 27, 2016. The view was obtained at a distance of approximately 41,000 miles (66,000 kilometers) from Enceladus. Image scale is 1,310 feet (398 meters) per pixel. http://photojournal.jpl.nasa.gov/catalog/PIA20524

The globe of Saturn, seen here in natural color, is reminiscent of a holiday ornament in this wide-angle view from NASA's Cassini spacecraft. The characteristic hexagonal shape of Saturn's northern jet stream, somewhat yellow here, is visible. At the pole lies a Saturnian version of a high-speed hurricane, eye and all. This view is centered on terrain at 75 degrees north latitude, 120 degrees west longitude. Images taken using red, green and blue spectral filters were combined to create this natural-color view. The images were taken with the Cassini spacecraft wide-angle camera on July 22, 2013. This view was acquired at a distance of approximately 611,000 miles (984,000 kilometers) from Saturn. Image scale is 51 miles (82 kilometers) per pixel. http://photojournal.jpl.nasa.gov/catalog/PIA17175

All was well at the North Pole this summer, when Santa and his elves were busily making toys and taking orders for this Christmas. NASA's Terra satellite was able to piece together a number of images it took to give us a complete look at the North Pole, which is usually very difficult to see by satellites, so Santa can keep his exact location secret. On June 30, 2011 the Moderate Resolution Imaging Spectroradiometer (MODIS) aboard NASA’s Terra satellite made multiple passes over the Arctic from its orbit in space, capturing a true-color image of the summer lands and sea-ice near the North Pole on each pass. Individual images were then pieced together to create a large mosaic of the area, which gives a broader view that would not be possible with individual images. In this mosaic of the Arctic, the polar ice cap appears blue-white, while the ice covering land appears bright white. The ice of Greenland, in the lower left (southwest), is especially bright. Clouds also appear bright white, and can be difficult to separate from ice in true-color images. Most of the clouds in this image appear in billowing swirls, while ice tends to be smoother. This can only be confirmed in the false-color images that were also generated by MODIS that same day. The North Pole is found northeast off the coast of Greenland, in the middle of the ice-covered Arctic Ocean and roughly near the center of this image. This is the northernmost point on Earth. From the North Pole, all directions are south. Santa will be leaving from here on the night of the 24th and circling the globe. Credit: NASA/GSFC/Jeff Schmaltz/MODIS Land Rapid Response Team <b><a href="http://www.nasa.gov/centers/goddard/home/index.html" rel="nofollow">NASA Goddard Space Flight Center</a></b> enables NASA’s mission through four scientific endeavors: Earth Science, Heliophysics, Solar System Exploration, and Astrophysics. Goddard plays a leading role in NASA’s accomplishments by contributing compelling scientific knowledge to advance the Agency’s mission. <b>Follow us on <a href="http://twitter.com/NASA_GoddardPix" rel="nofollow">Twitter</a></b> <b>Like us on <a href="http://www.facebook.com/pages/Greenbelt-MD/NASA-Goddard/395013845897?ref=tsd" rel="nofollow">Facebook</a></b> <b>Find us on <a href="http://web.stagram.com/n/nasagoddard/?vm=grid" rel="nofollow">Instagram</a></b>

AS08-14-2383 (24 Dec. 1968) --- The rising Earth is about five degrees above the lunar horizon in this telephoto view taken from the Apollo 8 spacecraft near 110 degrees east longitude. The horizon, about 570 kilometers (350 statute miles) from the spacecraft, is near the eastern limb of the moon as viewed from Earth. Width of the view at the horizon is about 150 kilometers (95 statute miles). On Earth 240,000 statute miles away the sunset terminator crosses Africa. The crew took the photo around 10:40 a.m. Houston time on the morning of Dec. 24, and that would make it 15:40 GMT on the same day. The South Pole is in the white area near the left end of the terminator. North and South America are under the clouds.
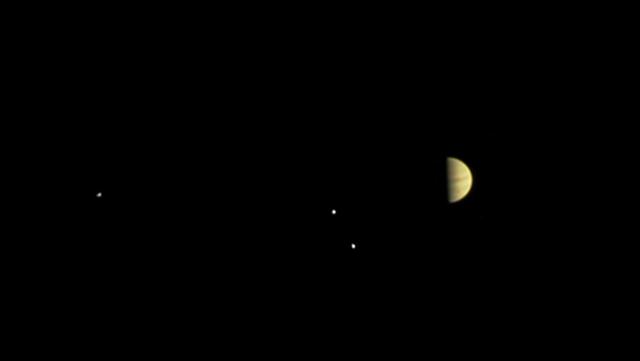
NASA's Juno spacecraft obtained this color view on June 21, 2016, at a distance of 6.8 million miles (10.9 million kilometers) from Jupiter. As Juno makes its initial approach, the giant planet's four largest moons -- Io, Europa, Ganymede and Callisto -- are visible, and the alternating light and dark bands of the planet's clouds are just beginning to come into view. Juno is approaching over Jupiter's north pole, affording the spacecraft a unique perspective on the Jupiter system. Previous missions that imaged Jupiter on approach saw the system from much lower latitudes, closer to the planet's equator. The scene was captured by the mission's imaging camera, called JunoCam, which is designed to acquire high resolution views of features in Jupiter's atmosphere from very close to the planet. http://photojournal.jpl.nasa.gov/catalog/PIA20701
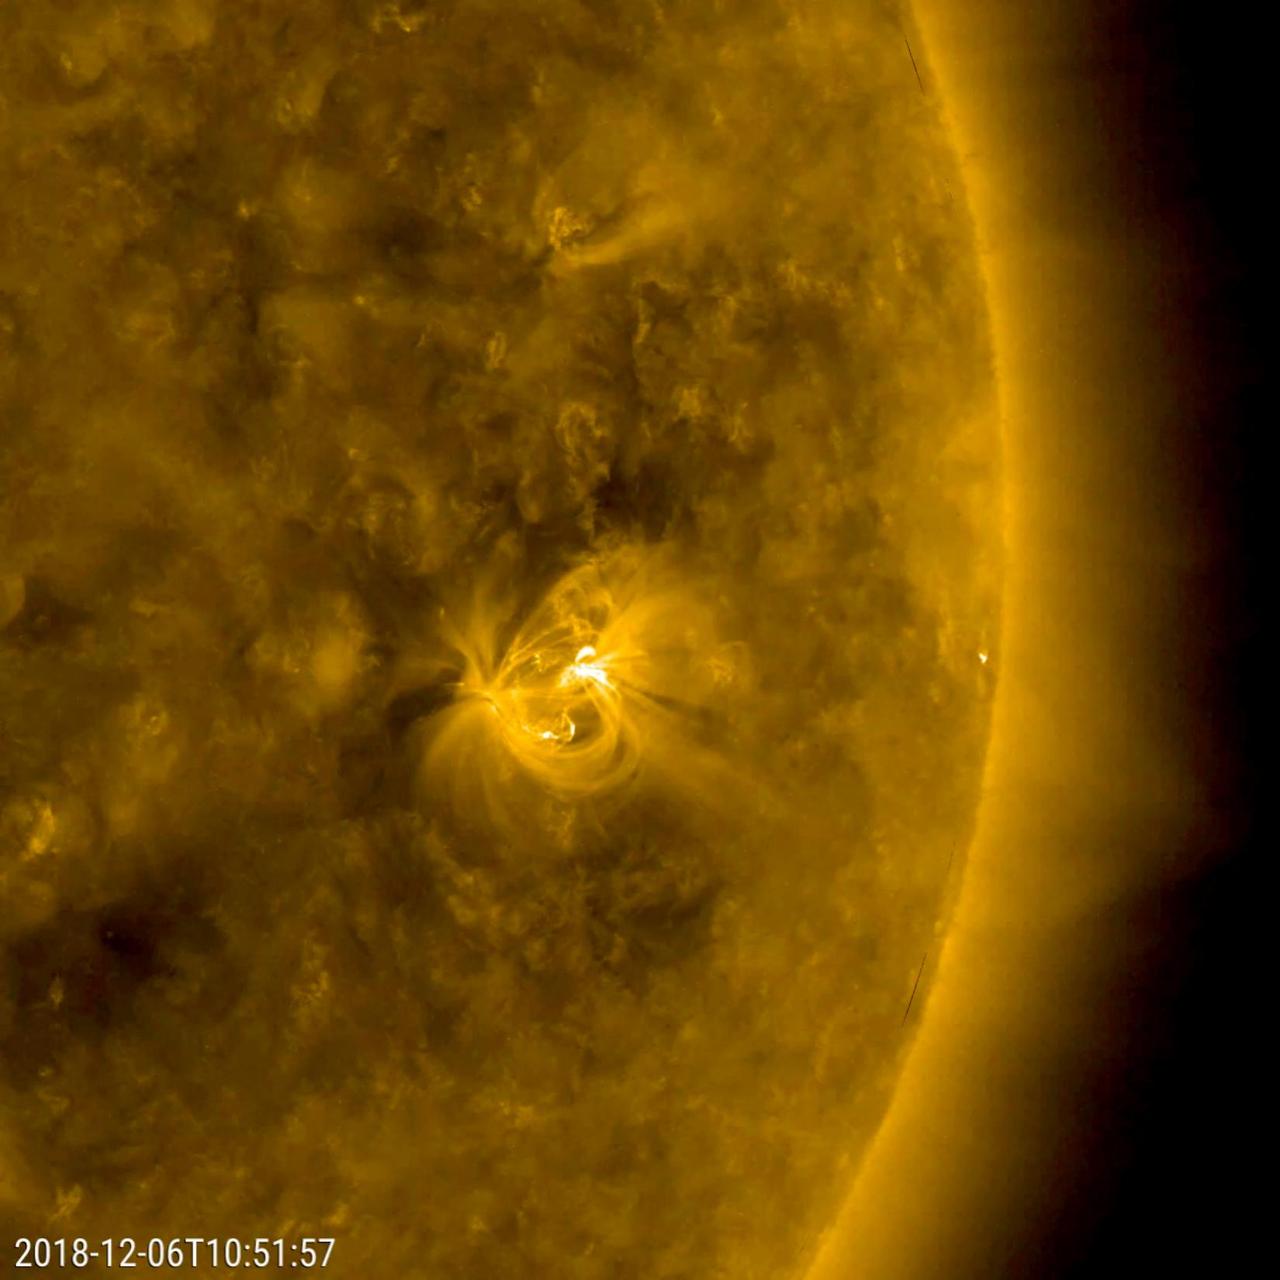
The only active region observed this week appeared on Dec. 5, 2018 and grew into an average size display of dynamic activity (Dec. 6-7, 2018). As viewed in a wavelength of extreme ultraviolet light, the region presented numerous magnetic loops of charged particles, rapidly changing their shapes and directions. As the sun is approaching its minimum level of activity in its 11 year solar cycle, we expect to see fewer and fewer active regions for quite a while. However, this active region is in the southern hemisphere of the Sun and has the North magnetic pole in the lead, so it is a sunspot of Solar Cycle 24. Movies available at https://photojournal.jpl.nasa.gov/catalog/PIA21211
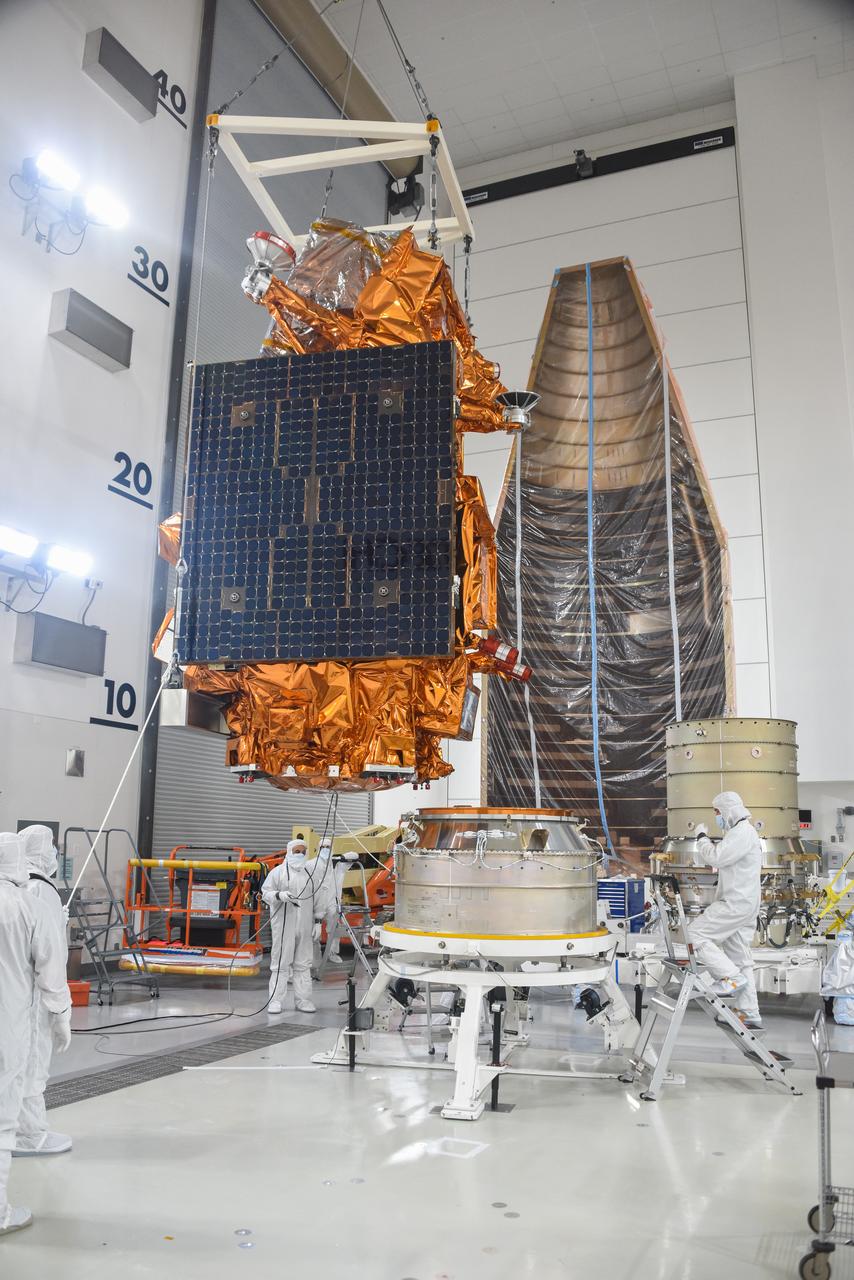
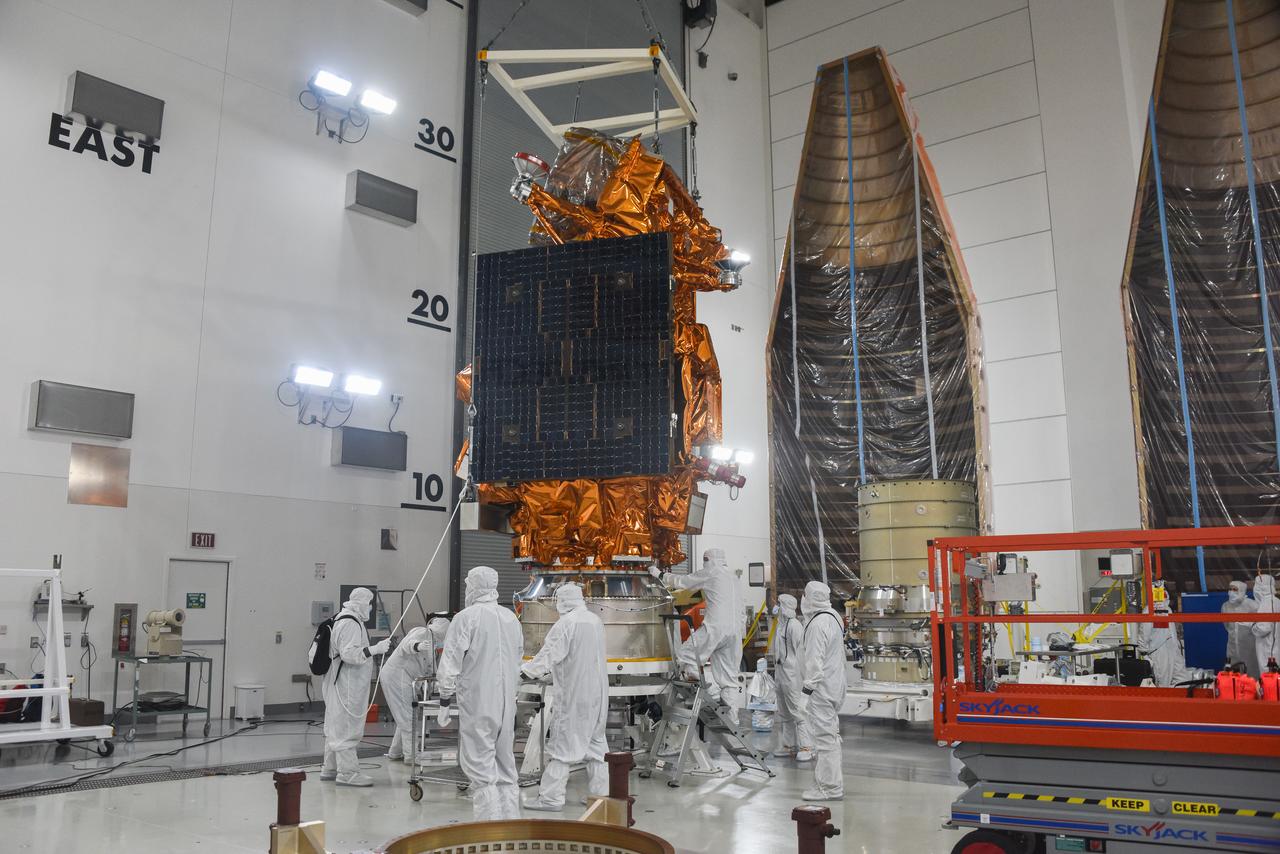
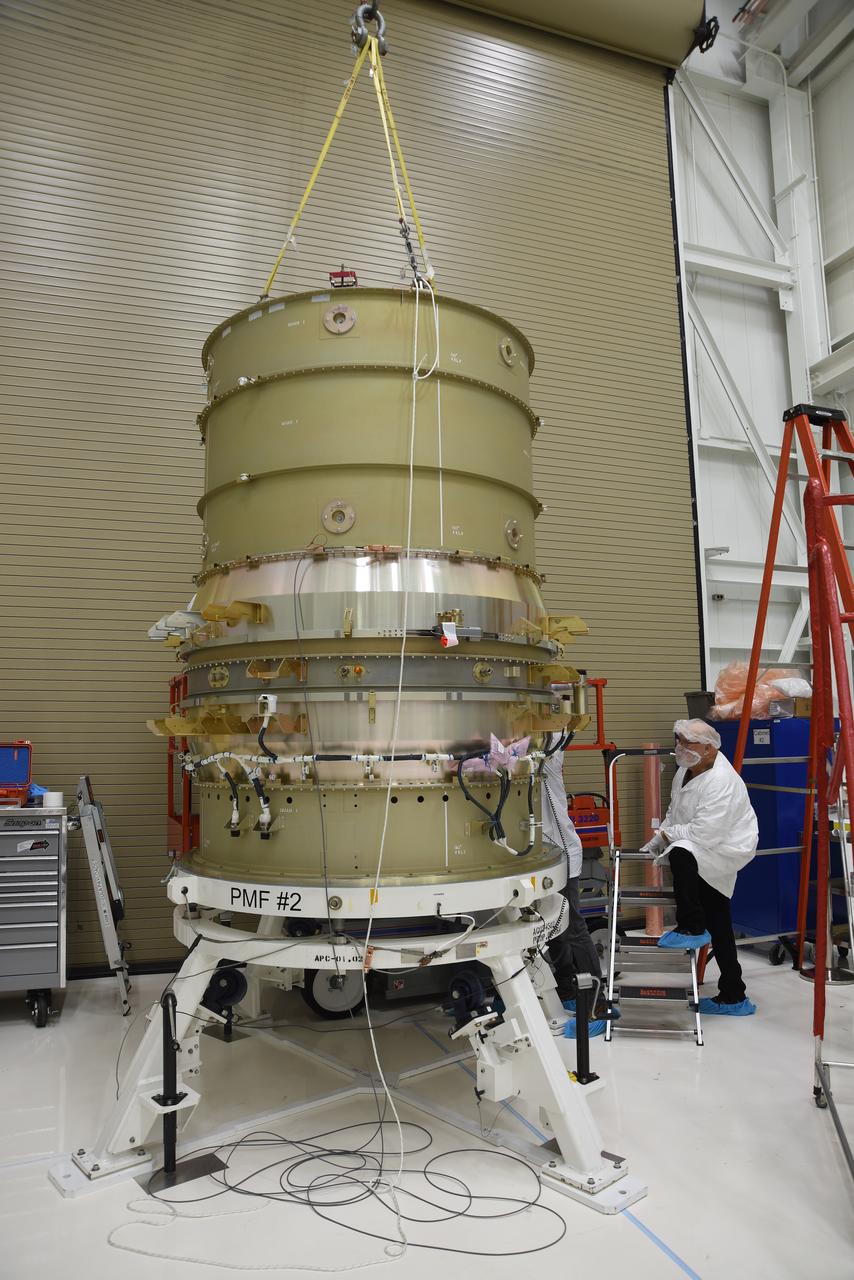
Technicians assist as a crane is used to move the National Oceanic and Atmospheric Administration’s Joint Polar Satellite System (JPSS-2) for mating to the spacecraft adapter inside the Astrotech Space Operations facility at Vandenberg Space Force Base (VSFB) in California on Oct. 4, 2022. JPSS-2 is the third satellite in the Joint Polar Satellite System series. It is scheduled to lift off from VSFB on Nov. 1 from Space Launch Complex-3. JPSS-2, which will be renamed NOAA-21 after reaching orbit, will join a constellation of JPSS satellites that orbit from the North to the South pole, circling Earth 14 times a day and providing a full view of the entire globe twice daily.
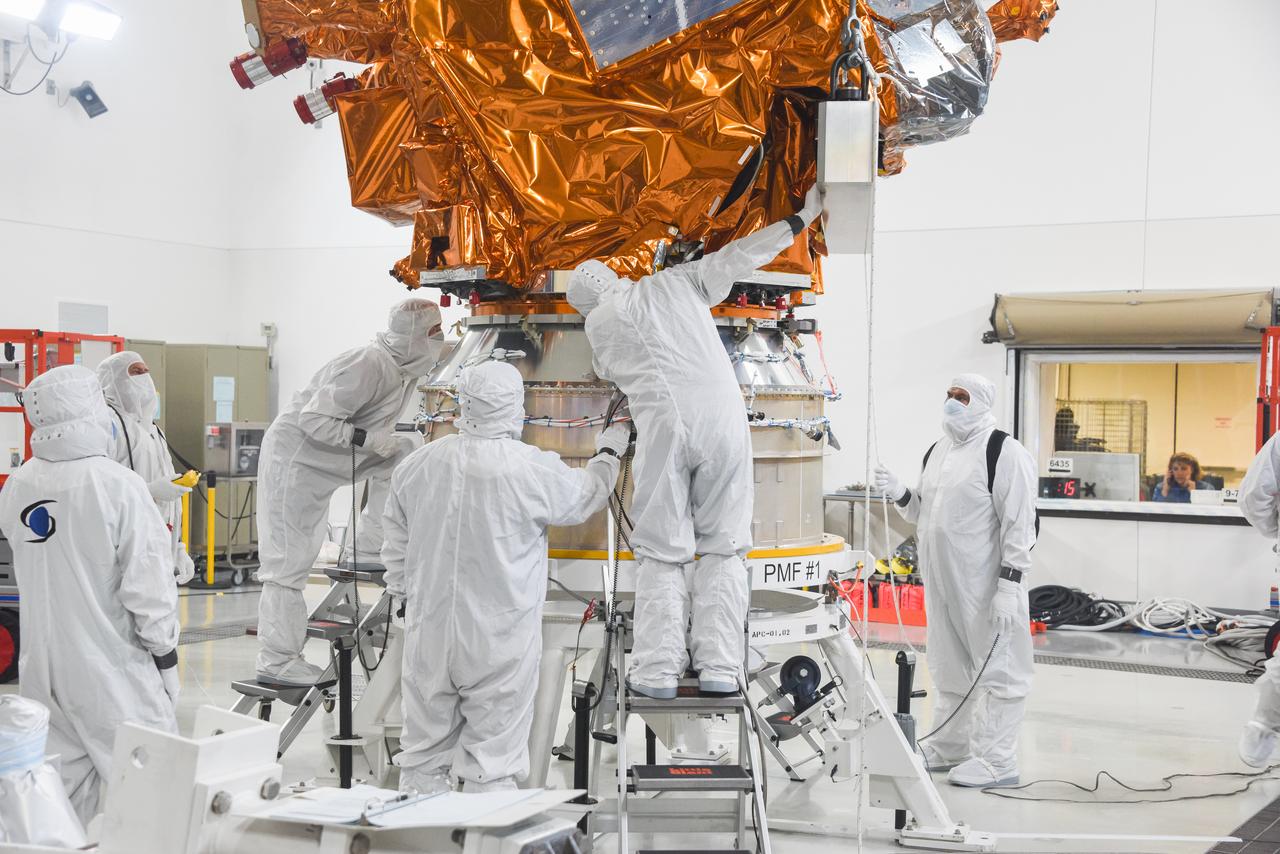
The National Oceanic and Atmospheric Administration’s Joint Polar Satellite System (JPSS-2) is now secured on the spacecraft adapter inside the Astrotech Space Operations facility at Vandenberg Space Force Base (VSFB) in California on Oct. 4, 2022. JPSS-2 is the third satellite in the Joint Polar Satellite System series. It is scheduled to lift off from VSFB on Nov. 1 from Space Launch Complex-3. JPSS-2, which will be renamed NOAA-21 after reaching orbit, will join a constellation of JPSS satellites that orbit from the North to the South pole, circling Earth 14 times a day and providing a full view of the entire globe twice daily.
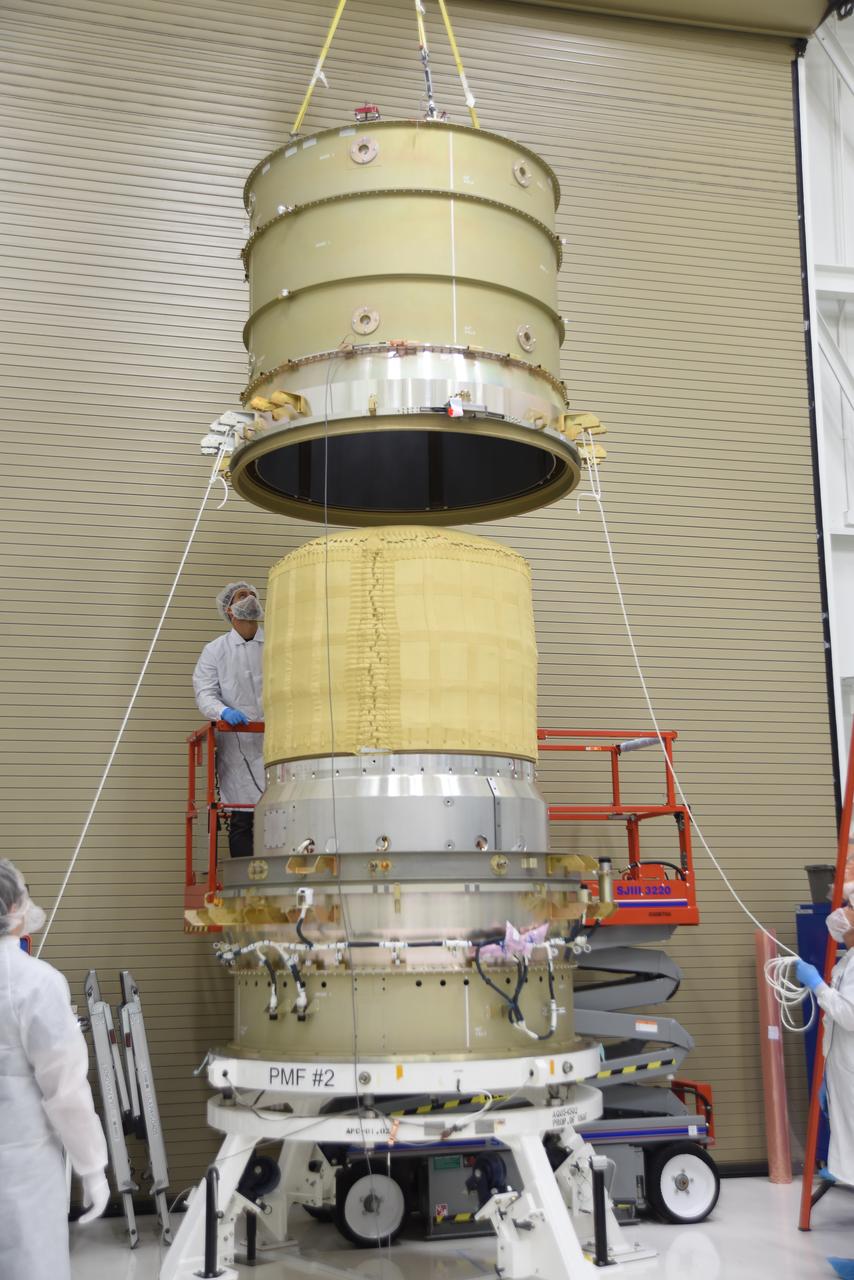
Technicians assist as a crane is used to lower the National Oceanic and Atmospheric Administration’s Joint Polar Satellite System (JPSS-2) onto the spacecraft adapter inside the Astrotech Space Operations facility at Vandenberg Space Force Base (VSFB) in California on Oct. 4, 2022. JPSS-2 is the third satellite in the Joint Polar Satellite System series. It is scheduled to lift off from VSFB on Nov. 1 from Space Launch Complex-3. JPSS-2, which will be renamed NOAA-21 after reaching orbit, will join a constellation of JPSS satellites that orbit from the North to the South pole, circling Earth 14 times a day and providing a full view of the entire globe twice daily.
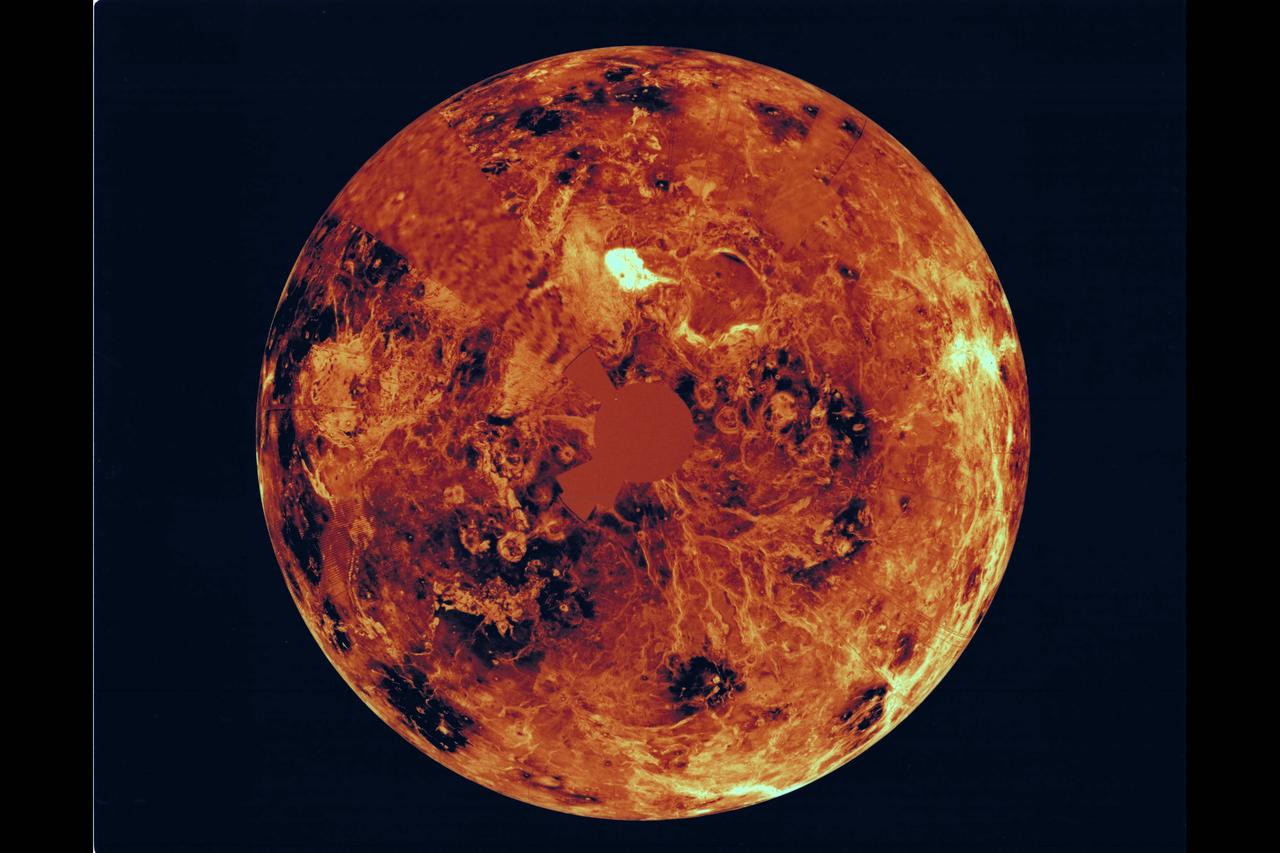
The northern hemisphere is displayed in this global view of the surface of Venus. The north pole is at the center of the image; with 0 degrees, 90 degrees , 180 degrees, 270 degrees east longitudes at 6, 3, 12 and 9 0'clock positions, repectively, of an imagery clock face. Magellan synthetic aperture radar mosaics from the first cycle of Magelolan mapping are mapped onto a computer-simulated globe to create this image. Data gaps are filled with Pioneere-Venus Orbiter data, or a constant mid-range value. Simulated color is used to enhance small-scale structure. The simulated hues are based on color images recorded by the Soviet Venera 13 & 14 spacecraft.
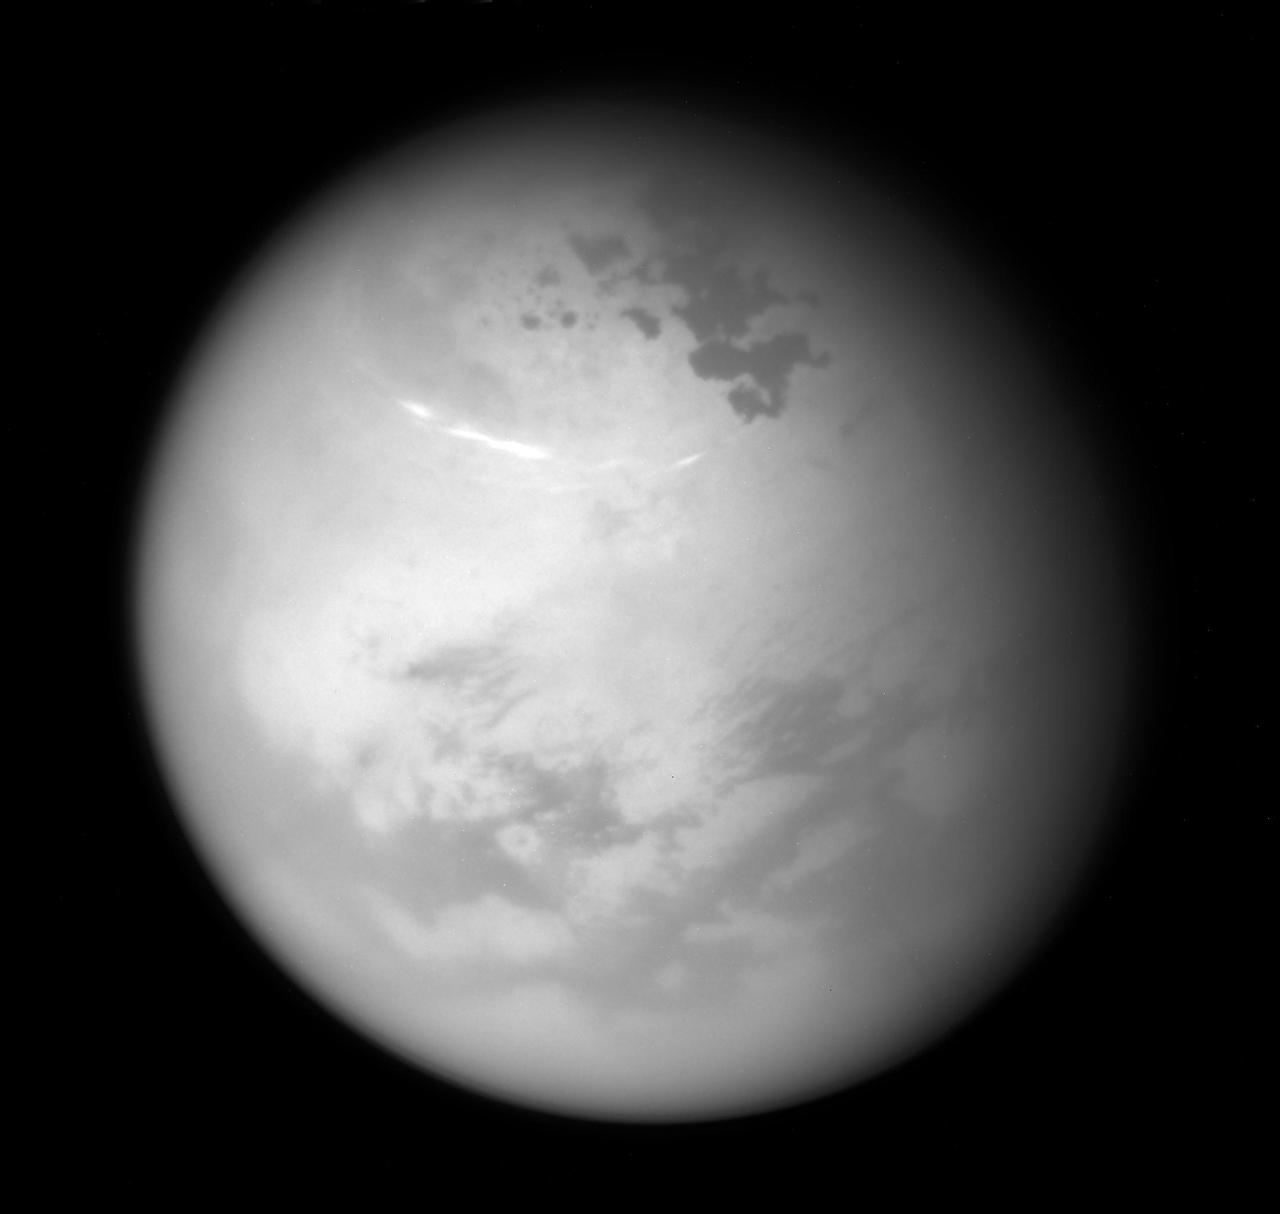
NASA's Cassini spacecraft sees bright methane clouds drifting in the summer skies of Saturn's moon Titan, along with dark hydrocarbon lakes and seas clustered around the north pole. Compared to earlier in Cassini's mission, most of the surface in the moon's northern high latitudes is now illuminated by the sun. The image was taken with the Cassini spacecraft narrow-angle camera on June 9, 2017, using a spectral filter that preferentially admits wavelengths of near-infrared light centered at 938 nanometers. Cassini obtained the view at a distance of about 315,000 miles (507,000 kilometers) from Titan. https://photojournal.jpl.nasa.gov/catalog/PIA21615
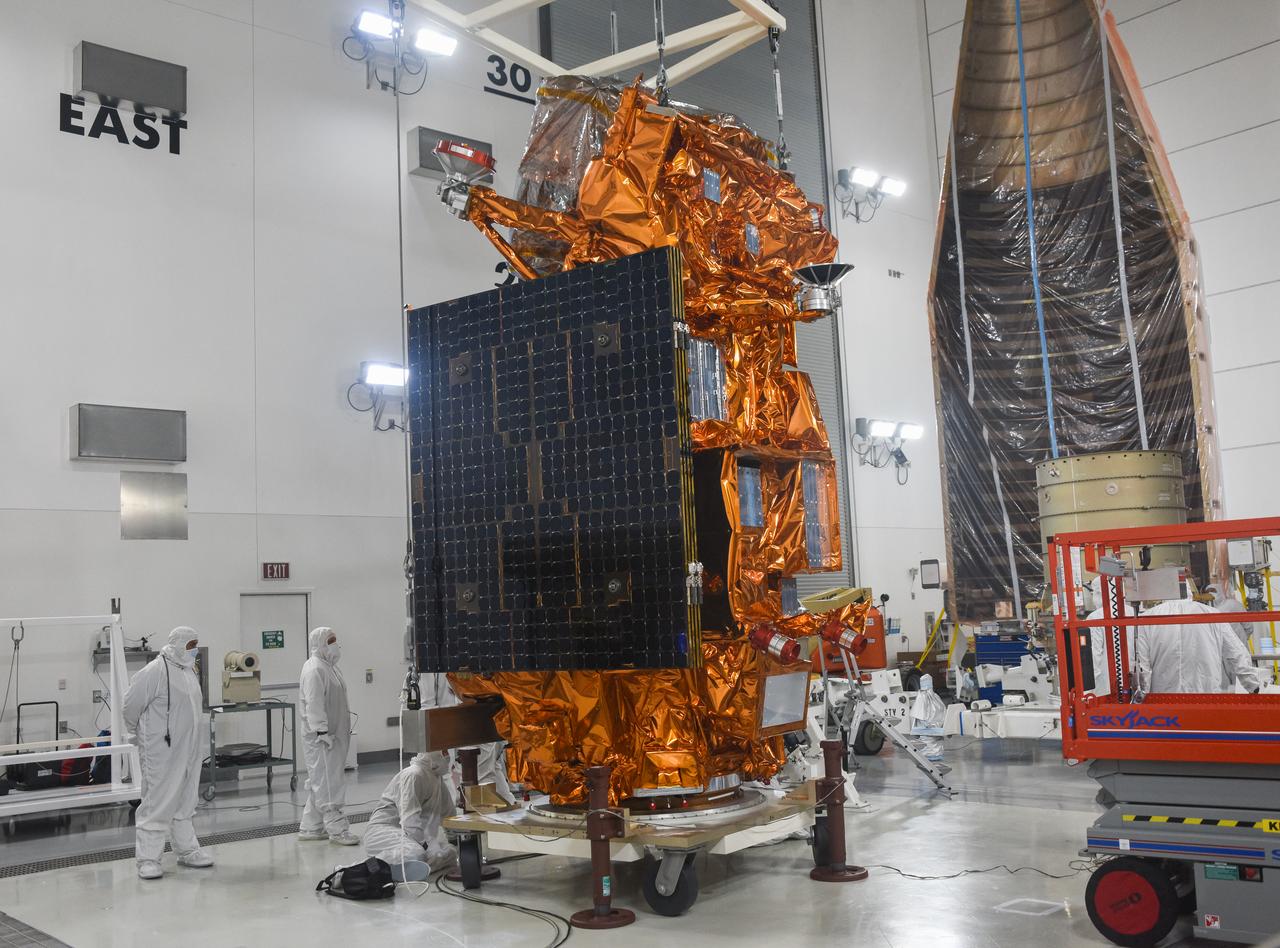
Technicians prepare the National Oceanic and Atmospheric Administration’s Joint Polar Satellite System (JPSS-2) to be attached to its spacecraft adapter inside the Astrotech Space Operations facility at Vandenberg Space Force Base (VSFB) in California on Oct. 4, 2022. JPSS-2 is the third satellite in the Joint Polar Satellite System series. It is scheduled to lift off from VSFB on Nov. 1 from Space Launch Complex-3. JPSS-2, which will be renamed NOAA-21 after reaching orbit, will join a constellation of JPSS satellites that orbit from the North to the South pole, circling Earth 14 times a day and providing a full view of the entire globe twice daily.
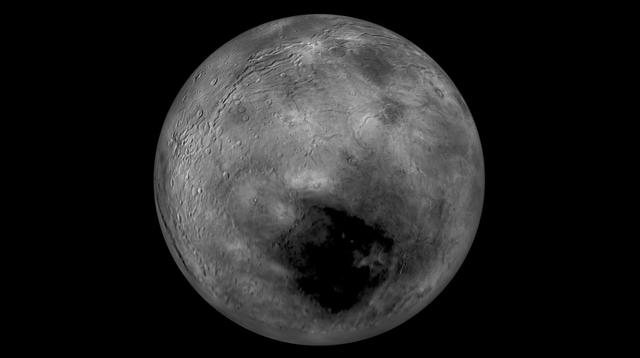
Images from NASA New Horizons spacecraft were used to create a flyover video (PIA19965) of Pluto largest moon, Charon. The flight starts with the informally named Mordor dark region near Charon north pole. In the video, the camera then moves south to a vast chasm, descending from 1,100 miles (1,800 kilometers) to just 40 miles (60 kilometers) above the surface to fly through the canyon system. From there it's a turn to the south to view the plains and "moat mountain," informally named Kubrick Mons, a prominent peak surrounded by a topographic depression. http://photojournal.jpl.nasa.gov/catalog/PIA19965

Technicians prepare the spacecraft adapter to be attached to the National Oceanic and Atmospheric Administration’s Joint Polar Satellite System (JPSS-2) inside the Astrotech Space Operations facility at Vandenberg Space Force Base (VSFB) in California on Oct. 4, 2022. JPSS-2 is the third satellite in the Joint Polar Satellite System series. It is scheduled to lift off from VSFB on Nov. 1 from Space Launch Complex-3. JPSS-2, which will be renamed NOAA-21 after reaching orbit, will join a constellation of JPSS satellites that orbit from the North to the South pole, circling Earth 14 times a day and providing a full view of the entire globe twice daily.
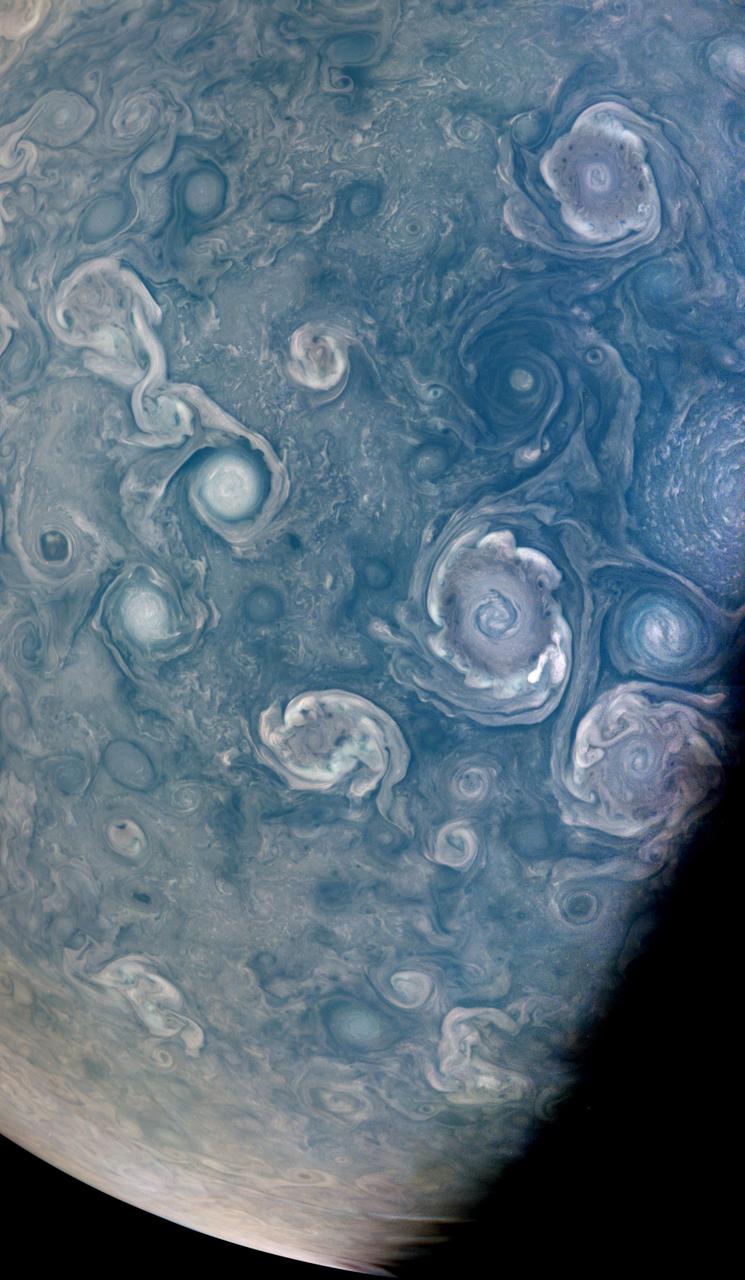
As NASA's Juno mission completed its 43rd close flyby of Jupiter on July 5, 2022, its JunoCam instrument captured this striking view of vortices – hurricane-like spiral wind patterns – near the planet's north pole. These powerful storms can be over 30 miles (50 kilometers) in height and hundreds of miles across. Figuring out how they form is key to understanding Jupiter's atmosphere, as well as the fluid dynamics and cloud chemistry that create the planet's other atmospheric features. Scientists are particularly interested in the vortices' varying shapes, sizes, and colors. For example, cyclones, which spin counter-clockwise in the northern hemisphere and clockwise in the southern, and anti-cyclones, which rotate clockwise in the northern hemisphere and counter-clockwise in the southern hemisphere, exhibit very different colors and shapes. A NASA citizen science project, Jovian Vortex Hunter, seeks help from volunteer members of the public to spot and help categorize vortices and other atmospheric phenomena visible in JunoCam photos of Jupiter. This process does not require specialized training or software, and can be done by anyone, anywhere, with a cellphone or laptop. As of July 2022, 2,404 volunteers had made 376,725 classifications using the Jovian Vortex Hunter project web site at https://www.zooniverse.org/projects/ramanakumars/jovian-vortex-hunter. Another citizen scientist, Brian Swift, created this enhanced color and contrast view of vortices using raw JunoCam image data. At the time the raw image was taken, the Juno spacecraft was about 15,600 miles (25,100 kilometers) above Jupiter's cloud tops, at a latitude of about 84 degrees. https://photojournal.jpl.nasa.gov/catalog/PIA25017

This view shows Mercury's north polar region, colored by the maximum biannual surface temperature, which ranges from >400 K (red) to 50 K (purple). As expected for the Solar System's innermost planet, areas of Mercury's surface that are sunlit reach high temperatures, and hence most of this image is colored red! In contrast, some craters near Mercury's poles have regions that remain permanently in shadow, and in these regions even the maximum temperatures can be extremely low. Evidence from MESSENGER and Earth-based observations indicate that water ice deposits are present in these cold craters. The craters nearest Mercury' poles have surface temperatures less than 100 K (-173°C, -280°F), and water ice is stable on the surface, such as in Prokofiev. However, many craters near but somewhat farther from Mercury's poles have cold, permanently shadowed interiors, but the maximum temperature is too high for water ice to persist at the surface. In these craters, water ice is present but is buried beneath a thin, low-reflectance volatile layer likely consisting of organic-rich material, such as in Berlioz crater. http://photojournal.jpl.nasa.gov/catalog/PIA19247

Nature is often more complex and wonderful than it first appears. For example, although it looks like a simple hexagon, this feature surrounding Saturn's north pole is really a manifestation of a meandering polar jet stream. Scientists are still working to understand more about its origin and behavior. For more on the hexagon, see PIA11682. This view looks toward the sunlit side of the rings from about 33 degrees above the ringplane. The image was taken in red light with the Cassini spacecraft wide-angle camera on July 24, 2013. The view was acquired at a distance of approximately 605,000 miles (973,000 kilometers) from Saturn and at a Sun-Saturn-spacecraft, or phase, angle of 19 degrees. Image scale is 36 miles (58 kilometers) per pixel. http://photojournal.jpl.nasa.gov/catalog/PIA18287
Like a giant eye for the giant planet, Saturn great vortex at its north pole appears to stare back at Cassini as NASA Cassini spacecraft stares at it. Measurements have sized the "eye" at a staggering 1,240 miles (2,000 kilometers) across with cloud speeds as fast as 330 miles per hour (150 meters per second). For color views of the eye and the surrounding region, see PIA14946 and PIA14944. The image was taken with the Cassini spacecraft narrow-angle camera on April 2, 2014 using a combination of spectral filters which preferentially admit wavelengths of near-infrared light centered at 748 nanometers. The view was obtained at a distance of approximately 1.4 million miles (2.2 million kilometers) from Saturn and at a Sun-Saturn-spacecraft, or phase, angle of 43 degrees. Image scale is 8 miles (13 kilometers) per pixel. http://photojournal.jpl.nasa.gov/catalog/PIA18273

During its flight and lunar orbit, NASA’s Clementine spacecraft returned images of the planet Earth and the Moon. This collection of UVVIS camera Clementine images shows the Earth from the Moon and 3 images of the Earth. The image on the left shows the Earth as seen across the lunar north pole; the large crater in the foreground is Plaskett. The Earth actually appeared about twice as far above the lunar horizon as shown. The top right image shows the Earth as viewed by the UVVIS camera while Clementine was in transit to the Moon; swirling white cloud patterns indicate storms. The two views of southeastern Africa were acquired by the UVVIS camera while Clementine was in low Earth orbit early in the mission. http://photojournal.jpl.nasa.gov/catalog/PIA00432

Reflected sunlight is the source of the illumination for visible wavelength images such as the one above. However, at longer infrared wavelengths, direct thermal emission from objects dominates over reflected sunlight. This enabled instruments that can detect infrared radiation to observe the pole even in the dark days of winter when Cassini first arrived at Saturn and Saturn's northern hemisphere was shrouded in shadow. Now, 13 years later, the north pole basks in full sunlight. Close to the northern summer solstice, sunlight illuminates the previously dark region, permitting Cassini scientists to study this area with the spacecraft's full suite of imagers. This view looks toward the northern hemisphere from about 34 degrees above Saturn's ringplane. The image was taken with the Cassini spacecraft wide-angle camera on April 25, 2017 using a spectral filter which preferentially admits wavelengths of near-infrared light centered at 752 nanometers. The view was acquired at a distance of approximately 274,000 miles (441,000 kilometers) from Saturn and at a Sun-Saturn-spacecraft, or phase, angle of 111 degrees. Image scale is 16 miles (26 kilometers) per pixel. The Cassini spacecraft ended its mission on Sept. 15, 2017. https://photojournal.jpl.nasa.gov/catalog/PIA21351
As Saturn's northern hemisphere summer approaches, the shadows of the rings creep ever southward across the planet. Here, the ring shadows appear to obscure almost the entire southern hemisphere, while the planet's north pole and its six-sided jet stream, known as "the hexagon," are fully illuminated by the sun. When NASA's Cassini spacecraft arrived at Saturn 12 years ago, the shadows of the rings lay far to the north on the planet (see PIA06077). As the mission progressed and seasons turned on the slow-orbiting giant, equinox arrived and the shadows of the rings became a thin line at the equator (see PIA11667). This view looks toward the sunlit side of the rings from about 16 degrees above the ring plane. The image was taken in red light with the Cassini spacecraft wide-angle camera on March 19, 2016. The view was obtained at a distance of approximately 1.7 million miles (2.7 million kilometers) from Saturn and at a Sun-Saturn-spacecraft, or phase, angle of 92 degrees. Image scale is 100 miles (160 kilometers) per pixel. http://photojournal.jpl.nasa.gov/catalog/PIA20486

With this view, Cassini captured one of its last looks at Saturn and its main rings from a distance. The Saturn system has been Cassini's home for 13 years, but that journey is nearing its end. Cassini has been orbiting Saturn for nearly a half of a Saturnian year but that journey is nearing its end. This extended stay has permitted observations of the long-term variability of the planet, moons, rings, and magnetosphere, observations not possible from short, fly-by style missions. When the spacecraft arrived at Saturn in 2004, the planet's northern hemisphere, seen here at top, was in darkness, just beginning to emerge from winter. Now at journey's end, the entire north pole is bathed in the continuous sunlight of summer. Images taken on Oct. 28, 2016 with the wide angle camera using red, green and blue spectral filters were combined to create this color view. This view looks toward the sunlit side of the rings from about 25 degrees above the ringplane. The view was acquired at a distance of approximately 870,000 miles (1.4 million kilometers) from Saturn. Image scale is 50 miles (80 kilometers) per pixel. https://photojournal.jpl.nasa.gov/catalog/PIA21345
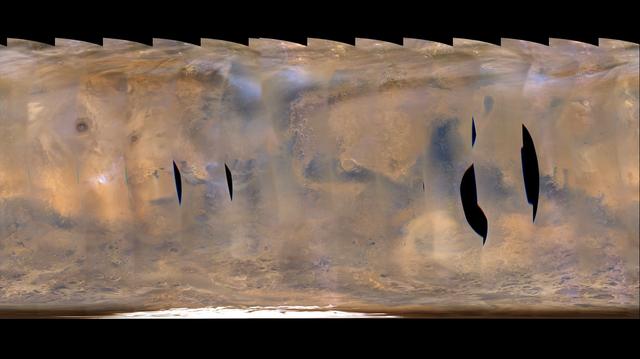
This frame from a movie clip of hundreds of images from NASA's Mars Reconnaissance Orbiter shows a global map of Mars with atmospheric changes from Feb. 18, 2017 through March 6, 2017, a period when two regional-scale dust storms appeared. It combines hundreds of images from the Mars Color Imager (MARCI) camera on NASA's Mars Reconnaissance Orbiter. The date for each map in the series is given at upper left. Dust storms appear as pale tan. In the opening frames, one appears left of center, near the top (north) of the map, then grows in size as it moves south, eventually spreading to about half the width of the map after reaching the southern hemisphere. As the dust from that first storm becomes more diffuse in the south, another storm appears near the center of the map in the final frames. In viewing the movie, it helps to understand some of the artifacts produced by the nature of MARCI images when seen in animation. MARCI acquires images in swaths from pole-to-pole during the dayside portion of each orbit. The camera can cover the entire planet in just over 12 orbits, and takes about one day to accumulate this coverage. The individual swaths for each day are assembled into a false-color, map-projected mosaic for the day. Equally spaced blurry areas that run from south-to-north result from the high off-nadir viewing geometry in those parts of each swath, a product of the spacecraft's low orbit. Portions with sharper-looking details are the central part of an image, viewing more directly downward through less atmosphere than the obliquely viewed portions. MARCI has a 180-degree field of view, and Mars fills about 78 percent of that field of view when the camera is pointed down at the planet. However, the Mars Reconnaissance Orbiter often is pointed to one side or the other off its orbital track in order to acquire targeted observations by other imaging systems on the spacecraft. When such rolls exceed about 20 degrees, gaps occur in the mosaic of MARCI swaths. Other dark gaps appear where data are missing. It isn't easy to see the actual dust motion in the atmosphere in these images, owing to the apparent motion of these artifacts. However, by concentrating on specific surface features (craters, prominent ice deposits, etc.) and looking for the tan clouds of dust, it is possible to see where the storms start and how they grow, move and eventually dissipate. Movies are available at http://photojournal.jpl.nasa.gov/catalog/PIA21484

In this close-up aerial view, the Delta II rocket with the THEMIS spacecraft atop sits ready for launch on Pad 17-B at Cape Canaveral Air Force Station. THEMIS, an acronym for Time History of Events and Macroscale Interactions during Substorms, consists of five identical probes that will track violent, colorful eruptions near the North Pole. This will be the largest number of scientific satellites NASA has ever launched into orbit aboard a single rocket. The THEMIS mission aims to unravel the mystery behind auroral substorms, an avalanche of magnetic energy powered by the solar wind that intensifies the northern and southern lights. The mission will investigate what causes auroras in the Earth’s atmosphere to dramatically change from slowly shimmering waves of light to wildly shifting streaks of bright color. Launch is scheduled for 6:05 p.m.
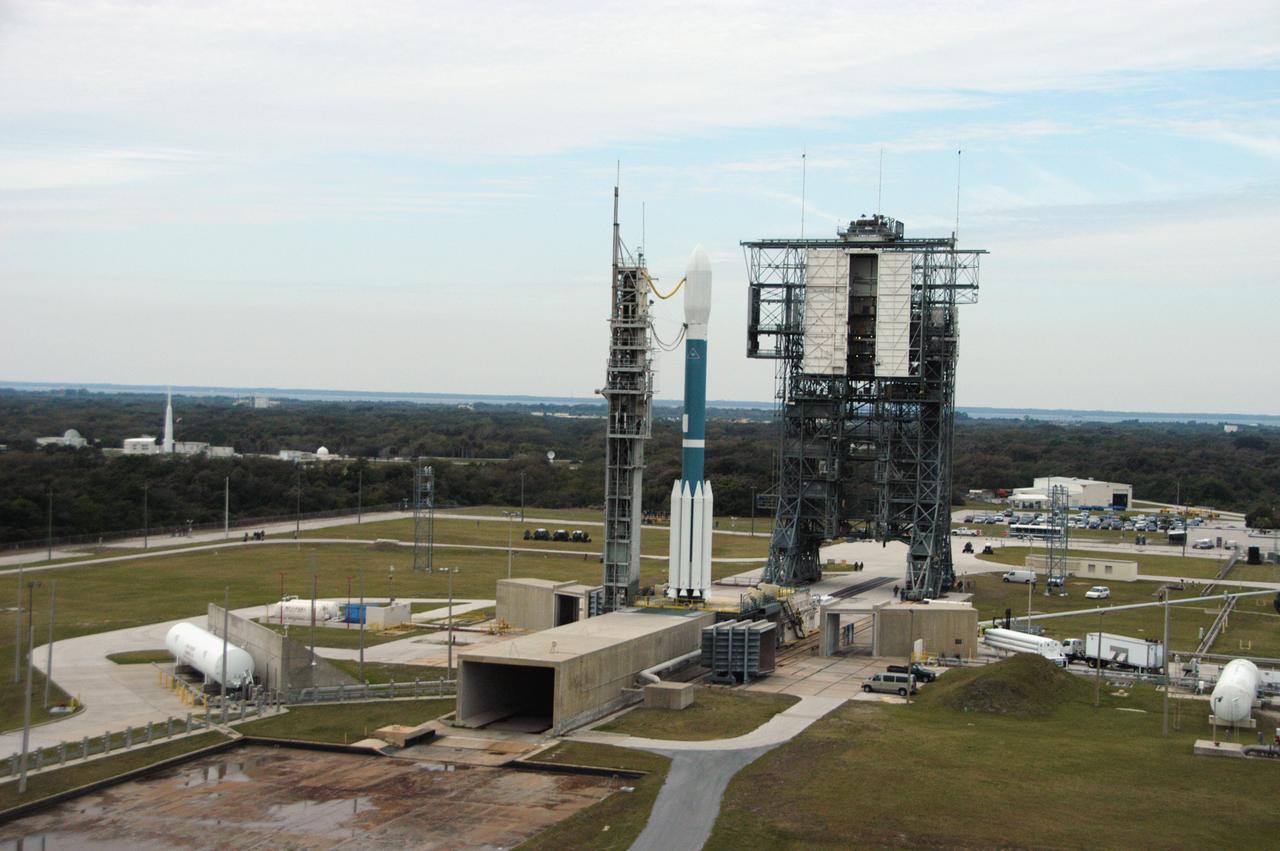
In this aerial view, the Delta II rocket with the THEMIS spacecraft sits ready for launch on Pad 17-B at Cape Canaveral Air Force Station, as the mobile service tower moves away from the pad. THEMIS, an acronym for Time History of Events and Macroscale Interactions during Substorms, consists of five identical probes that will track violent, colorful eruptions near the North Pole. This will be the largest number of scientific satellites NASA has ever launched into orbit aboard a single rocket. The THEMIS mission aims to unravel the mystery behind auroral substorms, an avalanche of magnetic energy powered by the solar wind that intensifies the northern and southern lights. The mission will investigate what causes auroras in the Earth’s atmosphere to dramatically change from slowly shimmering waves of light to wildly shifting streaks of bright color. Launch is scheduled for 6:05 p.m.

The main image and the inset image were taken by the JunoCam imager about NASA's Juno spacecraft a few hours before its closest approach to Jupiter on its 38th perijove pass, on Nov. 29, 2021, during an encounter with the Jovian moon Io. After snapping a series of Io images, JunoCam acquired this picture of Jupiter and Io together. Much fainter and more distant is Jupiter's moon Callisto, barely visible below and to the right of Io. The original JunoCam image used to produce this view was taken from an altitude of 15,404 miles (24,791 kilometers) above Jupiter's cloud tops near its north pole. At the time, Io was at a distance of 270,648 miles (435,567 kilometers), and Callisto was almost 1.2 million miles (2 million kilometers). Citizen scientist Brian Swift processed the main image and inset to enhance the color and contrast. https://photojournal.jpl.nasa.gov/catalog/PIA25032
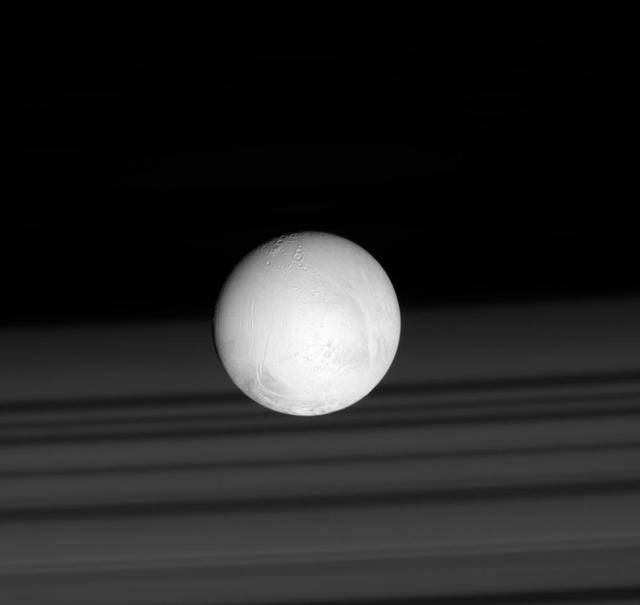
Saturn's rings cast shadows on the planet's cloud tops, providing a perfect backdrop for the brilliant sphere of Saturn's moon Enceladus. The tiny world's bright white surface results in part from a snow of material originating from the towering plume of icy particles at Enceladus' south pole. This image looks toward the leading side of Enceladus (504 kilometers, or 313 miles across). North is up. The image was taken in visible light with the Cassini spacecraft's narrow-angle camera on June 28, 2007. The view was acquired at a distance of approximately 281,000 kilometers (175,000 miles) from Enceladus. Image scale is about 2 kilometers (1 mile) per pixel. The Cassini spacecraft ended its mission on Sept. 15, 2017 https://photojournal.jpl.nasa.gov/catalog/PIA17216
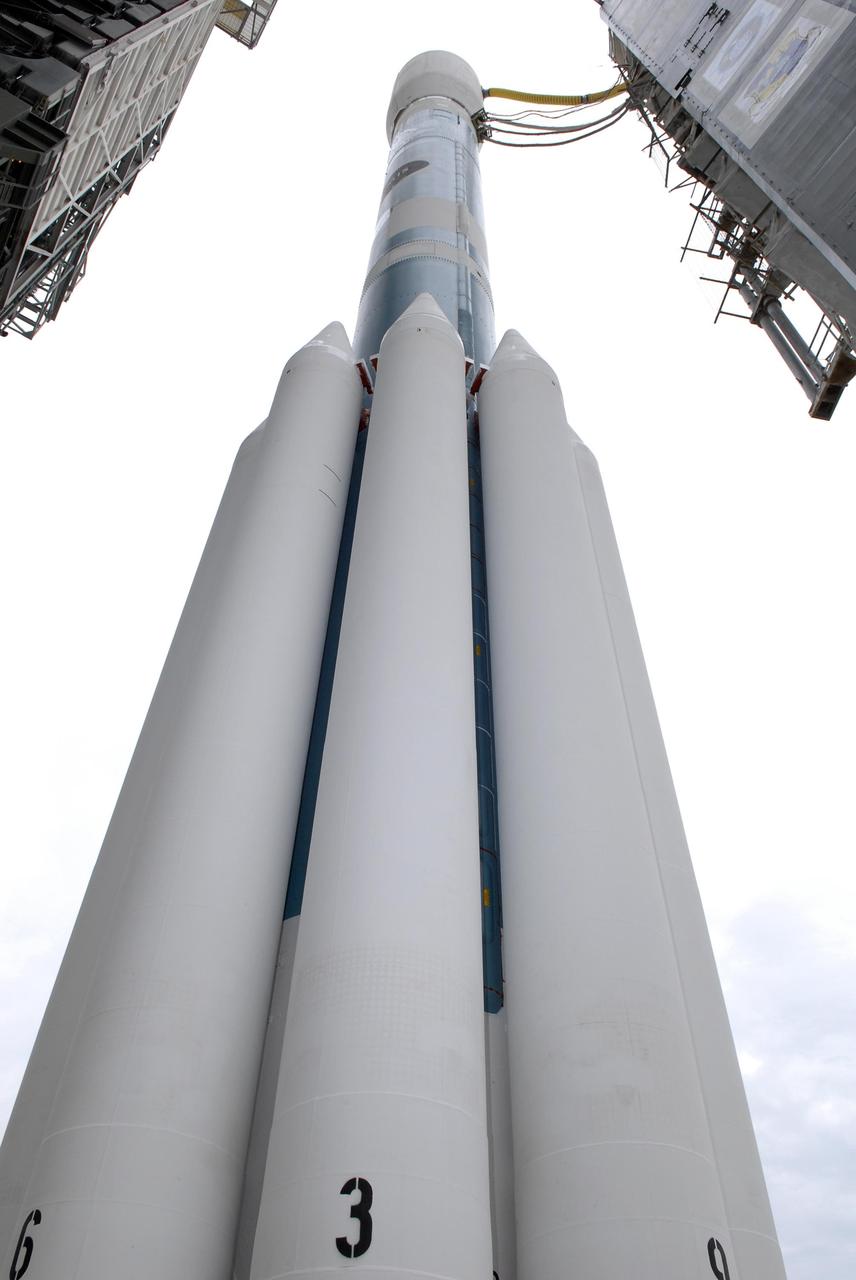
KENNEDY SPACE CENTER, FLA. -- At Launch Pad 17-B at Cape Canaveral Air Force Station, an unusual view of the Delta II rocket with the THEMIS spacecraft atop gives the solid rocket boosters a "larger than life" appearance as the mobile service tower moves away. THEMIS, an acronym for Time History of Events and Macroscale Interactions during Substorms, consists of five identical probes that will track violent, colorful eruptions near the North Pole. This will be the largest number of scientific satellites NASA has ever launched into orbit aboard a single rocket. The THEMIS mission aims to unravel the mystery behind auroral substorms, an avalanche of magnetic energy powered by the solar wind that intensifies the northern and southern lights. The mission will investigate what causes auroras in the Earth’s atmosphere to dramatically change from slowly shimmering waves of light to wildly shifting streaks of bright color. Launch is scheduled for 6:05 p.m. Photo credit: NASA/Kim Shiflett
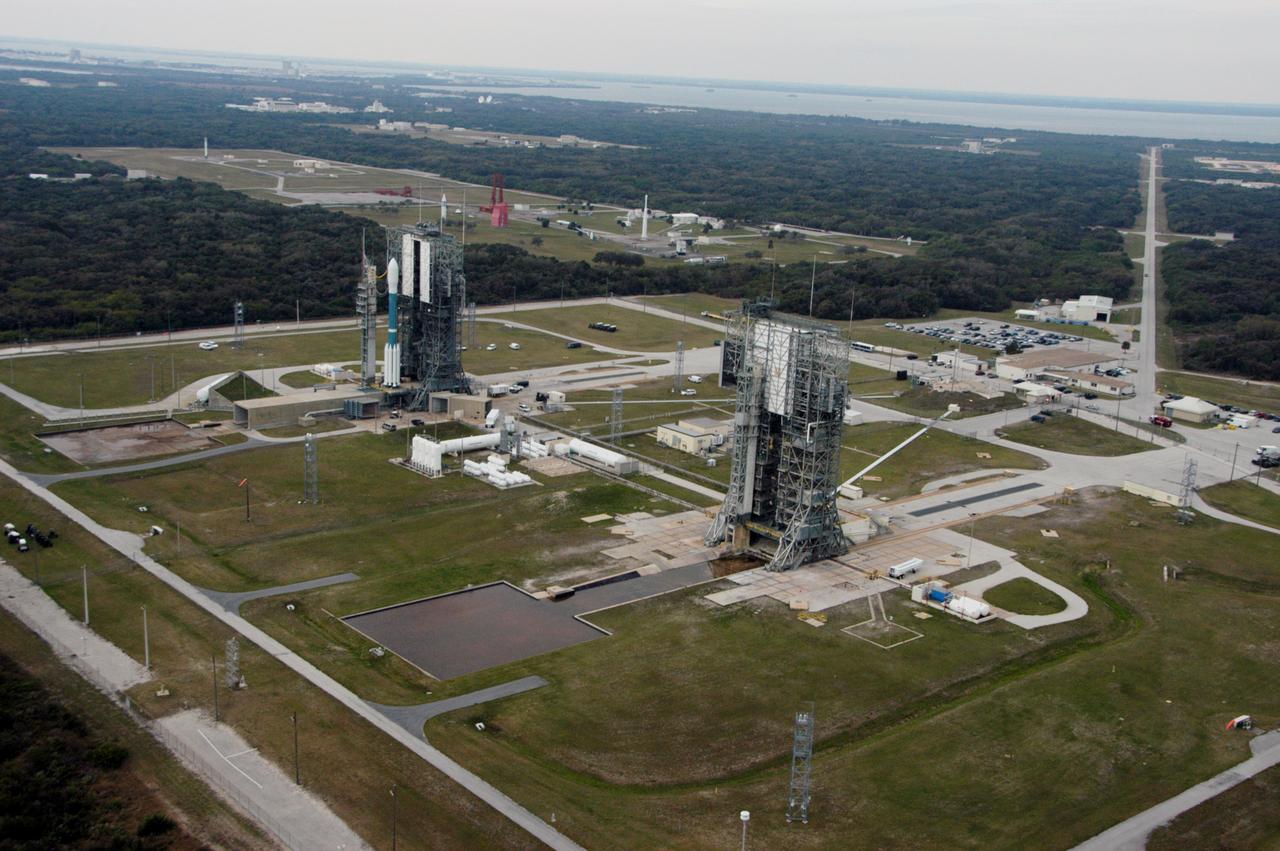
The Delta II rocket with the THEMIS spacecraft atop sits ready for launch on Pad 17-B at Cape Canaveral Air Force Station in this aerial view of the launch complex area as the mobile service tower begins to move away. THEMIS, an acronym for Time History of Events and Macroscale Interactions during Substorms, consists of five identical probes that will track violent, colorful eruptions near the North Pole. This will be the largest number of scientific satellites NASA has ever launched into orbit aboard a single rocket. The THEMIS mission aims to unravel the mystery behind auroral substorms, an avalanche of magnetic energy powered by the solar wind that intensifies the northern and southern lights. The mission will investigate what causes auroras in the Earth’s atmosphere to dramatically change from slowly shimmering waves of light to wildly shifting streaks of bright color. Launch is scheduled for 6:05 p.m.

KENNEDY SPACE CENTER, FLA. -- In this close-up aerial view, the Delta II rocket with the THEMIS spacecraft atop sits ready for launch on Pad 17-B at Cape Canaveral Air Force Station as the mobile service tower moves away from the pad. THEMIS, an acronym for Time History of Events and Macroscale Interactions during Substorms, consists of five identical probes that will track violent, colorful eruptions near the North Pole. This will be the largest number of scientific satellites NASA has ever launched into orbit aboard a single rocket. The THEMIS mission aims to unravel the mystery behind auroral substorms, an avalanche of magnetic energy powered by the solar wind that intensifies the northern and southern lights. The mission will investigate what causes auroras in the Earth’s atmosphere to dramatically change from slowly shimmering waves of light to wildly shifting streaks of bright color. Launch is scheduled for 6:05 p.m. Photo credit: NASA/George Shelton
Technicians secure the re-entry vehicle payload adapter canister for the Low-Earth Orbit Flight Test of an Inflatable Decelerator (LOFTID) onto the payload adapter separation systems canister as part of launch preparations occurring inside Building 836 at Vandenberg Space Force Base (VSFB) in California on Sept. 8, 2022. LOFTID is the secondary payload on NASA and the National Oceanic and Atmospheric Administration’s (NOAA) Joint Polar Satellite System-2 (JPSS-2) satellite mission. JPSS-2 is the third satellite in the Joint Polar Satellite System series. It is scheduled to lift off from VSFB on Nov. 1 from Space Launch Complex-3. JPSS-2, which will be renamed NOAA-21 after reaching orbit, will join a constellation of JPSS satellites that orbit from the North to the South pole, circling Earth 14 times a day and providing a full view of the entire globe twice daily.
Technicians use a crane to mate the re-entry vehicle payload adapter canister for the Low-Earth Orbit Flight Test of an Inflatable Decelerator (LOFTID) with the payload adapter separation systems canister as part of launch preparations occurring inside Building 836 at Vandenberg Space Force Base (VSFB) in California on Sept. 8, 2022. LOFTID is the secondary payload on NASA and the National Oceanic and Atmospheric Administration’s (NOAA) Joint Polar Satellite System-2 (JPSS-2) satellite mission. JPSS-2 is the third satellite in the Joint Polar Satellite System series. It is scheduled to lift off from VSFB on Nov. 1 from Space Launch Complex-3. JPSS-2, which will be renamed NOAA-21 after reaching orbit, will join a constellation of JPSS satellites that orbit from the North to the South pole, circling Earth 14 times a day and providing a full view of the entire globe twice daily.

KENNEDY SPACE CENTER, FLA. -- In this aerial view, the Delta II rocket with the THEMIS spacecraft sits ready for launch on Pad 17-B at Cape Canaveral Air Force Station, as the mobile service tower moves away from the pad. THEMIS, an acronym for Time History of Events and Macroscale Interactions during Substorms, consists of five identical probes that will track violent, colorful eruptions near the North Pole. This will be the largest number of scientific satellites NASA has ever launched into orbit aboard a single rocket. The THEMIS mission aims to unravel the mystery behind auroral substorms, an avalanche of magnetic energy powered by the solar wind that intensifies the northern and southern lights. The mission will investigate what causes auroras in the Earth’s atmosphere to dramatically change from slowly shimmering waves of light to wildly shifting streaks of bright color. Launch is scheduled for 6:05 p.m. Photo credit: NASA/George Shelton

Technicians prepare to lift the Low-Earth Orbit Flight Test of an Inflatable Decelerator (LOFTID) payload adapter separation systems canister, where it will go inside the payload adapter canister as part of launch preparations occurring inside Building 836 at Vandenberg Space Force Base (VSFB) in California on Sept. 1, 2022. LOFTID is the secondary payload on NASA and the National Oceanic and Atmospheric Administration’s (NOAA) Joint Polar Satellite System-2 (JPSS-2) satellite mission. JPSS-2 is the third satellite in the Joint Polar Satellite System series. It is scheduled to lift off from VSFB on Nov. 1 from Space Launch Complex-3. JPSS-2, which will be renamed NOAA-21 after reaching orbit, will join a constellation of JPSS satellites that orbit from the North to the South pole, circling Earth 14 times a day and providing a full view of the entire globe twice daily.
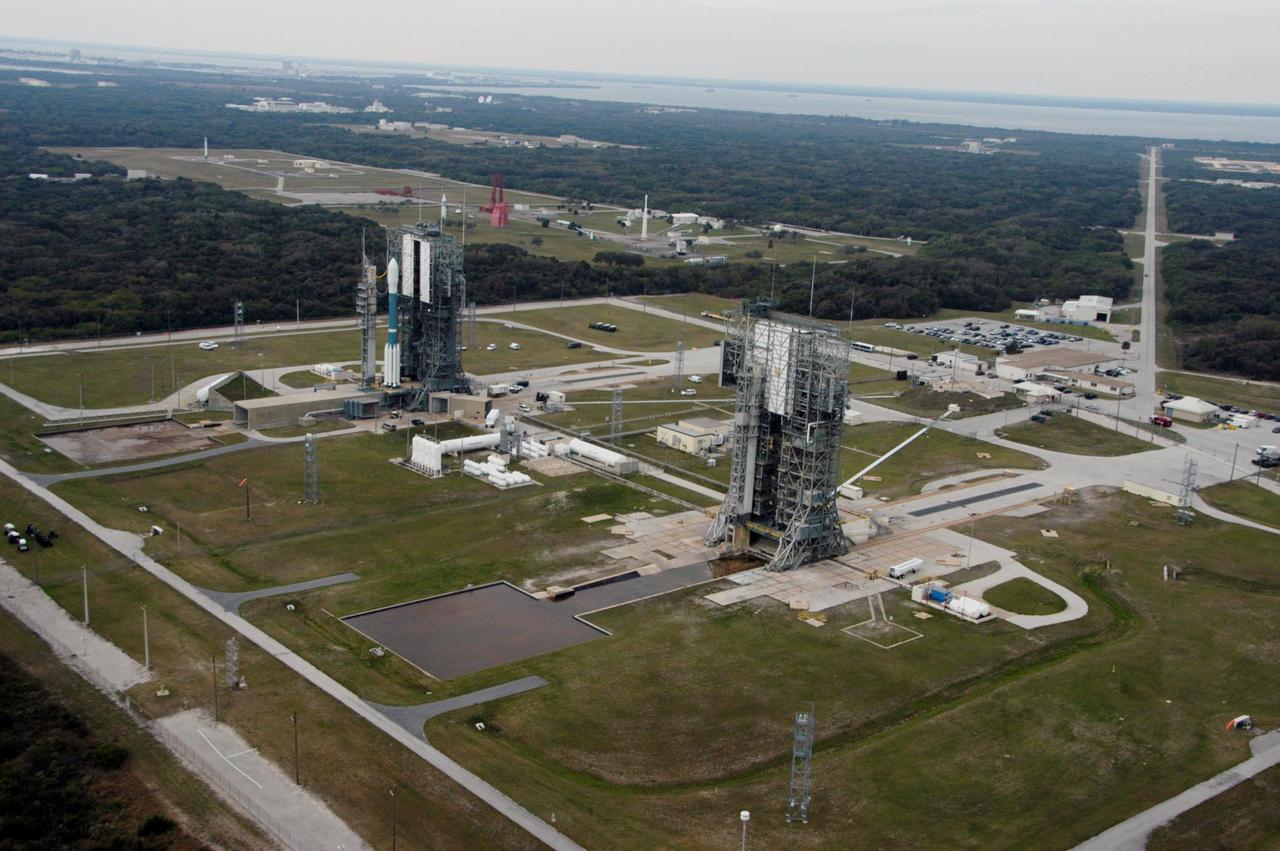
KENNEDY SPACE CENTER, FLA. -- The Delta II rocket with the THEMIS spacecraft atop sits ready for launch on Pad 17-B at Cape Canaveral Air Force Station in this aerial view of the launch complex area as the mobile service tower begins to move away. THEMIS, an acronym for Time History of Events and Macroscale Interactions during Substorms, consists of five identical probes that will track violent, colorful eruptions near the North Pole. This will be the largest number of scientific satellites NASA has ever launched into orbit aboard a single rocket. The THEMIS mission aims to unravel the mystery behind auroral substorms, an avalanche of magnetic energy powered by the solar wind that intensifies the northern and southern lights. The mission will investigate what causes auroras in the Earth’s atmosphere to dramatically change from slowly shimmering waves of light to wildly shifting streaks of bright color. Launch is scheduled for 6:05 p.m. Photo credit: NASA/George Shelton

KENNEDY SPACE CENTER, FLA. -- In this close-up aerial view, the Delta II rocket with the THEMIS spacecraft atop sits ready for launch on Pad 17-B at Cape Canaveral Air Force Station. THEMIS, an acronym for Time History of Events and Macroscale Interactions during Substorms, consists of five identical probes that will track violent, colorful eruptions near the North Pole. This will be the largest number of scientific satellites NASA has ever launched into orbit aboard a single rocket. The THEMIS mission aims to unravel the mystery behind auroral substorms, an avalanche of magnetic energy powered by the solar wind that intensifies the northern and southern lights. The mission will investigate what causes auroras in the Earth’s atmosphere to dramatically change from slowly shimmering waves of light to wildly shifting streaks of bright color. Launch is scheduled for 6:05 p.m. Photo credit: NASA/George Shelton
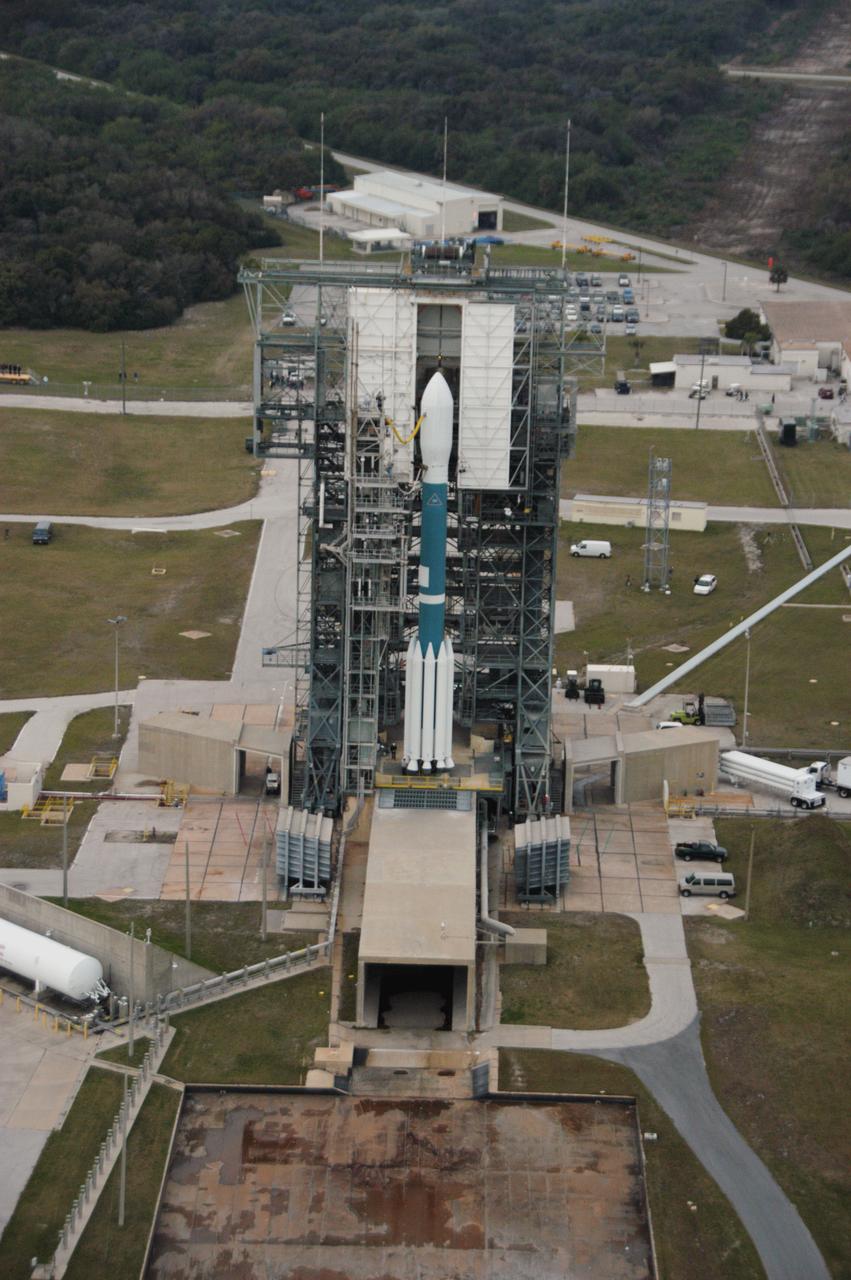
In this close-up aerial view, the Delta II rocket with the THEMIS spacecraft atop sits ready for launch on Pad 17-B at Cape Canaveral Air Force Station as the mobile service tower begins to move away. THEMIS, an acronym for Time History of Events and Macroscale Interactions during Substorms, consists of five identical probes that will track violent, colorful eruptions near the North Pole. This will be the largest number of scientific satellites NASA has ever launched into orbit aboard a single rocket. The THEMIS mission aims to unravel the mystery behind auroral substorms, an avalanche of magnetic energy powered by the solar wind that intensifies the northern and southern lights. The mission will investigate what causes auroras in the Earth’s atmosphere to dramatically change from slowly shimmering waves of light to wildly shifting streaks of bright color. Launch is scheduled for 6:05 p.m.
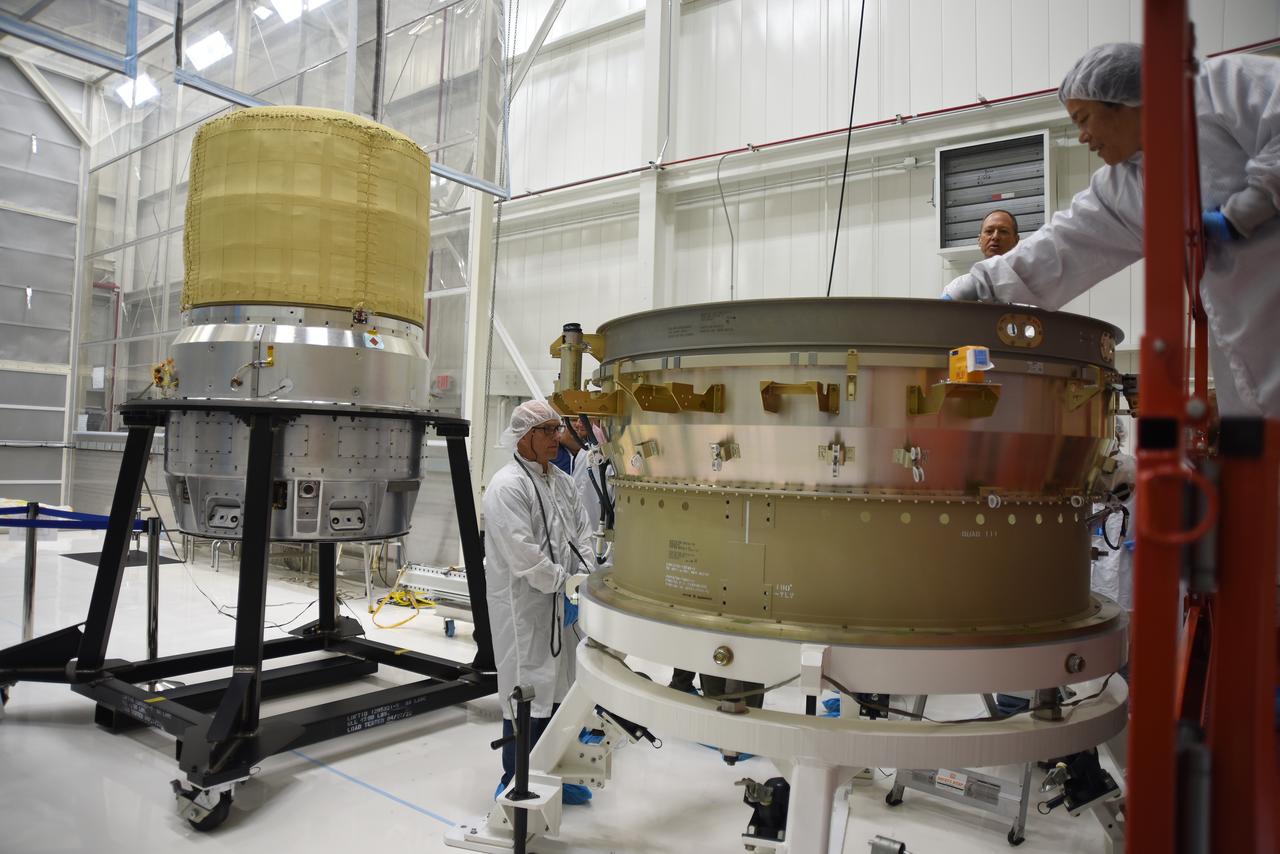
Technicians prepare the Low-Earth Orbit Flight Test of an Inflatable Decelerator (LOFTID) re-entry payload adapter interface ring for mating to the re-entry vehicle as part of launch preparations occurring inside Building 836 at Vandenberg Space Force Base (VSFB) in California on Sept. 7, 2022. LOFTID is the secondary payload on NASA and the National Oceanic and Atmospheric Administration’s (NOAA) Joint Polar Satellite System-2 (JPSS-2) satellite mission. JPSS-2 is the third satellite in the Joint Polar Satellite System series. It is scheduled to lift off from VSFB on Nov. 1 from Space Launch Complex-3. JPSS-2, which will be renamed NOAA-21 after reaching orbit, will join a constellation of JPSS satellites that orbit from the North to the South pole, circling Earth 14 times a day and providing a full view of the entire globe twice daily.
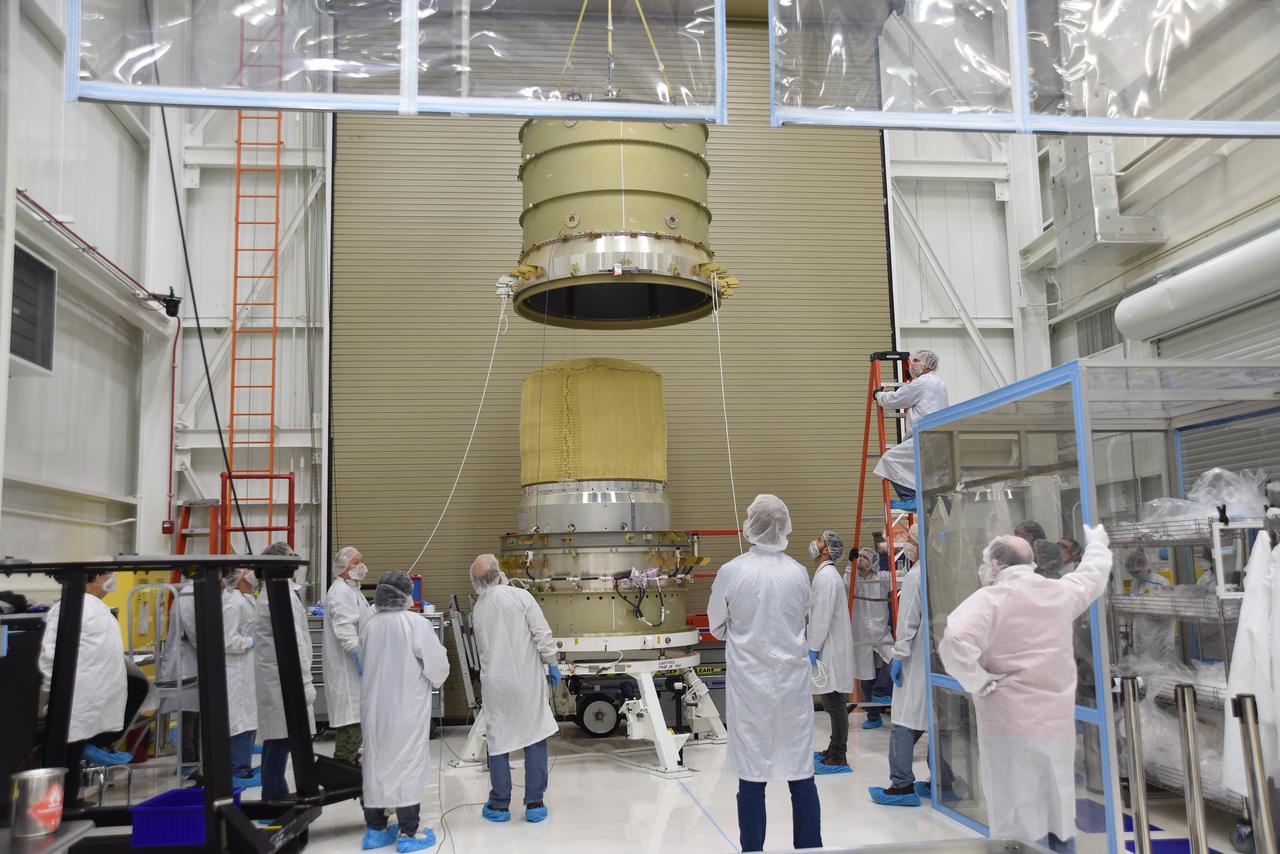
Technicians use a crane to mate the re-entry vehicle payload adapter canister for the Low-Earth Orbit Flight Test of an Inflatable Decelerator (LOFTID) with the payload adapter separation systems canister as part of launch preparations occurring inside Building 836 at Vandenberg Space Force Base (VSFB) in California on Sept. 8, 2022. LOFTID is the secondary payload on NASA and the National Oceanic and Atmospheric Administration’s (NOAA) Joint Polar Satellite System-2 (JPSS-2) satellite mission. JPSS-2 is the third satellite in the Joint Polar Satellite System series. It is scheduled to lift off from VSFB on Nov. 1 from Space Launch Complex-3. JPSS-2, which will be renamed NOAA-21 after reaching orbit, will join a constellation of JPSS satellites that orbit from the North to the South pole, circling Earth 14 times a day and providing a full view of the entire globe twice daily.
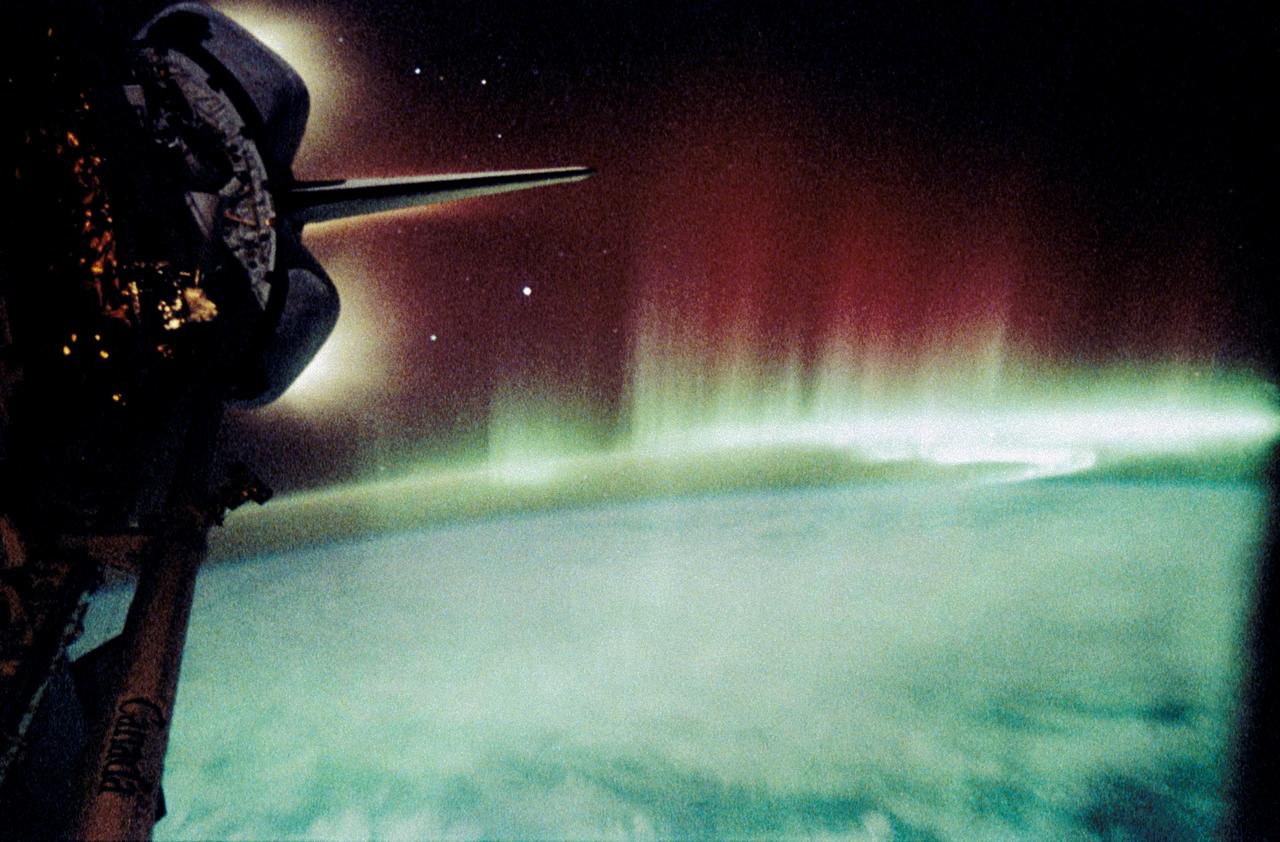
STS039-342-026 (28 April-6 May 1991) --- This view of the Aurora Australis, or Southern Lights, shows a band of airglow above the limb of Earth. Photo experts at NASA studying the mission photography identify the airglow as being in the 80-120 kilometer altitude region and attribute its existence to atomic oxygen (wavelength of 5,577 Angstroms), although other atoms can also contribute. The atomic oxygen airglow is usually most intense at altitudes around 65 degrees north and south latitude, and is most intense in the spring and fall of the year. The aurora phenomena is due to atmospheric oxygen and nitrogen being excited by the particles from the Van Allen Radiation belts which extend between the two geomagnetic poles. The red and green rays appear to extend upward to 200-300 kilometers, much higher than the usual upper limits of about 110 kilometers.
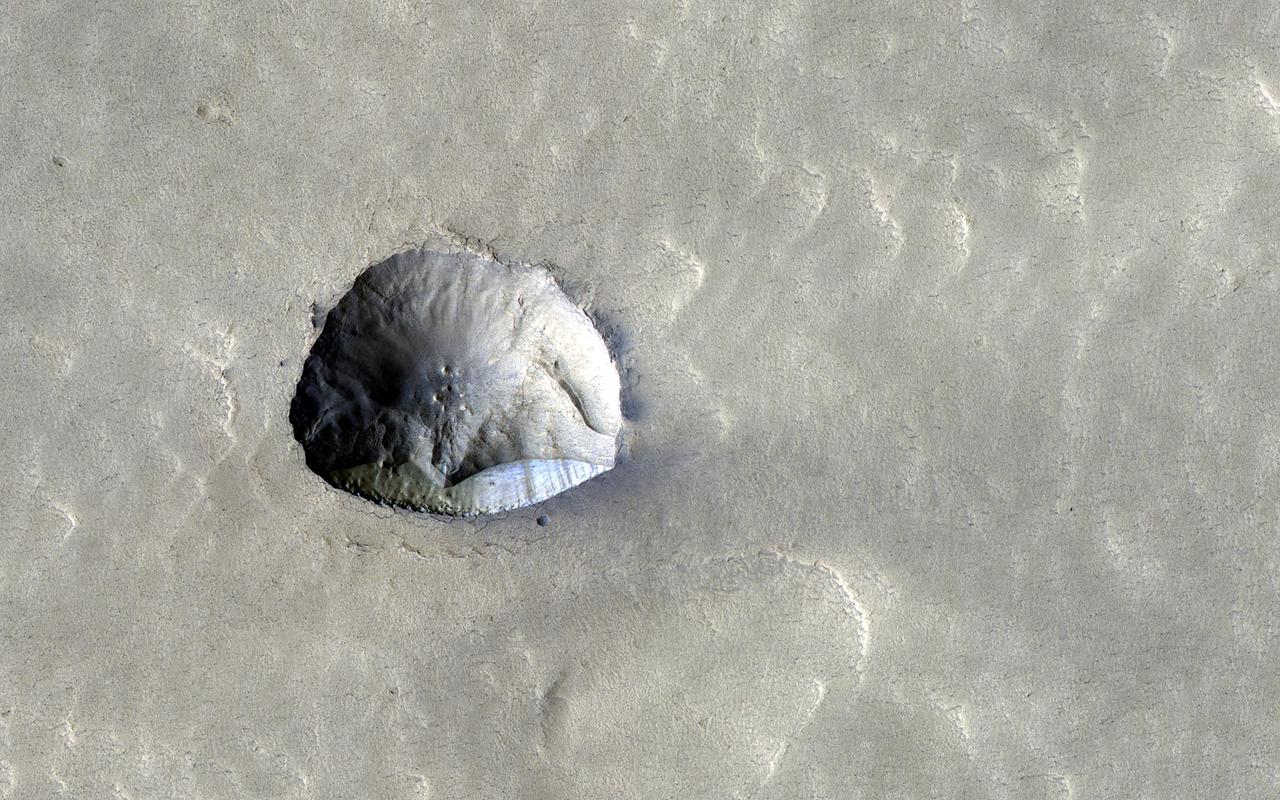
We've come to understand in recent years that about a third of Mars has ice just below the surface. Many impact craters in the mid-latitudes are filled with smooth material that is probably ice covered with a little dirt. Part of one of these filled craters appears in this HiRISE image and has an interesting feature about 250 meters (800 feet) across, near the image center. What looks like might have been a small impact crater now has a straight edge with a steep cliff on its southern side. This north-facing cliff appears to expose icy material that's similar to other pole-facing scarps showing buried ice elsewhere on the planet. These cliffs give us a cut-away view of the buried ice in that location and can help answer questions about what the Martian climate was like when this ice formed. https://photojournal.jpl.nasa.gov/catalog/PIA25083

KENNEDY SPACE CENTER, FLA. -- In this close-up aerial view, the Delta II rocket with the THEMIS spacecraft atop sits ready for launch on Pad 17-B at Cape Canaveral Air Force Station as the mobile service tower begins to move away. THEMIS, an acronym for Time History of Events and Macroscale Interactions during Substorms, consists of five identical probes that will track violent, colorful eruptions near the North Pole. This will be the largest number of scientific satellites NASA has ever launched into orbit aboard a single rocket. The THEMIS mission aims to unravel the mystery behind auroral substorms, an avalanche of magnetic energy powered by the solar wind that intensifies the northern and southern lights. The mission will investigate what causes auroras in the Earth’s atmosphere to dramatically change from slowly shimmering waves of light to wildly shifting streaks of bright color. Launch is scheduled for 6:05 p.m. Photo credit: NASA/George Shelton

In this close-up aerial view, the Delta II rocket with the THEMIS spacecraft atop sits ready for launch on Pad 17-B at Cape Canaveral Air Force Station as the mobile service tower moves away from the pad. THEMIS, an acronym for Time History of Events and Macroscale Interactions during Substorms, consists of five identical probes that will track violent, colorful eruptions near the North Pole. This will be the largest number of scientific satellites NASA has ever launched into orbit aboard a single rocket. The THEMIS mission aims to unravel the mystery behind auroral substorms, an avalanche of magnetic energy powered by the solar wind that intensifies the northern and southern lights. The mission will investigate what causes auroras in the Earth’s atmosphere to dramatically change from slowly shimmering waves of light to wildly shifting streaks of bright color. Launch is scheduled for 6:05 p.m.
Saturn's cloud belts generally move around the planet in a circular path, but one feature is slightly different. The planet's wandering, hexagon-shaped polar jet stream breaks the mold -- a reminder that surprises lurk everywhere in the solar system. This atmospheric feature was first observed by the Voyager mission in the early 1980s, and was dubbed "the hexagon." Cassini's visual and infrared mapping spectrometer was first to spy the hexagon during the mission, since it could see the feature's outline while the pole was still immersed in wintry darkness. The hexagon became visible to Cassini's imaging cameras as sunlight returned to the northern hemisphere. This view looks toward the northern hemisphere of Saturn -- in summer when this view was acquired -- from above 65 degrees north latitude. The image was taken with the Cassini spacecraft wide-angle camera on June 28, 2017 using a spectral filter which preferentially admits wavelengths of near-infrared light centered at 752 nanometers. The view was acquired at a distance of approximately 536,000 miles (862,000 kilometers) from Saturn. Image scale is 32 miles (52 kilometers) per pixel. The Cassini spacecraft ended its mission on Sept. 15, 2017. https://photojournal.jpl.nasa.gov/catalog/PIA21348
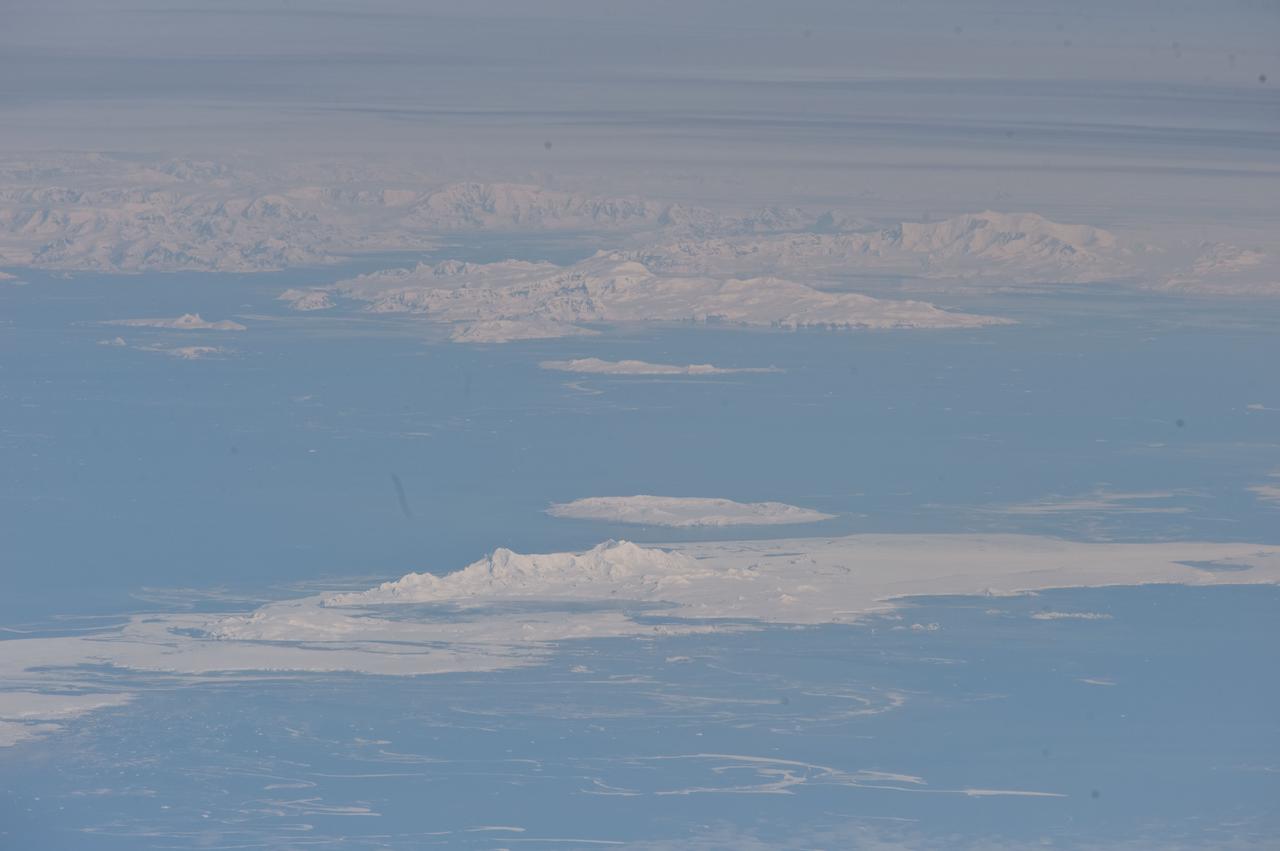
ISS029-E-041836 (4 Oct. 2011) --- South Shetland Islands and Antarctic Peninsula are featured in this image photographed by an Expedition 29 crew member on the International Space Station (ISS). The inclined equatorial orbit of the space station limits nadir Earth views?looking ?straight down? at the surface from the spacecraft?to latitudes between approximately 52 North and 52 South. When viewing conditions are ideal, the crew can obtain detailed oblique imagery?looking outwards at an angle from the space station?of regions at higher latitudes such as Greenland or, in this image, Antarctica. While the bulk of the continent of Antarctica is currently situated over the South Pole, the narrow Antarctic Peninsula extends like a finger towards the southern tip of South America. The northernmost part of the Peninsula is known as Graham Land, a small portion of which (located at approximately 64 South latitude) can be seen at top left in this photograph. Two of the South Shetland Islands that lay off the coast of Graham Land to the north-northwest, Livingston Island and Deception Island, are visible in the image. While both islands have a volcanic origin, active volcanism at Deception Island has been recorded since 1800; the last verified eruptive activity occurred in 1970. Closer to the coastline of Graham Land, Brabant Island (not considered to be part of the South Shetlands) also includes numerous outcrops of volcanic rock attesting to the complex tectonic history of the region. The space station was located over the South Atlantic Ocean, approximately 1,800 kilometers to the northeast in terms of its ground track, when this image was taken. This long viewing distance, combined with the highly oblique viewing angle, accentuates shadowing of the ground surface and provides a sense of the topography similar to the view one gets from an airplane. It also causes foreshortening of features visible in the image, making them appear closer to each other than they actually are ? for example, the actual distance between Livingston and Deception Islands is approximately 20 kilometers.
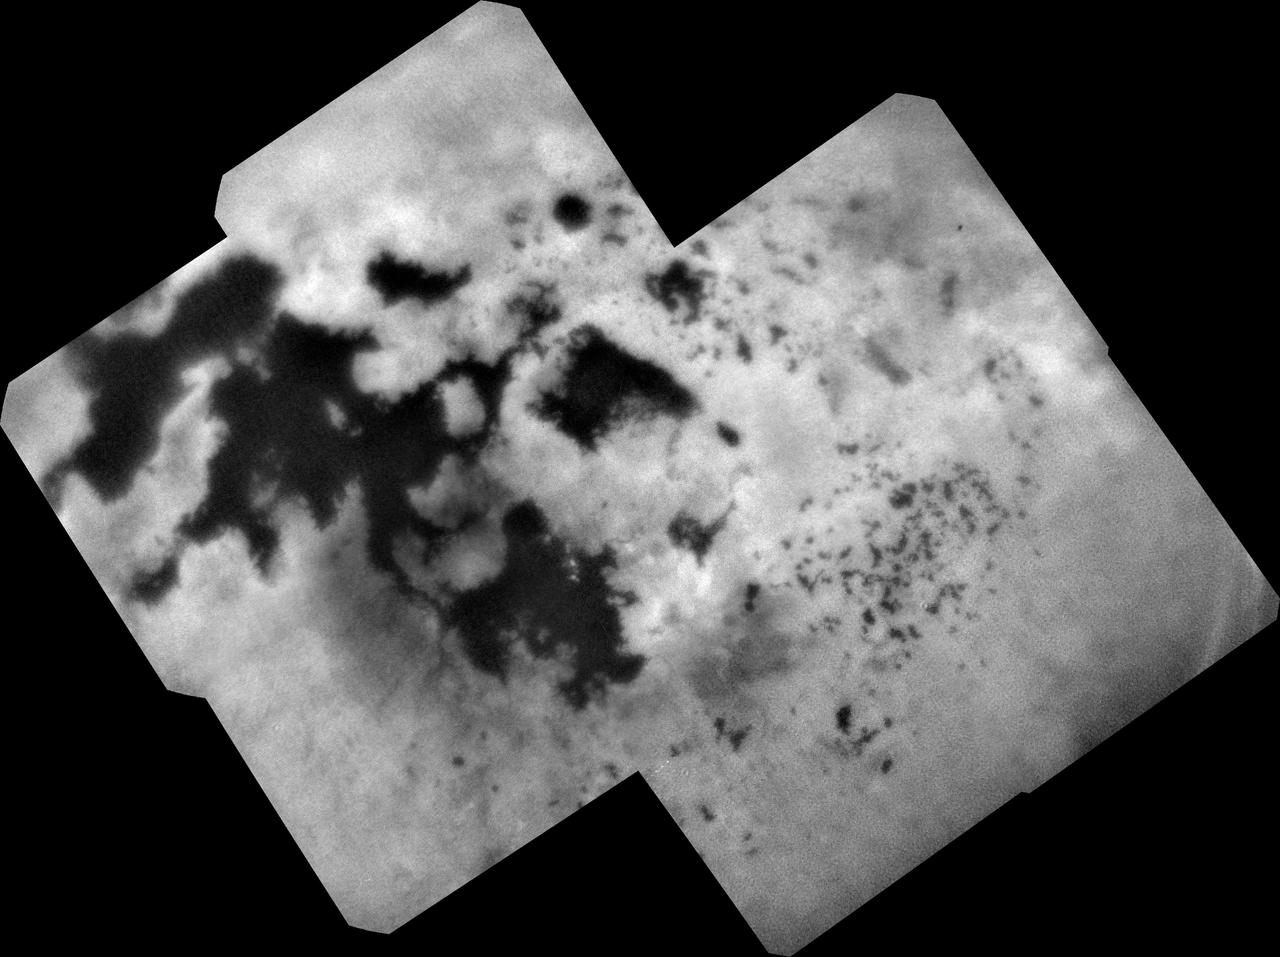
During NASA's Cassini mission's final distant encounter with Saturn's giant moon Titan, the spacecraft captured this view of the enigmatic moon's north polar landscape of lakes and seas, which are filled with liquid methane and ethane. Punga Mare (240 miles, or 390 kilometers, across) is seen just above the center of the mosaic, with Ligeia Mare (300 miles, or 500 kilometers, wide) below center and vast Kraken Mare stretching off 730 miles (1,200 kilometers) to the left of the mosaic. Titan's numerous smaller lakes can be seen around the seas and scattered around the right side of the mosaic. Among the ongoing mysteries about Titan is how these lakes are formed. Another mystery at Titan has been the weather. With its dense atmosphere, Titan has a methane cycle much like Earth's water cycle of evaporation, cloud formation, rainfall, surface runoff into rivers, and collection in lakes and seas. During Titan's southern summer, Cassini observed cloud activity over the south pole (see PIA06112 and PIA06109). However, typical of observations taken during northern spring and summer, the view here reveals only a few small clouds. They appear as bright features just below the center of the mosaic, including a few above Ligeia Mare. The images in this mosaic were taken with the ISS narrow-angle camera, using a spectral filter sensitive to wavelengths of near-infrared light centered at 938 nanometers. They were captured on Sept. 11, 2017, during Cassini's last encounter with Titan. Four days later, Cassini was deliberately plunged into the atmosphere of Saturn. The view was obtained at a distance of approximately 87,000 miles (140,000 kilometers) from Titan. Image scale is about 0.5 miles (800 meters) per pixel. The image is an orthographic projection centered on 67.19 degrees north latitude, 212.67 degrees west longitude. An orthographic view is most like the view seen by a distant observer looking through a telescope. The Cassini spacecraft ended its mission on Sept. 15, 2017. https://photojournal.jpl.nasa.gov/catalog/PIA22481
This image shows the southern high-latitudes region of Mars from March 19 through April 14, 2009, a period when regional dust storms occurred along the retreating edge of carbon-dioxide frost in the seasonal south polar cap. Compared with a full-hemisphere view (see PIA11987), this view shows more details of where the dust clouds formed and how they moved around the planet. The movie combines hundreds of images from the Mars Color Imager (MARCI) camera on NASA's Mars Reconnaissance Orbiter. In viewing the movie, it helps to understand some of the artifacts produced by the nature of MARCI images when seen in animation. MARCI acquires images in swaths from pole-to-pole during the dayside portion of each orbit. The camera can cover the entire planet in just over 12 orbits, and takes about 1 day to accumulate this coverage. The indiviual swaths are assembled into a mosaic, and that mosaic is shown here wrapped onto a sphere. The blurry portions of the mosaic, seen to be "pinwheeling" around the planet in the movie, are the portions of adjacent images viewing obliquely through the hazy atmosphsere. Portions with sharper-looking details are the central part of an image, viewing more directly downward through less atmosphere than the obliquely viewed portions. MARCI has a 180-degree field of view, and Mars fills about 78 percent of that field of view when the camera is pointed down at the planet. However, the Mars Reconnaissance Orbiter often is pointed to one side or the other off its orbital track in order to acquire targeted observations by the higher-resolution imaging systems on the spacecraft. When such rolls exceed about 20 degrees, gaps occur in the mosaic of MARCI swaths. Also, dark gaps appear when data are missing, either because of irrecoverable data drops, or because not all the data have yet been transmitted from the spacecraft. It isn't easy to see the actual dust motion in the atmosphere in these images, owing to the apparent motion of these artifacts. However, by concentrating on specific surface features (craters, prominent ice deposits, etc.) and looking for the brownish clouds of dust, it is possible to see where the storms start and how they move around the planet. In additon to tracking the storms, it is also interesting to watch how the seasonal cap shrinks from the beginning to the end of the animation. This shrinkage results from subliming of the carbon-dioxide frost from the surface as the frost absorbs southern hemisphere mid-spring sunlight. The temperature contrast between the warm sunlit ground just north of the cap's edge and the cold carbon-dioxide frost generates strong winds, enhanced by the excess carbon dioxide subliming off the cap. These winds create the conditions that lead to the dust storms. http://photojournal.jpl.nasa.gov/catalog/PIA11988
Saturn's north polar region displays its beautiful bands and swirls, which somewhat resemble the brushwork in a watercolor painting. Each latitudinal band represents air flowing at different speeds, and clouds at different heights, compared to neighboring bands. Where they meet and flow past each other, the bands' interactions produce many eddies and swirls. The northern polar region of Saturn is dominated by the famous hexagon shape (see PIA11682) which itself circumscribes the northern polar vortex -- seen as a dark spot at the planet's pole in the above image-- which is understood to the be eye of a hurricane-like storm (PIA14946). This view looks toward the sunlit side of the rings from about 20 degrees above the ring plane. The image was taken with the Cassini spacecraft wide-angle camera on Sept. 5, 2016 using a spectral filter which preferentially admits wavelengths of near-infrared light centered at 728 nanometers. The view was obtained at a distance of approximately 890,000 miles (1.4 million kilometers) from Saturn. Image scale is 53 miles (86 kilometers) per pixel. http://photojournal.jpl.nasa.gov/catalog/PIA20507
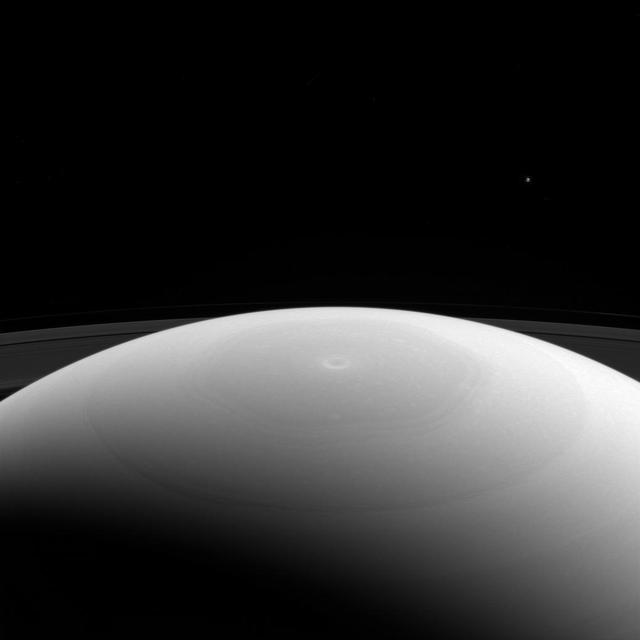
From high above Saturn's northern hemisphere, NASA's Cassini spacecraft gazes over the planet's north pole, with its intriguing hexagon and bullseye-like central vortex. Saturn's moon Mimas is visible as a mere speck near upper right. At 246 miles (396 kilometers across) across, Mimas is considered a medium-sized moon. It is large enough for its own gravity to have made it round, but isn't one of the really large moons in our solar system, like Titan. Even enormous Titan is tiny beside the mighty gas giant Saturn. This view looks toward Saturn from the sunlit side of the rings, from about 27 degrees above the ring plane. The image was taken in green light with the Cassini spacecraft wide-angle camera on March 27, 2017. The view was acquired at a distance of approximately 617,000 miles (993,000 kilometers) from Saturn. Image scale is 37 miles (59 kilometers) per pixel. Mimas' brightness has been enhanced by a factor of 3 in this image to make it easier to see. https://photojournal.jpl.nasa.gov/catalog/PIA21331
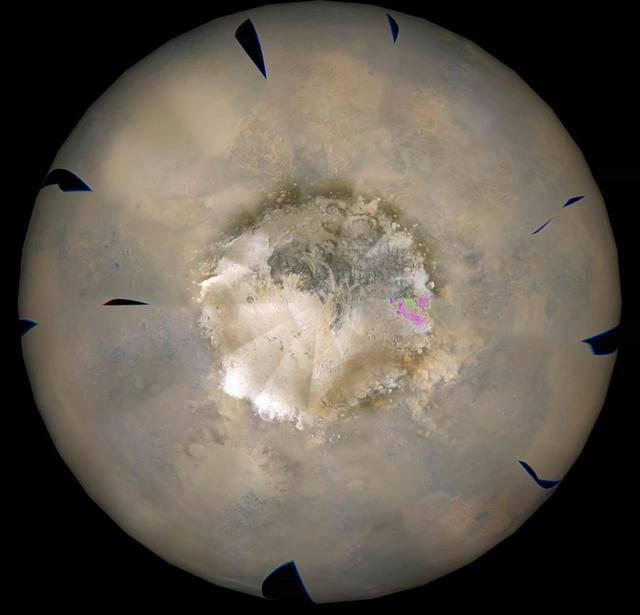
This image is from a movie from NASA Mars Reconnaissance Orbiter showing the southern high-latitudes region of Mars from Mar. 19-Apr. 14, 2009, a period when regional dust storms occurred along the retreating edge of carbon-dioxide frost in the seasonal south polar cap. The movie combines hundreds of images from the Mars Color Imager (MARCI) camera on NASA's Mars Reconnaissance Orbiter. In viewing the movie, it helps to understand some of the artifacts produced by the nature of MARCI images when seen in animation. MARCI acquires images in swaths from pole-to-pole during the dayside portion of each orbit. The camera can cover the entire planet in just over 12 orbits, and takes about 1 day to accumulate this coverage. The indiviual swaths are assembled into a mosaic, and that mosaic is shown here wrapped onto a sphere. The blurry portions of the mosaic, seen to be "pinwheeling" around the planet in the movie, are the portions of adjacent images viewing obliquely through the hazy atmosphsere. Portions with sharper-looking details are the central part of an image, viewing more directly downward through less atmosphere than the obliquely viewed portions. MARCI has a 180-degree field of view, and Mars fills about 78 percent of that field of view when the camera is pointed down at the planet. However, the Mars Reconnaissance Orbiter often is pointed to one side or the other off its orbital track in order to acquire targeted observations by the higher-resolution imaging systems on the spacecraft. When such rolls exceed about 20 degrees, gaps occur in the mosaic of MARCI swaths. Also, dark gaps appear when data are missing, either because of irrecoverable data drops, or because not all the data have yet been transmitted from the spacecraft. It isn't easy to see the actual dust motion in the atmosphere in these images, owing to the apparent motion of these artifacts. However, by concentrating on specific surface features (craters, prominent ice deposits, etc.) and looking for the brownish clouds of dust, it is possible to see where the storms start and how they move around the planet. In additon to tracking the storms, it is also interesting to watch how the seasonal cap shrinks from the beginning to the end of the animation. This shrinkage results from subliming of the carbon-dioxide frost from the surface as the frost absorbs southern hemisphere mid-spring sunlight. The temperature contrast between the warm sunlit ground just north of the cap's edge and the cold carbon-dioxide frost generates strong winds, enhanced by the excess carbon dioxide subliming off the cap. These winds create the conditions that lead to the dust storms. http://photojournal.jpl.nasa.gov/catalog/PIA11987

This collage shows some of the most interesting geological sites that NASA's Dawn spacecraft has revealed at dwarf planet Ceres. Images were acquired with the spacecraft's framing camera during various phases of the mission: Survey orbit at a distance of about 2,700 miles (4,400 kilometers); high-altitude mapping orbit (HAMO) at a distance of 915 miles (1,470 kilometers) from Ceres; and low-altitude mapping orbit (LAMO) at an altitude of 240 miles (385 kilometers). In the first row, from left to right: Ceres in shown in false color, roughly centered on Occator Crater, home of the brightest area on Ceres. This picture combines color images obtained by Dawn in its survey orbit. Red corresponds to a wavelength range around 980 nanometers (near infrared), green to a wavelength range around 750 nanometers (red, visible light) and blue to a wavelength range of around 430 nanometers (blue, visible light). This picture illustrates the diversity of terrains on Ceres where the bluish material points to recently emplaced material and the brownish background material is associated with older terrains. Juling Crater (12 miles, 20 kilometers in diameter) as seen in LAMO. Central coordinates are 36 degrees south latitude, 168 degrees east longitude. It is named after the Sakai/Orang Asli (Malaysia) spirit of the crops. This crater displays evidence for the presence of ice -- for example, in the form of a large flow feature seen at the top of the image. Oxo Crater (6 miles, 10 kilometers in diameter) as seen in LAMO. Center coordinates are 42 degrees north latitude, 0 degrees east longitude. It is named after the god of agriculture in Afro-Brazilian beliefs of Yoruba derivation. Oxo hosts the first site at which Dawn detected ice on Ceres, exposed by a landslide. Ahuna Mons is not only a volcano, but also the tallest mountain on Ceres. It is about 2.5 miles (4 kilometers) high and 11 miles (17 kilometers) wide. Center coordinates are 10 degrees south latitude, 316 degrees east longitude. This view combines images obtained in LAMO in blue (430 nanometers), green (750 nanometers) and infrared (980 nanometers) color filters. Ahuna is named after the Sumi tribe (Nagaland, northeastern India) traditional post-harvest thanksgiving festival. Second Row Occator Crater (57 miles, 92 kilometers across) is seen in LAMO images. Center coordinates are 20 degrees north latitude, 239 degrees east longitude. Named after the Roman agricultural deity of the harrowing. This image shows a "Type I" flow feature with a thick "toe" typical of rock glaciers and icy landslides on Earth as viewed in LAMO. The flow feature, found in Ghanan Crater (77 degrees north latitude, 31 degrees east longitude), is one of the most voluminous on Ceres. Enhanced color view of Haulani Crater (21 miles, 34 kilometers in diameter) in color observed in HAMO. Central coordinates: 6 degrees north latitude, 11 degrees east longitude. Named after the Hawaiian plant goddess. Kokopelli Crater (21 miles, 34 kilometers in diameter) seen in LAMO. Central coordinates: 18 degrees north latitude, 125 degrees east longitude. Named after the Pueblo (SW USA) fertility deity, who presides over agriculture. This crater displays a nice arrangement of scarps that likely formed when the crater partly collapsed during its formation. Third Row Central region of Occator Crater, called Cerealia Facula, seen in color. The facula -- or "bright spot" -- is about 9 miles (14 kilometers) in diameter. Center coordinates: 20 N, 240 E. Cerealia refers to the major festival in Ancient Rome that celebrates the grain goddess Ceres (8 days in mid- to late April). The view was produced by combining the highest resolution images of Occator obtained in LAMO (at image scales of 35 meters, or 115 feet, per pixel) with color images obtained in HAMO (at image scales of 135 meters, or about 440 feet, per pixel). The three images used to produce the color were taken using filters centered at 430, 750 and 980 nanometers (the last being slightly beyond the range of human vision, in the near-infrared). North part of Nar Sulcus seen in LAMO. The full feature is about 39 miles (63 km) in length and is located around 42 degrees south latitude, 280 degrees east longitude. Nar is a Azerbaijani festival of pomegranate harvest held in October-November in Goychay city, center of pomegranate cultivation in Azerbaijan. A sulcus is a set of parallel furrows or ridges. Ikapati Crater (31 miles, 50 kilometers in diameter) seen in LAMO. Central coordinates: 34 degrees north latitude, 46 degrees east longitude. Ikapati is named after the Philippine goddess of the cultivated lands. The crater has a smooth floor, probably because heat from the impact that formed Ikapati caused ice in the ground to melt, and then refreeze. This view of Ceres, taken in LAMO, shows an area located at approximately 86 degrees south longitude, 177 degrees east longitude. This part of Ceres, near the south pole, has such long shadows because, from the perspective of this location, the sun is near the horizon. At the time this image was taken, the sun was 4 degrees north of the equator. If you were standing this close to Ceres' south pole, the sun would never get high in the sky during the course of a nine-hour Cerean day. https://photojournal.jpl.nasa.gov/catalog/PIA22090
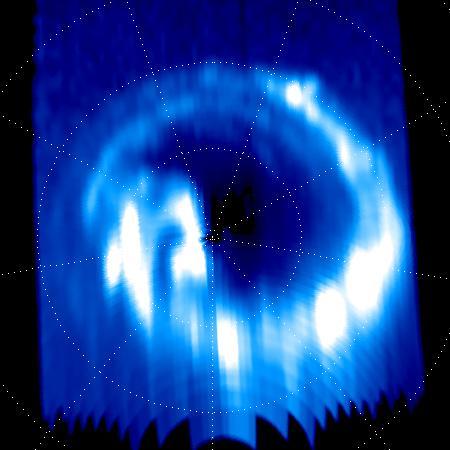
On Sept. 14, 2017, one day before making its final plunge into Saturn's atmosphere, NASA's Cassini spacecraft used its Ultraviolet Imaging Spectrograph, or UVIS, instrument to capture this final view of ultraviolet auroral emissions in the planet's north polar region. The view is centered on the north pole of Saturn, with lines of latitude visible for 80, 70 and 60 degrees. Lines of longitude are spaced 40 degrees apart. The planet's day side is at bottom, while the night side is at top. A sequence of images from this observation has also been assembled into a movie sequence. The last image in the movie was taken about an hour before the still image, which was the actual final UVIS auroral image. Auroral emissions are generated by charged particles traveling along the invisible lines of Saturn's magnetic field. These particles precipitate into the atmosphere, releasing light when they strike gas molecules there. Several individual auroral structures are visible here, despite that this UVIS view was acquired at a fairly large distance from the planet (about 424,000 miles or 683,000 kilometers). Each of these features is connected to a particular phenomenon in Saturn's magnetosphere. For instance, it is possible to identify auroral signatures here that are related to the injection of hot plasma from the dayside magnetosphere, as well as auroral features associated with a change in the magnetic field's shape on the magnetosphere's night side. Several possible scenarios have been postulated over the years to explain Saturn's changing auroral emissions, but researchers are still far from a complete understanding of this complicated puzzle. Researchers will continue to analyze the hundreds of image sequences UVIS obtained of Saturn's auroras during Cassini's 13-year mission, with many new discoveries likely to be made. This image and movie sequence were produced by the Laboratory for Planetary and Atmospheric Physics (LPAP) of the STAR Institute of the University of Liege in Belgium, in collaboration with the UVIS Team. The animation is available at https://photojournal.jpl.nasa.gov/catalog/PIA21899
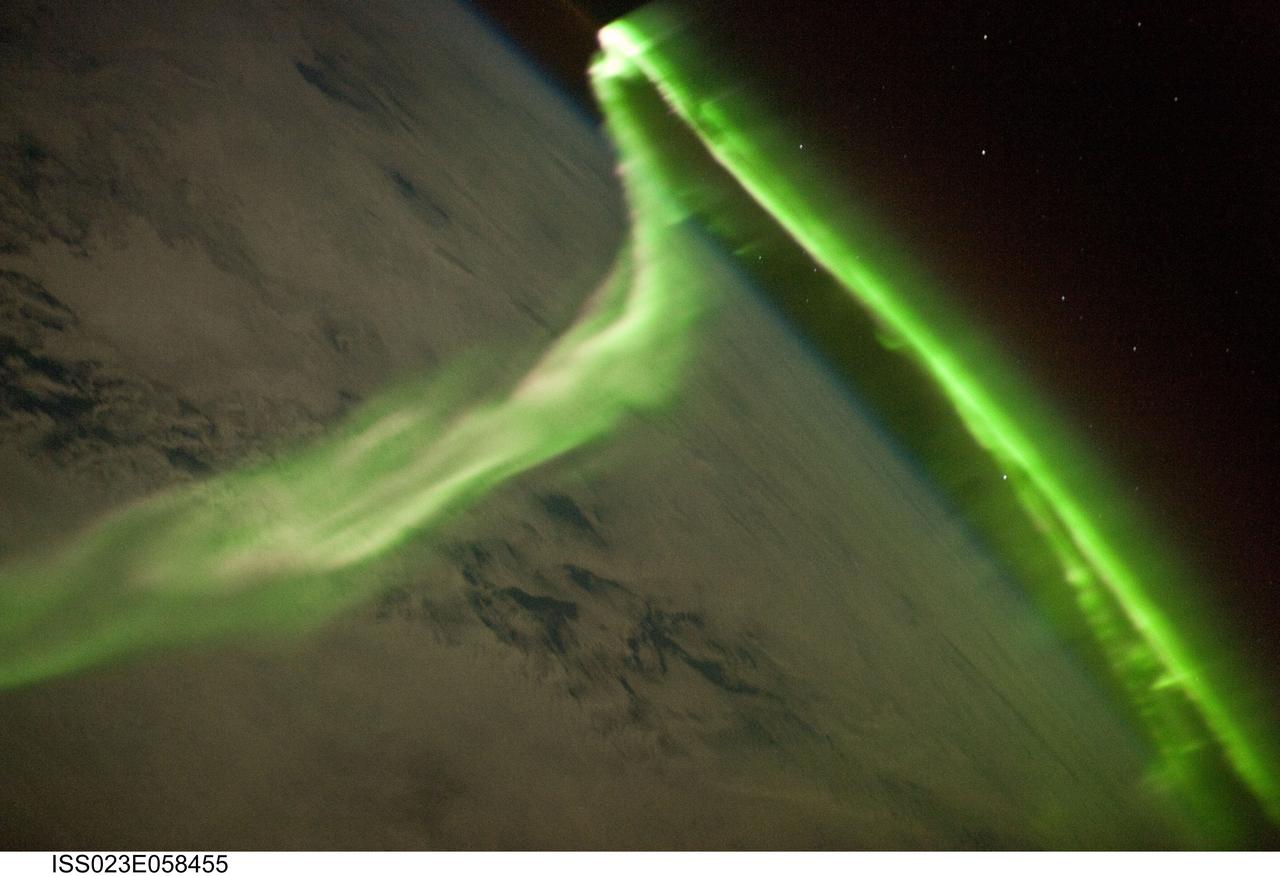
ISS023-E-058455 (29 May 2010) --- Aurora Australis is featured in this image photographed by an Expedition 23 crew member on the International Space Station. Among the views of Earth afforded crew members aboard the ISS, surely one of the most spectacular is of the aurora. These ever-shifting displays of colored ribbons, curtains, rays, and spots are most visible near the North (Aurora Borealis) and South (Aurora Australis) Poles as charged particles streaming from the sun (the solar wind) interact with Earth’s magnetic field, resulting in collisions with atoms of oxygen and nitrogen in the upper atmosphere. The atoms are excited by these collisions, and typically emit photons as a means of returning to their original energy state. The photons form the aurora that we see. The most commonly observed color of aurora is green, caused by photons (light) emitted by excited oxygen atoms at wavelengths centered at 0.558 micrometers, or millionths of a meter. Visible light is reflected from healthy (green) plant leaves at approximately the same wavelength. Red auroras are generated by light emitted at a longer wavelength (0.630 micrometers), and other colors such as blue and purple are also sometimes observed. While auroras are generally only visible close to the poles, severe magnetic storms impacting Earth’s magnetic field can shift them towards the equator. This striking aurora image was taken during a geomagnetic storm that was most likely caused by a coronal mass ejection from the sun on May 24, 2010. The ISS was located over the Southern Indian Ocean at an altitude of 350 kilometers, with the observer most likely looking towards Antarctica (not visible) and the South Pole. The aurora has a sinuous ribbon shape that separates into discrete spots near the lower right corner of the image. While the dominant coloration of the aurora is green, there are faint suggestions of red photon emission as well (light fuscia tones at center left). Dense cloud cover is dimly visible below the aurora. The curvature of Earth’s horizon, or limb, is clearly visible as is the faint blue line of the upper atmosphere directly above at top center. Several stars appear as bright pinpoints against the blackness of space at top right.
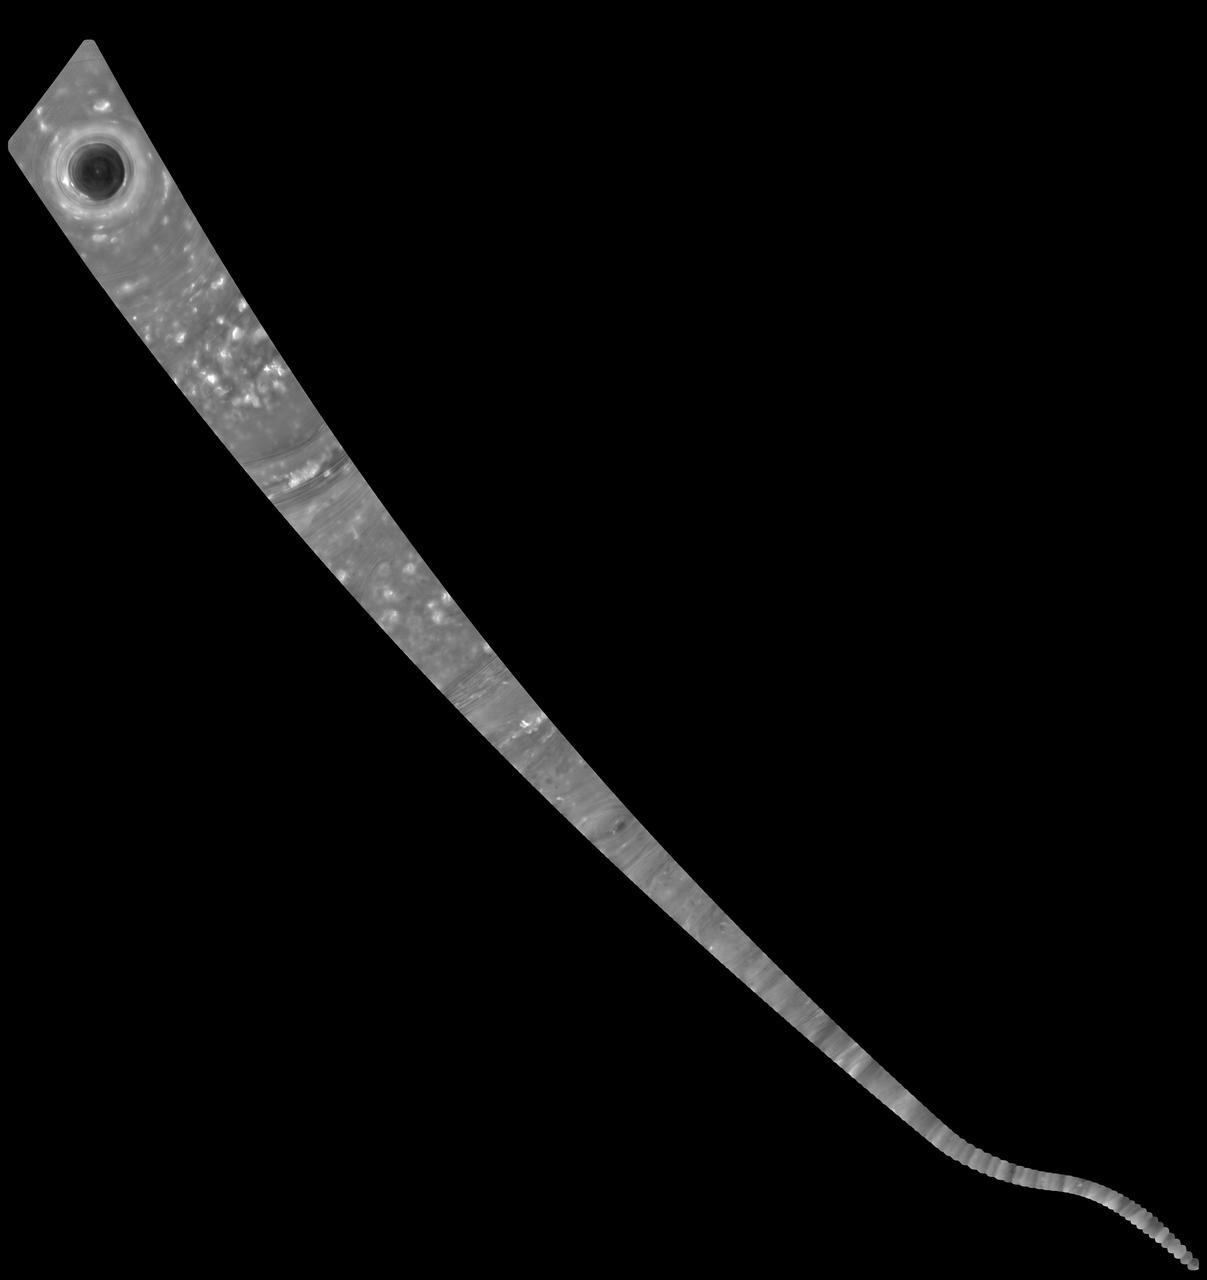
This mosaic of images combines views captured by NASA's Cassini spacecraft as it made the first dive of the mission's Grand Finale on April 26, 2017. It shows a vast swath of Saturn's atmosphere, from the north polar vortex to the boundary of the hexagon-shaped jet stream, to details in bands and swirls at middle latitudes and beyond. The mosaic is a composite of 137 images captured as Cassini made its first dive toward the gap between Saturn and its rings. It is an update to a previously released image product. In the earlier version, the images were presented as individual movie frames, whereas here, they have been combined into a single, continuous mosaic. The mosaic is presented as a still image as well as a video that pans across its length. Imaging scientists referred to this long, narrow mosaic as a "noodle" in planning the image sequence. The first frame of the mosaic is centered on Saturn's north pole, and the last frame is centered on a region at 18 degrees north latitude. During the dive, the spacecraft's altitude above the clouds changed from 45,000 to 3,200 miles (72,400 to 8374 kilometers), while the image scale changed from 5.4 miles (8.7 kilometers) per pixel to 0.6 mile (1 kilometer) per pixel. The bottom of the mosaic (near the end of the movie) has a curved shape. This is where the spacecraft rotated to point its high-gain antenna in the direction of motion as a protective measure before crossing Saturn's ring plane. The images in this sequence were captured in visible light using the Cassini spacecraft wide-angle camera. The original versions of these images, as sent by the spacecraft, have a size of 512 by 512 pixels. The small image size was chosen in order to allow the camera to take images quickly as Cassini sped over Saturn. These images of the planet's curved surface were projected onto a flat plane before being combined into a mosaic. Each image was mapped in stereographic projection centered at 55 degree north latitude. A movie is available at https://photojournal.jpl.nasa.gov/catalog/PIA21617

This image depicts a full view of the Earth, taken by the Geostationary Operational Environment Satellite (GOES-8). The red and green charnels represent visible data, while the blue channel represents inverted 11 micron infrared data. The north and south poles were not actually observed by GOES-8. To produce this image, poles were taken from a GOES-7 image. Owned and operated by the National Oceanic and Atmospheric Administration (NOAA), GOES satellites provide the kind of continuous monitoring necessary for intensive data analysis. They circle the Earth in a geosynchronous orbit, which means they orbit the equatorial plane of the Earth at a speed matching the Earth's rotation. This allows them to hover continuously over one position on the surface. The geosynchronous plane is about 35,800 km (22,300 miles) above the Earth, high enough to allow the satellites a full-disc view of the Earth. Because they stay above a fixed spot on the surface, they provide a constant vigil for the atmospheric triggers for severe weather conditions such as tornadoes, flash floods, hail storms, and hurricanes. When these conditions develop, the GOES satellites are able to monitor storm development and track their movements. NASA manages the design and launch of the spacecraft. NASA launched the first GOES for NOAA in 1975 and followed it with another in 1977. Currently, the United States is operating GOES-8, positioned at 75 west longitude and the equator, and GOES-10, which is positioned at 135 west longitude and the equator. (GOES-9, which malfunctioned in 1998, is being stored in orbit as an emergency backup should either GOES-8 or GOES-10 fail. GOES-11 was launched on May 3, 2000 and GOES-12 on July 23, 2001. Both are being stored in orbit as a fully functioning replacement for GOES-8 or GOES-10 on failure.
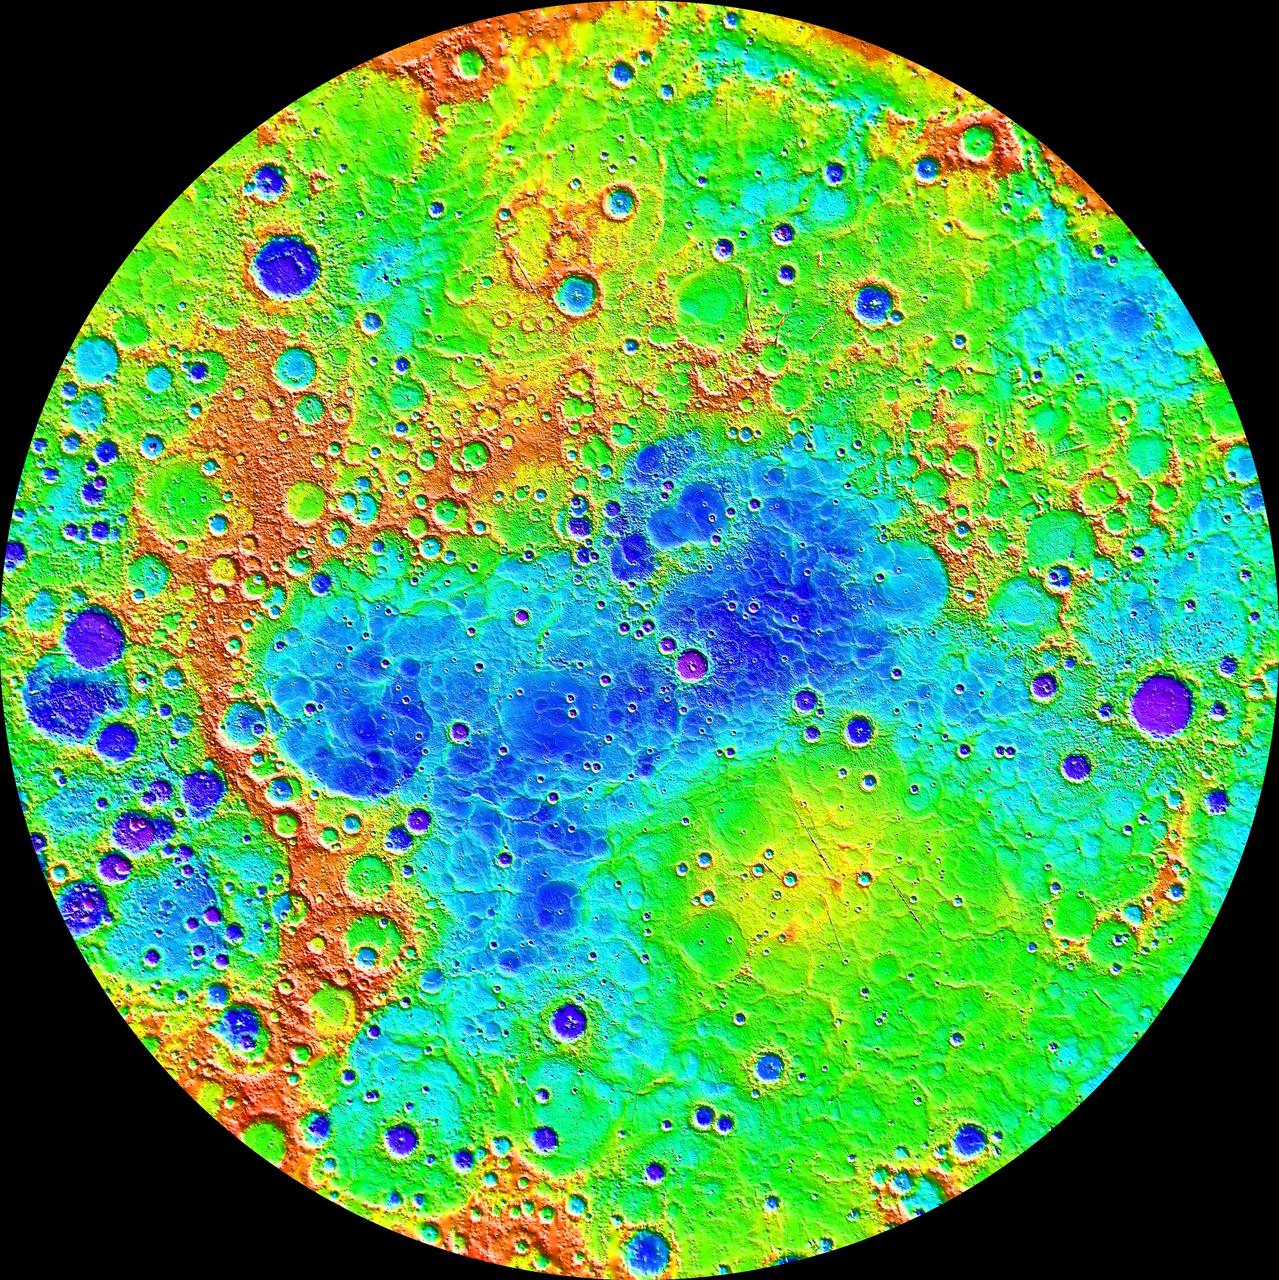
Measurements from NASA MESSENGER MLA instrument during the spacecraft greater than four-year orbital mission have mapped the topography of Mercury northern hemisphere in great detail. The view shown here is an interpolated shaded relief map of these data. The lowest regions are shown in purple, and the highest regions are shown in red. The difference in elevation between the lowest and highest regions shown here is roughly 10 kilometers! Among the prominent features visible here are the smooth northern volcanic plains and the enigmatic northern rise. The low-lying craters near the north pole host radar-bright materials, thought to be water ice. Linear artifacts can be seen in some areas of this map. These are due to individual MLA tracks that need minor adjustments in order to fit the rest of the data. Crossover analysis and better knowledge of the spacecraft position can be used to adjust these tracks and improve the map. Instrument: Mercury Laser Altimeter (MLA) Center Latitude: 90° Center Longitude: 0° E Latitude Range: 45° to 90° N http://photojournal.jpl.nasa.gov/catalog/PIA19420

The Low-Earth Orbit Flight Test of an Inflatable Decelerator (LOFTID) is lowered onto a work stand inside Building 836 at Vandenberg Space Force Base (VSFB) in California on Aug. 25, 2022. LOFTID is the secondary payload on NASA and the National Oceanic and Atmospheric Administration’s (NOAA) Joint Polar Satellite System-2 (JPSS-2) satellite mission. JPSS-2 is the third satellite in the Joint Polar Satellite System series. It is scheduled to lift off from VSFB on Nov. 1 from Space Launch Complex-3. JPSS-2, which will be renamed NOAA-21 after reaching orbit, will join a constellation of JPSS satellites that orbit from the North to the South pole, circling Earth 14 times a day and providing a full view of the entire globe twice daily. The NOAA/NASA Suomi National Polar-orbiting Partnership (Suomi NPP) satellite, and NOAA-20, previously known as JPSS-1, are both already in orbit. Each satellite carries at least four advanced instruments to measure weather and climate conditions on Earth. LOFTID is dedicated to the memory of Bernard Kutter. LOFTID will demonstrate inflatable heat shield technology that could enable a variety of proposed NASA missions to destinations such as Mars, Venus, and Titan, as well as returning heavier payloads from low-Earth orbit.
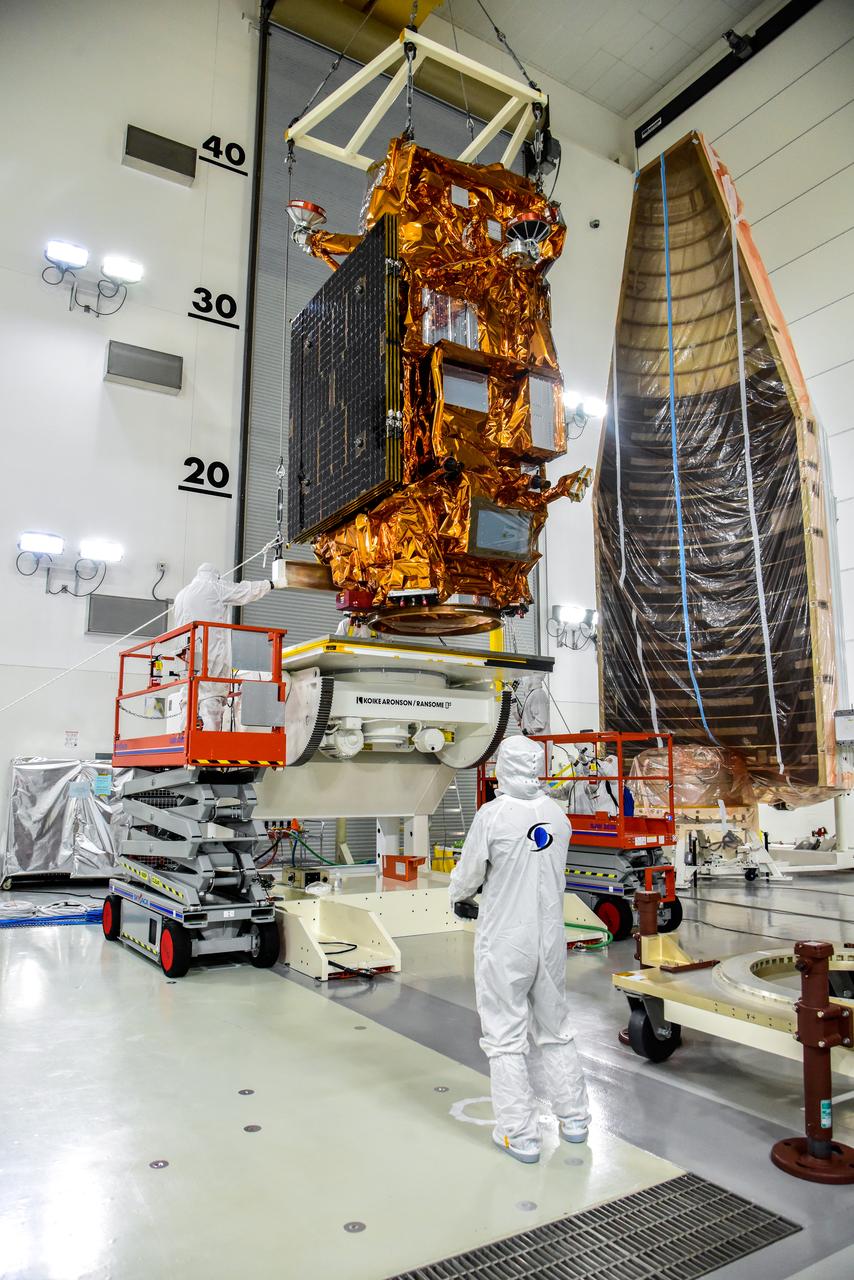
A crane is used to transfer NASA and the National Oceanic and Atmospheric Administration’s (NOAA) Joint Polar Satellite System-2 (JPSS-2) satellite to an Aronson Table for processing inside the Astrotech Space Operations facility at Vandenberg Space Force Base in California on Aug. 22, 2022. JPSS-2 is the third satellite in the Joint Polar Satellite System series. It is scheduled to lift off from VSFB on Nov. 1 from Space Launch Complex-3. JPSS-2, which will be renamed NOAA-21 after reaching orbit, will join a constellation of JPSS satellites that orbit from the North to the South pole, circling Earth 14 times a day and providing a full view of the entire globe twice daily. The NOAA/NASA Suomi National Polar-orbiting Partnership (Suomi NPP) satellite, and NOAA-20, previously known as JPSS-1, are both already in orbit. Each satellite carries at least four advanced instruments to measure weather and climate conditions on Earth. A secondary payload on the mission is the Low-Earth Orbit Flight Test of an Inflatable Decelerator (LOFTID), and is dedicated to the memory of Bernard Kutter. LOFTID will demonstrate inflatable heat shield technology that could enable a variety of proposed NASA missions to destinations such as Mars, Venus, and Titan, as well as returning heavier payloads from low-Earth orbit.
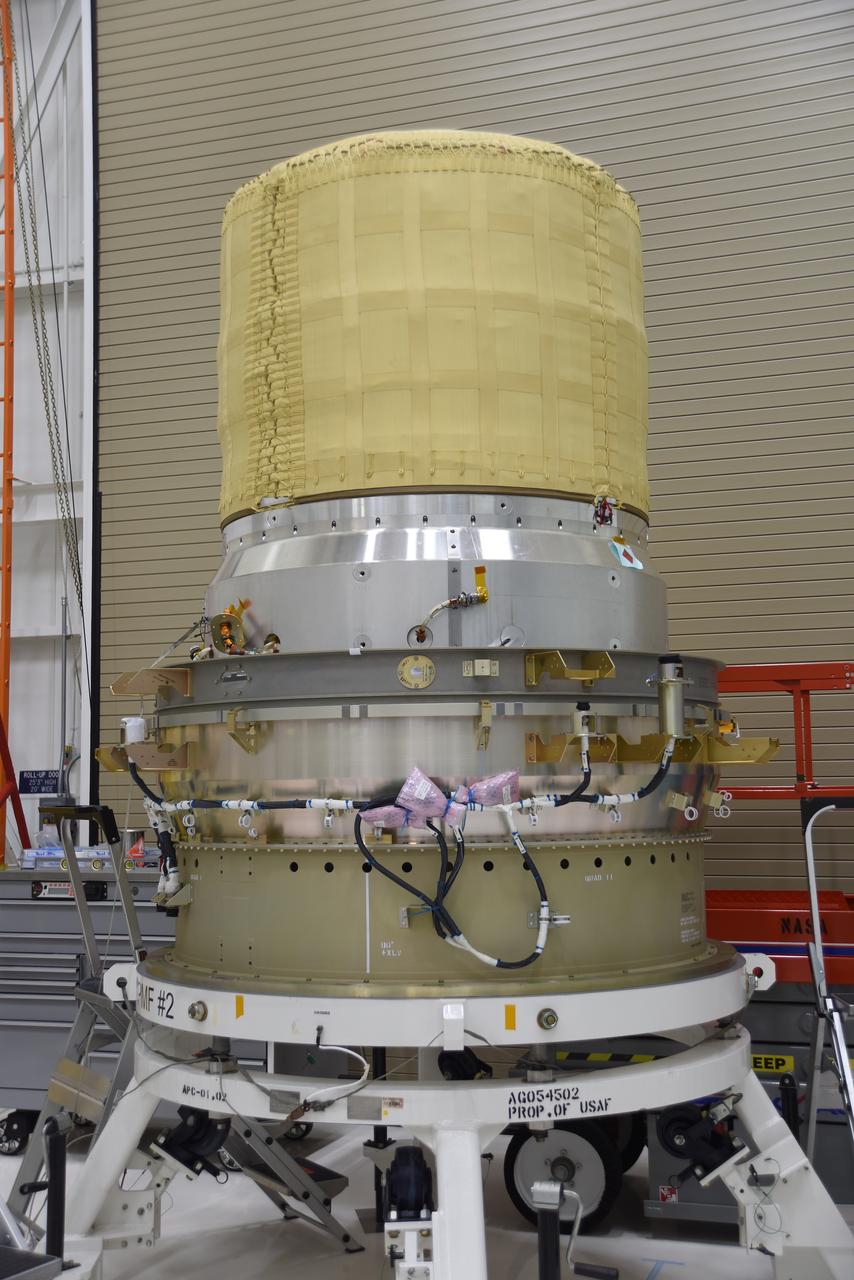
The re-entry vehicle for the Low-Earth Orbit Flight Test of an Inflatable Decelerator (LOFTID) is now mated to the re-entry vehicle payload adapter interface ring and secured on a work stand as part of launch preparations inside Building 836 at Vandenberg Space Force Base (VSFB) in California on Sept. 7, 2022. LOFTID is the secondary payload on NASA and the National Oceanic and Atmospheric Administration’s (NOAA) Joint Polar Satellite System-2 (JPSS-2) satellite mission. JPSS-2 is the third satellite in the Joint Polar Satellite System series. It is scheduled to lift off from VSFB on Nov. 1 from Space Launch Complex-3. JPSS-2, which will be renamed NOAA-21 after reaching orbit, will join a constellation of JPSS satellites that orbit from the North to the South pole, circling Earth 14 times a day and providing a full view of the entire globe twice daily. LOFTID will demonstrate inflatable heat shield technology that could enable a variety of proposed NASA missions to destinations such as Mars, Venus, and Titan, as well as returning heavier payloads from low-Earth orbit.
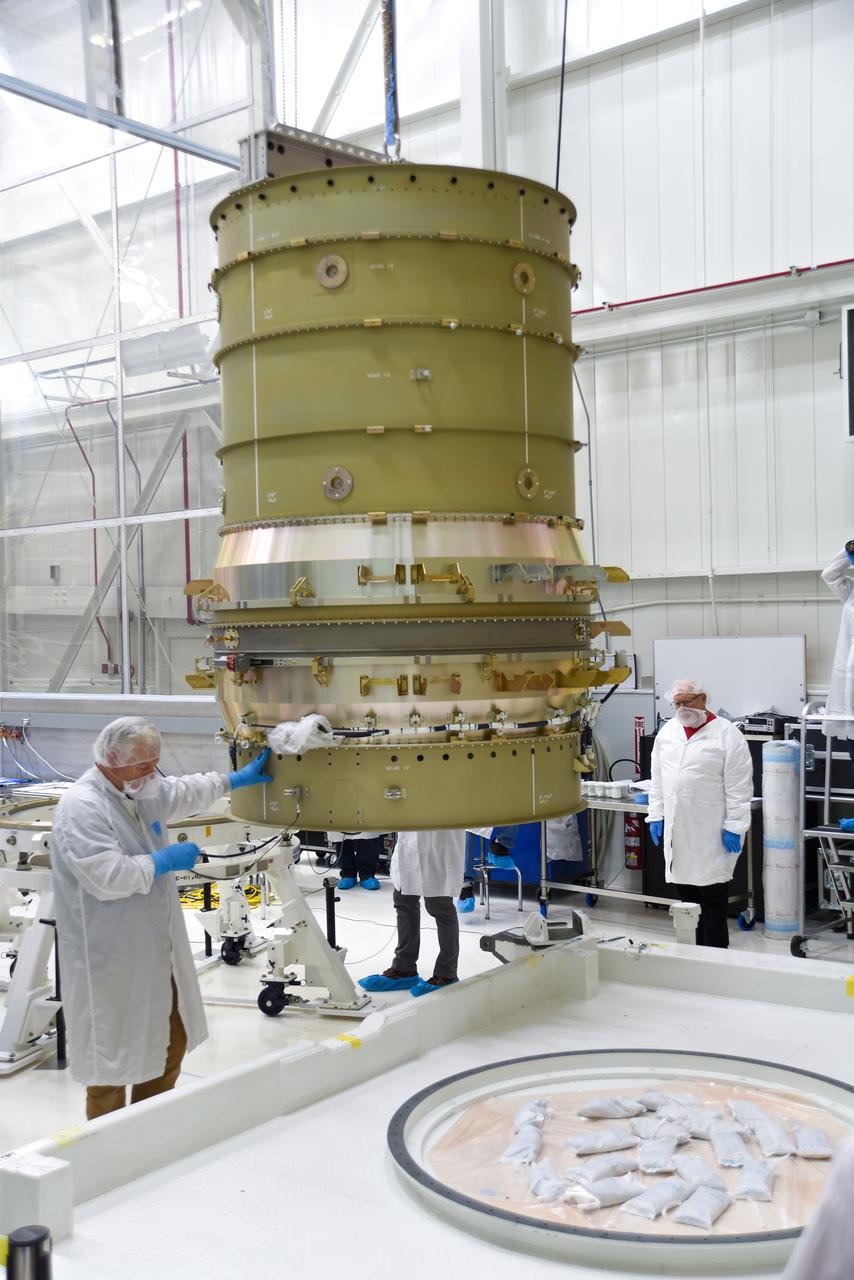
Technicians assist as a crane moves NASA’s Low-Earth Orbit Flight Test of an Inflatable Decelerator (LOFTID) stack to a ground transport vehicle as part of launch preparations occurring inside Building 836 at Vandenberg Space Force Base (VSFB) in California on Sept. 9, 2022. LOFTID is the secondary payload on the National Oceanic and Atmospheric Administration’s (NOAA) Joint Polar Satellite System-2 (JPSS-2) satellite mission. JPSS-2 is the third satellite in the Joint Polar Satellite System series. It is scheduled to lift off from VSFB on Nov. 1 from Space Launch Complex-3. JPSS-2, which will be renamed NOAA-21 after reaching orbit, will join a constellation of JPSS satellites that orbit from the North to the South pole, circling Earth 14 times a day and providing a full view of the entire globe twice daily. LOFTID will demonstrate inflatable heat shield technology that could enable a variety of proposed NASA missions to destinations such as Mars, Venus, and Titan, as well as returning heavier payloads from low-Earth orbit.