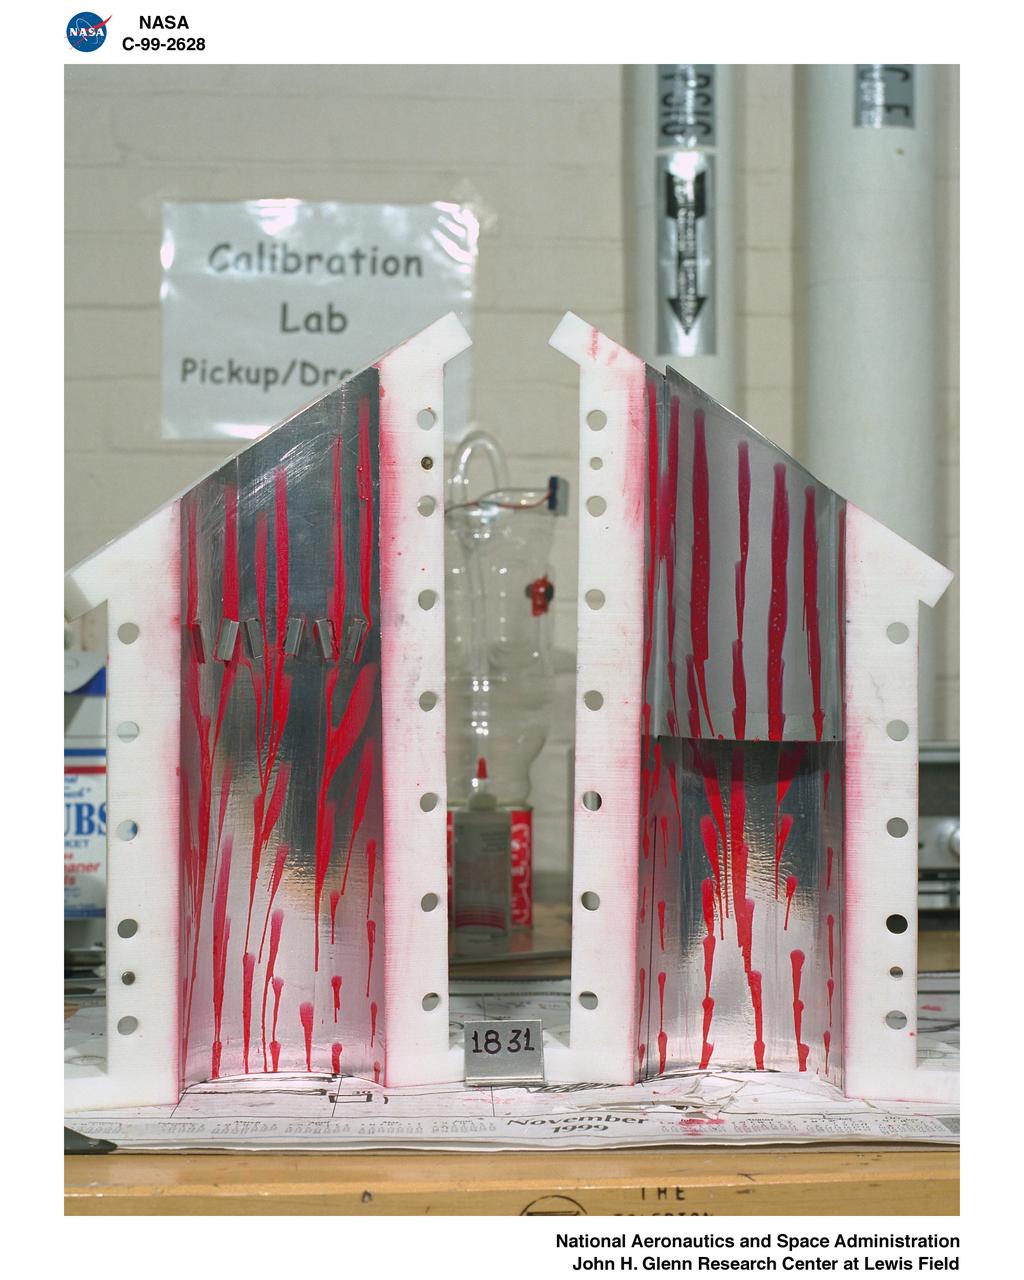
VORTEX GENERATOR TEST FOR WAVE ROTOR APPLICATIONS

VORTEX GENERATOR TEST FOR WAVE ROTOR APPLICATIONS
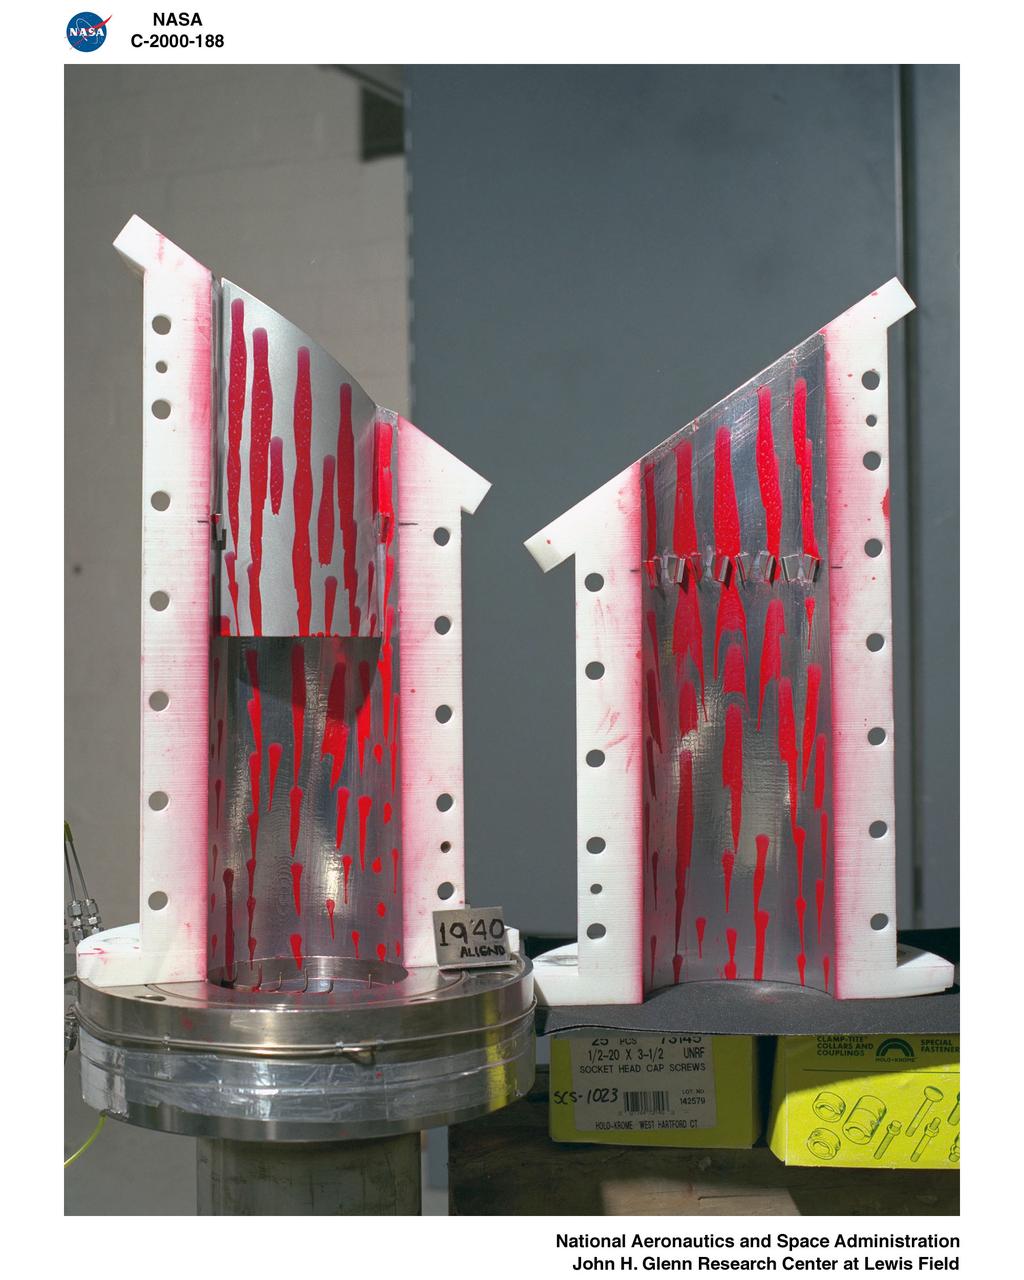
VORTEX GENERATOR TEST FOR WAVE ROTOR APPLICATIONS
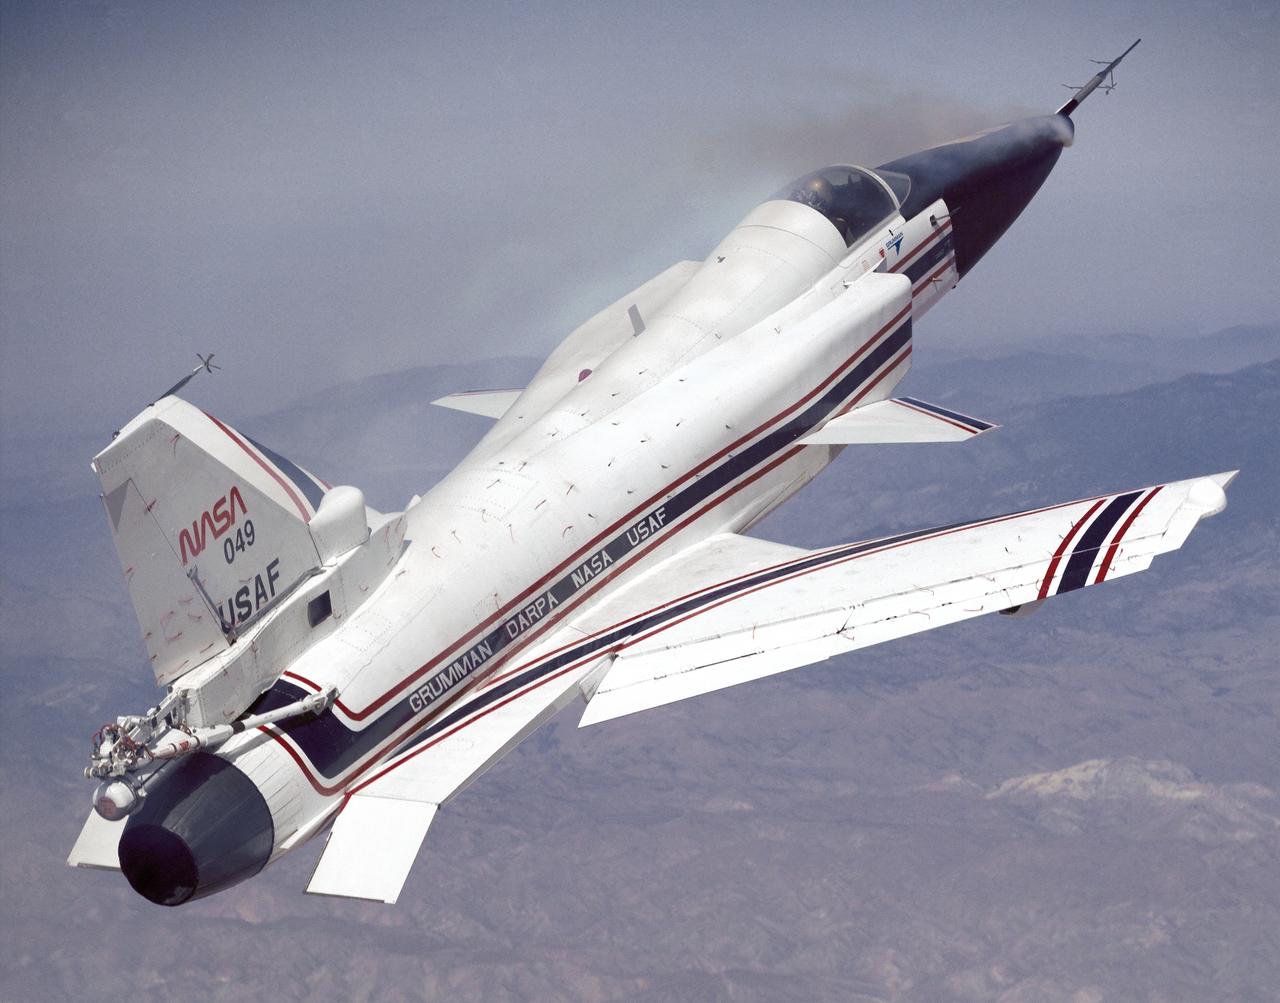
This photo shows the X-29 during a 1991 research flight. Smoke generators in the nose of the aircraft were used to help researchers see the behavior of the air flowing over the aircraft. The smoke here is demonstrating forebody vortex flow. This mission was flown September 10, 1991, by NASA research pilot Rogers Smith.

Wake Vortex behind a helicopter describing Longitudinal Cores (Secondary Vortes Generation) from Aviatsiya / Kosmonautika, 1973 (Illustration)
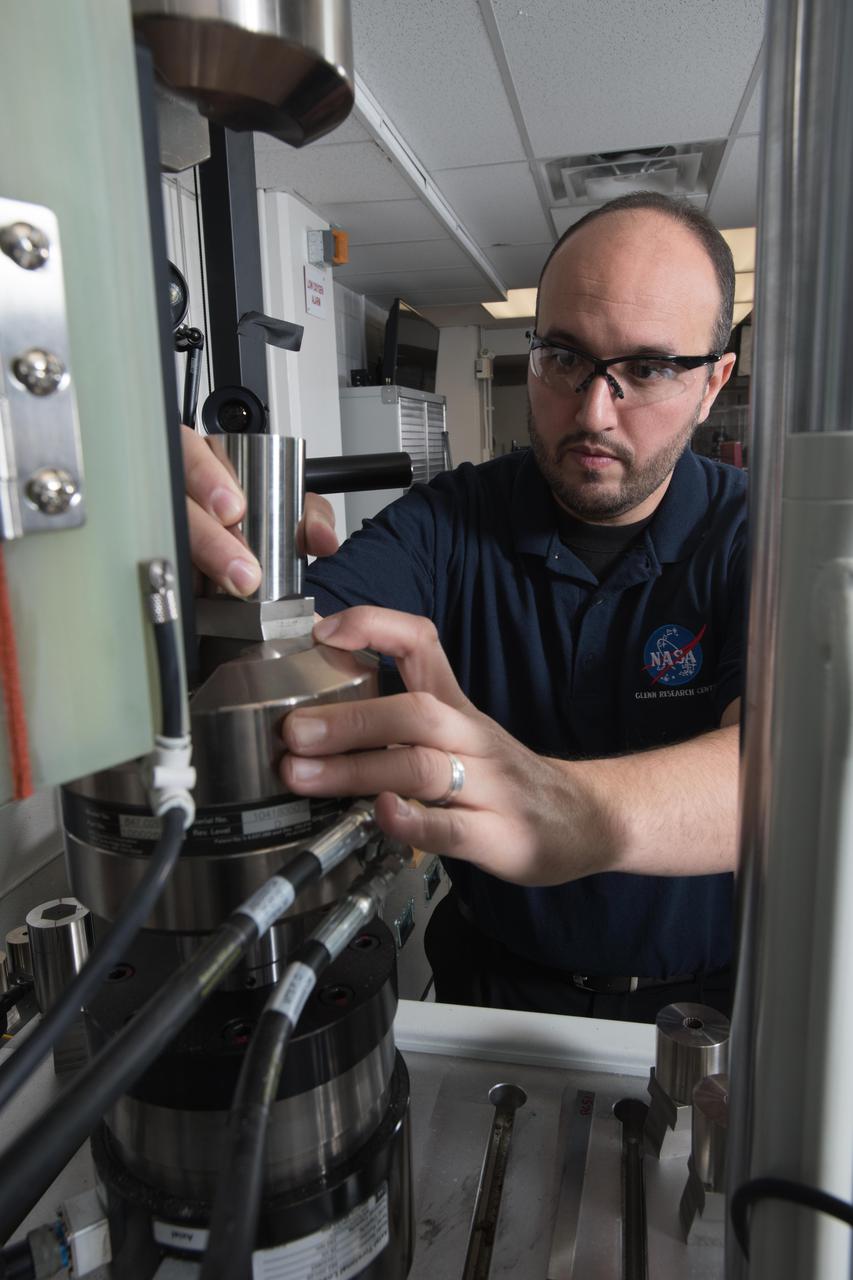
Shape Memory Alloys

DURING APPROACH. OGEE Wing Planform on modified F5D-1 SkylancerAirplane Flight Tests. 'Flow Visualization Photographs'. In landing approach trials at Moffett Field, vapor trails are generated by low pressure in votex flow near wing leading edge on upper wing surface. Studies were undertaken in efforts to determine if there were adverse effects of vortex flow on the dynamic stability of the aircraft.

Ames Mars Wind Tunnel Facility N-245: NASA is simulating small martian 'dust devils' and wind in a laboraotry to determine how they may affect the landscape and environment of the red planet. Dust Devils on Mars are often a great deal biggger than those on Earth and can at times cover the whole planet. Martian winds & dust devils, big and little, collectively are a great force that is constantly changing the planet's environment. shown here: vortex generator inside vacuum chamber using dry ice w/ Jaimie Chhu

Ames Mars Wind Tunnel Facility N-245: NASA is simulating small martian 'dust devils' and wind in a laboraotry to determine how they may affect the landscape and environment of the red planet. Dust Devils on Mars are often a great deal biggger than those on Earth and can at times cover the whole planet. Martian winds & dust devils, big and little, collectively are a great force that is constantly changing the planet's environment. shown here walnut shell particles used in vortex generator to simulate quartz dust on Mars
Ames Mars Wind Tunnel Facility N-245: NASA is simulating small martian 'dust devils' and wind in a laboraotry to determine how they may affect the landscape and environment of the red planet. Dust Devils on Mars are often a great deal biggger than those on Earth and can at times cover the whole planet. Martian winds & dust devils, big and little, collectively are a great force that is constantly changing the planet's environment. shown here: interior of vacuum chamber from above showing Mars W. T. and Vortex Generator w/ Dric Eddlemon and Jaimie Chhu
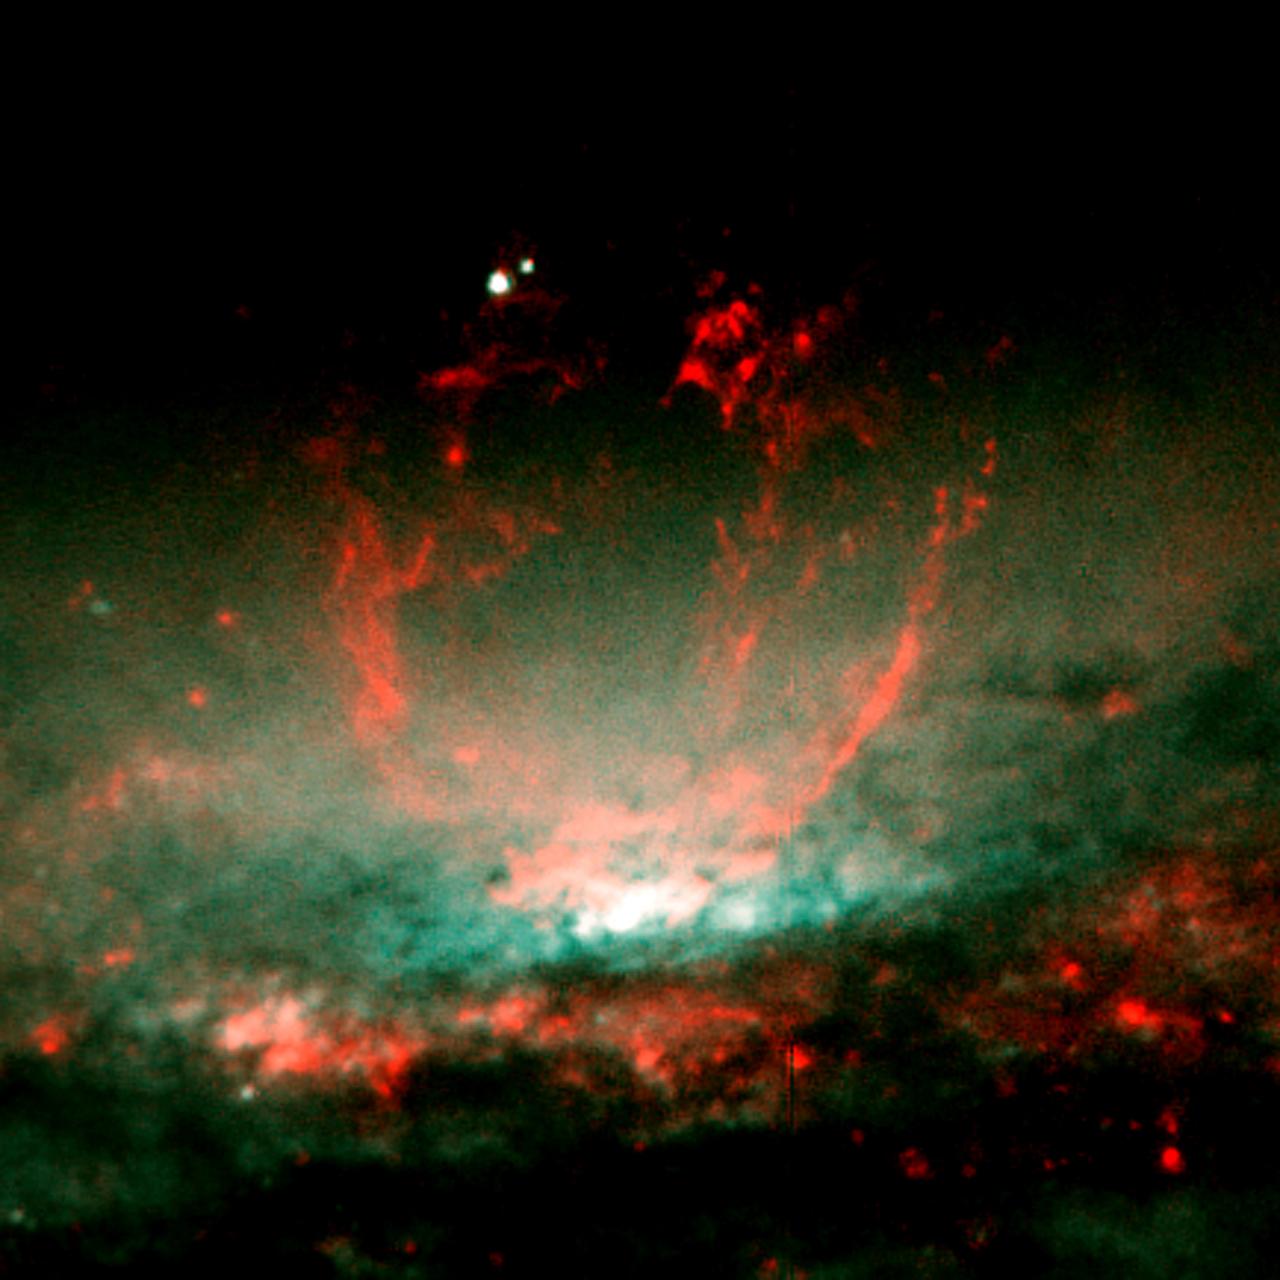
NASA's Hubble Space Telescope (HST) captures a lumpy bubble of hot gas rising from a cauldron of glowing matter in Galaxy NGC 3079, located 50 million light-years from Earth in the constellation Ursa Major. Astronomers suspect the bubble is being blown by "winds" or high speed streams of particles, released during a burst of star formation. The bubble's lumpy surface has four columns of gaseous filaments towering above the galaxy's disc that whirl around in a vortex and are expelled into space. Eventually, this gas will rain down on the disc and may collide with gas clouds, compress them, and form a new generation of stars.
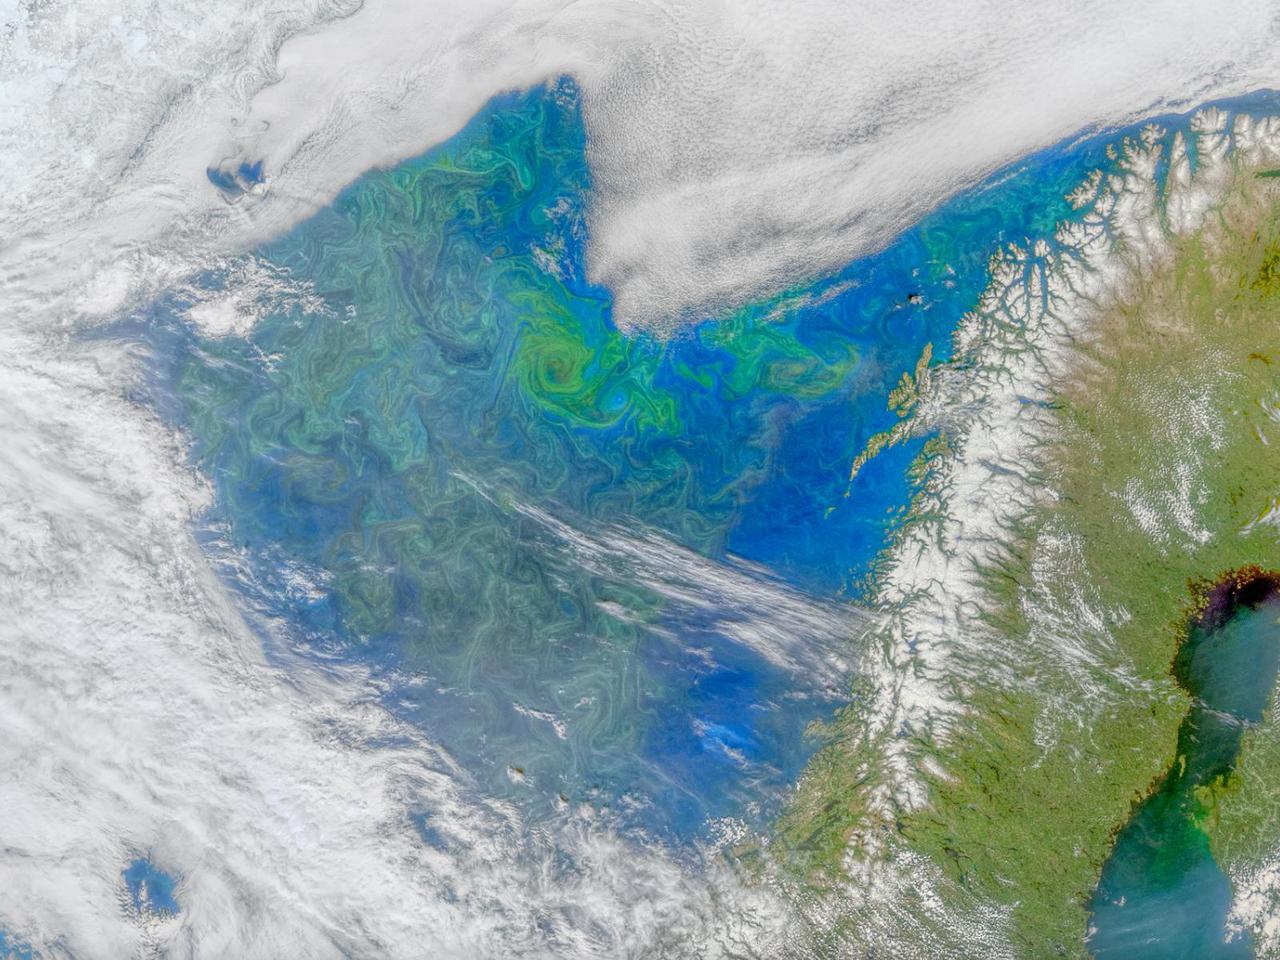
This morphing animation compares the eddies in Earth's oceans to the turbulent clouds in Jupiter's atmosphere. In the movie, a zoom occurs around a vortex dipole: a typical structure consisting of a cyclone and an anticyclone that is present both in Earth's ocean and Jupiter's atmosphere. The ocean image showing the spring phytoplankton bloom in the southern Gulf of Bothnia was generated from data collected by the MODIS instrument about NASA's Aqua satellite. The Jupiter image is from JunoCam. Scientist Lia Siegelman observed the similarities between the richness of turbulence around Joviancyclones and the filaments around smaller eddies seen in Earth's oceans. These similarities were especially evident in high-resolution satellite images of plankton blooms. Movie available at https://photojournal.jpl.nasa.gov/catalog/PIA25069
Shape Memory Alloys
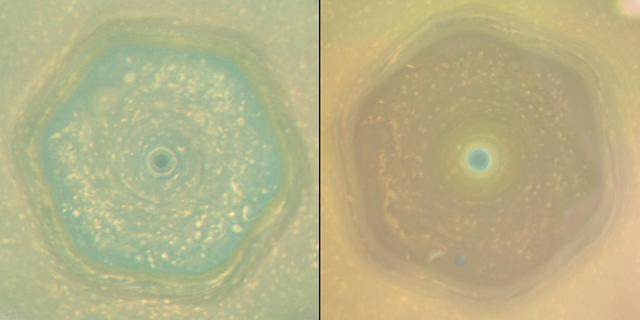
These natural color views from NASA's Cassini spacecraft compare the appearance of Saturn's north-polar region in June 2013 and April 2017. In both views, Saturn's polar hexagon dominates the scene. The comparison shows how clearly the color of the region changed in the interval between the two views, which represents the latter half of Saturn's northern hemisphere spring. In 2013, the entire interior of the hexagon appeared blue. By 2017, most of the hexagon's interior was covered in yellowish haze, and only the center of the polar vortex retained the blue color. The seasonal arrival of the sun's ultraviolet light triggers the formation of photochemical aerosols, leading to haze formation. The general yellowing of the polar region is believed to be caused by smog particles produced by increasing solar radiation shining on the polar region as Saturn approached the northern summer solstice on May 24, 2017. Scientists are considering several ideas to explain why the center of the polar vortex remains blue while the rest of the polar region has turned yellow. One idea is that, because the atmosphere in the vortex's interior is the last place in the northern hemisphere to be exposed to spring and summer sunlight, smog particles have not yet changed the color of the region. A second explanation hypothesizes that the polar vortex may have an internal circulation similar to hurricanes on Earth. If the Saturnian polar vortex indeed has an analogous structure to terrestrial hurricanes, the circulation should be downward in the eye of the vortex. The downward circulation should keep the atmosphere clear of the photochemical smog particles, and may explain the blue color. Images captured with Cassini's wide-angle camera using red, green and blue spectral filters were combined to create these natural-color views. The 2013 view (left in the combined view), was captured on June 25, 2013, when the spacecraft was about 430,000 miles (700,000 kilometers) away from Saturn. The original versions of these images, as sent by the spacecraft, have a size of 512 by 512 pixels and an image scale of about 52 miles (80 kilometers) per pixel; the images have been mapped in polar stereographic projection to the resolution of approximately 16 miles (25 kilometers) per pixel. The second and third frames in the animation were taken approximately 130 and 260 minutes after the first image. The 2017 sequence (right in the combined view) was captured on April 25, 2017, just before Cassini made its first dive between Saturn and its rings. During the imaging sequence, the spacecraft's distance from the center of the planet changed from 450,000 miles (725,000 kilometers) to 143,000 miles (230,000 kilometers). The original versions of these images, as sent by the spacecraft, have a size of 512 by 512 pixels. The resolution of the original images changed from about 52 miles (80 kilometers) per pixel at the beginning to about 9 miles (14 kilometers) per pixel at the end. The images have been mapped in polar stereographic projection to the resolution of approximately 16 miles (25 kilometers) per pixel. The average interval between the frames in the movie sequence is 230 minutes. Corresponding animated movie sequences are available at https://photojournal.jpl.nasa.gov/catalog/PIA21611 https://photojournal.jpl.nasa.gov/catalog/PIA21611
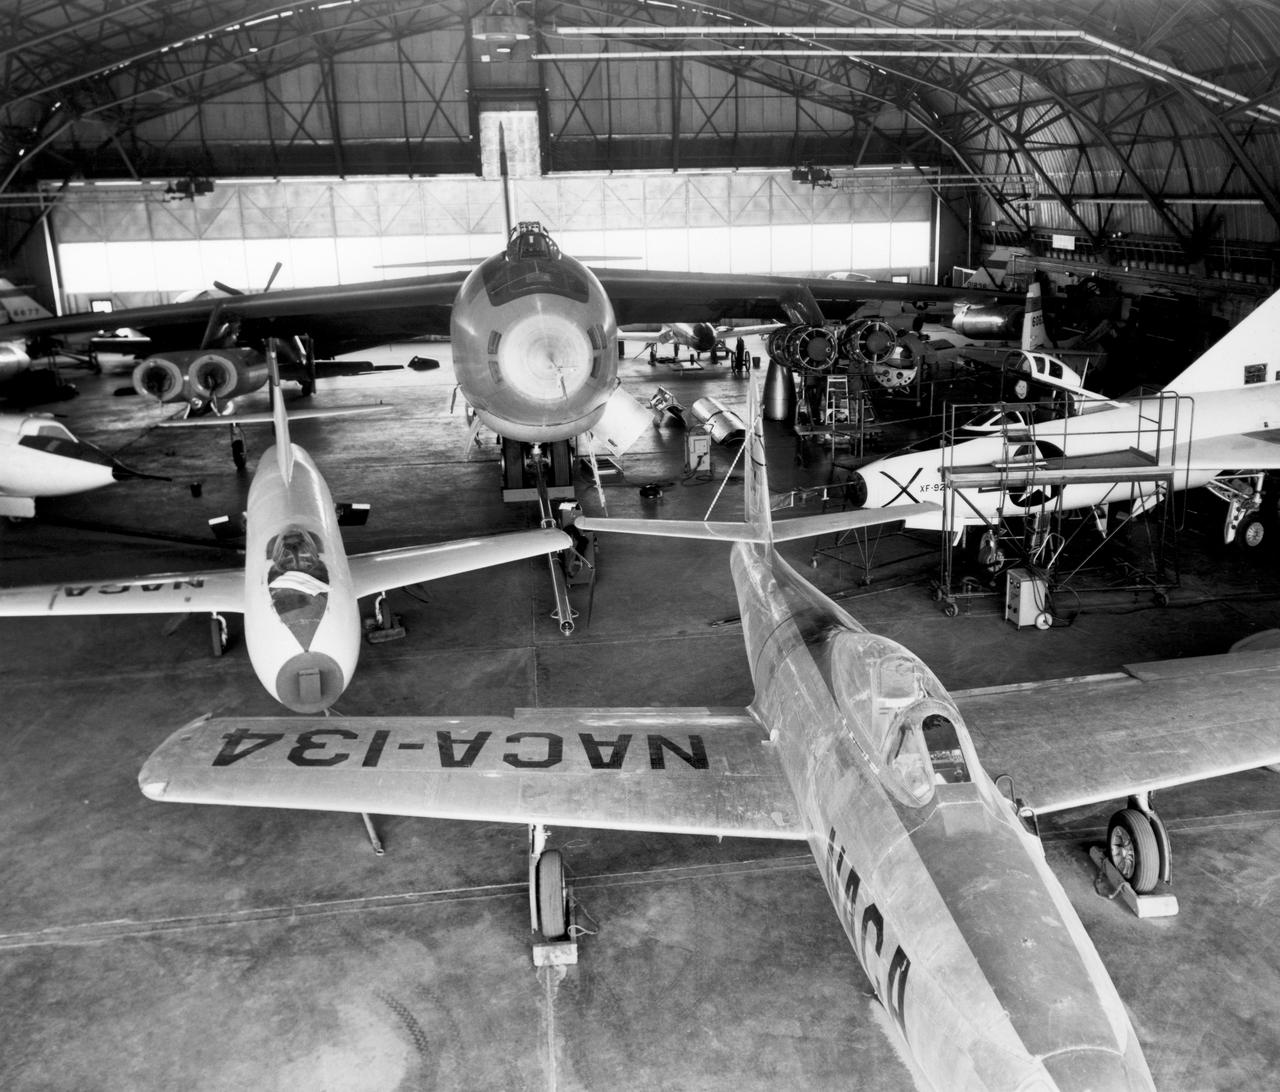
In the center foreground of this 1953 hangar photo is the YF-84A (NACA 134/Air Force 45-59490) used for vortex generator research. It arrived on November 28, 1949, and departed on April 21, 1954. Beside it is the third D-558-1 aircraft (NACA 142/Navy 37972). This aircraft was used for a total of 78 transonic research flights from April 1949 to June 1954. It replaced the second D-558-1, lost in the crash which killed Howard Lilly. Just visible on the left edge is the nose of the first D-558-2 (NACA 143/Navy 37973). Douglas turned the aircraft over to NACA on August 31, 1951, after the contractor had completed its initial test flights. NACA only made a single flight with the aircraft, on September 17, 1956, before the program was cancelled. In the center of the photo is the B-47A (NACA 150/Air Force 49-1900). The B-47 jet bomber, with its thin, swept-back wings, and six podded engines, represented the state of the art in aircraft design in the early 1950s. The aircraft undertook a number of research activities between May 1953 and its 78th and final research flight on November 22, 1957. The tests showed that the aircraft had a buffeting problem at speeds above Mach 0.8. Among the pilots who flew the B-47 were later X-15 pilots Joe Walker, A. Scott Crossfield, John B. McKay, and Neil A. Armstrong. On the right side of the B-47 is NACA's X-1 (Air Force 46-063). The second XS-1 aircraft built, it was fitted with a thicker wing than that on the first aircraft, which had exceeded Mach 1 on October 14, 1947. Flight research by NACA pilots indicated that this thicker wing produced 30 percent more drag at transonic speeds compared to the thinner wing on the first X-1. After a final flight on October 23, 1951, the aircraft was grounded due to the possibility of fatigue failure of the nitrogen spheres used to pressurize the fuel tanks. At the time of this photo, in 1953, the aircraft was in storage. In 1955, the aircraft was extensively modified, becoming the X-1E. In front o
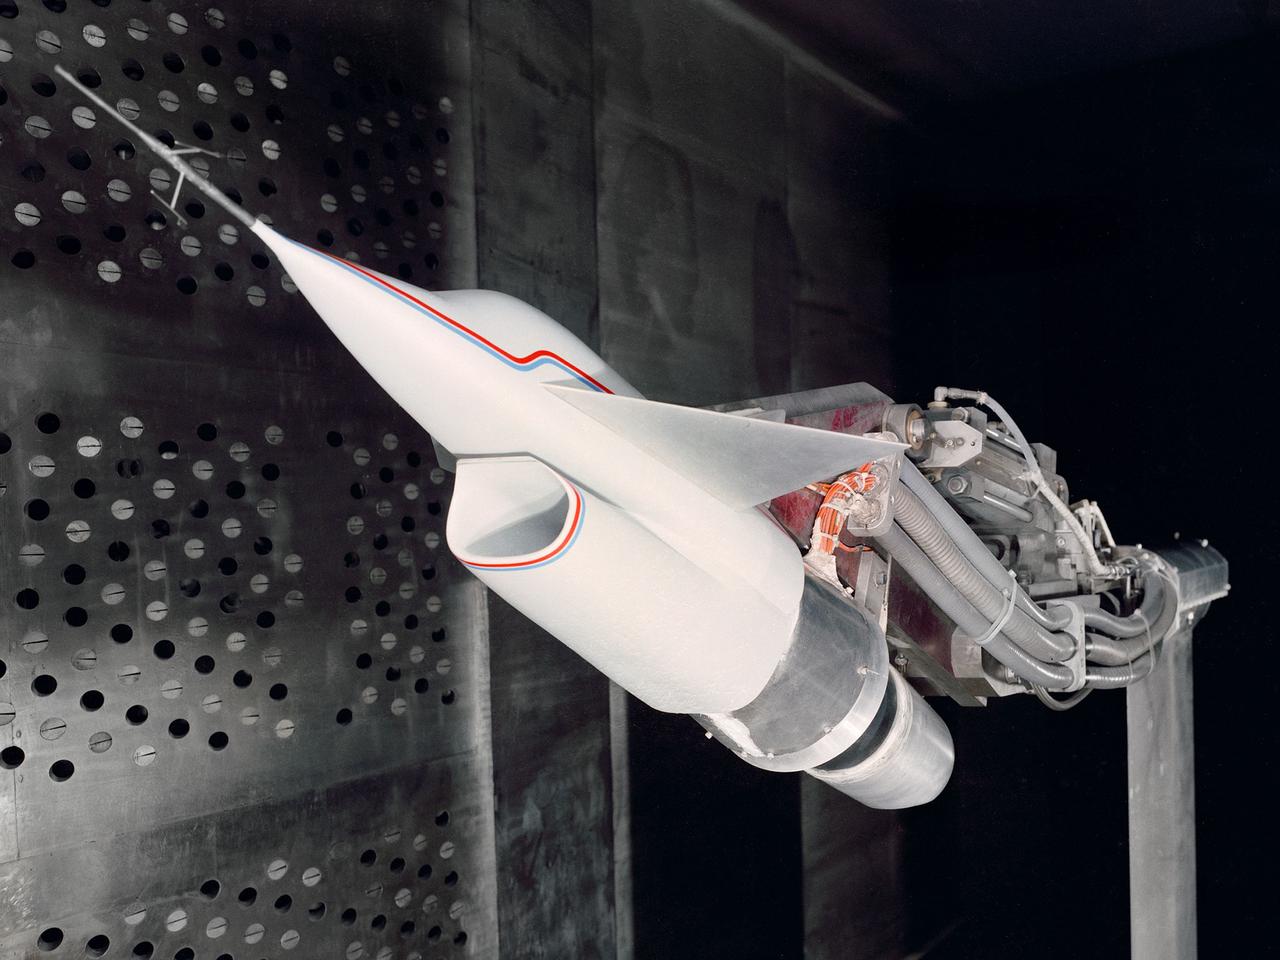
A Highly Maneuverable Aircraft Technology (HiMAT) inlet model installed in the test section of the 8- by 6-Foot Supersonic Wind Tunnel at the National Aeronautics and Space Administration (NASA) Lewis Research Center. Engineers at the Ames Research Center, Dryden Flight Research Center, and Rockwell International designed two pilotless subscale HiMAT vehicles in the mid-1970s to study new design concepts for fighter aircraft in the transonic realm without risking the lives of test pilots. The aircraft used sophisticated technologies such as advanced aerodynamics, composite materials, digital integrated propulsion control, and digital fly-by-wire control systems. In late 1977 NASA Lewis studied the HiMAT’s General Electric J85-21 jet engine in the Propulsion Systems Laboratory. The researchers charted the inlet quality with various combinations anti-distortion screens. HiMAT employed a relatively short and curved inlet compared to actual fighter jets. In the spring of 1979, Larry Smith led an in-depth analysis of the HiMAT inlet in the 8- by 6 tunnel. The researchers installed vortex generators to battle flow separation in the diffuser. The two HiMAT aircraft performed 11 hours of flying over the course of 26 missions from mid-1979 to January 1983 at Dryden and Ames. Although the HiMAT vehicles were considered to be overly complex and expensive, the program yielded a wealth of data that would validate computer-based design tools.

This sequence of color-enhanced images shows how quickly the viewing geometry changes for NASA's Juno spacecraft as it swoops by Jupiter. The images were obtained by JunoCam. Once every 53 days, Juno swings close to Jupiter, speeding over its clouds. In just two hours, the spacecraft travels from a perch over Jupiter's north pole through its closest approach (perijove), then passes over the south pole on its way back out. This sequence shows 11 color-enhanced images from Perijove 8 (Sept. 1, 2017) with the south pole on the left (11th image in the sequence) and the north pole on the right (first image in the sequence). The first image on the right shows a half-lit globe of Jupiter, with the north pole approximately at the upper center of the image close to the terminator -- the dividing line between night and day. As the spacecraft gets closer to Jupiter, the horizon moves in and the range of visible latitudes shrinks. The second and third images in this sequence show the north polar region rotating away from the spacecraft's field of view while the first of Jupiter's lighter-colored bands comes into view. The fourth through the eighth images display a blue-colored vortex in the mid-southern latitudes near Points of Interest "Collision of Colours," "Sharp Edge," "Caltech, by Halka," and "Structure01." The Points of Interest are locations in Jupiter's atmosphere that were identified and named by members of the general public. Additionally, a darker, dynamic band can be seen just south of the vortex. In the ninth and tenth images, the south polar region rotates into view. The final image on the left displays Jupiter's south pole in the center. From the start of this sequence of images to the end, roughly 1 hour and 35 minutes elapsed. https://photojournal.jpl.nasa.gov/catalog/PIA21967 . - Enhanced image by Kevin M. Gill (CC-BY) based on images provided courtesy of NASA/JPL-Caltech/SwRI/MSSS
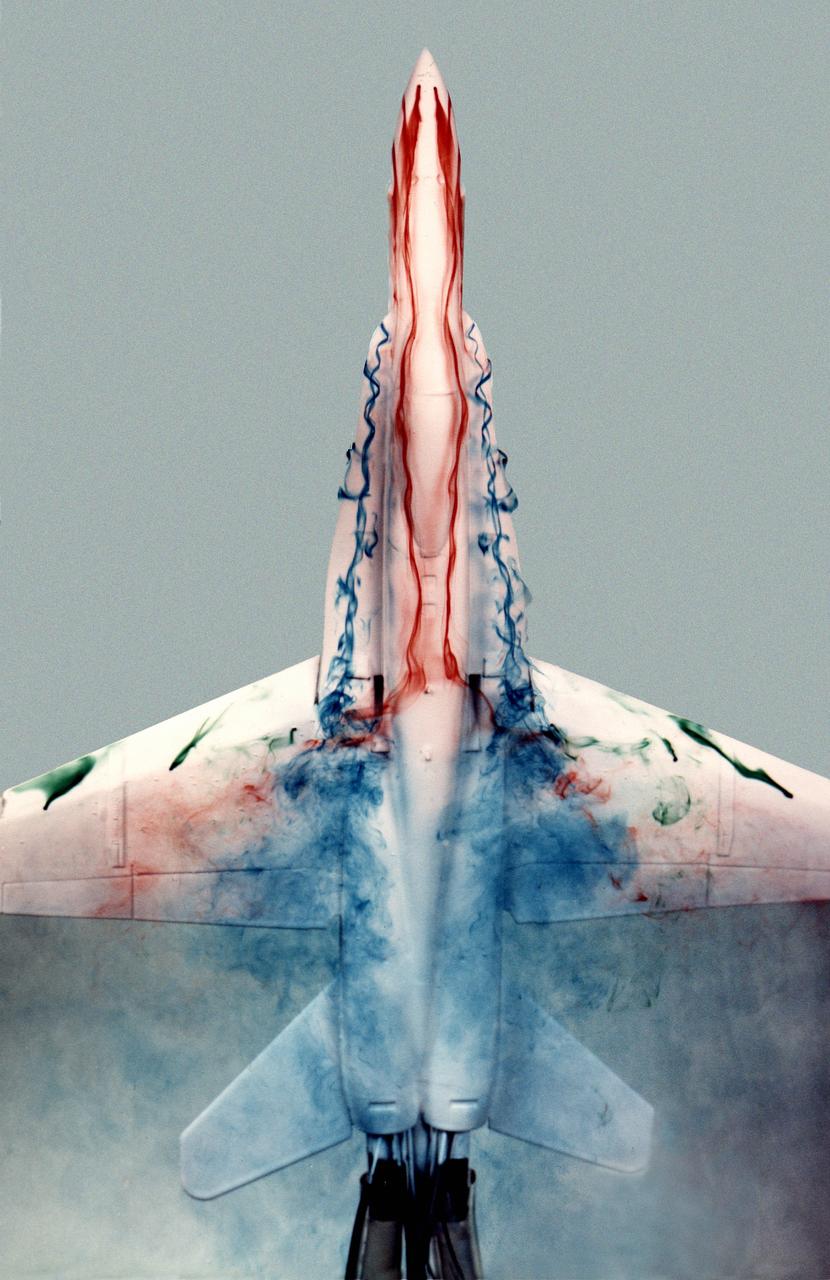
This image shows a plastic 1/48-scale model of an F-18 aircraft inside the "Water Tunnel" more formally known as the NASA Dryden Flow Visualization Facility. Water is pumped through the tunnel in the direction of normal airflow over the aircraft; then, colored dyes are pumped through tubes with needle valves. The dyes flow back along the airframe and over the airfoils highlighting their aerodynamic characteristics. The aircraft can also be moved through its pitch axis to observe airflow disruptions while simulating actual flight at high angles of attack. The Water Tunnel at NASA's Dryden Flight Research Center, Edwards, CA, became operational in 1983 when Dryden was a Flight Research Facility under the management of the Ames Research Center in Mountain View, CA. As a medium for visualizing fluid flow, water has played a significant role. Its use dates back to Leonardo da Vinci (1452-1519), the Renaissance Italian engineer, architect, painter, and sculptor. In more recent times, water tunnels have assisted the study of complex flows and flow-field interactions on aircraft shapes that generate strong vortex flows. Flow visualization in water tunnels assists in determining the strength of vortices, their location, and possible methods of controlling them. The design of the Dryden Water Tunnel imitated that of the Northrop Corporation's tunnel in Hawthorne, CA. Called the Flow Visualization Facility, the Dryden tunnel was built to assist researchers in understanding the aerodynamics of aircraft configured in such a way that they create strong vortex flows, particularly at high angles of attack. The tunnel provides results that compare well with data from aircraft in actual flight in another fluid-air. Other uses of the tunnel have included study of how such flight hardware as antennas, probes, pylons, parachutes, and experimental fixtures affect airflow. The facility has also been helpful in finding the best locations for emitting smoke from flight vehicles for flow vi

ISS038-E-003612 (15 Nov. 2013) --- Islands of the Four Mountains are featured in this image photographed by an Expedition 38 crew member on the International Space Station. Morning sunlight illuminates the southeast-facing slopes of the islands in the photograph. The islands, part of the Aleutian Island chain, are actually the upper slopes of volcanoes rising from the sea floor; Carlisle, Cleveland, Herbert, and Tana. Carlisle and Herbert volcanoes are distinct cones and form separate islands. Cleveland volcano and the Tana volcanic complex form the eastern and western ends respectively of Chuginadak Island; a cloud bank obscures the connecting land mass in this image. Cleveland volcano (peak elevation 1,730 meters above sea level) is one of the most active in the Aleutian chain, with its most recent activity--eruptions and lava flow emplacement--taking place in May of 2013. The northernmost of the islands, Carlisle volcano's (peak elevation 1,620 meters above sea level) last confirmed eruption occurred in 1828, with unconfirmed reports of activity in 1987. Herbert volcano (peak elevation 1,280 meters above sea level) to the southwest displays a classic cone structure breached by a two-kilometer wide summit caldera (upper right), but there are no historical records of volcanic activity. The easternmost peak, Tana (1,170 meters above sea level) is a volcanic complex comprised of two east-west trending volcanoes and associated younger cinder cones; like Herbert volcano, there is no historical record of activity at Tana. A layer of low clouds and/or fog obscures much of the lower elevations of the islands and the sea surface, but the clouds also indicate the general airflow pattern around and through the islands. Directly to the south-southeast of Cleveland volcano a Von Karman vortex "street" is visible. Shadows cast by the morning sun extend from the peaks towards the northwest. The peaks of all of the Four Islands have snow cover; this is distinct from the clouds due to both higher brightness (white versus gray) and specific location on the landscape.
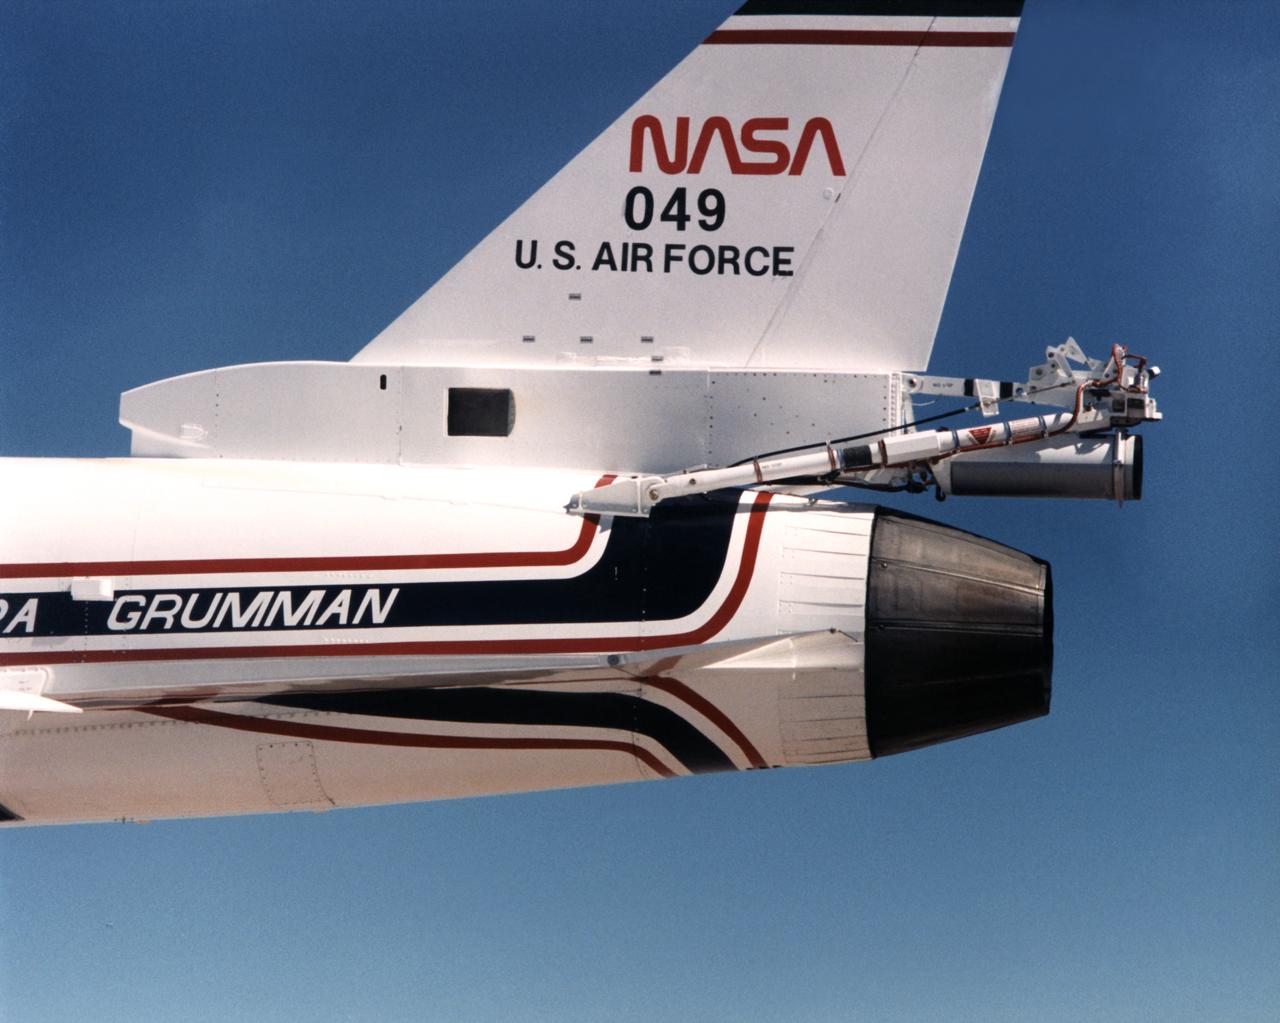
Because the number two X-29 at NASA's Ames-Dryden Flight Research Facility (later the Dryden Flight Research Center) flew at higher angles of attack than the number one aircraft, it required a spin chute system for safety. The system deployed a parachute for recovery of the aircraft if it inadvertently entered an uncontrolled spin. Most of the components of the spin chute system were located on a truss at the aft end of the aircraft. In addition, there were several cockpit modifications to facilitate use of the chute. The parachute was made of nylon and was of the conical ribbon type.
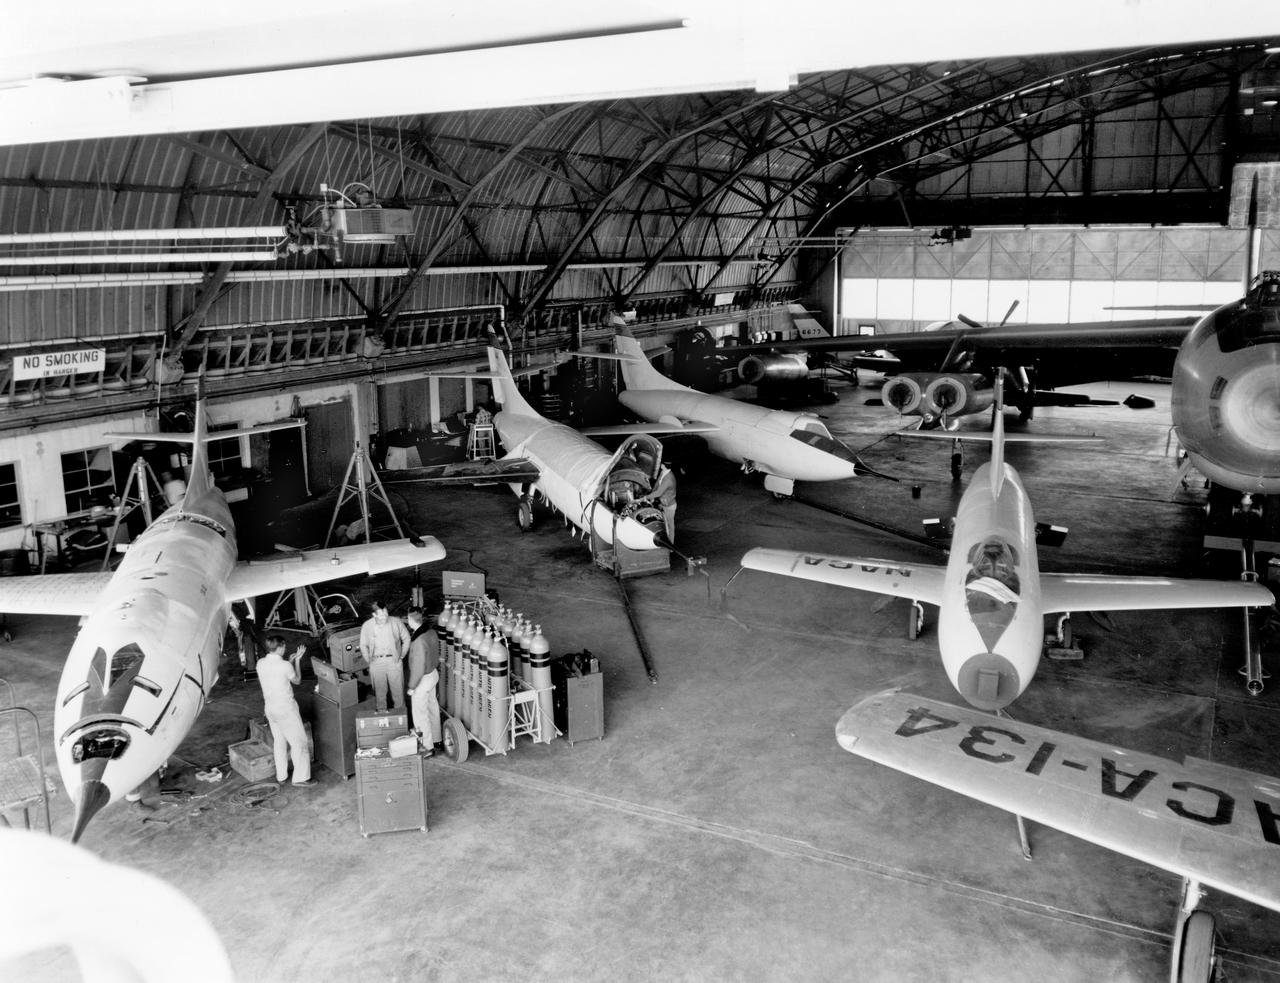
The aircraft in this 1953 photo of the National Advisory Committee for Aeronautics (NACA) hangar at South Base of Edwards Air Force Base showed the wide range of research activities being undertaken. On the left side of the hangar are the three D-558-2 research aircraft. These were designed to test swept wings at supersonic speeds approaching Mach 2. The front D-558-2 is the third built (NACA 145/Navy 37975). It has been modified with a leading-edge chord extension. This was one of a number of wing modifications, using different configurations of slats and/or wing fences, to ease the airplane's tendency to pitch-up. NACA 145 had both a jet and a rocket engine. The middle aircraft is NACA 144 (Navy 37974), the second built. It was all-rocket powered, and Scott Crossfield made the first Mach 2 flight in this aircraft on November 20, 1953. The aircraft in the back is D-558-2 number 1. NACA 143 (Navy 37973) was also carried both a jet and a rocket engine in 1953. It had been used for the Douglas contractor flights, then was turned over to the NACA. The aircraft was not converted to all-rocket power until June 1954. It made only a single NACA flight before NACA's D-558-2 program ended in 1956. Beside the three D-558-2s is the third D-558-1. Unlike the supersonic D-558-2s, it was designed for flight research at transonic speeds, up to Mach 1. The D-558-1 was jet-powered, and took off from the ground. The D-558-1's handling was poor as it approached Mach 1. Given the designation NACA 142 (Navy 37972), it made a total of 78 research flights, with the last in June 1953. In the back of the hangar is the X-4 (Air Force 46-677). This was a Northrop-built research aircraft which tested a swept wing design without horizontal stabilizers. The aircraft proved unstable in flight at speeds above Mach 0.88. The aircraft showed combined pitching, rolling, and yawing motions, and the design was considered unsuitable. The aircraft, the second X-4 built, was then used as a pilot traine
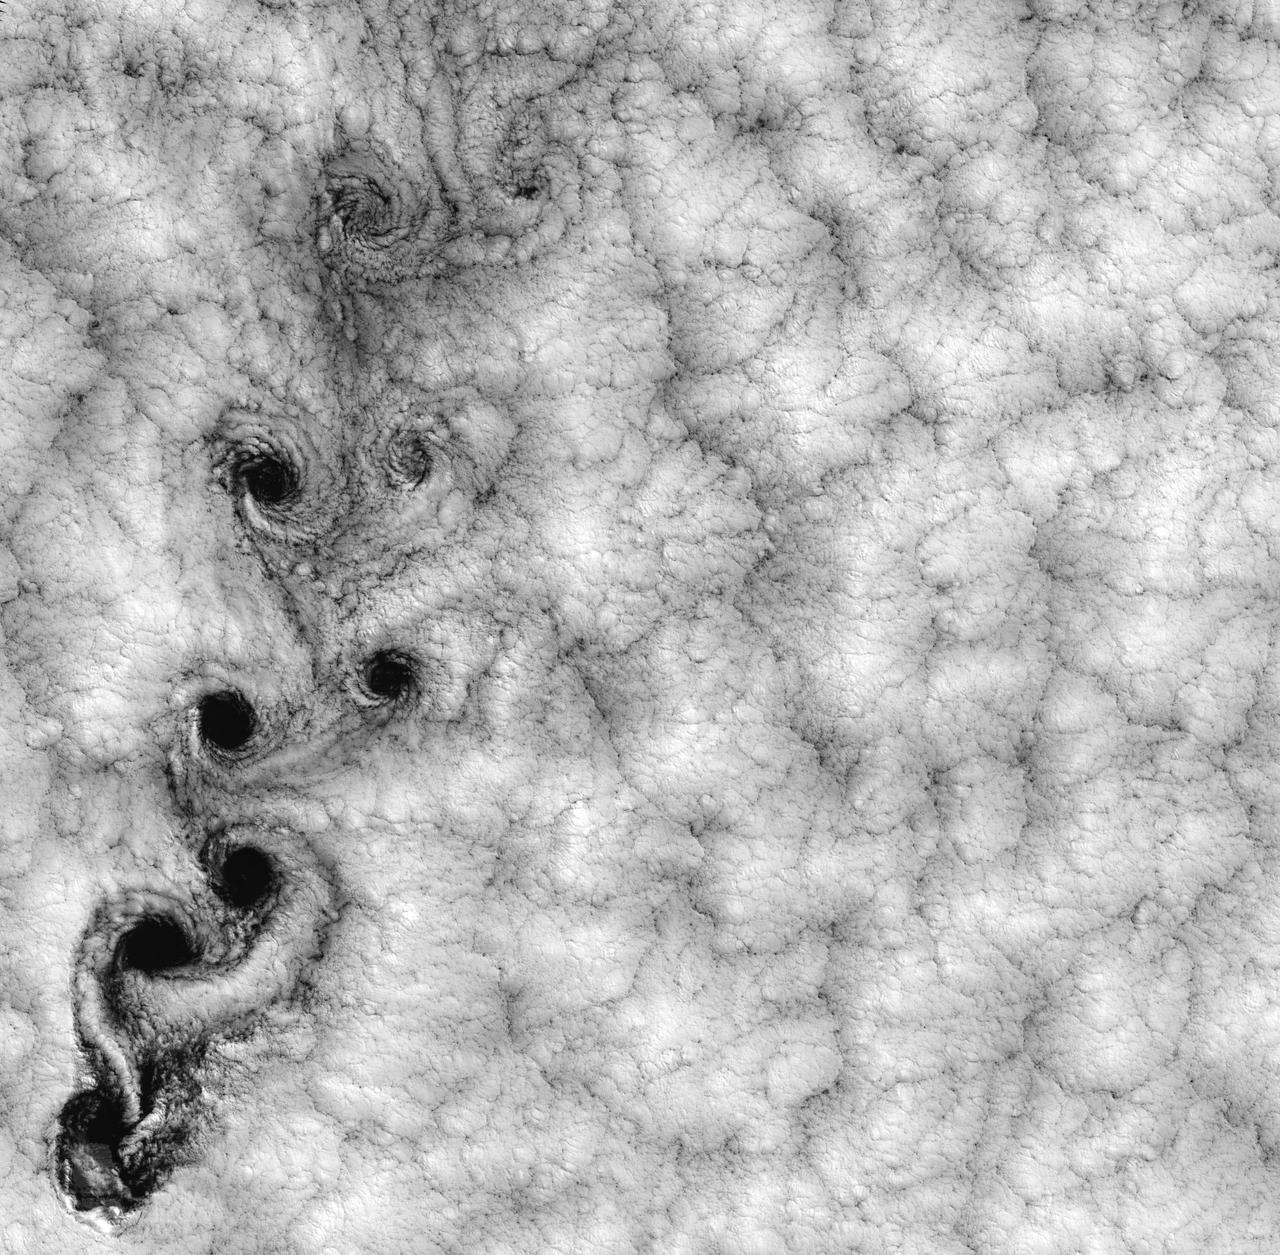
NASA image acquired September 15, 1999 This Landsat 7 image of clouds off the Chilean coast near the Juan Fernandez Islands (also known as the Robinson Crusoe Islands) on September 15, 1999, shows a unique pattern called a “von Karman vortex street.” This pattern has long been studied in the laboratory, where the vortices are created by oil flowing past a cylindrical obstacle, making a string of vortices only several tens of centimeters long. Study of this classic “flow past a circular cylinder” has been very important in the understanding of laminar and turbulent fluid flow that controls a wide variety of phenomena, from the lift under an aircraft wing to Earth’s weather. Here, the cylinder is replaced by Alejandro Selkirk Island (named after the true “Robinson Crusoe,” who was stranded here for many months in the early 1700s). The island is about 1.5 km in diameter, and rises 1.6 km into a layer of marine stratocumulus clouds. This type of cloud is important for its strong cooling of the Earth’s surface, partially counteracting the Greenhouse warming. An extended, steady equatorward wind creates vortices with clockwise flow off the eastern edge and counterclockwise flow off the western edge of the island. The vortices grow as they advect hundreds of kilometers downwind, making a street 10,000 times longer than those made in the laboratory. Observing the same phenomenon extended over such a wide range of sizes dramatizes the “fractal” nature of atmospheric convection and clouds. Fractals are characteristic of fluid flow and other dynamic systems that exhibit “chaotic” motions. Both clockwise and counter-clockwise vortices are generated by flow around the island. As the flow separates from the island’s leeward (away from the source of the wind) side, the vortices “swallow” some of the clear air over the island. (Much of the island air is cloudless due to a local “land breeze” circulation set up by the larger heat capacity of the waters surrounding the island.) The “swallowed” gulps of clear island air get carried along within the vortices, but these are soon mixed into the surrounding clouds. Landsat is unique in its ability to image both the small-scale eddies that mix clear and cloudy air, down to the 30 meter pixel size of Landsat, but also having a wide enough field-of-view, 180 km, to reveal the connection of the turbulence to large-scale flows such as the subtropical oceanic gyres. Landsat 7, with its new onboard digital recorder, has extended this capability away from the few Landsat ground stations to remote areas such as Alejandro Island, and thus is gradually providing a global dynamic picture of evolving human-scale phenomena. For more details on von Karman vortices, refer to <a href="http://climate.gsfc.nasa.gov/~cahalan" rel="nofollow">climate.gsfc.nasa.gov/~cahalan</a>. Image and caption courtesy Bob Cahalan, NASA GSFC Instrument: Landsat 7 - ETM+ Credit: NASA/GSFC/Landsat <b><a href="http://www.nasa.gov/centers/goddard/home/index.html" rel="nofollow">NASA Goddard Space Flight Center</a></b> enables NASA’s mission through four scientific endeavors: Earth Science, Heliophysics, Solar System Exploration, and Astrophysics. Goddard plays a leading role in NASA’s accomplishments by contributing compelling scientific knowledge to advance the Agency’s mission. <b>Follow us on <a href="http://twitter.com/NASA_GoddardPix" rel="nofollow">Twitter</a></b> <b>Join us on <a href="http://www.facebook.com/pages/Greenbelt-MD/NASA-Goddard/395013845897?ref=tsd" rel="nofollow">Facebook</a></b>