Among the Waves
Making Waves
Waves on Saturn
Waves and Curls
Saturn Waves

Daphnis Waves
Sinan Wave
Titan Waves?
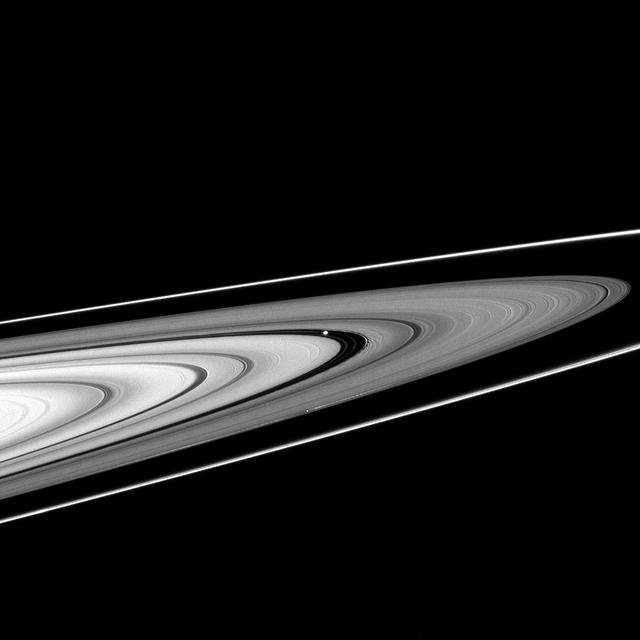
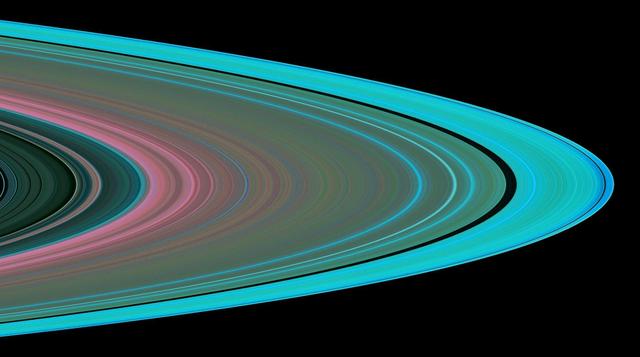
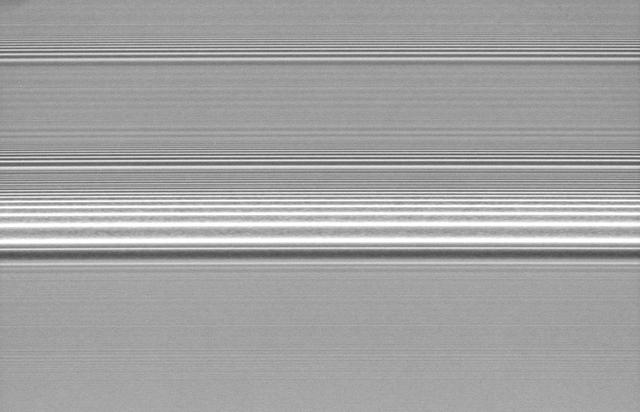
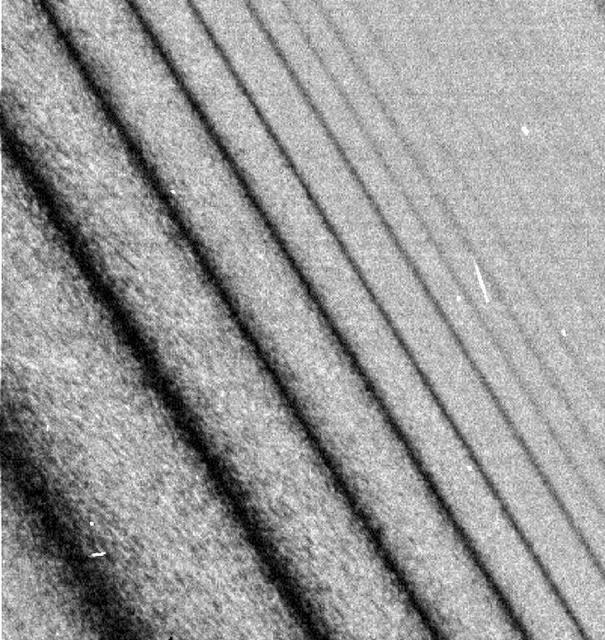
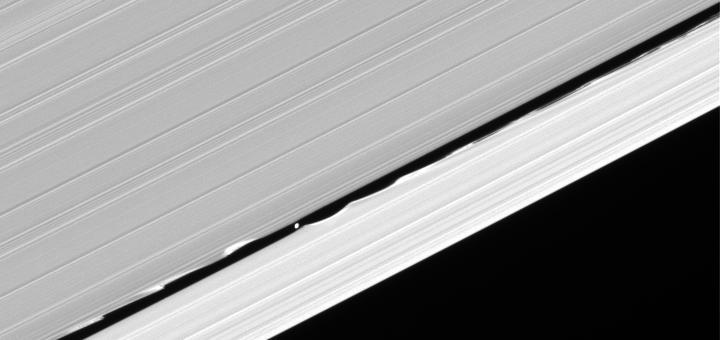
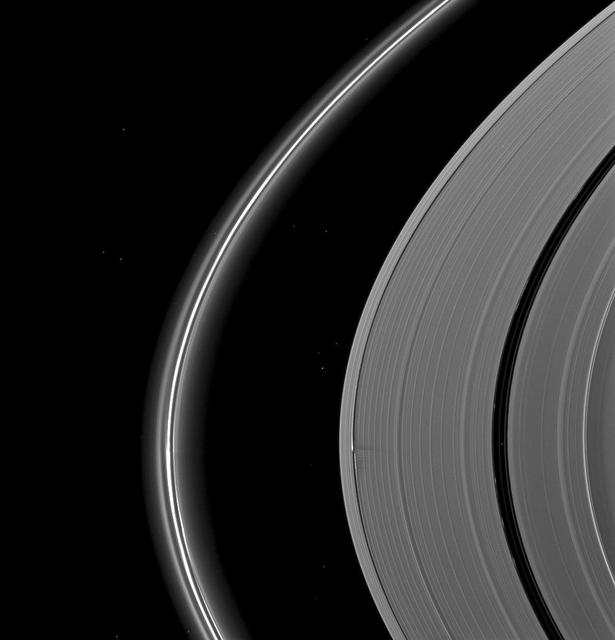
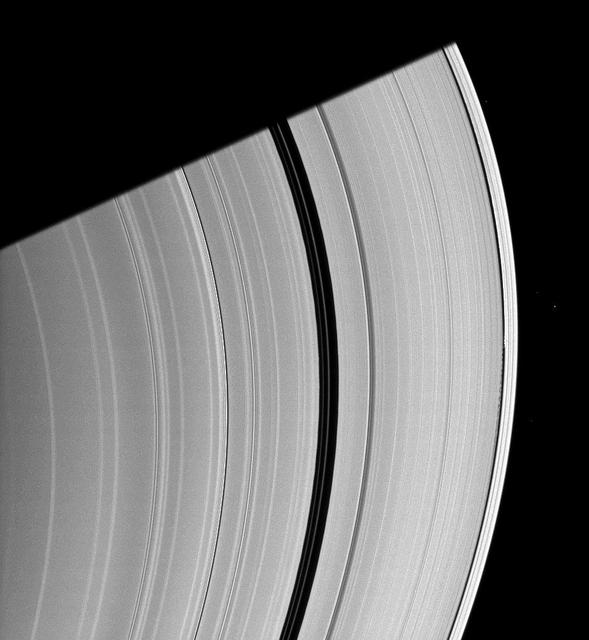
Saturn A ring is decorated with several kinds of waves. NASA Cassini spacecraft has captured a host of density waves, a bending wave, and the edge waves on the edge of the Keeler gap caused by the small moon Daphnis.
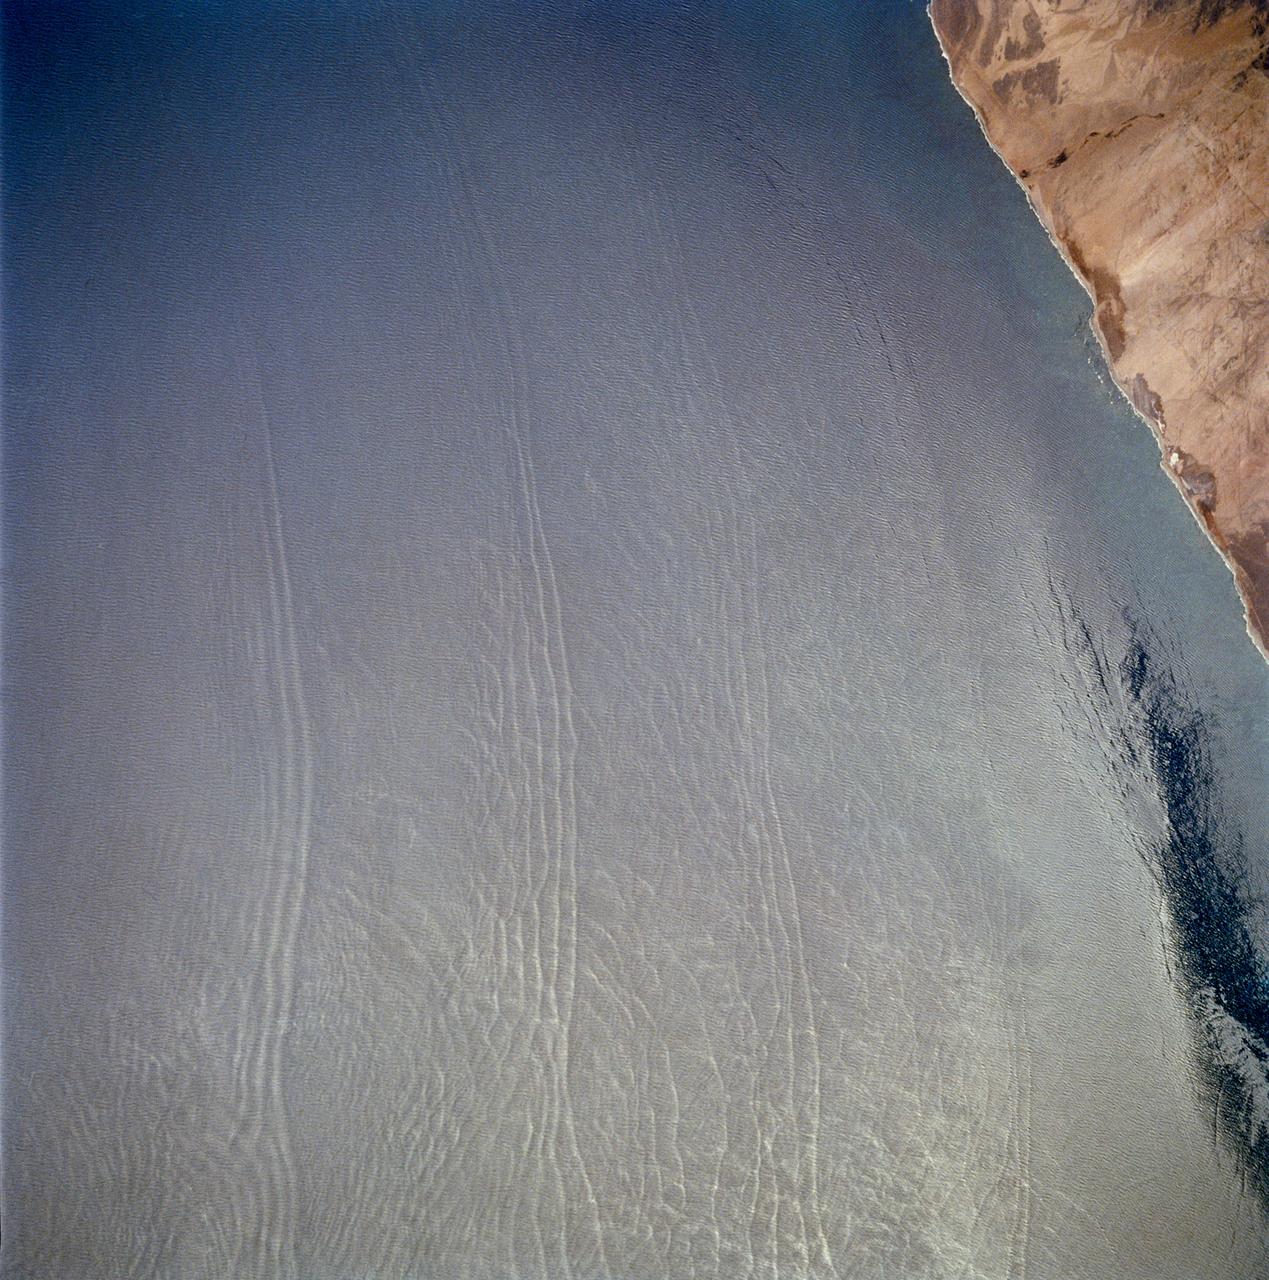
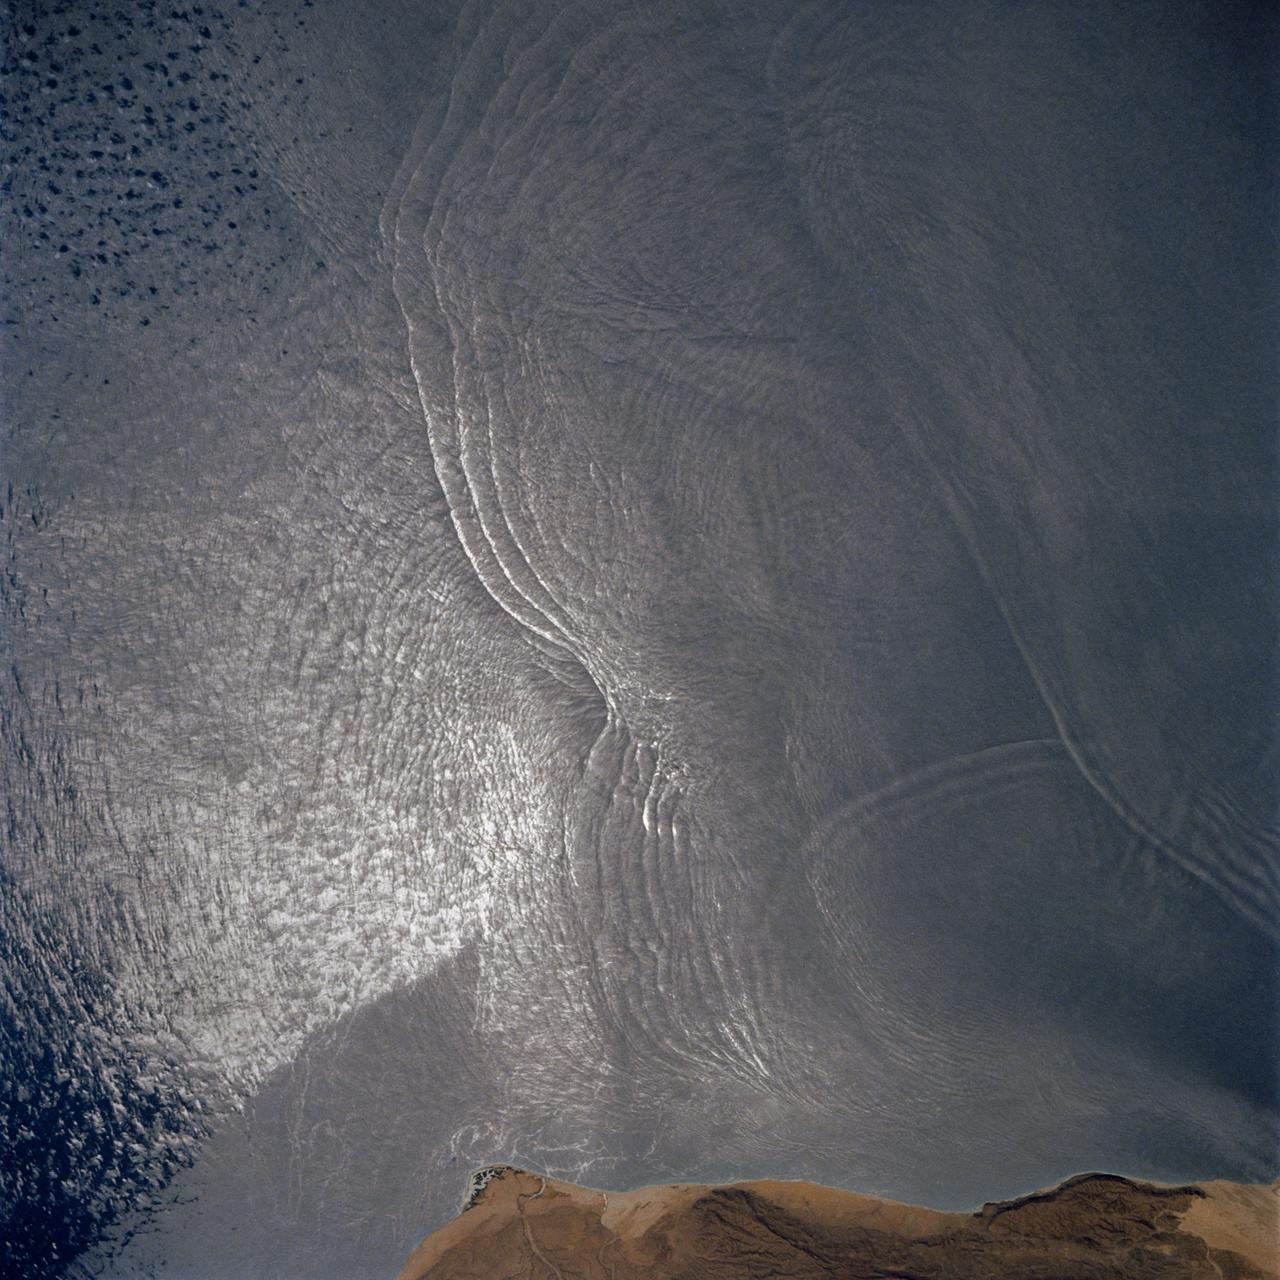
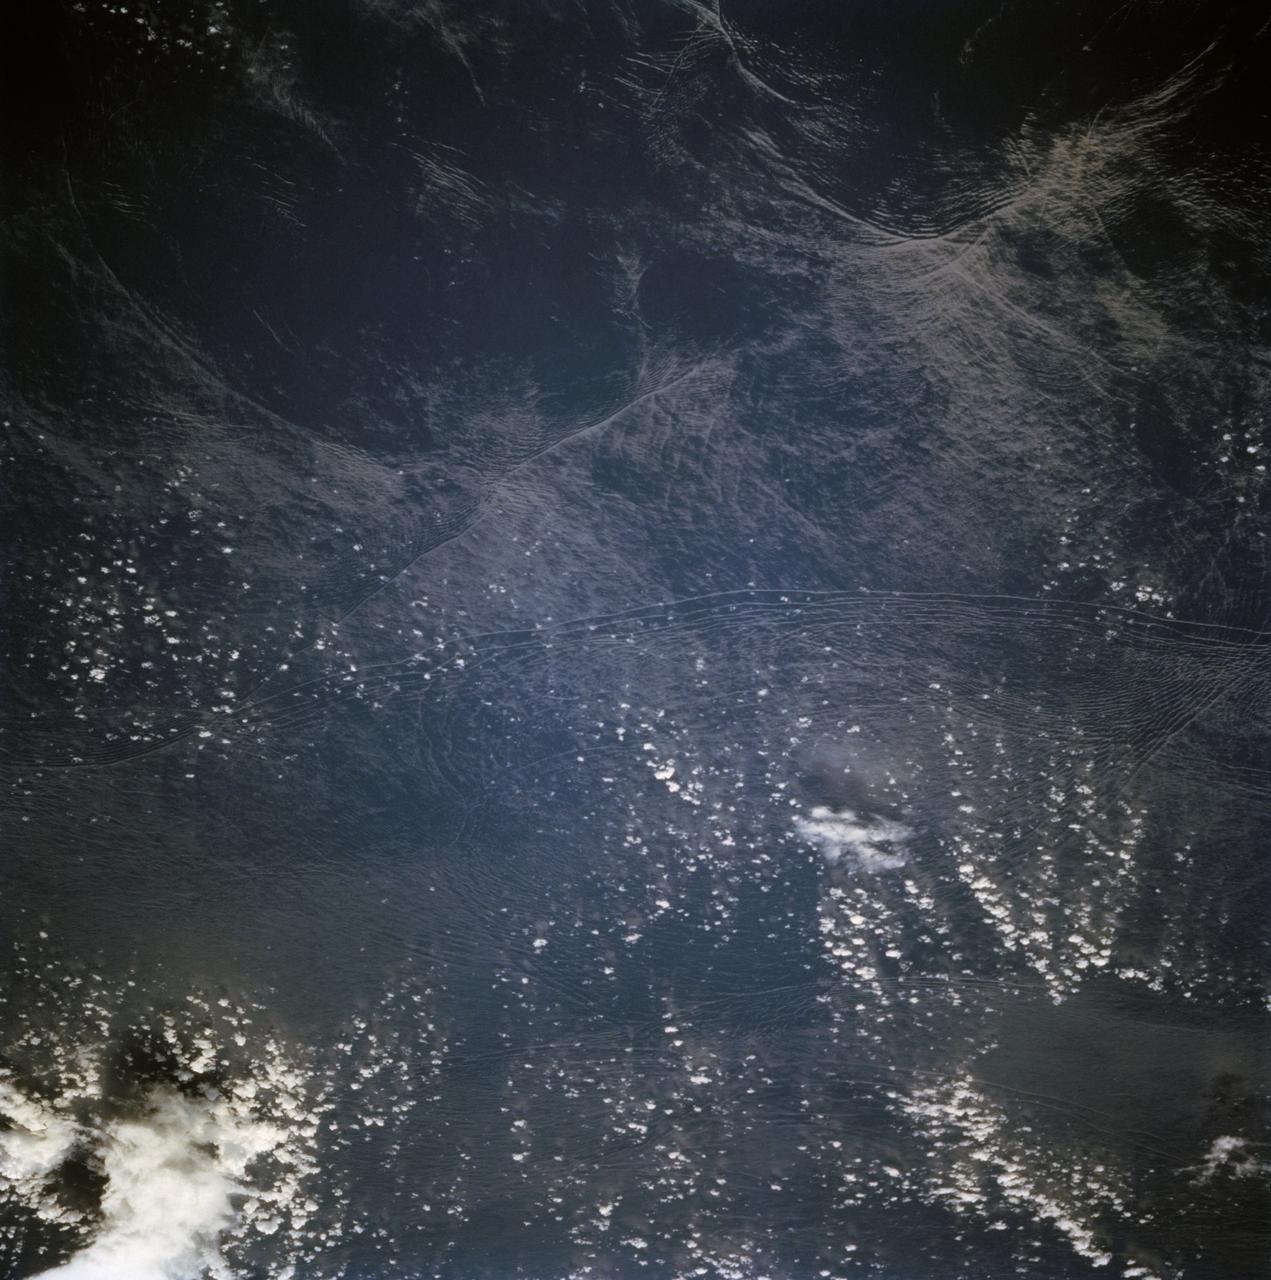
These open ocean Internal Waves were seen off the Namibia Coast, Africa (23.0S, 14.0E). The periodic and regularly spaced sets of internal waves most likely coincide with tidal periods about 12 hours apart. The wave length (distance from crest to crest) varies between 1.5 and 5.0 miles and the crest lengths stretch across and beyond the distance of the photo. The waves are intersecting the Namibia coastline at about a 30 degree angle.
Catching Saturn Waves
Wave Shadows in Motion
Keeler Moon and Waves
Waves and Small Particles in Ring A
Catching Saturn Ring Waves
Rings Full of Waves
Wave Clouds off Korolev
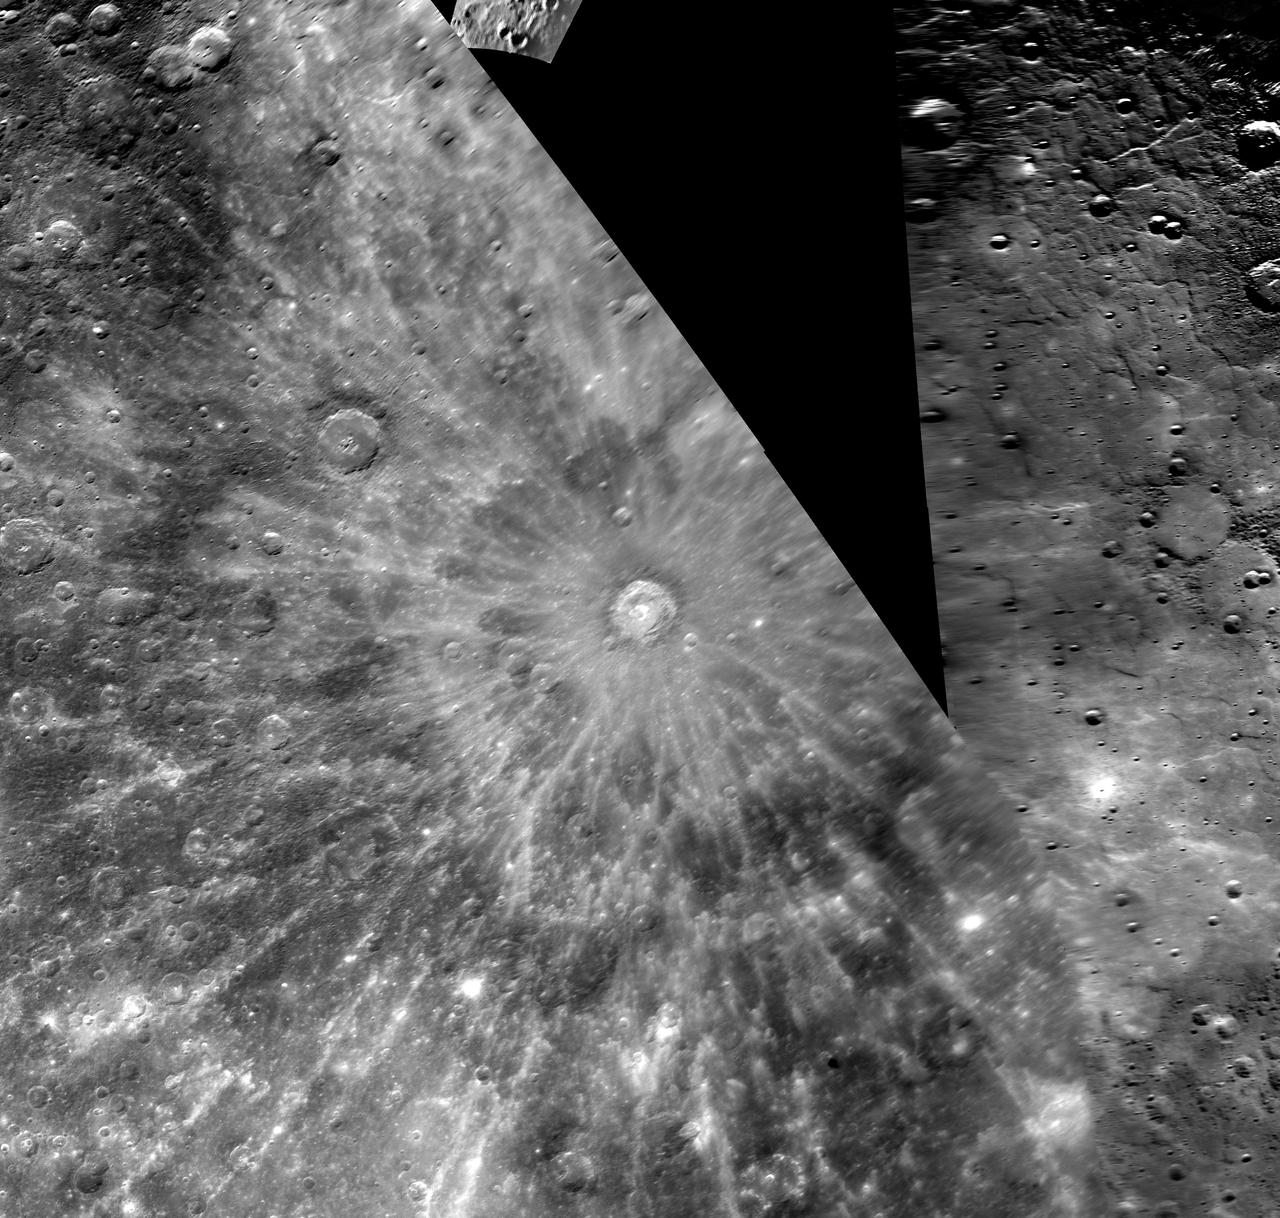
Hokusai Paints a Wave of Rays
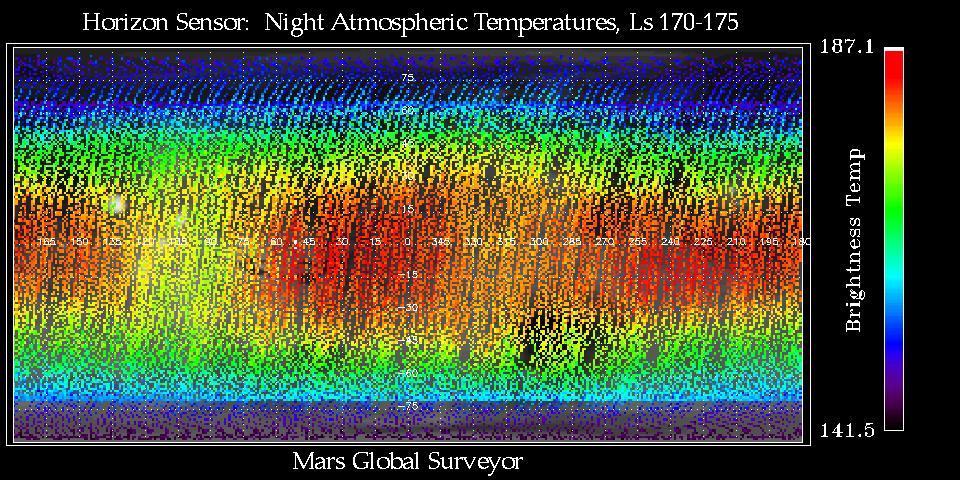
Thermal Wave Phenomena
Waves from Daphnis
Spiral Density Waves

Two Kinds of Wave
Rings Full of Waves zoom
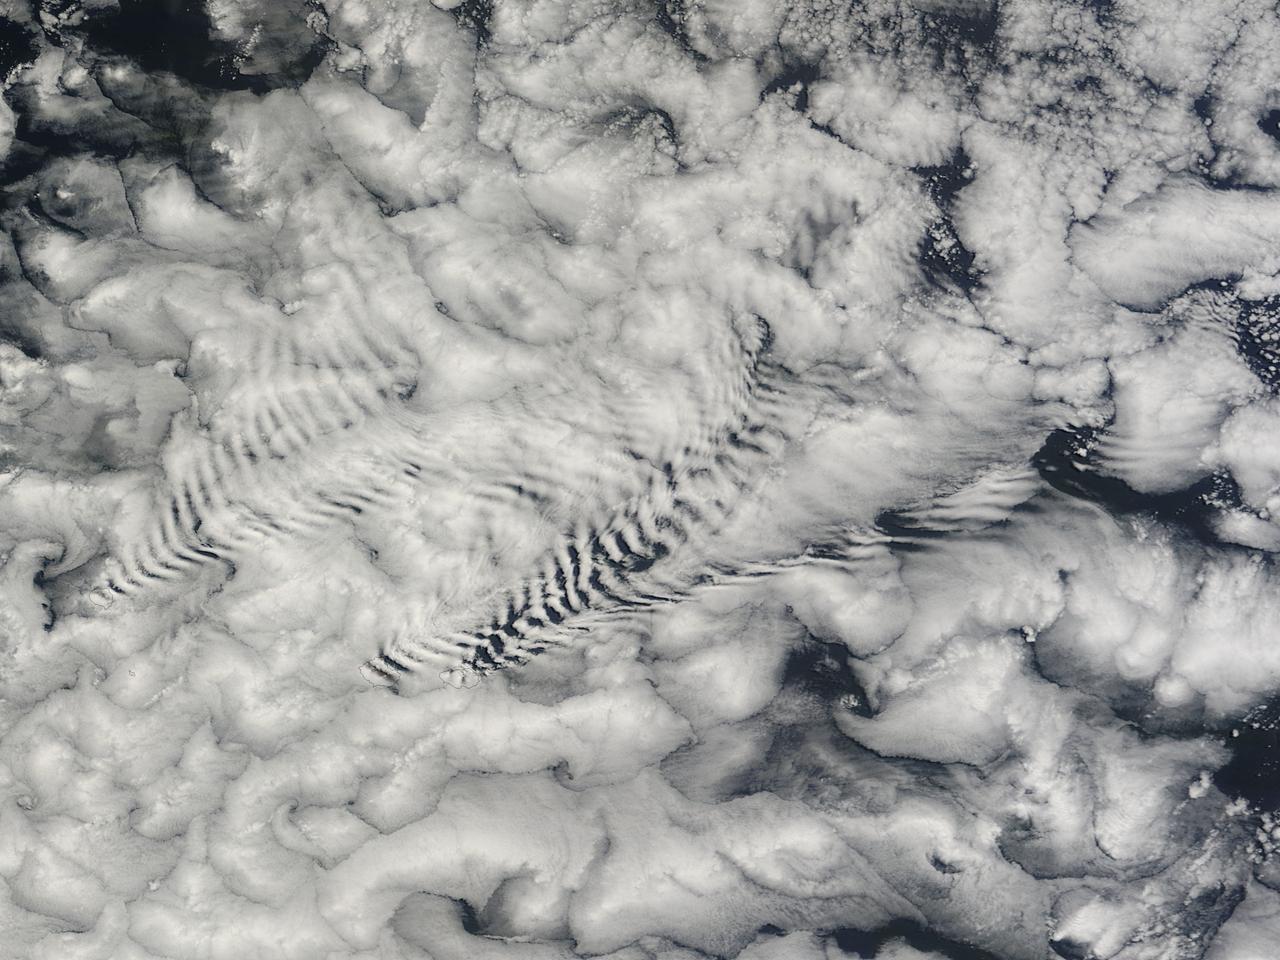
![On June 26, 2016, the Moderate Resolution Imaging Spectroradiometer (MODIS) on NASA’s Terra satellite acquired this natural-color image of cloud gravity waves off the coast of Angola and Namibia. “I [regularly] look at this area on Worldview because you quite often have these gravity waves,” said Bastiaan Van Diedenhoven, a researcher for Columbia University and NASA's Goddard Institute for Space Studies interested in cloud formations. “On this day, there was so much going on—so many different waves from different directions—that they really started interfering.” A distinctive criss-cross pattern formed in unbroken stretches hundreds of kilometers long. Similar to a boat’s wake, which forms as the water is pushed upward by the boat and pulled downward again by gravity, these clouds are formed by the rise and fall of colliding air columns. Off of west Africa, dry air coming off the Namib desert—after being cooled by the night—moves out under the balmy, moist air over the ocean and bumps it upwards. As the humid air rises to a higher altitude, the moisture condenses into droplets, forming clouds. Gravity rolls these newly formed clouds into a wave-like shape. When moist air goes up, it cools, and then gravity pushes it down again. As it plummets toward the earth, the moist air is pushed up again by the dry air. Repeated again and again, this process creates gravity waves. Clouds occur at the upward wave motions, while they evaporate at the downward motions. Such waves will often propagate in the morning and early afternoon, said Van Diedenhoven. During the course of the day, the clouds move out to sea and stretch out, as the dry air flowing off the land pushes the moist ocean air westward. NASA Earth Observatory image by Jesse Allen, using data from the Land Atmosphere Near real-time Capability for EOS (LANCE). via @NASAEarth <a href="http://go.nasa.gov/29Btxcy" rel="nofollow">go.nasa.gov/29Btxcy</a> <b><a href="http://go.nasa.gov/29BtHR6" rel="nofollow">NASA image use policy.</a></b> <b><a href="http://go.nasa.gov/29BtDku" rel="nofollow">NASA Goddard Space Flight Center</a></b> enables NASA’s mission through four scientific endeavors: Earth Science, Heliophysics, Solar System Exploration, and Astrophysics. Goddard plays a leading role in NASA’s accomplishments by contributing compelling scientific knowledge to advance the Agency’s mission. <b>Follow us on <a href="http://go.nasa.gov/29BtVrn" rel="nofollow">Twitter</a></b> <b>Like us on <a href="http://go.nasa.gov/29BtygK" rel="nofollow">Facebook</a></b> <b>Find us on <a href="http://go.nasa.gov/29Bu0vu" rel="nofollow">Instagram</a></b>](https://images-assets.nasa.gov/image/GSFC_20171208_Archive_e000269/GSFC_20171208_Archive_e000269~medium.jpg)
On June 26, 2016, the Moderate Resolution Imaging Spectroradiometer (MODIS) on NASA’s Terra satellite acquired this natural-color image of cloud gravity waves off the coast of Angola and Namibia. “I [regularly] look at this area on Worldview because you quite often have these gravity waves,” said Bastiaan Van Diedenhoven, a researcher for Columbia University and NASA's Goddard Institute for Space Studies interested in cloud formations. “On this day, there was so much going on—so many different waves from different directions—that they really started interfering.” A distinctive criss-cross pattern formed in unbroken stretches hundreds of kilometers long. Similar to a boat’s wake, which forms as the water is pushed upward by the boat and pulled downward again by gravity, these clouds are formed by the rise and fall of colliding air columns. Off of west Africa, dry air coming off the Namib desert—after being cooled by the night—moves out under the balmy, moist air over the ocean and bumps it upwards. As the humid air rises to a higher altitude, the moisture condenses into droplets, forming clouds. Gravity rolls these newly formed clouds into a wave-like shape. When moist air goes up, it cools, and then gravity pushes it down again. As it plummets toward the earth, the moist air is pushed up again by the dry air. Repeated again and again, this process creates gravity waves. Clouds occur at the upward wave motions, while they evaporate at the downward motions. Such waves will often propagate in the morning and early afternoon, said Van Diedenhoven. During the course of the day, the clouds move out to sea and stretch out, as the dry air flowing off the land pushes the moist ocean air westward. NASA Earth Observatory image by Jesse Allen, using data from the Land Atmosphere Near real-time Capability for EOS (LANCE). via @NASAEarth <a href="http://go.nasa.gov/29Btxcy" rel="nofollow">go.nasa.gov/29Btxcy</a> <b><a href="http://go.nasa.gov/29BtHR6" rel="nofollow">NASA image use policy.</a></b> <b><a href="http://go.nasa.gov/29BtDku" rel="nofollow">NASA Goddard Space Flight Center</a></b> enables NASA’s mission through four scientific endeavors: Earth Science, Heliophysics, Solar System Exploration, and Astrophysics. Goddard plays a leading role in NASA’s accomplishments by contributing compelling scientific knowledge to advance the Agency’s mission. <b>Follow us on <a href="http://go.nasa.gov/29BtVrn" rel="nofollow">Twitter</a></b> <b>Like us on <a href="http://go.nasa.gov/29BtygK" rel="nofollow">Facebook</a></b> <b>Find us on <a href="http://go.nasa.gov/29Bu0vu" rel="nofollow">Instagram</a></b>
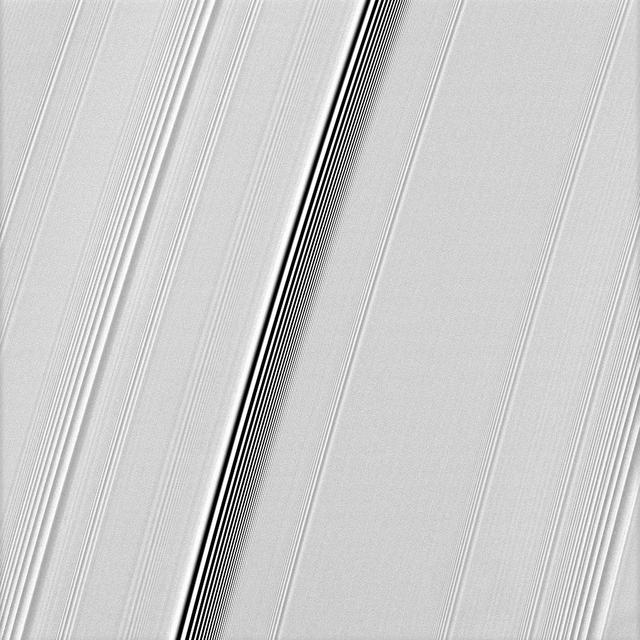
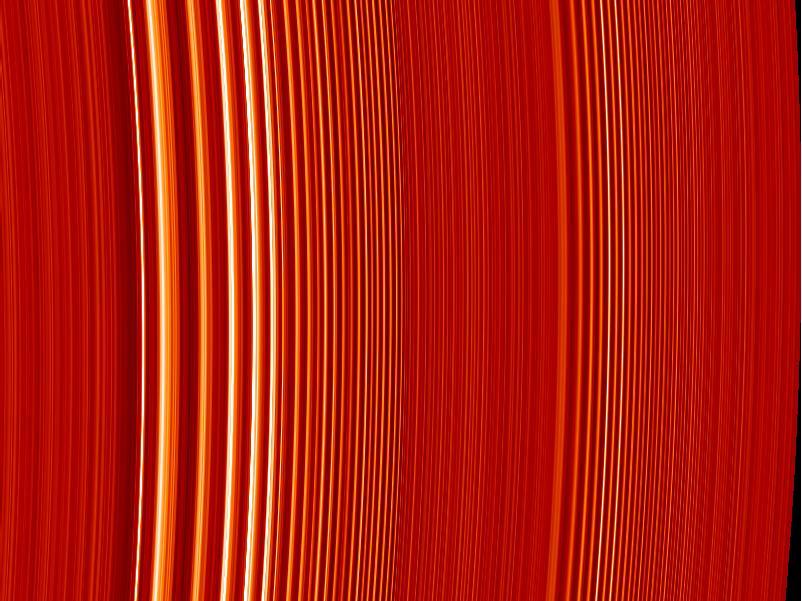
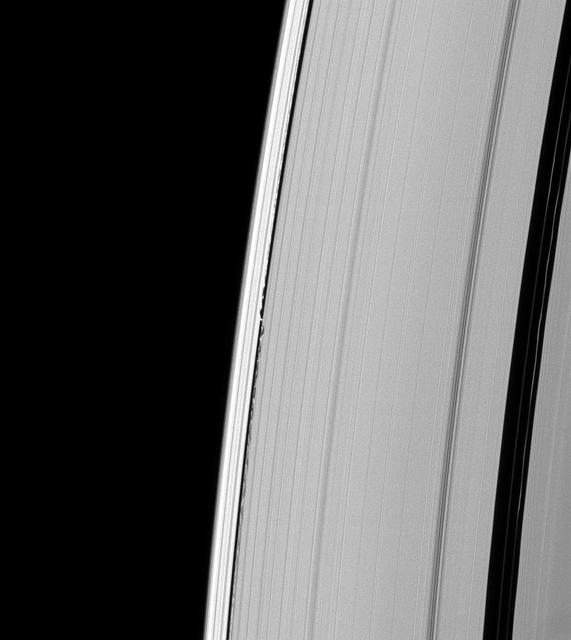
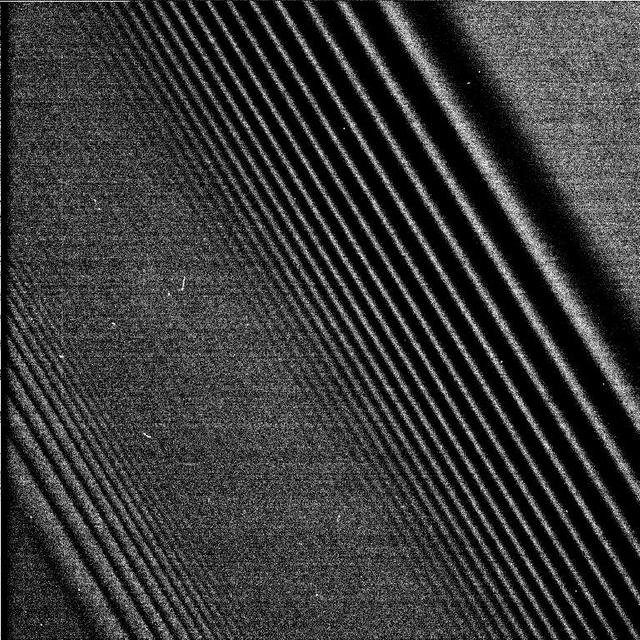
NASA Cassini spacecraft spies two types of waves in Saturn A ring: a spiral density wave on the left of the image and a more pronounced spiral bending wave near the middle.

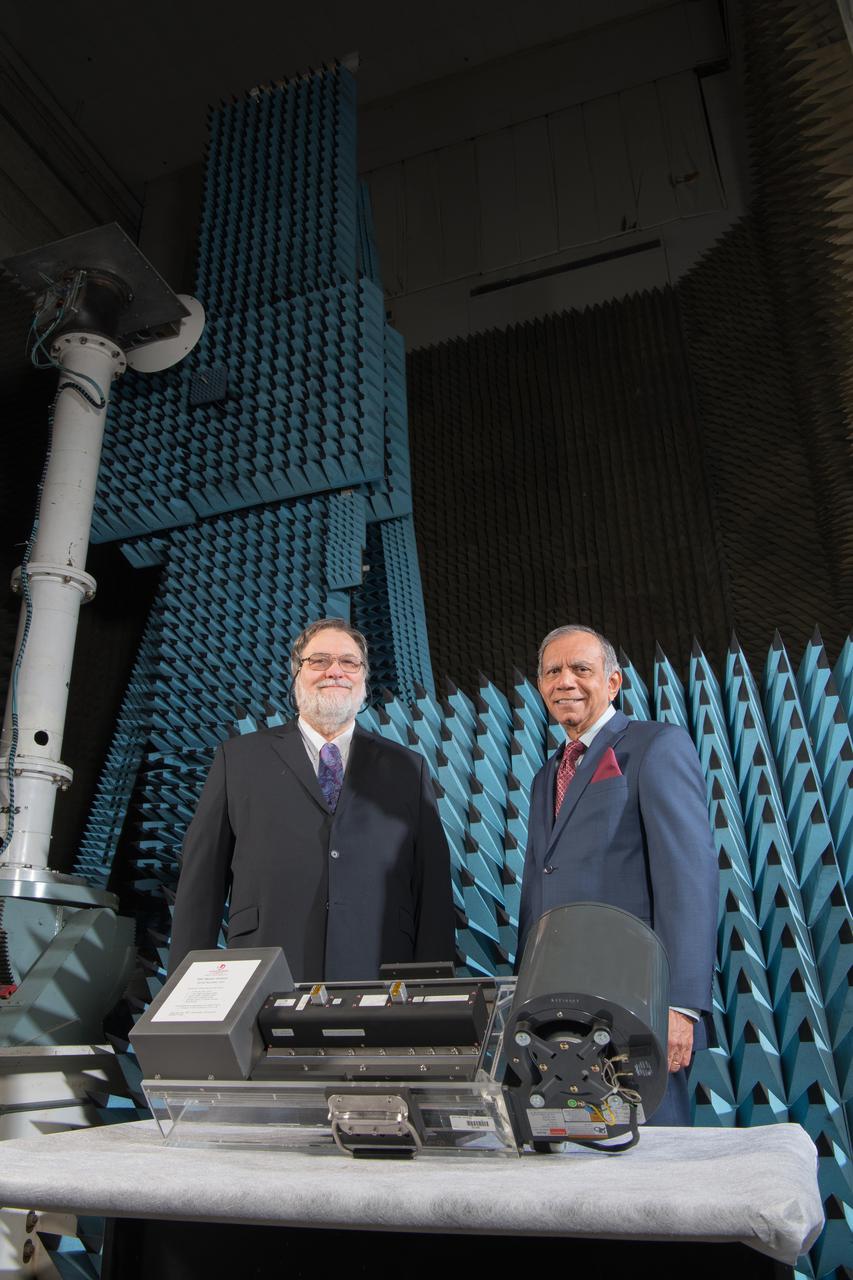
Traveling Wave Tube Amplifier,TWTA,

Traveling Wave Tube Amplifier,TWTA,

Traveling Wave Tube Amplifier,TWTA,
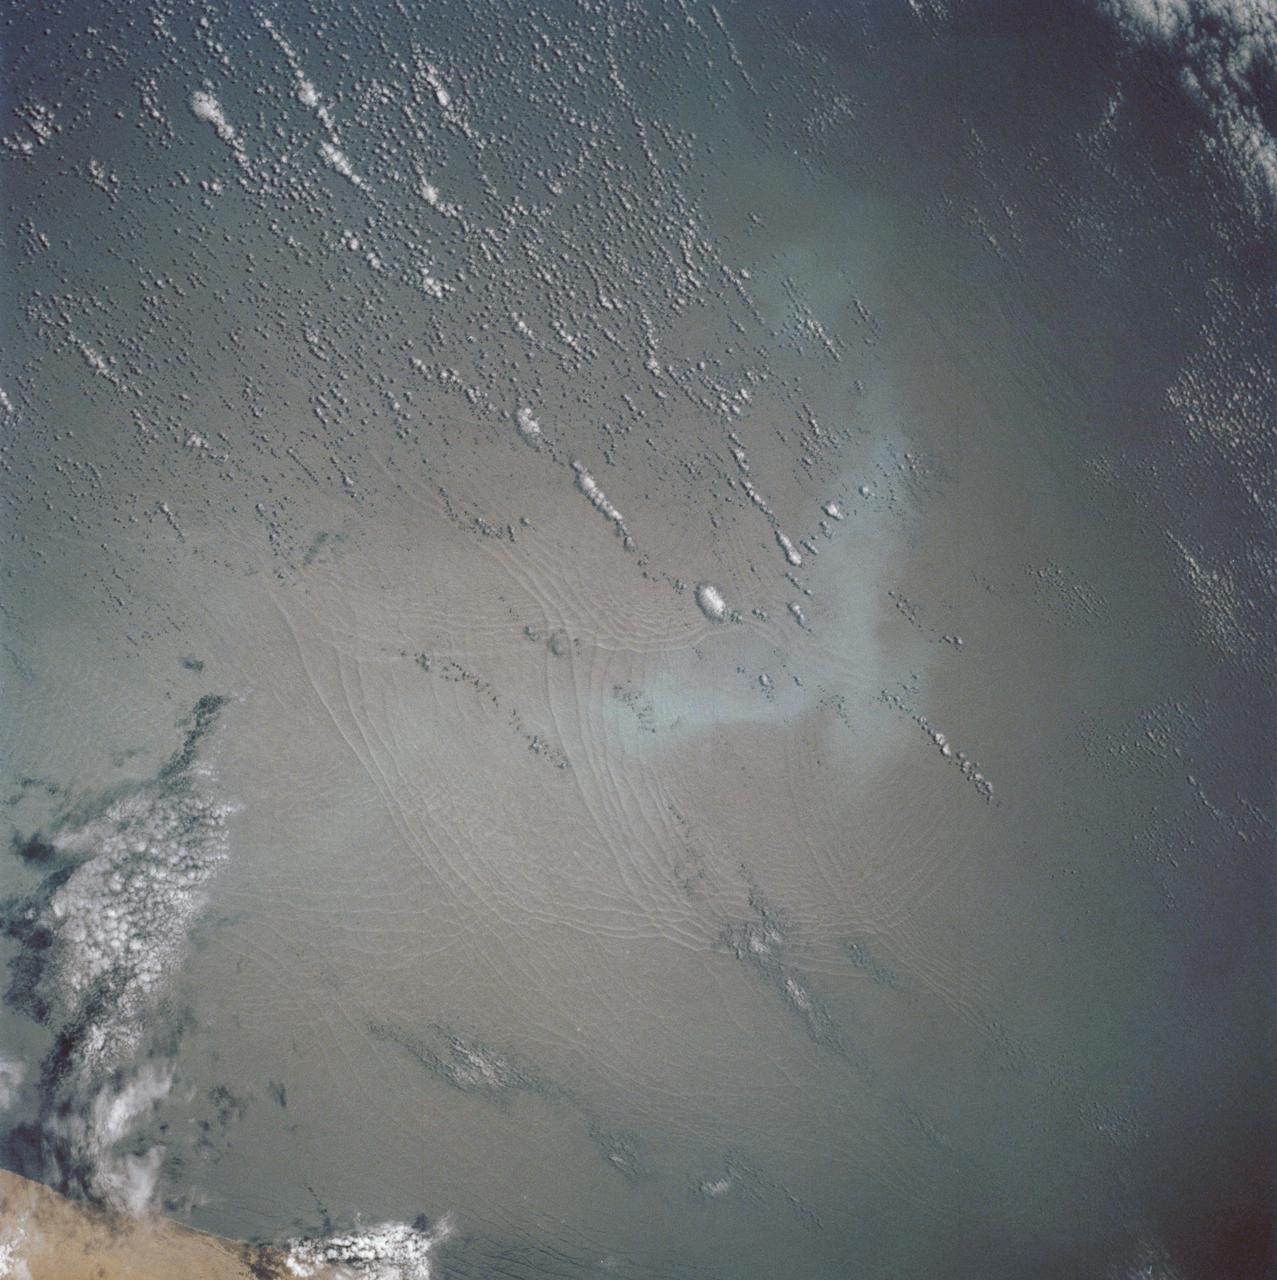
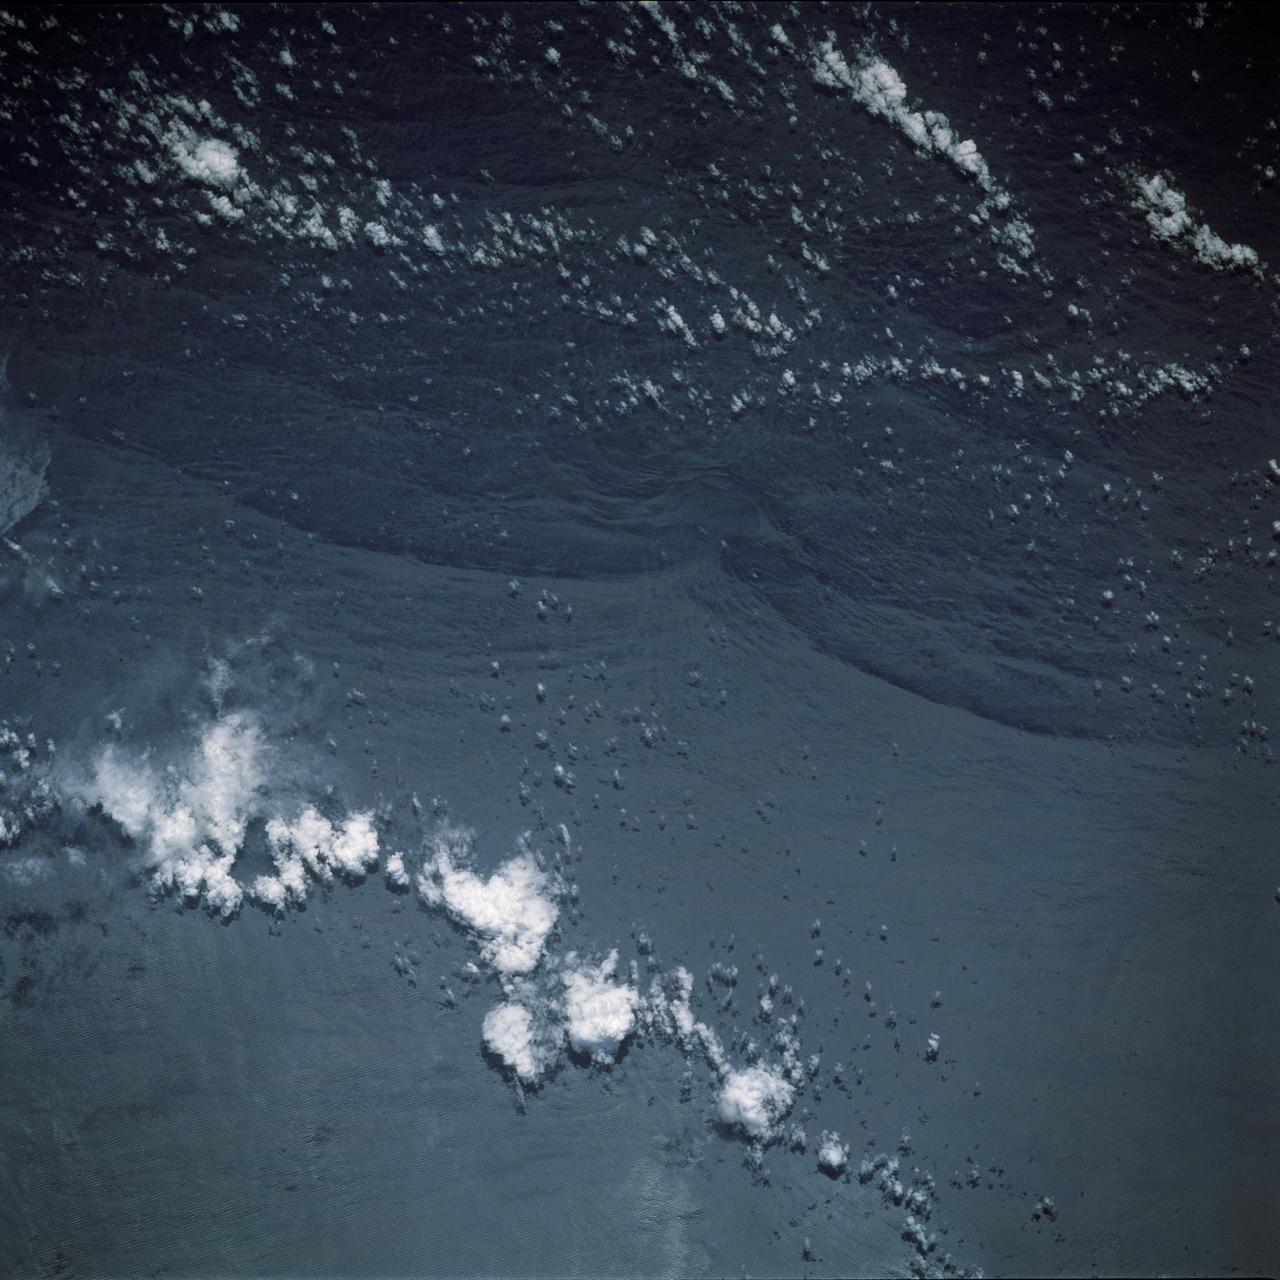
These open ocean Internal Waves were seen off the Namibia Coast, Africa (19.5S, 11.5E). The periodic and regularly spaced sets of incoming internal appear to be diffracting against the coastline and recombining to form a network of interference patterns. They seem to coincide with tidal periods about 12 hours apart and wave length (distance from crest to crest) varies between 1.5 and 5.0 miles and the crest lengths stretch beyond the image.
There are special places on Earth that sometimes write their personal signature in the clouds. The Crozet Islands are one such place, thanks to the tall volcanic peaks that grace the islands. When air flows around these tall peaks, it gets pushed around the islands as well as up and over the peak. The net effect of the flowing air flowing around the solid, tall peaks is much like the solid bow of a ship cutting through standing water. In each case v-shaped waves are formed behind the motion. In liquid, this is called a wake; in the atmosphere, when clouds are present or created, they are known as ship-wave-shaped clouds. The Moderate Resolution Imaging Spectroradiometer (MODIS) aboard NASA’s Terra satellite captured this true-color image as it passed over the Crozet Islands on November 26, 2014. Three distinct waves are seen behind the three largest islands. From west to east these are Pig Island, Possession Island and East Island. Credit: NASA/GSFC/Jeff Schmaltz/MODIS Land Rapid Response Team <b><a href="http://www.nasa.gov/audience/formedia/features/MP_Photo_Guidelines.html" rel="nofollow">NASA image use policy.</a></b> <b><a href="http://www.nasa.gov/centers/goddard/home/index.html" rel="nofollow">NASA Goddard Space Flight Center</a></b> enables NASA’s mission through four scientific endeavors: Earth Science, Heliophysics, Solar System Exploration, and Astrophysics. Goddard plays a leading role in NASA’s accomplishments by contributing compelling scientific knowledge to advance the Agency’s mission. <b>Follow us on <a href="http://twitter.com/NASAGoddardPix" rel="nofollow">Twitter</a></b> <b>Like us on <a href="http://www.facebook.com/pages/Greenbelt-MD/NASA-Goddard/395013845897?ref=tsd" rel="nofollow">Facebook</a></b> <b>Find us on <a href="http://instagram.com/nasagoddard?vm=grid" rel="nofollow">Instagram</a></b>
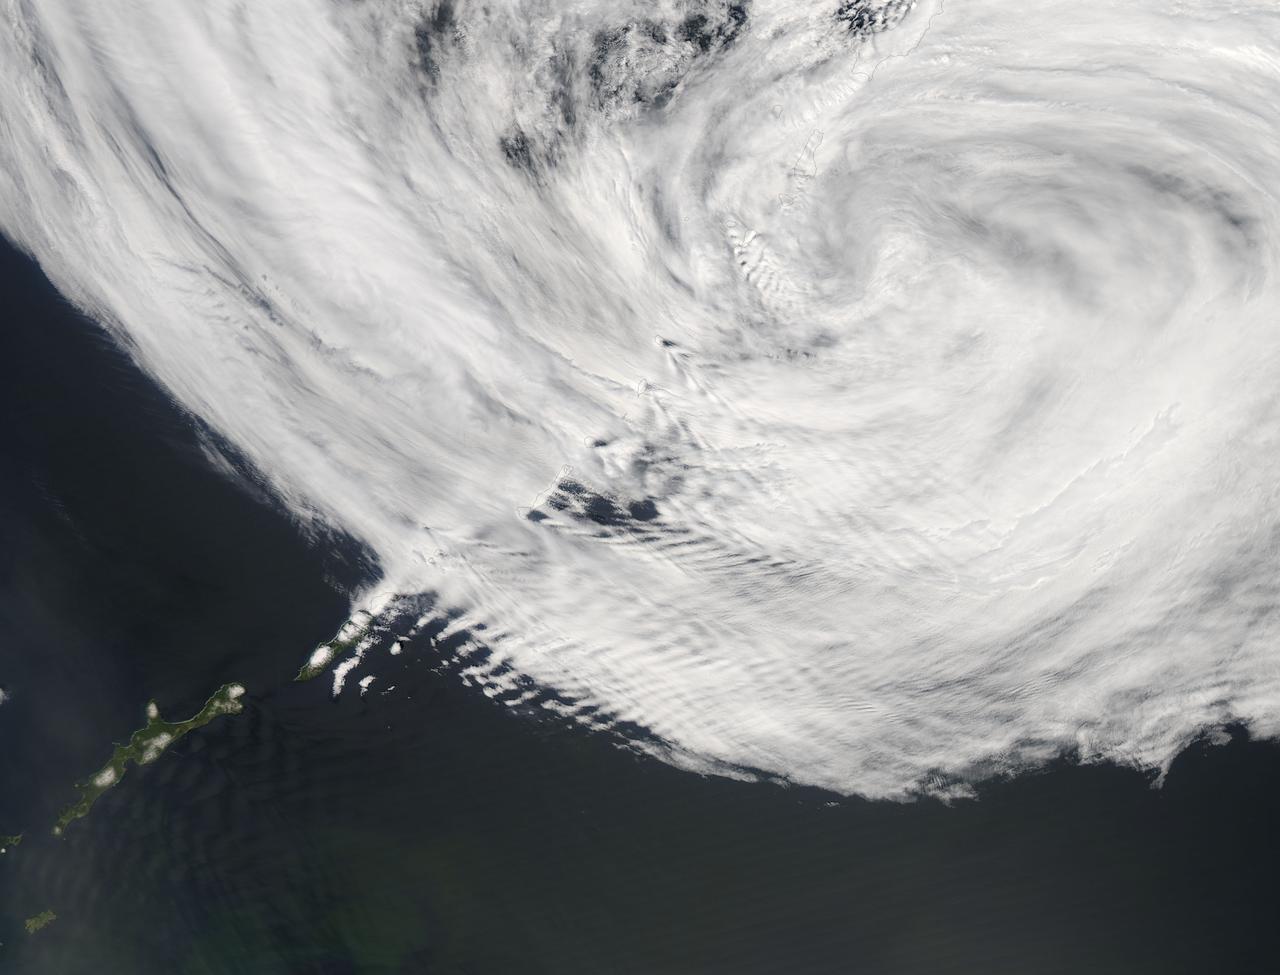
The Kuril Islands are a string of volcanically-formed islands that stretch between Russia and Japan, separating the North Pacific Ocean from the Sea of Okhotsk. Subject to the cold, moist breezes from the North Atlantic, and the frigid air from Siberia, the climate is severe, with frequent storms, and ever-present winds, which often reach hurricane strength. Cloudy, windy conditions are common. On June 1, 2015 the Moderate Resolution Imaging Spectroradiometer (MODIS) aboard NASA’s Aqua satellite captured this true-color image as it passed over the Kuril Islands. Clouds curl into the center of a storm system, bringing strong winds to the region. As the winds scrape over the tall volcanic peaks of the Kuril Islands, they become turbulent air behind the islands. The turbulence disturbs the cloudbank, etching its passage into a striking pattern that can be seen from space. This particular pattern is called “ship-waved-shaped wave clouds”, because the pattern can be likened to that formed behind a ship cutting through a smooth ocean. On the windward side of the Kuril Islands, the cloud bank is generally smooth, with streaks that are lined up parallel to the movement of the wind, blowing from the west and towards the east. Behind the tall volcanic peaks of the islands, V’s fan out on the leeward side, illustrating the flow of the turbulent air. Image Credit: Jeff Schmaltz, MODIS Land Rapid Response Team, NASA GSFC <b><a href="http://www.nasa.gov/audience/formedia/features/MP_Photo_Guidelines.html" rel="nofollow">NASA image use policy.</a></b> <b><a href="http://www.nasa.gov/centers/goddard/home/index.html" rel="nofollow">NASA Goddard Space Flight Center</a></b> enables NASA’s mission through four scientific endeavors: Earth Science, Heliophysics, Solar System Exploration, and Astrophysics. Goddard plays a leading role in NASA’s accomplishments by contributing compelling scientific knowledge to advance the Agency’s mission. <b>Follow us on <a href="http://twitter.com/NASAGoddardPix" rel="nofollow">Twitter</a></b> <b>Like us on <a href="http://www.facebook.com/pages/Greenbelt-MD/NASA-Goddard/395013845897?ref=tsd" rel="nofollow">Facebook</a></b> <b>Find us on <a href="http://instagrid.me/nasagoddard/?vm=grid" rel="nofollow">Instagram</a></b>
Daphnis drifts through the Keeler gap, at the center of its entourage of waves
Traveling Wave Tube Amplifier,TWTA,
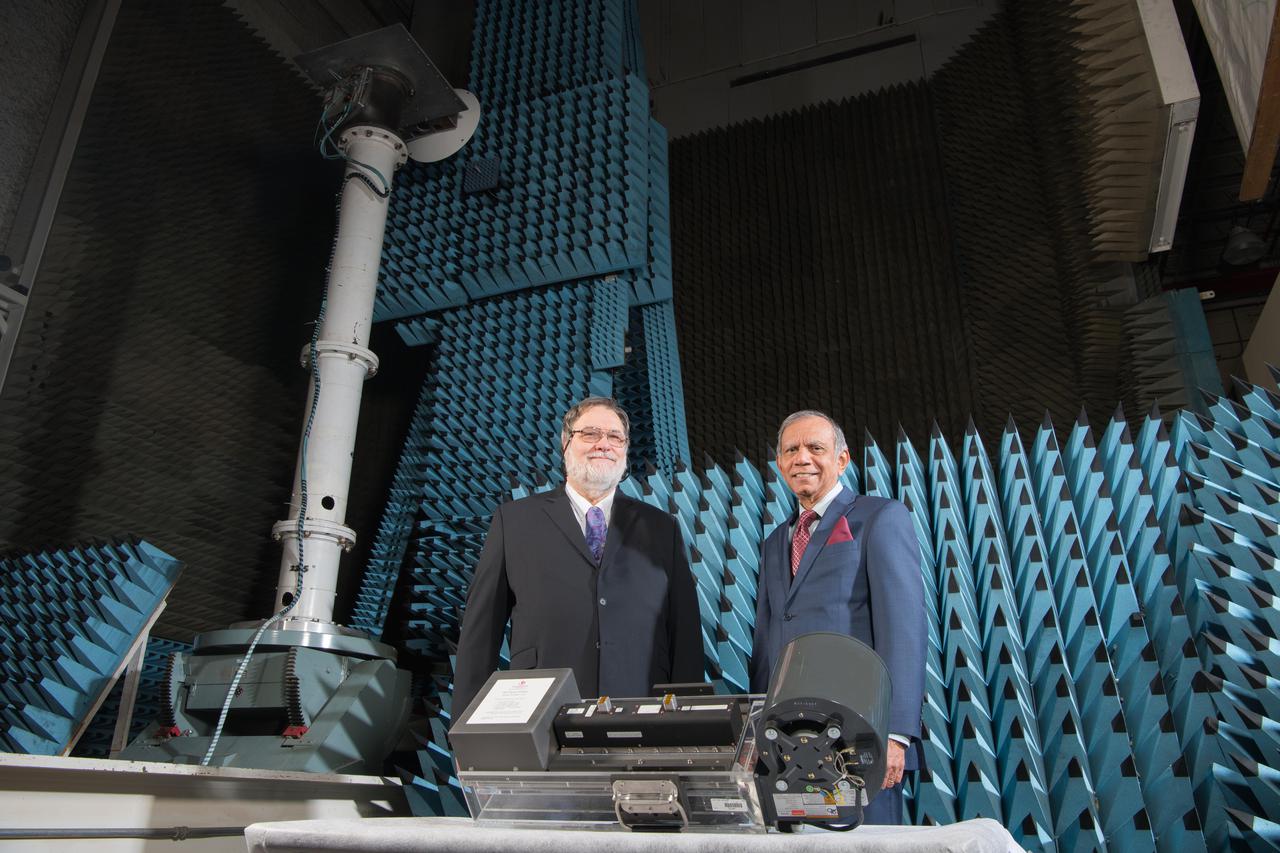
Traveling Wave Tube Amplifier,TWTA,
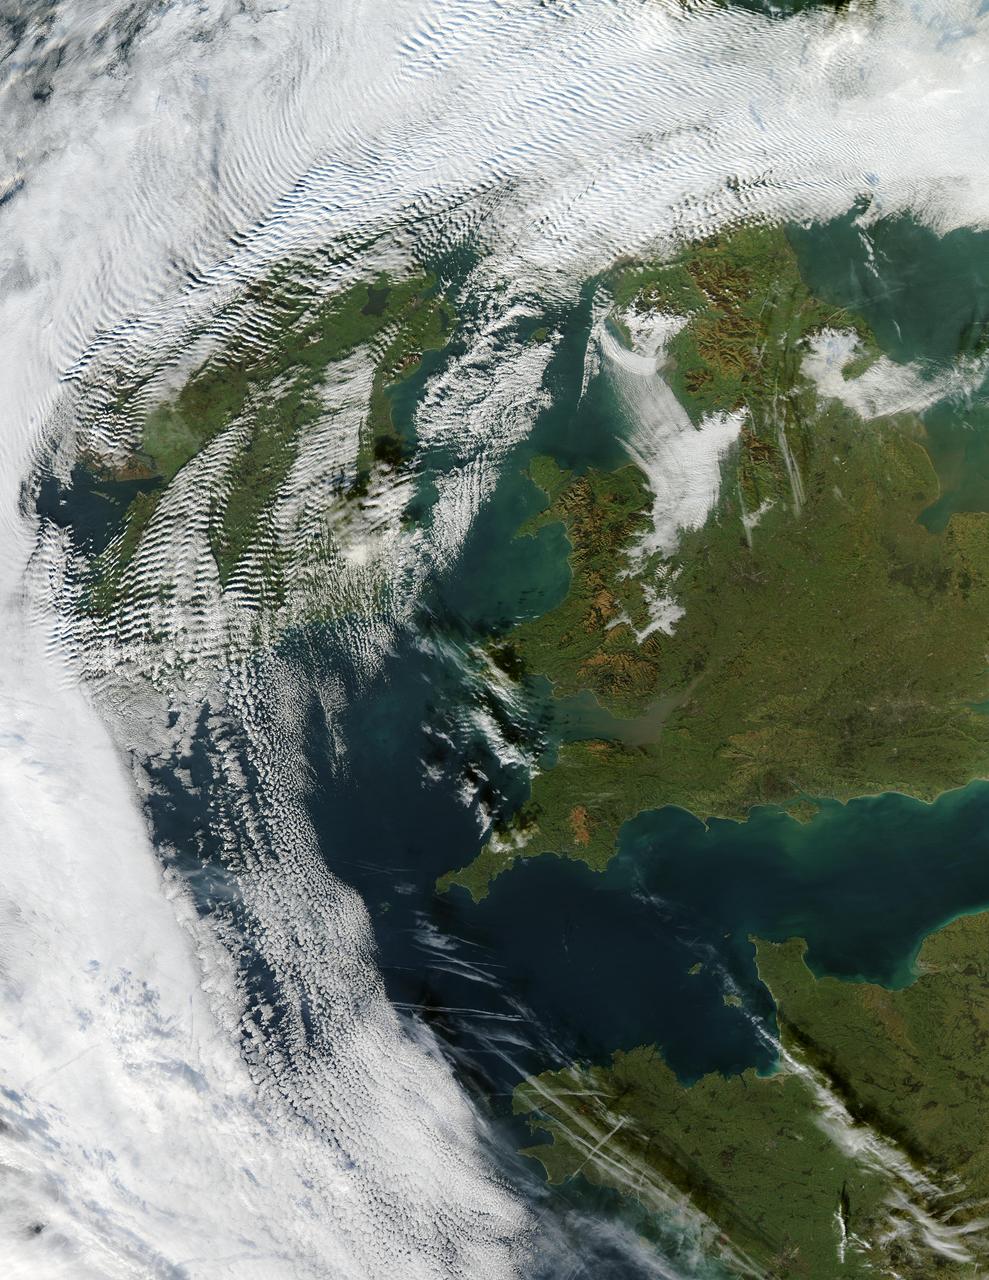
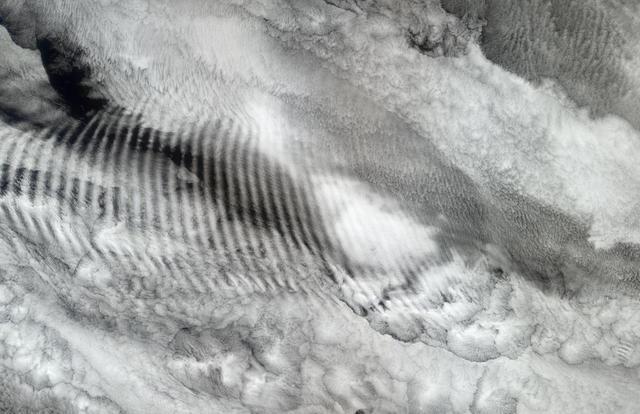
Visualization Date 2003-12-18 Clouds ripple over Ireland and Scotland in a wave pattern, similar to the pattern of waves along a seashore. The similarity is not coincidental — the atmosphere behaves like a fluid, so when it encounters an obstacle, it must move around it. This movement forms a wave, and the wave movement can continue for long distances. In this case, the waves were caused by the air moving over and around the mountains of Scotland and Ireland. As the air crested a wave, it cooled, and clouds formed. Then, as the air sank into the trough, the air warmed, and clouds did not form. This pattern repeated itself, with clouds appearing at the peak of every wave. Other types of clouds are also visible in the scene. Along the northwestern and southwestern edges of this true-color image from December 17, 2003, are normal mid-altitude clouds with fairly uniform appearances. High altitude cirrus-clouds float over these, casting their shadows on the lower clouds. Open- and closed-cell clouds formed off the coast of northwestern France, and thin contrail clouds are visible just east of these. Contrail clouds form around the particles carried in airplane exhaust. Fog is also visible in the valleys east of the Cambrian Mountains, along the border between northern/central Wales and England. This is an Aqua MODIS image. Sensor Aqua/MODIS Credit Jacques Descloitres, MODIS Rapid Response Team, NASA/GSFC For more information go to: <a href="http://visibleearth.nasa.gov/view_rec.php?id=6146" rel="nofollow">visibleearth.nasa.gov/view_rec.php?id=6146</a>
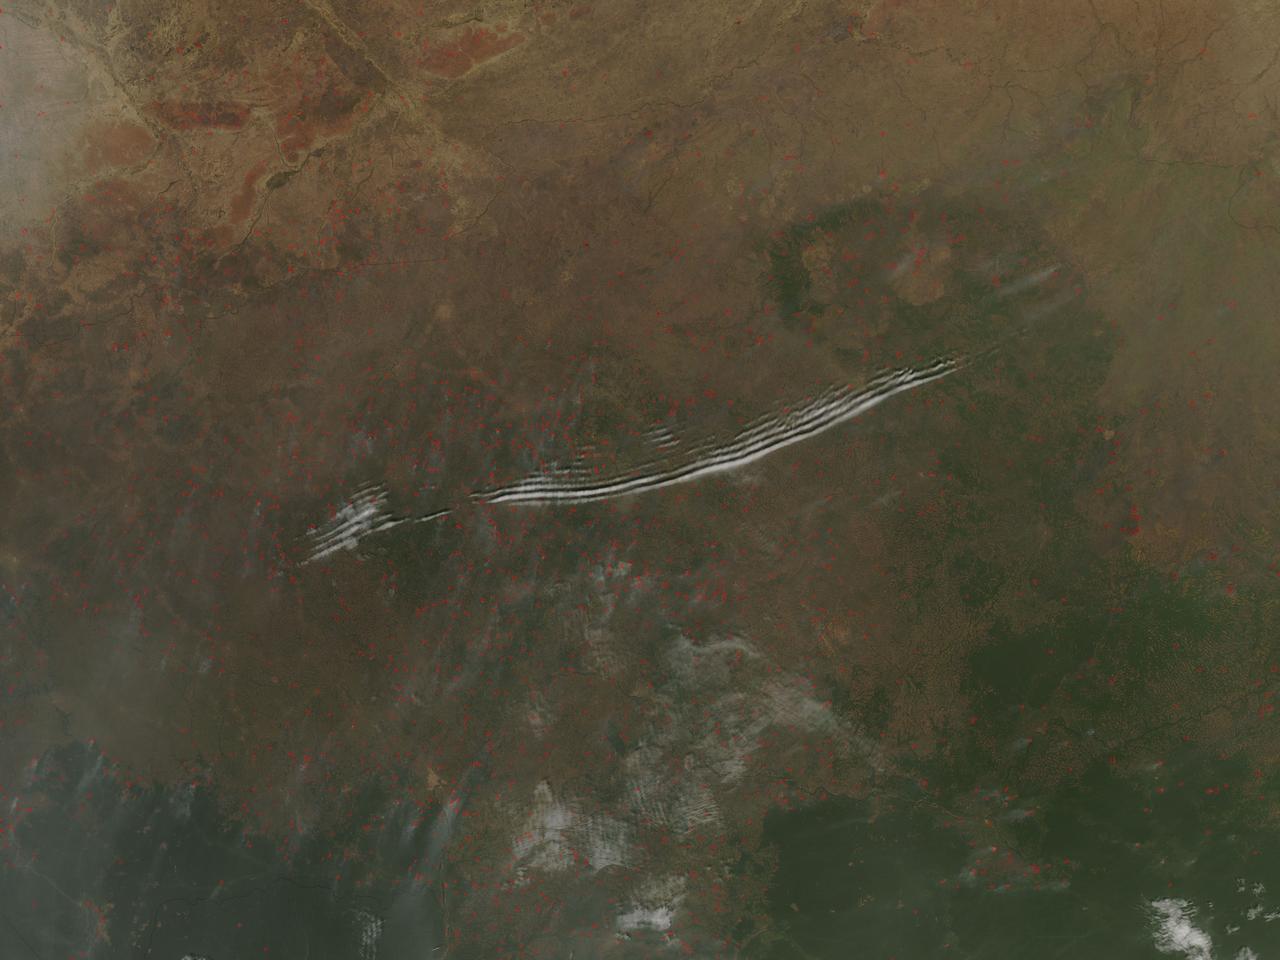
On January 27, 2016, the Moderate Resolution Imaging Spectroradiometer (MODIS) aboard NASA’s Aqua satellite passed over the Central African Republic and captured a true-color image of wave clouds rippling over a fire-speckled landscape. Wave clouds typically form when a mountain, island, or even another mass of air forces an air mass to rise, then fall again, in a wave pattern. The air cools as it rises, and if there is moisture in the air, the water condenses into clouds at the top of the wave. As the air begins to sink, the air warms and the cloud dissipates. The result is a line of clouds marking the crests of the wave separated by clear areas in the troughs of the wave. In addition to the long lines of clouds stretching across the central section of the country, clouds appear to line up in parallel rows near the border of the Democratic Republic of the Congo. In this area, small sets of grayish cloud appear to be lined up with the prevailing wind, judging by the plumes of smoke rising from red hotspots near each set of clouds. Clouds like this, that line in parallel rows parallel with the prevailing wind, are known as “cloud streets”. Each red “hotspot” marks an area where the thermal sensors on the MODIS instrument detected high temperatures. When accompanied by typical smoke, such hotspots are diagnostic for actively burning fires. Given the time of the year, the widespread nature, and the location of the fires, they are almost certainly agricultural fires that have been deliberately set to manage land. Image Credit: Jeff Schmaltz, MODIS Land Rapid Response Team, NASA GSFC <b><a href="http://www.nasa.gov/audience/formedia/features/MP_Photo_Guidelines.html" rel="nofollow">NASA image use policy.</a></b> <b><a href="http://www.nasa.gov/centers/goddard/home/index.html" rel="nofollow">NASA Goddard Space Flight Center</a></b> enables NASA’s mission through four scientific endeavors: Earth Science, Heliophysics, Solar System Exploration, and Astrophysics. Goddard plays a leading role in NASA’s accomplishments by contributing compelling scientific knowledge to advance the Agency’s mission. <b>Follow us on <a href="http://twitter.com/NASAGoddardPix" rel="nofollow">Twitter</a></b> <b>Like us on <a href="http://www.facebook.com/pages/Greenbelt-MD/NASA-Goddard/395013845897?ref=tsd" rel="nofollow">Facebook</a></b> <b>Find us on <a href="http://instagrid.me/nasagoddard/?vm=grid" rel="nofollow">Instagram</a></b>
The arculate fronts of these apparently converging internal waves off the northeast coast of Somalia (11.5N, 51.5E) probably were produced by interaction with two parallel submarine canyons off the Horn of Africa. Internal waves are packets of tidally generated waves traveling within the ocean at varying depths and are not detectable by any surface disturbance.

Combining data from NASA's Chandra X-ray Observatory with radio observations and computer simulations, an international team of scientists has discovered a vast wave of hot gas in the nearby Perseus galaxy cluster. Spanning some 200,000 light-years, the wave is about twice the size of our own Milky Way galaxy. The researchers say the wave formed billions of years ago, after a small galaxy cluster grazed Perseus and caused its vast supply of gas to slosh around an enormous volume of space. "Perseus is one of the most massive nearby clusters and the brightest one in X-rays, so Chandra data provide us with unparalleled detail," said lead scientist Stephen Walker at NASA's Goddard Space Flight Center in Greenbelt, Maryland. "The wave we've identified is associated with the flyby of a smaller cluster, which shows that the merger activity that produced these giant structures is still ongoing." Read more at nasa.gov Credit: NASA's Goddard Space Flight Center/Stephen Walker href="http://www.nasa.gov/audience/formedia/features/MP_Photo_Guidelines.html" rel="nofollow">NASA image use policy. <b><a href="http://www.nasa.gov/centers/goddard/home/index.html" rel="nofollow">NASA Goddard Space Flight Center</a></b> enables NASA’s mission through four scientific endeavors: Earth Science, Heliophysics, Solar System Exploration, and Astrophysics. Goddard plays a leading role in NASA’s accomplishments by contributing compelling scientific knowledge to advance the Agency’s mission. <b>Follow us on <a href="http://twitter.com/NASAGoddardPix" rel="nofollow">Twitter</a></b> <b>Like us on <a href="http://www.facebook.com/pages/Greenbelt-MD/NASA-Goddard/395013845897?ref=tsd" rel="nofollow">Facebook</a></b> <b>Find us on <a href="http://instagrid.me/nasagoddard/?vm=grid" rel="nofollow">Instagram</a></b>
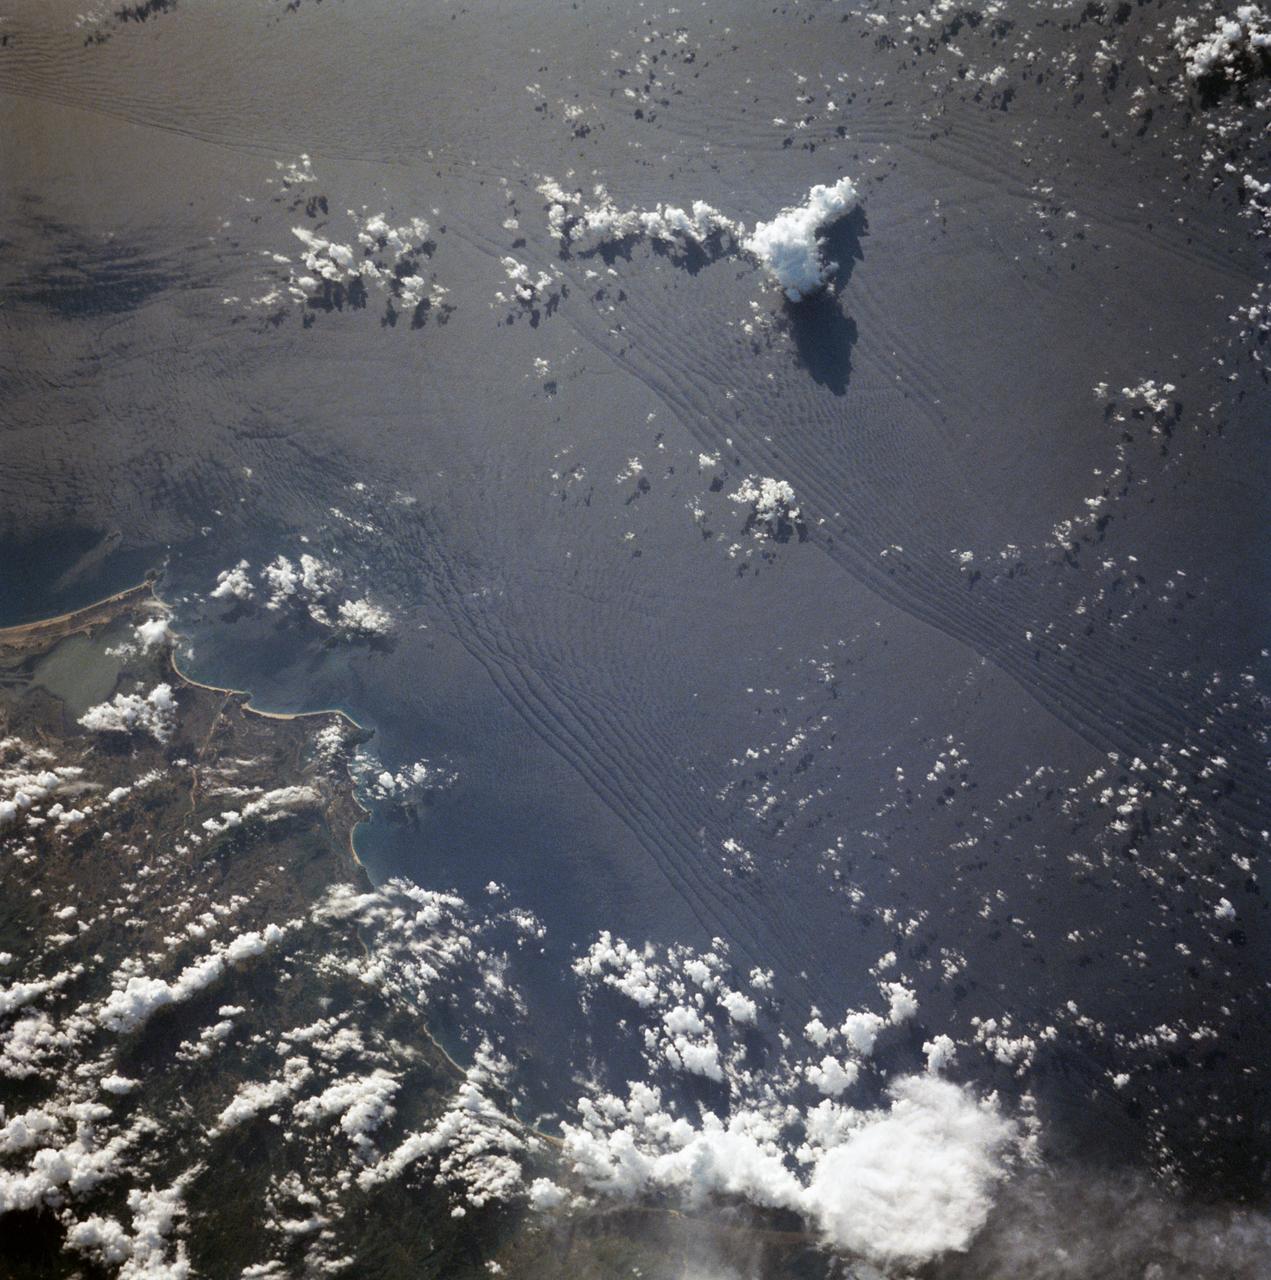
STS044-79-077 (24 Nov.-1 Dec. 1991) --- This photograph, captured from the Earth-orbiting Space Shuttle Atlantis, shows sunglint pattern in the western tropical Indian Ocean. Several large internal waves reflect around a shallow area on the sea floor. NASA scientists studying the STS-44 photography believe the shallow area to be a sediment (a submerged mountain) on top of the Mascarene Plateau, located northeast of Madagascar at approximately 5.6 degrees south latitude and 55.7 degrees east longitude. Internal waves are similar to surface ocean waves, except that they travel inside the water column along the boundary between water layers of different density. At the surface, their passage is marked on the sea surface by bands of smooth and rough water. These bands appear in the sunglint pattern as areas of brighter or darker water. NASA scientists point out that, when the waves encounter an obstacle, such as a near-surface seamount, they bend or refract around the obstacle in the same manner as surface waves bend around an island or headland.
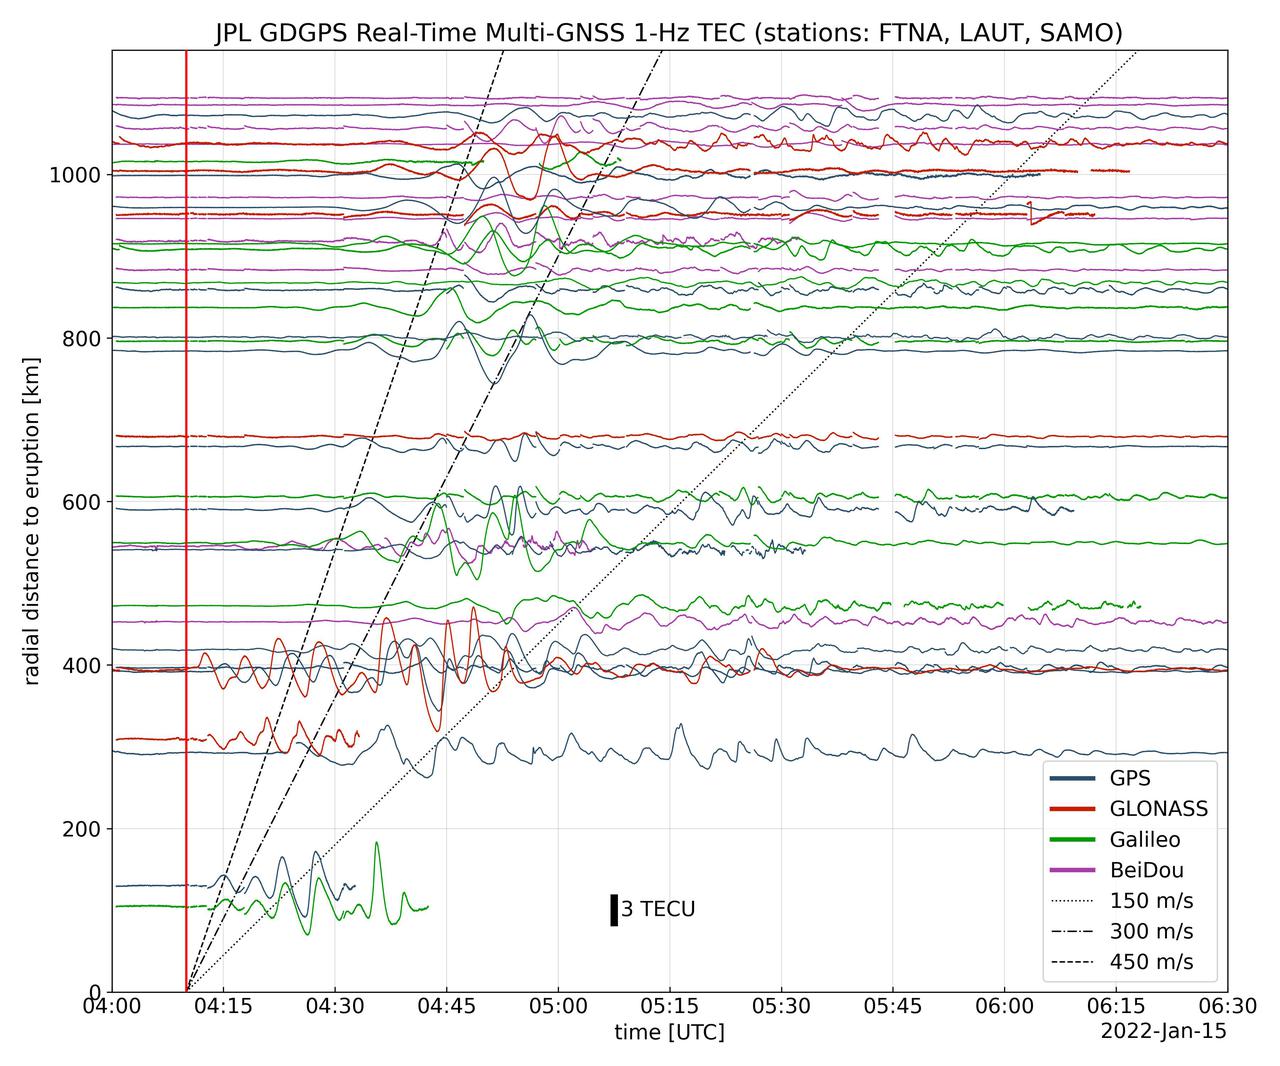
Real-time data collected by the Global Differential Global Positioning System network, operated by NASA's Jet Propulsion Laboratory, shows the atmospheric signature of the Hunga Tonga Hunga Ha'apai volcanic eruption in Tonga on Jan. 15, 2022. The data is a measure of the density of electrons (known as total electron content units, or TECU) in the ionosphere – the outermost layer of the atmosphere, which starts between 50 and 56 miles (80 to 90 kilometers) above Earth's surface. Navigation radio signals, like those received by location sensors on smartphones, are broadcast by global navigation satellite systems (GNSS) and experience delays when passing through the ionosphere. The extent of the delay depends on the density of electrons within the path of the GNSS signal in this atmospheric layer. When an explosive event such as a volcanic eruption or large earthquake injects energy into the atmosphere, the pressure waves from that event change the electron density in the ionosphere. These perturbations show up as tiny changes to the delays that GNSS radio signals usually experience as they pass through the atmosphere. The vertical red line in the data plot indicates the time of the eruption. The horizontal squiggles show electron density profiles picked up in the signals of four GNSS constellations, or groups of satellites: GPS, GLONASS, Galileo, and BeiDou. The slanted dashed and dotted lines indicate the velocity of waves. https://photojournal.jpl.nasa.gov/catalog/PIA24905
STS007-05-245 (18-24 June 1983) --- A rare view of internal waves in the South China Sea. Several different series of internal waves are represented in the 70mm frame, exposed with a handheld camera by members of the STS-7 astronaut crew aboard the Earth-orbiting Challenger. The land area visible in the lower left is part of the large island of Hainan, China.
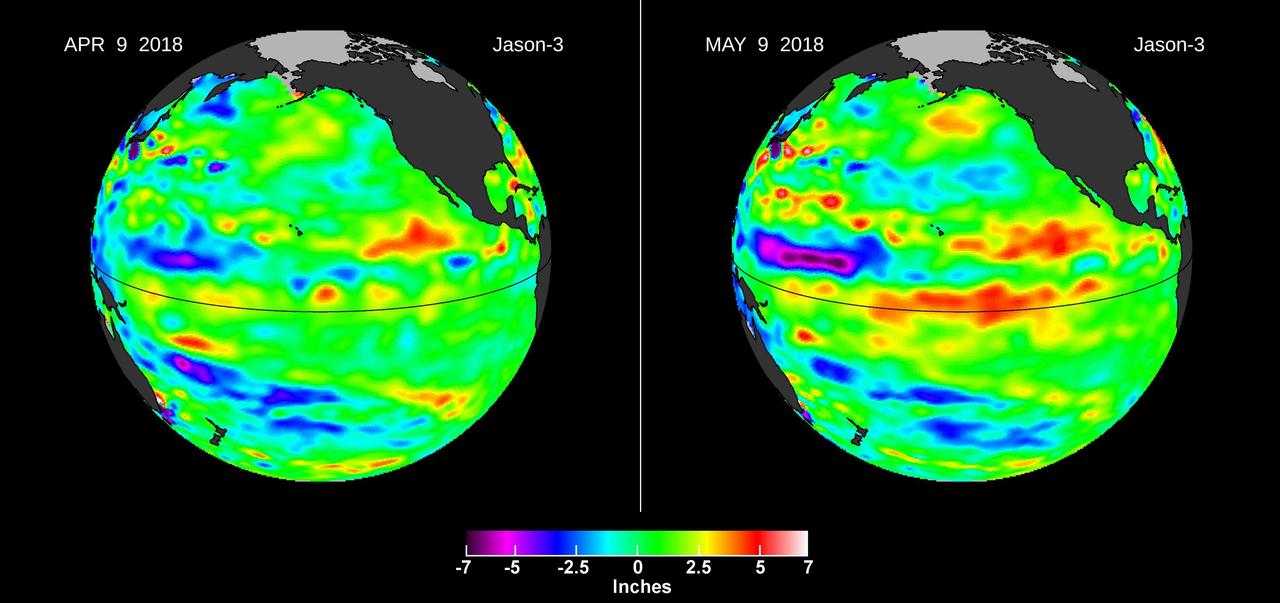
Images from the U.S./European Jason-3 satellite show sea surface height with respect to the seasonal cycle and the long-term trend. Blue/magenta colors indicate lower-than-normal sea levels, while yellow/red colors indicate higher-than-normal sea levels. The April 9, 2018 image (left panel) shows most of the ocean at neutral heights (green). A month later (right panel), a red patch is visible along the equator in the Central Pacific. The red area is a downwelling Kelvin wave, traveling eastward along the equator. https://photojournal.jpl.nasa.gov/catalog/PIA22473
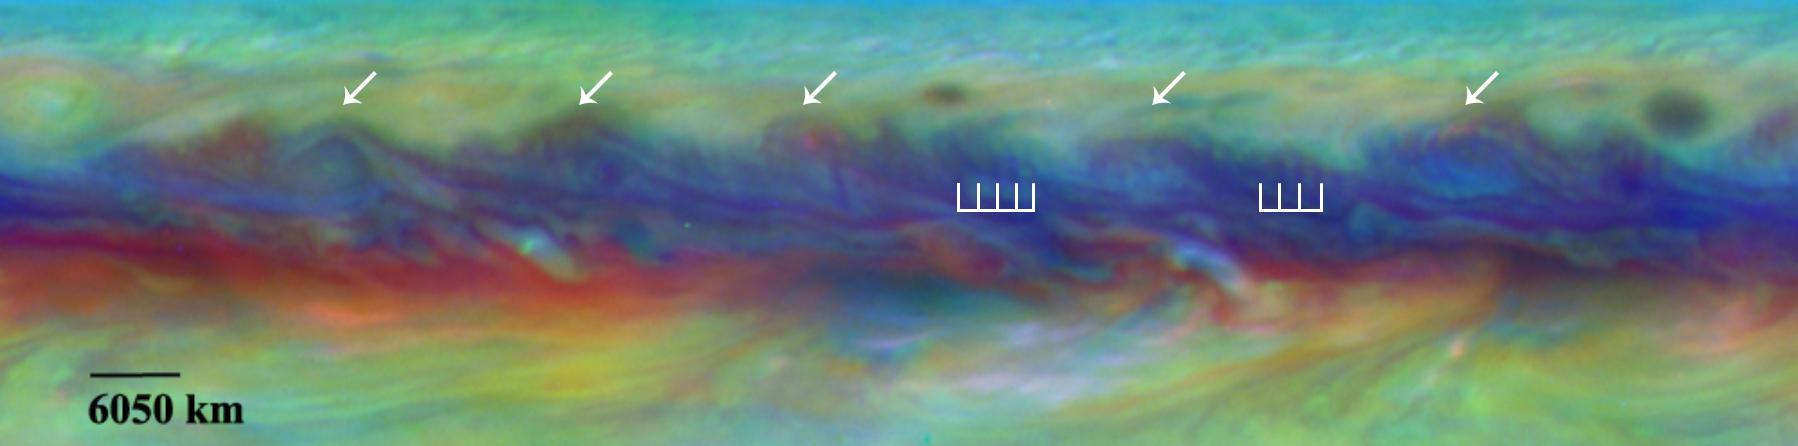
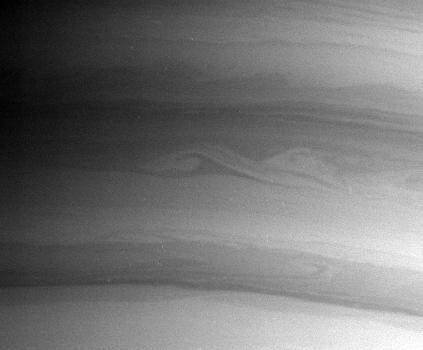
Scientists spotted a rare wave in Jupiter North Equatorial Belt that had been seen there only once before in this false-color close-up from NASA Hubble Telescope. In Jupiter's North Equatorial Belt, scientists spotted a rare wave that had been seen there only once before. It is similar to a wave that sometimes occurs in Earth's atmosphere when cyclones are forming. This false-color close-up of Jupiter shows cyclones (arrows) and the wave (vertical lines). http://photojournal.jpl.nasa.gov/catalog/PIA19659

The pattern on the right half of this image of the Bay of Bengal is the result of two opposing wave trains colliding. This ASTER sub-scene, acquired on March 29, 2000, covers an area 18 kilometers (13 miles) wide and 15 kilometers (9 miles) long in three bands of the reflected visible and infrared wavelength region. The visible and near-infrared bands highlight surface waves due to specular reflection of sunlight off of the wave faces. http://photojournal.jpl.nasa.gov/catalog/PIA02662
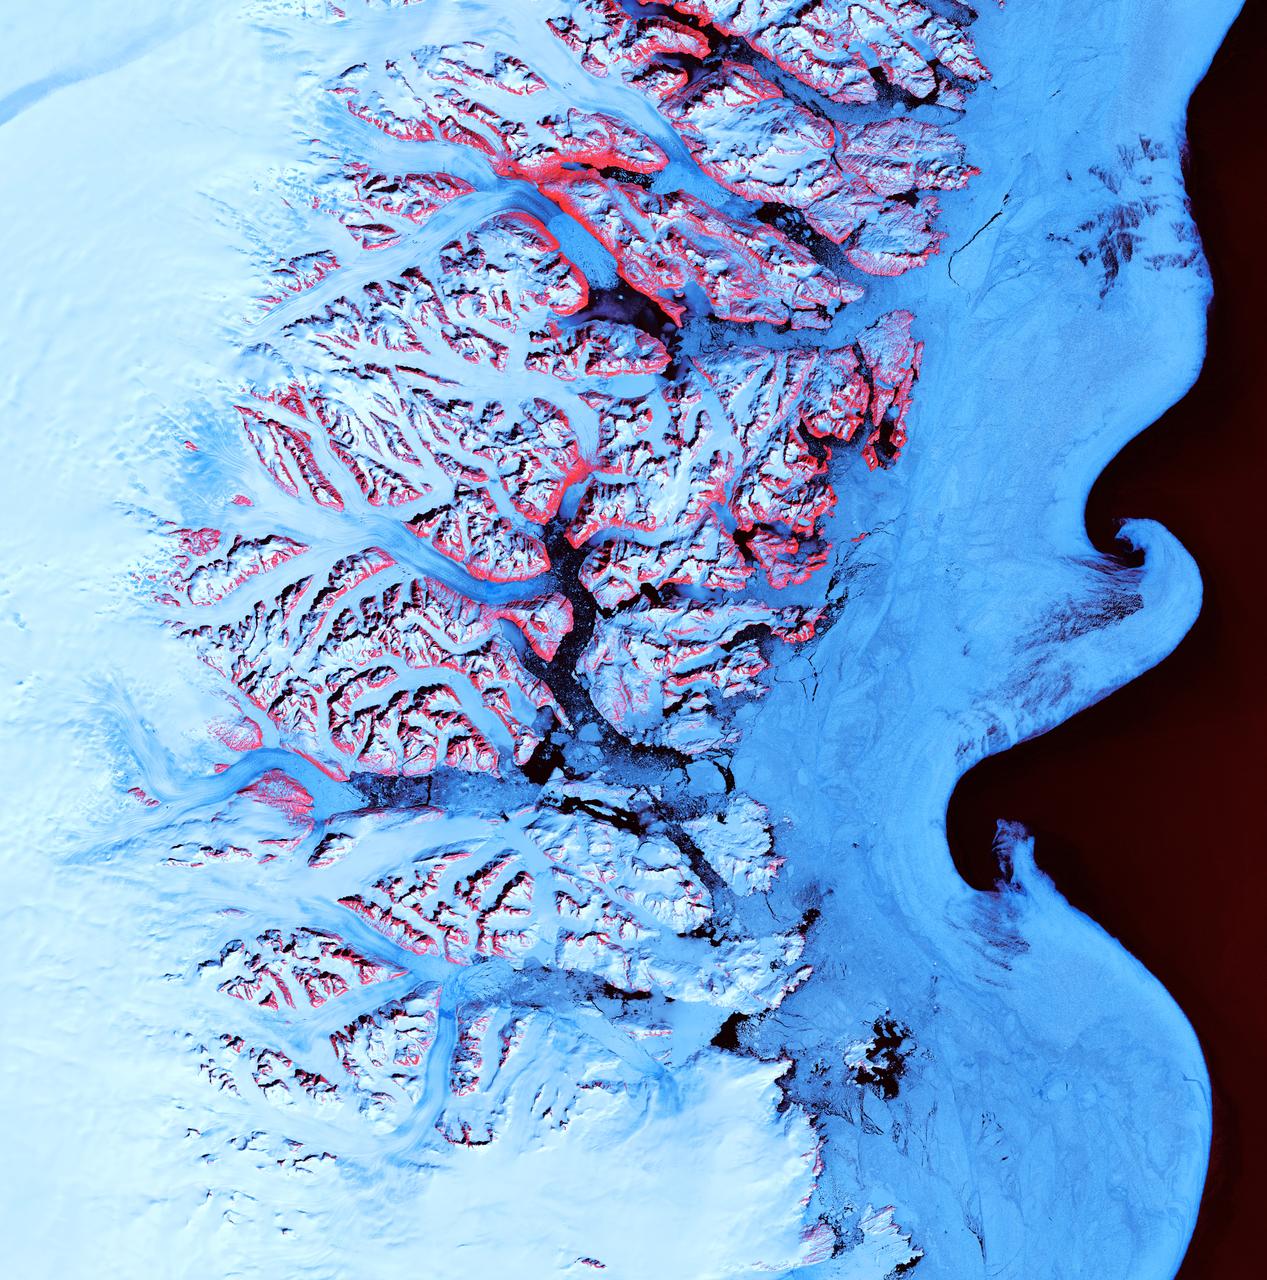
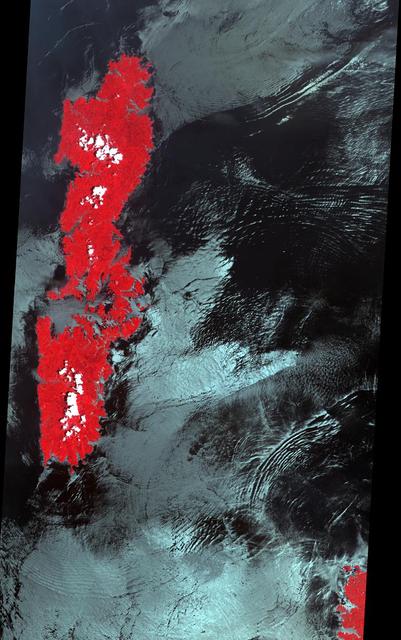
Ice Waves - May 21st, 2001 Description: Along the southeastern coast of Greenland, an intricate network of fjords funnels glacial ice to the Atlantic Ocean. During the summer melting season, newly calved icebergs join slabs of sea ice and older, weathered bergs in an offshore slurry that the southward-flowing East Greenland Current sometimes swirls into stunning shapes. Exposed rock of mountain peaks, tinted red in this image, hints at a hidden landscape. Credit: USGS/NASA/Landsat 7 To learn more about the Landsat satellite go to: <a href="http://landsat.gsfc.nasa.gov/" rel="nofollow">landsat.gsfc.nasa.gov/</a> <b><a href="http://www.nasa.gov/centers/goddard/home/index.html" rel="nofollow">NASA Goddard Space Flight Center</a></b> enables NASA’s mission through four scientific endeavors: Earth Science, Heliophysics, Solar System Exploration, and Astrophysics. Goddard plays a leading role in NASA’s accomplishments by contributing compelling scientific knowledge to advance the Agency’s mission. <b>Follow us on <a href="http://twitter.com/NASA_GoddardPix" rel="nofollow">Twitter</a></b> <b>Join us on <a href="http://www.facebook.com/pages/Greenbelt-MD/NASA-Goddard/395013845897?ref=tsd" rel="nofollow">Facebook</a></b>
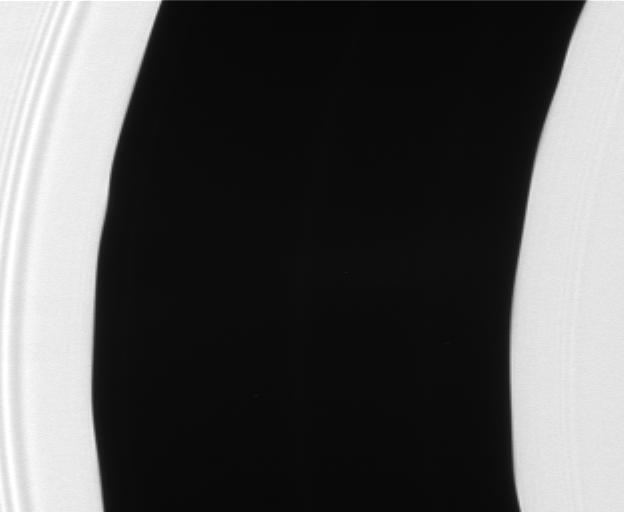
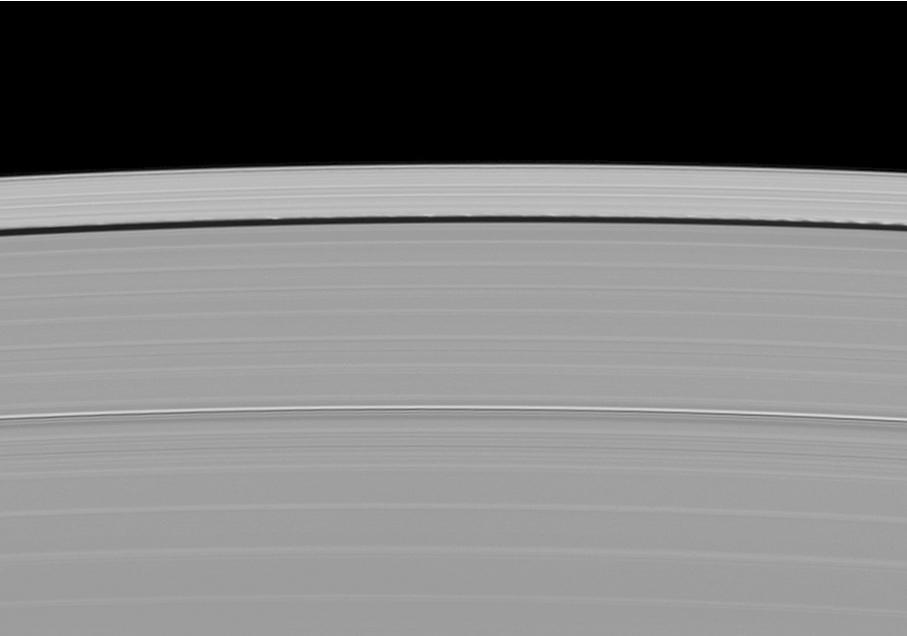
The Encke gap displays gentle waves in its inner and outer edges that are caused by gravitational tugs from the small moon Pan
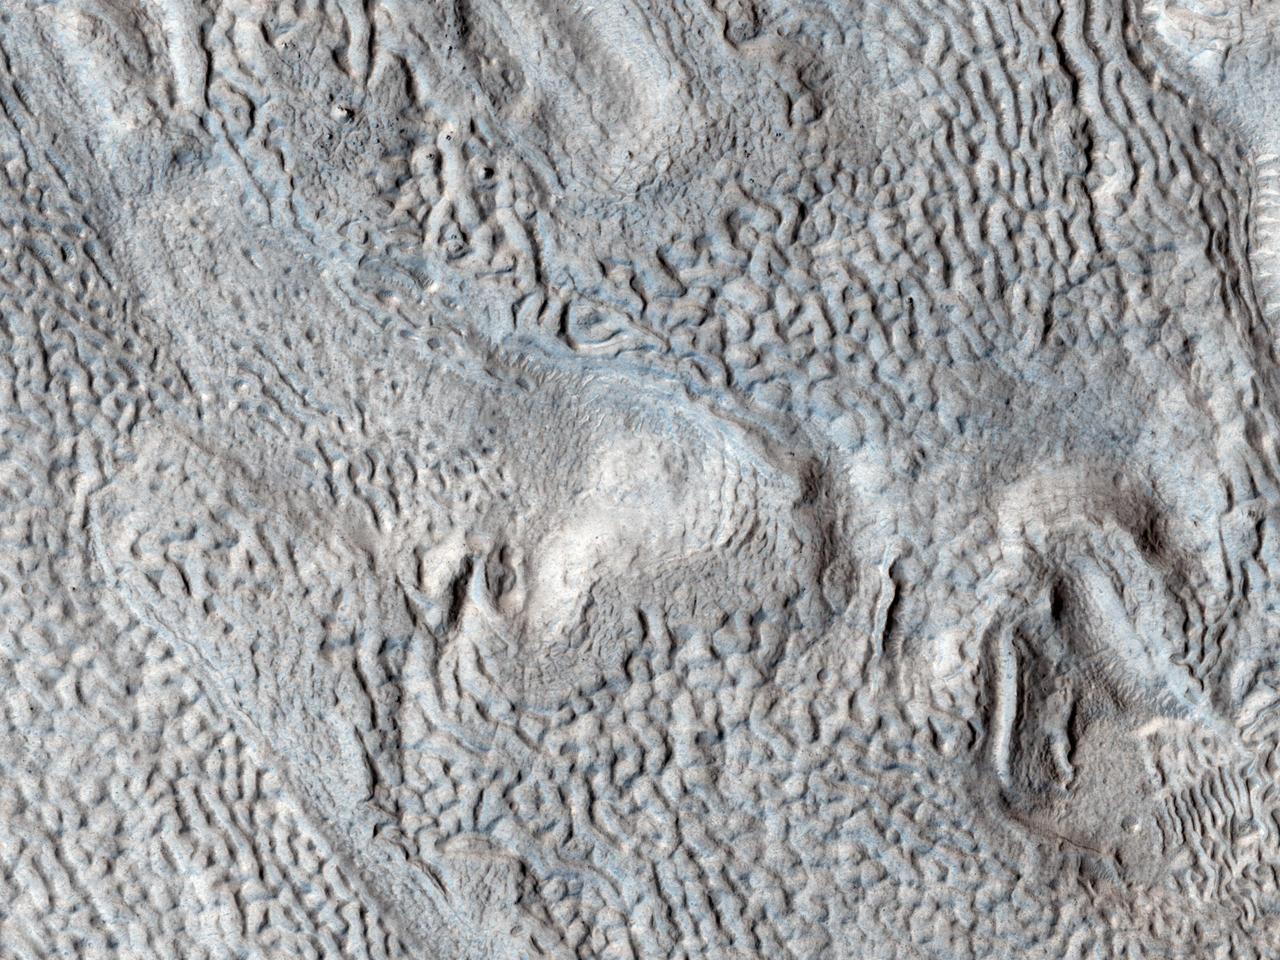
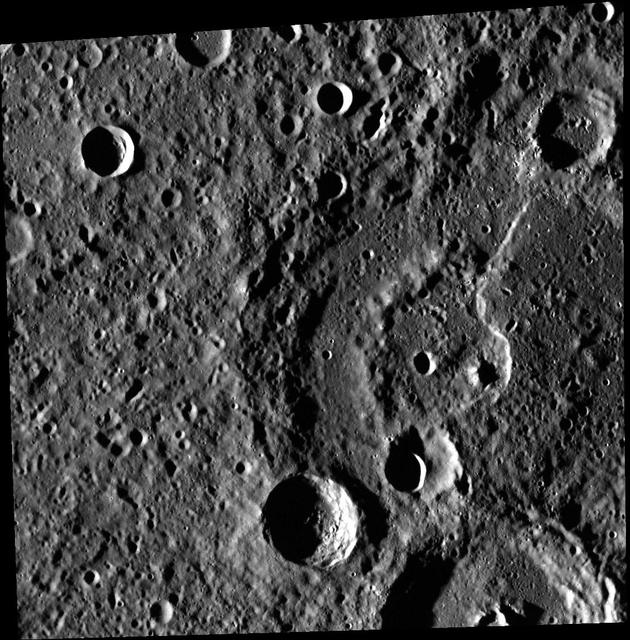
Ridges and Grooves That Wave and Buckle on a Valley Floor
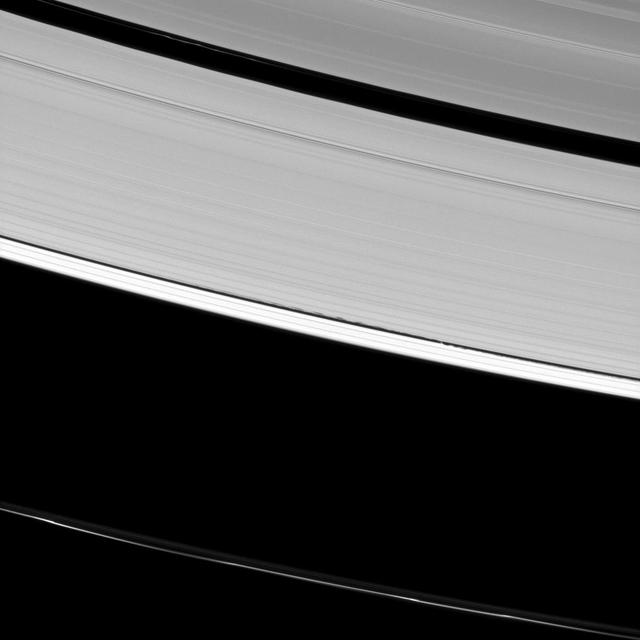
Two Waves in One Spectacular Image of Saturn Rings
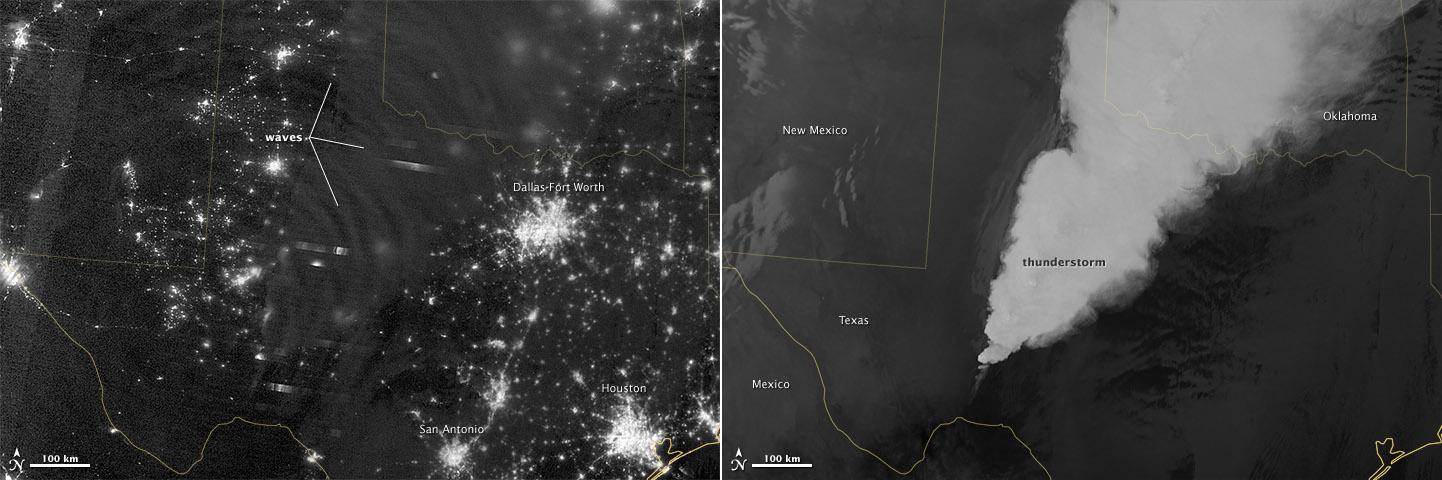
In April 2012, waves in Earth’s “airglow” spread across the nighttime skies of northern Texas like ripples in a pond. In this case, the waves were provoked by a massive thunderstorm. Airglow is a layer of nighttime light emissions caused by chemical reactions high in Earth’s atmosphere. A variety of reactions involving oxygen, sodium, ozone and nitrogen result in the production of a very faint amount of light. In fact, it’s approximately one billion times fainter than sunlight (~10-11 to 10-9 W·cm-2· sr-1). This chemiluminescence is similar to the chemical reactions that light up a glow stick or glow-in-the-dark silly putty. The “day-night band,” of the Visible Infrared Imaging Radiometer Suite (VIIRS) on the Suomi NPP satellite captured these glowing ripples in the night sky on April 15, 2012 (top image). The day-night band detects lights over a range of wavelengths from green to near-infrared and uses highly sensitive electronics to observe low light signals. (The absolute minimum signals detectable are at the levels of nightglow emission.) The lower image shows the thunderstorm as observed by a thermal infrared band on VIIRS. This thermal band, which is sensitive only to heat emissions (cold clouds appear white), is not sensitive to the subtle visible-light wave structures seen by the day-night band. Technically speaking, airglow occurs at all times. During the day it is called “dayglow,” at twilight “twilightglow,” and at night “nightglow.” There are slightly different processes taking place in each case, but in the image above the source of light is nightglow. The strongest nightglow emissions are mostly constrained to a relatively thin layer of atmosphere between 85 and 95 kilometers (53 and 60 miles) above the Earth’s surface. Little emission occurs below this layer since there’s a higher concentration of molecules, allowing for dissipation of chemical energy via collisions rather than light production. Likewise, little emission occurs above that layer because the atmospheric density is so tenuous that there are too few light-emitting reactions to yield an appreciable amount of light. Suomi NPP is in orbit around Earth at 834 kilometers (about 518 miles), well above the nightglow layer. The day-night band imagery therefore contains signals from the direction upward emission of the nightglow layer and the reflection of the downward nightglow emissions by clouds and the Earth’s surface. The presence of these nightglow waves is a graphic visualization of the usually unseen energy transfer processes that occur continuously between the lower and upper atmosphere. While nightglow is a well-known phenomenon, it’s not typically considered by Earth-viewing meteorological sensors. In fact, scientists were surprised at Suomi NPP’s ability to detect it. During the satellite’s check-out procedure, this unanticipated source of visible light was thought to indicate a problem with the sensor until scientists realized that what they were seeing was the faintest of light in the darkness of night. NASA Earth Observatory image by Jesse Allen and Robert Simmon, using VIIRS Day-Night Band data from the Suomi National Polar-orbiting Partnership. Suomi NPP is the result of a partnership between NASA, the National Oceanic and Atmospheric Administration, and the Department of Defense. Caption by Aries Keck and Steve Miller. Instrument: Suomi NPP - VIIRS Credit: <b><a href="http://www.earthobservatory.nasa.gov/" rel="nofollow"> NASA Earth Observatory</a></b> <b>Click here to view all of the <a href="http://earthobservatory.nasa.gov/Features/NightLights/" rel="nofollow"> Earth at Night 2012 images </a></b> <b>Click here to <a href="http://earthobservatory.nasa.gov/NaturalHazards/view.php?id=79817" rel="nofollow"> read more </a> about this image </b> <b><a href="http://www.nasa.gov/audience/formedia/features/MP_Photo_Guidelines.html" rel="nofollow">NASA image use policy.</a></b> <b><a href="http://www.nasa.gov/centers/goddard/home/index.html" rel="nofollow">NASA Goddard Space</a></b>
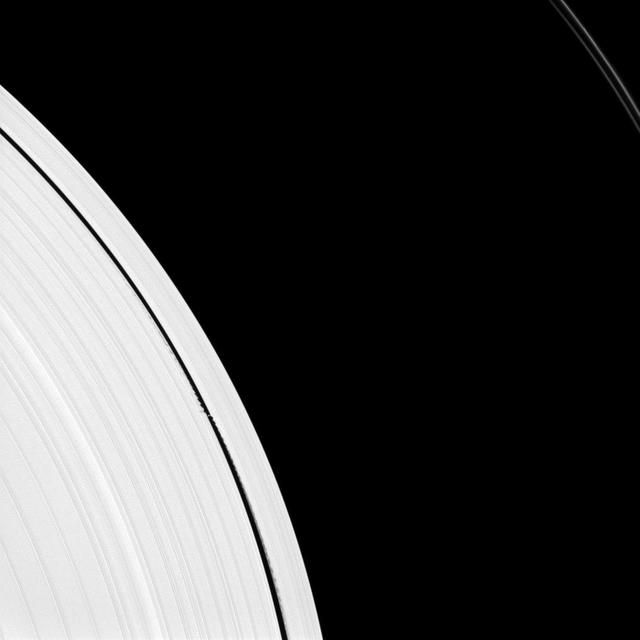
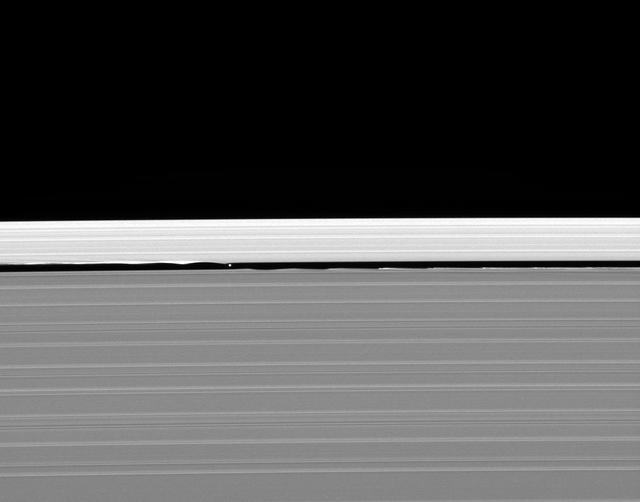
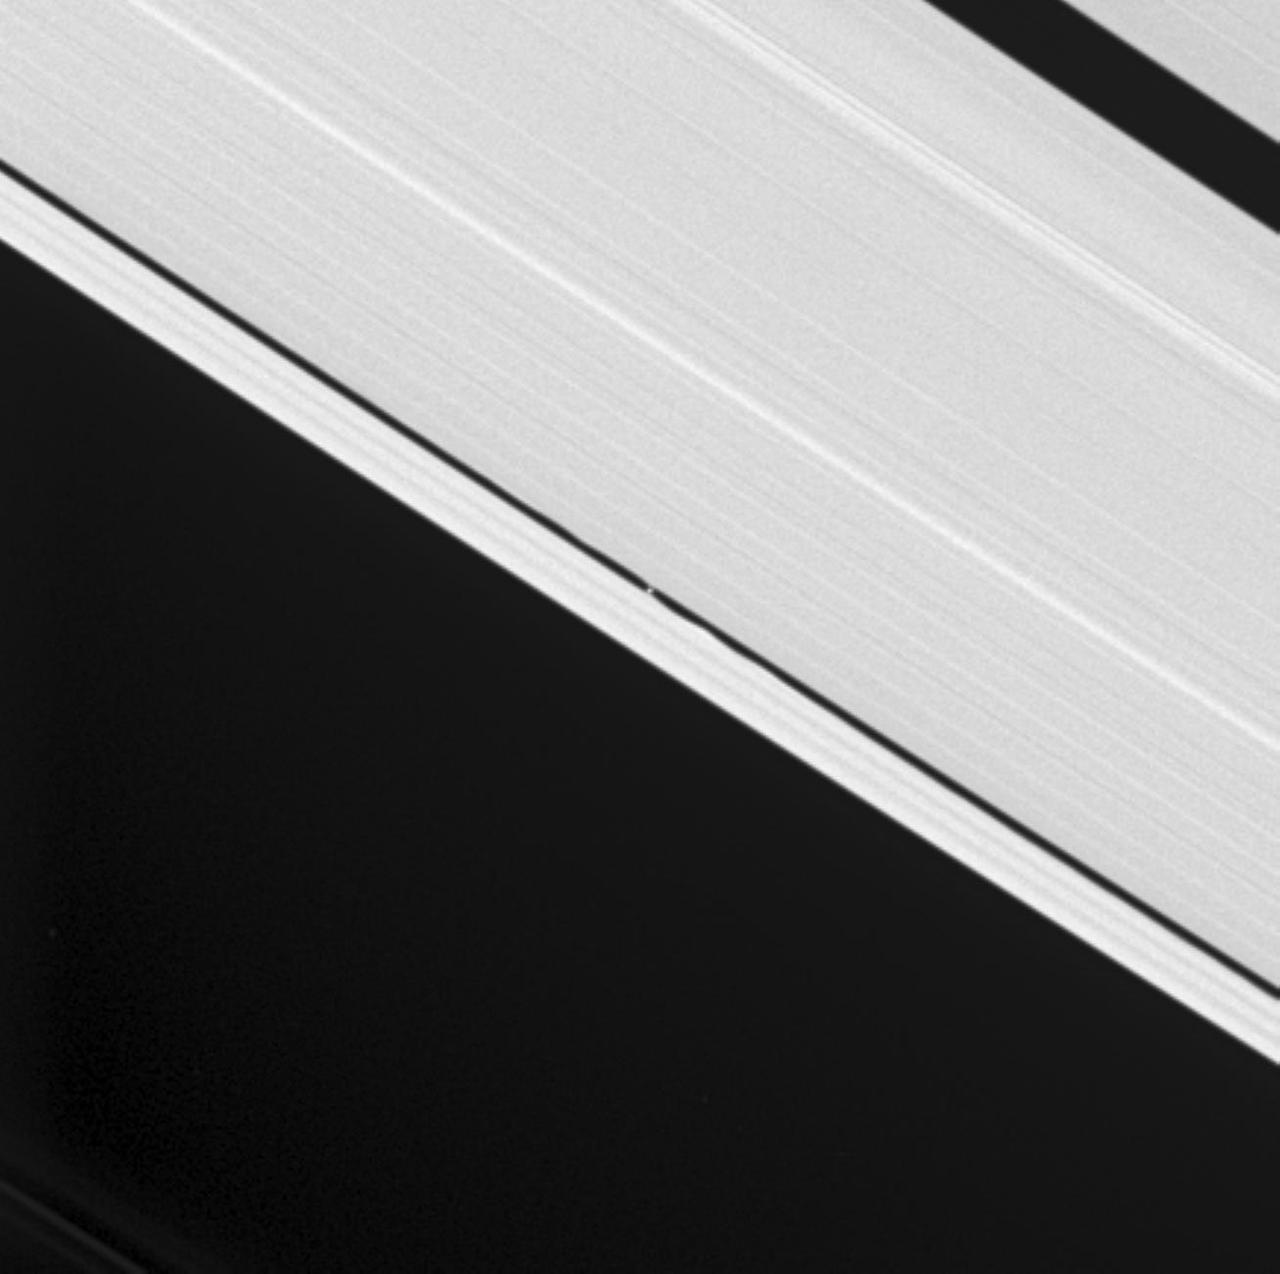
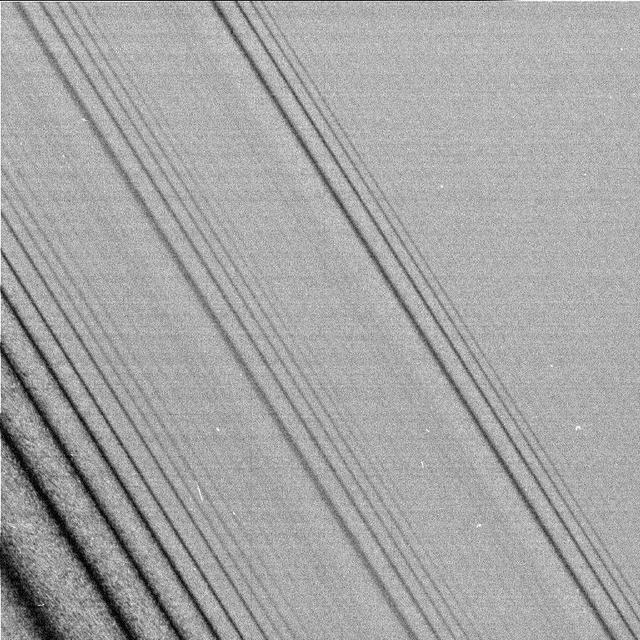
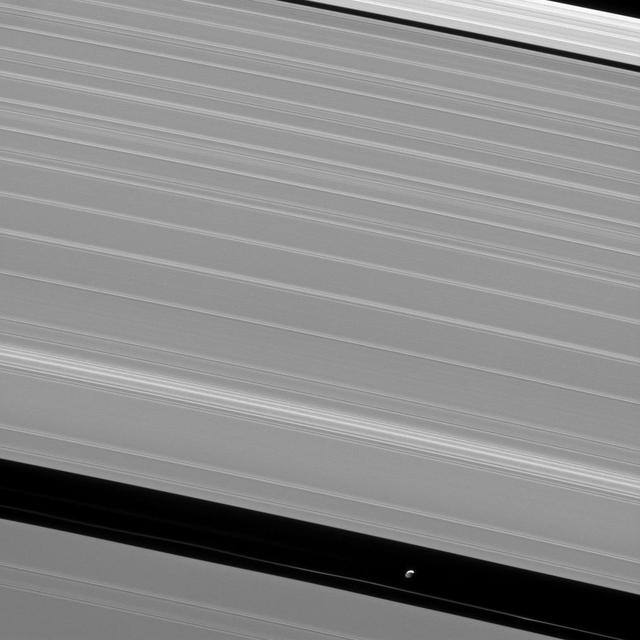
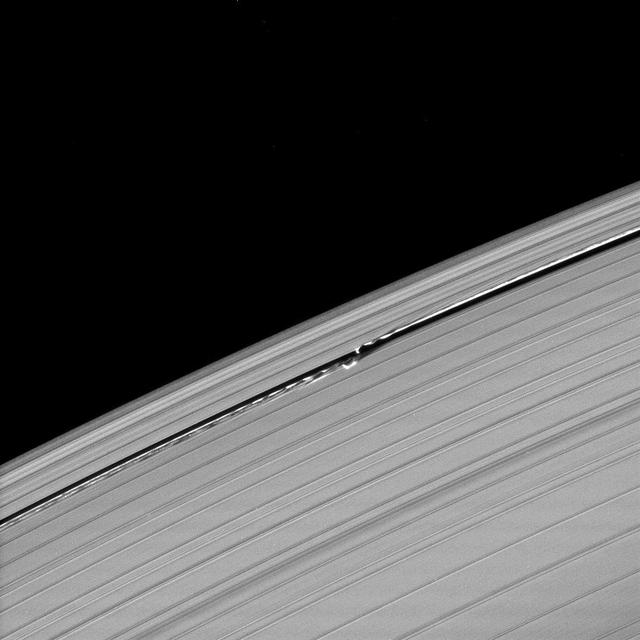
Saturn small moon Daphnis is caught in the act of raising waves on the edges of the Keeler gap, which is the thin dark band in the left half of the image. Waves like these allow scientists to locate small moons in gaps and measure their masses.

This cartoon shows how magnetic waves, called Alfvén S-waves, propagate outward from the base of black hole jets. The jet is a flow of charged particles, called a plasma, which is launched by a black hole. The jet has a helical magnetic field (yellow coil) permeating the plasma. The waves then travel along the jet, in the direction of the plasma flow, but at a velocity determined by both the jet's magnetic properties and the plasma flow speed. The BL Lac jet examined in a new study is several light-years long, and the wave speed is about 98 percent the speed of light. Fast-moving magnetic waves emanating from a distant supermassive black hole undulate like a whip whose handle is being shaken by a giant hand, according to a study using data from the National Radio Astronomy Observatory's Very Long Baseline Array. Scientists used this instrument to explore the galaxy/black hole system known as BL Lacertae (BL Lac) in high resolution. http://photojournal.jpl.nasa.gov/catalog/PIA19822
With its Multispectral Visible Imaging Camera MVIC, half of the Ralph instrument, New Horizons captured several pictures of mesoscale gravity waves in Jupiter equatorial atmosphere.
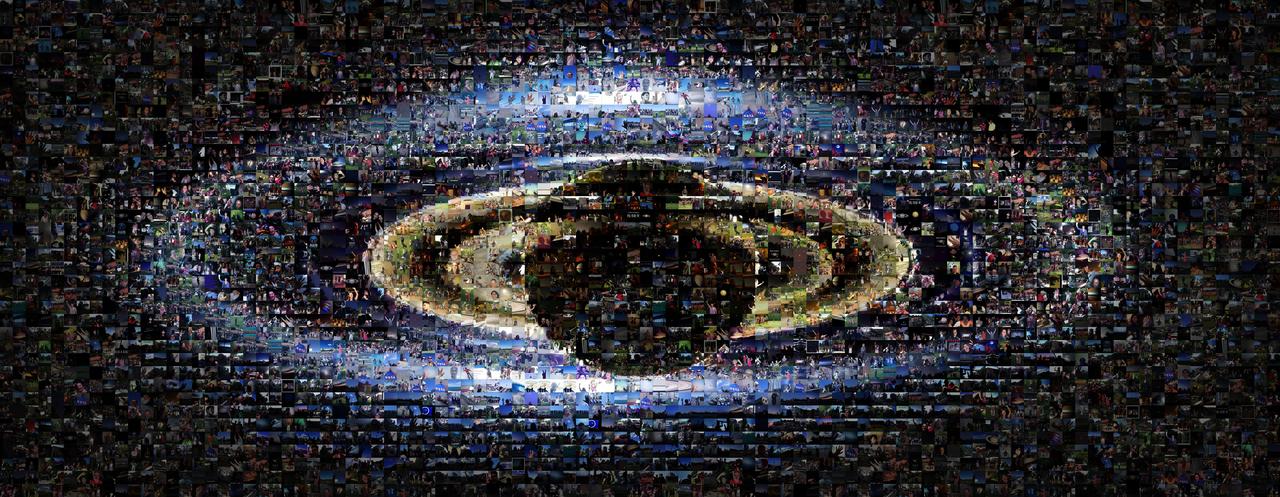
This collage includes about 1,600 images submitted by members of the public as part of the NASA Cassini mission Wave at Saturn campaign.
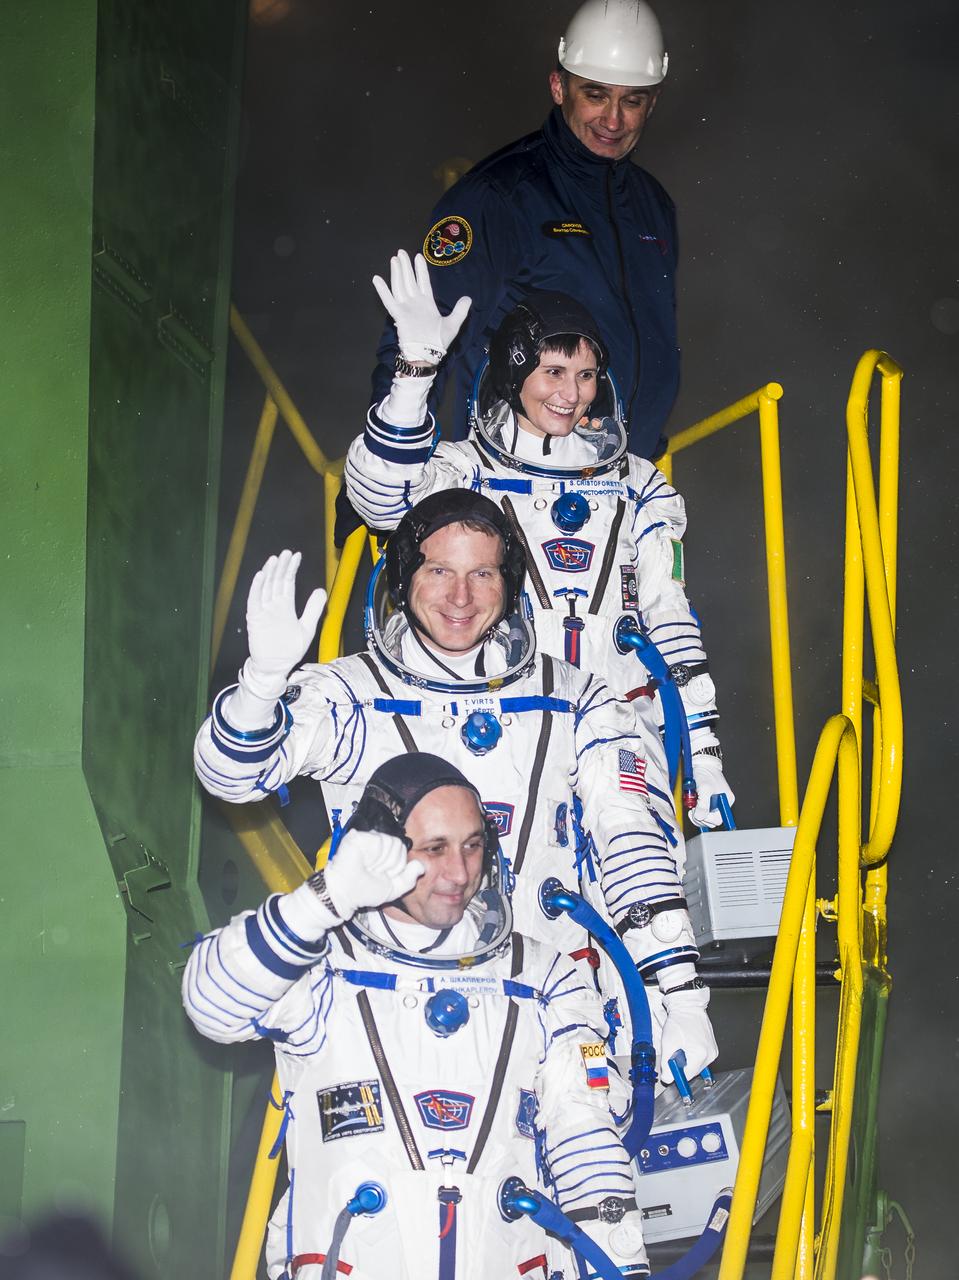
Expedition 42 Flight Engineer Samantha Cristoforetti, of the European Space Agency (ESA), top, Flight Engineer Terry Virts of NASA, center, and Soyuz Commander Anton Shkaplerov of the Russian Federal Space Agency (Roscosmos), bottom, wave farewell prior to boarding the Soyuz TMA-15M spacecraft for launch, Monday, Nov. 24, 2014 at the Baikonur Cosmodrome in Kazakhstan. Cristoforetti, Virts, and Shkaplerov will spend the next five and a half months aboard the International Space Station. Photo Credit: (NASA/Aubrey Gemignani)
NASA Cassini spacecraft catches Saturn moon Daphnis making waves and casting shadows from the narrow Keeler Gap of the planet A ring in this view taken around the time of Saturn August 2009 equinox.
The shepherd moon Pan orbits Saturn in the Encke gap while the A ring surrounding the gap displays wave features created by interactions between the ring particles and Saturnian moons in this image from NASA Cassini spacecraft.
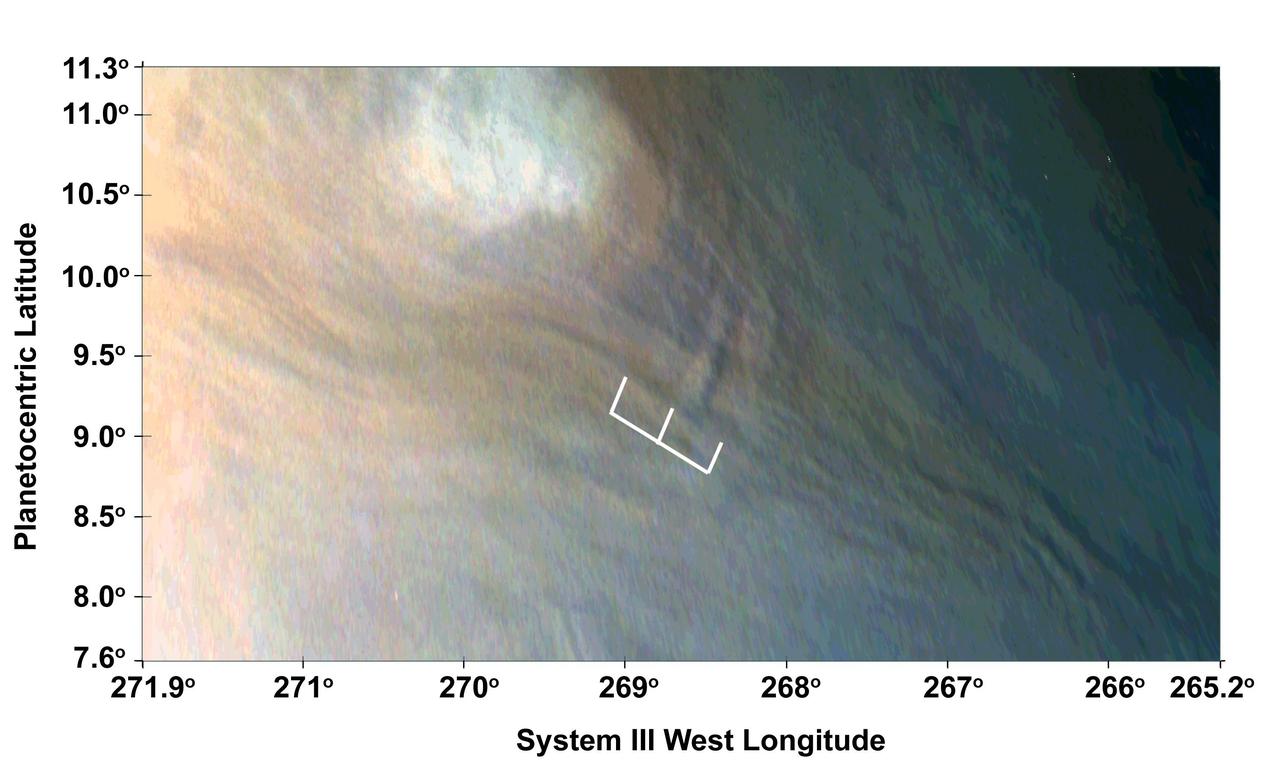
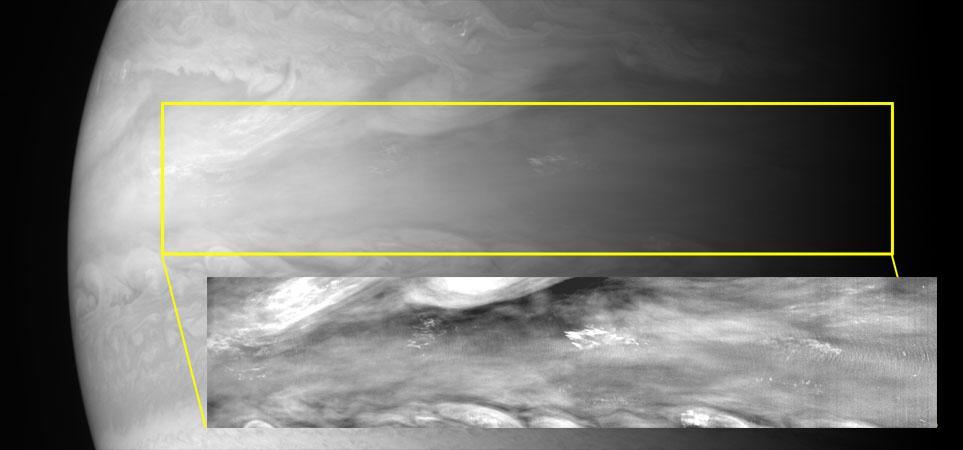
Three waves can be seen in this image, which is an excerpt of a JunoCam image taken on Feb. 2, 2017, during Juno's fourth flyby of Jupiter (perijove 4). The region imaged in this picture is part of the visibly dark band just north of Jupiter's equator known as the North Equatorial Belt. Most of this belt is characterized by downwelling motions, but during perijove 4 it had several bright areas of upwelling clouds. One of those upwelling clouds appears to be accompanied by dark regions, which are most likely shadows. The shadow associated with the center of the three waves is about 25 miles (40 kilometers) long; from the angle of illumination, we can deduce that the shadowed part of the wave must be around 4 miles (7 kilometers) above the main cloud deck, with the peak of the wave probably close to 6 miles (10 kilometers) above the main cloud deck. https://photojournal.jpl.nasa.gov/catalog/PIA22796

A coronal mass ejection (CME) erupted from just around the edge of the sun on May 1, 2013, in a gigantic rolling wave. CMEs can shoot over a billion tons of particles into space at over a million miles per hour. This CME occurred on the sun’s limb and is not headed toward Earth. The video (seen here: <a href="http://bit.ly/103whUl" rel="nofollow">bit.ly/103whUl</a>), taken in extreme ultraviolet light by NASA’s Solar Dynamics Observatory (SDO), covers about two and a half hours. Credit: NASA/Goddard/SDO <b><a href="http://www.nasa.gov/audience/formedia/features/MP_Photo_Guidelines.html" rel="nofollow">NASA image use policy.</a></b> <b><a href="http://www.nasa.gov/centers/goddard/home/index.html" rel="nofollow">NASA Goddard Space Flight Center</a></b> enables NASA’s mission through four scientific endeavors: Earth Science, Heliophysics, Solar System Exploration, and Astrophysics. Goddard plays a leading role in NASA’s accomplishments by contributing compelling scientific knowledge to advance the Agency’s mission. <b>Follow us on <a href="http://twitter.com/NASA_GoddardPix" rel="nofollow">Twitter</a></b> <b>Like us on <a href="http://www.facebook.com/pages/Greenbelt-MD/NASA-Goddard/395013845897?ref=tsd" rel="nofollow">Facebook</a></b> <b>Find us on <a href="http://instagram.com/nasagoddard?vm=grid" rel="nofollow">Instagram</a></b>
The false-color VNIR image from NASA Terra spacecraft was acquired off the island of Tsushima in the Korea Strait shows the signatures of several internal wave packets, indicating a northern propagation direction.
Pools of warm water known as Kelvin waves can be seen traveling eastward along the equator black line in this image from the NASA/French Space Agency Ocean Surface Topography Mission/Jason-2 satellite.
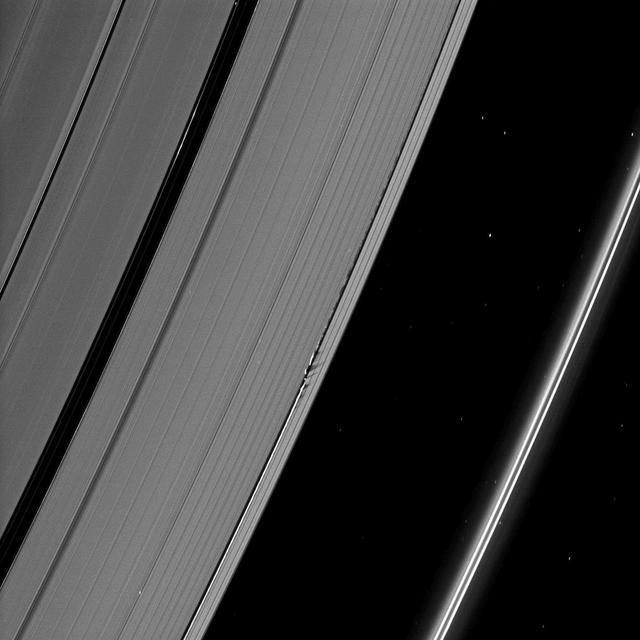
Waves in the edges of the Keeler gap in Saturn A ring, created by the embedded moon Daphnis, show considerable complexity in this image taken as Saturn approached its August 2009 equinox.
Shadows are cast by Daphnis and the moon attendant edge waves in this image from NASA Cassini spacecraft taken about a month and a half before the Saturn August 2009 equinox.
Saturn moon Daphnis, appearing as a tiny speck in the Keeler Gap of the A ring on the far right of this NASA Cassini spacecraft image, is almost lost among the moon attendant edge waves.
STS068-236-044 (30 September-11 October 1994) --- These internal waves in the Andaman Sea, west of Burma, were photographed from 115 nautical miles above Earth by the crew of the Space Shuttle Endeavour during the Space Radar Laboratory 2 (SRL-2) mission. The internal waves smooth out some of the capillary waves at the surface in bands and travel along the density discontinuity at the bottom of the mixed layer depth. There is little evidence of the internal waves at the surface. They are visible in the Space Shuttle photography because of sunglint, which reflects off the water.
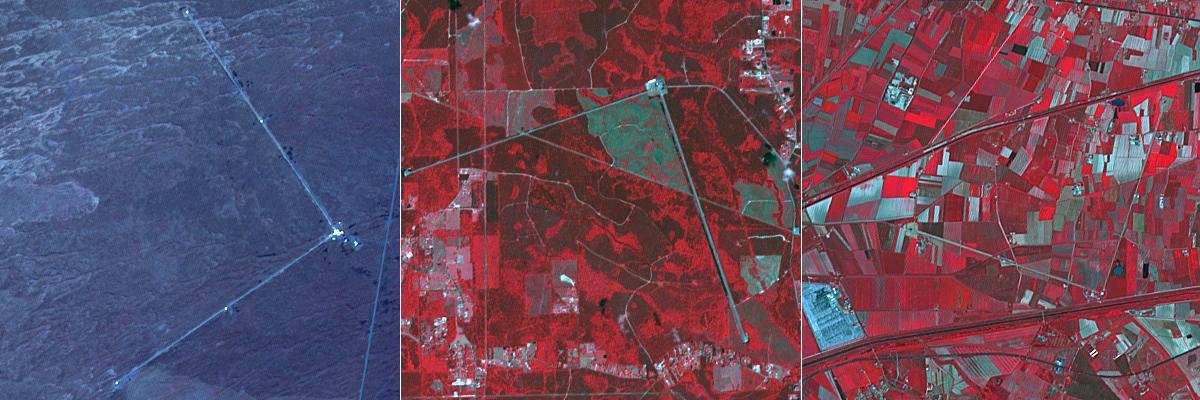
The biggest merger yet between two black holes produced gravity waves that were detected by gravitational wave detection systems. This analysis is the latest to come out of the international LIGO-VIRGO collaboration, which operates three super-sensitive gravitational wave-detection systems in America and Europe (Information from BBC News, September 2). The systems consist of two interferometers at right angles to each other. The two American LIGO systems are located near Livingston, LA (left image) and near Hanford, WA (center image); the European VIRGO system is located near Pisa, Italy (right image). The three ASTER cutouts each cover an area of 6 by 6 km. https://photojournal.jpl.nasa.gov/catalog/PIA24129
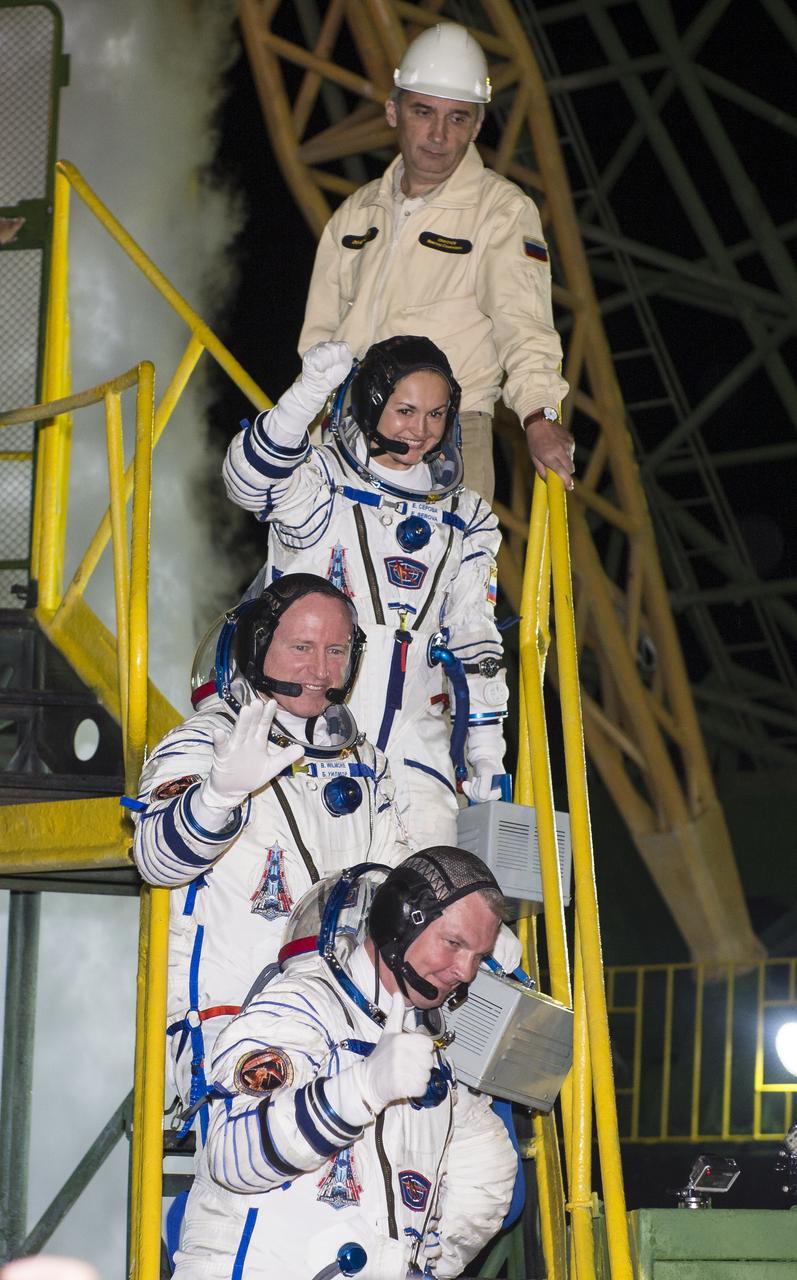
Expedition 41 Soyuz Commander Alexander Samokutyaev of the Russian Federal Space Agency (Roscosmos), bottom, Flight Engineer Barry Wilmore of NASA, middle, and Elena Serova of Roscosmos, top, wave farewell prior to boarding the Soyuz TMA-14M spacecraft for launch, Thursday, Sept. 25, 2014 at the Baikonur Cosmodrome in Kazakhstan. Samokutyaev, Wilmore, and Serova will spend the next five and a half months aboard the International Space Station. Photo Credit: (NASA/Aubrey Gemignani)
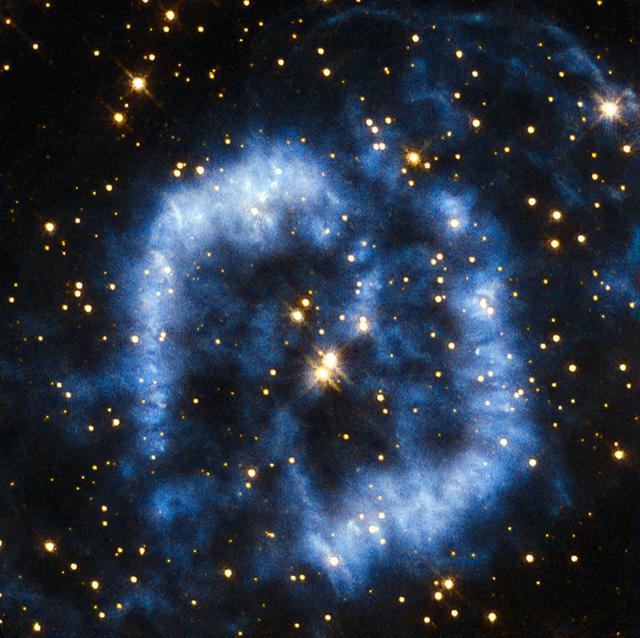
This planetary nebula is called PK 329-02.2 and is located in the constellation of Norma in the southern sky. It is also sometimes referred to as Menzel 2, or Mz 2, named after the astronomer Donald Menzel who discovered the nebula in 1922. When stars that are around the mass of the Sun reach their final stages of life, they shed their outer layers into space, which appear as glowing clouds of gas called planetary nebulae. The ejection of mass in stellar burnout is irregular and not symmetrical, so that planetary nebulae can have very complex shapes. In the case of Menzel 2 the nebula forms a winding blue cloud that perfectly aligns with two stars at its centre. In 1999 astronomers discovered that the star at the upper right is in fact the central star of the nebula, and the star to the lower left is probably a true physical companion of the central star. For tens of thousands of years the stellar core will be cocooned in spectacular clouds of gas and then, over a period of a few thousand years, the gas will fade away into the depths of the Universe. The curving structure of Menzel 2 resembles a last goodbye before the star reaches its final stage of retirement as a white dwarf. A version of this image was entered into the Hubble's Hidden Treasures image processing competition by contestant Serge Meunier.
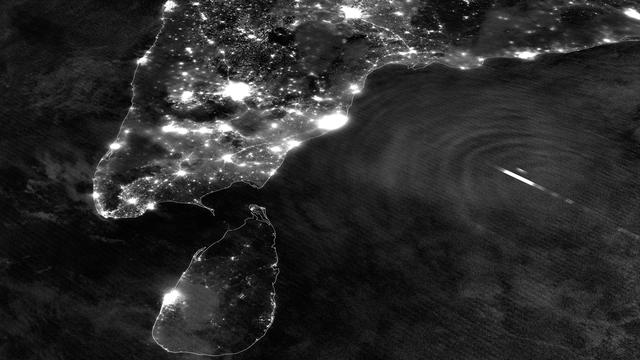
Tropical Cyclone Mahasen is moving north through the Indian Ocean along a track that places landfall along the Bangladesh coast on May 16th around 1200Z. On May 13, 2013 the Suomi NPP satellite caught an interesting glimpse of the storm as it moved off the eastern coast of India. The VIIRS Day-Night Band was able to resolve lightning flashes towards the center of the storm, along with mesopheric gravity waves emanating outwards like ripples in a pond. These gravity waves are of particular interest to air traffic controllers so assist in identifying areas of turbulence. Since the moon was in a new phase, the lights and other surface features of India and Sri Lanka are clearly visible, though the clouds of TC Mahasen are not - a tradeoff that occurs as the amount of moonlight cycles throughout the month. Credit: NASA/NOAA <b><a href="http://www.nasa.gov/audience/formedia/features/MP_Photo_Guidelines.html" rel="nofollow">NASA image use policy.</a></b> <b><a href="http://www.nasa.gov/centers/goddard/home/index.html" rel="nofollow">NASA Goddard Space Flight Center</a></b> enables NASA’s mission through four scientific endeavors: Earth Science, Heliophysics, Solar System Exploration, and Astrophysics. Goddard plays a leading role in NASA’s accomplishments by contributing compelling scientific knowledge to advance the Agency’s mission. <b>Follow us on <a href="http://twitter.com/NASA_GoddardPix" rel="nofollow">Twitter</a></b> <b>Like us on <a href="http://www.facebook.com/pages/Greenbelt-MD/NASA-Goddard/395013845897?ref=tsd" rel="nofollow">Facebook</a></b> <b>Find us on <a href="http://instagram.com/nasagoddard?vm=grid" rel="nofollow">Instagram</a></b>
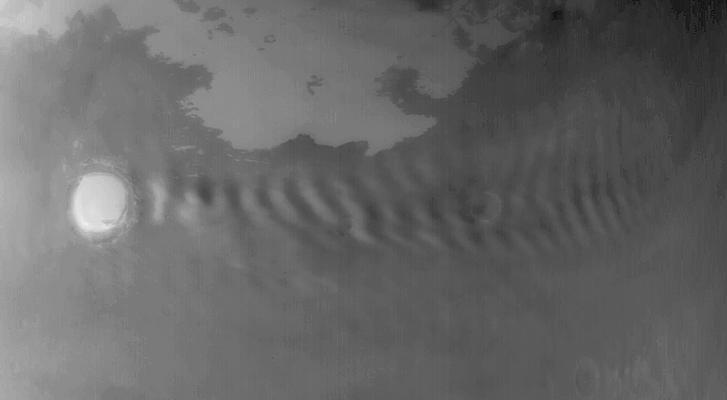
This frame from a series of images shows NASA Phoenix Mars Lander telltale instrument waving in the Martian wind. Documenting the telltale movement helps mission scientists and engineers determine what the wind is like on Mars.
In this natural-color image from NASA Terra spacecraft, a fingerprint-like gravity wave feature occurs over a deck of marine stratocumulus clouds.
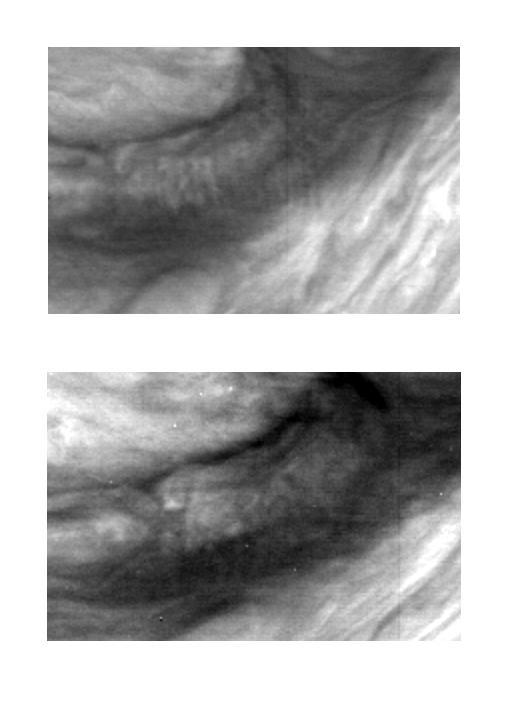
These two images of Jupiter atmosphere were taken with the violet filter of the Solid State Imaging CCD system aboard NASA Galileo spacecraft. Mesoscale waves can be seen in the center of the upper image. The images were obtained on June 26, 1996.
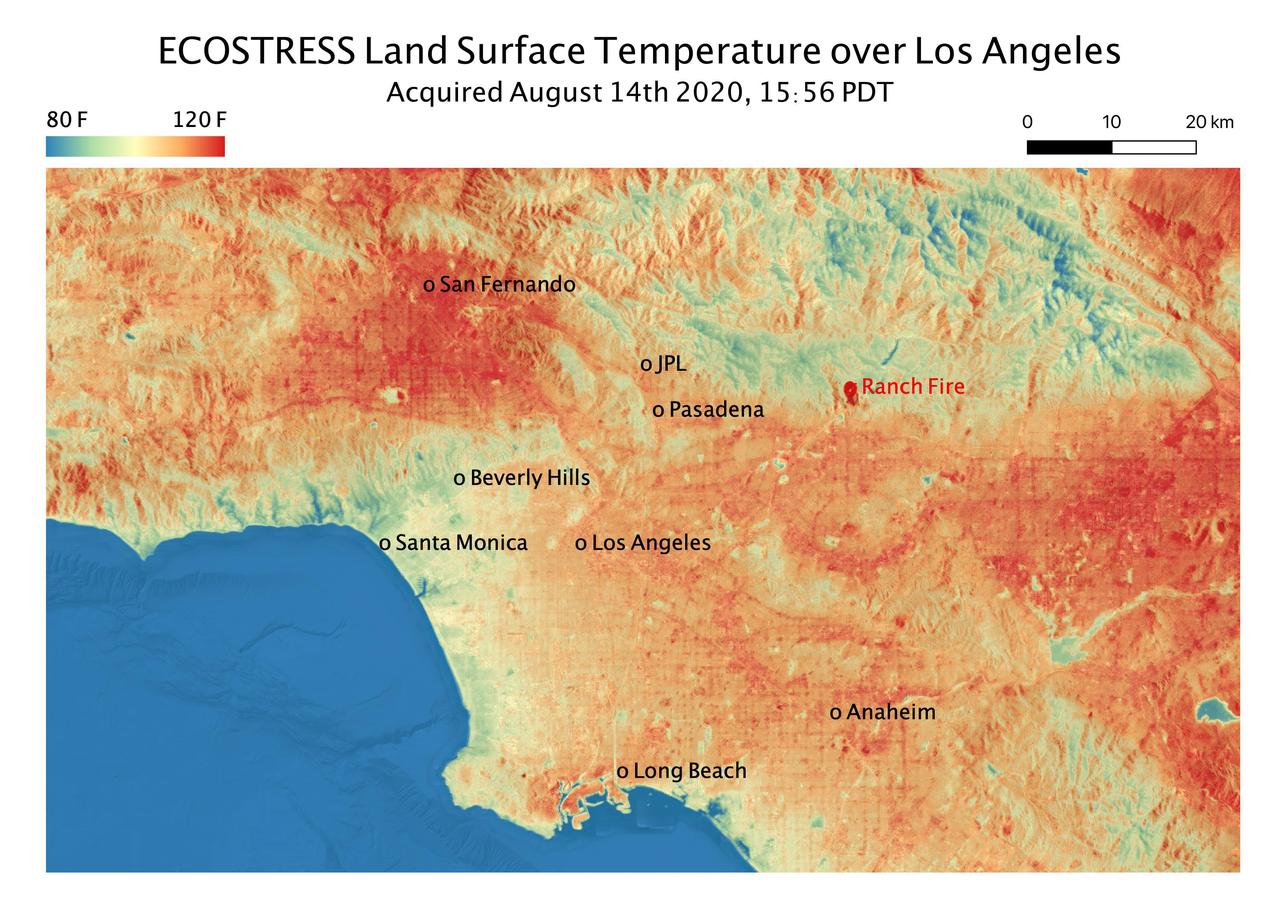
This temperature map shows the land surface temperatures throughout Los Angeles County on Aug. 14, 2020. The observation was made possible by NASA's Ecosystem Spaceborne Thermal Radiometer Experiment on Space Station (ECOSTRESS), which measured a peak land surface temperature in the San Fernando Valley, northwest of downtown Los Angeles, of 128.3 degrees Fahrenheit (53.5 degrees Celsius). ECOSTRESS collected this data as the space station passed over California at about 3:56 p.m. PDT (6:56 p.m. EDT) during a record-breaking heat wave that gripped the region. The Ranch fire, that burned near the city of Azuza was also detected by ECOSTRESS. With a resolution of about 77 by 77 yards (70 by 70 meters), the image enables the study of surface-temperature conditions down to the size of a football field. The hottest temperatures are shown in dark red, with the coolest temperatures in blue. ECOSTRESS measures the temperature of plants as they heat up when they run out of water. But it can also measure and track heat-related phenomena like heat waves, fires, and volcanoes. https://photojournal.jpl.nasa.gov/catalog/PIA23786
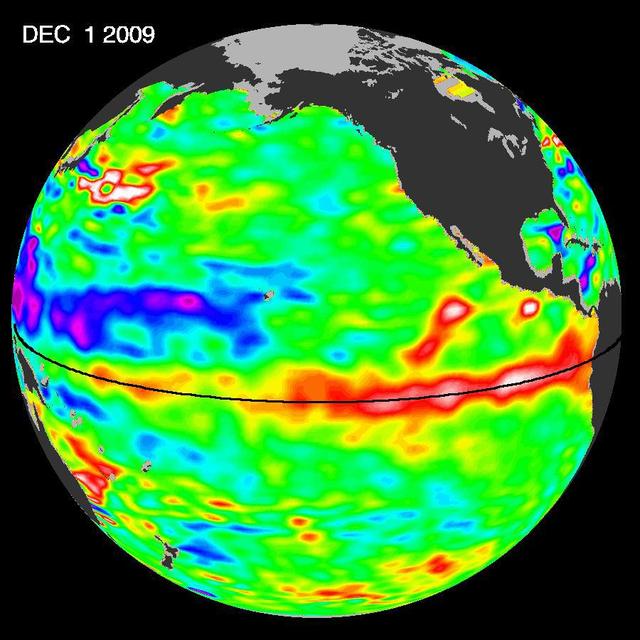
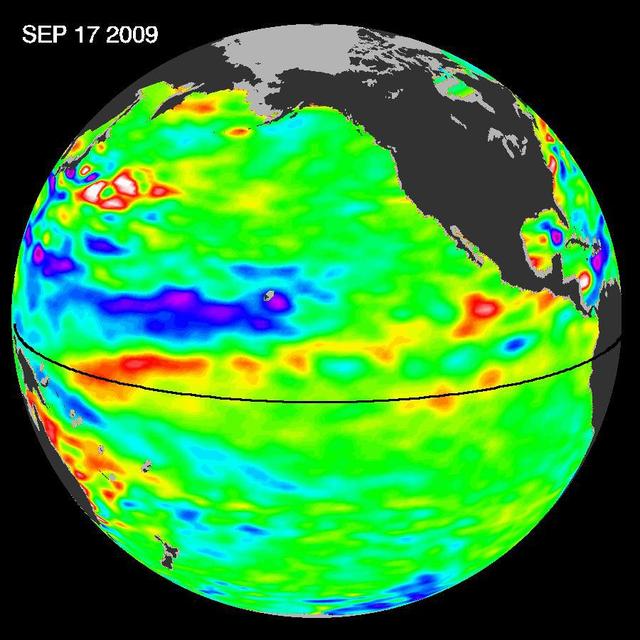
The most recent sea-level height data from the NASA/European Ocean Surface Topography Mission/Jason-2 oceanography satellite show the continued eastward progression of a strong wave of warm water, known as a Kelvin wave, now approaching South America.
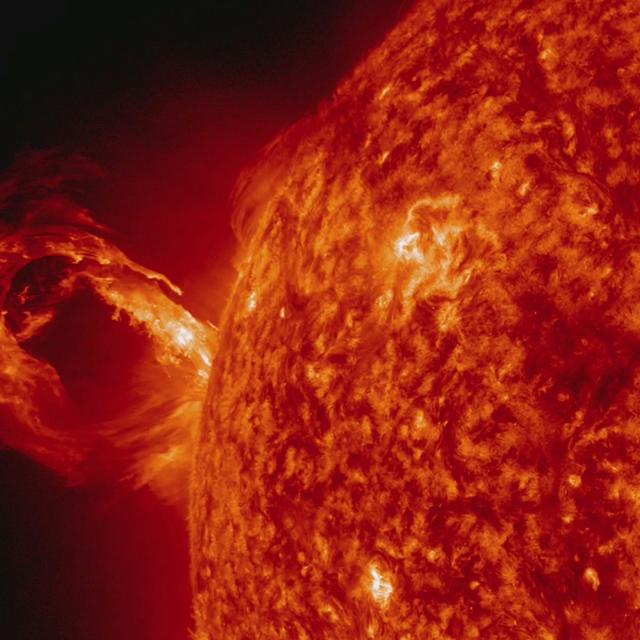
A corona mass ejection (CME) erupted from just around the edge of the sun on May 1, 2013, in a gigantic rolling wave. CMEs can shoot over a billion tons of particles into space at over a million miles per hour. This CME occurred on the sun’s limb and is not headed toward Earth. The video, taken in extreme ultraviolet light by NASA’s Solar Dynamics Observatory (SDO), covers about two and a half hours. Credit: NASA/Goddard/SDO <b><a href="http://www.nasa.gov/audience/formedia/features/MP_Photo_Guidelines.html" rel="nofollow">NASA image use policy.</a></b> <b><a href="http://www.nasa.gov/centers/goddard/home/index.html" rel="nofollow">NASA Goddard Space Flight Center</a></b> enables NASA’s mission through four scientific endeavors: Earth Science, Heliophysics, Solar System Exploration, and Astrophysics. Goddard plays a leading role in NASA’s accomplishments by contributing compelling scientific knowledge to advance the Agency’s mission. <b>Follow us on <a href="http://twitter.com/NASA_GoddardPix" rel="nofollow">Twitter</a></b> <b>Like us on <a href="http://www.facebook.com/pages/Greenbelt-MD/NASA-Goddard/395013845897?ref=tsd" rel="nofollow">Facebook</a></b> <b>Find us on <a href="http://instagram.com/nasagoddard?vm=grid" rel="nofollow">Instagram</a></b>

While it often seems unvarying from our viewpoint on Earth, the sun is constantly changing. Material courses through not only the star itself, but throughout its expansive atmosphere. Understanding the dance of this charged gas is a key part of better understanding our sun – how it heats up its atmosphere, how it creates a steady flow of solar wind streaming outward in all directions, and how magnetic fields twist and turn to create regions that can explode in giant eruptions. Now, for the first time, researchers have tracked a particular kind of solar wave as it swept upward from the sun's surface through its atmosphere, adding to our understanding of how solar material travels throughout the sun. Scientists analyzed sunspot images from a trio of observatories -- including the Big Bear Solar Observatory, which captured this footage -- to make the first-ever observations of a solar wave traveling up into the sun’s atmosphere from a sunspot. Tracking solar waves like this provides a novel tool for scientists to study the atmosphere of the sun. The imagery of the journey also confirms existing ideas, helping to nail down the existence of a mechanism that moves energy – and therefore heat – into the sun’s mysteriously-hot upper atmosphere, called the corona. A study on these results was published Oct. 11, 2016, in The Astrophysical Journal Letters. Image credit: Zhao et al/NASA/SDO/IRIS/BBSO Read more: <a href="http://go.nasa.gov/2dRv80g" rel="nofollow">go.nasa.gov/2dRv80g</a> <b><a href="http://www.nasa.gov/audience/formedia/features/MP_Photo_Guidelines.html" rel="nofollow">NASA image use policy.</a></b> <b><a href="http://www.nasa.gov/centers/goddard/home/index.html" rel="nofollow">NASA Goddard Space Flight Center</a></b> enables NASA’s mission through four scientific endeavors: Earth Science, Heliophysics, Solar System Exploration, and Astrophysics. Goddard plays a leading role in NASA’s accomplishments by contributing compelling scientific knowledge to advance the Agency’s mission. <b>Follow us on <a href="http://twitter.com/NASAGoddardPix" rel="nofollow">Twitter</a></b> <b>Like us on <a href="http://www.facebook.com/pages/Greenbelt-MD/NASA-Goddard/395013845897?ref=tsd" rel="nofollow">Facebook</a></b> <b>Find us on <a href="http://instagrid.me/nasagoddard/?vm=grid" rel="nofollow">Instagram</a></b>
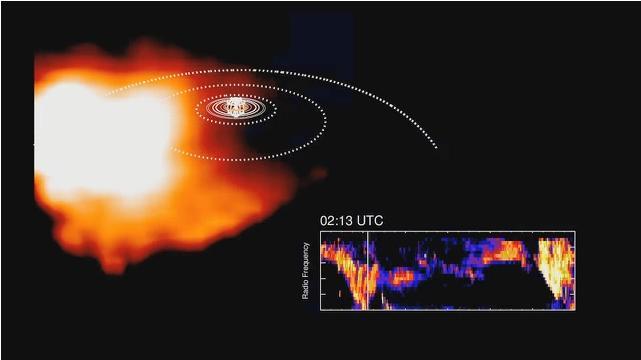
This frame from an animation, derived from data obtained by NASA Cassini spacecraft, shows how plasma swirling around Saturn is correlated to bursts of radio waves emanating from the planet.

This image shows an array of the 512 superconducting detectors used on the BICEP2 telescope at the South Pole. The technology was key to detecting the effects of gravitational waves associated with the early epoch of our universe known as inflation.
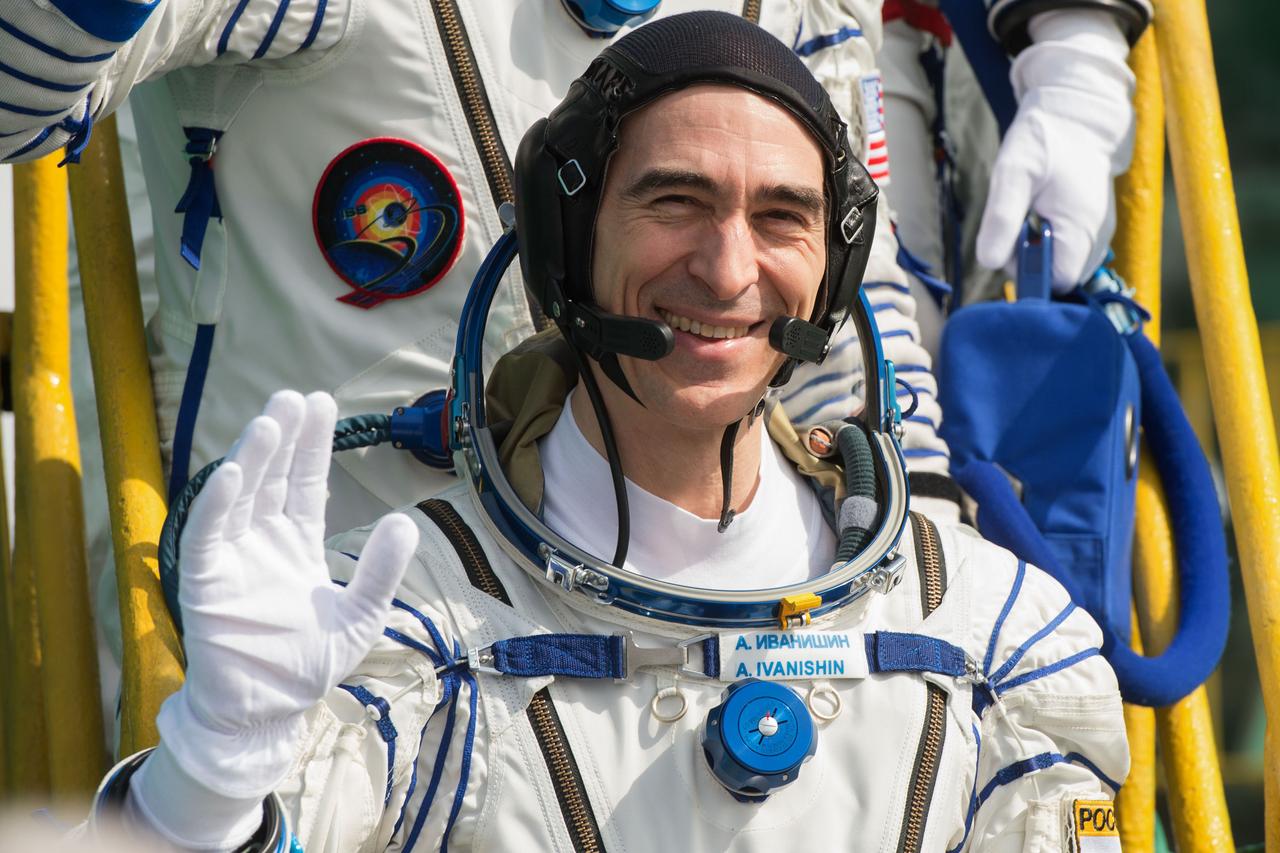
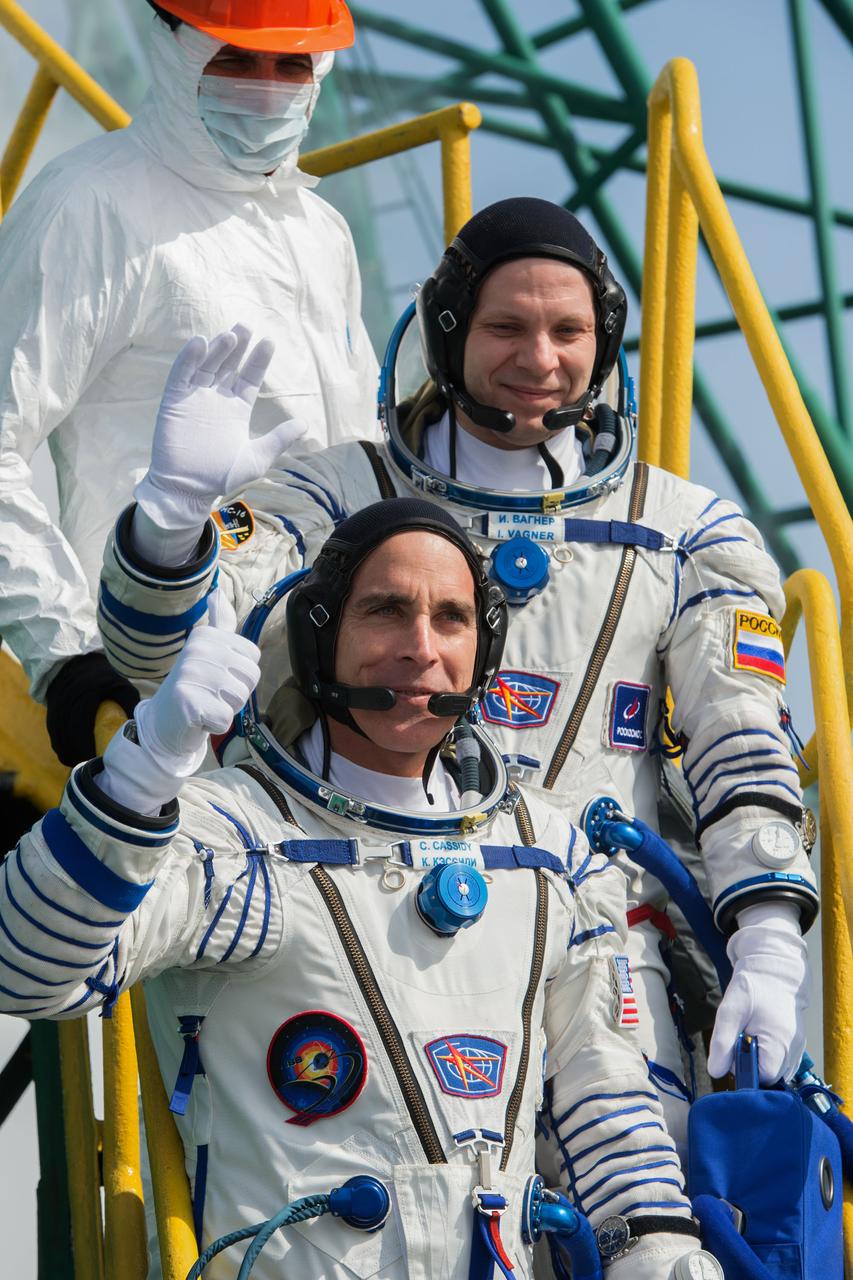
jsc2020e017125 - Expedition 63 Crew Waves Farewell - Expedition 63 crewmember Anatoly Ivanishin of Roscosmos, waves goodbye as he, Chris Cassidy of NASA, and Ivan Vagner of Roscosmos prepare to climb aboard the Soyuz MS-16 rocket at Site 31 at the Baikonur Cosmodrome in Kazakhstan, Thursday, April 9, 2020. They launched a short time later to the International Space Station for the start of a six-and-a-half month mission. Photo Credit: (NASA/GCTC/Andrey Shelepin)
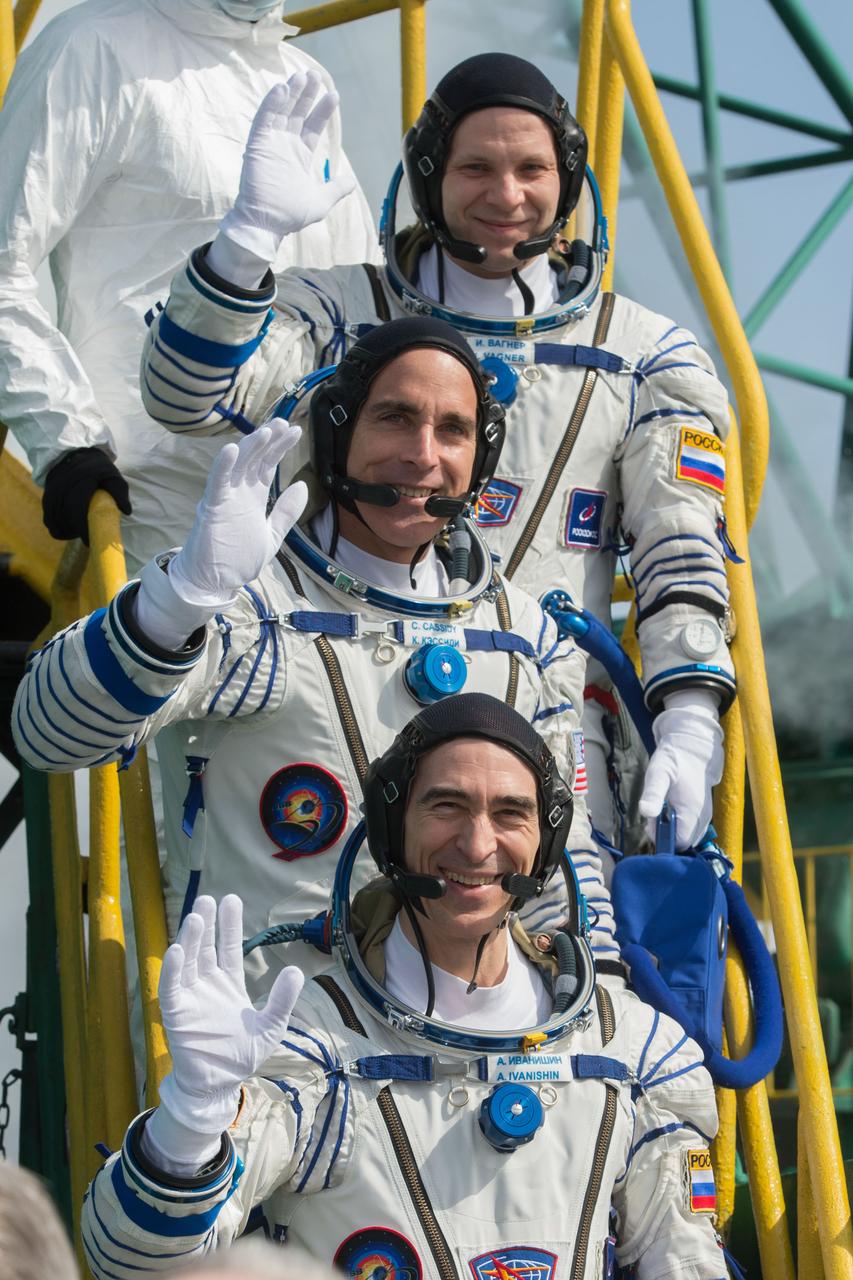
jsc2020e017122 - Expedition 63 Crew Waves Farewell - Expedition 63 crewmembers Ivan Vagner of Roscosmos, top, Chris Cassidy of NASA, center, and Anatoly Ivanishin wave goodbye as they prepare to climb aboard the Soyuz MS-16 rocket at Site 31 at the Baikonur Cosmodrome in Kazakhstan, Thursday, April 9, 2020. They launched a short time later to the International Space Station for the start of a six-and-a-half month mission. Photo Credit: (NASA/GCTC/Andrey Shelepin)

jsc2020e017124 - Expedition 63 Crew Waves Farewell - Expedition 63 crewmember Chris Cassidy of NASA waves goodbye as he, and cosmonauts Ivan Vagner and Anatoly Ivanishin of Roscosmos, prepare to climb aboard the Soyuz MS-16 rocket at Site 31 at the Baikonur Cosmodrome in Kazakhstan, Thursday, April 9, 2020. They launched a short time later to the International Space Station for the start of a six-and-a-half month mission. Photo Credit: (NASA/GCTC/Andrey Shelepin)

jsc2020e017123 - Expedition 63 Crew Waves Farewell - Expedition 63 crewmember Ivan Vagner of Roscosmos waves goodbye as he, Chris Cassidy of NASA, and Anatoly Ivanishin of Roscosmos, prepare to climb aboard the Soyuz MS-16 rocket at Site 31 at the Baikonur Cosmodrome in Kazakhstan, Thursday, April 9, 2020. They launched a short time later to the International Space Station for the start of a six-and-a-half month mission. Photo Credit: (NASA/GCTC/Andrey Shelepin)
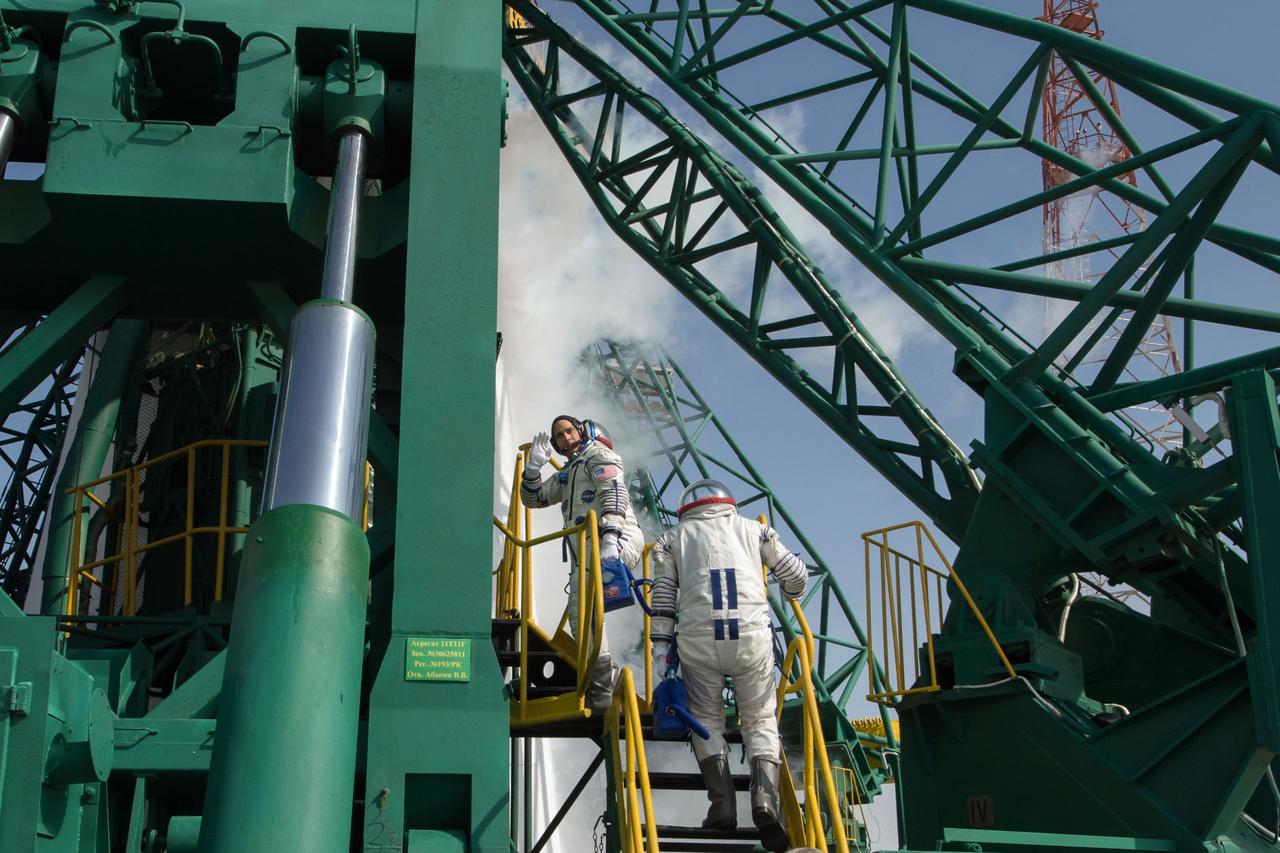
jsc2020e017127 - Expedition 63 Crew Waves Farewell - Expedition 63 crewmember Chris Cassidy of NASA waves farewell as he, Anatoly Ivanishin and Ivan Vagner of Roscosmos climb aboard the Soyuz MS-16 rocket at Site 31 at the Baikonur Cosmodrome in Kazakhstan, Thursday, April 9, 2020. They launched a short time later to the International Space Station for the start of a six-and-a-half month mission. Photo Credit: (NASA/GCTC/Andrey Shelepin)
jsc2020e017121 - Expedition 63 Crew Waves Farewell - Expedition 63 crewmembers Ivan Vagner of Roscosmos, top, and Chris Cassidy of NASA wave goodbye as they and Anatoly Ivanishin of Roscosmos prepare to climb aboard the Soyuz MS-16 rocket at Site 31 at the Baikonur Cosmodrome in Kazakhstan, Thursday, April 9, 2020. They launched a short time later to the International Space Station for the start of a six-and-a-half month mission. Photo Credit: (NASA/GCTC/Andrey Shelepin)

Image release September 2, 2010 ABOUT THIS IMAGE: This image shows the entire region around supernova 1987A. The most prominent feature in the image is a ring with dozens of bright spots. A shock wave of material unleashed by the stellar blast is slamming into regions along the ring's inner regions, heating them up, and causing them to glow. The ring, about a light-year across, was probably shed by the star about 20,000 years before it exploded. An international team of astronomers using the Hubble Space Telescope reports a significant brightening of the emissions from Supernova 1987A. The results, which appear in this week's Science magazine, are consistent with theoretical predictions about how supernovae interact with their immediate galactic environment. The team observed the supernova remnant in optical, ultraviolet, and near-infrared light. They studied the interaction between the ejecta from the stellar explosion and a glowing 6-trillion-mile-diameter ring of gas encircling the supernova remnant. The gas ring was probably shed some 20,000 years before the supernova exploded. Shock waves resulting from the impact of the ejecta onto the ring have brightened 30 to 40 pearl-like "hot spots" in the ring. These blobs likely will grow and merge together in the coming years to form a continuous, glowing circle. "We are seeing the effect a supernova can have in the surrounding galaxy, including how the energy deposited by these stellar explosions changes the dynamics and chemistry of the environment," said University of Colorado at Boulder Research Associate Kevin France of the Center for Astrophysics and Space Astronomy. "We can use these new data to understand how supernova processes regulate the evolution of galaxies." Discovered in 1987, Supernova 1987A is the closest exploding star to Earth to be detected since 1604 and it resides in the nearby Large Magellanic Cloud, a dwarf galaxy adjacent to our own Milky Way Galaxy. Credit: NASA, ESA, K. France (University of Colorado, Boulder), and P. Challis and R. Kirshner (Harvard-Smithsonian Center for Astrophysics) <b><a href="http://www.nasa.gov/centers/goddard/home/index.html" rel="nofollow">NASA Goddard Space Flight Center</a></b> is home to the nation's largest organization of combined scientists, engineers and technologists that build spacecraft, instruments and new technology to study the Earth, the sun, our solar system, and the universe. <b>Follow us on <a href="http://twitter.com/NASA_GoddardPix" rel="nofollow">Twitter</a></b> <b>Join us on <a href="http://www.facebook.com/pages/Greenbelt-MD/NASA-Goddard/395013845897?ref=tsd" rel="nofollow">Facebook</a></b>

A researcher stands next to the Pulsed Ejector Wave Propagation Test Rig in an opened section of the 1'x1' Supersonic Wind Tunnel at NASA Glenn Research Center.
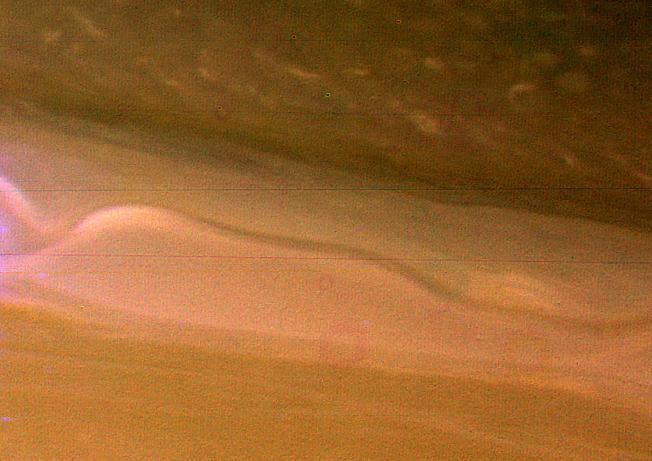
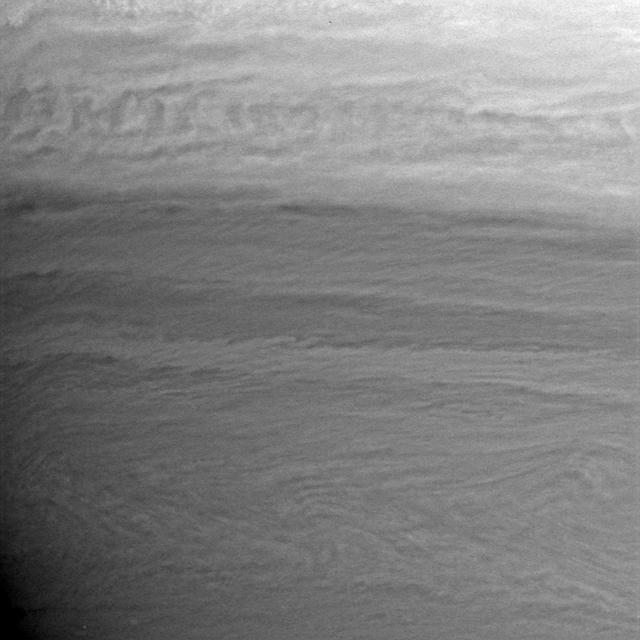
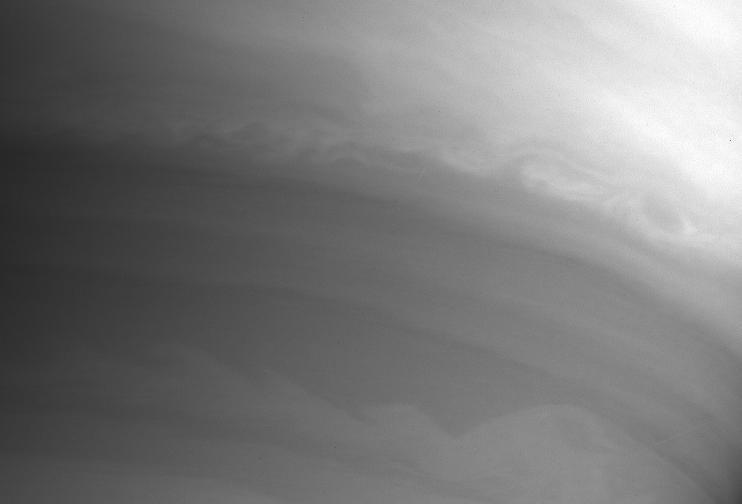
A view of Saturn clouds extending from 40 N latitude shows a ribbon-like wave structure in the south with small convective features marking a westward jet in the north. This image was obtained on November 10, 1980 by NASA Voyager 1.
The initial tsunami waves resulting from the undersea earthquake that occurred at 00:58:53 UTC Coordinated Universal Time on 26 December 2004 off the island of Sumatra, Indonesia, as seen by NASA Terra spacecraft.

Expedition 51 crew members, Soyuz Commander Fyodor Yurchikhin of Roscosmos, left, and Flight Engineer Jack Fischer of NASA, right, wave farewell to family and friends as they depart the Cosmonaut Hotel to suit-up for their Soyuz launch to the International Space Station on Thursday, April 20, 2017 in Baikonur, Kazakhstan. Launch of the Soyuz rocket is scheduled for 1:13PM April 20 Baikonur time and will send Yurchikhin and Fischer on a four and a half month mission aboard the International Space Station. Photo Credit: (NASA/Aubrey Gemignani)

Expedition 51 crew members, Soyuz Commander Fyodor Yurchikhin of Roscosmos, front, and Flight Engineer Jack Fischer of NASA, back, wave farewell to family and friends as they depart the Cosmonaut Hotel to suit-up for their Soyuz launch to the International Space Station on Thursday, April 20, 2017 in Baikonur, Kazakhstan. Launch of the Soyuz rocket is scheduled for 1:13PM April 20 Baikonur time and will send Yurchikhin and Fischer on a four and a half month mission aboard the International Space Station. Photo Credit: (NASA/Aubrey Gemignani)
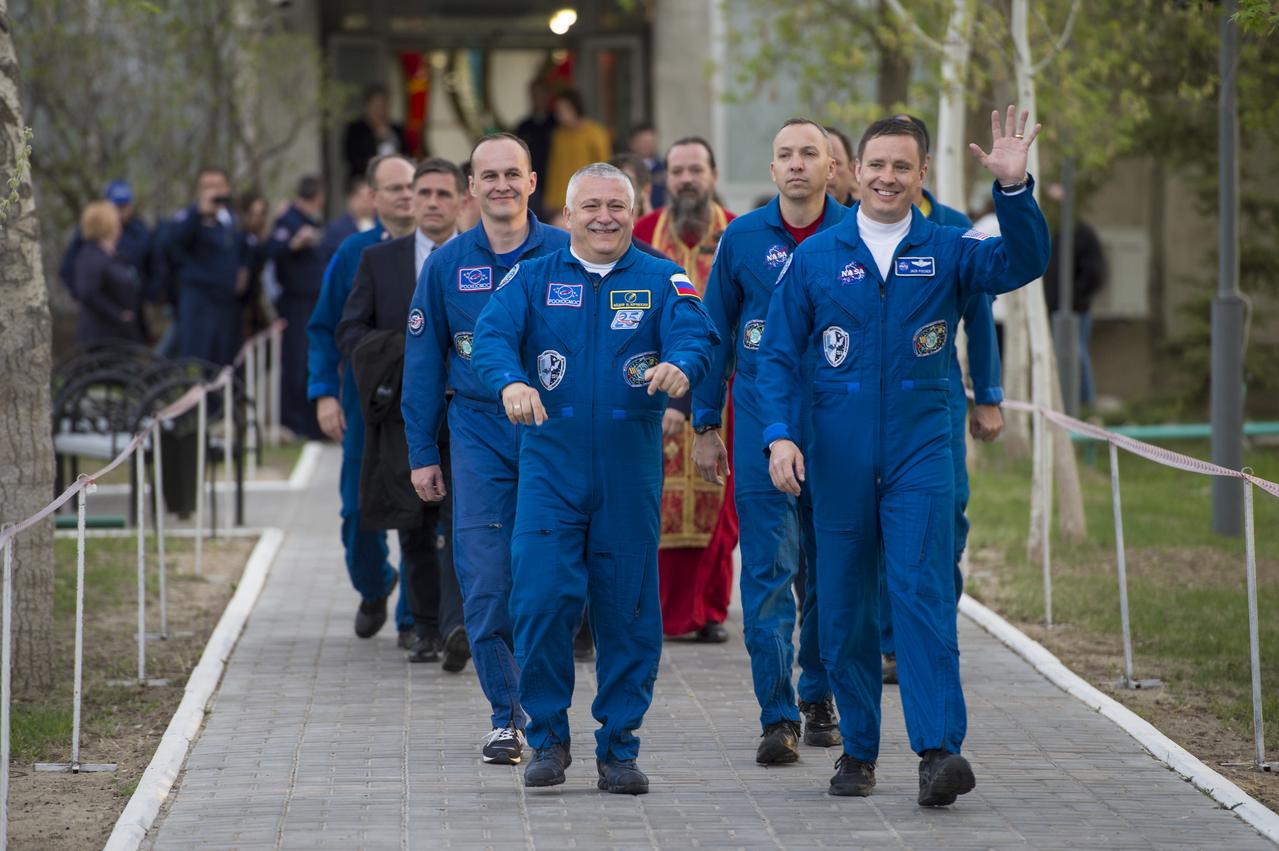
Expedition 51 crew members, Soyuz Commander Fyodor Yurchikhin of Roscosmos, left, and Flight Engineer Jack Fischer of NASA, right, wave to family and friends as they depart the Cosmonaut Hotel to suit-up for their Soyuz launch to the International Space Station on Thursday, April 20, 2017 in Baikonur, Kazakhstan. Launch of the Soyuz rocket is scheduled for 1:13PM April 20 Baikonur time and will send Yurchikhin and Fischer on a four and a half month mission aboard the International Space Station. Photo Credit: (NASA/Aubrey Gemignani)

Family of Expedition 58 Soyuz Commander Oleg Kononenko of Roscosmos wave farewell as the Expedition 58 crew departs the Cosmonaut Hotel to suit-up for their Soyuz launch to the International Space Station on Monday, Dec. 3, 2018 in Baikonur, Kazakhstan. Launch of the Soyuz rocket is scheduled for the same day and will send Kononenko, Flight Engineer Anne McClain of NASA, and Flight Engineer David Saint-Jacques of the Canadian Space Agency (CSA) on a six and a half month mission aboard the International Space Station. Photo Credit: (NASA/Aubrey Gemignani)
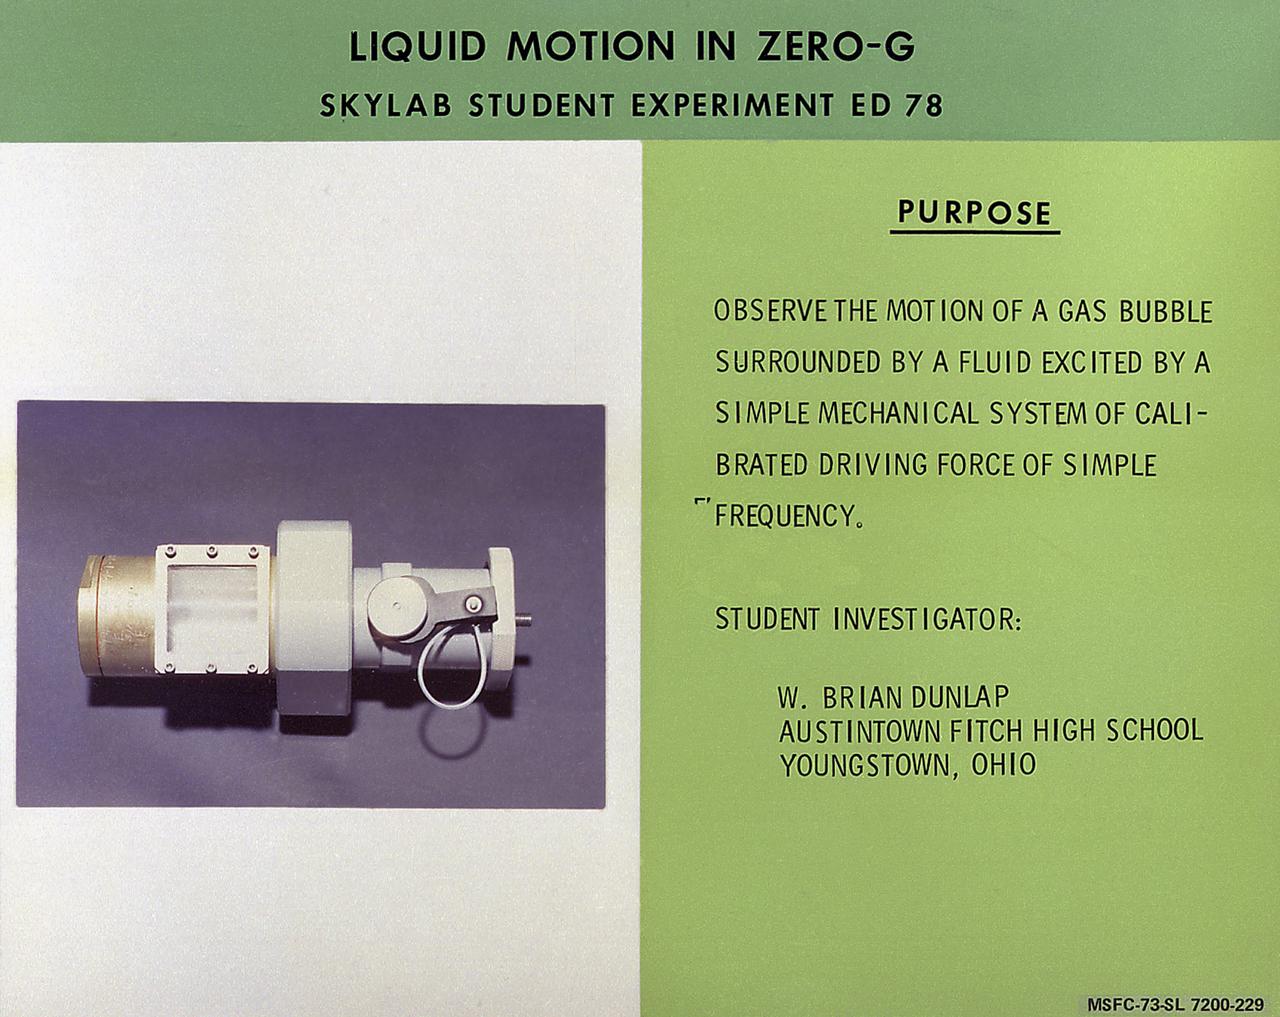
W. Brian Dunlap of Youngstown, Ohio, proposed Skylab student experiment ED-78, Liquid Motion in Zero-G, a study of wave motion in a liquid. He was particularly interested in comparing surface waves over a liquid in zero-gravity with those occurring on Earth. In space, with the absence of gravity, a liquid does not necessarily take the shape of its container as it does on Earth. Adhesion forces may hold the liquid in contact with its container, but the liquid can also assume a free-floating condition. It was in this latter state that Dunlap wished to examine the behavior of surface waves. Data were recorded on videotape and subsequently converted to 16-mm film. Dunlap analyzed these data to determine periods of oscillation of free-floating globules and found agreement with the theory to be much better than expected. In March 1972, NASA and the National Science Teachers Association selected 25 experiment proposals for flight on Skylab. Science advisors from the Marshall Space Flight Center aided and assisted the students in developing the proposals for flight on Skylab.
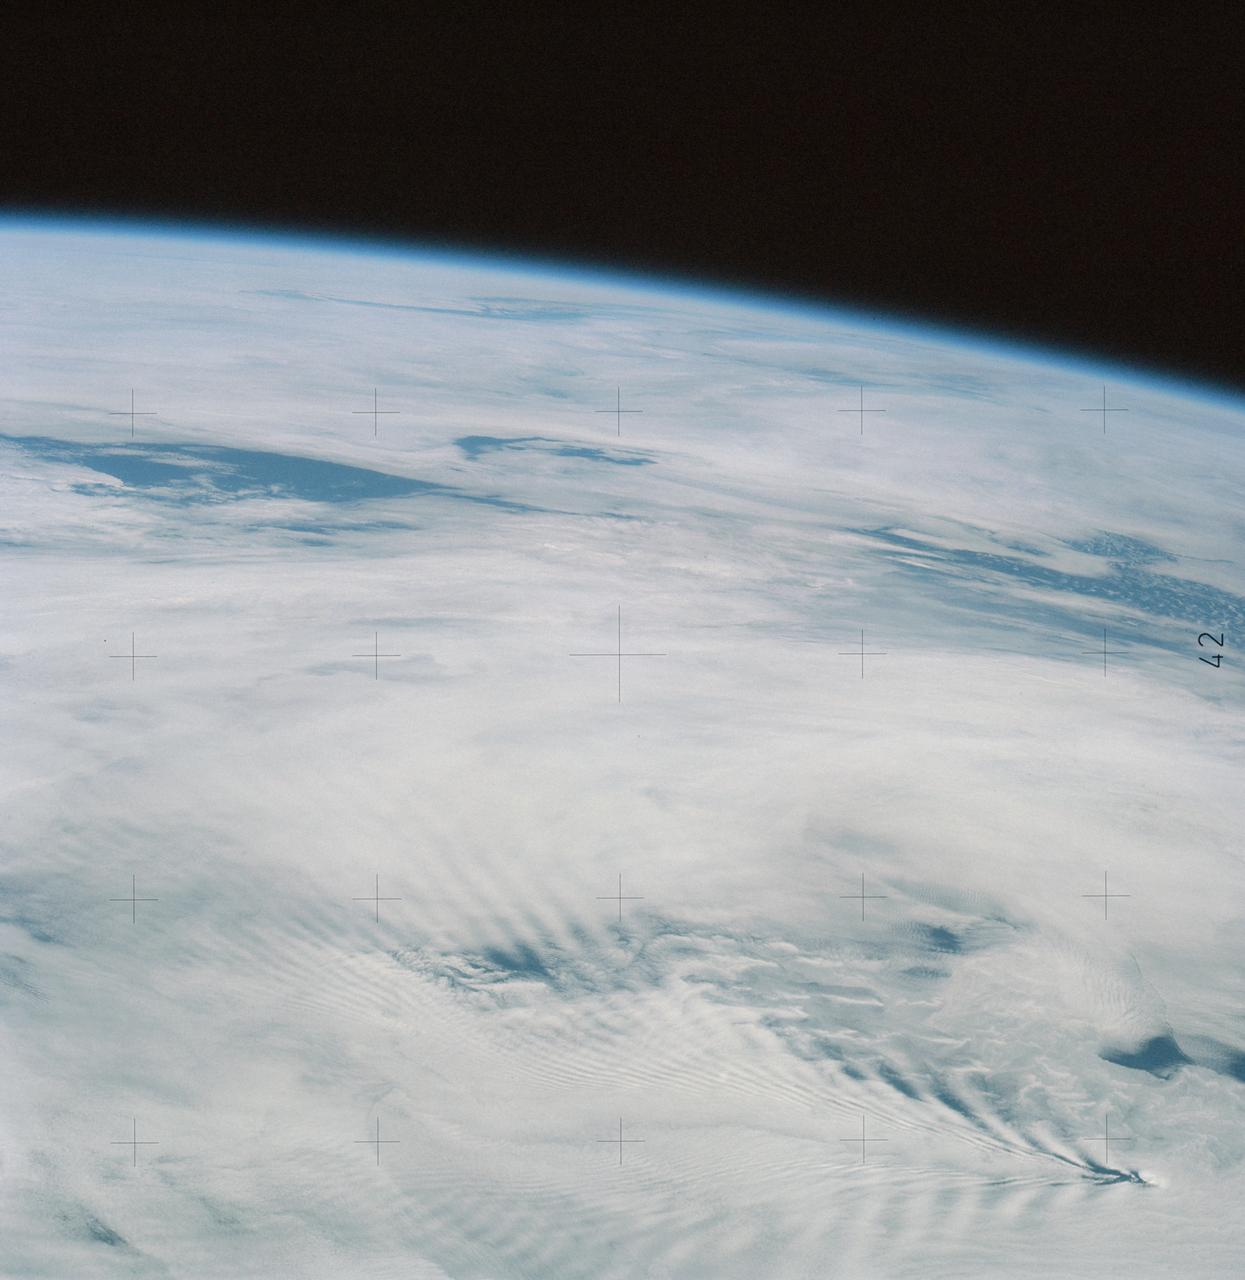
SL4-137-3632 (February 1974) --- A photograph taken from the Skylab space station in Earth orbit illustrating an atmospheric wave pattern by the affect of a small mountainous island on wind currents. Various patterns can be seen downwind of small islands. Often a Von Karmon vortex can be seen which appears as a spiral pattern. Multiple vortices have been photographed on previous missions. This photograph illustrates a "bow wave" pattern which extends for hundreds of miles downwind from the island. The island itself is often clear when a wave pattern is formed downstream. This particular pattern is very symmetrical. These wave patterns are most common in the South Pacific. This picture was taken by a Skylab 4 crewmen using a hand-held 70mm Hasselblad camera. Photo credit: NASA

Expedition 58 crew members, Flight Engineer Anne McClain of NASA, left, Soyuz Commander Oleg Kononenko of Roscosmos, center, and Flight Engineer David Saint-Jacques of the Canadian Space Agency (CSA), right, wave farewell to family and friends as they depart the Cosmonaut Hotel to suit-up for their Soyuz launch to the International Space Station on Monday, Dec. 3, 2018 in Baikonur, Kazakhstan. Launch of the Soyuz rocket is scheduled for Dec. 3 and will send Kononenko, McClain, and Saint-Jacques on a six and a half month mission aboard the International Space Station. Photo Credit: (NASA/Aubrey Gemignani)

Expedition 58 crew members, Flight Engineer Anne McClain of NASA, left, Soyuz Commander Oleg Kononenko of Roscosmos, center, and Flight Engineer David Saint-Jacques of the Canadian Space Agency (CSA), right, wave farewell to family and friends as they depart the Cosmonaut Hotel to suit-up for their Soyuz launch to the International Space Station on Monday, Dec. 3, 2018 in Baikonur, Kazakhstan. Launch of the Soyuz rocket is scheduled for Dec. 3 and will send Kononenko, McClain, and Saint-Jacques on a six and a half month mission aboard the International Space Station. Photo Credit: (NASA/Aubrey Gemignani)
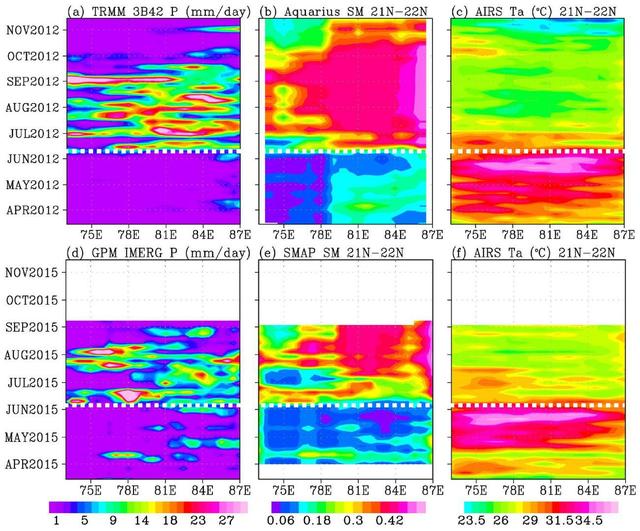
In June 2015, news organizations around the world reported on a deadly heat wave in India that killed more than 2,300 people. Prior to the arrival of the summer monsoon in India, weather conditions had been extremely hot and dry. Such conditions can lead to economic and agricultural disaster, human suffering and loss of life. NASA satellite sensors are allowing scientists to characterize pre-monsoon droughts and heat waves and postulate their scientific cause. This figure shows the longitude-time variations, averaged between 21 and 22 degrees North, across the middle of the India subcontinent from mid-April to mid-June. Longitude from the Arabian Sea to the Bay of Bengal is represented on the horizontal axis; while the vertical axis shows the timeframe. Rainfall is shown on the left, soil moisture is in the center, and surface air temperature is on the right. For both years (2012 and 2015), the summer monsoon begins in June, with sharp rises in rainfall and soil moisture, and a sharp drop in air temperature. The hottest and driest weeks occurred just before the summer monsoon onsets. Similar dry and hot periods, varying from one to a few weeks, were observed in 2013 and 2014. Soil moisture as an indication of drought as measured by NASA's Aquarius mission was first available in 2012. Rainfall data are from NASA's Tropical Rainfall Measuring Mission (TRMM), and surface air temperature is from NASA's Atmospheric Infrared Sounder (AIRS) instrument on NASA's Aqua satellite. The TRMM and Aquarius missions ended in April 2015, before the drought and heat waves. Their data were replaced by those presently available from NASA's Soil Moisture Active Passive Mission (SMAP) and Global Precipitation Mission (GPM) to show the drought and heatwave in 2015. Scientists from NASA's Jet Propulsion Laboratory, Pasadena, California, have shown that during the summer monsoon season, moisture is transported into the India Subcontinent from the Arabian Sea and out to the Bay of Bengal. The difference between moisture input from the west and output to the east is deposited as rain over land. The pre-monsoon drought and heat waves coincide with the short period when moisture is advected out to the Bay of Bengal ahead of input from the Arabian Sea. The onset of southwest monsoon winds begins in the Bay of Bengal and sucks moisture out from the subcontinent earlier than the onset in the Arabian Sea. http://photojournal.jpl.nasa.gov/catalog/PIA19939
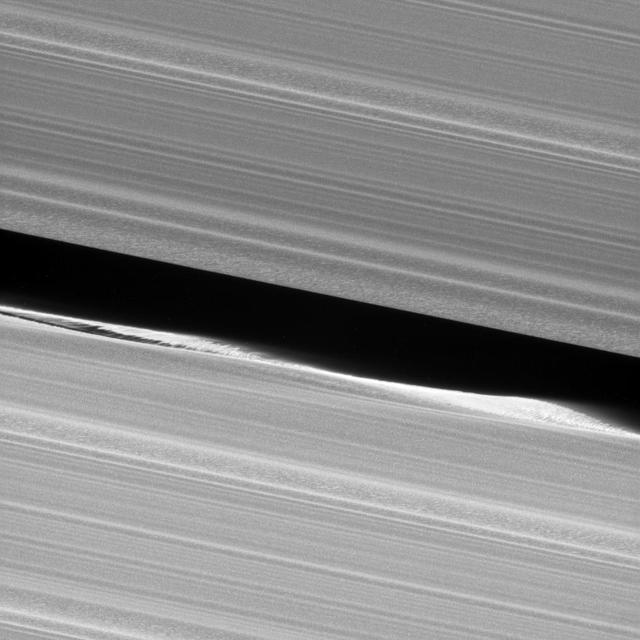
Before NASA's Cassini entered its Grand Finale orbits, it acquired unprecedented views of the outer edges of the main ring system. For example, this close-up view of the Keeler Gap, which is near the outer edge of Saturn's main rings, shows in great detail just how much the moon Daphnis affects the edges of the gap. Daphnis creates waves in the edges of the gap through its gravitational influence. Some clumping of ring particles can be seen in the perturbed edge, similar to what was seen on the edges of the Encke Gap back when Cassini arrived at Saturn in 2004. This view looks toward the sunlit side of the rings from about 3 degrees above the ring plane. The view was acquired at a distance of approximately 18,000 miles (30,000 kilometers) from Daphnis and at a Sun-Daphnis-spacecraft, or phase, angle of 69 degrees. Image scale is 581 feet (177 meters) per pixel. The image was taken in visible light with the Cassini spacecraft narrow-angle camera on Jan. 16, 2017. https://photojournal.jpl.nasa.gov/catalog/PIA21329
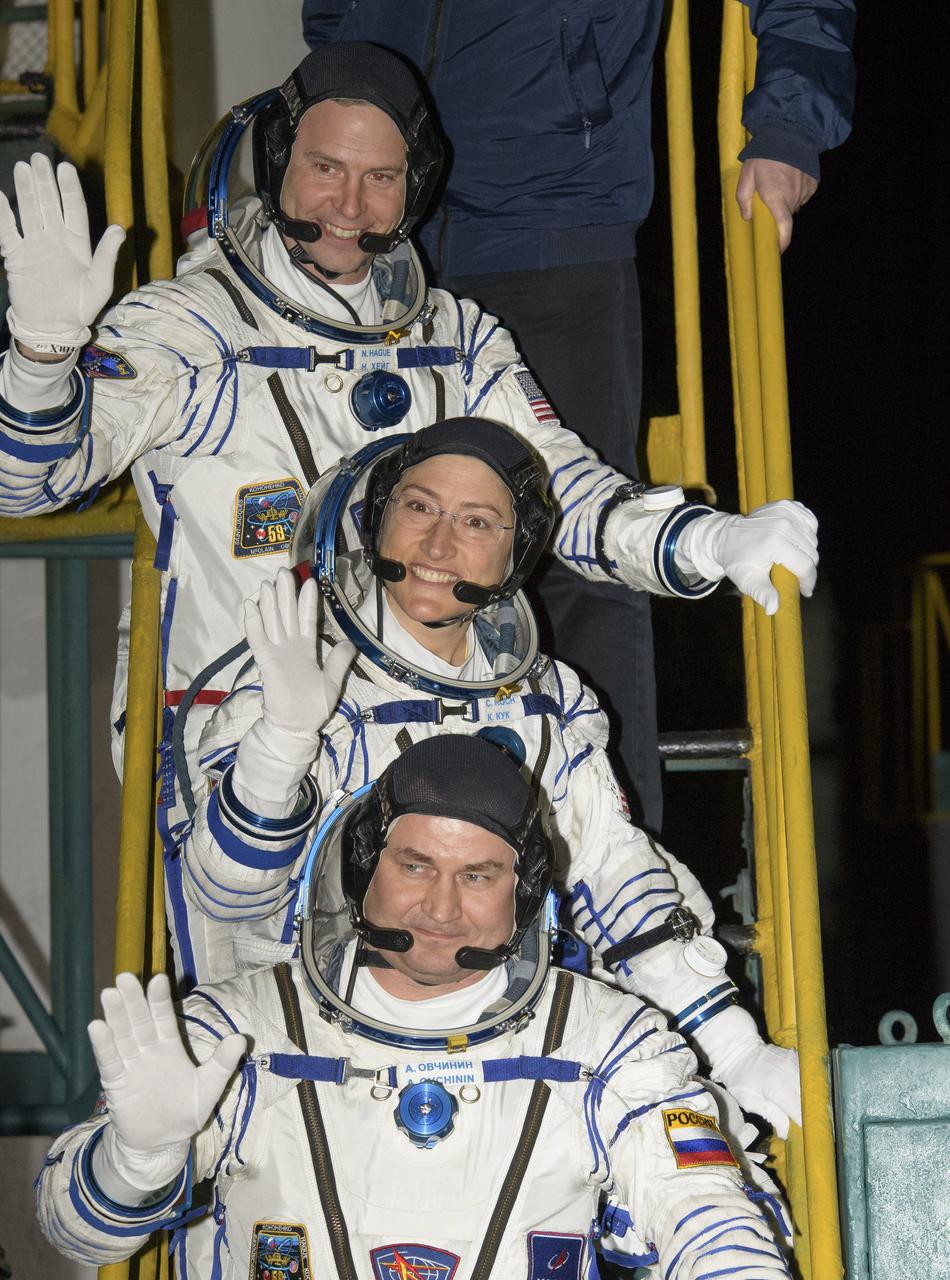
Expedition 59 crewmembers Nick Hague of NASA, top, Christina Koch of NASA, center, and Alexey Ovchinin of Roscosmos wave farewell prior to boarding the Soyuz MS-12 spacecraft for launch, Thursday, March 14, 2019 at the Baikonur Cosmodrome in Kazakhstan. Hague, Koch, and Ovchinin will spend six-and-a-half months living and working aboard the International Space Station. Photo Credit: (NASA/Bill Ingalls)

Expedition 58 Flight Engineer David Saint-Jacques of the Canadian Space Agency (CSA), top, Flight Engineer Anne McClain of NASA, center, and Soyuz Commander Oleg Kononenko of Roscosmos, bottom, wave farewell prior to boarding the Soyuz MS-11 spacecraft for launch, Monday, Dec. 3, 2018 in Baikonur, Kazakhstan. Kononenko. McClain, and Saint-Jacques will spend the next six and a half months onboard the International Space Station. Photo Credit: (NASA/Aubrey Gemignani)

Expedition 33/34 crew members, Soyuz Commander Oleg Novitskiy, bottom, Flight Engineer Kevin Ford of NASA, and Flight Engineer Evgeny Tarelkin of ROSCOSMOS, top, wave farewell before boarding their Soyuz rocket just a few hours before their launch to the International Space Station on Tuesday, October 23, 2012, in Baikonur, Kazakhstan. Launch of a Soyuz rocket later in the afternoon will send Ford, Novitskiy and Tarelkin on a five-month mission aboard the International Space Station. Photo Credit: (NASA/Bill Ingalls)