
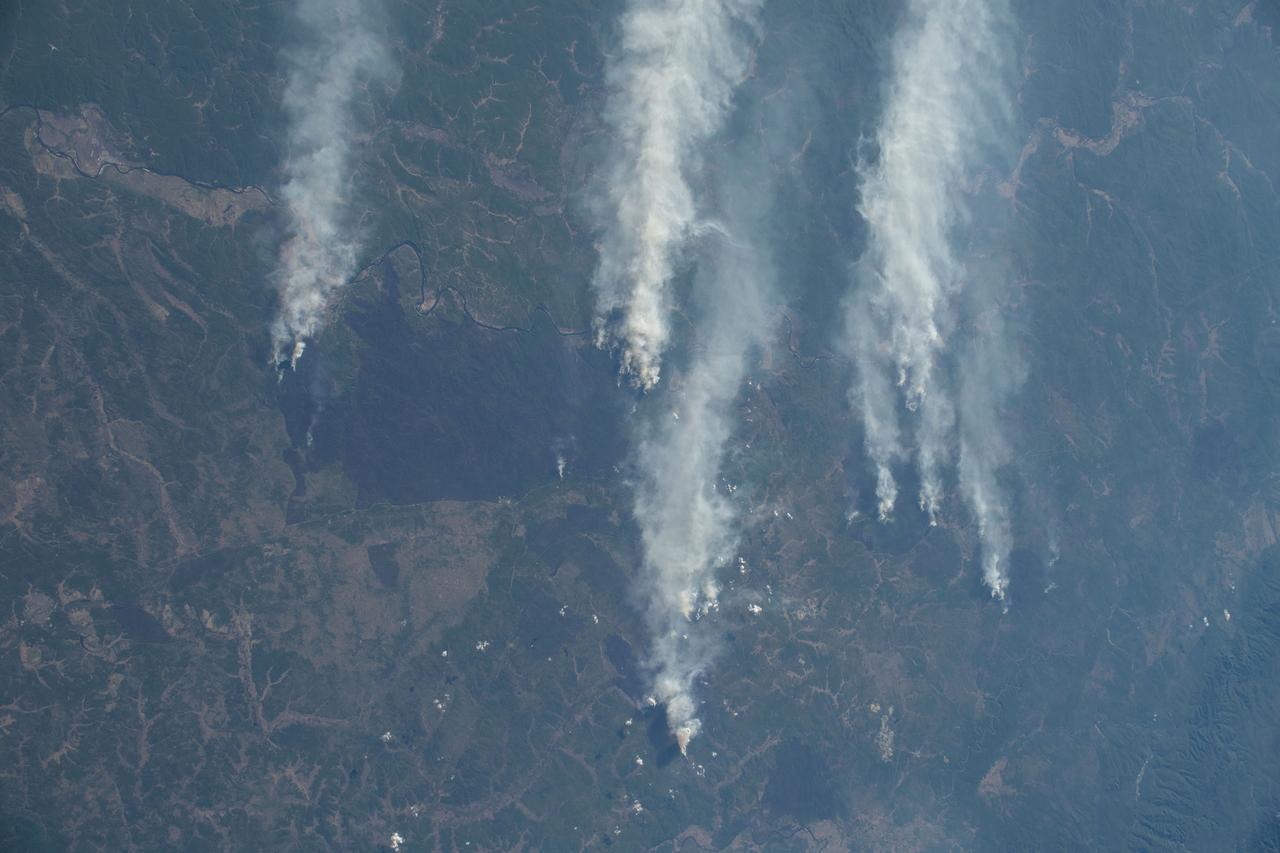
iss071e462173 (Aug. 8, 2024) --- Wildfires in northern California are pictured from the International Space Station as it orbited 261 miles above the Pacific Ocean off the coast of Washington's Olympic National Forest.
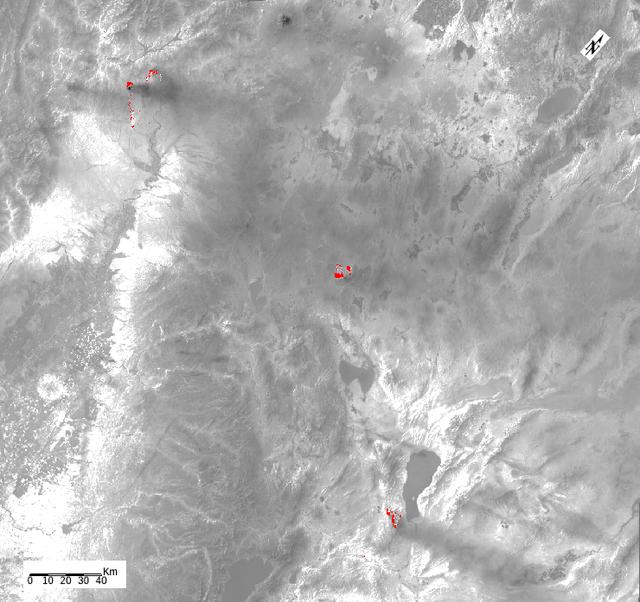
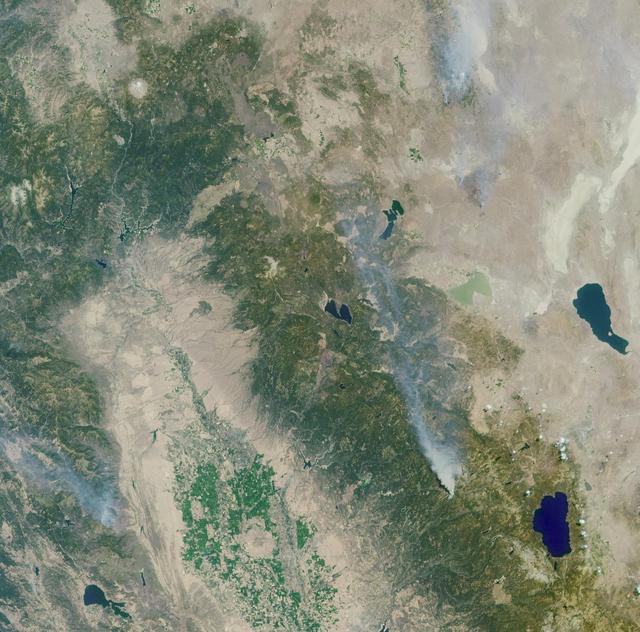
ECOSTRESS, NASA's new Earth-observing mission aboard the International Space Station, detected three wildfires burning in the western US on July 28, 2018 -- the Carr and Whaleback fires in California, and the Perry Fire in Nevada. The fires can be seen in red in Figures 1 and 2. Zooming in on the two larger fires shows the heat data in more detail and also reveals the fires' thick smoke plumes. ECOSTRESS launched on June 29 as part of a SpaceX commercial resupply mission to the space station. Its primary mission is to measure surface temperatures to detect plant health; however, it can also detect other heat-related phenomenon like heat waves, volcanoes and wildfires. This is the first image of wildfires acquired from ECOSTRESS. https://photojournal.jpl.nasa.gov/catalog/PIA22490

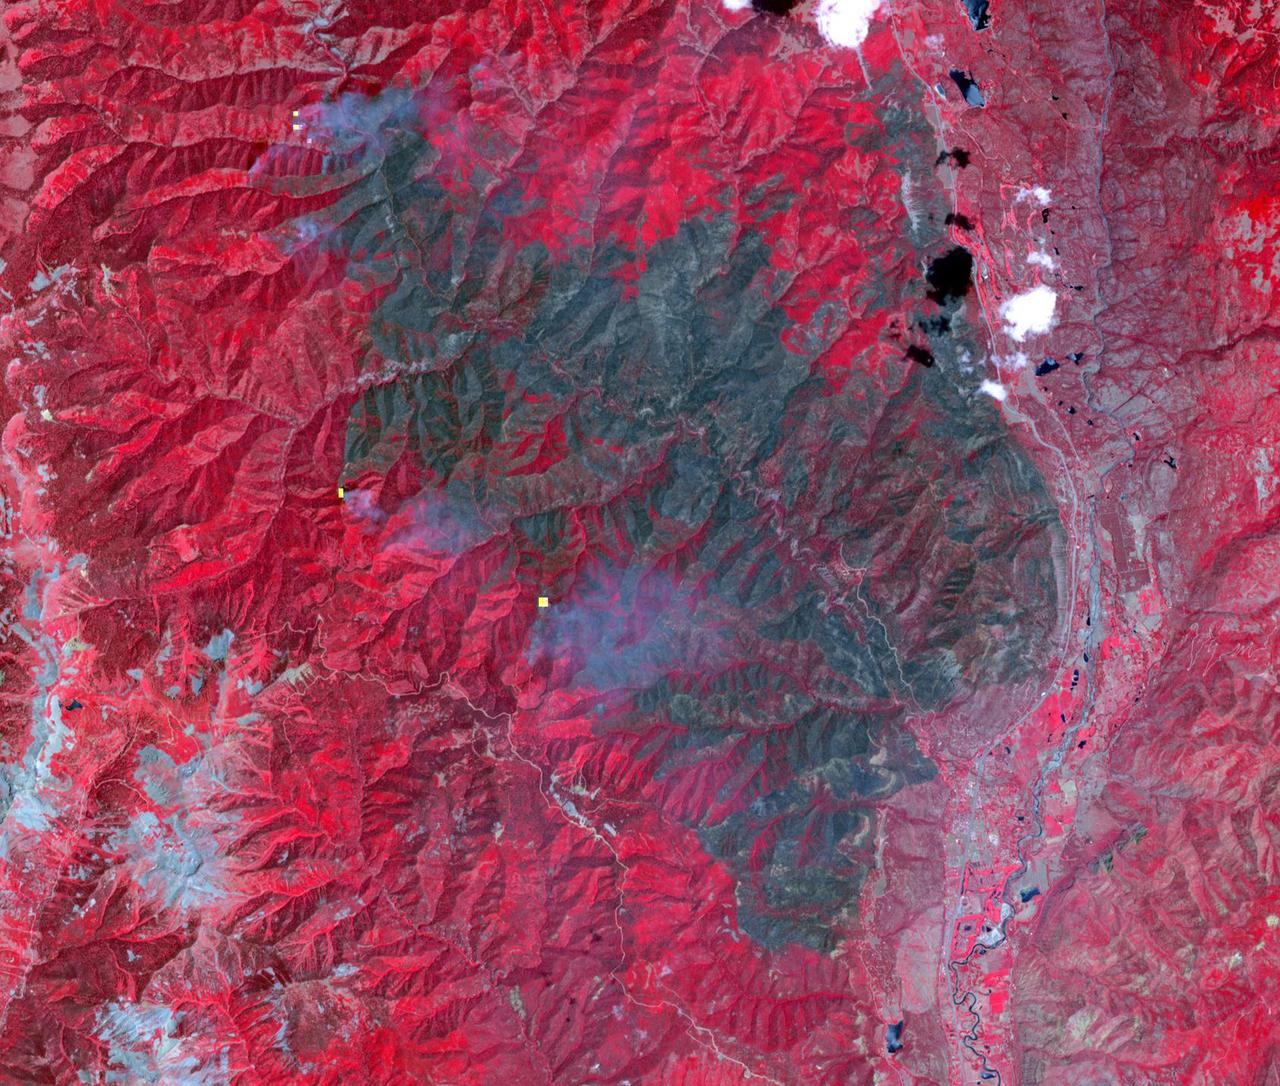
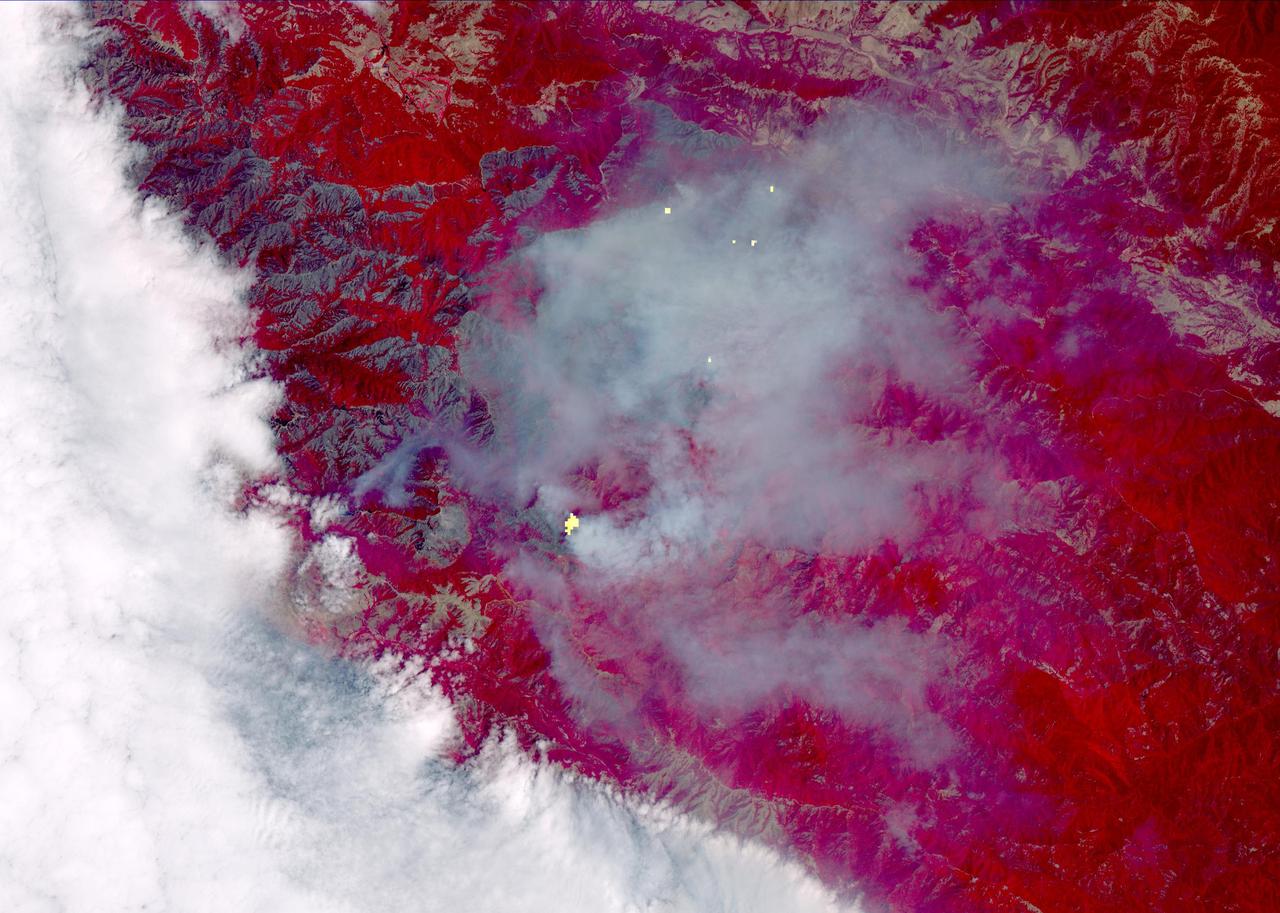
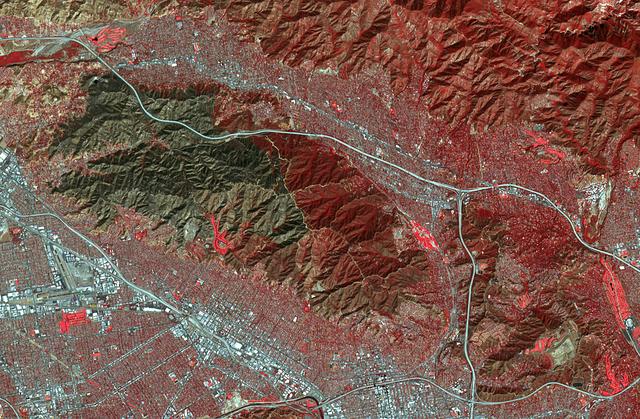
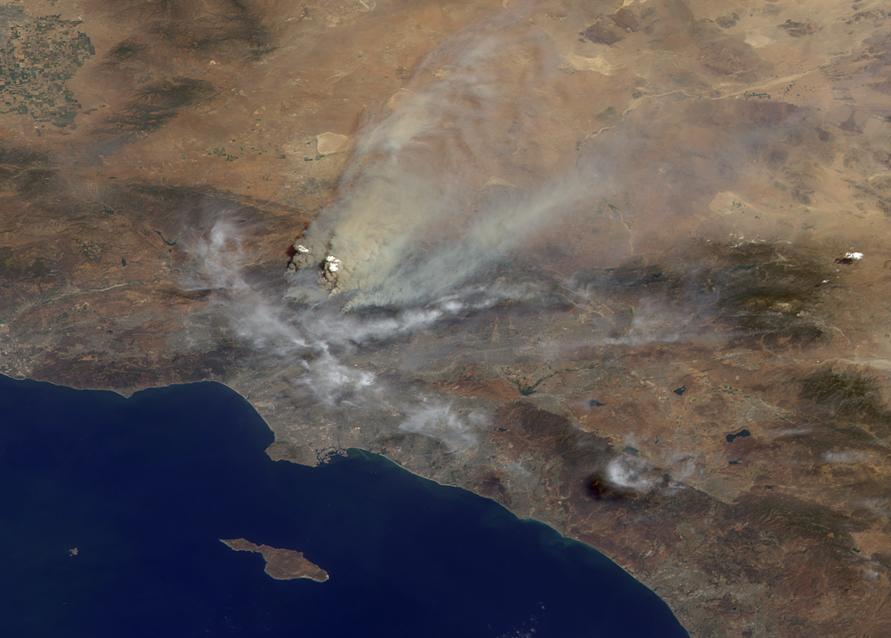
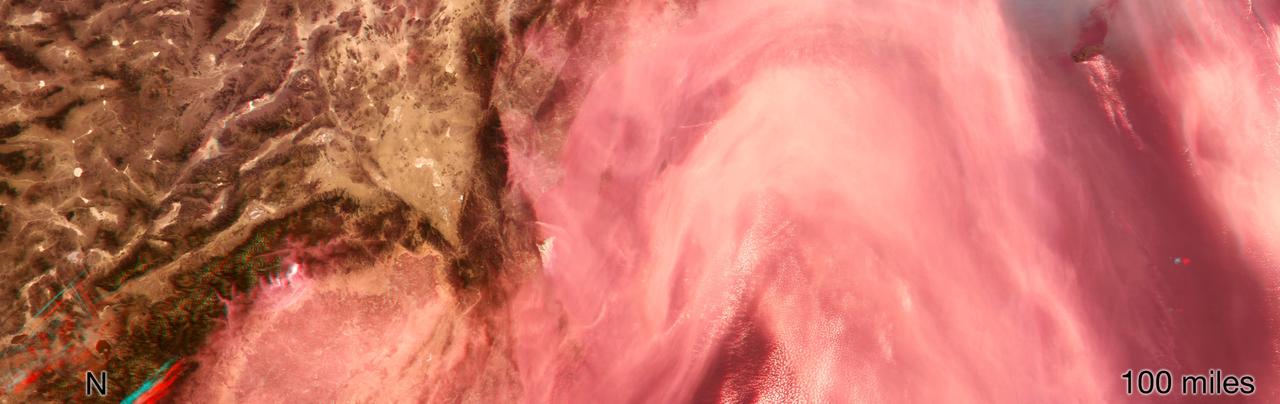
The Erskine wildfire, northeast of Bakersfield, California, is the state's largest to date in 2016. After starting on June 23, the fire has consumed 47,000 acres (19,020 hectares), destroyed more than 250 single residences, and is responsible for two fatalities. As of June 30, the fire was 70 percent contained; full containment was estimated by July 5. This image, obtained June 30 by the Advanced Spaceborne Thermal Emission and Reflection Radiometer (ASTER) instrument on NASA's Terra spacecraft, displays vegetation in red. The image covers an area of 19 by 21 miles (31 by 33 kilometers), and is located at 35.6 degrees north, 118.5 degrees west. http://photojournal.jpl.nasa.gov/catalog/PIA20741

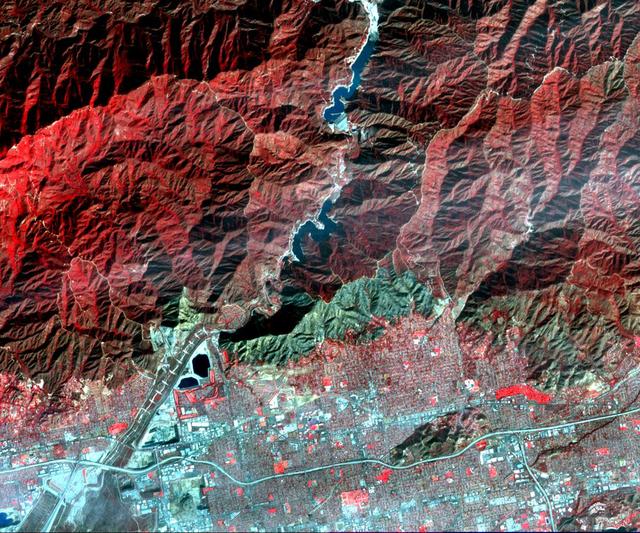
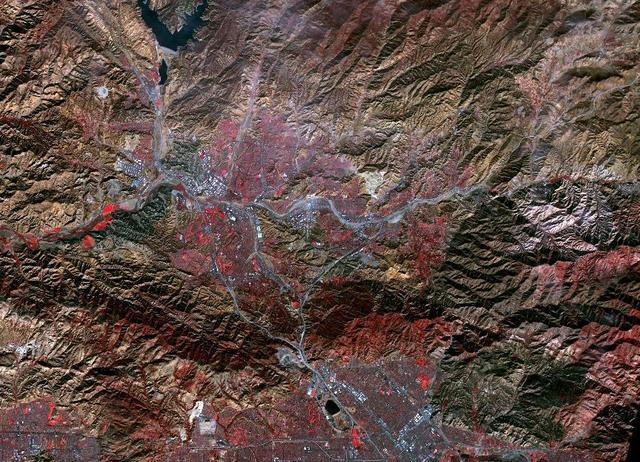
The Thomas Fire is the largest wildfire in California's recorded history. As of January 3, 2018, it was 93 percent contained after burning 282,000 acres and destroying 1,063 structures. The fire started Dec. 4, 2017, and quickly spread out of control, fanned by high temperatures and winds. At its peak, more than 8,500 firefighters mobilized to fight it. The Advanced Spaceborne Thermal Emission and Reflection Radiometer (ASTER) instrument on NASA's Terra satellite acquired this image on Dec. 26, 2017. It covers an area of 21 by 38 miles (33 by 61.8 kilometers), and is located at 34.5 degrees north, 119.3 degrees west. https://photojournal.jpl.nasa.gov/catalog/PIA22189
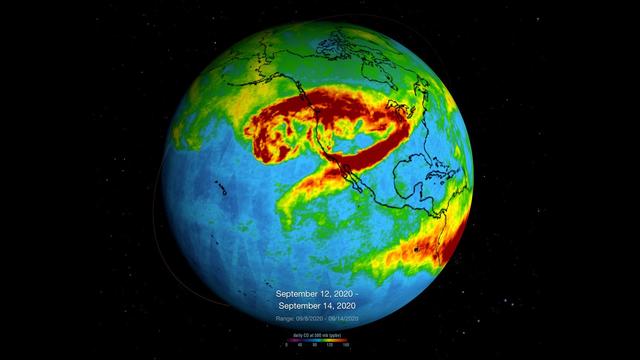
NASA's Atmospheric Infrared Sounder (AIRS), which is aboard the Aqua satellite, captured carbon monoxide plumes coming from California wildfires last week. There were 28 major wildfires burning across the state as of Sept. 14. This includes the August Complex Fire, which started on Aug. 17 and has since burned over 471,000 acres, making it the largest fire on record in California. The animation shows three-day averages of carbon monoxide concentrations around 3 miles (5 kilometers) up in the atmosphere between Sept. 6 and 14. The red and orange areas indicate regions with extremely high carbon monoxide concentrations of greater than 350 parts per billion by volume (ppbv). The more normal, background concentrations of carbon monoxide show up as yellow and green, with amounts between 30 and 50 ppbv. A pollutant that can travel large distances, carbon monoxide can persist in the atmosphere for about a month. At the high altitude mapped in these images, the gas has little effect on the air we breathe; however, strong winds can carry it downward to where it can significantly impact air quality. Carbon monoxide plays a role in both air pollution and climate change. The intense heat from the wildfires lofted the carbon monoxide high into the atmosphere, enabling detection by the AIRS instrument. The jet stream then blew the carbon monoxide plume eastward across the U.S. and over the Atlantic Ocean. Movie available at https://photojournal.jpl.nasa.gov/catalog/PIA23789

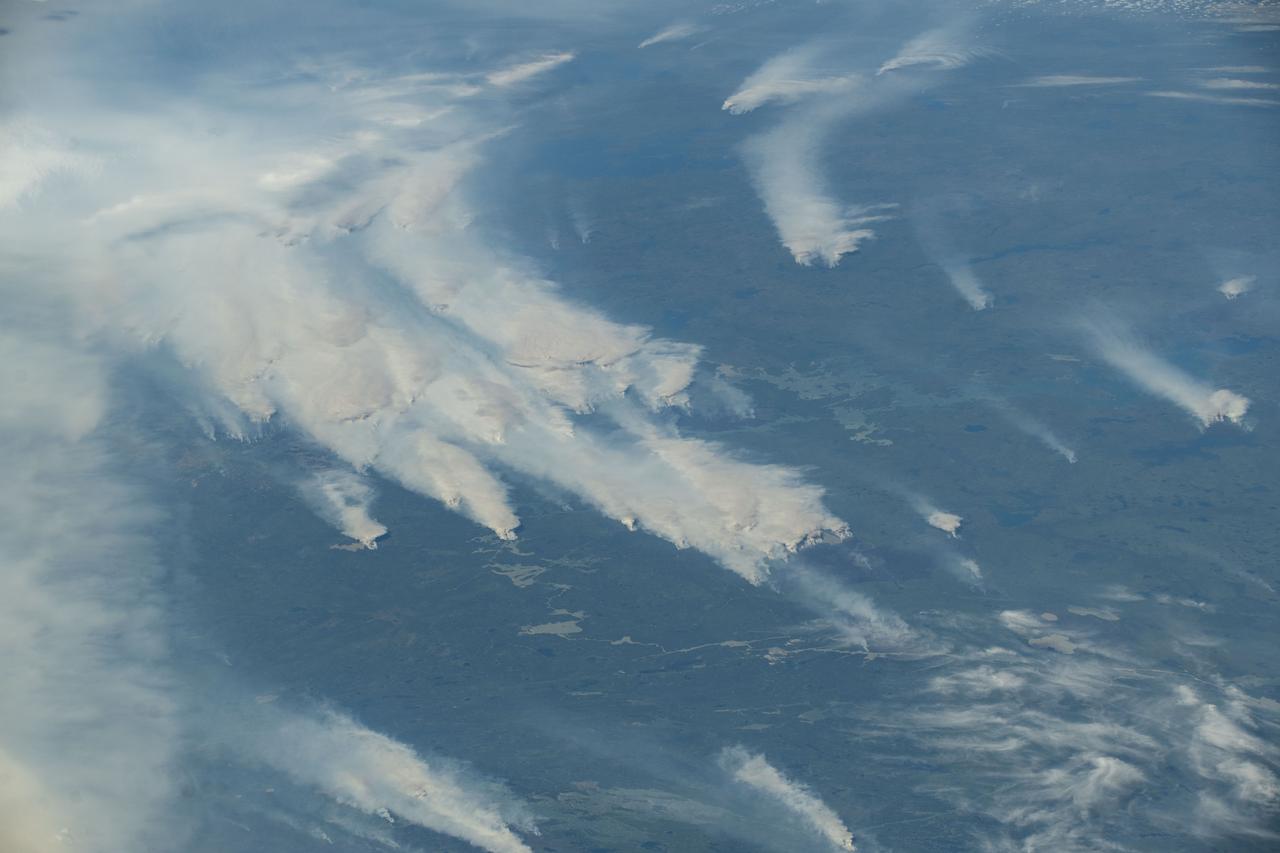
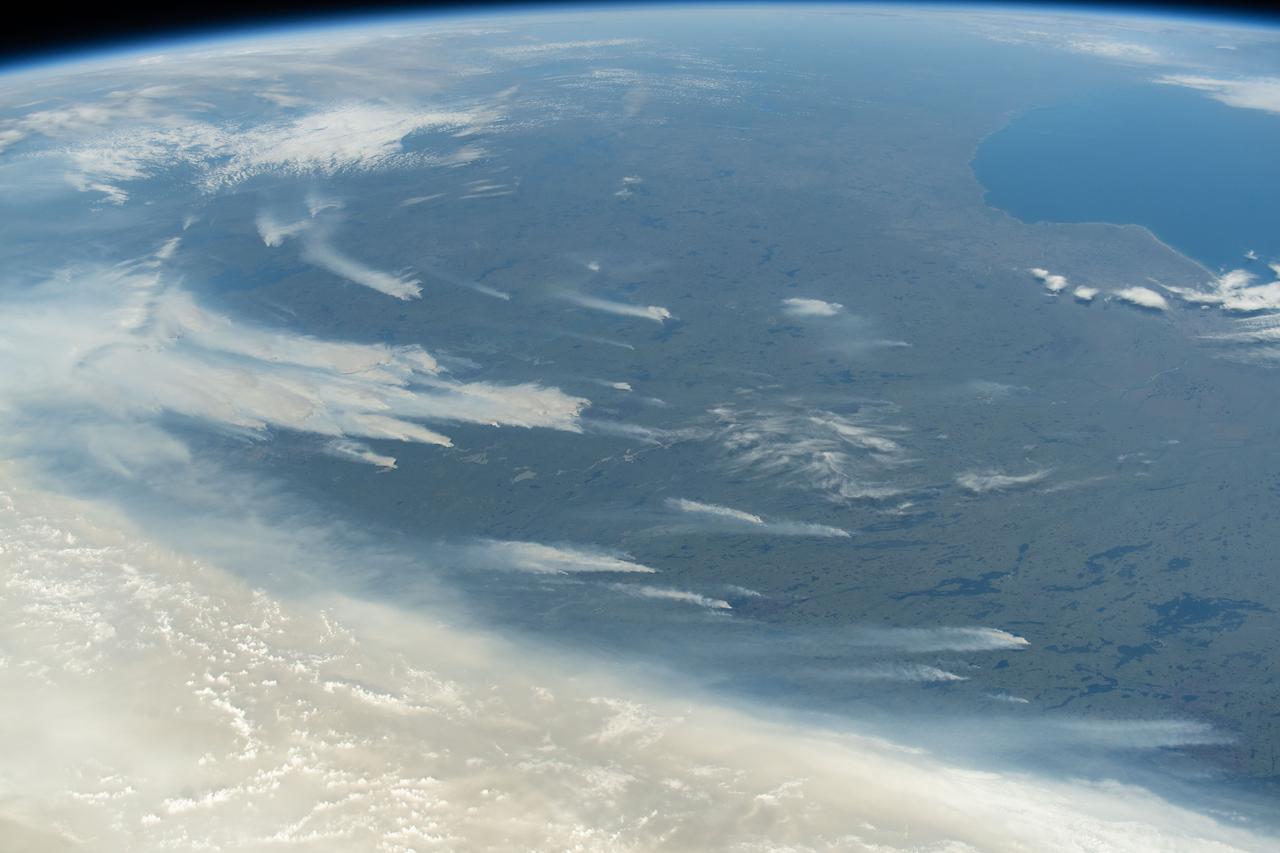
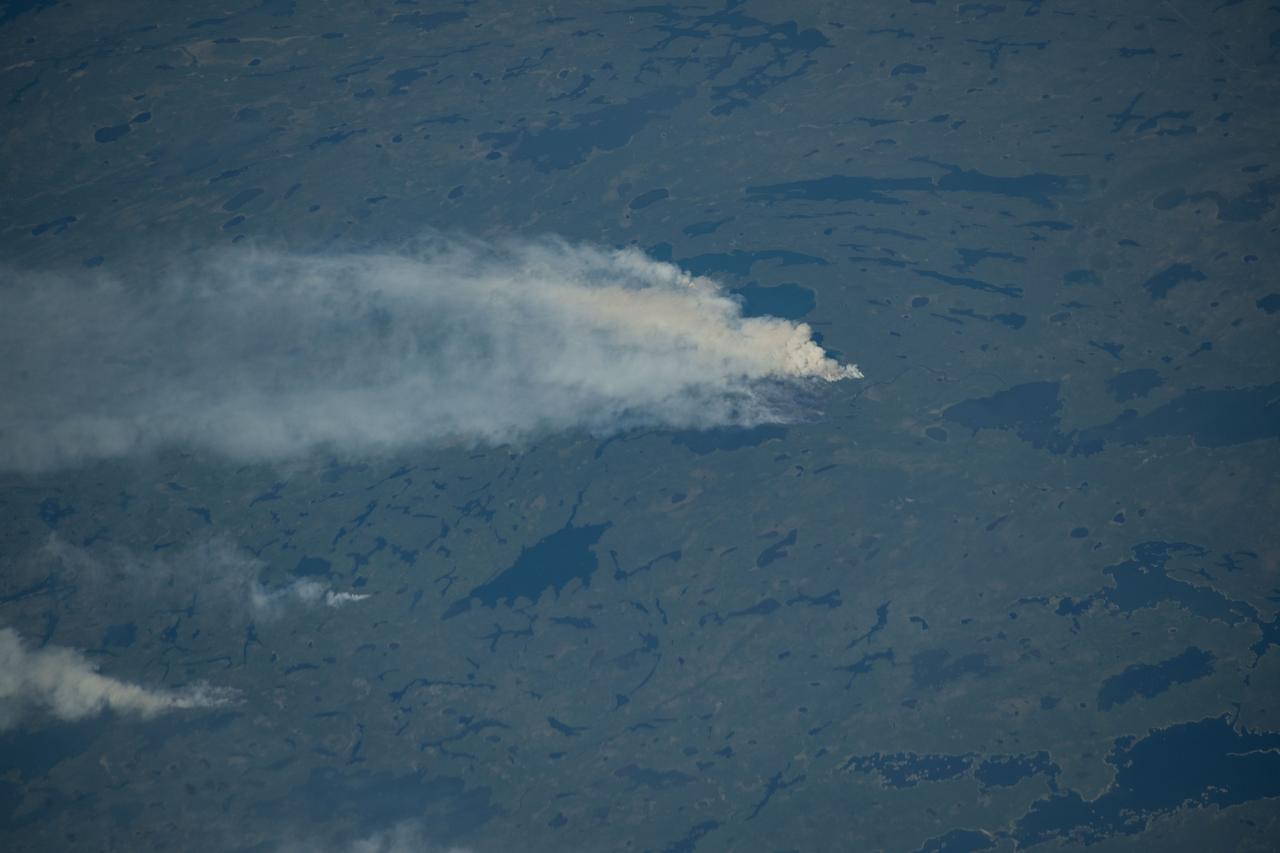
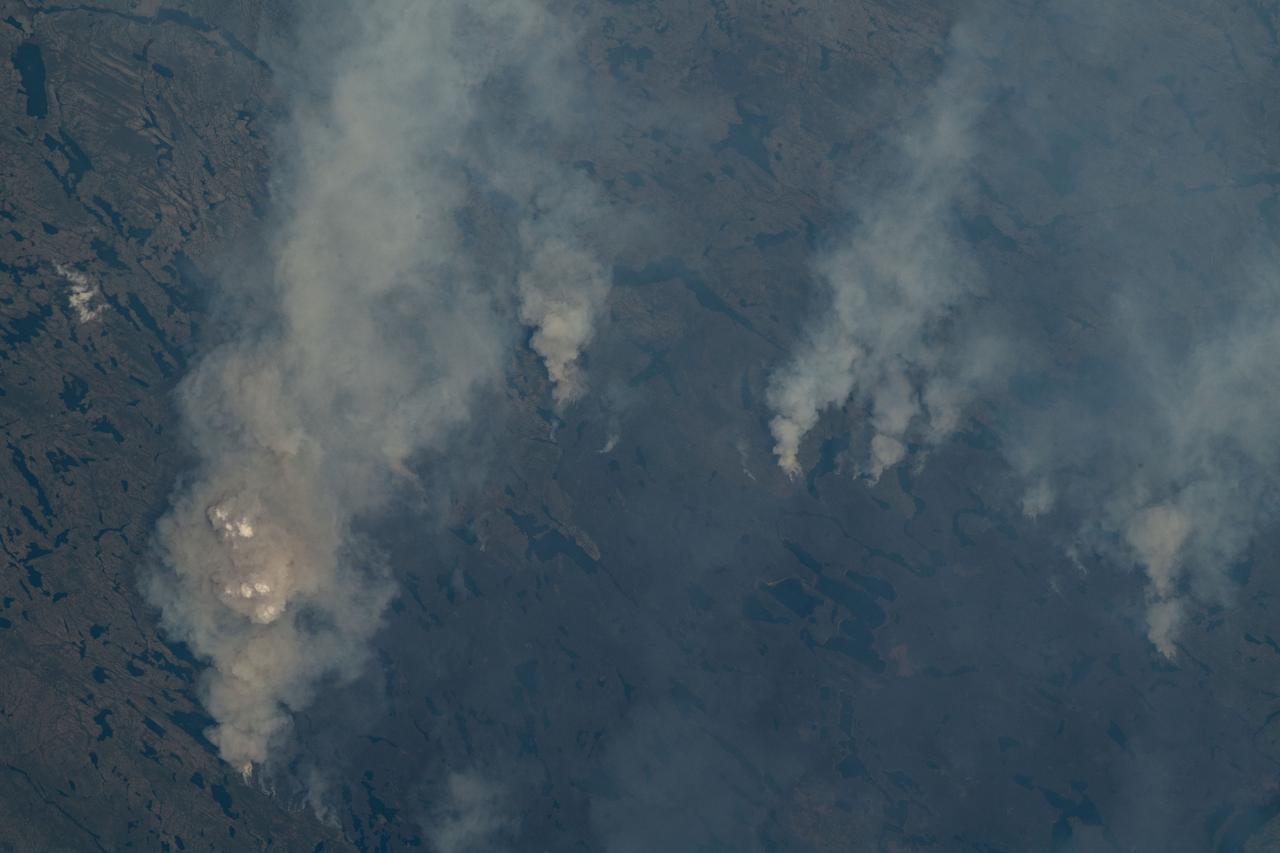
iss071e439719 (Aug. 6, 2024) --- A wildfire in Canada and its smoke spreading in the atmosphere are pictured from the Intenational Space Station as it orbited 263 miles above North Dakota.

iss071e439835 (Aug. 7, 2024) --- Wildfires just northwest of California's Eagle Lake and Honey Lake (far left) are pictured from the International Space Station as it orbited 260 miles above The Golden State.

iss071e439834 (Aug. 8, 2024) --- The Yangtze River beams in the Sun's glint as wildfires burn in the surrounding forestland near the city of Wuhan in China's province of Hubei. The International Space Station was orbiting 262 miles above the Asian nation at the time of this photograph.

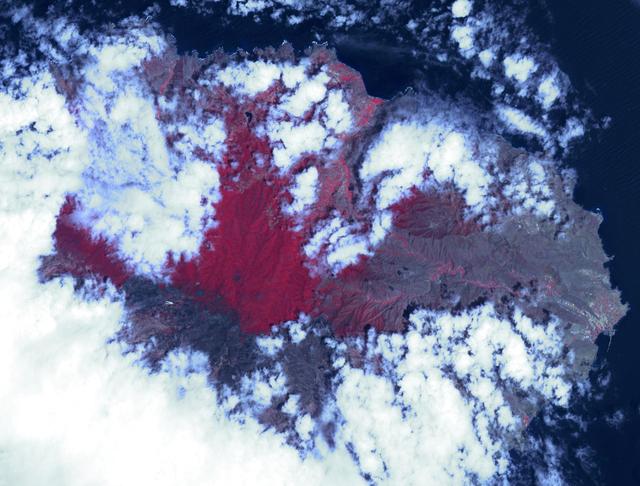
NASA Terra satellite passed directly over the island of Madeira on Wednesday, Aug. 10, 2016, where a wildfire spread to the capital city of Funchal.

Ignited by lightning strikes during a record-breaking heat wave, the Biscuit Fire became Oregon largest wildfire of the past century. NASA Terra spacecraft acquired these image between mid July and early September 2002.
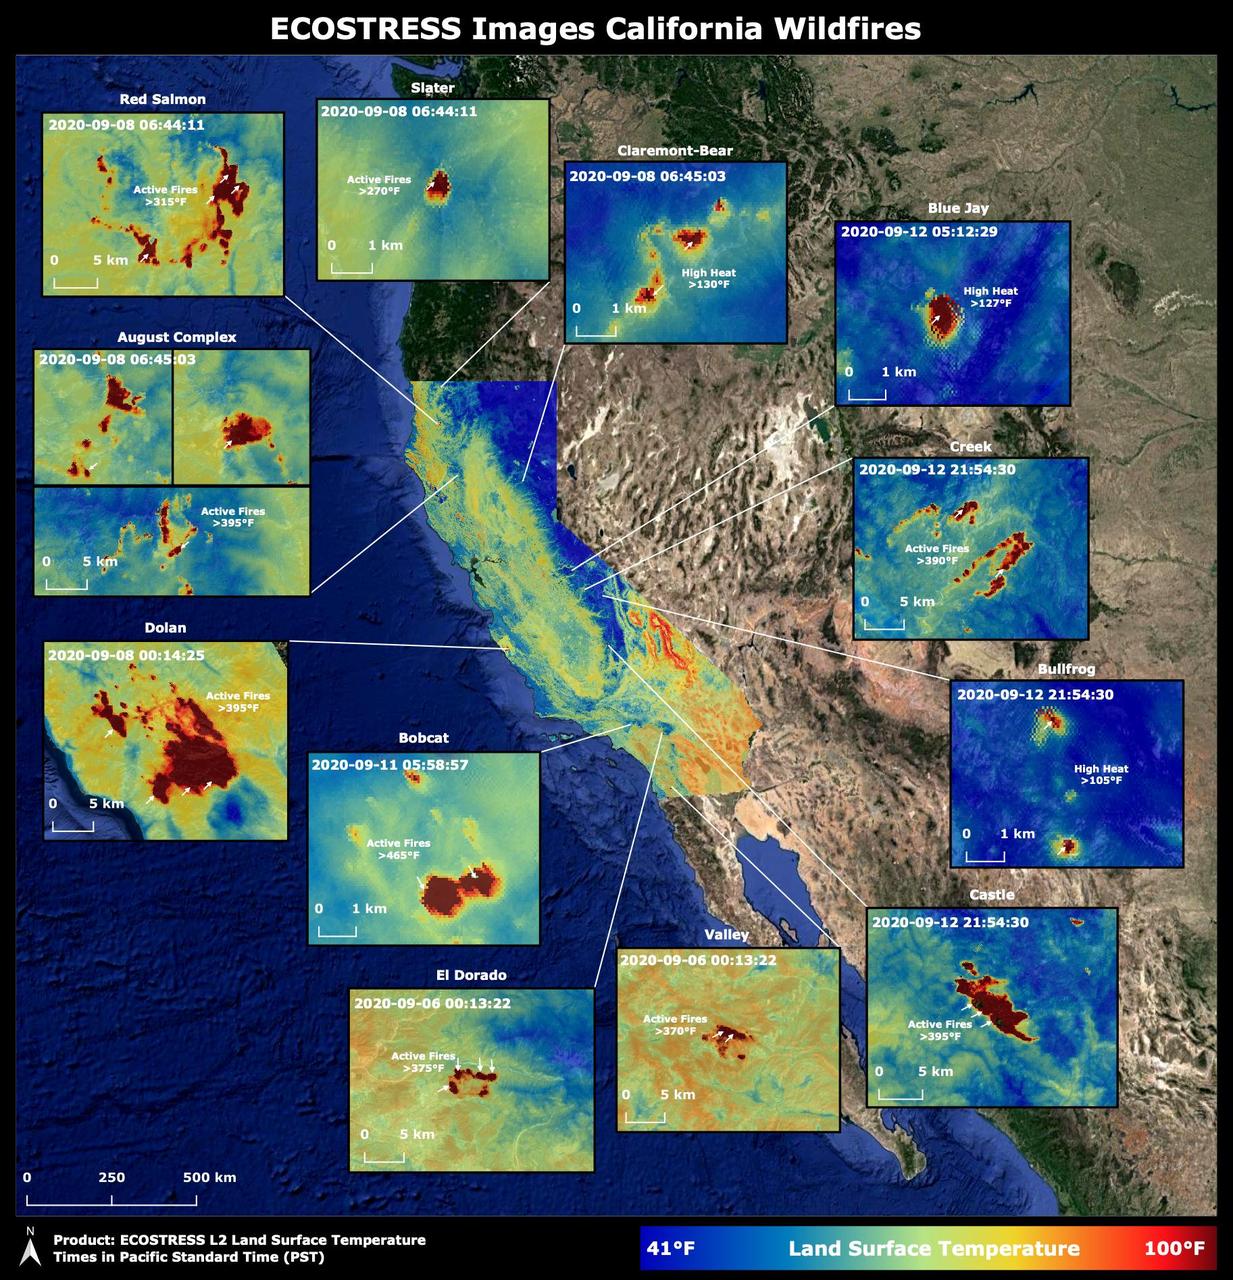
Throughout the month of September 2020, NASA's ECOsystem Spaceborne Thermal Radiometer Experiment on Space Station (ECOSTRESS) imaged multiple wildfires across the state of California. The image above shows the ECOSTRESS land surface temperature of California. Multiple insets highlight a fraction of the multiple fires that have impacted California, with effects seen throughout the U.S. and beyond. The dark red spots show areas of high heat, with arrows pointing out the active fires. The contiguous California image was stitched together from multiple evening (10 p.m.-6 a.m. PDT) ECOSTRESS images from Sept 6 to 12, 2020, to generate a cloud-free statewide map. NASA's Jet Propulsion Laboratory in Southern California built and manages the ECOSTRESS mission for the Earth Science Division in the Science Mission Directorate at NASA Headquarters in Washington. ECOSTRESS is an Earth Venture Instrument mission; the program is managed by NASA's Earth System Science Pathfinder program at NASA's Langley Research Center in Hampton, Virginia. Future studies could use ECOSTRESS data products in a similar fashion as LST was used to assess the fires pictured above. https://photojournal.jpl.nasa.gov/catalog/PIA23721

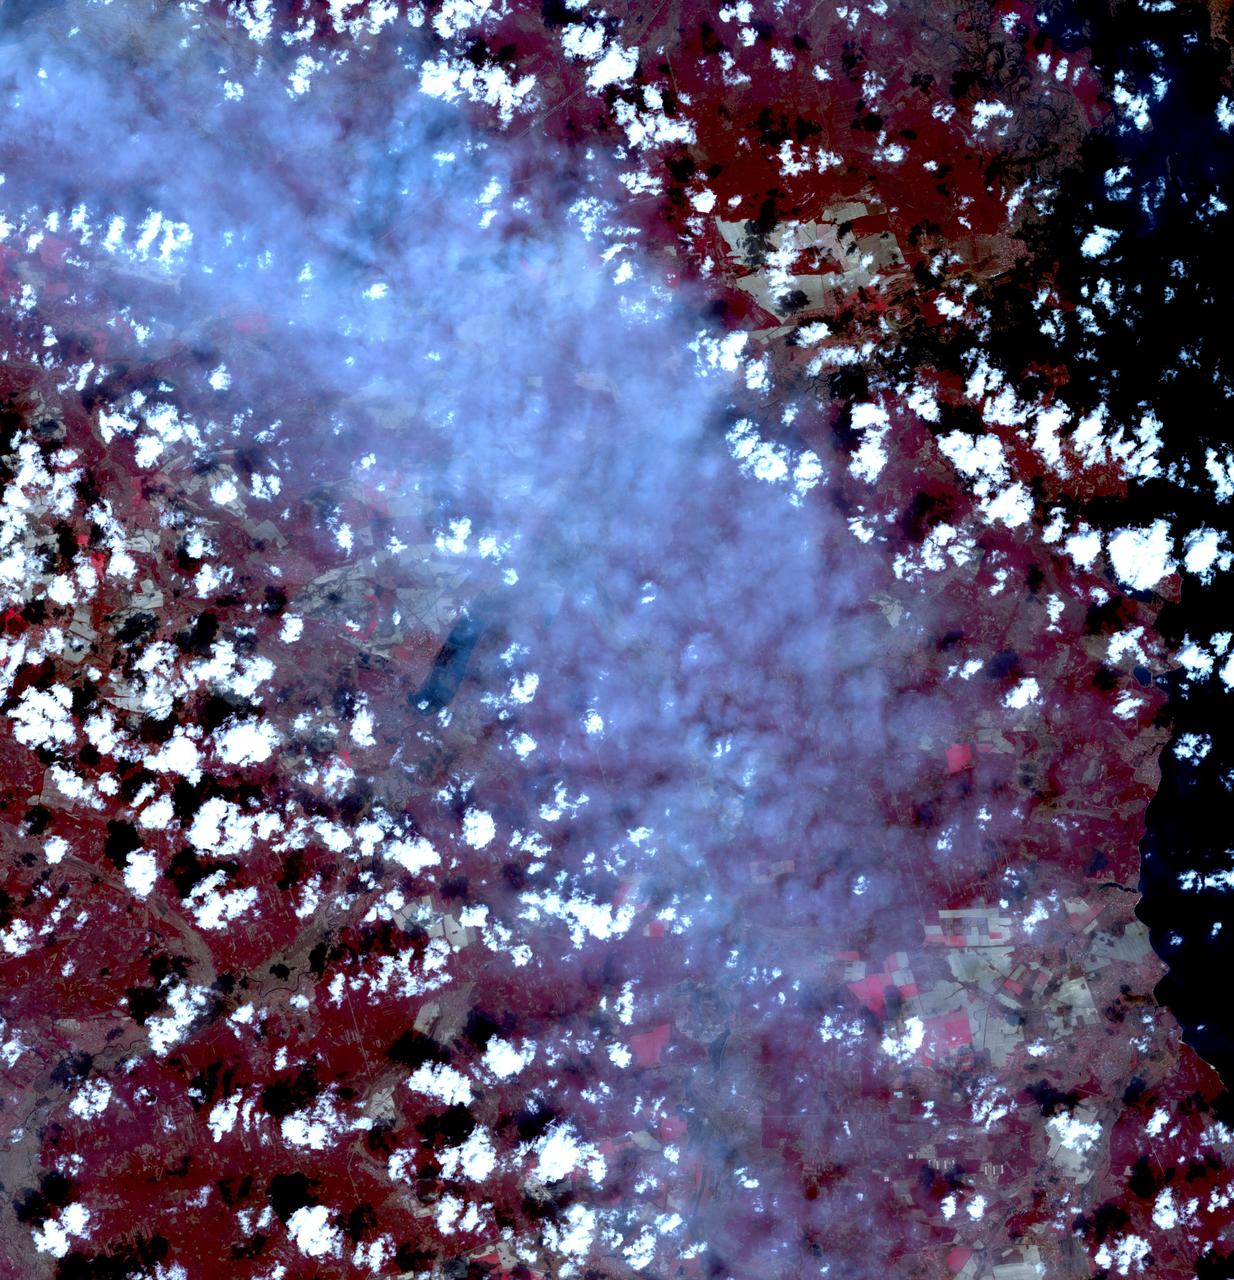
Canada has already had its share of wildfires this season, and the smoke from these wildfires is slowly drifting south over the United States' Midwest. The drifting smoke can be seen in this Terra satellite image over Lake Michigan, as well as parts of Minnesota, Wisconsin, Indiana and Ohio. The smoke released by any type of fire (forest, brush, crop, structure, tires, waste or wood burning) is a mixture of particles and chemicals produced by incomplete burning of carbon-containing materials. All smoke contains carbon monoxide, carbon dioxide and particulate matter (PM or soot). Smoke can contain many different chemicals, including aldehydes, acid gases, sulfur dioxide, nitrogen oxides, polycyclic aromatic hydrocarbons (PAHs), benzene, toluene, styrene, metals and dioxins. The type and amount of particles and chemicals in smoke varies depending on what is burning, how much oxygen is available, and the burn temperature. Exposure to any type of smoke should be avoided if possible, but especially by those with respiratory issues, the elderly, and children. This natural-color satellite image was collected by the Moderate Resolution Imaging Spectroradiometer (MODIS) aboard the Terra satellite on June 09, 2015. Credit: NASA image courtesy Jeff Schmaltz, MODIS Rapid Response Team <b><a href="http://www.nasa.gov/audience/formedia/features/MP_Photo_Guidelines.html" rel="nofollow">NASA image use policy.</a></b> <b><a href="http://www.nasa.gov/centers/goddard/home/index.html" rel="nofollow">NASA Goddard Space Flight Center</a></b> enables NASA’s mission through four scientific endeavors: Earth Science, Heliophysics, Solar System Exploration, and Astrophysics. Goddard plays a leading role in NASA’s accomplishments by contributing compelling scientific knowledge to advance the Agency’s mission. <b>Follow us on <a href="http://twitter.com/NASAGoddardPix" rel="nofollow">Twitter</a></b> <b>Like us on <a href="http://www.facebook.com/pages/Greenbelt-MD/NASA-Goddard/395013845897?ref=tsd" rel="nofollow">Facebook</a></b> <b>Find us on <a href="http://instagrid.me/nasagoddard/?vm=grid" rel="nofollow">Instagram</a></b>

Data from NASA's ECOSTRESS (Ecosystem Spaceborne Thermal Radiometer Experiment on Space Station) instrument aboard the International Space Station shows three wildfires burning in the mountains east and southeast of the Los Angeles area on Sept. 10, 2024. The Bridge Fire started Sept. 8 in the Angeles National Forest during an intense heat wave that blanketed the area for about a week. As of Sept. 13, the fire was only 3% contained. The Line Fire started Sept. 5 in Highland, within San Bernardino County, and spread toward the mountain communities of Running Springs and Big Bear. After more than a week of battling the blaze, firefighters had the conflagration 21% contained. The Airport Fire ignited Sept. 9 in the foothills of the Santa Ana Mountains east of the Orange County city of Irvine and spread into Riverside County. As of Sept. 13, it was 8% contained. The ECOSTRESS instrument measures the temperature of the land rather than air temperatures that most people are familiar with in weather forecasts. Bright white spots in the active fire areas in the visual above indicate a land surface temperature of over 300 degrees Fahrenheit (149 degrees Celsius). Dark red represents areas closer to 100 F (38 C). https://photojournal.jpl.nasa.gov/catalog/PIA26187
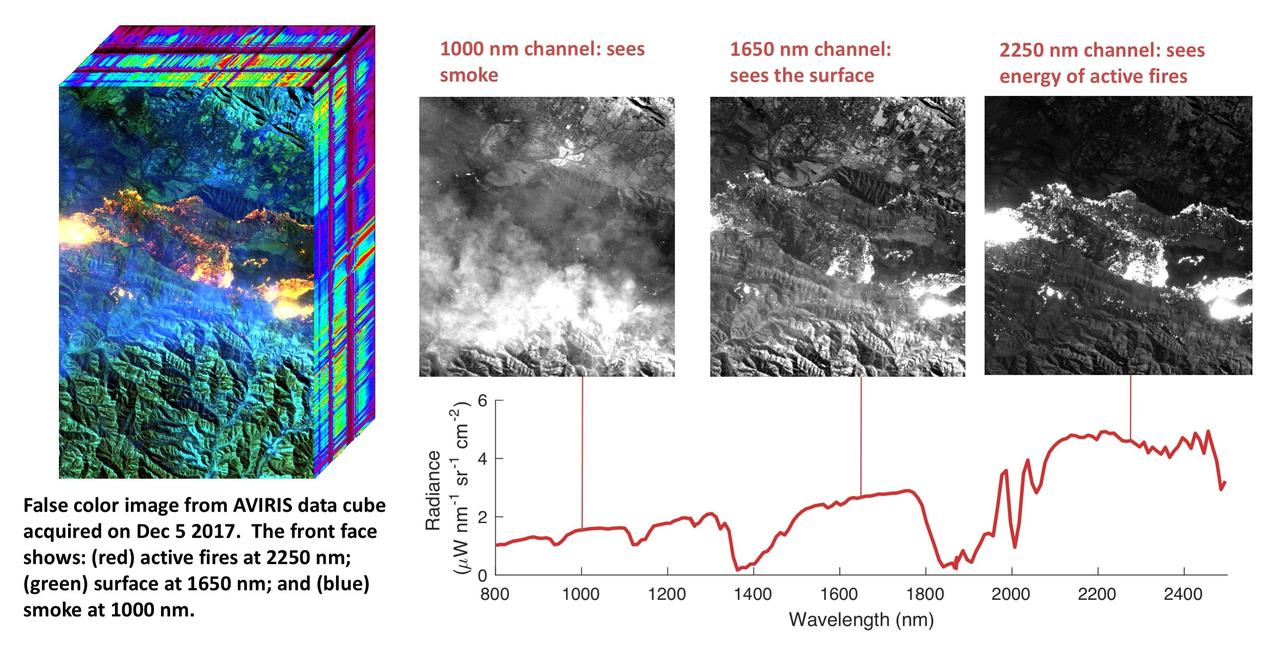
NASA's Airborne Visible Infrared Imaging Spectrometer instrument (AVIRIS), flying aboard a NASA Armstrong Flight Research Center high-altitude ER-2 aircraft, flew over the wildfires burning in Southern California on Dec. 5, 2017 and acquired this false-color image. Active fires are visible in red, ground surfaces are in green and smoke is in blue. AVIRIS is an imaging spectrometer that observes light in visible and infrared wavelengths, measuring the full spectrum of radiated energy. Unlike regular cameras with three colors, AVIRIS has 224 spectral channels from the visible through the shortwave infrared. This permits mapping of fire temperatures, fractional coverage, and surface properties, including how much fuel is available for a fire. Spectroscopy is also valuable for characterizing forest drought conditions and health to assess fire risk. AVIRIS has been observing fire-prone areas in Southern California for many years, forming a growing time series of before/after data cubes. These data are helping improve scientific understanding of fire risk and how ecosystems respond to drought and fire. https://photojournal.jpl.nasa.gov/catalog/PIA11243

Large plumes of smoke rising from devastating wildfires burning near Los Angeles and San Diego on Sunday, October 26, 2003, are highlighted in this set of images from NASA Terra spacecraft.
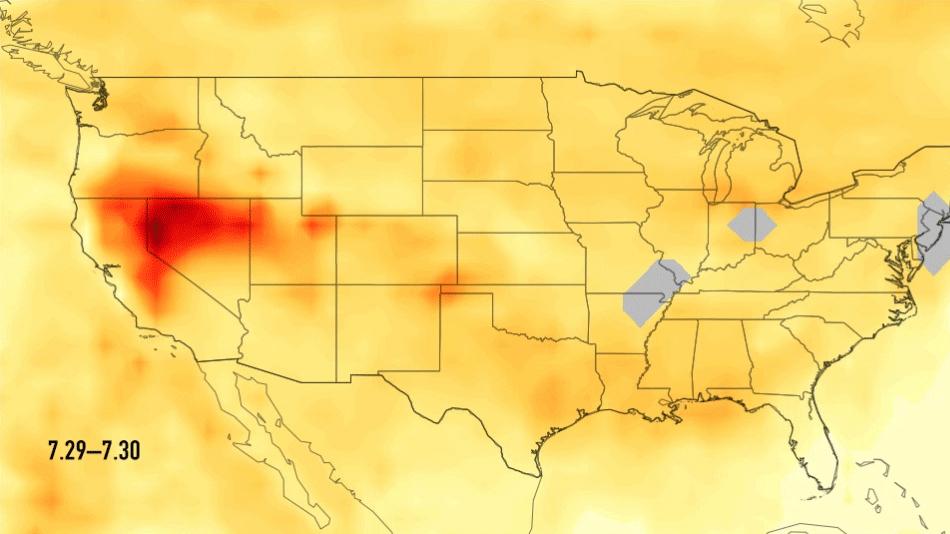
This single frame from a series of images shows carbon monoxide (in orange/red) from California's massive wildfires drifting east across the U.S. between July 30 and August 7, 2018. It was produced using data from the Atmospheric Infrared Sounder (AIRS) on NASA's Aqua satellite. AIRS measures concentrations of carbon monoxide that have been lofted high into the atmosphere. These images show the carbon monoxide at a 500 hPa pressure level, or an altitude of approximately 18,000 feet (5,500 meters). As the time series progresses, we see that this carbon monoxide is drifting east with one branch moving toward Texas and the other forking to the northeast. The high end of the scale is set to 200 parts per billion by volume (ppbv); however, local values can be significantly higher. Carbon monoxide is a pollutant that can persist in the atmosphere for about one month and can be transported large distances. It plays a role in both air pollution and climate change. An animation and single frames are available at https://photojournal.jpl.nasa.gov/catalog/PIA22492

NASA's Airborne Visible Infrared Imaging Spectrometer instrument (AVIRIS), flying aboard a NASA Armstrong Flight Research Center high-altitude ER-2 aircraft, observed wildfires burning in Southern California on Dec. 5-7, 2017. AVIRIS is an imaging spectrometer that observes light in visible and infrared wavelengths, measuring the full spectrum of radiated energy. Unlike regular cameras with three colors, AVIRIS has 224 spectral channels, measuring contiguously from the visible through the shortwave infrared. Data from these flights, compared against measurements acquired earlier in the year, show many ways this one instrument can improve both our understanding of fire risk and the response to fires in progress. The top row in this image compilation shows pre-fire data acquired from June 2017. At top left is a visible-wavelength image similar to what our own eyes would see. The top middle image is a map of surface composition based on analyzing the full electromagnetic spectrum, revealing green vegetated areas and non-photosynthetic vegetation that is potential fuel as well as non-vegetated surfaces that may slow an advancing fire. The image at top right is a remote measurement of the water in tree canopies, a proxy for how much moisture is in the vegetation. The bottom row in the compilation shows data acquired from the Thomas fire in progress in December 2017. At bottom left is a visible wavelength image. The bottom middle image is an infrared image, with red at 2,250 nanometers showing fire energy, green at 1,650 nanometers showing the surface through the smoke, and blue at 1,000 nanometers showing the smoke itself. The image at bottom right is a fire temperature map using spectroscopic analysis to measure fire thermal emission recorded in the AVIRIS spectra. https://photojournal.jpl.nasa.gov/catalog/PIA22194

NASA's Aqua satellite captured this image of the clouds over Canada. Entwined within the clouds is the smoke billowing up from the wildfires that are currently burning across a large expanse of the country. The smoke has become entrained within the clouds causing it to twist within the circular motion of the clouds and wind. This image was taken by the Moderate Resolution Imaging Spectroradiometer (MODIS) instrument on the Aqua satellite on May 9, 2016. Image Credit: NASA image courtesy Jeff Schmaltz LANCE/EOSDIS MODIS Rapid Response Team, GSFC <b><a href="http://www.nasa.gov/audience/formedia/features/MP_Photo_Guidelines.html" rel="nofollow">NASA image use policy.</a></b> <b><a href="http://www.nasa.gov/centers/goddard/home/index.html" rel="nofollow">NASA Goddard Space Flight Center</a></b> enables NASA’s mission through four scientific endeavors: Earth Science, Heliophysics, Solar System Exploration, and Astrophysics. Goddard plays a leading role in NASA’s accomplishments by contributing compelling scientific knowledge to advance the Agency’s mission. <b>Follow us on <a href="http://twitter.com/NASAGoddardPix" rel="nofollow">Twitter</a></b> <b>Like us on <a href="http://www.facebook.com/pages/Greenbelt-MD/NASA-Goddard/395013845897?ref=tsd" rel="nofollow">Facebook</a></b> <b>Find us on <a href="http://instagrid.me/nasagoddard/?vm=grid" rel="nofollow">Instagram</a></b>
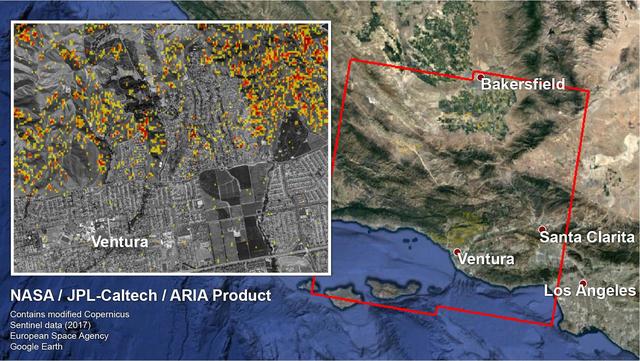
The Advanced Rapid Imaging and Analysis (ARIA) team at NASA's Jet Propulsion Laboratory in Pasadena, California, and Caltech, also in Pasadena, created a Damage Proxy Map (DPM) depicting areas in Southern California that are likely damaged (shown by red and yellow pixels) as a result of recent wildfires, including the Thomas Fire in Ventura and Santa Barbara Counties, highlighted in the attached image taken from the DPM. The map is derived from synthetic aperture radar (SAR) images from the Copernicus Sentinel-1 satellites, operated by the European Space Agency (ESA). The images were taken before (Nov. 28, 2017, 6 a.m. PST) and after (Dec. 10, 2017, 6 a.m. PST) the onset of the fires. The map covers an area of 107 by 107 miles (172 by 172 kilometers), shown by the large red polygon. Each pixel measures about 33 yards (30 meters) across. The color variation from yellow to red indicates increasingly more significant ground surface change. Preliminary validation was done by comparing the map to optical satellite imagery from DigitalGlobe. This damage proxy map should be used as guidance to identify damaged areas, and may be less reliable over vegetated areas. For example, the colored pixels seen over mountainous areas may seem a little scattered even though the reality could be that the contiguous areas were burned. Patches of farmland can also appear as signals due to plowing or irrigation. The full map is available to download from https://aria-share.jpl.nasa.gov/events/20171210-SoCal_Fire/. https://photojournal.jpl.nasa.gov/catalog/PIA22191

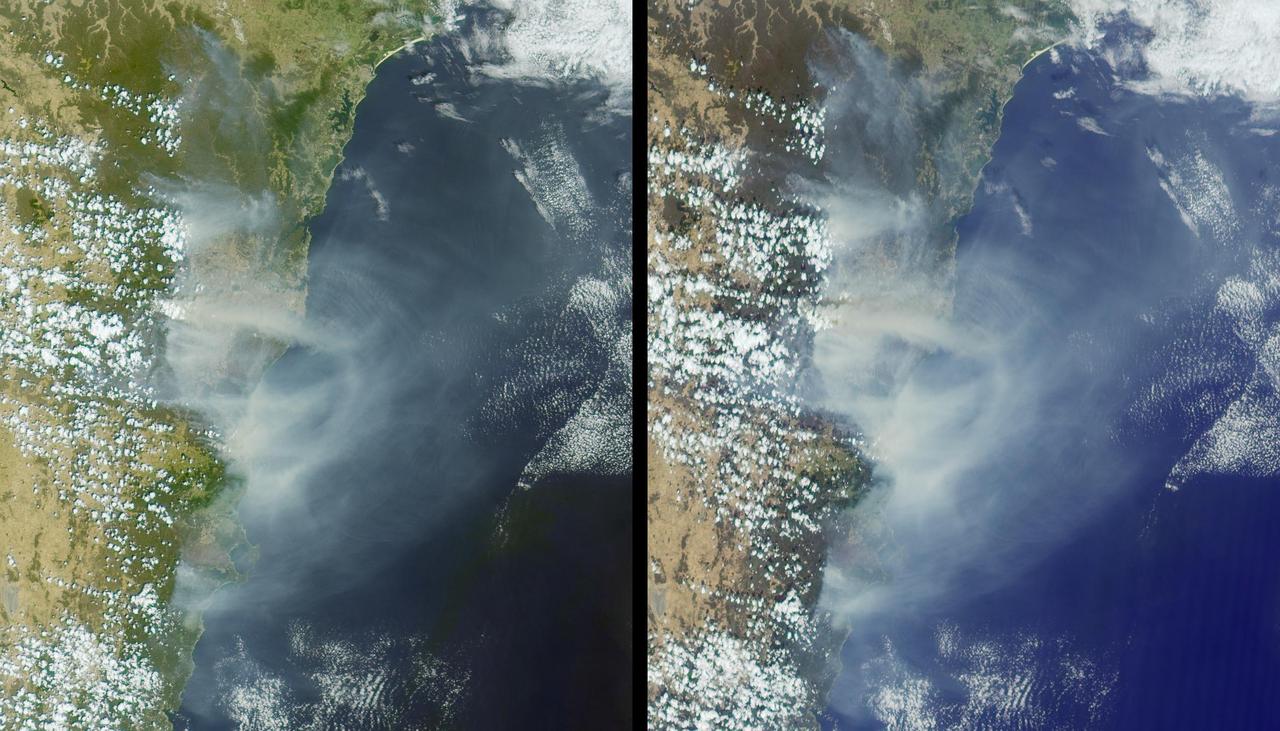
This image, acquired by NASA Terra spacecraft, shows the Cordoba province of northern Argentina, struck by wildfires caused by high temperatures and strong winds.
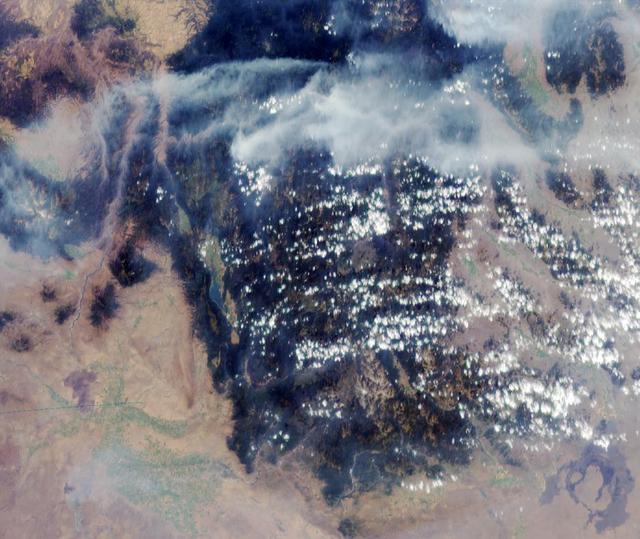
These images from NASA Terra satellite are of smoke plumes from devastating wildfires in the northwestern U.S. This view of the Clearwater and Salmon River Mountains in Idaho was acquired on August 5, 2000 Terra orbit 3370.
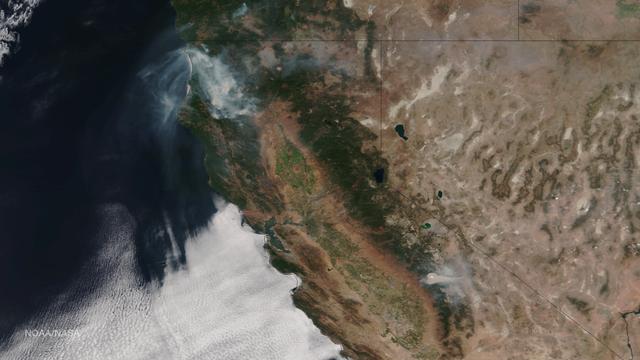
Very hot, dry and unstable conditions in California and across the Pacific Northwest add to the challenges facing firefighters as they battle blazes around the region. Cal Fire is urging Californians to be extremely cautious, especially for the next few days, as the current conditions increase the dangers authorities face. This image was taken by NASA-NOAA's Suomi NPP satellite's VIIRS instrument around 2145 UTC (5:45 p.m. EDT) on August 17, 2015. Northern California is seeing smoke from the River Complex, Route Complex, South Complex, Fork Complex and Mad River Complex fires combine over a large area of the Shasta-Trinity National Forest west of Redding, California, while the Rough Fire in Fresno County is spreading toward the Black Rock Reservoir, causing evacuations and road closures. Fires across the Pacific Northwest aren't limited to California. Please see the Suomi NPP VIIRS composites in NOAA View to see the growth and extent of fires over the past weeks. Credit: NASA/NOAA via <b><a href="www.nnvl.noaa.gov/" rel="nofollow"> NOAA Environmental Visualization Laboratory</a></b>
The Multi-angle Imaging SpectroRadiometer (MISR) instrument on NASA's Terra satellite took these images of the Carr Fire (left) and the Ferguson Fire (right) on July 27 and July 29, respectively. The Carr Fire, which has been burning near Redding, California since July 23, spanned 110,154 acres as of July 31 and was 27 percent contained. The Ferguson Fire, near Yosemite National Park, spanned 57,846 acres as of July 31 and was 33 percent contained. More info is available at https://photojournal.jpl.nasa.gov/catalog/PIA22488
The blue dots in this field of galaxies, known as the COSMOS field, show galaxies that contain supermassive black holes emitting high-energy X-rays. The black holes were detected by NASA's Nuclear Spectroscopic Array, or NuSTAR, which spotted 32 such black holes in this field and has observed hundreds across the whole sky so far. The other colored dots are galaxies that host black holes emitting lower-energy X-rays, and were spotted by NASA's Chandra X-ray Observatory. Chandra data show X-rays with energies between 0.5 to 7 kiloelectron volts, while NuSTAR data show X-rays between 8 to 24 kiloelectron volts. http://photojournal.jpl.nasa.gov/catalog/PIA20865

NASA’s Aqua satellite captured a large area of smoke from the Long Valley Wildfire that was affecting Yosemite National Park. This natural-color satellite image was collected by the Moderate Resolution Imaging Spectroradiometer instrument that flies aboard the Aqua satellite. The image, taken July 20, showed actively burning areas in red, as detected by MODIS’s thermal bands. According to Inciweb, an interagency all-risk incident information management system that coordinates with federal, state and local agencies to manage wildfires, the fire started on Tuesday July 11, 2017. It is located about two miles north of Doyle, California and about 50 miles north of Reno, Nevada. As of July 21 the fire covered 83,733 acres and was 91 percent contained. NASA image courtesy NASA MODIS Rapid Response Team <b><a href="http://www.nasa.gov/audience/formedia/features/MP_Photo_Guidelines.html" rel="nofollow">NASA image use policy.</a></b> <b><a href="http://www.nasa.gov/centers/goddard/home/index.html" rel="nofollow">NASA Goddard Space Flight Center</a></b> enables NASA’s mission through four scientific endeavors: Earth Science, Heliophysics, Solar System Exploration, and Astrophysics. Goddard plays a leading role in NASA’s accomplishments by contributing compelling scientific knowledge to advance the Agency’s mission. <b>Follow us on <a href="http://twitter.com/NASAGoddardPix" rel="nofollow">Twitter</a></b> <b>Like us on <a href="http://www.facebook.com/pages/Greenbelt-MD/NASA-Goddard/395013845897?ref=tsd" rel="nofollow">Facebook</a></b> <b>Find us on <a href="http://instagrid.me/nasagoddard/?vm=grid" rel="nofollow">Instagram</a></b>
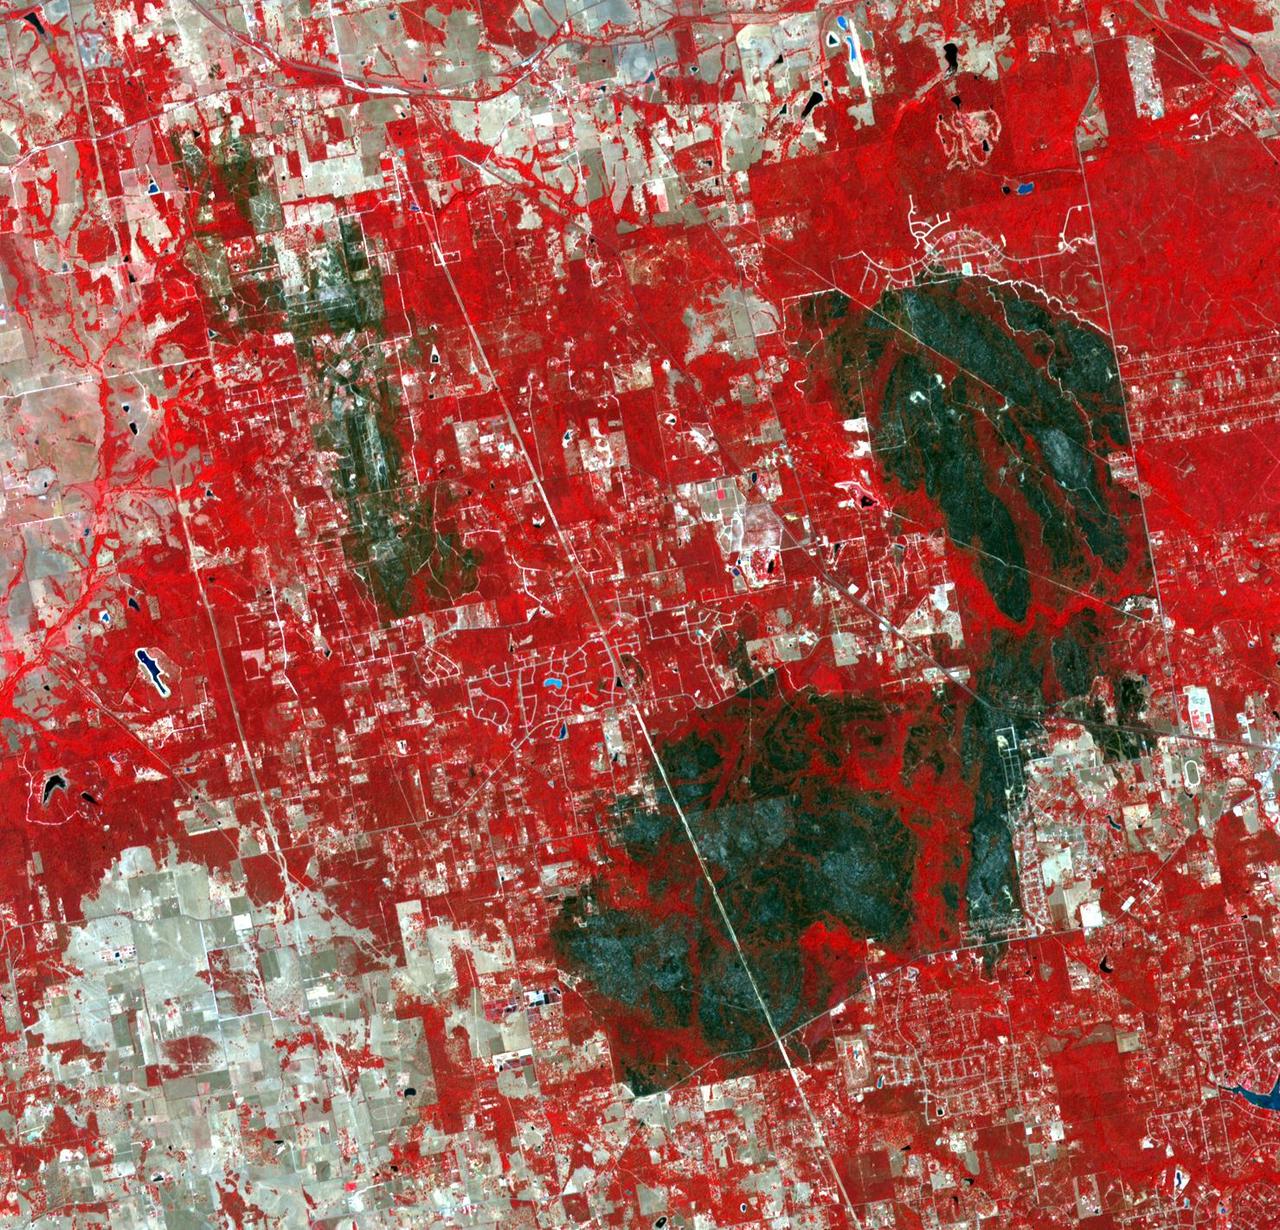
The tri-county Riley Road wildfire burning in Texas north of Houston was 85 percent contained when NASA Terra spacecraft acquired this image on Sept. 12, 2011. Burned areas are dark gray and black; vegetation red; and bare ground and roads light gray.
The Espanola wildfire had consumed more than 4,300 acres when the Advanced Spaceborne Thermal Emission and Reflection Radiometer ASTER instrument aboard NASA Terra spacecraft acquired this image on June 16, 2011, over Flagler County, Fla.

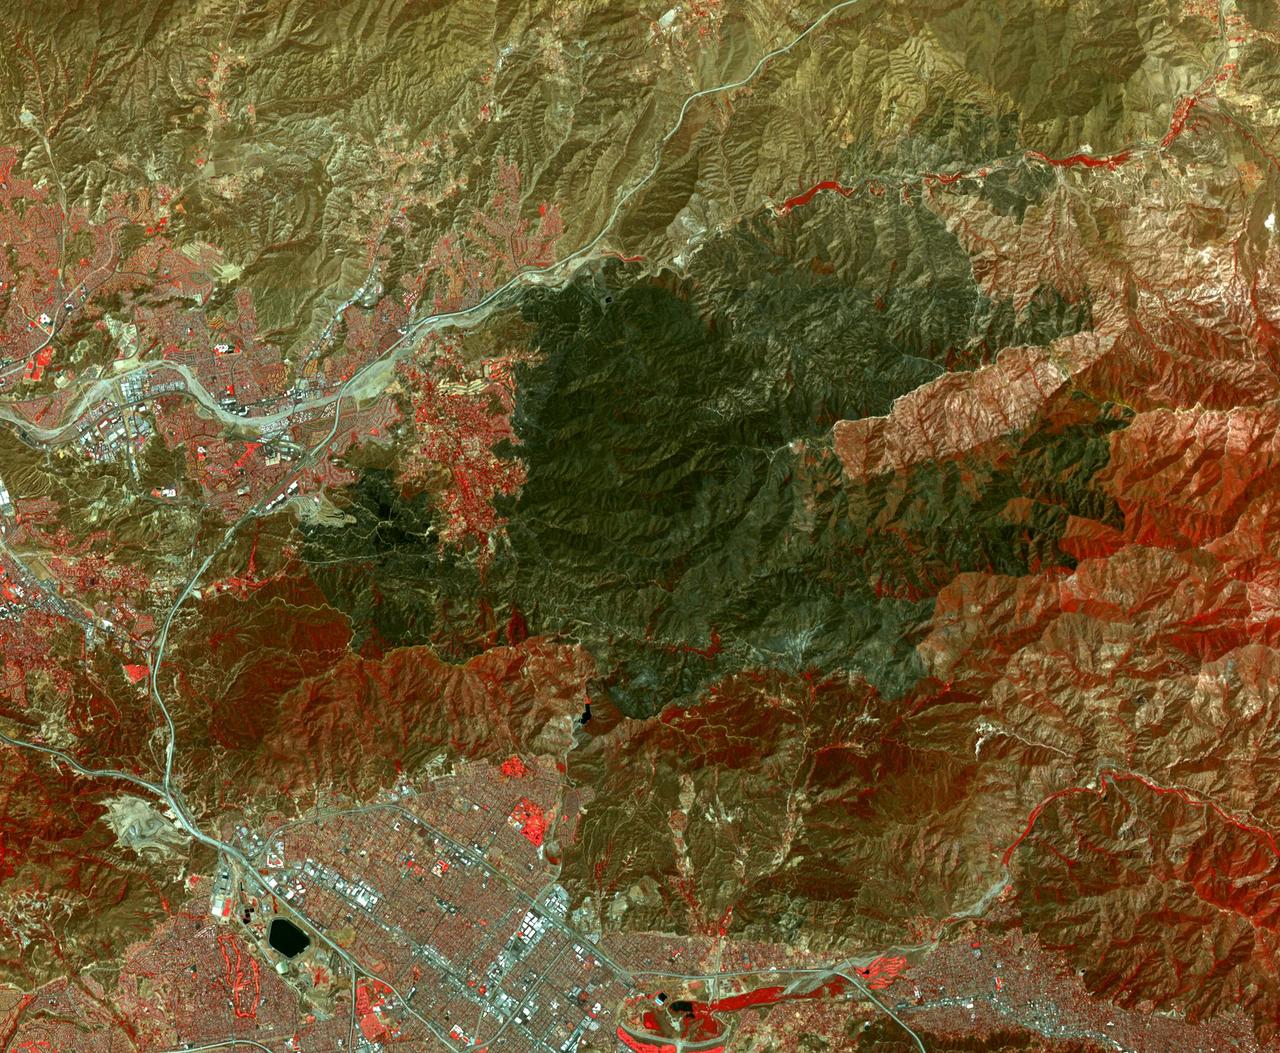
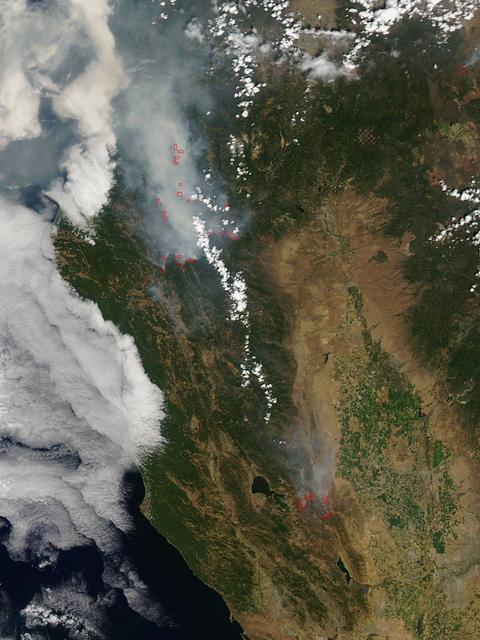
As firefighters continue to work toward full containment of the rash of wildfires burning in Northern California, a new image from the Advanced Spaceborne Thermal Emission and Reflection Radiometer (ASTER) instrument on NASA's Terra satellite shows the growing fire scar on the landscape. In this ASTER image, acquired Oct. 21, 2017, vegetation is red, while burned areas appear dark gray. The image covers an area of 38 by 39 miles (60.5 by 63 kilometers) and is located near 38.5 degrees north, 122.4 degrees west. https://photojournal.jpl.nasa.gov/catalog/PIA22049
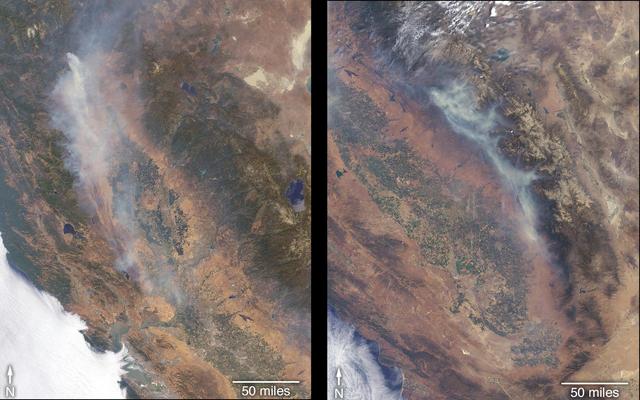
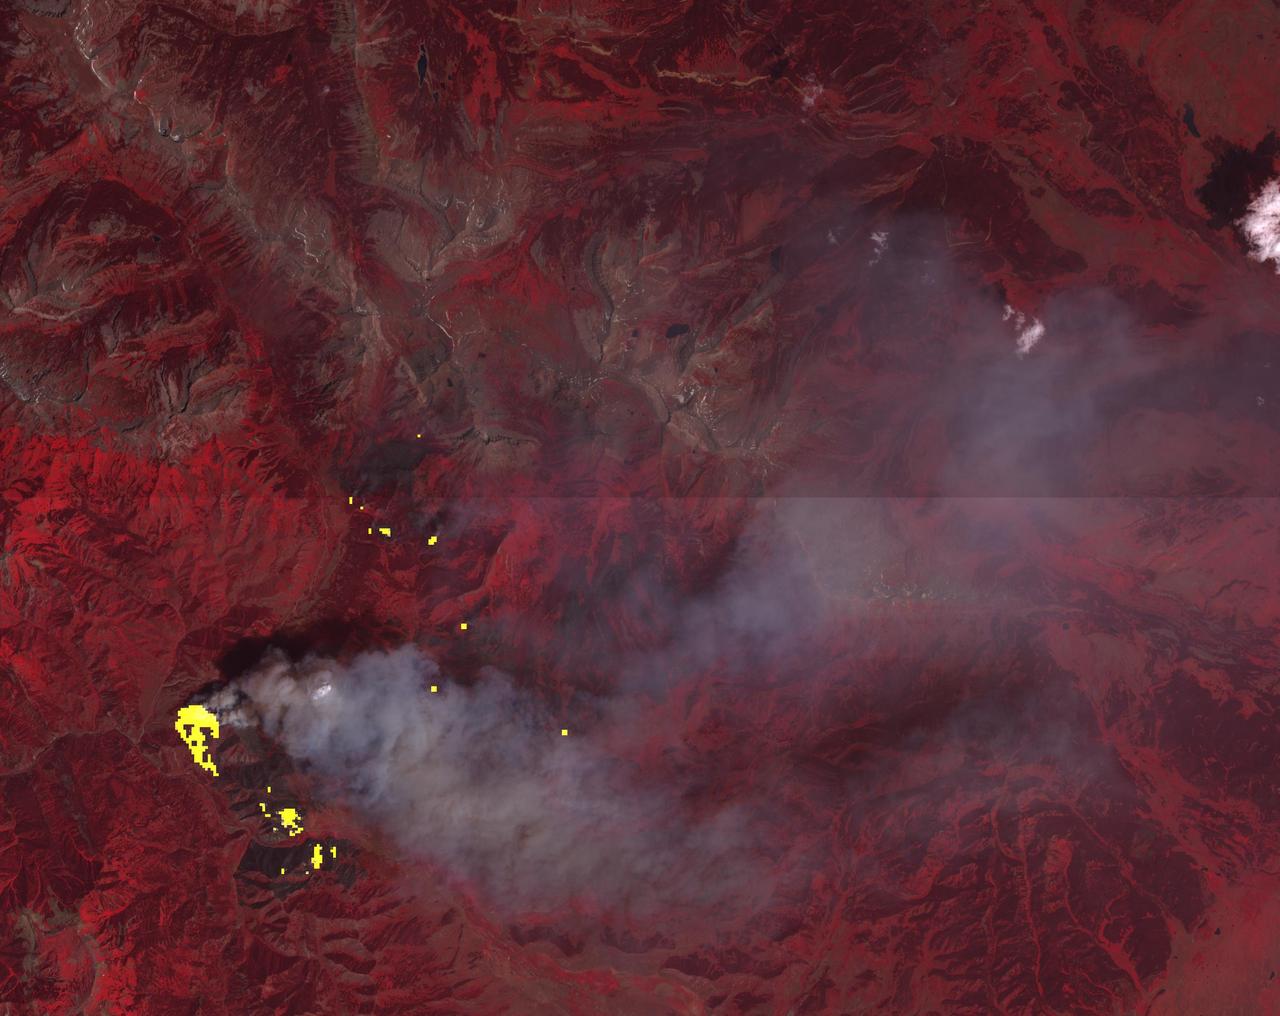
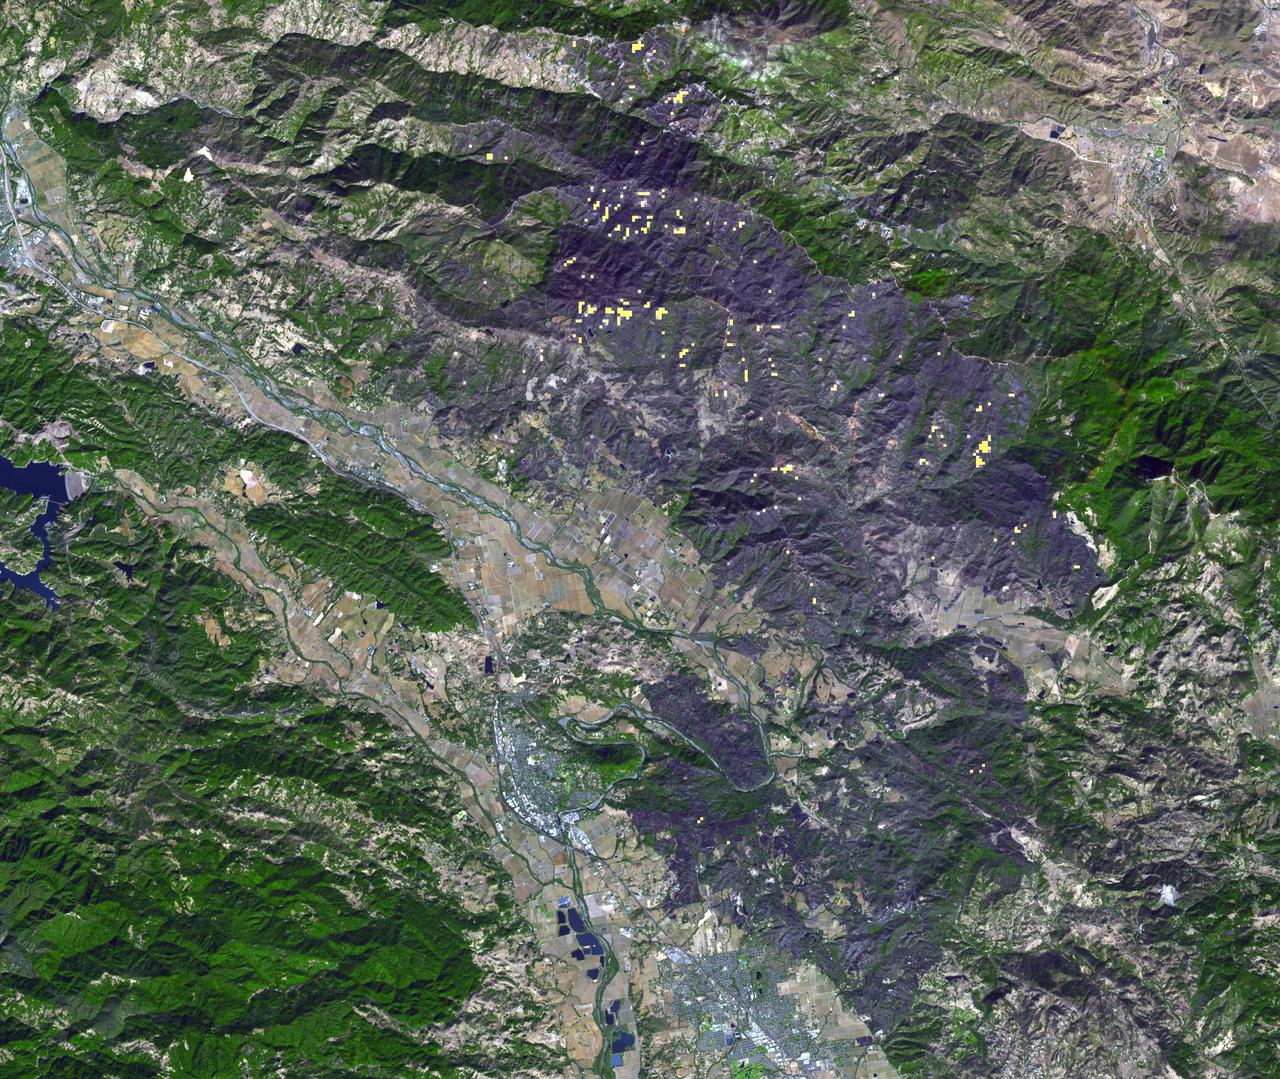
The 416 Fire started June 1, 2018, about 13 miles (18 kilometers) north of Durango, Colorado. Four weeks later, the fire was mostly contained, after consuming 35,000 acres of timber and brush. The cause of the fire is presently unknown. This image, acquired June 26, 2018 by the Advanced Spaceborne Thermal Emission and Reflection (ASTER) radiometer instrument aboard NASA's Terra satellite, shows vegetation in red, clouds in white, cities and bare rocky areas in gray, and the burned area in dark gray. A few small hot spots, detected on ASTER's thermal channels, are overlain in yellow. Smoke can be seen drifting eastward from these hotspots. The data cover an area of 15.2 by 12.9 miles (25.3 by 21.5 kilometers) located at 7.5 degrees north, 107.9 degrees east. https://photojournal.jpl.nasa.gov/catalog/PIA22554
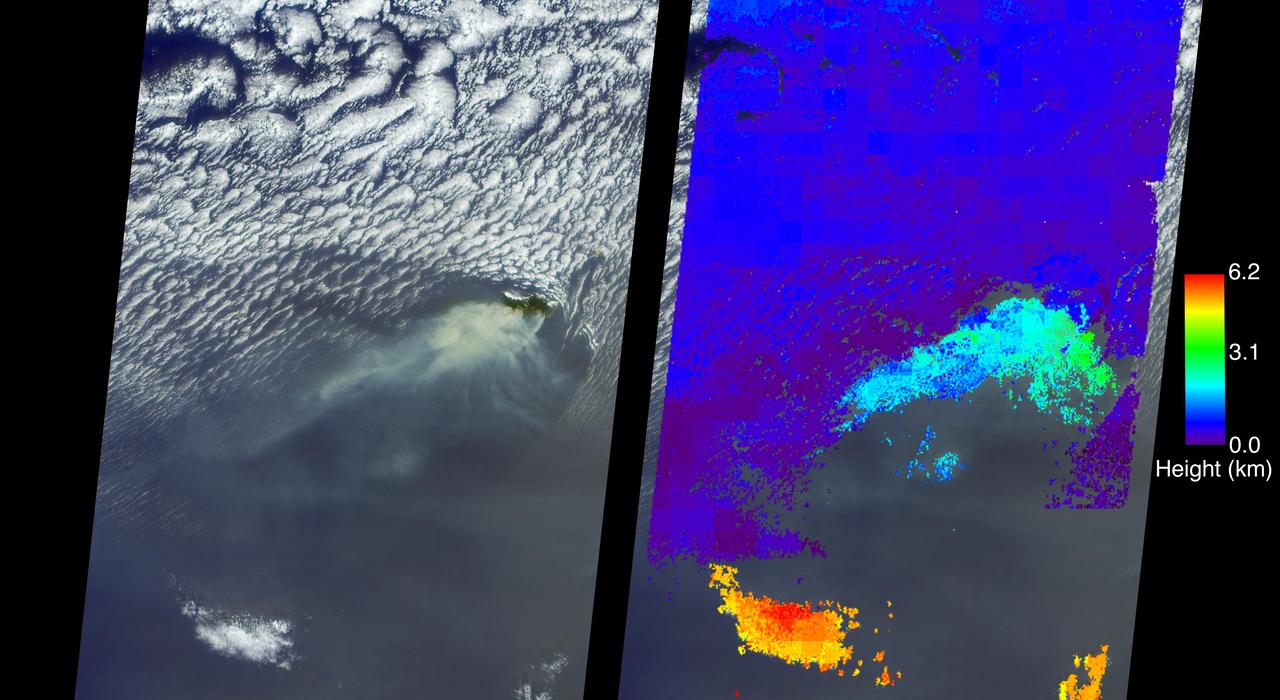
A wildfire spread to the capital city of Funchal on the island of Madeira, an autonomous region of Portugal, over the nighttime hours of Tuesday, Aug. 9, 2016, with three deaths reported and hundreds of others hospitalized. Several homes and a luxury hotel have burned, and a thousand people have been evacuated. The three fatalities are reported to be elderly people who were unable to escape when their homes caught fire. The fire ignited Monday, Aug. 8, after several weeks of scorching temperatures topping 95 degrees Fahrenheit and very dry weather. The entire island is only 30 miles (48 kilometers) from end to end, which naturally makes protecting the island's 270,000 residents and many tourists more difficult. The MISR (Multi-angle Imaging SpectroRadiometer) instrument aboard NASA's Terra satellite passed directly over the island of Madeira on Wednesday, Aug. 10, 2016. The left image is a true-color image taken by MISR's 60-degree forward-pointing camera. This oblique view gives a better view of the smoke than a downward-pointing view. The island of Madeira is the only land within the field of view, and the smoke from the wildfire is being blown to the southwest. The city of Funchal is located on the southeastern coast of the island. MISR's nine cameras, each viewing Earth at a different angle, can be used to determine the height of clouds and smoke above the surface in much the same way that our two eyes, pointing in slightly different directions, give us depth perception. The right-hand image shows MISR's publically available standard cloud top height product. These data show that the main body of clouds is indeed very low, less than 0.6 miles (1 kilometer) above sea level, while the smoke plume is about 1.9 miles (3 kilometers) high at the source, dropping lower as it is blown to the southwest. A stereo "anaglyph" of this scene is also available at PIA20886. As can be seen from both the MISR height product and the 3D anaglyph, the isolated clouds to the south are much higher than either the low clouds or the plume. Interestingly, the low clouds drop to almost sea level and then die out near where the smoke is present. These data were acquired during Terra orbit 88524. http://photojournal.jpl.nasa.gov/catalog/PIA20887
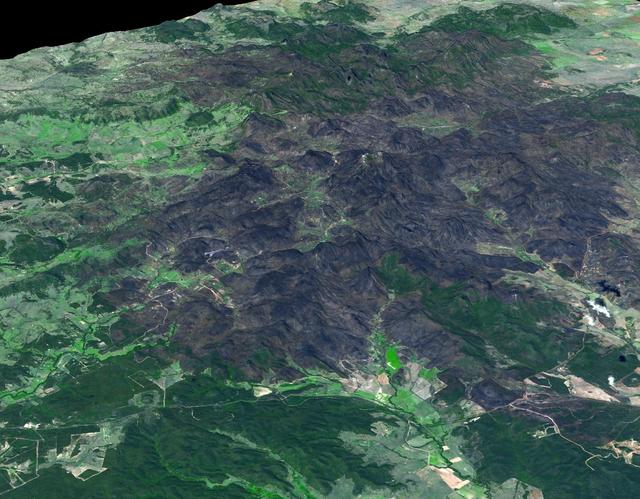
This 3-D view was created from data acquired Feb. 4, 2013 by NASA Terra spacecraft showing a massive wildfire which damaged Australia largest optical astronomy facility, the Siding Spring Observatory.
NASA Terra spacecraft acquired this image, a birdseye view of the Canary Islands wildfire, on Aug. 17, 2012. The main town of San Sebastian can be seen on the eastern shore of the island.
This image, acquired by NASA Terra spacecraft, is of the Carstens, Calif. wildfire which continues to burn in the foothills west of Yosemite National Park. Vegetation is displayed in green and burned and bare areas are dark to light gray.

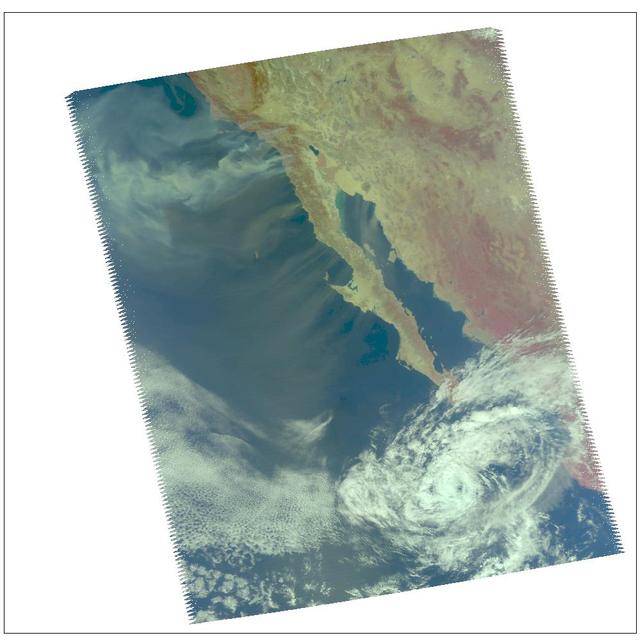
Carbon monoxide from California wildfire, a visualization created using data from the Atmospheric Infrared Sounder AIRS on NASA Aqua satellite, June-July, 2008.

NASA’s B200 King Air team includes, from left, principal engineer Cory Hill, operations engineer KC Sujan, pilot Tracy Phelps, crew chief Mario Soto, aircraft technician Ruben Saiza, quality assurance technician Scott Silver, and senior engineer Alexander Soibel. The compact Fire Infrared Radiance Spectral Tracker (c-FIRST) instrument was tested on the B200 aircraft – based at NASA’s Armstrong Flight Research Center in Edwards, California – over the wildfires in the Pacific Palisades and Altadena, California, on November 21, 2024.

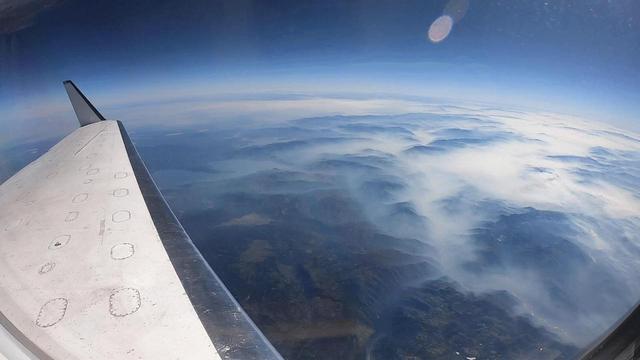
An ER-2 based at NASA's Armstrong Flight Research Center in California flew a mission over the state's wildfires Aug. 9 to validate instruments and to collect information to help U.S. Forest Service officials plan for recovery.
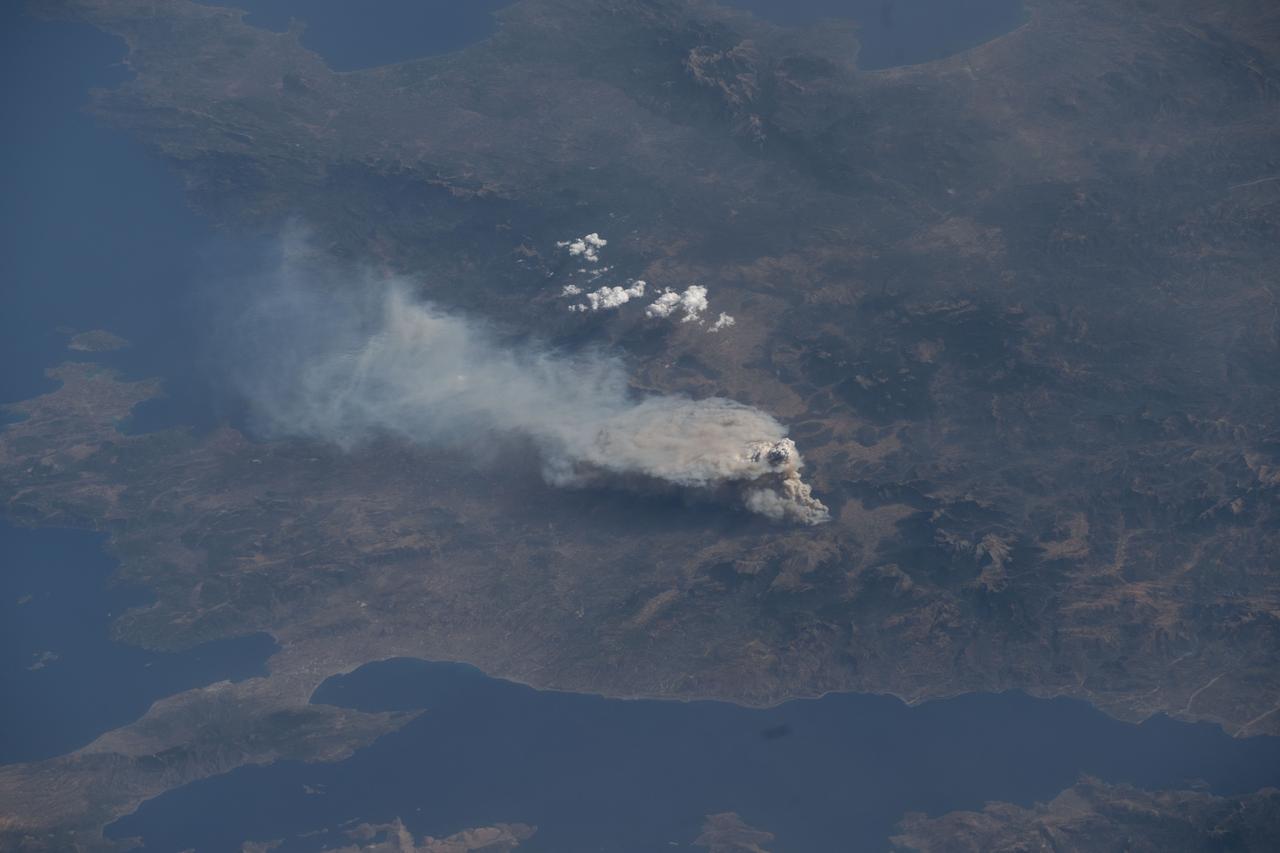
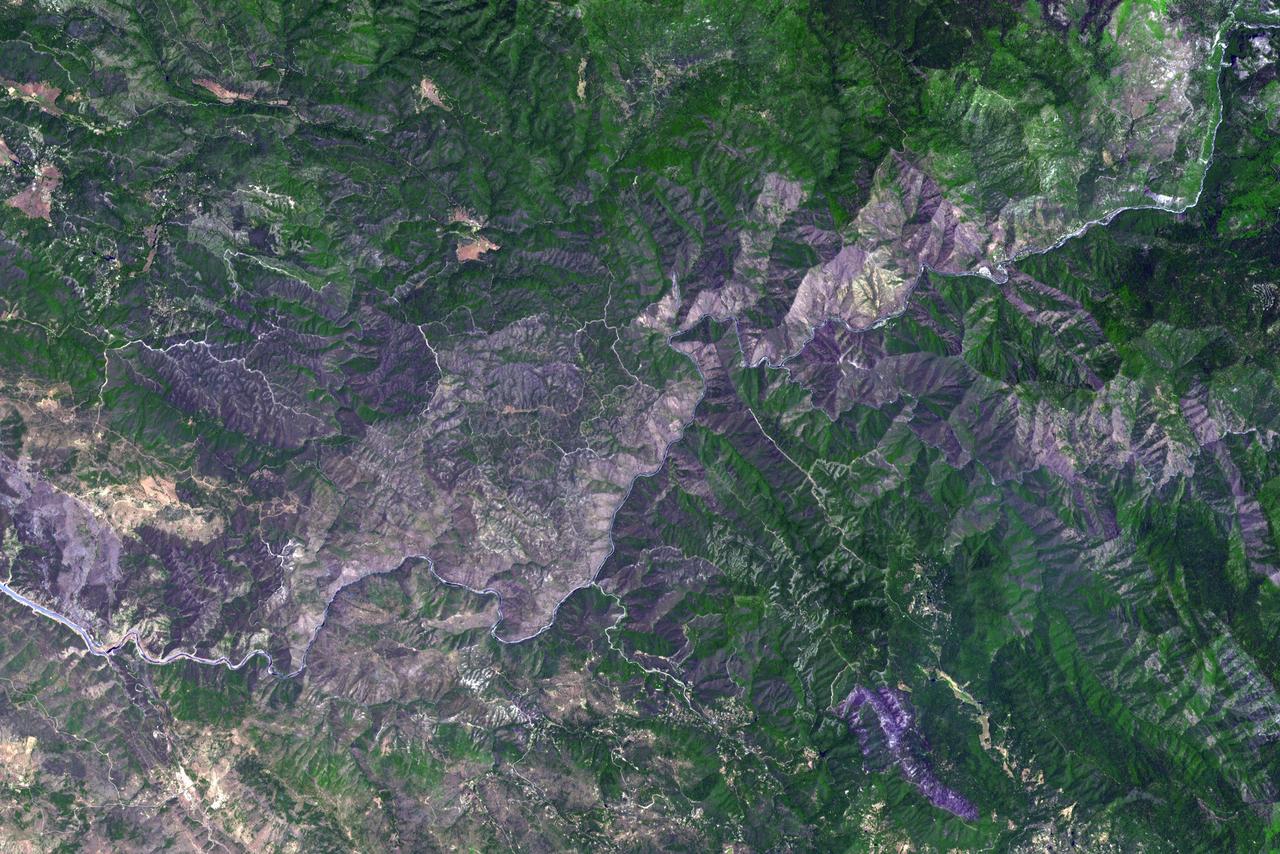
iss073e0421317 (July 22, 2025) --- Wildfires breakout near the Greek village of Feneos south of the Gulf of Corinth in this photograph from the International Space Station as it orbited 261 miles above Southern Europe.
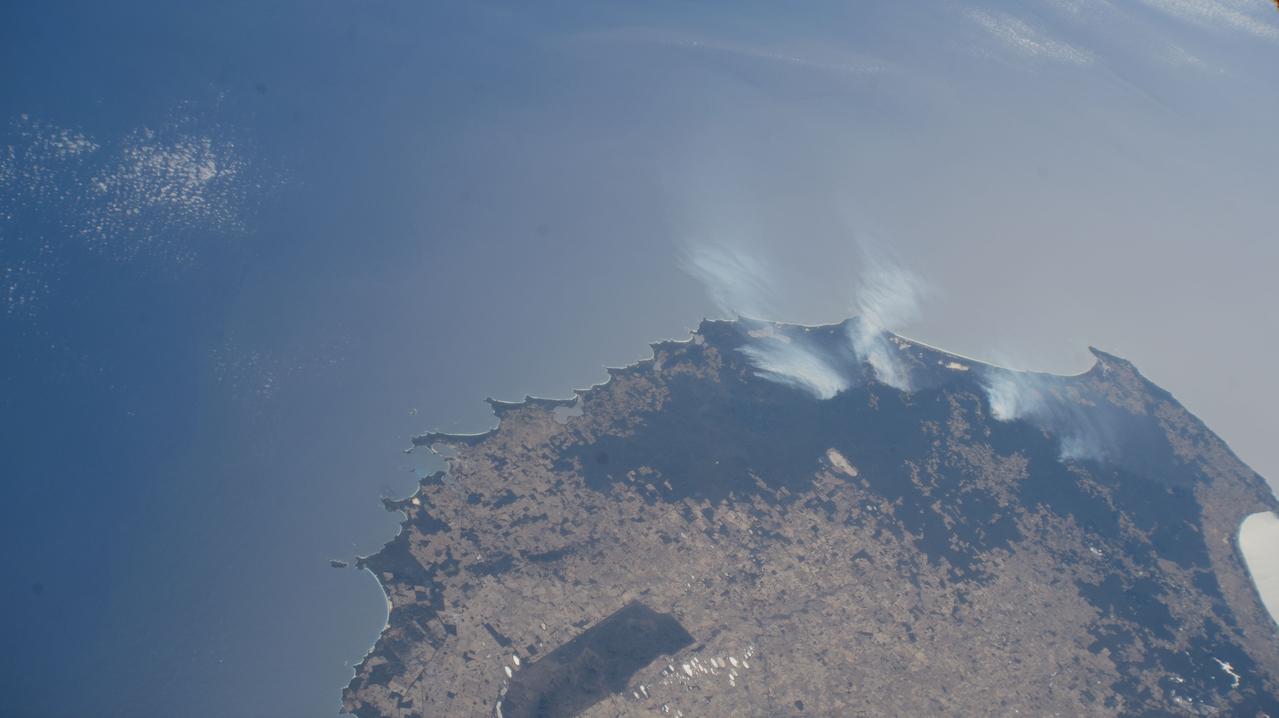
iss072e398046 (Dec. 20, 2024) --- Wildfires are spotted in Mount Frankland National Park about 195 miles south of Perth, Western Australia, in this photograph from the International Space Station as it orbited 266 miles above the island continent.
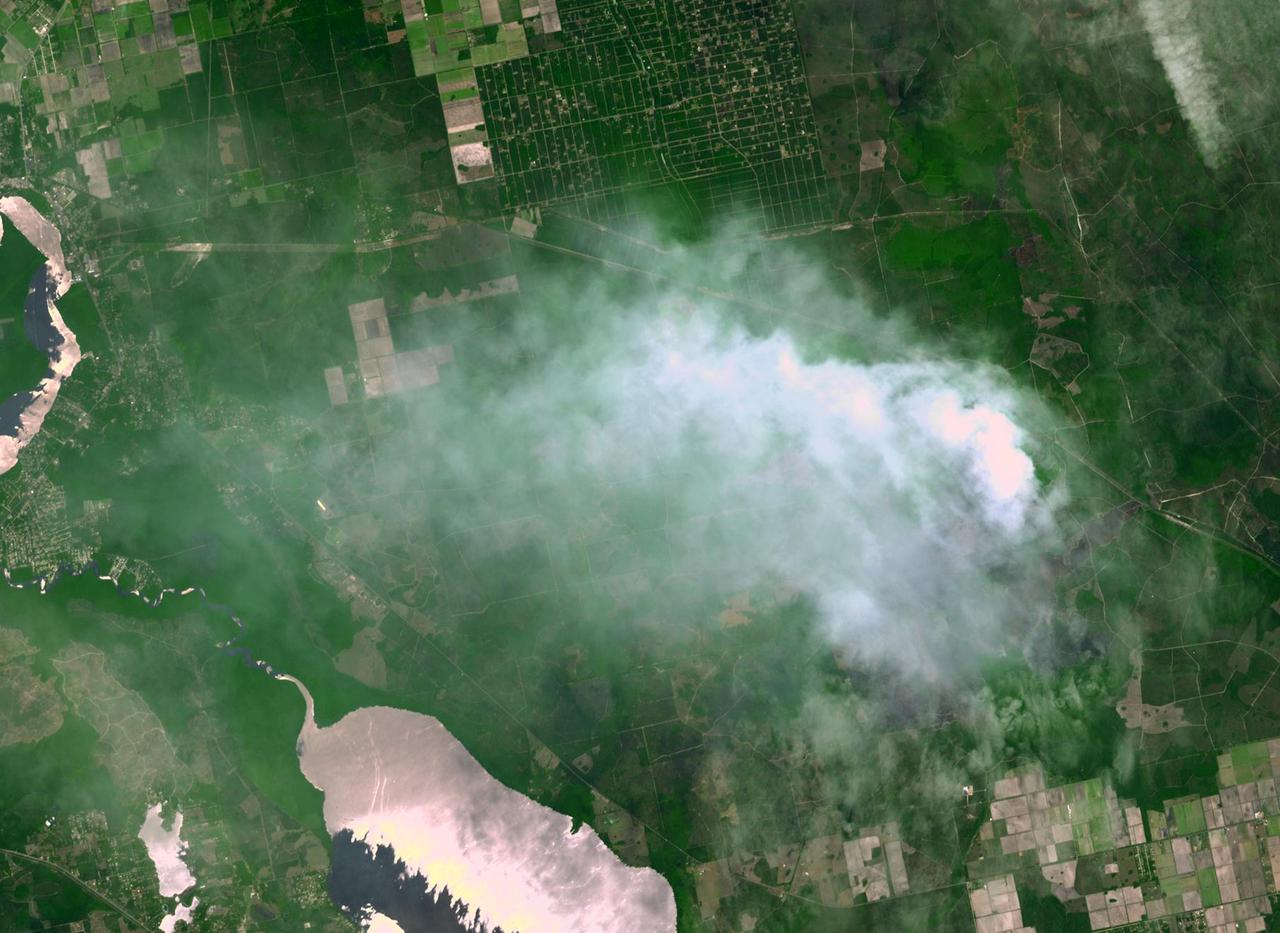
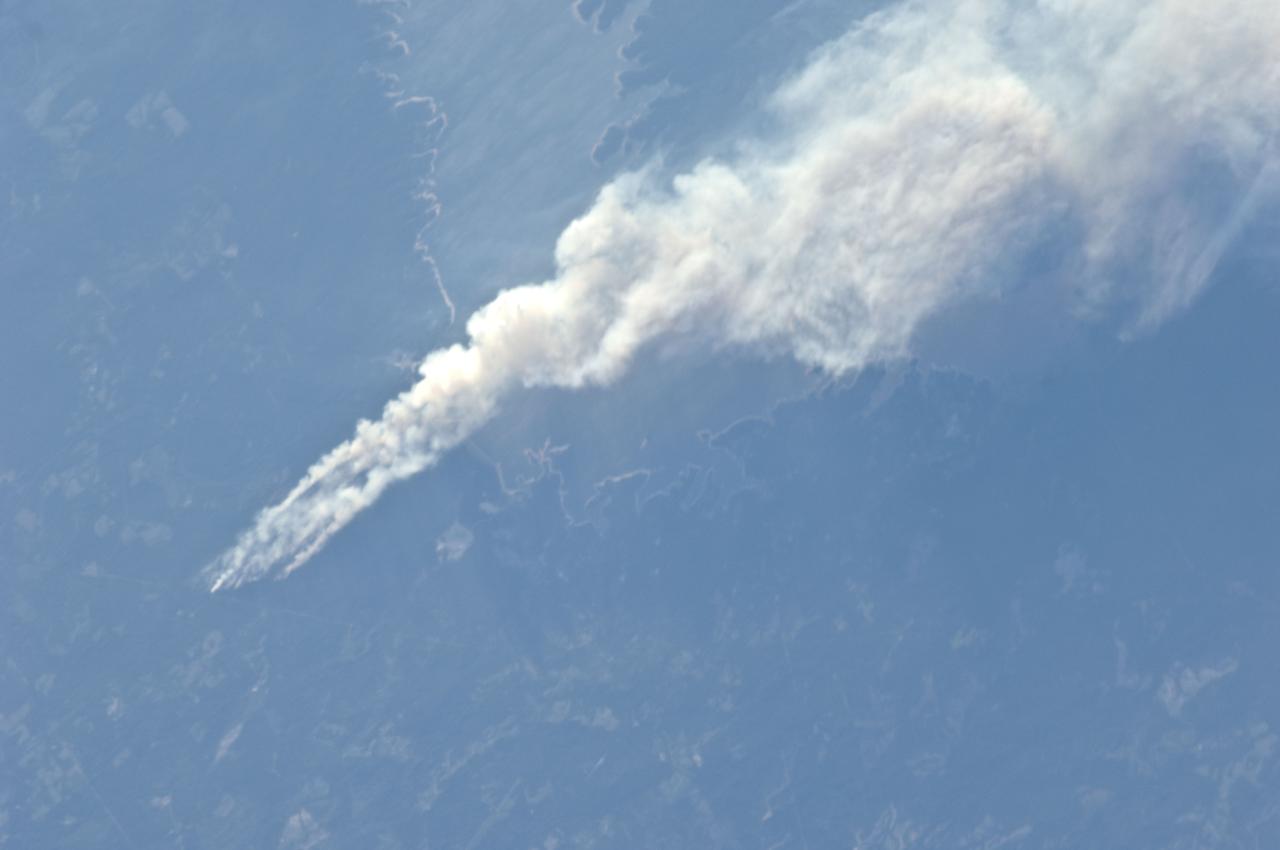
ISS028-E-008375 (21 June 2011) --- One of the Expedition 28 crew members aboard the International Space Station, flying at an altitude of approximately 235 statute miles, on June 21 spotted and photographed this image of one of the major Texas wildfires currently burning up massive acreage. This one is near the Sabine River, southeast of Kirbyville.

ISS028-E-008377 (21 June 2011) --- One of the Expedition 28 crew members aboard the International Space Station, flying at an altitude of approximately 235 statute miles, on June 21 spotted and photographed this image of one of the major Texas wildfires currently burning up massive acreage. This one is near Jasper and Lake Sam Rayburn in far east Texas.
ISS028-E-008374 (21 June 2011) --- One of the Expedition 28 crew members aboard the International Space Station, flying at an altitude of approximately 235 statute miles, on June 21 spotted and photographed this image of one of the major Texas wildfires currently burning up massive acreage. This one is near Jasper and Lake Sam Rayburn in far east Texas.
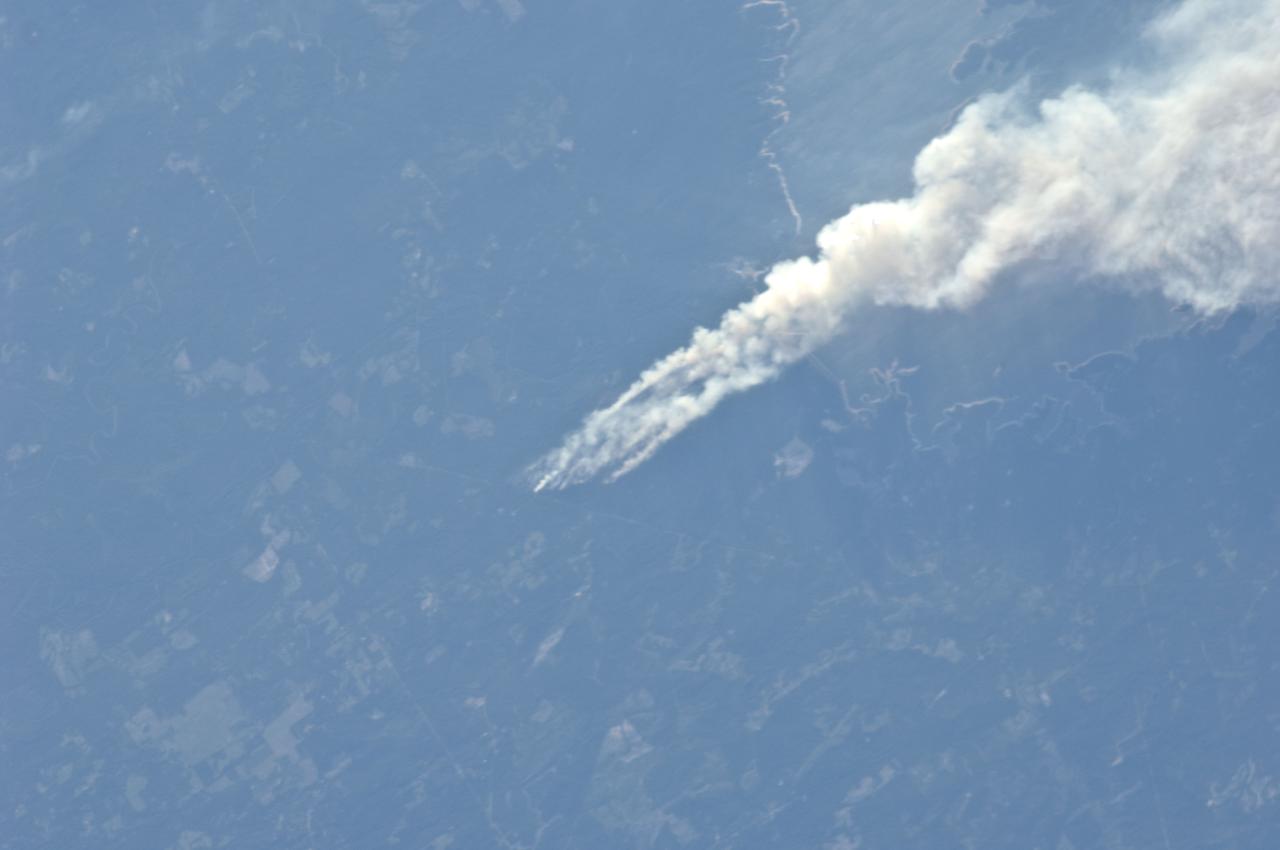
ISS028-E-008373 (21 June 2011) --- One of the Expedition 28 crew members aboard the International Space Station, flying at an altitude of approximately 235 statute miles, on June 21 spotted and photographed this image of one of the major Texas wildfires currently burning up massive acreage. This one is near Jasper and Lake Sam Rayburn in far east Texas.
The Soberanes fire, in Central California near Big Sur, had grown to more than 67,000 acres when the Advanced Spaceborne Thermal Emission and Reflection Radiometer (ASTER) instrument on NASA's Terra spacecraft captured this image on Aug. 6, 2016. More than 4,800 personnel are battling the blaze, which is now 50 percent contained. The fire has destroyed 57 homes and 11 outbuildings and caused one fatality. Evacuation orders are still in effect for a number of nearby communities. The fire was caused by an illegal unattended campfire. Vegetation is depicted in red colors; burned areas are dark grey; clouds are white; smoke and ash are light grey. Yellow indicates active fires, detected on ASTER's thermal infrared channels. The image covers an area of 19 by 26 miles (30 by 42 kilometers), and is located at 36.4 degrees north, 121.8 degrees west. http://photojournal.jpl.nasa.gov/catalog/PIA20725
The Sand fire, in the mountains northwest of Los Angeles, has burned more than 39,000 acres, destroyed 18 houses, and caused one fatality. By August 1, 2016, when the Advanced Spaceborne Thermal Emission and Reflection Radiometer (ASTER) instrument on NASA's Terra spacecraft acquired this image, the fire was more than 90 percent contained. The fire began 10 days earlier in a brushy area near Highway 14. It grew explosively to thousands of acres, driven by high winds and temperatures over 100 degrees Fahrenheit. At one time, more than 20,000 residents were evacuated from their homes. In this image, vegetation is displayed in red, and the burn area is dark grey to black. The image covers an area of 16.4 by 19.4 miles (26.4 by 31.3 kilometers), and is located at 34.4 degrees north, 118.3 degrees west. http://photojournal.jpl.nasa.gov/catalog/PIA20723

The Thomas fire, west of Los Angeles, continues to advance to the west and north and is threatening a number of coastal communities, including Santa Barbara. It is now the fifth largest wildfire in modern California history. According to CAL FIRE, as of midday Dec. 11, the fire had consumed more than 230,000 acres and was 15 percent contained. The Advanced Spaceborne Thermal Emission and Reflection Radiometer (ASTER) instrument on NASA's Terra satellite captured this image on Dec. 10. The image depicts vegetation in red, smoke in light brown, burned areas in dark grey, and active fires in yellow, as detected by the thermal infrared bands. The image covers an area of 14.3 by 19.6 miles (23 by 31.5 kilometers), and is located at 34.5 degrees north, 119.4 degrees west. https://photojournal.jpl.nasa.gov/catalog/PIA22122
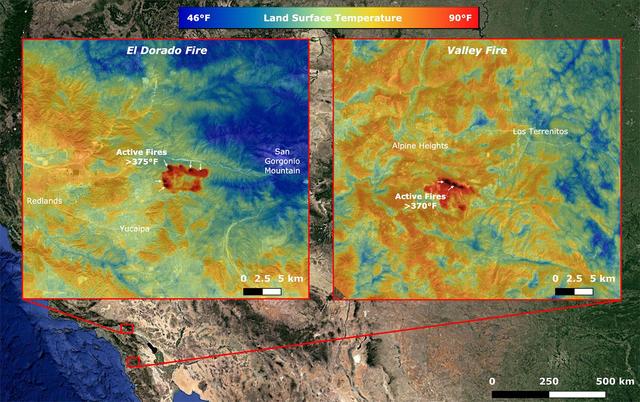
On Sept. 6, NASA's ECOsystem Spaceborne Thermal Radiometer Experiment on Space Station (ECOSTRESS) imaged active fires across California, including the El Dorado fire near Yucaipa and the Valley fire in Japatul Valley in the southern part of the state. As of Sept. 8, there were 25 major wildfires burning in California. Both images, taken at 12:13 a.m. PDT (3:13 a.m. EDT), show multiple concentrated areas of surface temperatures (in red) higher than 375 degrees Fahrenheit (191 degrees Celsius). These high temperature regions were likely where the active fires were occurring. The surrounding areas show abnormally warm middle-of-the-night background surface temperatures (orange) due to the ongoing heat wave. https://photojournal.jpl.nasa.gov/catalog/PIA23788
iss073e0420617 (Aug. 3, 2025) --- Wildfires burn throughout Canada's central provinces sending smoke drifting into the United States' Great Lakes and Northeast regions impacting air quality. The International Space Station was orbiting 262 miles above Canada at the time of this photograph.
iss073e0420604 (Aug. 3, 2025) --- Wildfires burn throughout Canada's central provinces sending smoke drifitng into the United States' Great Lakes and Northeast regions impacting air quality. The International Space Station was orbiting 262 miles above Canada at the time of this photograph.

Scott Howe, a pilot at NASA's Armstrong Flight Research Center in California, assisted with monitoring California's wildfires by operating a MQ-9 remotely piloted aircraft during launches and recoveries for the California Air National Guard. The MQ-9 closely resembles the Ikhana aircraft, which Howe had piloted at Armstrong.
iss073e0420614 (Aug. 3, 2025) --- Wildfires burn throughout Canada's central provinces sending smoke drifitng into the United States' Great Lakes and Northeast regions impacting air quality. The International Space Station was orbiting 262 miles above Canada at the time of this photograph.
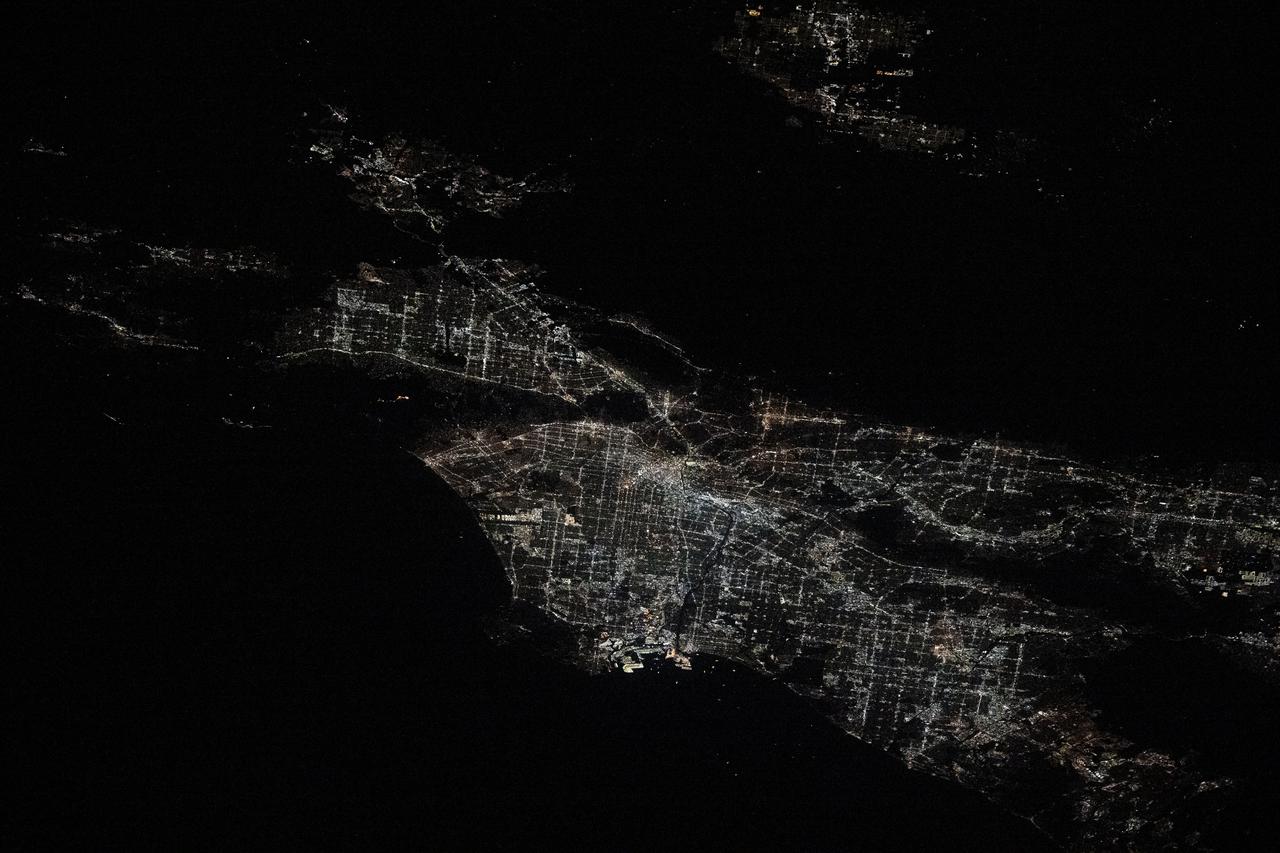
iss072e454582 (Jan. 10, 2024) --- City lights illuminate the Los Angeles, California, metropolitan area at approximately 2:30 a.m. local time as the Palisades, Hurst, and Eaton wildfires rage around nearby suburbs including Malibu, San Fernando, and Pasadena. The International Space Station was orbiting 258 miles above the southwestern United States at the time of this photograph. Credit: NASA/Don Pettit
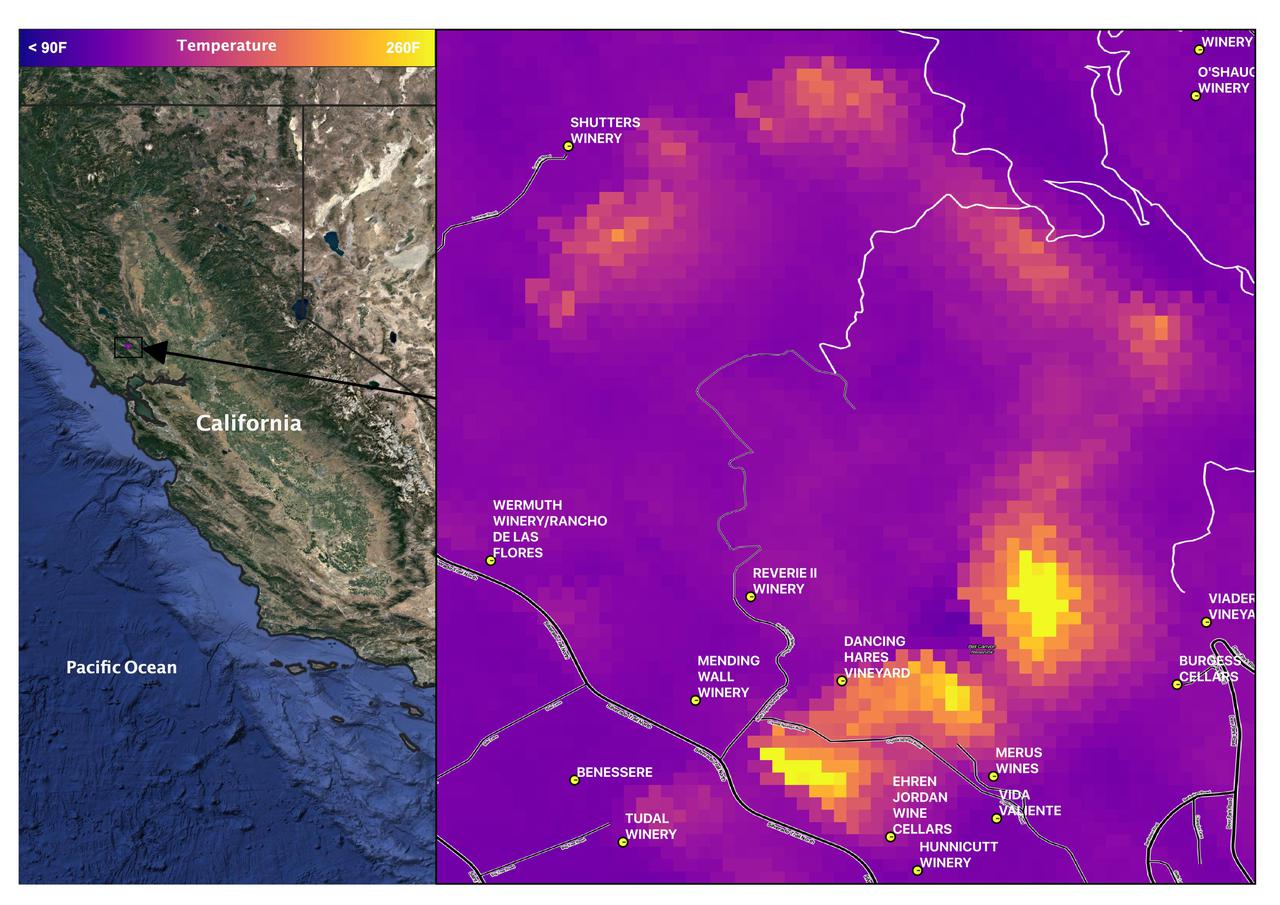
Late in the evening on September 27, 2020 the Glass Fire ignited in the foothills of Napa Valley, California. The cause of the fire is still unknown. Within 24 hours it exploded to over 11,000 acres fueled by dehydrated soil and the drought-stricken landscape. Within hours of the start of the fire, ECOSTRESS captured several hotspots near the fire's origin (represented by the brightest yellow spots on the map). Not only is it important to monitor the progress of the fire as it to help protect people and property, dense wildfire smoke can also damage crops. For this reason, it is important to track both the movement of the fire and local weather patterns to predict crop damage from smoke exposure. Wildfires are common in this region of California, however this unseasonable fire ripped through the region with unusual speed and intensity. As wildfire behavior continues to adapt with Climate Change, images like this help scientists and farmers understand the impacts that the new fire season has on crops. This information is helpful in developing plans to increase agricultural resilience to climate change. Tasked with detecting plant water use and stress, ECOSTRESS's primary mission is to measure the temperature of plants heating up as they run out of water. But it can also measure and track heat-related phenomena like wildfires, heat waves, and volcanoes. ECOSTRESS observations have a spatial resolution of about 77 by 77 yards (70 by 70 meters), which enables researchers to study surface-temperature conditions down to the size of a football field. Due to the space station's unique orbit, the mission can acquire images of the same regions at different times of the day, as opposed to crossing over each area at the same time of day like satellites in other orbits do. This is advantageous when monitoring plant stress in the same area throughout the day, for example. https://photojournal.jpl.nasa.gov/catalog/PIA24209
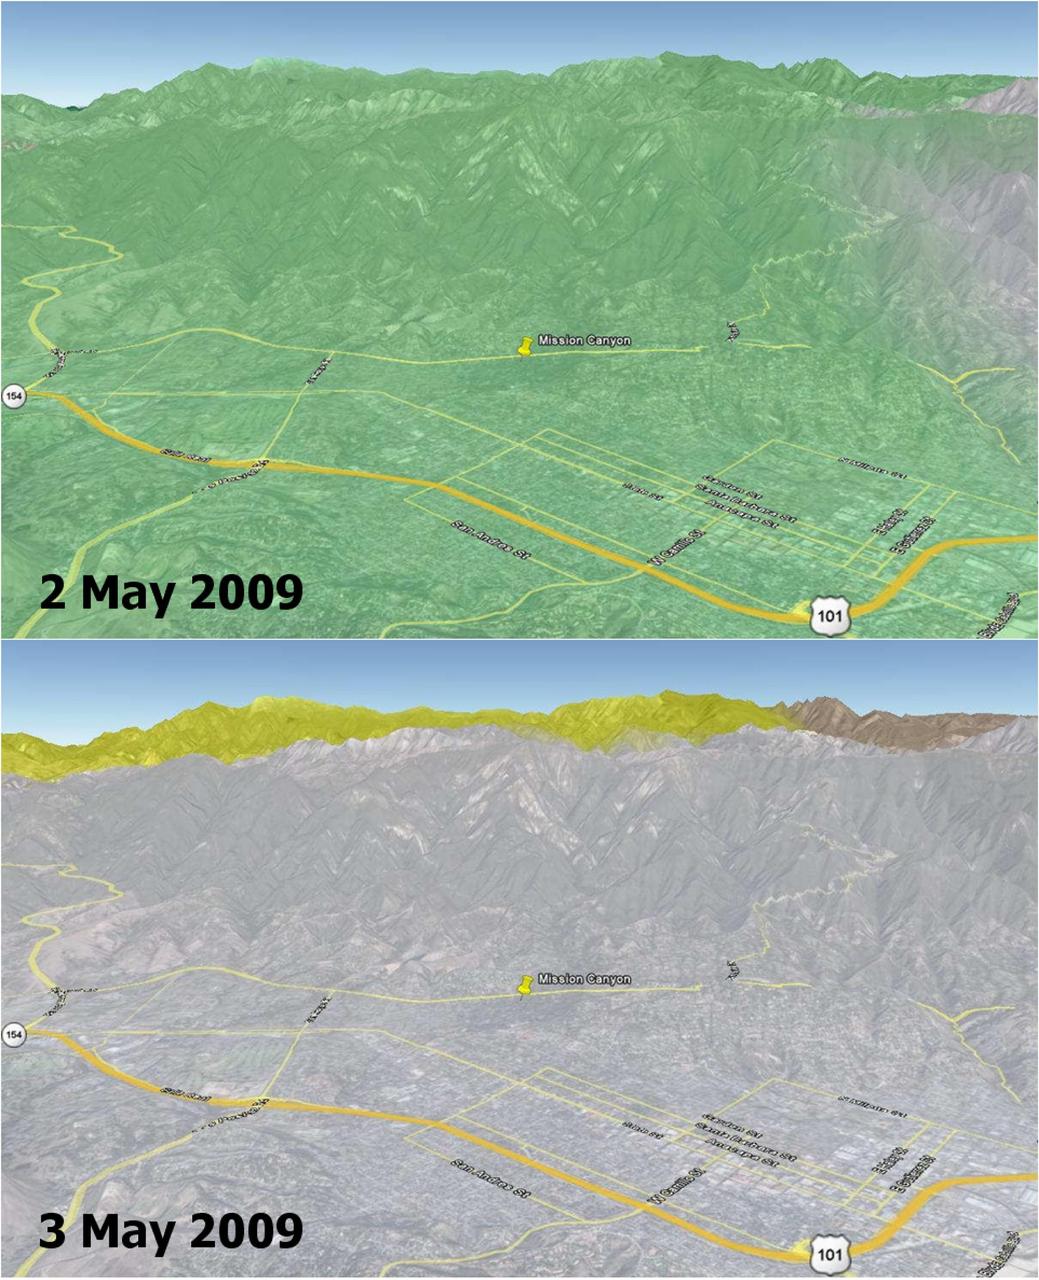
Wildfires are a recurring natural hazard faced by Californians. In Santa Barbara County, a wildfire, called the Jesusita fire, ignited on May 5, 2009 in the Cathedral Peak area northwest of Mission Canyon. As of midday May 8, the fire, which was 10-percent contained, had scorched 3,500 acres, damaged or destroyed 75 structures, and had forced the evacuation of tens of thousands of residents. This image shows soil moisture change in the top soil layer (2-inches deep) on 2 and 3 May 2009, as measured by the NASA QuikSCAT satellite scatterometer (radar). Rainwater increased the amount of moisture in the soil by a moderate 4 percent (represented by the green color) on May 2, which rapidly dried up on the next day (0 percent, as depicted by the grey color on May 3). Son Nghiem of JPL is leading a science team to develop wildfire applications using QuikScat data. “Information critical to assessing the conditions leading to wildfires can be obtained from NASA’s SeaWinds scatterometer, a stable and accurate radar aboard the QuikScat satellite,” says Dr. Son Nghiem, a JPL scientist in remote sensing. This is accomplished by using QuikScat data to map moisture changes in the topsoil. As such, QuikScat can detect rainwater that actually reaches the land surface and accumulates on it, rather than raindrops in the air. While rain radars may detect a significant rain rate, rainwater may evaporate in part before reaching the surface. For example, in the case of dry thunderstorm (known as virga), raindrops disappear on the way down, leaving the land dry, while the associated lightning ignites fires. For the case of the current fire in Santa Barbara, QuikScat detected a moderate increase of 4 percent in soil moisture on May 2, while rain radar data seemed to indicate a significant and extensive rain. The next day, QuikScat revealed that whatever rainwater that had accumulated earlier quickly dried up over the whole area. The maximum temperature in Santa Barbara approached 90 degrees Fahrenheit and broke the record set in 1984. An important characteristic of QuikScat measurements is that they represent the average conditions over the whole area, rather than some disparate data collected at a few localized points. The rapid dry-up in Santa Barbara together with high temperatures and high winds led to the devastating Jesusita fire. http://photojournal.jpl.nasa.gov/catalog/PIA12006
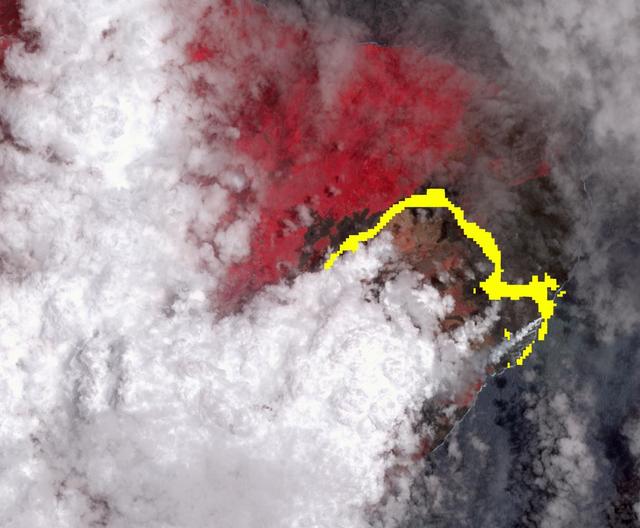
California has been hit hard the past few weeks with storms. Storms bring lightning and lightning strikes cause wildfires. Currently there are at least five fire complexes in the area including River, Fork, South, Route and Mad River. The Mad River complex is a series of seven lightning fires that started on July 30th, 2015 after a lightning storm moved through Northern California. After initial firefighters responded, 25 fires were reported and most of the fires were contained. Some additional fires might be detected from the original lightning storms in the upcoming days and will be attacked once they are found. Damage assessment is ongoing and crews will determine the extent of structures and equipment damaged or destroyed. The River Complex is managing a total of 5 fires due to fires merging together on the Shasta-Trinity and the Six Rivers National Forests. Winds from the west are expected to lift the inversion today resulting in active fire behavior. The Fork Complex consists of over 40 fires, all of which were ignited by lightning between July 29 and 31, 2015. These fires are still being identified, assessed, and prioritized. Updated acreage and information about specific fires will be published as it is known. Fire activity moderated throughout last night (8/4) with the smoke inversion layer remaining in place today. Hopefully this will create favorable conditions for fire crews to take direct fire attack on the fires edge, construct dozer line and scout for best firefighting locations on all fires in the complex. The South Complex consists of approximately nine known fires, five of which are currently over 100 acres. The fires are active and defense of structures and point protection are in progress. The weather is trapping smoke in the valley causing very poor air quality. As the smoke lifts the fire activity increases. Firefighters will continue to provide point protection on structures and to look for opportunities to build direct and indirect containment lines. The Route Complex currently stands at 12,164 acres from seven separate fires and is at 2% containment. The overall acreage has been reduced because the South Fire on the nearby South Complex is merging with the Johnson Fire in the Route Complex resulting in decreased and revised fire perimeter acreage. This natural-color satellite image collected by the Moderate Resolution Imaging Spectroradiometer (MODIS) aboard the Terra satellite shows smoke rising and drifting northwest from the various fire complexes. It was captured on August 04, 2015. Actively burning areas, detected by MODIS’s thermal bands, are outlined in red. NASA image courtesy Jeff Schmaltz, MODIS Rapid Response Team. <b><a href="http://www.nasa.gov/audience/formedia/features/MP_Photo_Guidelines.html" rel="nofollow">NASA image use policy.</a></b> <b><a href="http://www.nasa.gov/centers/goddard/home/index.html" rel="nofollow">NASA Goddard Space Flight Center</a></b> enables NASA’s mission through four scientific endeavors: Earth Science, Heliophysics, Solar System Exploration, and Astrophysics. Goddard plays a leading role in NASA’s accomplishments by contributing compelling scientific knowledge to advance the Agency’s mission. <b>Follow us on <a href="http://twitter.com/NASAGoddardPix" rel="nofollow">Twitter</a></b> <b>Like us on <a href="http://www.facebook.com/pages/Greenbelt-MD/NASA-Goddard/395013845897?ref=tsd" rel="nofollow">Facebook</a></b> <b>Find us on <a href="http://instagrid.me/nasagoddard/?vm=grid" rel="nofollow">Instagram</a></b>
A wildfire burned 46,000 acres southwest of Pocatello, Idaho, threatening homes and filling the area with smoke. The human-caused fire was 85 percent contained by Aug. 10, 2017. The extent of the burned area is evident in this image as the dark gray area. The image was acquired Aug. 13, 2017, covers an area of 22 by 28 miles (36 by 45 kilometers), and is located at 42.7 degrees north, 112.6 degrees west. https://photojournal.jpl.nasa.gov/catalog/PIA21875
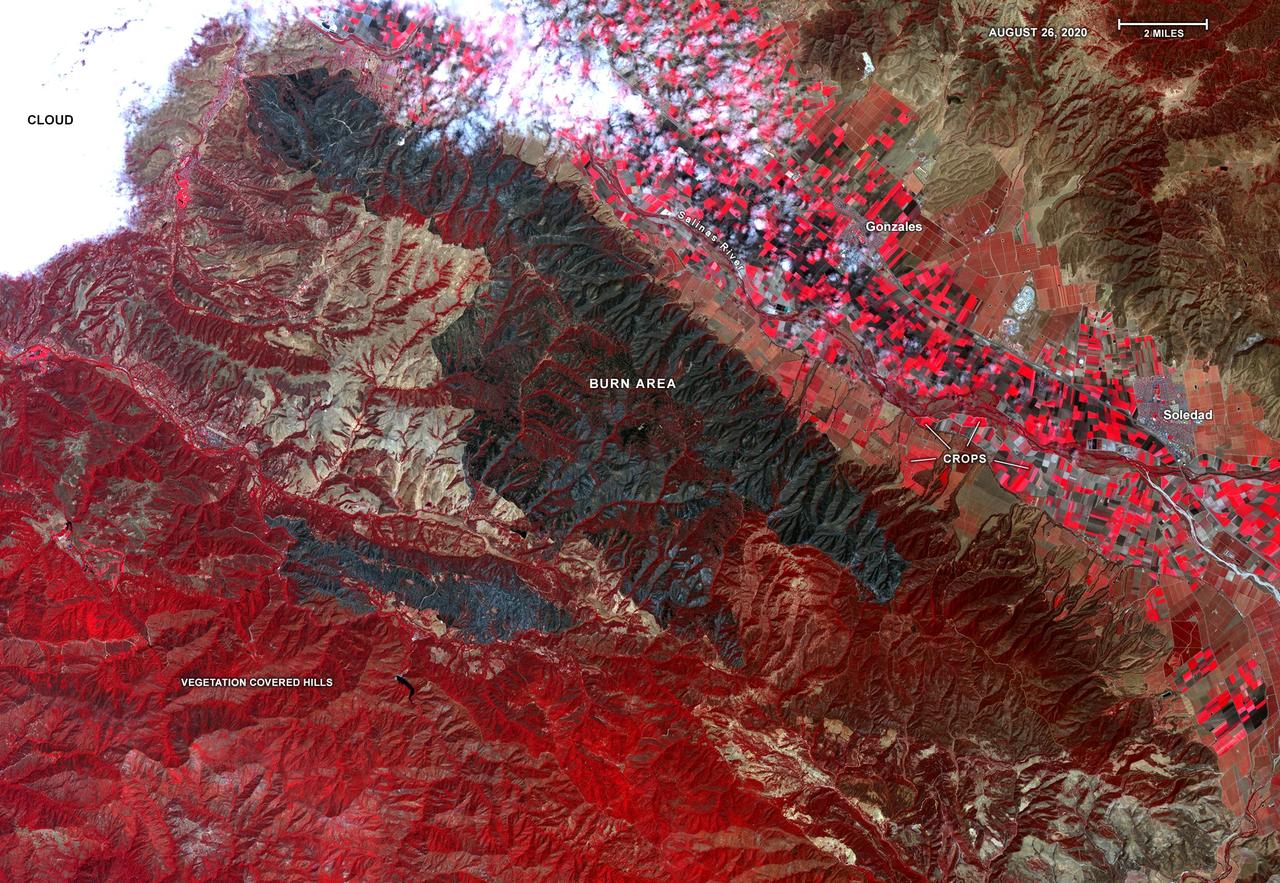
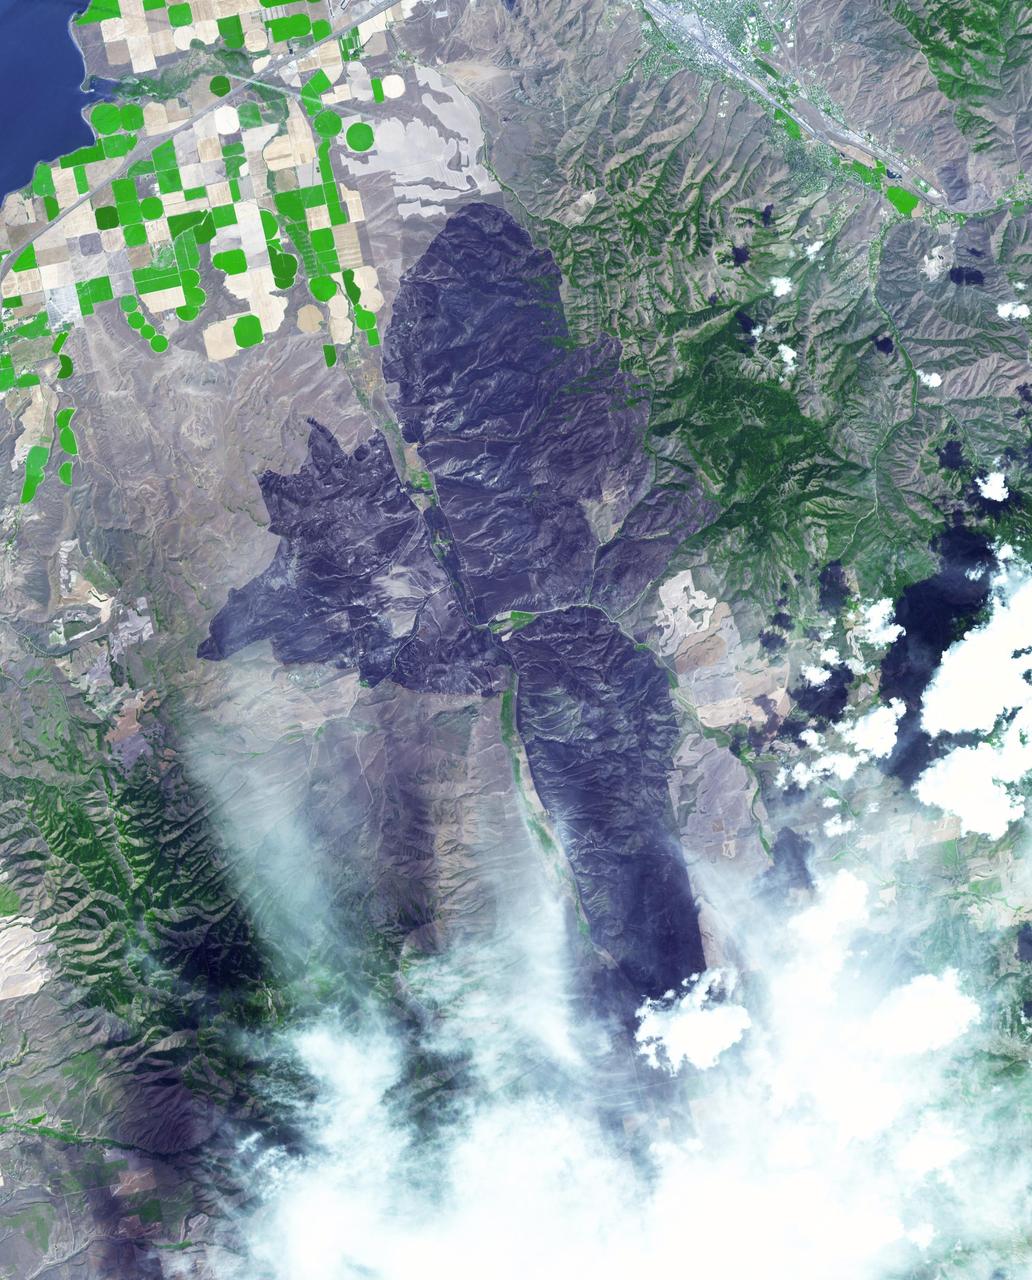
On Aug. 26, 2020, Advanced Spaceborne Thermal Emission and Reflection Radiometer (ASTER) instrument aboard NASA's Terra satellite passed over the River and Carmel fires in Monterey County, California, got a bird's eye view of the vast fire burn area. This false-color map shows the burn area as dark blue and gray, in the center of the image. Vegetation is in red, including agricultural crops along the Salinas River (bright red rectangles) surrounding the towns of Soledad and Gonzales; bare areas with no vegetation and rock are shown in tan and brown. The city of Salinas is in the upper left of the image, obscured by thick clouds. ASTER obtains high-resolution (15-90 square meters, or 161-969 square feet, per pixel) images of the Earth in 14 wavelengths of the electromagnetic spectrum, ranging from visible to thermal infrared light. Data from ASTER — which is managed by Japan Space Systems and NASA's Jet Propulsion Laboratory in Southern California — are used by scientists to create detailed maps of land surface temperature, how much infrared energy the land emits, how much light the land reflects and its elevation. On this occasion, ASTER was able to support NASA's Disaster Program response to the state's wildfires, providing data products that can be used by resources on the ground to fight the fires and for scientists to better understand their long-term effects. The area covered here is 21.4 by 31 miles (34.4 by 49.9 kilometers). https://photojournal.jpl.nasa.gov/catalog/PIA23800
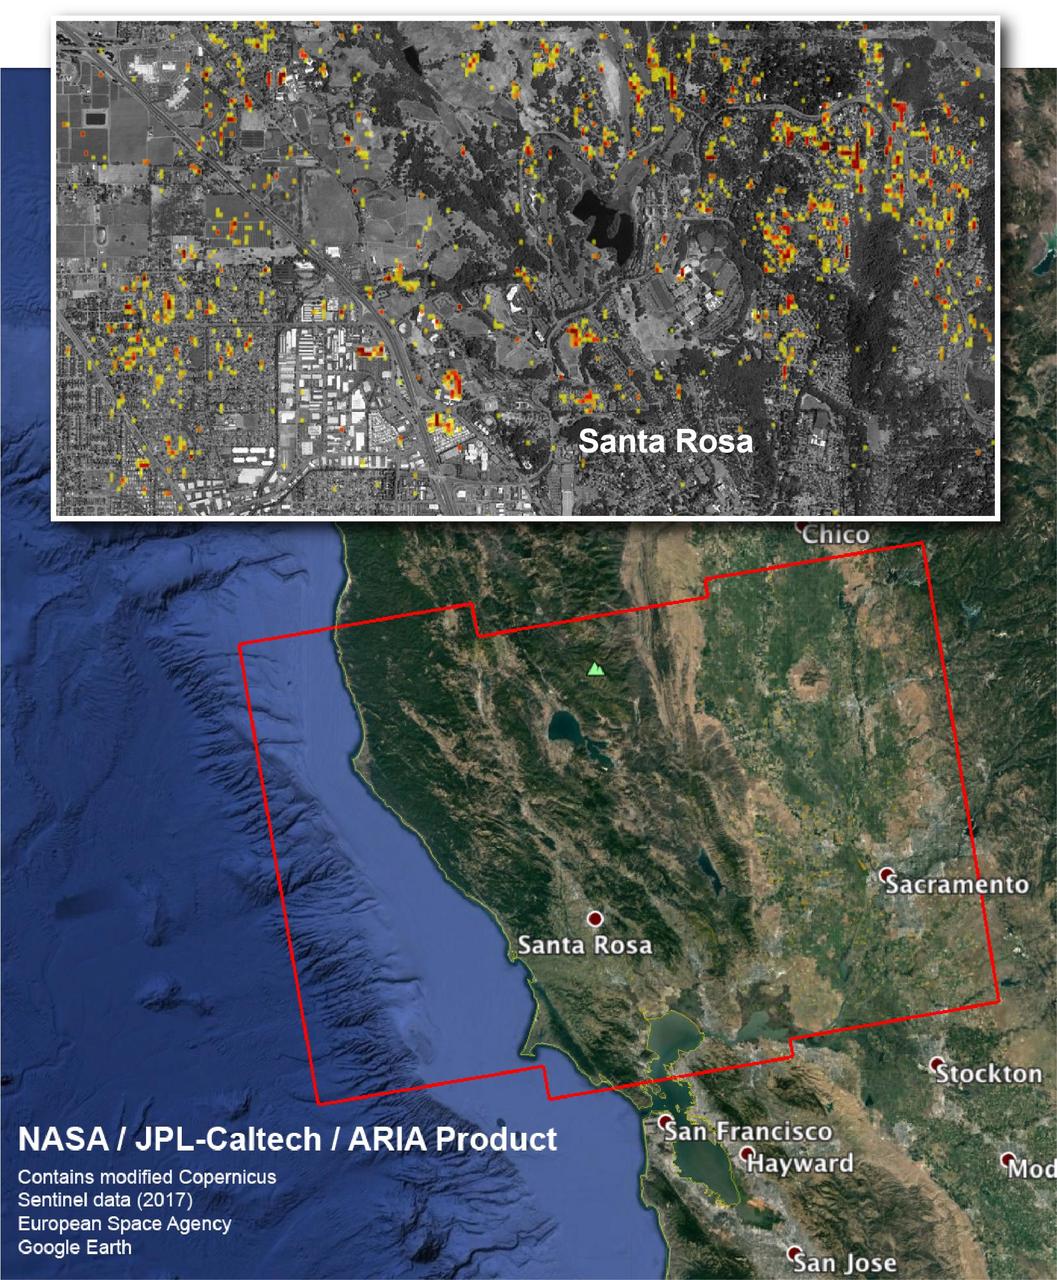
The Advanced Rapid Imaging and Analysis (ARIA) team at NASA's Jet Propulsion Laboratory in Pasadena, California, and Caltech, also in Pasadena, created this Damage Proxy Map depicting areas in Northern California that are likely damaged (shown by red and yellow pixels) as a result of the region's current outbreak of wildfires. The map is derived from synthetic aperture radar (SAR) images from the Copernicus Sentinel-1 satellites, operated by the European Space Agency (ESA). The images were taken before (Sep. 27, 2017, 7 p.m. PDT) and after (Oct. 9, 2017, 7 p.m. PDT) the onset of the fires. The map has been provided to various agencies to aid in the wildfire response. The map covers the area within the large red polygon, and measures 155 by 106 miles (250 by 170 kilometers). The illustrative figure from the map depicted in the inset shows damage in the city of Santa Rosa. Each pixel in the Damage Proxy Map measures about 98 feet (30 meters) across. The color variation from yellow to red indicates increasingly more significant ground surface change. Preliminary validation was done by comparing to optical satellite imagery from DigitalGlobe. This Damage Proxy Map should be used as guidance to identify damaged areas, and may be less reliable over vegetated areas. Sentinel-1 data were accessed through the Copernicus Open Access Hub. The image contains modified Copernicus Sentinel data (2017), processed by ESA and analyzed by the NASA-JPL/Caltech ARIA team. This research was carried out at JPL under a contract with NASA. https://photojournal.jpl.nasa.gov/catalog/PIA22048

Equipped with a pod-mounted infrared imaging sensor, the Altair UAS aided fire mapping efforts over wildfires in central and southern California in late 2006.
The October 2007 wildfires, including the Witch Wildland fire, plagued southern California and were some of the worst on record. Image from NASA Terra satellite.
On Jan. 16, 2014, NASA Terra spacecraft acquired this image of a wildfire broke that out in the mountains above the Los Angeles suburbs of Glendora and Azusa.

With smoke from the Lake Arrowhead area fires streaming in the background, NASA's Ikhana unmanned aircraft heads out on a Southern California wildfires imaging mission.

With smoke from the Lake Arrowhead area fires streaming in the background, NASA's Ikhana unmanned aircraft heads out on a Southern California wildfires imaging mission.

NASA's ECOsystem Spaceborne Thermal Radiometer Experiment on Space Station (ECOSTRESS) has imaged a temperature profile of an area surrounding a fire-induced tornado in Loyalton, California. A 20,000-acre wildfire early on Saturday, Aug. 15, 2020, had been the source of the tornado. Fire tornados are rare occurrences and happen due to the most unfavorable weather conditions: harsh winds and a surge in heat from a fire. They have the potential to be highly dangerous, leading to many areas to issue a weather alert to their residents to stay cautious and find places of shelter. In this map, there is a concentrated area of high temperature, which is likely where the fire-induced tornado had taken place. Also present in the image are very cold clouds, possibly representing the pyrocumulonimbus cloud that usually forms above a fire tornado. The National Weather Service (NWS) also suggested outflow winds in excess of 60 mph, which points to the event to be an EF1 or EF2 tornado. https://photojournal.jpl.nasa.gov/catalog/PIA23215
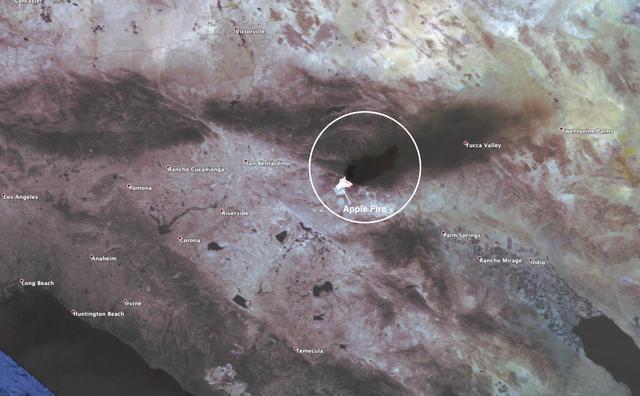
This observation shows the burn area and smoke plume created by the Apple fire in Southern California on Aug. 1, 2020. The observation was made possible by NASA's Ecosystem Spaceborne Thermal Radiometer Experiment on Space Station (ECOSTRESS). Data gathered by the mission can be further refined to measure the temperature of the wildfire, smoke plume and surrounding landscape. ECOSTRESS collected this data when the space station passed over the region at about 1:15 p.m. PST on Saturday, Aug. 1, 2020, when the burn area was approximately 4,000 acres in size. As of Aug. 3, it was more than 26,000 acres. Black smoke can be seen drifting east and over Joshua Tree National Park in the Mojave Desert. With a resolution of about 77 by 77 yards (70 by 70 meters), the image enables surface-temperature conditions down to the size of a football field to be studied. Tasked with detecting plant water use and stress, ECOSTRESS measures the temperature of plants as they heat up when they run out of water. But it can also measure and track heat-related phenomena like fires, heat waves, and volcanoes. https://photojournal.jpl.nasa.gov/catalog/PIA23799
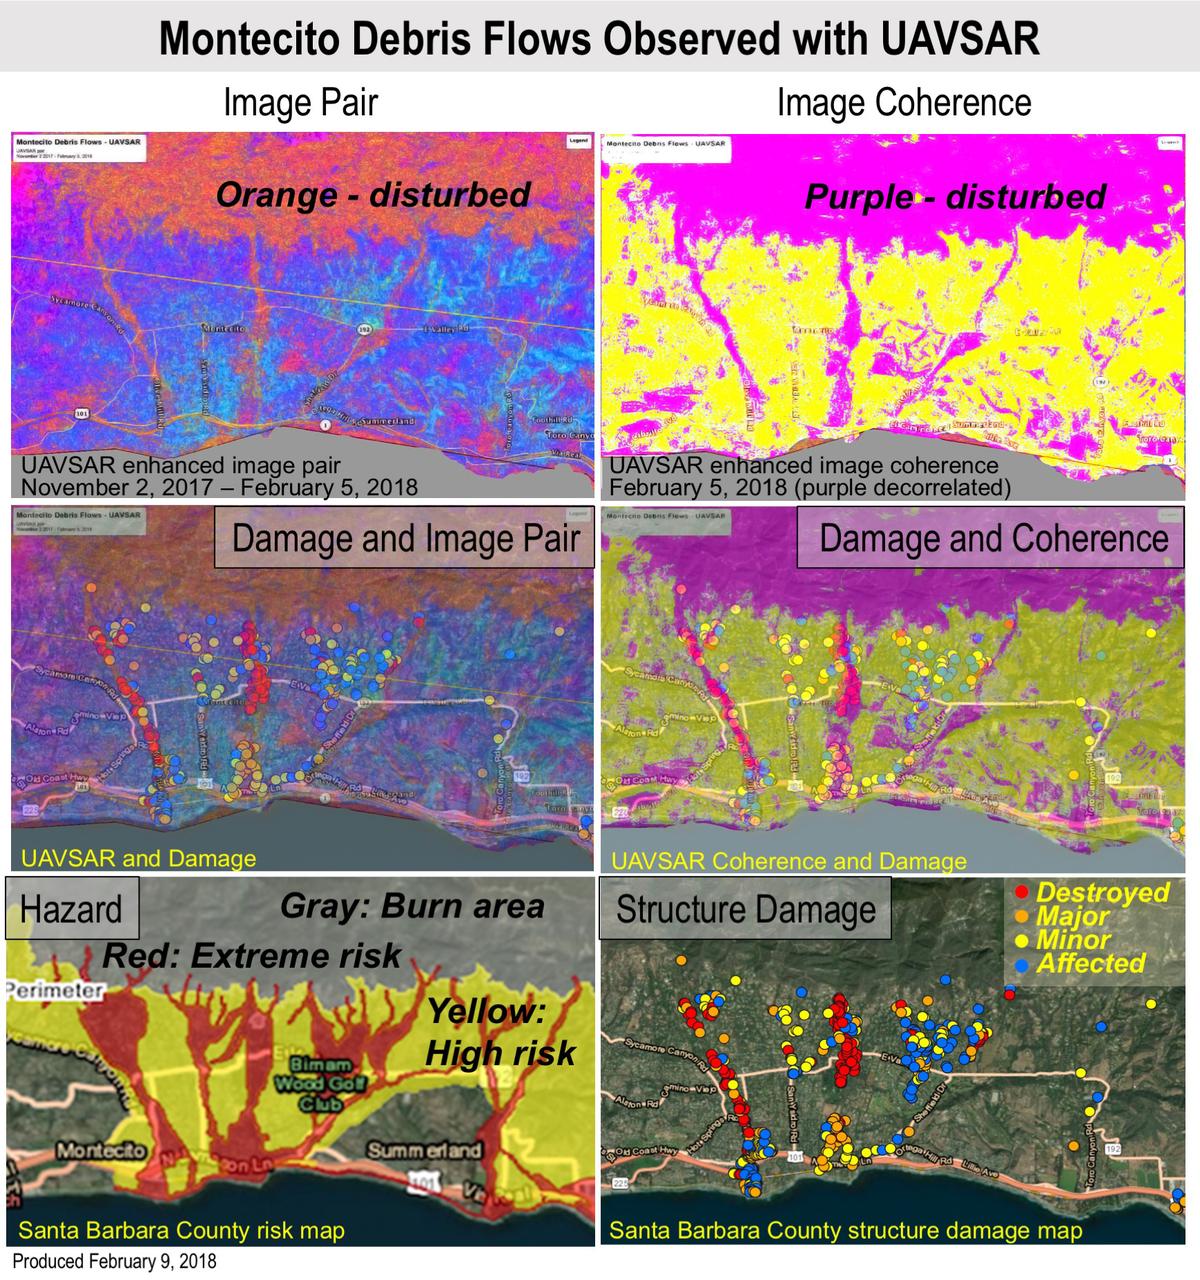
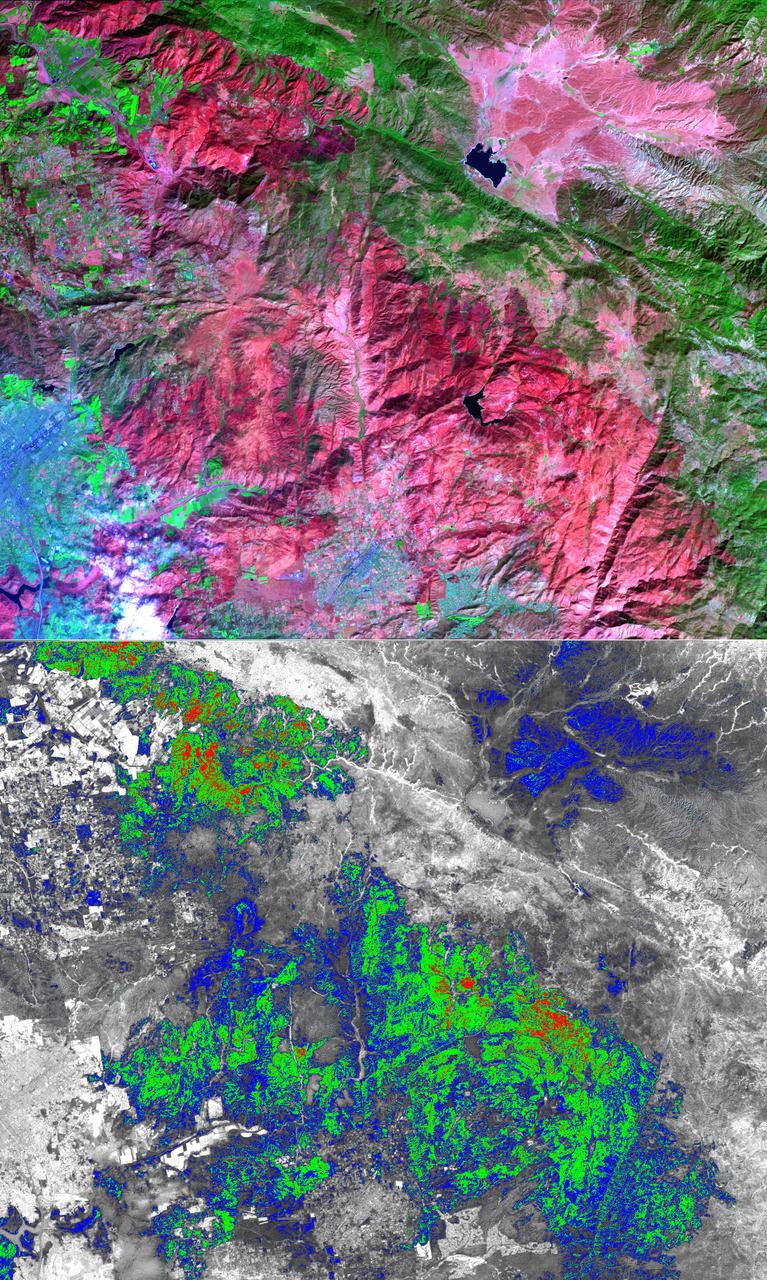
Extreme winter rains in January 2018 following the Thomas Fire in Ventura and Santa Barbara Counties caused severe debris flows, resulting in significant loss of life and considerable property damage in the town on Montecito, just east of Santa Barbara. NASA's Uninhabited Aerial Vehicle Synthetic Aperture Radar (UAVSAR) airborne radar platform detected changes caused by the debris flows between two images acquired on Nov. 2, 2017, and Feb. 5, 2018. An enhanced image pair (top left) shows disturbed areas in orange. In areas of severe surface disruption from the fire scar and debris flows the two image pairs can't be matched and decorrelate (top right). In the middle panels, the radar images are overlaid on the structure damage map produced by the County of Santa Barbara. The fire scars and damage correspond well with the risk map (lower left) and damage map (lower right). With an operational system, products such as these have the potential to augment information available for search and rescue, and for damage assessment for government agencies or the insurance industry. Radar has the advantage of being available in all weather conditions, as it can image through clouds. NASA's Uninhabited Aerial Vehicle Synthetic Aperture Radar (UAVSAR), developed and managed by the Jet Propulsion Laboratory, Pasadena, California, can record changes on the ground beneath the aircraft that occur between multiple flights, which take exactly the same flight path. The instrument is used to monitor how volcanoes, earthquakes, and other natural hazards are changing Earth. The JPL UAVSAR team collected and processed the imagery for Principal Investigator Andrea Donnellan who performed the analysis. She has been conducting ground change research using UAVSAR in this and other regions of California since 2009. https://photojournal.jpl.nasa.gov/catalog/PIA22243
NASA flew an aircraft equipped with Uninhabited Aerial Vehicle Synthetic Aperture Radar (UAVSAR) flew above California fires on Sept. 3 and 10. The smoke-penetrating UAVSAR enables scientists to get a close-up view of how these fires have altered the landscape. Attached to the bottom of the aircraft, the radar is flown repeatedly over an area to measure tiny changes in surface height with extreme accuracy. The flight is part of the ongoing effort by NASA's Applied Sciences Disaster Program in the Earth Sciences Division, which generates maps and other data products that can be used by partner agencies on the ground to track fire hotspots, map the extent of the burn areas, and even measure the height of the smoke plumes that have drifted over California and neighboring states. Movie available at https://photojournal.jpl.nasa.gov/catalog/PIA24102
On Sept. 1, 2017, the La Tuna Canyon fire began in the foothills north of Los Angeles. By the time it was contained, it became one of the biggest wildfires in the history of the city in terms of sheer acreage. The fire burned several structures and resulted in a large number of evacuations. The fire could be seen over a large area, from the Hollywood Burbank airport (left side of image), to NASA's Jet Propulsion Laboratory and the Rose Bowl (right side of image). In this image from the Advanced Spaceborne Thermal Emission and Reflection Radiometer (ASTER) instrument on NASA's Terra satellite, vegetation is depicted in red (golf courses are particularly prominent), and the burned area is in dark gray. The image was acquired Oct. 7, 2017, covers an area of approximately 8 by 13 miles (13.5 by 20.5 kilometers), and is located at 34.2 degrees north, 118.2 degrees west. https://photojournal.jpl.nasa.gov/catalog/PIA22044
These images from NASA Terra satellite are of the Central Valley and the Sierra Nevada Mountains showing several smoke plumes from wildfires burning throughout Northern California on August 13, 2001.
Smoke from multiple wildfires burning in Southern California in October, 2007, can be seen in this false-color image from the Atmospheric Infrared Sounder AIRS on NASA Aqua satellite.

NASA Terra spacecraft captured this image of the wildfire near Palmdale, Calif. on August 1, 2010 called the Crown fire. The burned areas appear in shades of gray in this simulated natural color image.
On May 6, 2016, NASA Terra spacecraft captured this image of devastating wildfires in Alberta Province, Canada, near the city of Fort McMurray which began on May 1, 2016.
Australia largest city of Sydney was clouded with smoke when more than 70 wildfires raged across the state of New South Wales when NASA Terra satellite captured this image the morning of December 30, 2001.
The Multi-angle Imaging SpectroRadiometer MISR instrument on NASA Terra satellite captured this Aug. 30 image of smoke plumes from the Station and other wildfires burning throughout Southern California.

On Jan. 16, 2014, NASA Terra satellite passed over Glendora, Calif., where a large wildfire has claimed several homes, causing mandatory evacuations and prompting an air quality alert by public health officials.
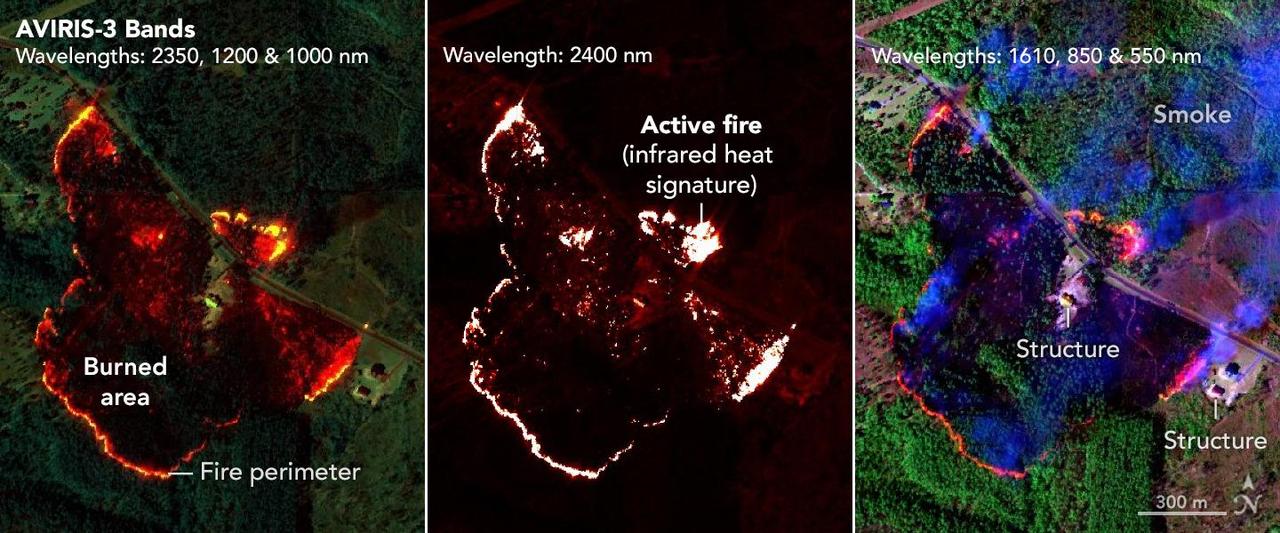
NASA's AVIRIS-3 sensor, an airborne imaging spectrometer built and operated by the agency's Jet Propulsion Laboratory in Southern California, captured infrared data of a wildfire 4 miles (2.5 kilometers) southwest of the unincorporated community of Perdido, Alabama, on March 21, 2025. Within minutes of flying over, real-time maps of the fire were sent via satellite internet to firefighters with the Alabama Forestry Commission, who used it to contain the fire, preventing it from reaching six buildings. The first image in the series combines reflection data from AVIRIS-3 (Airborne Visible Infrared Imaging Spectrometer 3) at three infrared wavelengths that are invisible to the human eye – 2,350 nanometers, 1,200 nanometers, and 1,000 nanometers. In the resulting composite image, the colors indicate where the fire was burning most intensely. Orange and red areas show cooler-burning areas, while yellow indicates the most intense flames. Burned areas show up as dark red or brown. The second image in the series looks solely at the 2,400 nanometers wavelength. The images are particularly useful for seeing hot spots and the perimeters of fires, which show brightly against a red background. The third image in the series combines light at 1,610 nanometers, 850 nanometers, and 550 nanometers. This view shows burn areas and smoke. The AVIRIS-3 sensor belongs to a line of imaging spectrometers built at JPL since 1986. The instruments have been used to study a wide range of phenomena – including fire – by measuring sunlight reflecting from the planet's surface. Data from imaging spectrometers like AVIRIS-3 typically takes days or weeks to be processed into highly detailed, multilayer image products used for research. By simplifying the calibration algorithms, researchers were able to process data on a computer aboard the plane in a sliver of the time it otherwise would have taken, and airborne satellite internet connectivity enabled the images to be distributed almost immediately, while the plane was still in flight, rather than after it landed. Flying about 9,000 feet (3,000 meters) in altitude aboard a NASA King Air B200 research plane, AVIRIS-3 collected data on the Castleberry Fire while preparing for prescribed burn experiments that took place in the Geneva State Forest in Alabama on March 28 and at Fort Stewart-Hunter Army Airfield in Georgia from April 14 to 20. The burns were part of a NASA 2025 FireSense Airborne Campaign. https://photojournal.jpl.nasa.gov/catalog/PIA26498
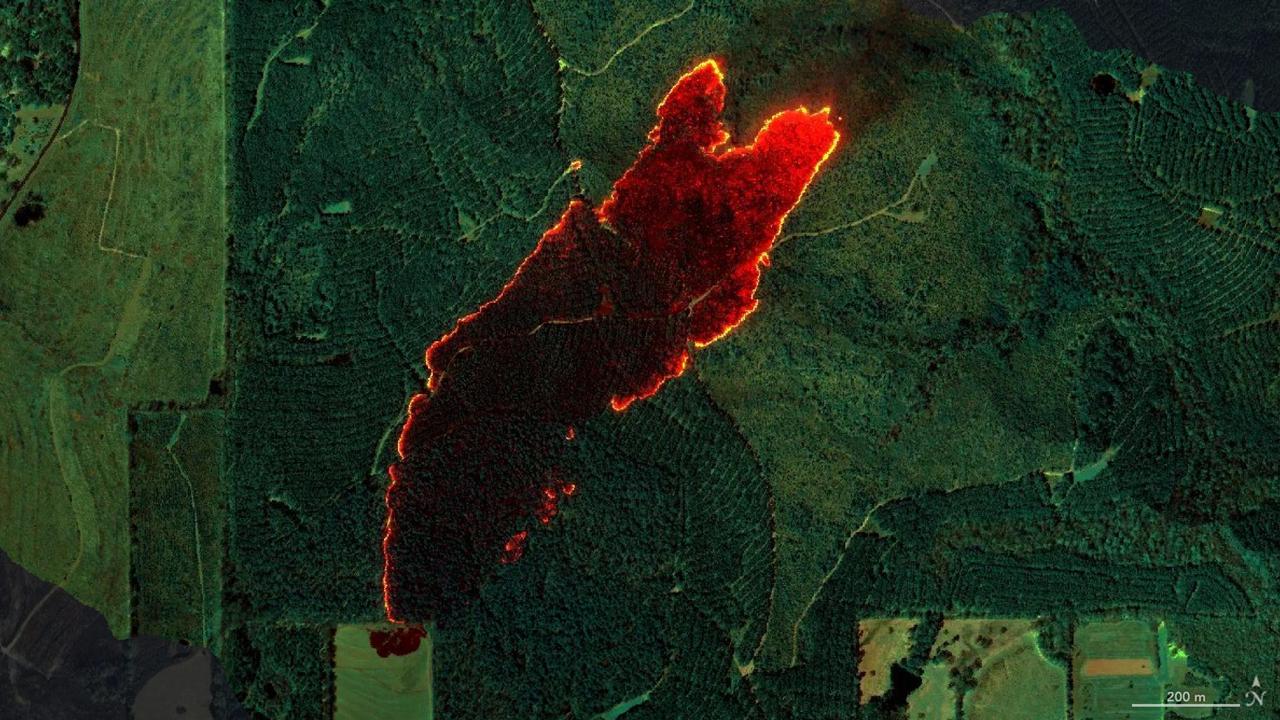
NASA's AVIRIS-3 sensor, an airborne imaging spectrometer built and operated by the agency's Jet Propulsion Laboratory in Southern California, captured infrared data of a roughly 120-acre wildfire about 3 miles (5 kilometers) east of the town of Castleberry, Alabama, on March 19, 2025. Within minutes of flying over the Castleberry Fire, which had not previously been reported to authorities, real-time maps of where burning was most intense were sent via satellite internet to firefighters with the Alabama Forestry Commission, who used it to decide how to deploy their personnel and firefighting equipment. The image combines reflection data from AVIRIS-3 (Airborne Visible Infrared Imaging Spectrometer 3) at three infrared wavelengths that are invisible to the human eye: 2,350 nanometers, 1,200 nanometers, and 1,000 nanometers. In the resulting composite image, the colors indicate where the fire was burning most intensely. Orange and red areas show cooler-burning areas, while yellow indicates the most intense flames. Burned areas show up as dark red or brown. The AVIRIS-3 sensor belongs to a line of imaging spectrometers built at JPL since 1986. The instruments have been used to study a wide range of phenomena – including fire – by measuring sunlight reflecting from the planet's surface. Data from imaging spectrometers like AVIRIS-3 typically takes days or weeks to be processed into highly detailed, multilayer image products used for research. By simplifying the calibration algorithms, researchers were able to process data on a computer aboard the plane in a sliver of the time it otherwise would have taken, and airborne satellite internet connectivity enabled the images to be distributed almost immediately, while the plane was still in flight, rather than after it landed. Flying about 9,000 feet (3,000 meters) in altitude aboard a NASA King Air B200 research plane, AVIRIS-3 collected data on the Castleberry Fire while preparing for prescribed burn experiments that took place in the Geneva State Forest in Alabama on March 28 and at Fort Stewart-Hunter Army Airfield in Georgia from April 14 to 20. The burns were part of a NASA 2025 FireSense Airborne Campaign. https://photojournal.jpl.nasa.gov/catalog/PIA26497
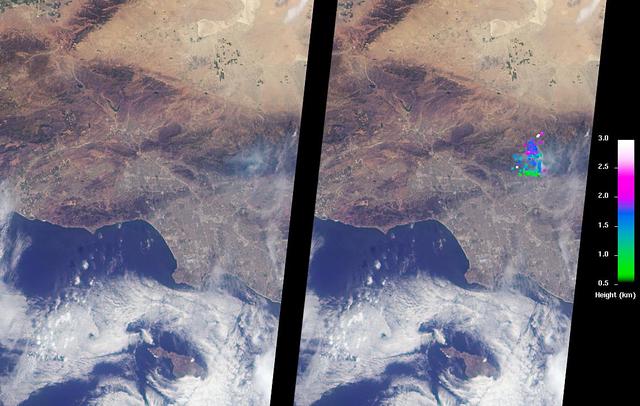
The Los Angeles area is currently suffering the effects of three major wildfires that are blanketing the area with smoke. Over the past few days, Southern California has experienced record-breaking temperatures, topping 110 degrees Fahrenheit in some cities. The heat, in combination with offshore winds, helped to stoke the Sherpa Fire west of Santa Barbara, which has been burning since June 15, 2016. Over the weekend of June 18-19, this fire rapidly expanded in size, forcing freeway closures and evacuations of campgrounds and state beaches. On Monday, June 20, two new fires ignited in the San Gabriel Mountains north of Azusa and Duarte, together dubbed the San Gabriel Complex Fire. They have burned more than 4,900 acres since June 20, sending up plumes of smoke visible to many in the Los Angeles basin and triggering air quality warnings. More than 1,400 personnel have been battling the blazes in the scorching heat, and evacuations were ordered for neighborhoods in the foothills. On June 21, the Multi-angle Imaging SpectroRadiometer (MISR) instrument aboard NASA's Terra satellite captured this view of the San Gabriel Mountains and Los Angeles Basin from its 46-degree forward-viewing camera, which enhances the visibility of the smoke compared to the more conventional nadir (vertical) view. The width of this image is about 75 miles (120 kilometers) across. Smoke from the San Gabriel Complex Fire is visible at the very right of the image. Stereoscopic analysis of MISR's multiple camera angles is used to compute the height of the smoke plume from the San Gabriel Complex Fire. In the right-hand image, these heights are superimposed on the underlying image. The color scale shows that the plume is not much higher than the surrounding mountains. As a result, much of the smoke is confined to the local area. http://photojournal.jpl.nasa.gov/catalog/PIA20718
NASA's Advanced Spaceborne Thermal Emission and Reflection Radiometer (ASTER) instrument imaged areas burned by the Bighorn Fire north of Tucson, Arizona, on June 29. In the image, vegetation is shown in red and burned areas are shown in dark gray. It covers an area of 20 by 30 miles (33 by 48 kilometers). https://photojournal.jpl.nasa.gov/catalog/PIA23691
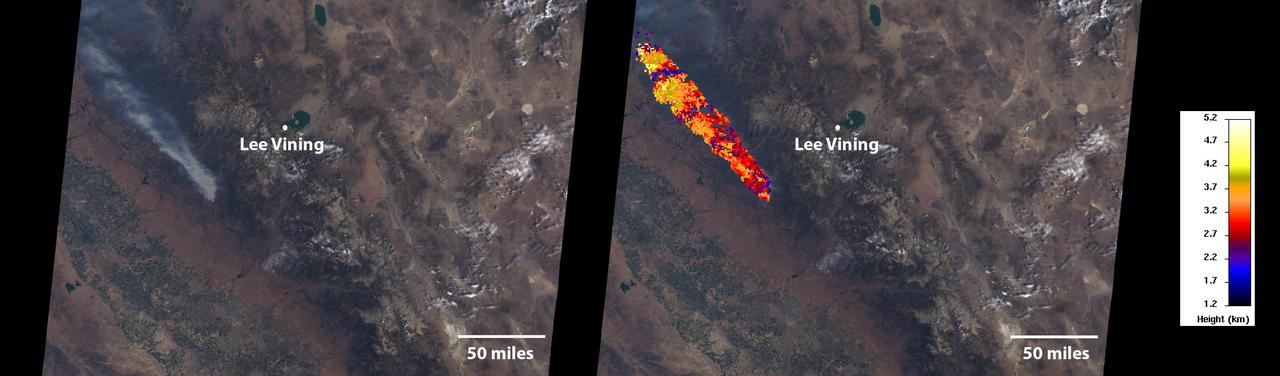
On July 24, 2022, the Multi-angle Imaging SpectroRadiometer (MISR) instrument aboard NASA's Terra satellite captured data on a smoke plume from the Oak Fire burning near Yosemite National Park in California. As of July 26, the Oak Fire had scorched more than 18,000 acres (7,284 hectares) and was 26% contained, with thousands of residents under evacuation orders. Hot, dry air, along with vegetation parched from years of drought, fueled the fire's rapid spread. The MISR instrument contains nine cameras that view Earth at different angles. The left panel in the image above shows an image captured by MISR's nadir (downward-pointing) camera of a smoke plume from the fire. Although the fire was burning near Yosemite at the time, it wasn't a threat to the national park. The panel on the right indicates the height of various parts of the plume as measured by several of MISR's cameras. Yellow areas are higher than the red and blue regions in the smoke plume. The height of the plume top near the active fire was about 17,060 feet (5,200 meters), or roughly 3 miles (nearly 5 kilometers). In general, higher-altitude plumes transport smoke greater distances from the source, impacting communities downwind. On the day the images were captured, unhealthy-to-hazardous air quality was reported in the area around Lake Tahoe and Truckee, about 125 miles (200 kilometers) north of the fire. MISR researchers calculate smoke plume height using the publicly available MISR INteractive eXplorer (MINX) software tool. https://photojournal.jpl.nasa.gov/catalog/PIA24907
Fires began near the Chernobyl Nuclear Power Plant in Ukraine April 4, 2020. By April 14, the fires were nearly extinguished. On April 16, new fires erupted, sending large, dark gray clouds of smoke traveling over 750 km to the southeast. The ASTER image, acquired April 18, shows part of the billowing smoke plume. The image covers an area of 59.2 by 61.4 km, and is located near 51 degrees north, 30.1 degrees east. https://photojournal.jpl.nasa.gov/catalog/PIA23911
Data from the Multi-angle Imaging SpectroRadiometer (MISR) instrument aboard NASA's Terra satellite was used to produce this stereo anaglyph of the Woolsey Fire in southern California on Nov. 11, 2018. It shows a three-dimensional view of the smoke plume -- visible through red-blue 3D glasses. https://photojournal.jpl.nasa.gov/catalog/PIA22817
While the Thomas fire in Ventura County, CA is the largest and most destructive, several other smaller fires burned in the Los Angeles area. The Creek fire destroyed 123 buildings and consumed over 15,000 acres. The smaller Rye fire burned 6,000 acres and destroyed 9 structures. The image was acquired December 17, 2017, covers an area of 9.7 by 13.5 kilometers, and is located at 34.4 degrees north, 118.5 degrees west. https://photojournal.jpl.nasa.gov/catalog/PIA22149
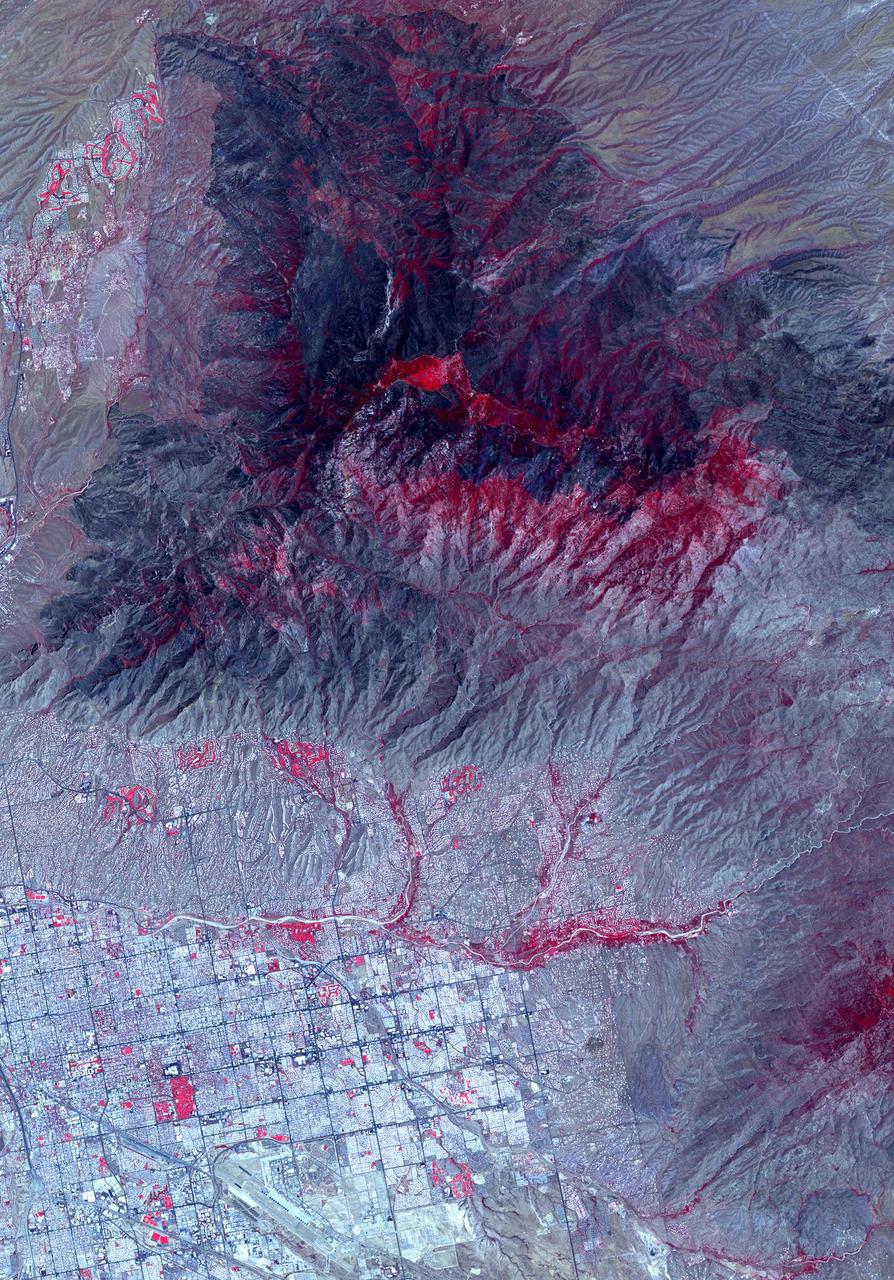
In San Bernardino County, California, the Blue Cut fire burned ferociously for one week starting Aug. 16, 2016. By the time it was contained, it had burned 36,000 acres and destroyed 105 homes. More than 80,000 people were affected by evacuation orders. Ten days after containment, the Advanced Spaceborne Thermal Emission and Reflection Radiometer (ASTER) instrument on NASA's Terra spacecraft captured this image of the region, highlighting the extent of the damage. Healthy vegetation is depicted in red, with burnt areas in the mountains and fields shown in shades of black. The image, acquired Sept. 3, covers an area of 14 by 17 miles (22 by 27 kilometers), and is located at 34.3 degrees north, 117.5 degrees west. http://photojournal.jpl.nasa.gov/catalog/PIA20899
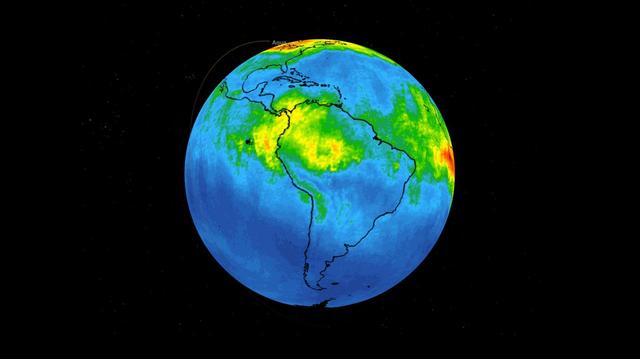
This time series shows carbon monoxide associated with fires from the Amazon region in Brazil from Aug. 8-22, 2019. The images show carbon monoxide at an hPA — a common unit of measurement for atmospheric pressure — of 500, or approximately 18,000 feet (5,500 meters) altitude, made with data collected from the Atmospheric Infrared Sounder (AIRS) on NASA's Aqua satellite. Each "day" in the series is made by averaging three day's-worth of measurements, a technique used to eliminate data gaps. As the series progresses, the carbon monoxide plume blooms in the northwest Amazon region then drifts south and east in a more concentrated plume toward Sao Paulo. Green indicates concentrations of carbon monoxide at approximately 100 parts per billion by volume (ppbv), yellow at approximately 120 ppbv, and dark red at approximately 160 ppbv. It must be noted that local values can be significantly higher. Carbon monoxide is a pollutant that can be transported large distances and persist in the atmosphere for about one month. It plays a role in both air pollution and climate change. Movie available at https://photojournal.jpl.nasa.gov/catalog/PIA23356
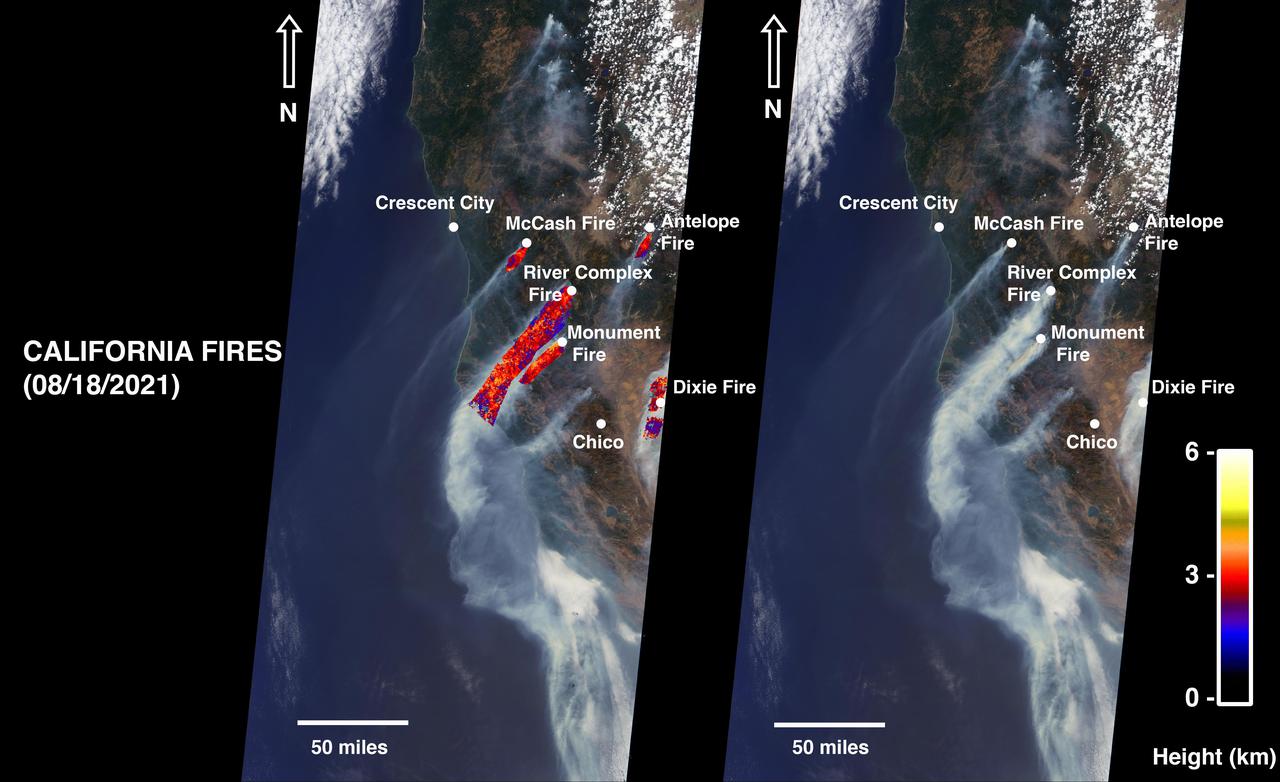
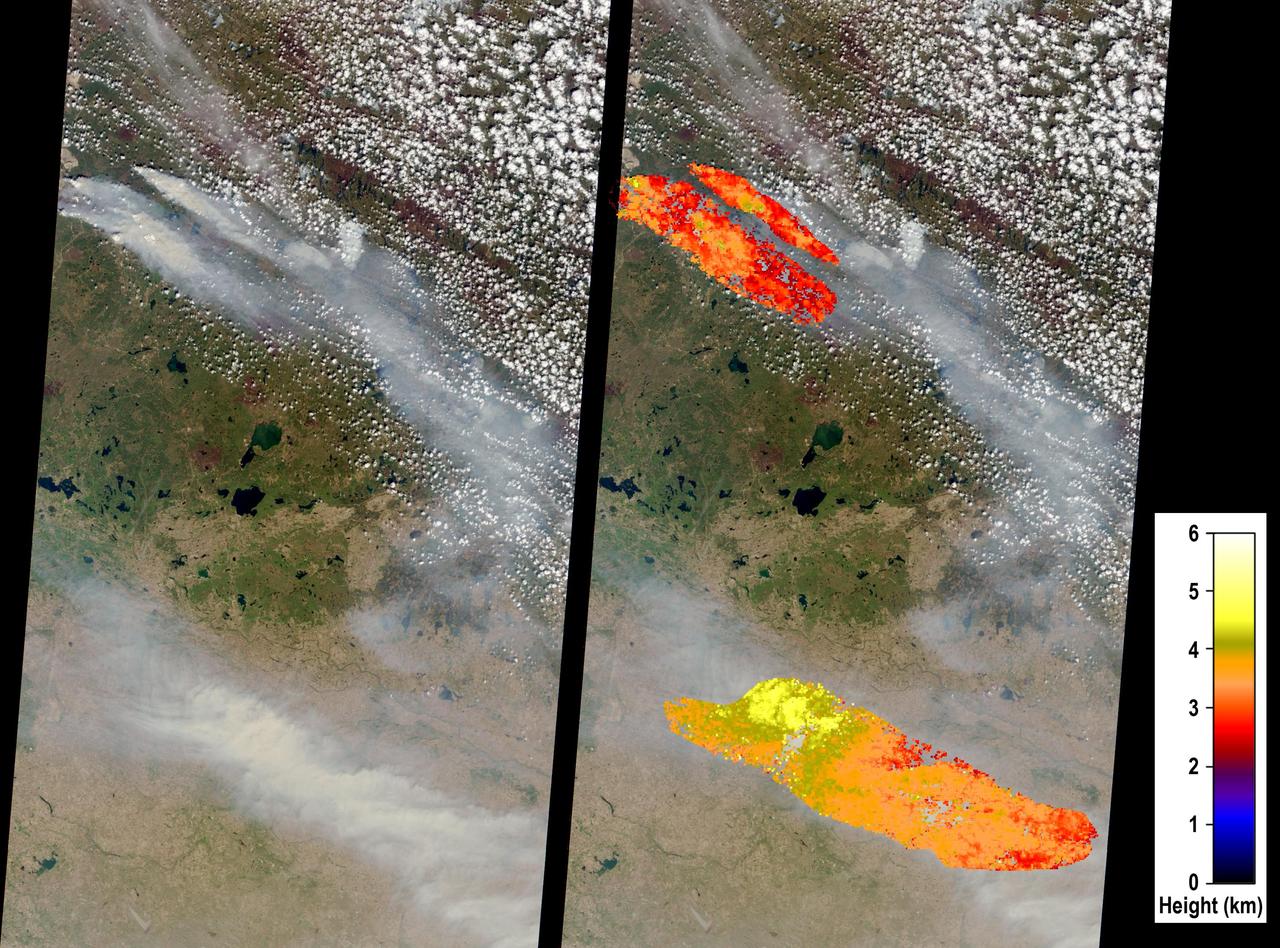
On August 18, 2021, at 12:10 p.m. local time, the Multi-angle Imaging Spectroradiometer (MISR) instrument captured imagery of the McCash, Antelope, River Complex, Monument, and Dixie fires as it passed overhead aboard NASA's Terra satellite. Combined, the fires had burned over 1 million acres as of August 24, 2021. MISR has nine cameras that view Earth at different angles. The right side of the image shows smoke from the five fires as observed by MISR's nadir (downward-pointing) camera. The multi-angular information from MISR's images is used to calculate the height of the smoke plumes. The results of those calculations are shown on the left side of the image. Smoke from areas in red reached an altitude of at least 9,842 feet (3,000 meters). The highest plume top near the active fires reached approximately 19,685 feet (6,000 meters). In general, higher-altitude plumes like this one transport smoke greater distances from the source, impacting communities downwind. In recent weeks, smoke from fires in the Western U.S. and Canada has impacted much of the East Coast. This data was acquired during Terra orbit 115254. The smoke plume height calculation was performed using the publicly available MISR INteractive eXplorer (MINX)software tool. The MISR Plume Height Project maintains a database of global smoke plume heights. https://photojournal.jpl.nasa.gov/catalog/PIA23698
Hawaii's Kilauea volcano continues to create new land as flows from fissure 8, one of the most active to break ground since the eruption began in early May, reach the ocean. The Advanced Spaceborne Thermal Emission and Reflection (ASTER) radiometer instrument on NASA's Terra satellite detected the lava flow of fissure 8 -- which extends from Leilani Estates to the Pacific Ocean -- on July 25. In the image, vegetation is displayed in red, clouds are white and the hot lava flows, detected by ASTER's thermal infrared channels, are overlaid in yellow. The image covers an area of 9.5 by 11.5 miles (15.3 by 18.6 kilometers). https://photojournal.jpl.nasa.gov/catalog/PIA22489
On Aug. 16, 2016, at around 10:30 a.m., a brush fire ignited in the Cajon Pass east of Los Angeles, just to the west of Interstate 15. Within a matter of hours, extreme temperatures, high winds and low humidity allowed the fire to spread rapidly, burning through brush left tinder-dry by years of drought. Firefighters quickly responded, ordering the evacuation of about 83,000 people in and around the Cajon Pass, Wrightwood, Lytle Creek, Oak Hills and surrounding areas. An as-yet uncounted number of homes and structures have burned, and Interstate 15 remains closed to downed power lines and barrier damage. By Aug. 17, the fire had expanded to more than 30,000 acres and remains zero percent contained as some 1,300 firefighters continue to battle to save homes and evacuate residents. The Multi-angle Imaging SpectroRadiometer (MISR) instrument aboard NASA's Terra satellite passed over the region on Aug. 17 around 11:50 a.m. PDT and captured this natural-color image from MISR's 70-degree forward-viewing camera, which covers an areas about 257 miles (414 kilometers) wide. The oblique view angle makes the smoke more apparent than it would be in a more conventional vertical view. The Los Angeles metropolitan area is the large gray area on the coast in the center of the image. Three plumes from the Blue Cut Fire are clearly visible in the mountains to the north. This oblique view also shows an enormous cloud of smoke spreading northeastward over a significant portion of eastern California and Nevada. This smoke probably originated from the fire as it consumed almost 20,000 acres on the evening of the 16th and traveled north overnight. Also visible from this oblique view is considerable haziness filling California's Central Valley, to the northwest of the Blue Cut Fire. This haziness is most likely due to smoke from several other fires burning in California, including the Soberanes Fire near Monterey, the Clayton Fire that has destroyed 175 structures north of San Francisco, the Chimney Fire and the Cedar Fire, which is visible in the image in the southern Sierra Nevada. The total number of acres burned in California this year has tripled in just the past week. The 3D stereo anaglyph is made by combining data from MISR's 60-degree and 70-degree forward-viewing cameras. You will need red-blue glasses to view the 3D effect (ensure the red lens is over your left eye). In order to enable stereo viewing, the image has been rotated so north is to the left. These data were acquired during Terra orbit 88648. http://photojournal.jpl.nasa.gov/catalog/PIA20888
On April 27, 2018, the Tinder Fire ignited in eastern Arizona near the Blue Ridge Reservoir, about 50 miles (80 kilometers) southeast of Flagstaff and 20 miles (32 kilometers) northeast of Payson. During the first 24 hours it remained relatively small at 500 acres (202 hectares), but on April 29, during red flag wind conditions, it exploded to 8,600 acres (3,480 hectares). Residents of rural communities in the area were forced to evacuate and an unknown number of structures were burned. As of April 30, the Tinder Fire had burned a total of 11,400 acres (4,613 hectares). On April 30 at 11:15 a.m. local time, the Multi-angle Imaging SpectroRadiometer (MISR) captured imagery of the Tinder Fire as it passed overhead on NASA's Terra satellite. The MISR instrument has nine cameras that view Earth at different angles. This image shows the view from MISR's nadir (downward-pointing) camera. The angular information from MISR's images is used to calculate the height of the smoke plume, results of which are superimposed on the right-hand image. This shows that the plume top near the active fire was at approximately 13,000 feet altitude (4,000 meters). In general, higher-altitude plumes transport smoke greater distances from the source, impacting communities downwind. A stereo anaglyph providing a three-dimensional view of the plume is also shown. Red-blue glasses with the red lens placed over your left eye are required to observe the 3D effect. These data were acquired during Terra orbit 97691. An annotated figure and anaglyph are available at https://photojournal.jpl.nasa.gov/catalog/PIA00698

39,000 acres (60 square miles, or 160 square kilometers). Thousands of residents were evacuated, and the fire claimed the life of one person. The Multi-angle Imaging SpectroRadiometer (MISR) instrument aboard NASA's Terra satellite passed over the region on July 23 around 11:50 a.m. PDT. At left is an image acquired by MISR's 60-degree forward-viewing camera. The oblique view angle makes the smoke more apparent than it would be in a more conventional vertical view. This cropped image is about 185 miles (300 kilometers) wide. Smoke from the Sand Fire is visible on the right-hand side of the image. Stereoscopic analysis of MISR's multiple camera angles is used to compute the height of the smoke plume from the Sand Fire. In the right-hand image, these heights are superimposed on the underlying image. The color scale shows that the plume extends up to about 4 miles (6 kilometers) above its source in Santa Clarita, but rapidly diminishes in height as winds push it to the southwest. The data compare well with a pilot report issued at Los Angeles International Airport on the evening of July 22, which reported smoke at 15,000-18,000 feet altitude (4.5 to 5.5 kilometers). Air quality warnings were issued for the San Fernando Valley and the western portion of Los Angeles due to this low-hanging smoke. However, data from air quality monitoring instruments seem to indicate that the smoke did not actually reach the ground. These data were captured during Terra orbit 88284. http://photojournal.jpl.nasa.gov/catalog/PIA20724
Thousands of acres damaged by the ongoing Kincade Fire in Northern California's Sonoma County are visible in this new image from the Advanced Spaceborne Thermal Emission and Reflection Radiometer (ASTER) instrument aboard NASA's Terra satellite. The image was taken at 11:01 a.m. PST (2:01 p.m. EST) on Nov. 3, 2019. The burned area appears dark gray in ASTER's visible channels. Hotspots, where the fire is still smoldering, appear as yellow dots in ASTER's heat-sensing, thermal infrared channels. After starting on Oct. 23, forcing residents to evacuate, the fire had burned 77,758 acres and destroyed 372 structures by Nov. 3, according to the California Department of Forestry and Fire Protection. It is now over 80% contained. The town of Healdsburg is in the center of the image, which covers an area of about 24 by 25 miles (39 by 40 kilometers). https://photojournal.jpl.nasa.gov/catalog/PIA23426
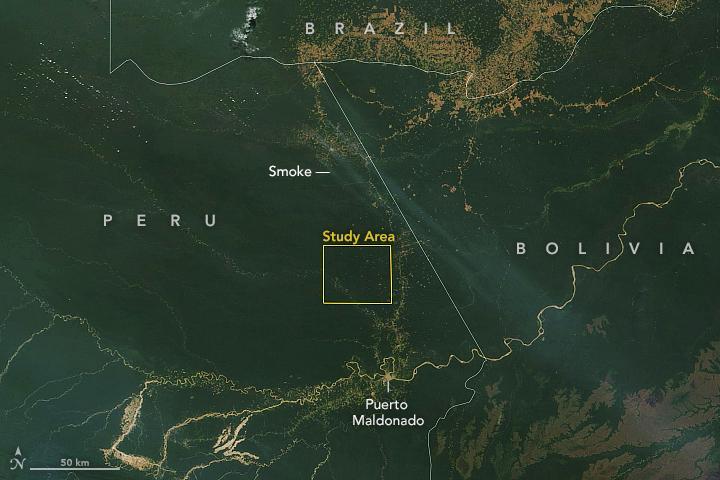
This satellite image, taken by NASA's Earth-observing Terra satellite on Aug. 18, 2019, shows the ECOSTRESS study area in the Amazon Basin and smoke from active fires in the rainforest. ECOSTRESS also captured an image of the Amazon rainforest, PIA23432, revealing water-stressed and non-stressed forest in the area. The water-stressed areas of the forest look as green and healthy as these cooler areas, making them invisible except to a radiometer that can measure thermal infrared energy from the surface. https://photojournal.jpl.nasa.gov/catalog/PIA23546
The Multi-angle Imaging SpectroRadiometer (MISR) instrument on NASA's Terra satellite took this image of the Woolsey Fire in southern California on Nov. 11, 2018. The Woolsey Fire had charred more than 90,000 acres as of Nov. 12, 2018, and was 20-percent contained at that time. https://photojournal.jpl.nasa.gov/catalog/PIA22818
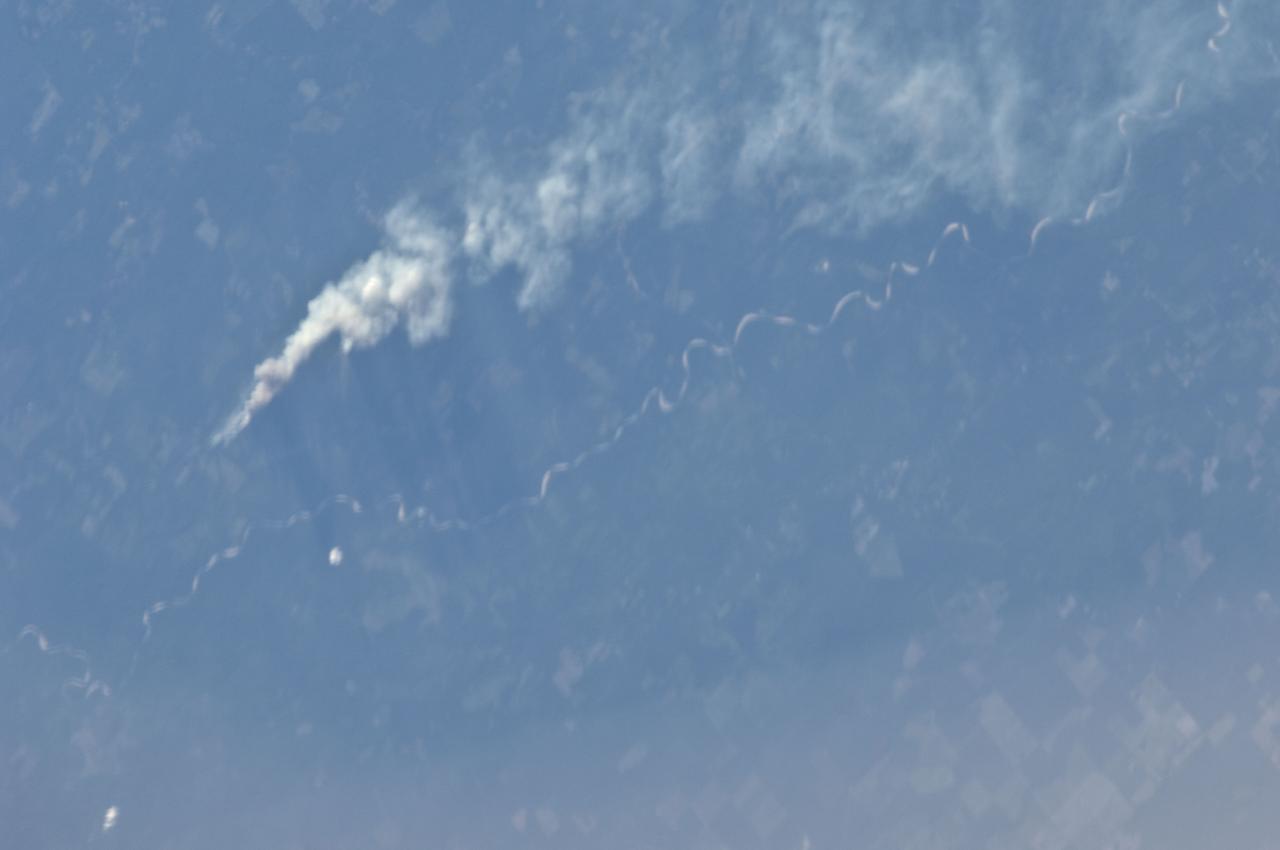
iss063e093344 (Sept. 22, 2020) --- A wildfire is pictured in northern Argentina as the International Space Station was orbiting across the South American continent.
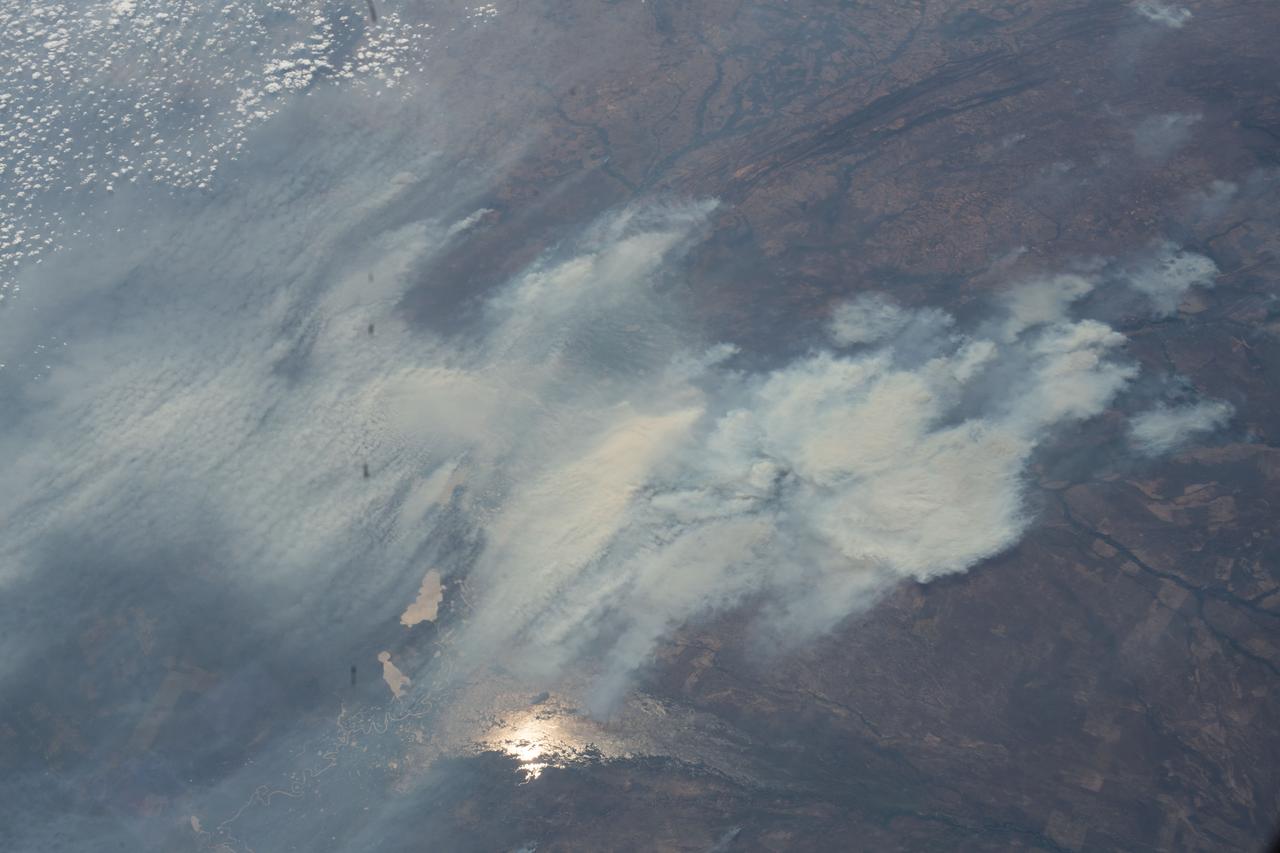
iss069e020311 (June 12, 2023) --- Wildfires in the Canadian province of Quebec are pictured from the International Space Station as it orbited 259 miles above.
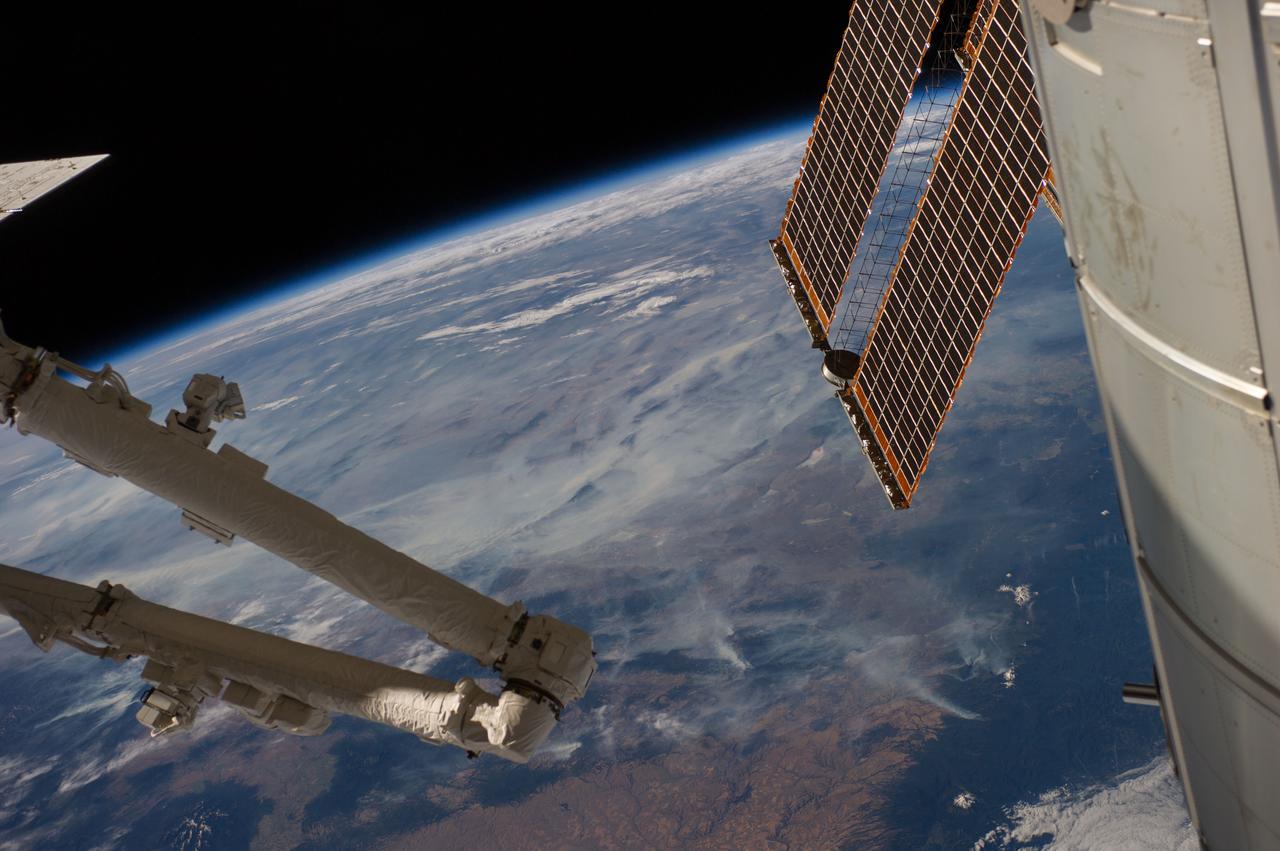
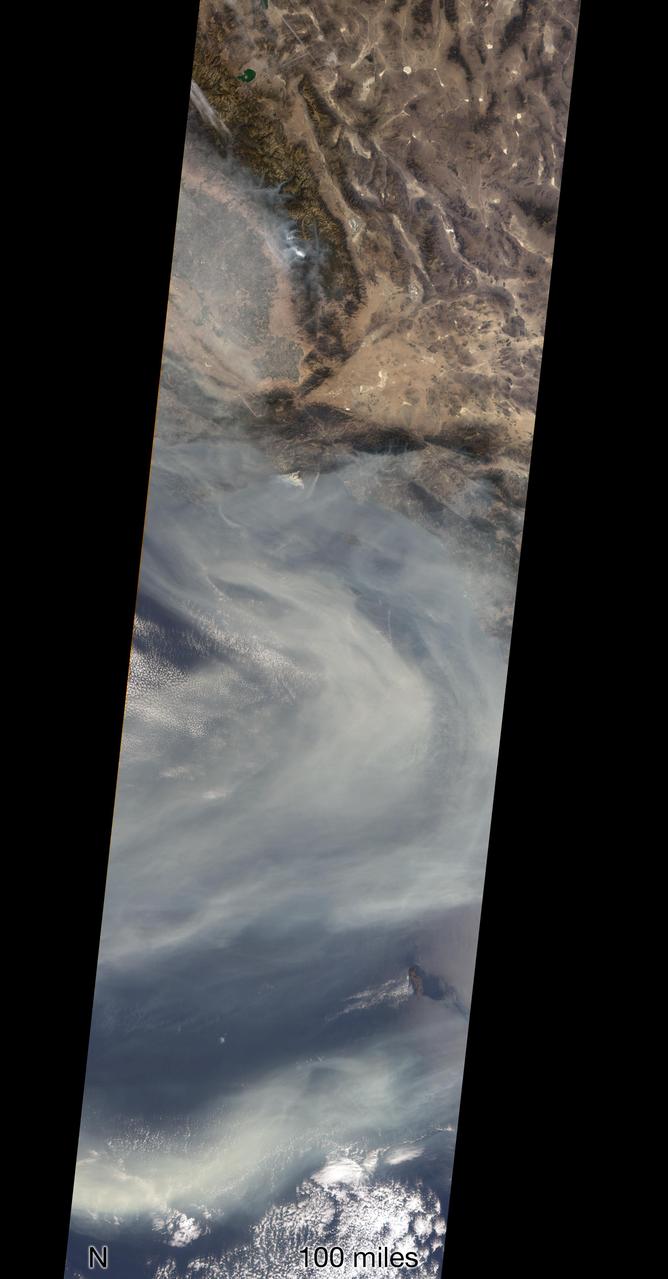
Earth observation taken during day pass by the Expedition 40 crew aboard the International Space Station (ISS). Folder lists this as: Pacific Northwest Wildfires.
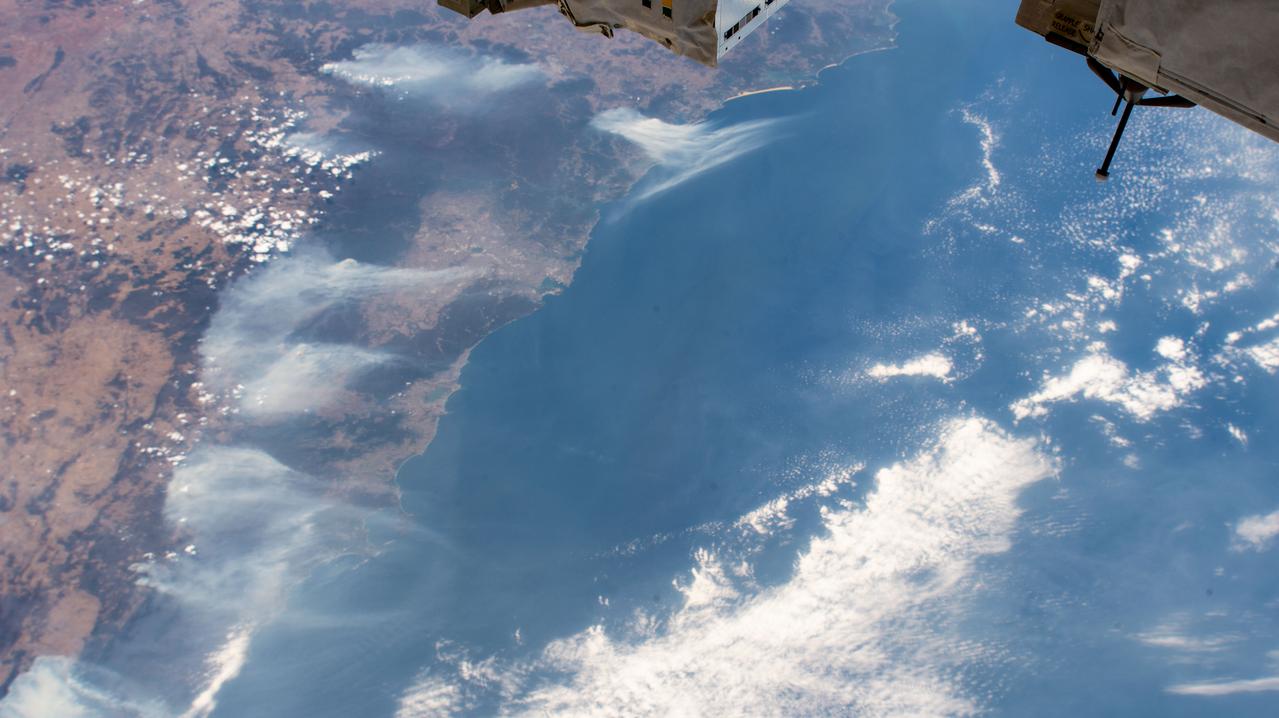
iss061e113753 (Jan. 3, 2020) --- Wildfires are pictured surrounding Sydney, Australia as the International Space Station orbited 269 miles above the Tasman Sea.

NASA's Ikhana remotely piloted aircraft soars over smoky terrain during a wildfire imaging demonstration mission in the late summer of 2007.
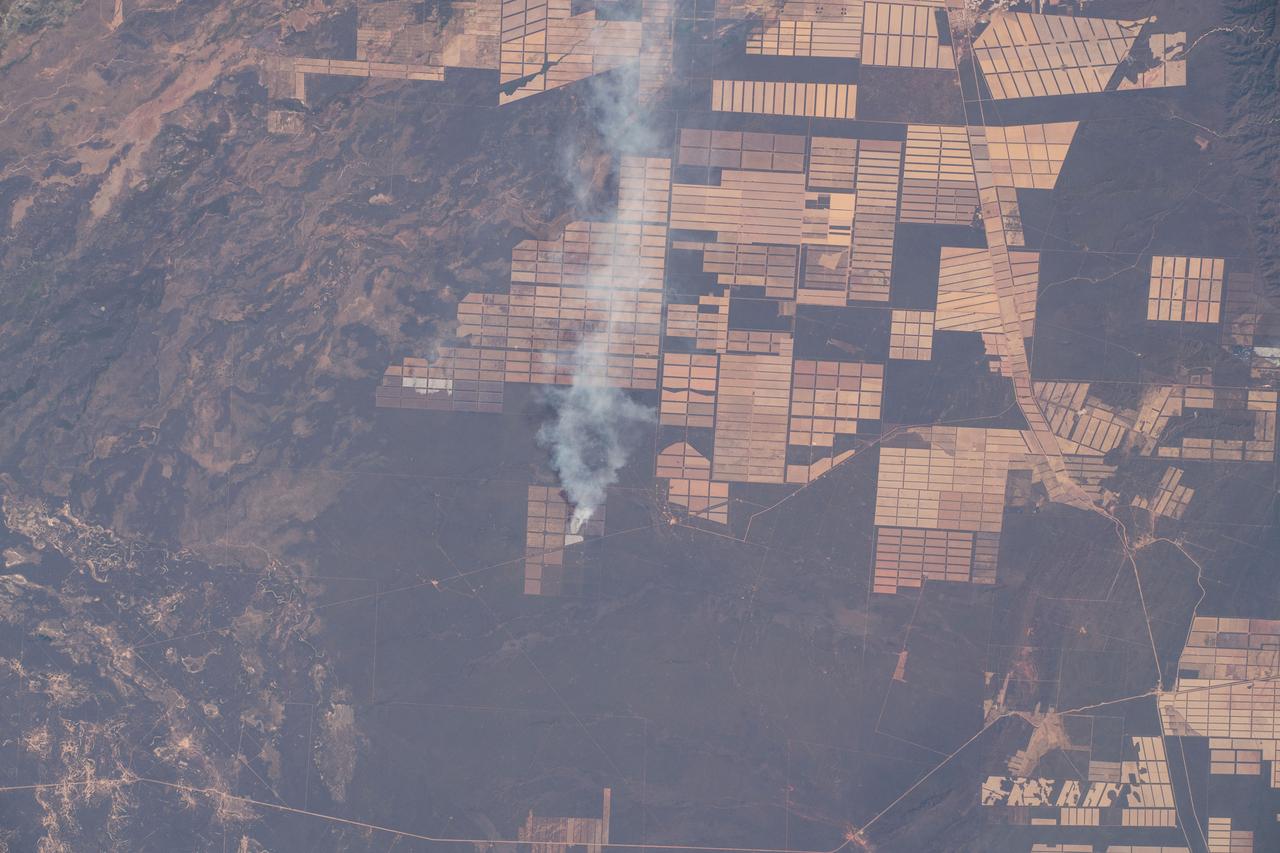
iss063e080404 (Aug. 29, 2020) --- Wildfires are pictured in the Amazon rainforest as the International Space Station orbited above the border between Bolivia and Brazil.
iss071e133475 (May 30, 2024) --- Wildfires in eastern Russia are pictured from the International Space Station as it orbited 264 miles above the China-Russia border.
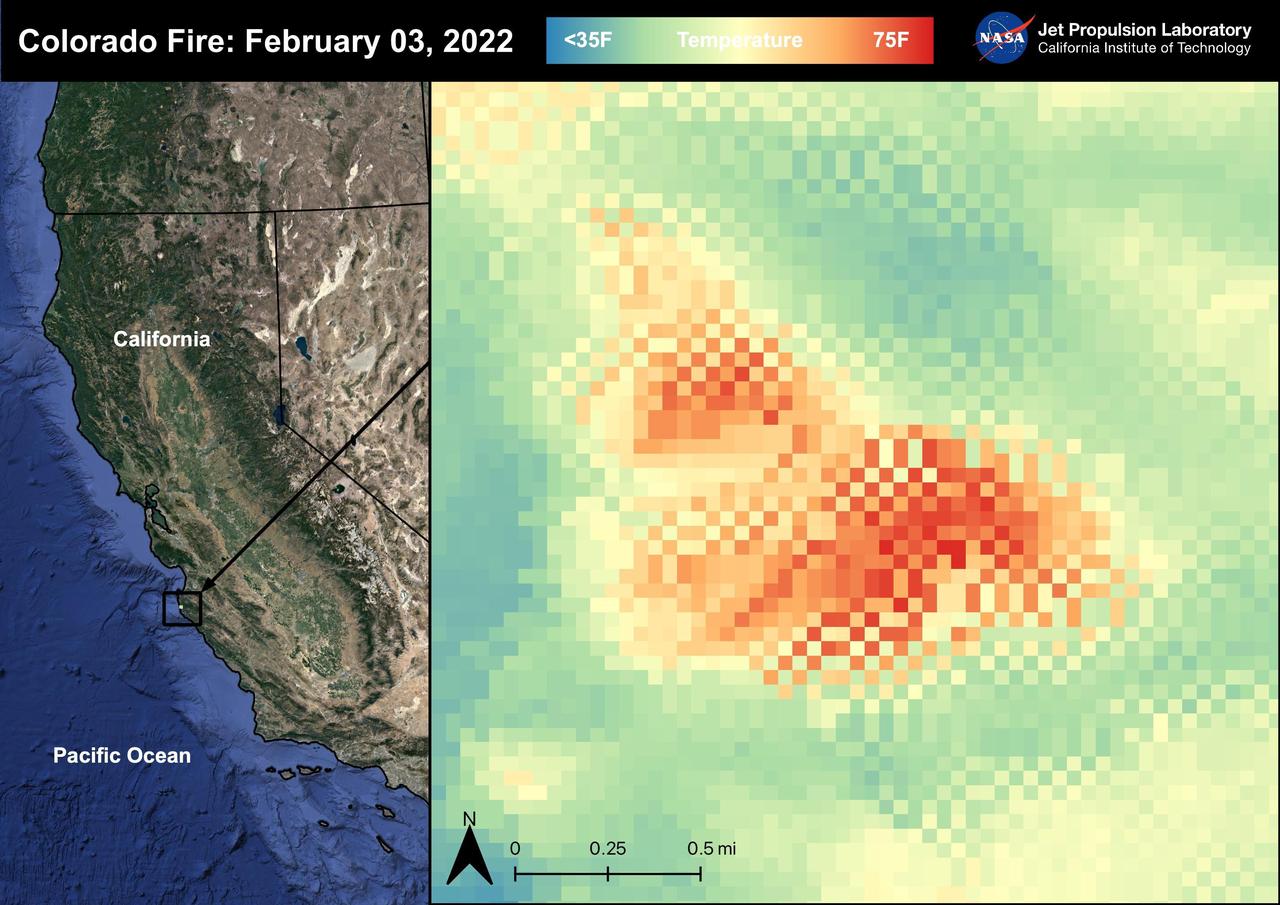
The Colorado Fire began on January 21st, 2022 was started by an escaped fire by the Palo Colorado Road. The wildfire burned 687 acres between Carmel-by-the-Sea and Big Sur. The Colorado Fire was driven towards the coast by strong winds leading to the shut down of the Bixby Bridge and a section of Highway 1. The fire was completely contained as of February 5th, 2022. No injuries or causalities have been reported; one structure was destroyed. The image above shows the fire captured in a Land Surface Temperature image from ECOSTRESS on February 3rd, 2022 at 01:11 PM PDT. As California is currently in a drought, there are concerns that 2022 will see a severe wildfire season; ECOSTRESS allows for the monitoring of the drought and of wildfires. ECOSTRESS is a thermal instrument on the International Space Station that measures the temperature of the ground, which is hotter than the air temperature during the day. It was launched to the space station in 2018. Its primary mission is to identify critical thresholds of water use and water stress in plants and to detect the timing, location, and predictive factors leading to plant water uptake decline and/or cessation. The nature of the high-resolution data provided by ECOSTRESS allows it to record heat related phenomena such as heat waves, droughts and wildfires. https://photojournal.jpl.nasa.gov/catalog/PIA25280