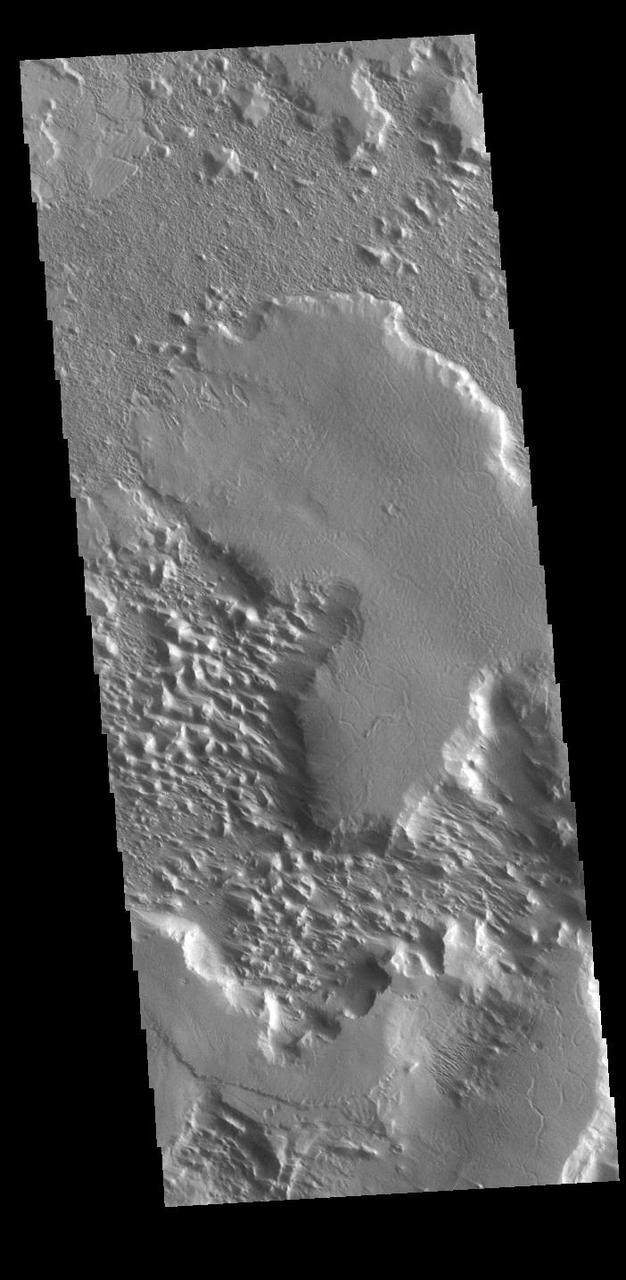
Windtails Show Direction of Martian Winds
This image from NASA Mars Odyssey of part of Meridiani Planum contains windstreaks that formed in several directions around a single crater. This indicates that wind directions changed, forming new tails for each prevailing wind direction.

Researchers Anna Noe and Eric Altman check out the Doppler Aerosol Wind Lidar (DAWN), an airborne instrument that uses pulsed lasers to detect the movement of atmospheric aerosols such as dust or sea salt. In detecting those movements, it can profile wind vector — both speed and direction. Researchers are testing DAWNs capabilities during flights over the eastern Pacific.
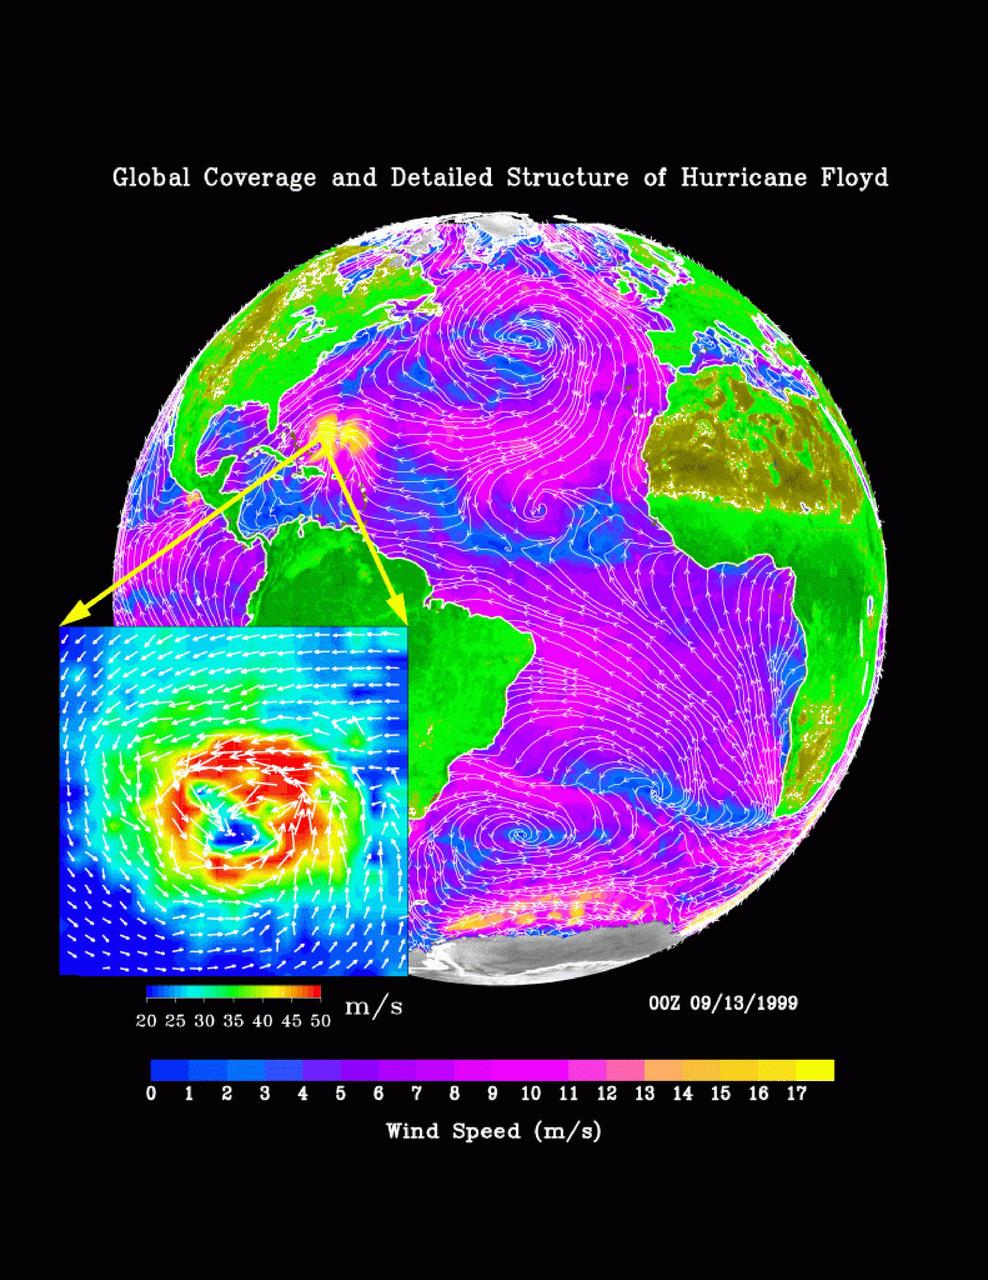
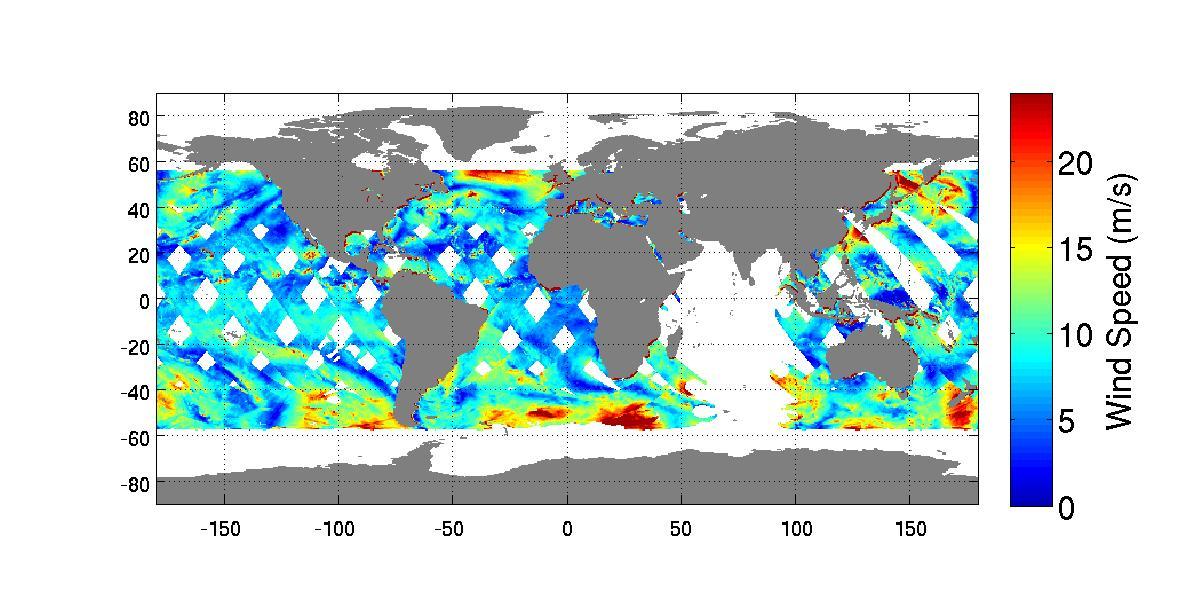
The distribution of ocean surface winds over the Atlantic Ocean, based on September 1999 data from NASA SeaWinds instrument on the QuikScat satellite, shows wind direction, superimposed on the color image indicating wind speed.
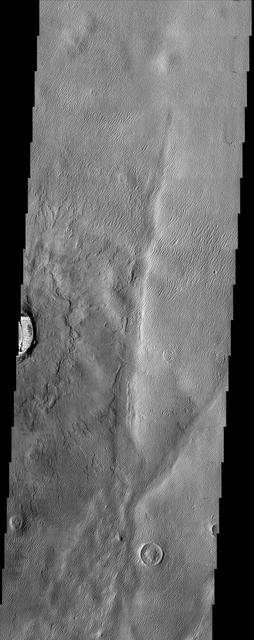
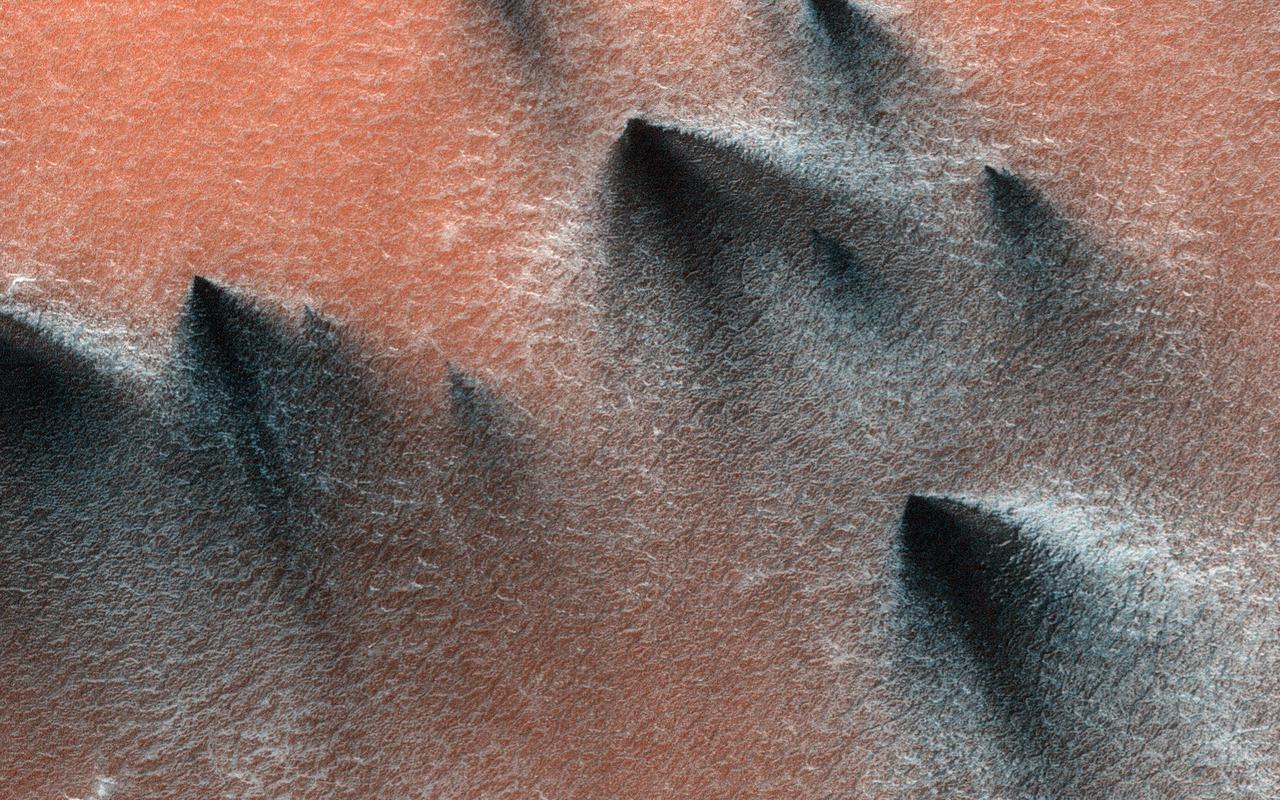
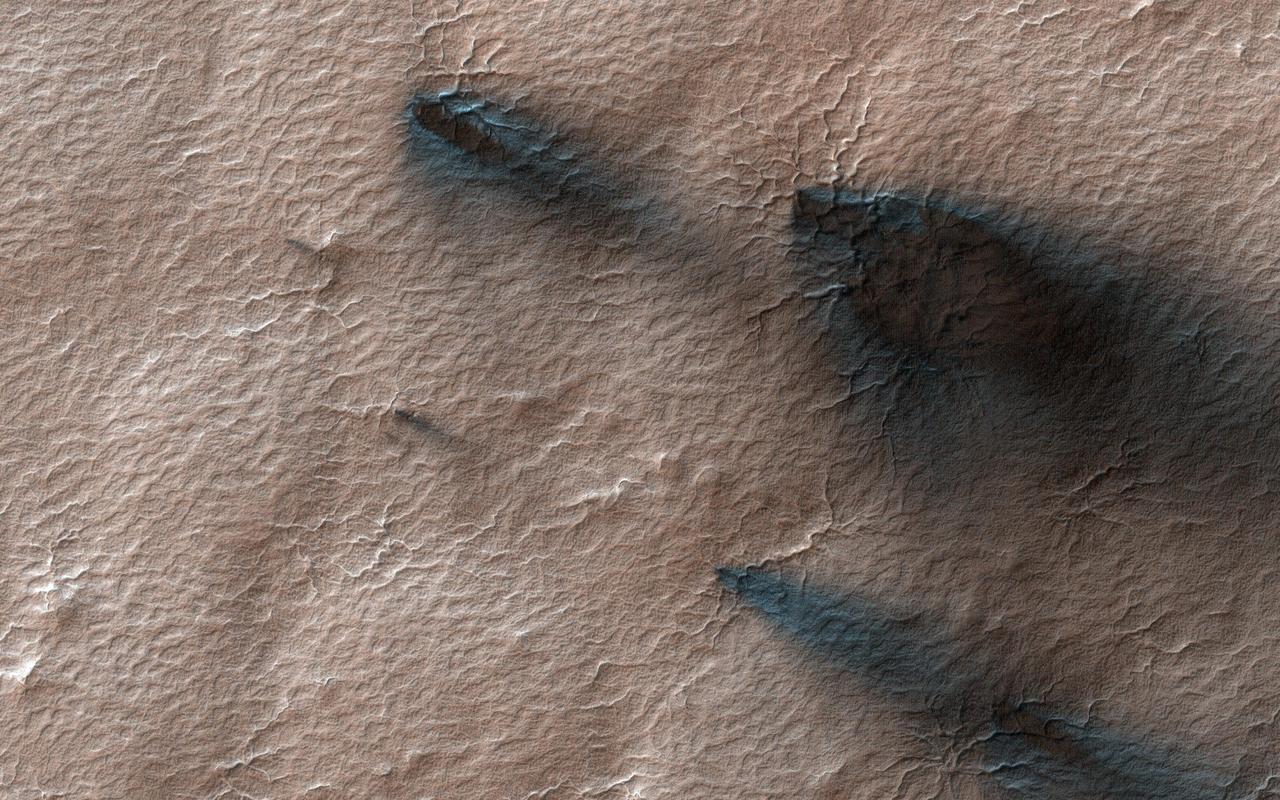
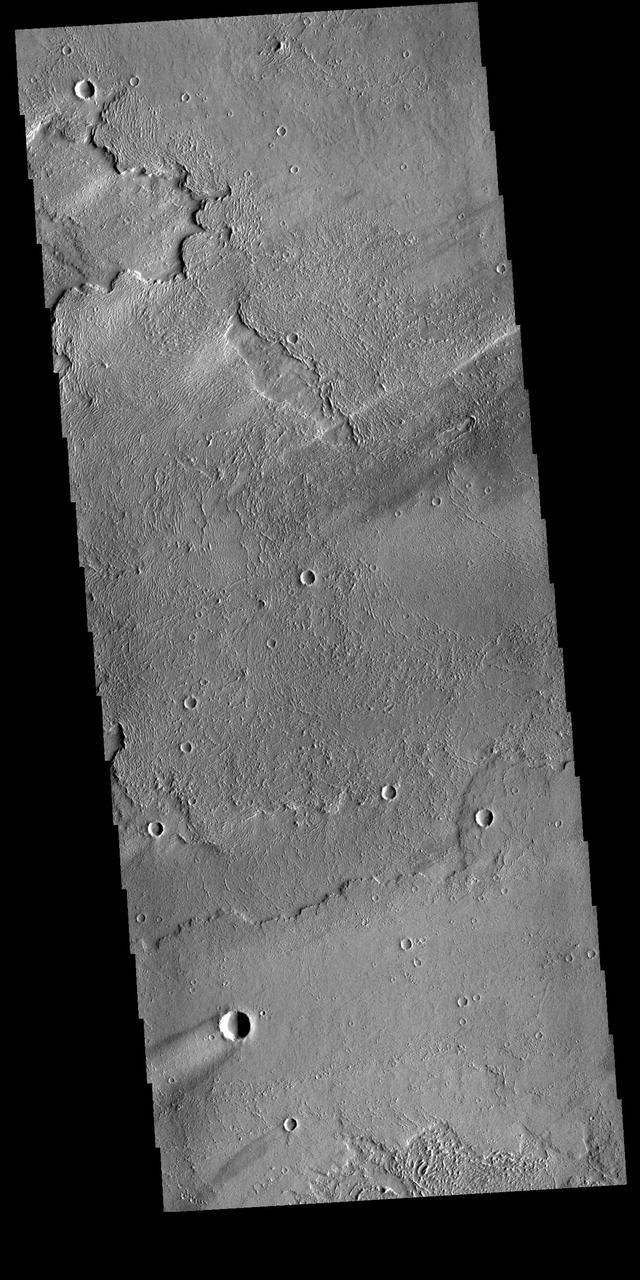
The windstreaks in this area northwest of Schiaparelli Crater point in three different directions. This indicates that the wind shifts/ed with time
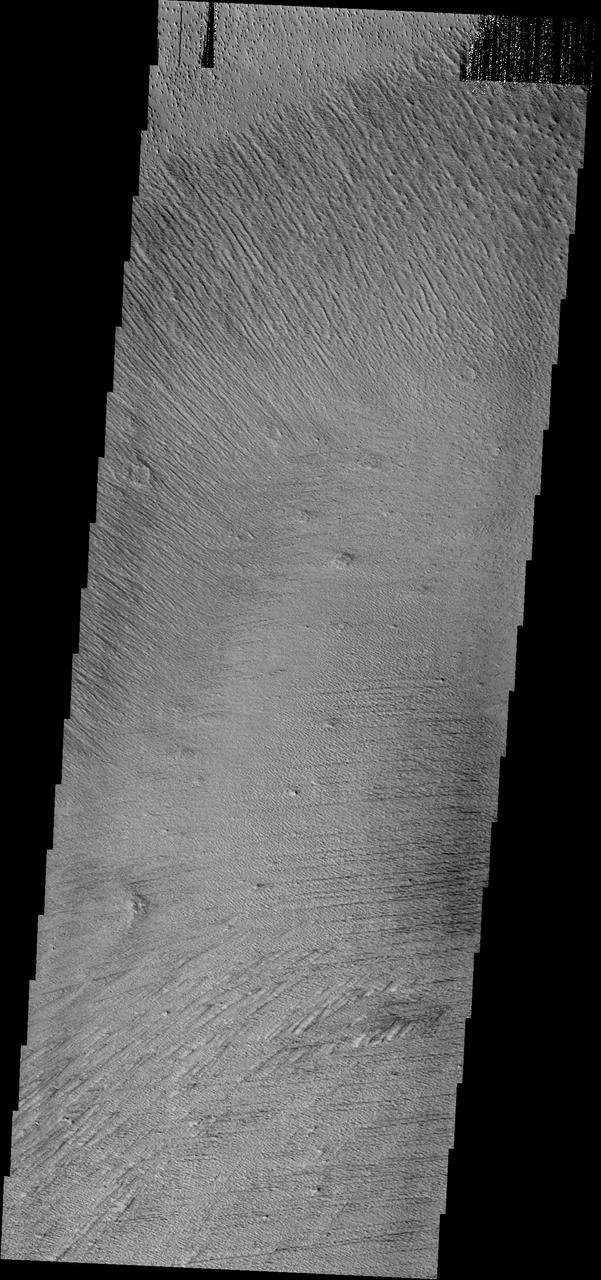
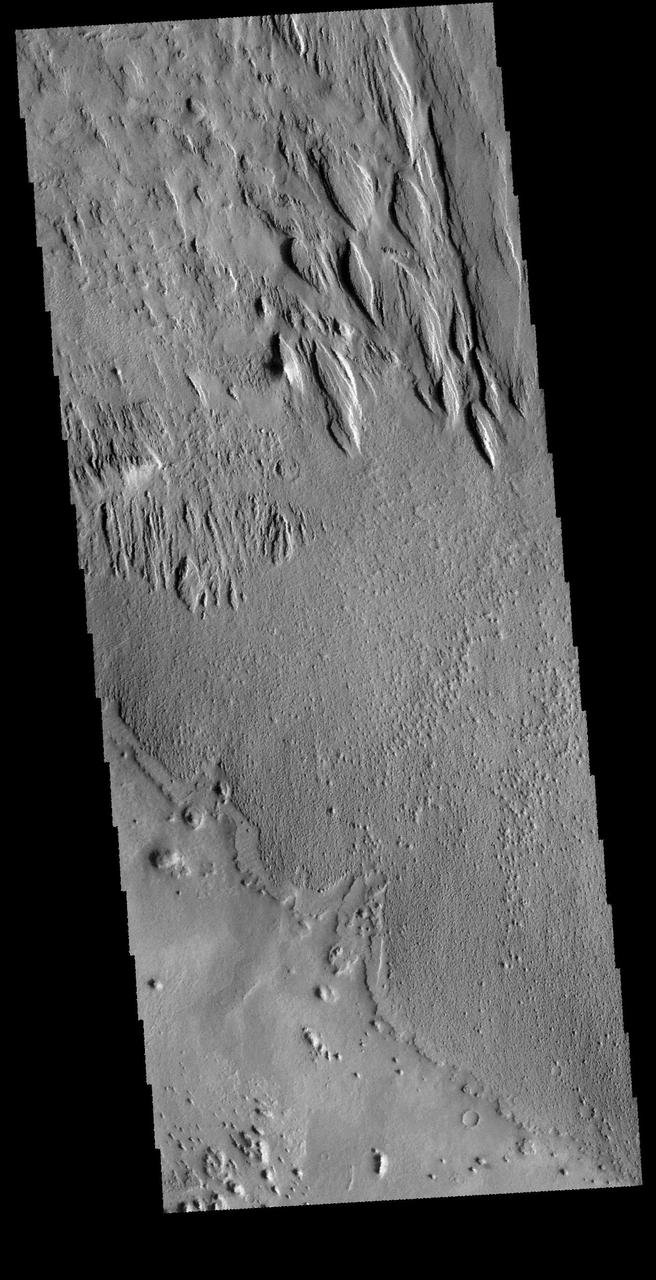
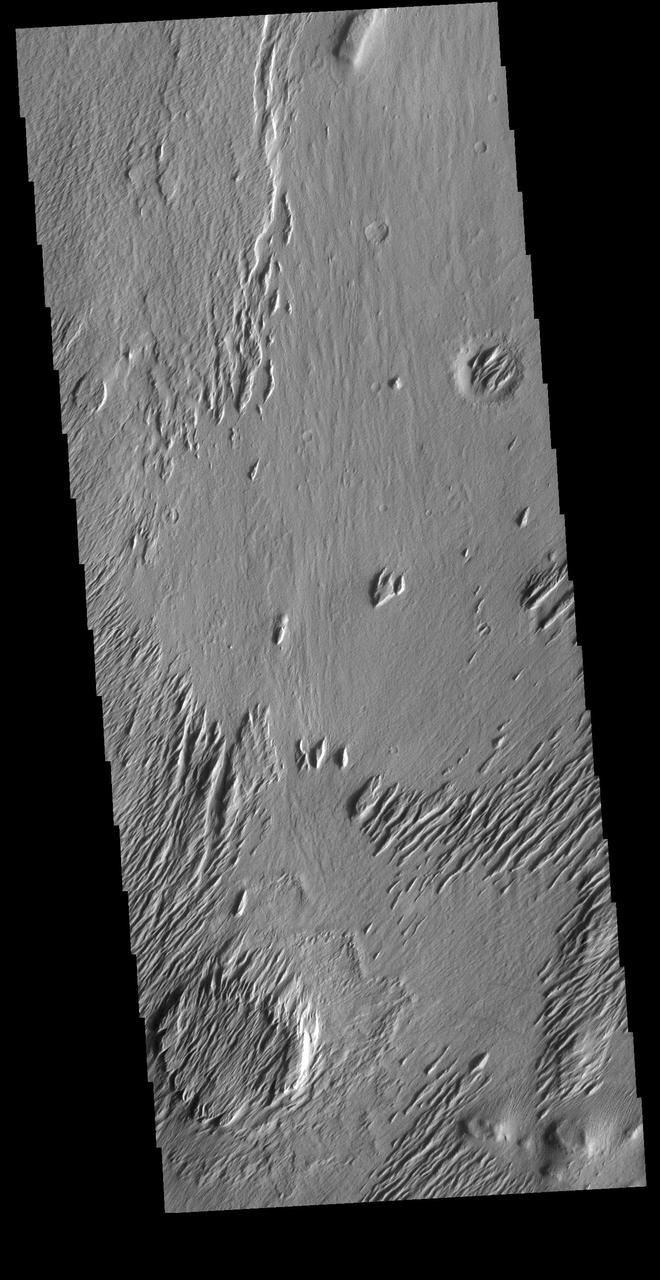
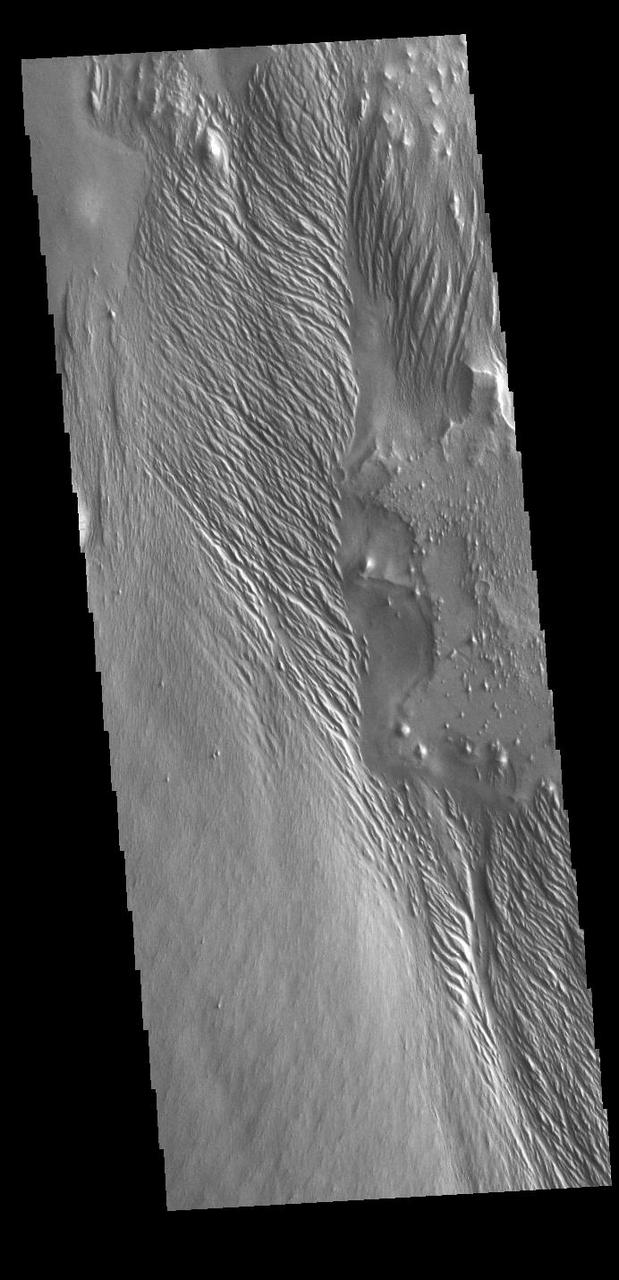
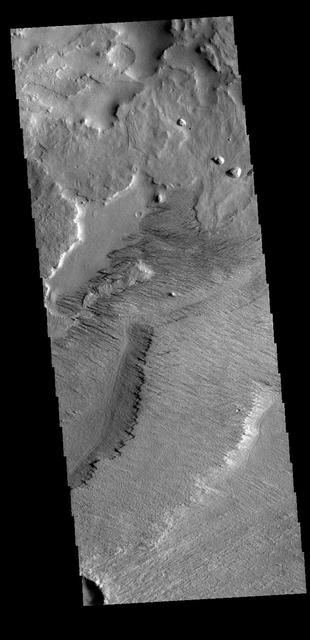
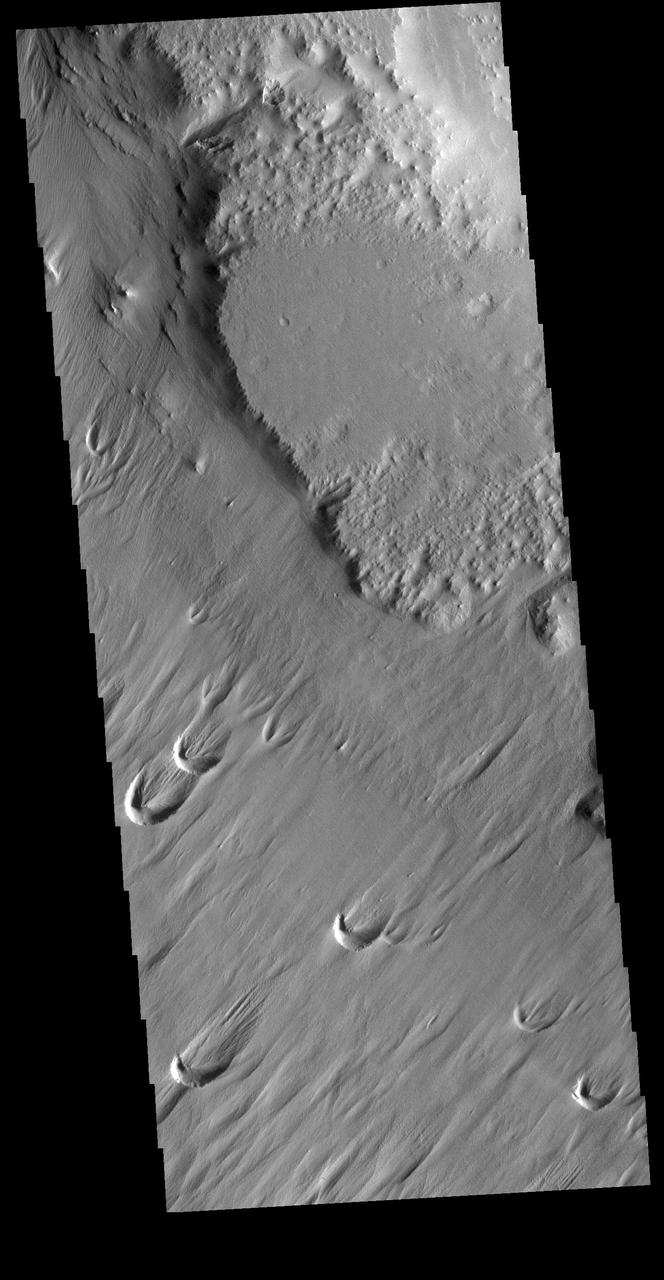
The multiple trends of yardangs in this image indicate that the winds in the Elysium region have changed direction several times
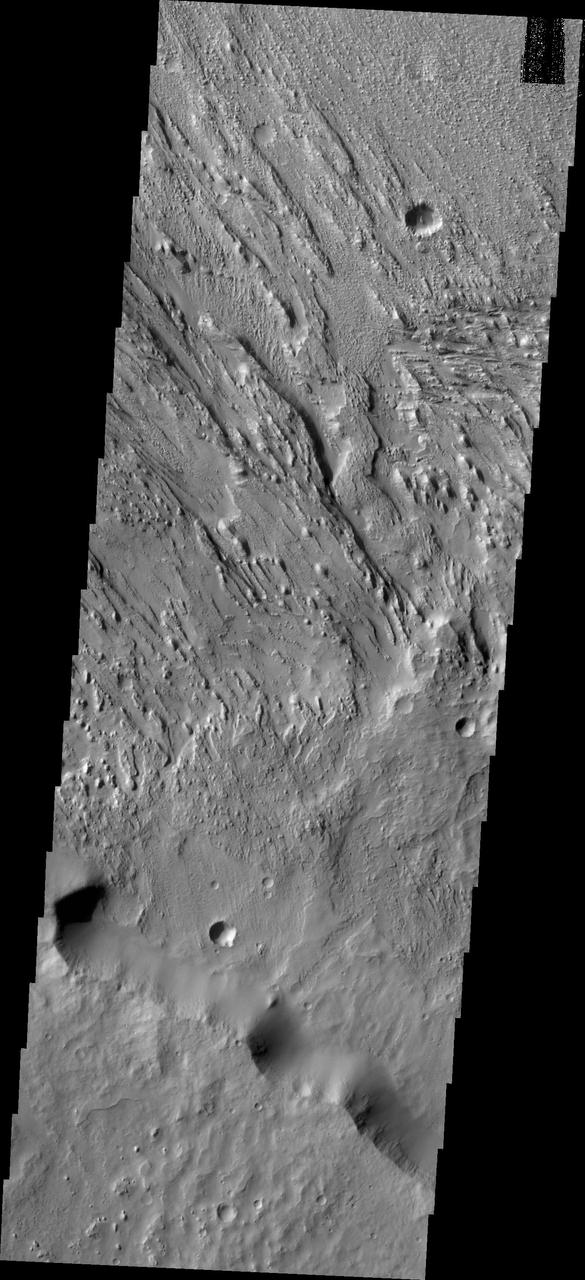
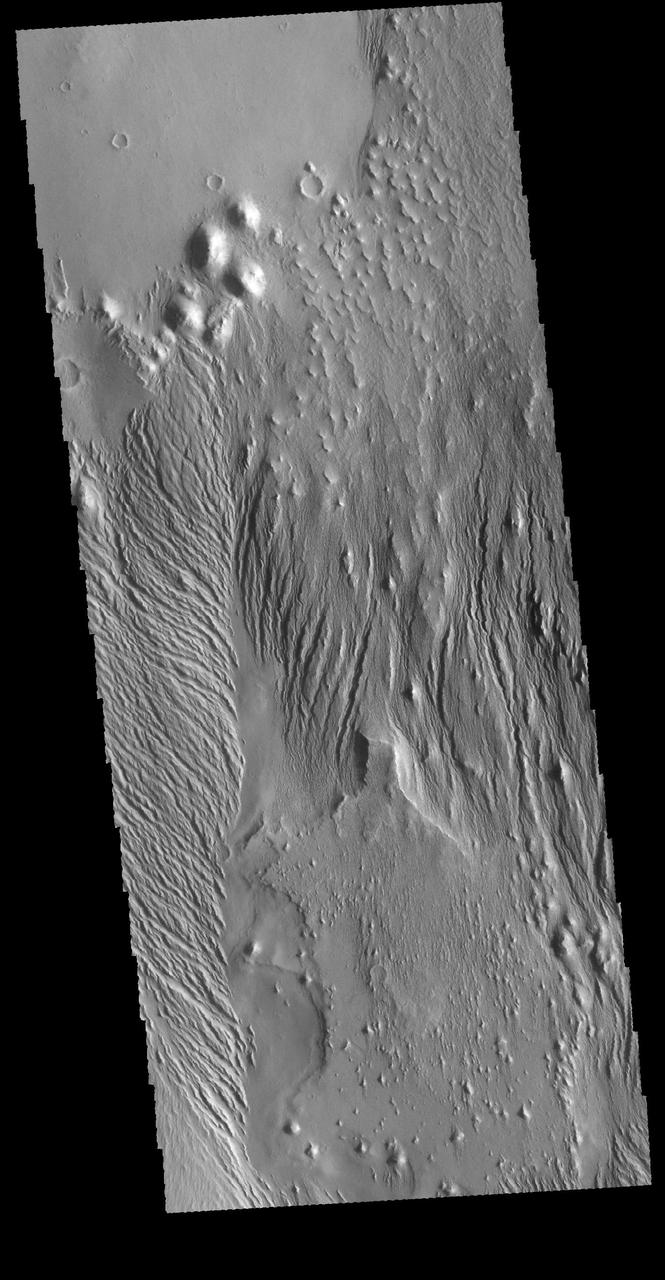
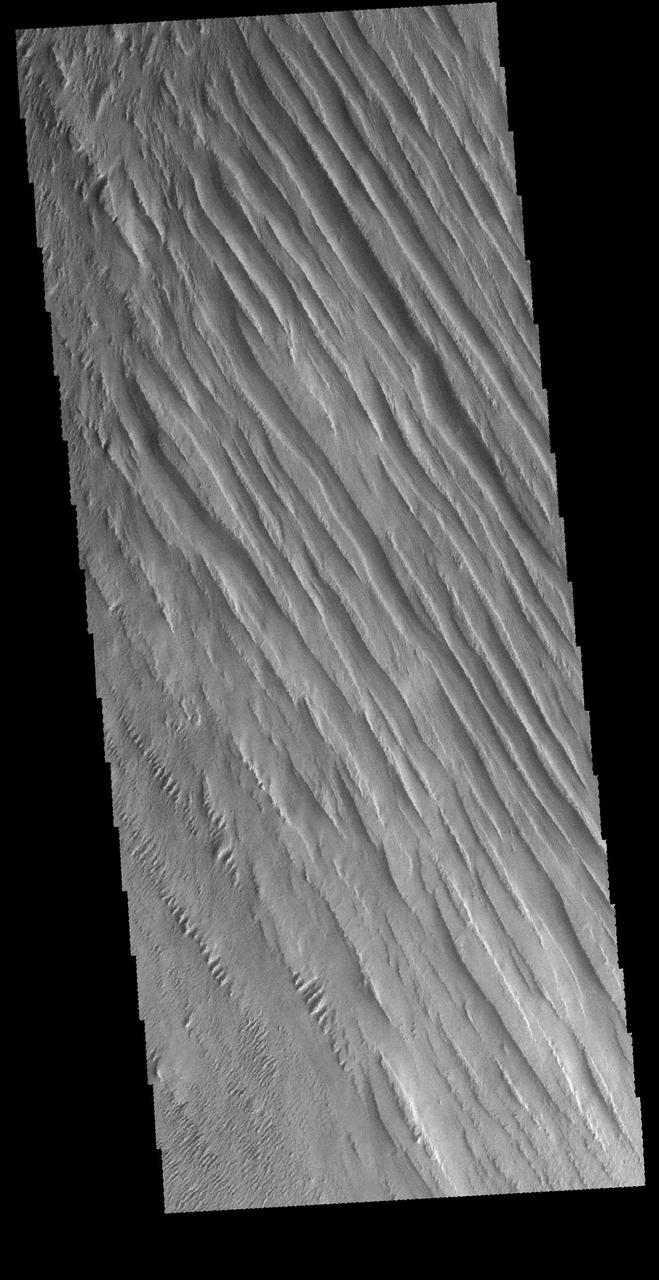
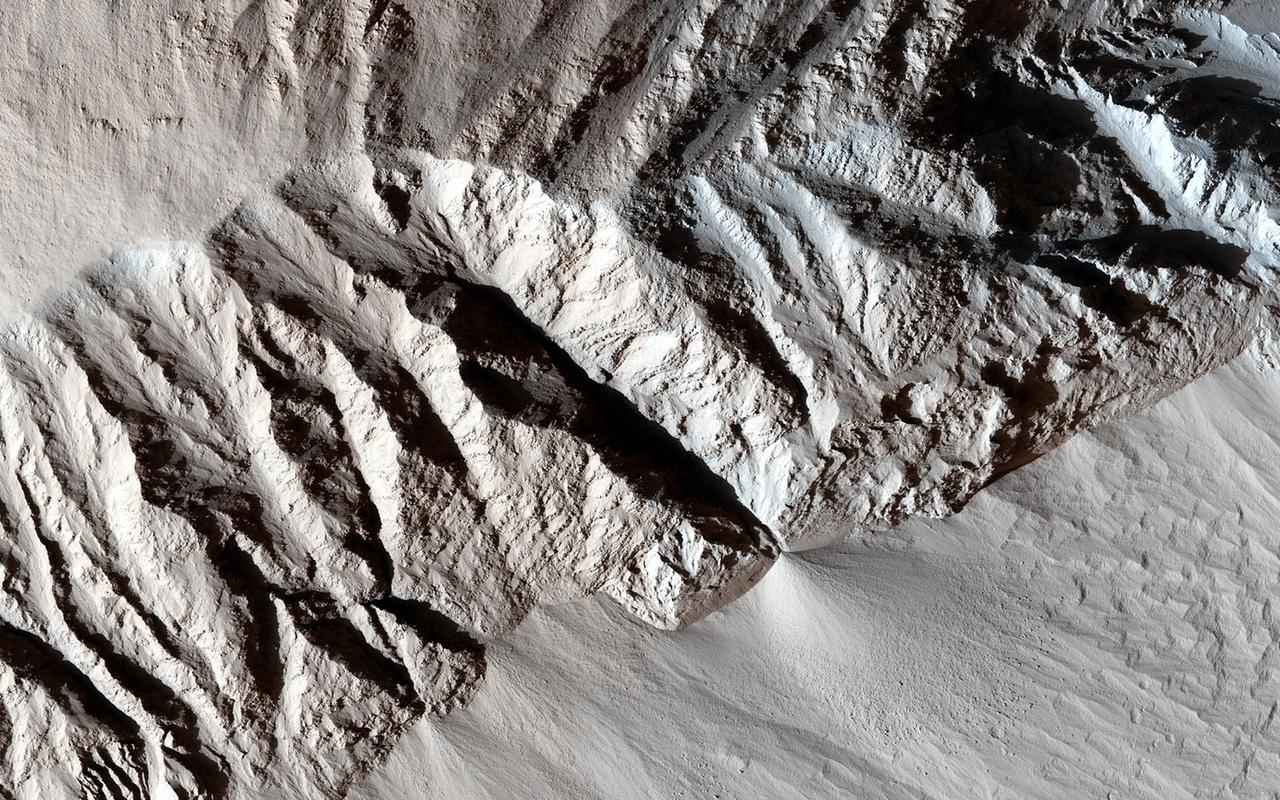
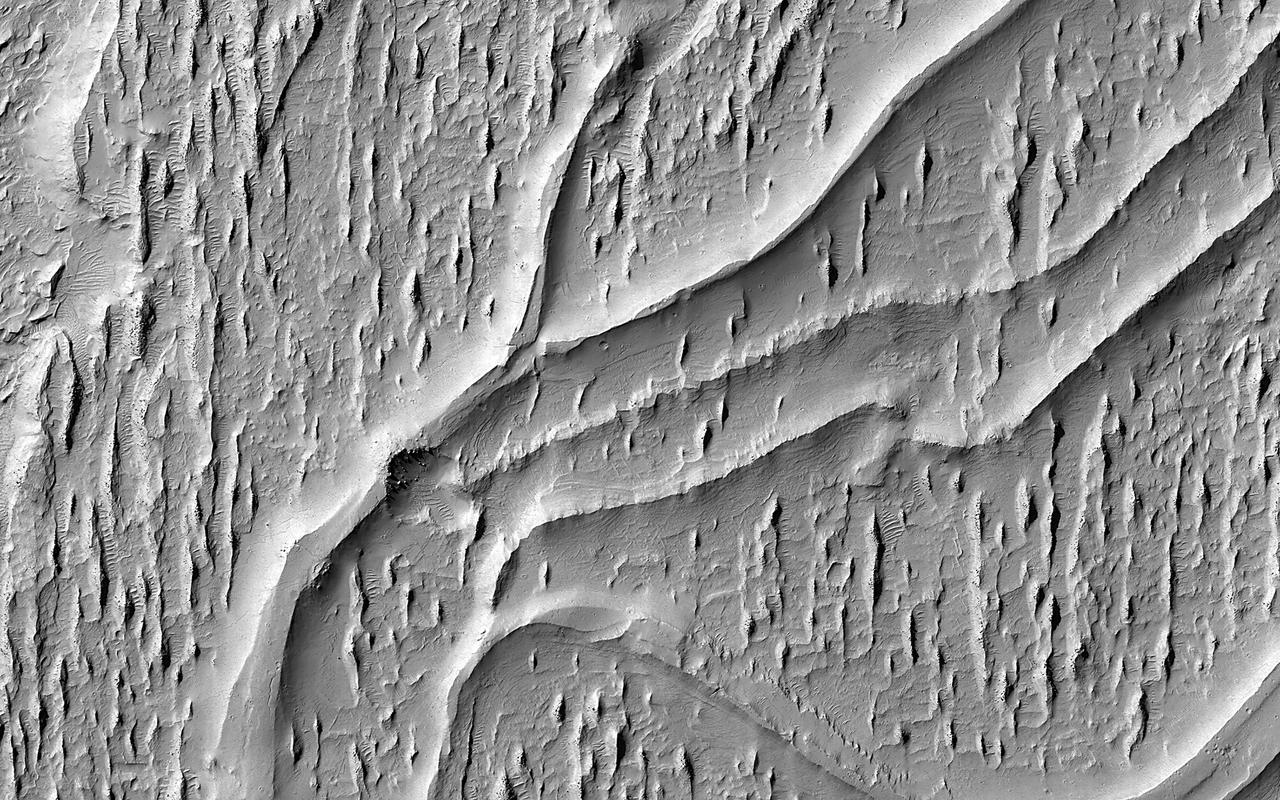
This image from NASA 2001 Mars Odyssey spacecraft shows a region near Memnonia Sulci, which has been eroded by the wind to form linear ridges called yardangs. The two prominent directions of wind are recorded by the two directions of the ridges.
This VIS image shows part of Medusa Fossae. Winds have eroded materials in this region, creating ridges and valleys aligned with the direction of the wind. Orbit Number: 72008 Latitude: -3.47752 Longitude: 199.295 Instrument: VIS Captured: 2018-03-09 07:31 https://photojournal.jpl.nasa.gov/catalog/PIA22510
NASA 2001 Mars Odyssey captured this region of Mars which has been eroded by the wind. Linear hills called yardangs indicate the wind direction, which varies in this area of Medusae Fossae.
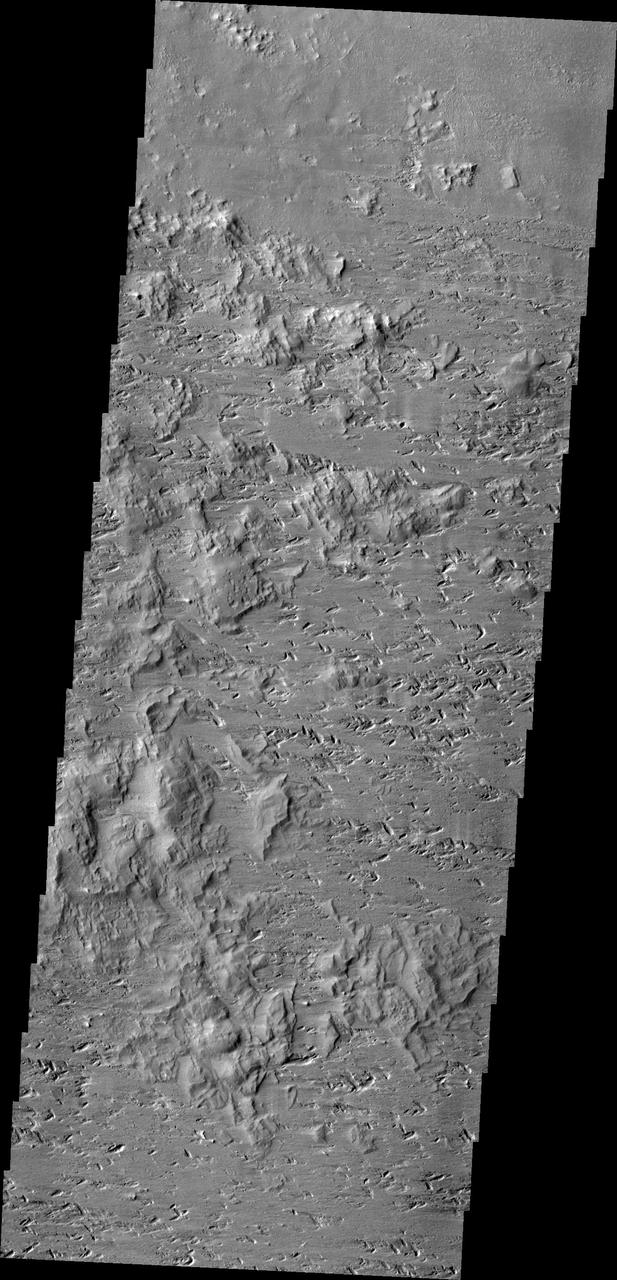
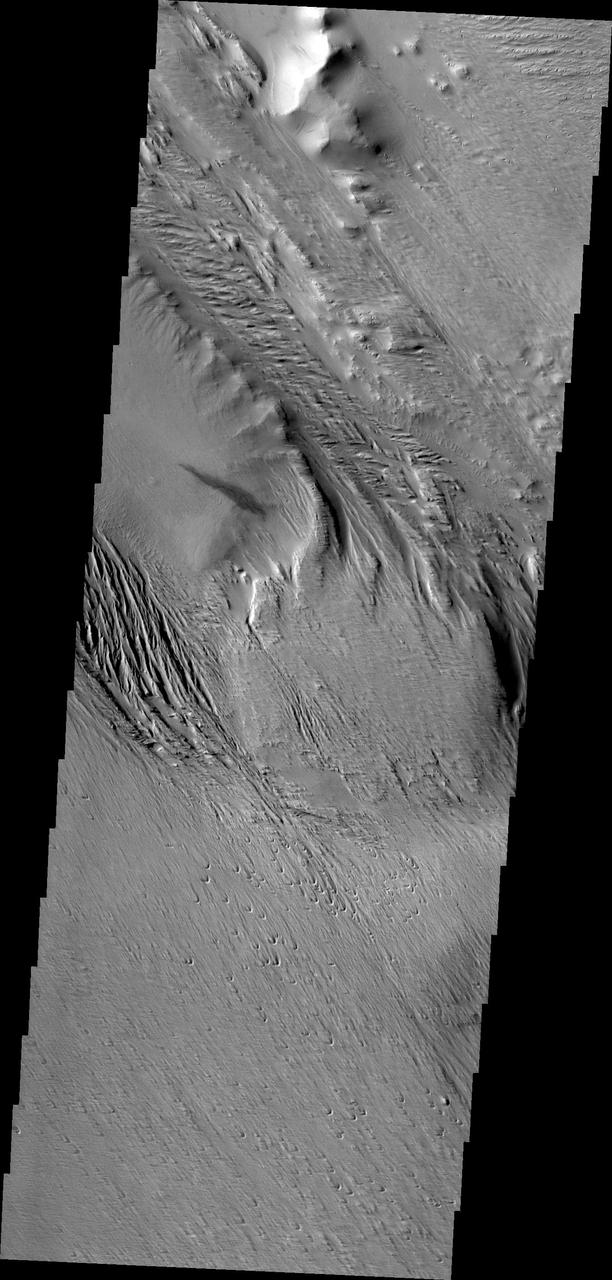
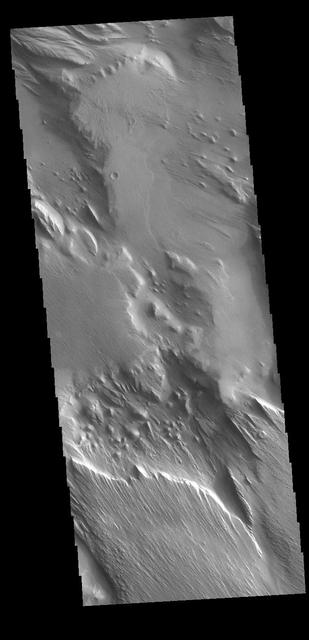
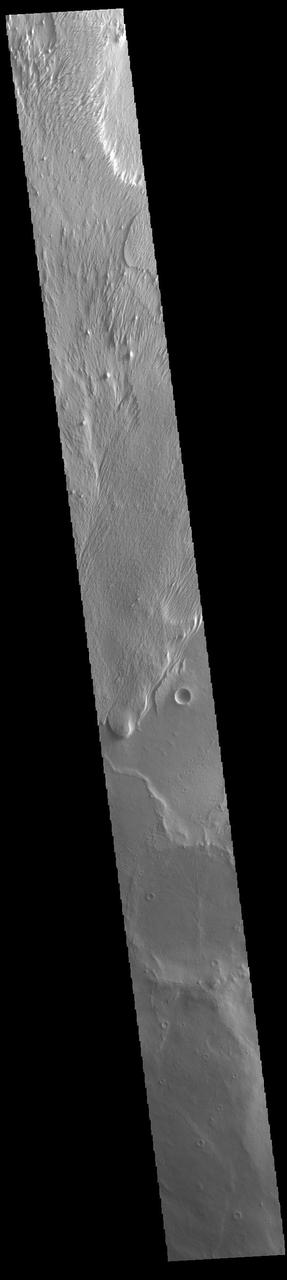
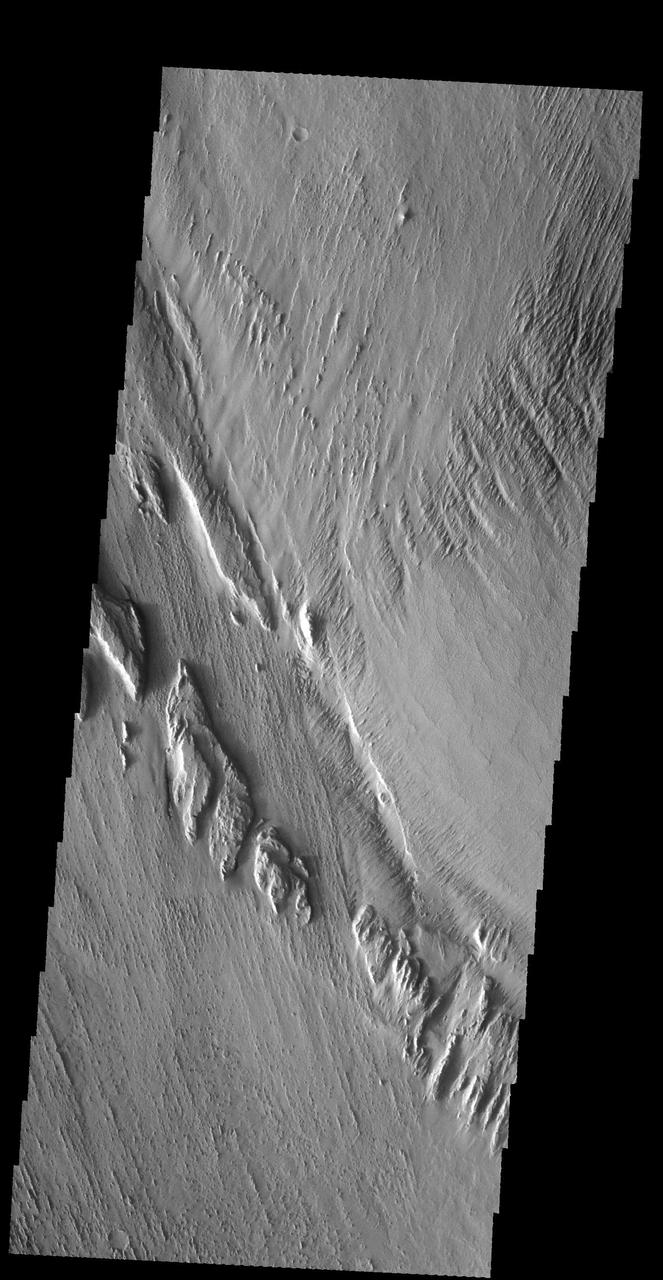
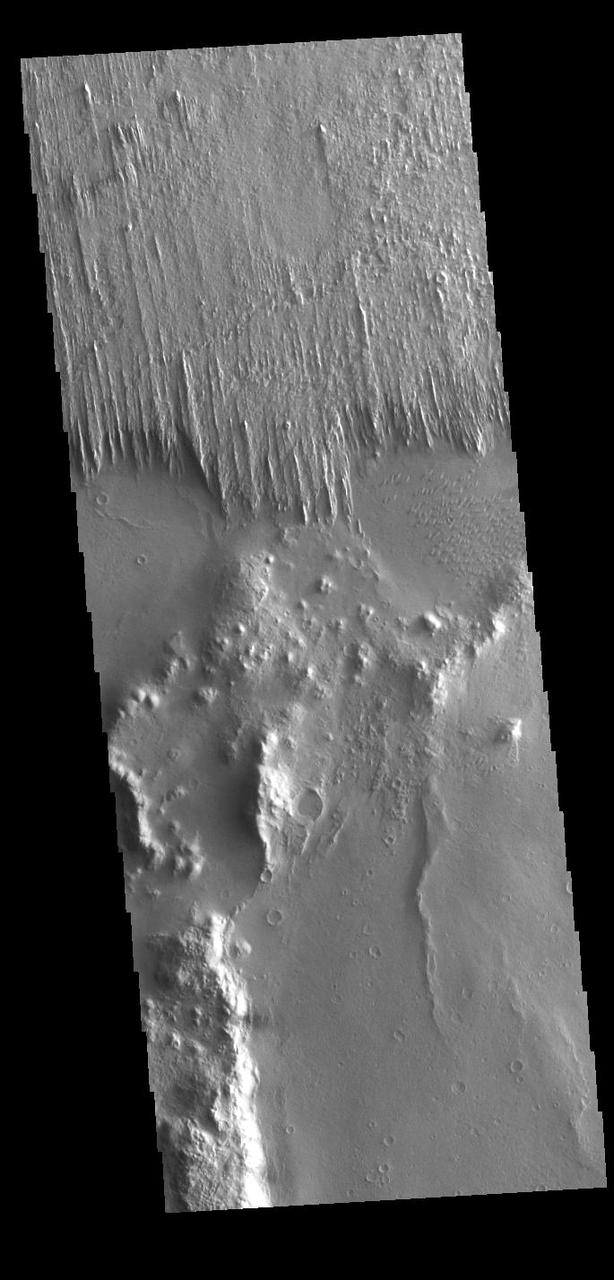
This image captured by NASA 2001 Mars Odyssey spacecraft shows the complexity of wind erosion on Mars. The erosion of the hills and the gouge-like pits indicate two, if not three wind directions that all altered the surface.
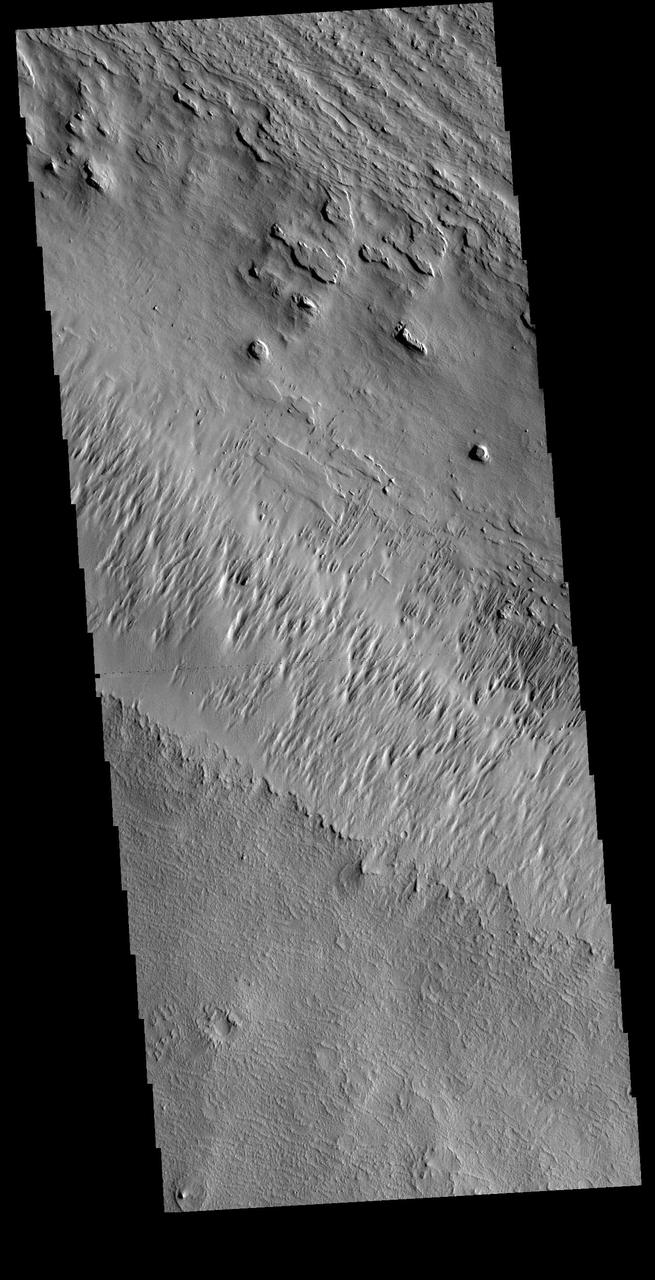
The region southwest of Olympus Mons is covered with materials that have been eroded by the wind. Surface materials in this area indicate wind action in many different directions as shown in this image from NASA Mars Odyssey.
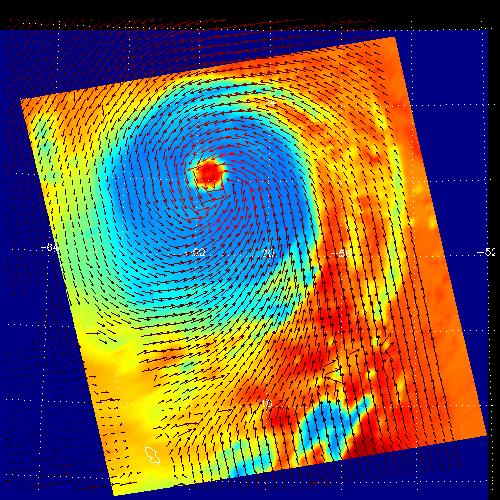
This image from NASA Cassini spacecraft reveals the wind patterns within a large vortex that was spawned by a giant northern storm on Saturn. The arrows indicate the local direction of the winds.
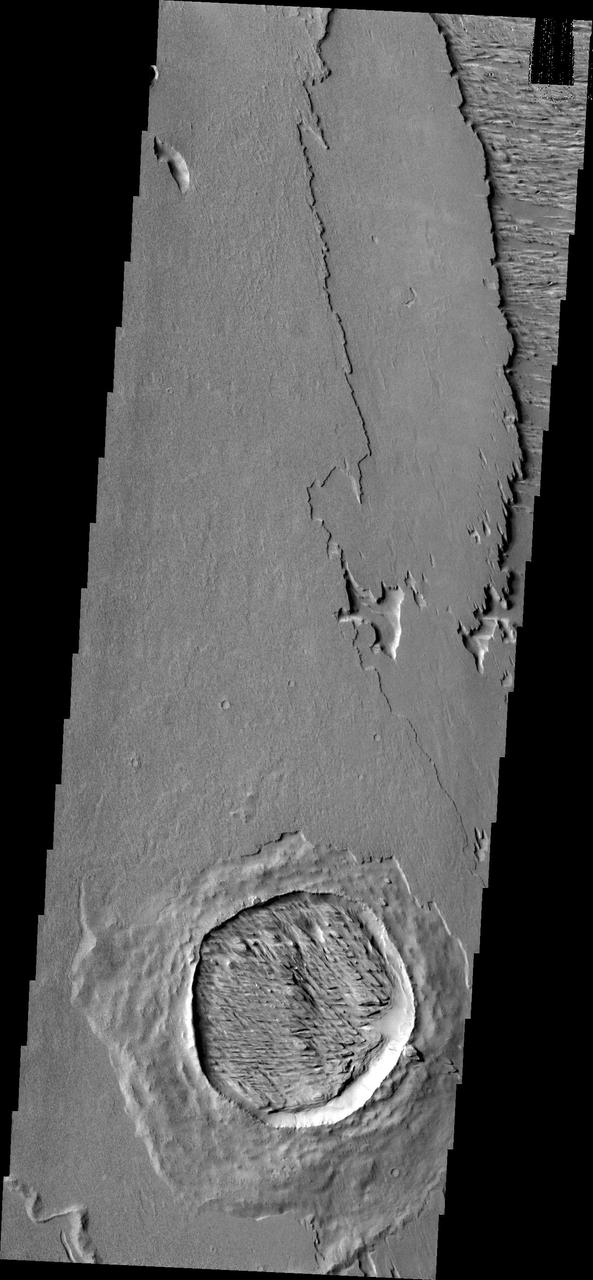
The crater in this image captured by NASA 2001 Mars Odyssey spacecraft has not only been filled by wind-blown material, but that material has been eroded into the two directions of winnowing by continued wind action.
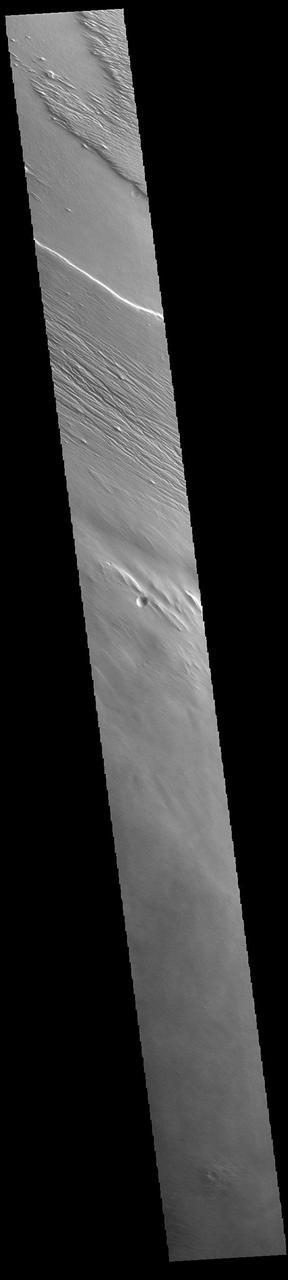
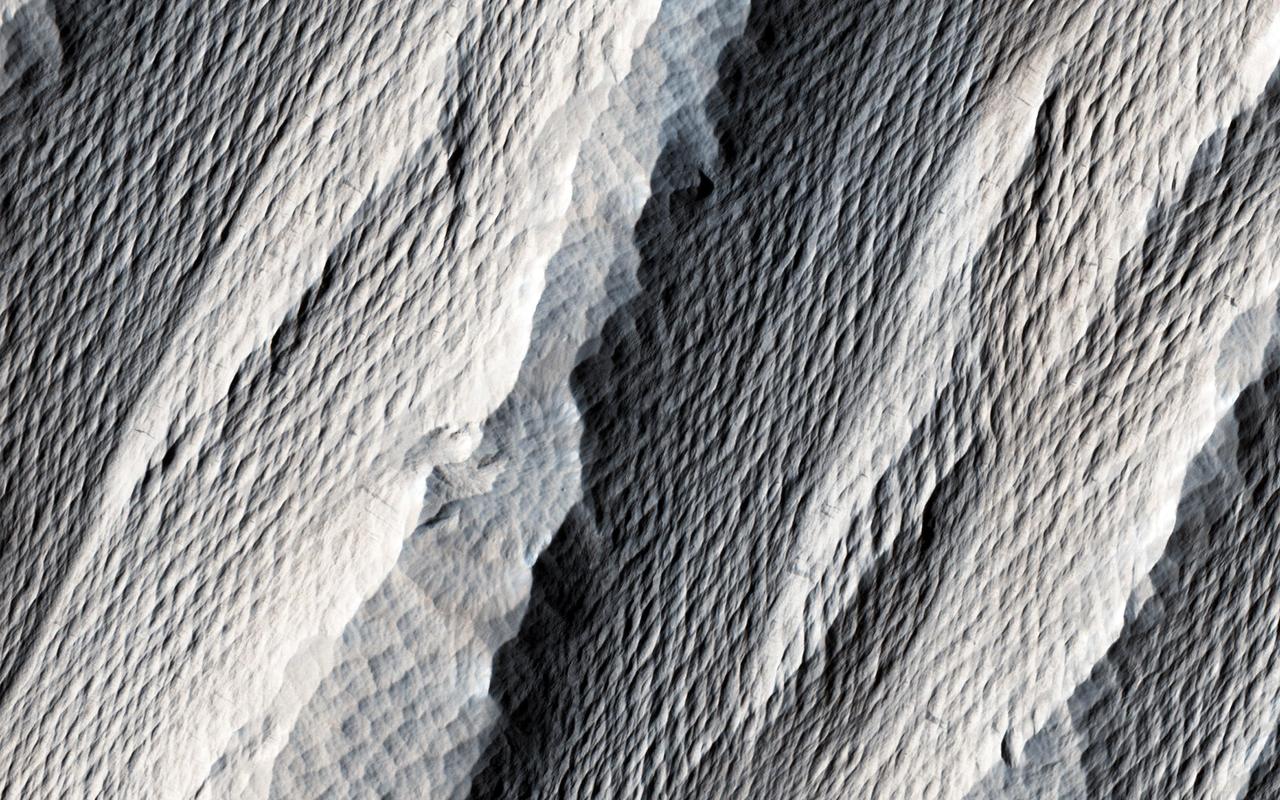
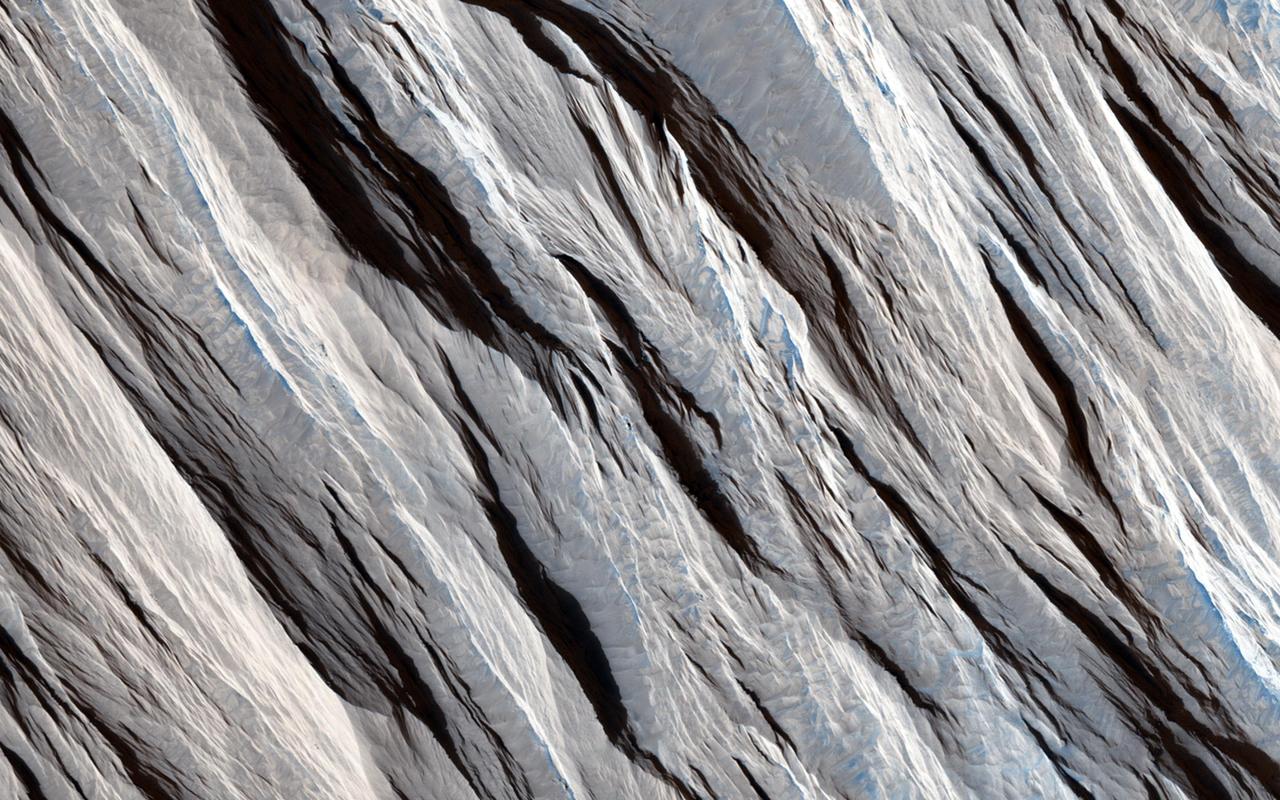
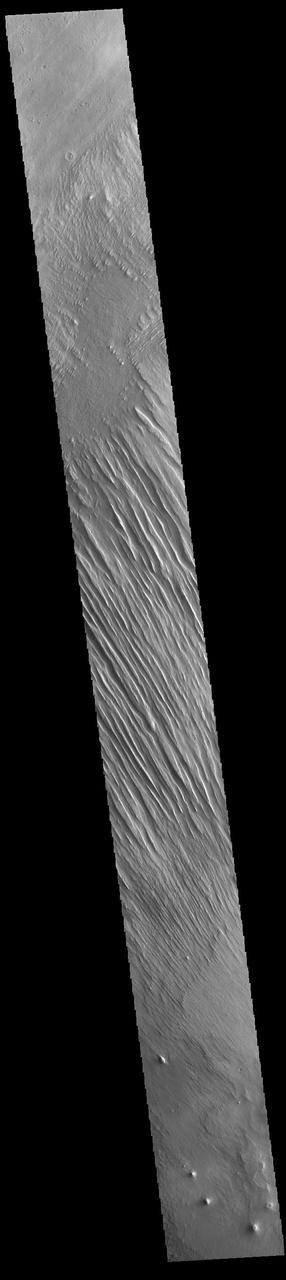
The long sharp-crested features observed in this image from NASA Mars Odyssey spacecraft are named yardangs. Yardangs form by wind erosion and typically lie in the direction of the dominant wind.
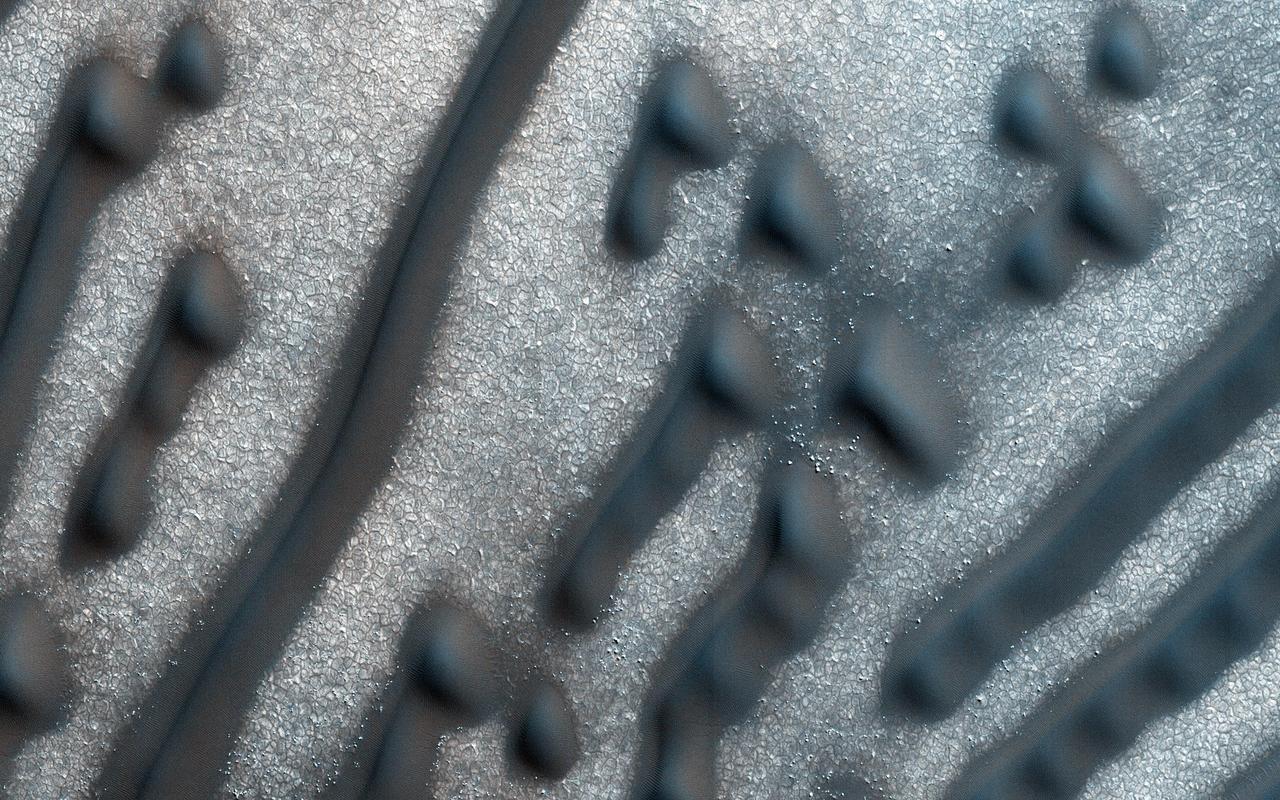
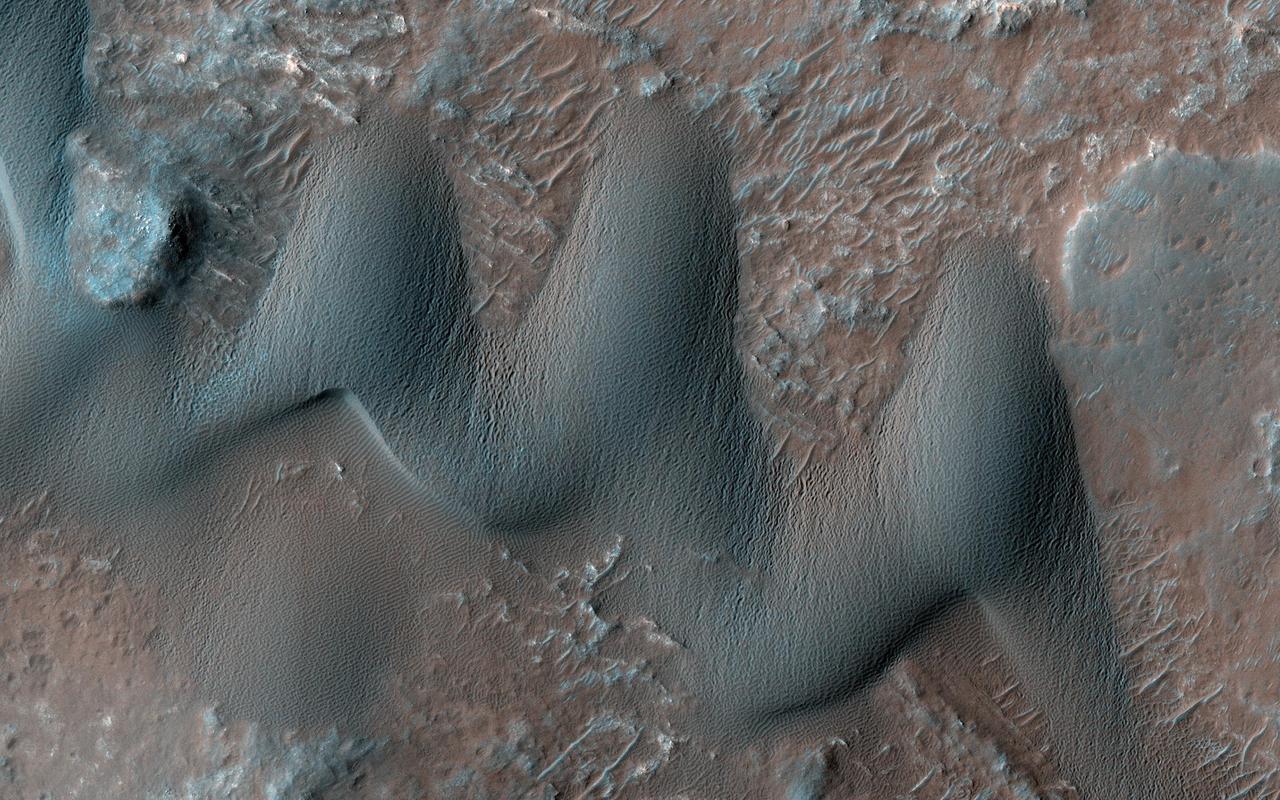
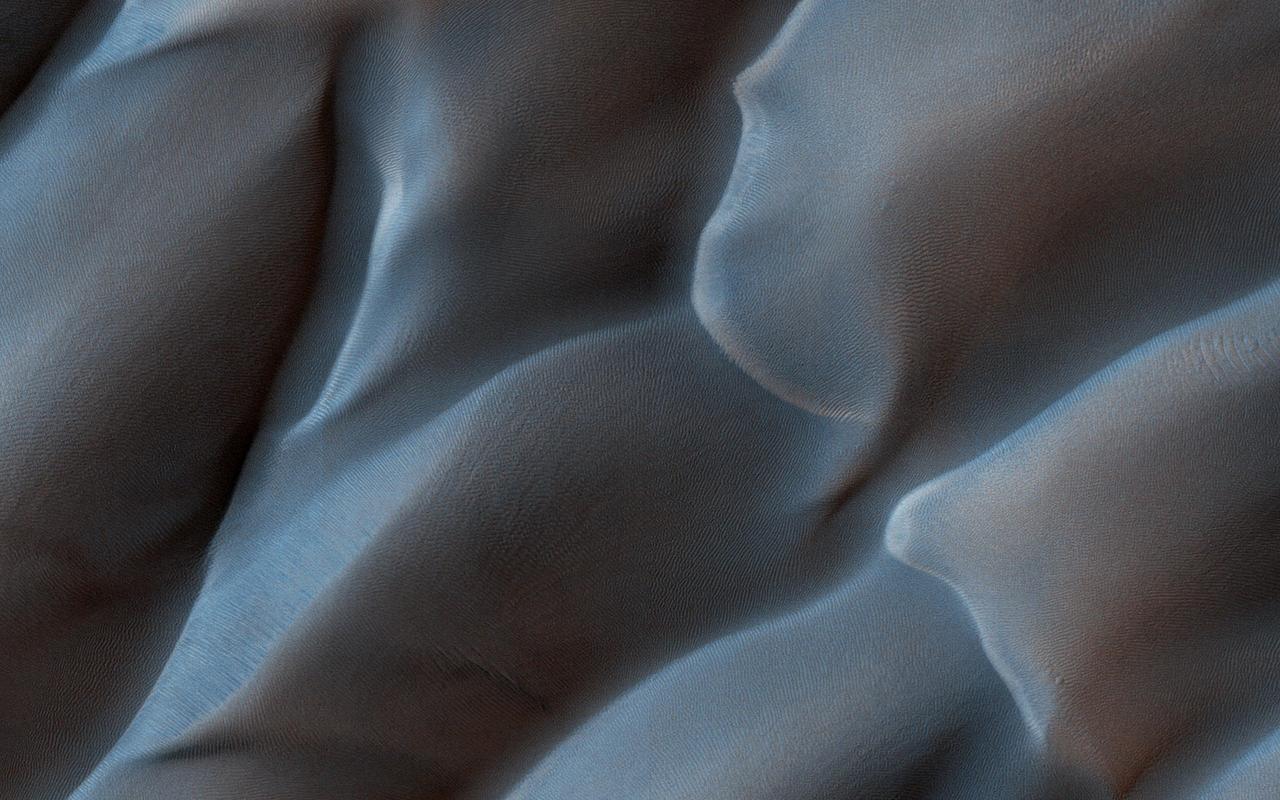
These dark dunes are influenced by local topography. The shape and orientation of dunes can usually tell us about wind direction, but in this image, the dune-forms are very complex, so it's difficult to know the wind direction. However, a circular depression (probably an old and infilled impact crater) has limited the amount of sand available for dune formation and influenced local winds. As a result, the dunes here form distinct dots and dashes. The "dashes" are linear dunes formed by bi-directional winds, which are not traveling parallel to the dune. Instead, the combined effect of winds from two directions at right angles to the dunes, funnels material into a linear shape. The smaller "dots" (called "barchanoid dunes") occur where there is some interruption to the process forming those linear dunes. This process is not well understood at present and is one motivation for HiRISE to image this area. http://photojournal.jpl.nasa.gov/catalog/PIA20735
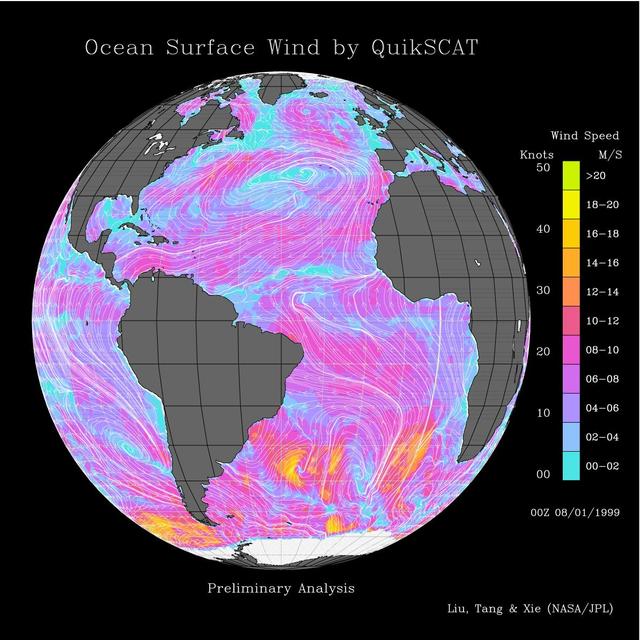
This image shows wind speeds and direction in the Atlantic Ocean on August 1, 1999, gathered by NASA Seawinds radar instrument flying onboard NASA QuikScat satellite.

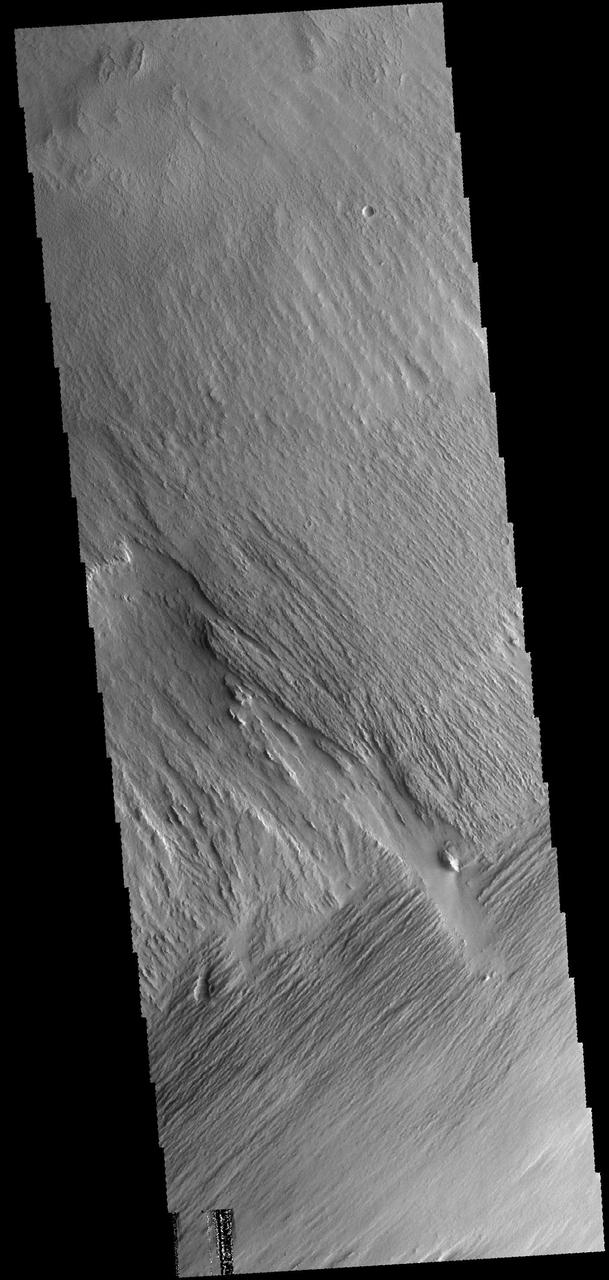
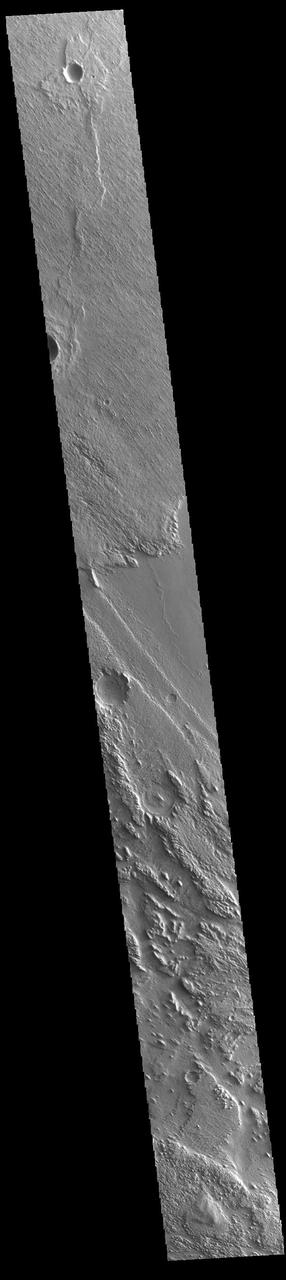
This image from NASA 2001 Mars Odyssey spacecraft of Zephyria Planum shows erosion in different orientations, related to different wind directions.

This image shows wind speeds and direction in the Pacific Ocean on August 1, 1999, gathered by NASA Seawinds radar instrument flying onboard NASA QuikScat satellite.
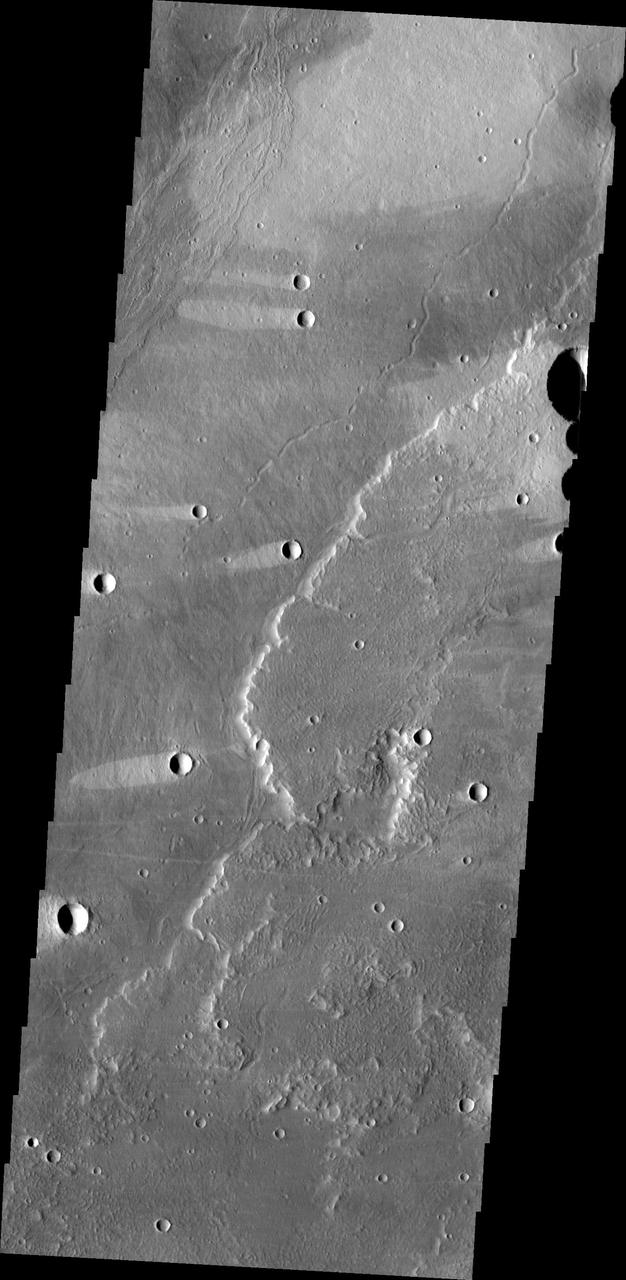
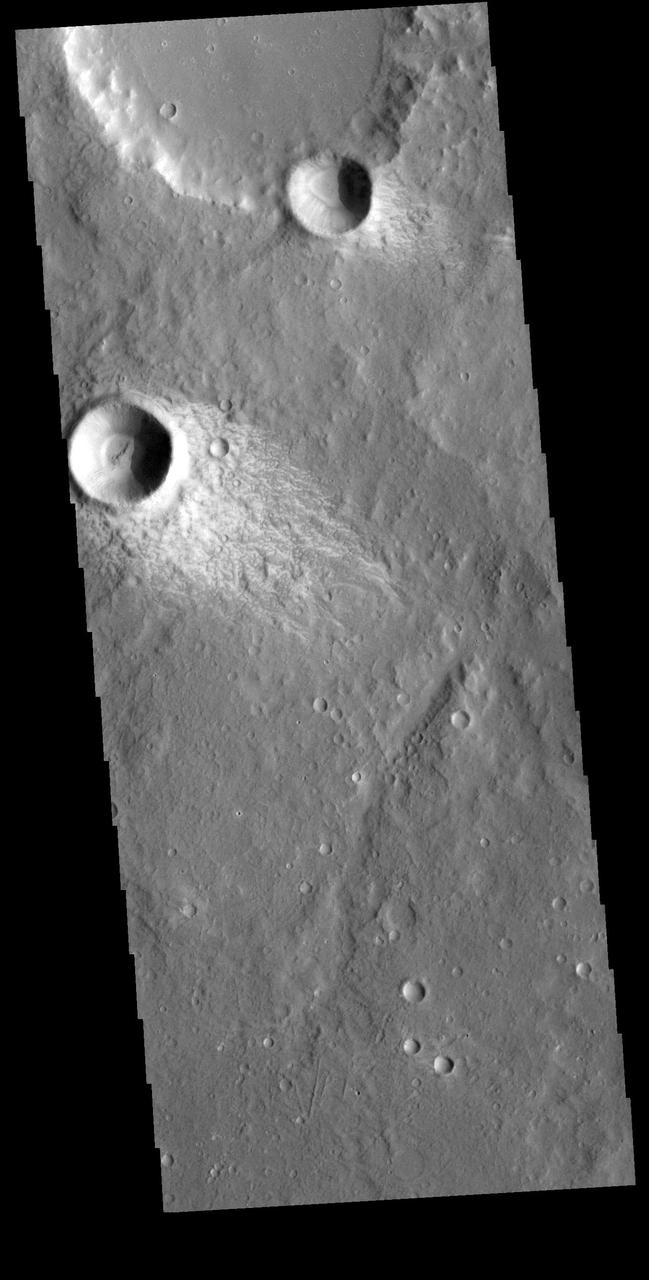
The triple tails of windstreaks behind these small craters in Arabia Terra indicate multiple wind directions in the area in this image from NASA Mars Odyssey.
This image from NASA 2001 Mars Odyssey spacecraft shows two directions of wind erosion southwest of Olympus Mons and south of Elysium Mons.
This VIS image shows part of Medusa Fossae. Winds have eroded materials in this region, creating ridges and valleys aligned with the direction of the wind. These features are created by long term winds scouring a poorly cemented surface material. It has been suggested that this region of Mars provides a large percentage of the surface dust seen around the planet. Ash falls from nearby volcanoes may have been the source of the surface materials eroded into these and other wind eroded landforms. Orbit Number: 79144 Latitude: -4.5831 Longitude: 200.487 Instrument: VIS Captured: 2019-10-18 00:48 https://photojournal.jpl.nasa.gov/catalog/PIA23576
The elongated hills in this VIS image are a feature termed yardangs. Yardangs are formed by wind activity in regions where the surface material is not well cemented. The elongation indicates the direction of the wind. Orbit Number: 65299 Latitude: -10.1078 Longitude: 183.91 Instrument: VIS Captured: 2016-09-02 13:39 http://photojournal.jpl.nasa.gov/catalog/PIA21019
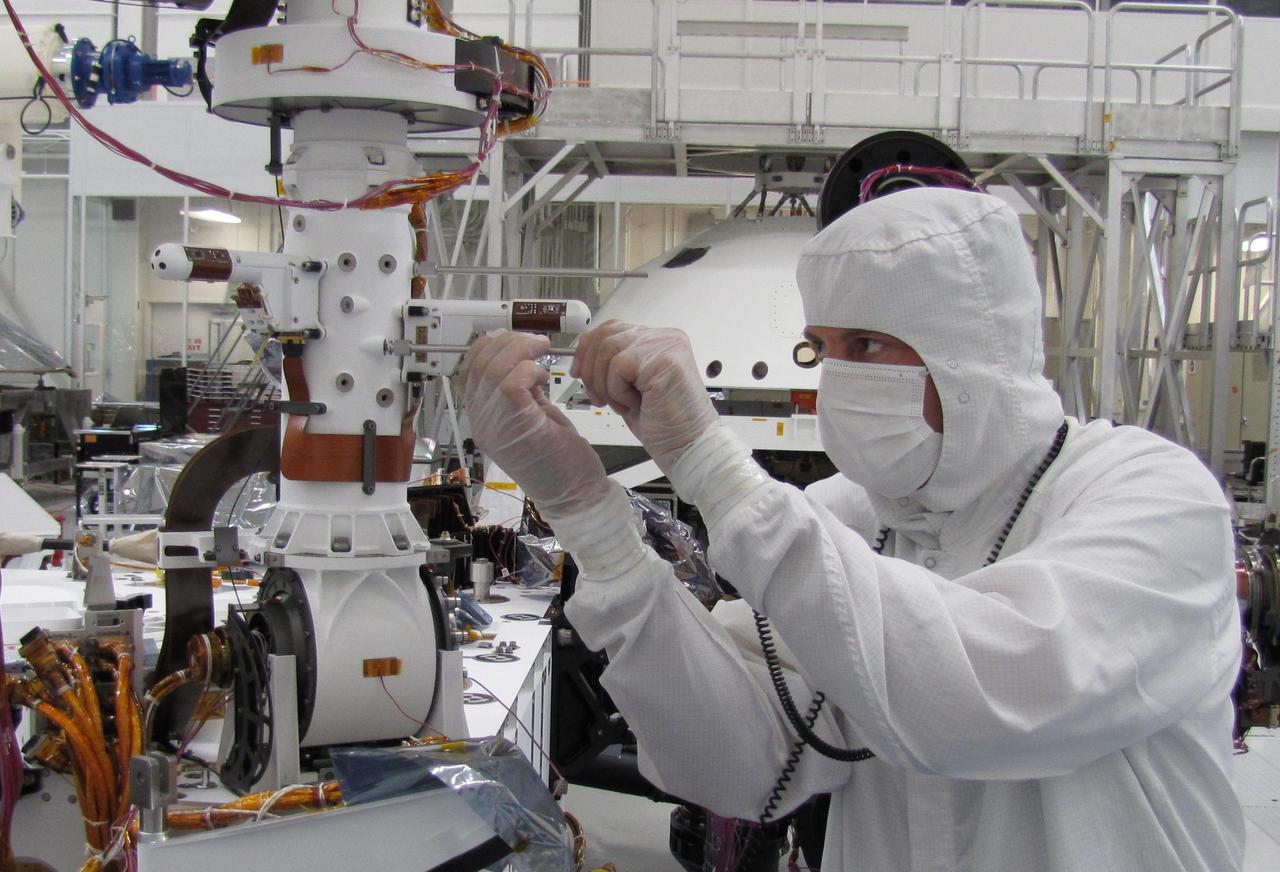
Sensors on two finger-like mini-booms extending horizontally from the mast of NASA Mars rover Curiosity will monitor wind speed, wind direction and air temperature; image taken during installation of the instrument inside a clean room at NASA JPL.
This image from NASA Mars Odyssey shows lava flows of Alba Mons and windstreaks behind craters in the area. Windstreak tail directions indicate winds from the East and East-Northeast.
Fans and ribbons of dark sand dunes creep across the floor of Bunge Crater in response to winds blowing from the direction at the top of the picture. This image is from NASA Mars Odyssey, one of an All Star set.
The solitary windstreak in today image from NASA 2001 Mars Odyssey spacecraft is located on the volcanic plains of Daedalia Planum. The windstreak appears to represent two different wind directions.
Artist rendering of NASA ISS-RapidScat instrument inset, which will launch to the International Space Station in 2014 to measure ocean surface wind speed and direction and help improve weather forecasts, including hurricane monitoring.
Launched Sept. 21, 2014, to the International Space Station, NASA newest Earth-observing mission, the International Space Station-RapidScat scatterometer to measure global ocean near-surface wind speeds and directions.
This image from NASA Mars Odyssey spacecraft is from the region of Syrtis Major, which is dominated by a low-relief shield volcano and believed to be an area of vigorous aeolian activity with strong winds in the east-west direction.
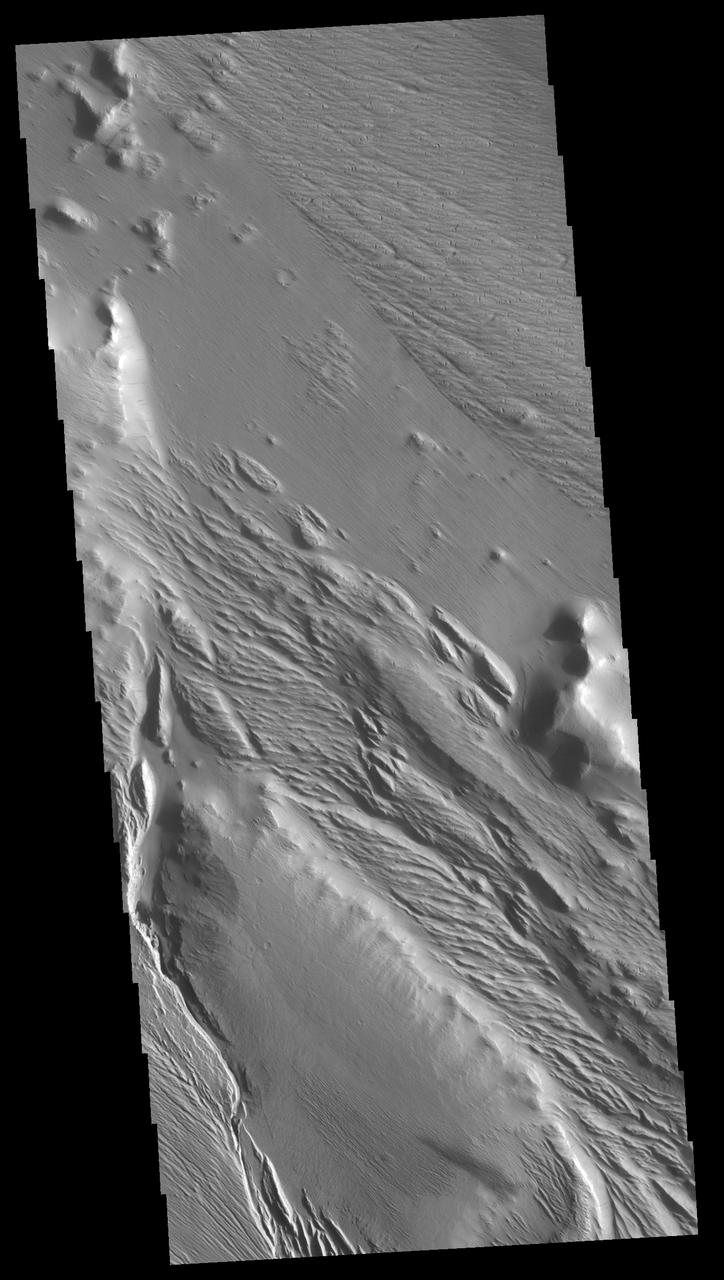
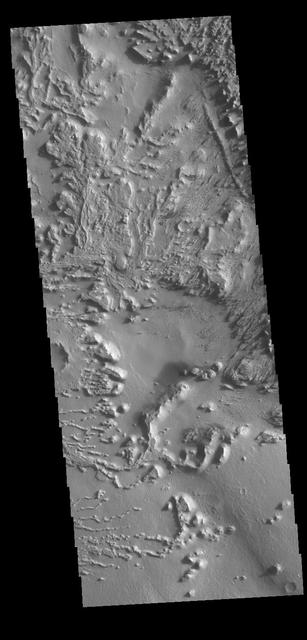
This image from NASA 2001 Mars Odyssey spacecraft is of Lycus Sulci, located on the western side of Olympus Mons and dominated by multi-direction ridges which contains material less resistant than the ridges to the effects of wind.
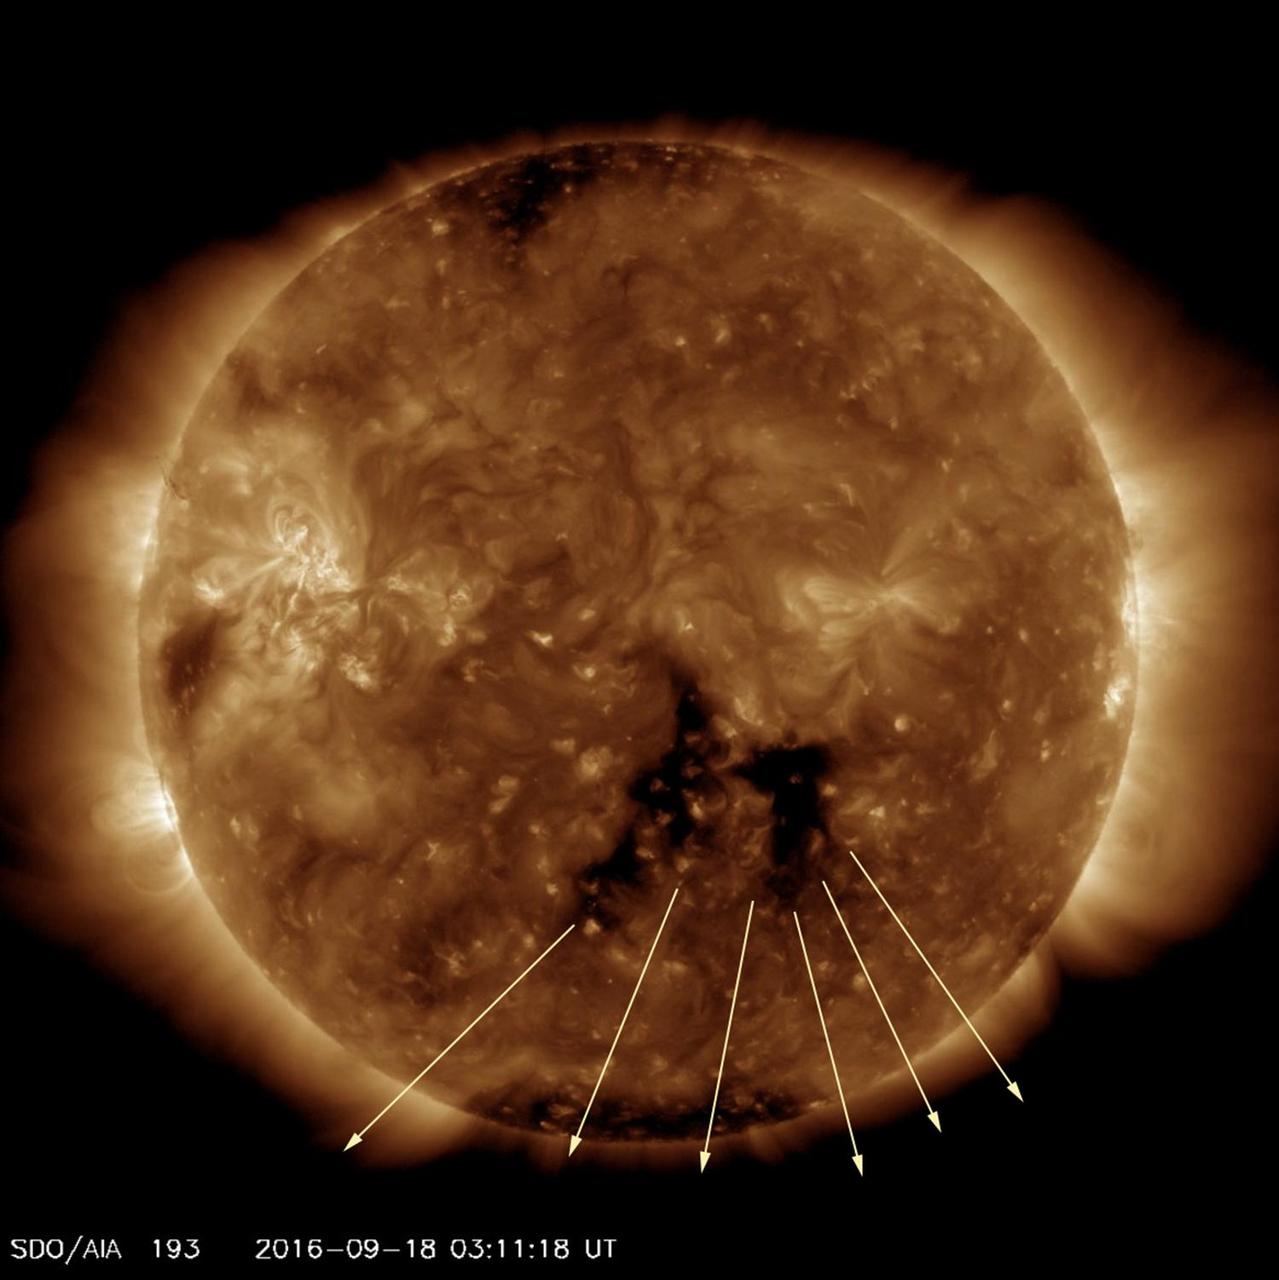
A dark coronal hole that was facing towards Earth for several days spewed streams of solar wind in our direction (Sept. 18-21, 2016). A coronal hole is a magnetically open region. The magnetic fields have opened up allowing solar wind (comprised of charged particles) to stream into space. Gusts of solar wind can generate beautiful aurora when they reach Earth. The video clip shows the sun in a wavelength of extreme ultraviolet light. Movies are available at http://photojournal.jpl.nasa.gov/catalog/PIA21067
Today's VIS image shows a region of wind etched materials near the margin of Lucus Planum. In regions of poorly cemented surface materials it is possible to create large features due to just the action of the wind. The equatorial region between Olympus Mons and Apollinaris Mons is dominated by wind etched regions. The direction of the wind aligns with the ridges and valleys. The dominant wind direction in this region is southwest to northeast; however, other wind directions can occur within a localized region. Orbit Number: 95167 Latitude: -5.43918 Longitude: 189.898 Instrument: VIS Captured: 2023-05-29 08:26 https://photojournal.jpl.nasa.gov/catalog/PIA26265
Today's VIS image shows a region of wind etched materials. In regions of poorly cemented surface materials it is possible to create large features due to just the action of the wind. The equatorial region between Olympus Mons and Apollinaris Mons is dominated by wind etched regions. The direction of the wind aligns with the ridges and valleys. The dominant wind direction in this region is southeast to northwest; however, other wind directions can occur within a localized region. Orbit Number: 94405 Latitude: -0.344951 Longitude: 212.207 Instrument: VIS Captured: 2023-03-27 14:40 https://photojournal.jpl.nasa.gov/catalog/PIA26026
Today's VIS image shows part of Aeolis Planum. The surface in this region has been heavily eroded by wind action. In regions of poorly cemented surface materials it is possible to create large features due to just the action of the wind. The direction of the wind aligns with the ridges and valleys. The dominant wind direction in this region is southeast to northwest; however, other wind directions can occur within a localized region. Orbit Number: 94819 Latitude: -1.42232 Longitude: 148.839 Instrument: VIS Captured: 2023-04-30 16:46 https://photojournal.jpl.nasa.gov/catalog/PIA26178
In regions of poorly cemented surface materials it is possible to create large features due to just the action of the wind. The equatorial region between Olympus Mons and Apollinaris Mons is dominated by wind etched regions. This region east of Apollinaris Mons contains just such a terrain. The direction of the wind aligns with the ridges and valleys. The dominant wind direction in this region is southeast to northwest; however, other wind directions can occur within a localized region.The top of this VIS image follows the regional trend, with a smaller central surface indicating winds perpendicular to the prevailing direction. Orbit Number: 72333 Latitude: -10.2083 Longitude: 179.736 Instrument: VIS Captured: 2018-04-05 02:02 https://photojournal.jpl.nasa.gov/catalog/PIA22577
Today's VIS image is located on Lucus Planum. The surface in this image has been eroded by the wind to form features called yardangs. Yardangs form in a poorly cemented material where the wind cuts linear valleys, removing some of the material and leaving parallel ridges behind. The direction of the ridge/valley is aligned with the wind direction. The dominant wind direction in this region is along a northeast/southwest trend; however, other wind directions can occur within a localized region. There is a circular feature in the lower left side of the image. This is likely the remains of a crater. Meteor impacts melt the surface and subsurface, creating a harder material then the surrounding surfaces. The remnant of the crater are still visible due to being a more resistant material. Orbit Number: 81740 Latitude: -1.61604 Longitude: 187.227 Instrument: VIS Captured: 2020-05-18 18:55 https://photojournal.jpl.nasa.gov/catalog/PIA24008
This image shows two types of sand dunes on Mars. The small dots are called barchan dunes, and from their shape we can tell that they are upwind. The downwind dunes are long and linear. These two types of dune each show the wind direction in different ways: the barchans have a steep slope and crescent-shaped "horns" that point downwind, while the linear dunes are stretched out along the primary wind direction. Linear dunes, however, typically indicate a wind regime with at least two different prevailing winds, which stretch out the sand along their average direction. In several places in this image, you can find barchan dunes turning into linear dunes as they are stretched out, but they both seem into indicate the same wind direction. https://photojournal.jpl.nasa.gov/catalog/PIA23669
Today's image shows a cross section of Nicholson Crater. The central peak of this crater is surrounded by a layered deposit that rises 3.5km (2 miles) above the crater floor. This central mound of material has undergone extensive wind erosion, with yardangs visible on the on most of the mound. These features are created by long term winds scouring a poor cemented surface material into linear ridges and valleys. The direction of the ridge/valley is aligned with the wind direction. The dominant wind direction in this region of the mound is along a north/south trend. However, other wind directions can occur within a localized region, as evidenced by the smaller yardangs near the north side of the mound. Located on the southern edge of Amazonis Planitia, Nicholson Crater is 102km (63 miles) in diameter. Orbit Number: 85995 Latitude: 0.290091 Longitude: 195.593 Instrument: VIS Captured: 2021-05-04 03:15 https://photojournal.jpl.nasa.gov/catalog/PIA24218
This VIS image is located near Zephyria Planum. Winds of two different directions have excavated a poorly cemented surface into linear ridge features called yardangs. Examining the structure of the ridges, it appears that winds first blew from the upper left of the image. Then perhaps after a change in climate, winds blew toward the upper right, carving a new pattern on top of the older one. The ridges are not perpendicular, but intersect at a wider angle. Orbit Number: 72496 Latitude: -4.75332 Longitude: 154.461 Instrument: VIS Captured: 2018-04-18 12:20 https://photojournal.jpl.nasa.gov/catalog/PIA22612
Today's VIS image shows a region of wind etched materials. In regions of poorly cemented surface materials it is possible to create large features due to just the action of the wind. The equatorial region between Olympus Mons and Apollinaris Mons is dominated by wind etched regions. The direction of the wind aligns with the ridges and valleys. The dominant wind direction in this region is southeast to northwest; however, the wind direction for the upper right of the image is to the other direction. The long linear wind etched valleys are called yardangs. These features are created by long term winds scouring a poor cemented surface material into linear ridges and valleys. These yardangs are part of the Medusa Fossae Formation. It has been suggested that this region of Mars provides a large percentage of the surface dust seen around the planet. Ash falls from nearby volcanoes may have been the source of the surface materials eroded into these and other wind eroded landforms. Orbit Number: 94817 Latitude: -0.841679 Longitude: 206.486 Instrument: VIS Captured: 2023-04-30 12:50 https://photojournal.jpl.nasa.gov/catalog/PIA26177
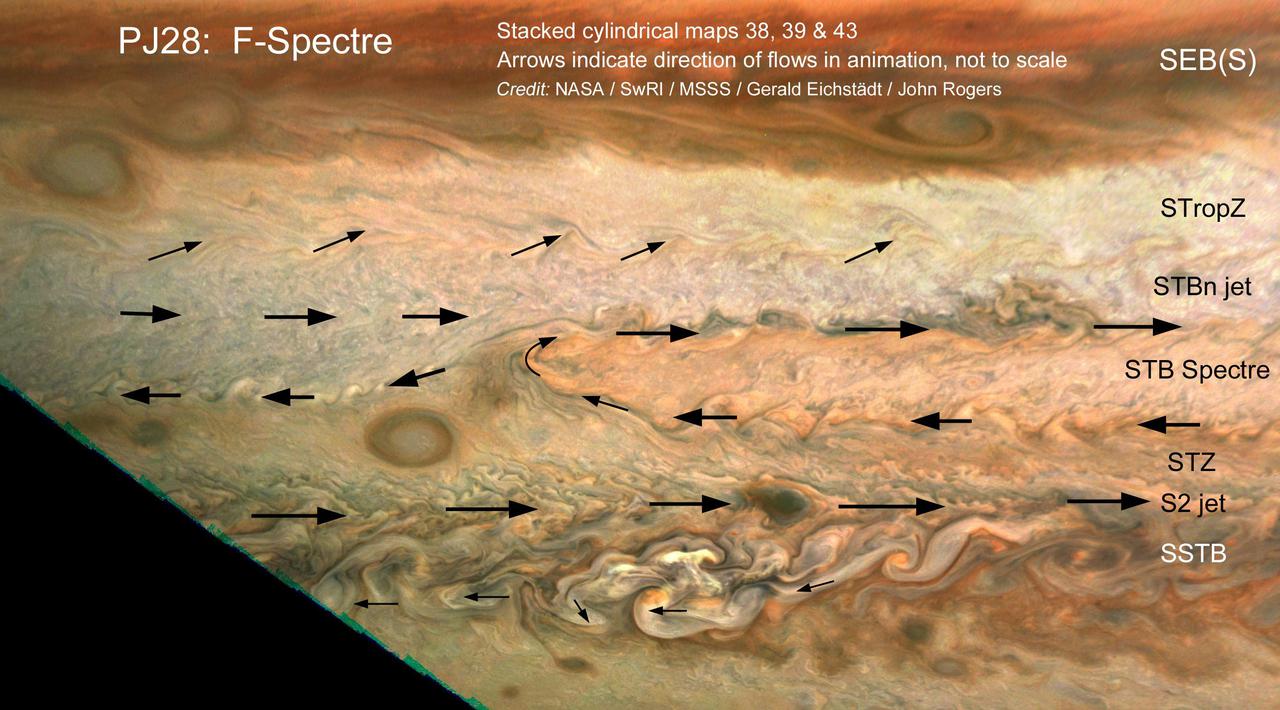
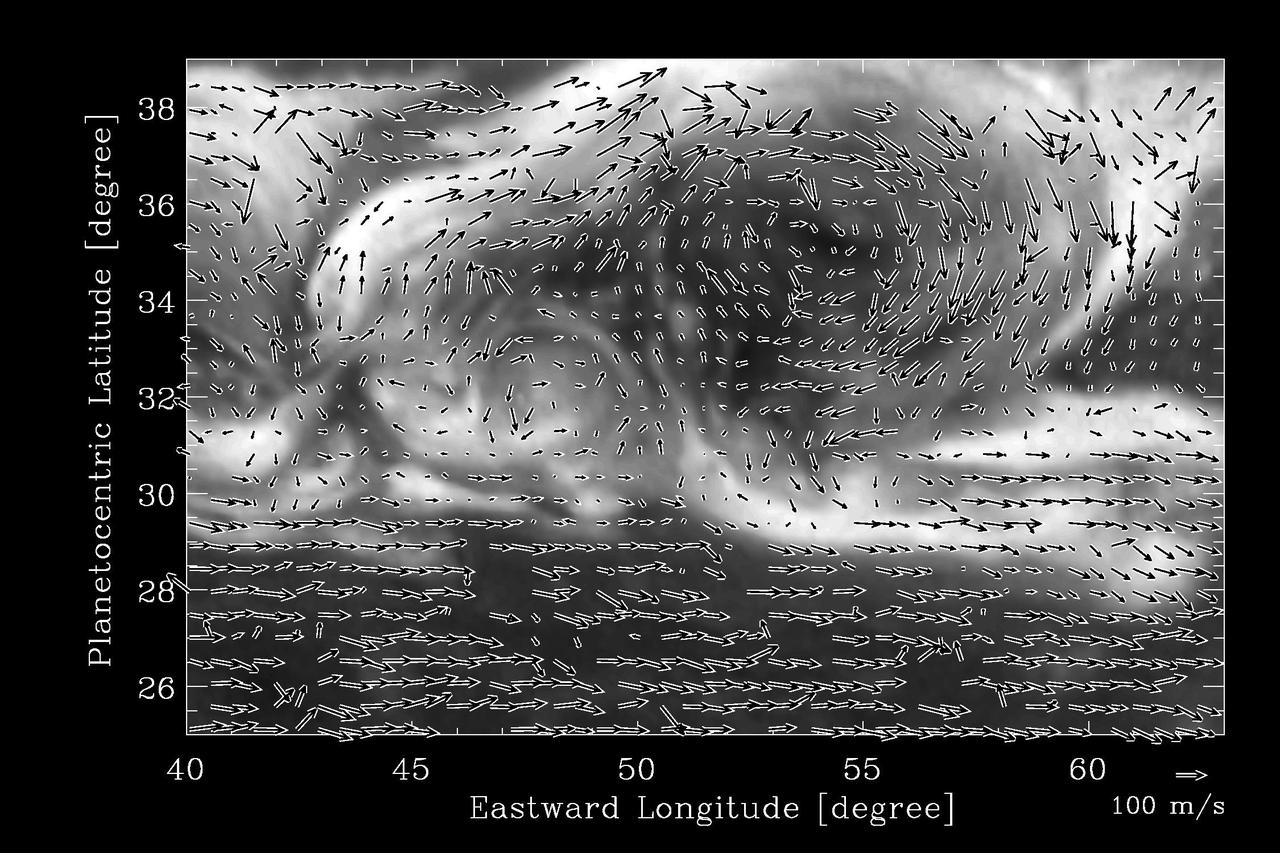
The motion of small clouds on Jupiter is used to determine wind direction (indicated with arrows) in this work by citizen scientists John Rogers and Gerald Eichstädt. Using multiple images to track the motion of clouds was enabled by the Juno spacecraft's slow departure from Jupiter's southern hemisphere on perijove pass 28, on July 25, 2020. Zonal winds are a well-known phenomenon on Jupiter, correlating with its familiar belts and zones. Within a latitudinal band there can be regional circulation, such as the South Temperate Belt (STB) Spectre shown in this image. The STB Spectre is cyclonic (winds rotating in clockwise direction), spread out in latitude but confined in longitude. This work is representative of an ongoing and fruitful collaboration of amateur astronomers with the Juno project. John Rogers analyzed cloud movement in three JunoCam images processed by citizen scientist Gerald Eichstädt to identify winds. Latitudinal belts and zones ( labeled with the conventions used by the amateur astronomy community and professional observers), are: SEB(S): South Equatorial Belt (south); STropZ: South Tropical Zone; STBn jet: South Temperate Belt (north) jet; STZ: South Temperate Zone; and SSTB: South South Temperate Belt. https://photojournal.jpl.nasa.gov/catalog/PIA24235
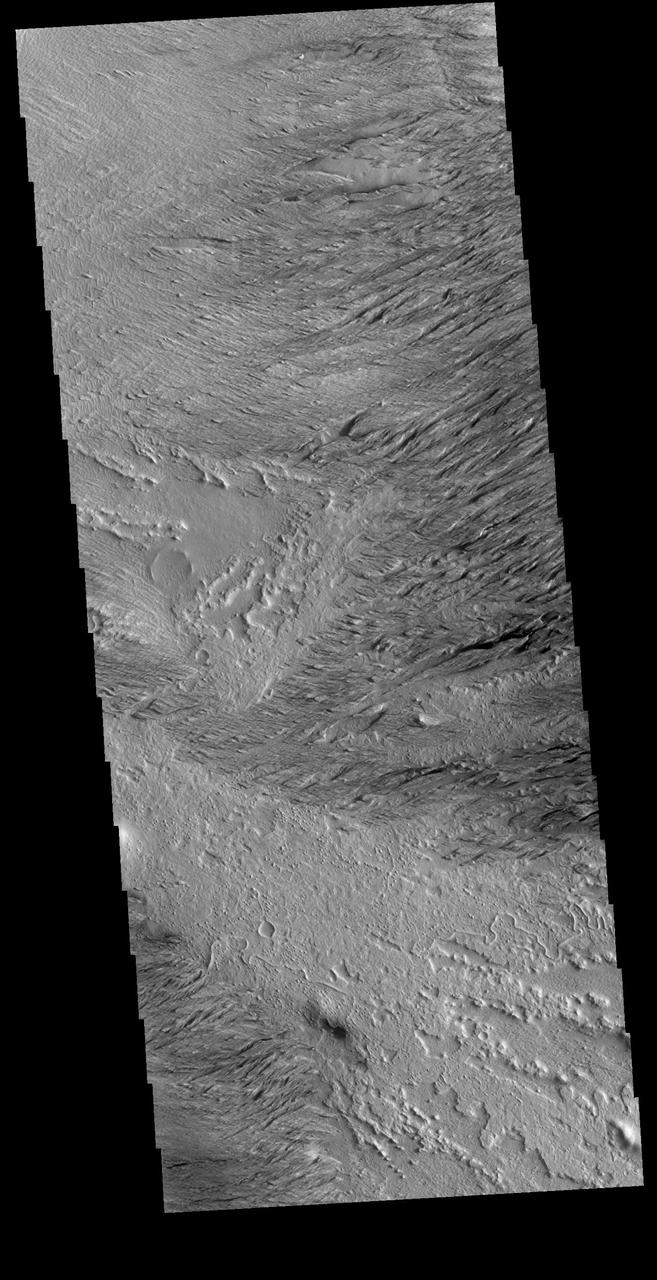
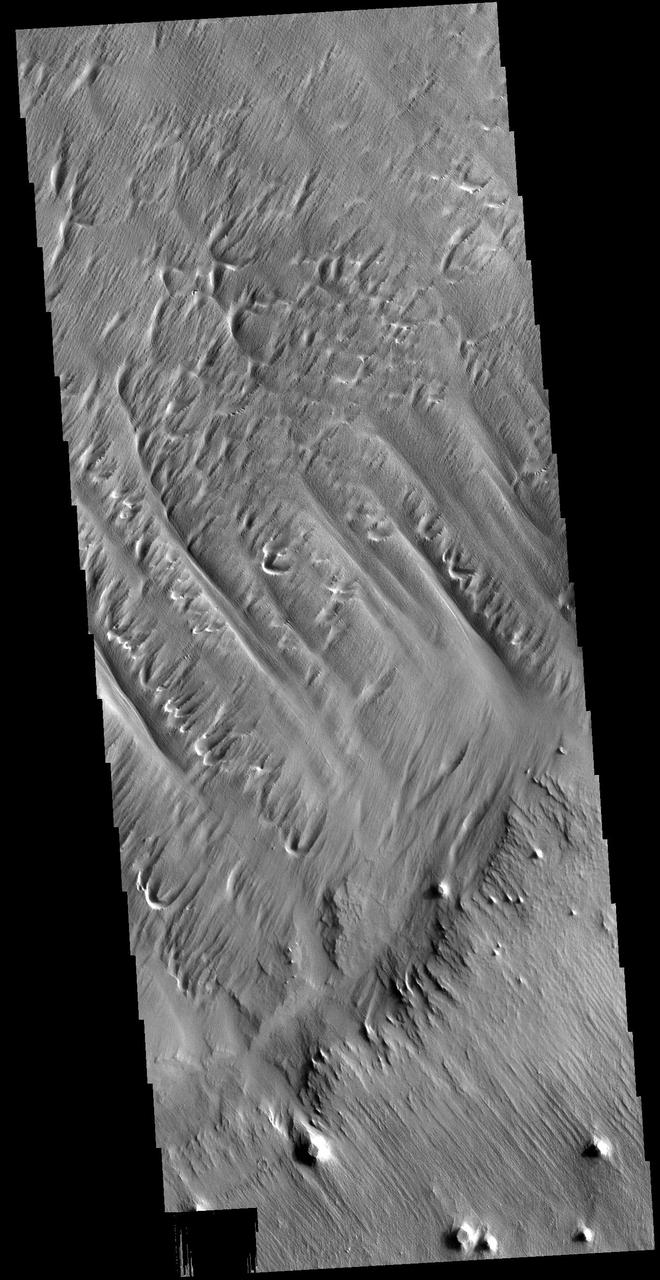
Long term winds have etched the surface in Memnonia Sulci. Partial cemented surface materials are easily eroded by the wind, forming linear ridges called yardangs. The multiple direction of yardangs in this VIS image indicate that there were at least two different wind directions in this area. Orbit Number: 59217 Latitude: -8.33112 Longitude: 186.506 Instrument: VIS Captured: 2015-04-20 15:12 http://photojournal.jpl.nasa.gov/catalog/PIA19502
Today's VIS image shows the surface between Aeolis Planum and Zephyria Planum in Elysium Planitia. Long term winds have eroded the surface in this region. Features align with wind direction, and the multiple ridge orientations in this image indicate varying wind directions over time. Orbit Number: 79757 Latitude: -5.05219 Longitude: 155.498 Instrument: VIS Captured: 2019-12-07 12:12 https://photojournal.jpl.nasa.gov/catalog/PIA23708
Today's VIS image shows the surface on the western margin of Zephyria Planum. Zephyria Planum is located south of Elysium Planitia. Long term winds have eroded the surface in this region. Features align with wind direction, and the multiple ridge orientations in this image indicate varying wind directions over time. Orbit Number: 80955 Latitude: -4.15683 Longitude: 154.144 Instrument: VIS Captured: 2020-03-15 03:38 https://photojournal.jpl.nasa.gov/catalog/PIA23907
Eumenides Dorsum is a large linear rise located in southern Amazonis Planitia. Erosion by wind action is prevalent in this region. The horseshoe shaped depressions in this image are called blowouts and align with the wind direction that blew from upper right to lower left. The deep troughs and the finer scale linear erosion at the bottom of the image were created by winds that blew along the trend from upper left to lower right. This reflects two different predominant wind directions. It is difficult from just one image to determine if the wind changes were seasonal or over thousands of years in a single direction. Orbit Number: 79668 Latitude: 3.05139 Longitude: 202.032 Instrument: VIS Captured: 2019-11-30 04:22 https://photojournal.jpl.nasa.gov/catalog/PIA23746
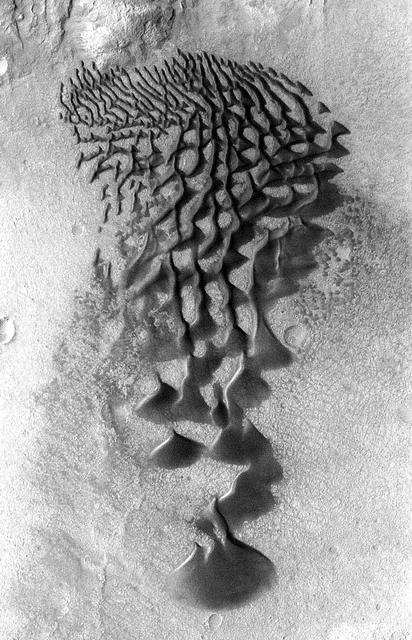
Sand dunes commonly form when particles that are being moved around by the wind find a natural barrier to accumulate and build a hill-like formation. Scientists study dunes because their shape and size can give us valuable information about the wind directions and speeds in current and past climates. For instance, barchan dunes are crescent-shaped, and they form when the wind blows mainly from one direction (perpendicular to the crescent long edge). On the other hand, "star" dunes have three or more "arms," and form in environments that that are affected by multiple wind directions. Our image shows an area on Mars with both star and barchan dunes next to each other. This implies that wind directions have changed with time, or that the surrounding landscape is creating complex wind patterns. Scientists can study HiRISE images collected over time of the same dunes to observe whether they are moving or not, and if so, how fast. By observing multiple dune systems over many seasons, we can get a better picture of wind regimes on Mars and possibly how they have evolved with time. https://photojournal.jpl.nasa.gov/catalog/PIA23849
Marine stratocumulus clouds frequently form parallel rows, or cloud streets, along the direction of wind flow. NASA Terra spacecraft captured this stereo image of Jan Mayen island Beerenberg volcano. 3D glasses are necessary to view this image.
Today's VIS image shows part of Apollinaris Sulci. Yardangs are present at the top of this VIS image. These features are created by long term winds scouring a poor cemented surface material into linear ridges and valleys. The direction of the ridge/valley is aligned with the wind direction, indicating the dominant wind direction in this region was north/south. These yardangs are the southern margin of Apollinaris Sulci, located south of Apollinaris Mons. It has been suggested that this region of Mars provides a large percentage of the surface dust seen around the planet. Ash falls from nearby volcanoes may have been the source of the surface materials eroded into these and other wind etched landforms. Orbit Number: 86395 Latitude: -12.5877 Longitude: 177.796 Instrument: VIS Captured: 2021-06-06 01:38 https://photojournal.jpl.nasa.gov/catalog/PIA24952
The Hellespontus Montes is a rugged mountain range located on the western rim of one of the largest impact basins in the Solar System: Hellas Basin. The 7-kilometer depth of Hellas and its location in the Southern Hemisphere form an active atmospheric system that directly impacts local landscape evolution. Hellespontus has a large accumulation of sand dunes and other wind-created bedforms that have been migrating on a continual basis since HiRISE began imaging Mars. A dune's steepest area, called a "slip face," indicates the down-wind side of the dune and its migration direction as driven by local winds. At this location, there are many dunes influenced by eastward winds that were draining into Hellas. Meanwhile, other locations show that migration had shifted towards the opposite direction to the west. In certain cases, we see these opposing dune directions in proximity. The complex patterns are not due to winds that are constant in magnitude or direction, but rather they wax and wane over the course of the Martian year. https://photojournal.jpl.nasa.gov/catalog/PIA25899
Today's VIS image shows some of the extensive wind etched terrain in Memnonia Sulci, located southwest of Olympus Mons. The linear ridges are called yardangs and form by wind removal of semi-cemented material. The ridges are parallel to wind direction, so the predominate winds that created the yardangs in this image blew NW/SE. Orbit Number: 81216 Latitude: -7.99809 Longitude: 185.052 Instrument: VIS Captured: 2020-04-05 15:23 https://photojournal.jpl.nasa.gov/catalog/PIA23944
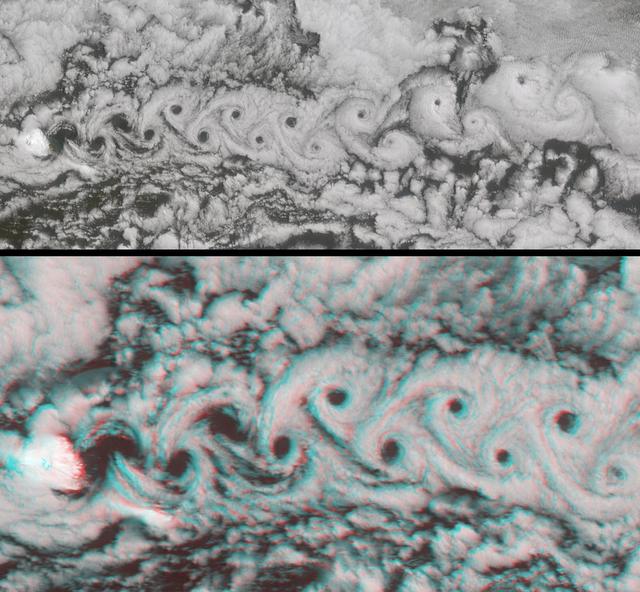
As the air blows over the tops of the mountain peaks, seen here in the clear region, the direction of the air flow is disturbed. These disturbances in the flow pattern are generally small circular eddies with one circulating in a clockwise direction and the next in the reverse direction. The wind here has caused the shallow cloud cover to change accordingly. These eddies are commonly called von Karmen Vortices.
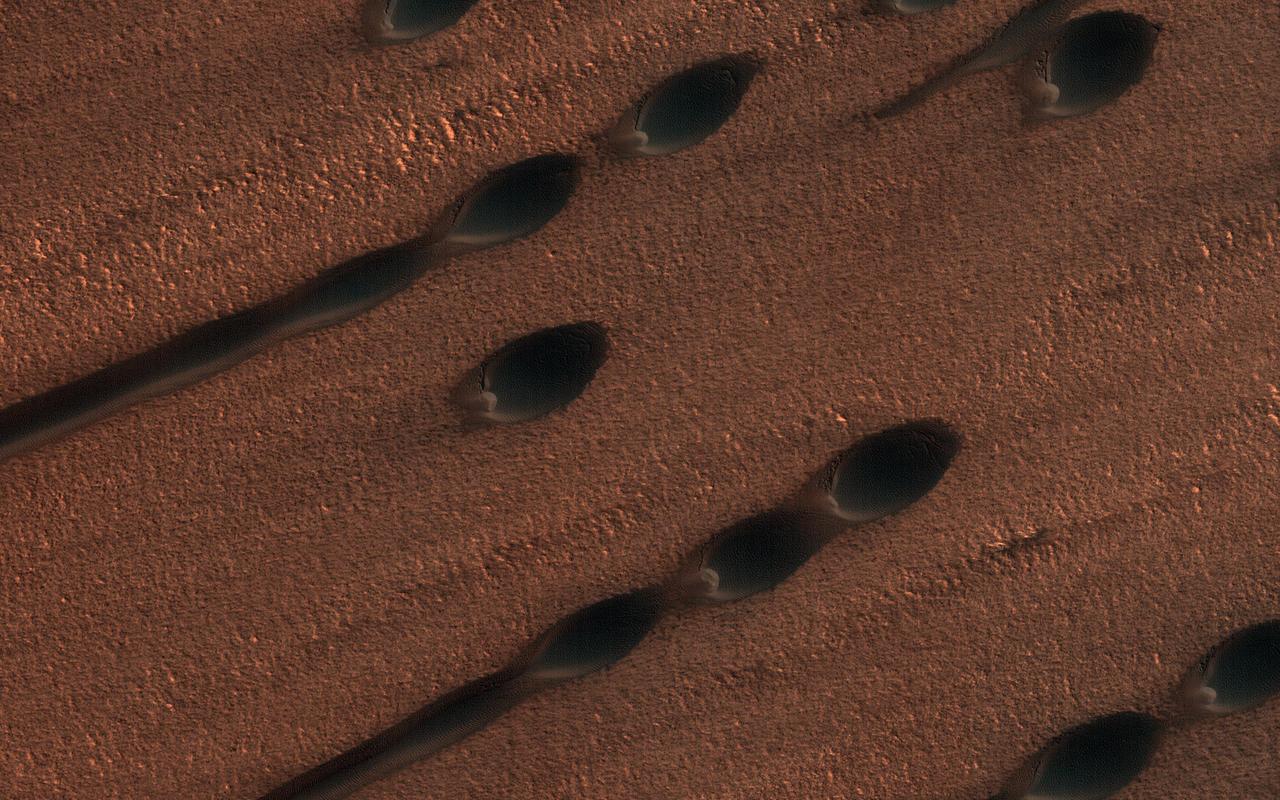
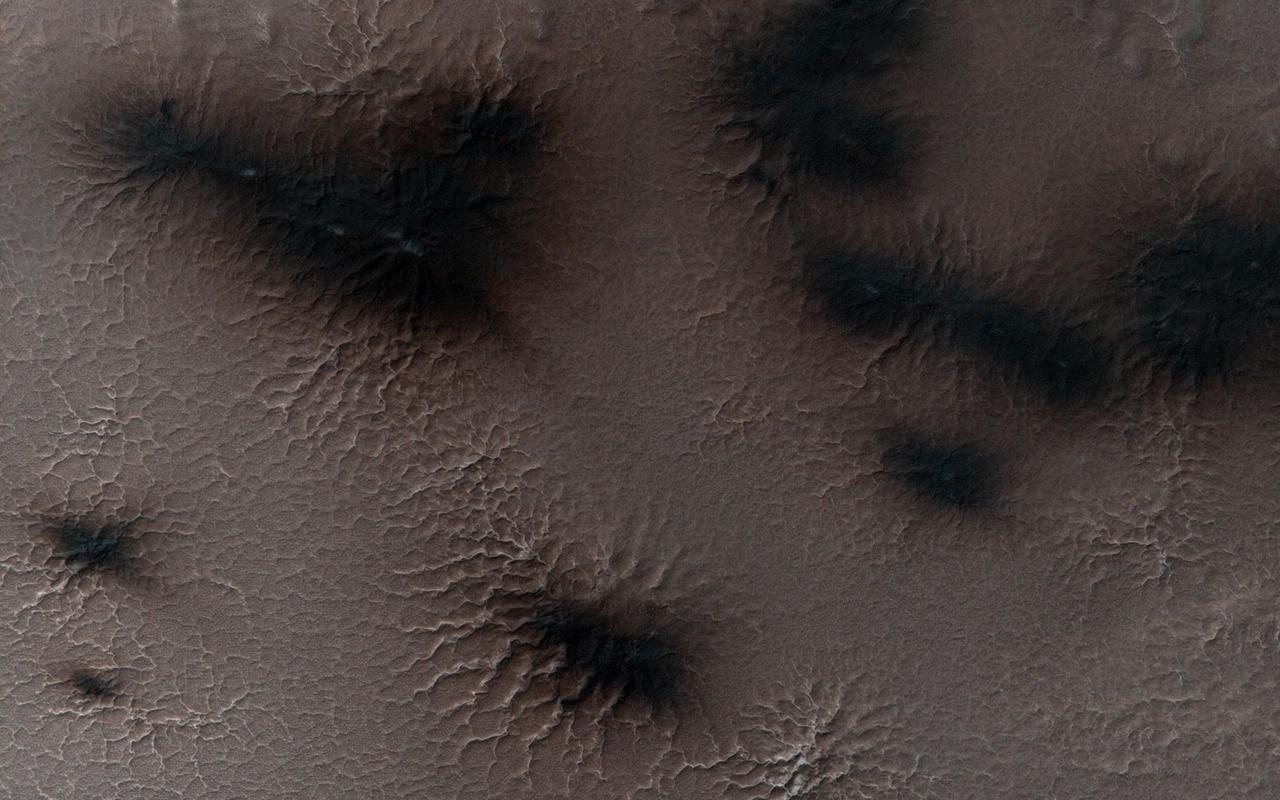
Springtime in the South Polar region of Mars is a season of exciting activity. The thick coating of carbon dioxide ice that accumulated over the winter begins to sublimate (turn to vapor) as the sun rises higher in the sky and warms the ice. Sunlight penetrates through the transparent ice, and is absorbed at the base of the ice layer. The gas that forms as a result of the warming escapes through weaknesses in the ice and erupts in the form of magnificent geysers of gas and dust. This image captures some of this activity in a region near 85 degrees south latitude that is being monitored by HiRISE. What makes this image interesting is the changing directions of the fans left behind by the geysers, indicating that the winds blew from different directions at the time that the geysers erupted. Winds from the southwest produced the dark fans at both ends of the image, whereas northwesterly winds dominated dust deposition in between. Local topography probably played a role in altering the wind direction; this shaded relief image shows that this image traverses a trough in the South Polar layered deposits, which may have funneled winds down slope along the length of the trough. https://photojournal.jpl.nasa.gov/catalog/PIA22881
The distinctively fluted surface and elongated hills in this image in Medusae Fossae are caused by wind erosion of a soft fine-grained rock. Called yardangs, these features are aligned with the prevailing wind direction. This wind direction would have dominated for a very long time to carve these large-scale features into the exposed rock we see today. Yardangs not only reveal the strength and direction of historic winds, but also reveal something of the host rock itself. Close inspection by HiRISE shows an absence of boulders or rubble, especially along steep yardang cliffs and buttresses. The absence of rubble and the scale of the yardangs tells us that the host rock consists only of weakly cemented fine granules in tens of meters or more thick deposits. Such deposits could have come from extended settling of volcanic ash, atmospheric dust, or accumulations of wind deposited fine sands. After a time these deposits became cemented and cohesive, illustrated by the high standing relief and exposed cliffs. http://photojournal.jpl.nasa.gov/catalog/PIA21111
LSAWT\Twin Jet Test with HWB Model\JEDA Measurements Low Speed Aeroacoustic Wind Tunnel\Twin Jet Model System \Hybrid Wing Model Installed\ Measurement Technique: Jet Directional Array (JEDA)
LSAWT\Twin Jet Test with HWB Model\JEDA Measurements Low Speed Aeroacoustic Wind Tunnel\Twin Jet Model System \Hybrid Wing Model Installed\ Measurement Technique: Jet Directional Array (JEDA)
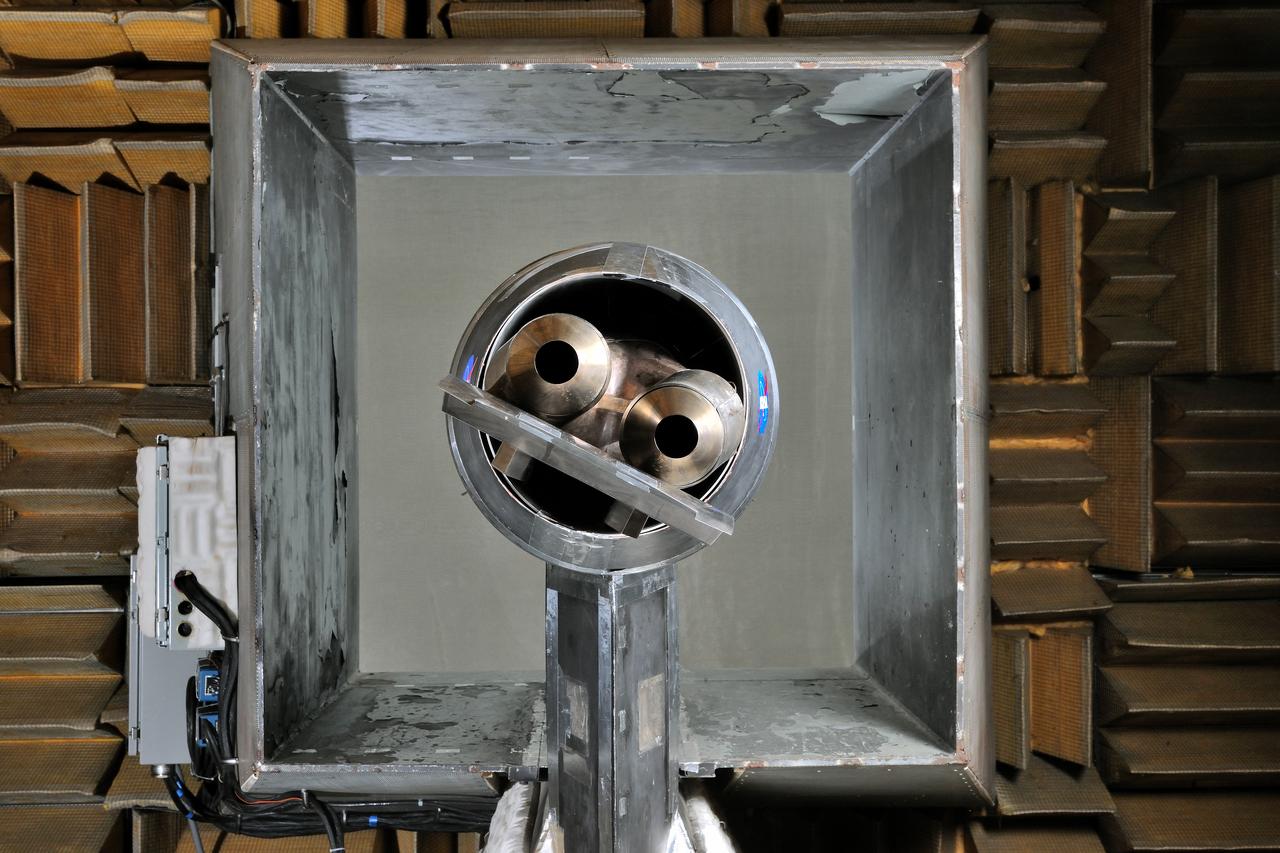
LSAWT\Twin Jet Test with HWB Model\JEDA Measurements Low Speed Aeroacoustic Wind Tunnel\Twin Jet Model System \Hybrid Wing Model Installed\ Measurement Technique: Jet Directional Array (JEDA)
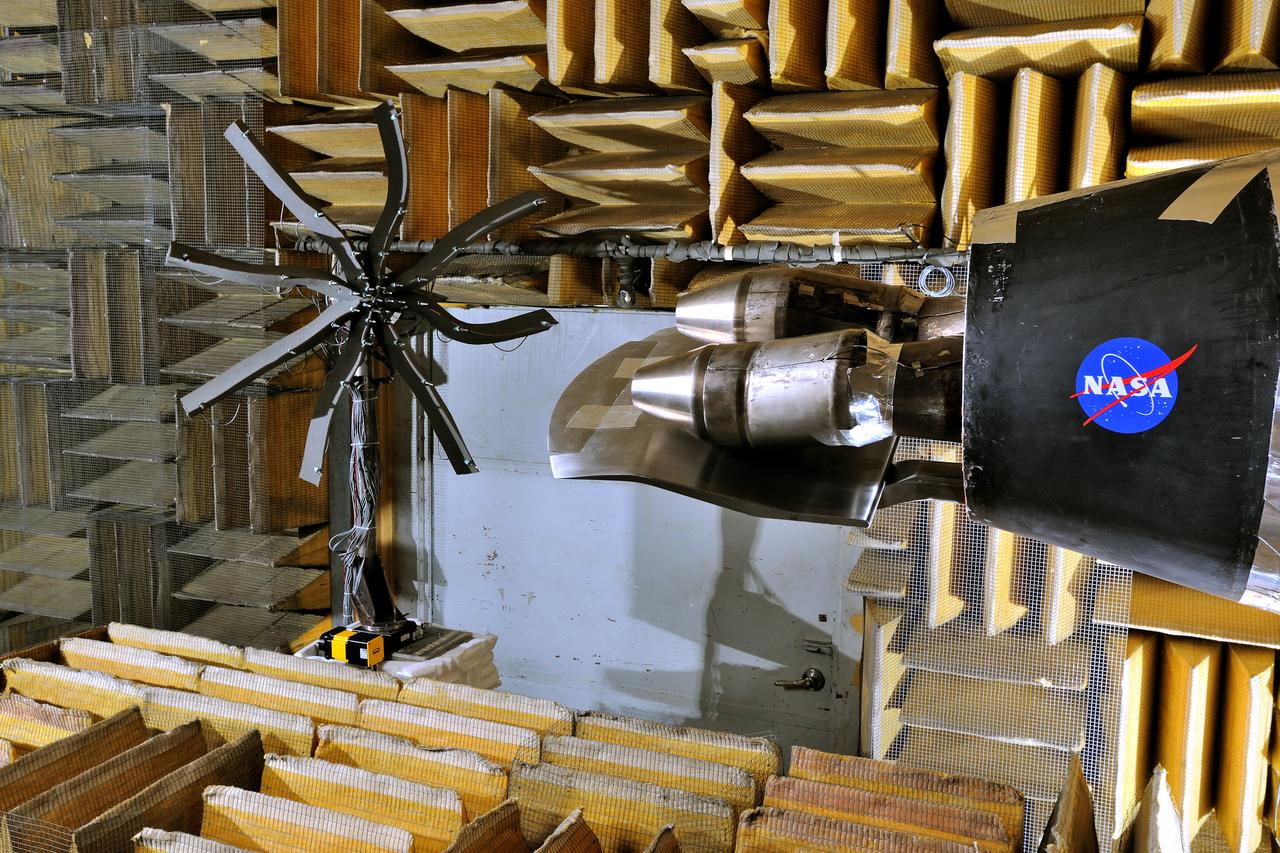
LSAWT\Twin Jet Test with HWB Model\JEDA Measurements Low Speed Aeroacoustic Wind Tunnel\Twin Jet Model System \Hybrid Wing Model Installed\ Measurement Technique: Jet Directional Array (JEDA)
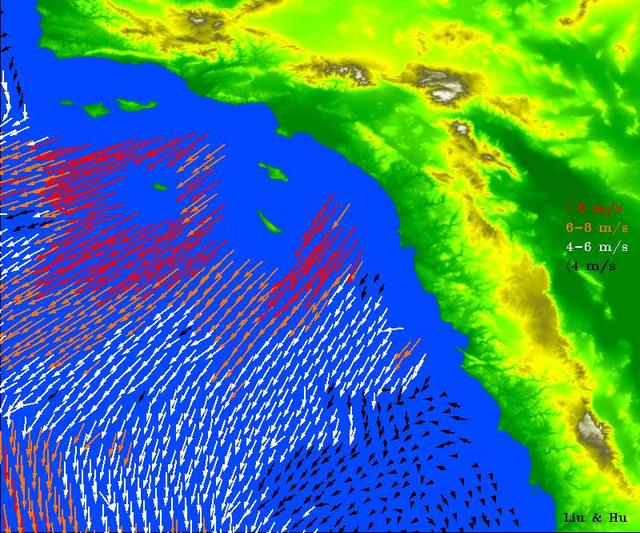
High-resolution ocean surface wind data from NASA's Quick Scatterometer (QuikScat) illustrate the strength of Santa Ana winds that pounded Southern California this week, causing damage and spreading brush fires. The colored arrows represent various ranges of wind speed, which were still well in excess of 30 knots (34 miles per hour), even after reaching the ocean and weakening. Santa Ana winds are offshore and down-slope winds unique to Southern California that are usually channeled through mountain gaps. These Santa Ana winds extend more than 500 kilometers (310 miles) offshore before changing direction to flow along the shore. The wind speeds and directions are retrieved from range-compressed backscatter data measured by QuikScat that has much higher spatial resolution than QuikScat's standard data products. Useful applications of high-resolution science-quality wind products derived from range-compressed backscatter have been demonstrated in two scientific papers: one on Hurricane Floyd and the other on Catalina Eddies. This is the first demonstration on near-real-time retrieval applications. http://photojournal.jpl.nasa.gov/catalog/PIA03892
Every Martian spring, fans of dust are blown out from under the seasonal layer of carbon dioxide ice that forms a polar cap over the winter. Gas blowing out from under the ice carries with it a load of dust that is deposited on the surface in a direction determined by the wind at the time of the eruption. Like windsocks, these fans in a polar area we've dubbed Macclesfield, record the direction that the wind was blowing. A citizen science task at Planet Four enlists the public to outline the fans. Their measurements go into a data base that will ultimately help us to understand weather on Mars. https://photojournal.jpl.nasa.gov/catalog/PIA23954
Today's VIS image is located in a region that has been heavily modified by wind action. The narrow ridge/valley system seen in this image are a feature called yardangs. Yardangs form when unidirectional winds blow across poorly cemented materials. Multiple yardang directions can indicate changes in regional wind regimes. Orbit Number: 64188 Latitude: -0.629314 Longitude: 206.572 Instrument: VIS Captured: 2016-06-03 01:20 http://photojournal.jpl.nasa.gov/catalog/PIA20799
Today's VIS image shows some of the extensive wind etched terrain in Memnonia Sulci, located south west of Olympus Mons. The linear ridges are called yardangs and form by wind removal of semi-cemented material. The ridges are parallel to wind direction, so the predominate winds that created the yardangs in this image blew NW/SE. At the bottom of the image several of the ridges have been eroded into smaller ridges aligned perpendicular to the large yardangs, indicating winds at a different angle. Orbit Number: 66197 Latitude: -5.91796 Longitude: 183.886 Instrument: VIS Captured: 2016-11-15 13:08 http://photojournal.jpl.nasa.gov/catalog/PIA21283
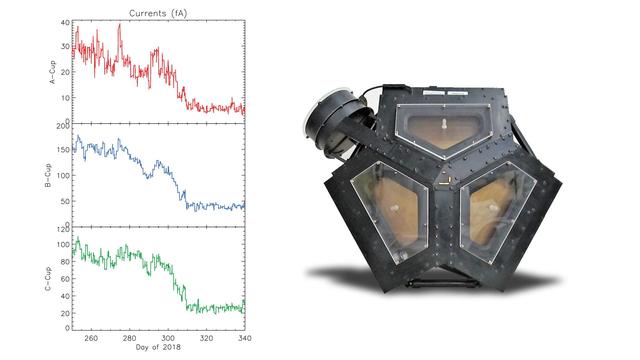
The set of graphs on the left illustrates the drop in electrical current detected in three directions by Voyager 2's plasma science experiment (PLS) to background levels. They are among the key pieces of data that Voyager scientists used to determine that Voyager 2 entered interstellar space, the space between stars, in November 2018. The disappearance in electrical current in the sunward-looking detectors indicates the spacecraft is no longer in the outward flow of solar wind plasma. It is instead in a new plasma environment -- interstellar medium plasma. The image on the right shows the Faraday cups of the PLS. The three sunward pointed cups point in slightly different directions in order to measure the direction of the solar wind. The fourth cup (on the upper left) points perpendicular to the others. https://photojournal.jpl.nasa.gov/catalog/PIA22922
On the west (left) side of this image from NASA's Mars Reconnaissance Orbiter, fairly textbook-looking barchan sand dunes sit atop the bedrock. Barchan dunes pointing in the opposite direction are just a few kilometers away to the east. In between these opposing barchan dunes are star dunes. Barchan dunes form when the sand-moving wind is fairly unidirectional. Star dunes, in contrast, form when the sand-moving wind comes from multiple directions -- not all at once, but from varying directions at different times of day or year. Where is the sand coming from? As with most places on Mars...well, that's an area of on-going research. But the star dunes are telling us that this area seems to be accumulating sand. https://photojournal.jpl.nasa.gov/catalog/PIA21934
![The prominent tear-shaped features in this image from NASA's Mars Reconnaissance Orbiter (MRO) are erosional features called yardangs. Yardangs are composed of sand grains that have clumped together and have become more resistant to erosion than their surrounding materials. As the winds of Mars blow and erode away at the landscape, the more cohesive rock is left behind as a standing feature. (This Context Camera image shows several examples of yardangs that overlie the darker iron-rich material that makes up the lava plains in the southern portion of Elysium Planitia.) Resistant as they may be, the yardangs are not permanent, and will eventually be eroded away by the persistence of the Martian winds. For scientists observing the Red Planet, yardangs serve as a useful indicator of regional prevailing wind direction. The sandy structures are slowly eroded down and carved into elongated shapes that point in the downwind direction, like giant weathervanes. In this instance, the yardangs are all aligned, pointing towards north-northwest. This shows that the winds in this area generally gust in that direction. The map is projected here at a scale of 50 centimeters (19.7 inches) per pixel. [The original image scale is 55.8 centimeters (21 inches) per pixel (with 2 x 2 binning); objects on the order of 167 centimeters (65.7 inches) across are resolved.] North is up. https://photojournal.jpl.nasa.gov/catalog/PIA22119](https://images-assets.nasa.gov/image/PIA22119/PIA22119~medium.jpg)
The prominent tear-shaped features in this image from NASA's Mars Reconnaissance Orbiter (MRO) are erosional features called yardangs. Yardangs are composed of sand grains that have clumped together and have become more resistant to erosion than their surrounding materials. As the winds of Mars blow and erode away at the landscape, the more cohesive rock is left behind as a standing feature. (This Context Camera image shows several examples of yardangs that overlie the darker iron-rich material that makes up the lava plains in the southern portion of Elysium Planitia.) Resistant as they may be, the yardangs are not permanent, and will eventually be eroded away by the persistence of the Martian winds. For scientists observing the Red Planet, yardangs serve as a useful indicator of regional prevailing wind direction. The sandy structures are slowly eroded down and carved into elongated shapes that point in the downwind direction, like giant weathervanes. In this instance, the yardangs are all aligned, pointing towards north-northwest. This shows that the winds in this area generally gust in that direction. The map is projected here at a scale of 50 centimeters (19.7 inches) per pixel. [The original image scale is 55.8 centimeters (21 inches) per pixel (with 2 x 2 binning); objects on the order of 167 centimeters (65.7 inches) across are resolved.] North is up. https://photojournal.jpl.nasa.gov/catalog/PIA22119

A large coronal hole has been spewing solar wind particles in the general direction of Earth over the past few days (Aug. 31- Sept. 1, 2017). It is the extensive dark area that stretches from the top of the sun and angles down to the right. Coronal holes are areas of open magnetic field, which allow charge particles to escape into space. They appear dark in certain wavelengths of extreme ultraviolet light such as shown here. These clouds of particles can cause aurora to appear, particularly in higher latitude regions. Movies are available at https://photojournal.jpl.nasa.gov/catalog/PIA21942
This image shows us a cross-section of a dune field. Dune shape depends on several factors, including the amount of sand present and the local wind directions. This dune field displays several distinct dune morphologies. We see both individual barchan-like dunes and more complex dune shapes. The dunes are arranged in a linear fashion at the northern extent of the field, first in areas with lots of sand, and then with relatively sand-free patches in between dune crests. HiRISE has observed dune activity in other similar fields, but this is our first image over this group of dunes. A second image is needed to determine if these dunes are also evolving and moving. https://photojournal.jpl.nasa.gov/catalog/PIA23021
Some geological materials (like solid rock) are incredibly tough, but others (like piles of volcanic ash) are quite soft. Some materials are soft enough that they can be eroded by the wind alone and yield landscapes that look like what we see in this HiRISE image. The long straight ridges seen here are called yardangs and they form on Mars (and Earth) when the wind strips away the inter-ridge material. This process is greatly aided when the wind is also blowing sand along. The sand grains do an effective job at stripping away loose material: these ridges are literally being sandblasted. Yardangs are useful features to recognize because the tell us the direction the wind is blowing in. They take a long time to form so this direction is the dominant wind orientation averaged over a long period of time (which might be quite different that the winds on Mars today). These yardangs also tell us that the surface here is made up of loose weak material and this information, in conjunction with other data, can tell us what the material is composed of and what the history of this particular site on Mars has been. http://photojournal.jpl.nasa.gov/catalog/PIA19457
The lower elevation on the left side of this VIS image is part of Memnonia Sucli. The higher elevations to the right are on the upper part of a mesa that bounds the sulci. The image shows some of the extensive wind etched terrain in Memnonia Sulci, located south west of Olympus Mons. The linear ridges are called yardangs and form by wind removal of semi-cemented material. The ridges are parallel to wind direction, so the predominate winds that created the yardangs in this image blew NE/SW. Orbit Number: 78296 Latitude: -7.8302 Longitude: 186.694 Instrument: VIS Captured: 2019-08-09 04:54 https://photojournal.jpl.nasa.gov/catalog/PIA23471
Today's VIS image shows part of the eastern flank of Eumenides Dorsum, a large linear rise located in southern Amazonis Planitia. This area of Mars is dominated by poorly cemented surface material that is easily eroded by the wind. Features align with wind direction, indicating that the winds in this region blew from the northeast. Eumenides Dorsum is part of the larger Medusa Fossae Formation of wind eroded materials south and southwest of Olympus Mons. The nature of the material being eroded is not known, but may be ash fall deposits, sourced from the Tharsis and Apollinaris volcanoes. Orbit Number: 93214 Latitude: -3.19141 Longitude: 205.117 Instrument: VIS Captured: 2022-12-19 12:09 https://photojournal.jpl.nasa.gov/catalog/PIA25849
This VIS image of the northwestern end of Gordii Dorsum shows where the dorsum meets Amazonis Planitia. This area of Mars is dominated by poorly cemented surface material that is easily eroded by the wind. Features align with wind direction, indicating that the winds in this region blew to the northwest. Gordii Dorsum is part of the larger Medusa Fossae Formation of wind eroded materials south and southwest of Olympus Mons. The nature of the material being eroded is not known, but may be ash fall from the large volcanoes in the region. Orbit Number: 86244 Latitude: 10.6389 Longitude: 210.903 Instrument: VIS Captured: 2021-05-24 15:22 https://photojournal.jpl.nasa.gov/catalog/PIA24230
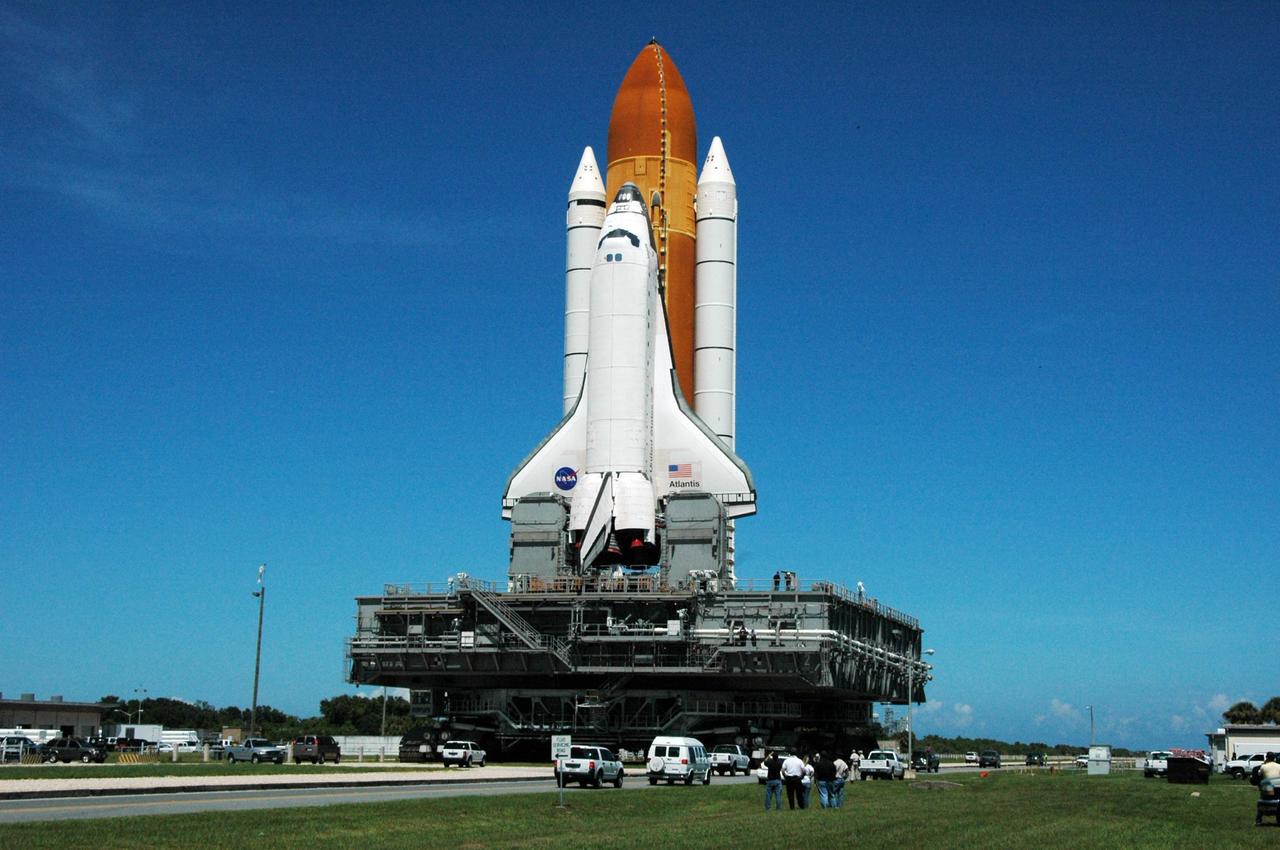
KENNEDY SPACE CENTER, FLA. - On the crawlerway, Space Shuttle Atlantis reverses direction and begins rolling back out to Launch Pad 39B. It had been moved off the launch pad due to concerns about the impact of Tropical Storm Ernesto, expected within 24 hours. The forecast of lesser winds expected from Ernesto and its projected direction convinced Launch Integration Manager LeRoy Cain and Shuttle Launch Director Mike Leinbach to return the shuttle to the launch pad. Photo credit: NASA/Ken Thornsley
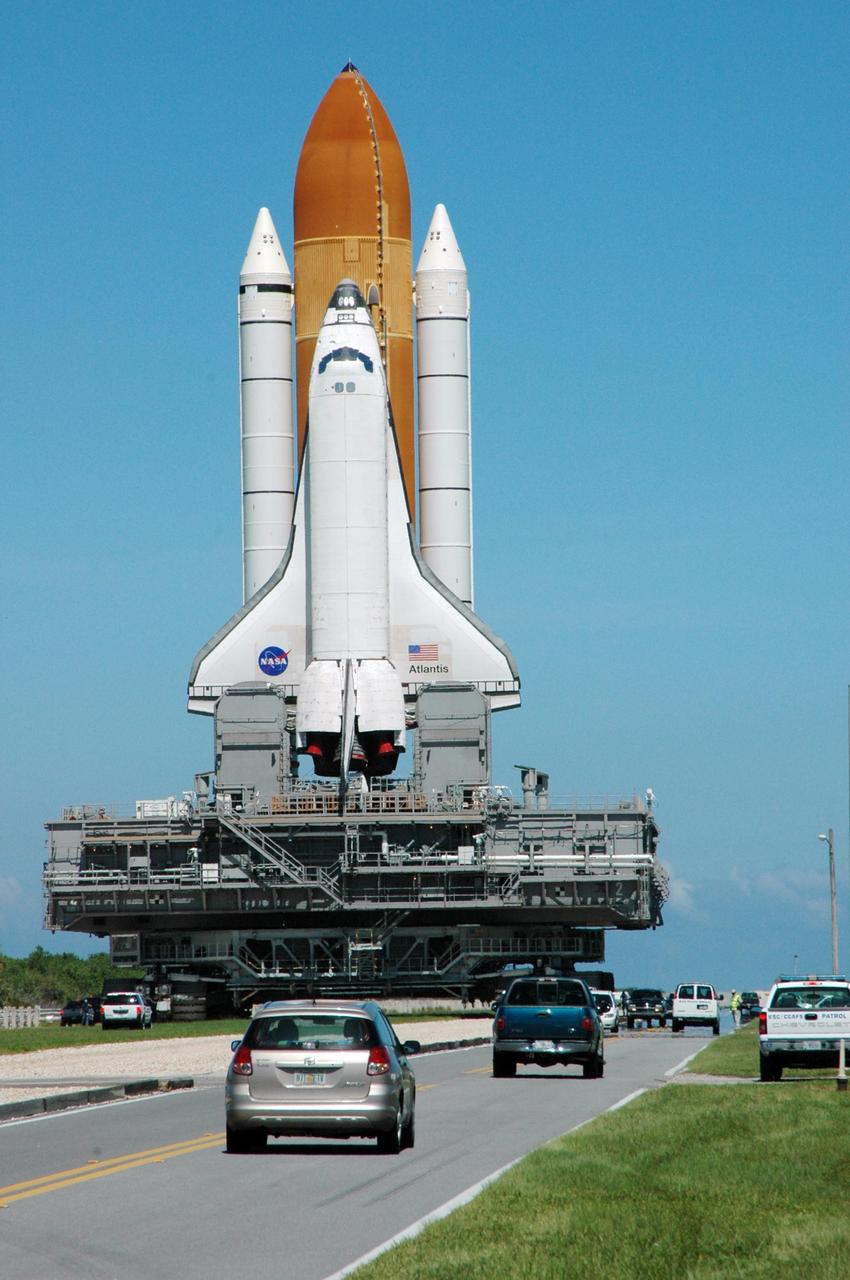
KENNEDY SPACE CENTER, FLA. - Space Shuttle Atlantis reverses direction and begins rolling back out to Launch Pad 39B. It had been moved off the launch pad due to concerns about the impact of Tropical Storm Ernesto, expected within 24 hours. The forecast of lesser winds expected from Ernesto and its projected direction convinced Launch Integration Manager LeRoy Cain and Shuttle Launch Director Mike Leinbach to return the shuttle to the launch pad Photo credit: NASA/Ken Thornsley
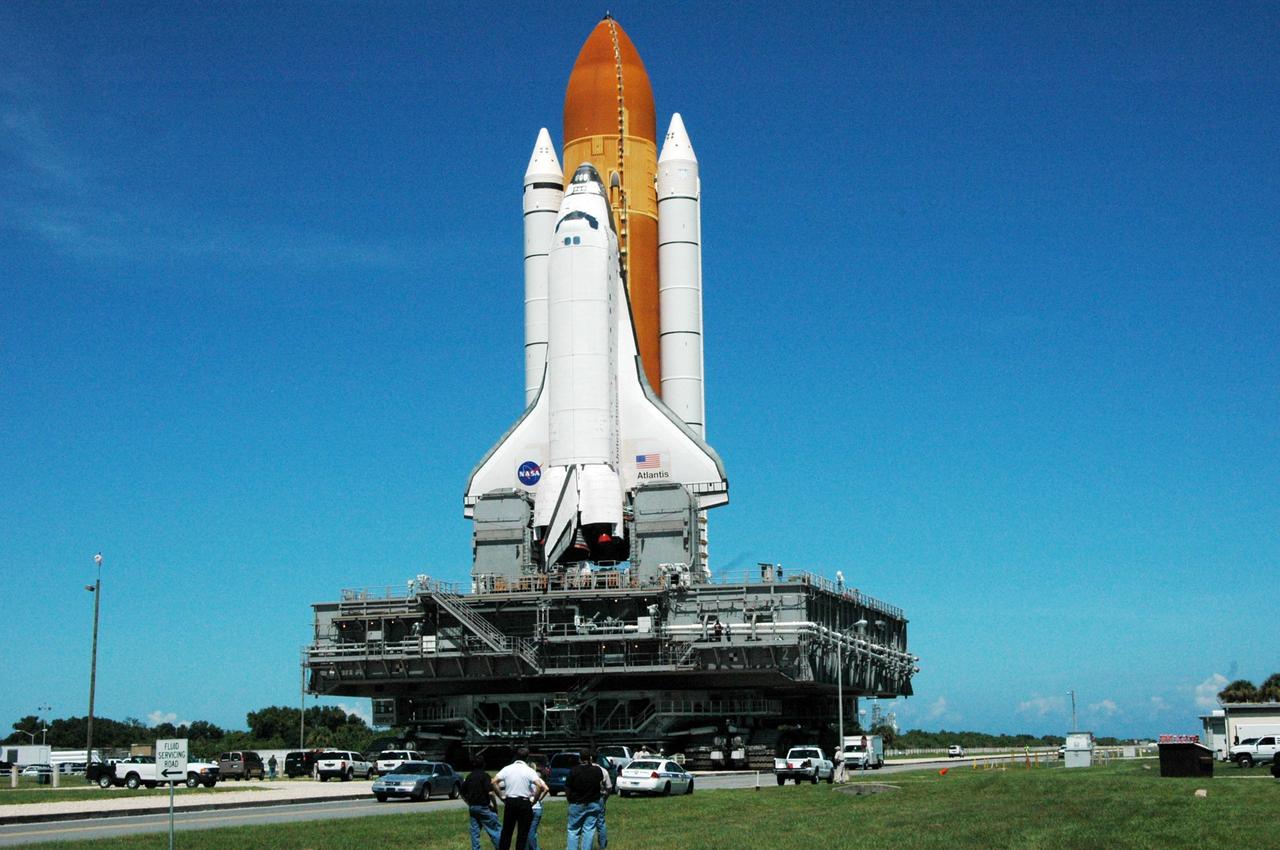
KENNEDY SPACE CENTER, FLA. - Space Shuttle Atlantis reverses direction and begins rolling back out to Launch Pad 39B. It had been moved off the launch pad due to concerns about the impact of Tropical Storm Ernesto, expected within 24 hours. The forecast of lesser winds expected from Ernesto and its projected direction convinced Launch Integration Manager LeRoy Cain and Shuttle Launch Director Mike Leinbach to return the shuttle to the launch pad. Photo credit: NASA/Ken Thornsley
This observation from NASA Mars Reconnaissance Orbiter spacecraft shows a terrain of relatively smooth region that transitions into sharp ridges called yardangs on Apollonaris Patera. These ridges, aligned in the nearly same direction, are called yardangs. Yardangs are not unique to Mars. Many yardangs can be found on Earth, in very dry regions with strong prevailing winds. Yardangs are formed when a surface that is composed of materials of differing strengths (i.e., of both harder and softer materials) is shaped by the abrasive action of sand and dust carried by the wind. In this case, and given the proximity of the Apollonaris Patera volcanic center, we think that these wind-carved deposits are comprised of volcanic ash and pyroclastics that erupted from Apollonaris when it was last active in the not-too-distant geologic past. Over time, the softer materials (likely volcanic ash) were eroded away, leaving behind the harder materials in the form of elongated ridges that are parallel to the direction of the prevailing wind. The end result is a stunning, out-of-this-world display of yardangs, sculpted with the artistic chisel of the Martian wind. http://photojournal.jpl.nasa.gov/catalog/PIA19869
These two images show Hurricane Isabel as viewed by AIRS and SeaWinds scatterometers on NASA ADEOS-2 and QuikScat satellites in September, 2003. AIRS data are used to create global three-dimensional maps of temperature, humidity and clouds, while scatterometers measure surface wind speed and direction. http://photojournal.jpl.nasa.gov/catalog/PIA00429
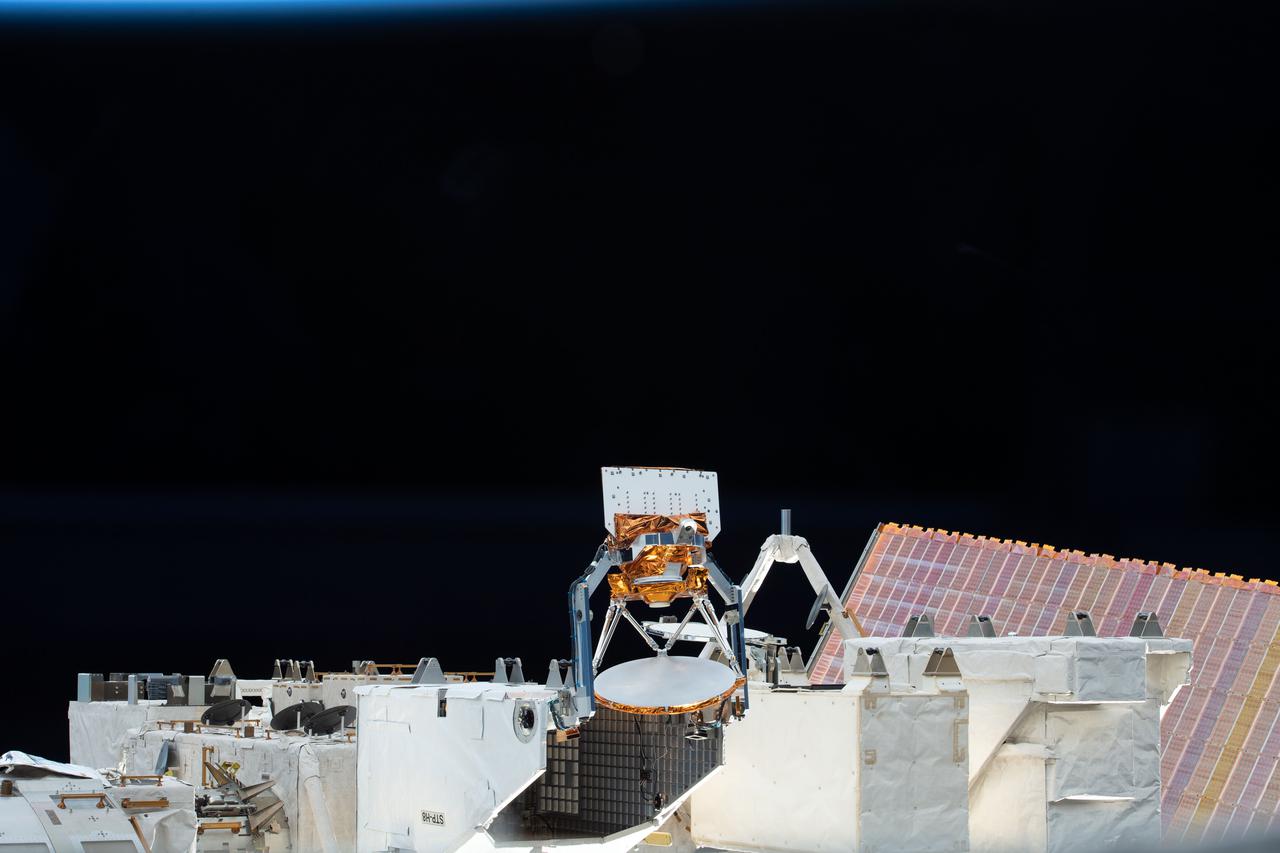
iss066e113950 (1/15/2022) --- A view of the STP-H8-COWVR aboard the International Space Station (ISS). The Space Test Program-Houston 8-Compact Ocean Wind Vector Radiometer (STP-H8-COWVR) demonstrates on-orbit use of a new terrestrial microwave meterological sensor designed to deliver accurate sea surface wind direction and speed data .
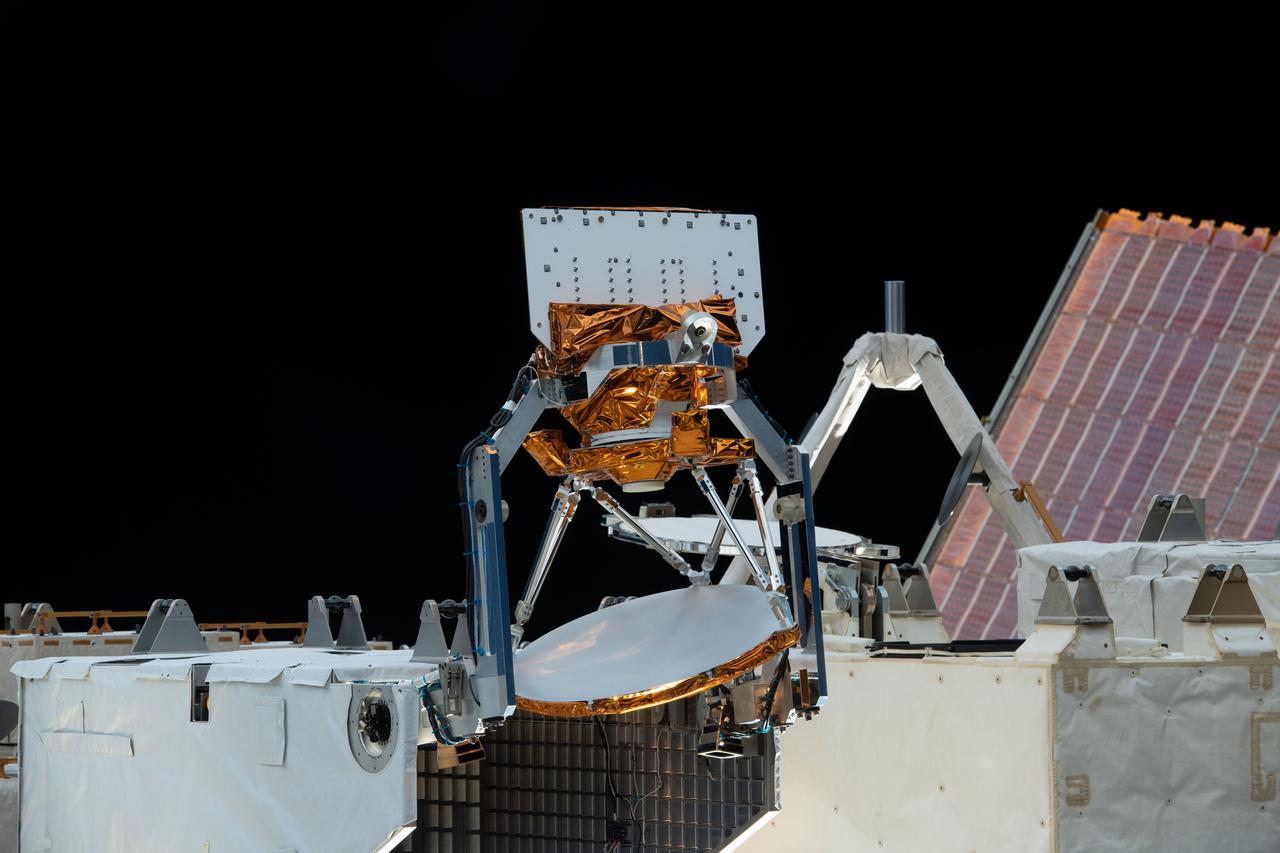
iss066e113944 (1/15/2022) --- A view of the STP-H8-COWVR aboard the International Space Station (ISS). The Space Test Program-Houston 8-Compact Ocean Wind Vector Radiometer (STP-H8-COWVR) demonstrates on-orbit use of a new terrestrial microwave meterological sensor designed to deliver accurate sea surface wind direction and speed data .
jsc2021e048037 (10/22/2021) --- A preflight view of COWVR during Antenna Range Testing. Space Test Program-Houston 8-Compact Ocean Wind Vector Radiometer (STP-H8-COWVR) demonstrates on-orbit use of a new terrestrial microwave meteorological sensor. It is designed to deliver accurate sea surface wind direction and speed data that are critical to naval surface operations and forecasting and tracking hurricanes and typhoons. Image courtesy of JPL.
Eumenides Dorsum is a large linear rise located in southern Amazonis Planitia. Erosion by wind action is prevalent in this region. The horseshoe shaped depressions, called blowouts, indicate the major wind direction in this region is from lower left to upper right. Orbit Number: 72856 Latitude: 1.32798 Longitude: 203.353 Instrument: VIS Captured: 2018-05-18 04:06 https://photojournal.jpl.nasa.gov/catalog/PIA22658
jsc2021e0480388 (10/22/2021) --- A preflight view of COWVR during TVAC Testing. Space Test Program-Houston 8-Compact Ocean Wind Vector Radiometer (STP-H8-COWVR) demonstrates on-orbit use of a new terrestrial microwave meteorological sensor. It is designed to deliver accurate sea surface wind direction and speed data that are critical to naval surface operations and forecasting and tracking hurricanes and typhoons. Image courtesy of JPL.
The northeast coast of Hokkaido and Kunashir Island, Japan (44.0N, 143.0E) are seen bordered by drifting sea ice. The sea ice has formed a complex pattern of eddies in response to surface water currents and winds. Photos of this kind aid researchers in describing local ocean current patterns and the effects of wind speed and direction on the drift of surface material, such as ice floes or oil. Kunashir is the southernmost of the Kuril Islands.
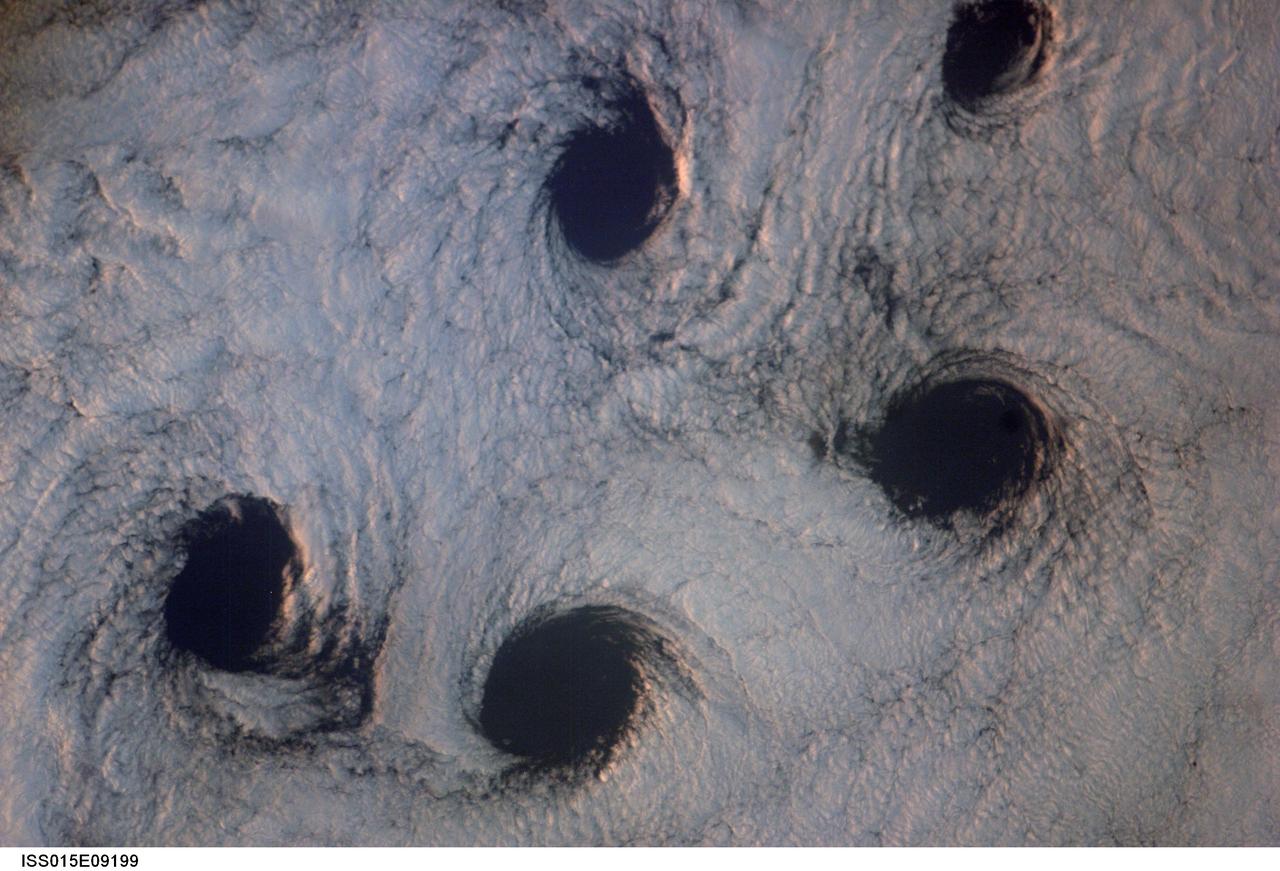
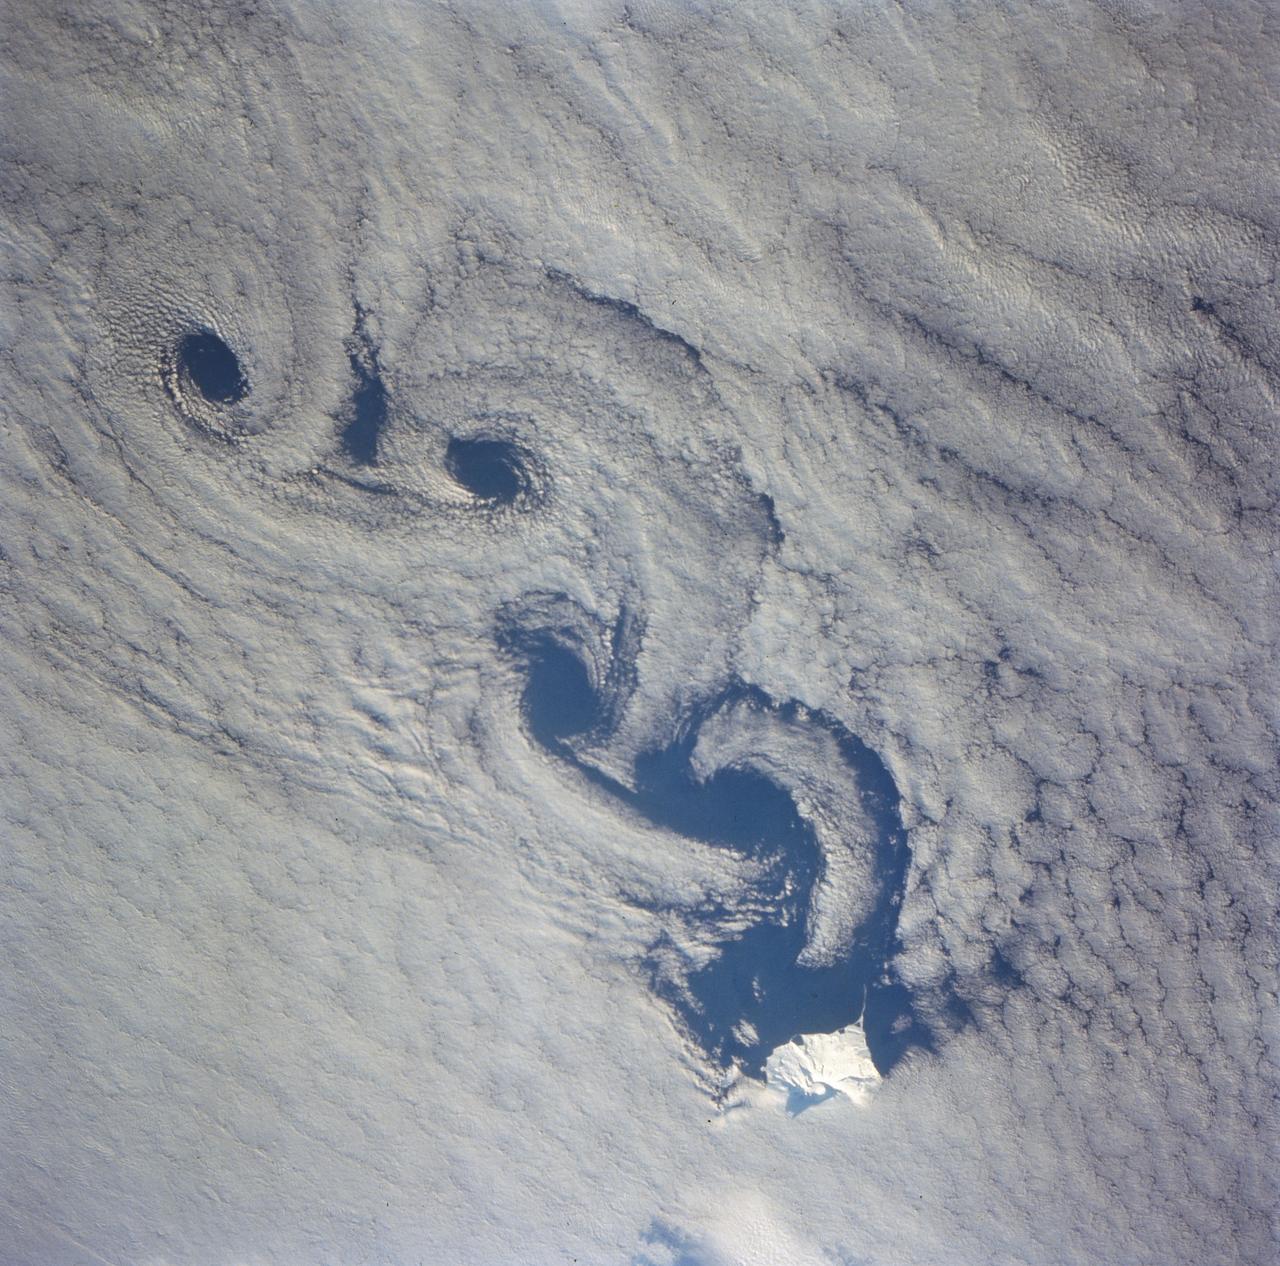
ISS015-E-09199 (23 May 2007) --- Von Karman cloud vortices near the Aleutian Islands are featured in this image photographed by an Expedition 15 crewmember on the International Space Station. The vortices are created by the wind encountering a barrier such as an island, changing direction and velocity and forming eddies in the wind and cloud pattern on the lee side of the island. The nadir point of the space station when the image was taken was 51.1 degrees north latitude and 178.8 degrees west longitude.
jsc2021e048036 (10/22/2021) --- A preflight view of COWVR during EMC Testing. Space Test Program-Houston 8-Compact Ocean Wind Vector Radiometer (STP-H8-COWVR) demonstrates on-orbit use of a new terrestrial microwave meteorological sensor. It is designed to deliver accurate sea surface wind direction and speed data that are critical to naval surface operations and forecasting and tracking hurricanes and typhoons. Image courtesy of JPL.
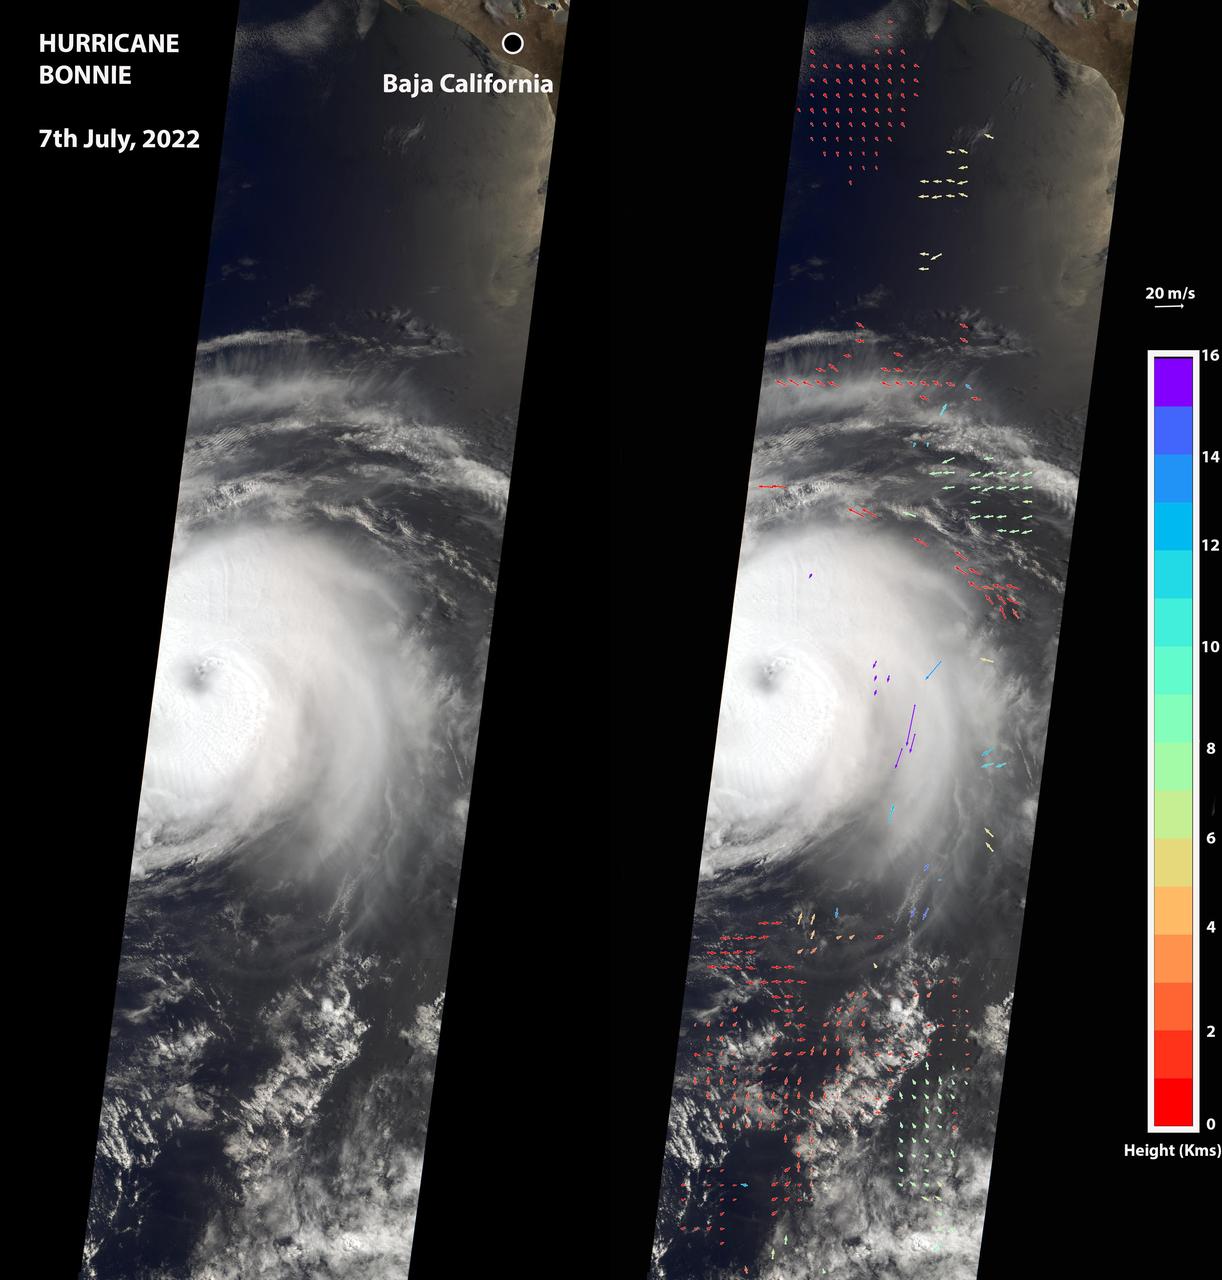
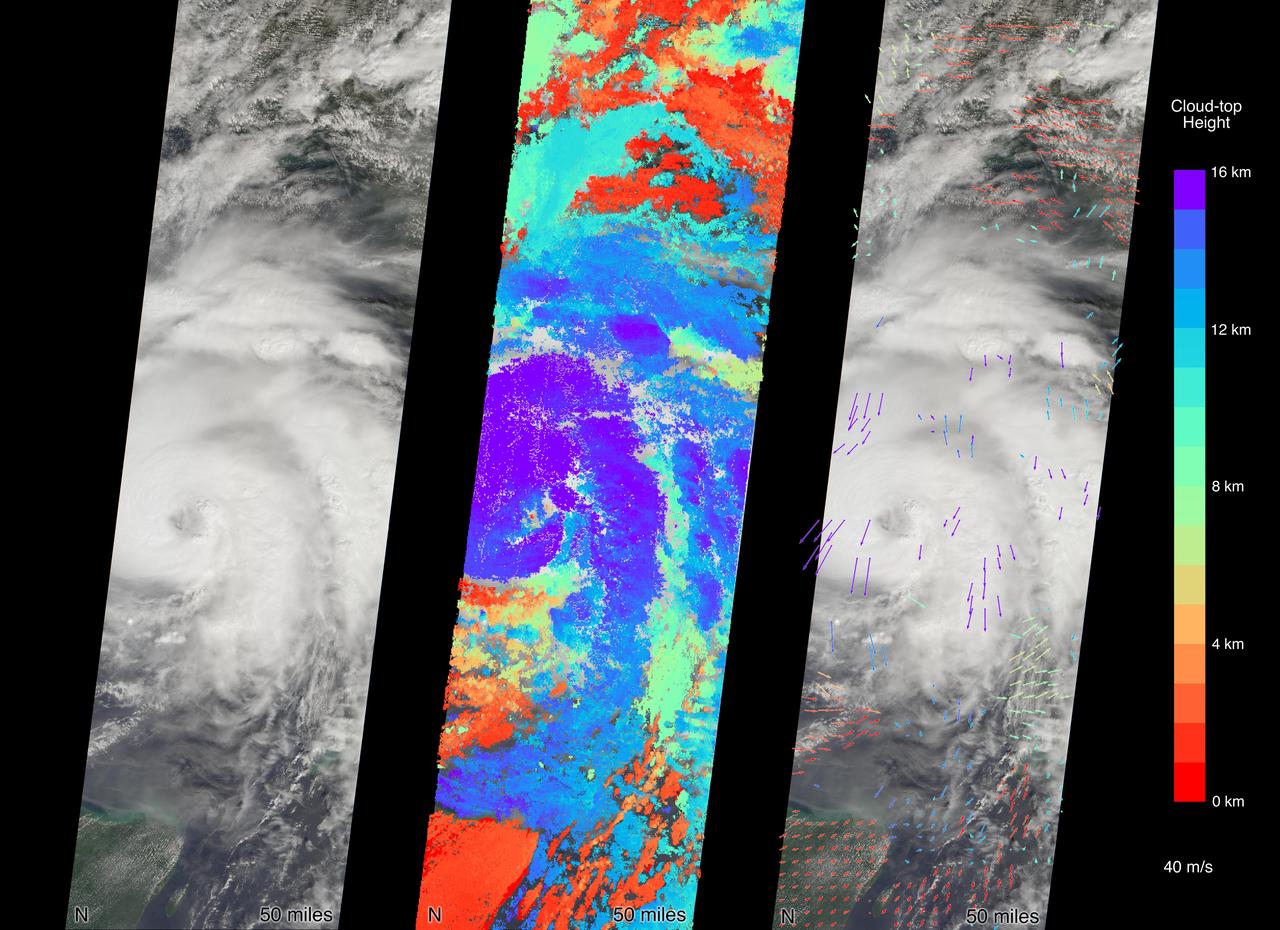
The Multi-angle Imaging SpectroRadiometer (MISR) instrument aboard NASA's Terra satellite captured this image of the eye of Hurricane Bonnie, located about 500 miles (800 kilometers) southwest of the southern tip of Baja California, Mexico, at about 11 a.m. local time on July 7, 2022. Initially classified as a tropical storm on July 2, Bonnie intensified to a Category 3 hurricane on July 5. It was later downgraded, and as of July 8, was considered a tropical storm. MISR carries nine cameras pointed at Earth at different angles and each camera viewed Bonnie over a period of seven minutes. The motion of the hurricane between those views provides information on wind speed and direction at the height of the clouds. The panel on the left shows the image from MISR's downward-pointing camera. The colored arrows in the panel on the right, superimposed on the same image as the left panel, show wind speed and direction. The length of the arrows is proportional to wind speed, and their color shows the altitude of the cloud tops in kilometers. MISR observed winds blowing counterclockwise at about 34 mph (55 kph) at altitudes of 6,500 to 33,000 feet (2 to 10 kilometers), consistent with maximal wind gusts reported by the National Hurricane Center based on data from local weather stations and buoys. At altitudes of about 36,000 to 52,000 feet (11 to 16 kilometers), MISR observed winds blowing clockwise at up to 123 mph (198 kph). The eye, spiral rainbands, and reversal of wind direction between low and high altitudes are typical features of a hurricane. https://photojournal.jpl.nasa.gov/catalog/PIA24906
This VIS images shows several windstreaks located on the volcanic plains of Daedalia Planum. The dark and bright material forming "tails" behind the craters were created by surface winds funneled over and around the crater. The raised rims and bowls of impact craters causes a complex interaction such that the wind vortex in the lee of the crater can both scour away the surface dust and deposit it back in the center of the lee. The "tail" shows the direction of the wind, in this case blowing from the right to the left. Orbit Number: 80441 Latitude: -13.1034 Longitude: 223.8 Instrument: VIS Captured: 2020-02-01 19:50 https://photojournal.jpl.nasa.gov/catalog/PIA23838
This VIS image shows a small region in Terra Sirenum. The bright material forming "tails" behind the craters were created by surface winds funneled over and around the crater. The raised rims and bowls of impact craters causes a complex interaction such that the wind vortex in the lee of the crater can both scour away the surface dust and deposit it back in the center of the lee. The "tail" shows the direction of the wind, in this case blowing from the upper right to the lower left. Orbit Number: 73131 Latitude: -15.549 Longitude: 188.595 Instrument: VIS Captured: 2018-06-09 19:41 https://photojournal.jpl.nasa.gov/catalog/PIA22668

In this image many sand dunes are visible. They have an elongated crescent form and are called "barchan dunes." They are formed by the continuous action of the wind, blowing in the same direction, giving this particular shape. The orientation of these dunes tell us that the prevailing wind blows from the right to the left (east to west). The wind is continuously moving sand grains up the longer dune slope, towards the top. The small ripples on the slope are caused by this movement. When the sand grains arrive at the top, they fall down the steeper and shorter slope, which as a consequence, has no ripples. It is this gradual sand movement that causes the dunes to slowly move over time. https://photojournal.jpl.nasa.gov/catalog/PIA23056
Today's VIS image shows a windstreak on lava plains southwest of Arsia Mons. The extensive lava flow field is called Daedalia Planum. The dark and bright material forming the "tail" behind the crater were created by surface winds funneling over and around the crater. The raised rim and bowl of impact craters causes a complex interaction such that the wind vortex in the lee of the crater can both scour away the surface dust and deposit it back in the center of the lee. The "tail" shows the direction of the wind, in this case blowing from the right to the left. Orbit Number: 81564 Latitude: -15.0456 Longitude: 226.493 Instrument: VIS Captured: 2020-05-04 07:02 https://photojournal.jpl.nasa.gov/catalog/PIA23997
Today's VIS image shows some of the extensive wind etched terrain in Memnonia Sulci, located east of Apollinaris Mons. Memnonia Sulci is part of the Medusae Fossae Formation, a region of soft, easily eroded deposits that extends for nearly 5000km (3106 miles) along the equator of Mars between Olympus Mons and Apollinaris Mons. In this region, like many others throughout the Medusae Fossae Formation, the surface has been eroded by the wind into a series of linear ridges called yardangs. The ridges generally point in direction of the prevailing winds that carved them, so the predominate winds that created the yardangs in this image blew NW/SE. The easily eroded nature of the Medusae Fossae Formation suggests that it is composed of weakly cemented particles, and was most likely formed by the deposition of wind-blown dust or volcanic ash. Orbit Number: 94406 Latitude: -5.66737 Longitude: 184.045 Instrument: VIS Captured: 2023-03-27 16:37 https://photojournal.jpl.nasa.gov/catalog/PIA26027
MISR carries nine cameras fixed at different angles, each of which viewed Michael over the course of approximately seven minutes when it was just off Florida's west coast on Tuesday, October 9. Images from the nine views are used to calculate the height of the cloud tops, and the motion of the clouds between the views provides information on wind speed and direction. This composite image shows the view from the central, downward-pointing camera (left), the calculated cloud-top heights (middle), and wind velocity vectors (right) superimposed on the image. The length of the arrows is proportional to wind speed and the colors show the altitude of the cloud tops in kilometers. The National Hurricane Center clocked Michael's sustained wind speed at 150 mph (240 kph) just before noon local time on Wednesday. It is expected to bring strong winds, storm surge and heavy rain to much of the southeast. https://photojournal.jpl.nasa.gov/catalog/PIA22750
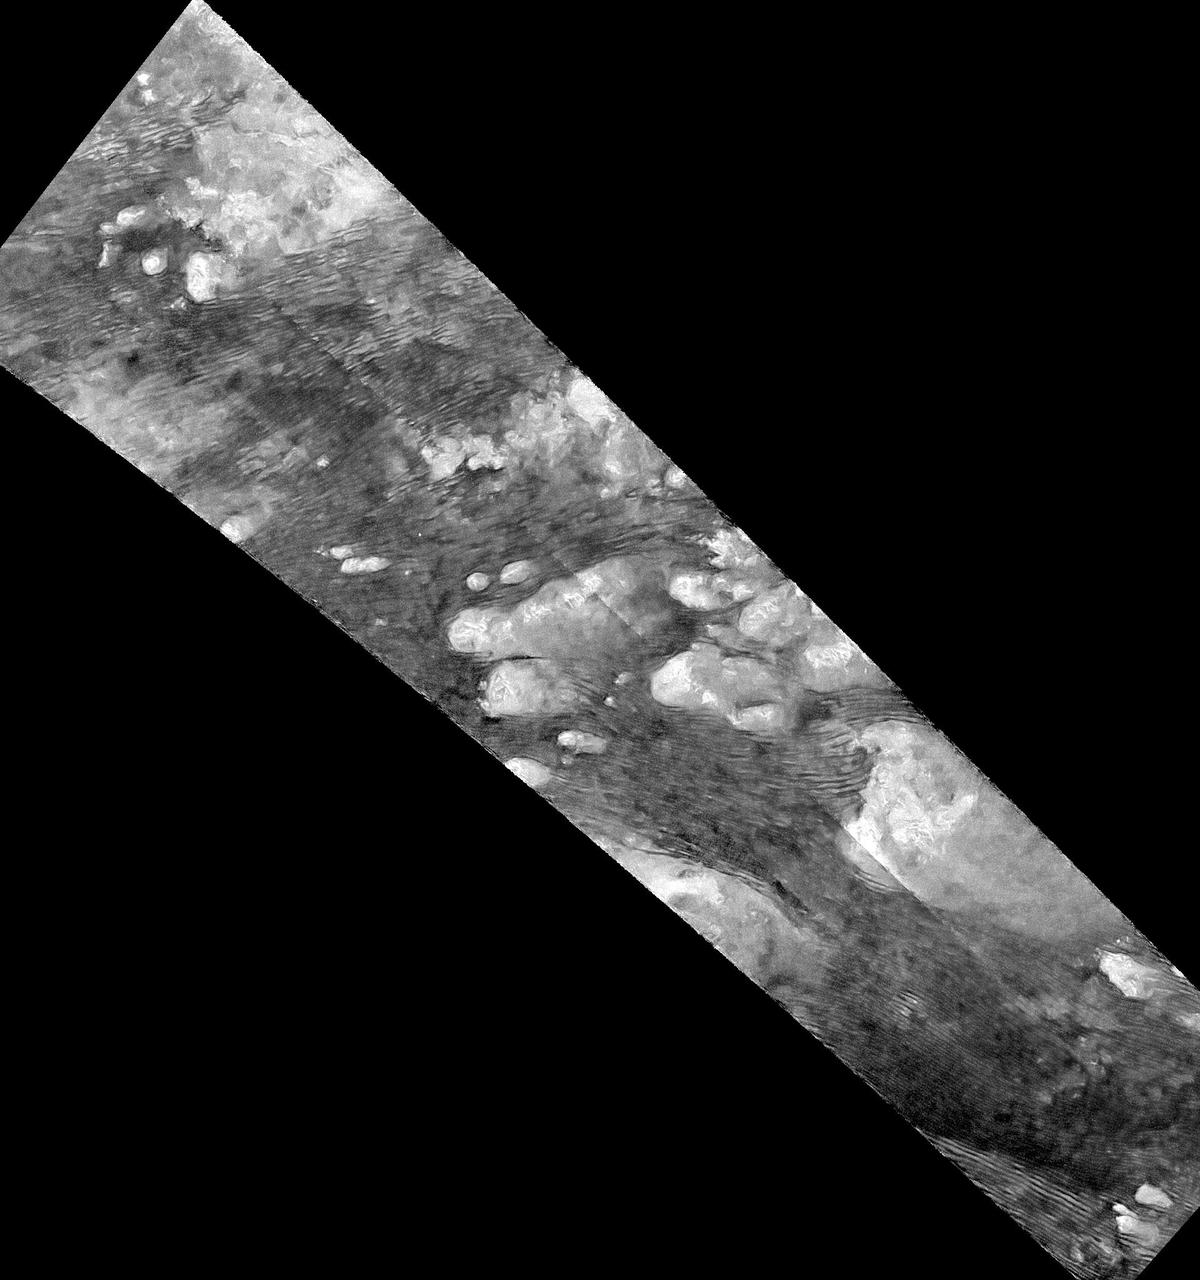
This radar image of the Shangri-La Sand Sea on Titan from NASA's Cassini spacecraft shows hundreds of sand dunes are visible as dark lines snaking across the surface. These dunes display patterns of undulation and divergence around elevated mountains (which appear bright to the radar), thereby showing the direction of wind and sand transport on the surface. Sands being carried from left to right (west to east) cannot surmount the tallest obstacles; instead, they are directed through chutes and canyons between the tall features, evident in thin, blade-like, isolated dunes between bright some features. Once sands have passed around the obstacles, they resume their downwind course, at first collecting into small, patchy dunes and then organizing into larger, more pervasive linear forms, before being halted once again by obstacles. These patterns reveal the effects not only of wind -- perhaps even modern winds if the dunes are actively moving today -- but also the effects of underlying bedrock and surrounding topography. Dunes across the solar system aid in our understanding of underlying topography, winds and climate, past and present. Similar patterns can be seen in dunes of the Great Sandy Desert in Australia, where dunes undulate broadly across the uneven terrain and are halted at the margins of sand-trapping lakes. The dune orientations correlate generally with the direction of current trade winds, and reveal that winds must have been similar back when the dunes formed, during the Pleistocene glacial and interglacial periods. The image was taken by the Cassini Synthetic Aperture radar (SAR) on July 25, 2016 during the mission's 122nd targeted Titan encounter. The image has been modified by the denoising method described in A. Lucas, JGR:Planets (2014). http://photojournal.jpl.nasa.gov/catalog/PIA20711
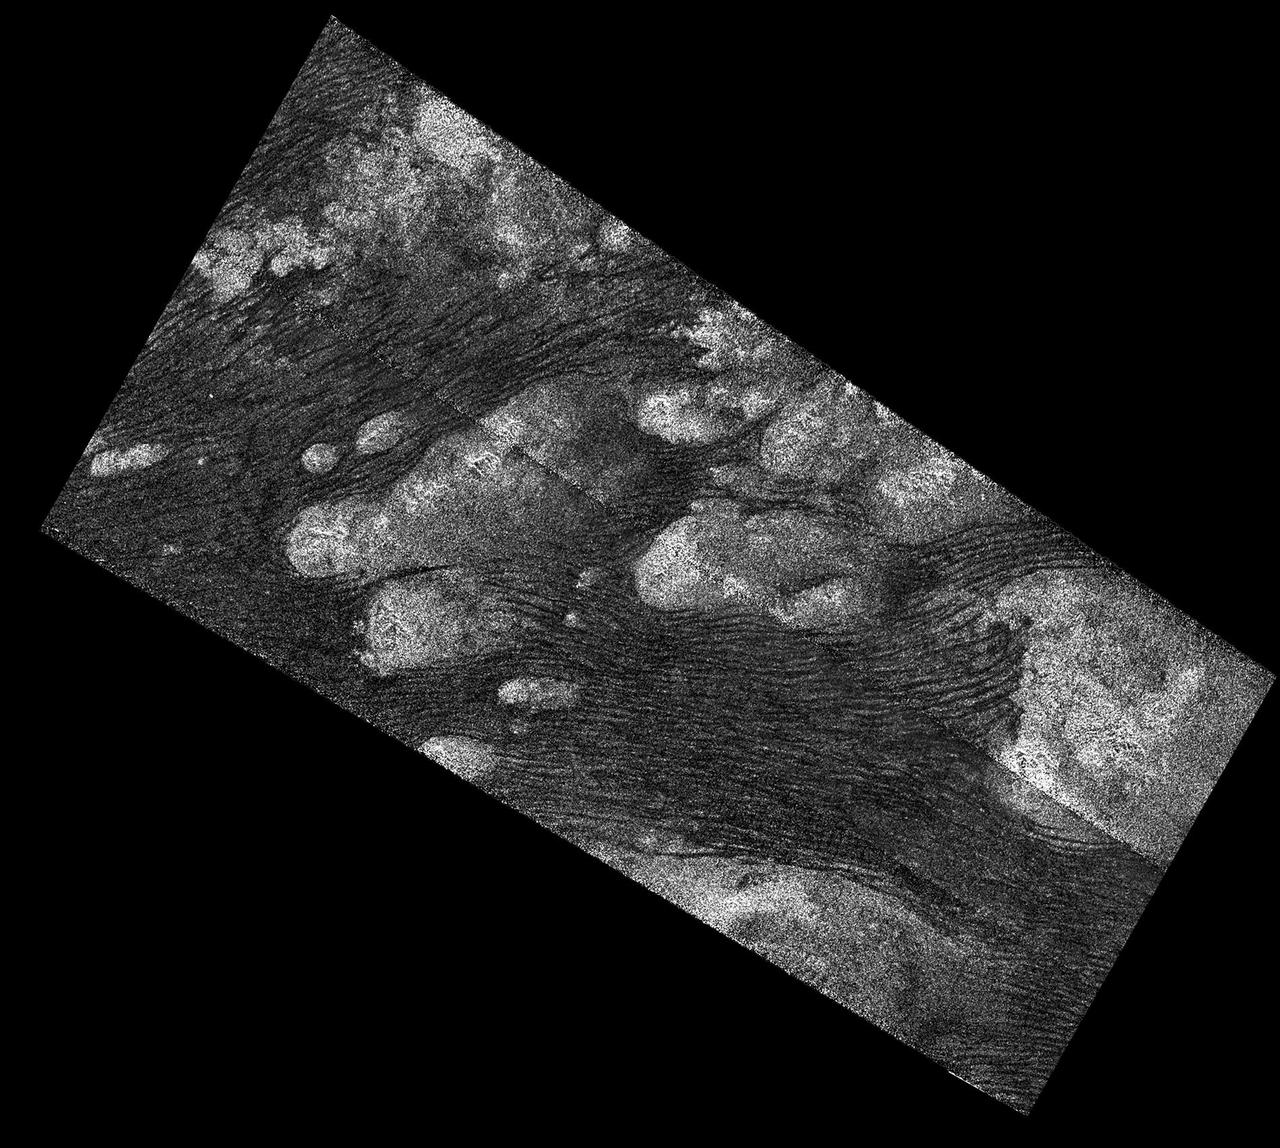
The Shangri-La Sand Sea on Titan is shown in this image from the Synthetic Aperture radar (SAR) on NASA's Cassini spacecraft. Hundreds of sand dunes are visible as dark lines snaking across the surface. These dunes display patterns of undulation and divergence around elevated mountains (which appear bright to the radar), thereby showing the direction of wind and sand transport on the surface. Sands being carried from left to right (west to east) cannot surmount the tallest obstacles; instead, they are directed through chutes and canyons between the tall features, evident in thin, blade-like, isolated dunes between bright some features. Once sands have passed around the obstacles, they resume their downwind course, at first collecting into small, patchy dunes and then organizing into larger, more pervasive linear forms, before being halted once again by obstacles. These patterns reveal the effects not only of wind -- perhaps even modern winds if the dunes are actively moving today -- but also the effects of underlying bedrock and surrounding topography. Dunes across the solar system aid in our understanding of underlying topography, winds and climate, past and present. Similar patterns can be seen in dunes of the Great Sandy Desert in Australia, where dunes undulate broadly across the uneven terrain and are halted at the margins of sand-trapping lakes. The dune orientations correlate generally with the direction of current trade winds, and reveal that winds must have been similar back when the dunes formed, during the Pleistocene glacial and interglacial periods. An annotated version of this radar image is also available.at the Photojournal. North on Titan is up in the image. Radar illuminates the scene from upper right at a 27-degree incidence angle. http://photojournal.jpl.nasa.gov/catalog/PIA20710

Taken in late southern spring and when Mars is near perihelion (closest distance to the Sun), this image shows the effects of dry ice sublimation on a longitudinal dune in the far Southern hemisphere. The bright patches on the dune are still covered in frost, and the dark regions are frost-free. Longitudinal dunes form when the wind switches between two common directions*. Based on the direction of this dune's long crest and the orientation of the smaller ripples, it appears the wind blows from the east and from the northwest. However, it would require taking multiple HiRISE images of this location over time and noticing movement before we could say this definitively. The broad base of this dune may indicate that dune sand has spilled out from areas once covered in ice. During the next Martian Southern hemisphere winter (about half a Mars year or one Earth year from when this image was taken), this dune will again be covered in frost and possibly solid carbon dioxide ice, unable to blow in the wind until the volatiles begin to sublimate in the spring. *These are ripples indicating a wind out of the north/northwest. The scene is 250 m across. http://photojournal.jpl.nasa.gov/catalog/PIA19293

ISS013-E-75141 (2 Sept. 2006) --- Erg Oriental, Algeria is featured in this image photographed by an Expedition 13 crewmember onboard the International Space Station. One of the main interests of rainless regions like the Sahara Desert to landscape science is that the work of flowing water--mainly streams and rivers--becomes less important than the work of wind. According to scientists, over millennia, and if enough sand is available, winds can generate dunes of enormous size, arranged in regular patterns. Long, generally north-south trending linear dunes stretch across much of northeast Algeria covering a vast tract (approximately 140,000 kilometers square) of the Sahara Desert known as the Erg Oriental. Erg means dune sea in Arabic, and the term has been adopted into modern geology. Spanning this image diagonally are a series of two kilometer-wide linear dunes, comprised of red sand, from a point on the southwest margin of the erg (center point 28.9N 4.8W). The dune chains are more than 100 meters high. The "streets" between the dunes are grayer areas free of sand. Linear dune chains are usually generated roughly parallel with the dominant winds. It also seems to be true that linear dunes are built by stronger winds. This detailed view shows that smaller dunes, known as star dunes, are built on top of the linear dunes. By contrast, star dunes seem to form in weak wind regimes, with winds from different directions in each season -- resulting in characteristic "arms" snaking away from a central point. Some scientists therefore think the dunes in this image were generated in two earlier climatic phases, different from that of today. (1) During a phase when winds were stronger and dominantly from one direction (the south), major linear sand masses accumulated. (2) Later, when wind strengths declined, the star dunes formed. Modern features--known as wind streaks--on the edge of the present erg (not shown), younger than either the linear or star dunes, show that present-day sand-moving winds blow from the southwest.
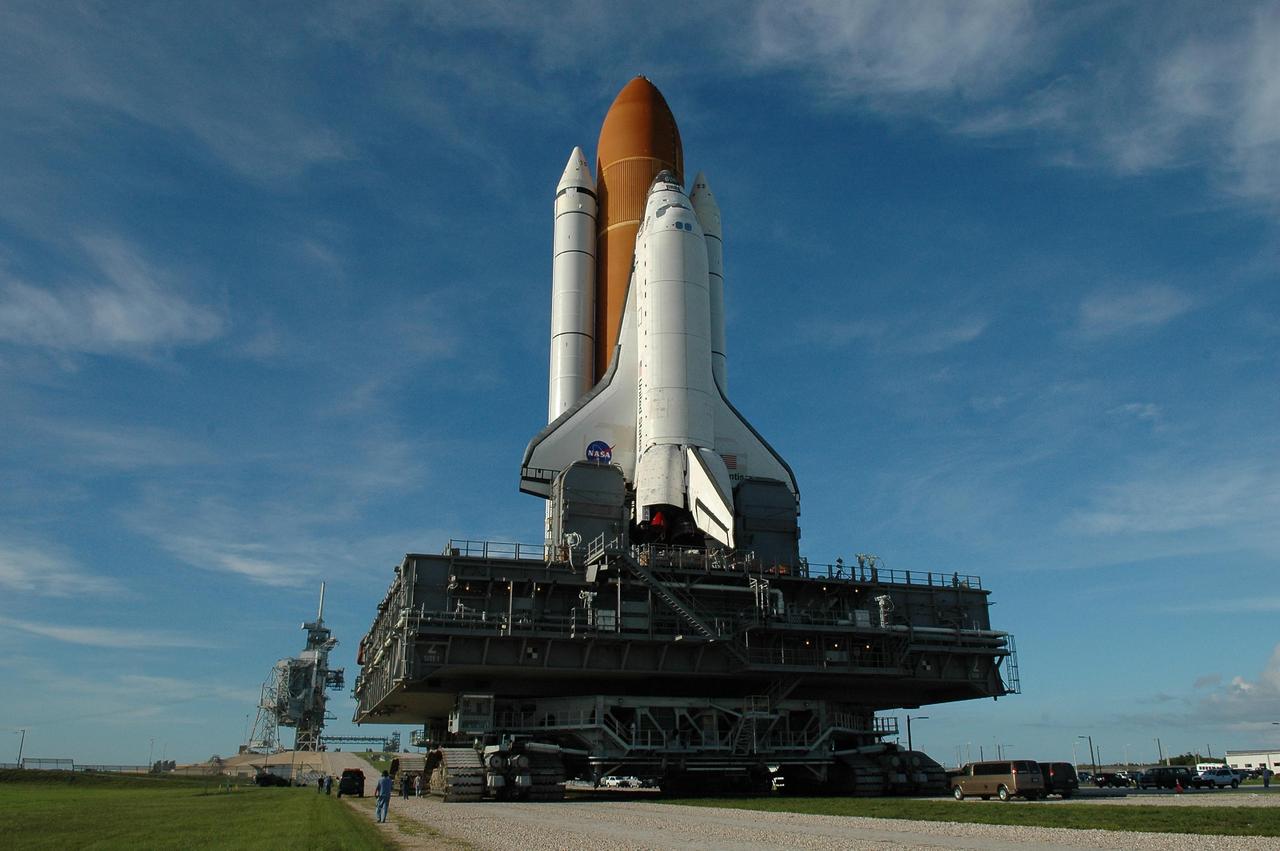
KENNEDY SPACE CENTER, FLA. - After reversing its direction to the Vehicle Assembly Building, Space Shuttle Atlantis nears Launch Pad 39B. The shuttle is returning to Launch Pad 39B, in the background, after rolling back to the Vehicle Assembly Building due to concerns about the impact of Tropical Storm Ernesto. However, before reaching the VAB, the forecast of lesser winds expected from Ernesto and its projected direction convinced Launch Integration Manager LeRoy Cain and Shuttle Launch Director Mike Leinbach to return the shuttle to the launch pad. Photo credit: NASA/Kim Shiflett
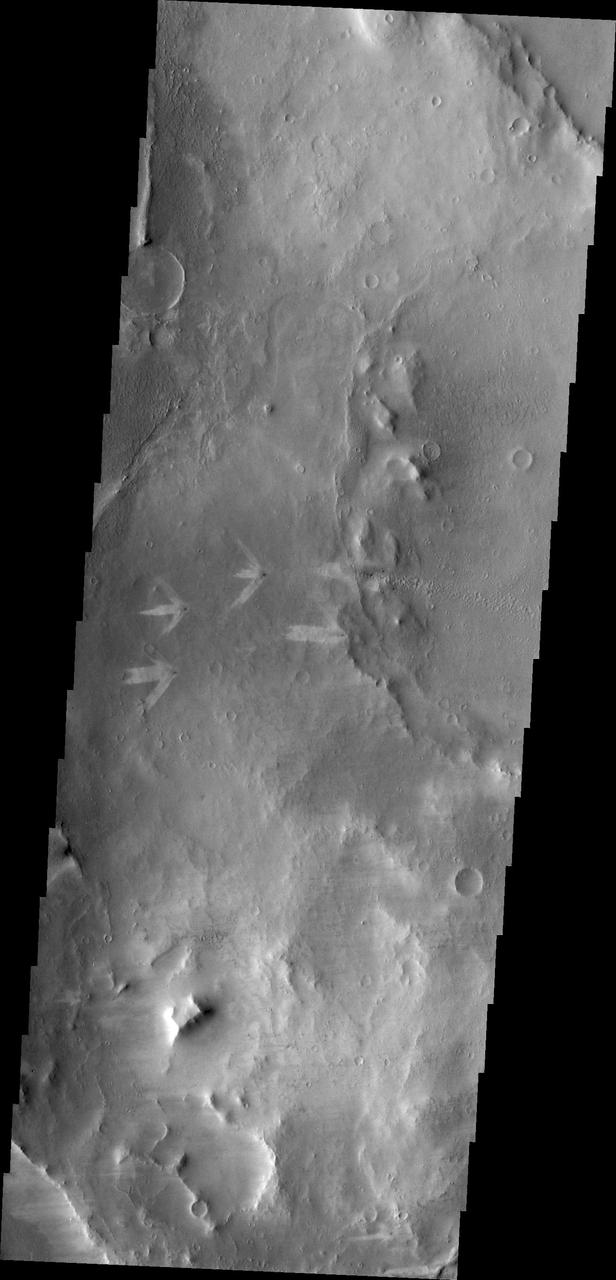
It is about two weeks later in Inca City and the season is officially spring. Numerous changes have occurred. Large blotches of dust cover the araneiforms. Dark spots on the ridge show places where the seasonal polar ice cap has ruptured, releasing gas and fine material from the surface below. At the bottom of the image fans point in more than one direction from a single source, showing that the wind has changed direction while gas and dust were flowing out. Was the flow continuous or has the vent opened and closed? http://photojournal.jpl.nasa.gov/catalog/PIA18893
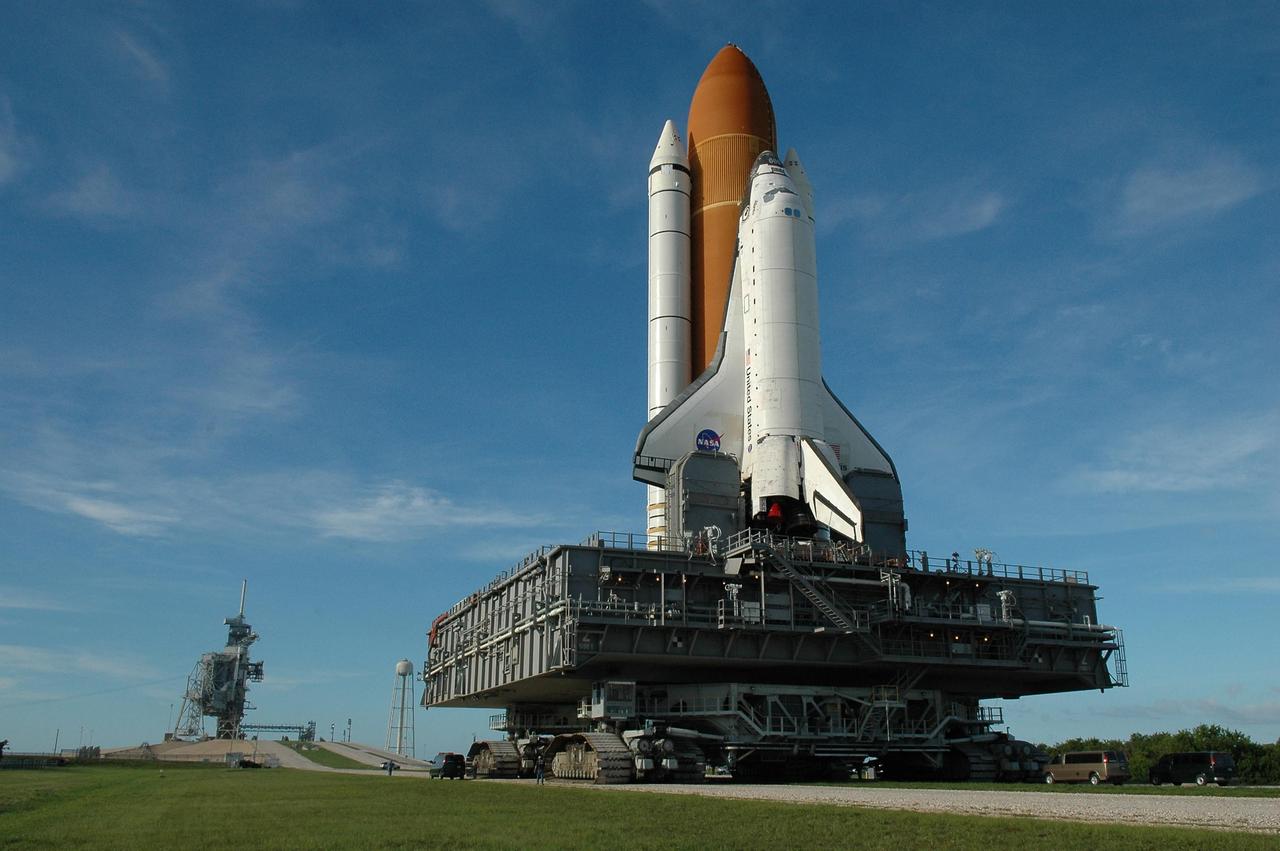
KENNEDY SPACE CENTER, FLA. - After reversing its direction to the Vehicle Assembly Building, Space Shuttle Atlantis nears Launch Pad 39B. The shuttle had been moved off the launch pad due to concerns about the impact of Tropical Storm Ernesto, expected within 24 hours. The forecast of lesser winds expected from Ernesto and its projected direction convinced Launch Integration Manager LeRoy Cain and Shuttle Launch Director Mike Leinbach to return the shuttle to the launch pad. Photo credit: NASA/Kim Shiflett
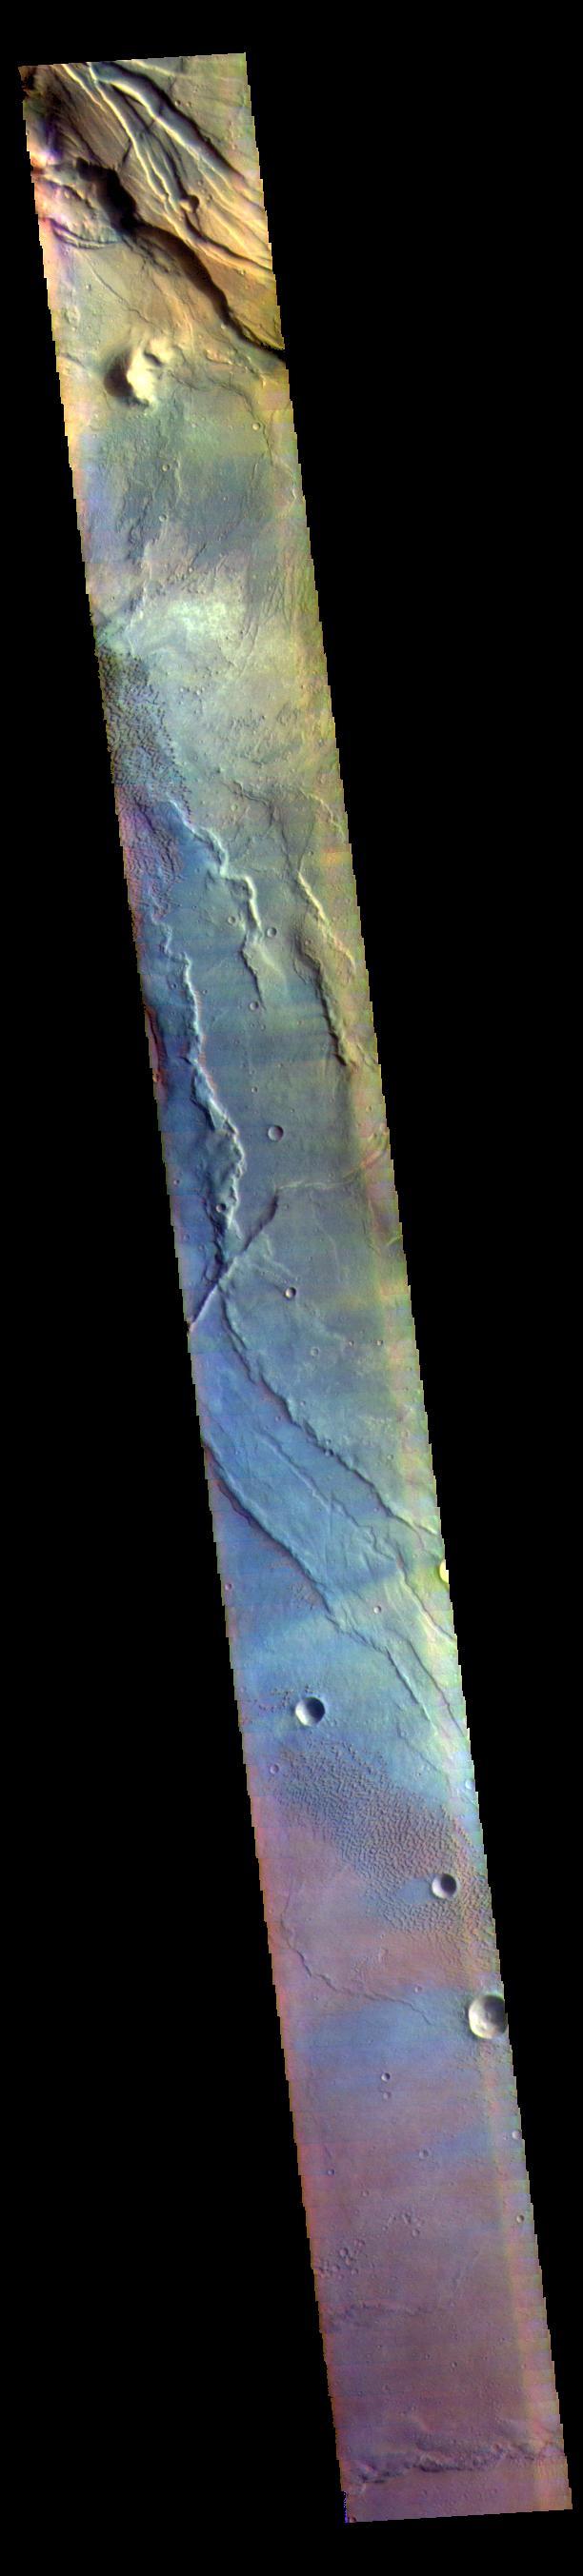
Multiple processes, which may have occurred billions of years apart, are reflected in this HiRISE image of Aeolis Planum. Cutting across the scene are curvilinear ridges. These likely represent ancient, meandering river channels that flowed across the surface and buried themselves over time. The channels have subsequently been exposed to the surface by the wind, forming the cross-cutting ridges. Approximately north-south across the image are a series of linear ridges called "yardangs," which are streamlined landforms that also form due to wind-driven erosion. The orientation of the yardangs reflects the prevailing wind direction when they formed. Both sets of ridges emerged from the preferential removal of softer bedrock by the wind. https://photojournal.jpl.nasa.gov/catalog/PIA25989
This VIS image is located in the center of Syrtis Major Planum. At the top of the image is Nili Patera, a volcanic summit. The sand dunes located near Nili Patera are visible on the left side of the image. The bottom of the image is just west of Meroe Patera. Dunes located between Nili and Meroe are visible towards the bottom of the image. Winds in the region have created the dunes, but also many windstreaks on the downward side of craters in the image. Wind streaks indicate the direction of the wind. In this region the winds are blowing from east to west. The THEMIS VIS camera contains 5 filters. The data from different filters can be combined in multiple ways to create a false color image. These false color images may reveal subtle variations of the surface not easily identified in a single band image. Orbit Number: 62072 Latitude: 7.99408 Longitude: 67.5512 Instrument: VIS Captured: 2015-12-11 18:39 https://photojournal.jpl.nasa.gov/catalog/PIA23095
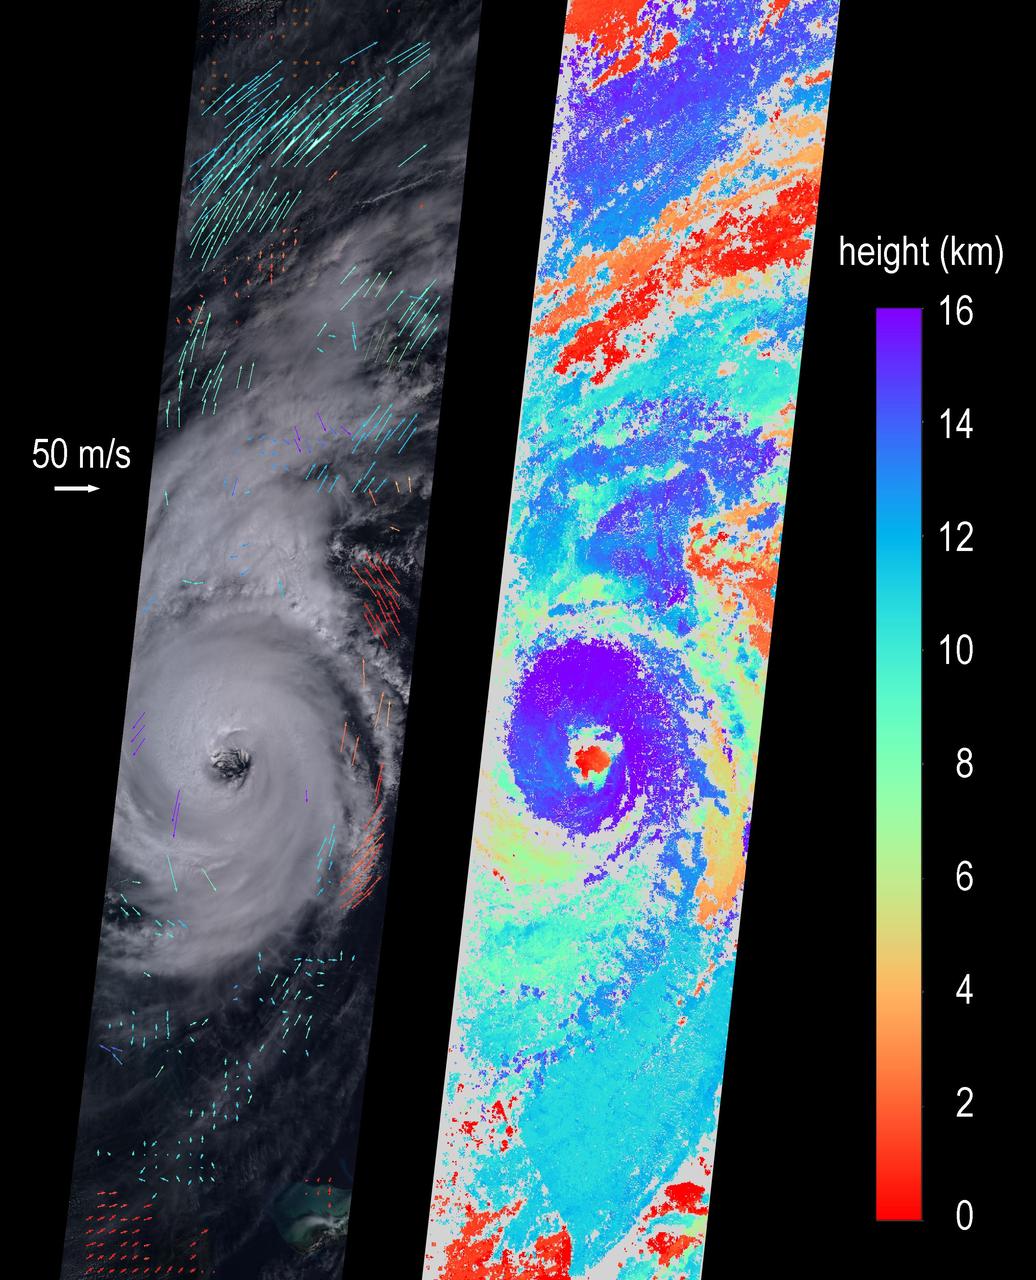
On Sept. 5, 2019 at about noon EDT, the Multi-angle Imaging SpectroRadiometer (MISR) instrument aboard NASA's Terra satellite passed over the eye of Hurricane Dorian as the storm tracked northeast along the Atlantic coast, about 50 miles from Charleston, South Carolina. During this time, Dorian was weakening from Category 3 to Category 2 following a second period of intensification. MISR carries nine cameras fixed at different angles, each of which viewed Dorian over a period of about seven minutes. The multi-camera views are used to calculate the heights of the cloud tops, and the motion of the clouds between the views provides information on wind speed and direction. The left side of the image shows the view from the downward-pointing (nadir) camera, with wind velocity vectors superimposed over it. The derived cloud-top heights are shown at the right, along with the color scale. The length of the wind arrows is proportional to wind speed and their colors show the altitude of the cloud tops in kilometers. MISR observed cyclonic (counterclockwise) wind speeds up to 35 meters per second (78 miles per hour) at altitudes of 3-4 kilometers (1.9 to 2.5 miles), consistent with maximal wind gusts reported by the National Hurricane Center based on data from local weather stations and buoys. At higher altitudes of 11-12 kms (6.8-7.5 miles), MISR observed anti-cyclonic (clockwise) wind speeds up to 55 meters per second (123 mph). The eye, spiral rainbands, and reversal of wind direction between low and high altitudes are typical features of a hurricane's anatomy. https://photojournal.jpl.nasa.gov/catalog/PIA23423