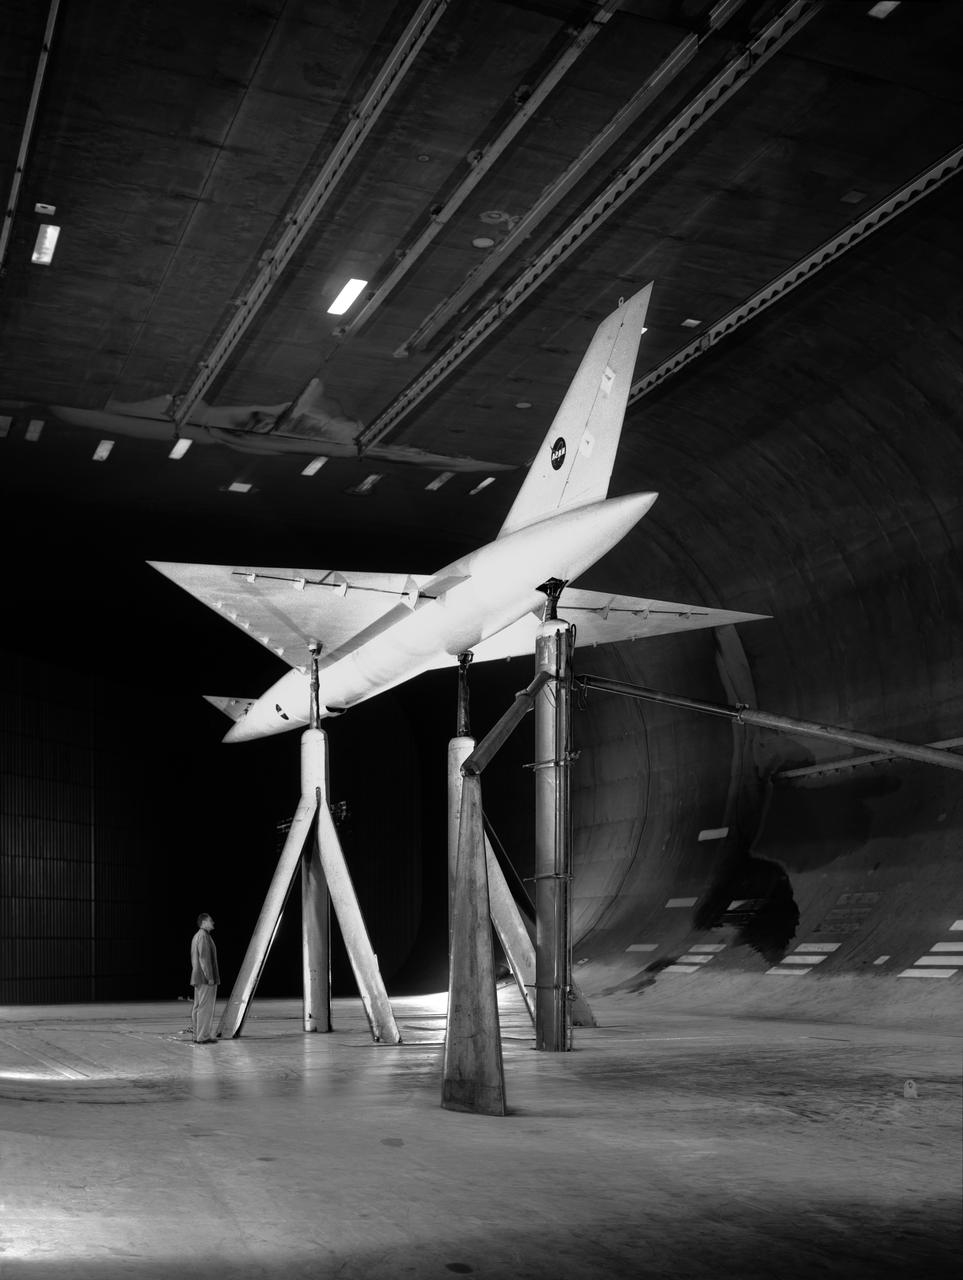
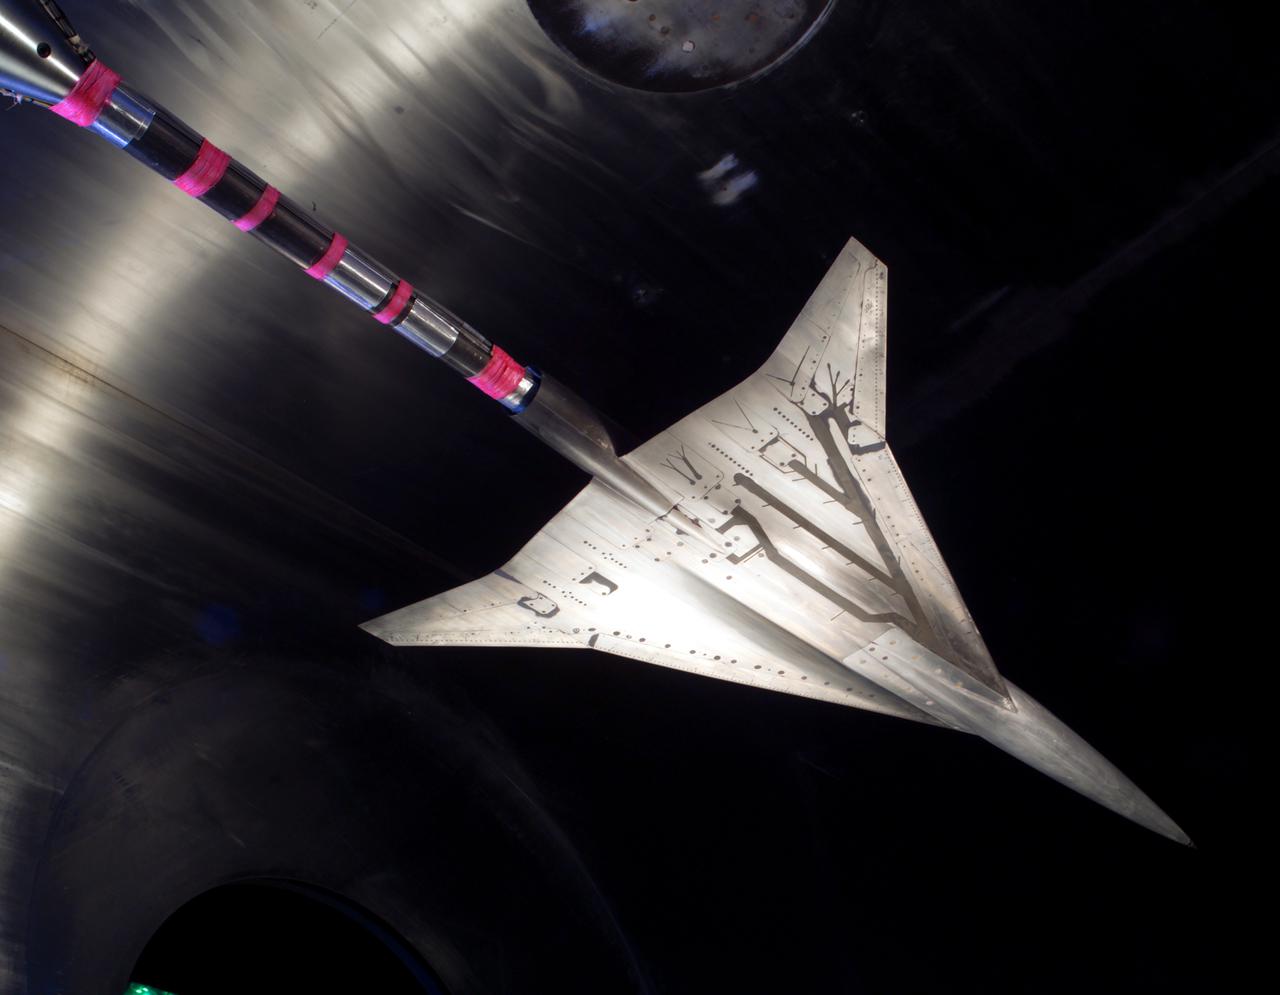
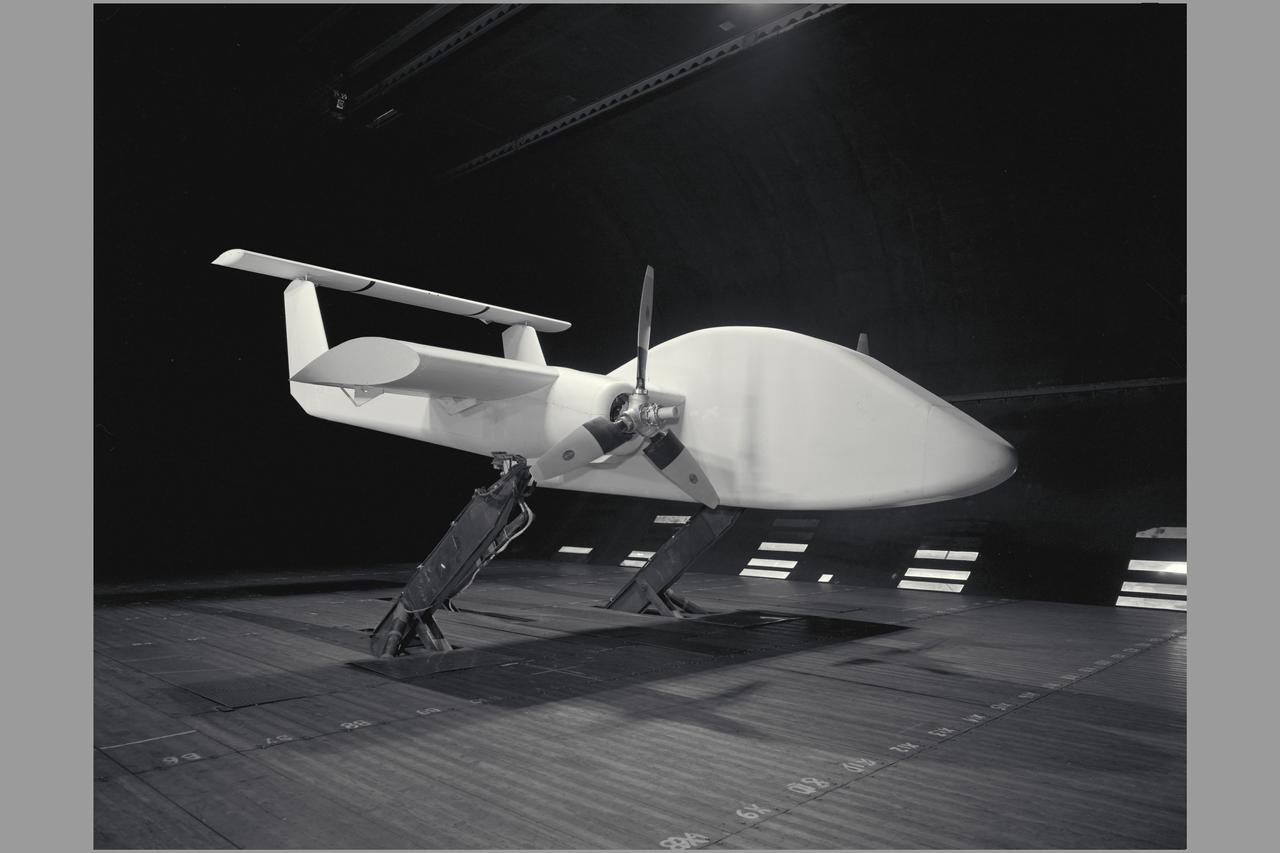
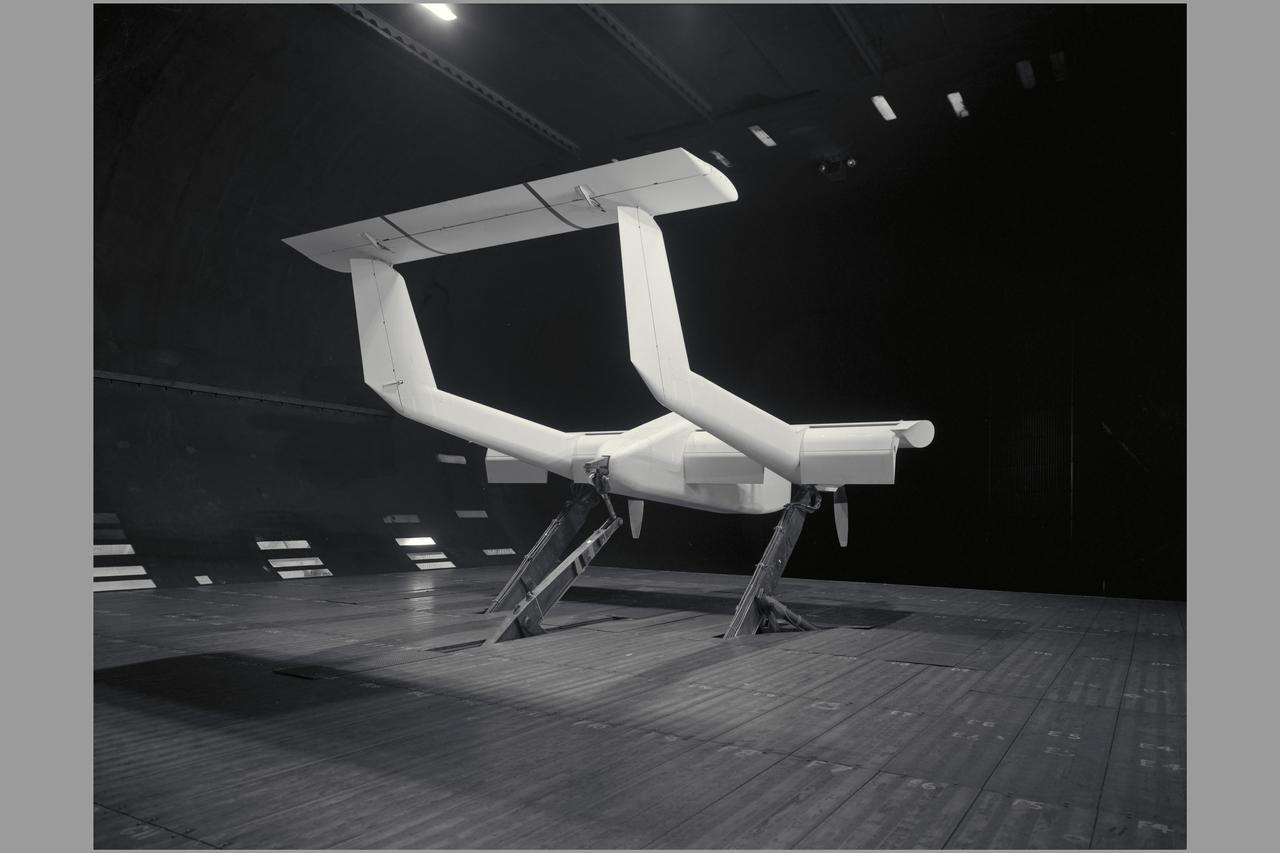
Low Speed investigation of a supersonic transport model with delta wing and delta conard, in the 40x80 Wind Tunnel. R 975 T Zero angel of attack. 3/4 rear view from below.
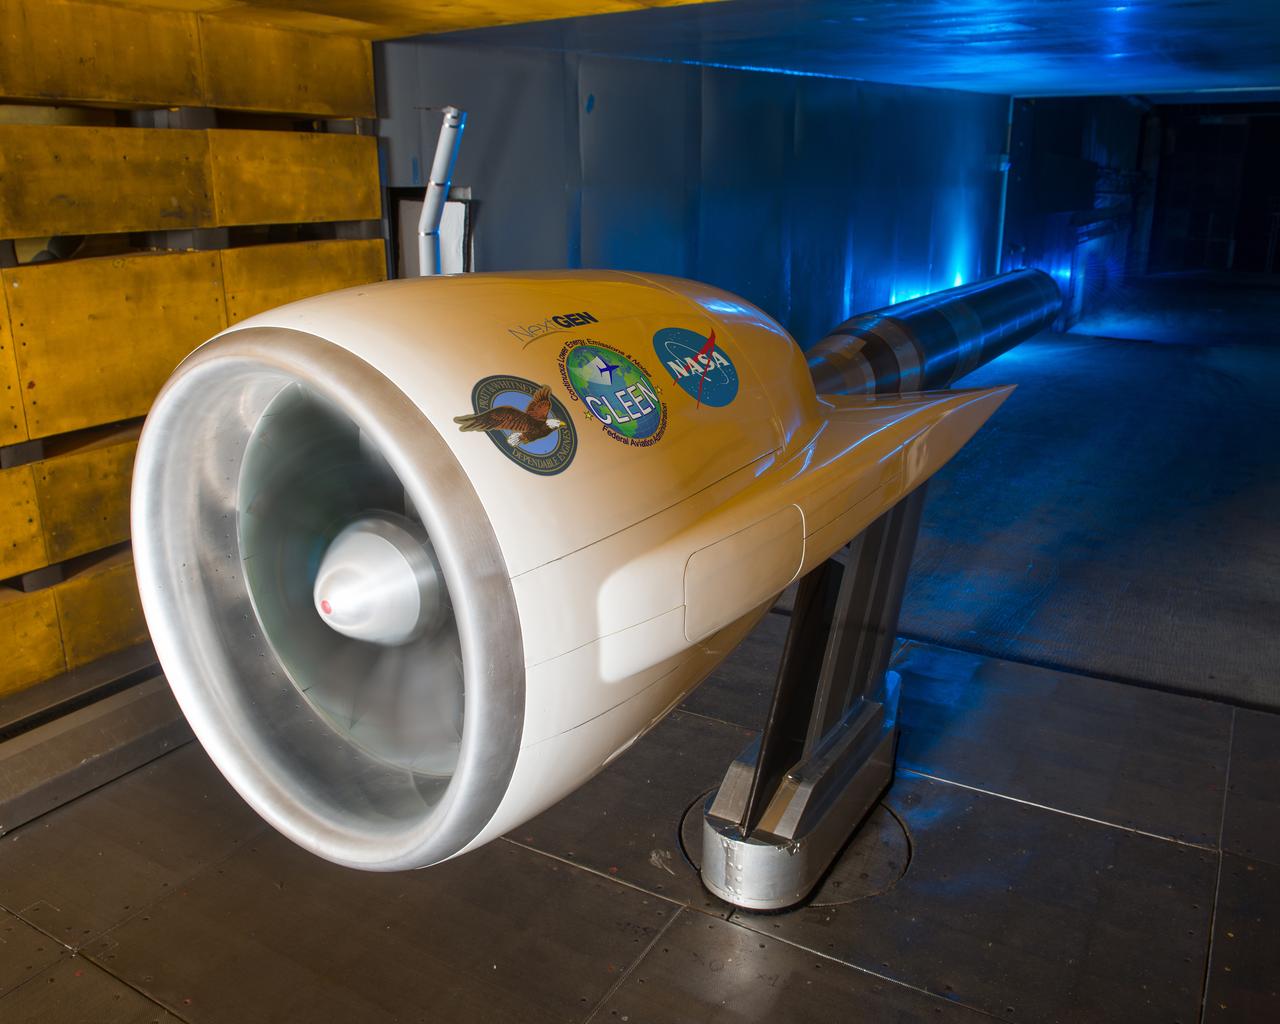
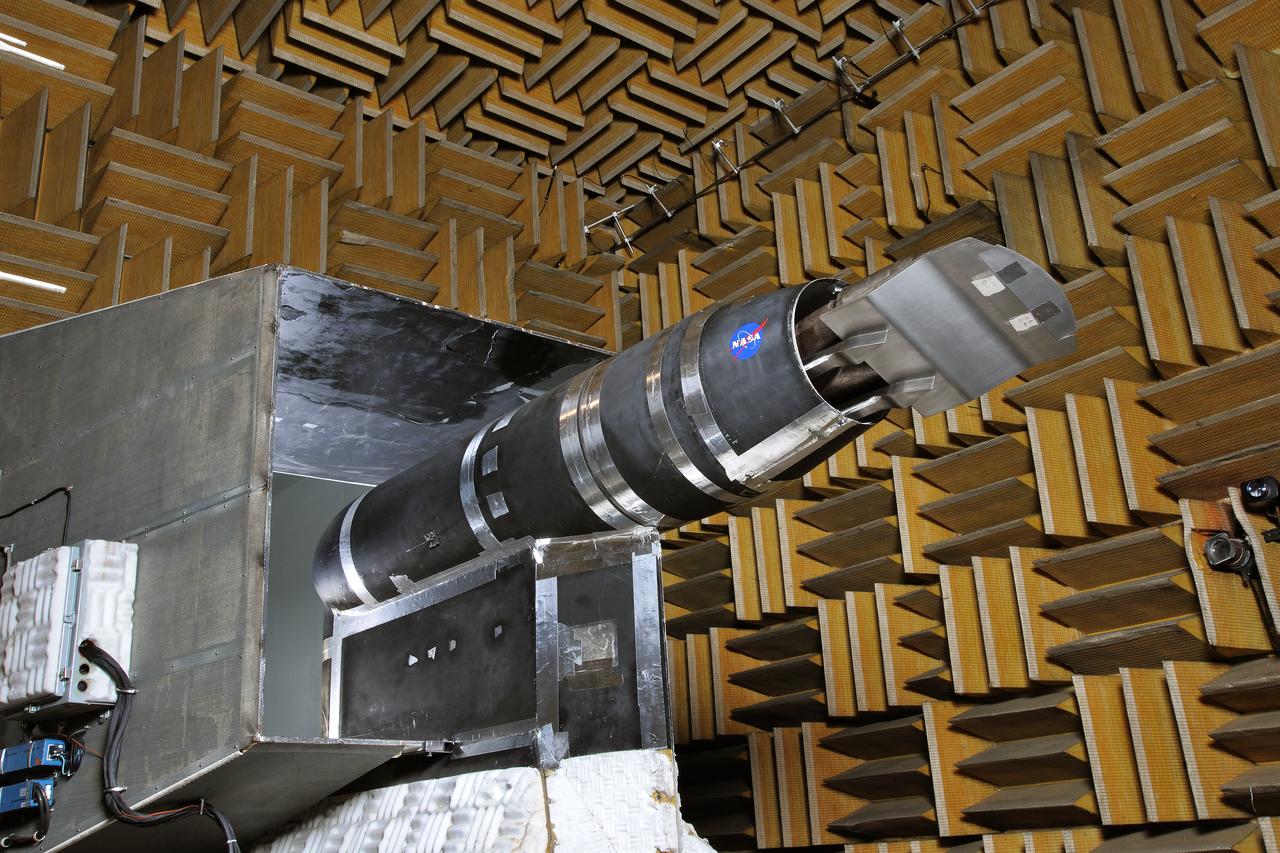
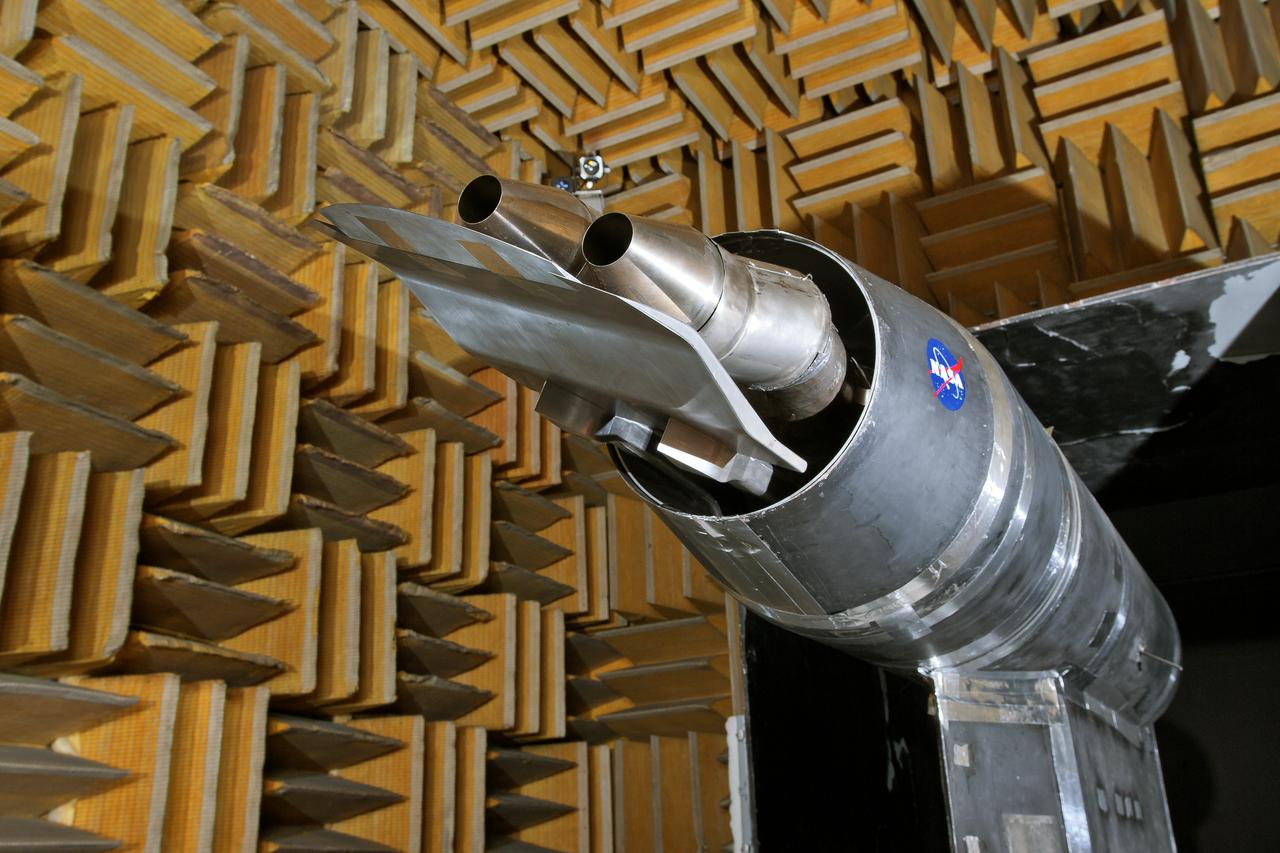
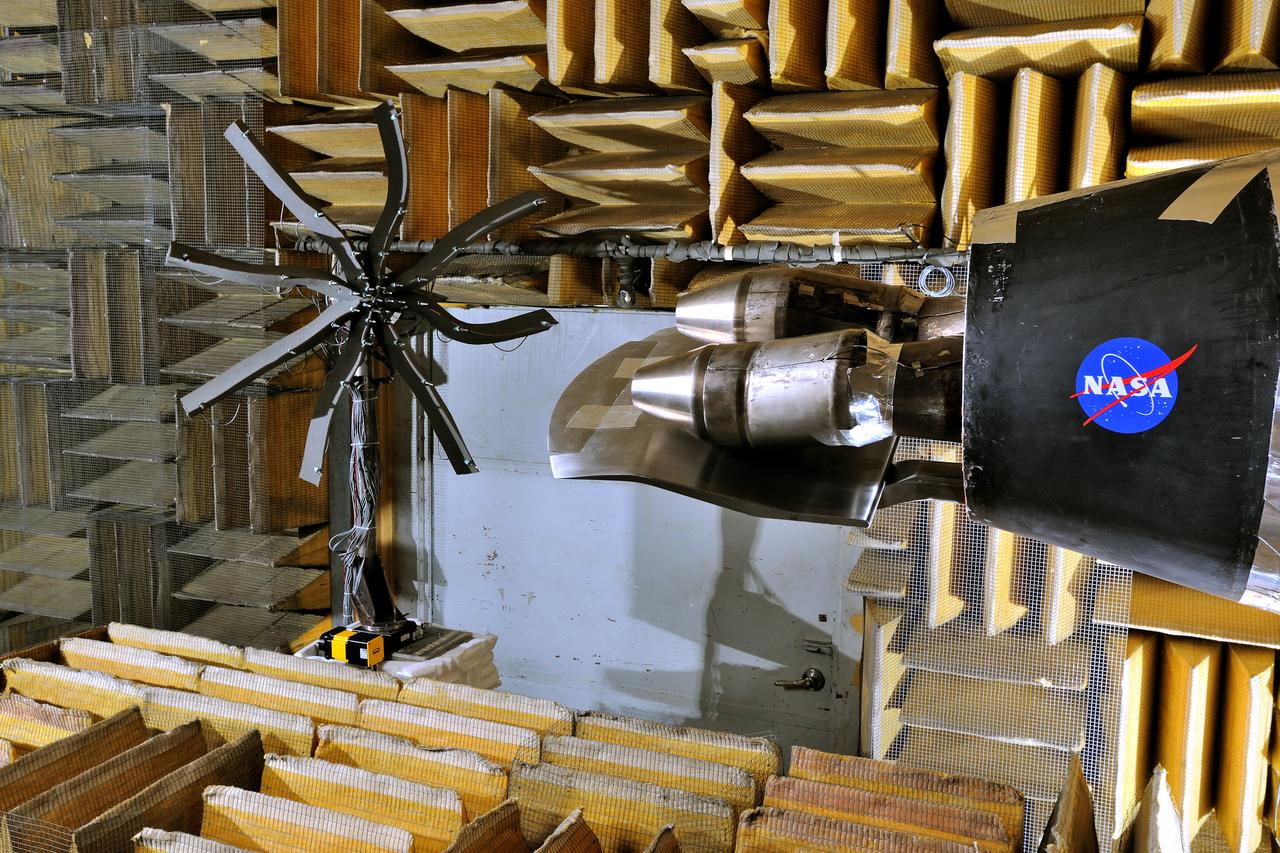
Ultra High Bypass Integrated System Test Testing of an Ultra High Bypass Ratio Turbofan model in the 9-by 15-Foot Low Speed Wind Tunnel. Pratt & Whitney designed the experimental engine to meet new efficiency and noise reduction targets for commercial aircraft set by NASA and the Federal Aviation Administration. The 9-by 15 tests analyzed two noise reduction technologies.
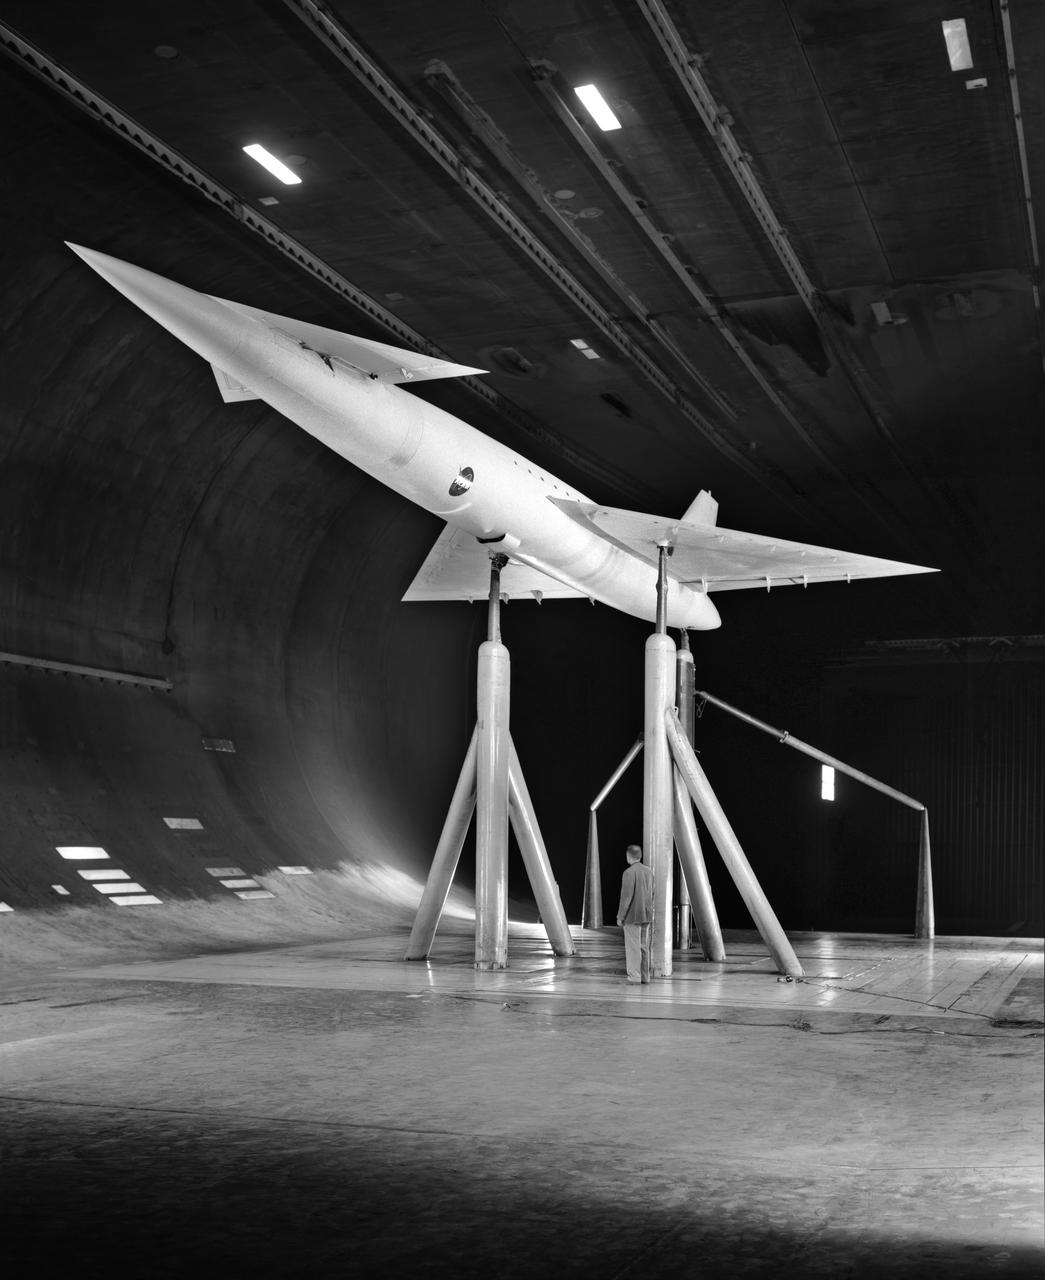
Low Speed investigation of a supersonic transport model in the 40x80 Wind Tunnel. 03/01/1961 R 975 T Zero angel of attack. Supersonic transport with delta wing and delta conard. 3/4 front view.
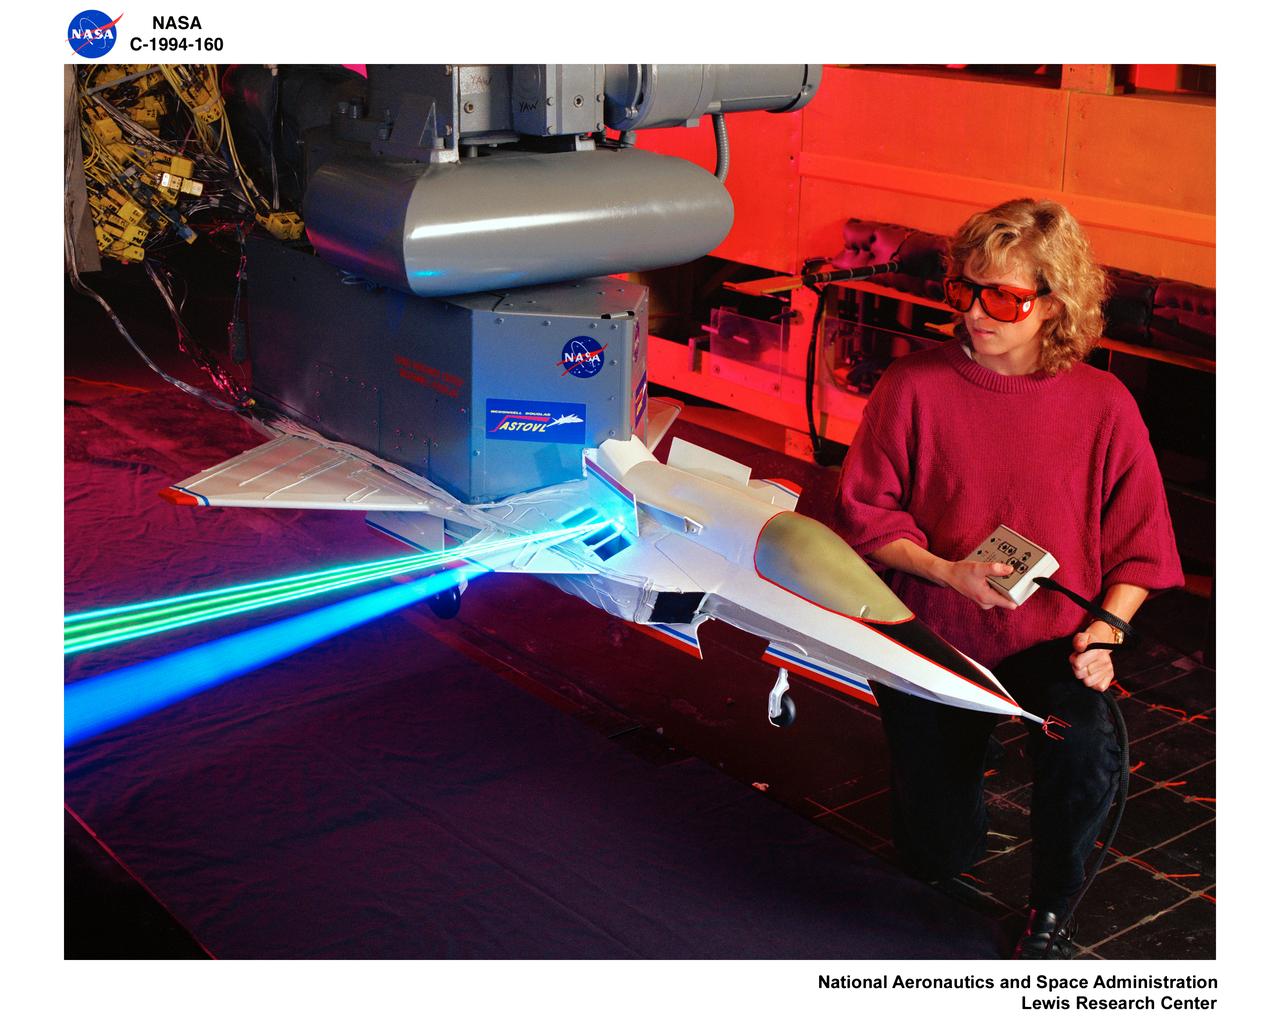
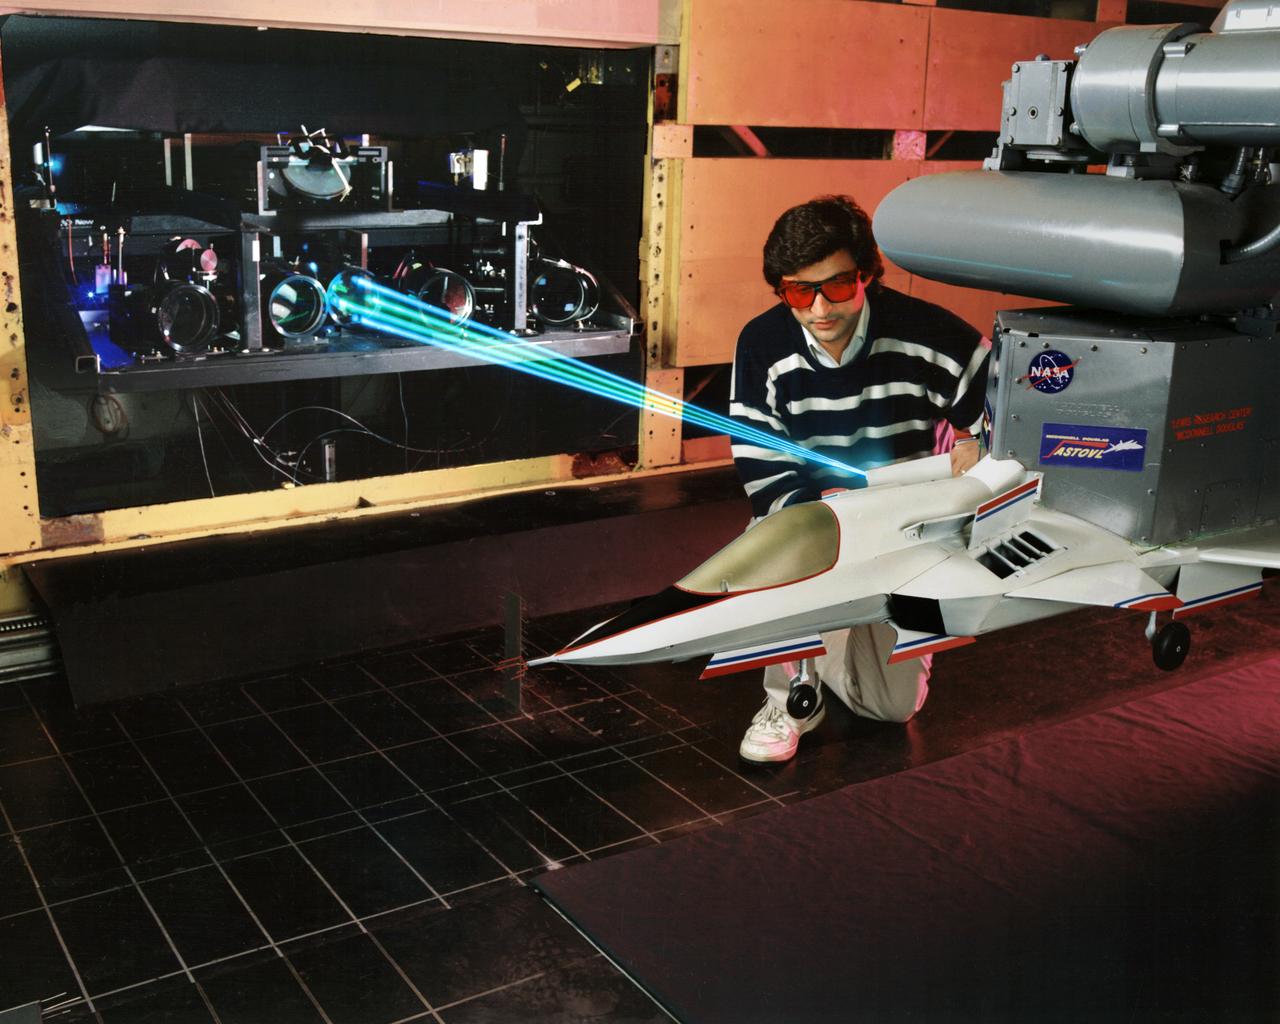
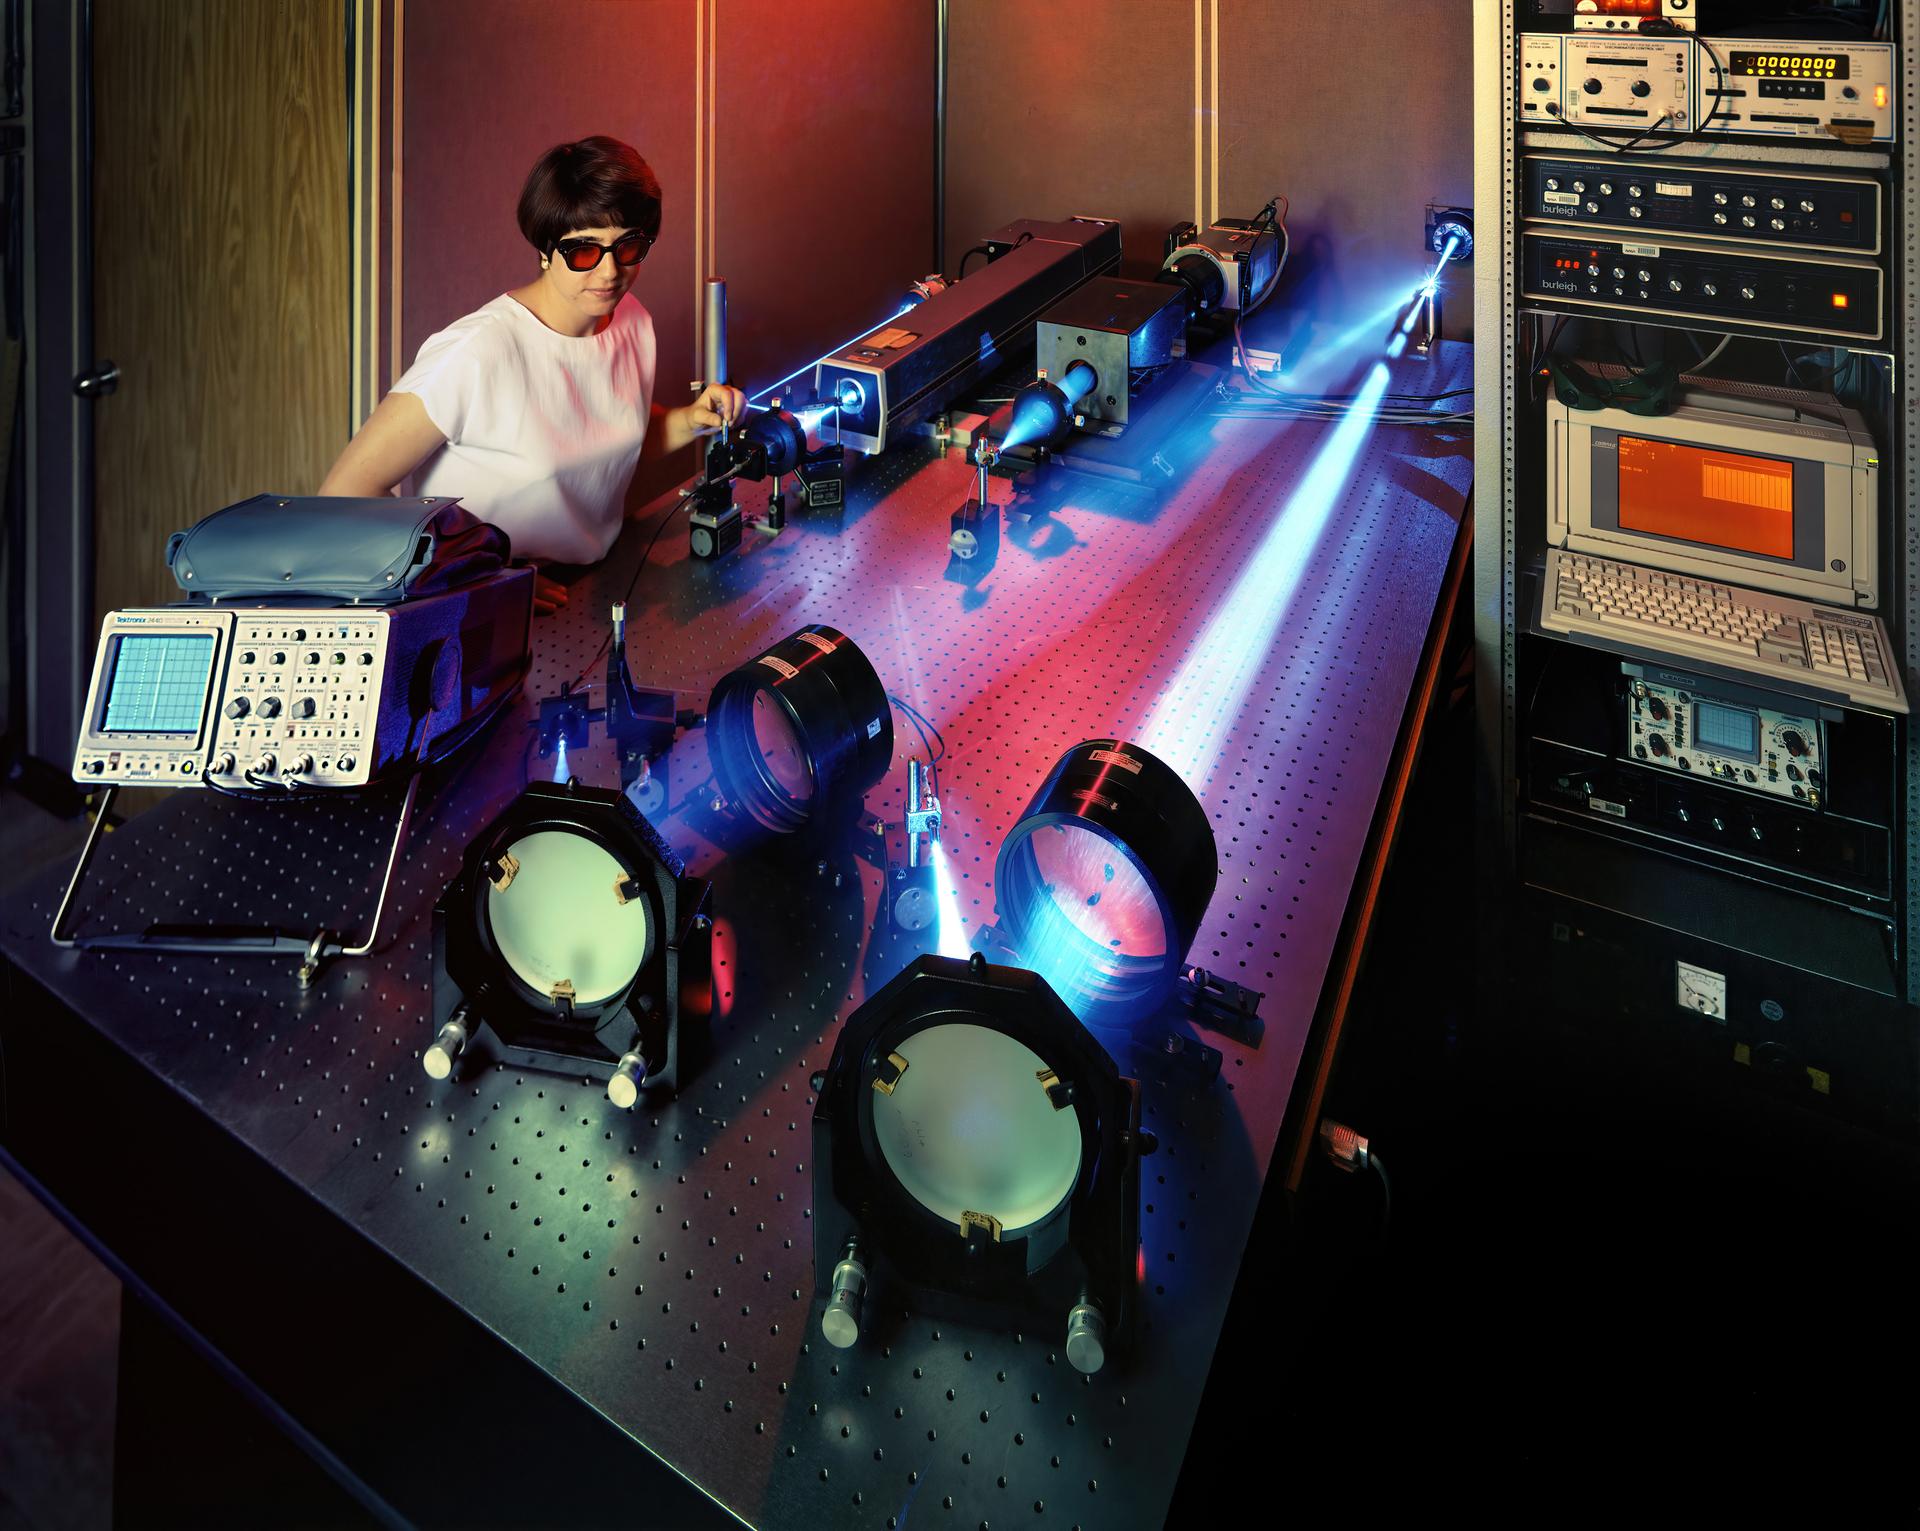
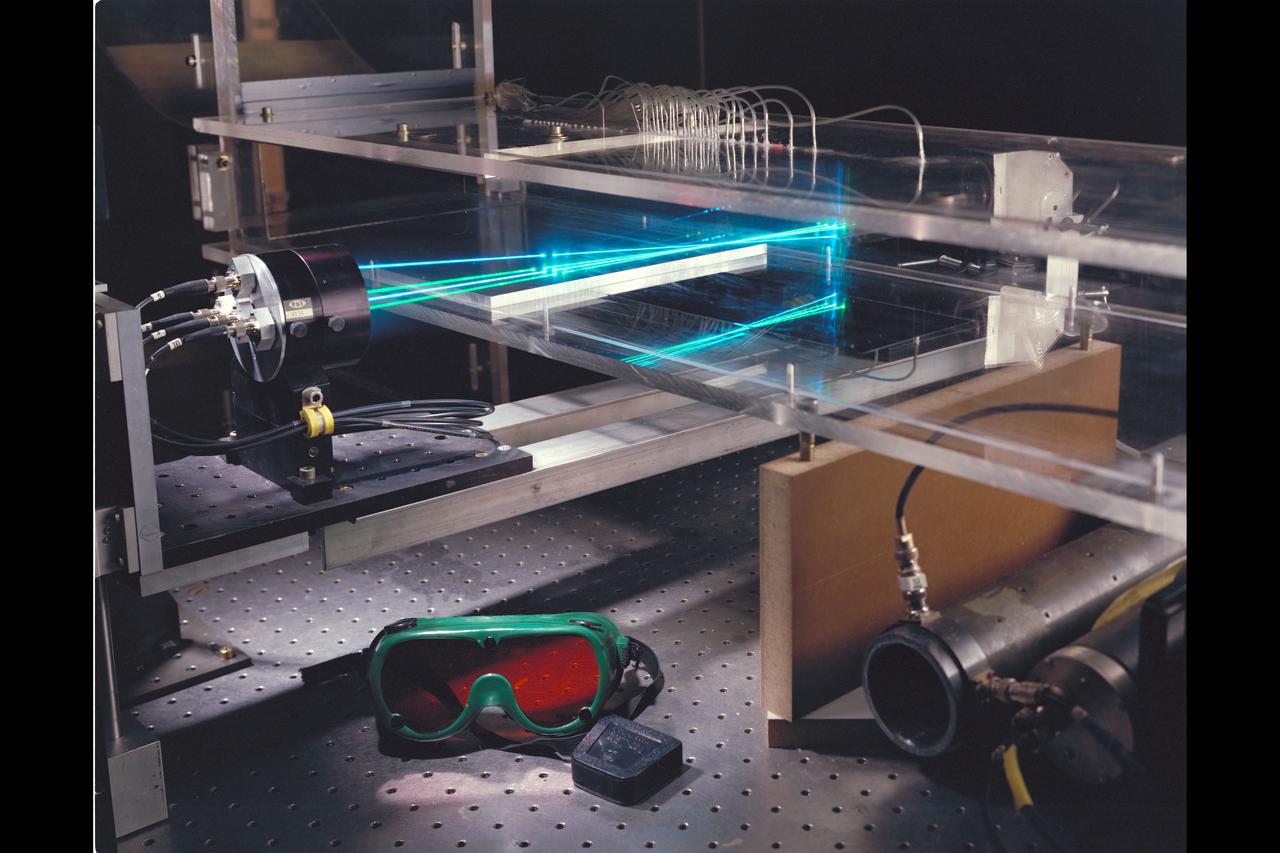
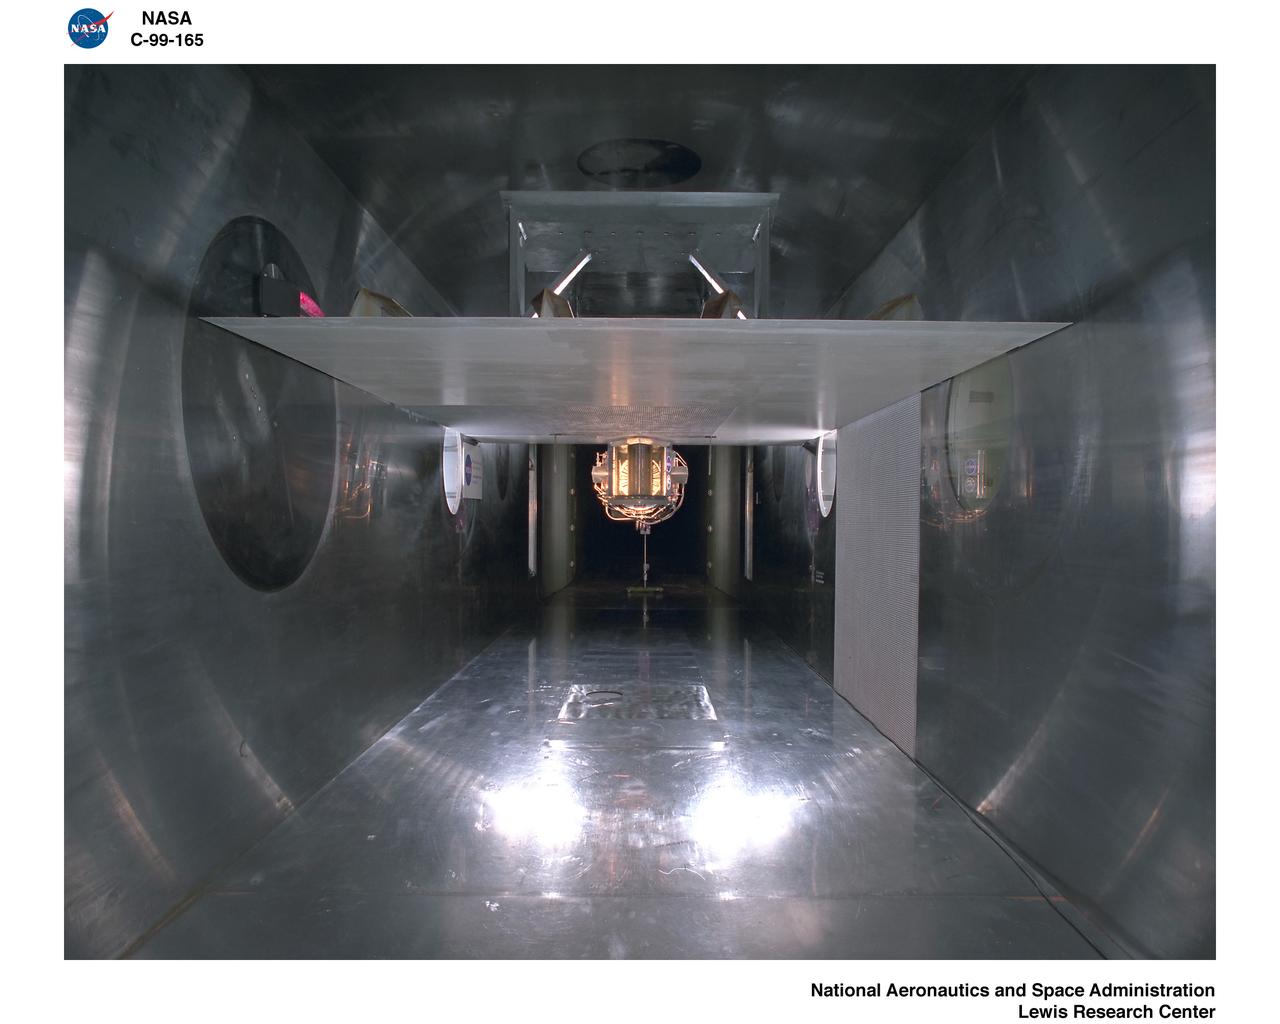
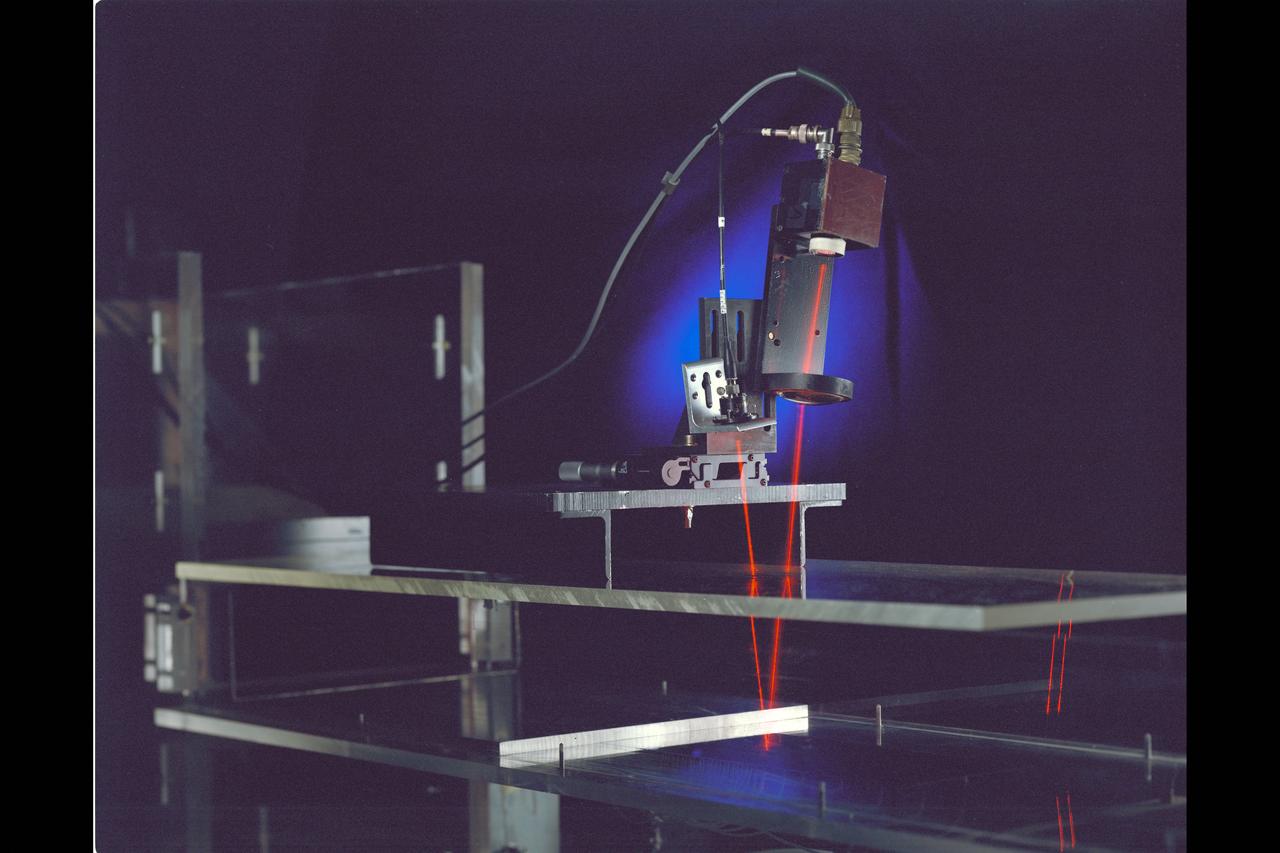
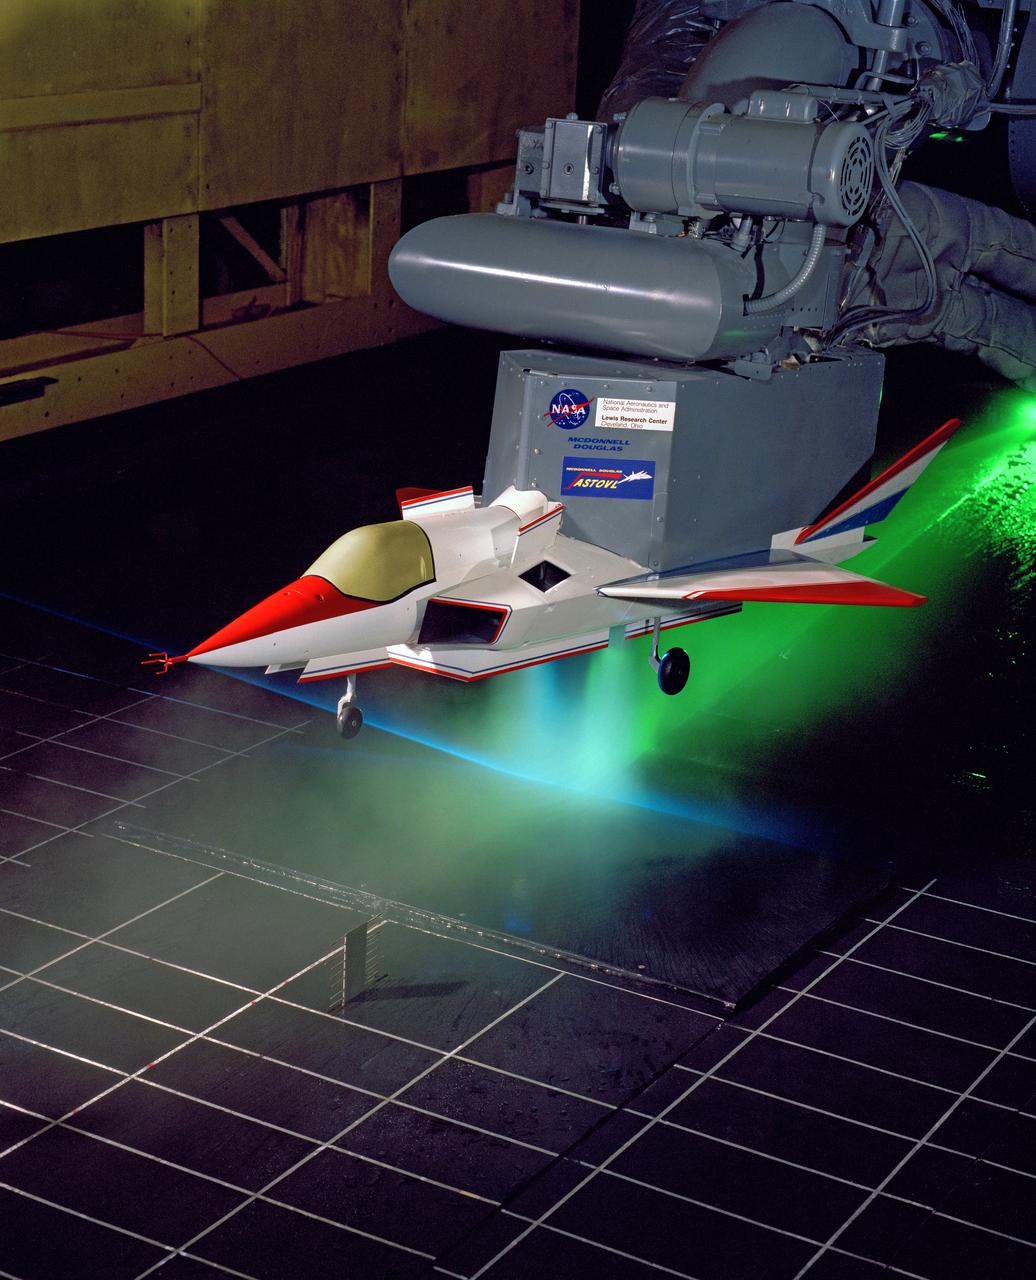
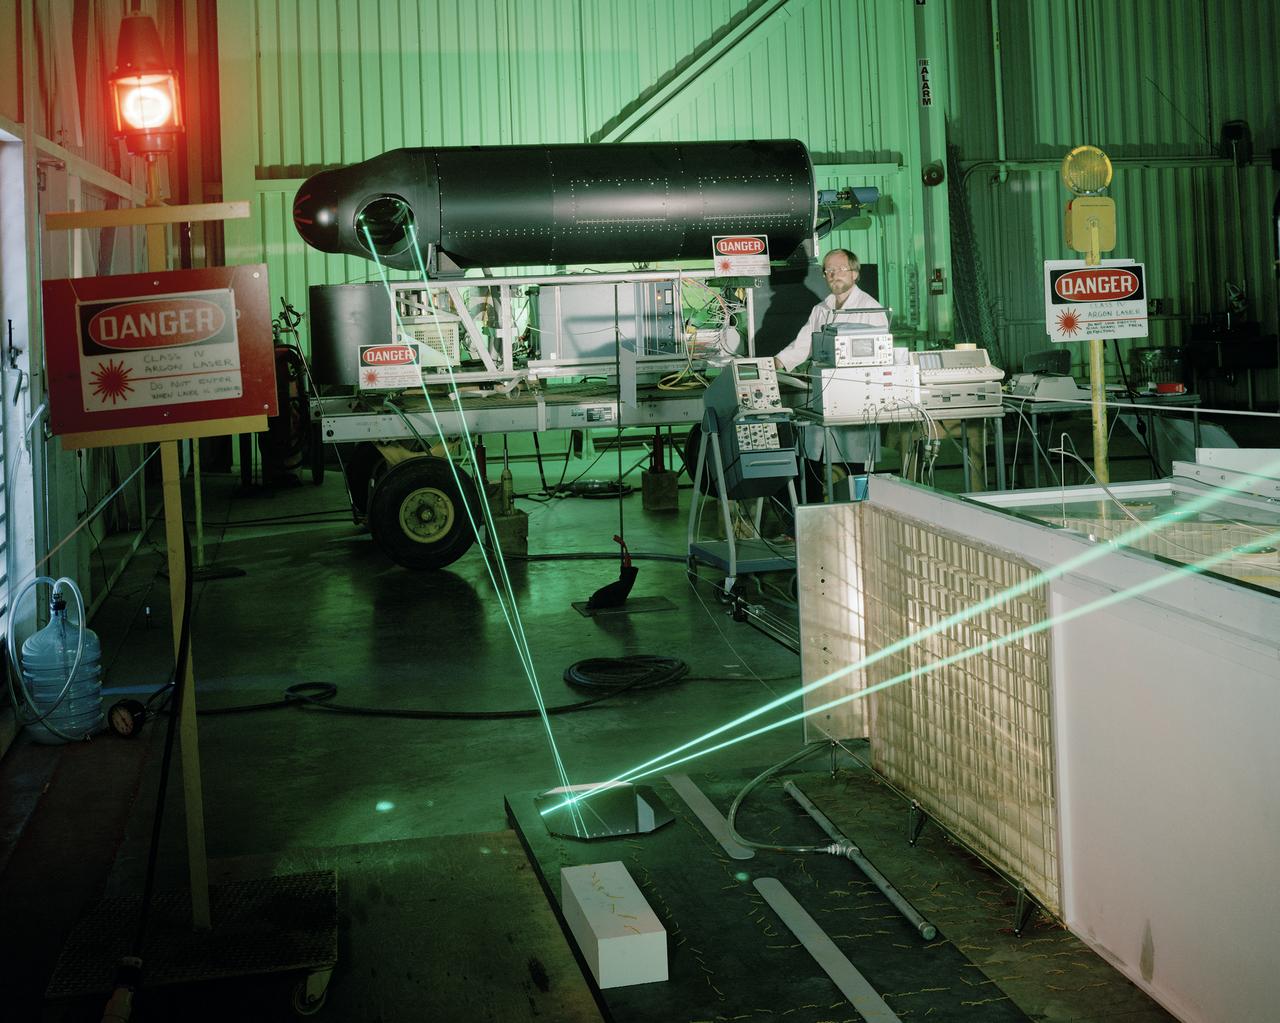
LASER Velocimetry System for Flow Measurement. Advanced Short Takeoff and Vertical Landing, ASTOVL model n the 9x15 foot Low Speed Wind Tunnel, LSWT
LSAWT\Twin Jet Test with HWB Model\JEDA Measurements Low Speed Aeroacoustic Wind Tunnel\Twin Jet Model System \Hybrid Wing Model Installed\ Measurement Technique: Jet Directional Array (JEDA)

Researchers Anna Noe and Eric Altman check out the Doppler Aerosol Wind Lidar (DAWN), an airborne instrument that uses pulsed lasers to detect the movement of atmospheric aerosols such as dust or sea salt. In detecting those movements, it can profile wind vector — both speed and direction. Researchers are testing DAWNs capabilities during flights over the eastern Pacific.
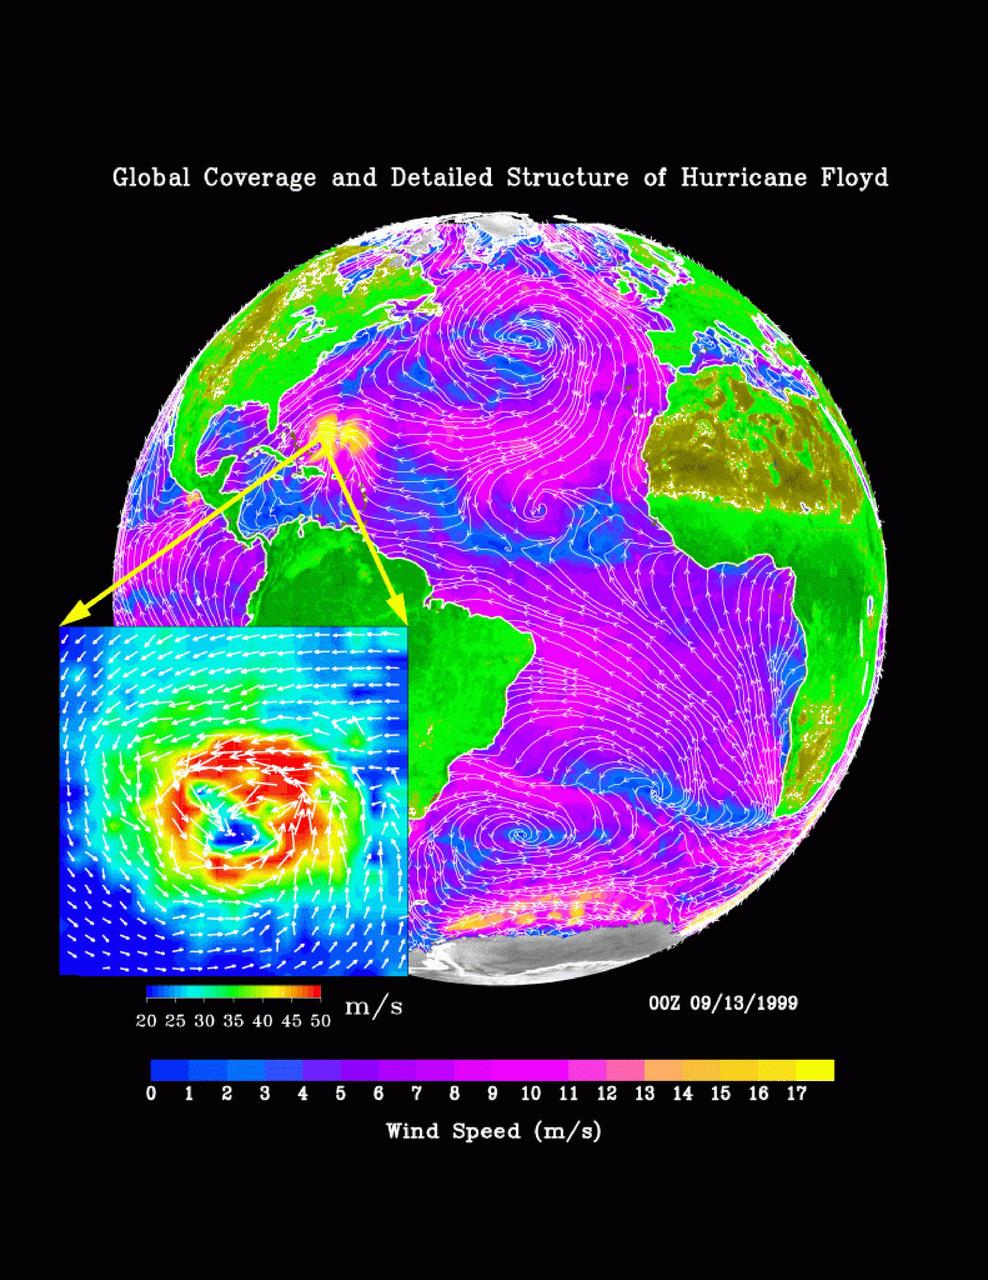
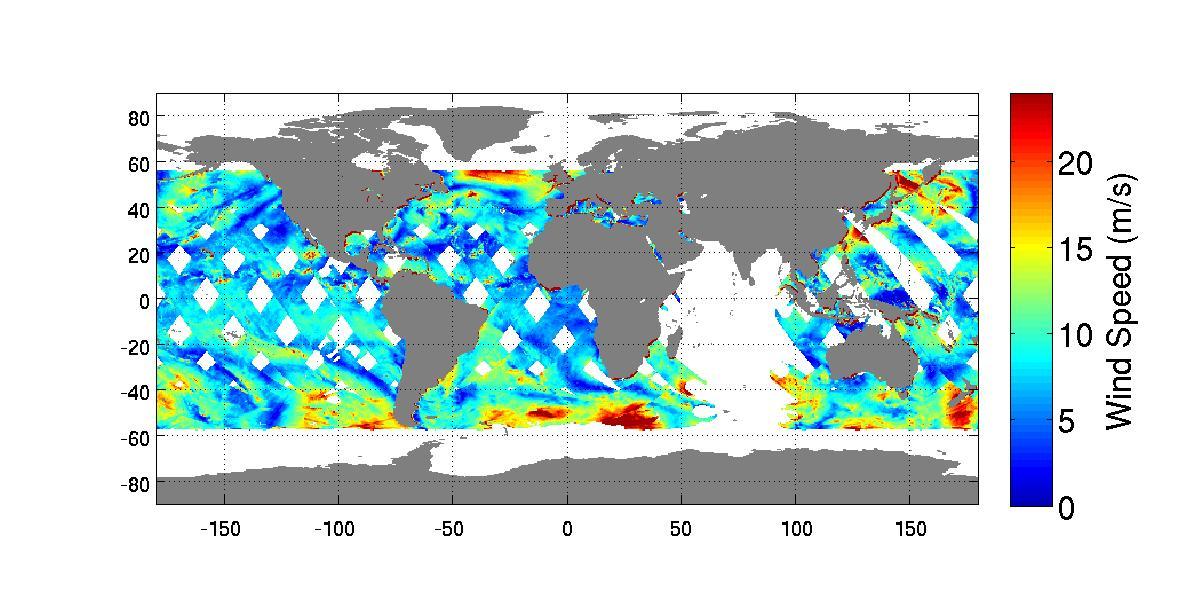
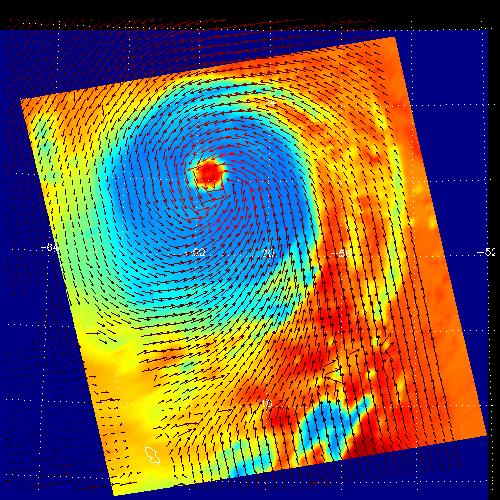
The distribution of ocean surface winds over the Atlantic Ocean, based on September 1999 data from NASA SeaWinds instrument on the QuikScat satellite, shows wind direction, superimposed on the color image indicating wind speed.
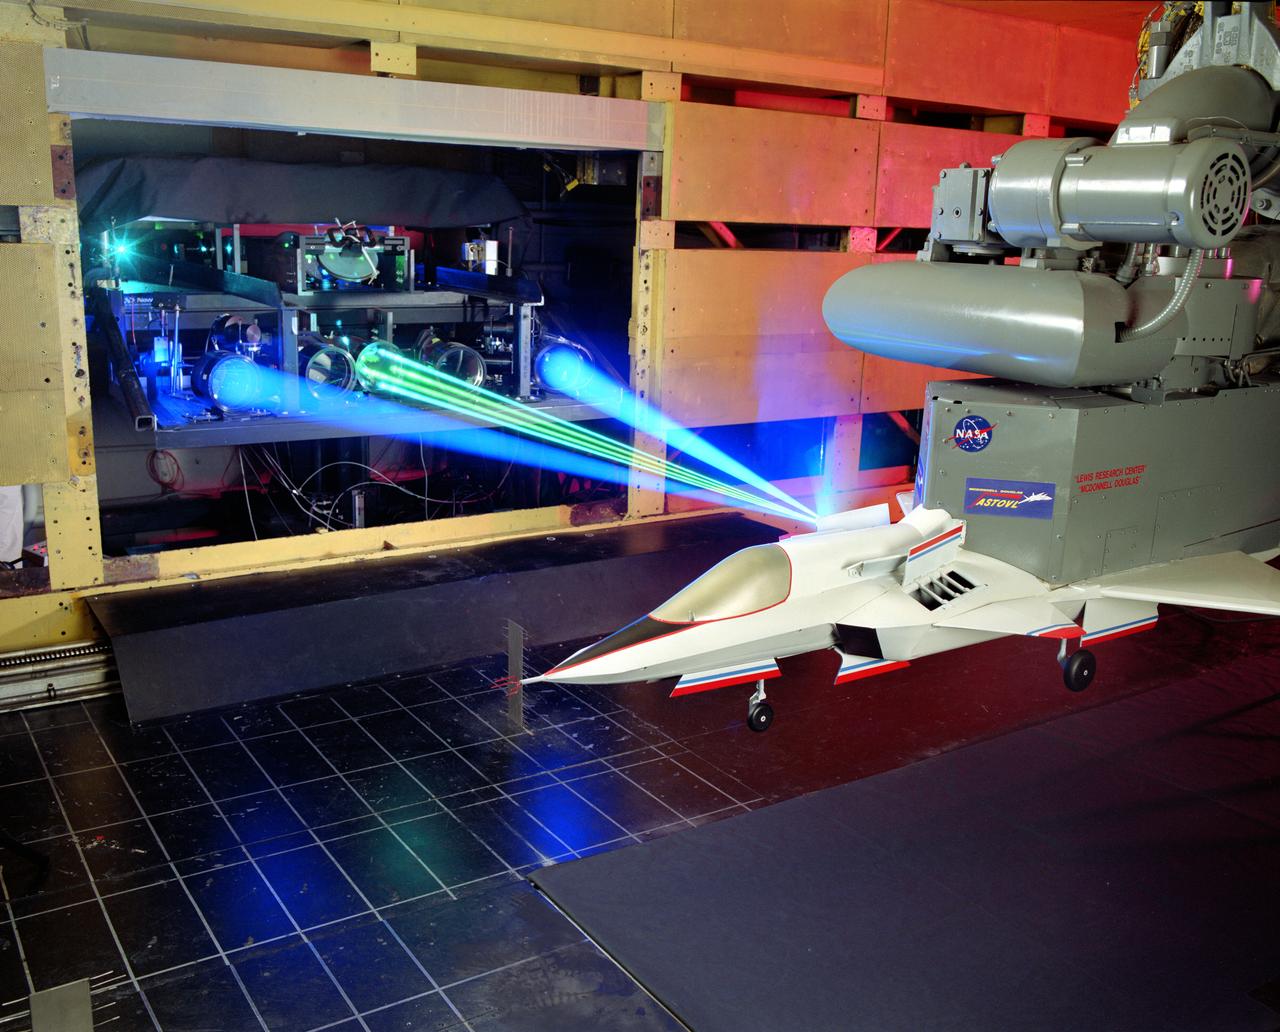
The 9x15 low speed tunnel tests take off and landing of aircraft. The laser velocimetry system for flow measurement show here, with the color blue and green lasers, measures engine exhaust that comes back up from the ground. The STOVL model n the 9x15 low speed wind tunnel, building 39, is similar to the British Harrier aircraft.
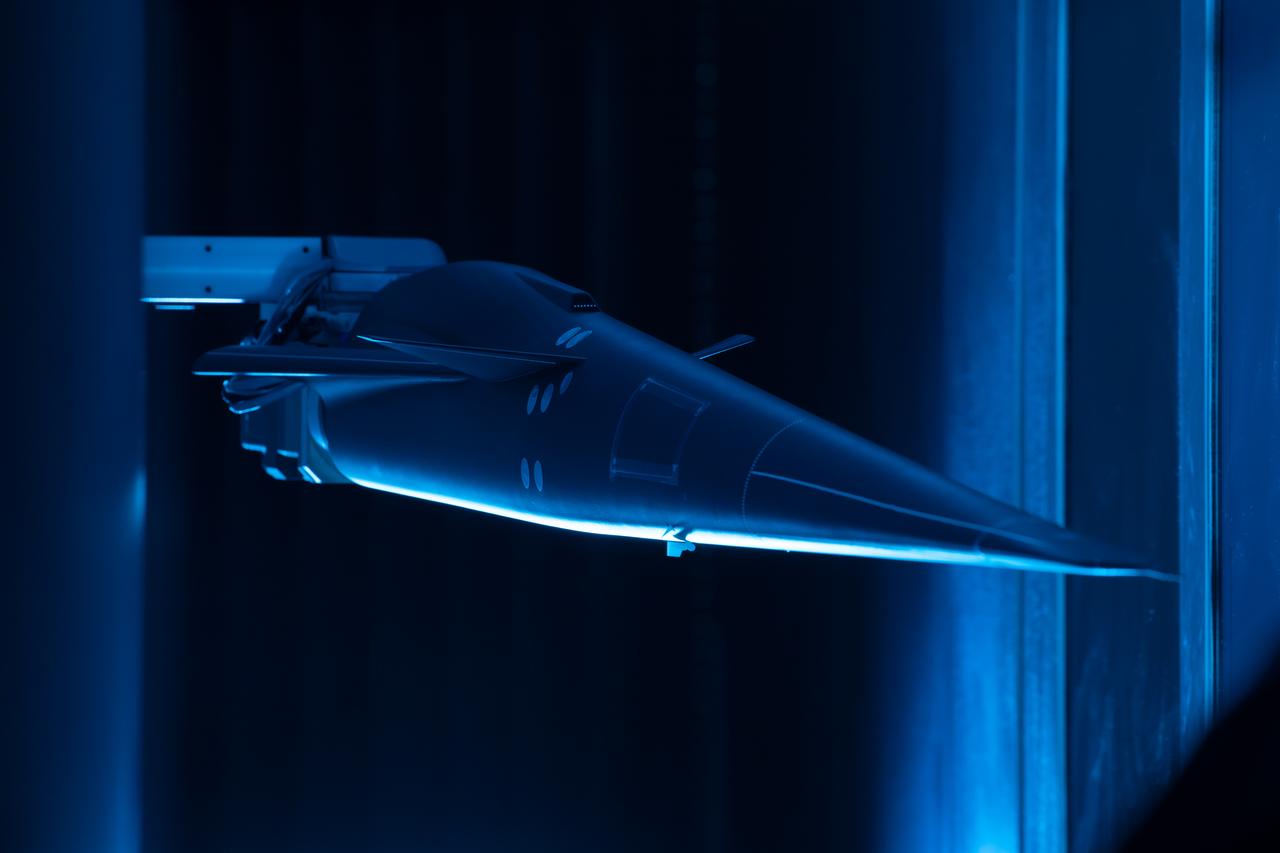
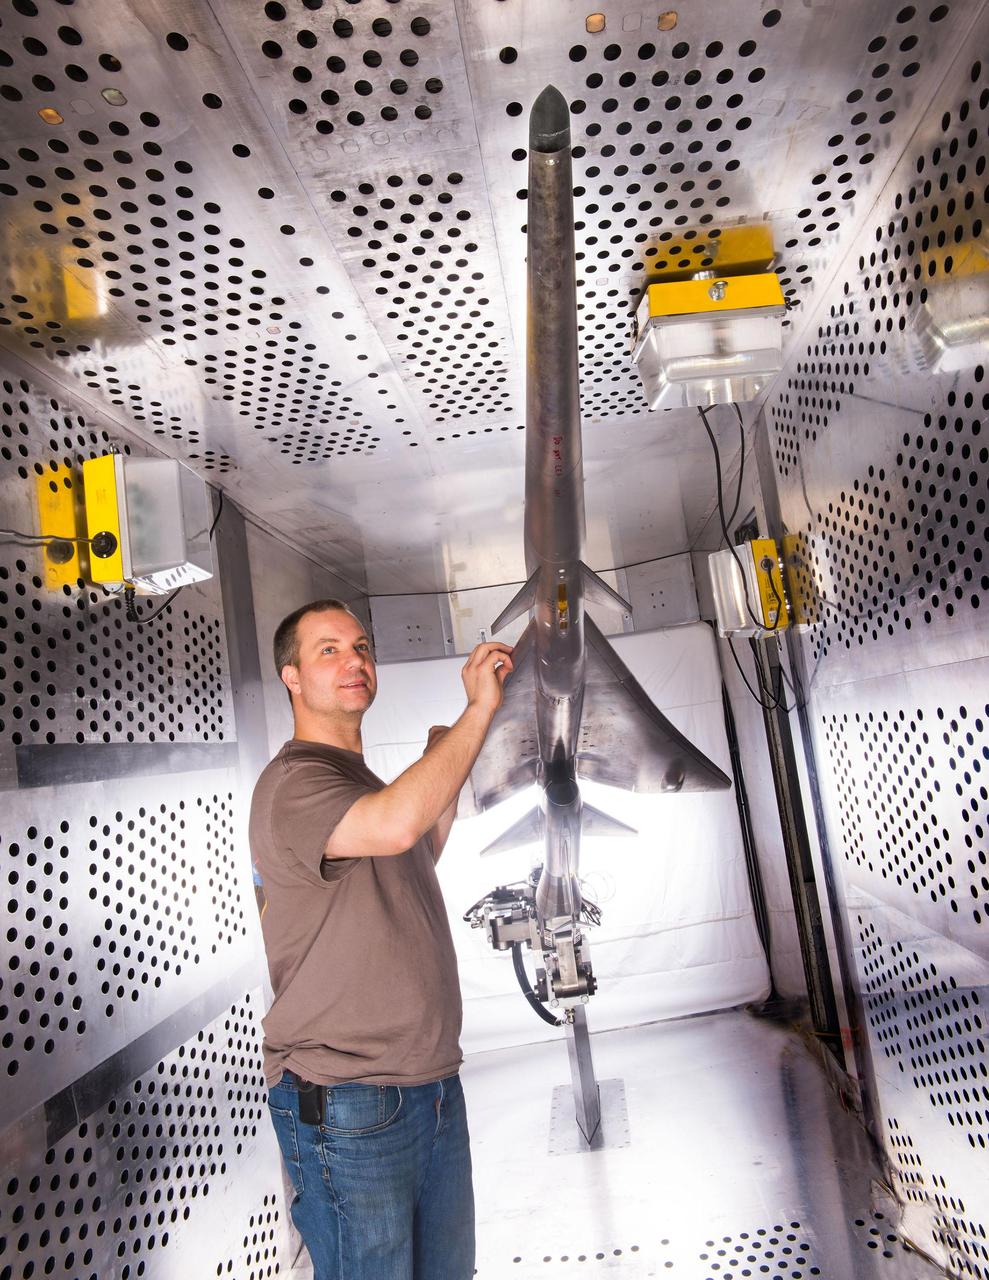
Event: Forebody and Nose - Windtunnel Testing A model of the X-59 forebody is shown in the Lockheed Martin Skunk Works’ wind tunnel in Palmdale, California. These tests gave the team measurements of wind flow angle around the aircraft’s nose and confirmed computer predictions made using computational fluid dynamics (CFD) software tools. The data will be fed into the aircraft flight control system to tell the pilot the aircraft’s altitude, speed and angle. This is part of NASA’s Quesst mission which plans to help enable supersonic air travel over land.
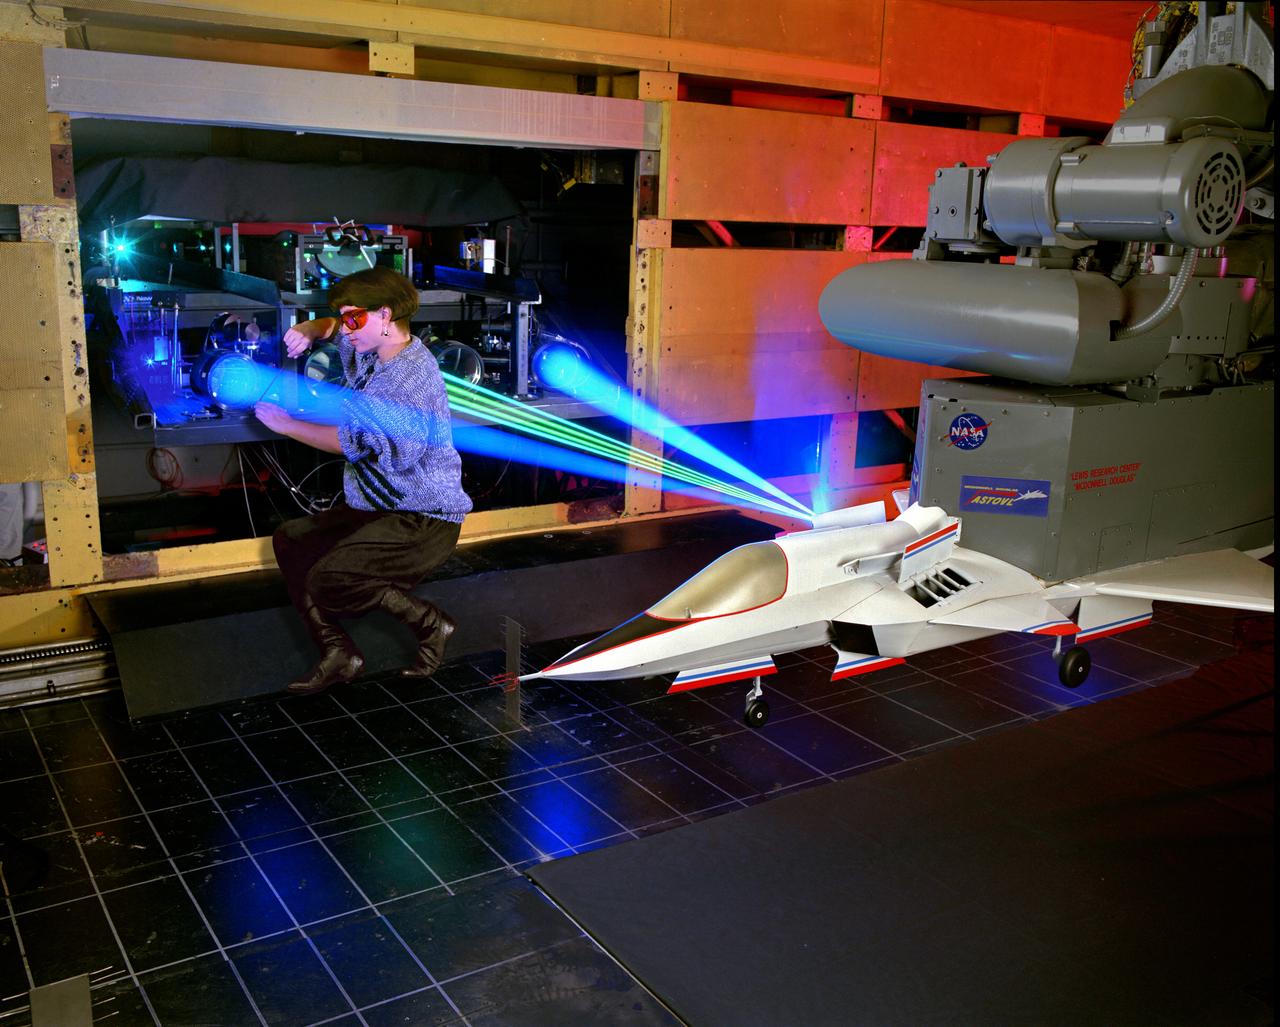
The 9x15 low speed tunnel tests take off and landing of aircraft. The laser velocimetry system for flow measurement show here, with the color blue and green lasers, measures engine exhaust that comes back up from the ground. The STOVL model n the 9x15 low speed wind tunnel, building 39, is similar to the British Harrier aircraft.
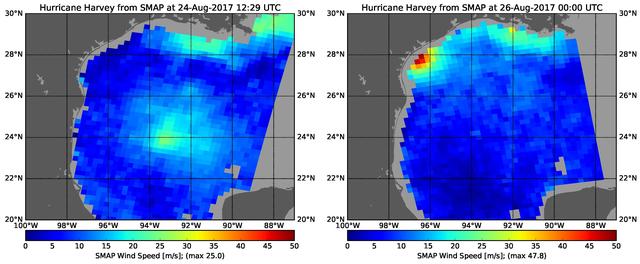
The rapid intensification of Hurricane Harvey is seen in this pair of images of ocean surface wind speeds as observed by the radiometer instrument aboard NASA's Soil Moisture Active Passive (SMAP) satellite at 7:29 a.m. CDT Aug. 24th, 2017 (left) and at 7 p.m. CDT Aug. 26th (right). Color indicates wind speed, with red being highest and blue lowest. The images show Harvey's maximum wind speeds increased from approximately 56 miles per hour (25 meters per second) to about 107 miles per hour (47.8 meters per second) in the 36 hours just before landfall. The higher wind speeds estimated near the mouth of the Mississippi River are erroneous and are due to errors in the ancillary sea-surface-salinity data product used by SMAP to estimate extreme wind speeds. https://photojournal.jpl.nasa.gov/catalog/PIA21884
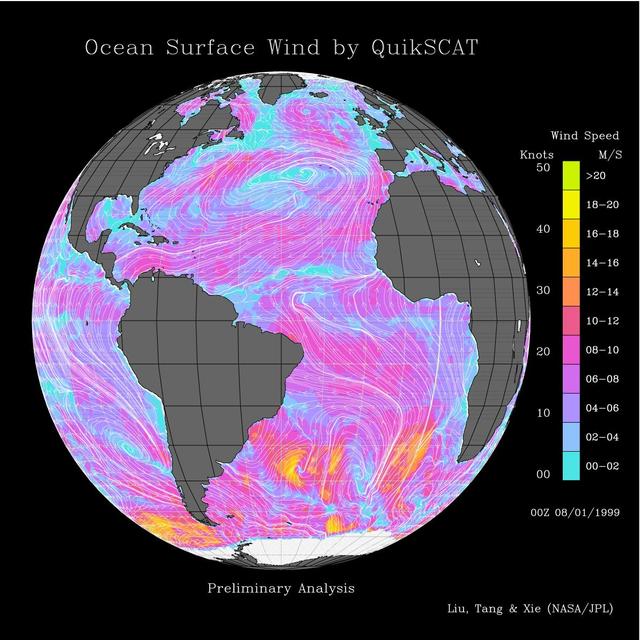
This image shows wind speeds and direction in the Atlantic Ocean on August 1, 1999, gathered by NASA Seawinds radar instrument flying onboard NASA QuikScat satellite.
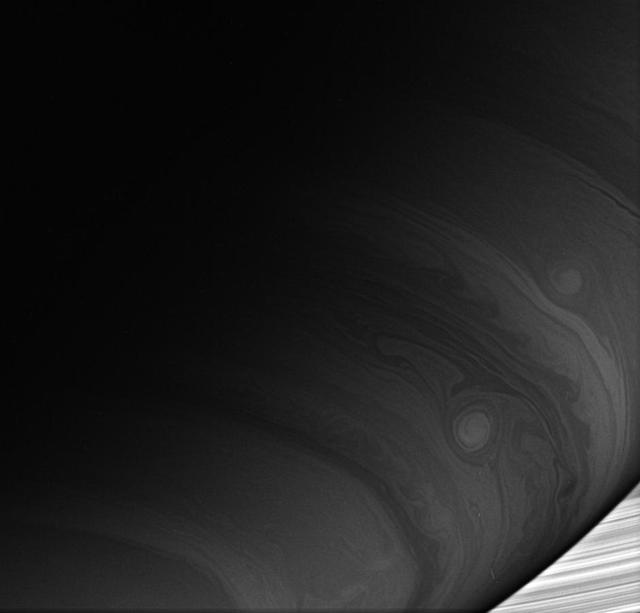
Two bright vortices roll across the cloud-lined face of Saturn, where winds howl at high speeds never experienced on Earth

This image shows wind speeds and direction in the Pacific Ocean on August 1, 1999, gathered by NASA Seawinds radar instrument flying onboard NASA QuikScat satellite.
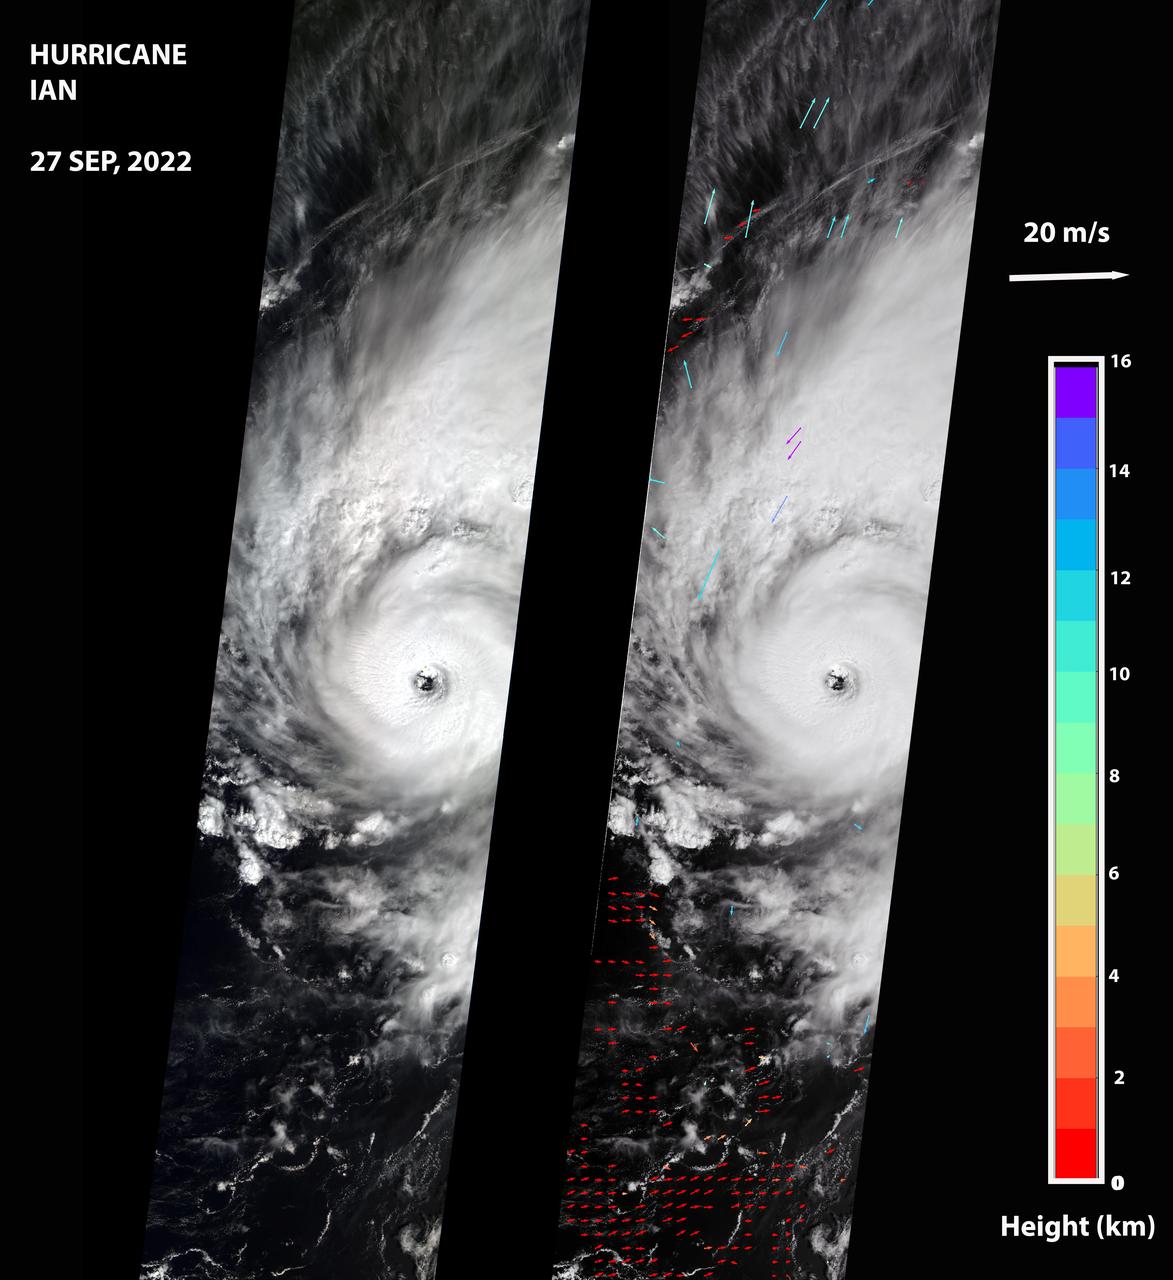
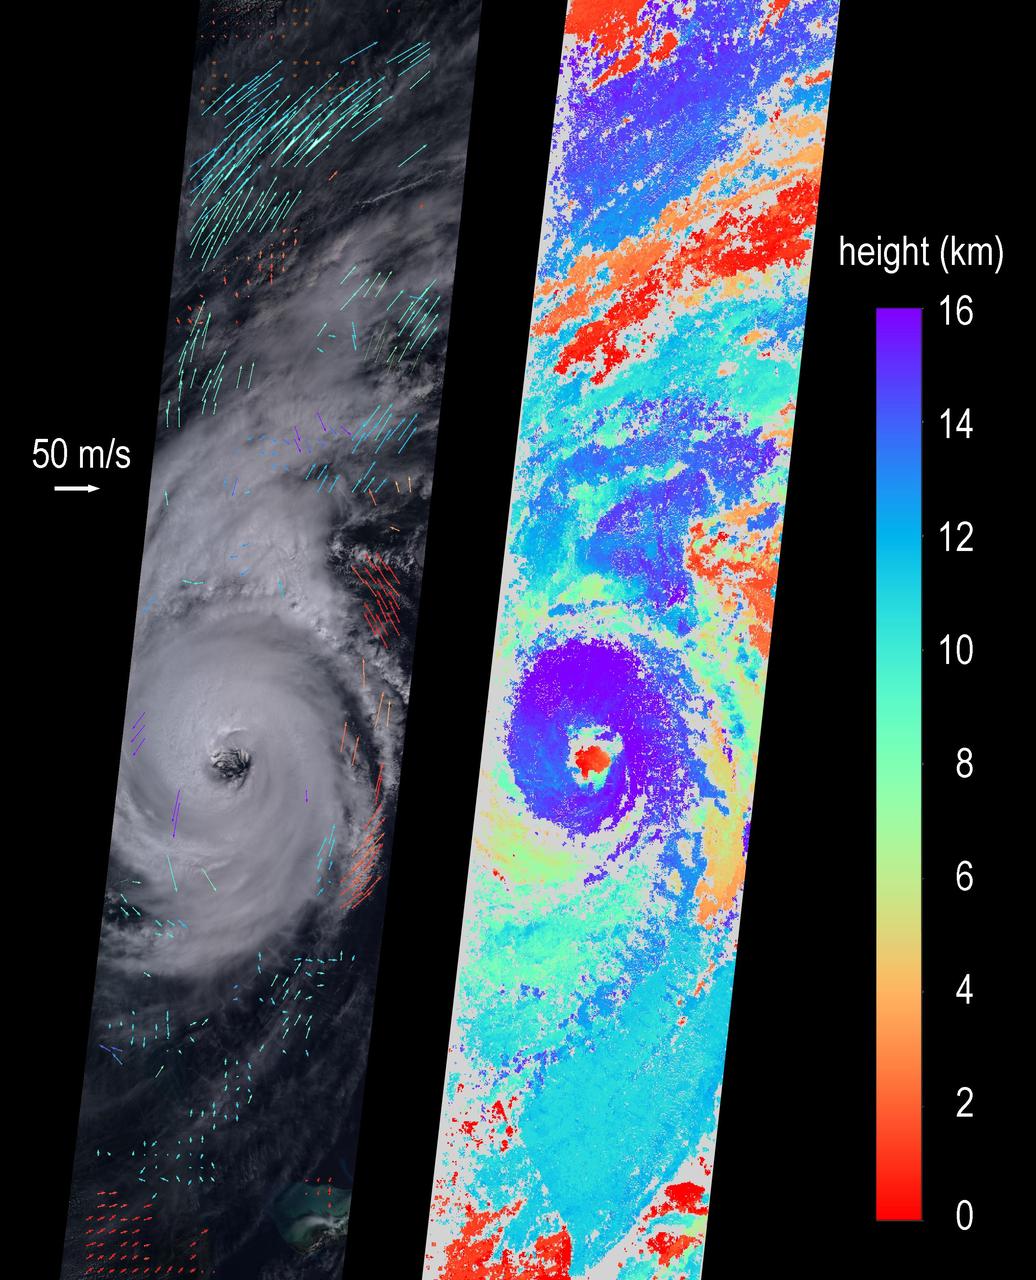
NASA's Multi-angle Imaging SpectroRadiometer (MISR) captured an optical image of Hurricane Ian, as well as measurements of the storm's wind speed, at noon local time Sept. 27, 2022. The storm, a Category 3 hurricane at that time, had maximum sustained winds of 115 mph (185 kph). The eye of the storm was located off the northern coast of Cuba, approximately 70 miles (110 kilometers) west of Havana, after passing over the island in the morning hours. The MISR instrument, flying aboard NASA's Terra satellite, carries nine cameras that observe the Earth at different angles. It takes approximately seven minutes for all the cameras to observe the same location on the Earth, and the motion of clouds during that time is used to calculate wind speed at the cloud tops. The left-hand panel of the first figure shows an image of the storm as viewed by MISR's central, downward-looking camera. The panel on the right shows the wind speeds derived from MISR data superimposed on the image. The length of the arrows is proportional to the wind speed, while their color shows the altitudes of the cloud tops in kilometers. The MISR data shows that the cloud-top winds near the center of the storm reached approximately 108 mph (174 kph), with maximum cloud-top wind speed reaching 123 mph (198 kph). The wind data shows that the lowest clouds are moving counterclockwise, while the high clouds north of the hurricane's center are rotating clockwise. The anaglyph reveals high clouds associated with strong thunderstorms in the eyewall of Hurricane Ian as well as individual strong thunderstorms in the outer rainbands. https://photojournal.jpl.nasa.gov/catalog/PIA24909
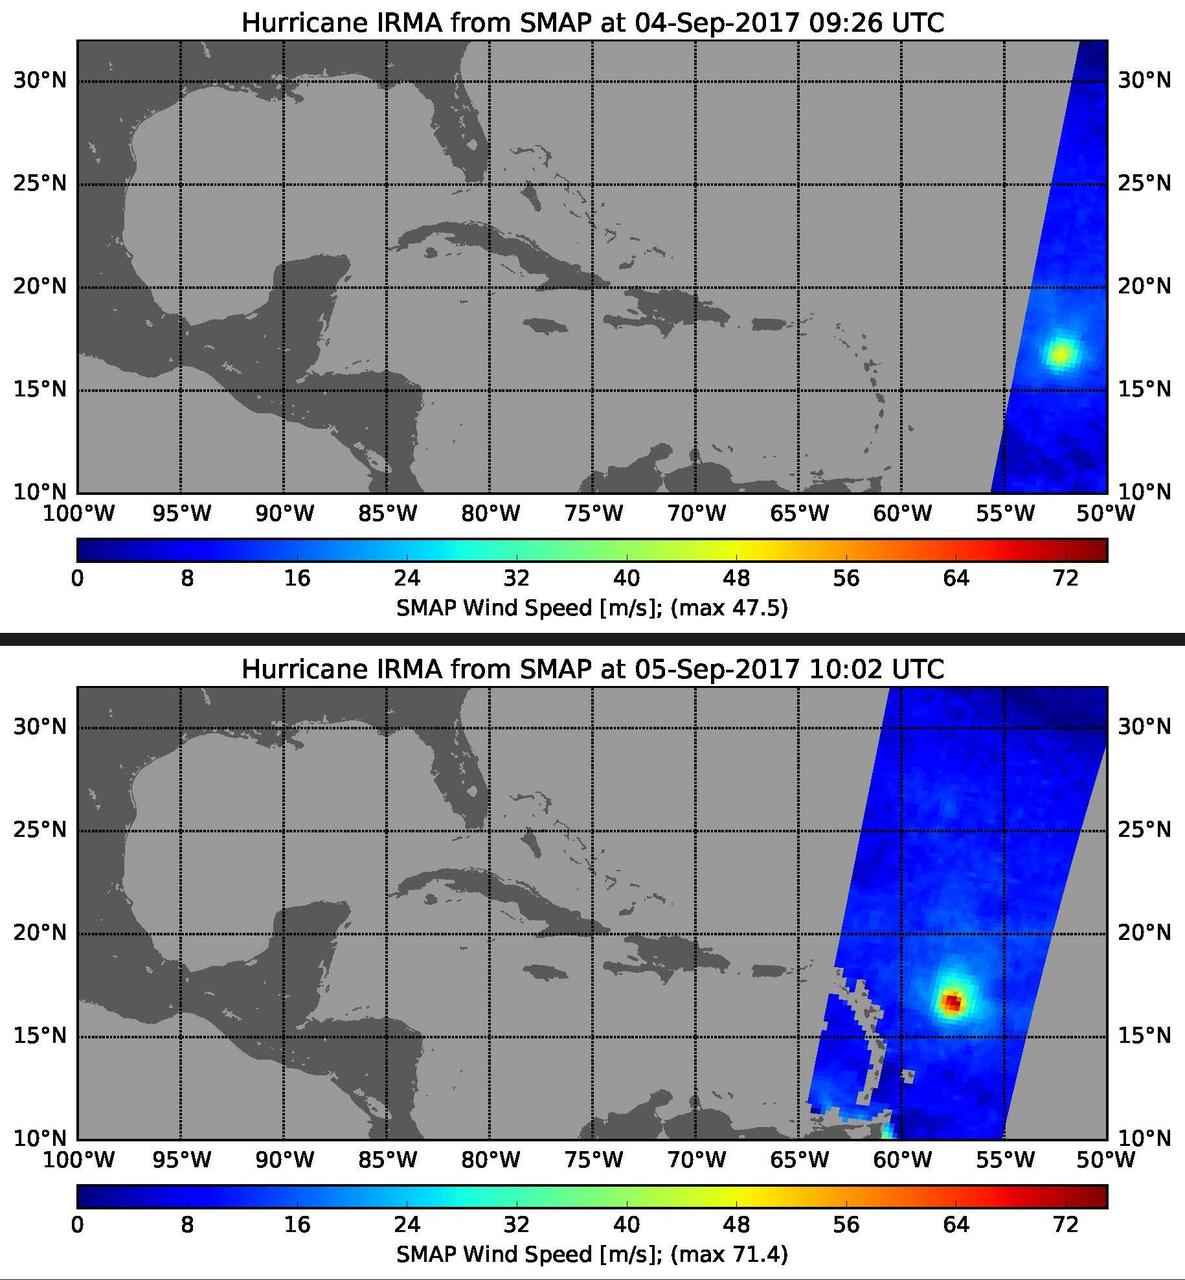
This pair of images shows ocean surface wind speeds for Hurricane Irma as observed at 5:26 a.m. EDT on Sept. 4, 2017 (top) and 24.5 hours later at 6:02 a.m. EDT on September 5th (bottom) by the radiometer instrument on NASA's Soil Moisture Active Passive (SMAP) satellite. Color indicates wind speed, with red being highest and blue lowest. Irma intensified from a Category 2 hurricane on Sept. 4 with observed wind speed of 106 miles per hour (47.5 meters per second) to a Category 5 hurricane on Sept. 5 with a maximum observed wind speed of 160 miles per hour (71.4 meters per second). https://photojournal.jpl.nasa.gov/catalog/PIA21939
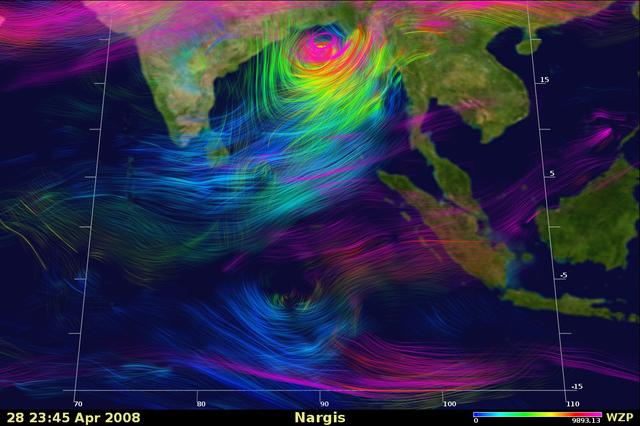
Shen_Nargis: Snapshot of a very large simulation showing the altitude and velocity of wind speeds within the 2008 Cyclone Nargis. Top wind speeds for the storm were measured at 135 mph. The lowest altitude winds are shown in blue, while the highest altitude winds are shown in pink. Wind speed is shown by color density: higher density denotes stronger winds, slightly transparent color indicates slower wind speeds. Credit: Bryan Green, NASA Ames Research Center; Bo-wen Shen, NASA Goddard Space Flight Center.
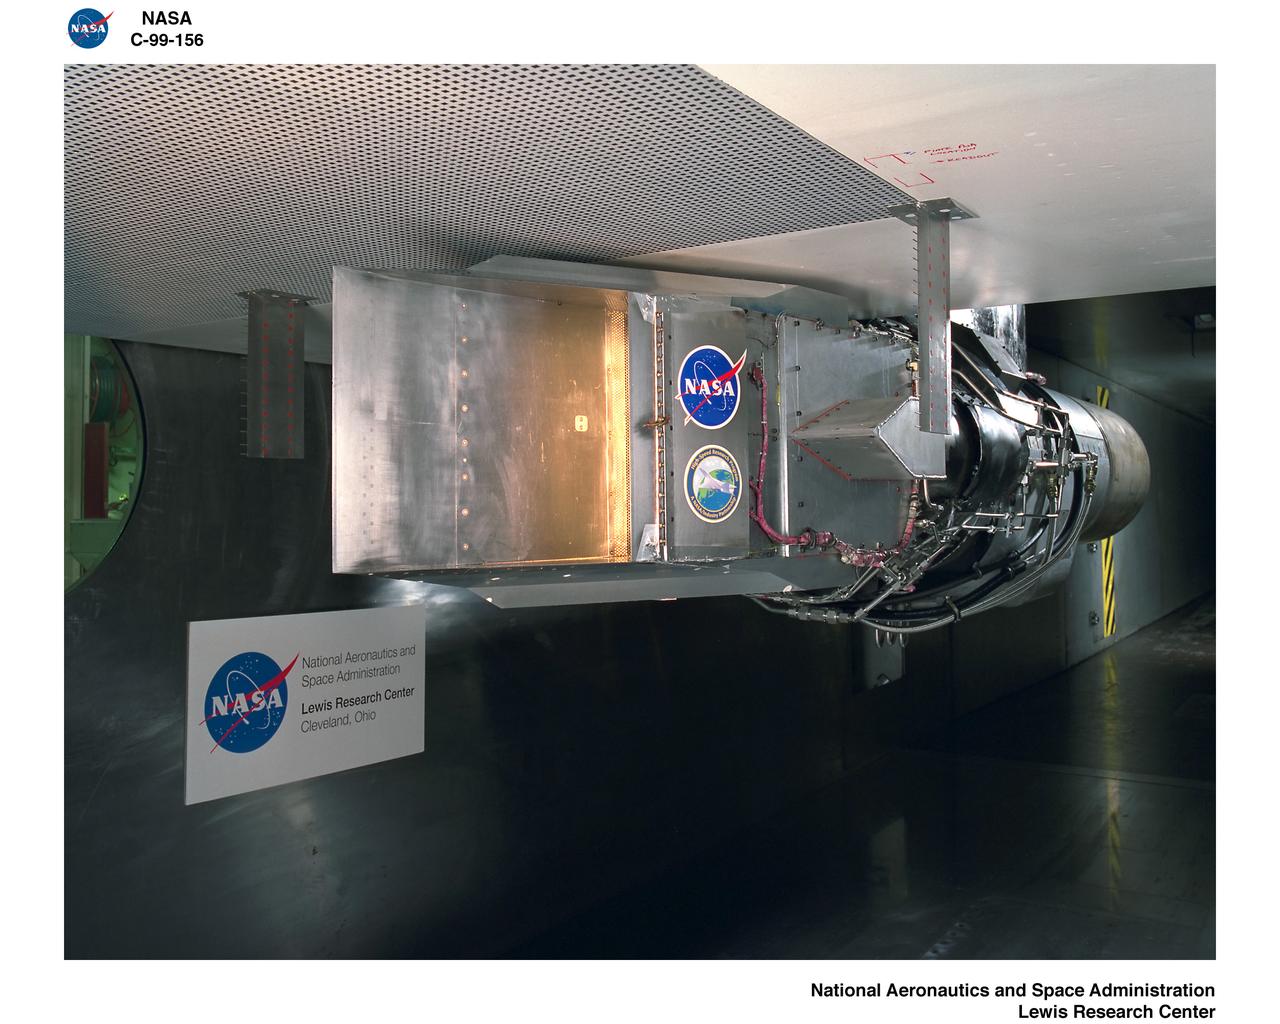
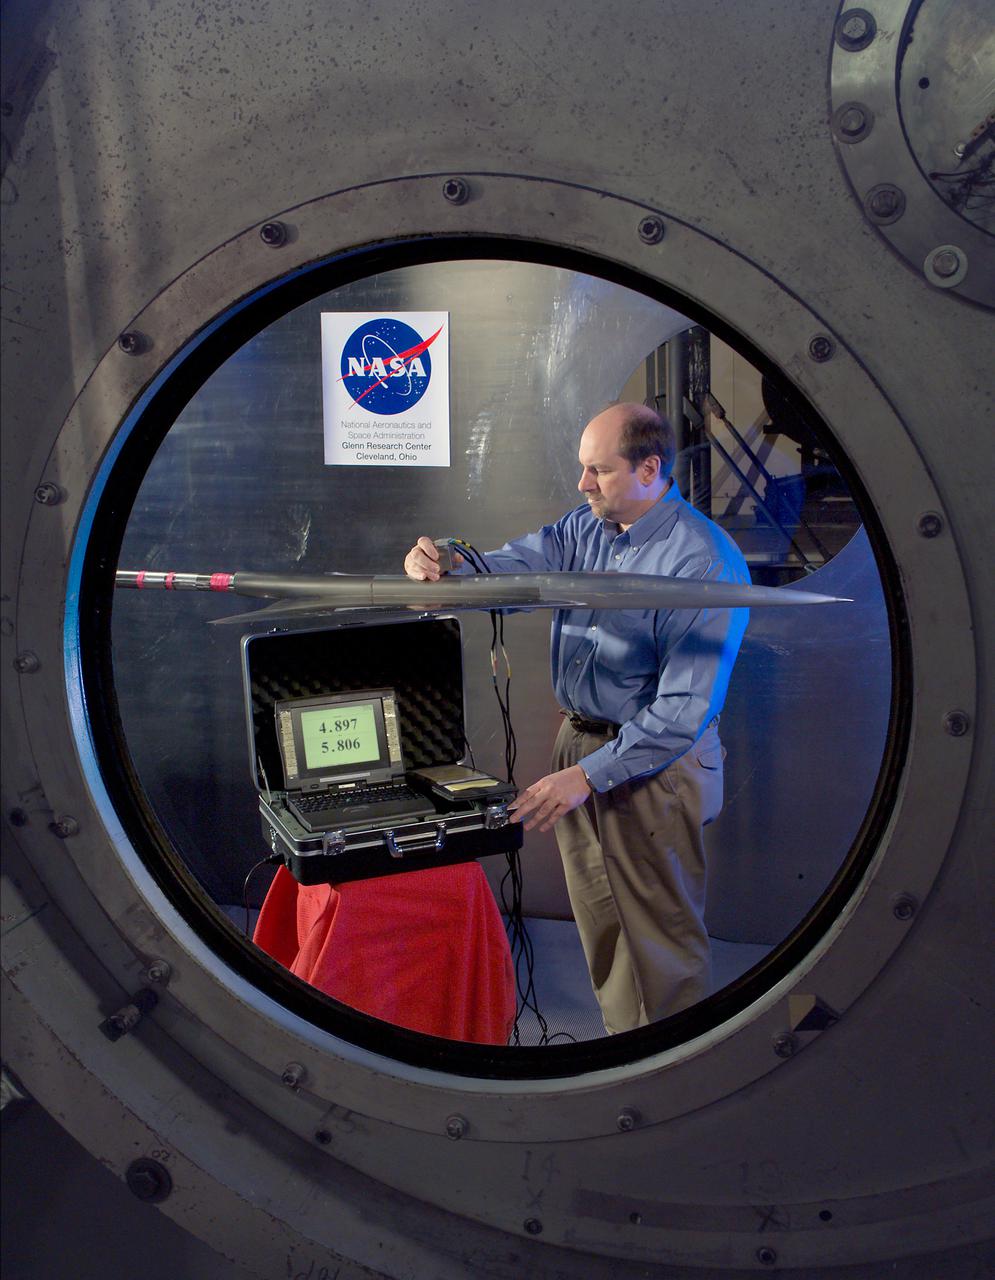
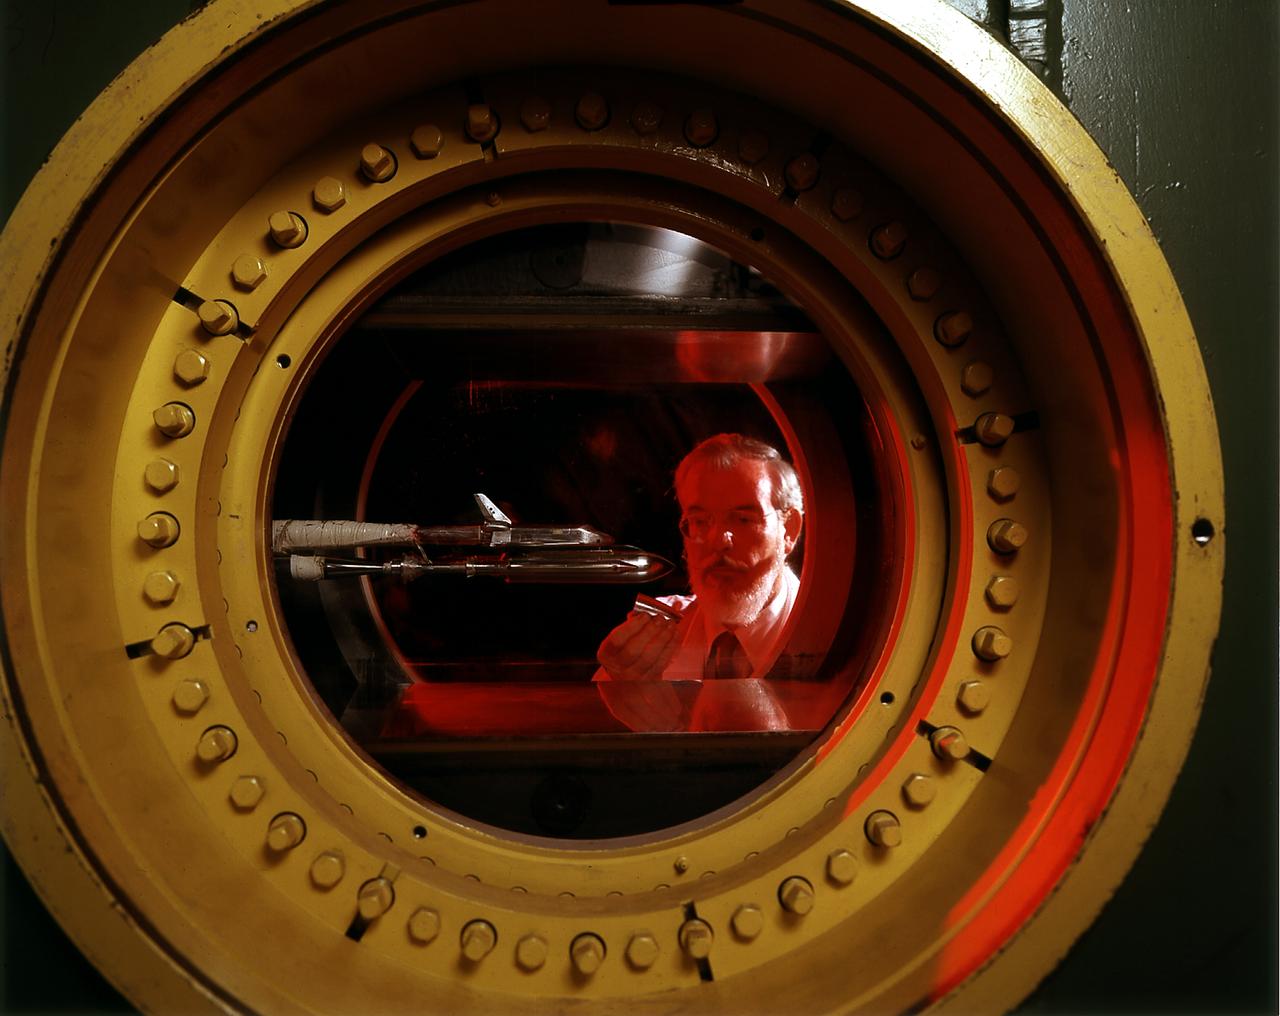
A spectrally resolved Rayleigh/Mie scattering diagnostic was developed to measure temperature and wing span wise velocity in the vicinity of an ASTOVL aircraft model tested in the Lewis, now Glenn, 9x15 Low Speed Wind Tunnel. Shown is a Fabry-Perot interferometer that uses only the blue light from a laser to measure static temperature and velocity near the lift nozzles and suction systems.
A spectrally resolved Rayleigh/Mie scattering diagnostic was developed to measure temperature and wingspan wise velocity in the vicinity of an ASTOVL aircraft model tested in the Lewis, now Glenn, 9x15 Low Speed Wind Tunnel. This was done for the Phase III hot gas ingestion study of ground-effect flow-field on such aircraft during hover or vertical landing.
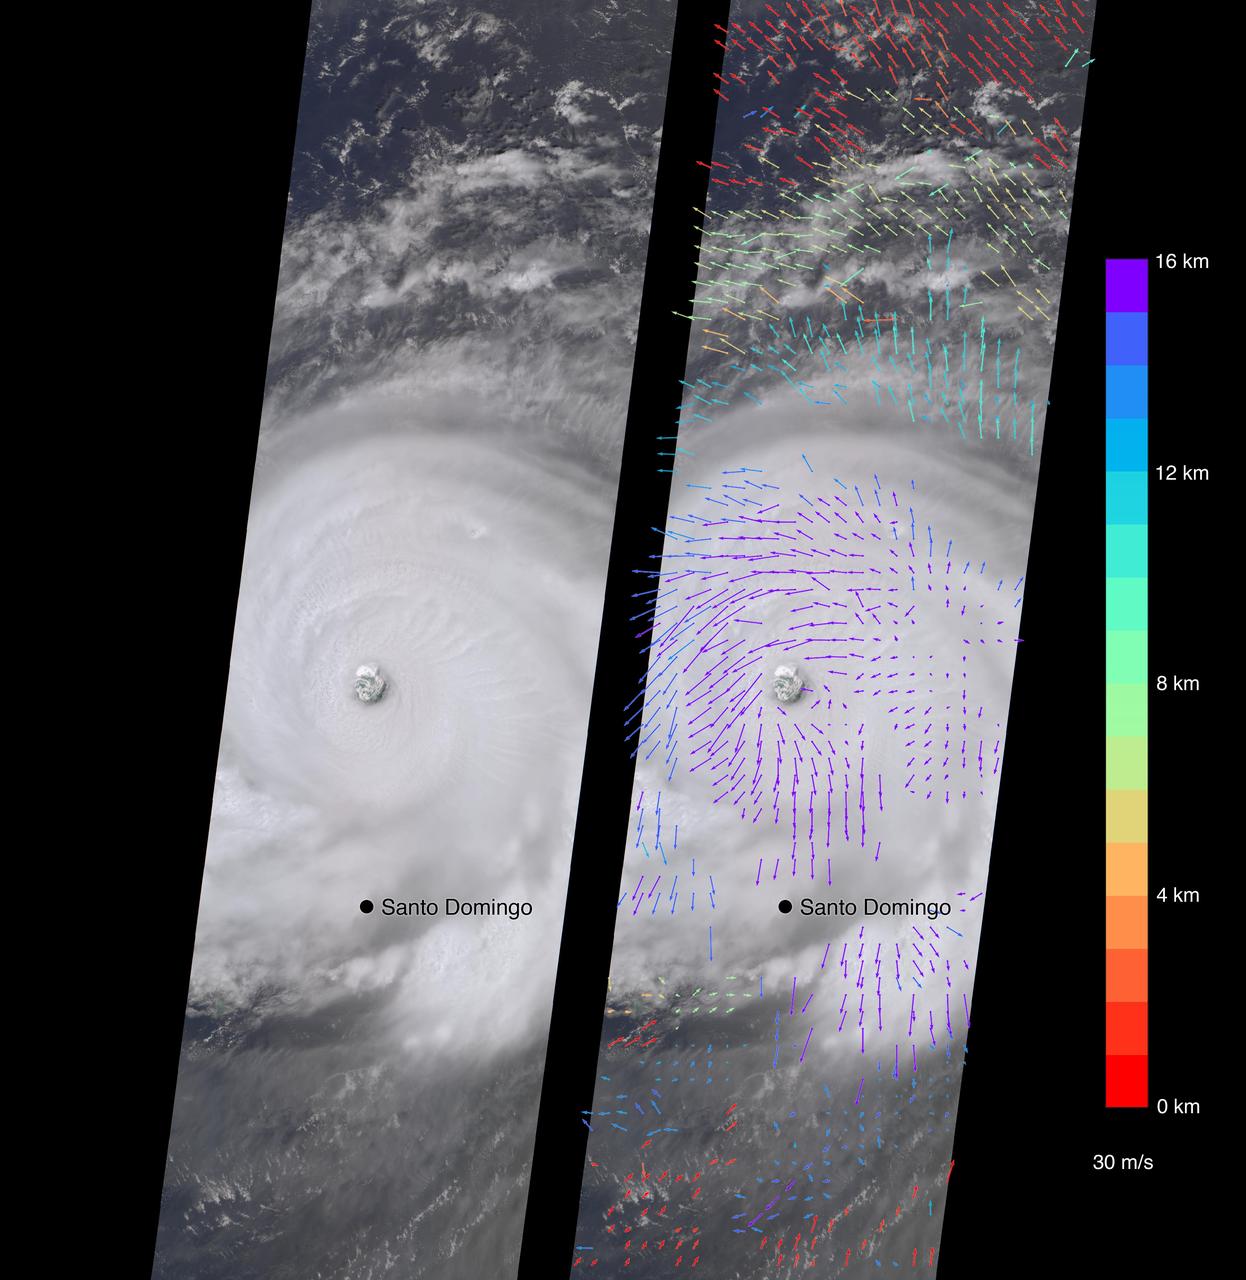
On Sept. 7, the Multi-angle Imaging SpectroRadiometer (MISR) instrument on NASA's Terra satellite passed over Hurricane Irma at approximately 11:20 a.m. local time. The MISR instrument comprises nine cameras that view the Earth at different angles, and since it takes roughly seven minutes for all nine cameras to capture the same location, the motion of the clouds between images allows scientists to calculate the wind speed at the cloud tops. The animated GIF shows Irma's motion over the seven minutes of the MISR imagery. North is toward the top of the image. This composite image shows Hurricane Irma as viewed by the central, downward-looking camera (left), as well as the wind speeds (right) superimposed on the image. The length of the arrows is proportional to the wind speed, while their color shows the altitude at which the winds were calculated. At the time the image was acquired, Irma's eye was located approximately 60 miles (100 kilometers) north of the Dominican Republic and 140 miles (230 kilometers) north of its capital, Santo Domingo. Irma was a powerful Category 5 hurricane, with wind speeds at the ocean surface up to 185 miles (300 kilometers) per hour, according to the National Oceanic and Atmospheric Administration. The MISR data show that at cloud top, winds near the eye wall (the most destructive part of the storm) were approximately 90 miles per hour (145 kilometers per hour), and the maximum cloud-top wind speed throughout the storm calculated by MISR was 135 miles per hour (220 kilometers per hour). While the hurricane's dominant rotation direction is counter-clockwise, winds near the eye wall are consistently pointing outward from it. This is an indication of outflow, the process by which a hurricane draws in warm, moist air at the surface and ejects cool, dry air at its cloud tops. These data were captured during Terra orbit 94267. An animation is available at https://photojournal.jpl.nasa.gov/catalog/PIA21946
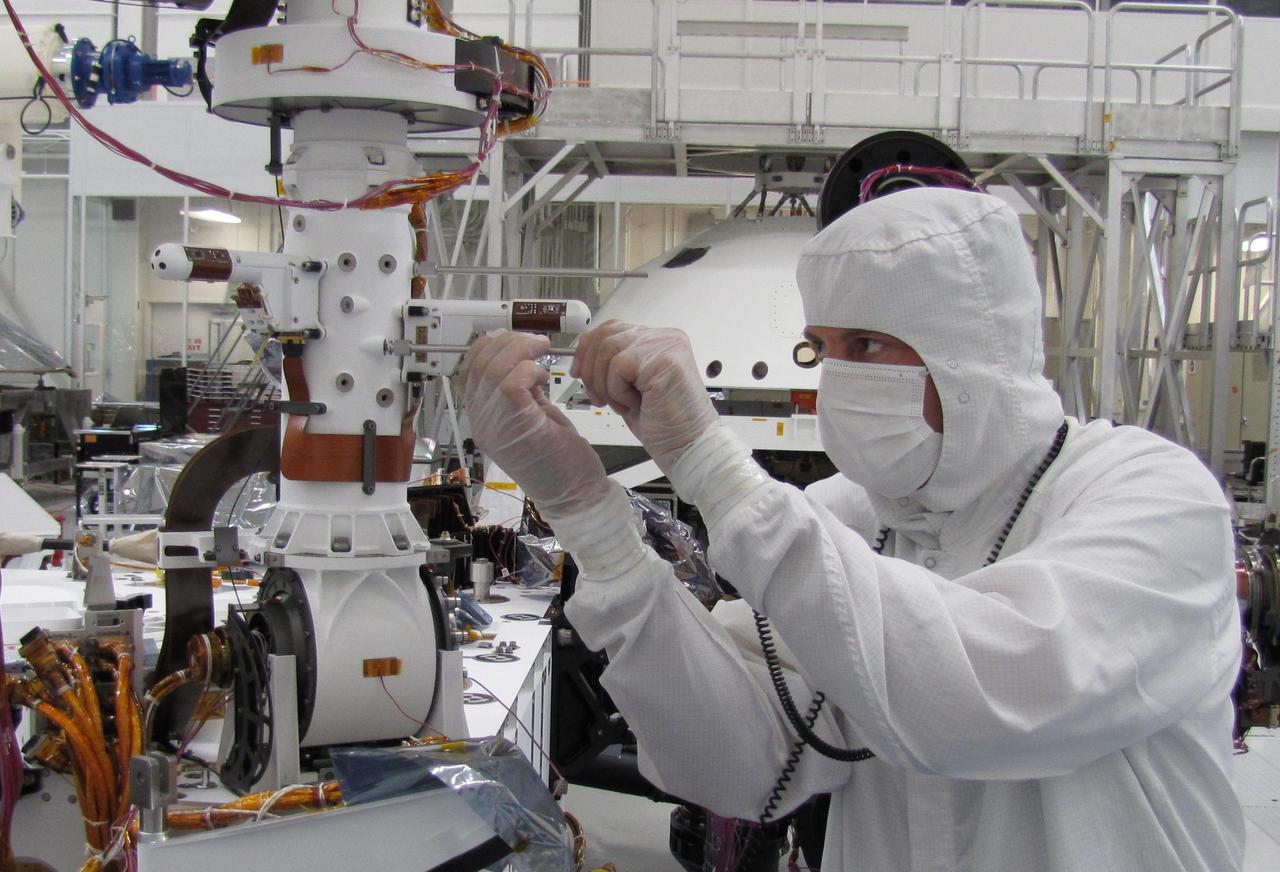
Sensors on two finger-like mini-booms extending horizontally from the mast of NASA Mars rover Curiosity will monitor wind speed, wind direction and air temperature; image taken during installation of the instrument inside a clean room at NASA JPL.
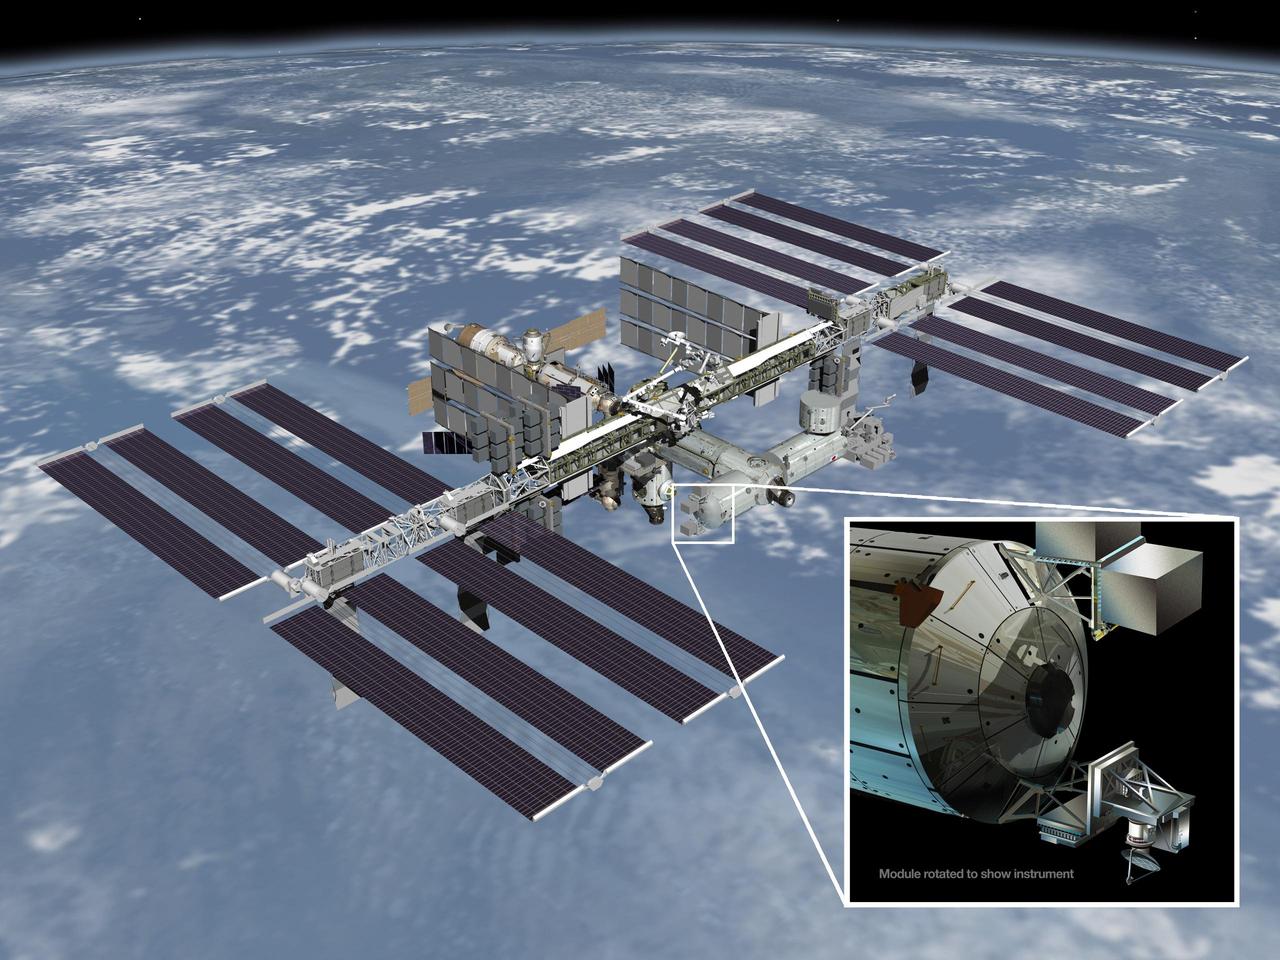
Artist rendering of NASA ISS-RapidScat instrument inset, which will launch to the International Space Station in 2014 to measure ocean surface wind speed and direction and help improve weather forecasts, including hurricane monitoring.
Launched Sept. 21, 2014, to the International Space Station, NASA newest Earth-observing mission, the International Space Station-RapidScat scatterometer to measure global ocean near-surface wind speeds and directions.
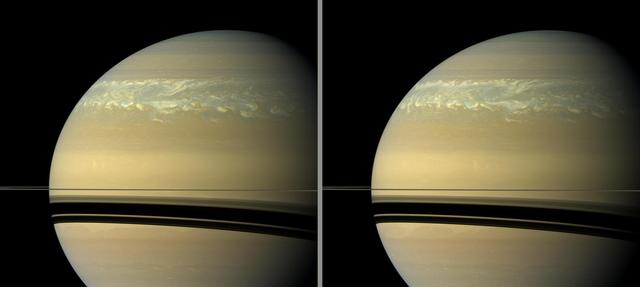
These two natural color views taken 11 hours -- one Saturn day -- apart by NASA Cassini spacecraft help scientists measure wind speeds in the huge storm seen here in the planet northern hemisphere.
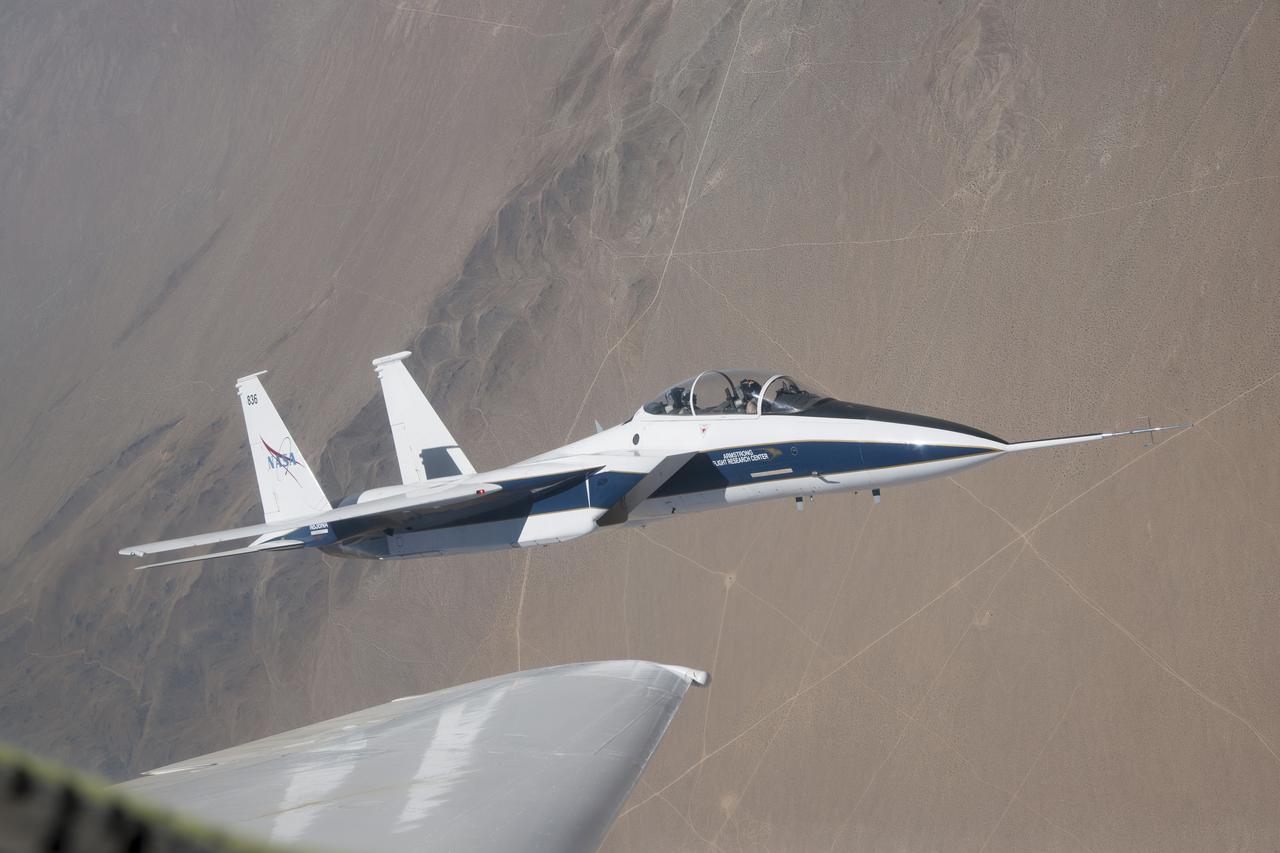
NASA’s F-15 research test bed will expose the Swept Wing Laminar Flow test article to speeds up to Mach 2, matching conditions presented during wind tunnel testing at NASA’s Langley Research Center.
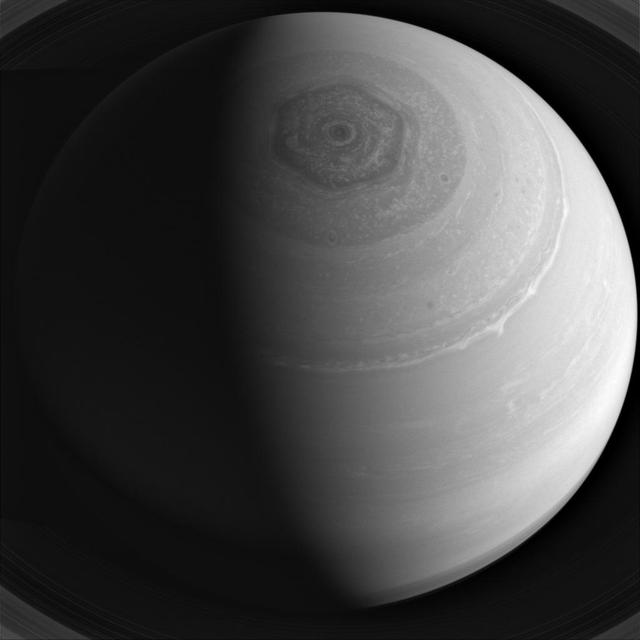
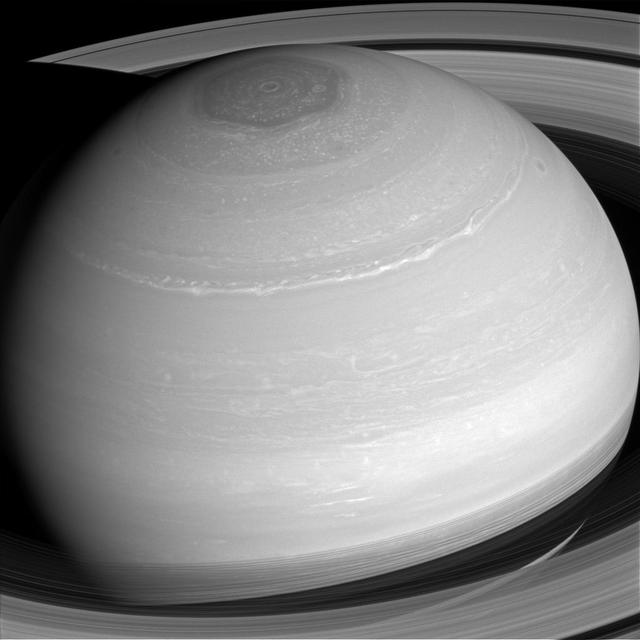
Saturn winds race furiously around the planet, blowing at high speeds which form distinct belts and zones which encircle the planet pole, as well as its famous hexagon as seen in this image from NASA Cassini spacecraft.
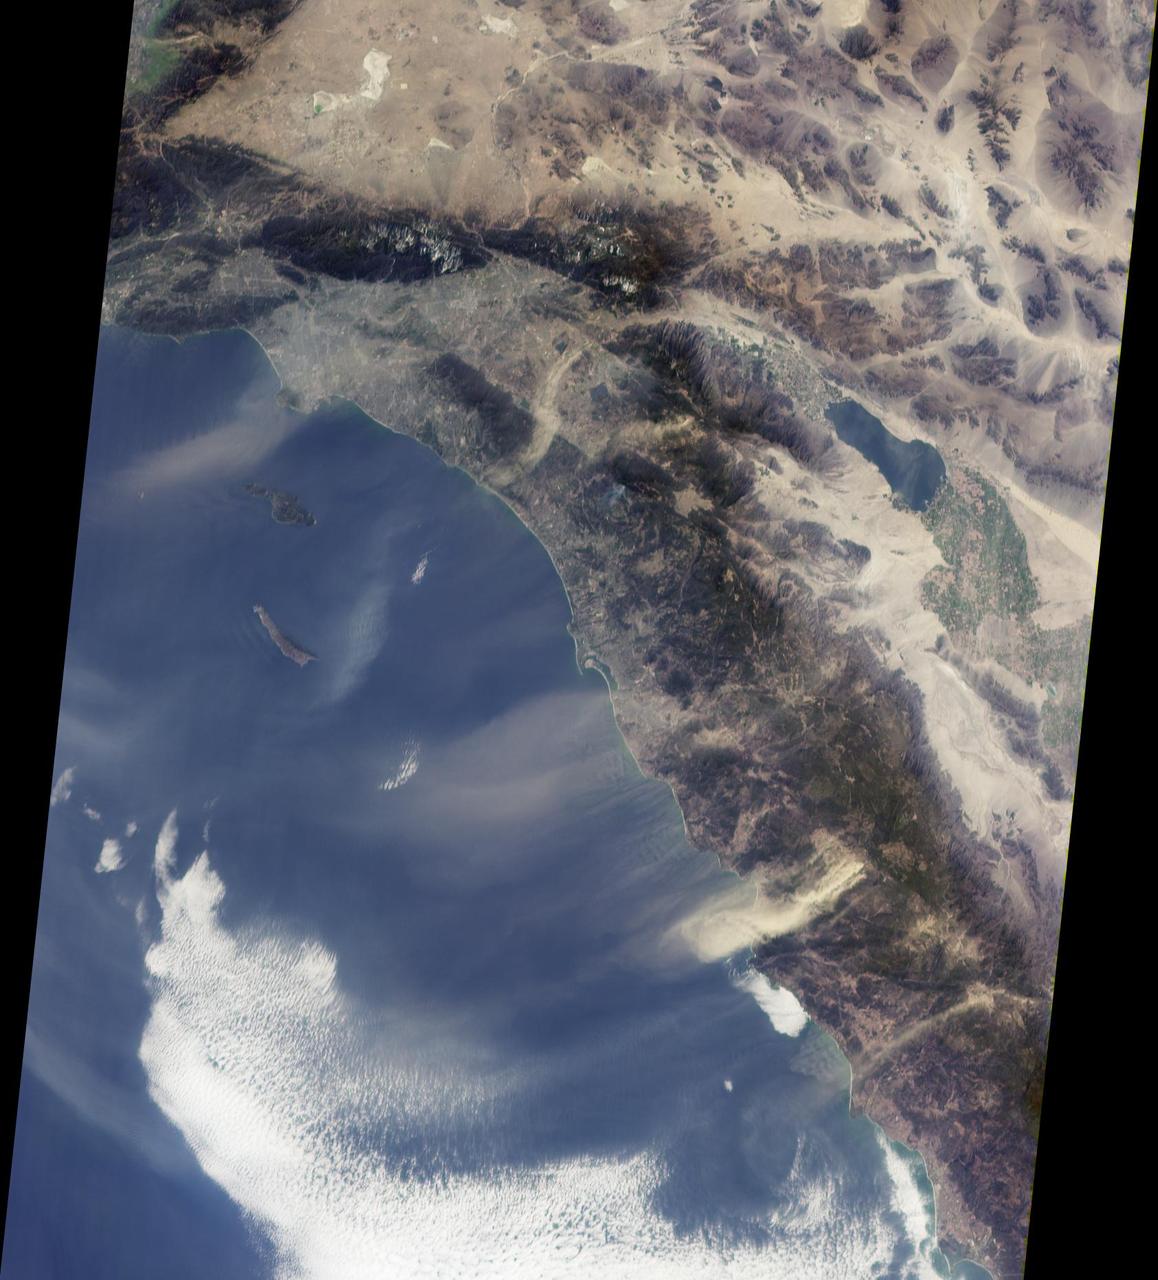
Southern California Santa Anas are dry, north-easterly winds having speeds in excess of 25 knots 46 kilometers/hour. Santa Ana conditions are commonly associated with gusts of more than twice this level.
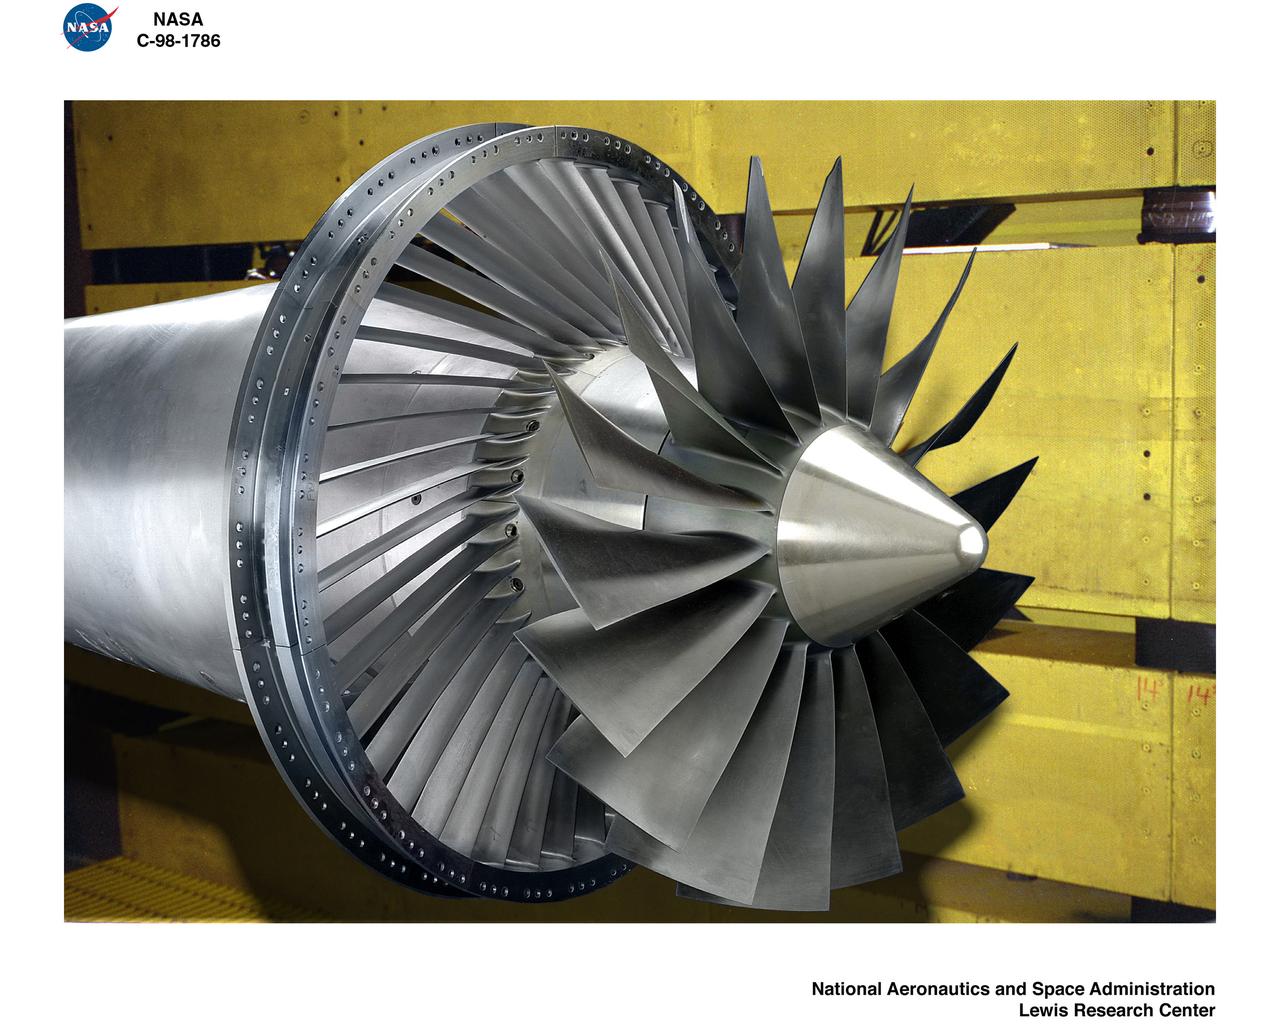
ALLISON LOW SPEED NOISE FAN WITH SWEPT / LEANED STATORS IN 9X15 FOOT LOW SPEED WIND TUNNEL
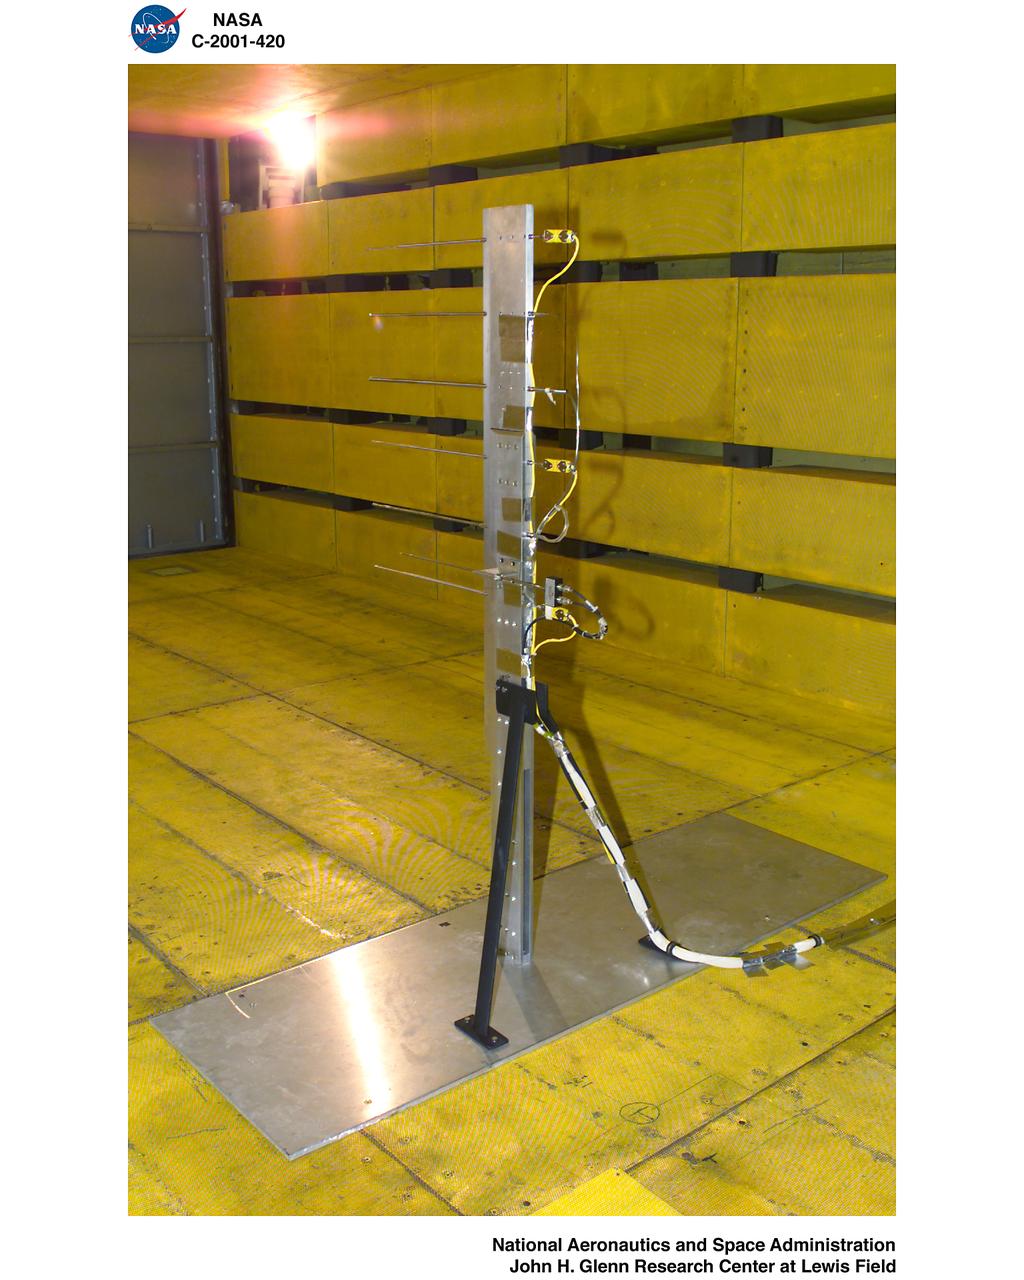
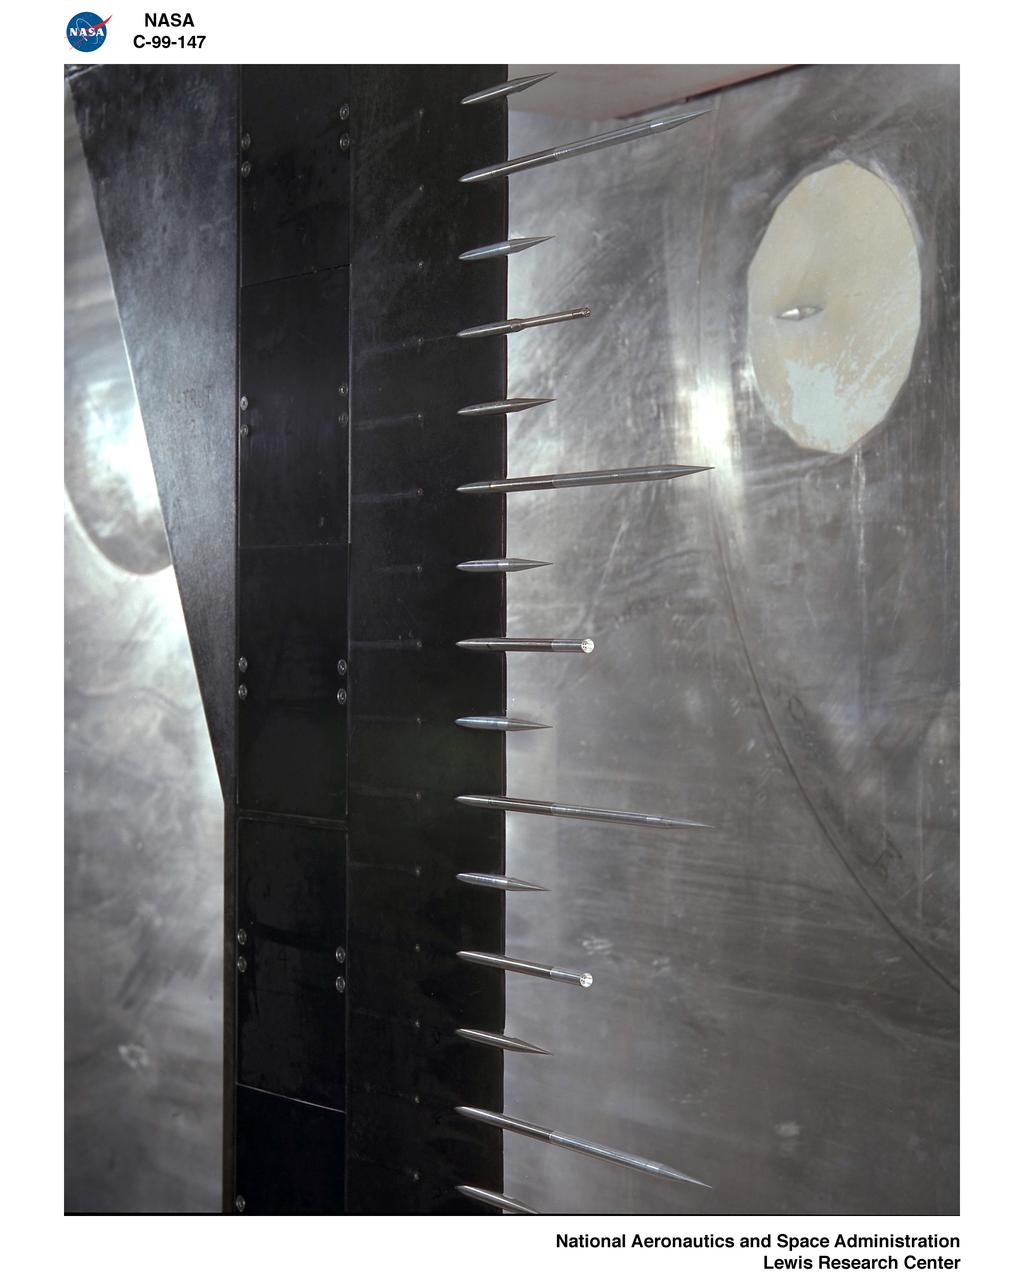
LOW SPEED WIND TUNNEL CALIBRATION HARDWARE IN 9X15 FOOT WIND TUNNEL TEST SECTION
Saturn many cloud patterns, swept along by high-speed winds, look as if they were painted on by some eager alien artist in this image from NASA Cassini spacecraft. With no real surface features to slow them down, wind speeds on Saturn can top 1,100 mph (1,800 kph), more than four times the top speeds on Earth. This view looks toward the sunlit side of the rings from about 29 degrees above the ringplane. The image was taken with the Cassini spacecraft wide-angle camera on April 4, 2014 using a spectral filter which preferentially admits wavelengths of near-infrared light centered at 752 nanometers. The view was obtained at a distance of approximately 1.1 million miles (1.8 million kilometers) from Saturn. Image scale is 68 miles (109 kilometers) per pixel. http://photojournal.jpl.nasa.gov/catalog/PIA18280
![Astronaut Neil Armstrong examines a Vertical and Short Takeoff and Landing test setup in the 9- by 15-Foot Low Speed Wind Tunnel at the National Aeronautics and Space Administration (NASA) Lewis Research Center. Armstrong spent February 6, 1970 at Lewis attending technical meetings and touring some facilities. Just six months after Armstrong had returned from the moon looming agency budget cuts were already a concern in his comments. He noted that NASA had to “find a balanced approach…and [make] aggressive use of available facilities.” Armstrong spent four months at the center as a research pilot in 1955. Armstrong had served as a Navy pilot during the Korean War then earned a degree in aeronautical engineering at Purdue University. He was recruited by Lewis while at Purdue and began at the center shortly after graduation. During his brief tenure in Cleveland Armstrong served as both a test pilot and research engineer, primarily involved with icing research. In his role as research pilot Armstrong also flew a North American F-82 Twin Mustang over the ocean near Wallops Island to launch small instrumented rockets from high altitudes down into the atmosphere to obtain high Mach numbers. After four months in Cleveland a position opened up at what is today the Dryden Flight Research Center. Armstrong’s career in Cleveland officially ended on June 30, 1955.](https://images-assets.nasa.gov/image/GRC-1970-C-00473/GRC-1970-C-00473~medium.jpg)
Astronaut Neil Armstrong examines a Vertical and Short Takeoff and Landing test setup in the 9- by 15-Foot Low Speed Wind Tunnel at the National Aeronautics and Space Administration (NASA) Lewis Research Center. Armstrong spent February 6, 1970 at Lewis attending technical meetings and touring some facilities. Just six months after Armstrong had returned from the moon looming agency budget cuts were already a concern in his comments. He noted that NASA had to “find a balanced approach…and [make] aggressive use of available facilities.” Armstrong spent four months at the center as a research pilot in 1955. Armstrong had served as a Navy pilot during the Korean War then earned a degree in aeronautical engineering at Purdue University. He was recruited by Lewis while at Purdue and began at the center shortly after graduation. During his brief tenure in Cleveland Armstrong served as both a test pilot and research engineer, primarily involved with icing research. In his role as research pilot Armstrong also flew a North American F-82 Twin Mustang over the ocean near Wallops Island to launch small instrumented rockets from high altitudes down into the atmosphere to obtain high Mach numbers. After four months in Cleveland a position opened up at what is today the Dryden Flight Research Center. Armstrong’s career in Cleveland officially ended on June 30, 1955.
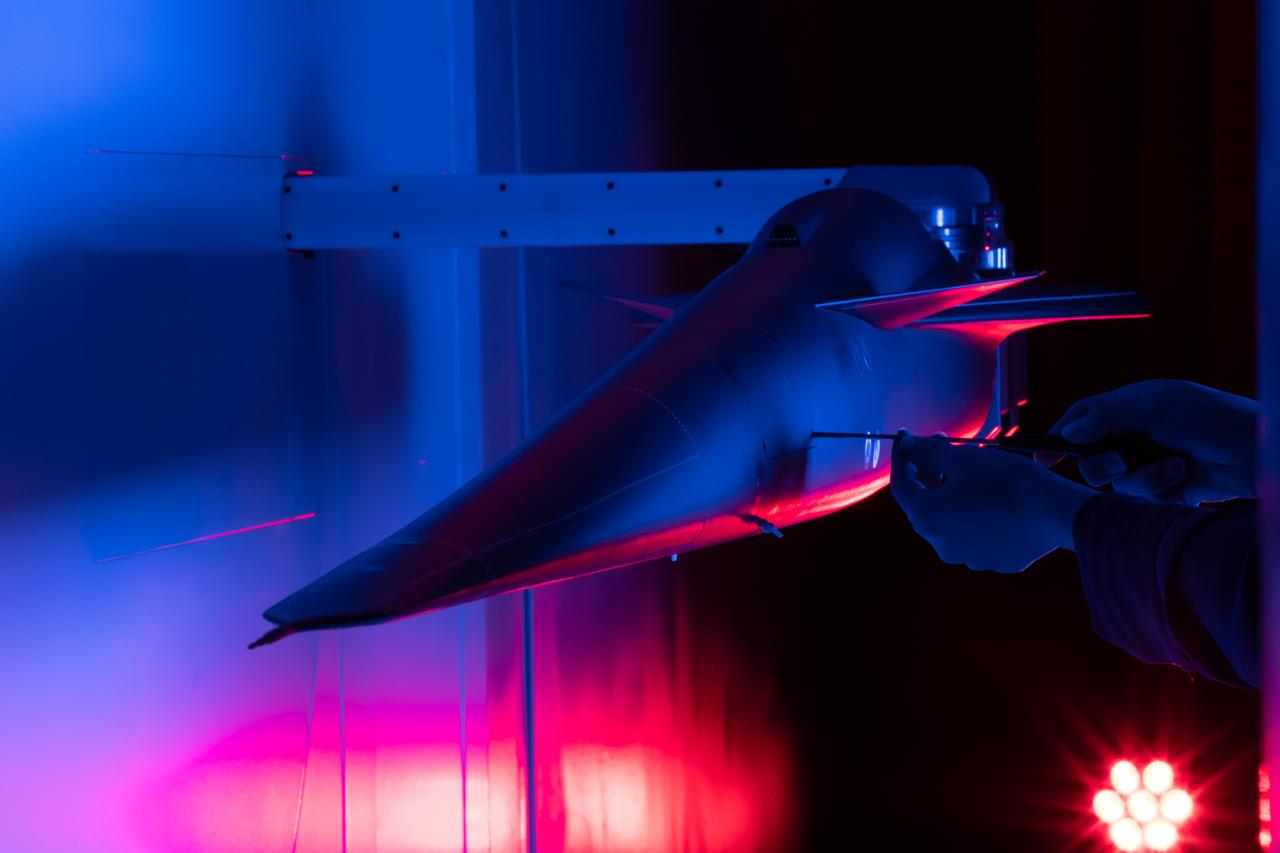
Event: Forebody and Nose - Windtunnel Testing A technician works on the X-59 model during testing in the low-speed wind tunnel at Lockheed Martin Skunk Works in Palmdale, California. These tests gave the team measurements of wind flow angle around the aircraft’s nose and confirmed computer predictions made using computational fluid dynamics (CFD) software tools. The data will be fed into the aircraft flight control system to tell the pilot the aircraft’s altitude, speed, and angle. This is part of NASA’s Quesst mission which plans to help enable supersonic air travel over land.

ALLISON DUCTED FAN IN 9X15 FOOT LOW SPEED WIND TUNNEL
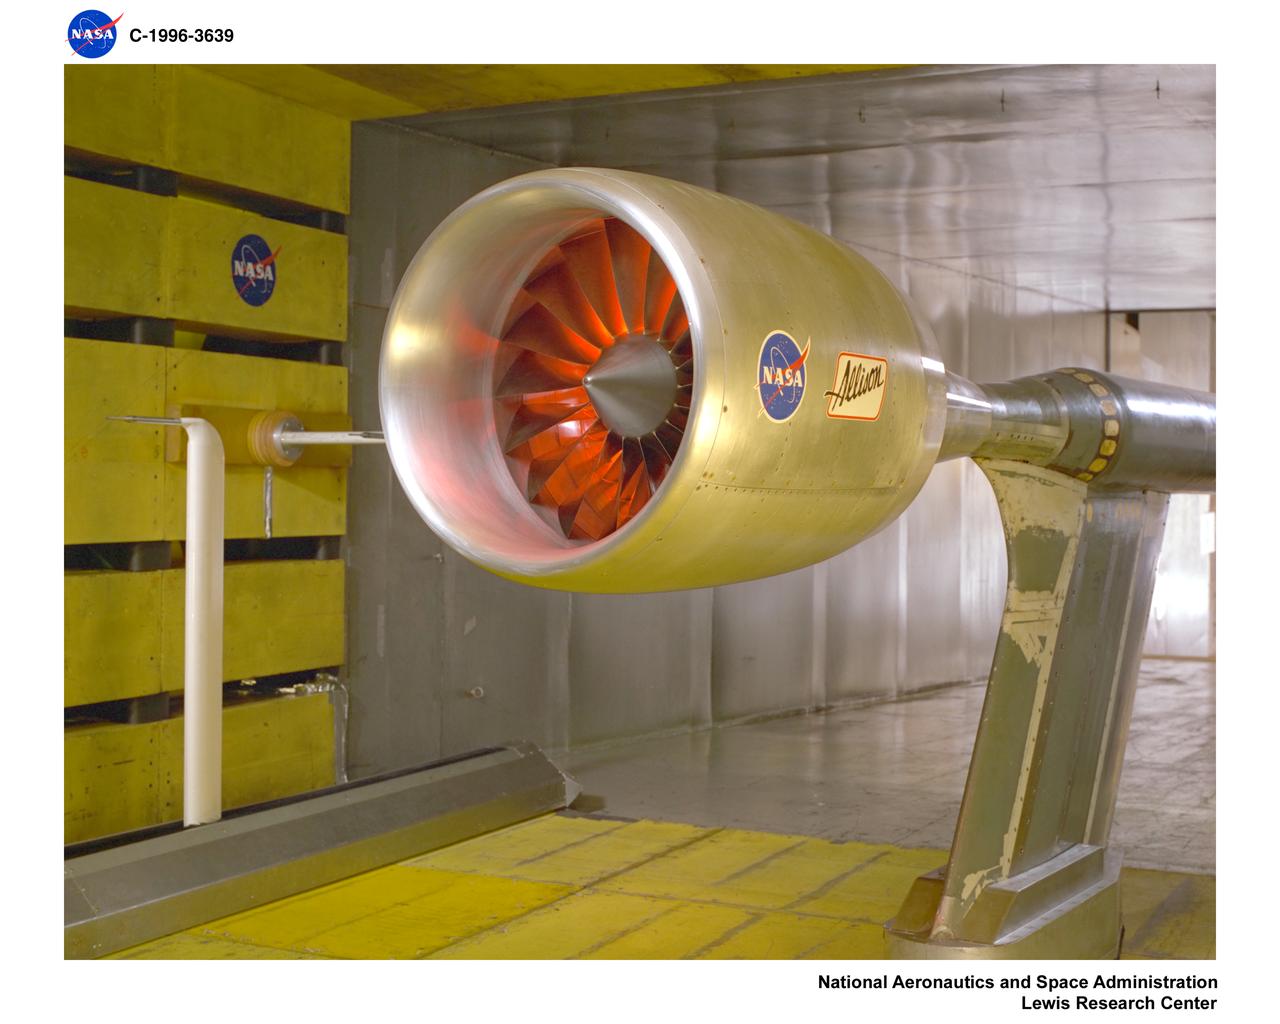
ALLISON DUCTED FAN IN 9X15 FOOT LOW SPEED WIND TUNNEL
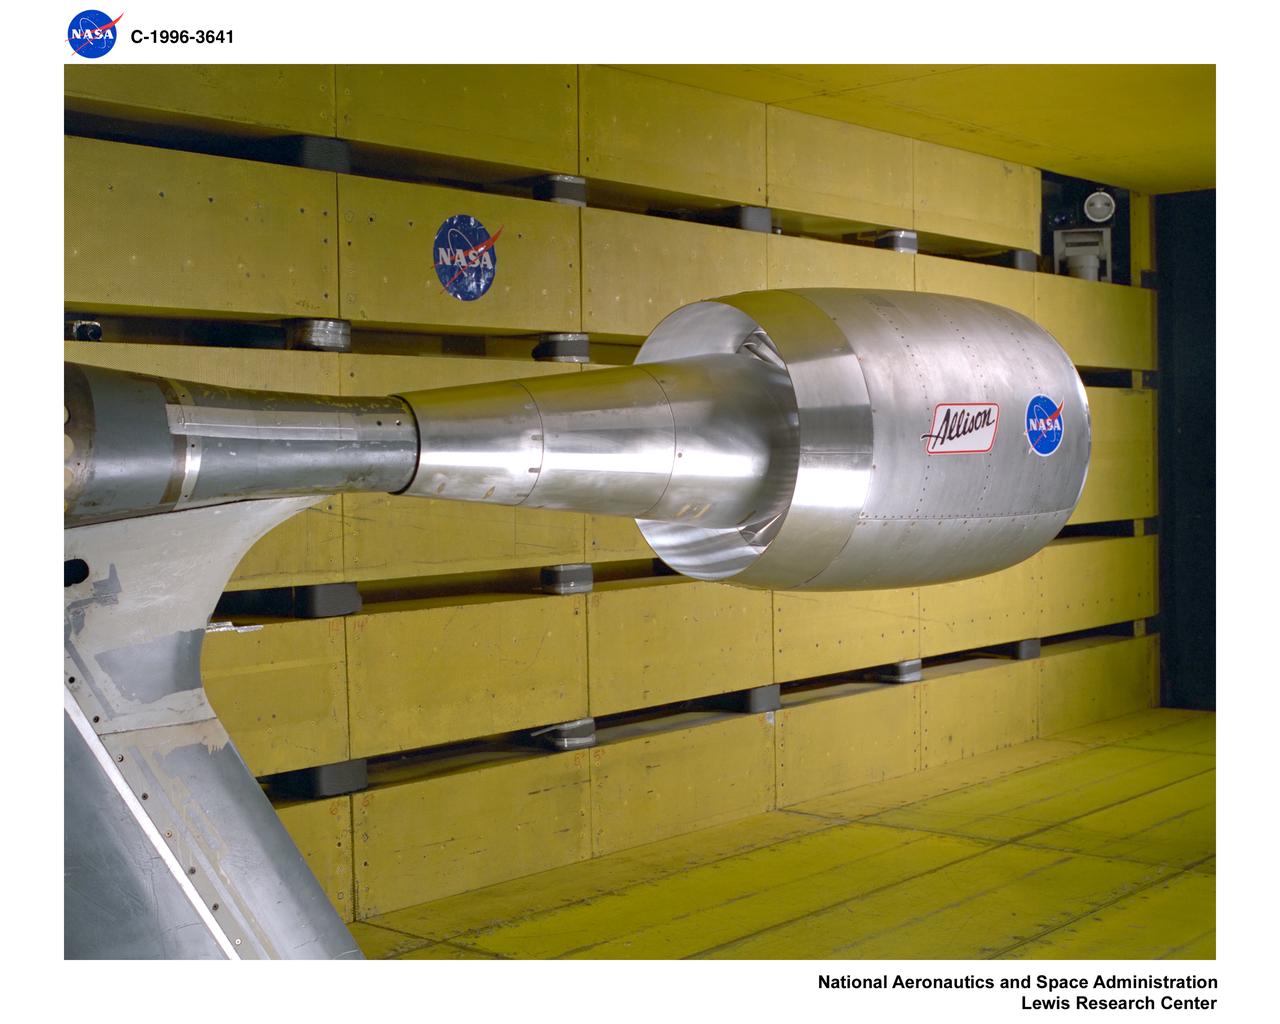
ALLISON DUCTED FAN IN 9X15 FOOT LOW SPEED WIND TUNNEL
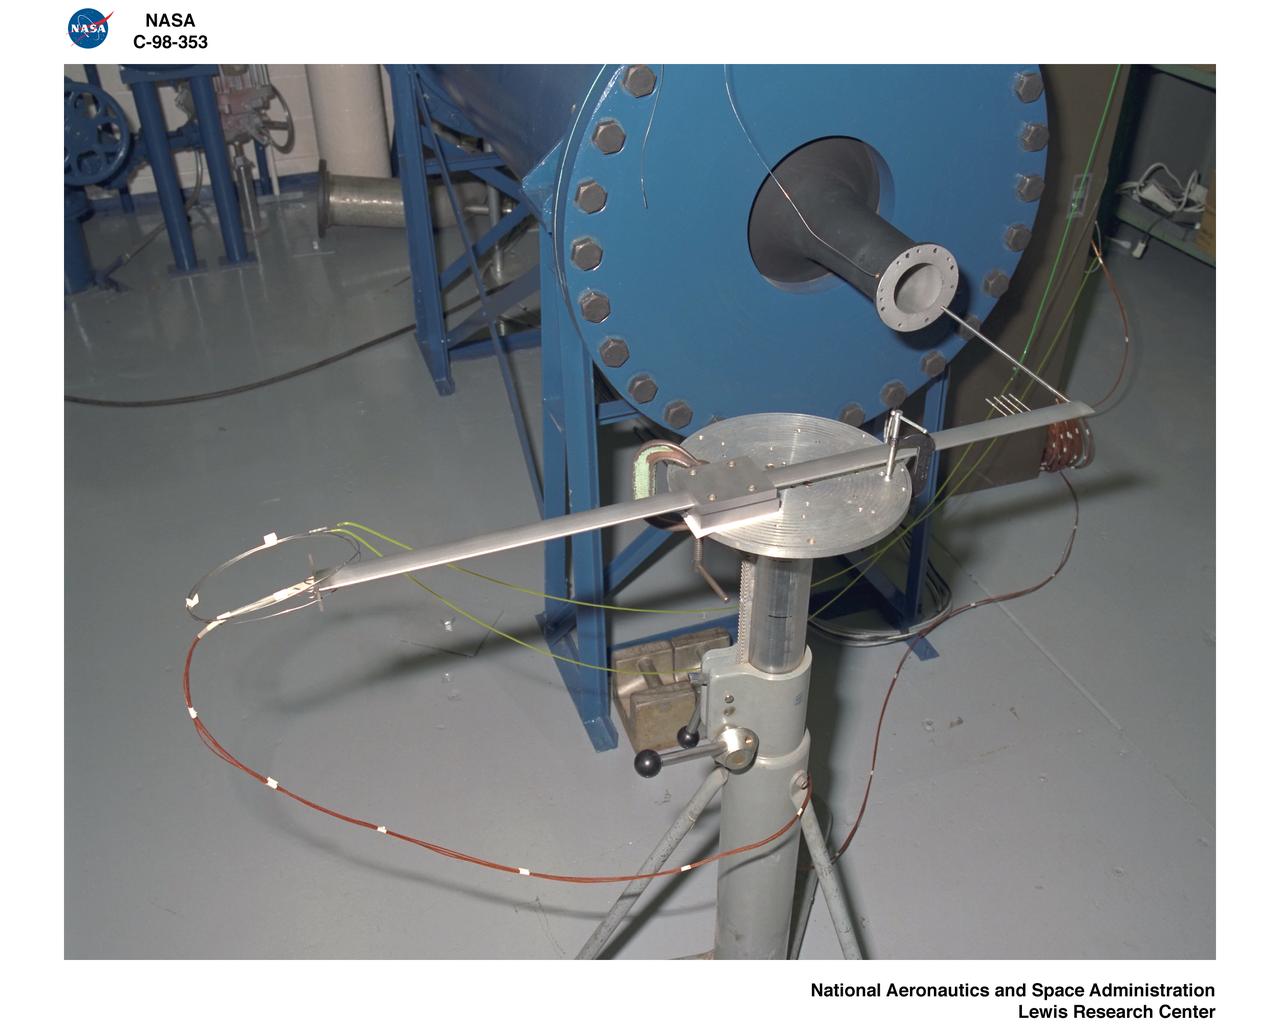
CALIBRATION OF THE 9X15 FOOT LOW SPEED WIND TUNNEL TEST SECTION RAKES
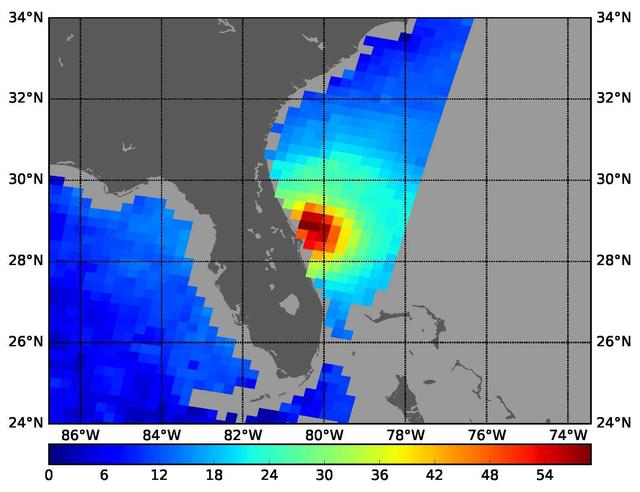
NASA's SMAP radiometer instrument measured Hurricane Matthew's wind speeds at 4:52 a.m. PDT (7:52 a.m. EDT) at up to 132 miles per hour (59 meters per second). SMAP has excellent sensitivity to extreme winds, far beyond that of typical scatterometer instruments now in orbit. http://photojournal.jpl.nasa.gov/catalog/PIA21096
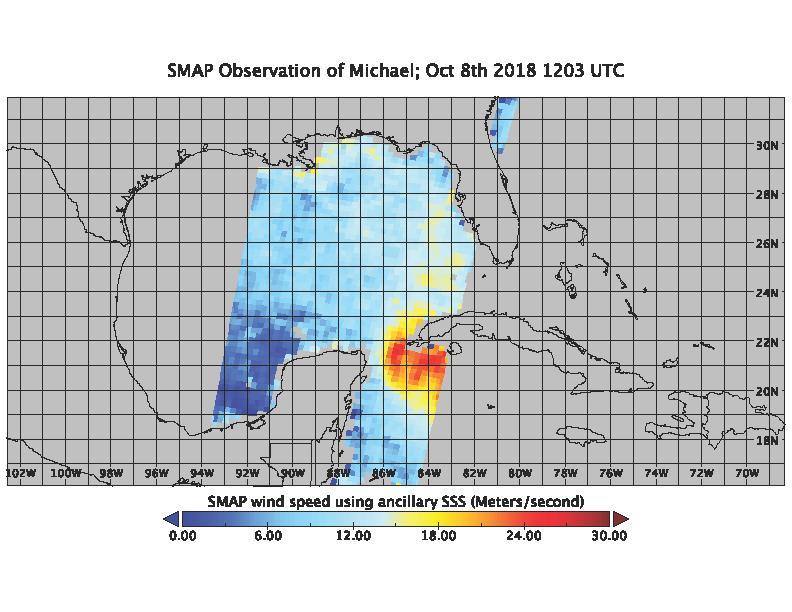
On the morning of Oct. 8, 2018, the NASA Soil Moisture Active Passive (SMAP) Radiometer got a snapshot of Hurricane Michael, which has intensified to a Category 2 hurricane over the warm waters of the Gulf of Mexico. The radiance acquired by the SMAP L-band Microwave Radiometer can see through clouds and rains, and is sensitive to the extreme ocean surface winds under a tropical storm or hurricane. Areas in red represent higher wind speeds; areas in blue have lower wind speeds. https://photojournal.jpl.nasa.gov/catalog/PIA22747
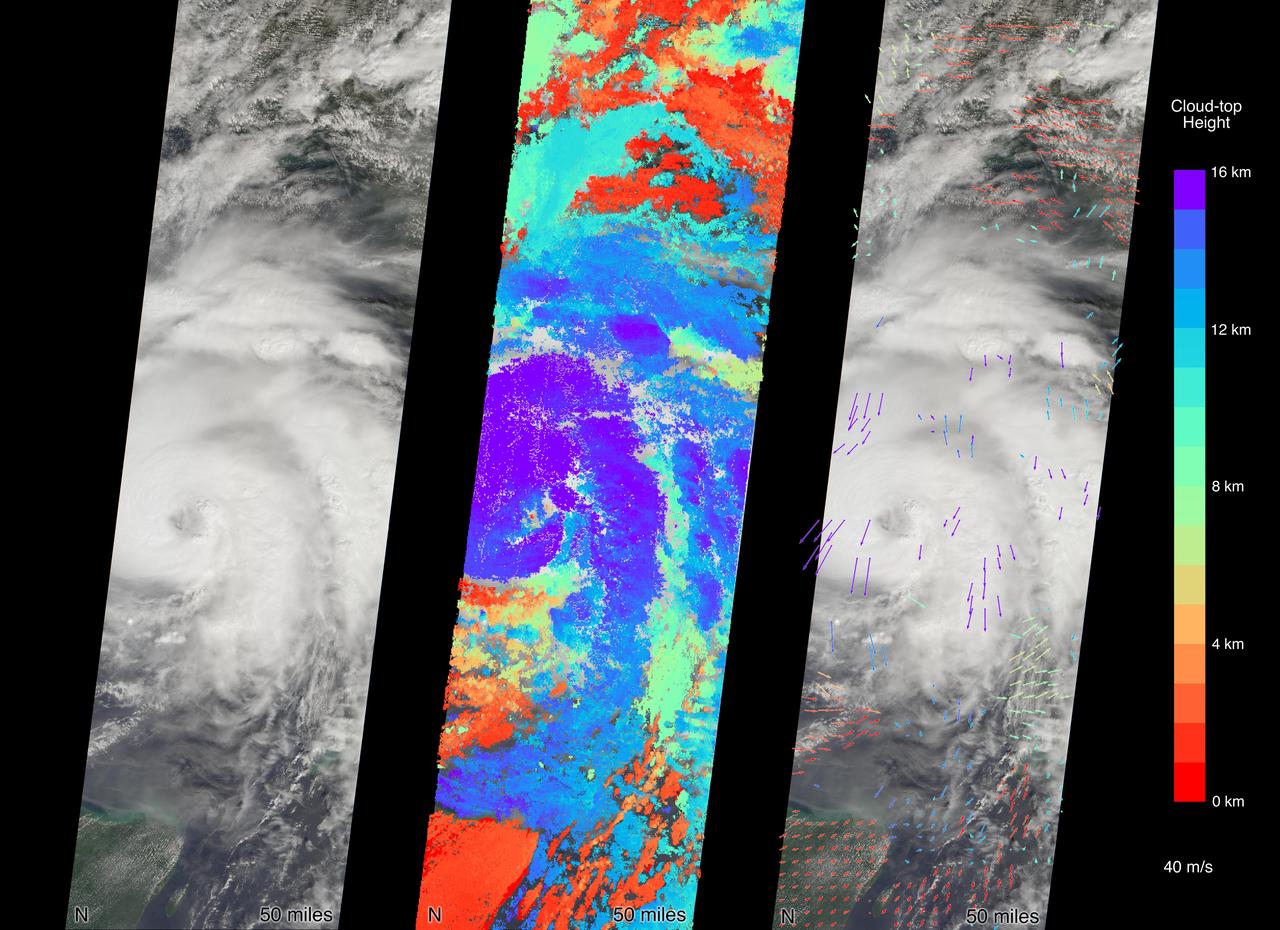
MISR carries nine cameras fixed at different angles, each of which viewed Michael over the course of approximately seven minutes when it was just off Florida's west coast on Tuesday, October 9. Images from the nine views are used to calculate the height of the cloud tops, and the motion of the clouds between the views provides information on wind speed and direction. This composite image shows the view from the central, downward-pointing camera (left), the calculated cloud-top heights (middle), and wind velocity vectors (right) superimposed on the image. The length of the arrows is proportional to wind speed and the colors show the altitude of the cloud tops in kilometers. The National Hurricane Center clocked Michael's sustained wind speed at 150 mph (240 kph) just before noon local time on Wednesday. It is expected to bring strong winds, storm surge and heavy rain to much of the southeast. https://photojournal.jpl.nasa.gov/catalog/PIA22750

When imaged by NASA Cassini spacecraft at infrared wavelengths that pierce the planet upper haze layer, the high-speed winds of Saturn atmosphere produce watercolor-like patterns. With no solid surface creating atmospheric drag, winds on Saturn can reach speeds of more than 1,100 miles per hour (1,800 kilometers per hour) -- some of the fastest in the solar system. This view was taken from a vantage point about 28 degrees above Saturn's equator. The image was taken with the Cassini spacecraft wide-angle camera on Dec. 2, 2016, with a combination of spectral filters which preferentially admits wavelengths of near-infrared light centered at 728 nanometers. The view was acquired at a distance of approximately 592,000 miles (953,000 kilometers) from Saturn. Image scale is 35 miles (57 kilometers) per pixel. https://photojournal.jpl.nasa.gov/catalog/PIA20528
NASA's Multi-angle Imaging SpectroRadiometer (MISR) passed over Hurricane Florence as it approached the eastern coast of the United States on Thursday, September 13, 2018. At the time the image was acquired, Florence was a large Category 2 storm and coastal areas were already being hit with tropical-storm-force winds. The MISR instrument, flying onboard NASA's Terra satellite, carries nine cameras that observe Earth at different angles. It takes about seven minutes for all the cameras to observe the same location. The motion of the clouds during that time is used to compute wind speed at the cloud tops. These images show Florence as viewed by the central, downward-looking camera (left) and the storm's wind speeds (right). In the right image, the length of the arrows is proportional to wind speed and their colors show the altitude of the cloud tops in kilometers. The data show that the cloud top winds near the center of the storm were approximately 70 mph (113 kph), and the maximum cloud-top wind speed throughout the storm was 90 mph (145 kph). The wind data also shows that the lowest clouds are moving counter-clockwise, indicating inflow into the southern part of the hurricane, while the high clouds to the north of the hurricane show a clockwise outflow. https://photojournal.jpl.nasa.gov/catalog/PIA22700

UNSTART PROGRAM - 10X10 FOOT SUPERSONIC WIND TUNNEL AS PART OF THE HIGH SPEED RESEARCH PROGRAM
N-231 Low Speed Wind Tunnel Laser Doppler Velocemeter and Helium Neon Laser
UNSTART PROGRAM - 10X10 FOOT SUPERSONIC WIND TUNNEL AS PART OF THE HIGH SPEED RESEARCH PROGRAM
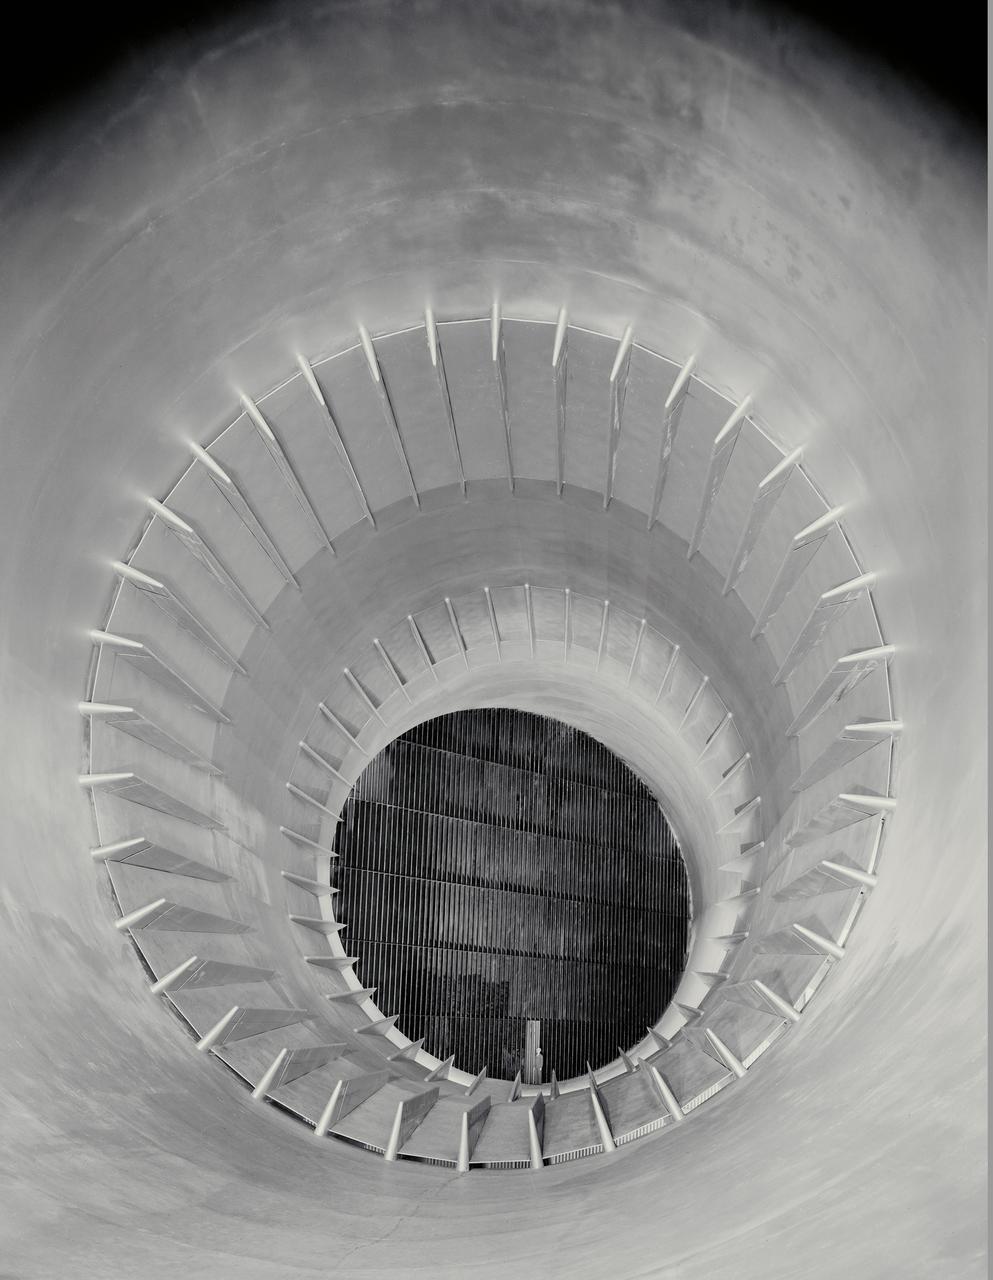
NACA Photographer - 16ft High Speed Wind Tunnel downstream view through cooling tower section

UNSTART PROGRAM - 10X10 FOOT SUPERSONIC WIND TUNNEL AS PART OF THE HIGH SPEED RESEARCH PROGRAM
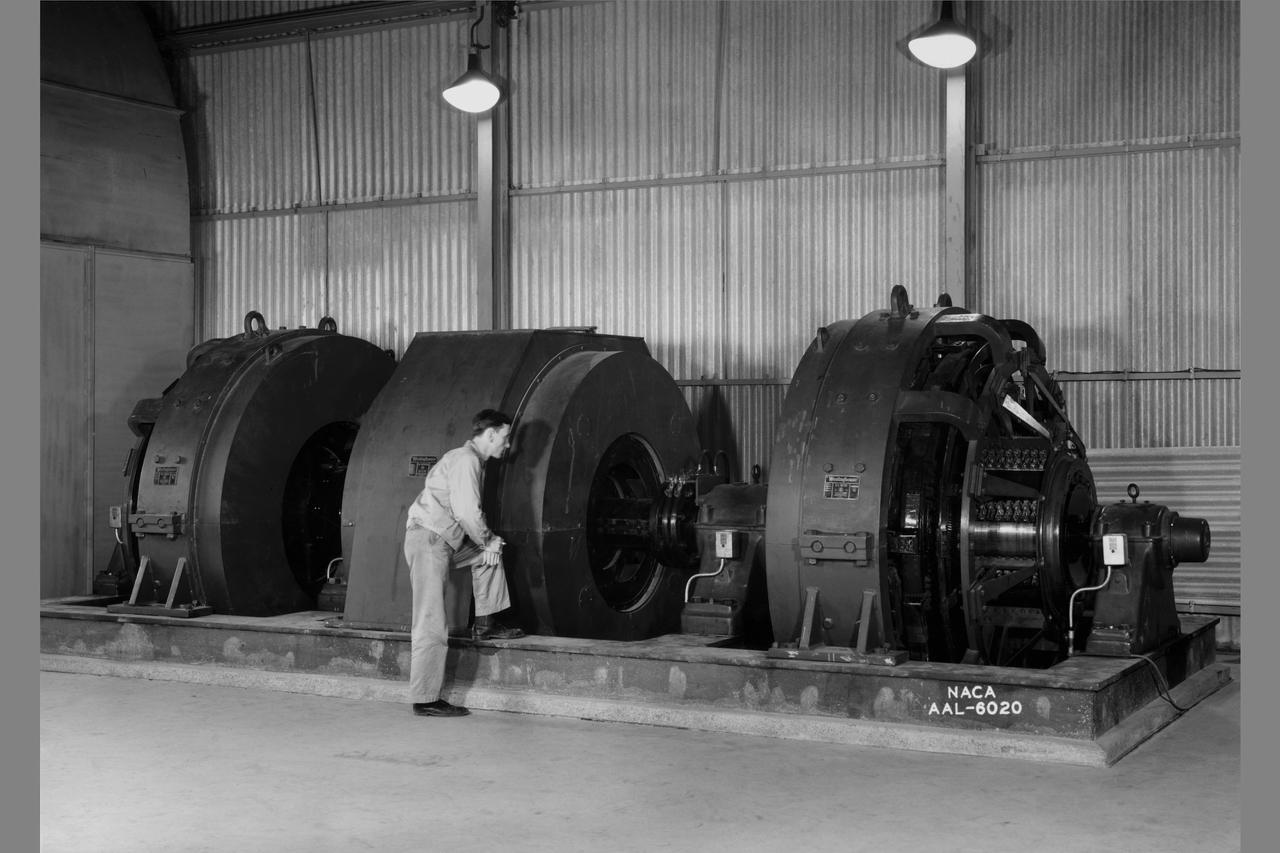
N-221 Ames 40x80ft Subsonic wind tunnel construction; Constant speed - motor generator set.

UNSTART PROGRAM - 10X10 FOOT SUPERSONIC WIND TUNNEL AS PART OF THE HIGH SPEED RESEARCH PROGRAM
UNSTART PROGRAM - 10X10 FOOT SUPERSONIC WIND TUNNEL AS PART OF THE HIGH SPEED RESEARCH PROGRAM
UNSTART PROGRAM - 10X10 FOOT SUPERSONIC WIND TUNNEL AS PART OF THE HIGH SPEED RESEARCH PROGRAM
N-231 Low Speed Wind Tunnel Laser Doppler Velocemeter and Helium Neon Laser
UNSTART PROGRAM - 10X10 FOOT SUPERSONIC WIND TUNNEL AS PART OF THE HIGH SPEED RESEARCH PROGRAM
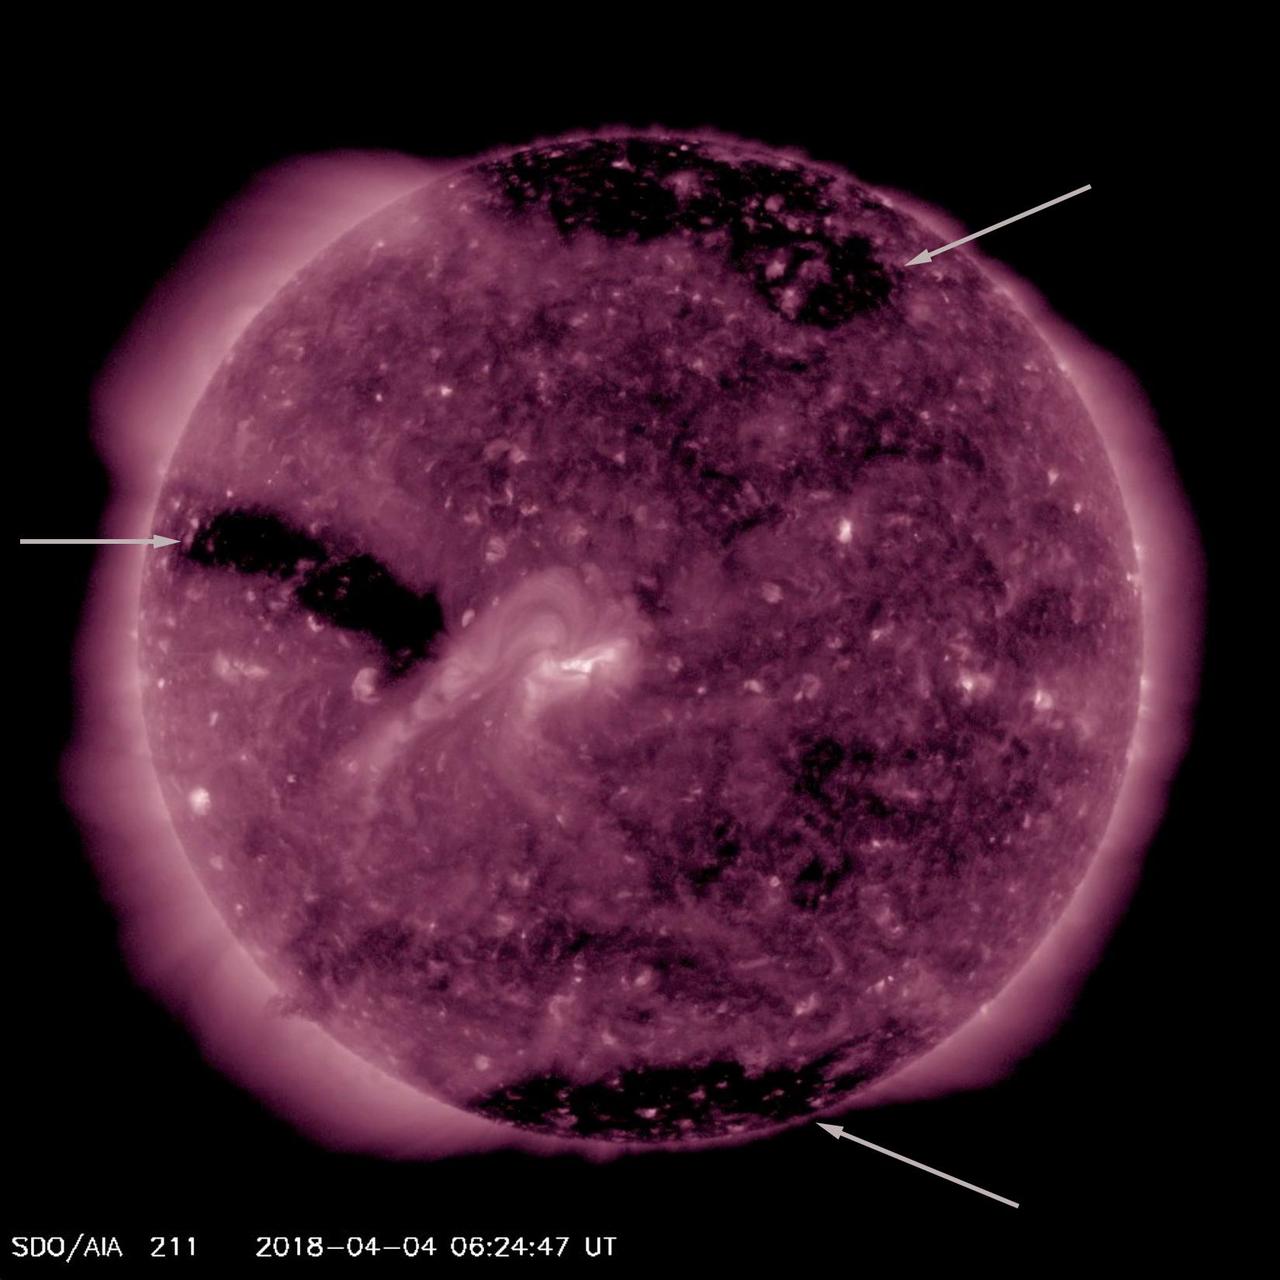
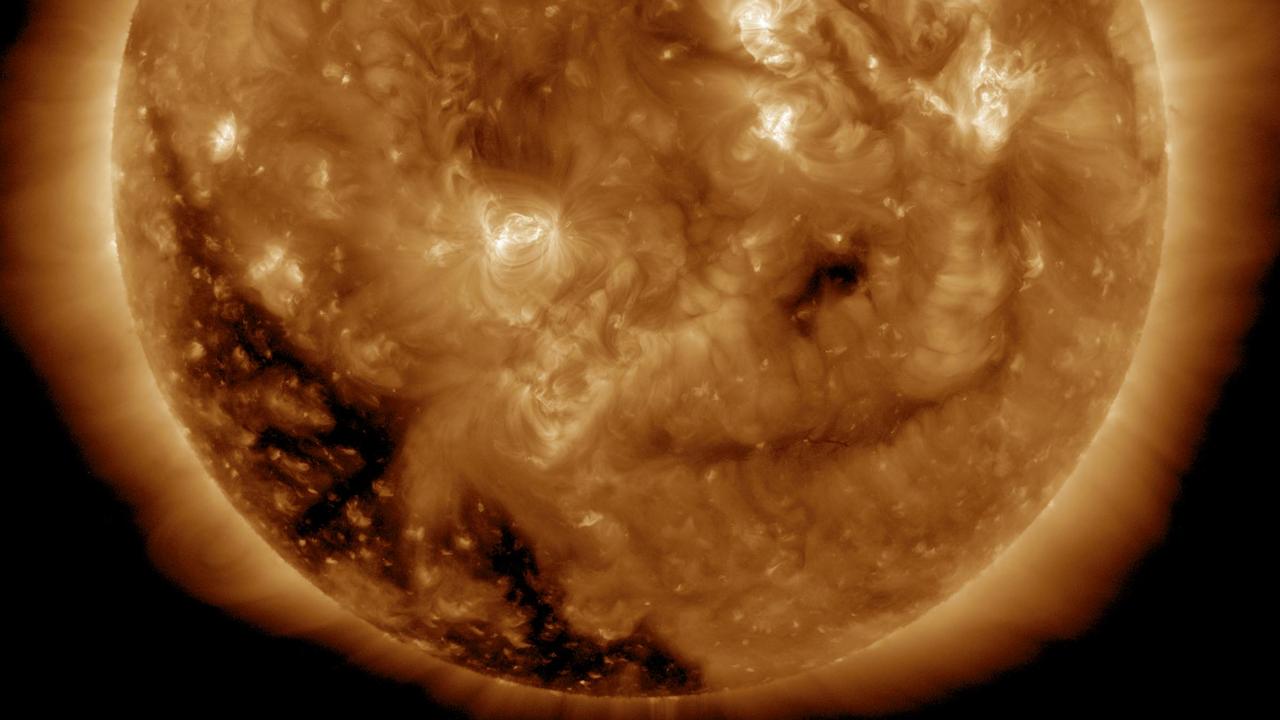
For much of this week the sun featured three substantial coronal holes (Apr. 3-6, 2018). Coronal holes appear as large dark areas which are identified with arrows in the still image. These are areas of open magnetic field from which high speed solar wind rushes out into space. This wind, if it interacts with Earth's magnetosphere, can cause aurora to appear near the poles. They are not at all uncommon. Animations are available at https://photojournal.jpl.nasa.gov/catalog/PIA22414
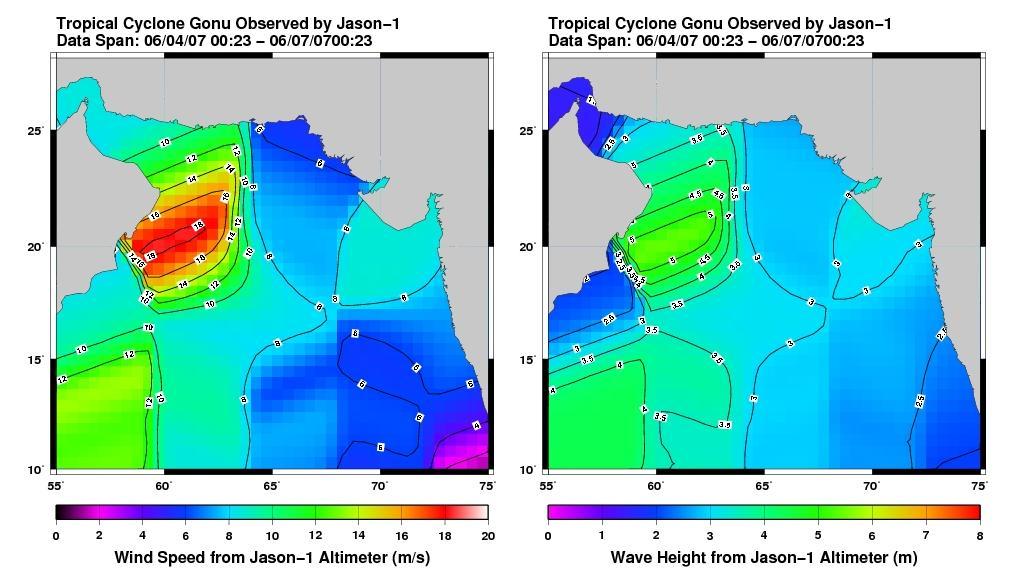
This pair of images from the radar altimeter instrument on NASA U.S./France Jason mission reveals information on wind speeds and wave heights of Tropical Cyclone Gonu, which reached Category 5 strength in the Arabian Sea prior to landfall in early June.
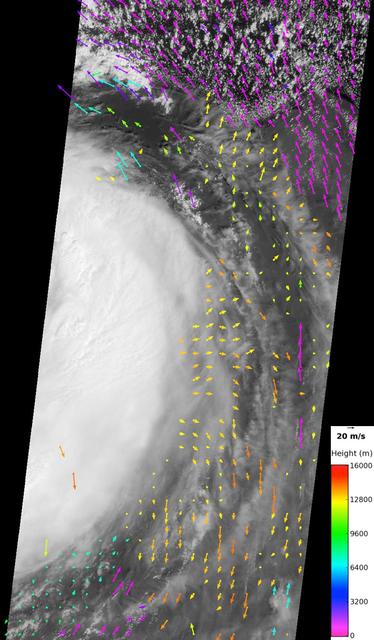
NASA Terra spacecraft recorded low-level wind speeds of up to 75 miles per hour 65 knots from cloud motion observed outside Tropical Storm Isaac eye. The spacecraft flew over Isaac a few hours before Isaac was upgraded to a Category 1 hurricane.
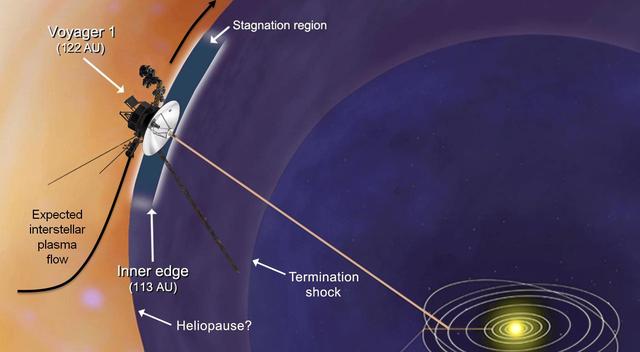
This artist concept shows plasma flows around NASA Voyager 1 spacecraft as it approaches interstellar space. Voyager 1 low-energy charged particle instrument detects the speed of the wind of plasma, or hot ionized gas, streaming off the sun.
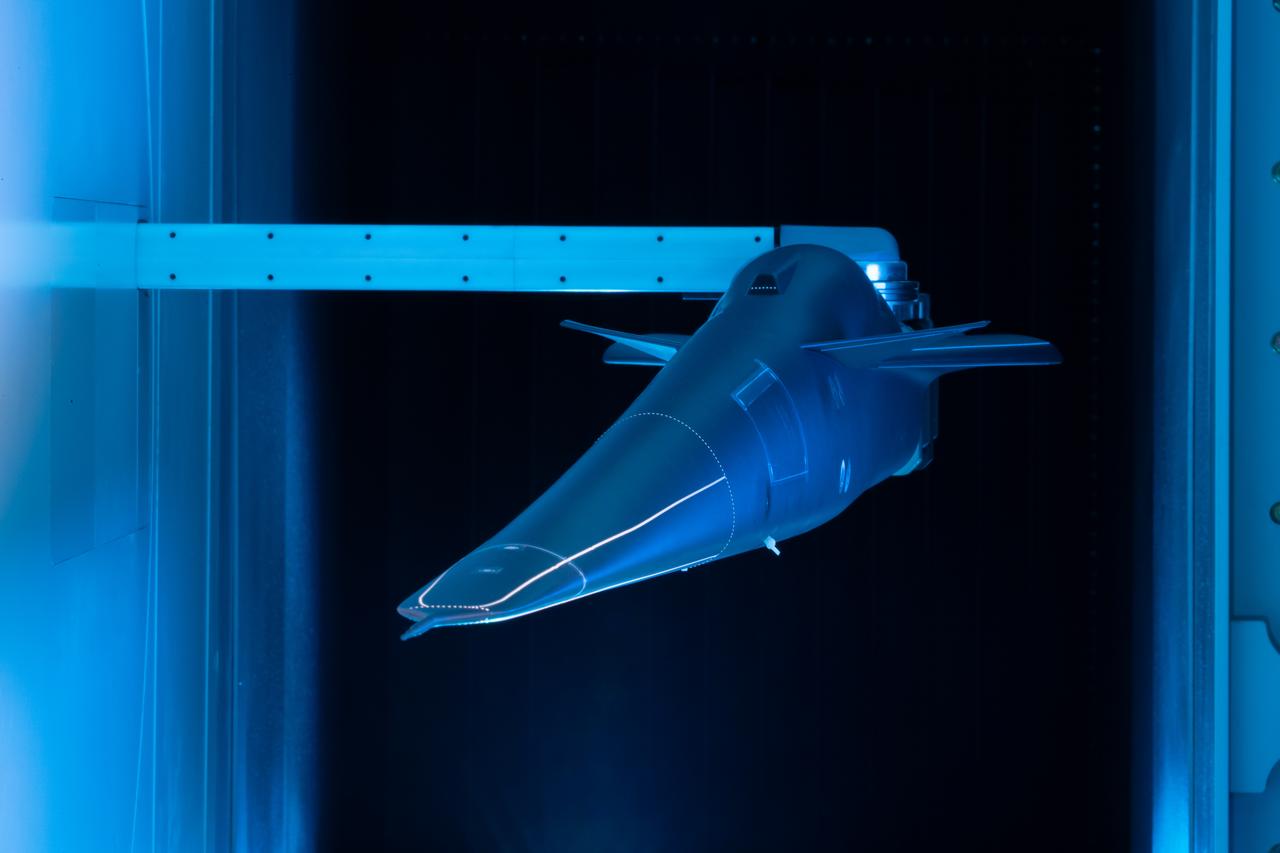
Event: Forebody and Nose - Windtunnel Testing A model of the X-59 forebody is shown in the Lockheed Martin Skunk Works’ wind tunnel in Palmdale, California. These tests gave the team measurements of wind flow angle around the aircraft’s nose and confirmed computer predictions made using computational fluid dynamics (CFD) software tools. The data will be fed into the aircraft flight control system to tell the pilot the aircraft’s altitude, speed and angle. This is part of NASA’s Quesst mission which plans to help enable supersonic air travel over land.
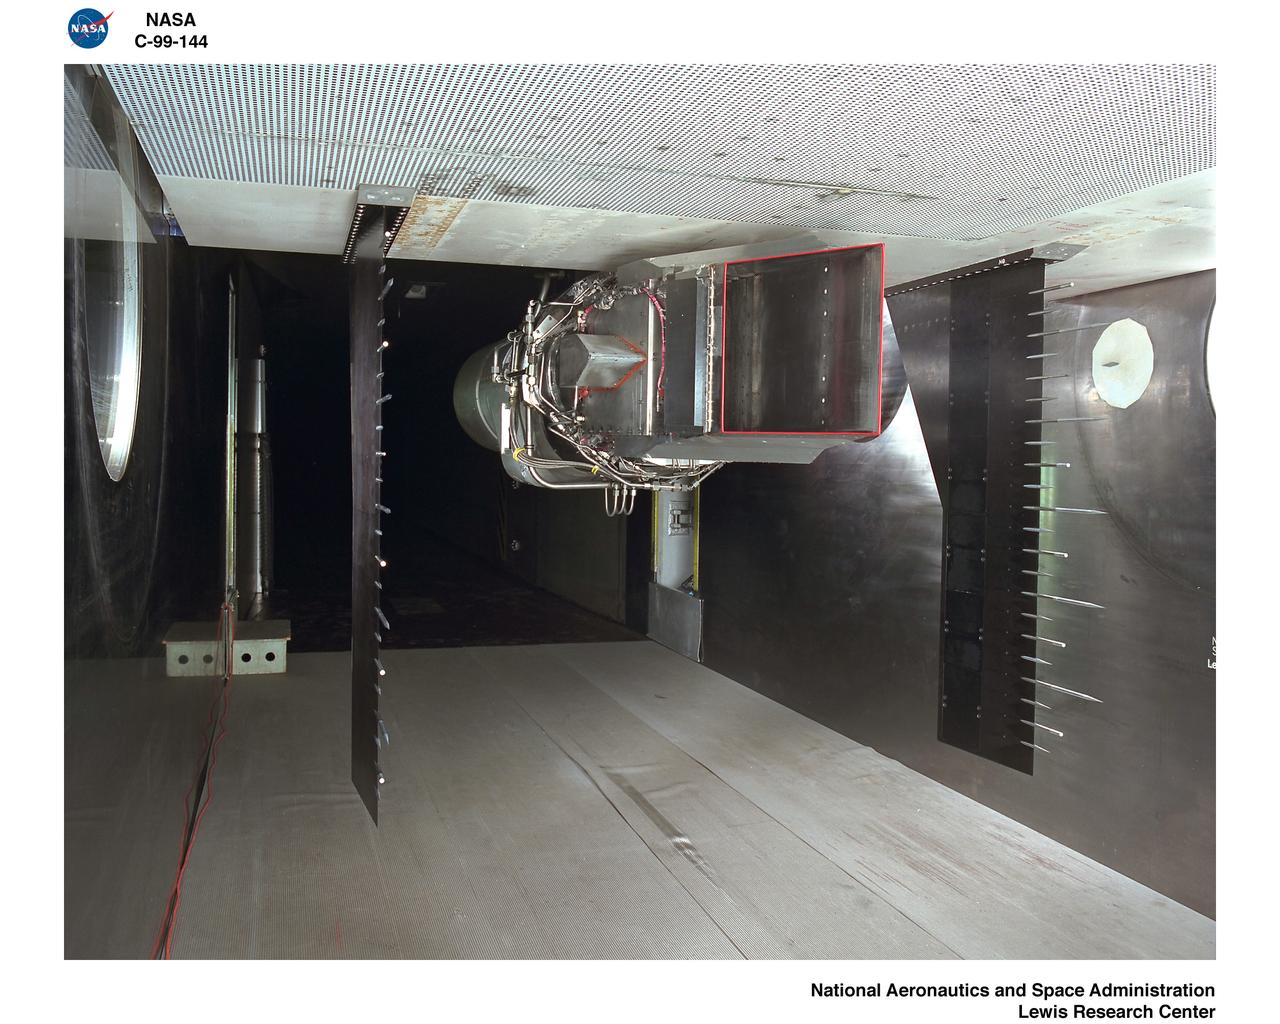
Supersonic Short Take Off Vertical Landing Hot Gas Ingestion Model Testing in the 9x15-foot Low Speed Wind Tunnel, LSWT
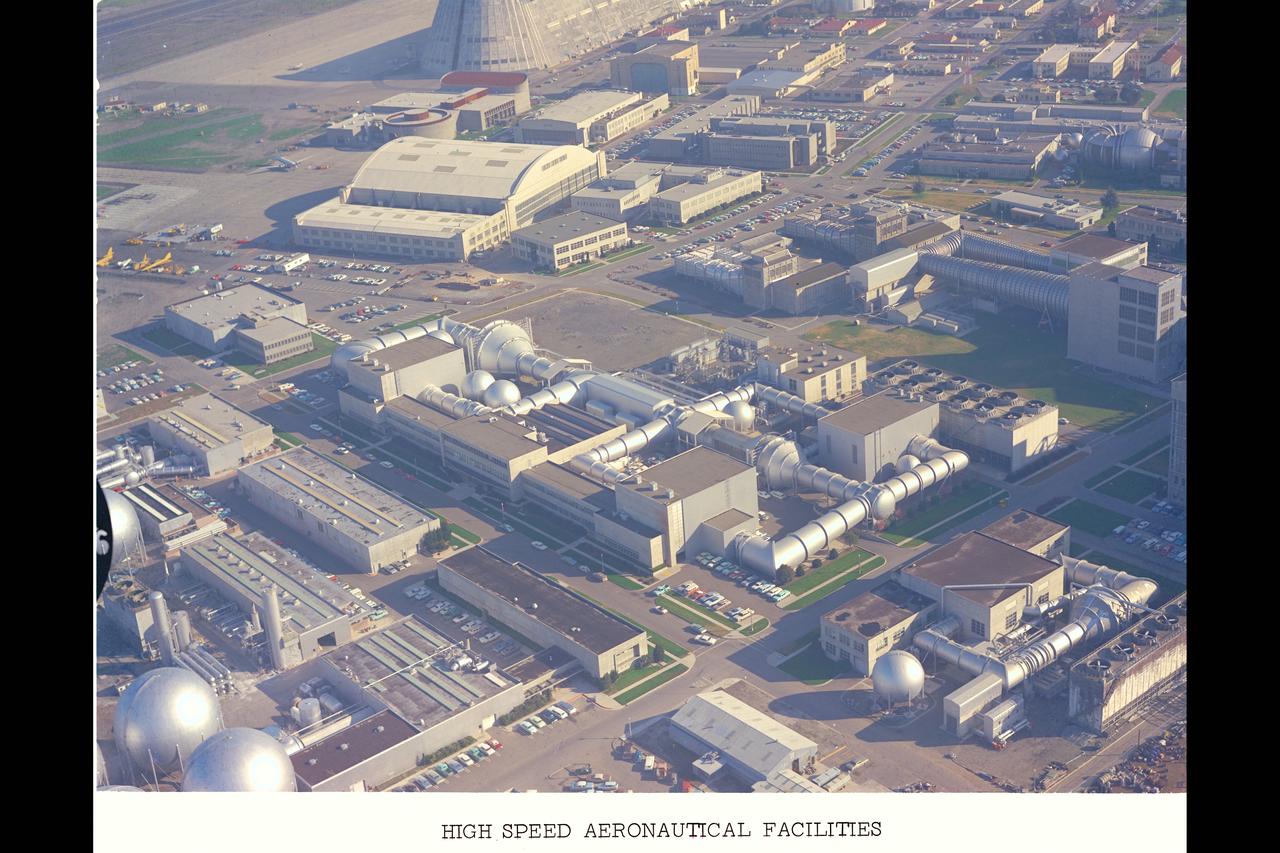
Aerial Survey of Ames Research Center centered on the Unitary Plan Wind Tunnel Complex and High Speed Aerodynamic Facilities (used in Bicentennial)
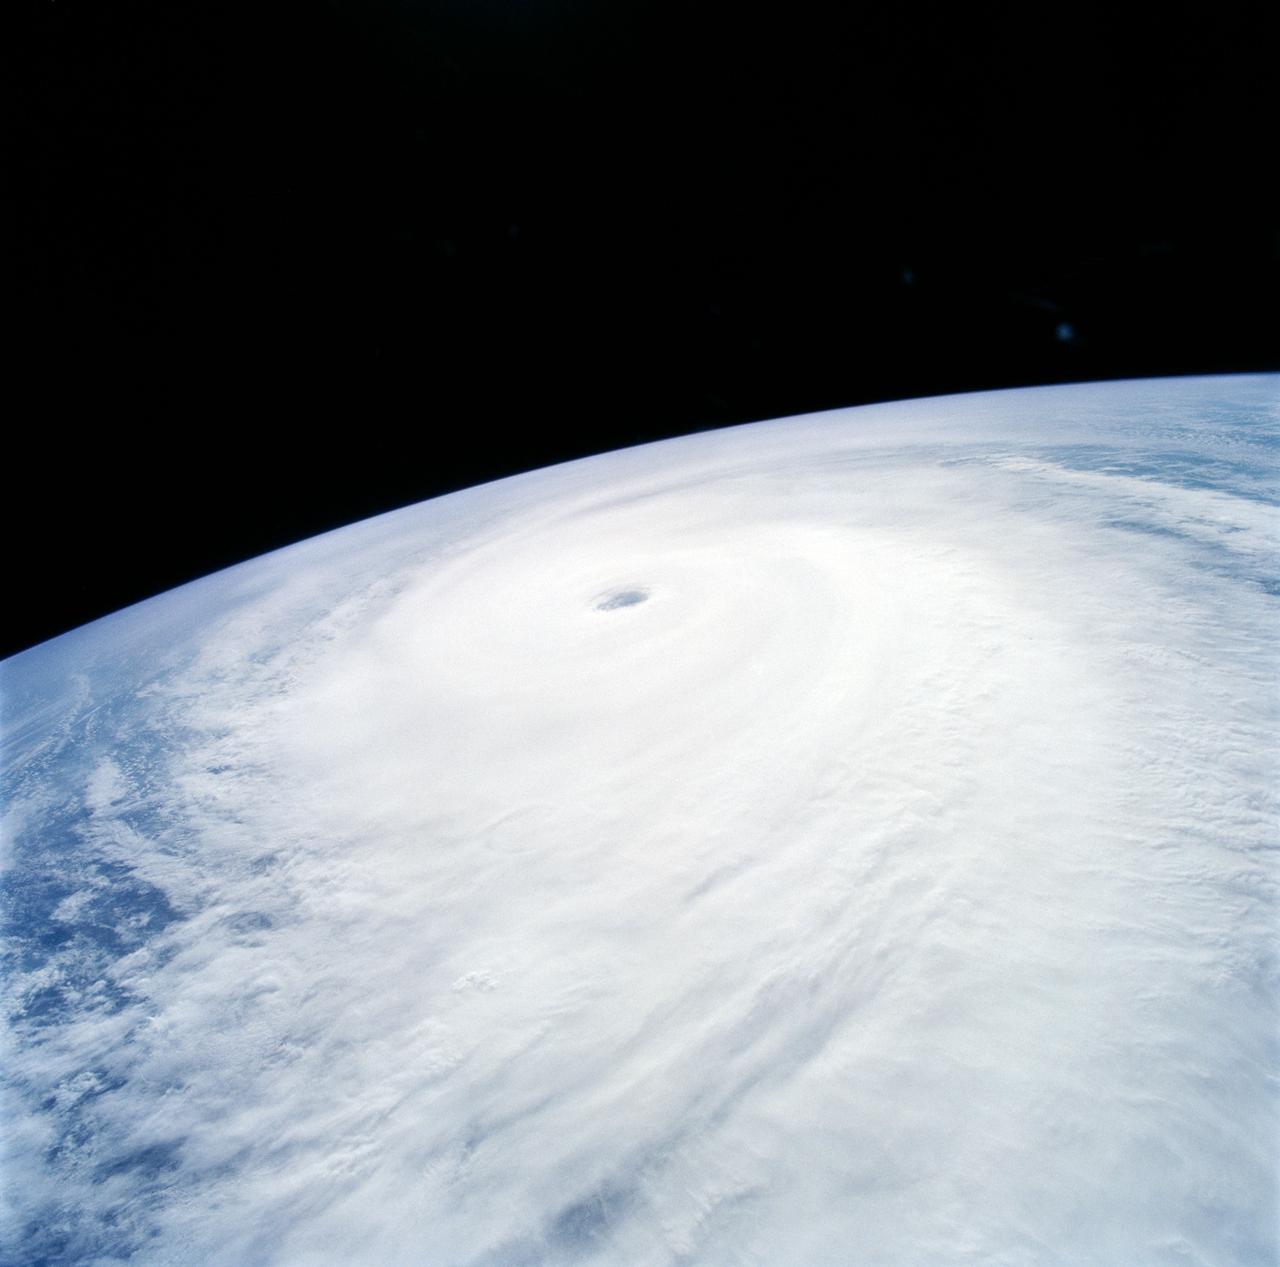
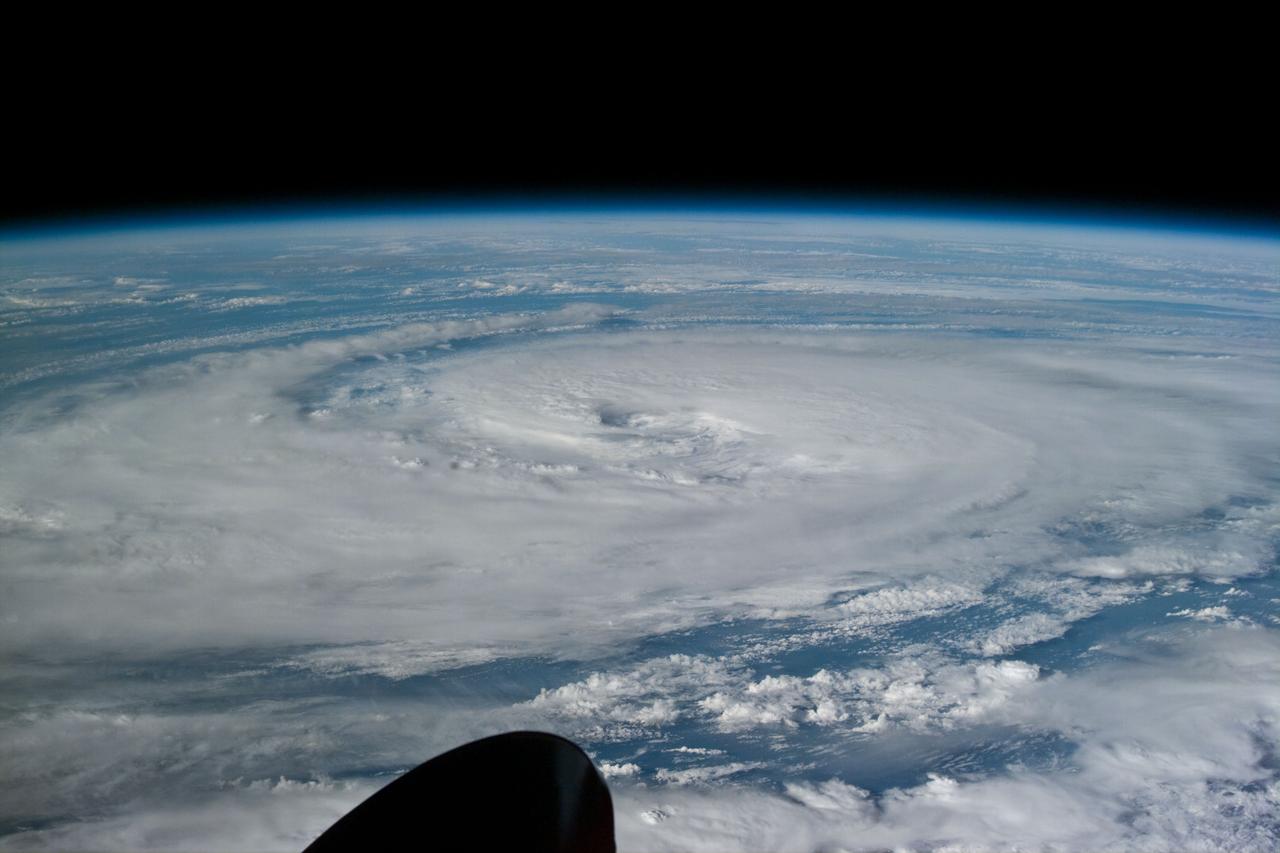
Supertyphoon Yuri began development approximately 1000 miles east of the Philippine Islands. At the time this photo was taken, Yuri was about 1000 nautical miles in diameter and had estimated maximum sustained wind speeds of 145 mph, gusting to 170 mph. This oblique view shows the well formed eye of Yuri and the raised segment of clouds at the cusp of the eye indicating very high wind speeds within the vortex.
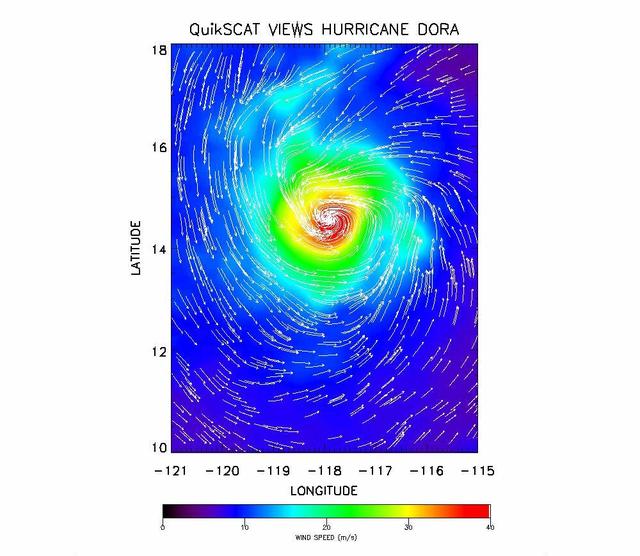
The SeaWinds instrument onboard NASA new QuikScat ocean-viewing satellite captured this image of Hurricane Dora in the eastern tropical Pacific Ocean on August 10, as it was blowing at speeds of nearly 40 meters per second 90 miles per hour.
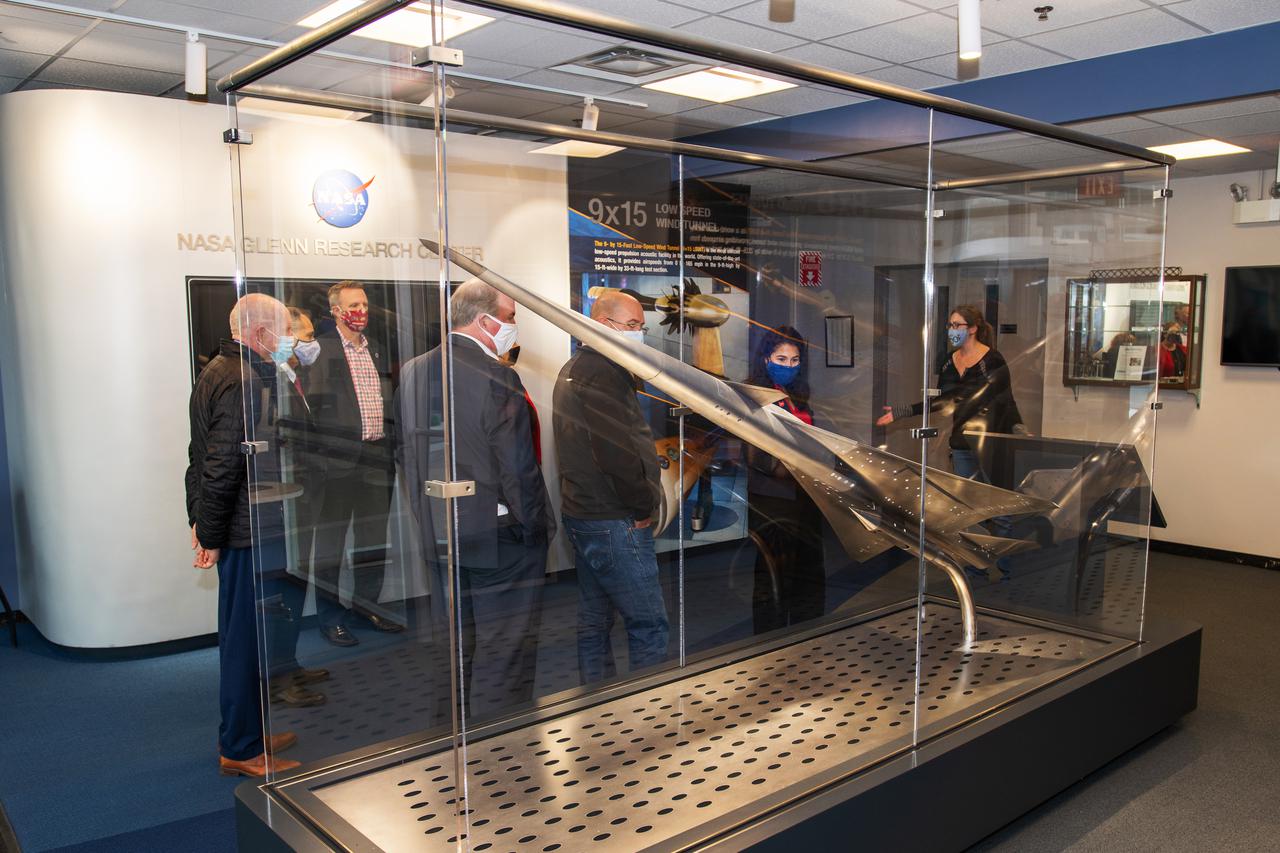
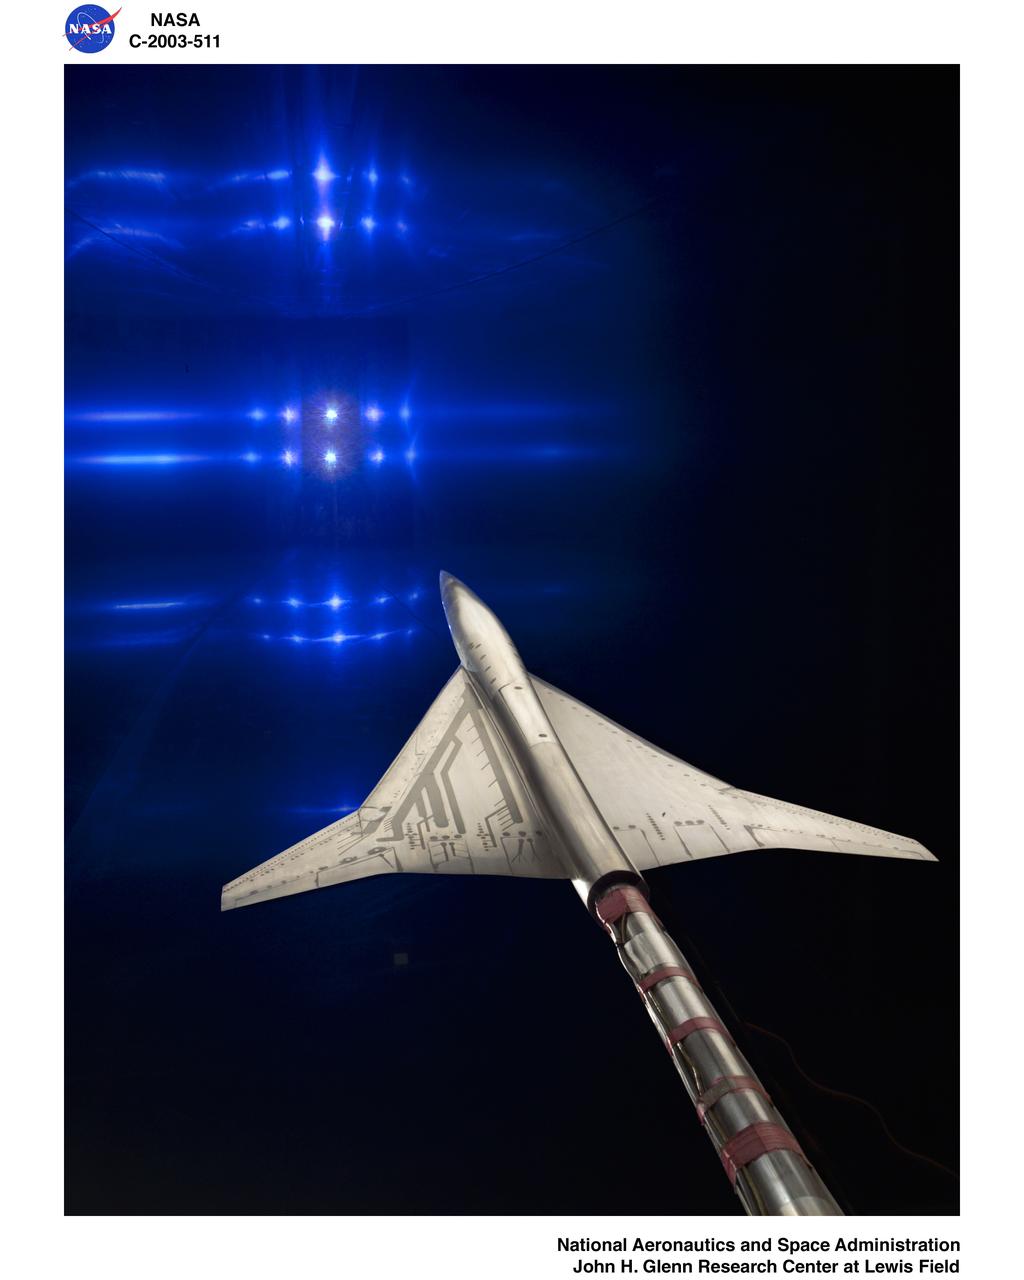
Tour of the Glenn Research Center’s 8x6 Supersonic wind tunnel and the 9x15 Low Speed wind tunnels by senior management. The tour group is the Dayton Development Coalition representing JobsOhio. Photo was taken in the lobby of building 54 with the display of the QueSST (Quiet, Efficient SuperSonic Transport) model in the foreground.
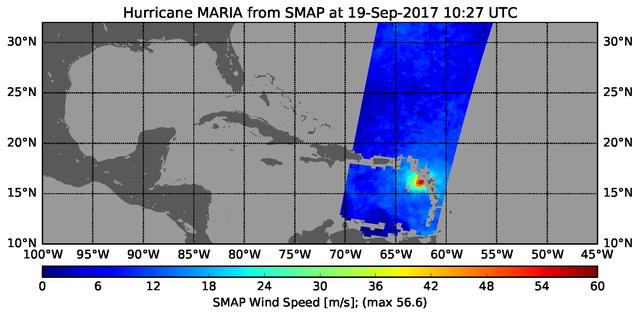
The radiometer instrument on NASA's Soil Moisture Active Passive (SMAP) spacecraft captured this image of Hurricane Maria at 6:27 a.m. EDT on Sept. 19, 2017 (10:27 UTC), showing an estimated maximum surface wind speed of 126.6 miles per hour (56.6 meters per second). While Maria was already a Category 5 hurricane at the time of this observation, it is an extremely tightly organized hurricane and SMAP cannot fully resolve its highest winds due to the 25-mile (40-kilometer) resolution of SMAP. https://photojournal.jpl.nasa.gov/catalog/PIA21960
NASA Glenn/NASA Langley, Loads Comparison Test With 6 Component Force/Moment Balance and 1.7% High Speed Research, HSR Model 5. In the Glenn Research Center 10x10 Foot Supersonic Wind Tunnel, SWT
Mechanical technician Dan Pitts prepares a scale model of Lockheed Martin's Quiet Supersonic Technology (QueSST) X-plane preliminary design for its first high-speed wind tunnel tests at NASA's Glenn Research Center.
LSAWT\Twin Jet Test with HWB Model\JEDA Measurements Low Speed Aeroacoustic Wind Tunnel\Twin Jet Model System \Hybrid Wing Model Installed\ Measurement Technique: Jet Directional Array (JEDA)
3/4 front view of model with flaps up. V/STOL Aircraft: Wind tunnel investigation of rotating cylinder applied to training edge flaps for high lift & low-speed control.
NASA GLENN/NASA LANGLEY LOADS COMPARISON TEST WITH 6 COMPONENT FORCE/MOMENT BALANCE AND 1.7% HIGH SPEED RESEARCH MODEL 5. in the 10x10 super sonic wind tunnel
NASA GLENN/NASA LANGLEY LOADS COMPARISON TEST WITH 6 COMPONENT FORCE/MOMENT BALANCE AND 1.7% HIGH SPEED RESEARCH MODEL 5.l in the 10x10 supersonic wind tunnel
3/4 rear view of model with flaps down. V/STOL Aircraft: Wind tunnel investigation of rotating cylinder applied to training edge flaps for high lift & low-speed control.
40x80x120 Foot Wind Tunnel at NASA's Ames Research Center Laser Velocimeter (LV) Long Range System. Requesting Organization: Low Speed Aircraft Photographed on May 18, 1983
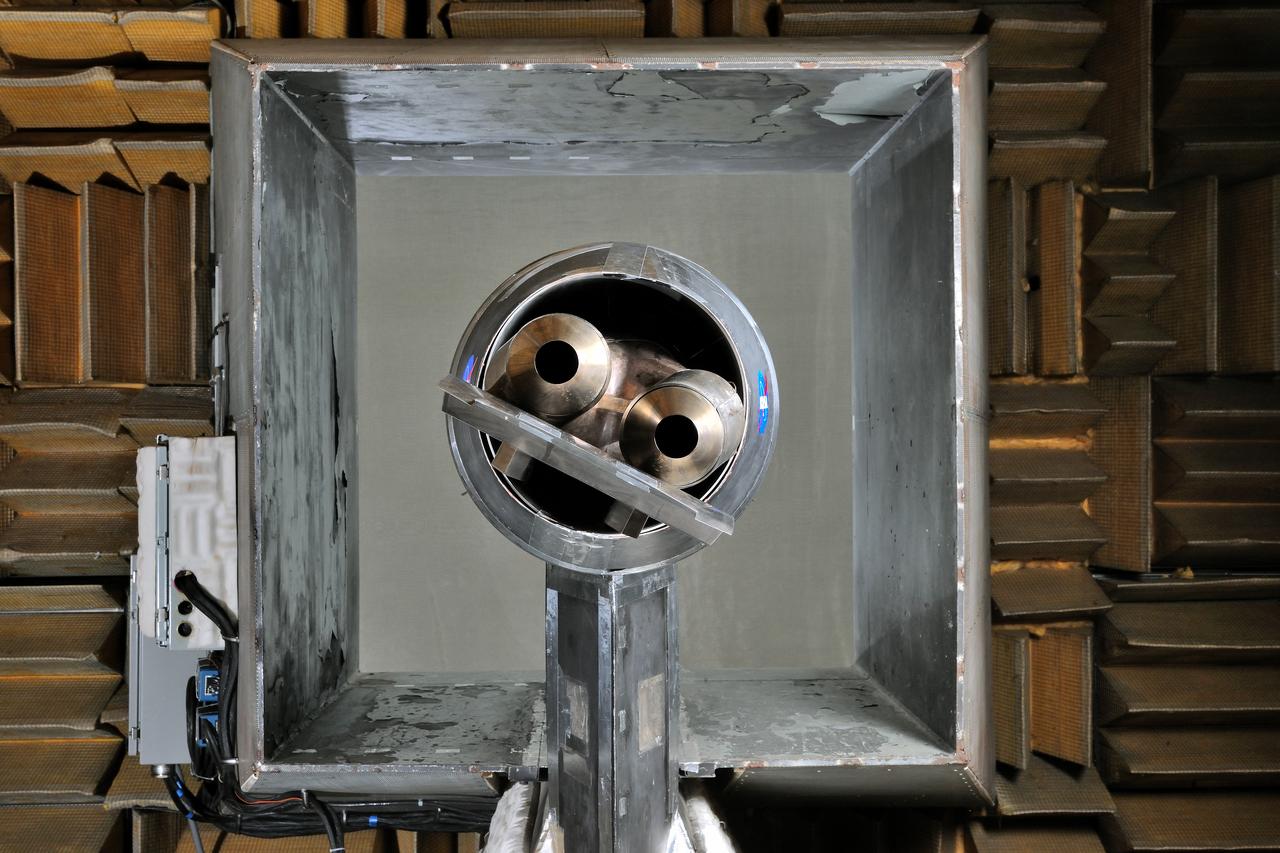
LSAWT\Twin Jet Test with HWB Model\JEDA Measurements Low Speed Aeroacoustic Wind Tunnel\Twin Jet Model System \Hybrid Wing Model Installed\ Measurement Technique: Jet Directional Array (JEDA)
LSAWT\Twin Jet Test with HWB Model\JEDA Measurements Low Speed Aeroacoustic Wind Tunnel\Twin Jet Model System \Hybrid Wing Model Installed\ Measurement Technique: Jet Directional Array (JEDA)

3/4 rear view of model with flaps down with Cecil E. MacDonald. V/STOL Aircraft: Wind tunnel investigation of rotating cylinder applied to training edge flaps for high lift & low-speed control.
On Sept. 5, 2019 at about noon EDT, the Multi-angle Imaging SpectroRadiometer (MISR) instrument aboard NASA's Terra satellite passed over the eye of Hurricane Dorian as the storm tracked northeast along the Atlantic coast, about 50 miles from Charleston, South Carolina. During this time, Dorian was weakening from Category 3 to Category 2 following a second period of intensification. MISR carries nine cameras fixed at different angles, each of which viewed Dorian over a period of about seven minutes. The multi-camera views are used to calculate the heights of the cloud tops, and the motion of the clouds between the views provides information on wind speed and direction. The left side of the image shows the view from the downward-pointing (nadir) camera, with wind velocity vectors superimposed over it. The derived cloud-top heights are shown at the right, along with the color scale. The length of the wind arrows is proportional to wind speed and their colors show the altitude of the cloud tops in kilometers. MISR observed cyclonic (counterclockwise) wind speeds up to 35 meters per second (78 miles per hour) at altitudes of 3-4 kilometers (1.9 to 2.5 miles), consistent with maximal wind gusts reported by the National Hurricane Center based on data from local weather stations and buoys. At higher altitudes of 11-12 kms (6.8-7.5 miles), MISR observed anti-cyclonic (clockwise) wind speeds up to 55 meters per second (123 mph). The eye, spiral rainbands, and reversal of wind direction between low and high altitudes are typical features of a hurricane's anatomy. https://photojournal.jpl.nasa.gov/catalog/PIA23423
An engineer at the Marshall Space Flight Center (MSFC) observes a model of the Space Shuttle Orbiter being tested in the MSFC's 14x14-Inch Trisonic Wind Tunnel. The 14-Inch Wind Tunnel is a trisonic wind tunnel. This means it is capable of running subsonic, below the speed of sound; transonic, at or near the speed of sound (Mach 1,760 miles per hour at sea level); or supersonic, greater than Mach 1 up to Mach 5. It is an intermittent blowdown tunnel that operates by high pressure air flowing from storage to either vacuum or atmospheric conditions. The MSFC 14x14-Inch Trisonic Wind Tunnel has been an integral part of the development of the United States space program Rocket and launch vehicles from the Jupiter-C in 1958, through the Saturn family up to the current Space Shuttle and beyond have been tested in this Wind Tunnel. MSFC's 14x14-Inch Trisonic Wind Tunnel, as with most other wind tunnels, is named after the size of the test section. The 14-Inch Wind Tunnel, as in the past, will continue to play a large but unseen role in the development of America's space program.
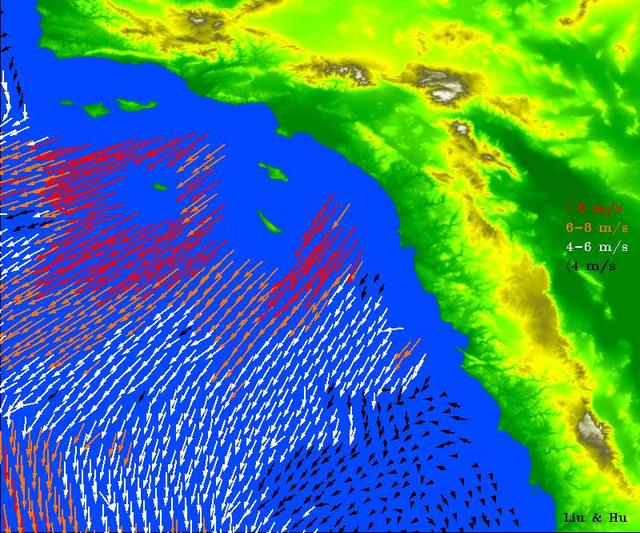
High-resolution ocean surface wind data from NASA's Quick Scatterometer (QuikScat) illustrate the strength of Santa Ana winds that pounded Southern California this week, causing damage and spreading brush fires. The colored arrows represent various ranges of wind speed, which were still well in excess of 30 knots (34 miles per hour), even after reaching the ocean and weakening. Santa Ana winds are offshore and down-slope winds unique to Southern California that are usually channeled through mountain gaps. These Santa Ana winds extend more than 500 kilometers (310 miles) offshore before changing direction to flow along the shore. The wind speeds and directions are retrieved from range-compressed backscatter data measured by QuikScat that has much higher spatial resolution than QuikScat's standard data products. Useful applications of high-resolution science-quality wind products derived from range-compressed backscatter have been demonstrated in two scientific papers: one on Hurricane Floyd and the other on Catalina Eddies. This is the first demonstration on near-real-time retrieval applications. http://photojournal.jpl.nasa.gov/catalog/PIA03892
This photograph shows an overall view of the Marshall Space Flight Center's (MSFC's) 14x14-Inch Trisonic Wind Tunnel. The 14-Inch Wind Tunnel is a trisonic wind tunnel. This means it is capable of running subsonic, below the speed of sound; transonic, at or near the speed of sound (Mach 1, 760 miles per hour at sea level); or supersonic, greater than Mach 1 up to Mach 5. It is an intermittent blowdown tunnel that operates by high pressure air flowing from storage to either vacuum or atmospheric conditions. The MSFC 14x14-Inch Trisonic Wind Tunnel has been an integral part of the development of the United States space program Rocket and launch vehicles from the Jupiter-C in 1958, through the Saturn family up to the current Space Shuttle and beyond have been tested in this Wind Tunnel. MSFC's 14x14-Inch Trisonic Wind Tunnel, as with most other wind tunnels, is named after the size of the test section. The 14-Inch Wind Tunnel, as in the past, will continue to play a large but unseen role in the development of America's space program.
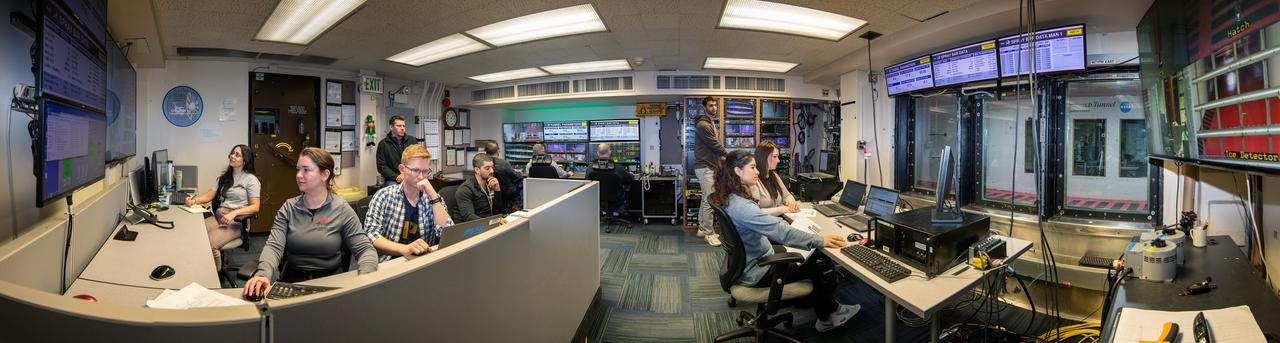
Panorama of the IRT engineering and ice cloud calibration team in the control room. Shown on the left are the data and system engineers. In the center with their backs to the camera are the wind tunnel operators who control the wind speed and super cooled water flow. In the center right of the photo is the video recording system and the test engineers. On the right side the test section can be see though the wind and the TV screen shows the pray bars that create the icing cloud.
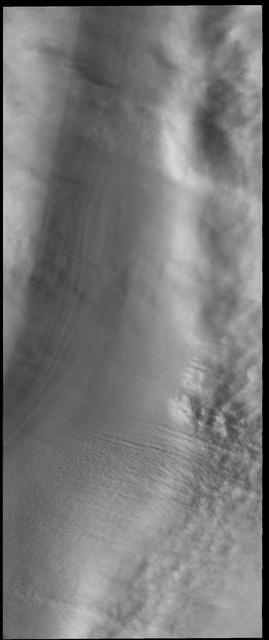
This VIS image shows 'streamers' of clouds created by katabatic winds at the north polar cap. Katabatic winds are created by cold air sinking at the pole and then speeding along the ice surface towards the edge of the polar cap. When the winds enter troughs the wind regime changes from laminar flow to choatic and clouds of ice particles and/or dust are visible. This wind activity peaks at the start of northern hemisphere summer. Orbit Number: 53942 Latitude: 86.8433 Longitude: 99.3149 Instrument: VIS Captured: 2014-02-10 10:50 https://photojournal.jpl.nasa.gov/catalog/PIA22362
A substantial coronal hole began to rotate into view over the past few days (Dec. 1-2, 2016). Coronal holes are magnetically open areas of the sun's magnetic field structure that spew streams of high speed solar wind into space. In about a week or so that coronal hole might send streams of particles in the direction of Earth. Often times these streams can interact with Earth's magnetosphere and generate aurora. The images were taken in a wavelength of extreme ultraviolet light. Movies are available at http://photojournal.jpl.nasa.gov/catalog/PIA21208
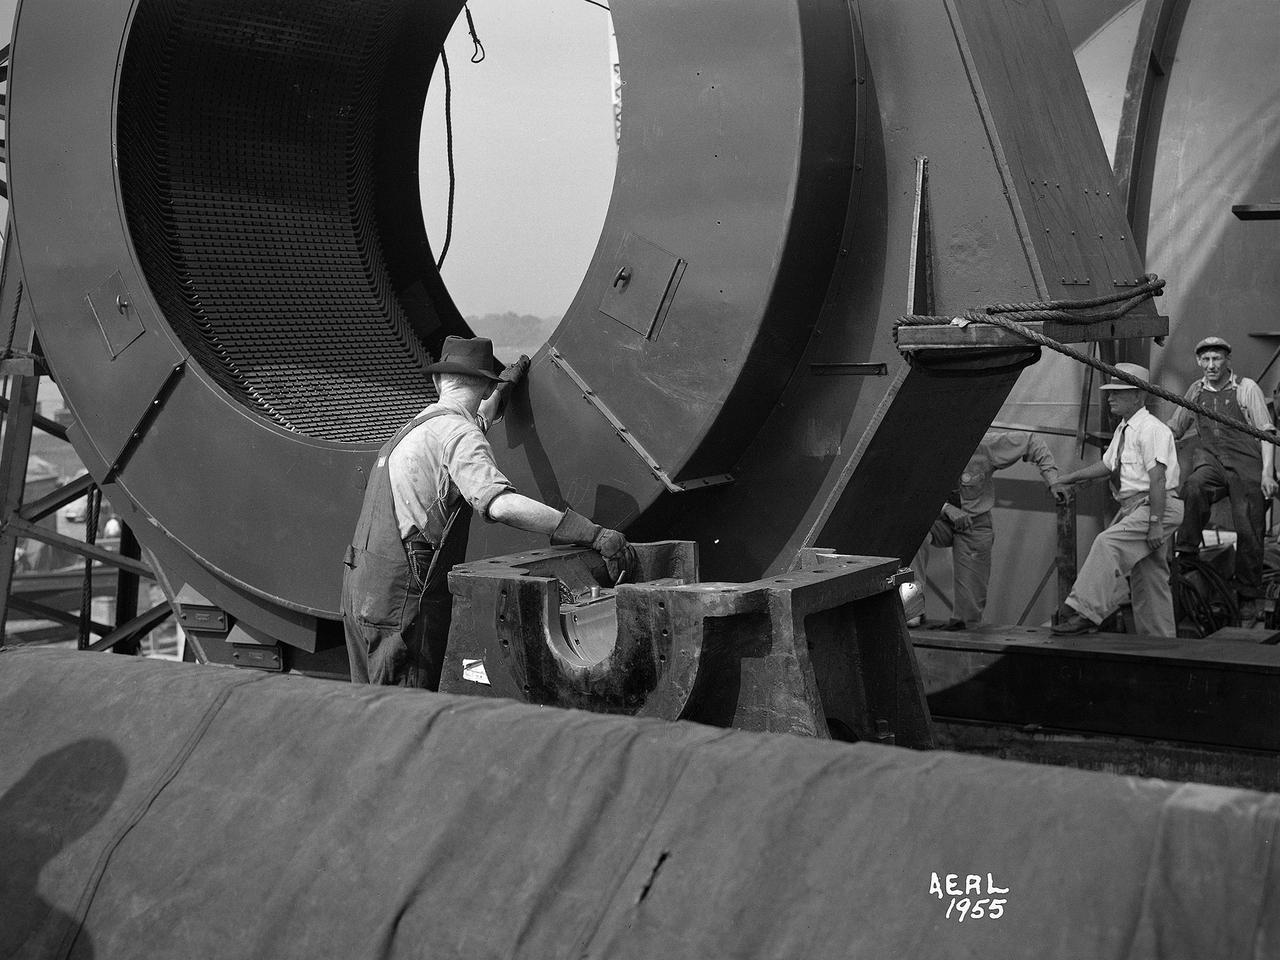
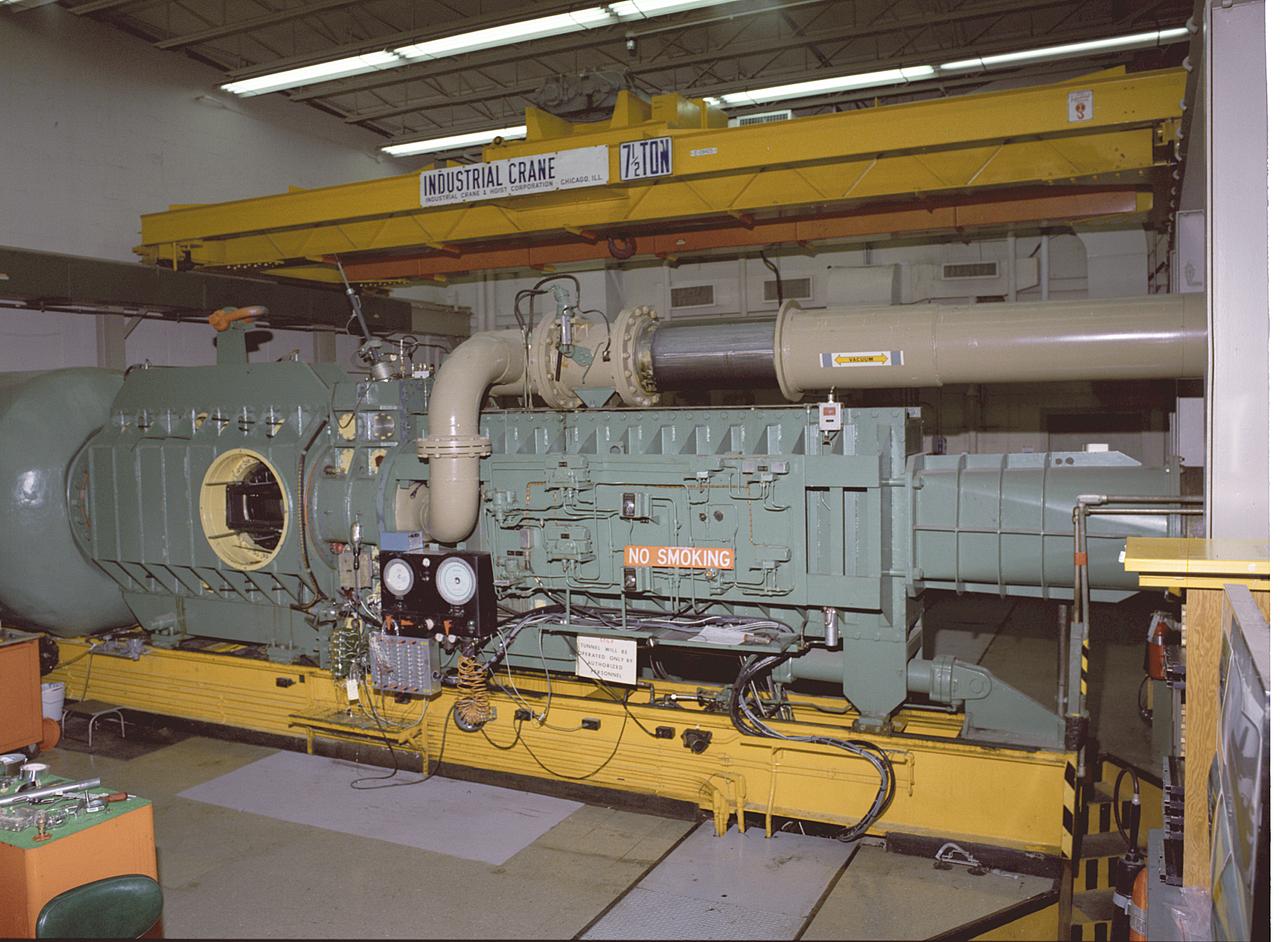
Construction workers install the drive motor for the Altitude Wind Tunnel (AWT) in the Exhauster Building at the National Advisory Committee for Aeronautics (NACA) Aircraft Engine Research Laboratory. The AWT was capable of operating full-scale engines in air density, speed, and temperature similar to that found at high altitudes. The tunnel could produce wind speeds up to 500 miles per hour through a 20-foot-diameter test section at the standard operating altitude of 30,000 feet. The airflow was created by a large wooden fan near the tunnel’s southeast corner. This photograph shows the installation of the 18,000-horsepower drive motor inside the adjoining Exhauster Building in July 1943. The General Electric motor, whose support frame is seen in this photograph, connected to a drive shaft that extended from the building, through the tunnel shell, and into a 12-bladed, 31-foot-diameter spruce wood fan. Flexible couplings on the shaft allowed for the movement of the shell. The corner of the Exhauster Building was built around the motor after its installation. The General Electric induction motor could produce 10 to 410 revolutions per minute and create wind speeds up to 500 miles per hour, or Mach 0.63, at 30,000 feet. The AWT became operational in January 1944 and tested piston, turbojet and ramjet engines for nearly 20 years.
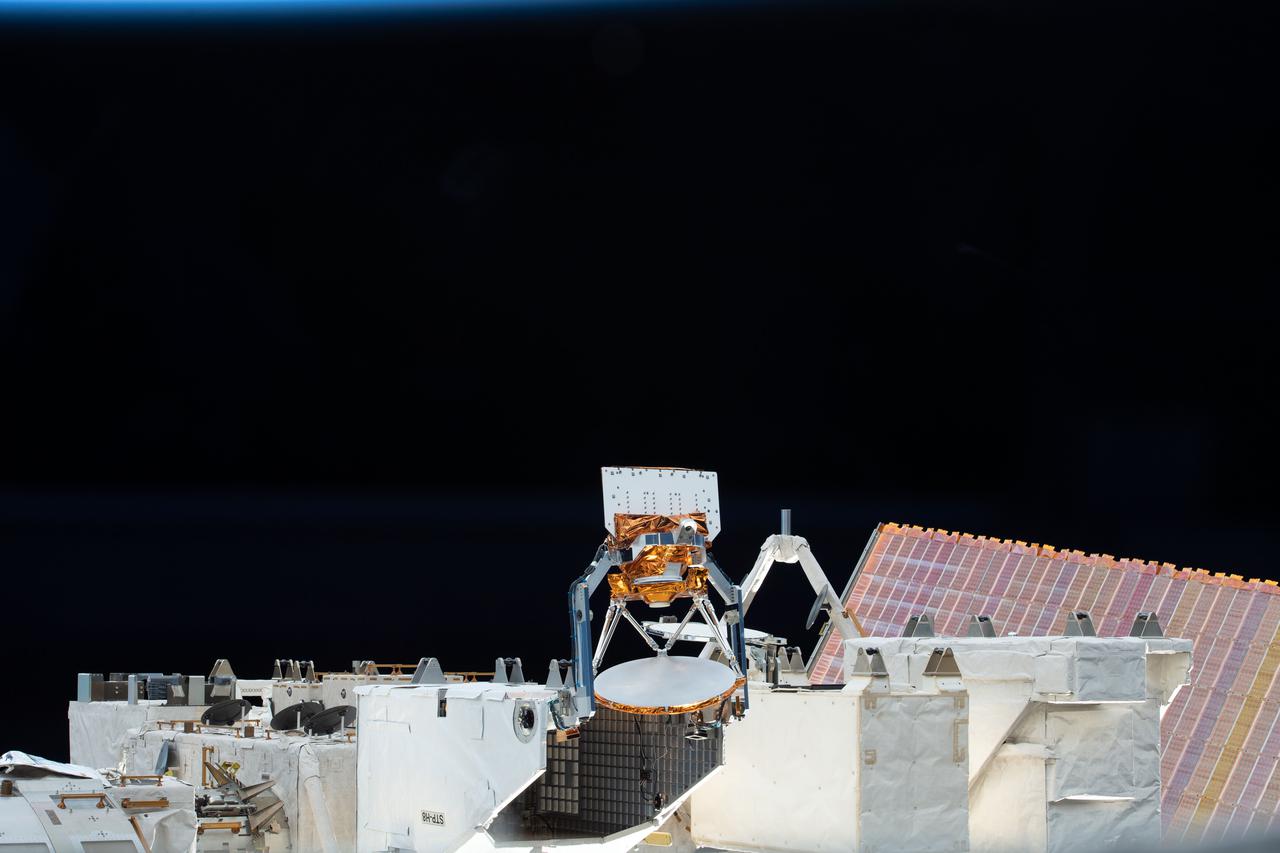
iss066e113950 (1/15/2022) --- A view of the STP-H8-COWVR aboard the International Space Station (ISS). The Space Test Program-Houston 8-Compact Ocean Wind Vector Radiometer (STP-H8-COWVR) demonstrates on-orbit use of a new terrestrial microwave meterological sensor designed to deliver accurate sea surface wind direction and speed data .
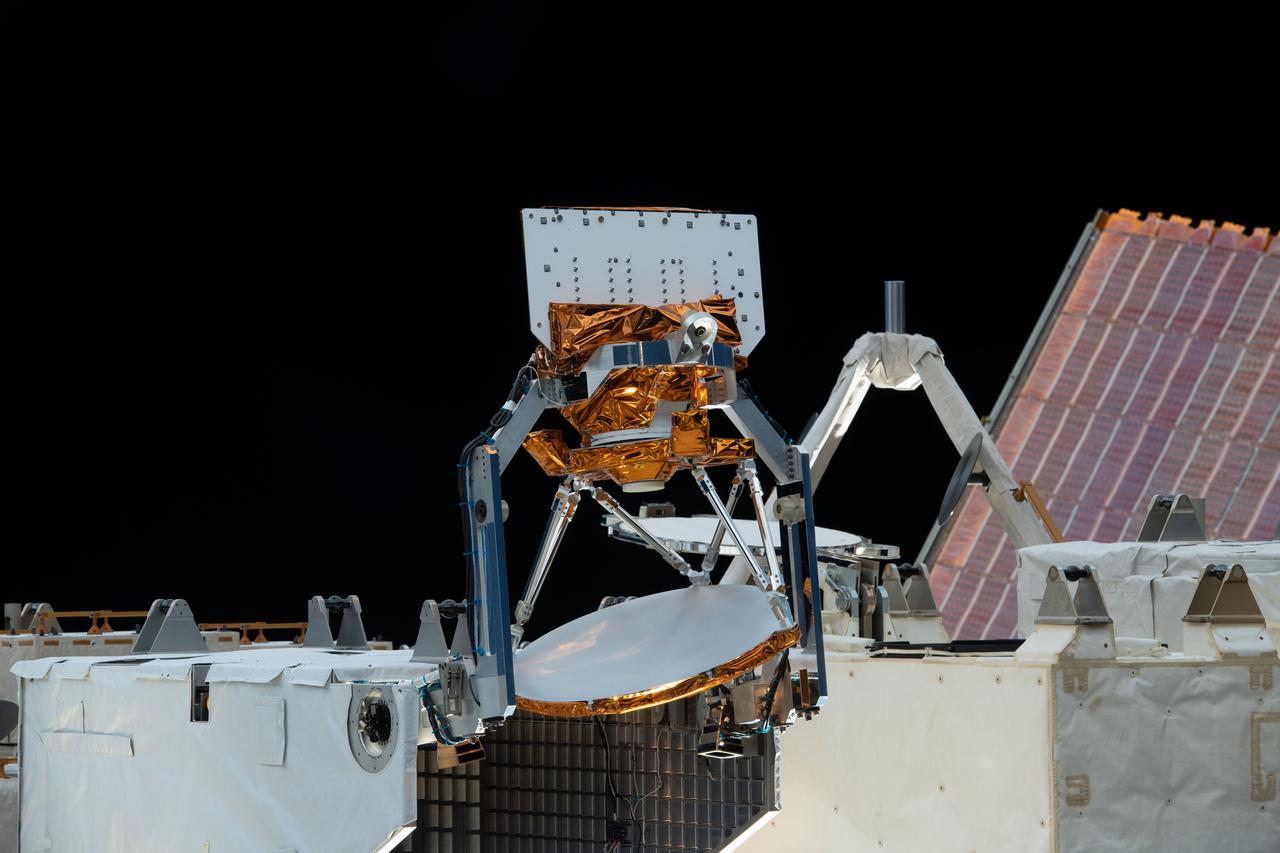
iss066e113944 (1/15/2022) --- A view of the STP-H8-COWVR aboard the International Space Station (ISS). The Space Test Program-Houston 8-Compact Ocean Wind Vector Radiometer (STP-H8-COWVR) demonstrates on-orbit use of a new terrestrial microwave meterological sensor designed to deliver accurate sea surface wind direction and speed data .
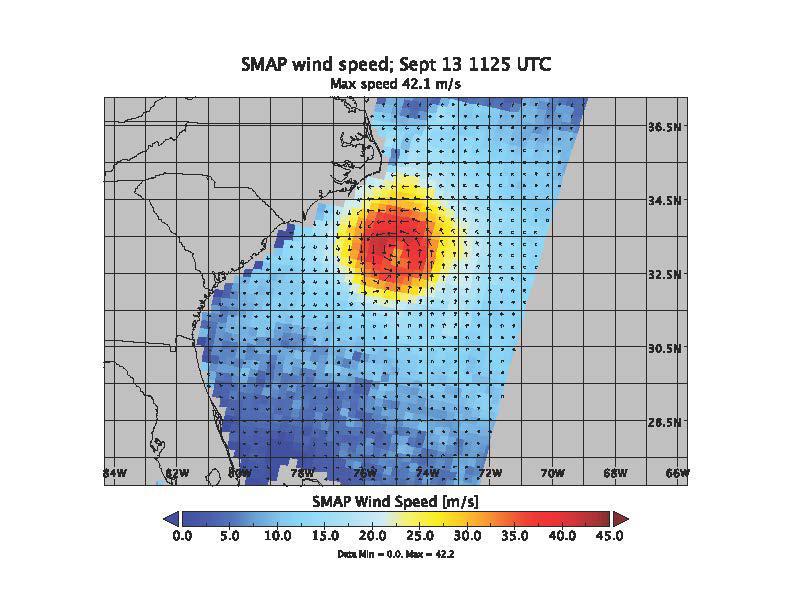
SMAP wind estimates over Hurricane Florence on Sept. 12, 2018 at 10:49 UTC and on Sept. 13, 2018 at 11:25 UTC. We see weakening of the hurricane from the 12th to the 13th; however, the overall size and energy of the storm has increased. The brightness temperatures have been shown to yield unprecedented sensitivity to extreme wind speeds as compared to conventional Ku and C-band scatterometers. https://photojournal.jpl.nasa.gov/catalog/PIA22699
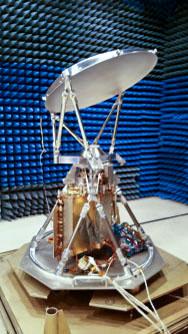
jsc2021e048037 (10/22/2021) --- A preflight view of COWVR during Antenna Range Testing. Space Test Program-Houston 8-Compact Ocean Wind Vector Radiometer (STP-H8-COWVR) demonstrates on-orbit use of a new terrestrial microwave meteorological sensor. It is designed to deliver accurate sea surface wind direction and speed data that are critical to naval surface operations and forecasting and tracking hurricanes and typhoons. Image courtesy of JPL.
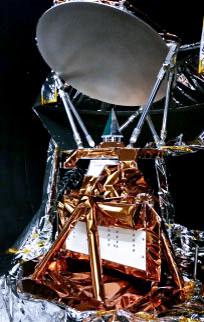
jsc2021e0480388 (10/22/2021) --- A preflight view of COWVR during TVAC Testing. Space Test Program-Houston 8-Compact Ocean Wind Vector Radiometer (STP-H8-COWVR) demonstrates on-orbit use of a new terrestrial microwave meteorological sensor. It is designed to deliver accurate sea surface wind direction and speed data that are critical to naval surface operations and forecasting and tracking hurricanes and typhoons. Image courtesy of JPL.
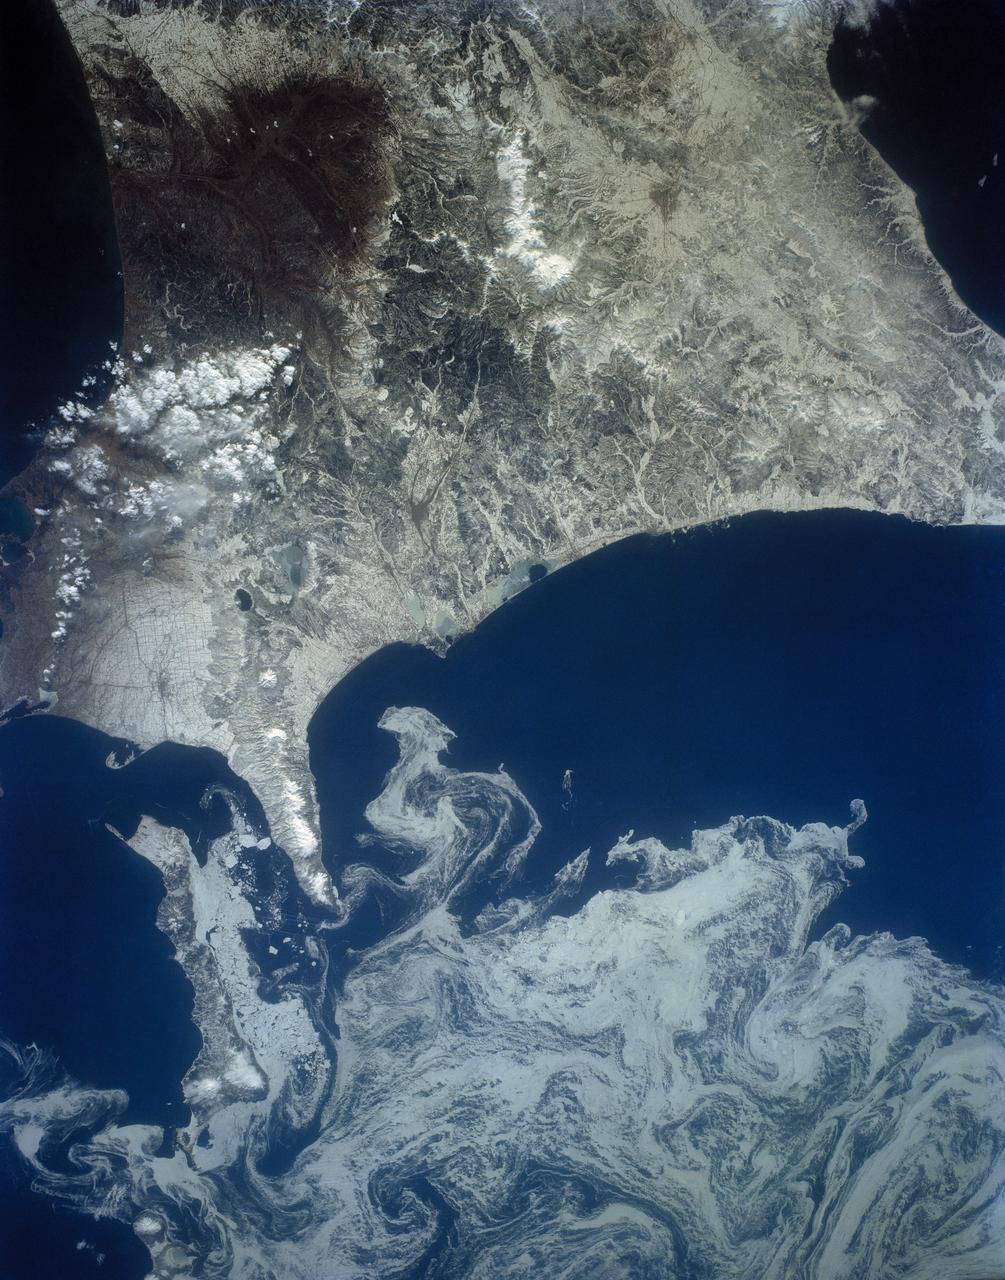
The northeast coast of Hokkaido and Kunashir Island, Japan (44.0N, 143.0E) are seen bordered by drifting sea ice. The sea ice has formed a complex pattern of eddies in response to surface water currents and winds. Photos of this kind aid researchers in describing local ocean current patterns and the effects of wind speed and direction on the drift of surface material, such as ice floes or oil. Kunashir is the southernmost of the Kuril Islands.
NASA's RapidScat's antenna, lower right, was pointed at Hurricane Patricia as the powerful storm approached Mexico on Oct. 23, 2015. Patricia was the strongest hurricane ever recorded in the Western Hemisphere, with maximum winds of 200 mph (320 kilometers per hour). When it first made landfall on the Pacific coast of Mexico on Oct. 23, it was a destructive Category 5 storm. The videos are from the International Space Station. RapidScat's spinning antenna, lower right, collects wind-speed data from Hurricane Patricia. http://photojournal.jpl.nasa.gov/catalog/PIA20049
jsc2021e048036 (10/22/2021) --- A preflight view of COWVR during EMC Testing. Space Test Program-Houston 8-Compact Ocean Wind Vector Radiometer (STP-H8-COWVR) demonstrates on-orbit use of a new terrestrial microwave meteorological sensor. It is designed to deliver accurate sea surface wind direction and speed data that are critical to naval surface operations and forecasting and tracking hurricanes and typhoons. Image courtesy of JPL.
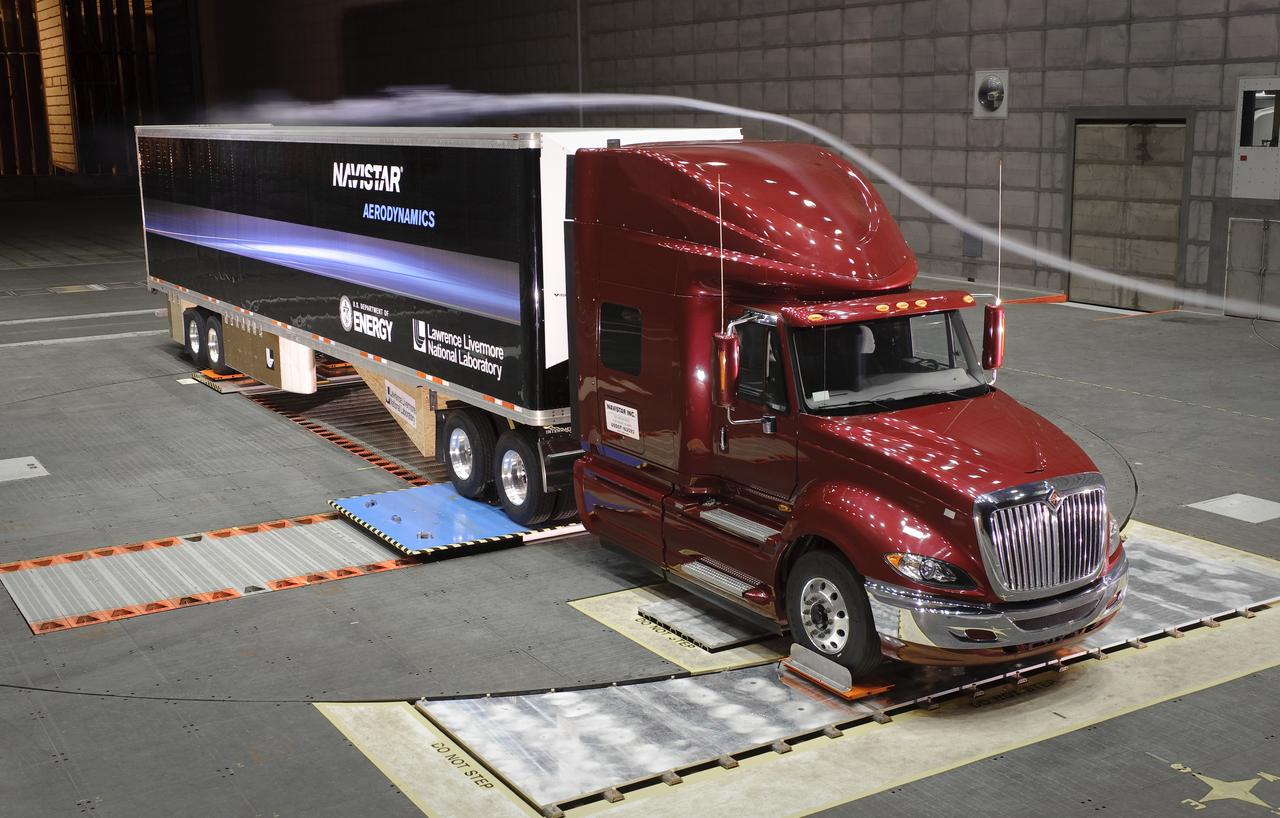
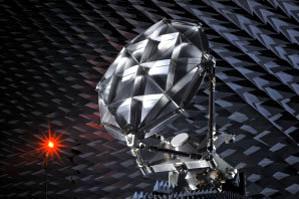
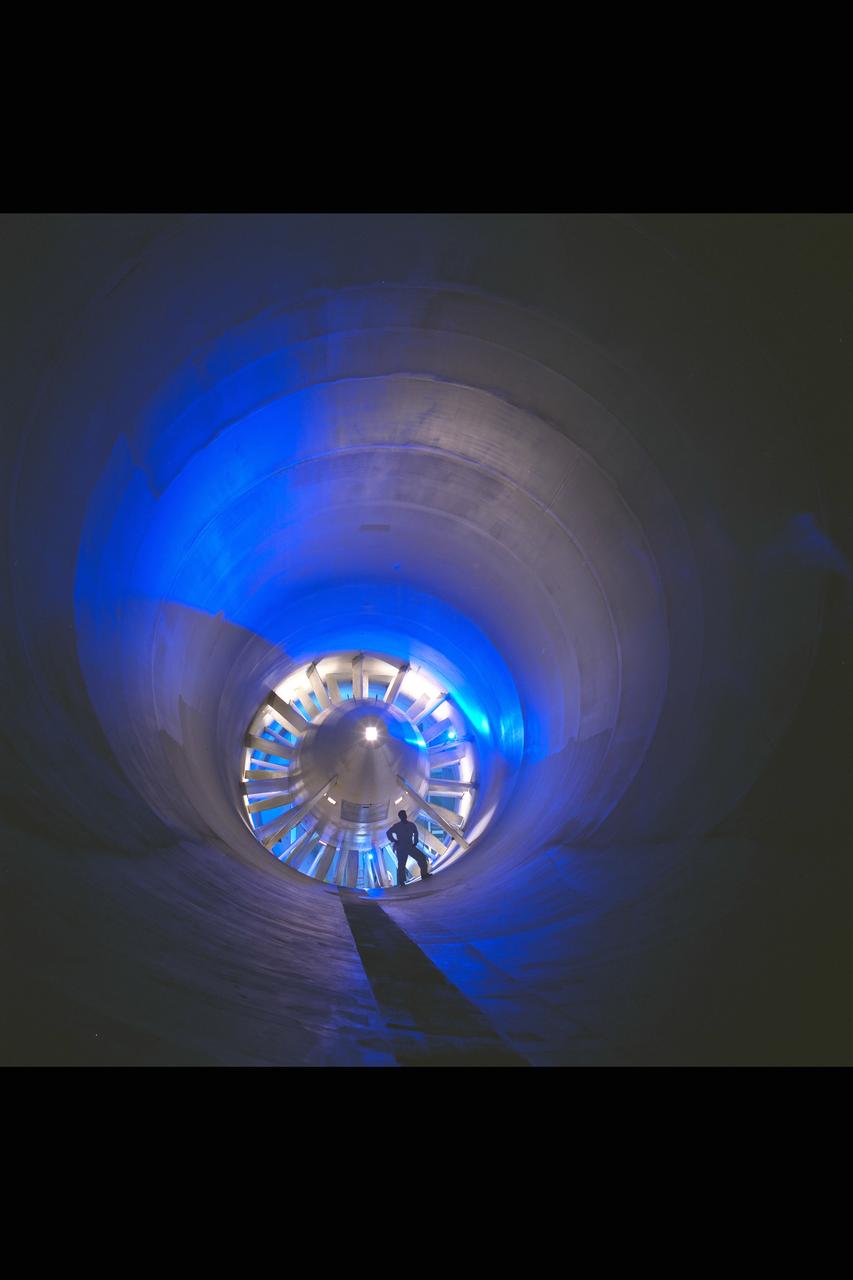
Lawrence Livermore National Labs (LLNL), Navistar and the Department of Energy conduct tests in the NASA Ames National Full-scale Aerodynamic Complex 80x120_foot wind tunnel. The LLNL project is aimed at aerodynamic truck and trailer devices that can reduce fuel consumption at highway speed by 10 percent. Smoke test demo.
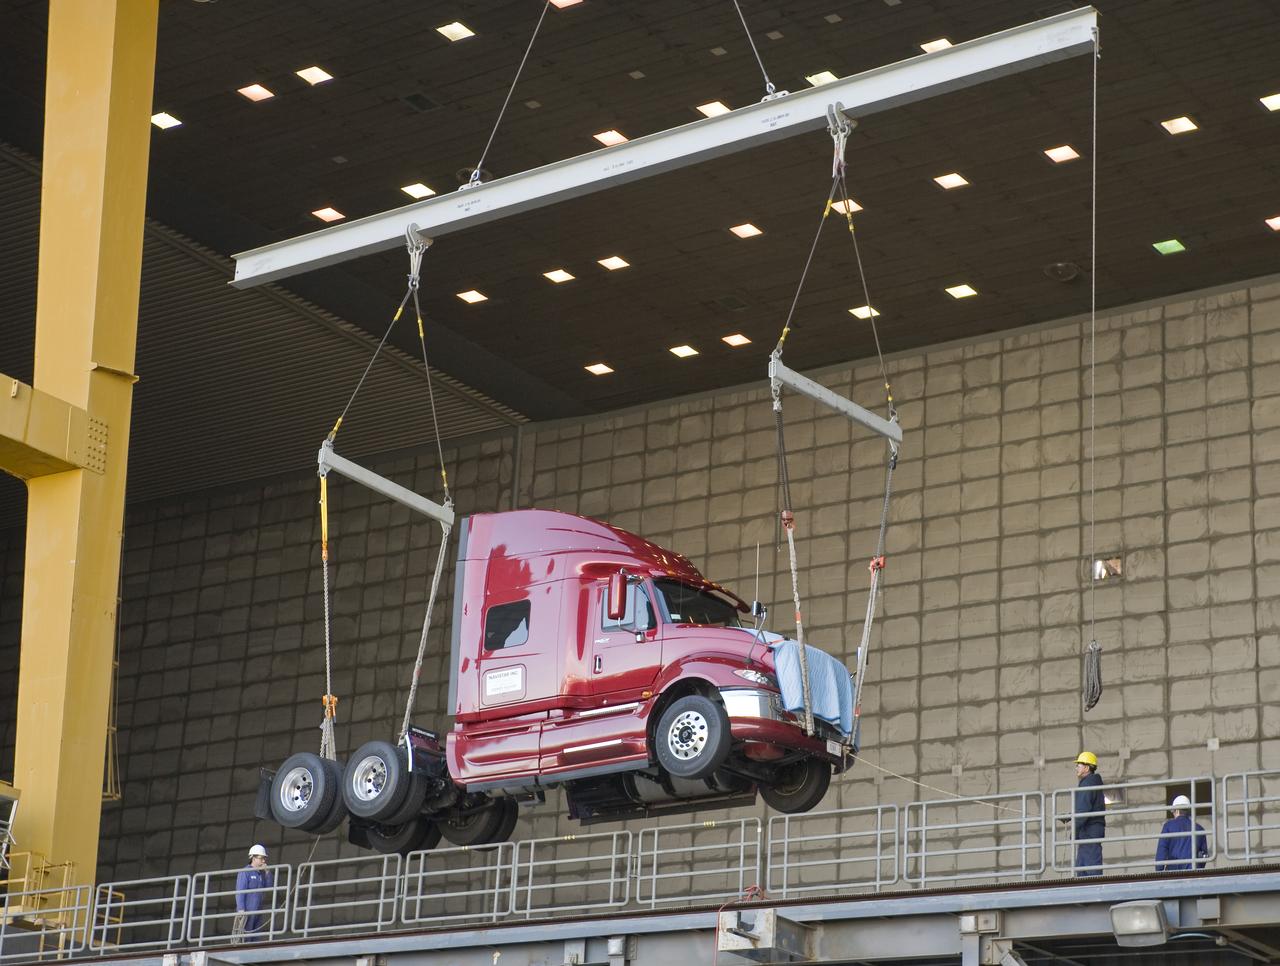
Lawrence Livermore National Labs (LLNL), Navistar and the Department of Energy conduct tests in the NASA Ames National Full-scale Aerodynamic Complex 80x120_foot wind tunnel. The LLNL project is aimed at aerodynamic truck and trailer devices that can reduce fuel consumption at highway speed by 10 percent. Cab being lifted into the tunnel.
These two images show Hurricane Isabel as viewed by AIRS and SeaWinds scatterometers on NASA ADEOS-2 and QuikScat satellites in September, 2003. AIRS data are used to create global three-dimensional maps of temperature, humidity and clouds, while scatterometers measure surface wind speed and direction. http://photojournal.jpl.nasa.gov/catalog/PIA00429
New renovated NASA Ames Research Center 12 foot Pressure Wind Tunnel, seen here is the single stage, 20 blade axial-flow fan powered by a 15,000 horsepower variable speed, synchronous electric motor that provides airflow in the closed-return, variable-density tunnel.
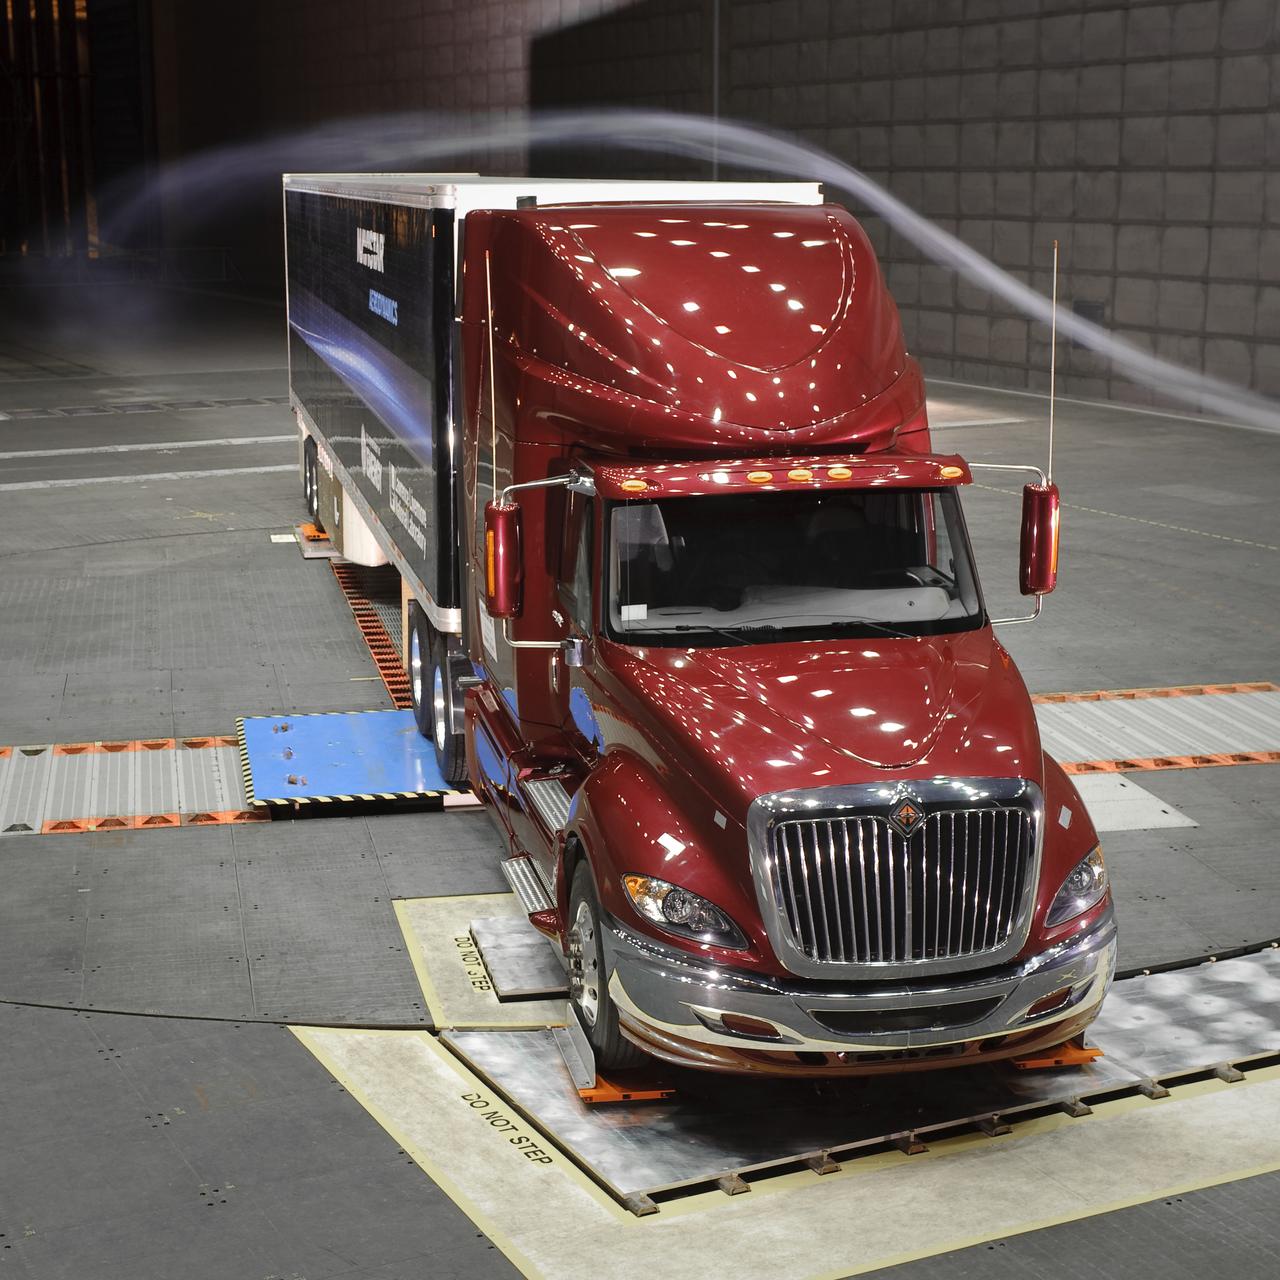
Lawrence Livermore National Labs (LLNL), Navistar and the Department of Energy conduct tests in the NASA Ames National Full-scale Aerodynamic Complex 80x120_foot wind tunnel. The LLNL project is aimed at aerodynamic truck and trailer devices that can reduce fuel consumption at highway speed by 10 percent. Smoke test demo.
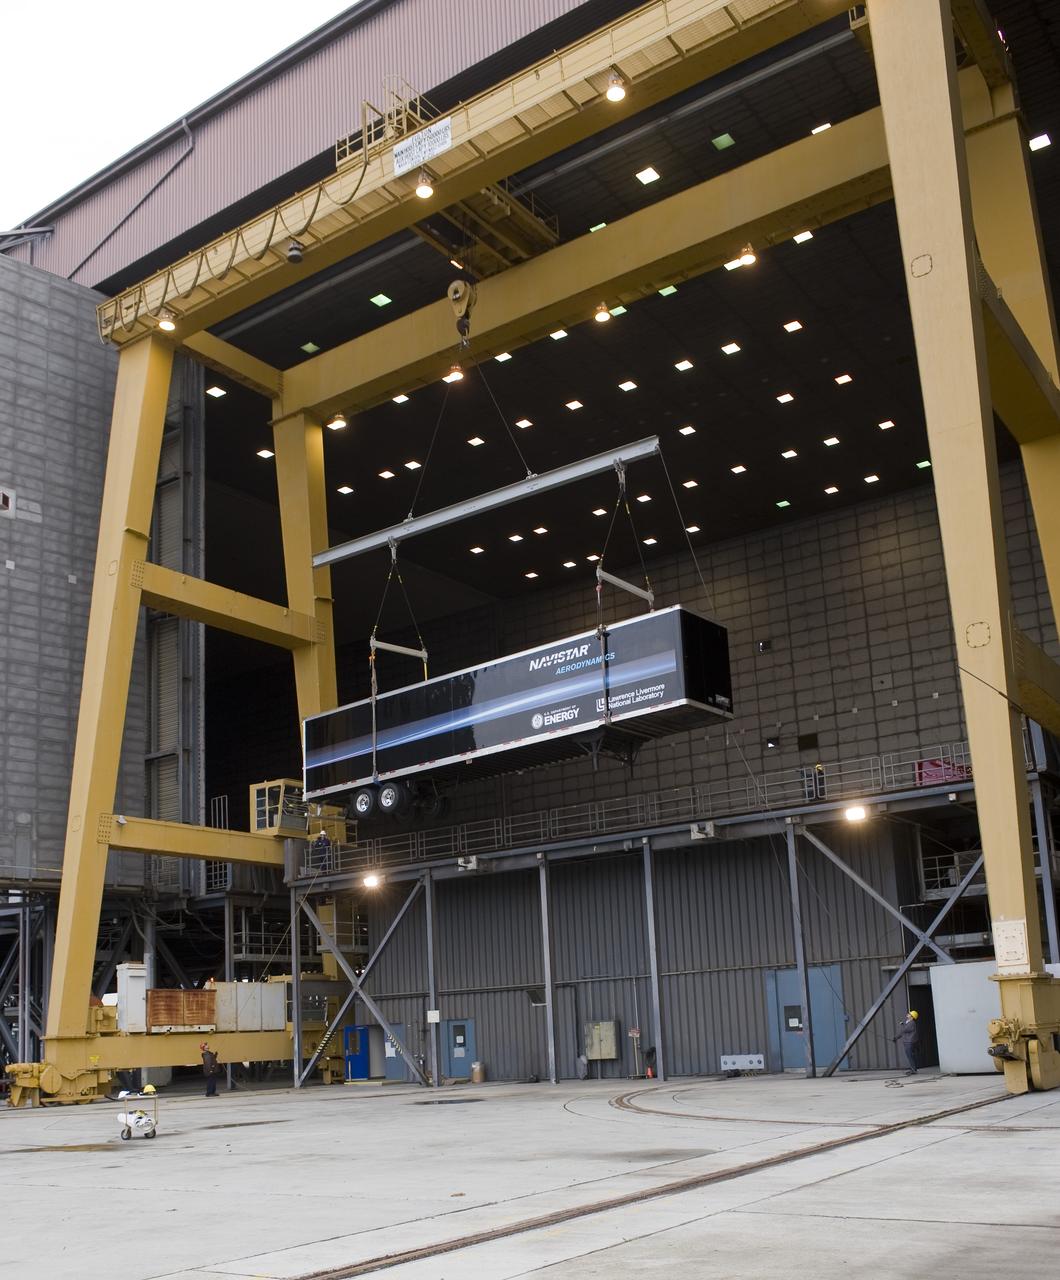
Lawrence Livermore National Labs (LLNL), Navistar and the Department of Energy conduct tests in the NASA Ames National Full-scale Aerodynamic Complex 80x120_foot wind tunnel. The LLNL project is aimed at aerodynamic truck and trailer devices that can reduce fuel consumption at highway speed by 10 percent. Trailer being lifted into the tunnel.
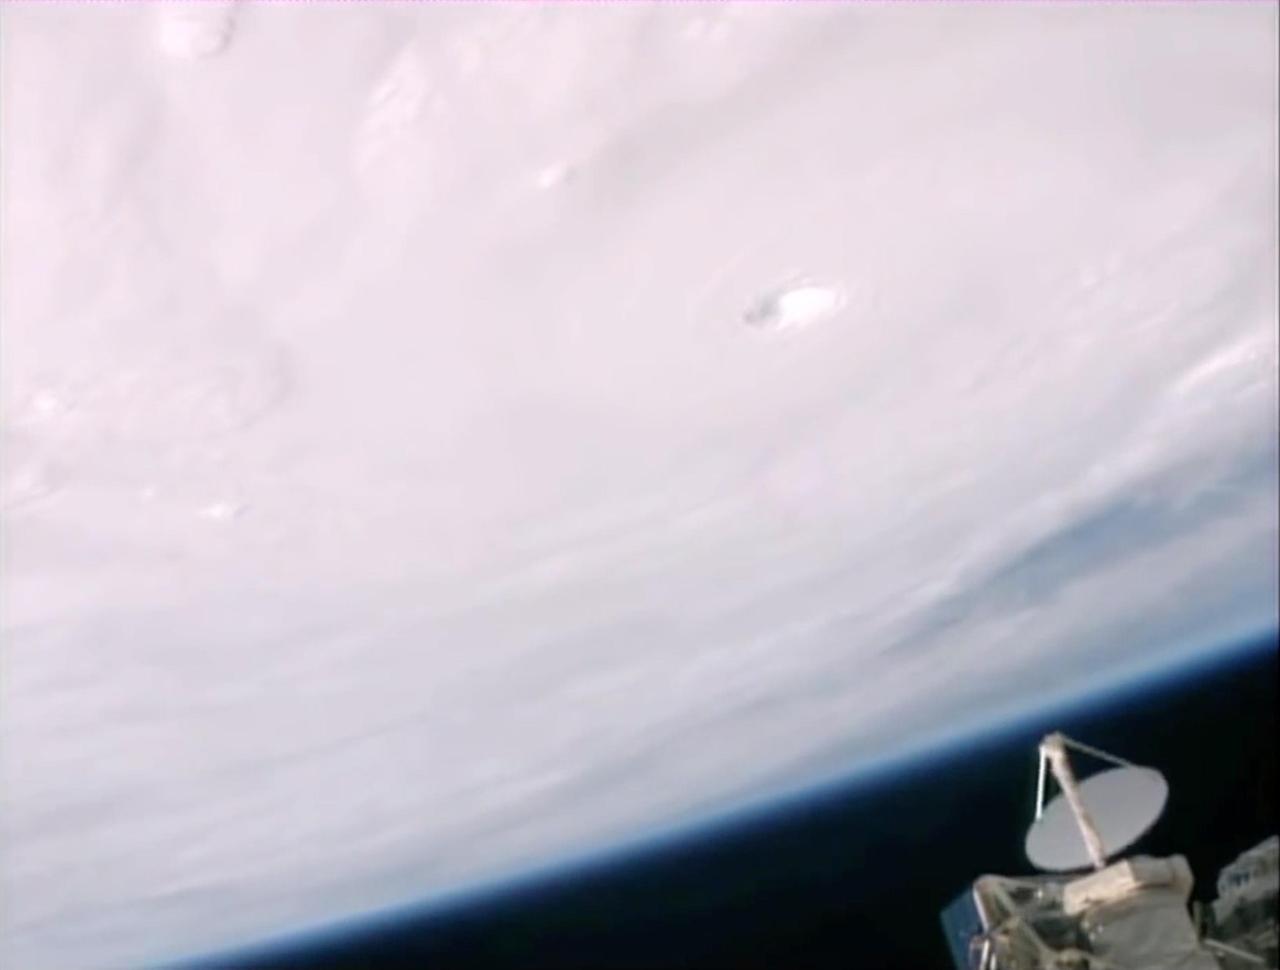
STS073-E-5313 (3 Nov. 1995) --- Typhoon Angela packed winds of 115 knots when this shot was taken with an Electronic Still Camera (ESC) from the Earth-orbiting space shuttle Columbia. It subsequently increased to speeds of 155 nautical miles, making it a super typhoon, heading due west toward Luzon in the Philippines.
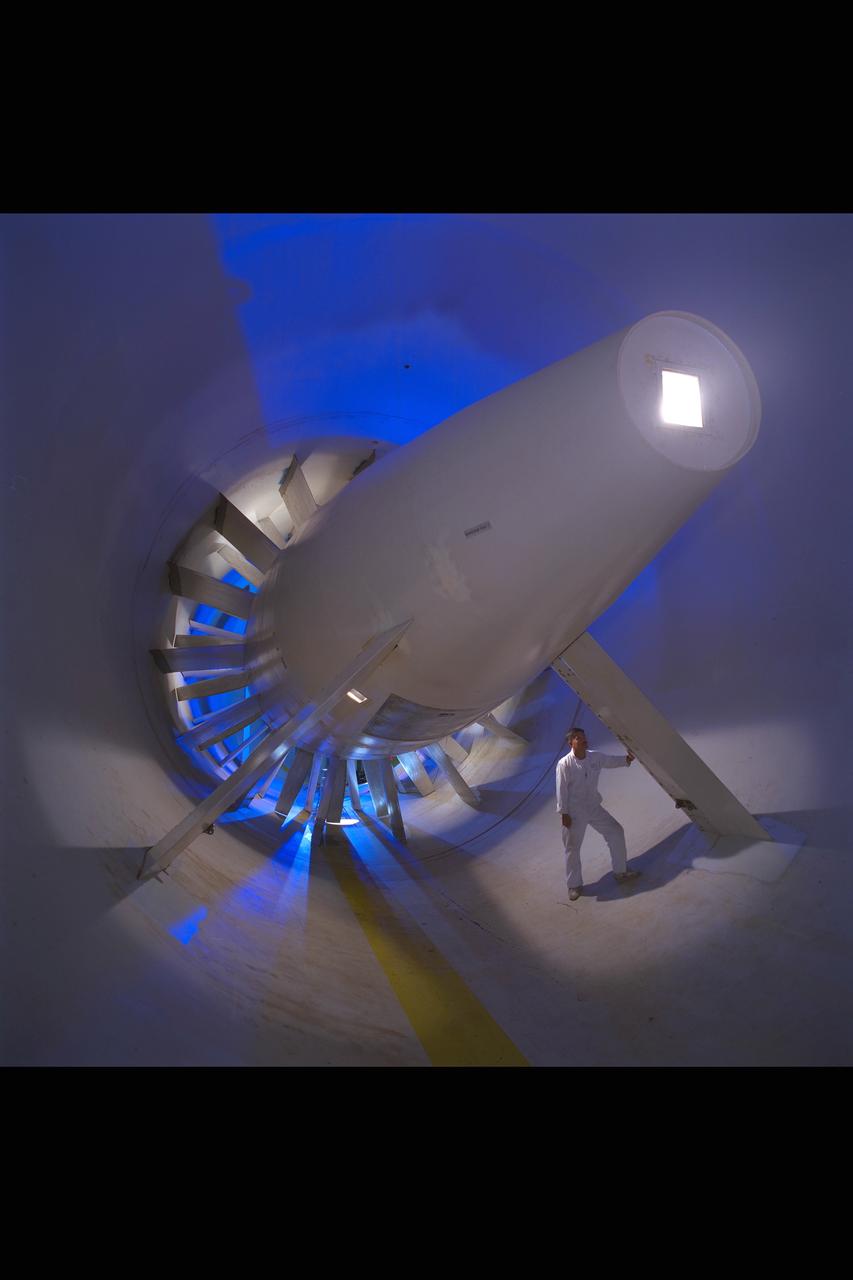
New renovated NASA Ames Research Center 12 foot Pressure Wind Tunnel, seen here is the single stage, 20 blade axial-flow fan powered by a 15,000 horsepower variable speed, synchronous electric motor that provides airflow in the closed-return, variable-density tunnel.
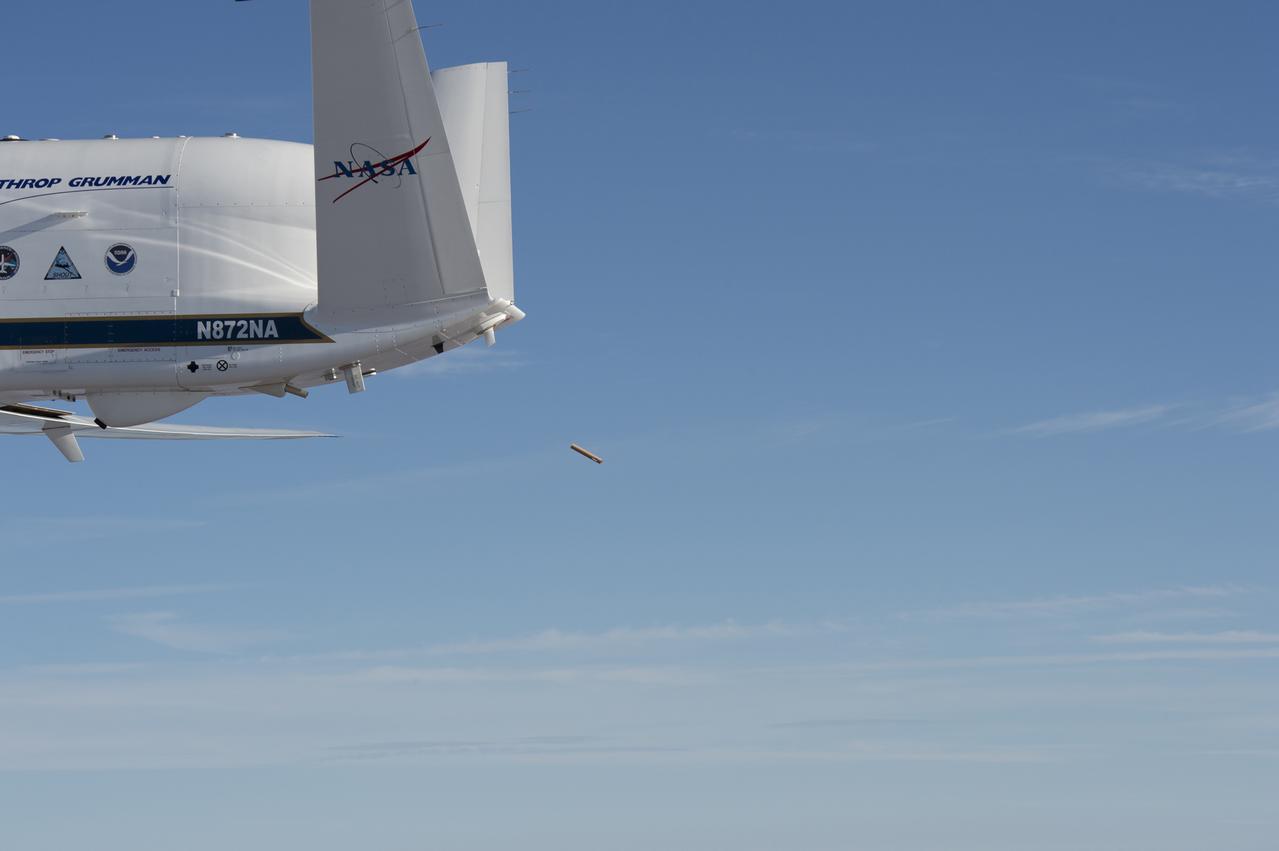
NASA’s Global Hawk aircraft deploys a dropsonde during a test flight over the Dryden Aeronautical Test Range in August 2015. The small, tube-shaped sensor will transmit data on temperature, humidity, and wind speed, which will be used to help improve weather model forecasts
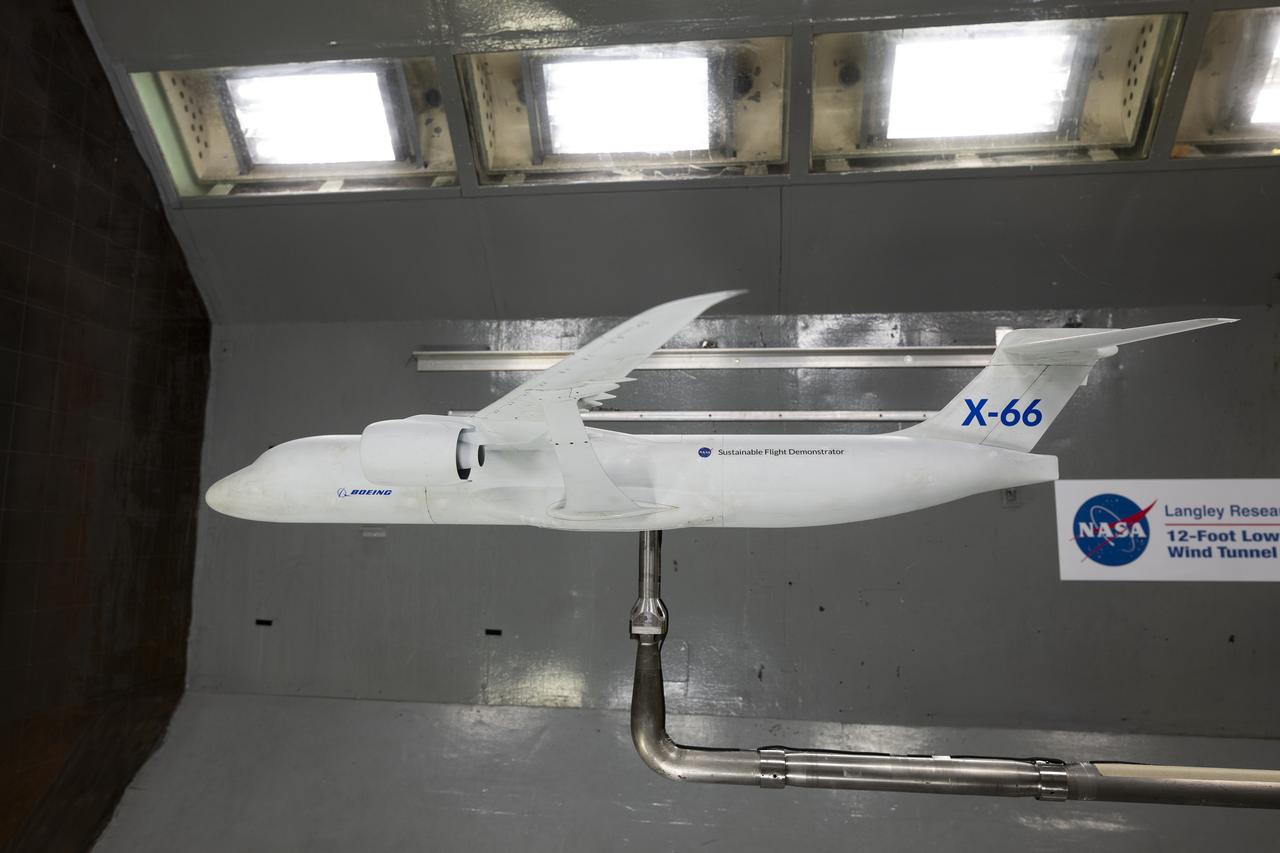
A model of the X-66 aircraft with a wingspan of almost 6 feet was placed in the 12-Foot Low-Speed Wind Tunnel at NASA’s Langley Research Center in Hampton, Virginia on October 30, 2024. During the tests, the team captured measurements of forces such as lift and drag over many aerodynamic configurations and flight conditions.