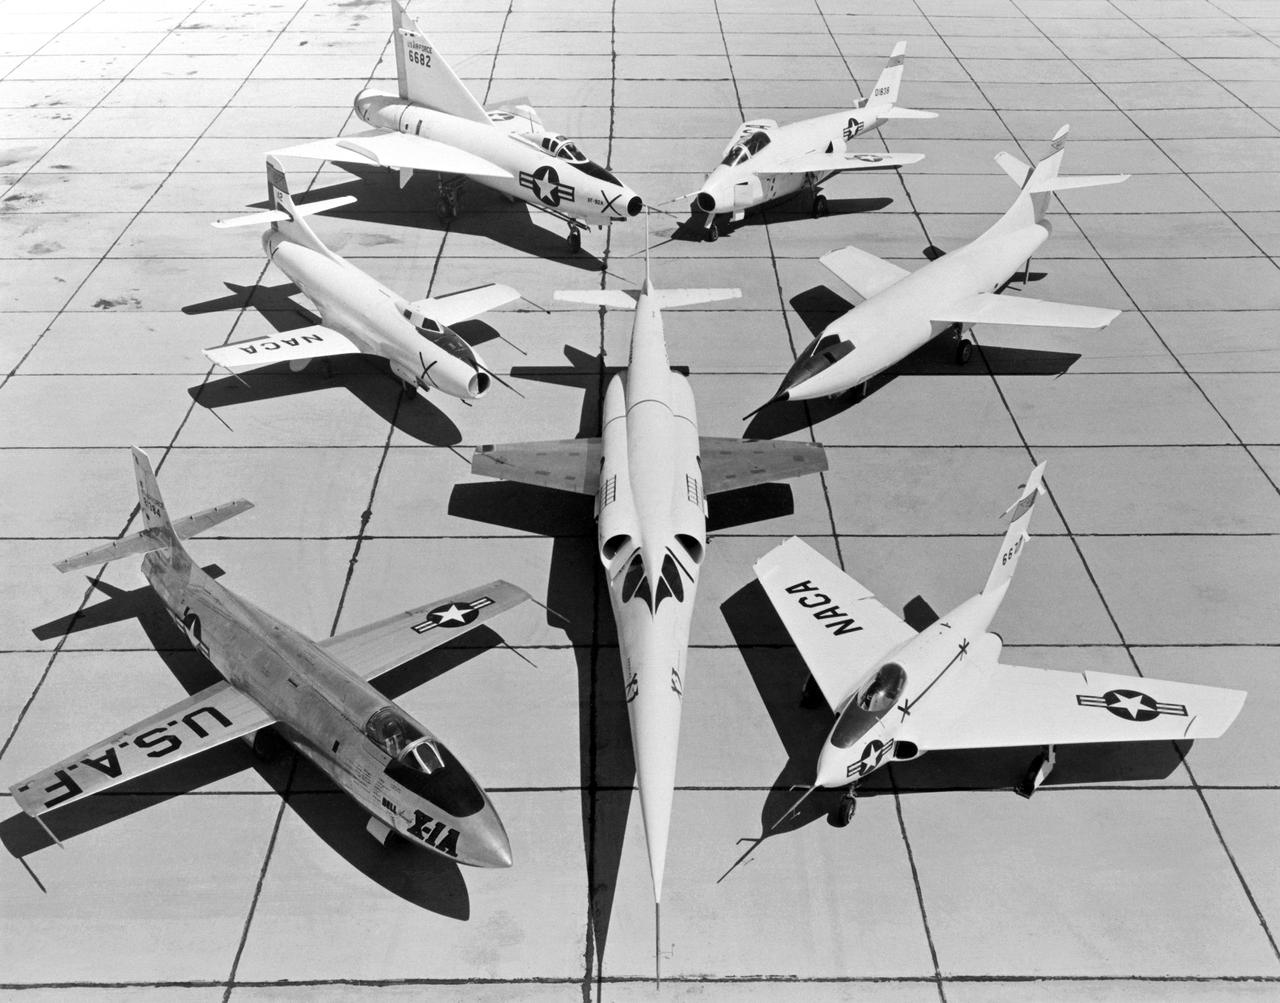
A 1953 photo of some of the research aircraft at the NACA High-Speed Flight Research Station (now known as the the Dryden Flight Research Center). The photo shows the X-3 (center) and, clockwise from left: X-1A (Air Force serial number 48-1384), the third D-558-1 (NACA tail number 142), XF-92A, X-5, D-558-2, and X-4.

This image of the suspected Black Hole, Cygnus X-1, was the first object seen by the High Energy Astronomy Observatory (HEAO)-2/Einstein Observatory. According to the theories to date, one concept of a black hole is a star, perhaps 10 times more massive than the Sun, that has entered the last stages of stelar evolution. There is an explosion triggered by nuclear reactions after which the star's outer shell of lighter elements and gases is blown away into space and the heavier elements in the stellar core begin to collapse upon themselves. Once this collapse begins, the inexorable force of gravity continues to compact the material until it becomes so dense it is squeezed into a mere point and nothing can escape from its extreme gravitational field, not even light. The HEAO-2, the first imaging and largest x-ray telescope built to date, was capable of producing actual photographs of x-ray objects. Shortly after launch, the HEAO-2 was nicknamed the Einstein Observatory by its scientific experimenters in honor of the centernial of the birth of Albert Einstein, whose concepts of relativity and gravitation have influenced much of modern astrophysics, particularly x-ray astronomy.

The Bell Aircraft Corporation X-1-2 aircraft on the ramp at NACA High Speed Flight Research Station located on the South Base of Muroc Army Air Field in 1947. The X-1-2 flew until October 23, 1951, completing 74 glide and powered flights with nine different pilots. The aircraft has white paint and the NACA tail band. The black Xs are reference markings for tracking purposes. They were widely used on NACA aircraft in the early 1950s.
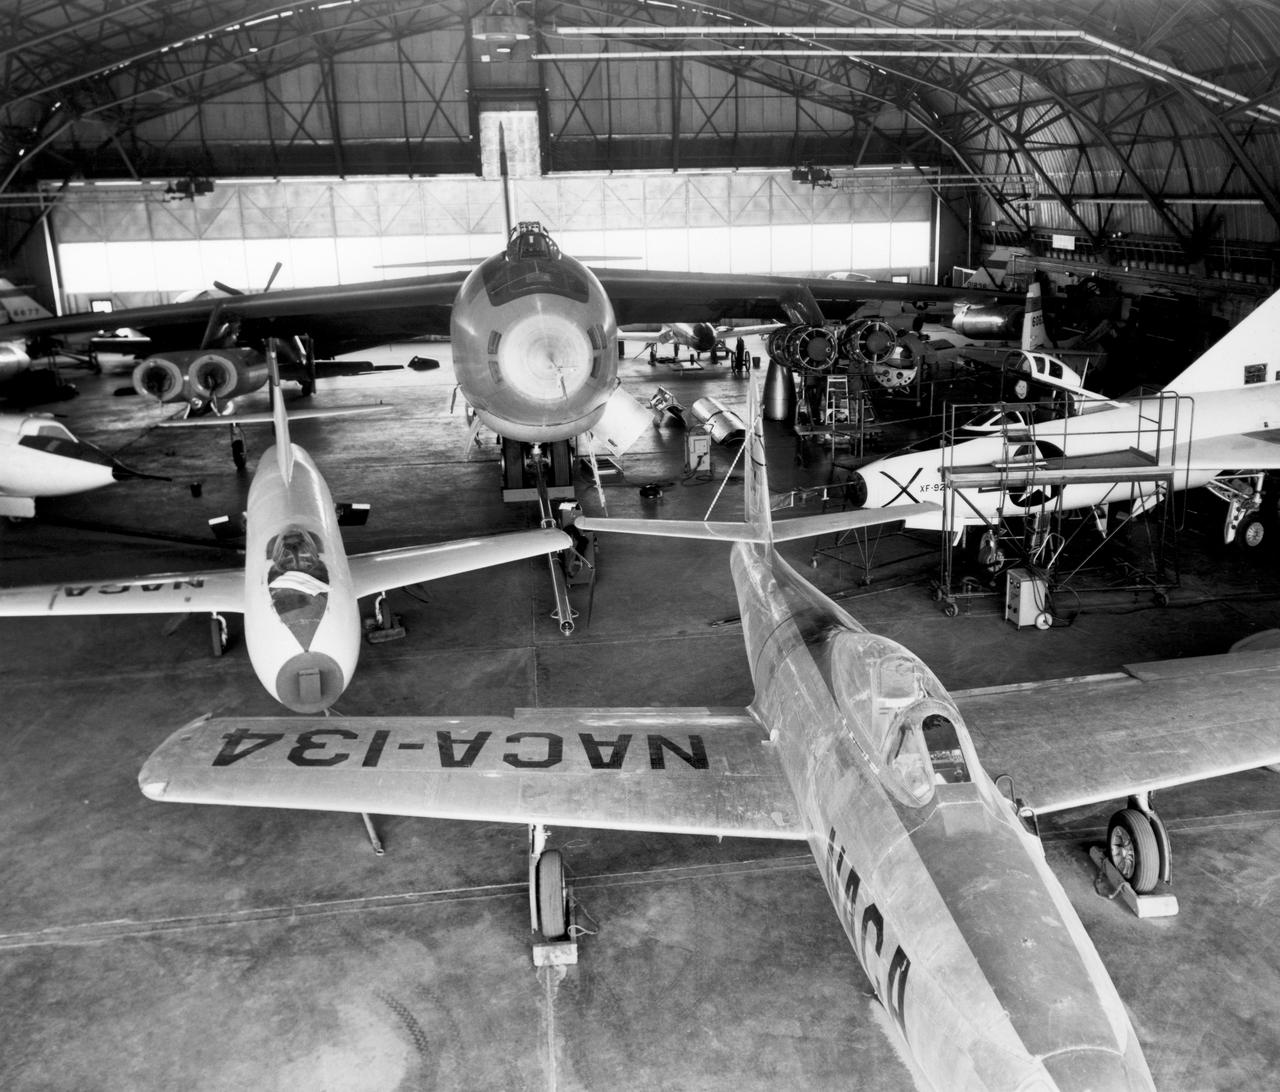
In the center foreground of this 1953 hangar photo is the YF-84A (NACA 134/Air Force 45-59490) used for vortex generator research. It arrived on November 28, 1949, and departed on April 21, 1954. Beside it is the third D-558-1 aircraft (NACA 142/Navy 37972). This aircraft was used for a total of 78 transonic research flights from April 1949 to June 1954. It replaced the second D-558-1, lost in the crash which killed Howard Lilly. Just visible on the left edge is the nose of the first D-558-2 (NACA 143/Navy 37973). Douglas turned the aircraft over to NACA on August 31, 1951, after the contractor had completed its initial test flights. NACA only made a single flight with the aircraft, on September 17, 1956, before the program was cancelled. In the center of the photo is the B-47A (NACA 150/Air Force 49-1900). The B-47 jet bomber, with its thin, swept-back wings, and six podded engines, represented the state of the art in aircraft design in the early 1950s. The aircraft undertook a number of research activities between May 1953 and its 78th and final research flight on November 22, 1957. The tests showed that the aircraft had a buffeting problem at speeds above Mach 0.8. Among the pilots who flew the B-47 were later X-15 pilots Joe Walker, A. Scott Crossfield, John B. McKay, and Neil A. Armstrong. On the right side of the B-47 is NACA's X-1 (Air Force 46-063). The second XS-1 aircraft built, it was fitted with a thicker wing than that on the first aircraft, which had exceeded Mach 1 on October 14, 1947. Flight research by NACA pilots indicated that this thicker wing produced 30 percent more drag at transonic speeds compared to the thinner wing on the first X-1. After a final flight on October 23, 1951, the aircraft was grounded due to the possibility of fatigue failure of the nitrogen spheres used to pressurize the fuel tanks. At the time of this photo, in 1953, the aircraft was in storage. In 1955, the aircraft was extensively modified, becoming the X-1E. In front o
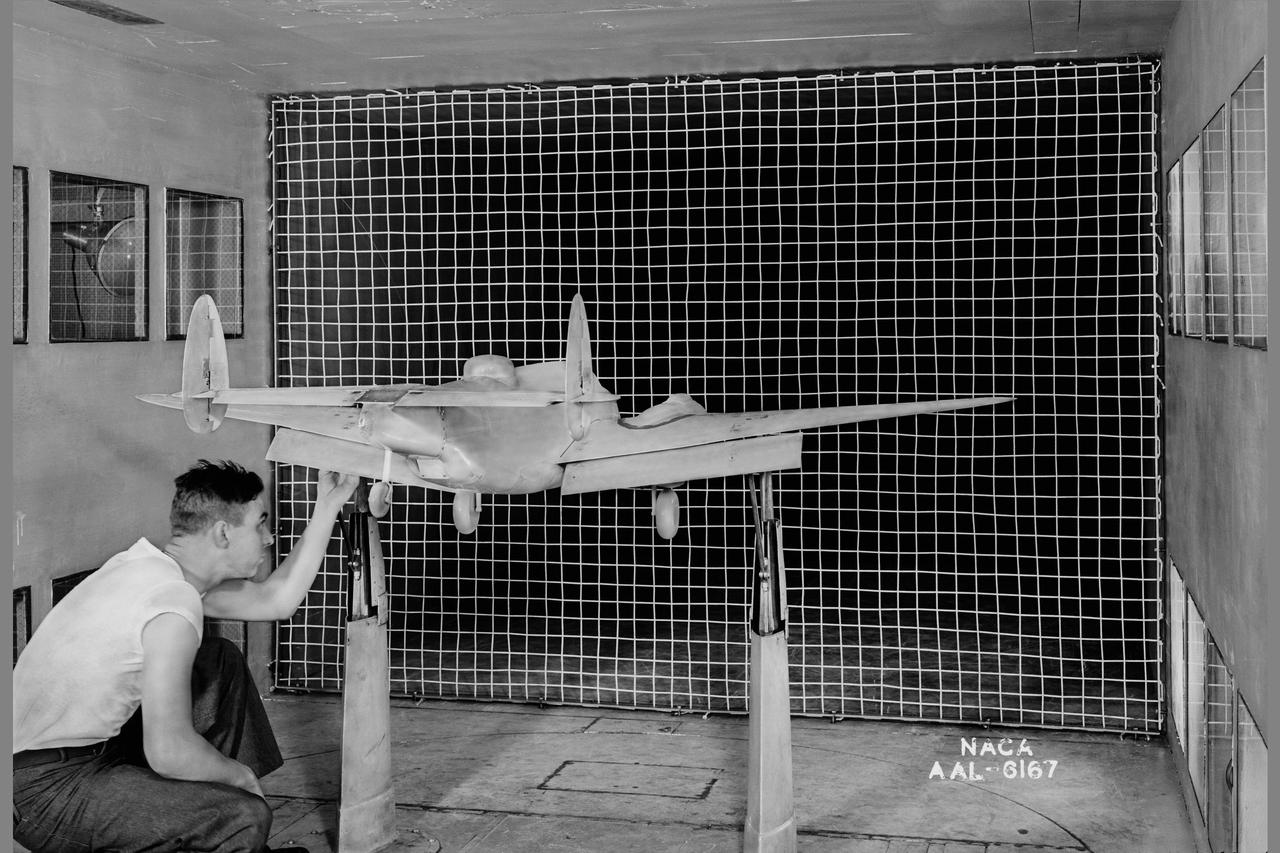
PV-1 model; rear view with 2 1/2' x 2 1/2' trubulene net mount in the 7x10ft w.t. at Ames Research Center
NACA X-Planes on South Base ramp. Northrop X-4, Bell X-1, Bell X-5, Douglas D-558-1, Douglas D-558-2. Back row Convair XF-92A. March 30, 1952
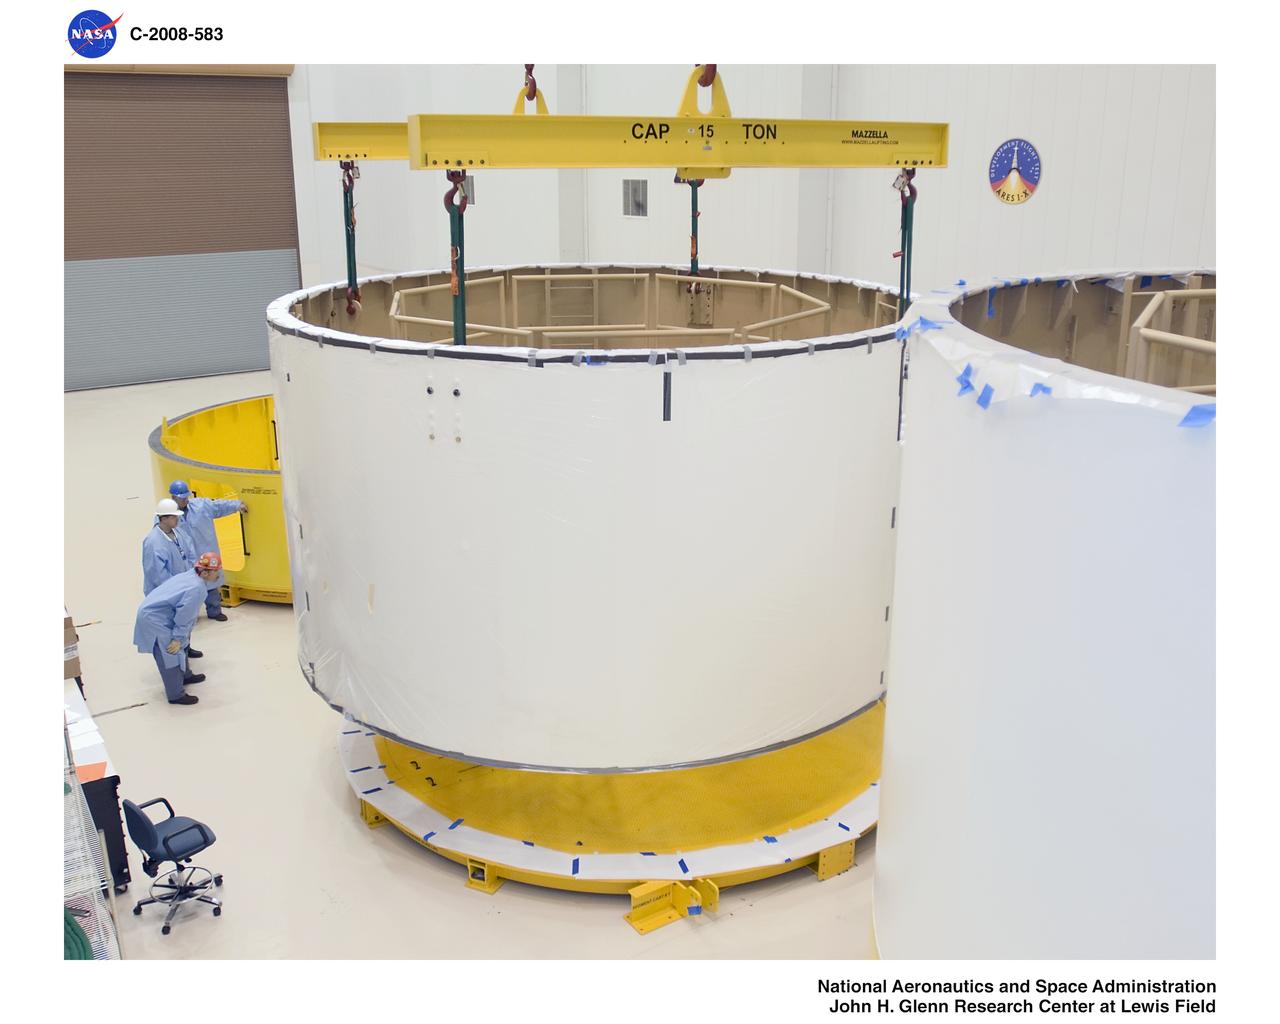
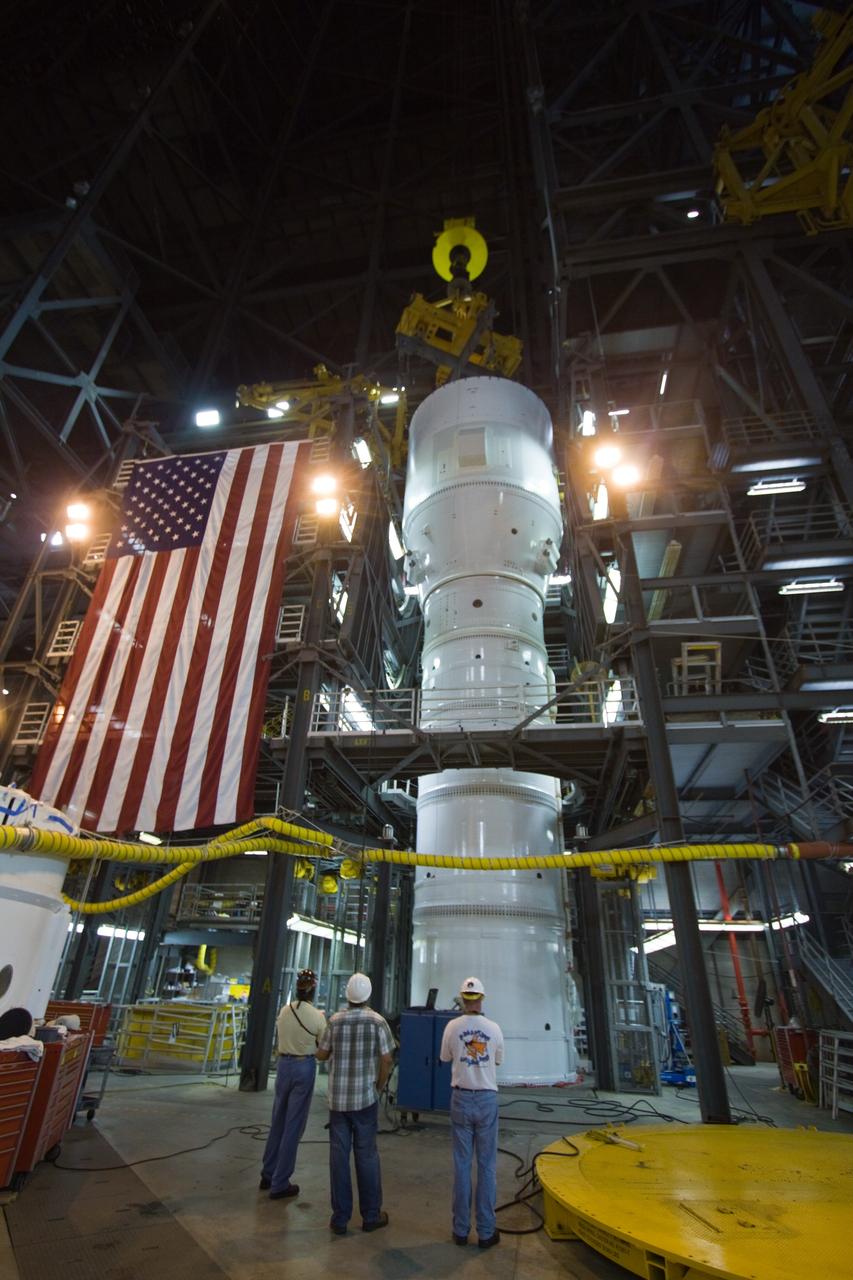
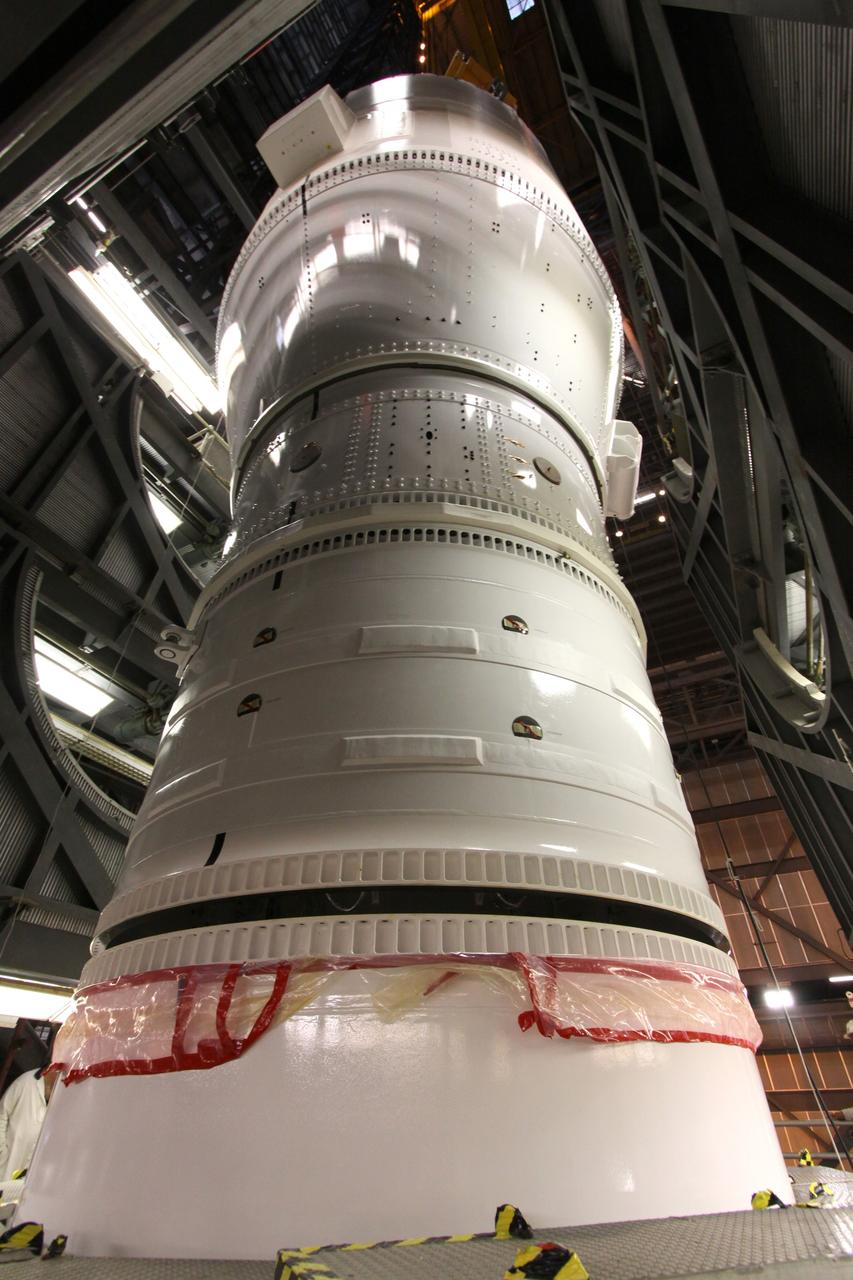
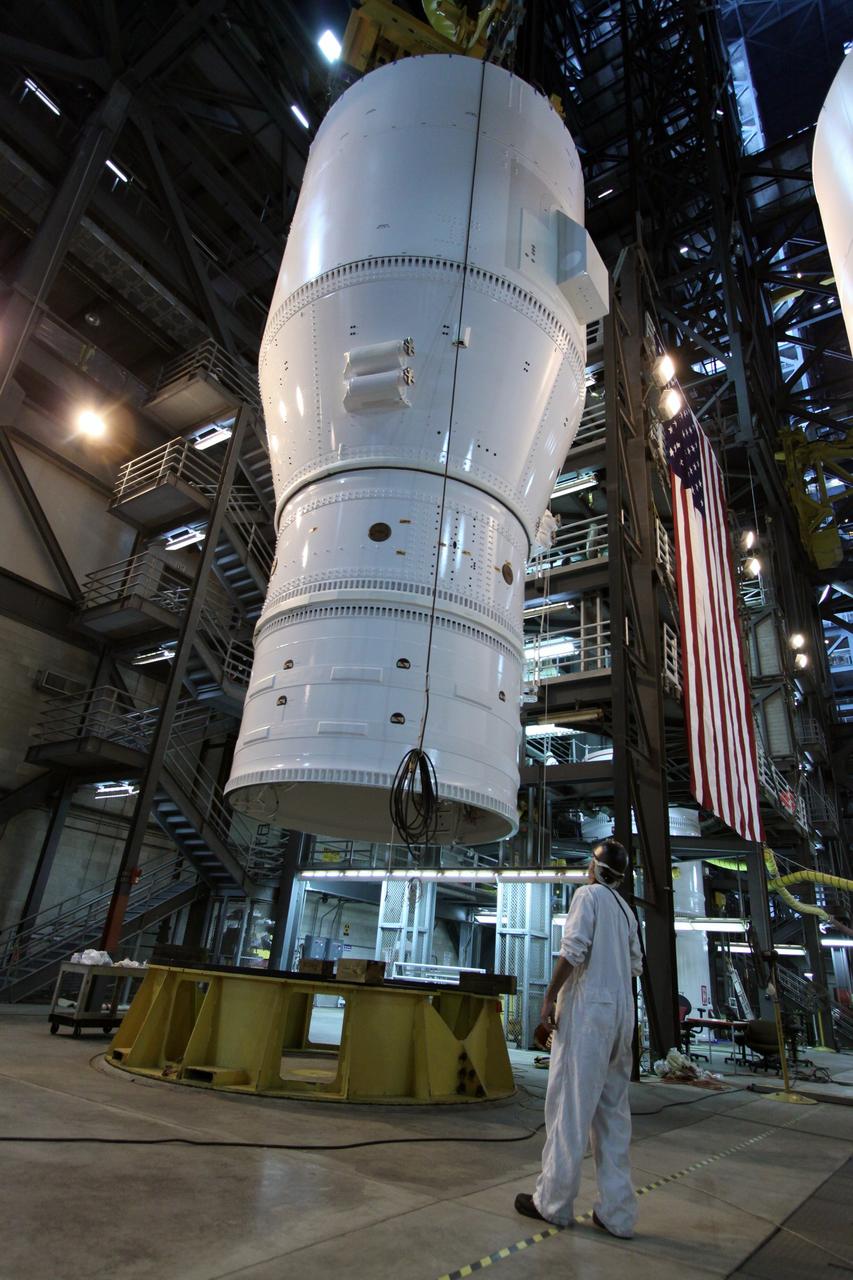
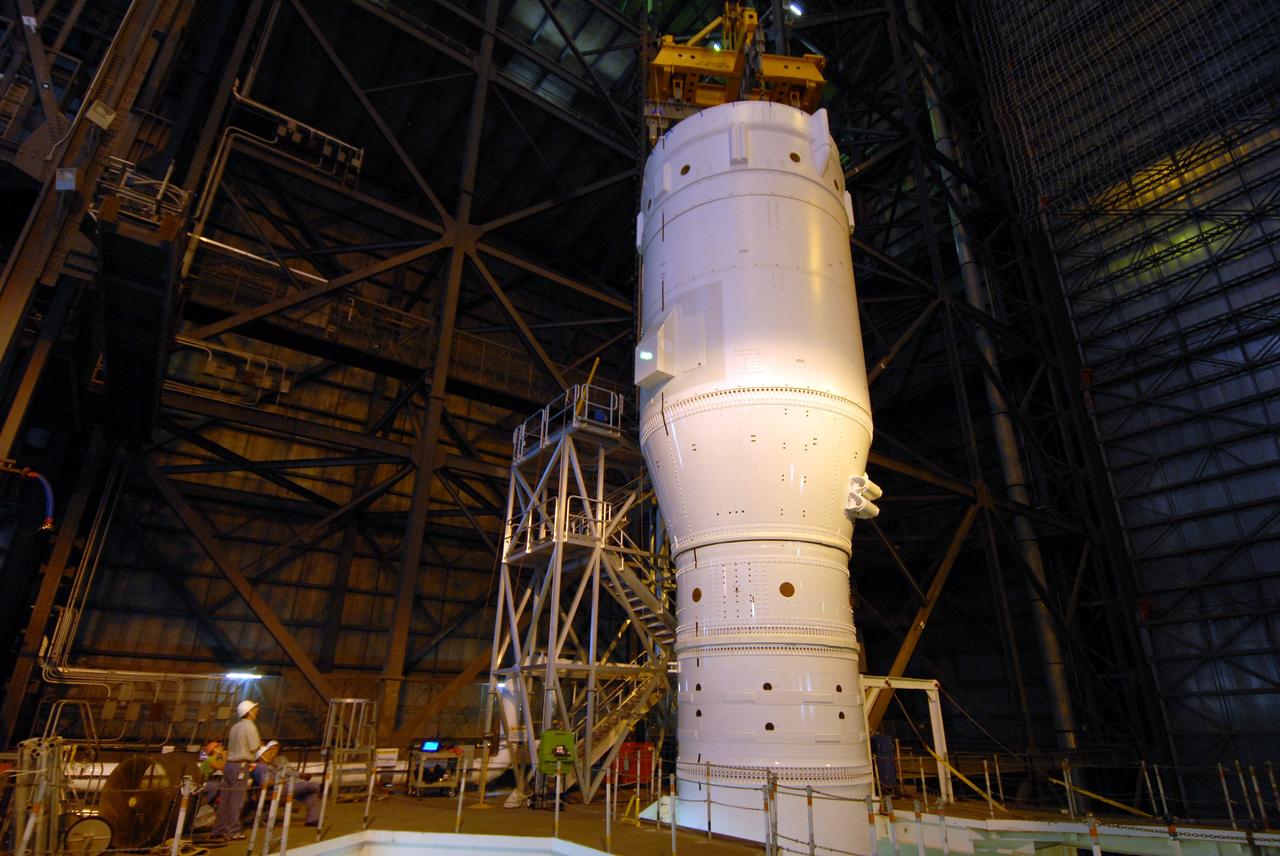
Ares 1-X segment US-3 being lifted onto the cart prior to being stacked onto US-2 to start forming the Ares 1-X USS Super Stack
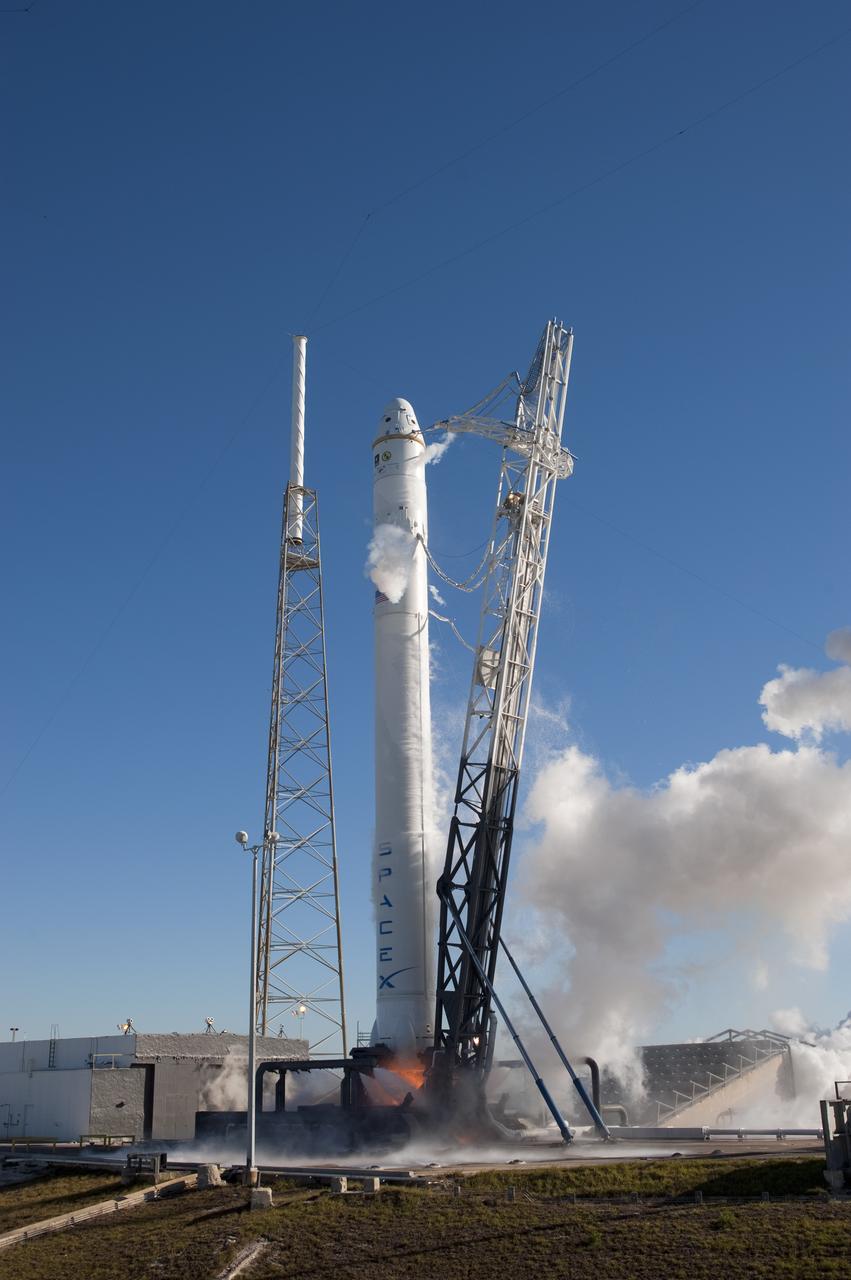
SPACE X FALCON 9 COTS-1 TEST FIRE - DAY 2
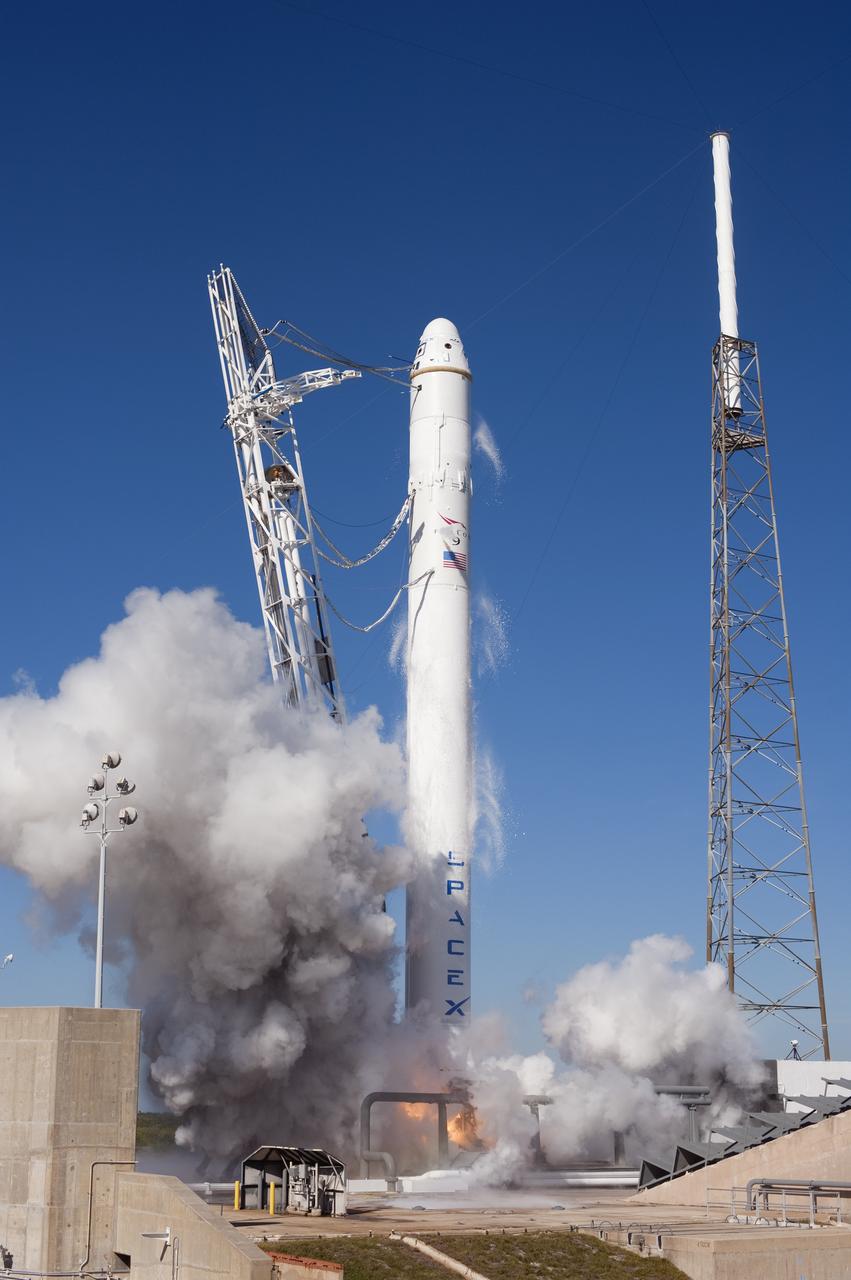
SPACE X FALCON 9 COTS-1 TEST FIRE - DAY 2
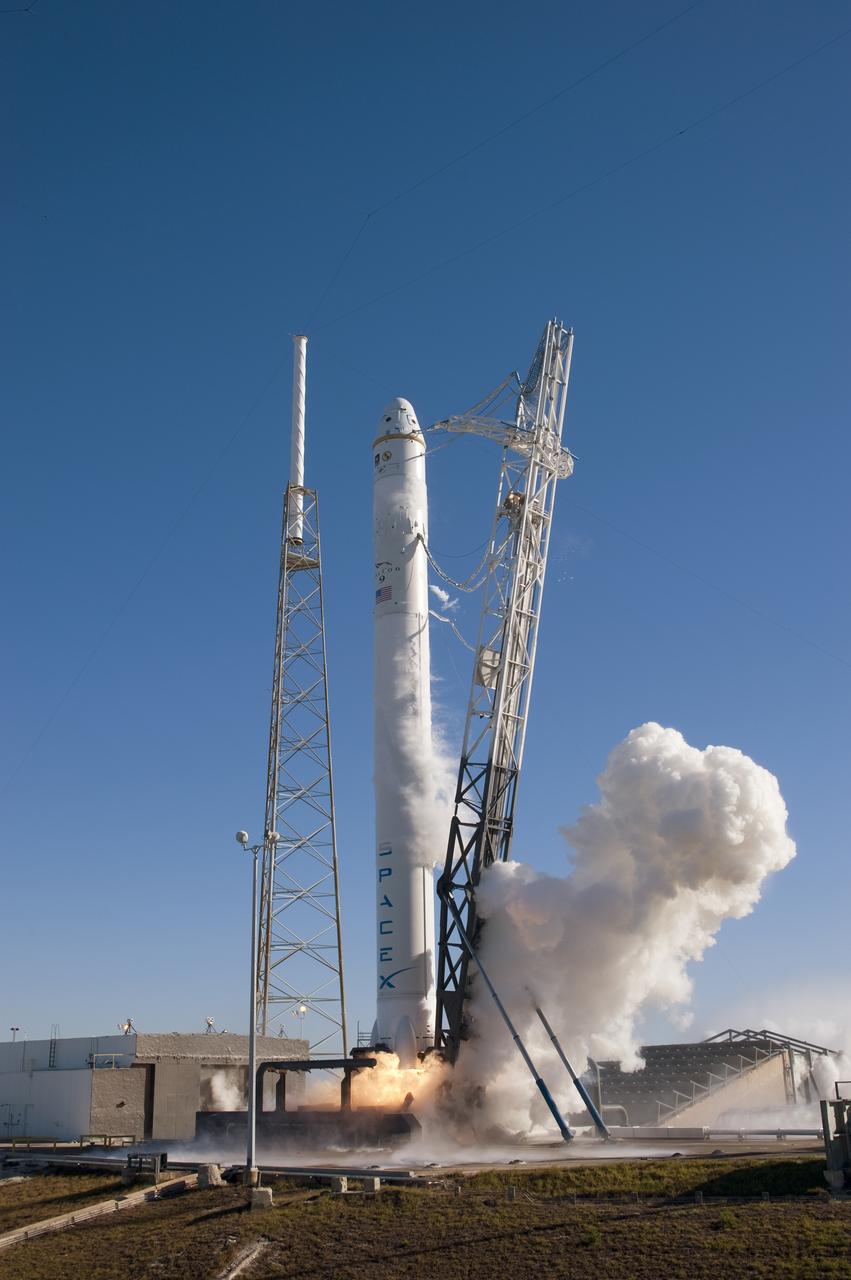
SPACE X FALCON 9 COTS-1 TEST FIRE - DAY 2
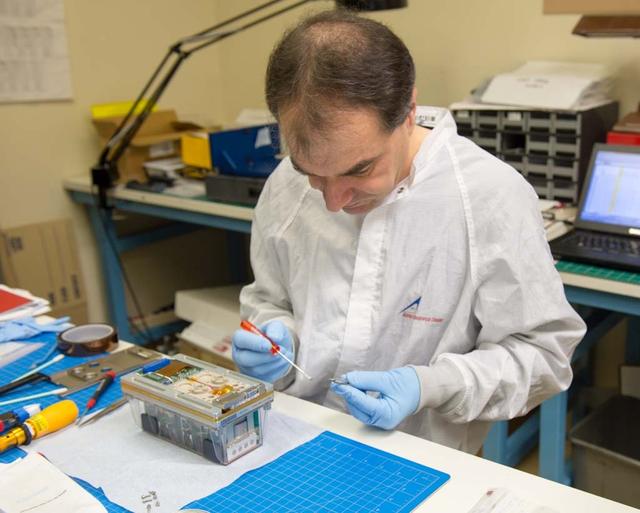
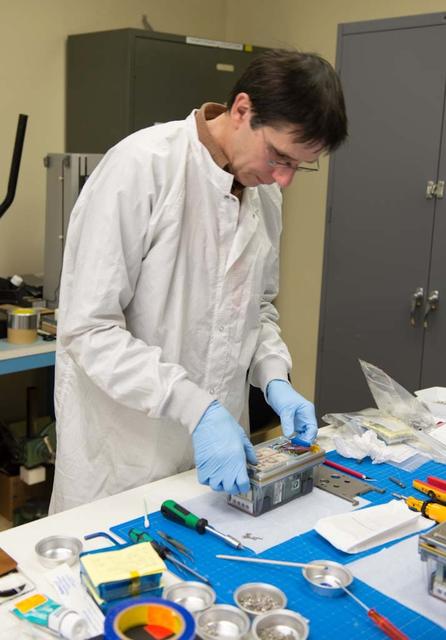
TROPI Seed Growth-1 payload (will fly to ISS on Space X 2) with John Freeman, Intrinsyx @ Ames, Plant Scientist
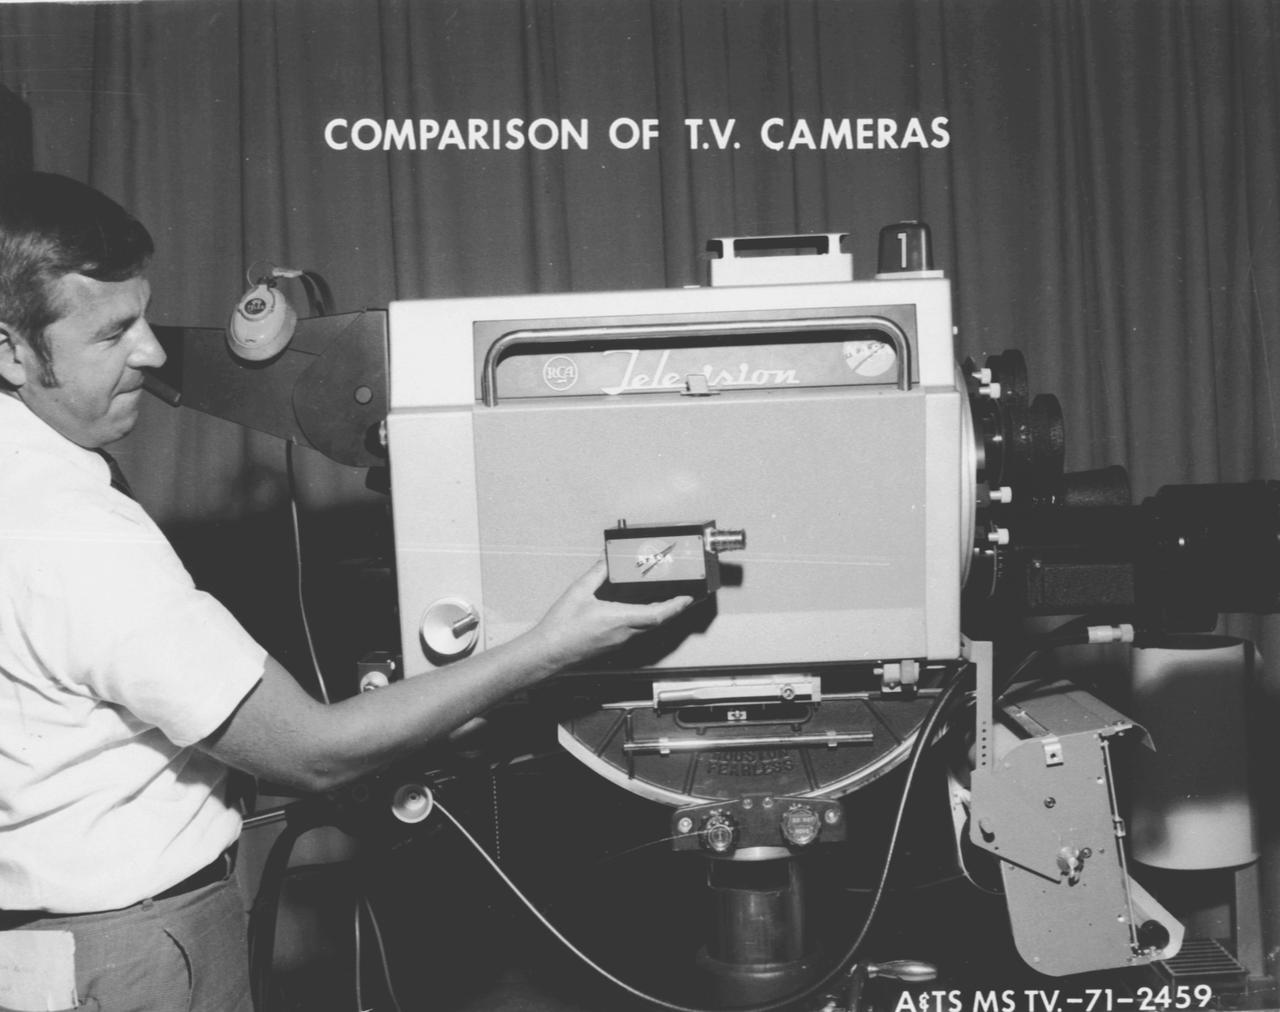
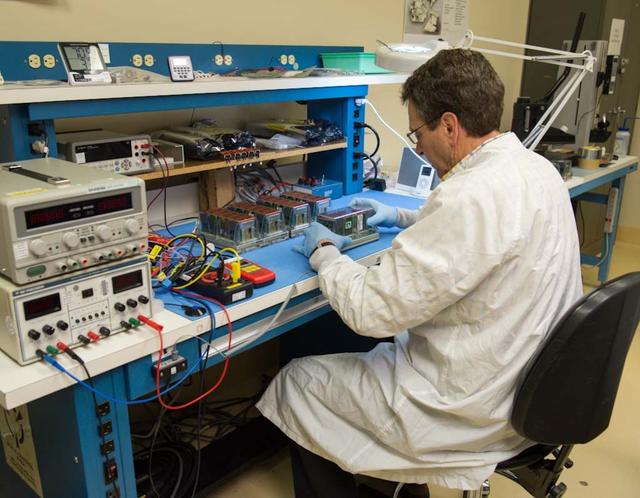
Originally devised to observe Saturn stage separation during Apollo flights, Marshall Space Flight Center's Miniature Television Camera, measuring only 4 x 3 x 1 1/2 inches, quickly made its way to the commercial telecommunications market.

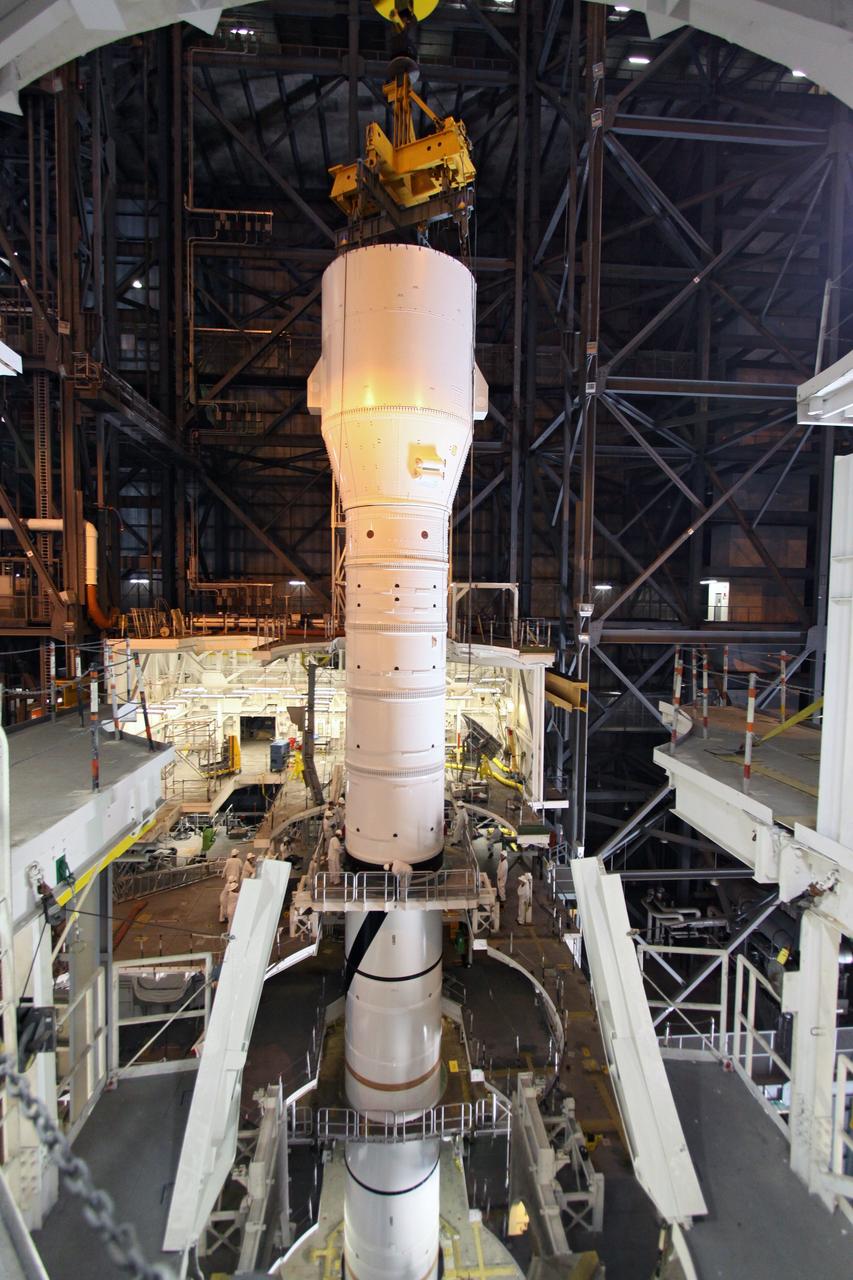
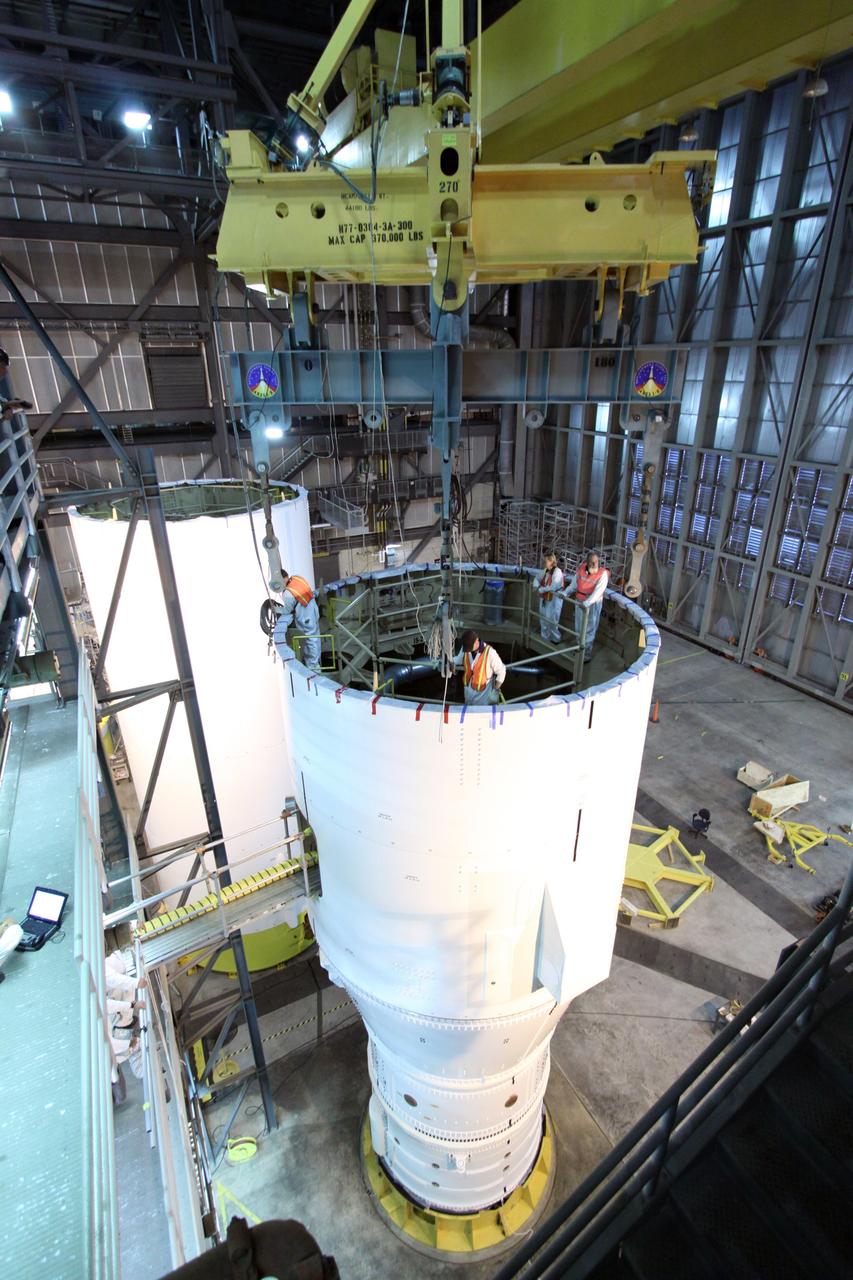
The first of Ares 1-X Flight Segments, the US-2 being stacked onto the SSAS (Super Structure Assembly Stand). This is the first formaiton of the Super Stack

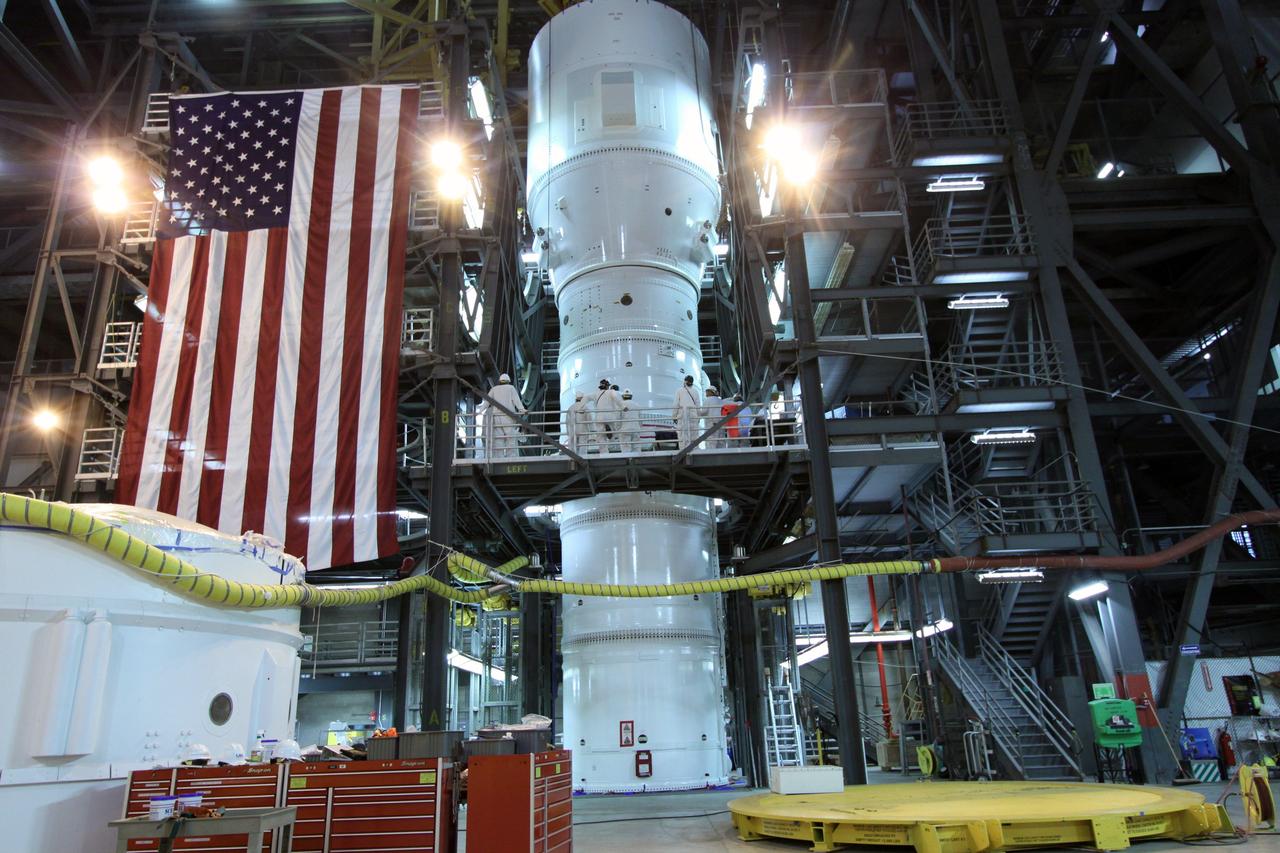
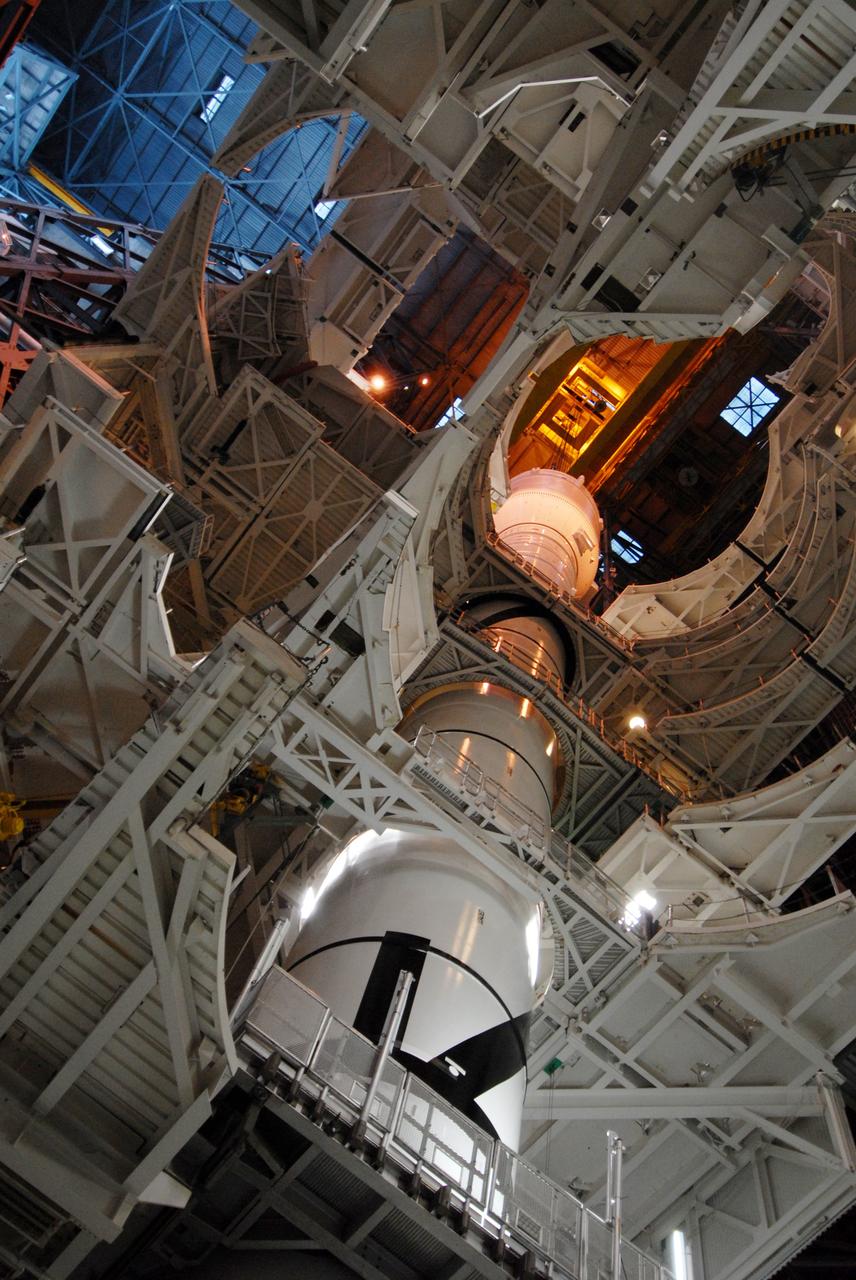
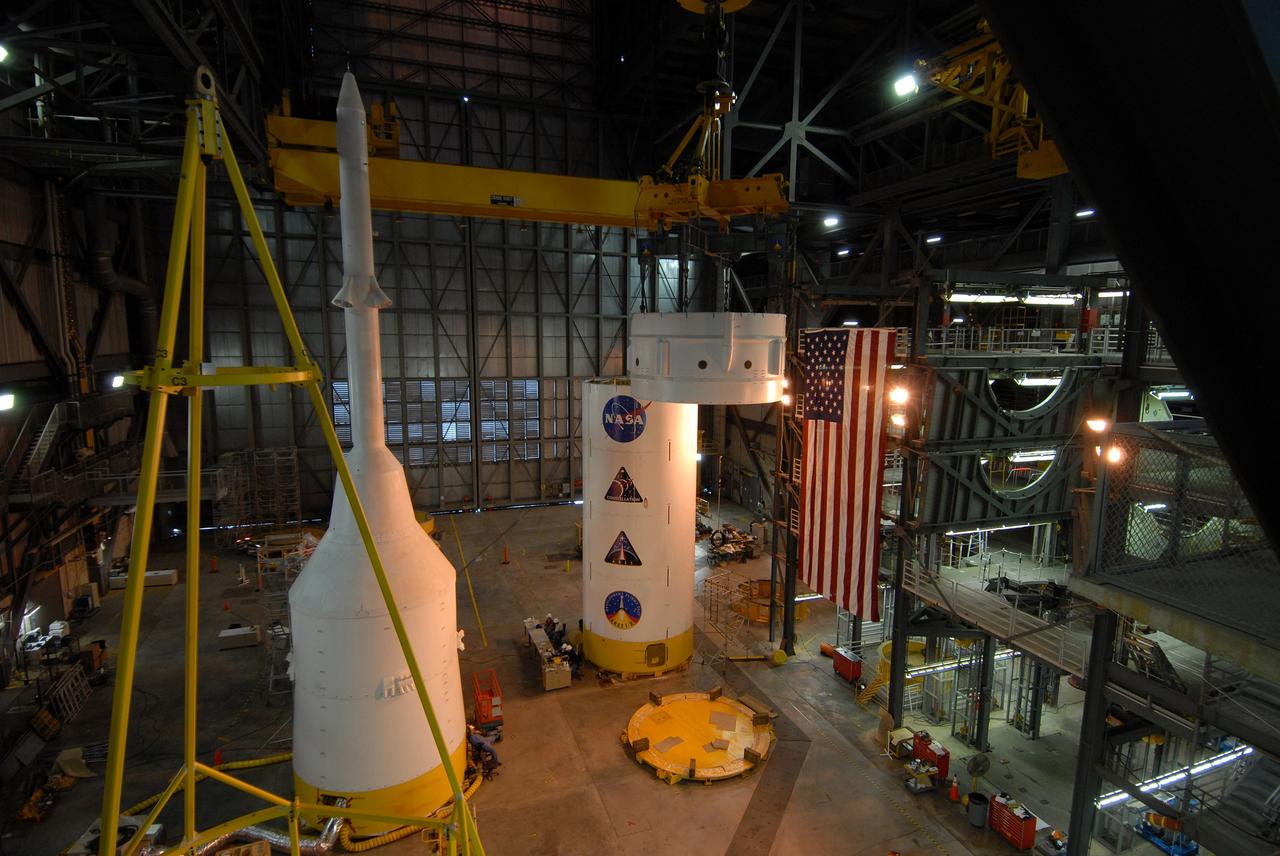
CAPE CANAVERAL, Fla. – In the Vehicle Assembly Building's High Bay 3, the Ares I-X "super stack 1" is being attached to the forward motor segment. Super stack 1 comprises the frustum, forward skirt, forward skirt extension, interstages 1 and 2 and the fifth segment simulator. Ares I-X is the test vehicle for the Ares I, which is part of the Constellation Program to return men to the moon and beyond. The Ares I-X flight test is targeted for Oct. 31, pending forma NASA Headquarters approval. Photo credit: NASA/Jack Pfaller

CAPE CANAVERAL, Fla. – In the Vehicle Assembly Building's High Bay 3, the Ares I-X "super stack 1" is being attached to the forward motor segment. Super stack 1 comprises the frustum, forward skirt, forward skirt extension, interstages 1 and 2 and the fifth segment simulator. Ares I-X is the test vehicle for the Ares I, which is part of the Constellation Program to return men to the moon and beyond. The Ares I-X flight test is targeted for Oct. 31, pending forma NASA Headquarters approval. Photo credit: NASA/Jack Pfaller
CAPE CANAVERAL, Fla. – In the Vehicle Assembly Building's High Bay 4, the Ares I-X "super stack 1" is to be lifted into High Bay 3 and attached to the forward motor segment. Super stack 1 comprises the frustum, forward skirt, forward skirt extension, interstages 1 and 2 and the fifth segment simulator. Ares I-X is the test vehicle for the Ares I, which is part of the Constellation Program to return men to the moon and beyond. The Ares I-X flight test is targeted for Oct. 31, pending forma NASA Headquarters approval. Photo credit: NASA/Jack Pfaller
CAPE CANAVERAL, Fla. – In the Vehicle Assembly Building's High Bay 3, the Ares I-X "super stack 1" is being attached to the forward motor segment. Super stack 1 comprises the frustum, forward skirt, forward skirt extension, interstages 1 and 2 and the fifth segment simulator. Ares I-X is the test vehicle for the Ares I, which is part of the Constellation Program to return men to the moon and beyond. The Ares I-X flight test is targeted for Oct. 31, pending forma NASA Headquarters approval. Photo credit: NASA/Jack Pfaller
TROPI Seed Growth-1 payload (will fly to ISS on Space X 2) with Thomas Neidermaier, Europeon Modular Culitivation System Payload Intergration Manager both from Astrium Space Transportaton, Friedrichshafen, Germany.
TROPI Seed Growth-1 payload (will fly to ISS on Space X 2) with Reinhard Born, Astrium Space Transportaton, Friedrichshafen, Germany - Europeon Modular Culitivation System Payload Engineering Manager
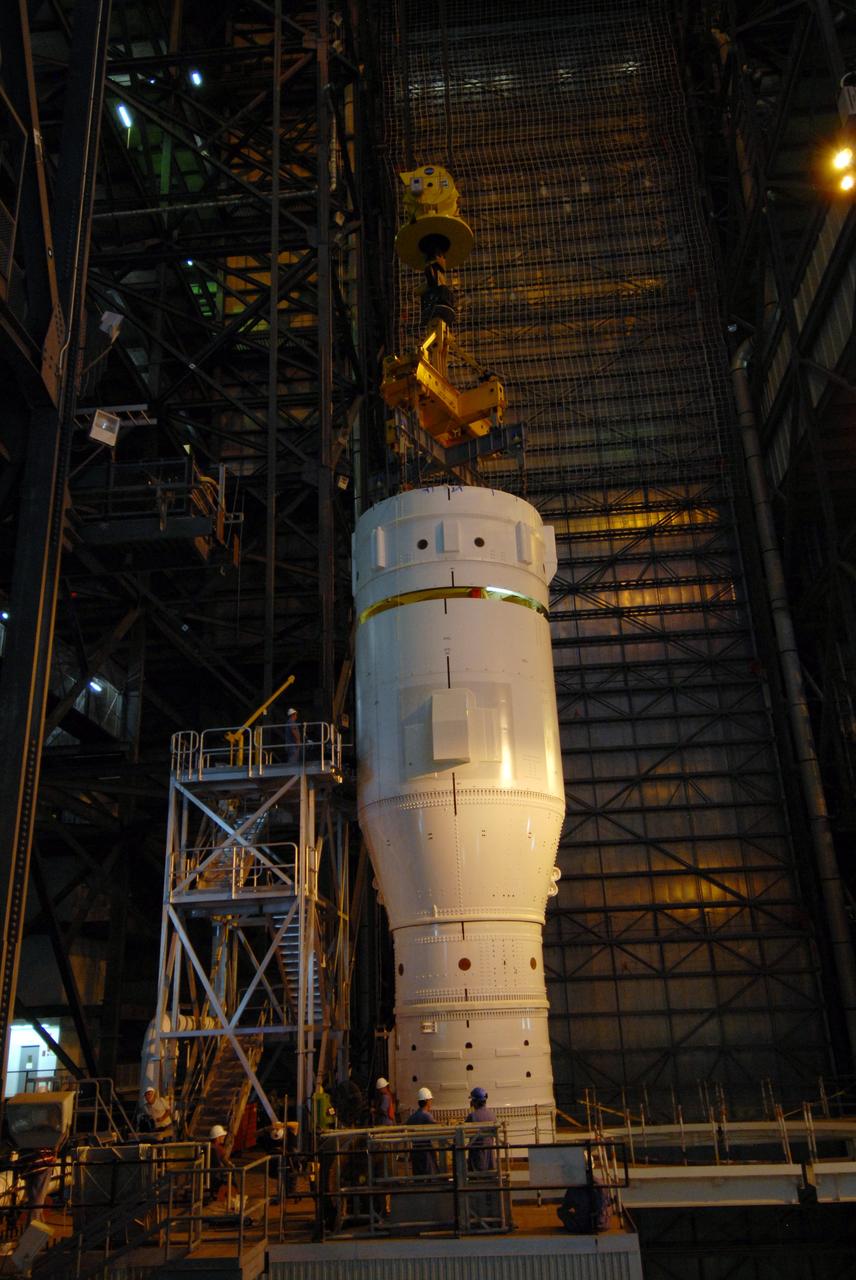
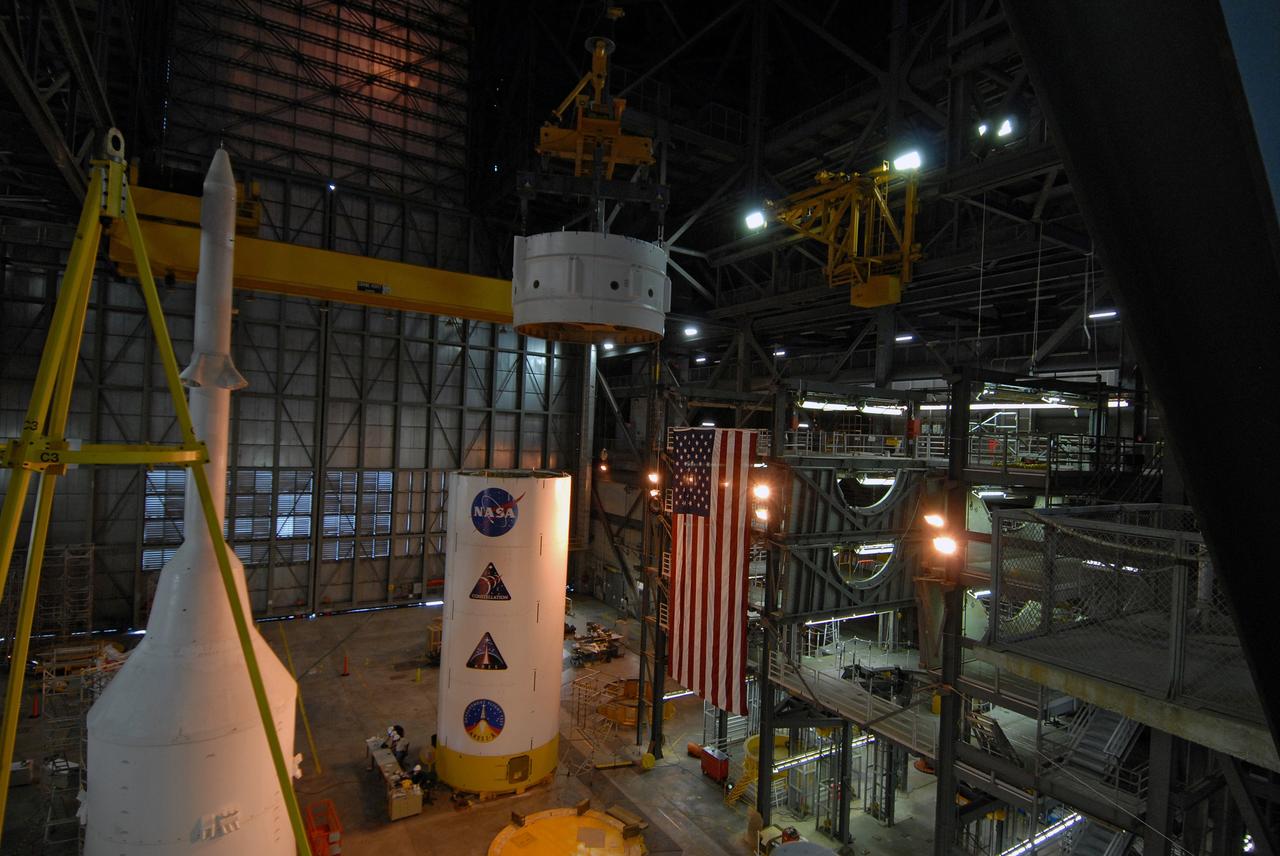
CAPE CANAVERAL, Fla. – In the Vehicle Assembly Building at NASA's Kennedy Space Center in Florida, segments of the Ares I-X first stage are lowered onto the fifth simulator segment for mating, to complete Super Stack 1. The super stack comprises the forward skirt, forward skirt extension, interstages 1 and 2 and the fifth segment simulator. Ares I-X is the test vehicle for the Ares I, which is part of the Constellation Program to return men to the moon and beyond. The Ares I-X flight test is targeted no earlier than Aug. 30 from Launch Pad 39B. Photo credit: NASA/Jack Pfaller
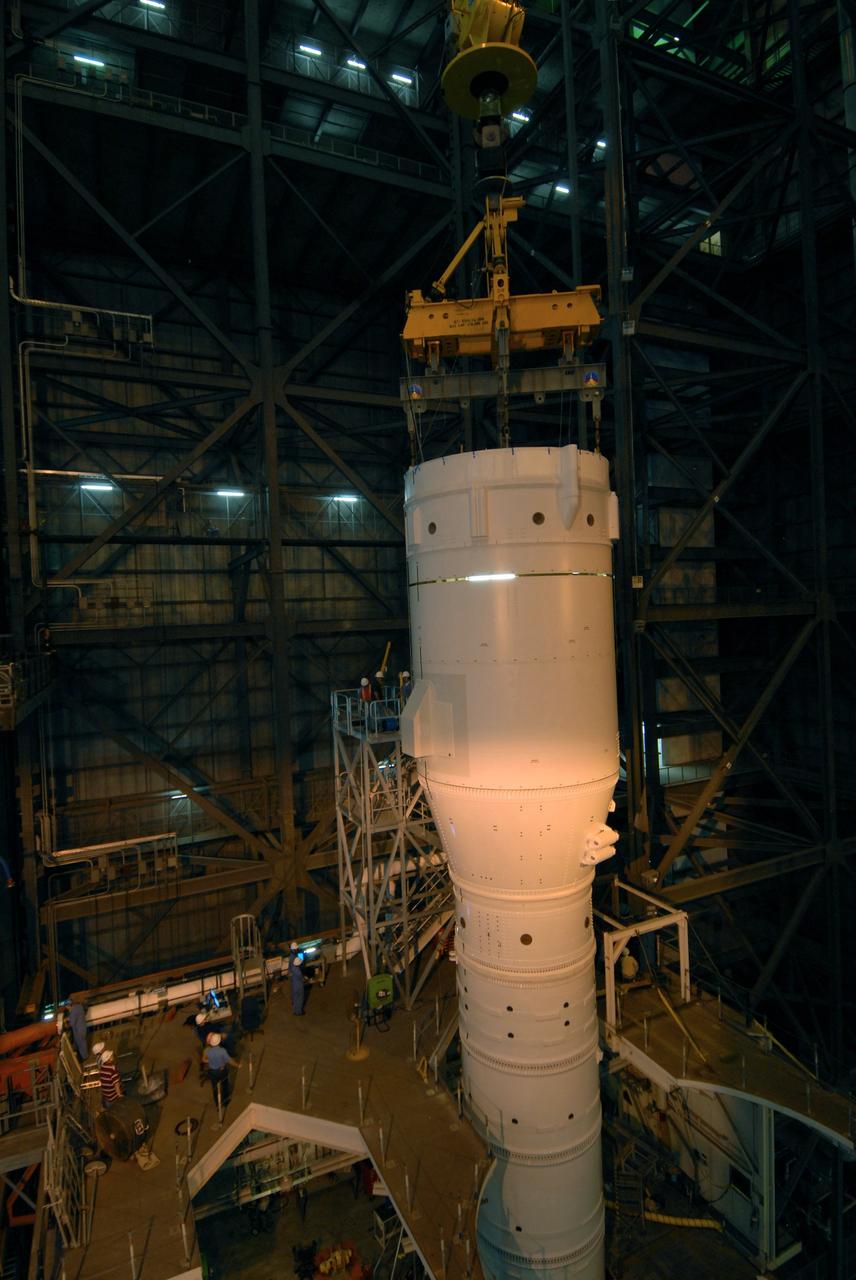
CAPE CANAVERAL, Fla. – In the Vehicle Assembly Building at NASA's Kennedy Space Center in Florida, segments of the Ares I-X first stage are mated to the fifth simulator segment, completing Super Stack 1. The super stack comprises the forward skirt, forward skirt extension, interstages 1 and 2 and the fifth segment simulator. Ares I-X is the test vehicle for the Ares I, which is part of the Constellation Program to return men to the moon and beyond. The Ares I-X flight test is targeted no earlier than Aug. 30 from Launch Pad 39B. Photo credit: NASA/Jack Pfaller
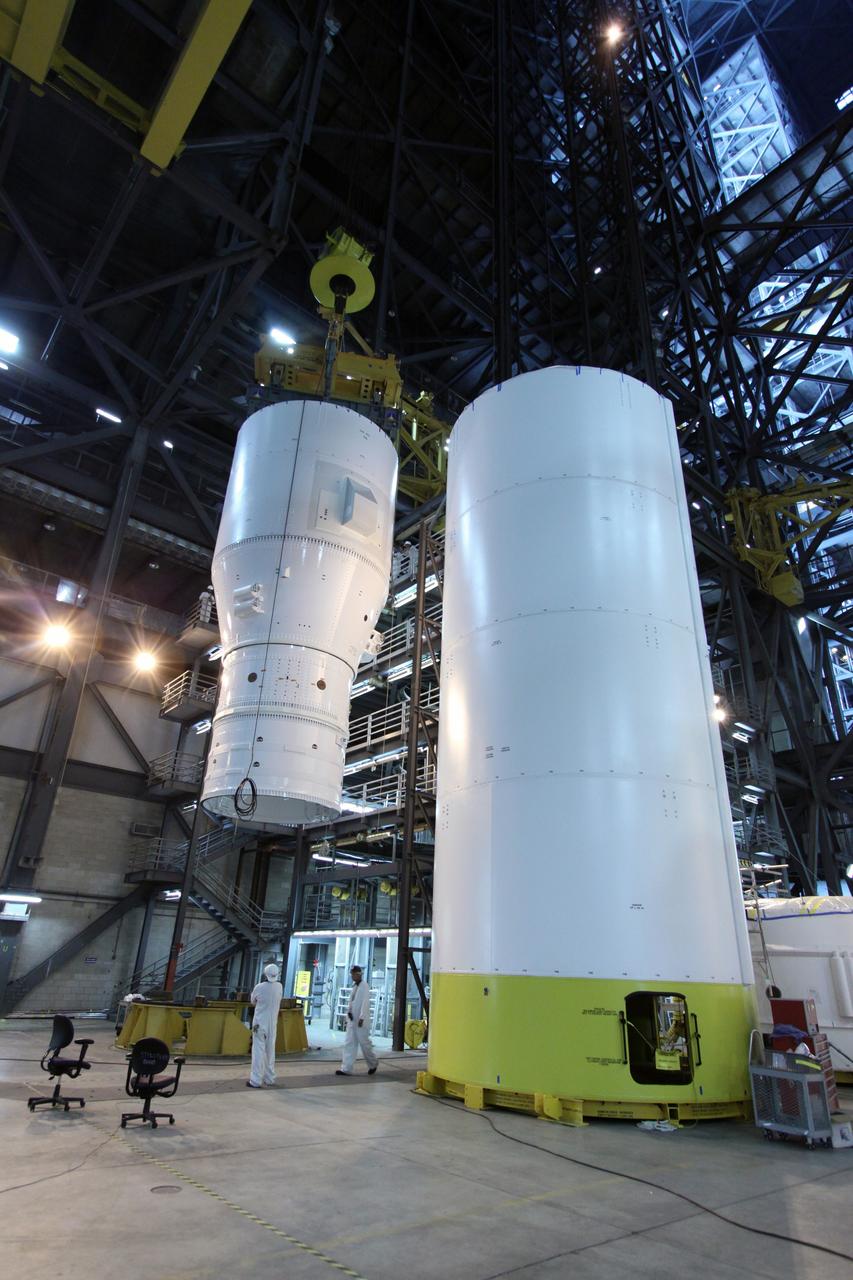
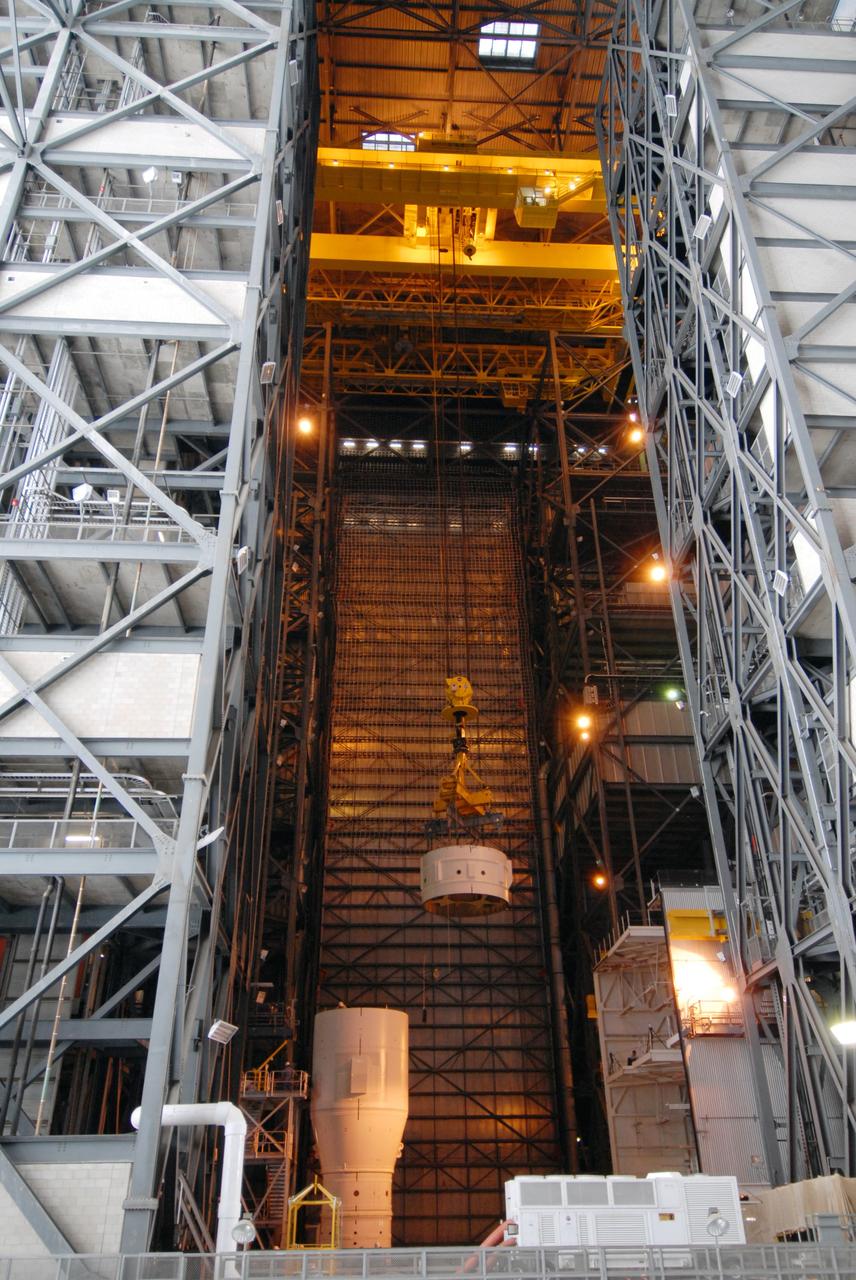
CAPE CANAVERAL, Fla. – In the Vehicle Assembly Building at NASA's Kennedy Space Center in Florida, segments of the Ares I-X first stage are moved across the bay. They will be stacked and mated to the fifth segment simulator, completing Super Stack 1. The super stack comprises the forward skirt, forward skirt extension, interstages 1 and 2 and the fifth segment simulator. Ares I-X is the test vehicle for the Ares I, which is part of the Constellation Program to return men to the moon and beyond. The Ares I-X flight test is targeted no earlier than Aug. 30 from Launch Pad 39B. Photo credit: NASA/Jack Pfaller
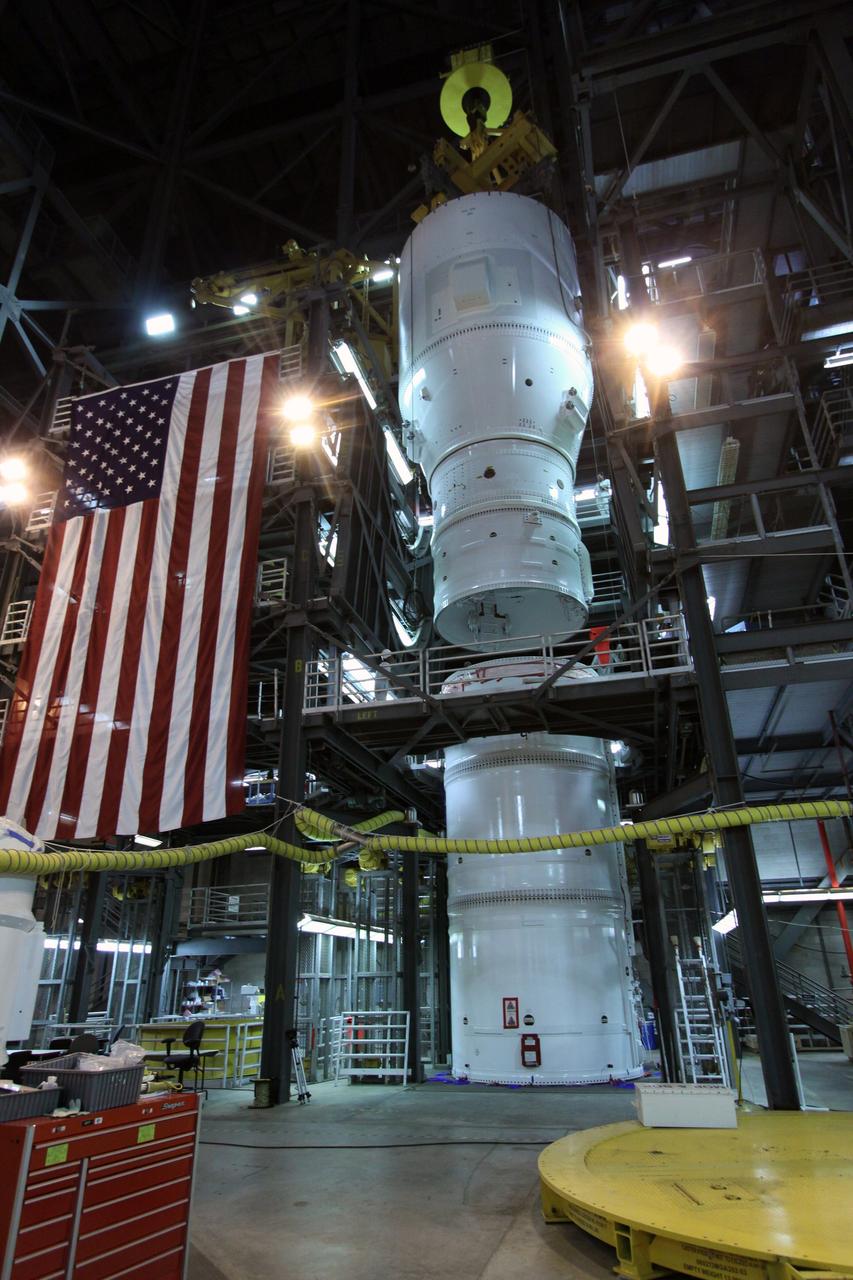
CAPE CANAVERAL, Fla. – In the Vehicle Assembly Building at NASA's Kennedy Space Center in Florida, segments of the Ares I-X first stage are lowered toward the fifth simulator segment for mating, to complete Super Stack 1. The super stack comprises the forward skirt, forward skirt extension, interstages 1 and 2 and the fifth segment simulator. Ares I-X is the test vehicle for the Ares I, which is part of the Constellation Program to return men to the moon and beyond. The Ares I-X flight test is targeted no earlier than Aug. 30 from Launch Pad 39B. Photo credit: NASA/Jack Pfaller
CAPE CANAVERAL, Fla. – In the Vehicle Assembly Building at NASA's Kennedy Space Center in Florida, segments of the Ares I-X first stage are fitted with a crane to lift it to the fifth segment simulator for mating, completing Super Stack 1. The super stack comprises the forward skirt, forward skirt extension, interstages 1 and 2 and the fifth segment simulator. Ares I-X is the test vehicle for the Ares I, which is part of the Constellation Program to return men to the moon and beyond. The Ares I-X flight test is targeted no earlier than Aug. 30 from Launch Pad 39B. Photo credit: NASA/Jack Pfaller
CAPE CANAVERAL, Fla. – In the Vehicle Assembly Building at NASA's Kennedy Space Center in Florida, segments of the Ares I-X first stage move past other stacks toward the fifth simulator segment stack at right. The two stacks will be mated, completing Super Stack 1. The super stack comprises the forward skirt, forward skirt extension, interstages 1 and 2 and the fifth segment simulator. Ares I-X is the test vehicle for the Ares I, which is part of the Constellation Program to return men to the moon and beyond. The Ares I-X flight test is targeted no earlier than Aug. 30 from Launch Pad 39B. Photo credit: NASA/Jack Pfaller
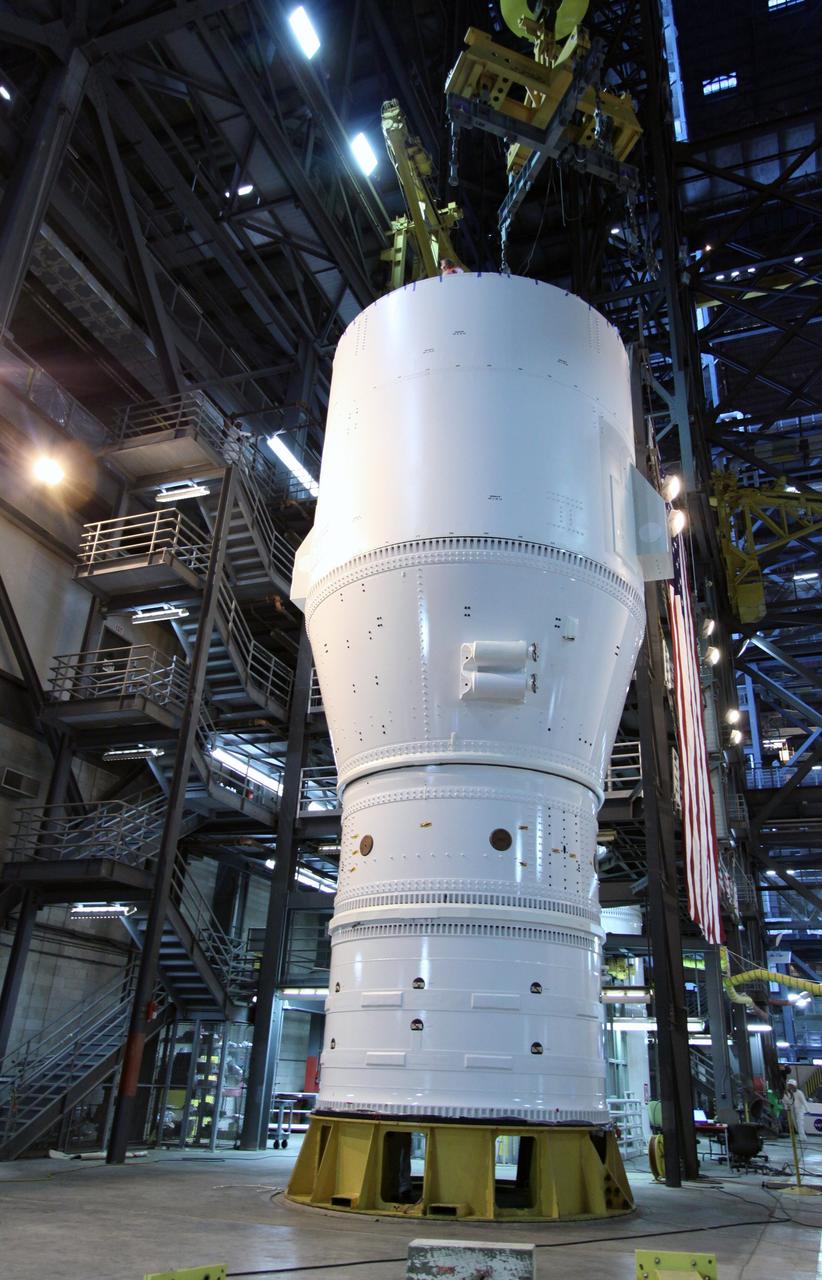
CAPE CANAVERAL, Fla. – In the Vehicle Assembly Building at NASA's Kennedy Space Center in Florida, segments of the Ares I-X first stage are lifted from the stand. The segments are being moved for stacking and mating to the fifth segment simulator, completing Super Stack 1. The super stack comprises the forward skirt, forward skirt extension, interstages 1 and 2 and the fifth segment simulator. Ares I-X is the test vehicle for the Ares I, which is part of the Constellation Program to return men to the moon and beyond. The Ares I-X flight test is targeted no earlier than Aug. 30 from Launch Pad 39B. Photo credit: NASA/Jack Pfaller
CAPE CANAVERAL, Fla. – In the Vehicle Assembly Building at NASA's Kennedy Space Center in Florida, the segments of the Ares I-X first stage are fitted with a crane to lift it to the fifth segment simulator for mating, completing Super Stack 1. The super stack comprises the forward skirt, forward skirt extension, interstages 1 and 2 and the fifth segment simulator. Ares I-X is the test vehicle for the Ares I, which is part of the Constellation Program to return men to the moon and beyond. The Ares I-X flight test is targeted no earlier than Aug. 30 from Launch Pad 39B. Photo credit: NASA/Jack Pfaller
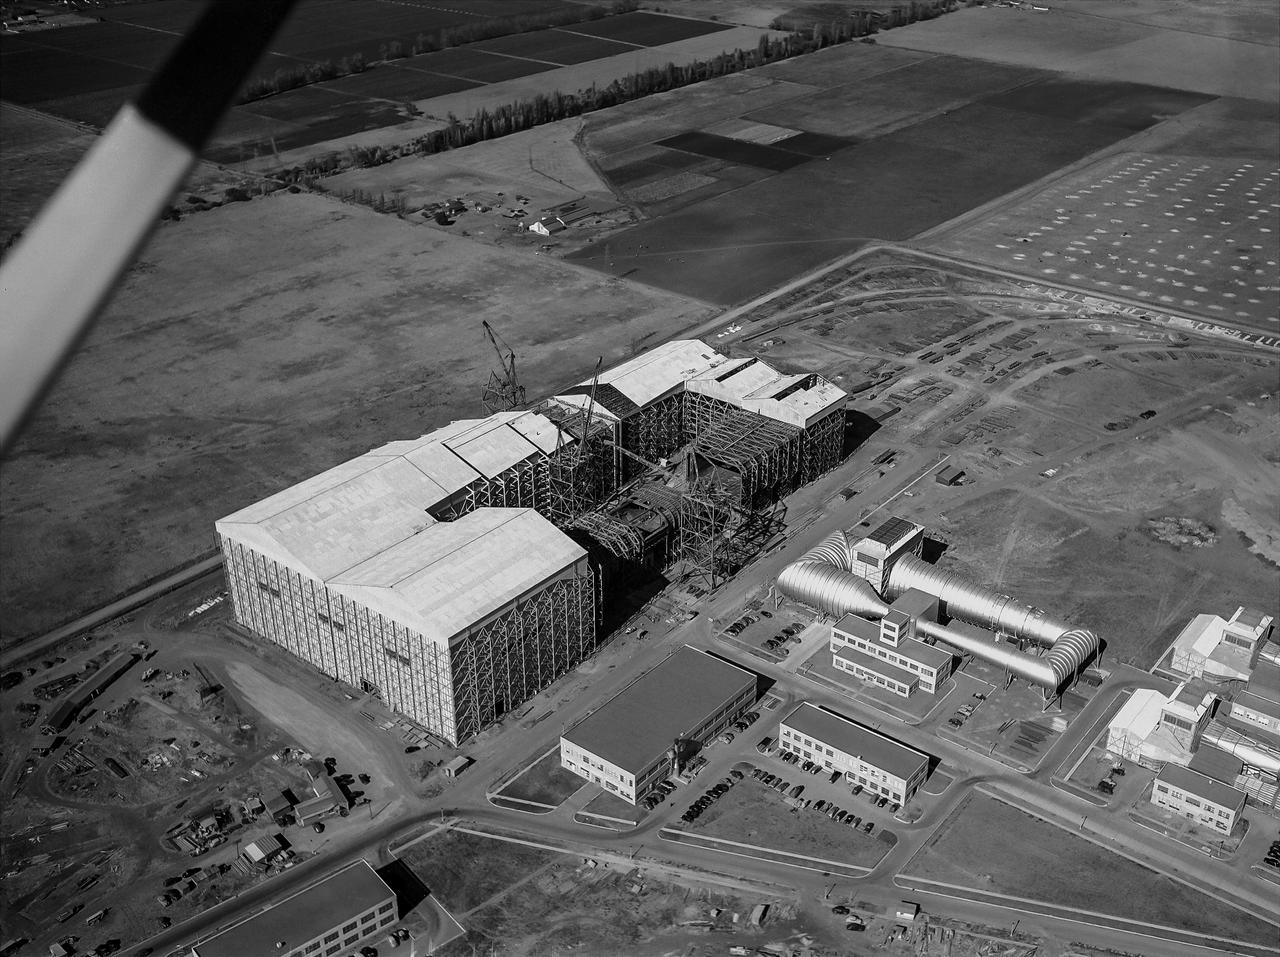
Aerial view looking North West of the nearly completed 40 x 80 foot wind tunnel. Drive and test section exposed. The facility covered 8 acres, and the air circuit was just over 1/2 mile long (2700 feet).
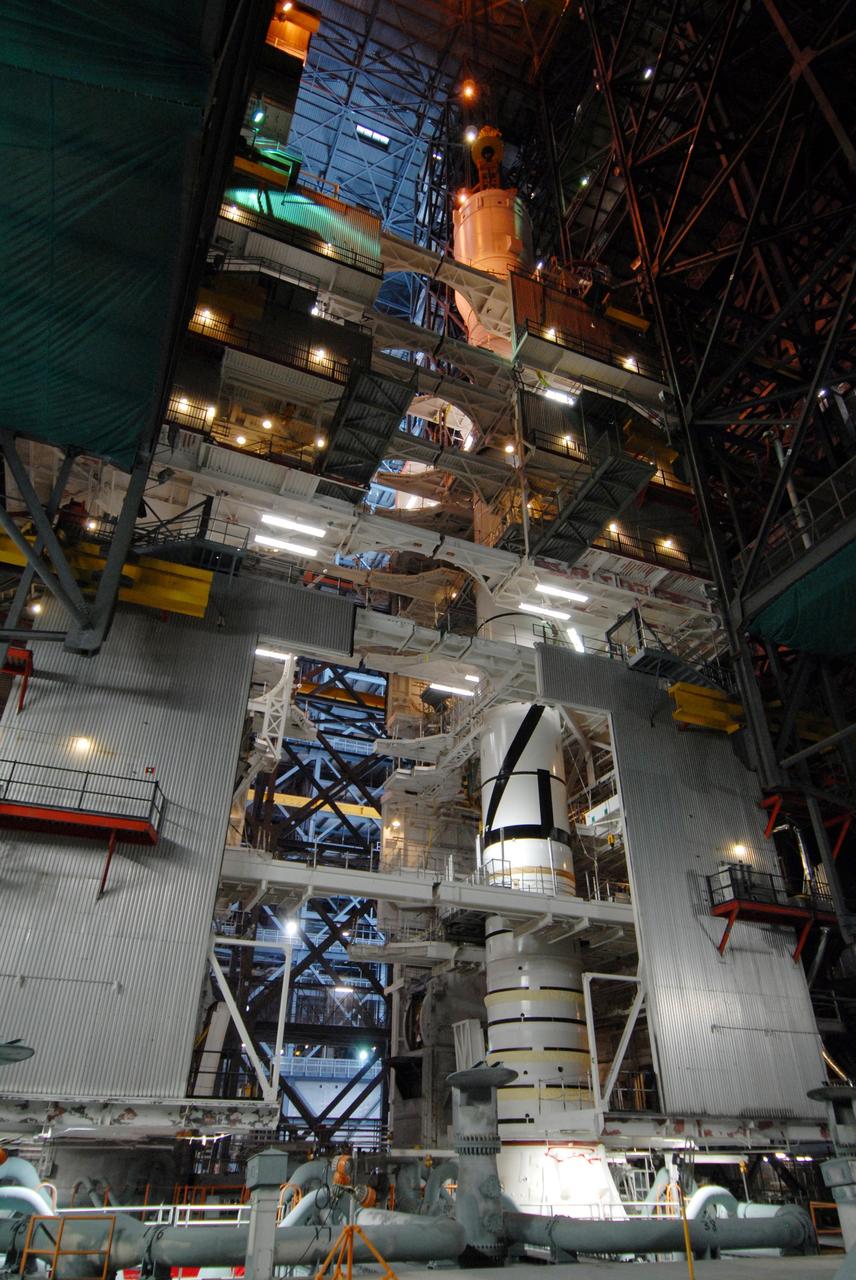
CAPE CANAVERAL, Fla. – In the Vehicle Assembly Building's High Bay 3 at NASA's Kennedy Space Center in Florida, a crane has lowered Super Stack 2, part of the Ares I-X upper stage, onto Super Stack 1 for assembly. The upper stage comprises five super stacks, which are integrated with the four-segment solid rocket booster first stage on the mobile launch platform. Ares I-X is the test vehicle for the Ares I, which is part of the Constellation Program to return men to the moon and beyond. The Ares I-X flight test is targeted for Oct. 31, pending formal NASA Headquarters approval. Photo credit: NASA/Tim Jacobs
CAPE CANAVERAL, Fla. – In the Vehicle Assembly Building's High Bay 3 at NASA's Kennedy Space Center in Florida, a crane has lowered Super Stack 2, part of the Ares I-X upper stage, onto Super Stack 1 for integration atop the first stage, which comprises four solid rocket booster segments, on the mobile launch platform. Ares I-X is the test vehicle for the Ares I, which is part of the Constellation Program to return men to the moon and beyond. The Ares I-X flight test is targeted for Oct. 31, pending formal NASA Headquarters approval. Photo credit: NASA/Tim Jacobs
CAPE CANAVERAL, Fla. – In the Vehicle Assembly Building's High Bay 3 at NASA's Kennedy Space Center in Florida, a crane lowers Super Stack 2, part of the Ares I-X upper stage, for attachment with Super Stack 1 below. The upper stage comprises five super stacks, which are integrated with the four-segment solid rocket booster first stage on the mobile launch platform. Ares I-X is the test vehicle for the Ares I, which is part of the Constellation Program to return men to the moon and beyond. The Ares I-X flight test is targeted for Oct. 31, pending formal NASA Headquarters approval. Photo credit: NASA/Tim Jacobs
CAPE CANAVERAL, Fla. – In the Vehicle Assembly Building's High Bay 3 at NASA's Kennedy Space Center in Florida, a crane lowers Super Stack 2, part of the Ares I-X upper stage, onto Super Stack 1 for integration. The upper stage comprises five super stacks, which are integrated with the four-segment solid rocket booster first stage on the mobile launch platform. Ares I-X is the test vehicle for the Ares I, which is part of the Constellation Program to return men to the moon and beyond. The Ares I-X flight test is targeted for Oct. 31, pending formal NASA Headquarters approval. Photo credit: NASA/Tim Jacobs
CAPE CANAVERAL, Fla. – In the Vehicle Assembly Building's High Bay 3 at NASA's Kennedy Space Center in Florida, a crane lowers Super Stack 2, part of the Ares I-X upper stage, for integration with Super Stack 1. The upper stage comprises five super stacks, which are integrated with the four-segment solid rocket booster first stage on the mobile launch platform. Ares I-X is the test vehicle for the Ares I, which is part of the Constellation Program to return men to the moon and beyond. The Ares I-X flight test is targeted for Oct. 31, pending formal NASA Headquarters approval. Photo credit: NASA/Tim Jacobs
CAPE CANAVERAL, Fla. – In the Vehicle Assembly Building's High Bay 3 at NASA's Kennedy Space Center in Florida, a crane lowers Super Stack 2, part of the Ares I-X upper stage, onto Super Stack 1 for integration. The upper stage comprises five super stacks, which are integrated with the four-segment solid rocket booster first stage on the mobile launch platform. Ares I-X is the test vehicle for the Ares I, which is part of the Constellation Program to return men to the moon and beyond. The Ares I-X flight test is targeted for Oct. 31, pending formal NASA Headquarters approval. Photo credit: NASA/Tim Jacobs
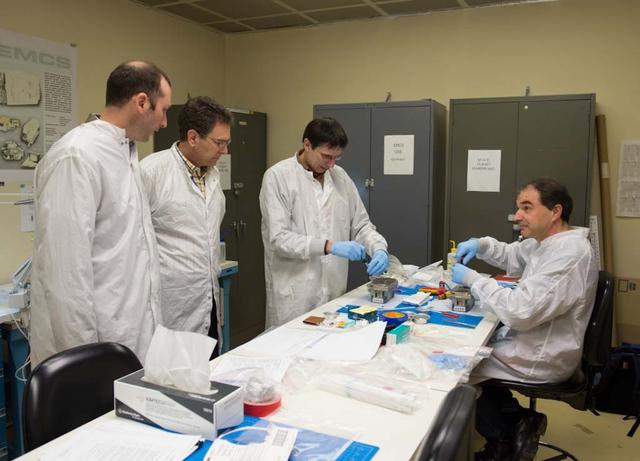
TROPI Seed Growth-1 payload (will fly to ISS on Space X 2) from left to right are Krisofer Vogelsong, Project Science Lead, Tropi SG-1, Lockheed Martin, NASA Ames, John Freeman Plant Scientist, Tropi SG-1, intrinsyx, NASA Ames, Reinhard Born, Europeon Modular Culitivation System Payload Engineering Manager standing and Thomas Neidermaier, Europeon Modular Culitivation System Payload Intergration Manager both from Astrium Space Transportaton ESA, Friedrichshafen, Germany.
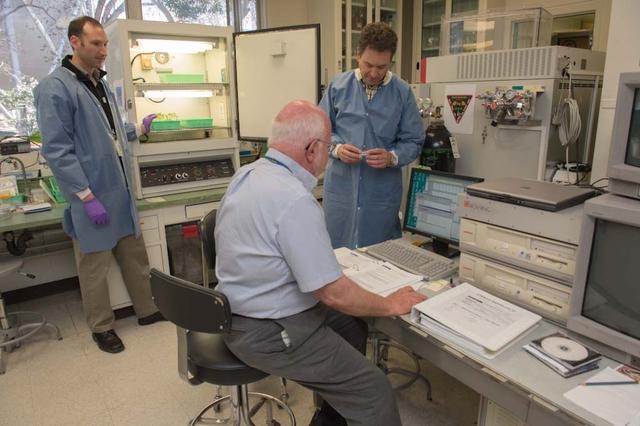
TROPI Seed Growth-1 payload (will fly to ISS on Space X 2) from left to right are Krisofer Vogelsong, Project Science Lead, Tropi SG-1, Lockheed Martin, NASA Ames, John Freeman Plant Scientist, Tropi SG-1, intrinsyx, NASA Ames, seated Dave Heathcote, ISS Payload Support, Lockheed Martin, NASA Ames
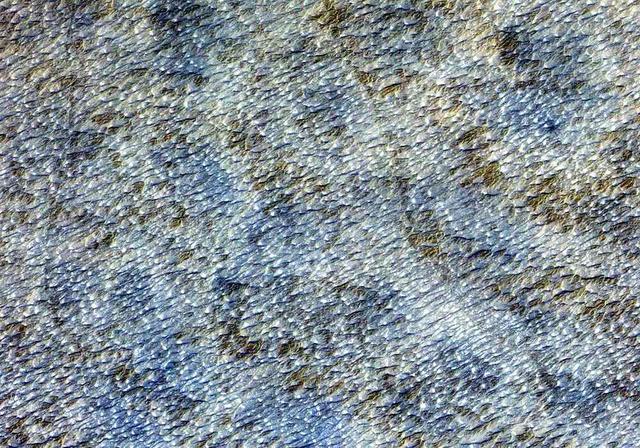
![There are many dust devils on Mars -- little twisters that raise dust from the surface. They have also cleaned dust off of the solar panels of the rovers Opportunity and Spirit, improving the solar power production. (Spirit became stuck in 2009 and ceased communication a year later.) HiRISE sees many dust-devil tracks on Mars, but rarely captures an active feature because the images cover such small areas and because the typical time of day near 3 p.m. is past the peak heating and dust-devil activity. The map is projected here at a scale of 25 centimeters (9.8 inches) per pixel. [The original image scale is 29.5 centimeters (11.6 inches) per pixel (with 1 x 1 binning) to 58.9 centimeters (23.2 inches) per pixel (with 2 x 2 binning)]. North is up. http://photojournal.jpl.nasa.gov/catalog/PIA21457](https://images-assets.nasa.gov/image/PIA21457/PIA21457~medium.jpg)
There are many dust devils on Mars -- little twisters that raise dust from the surface. They have also cleaned dust off of the solar panels of the rovers Opportunity and Spirit, improving the solar power production. (Spirit became stuck in 2009 and ceased communication a year later.) HiRISE sees many dust-devil tracks on Mars, but rarely captures an active feature because the images cover such small areas and because the typical time of day near 3 p.m. is past the peak heating and dust-devil activity. The map is projected here at a scale of 25 centimeters (9.8 inches) per pixel. [The original image scale is 29.5 centimeters (11.6 inches) per pixel (with 1 x 1 binning) to 58.9 centimeters (23.2 inches) per pixel (with 2 x 2 binning)]. North is up. http://photojournal.jpl.nasa.gov/catalog/PIA21457
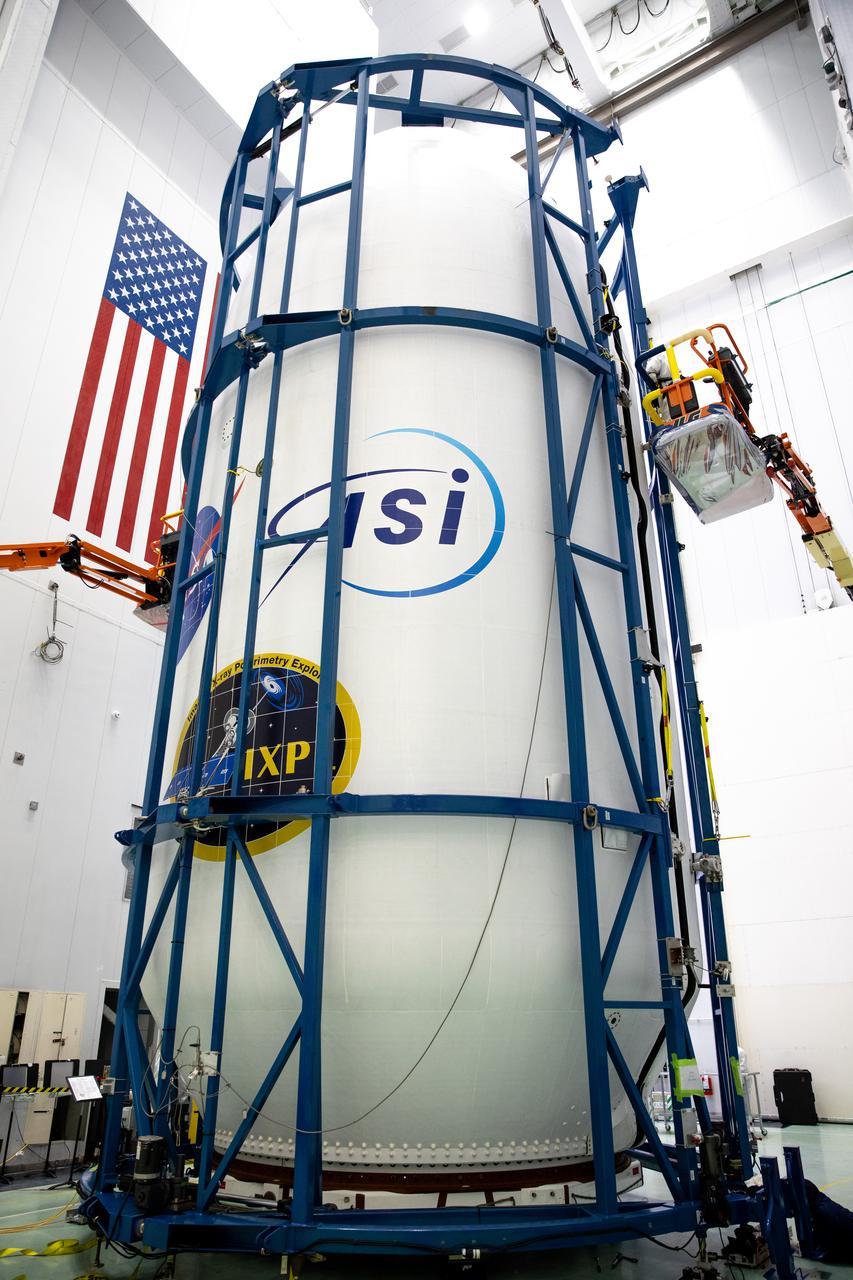
NASA’s Imaging X-Ray Polarimetry Explorer (IXPE) spacecraft and nose fairing are brought together for encapsulation inside SpaceX’s Payload Processing Facility at Kennedy Space Center in Florida on Dec. 2, 2021. The mission is scheduled to launch no earlier than Thursday, Dec. 9, at 1 a.m. EST, on a SpaceX Falcon 9 rocket from Launch Complex 39A at NASA’s Kennedy Space Center in Florida. IXPE is the first satellite dedicated to measuring the polarization of X-rays from a variety of cosmic sources, such as black holes and neutron stars.
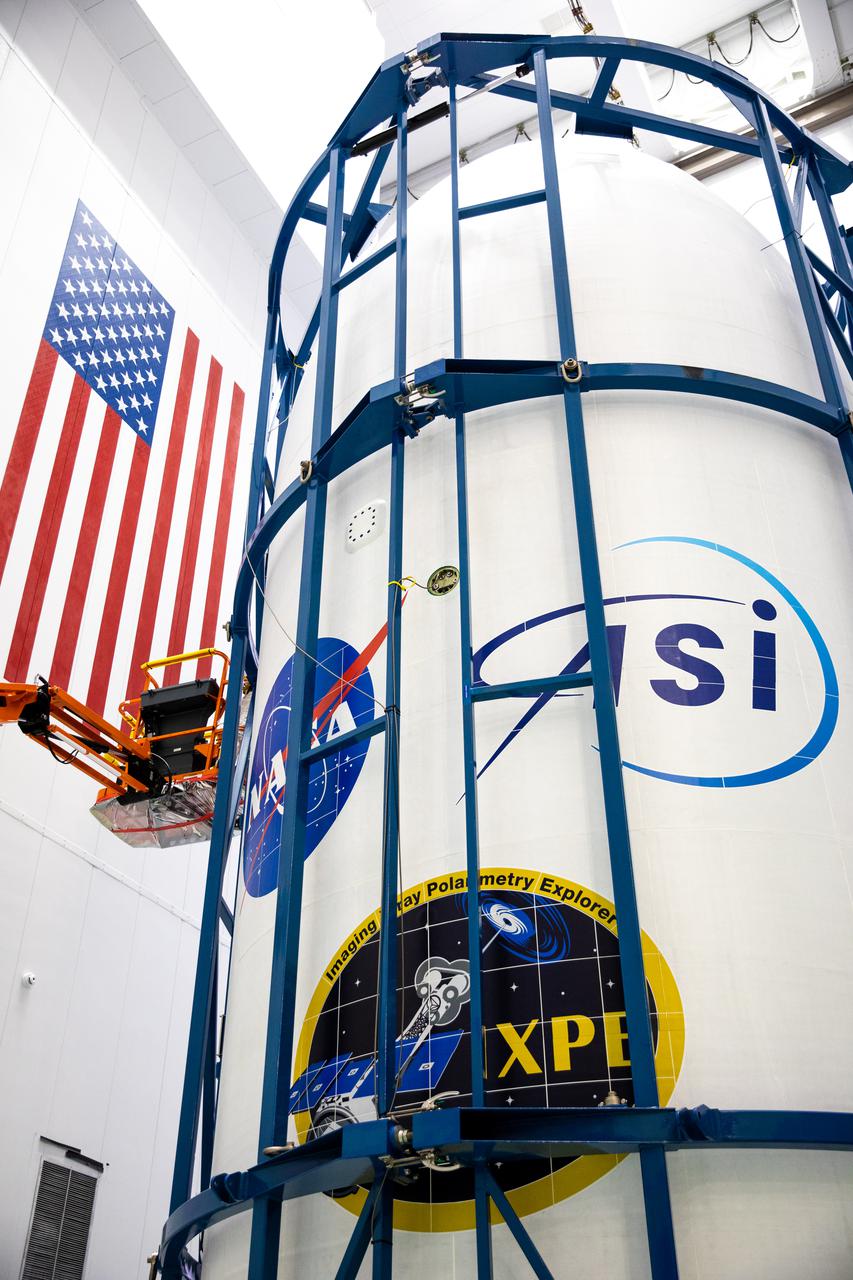
NASA’s Imaging X-Ray Polarimetry Explorer (IXPE) spacecraft and nose fairing are brought together for encapsulation inside SpaceX’s Payload Processing Facility at Kennedy Space Center in Florida on Dec. 2, 2021. The mission is scheduled to launch no earlier than Thursday, Dec. 9, at 1 a.m. EST, on a SpaceX Falcon 9 rocket from Launch Complex 39A at NASA’s Kennedy Space Center in Florida. IXPE is the first satellite dedicated to measuring the polarization of X-rays from a variety of cosmic sources, such as black holes and neutron stars.
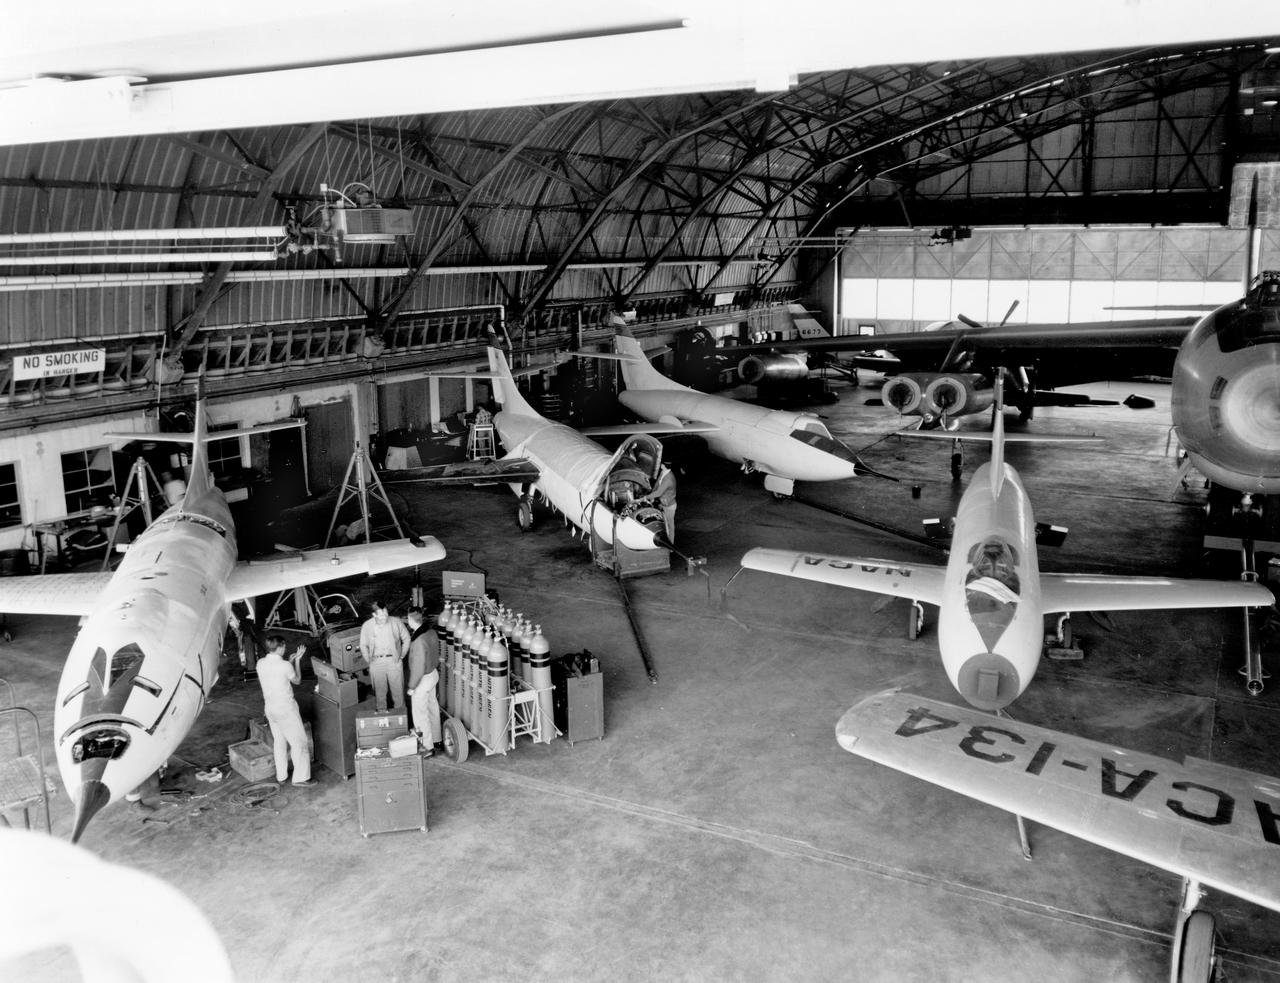
The aircraft in this 1953 photo of the National Advisory Committee for Aeronautics (NACA) hangar at South Base of Edwards Air Force Base showed the wide range of research activities being undertaken. On the left side of the hangar are the three D-558-2 research aircraft. These were designed to test swept wings at supersonic speeds approaching Mach 2. The front D-558-2 is the third built (NACA 145/Navy 37975). It has been modified with a leading-edge chord extension. This was one of a number of wing modifications, using different configurations of slats and/or wing fences, to ease the airplane's tendency to pitch-up. NACA 145 had both a jet and a rocket engine. The middle aircraft is NACA 144 (Navy 37974), the second built. It was all-rocket powered, and Scott Crossfield made the first Mach 2 flight in this aircraft on November 20, 1953. The aircraft in the back is D-558-2 number 1. NACA 143 (Navy 37973) was also carried both a jet and a rocket engine in 1953. It had been used for the Douglas contractor flights, then was turned over to the NACA. The aircraft was not converted to all-rocket power until June 1954. It made only a single NACA flight before NACA's D-558-2 program ended in 1956. Beside the three D-558-2s is the third D-558-1. Unlike the supersonic D-558-2s, it was designed for flight research at transonic speeds, up to Mach 1. The D-558-1 was jet-powered, and took off from the ground. The D-558-1's handling was poor as it approached Mach 1. Given the designation NACA 142 (Navy 37972), it made a total of 78 research flights, with the last in June 1953. In the back of the hangar is the X-4 (Air Force 46-677). This was a Northrop-built research aircraft which tested a swept wing design without horizontal stabilizers. The aircraft proved unstable in flight at speeds above Mach 0.88. The aircraft showed combined pitching, rolling, and yawing motions, and the design was considered unsuitable. The aircraft, the second X-4 built, was then used as a pilot traine
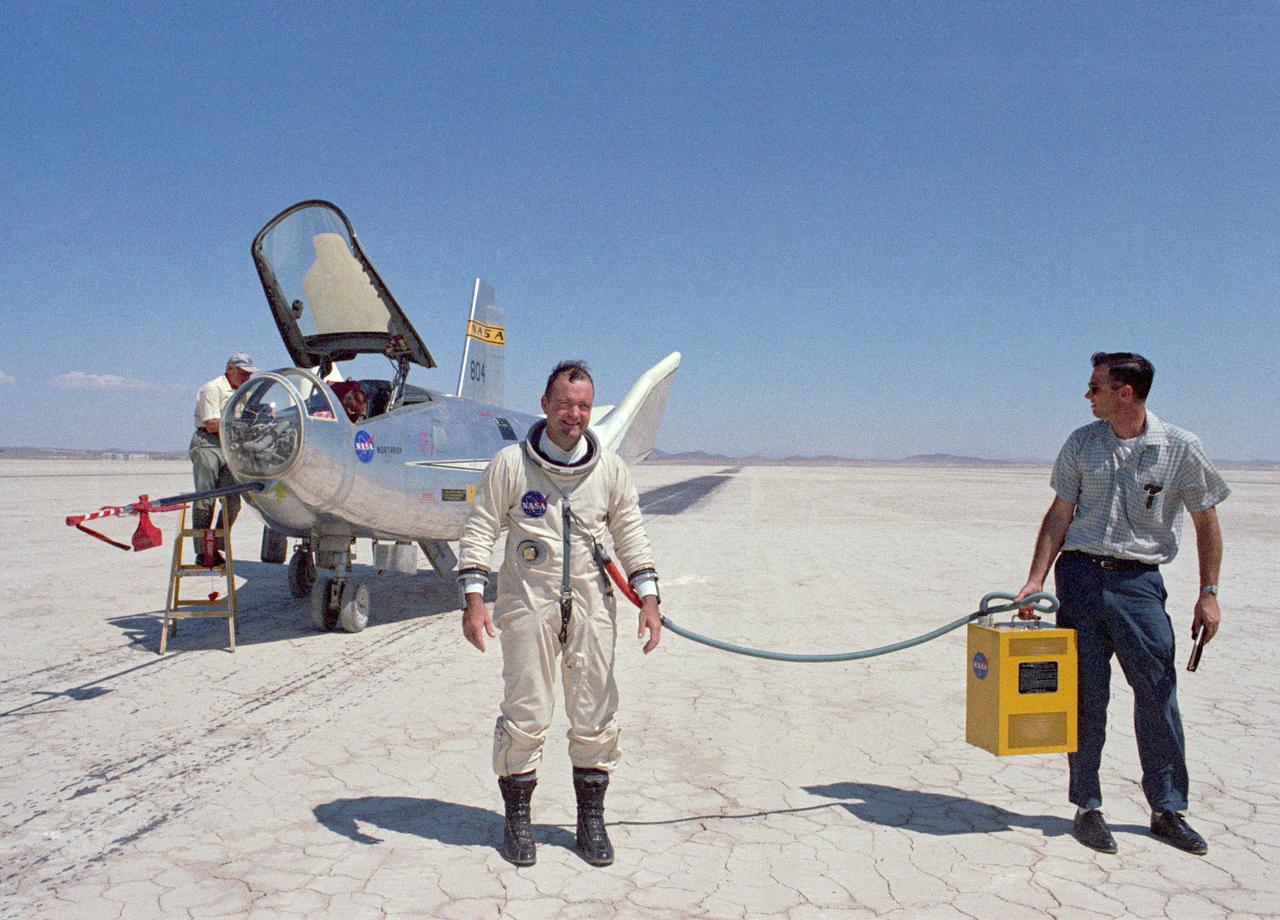
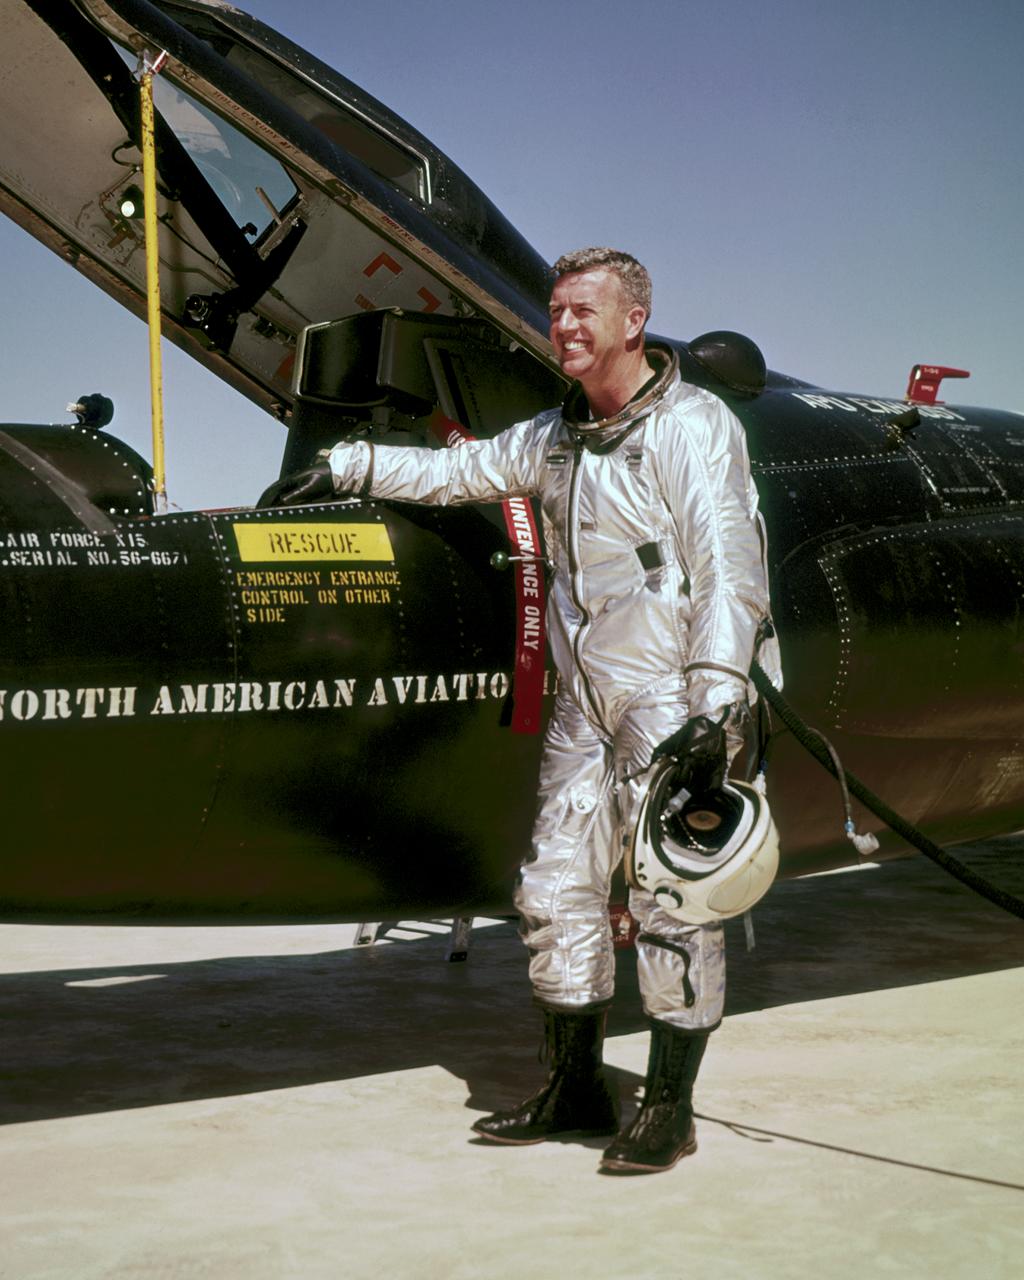
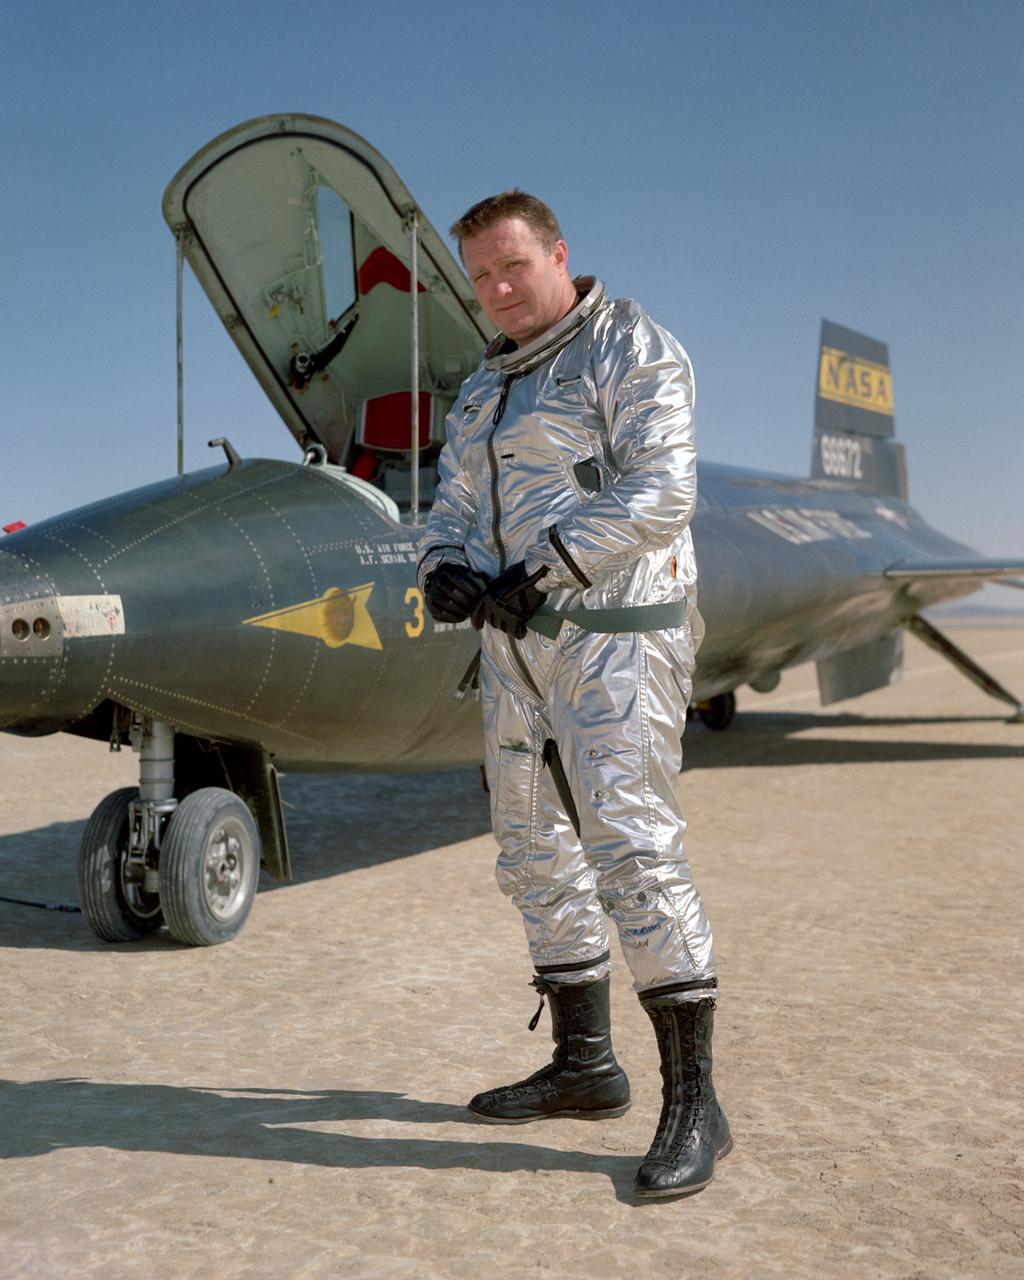
NASA research pilot Bill Dana after his fourth free flight (1 glide and 3 powered) in the HL-10. This particular flight reached a maximum speed of Mach 1.45. Dana made a total of nine HL-10 flights (1 glide and 8 powered), and his lifting body experience as a whole included several car tow and 1 air tow flights in the M2-F1; 4 glide and 15 powered flights in the M2-F3; and 2 powered flights in the X-24B. He is wearing a pressure suit for protection against the cockpit depressurizing at high altitudes. The air conditioner box held by the ground crewman provides cool air to prevent overheating.

STS059-S-086 (18 April 1994) --- This is a three-frequency false-color image of Flevoland, the Netherlands, centered at 52.4 degrees north latitude, and 5.4 degrees east longitude. This image was acquired by the Spaceborne Imaging Radar-C and X-Band Synthetic Aperture Radar (SIR-C/X-SAR) aboard the Space Shuttle Endeavour on April 14, 1994. It was produced by combining data from the X-Band, C-Band and L-Band radar's. The area shown is approximately 25 by 28 kilometers (15 1/2 by 17 1/2 miles). Flevoland, which fills the lower two-thirds of the image, is a very flat area that is made up of reclaimed land that is used for agriculture and forestry. At the top of the image, across the canal from Flevoland, is an older forest shown in red; the city of Harderwijk is shown in white on the shore of the canal. At this time of the year, the agricultural fields are bare soil, and they show up in this images in blue. The changes in the brightness of the blue areas are equal to the changes in roughness. The dark blue areas are water and the small dots in the canal are boats. This SIR-C/X-SAR supersite is being used for both calibration and agricultural studies. Several soil and crop ground-truth studies will be conducted during the Shuttle flight. In addition, about 10 calibration devices and 10 corner reflectors have been deployed to calibrate and monitor the radar signal. One of these transponders can be seen as a bright star in the lower right quadrant of the image. This false-color image was made using L-Band total power in the red channel, C-Band total power in the green channel, and X-Band VV polarization in the blue channel. SIR-C/X-SAR is part of NASA's Mission to Planet Earth (MTPE). SIR-C/X-SAR radars illuminate Earth with microwaves allowing detailed observations at any time, regardless of weather or sunlight conditions. SIR-C/X-SAR uses three microwave wavelengths: L-Band (24 cm), C-Band (6 cm), and X-Band (3 cm). The multi-frequency data will be used by the international scientific community to better understand the global environment and how it is changing. The SIR-C/X-SAR data, complemented by aircraft and ground studies, will give scientists clearer insights into those environmental changes which are caused by nature and those changes which are induced by human activity. SIR-C was developed by NASA's Jet Propulsion Laboratory (JPL). X-SAR was developed by the Dornire and Alenia Spazio Companies for the German Space Agency, Deutsche Agentur fuer Raumfahrtangelegenheiten (DARA), and the Italian Space Agency, Agenzia Spaziale Italiana (ASI). JPL Photo ID: P-43941
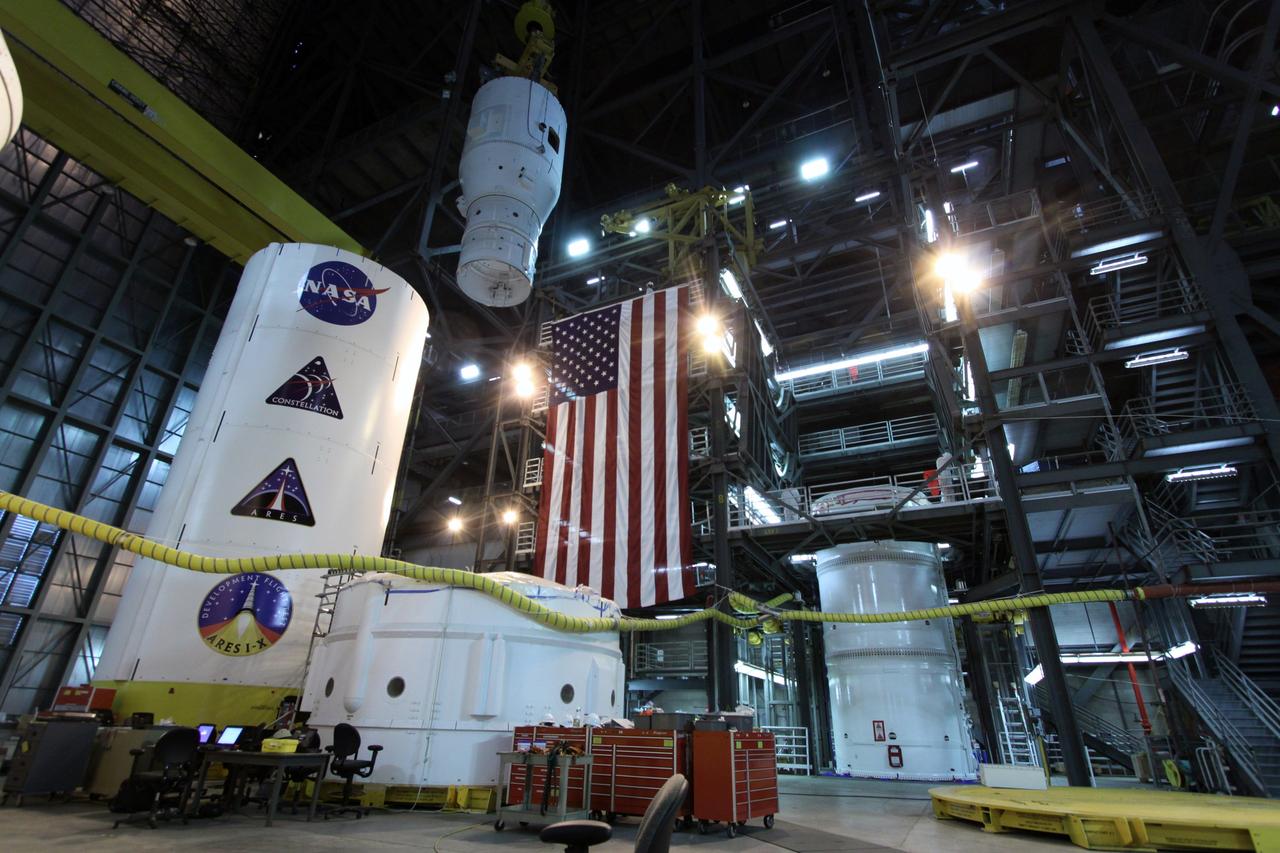
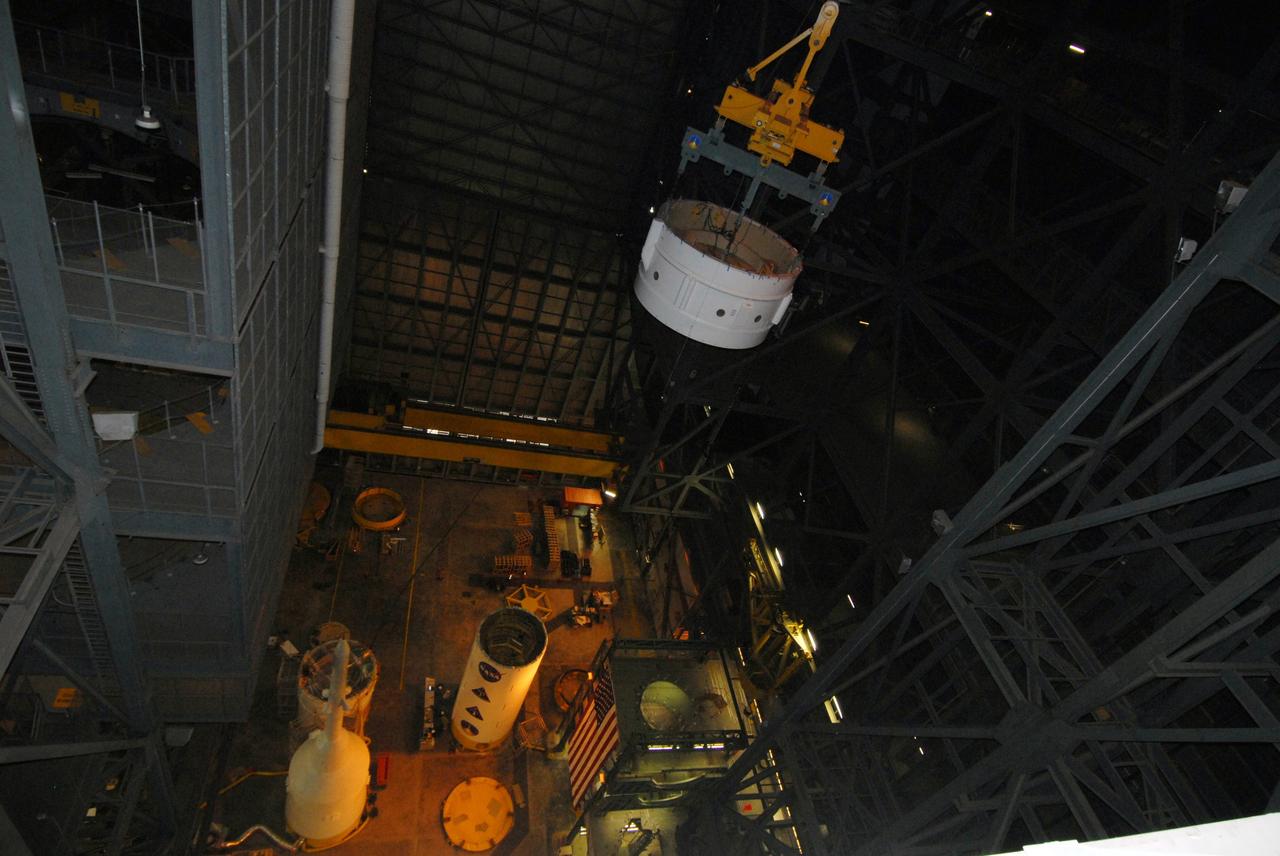
CAPE CANAVERAL, Fla. – In the Vehicle Assembly Building's High Bay 4 at NASA's Kennedy Space Center in Florida, a crane lifts Super Stack 2, part of the Ares I-X upper stage. The stack is being moved across the transfer aisle for attachment to Super Stack 1 in High Bay 3. Beneath is seen Super Stack 3 and at left is the crew module-launch abort system, or CM-LAS, and simulator service module-service adapter stack. The upper stage comprises five super stacks, which are integrated with the four-segment solid rocket booster first stage on the mobile launch platform. Ares I-X is the test vehicle for the Ares I, which is part of the Constellation Program to return men to the moon and beyond. The Ares I-X flight test is targeted for Oct. 31, pending formal NASA Headquarters approval. Photo credit: NASA/Tim Jacobs
CAPE CANAVERAL, Fla. – In the Vehicle Assembly Building's High Bay 4 at NASA's Kennedy Space Center in Florida, a crane lifts Super Stack 2, part of the Ares I-X upper stage. The stack is being moved across the transfer aisle for attachment to Super Stack 1 in High Bay 3. Beneath can be seen Super Stack 3 and at left is the crew module-launch abort system, or CM-LAS, and simulator service module-service adapter stack. The upper stage comprises five super stacks, which are integrated with the four-segment solid rocket booster first stage on the mobile launch platform. Ares I-X is the test vehicle for the Ares I, which is part of the Constellation Program to return men to the moon and beyond. The Ares I-X flight test is targeted for Oct. 31, pending formal NASA Headquarters approval. Photo credit: NASA/Tim Jacobs
CAPE CANAVERAL, Fla. – In the Vehicle Assembly Building's High Bay 4 at NASA's Kennedy Space Center in Florida, a crane lifts Super Stack 2, part of the Ares I-X upper stage. The stack is being moved across the transfer aisle for attachment to Super Stack 1 in High Bay 3. Beneath is seen Super Stack 3 and at left is the crew module-launch abort system, or CM-LAS, and simulator service module-service adapter stack. The upper stage comprises five super stacks, which are integrated with the four-segment solid rocket booster first stage on the mobile launch platform. Ares I-X is the test vehicle for the Ares I, which is part of the Constellation Program to return men to the moon and beyond. The Ares I-X flight test is targeted for Oct. 31, pending formal NASA Headquarters approval. Photo credit: NASA/Tim Jacobs

CAPE CANAVERAL, Fla. – In the Vehicle Assembly Building's High Bay 4 at NASA's Kennedy Space Center in Florida, a crane lifts Super Stack 2, part of the Ares I-X upper stage. The stack will be attached to Super Stack 1 across the transfer aisle in High Bay 3. At left is Super Stack 3. The upper stage comprises five super stacks, which are integrated with the four-segment solid rocket booster first stage on the mobile launch platform. Ares I-X is the test vehicle for the Ares I, which is part of the Constellation Program to return men to the moon and beyond. The Ares I-X flight test is targeted for Oct. 31, pending formal NASA Headquarters approval. Photo credit: NASA/Tim Jacobs
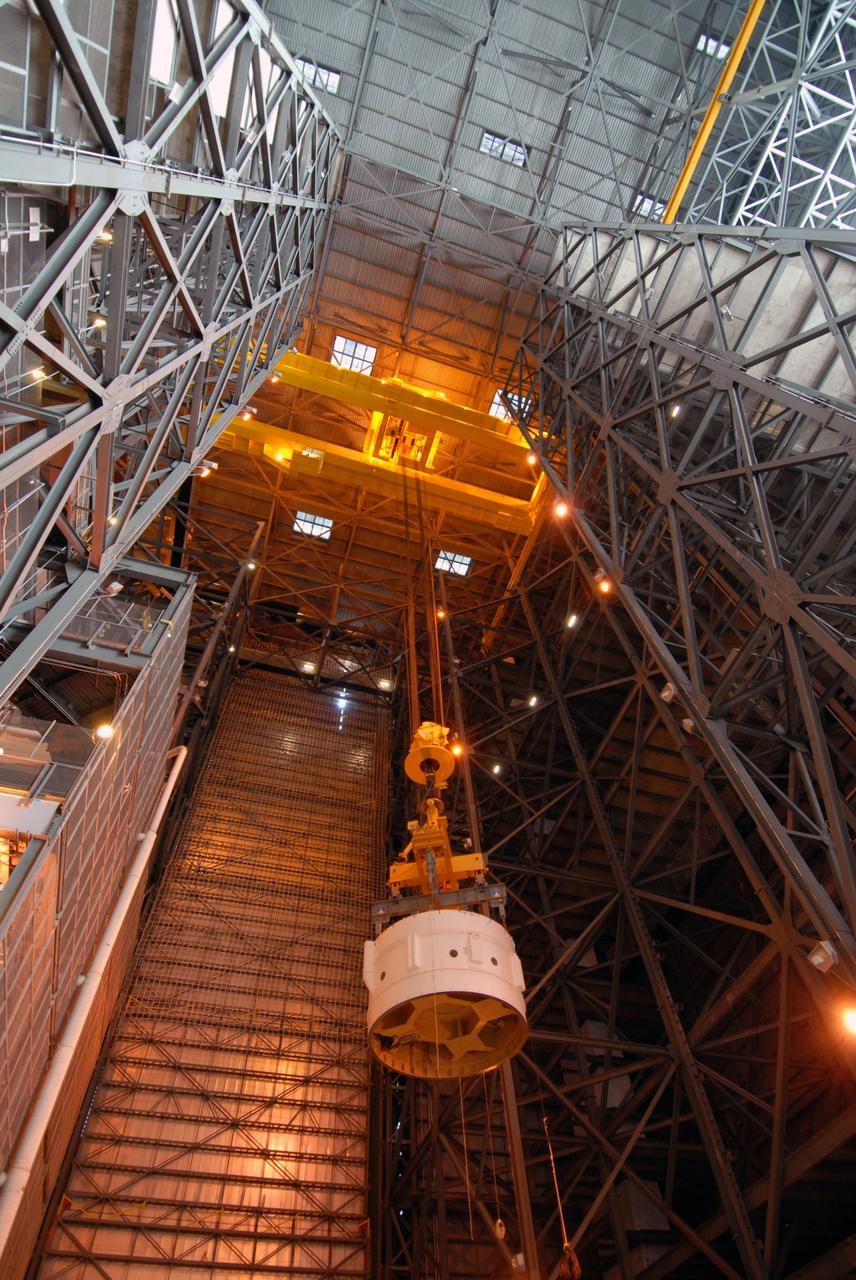
CAPE CANAVERAL, Fla. – In the Vehicle Assembly Building's High Bay 4 at NASA's Kennedy Space Center in Florida, a crane lifts Super Stack 2, part of the Ares I-X upper stage, into the upper levels. The stack is being moved across the transfer aisle for attachment to Super Stack 1 in High Bay 3. The upper stage comprises five super stacks, which are integrated with the four-segment solid rocket booster first stage on the mobile launch platform. Ares I-X is the test vehicle for the Ares I, which is part of the Constellation Program to return men to the moon and beyond. The Ares I-X flight test is targeted for Oct. 31, pending formal NASA Headquarters approval. Photo credit: NASA/Tim Jacobs
This ASTER image covers an area of 10.5 x 15 km in southern Afghanistan and was acquired on August 20, 2000. The band 3-2-1 composite shows part of an extensive field of barchan sand dunes south of Kandahar. The shape of the dunes indicates that the prevailing wind direction is from the west. The image is located at 30.7 degrees north latitude and 65.7 degrees east longitude. http://photojournal.jpl.nasa.gov/catalog/PIA11099
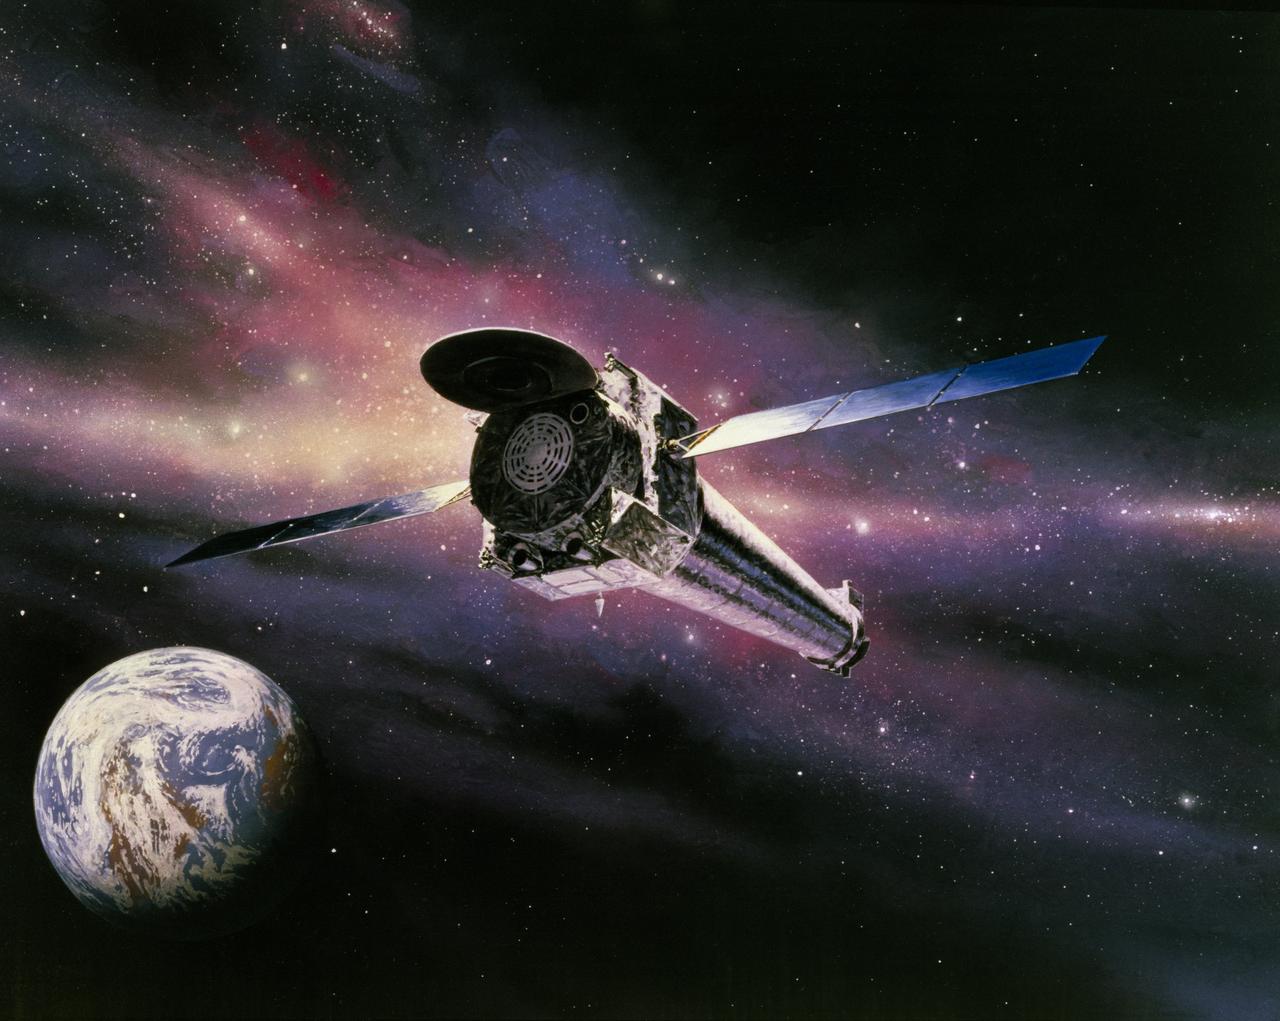
This is an artist's concept of the Chandra X-Ray Observatory (CXO), formerly Advanced X-Ray Astrophysics Facility (AXAF), fully developed in orbit in a star field with Earth. In 1999, the AXAF was renamed the CXO in honor of the late Indian-American Novel Laureate Subrahmanyan Chandrasekhar. The CXO is the most sophisticated and the world's most powerful x-ray telescope ever built. It is designed to observe x-rays from high energy regions of the Universe, such as hot gas in the renmants of exploded stars. It produces picture-like images of x-ray emissions analogous to those made in visible light, as well as gathers data on the chemical composition of x-ray radiating objects. The CXO helps astronomers world-wide better understand the structure and evolution of the universe by studying powerful sources of x-ray such as exploding stars, matter falling into black holes, and other exotic celestial objects. The Observatory has three major parts: (1) the x-ray telescope, whose mirrors will focus x-rays from celestial objects; (2) the science instruments that record the x-rays so that x-ray images can be produced and analyzed; and (3) the spacecraft, which provides the environment necessary for the telescope and the instruments to work. TRW, Inc. was the prime contractor for the development the CXO and NASA's Marshall Space Flight Center was responsible for its project management. The Smithsonian Astrophysical Observatory controls science and flight operations of the CXO for NASA from Cambridge, Massachusetts. The Observatory was launched July 22, 1999 aboard the Space Shuttle Columbia, STS-93 mission. (Image courtesy of TRW).
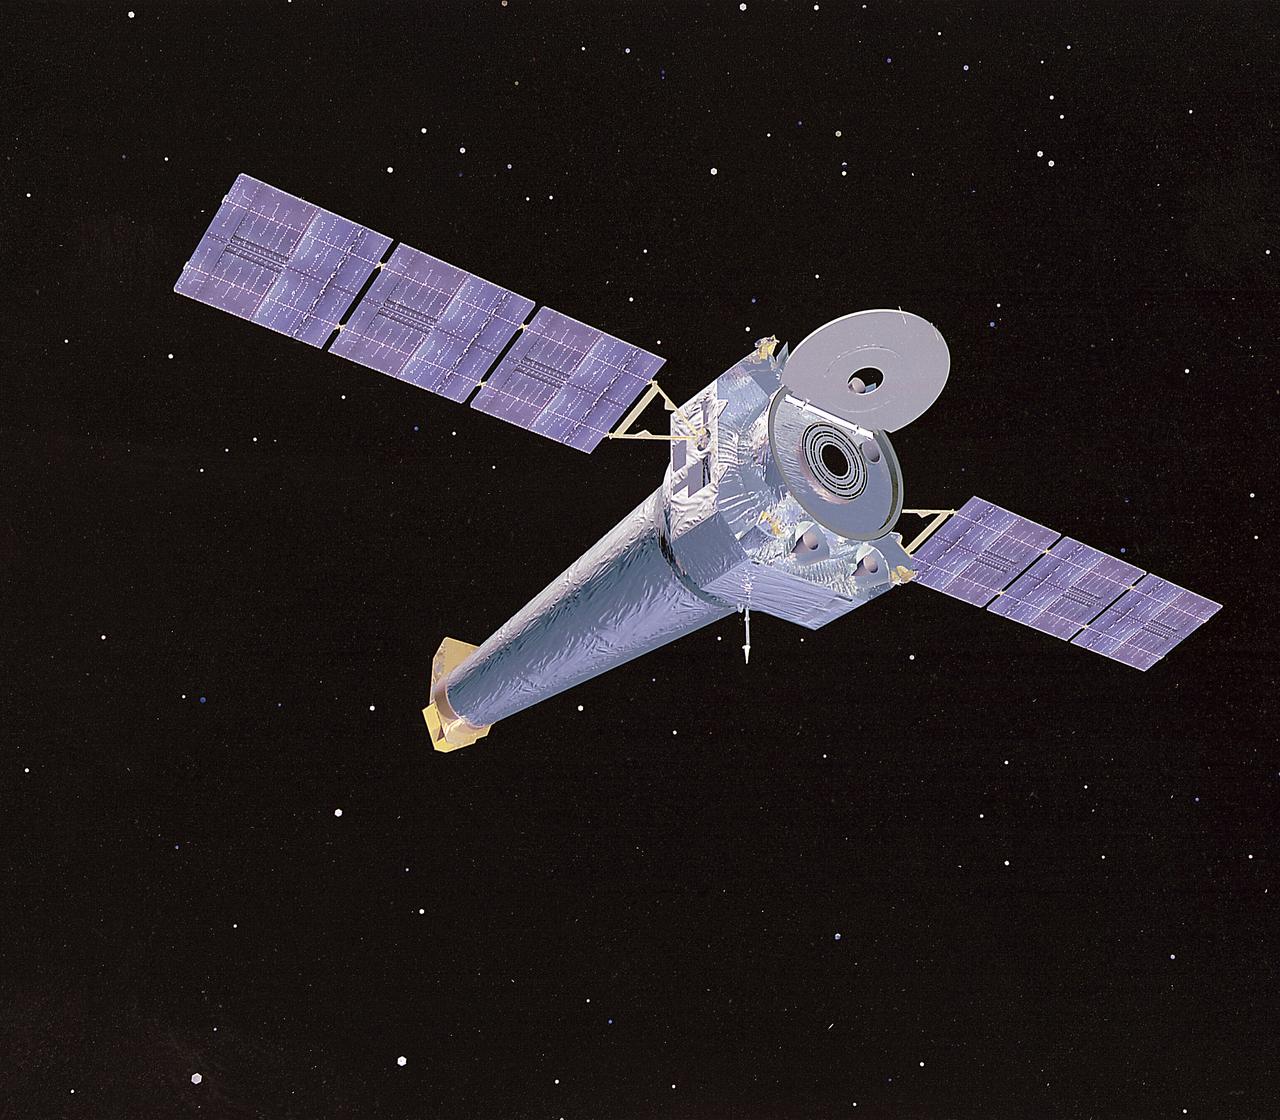
This is a computer rendering of the fully developed Chandra X-Ray Observatory (CXO), formerly Advanced X-Ray Astrophysics Facility (AXAF). In 1999, the AXAF was renamed the CXO in honor of the late Indian-American Novel Laureate Subrahmanyan Chandrasekhar. The CXO is the most sophisticated and the world's most powerful x-ray telescope ever built. It is designed to observe x-rays from high energy regions of the Universe, such as hot gas in the renmants of exploded stars. It produces picture-like images of x-ray emissions analogous to those made in visible light, as well as gathers data on the chemical composition of x-ray radiating objects. The CXO helps astronomers world-wide better understand the structure and evolution of the universe by studying powerful sources of x-ray such as exploding stars, matter falling into black holes, and other exotic celestial objects. The Observatory has three major parts: (1) the x-ray telescope, whose mirrors will focus x-rays from celestial objects; (2) the science instruments that record the x-rays so that x-ray images can be produced and analyzed; and (3) the spacecraft, which provides the environment necessary for the telescope and the instruments to work. TRW, Inc. was the prime contractor for the development of the CXO and NASA's Marshall Space Flight Center was responsible for its project management. The Smithsonian Astrophysical Observatory controls science and flight operations of the CXO for NASA from Cambridge, Massachusetts. The Observatory was launched July 22, 1999 aboard the Space Shuttle Columbia, STS-93 mission. (Image courtesy of TRW).
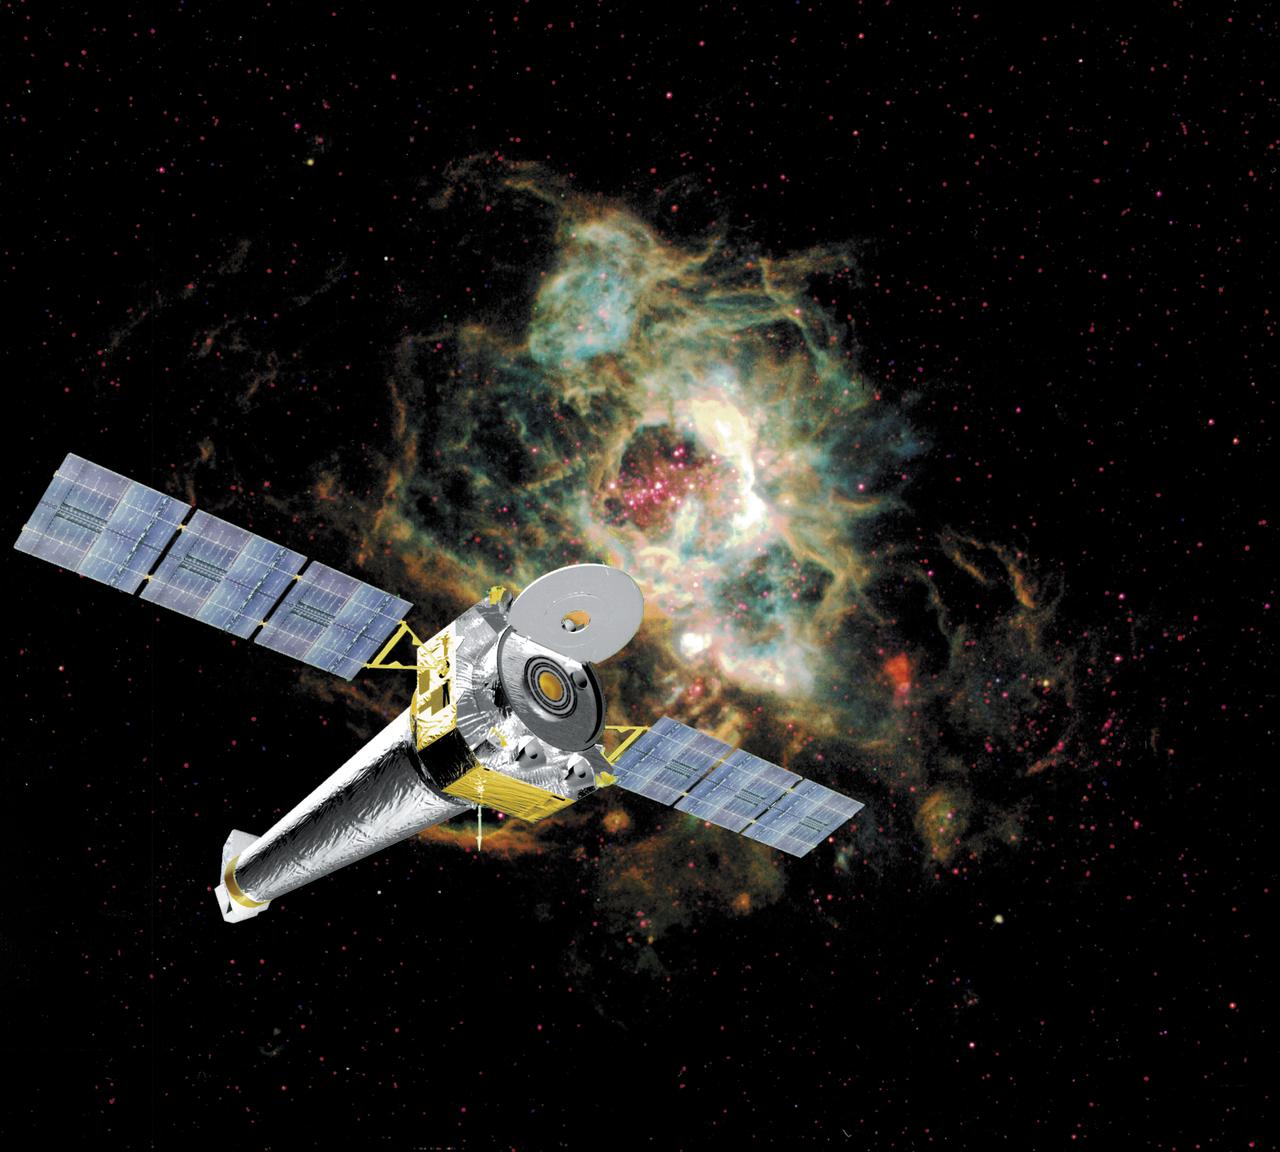
This is a computer rendering of the fully developed Chandra X-ray Observatory (CXO), formerly Advanced X-Ray Astrophysics Facility (AXAF), in orbit in a star field. In 1999, the AXAF was renamed the CXO in honor of the late Indian-American Novel Laureate Subrahmanyan Chandrasekhar. The CXO is the most sophisticated and the world's most powerful x-ray telescope ever built. It is designed to observe x-rays from high energy regions of the Universe, such as hot gas in the renmants of exploded stars. It produces picture-like images of x-ray emissions analogous to those made in visible light, as well as gathers data on the chemical composition of x-ray radiating objects. The CXO helps astronomers world-wide better understand the structure and evolution of the universe by studying powerful sources of x-rays such as exploding stars, matter falling into black holes, and other exotic celestial objects. The Observatory has three major parts: (1) the x-ray telescope, whose mirrors will focus x-rays from celestial objects; (2) the science instruments that record the x-rays so that x-ray images can be produced and analyzed; and (3) the spacecraft, which provides the environment necessary for the telescope and the instruments to work. TRW, Inc. was the prime contractor for the development of the CXO and NASA's Marshall Space Flight Center was responsible for its project management. The Smithsonian Astrophysical Observatory controls science and flight operations of the CXO for NASA from Cambridge, Massachusetts. The Observatory was launched July 22, 1999 aboard the Space Shuttle Columbia, STS-93 mission. (Image courtesy of TRW).
Joseph A. Walker was a Chief Research Pilot at the NASA Dryden Flight Research Center during the mid-1960s. He joined the NACA in March 1945, and served as project pilot at the Edwards flight research facility on such pioneering research projects as the D-558-1, D-558-2, X-1, X-3, X-4, X-5, and the X-15. He also flew programs involving the F-100, F-101, F-102, F-104, and the B-47. Walker made the first NASA X-15 flight on March 25, 1960. He flew the research aircraft 24 times and achieved its fastest speed and highest altitude. He attained a speed of 4,104 mph (Mach 5.92) during a flight on June 27, 1962, and reached an altitude of 354,300 feet on August 22, 1963 (his last X-15 flight). He was the first man to pilot the Lunar Landing Research Vehicle (LLRV) that was used to develop piloting and operational techniques for lunar landings. Walker was born February 20, 1921, in Washington, Pa. He lived there until graduating from Washington and Jefferson College in 1942, with a B.A. degree in Physics. During World War II he flew P-38 fighters for the Air Force, earning the Distinguished Flying Cross and the Air Medal with Seven Oak Clusters. Walker was the recipient of many awards during his 21 years as a research pilot. These include the 1961 Robert J. Collier Trophy, 1961 Harmon International Trophy for Aviators, the 1961 Kincheloe Award and 1961 Octave Chanute Award. He received an honorary Doctor of Aeronautical Sciences degree from his alma mater in June of 1962. Walker was named Pilot of the Year in 1963 by the National Pilots Association. He was a charter member of the Society of Experimental Test Pilots, and one of the first to be designated a Fellow. He was fatally injured on June 8, 1966, in a mid-air collision between an F-104 he was piloting and the XB-70.

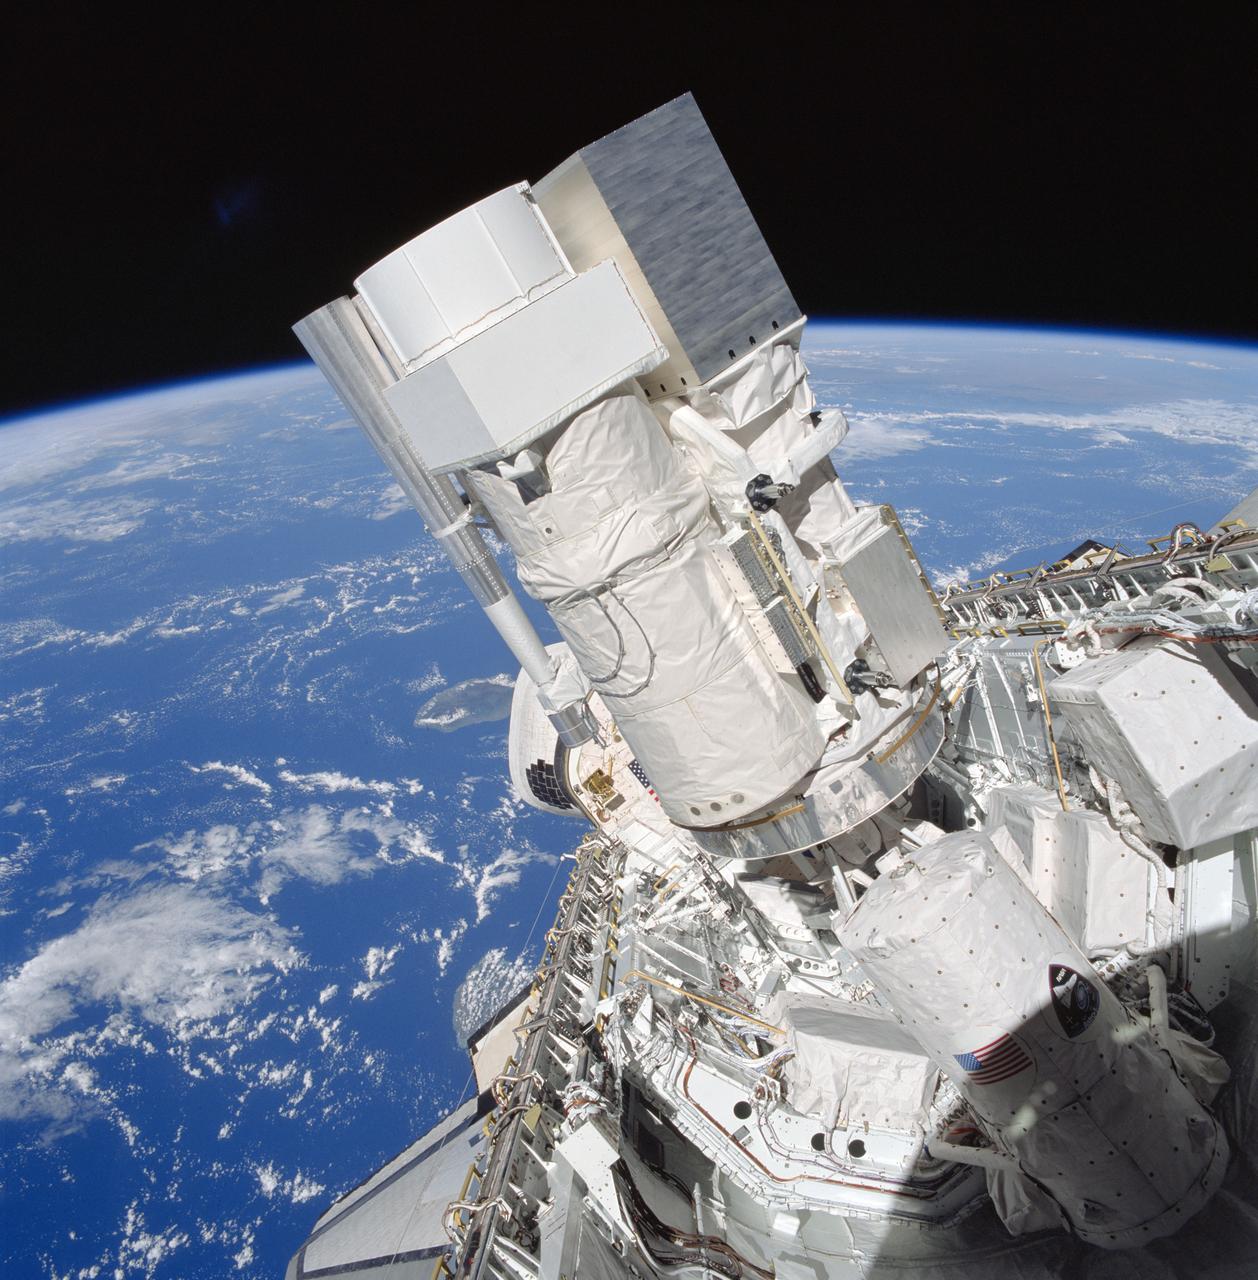
This photograph was taken during the integration of the Astro-1 mission payloads at the Kennedy Space Center on March 20, 1990, showing the Broad Band X-Ray Telescope (BBXRT) at the left, as three telescopes for the Astro-1 Observatory are settled into the Orbiter Columbia payload bay. Above Earth's atmospheric interference, Astro-1 would make precise measurements of objects such as planets, stars, and galaxies in relatively small fields of view and would observe and measure ultraviolet radiation from celestial objects. The Astro-1 used a Spacelab pallet system with an instrument pointing system and a cruciform structure for bearing the three ultraviolet instruments mounted in a parallel configuration. The three instruments were: The Hopkins Ultraviolet Telescope (HUT), which was designed to obtain far-ultraviolet spectroscopic data from white dwarfs, emission nebulae, active galaxies, and quasars; the Wisconsin Ultraviolet Photo-Polarimeter Experiment (WUPPE) which was to study polarized ultraviolet light from magnetic white dwarfs, binary stars, reflection nebulae, and active galaxies; and the Ultraviolet Imaging Telescope (UIT), which was to record photographic images in ultraviolet light of galaxies, star clusters, and nebulae. The star trackers that supported the instrument pointing system, were also mounted on the cruciform. Also in the payload bay was the Broad Band X-Ray Telescope (BBXRT), which was designed to obtain high-resolution x-ray spectra from stellar corona, x-ray binary stars, active galactic nuclei, and galaxy clusters. Managed by the Marshall Space Flight Center, the Astro-1 observatory was launched aboard the Space Shuttle Orbiter Columbia (STS-35) on December 2, 1990.
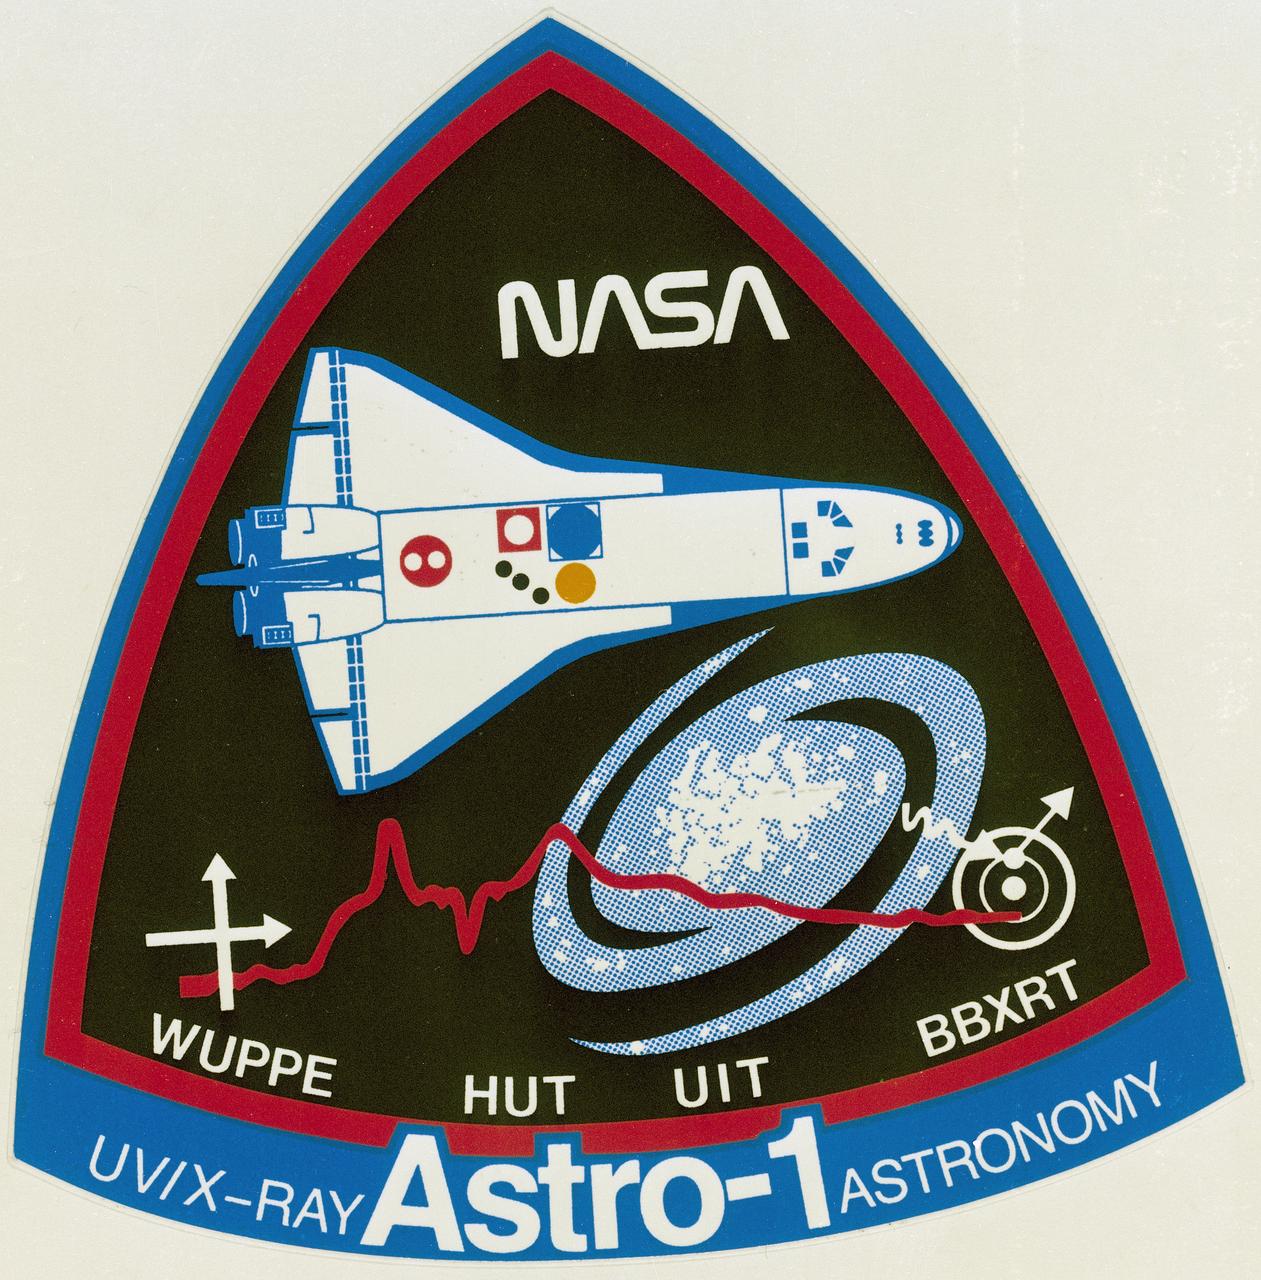
The primary payload for Space Shuttle Mission STS-35, launched December 2, 1990, was the ASTRO-1 Observatory. Designed for round the clock observation of the celestial sphere in ultraviolet and X-ray astronomy, ASTRO-1 featured a collection of four telescopes: the Hopkins Ultraviolet Telescope (HUT); the Wisconsin Ultraviolet Photo- Polarimeter Experiment (WUPPE); the Ultraviolet Imaging Telescope (UIT); and the Broad Band X-ray Telescope (BBXRT). Ultraviolet telescopes mounted on Spacelab elements in cargo bay were to be operated in shifts by flight crew. Loss of both data display units (used for pointing telescopes and operating experiments) during mission impacted crew-aiming procedures and forced ground teams at Marshall Space Flight Center to aim ultraviolet telescopes with fine-tuning by flight crew. BBXRT, also mounted in cargo bay, was directed from outset by ground-based operators at Goddard Space Flight Center. This is the logo or emblem that was designed to represent the ASTRO-1 payload.
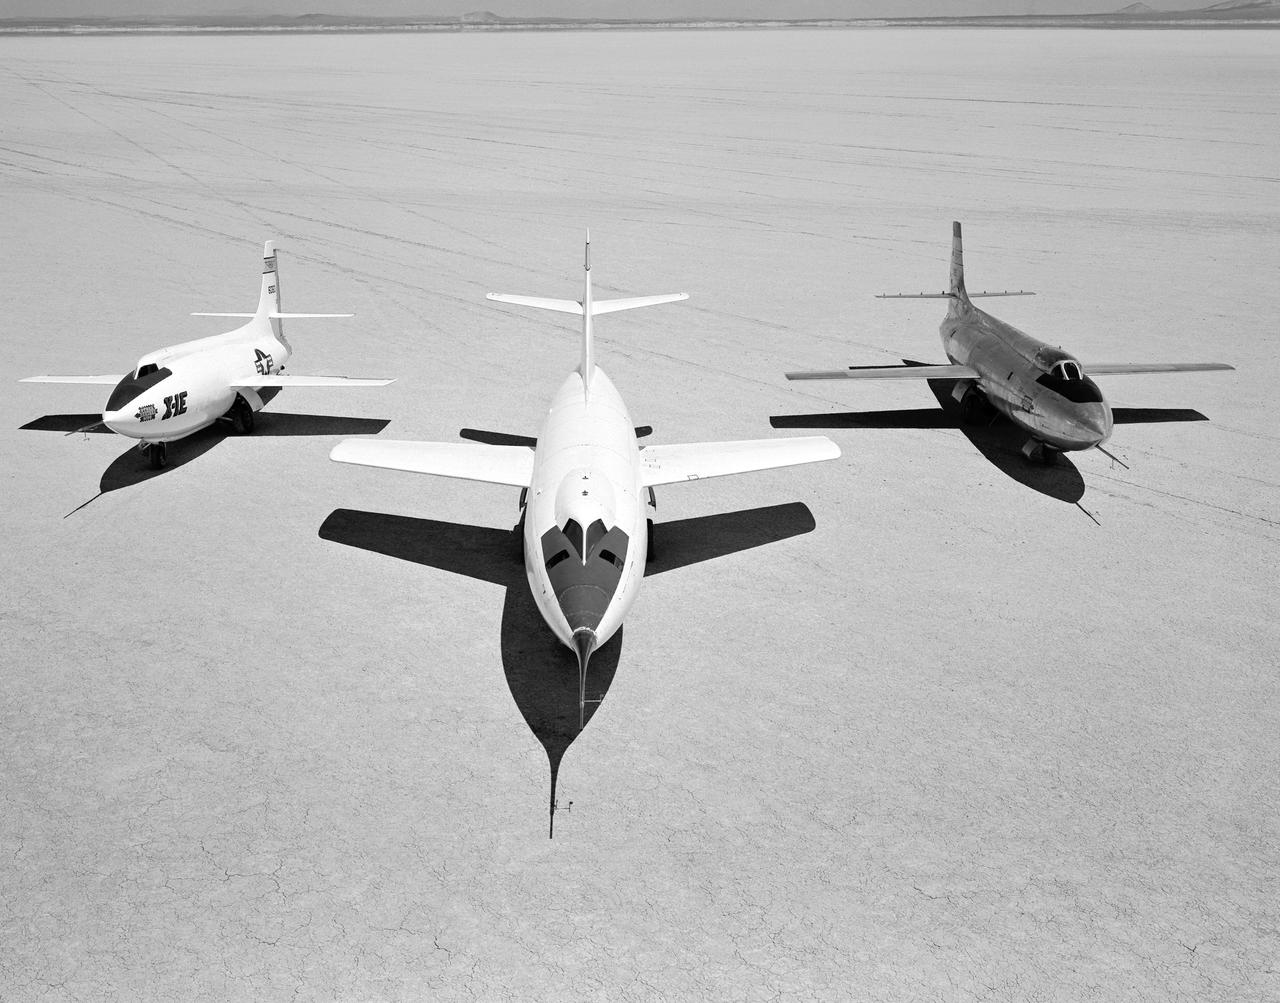
Early NACA research aircraft on the lakebed at the High Speed Research Station in 1955: Left to right: X-1E, D-558-II, X-1B
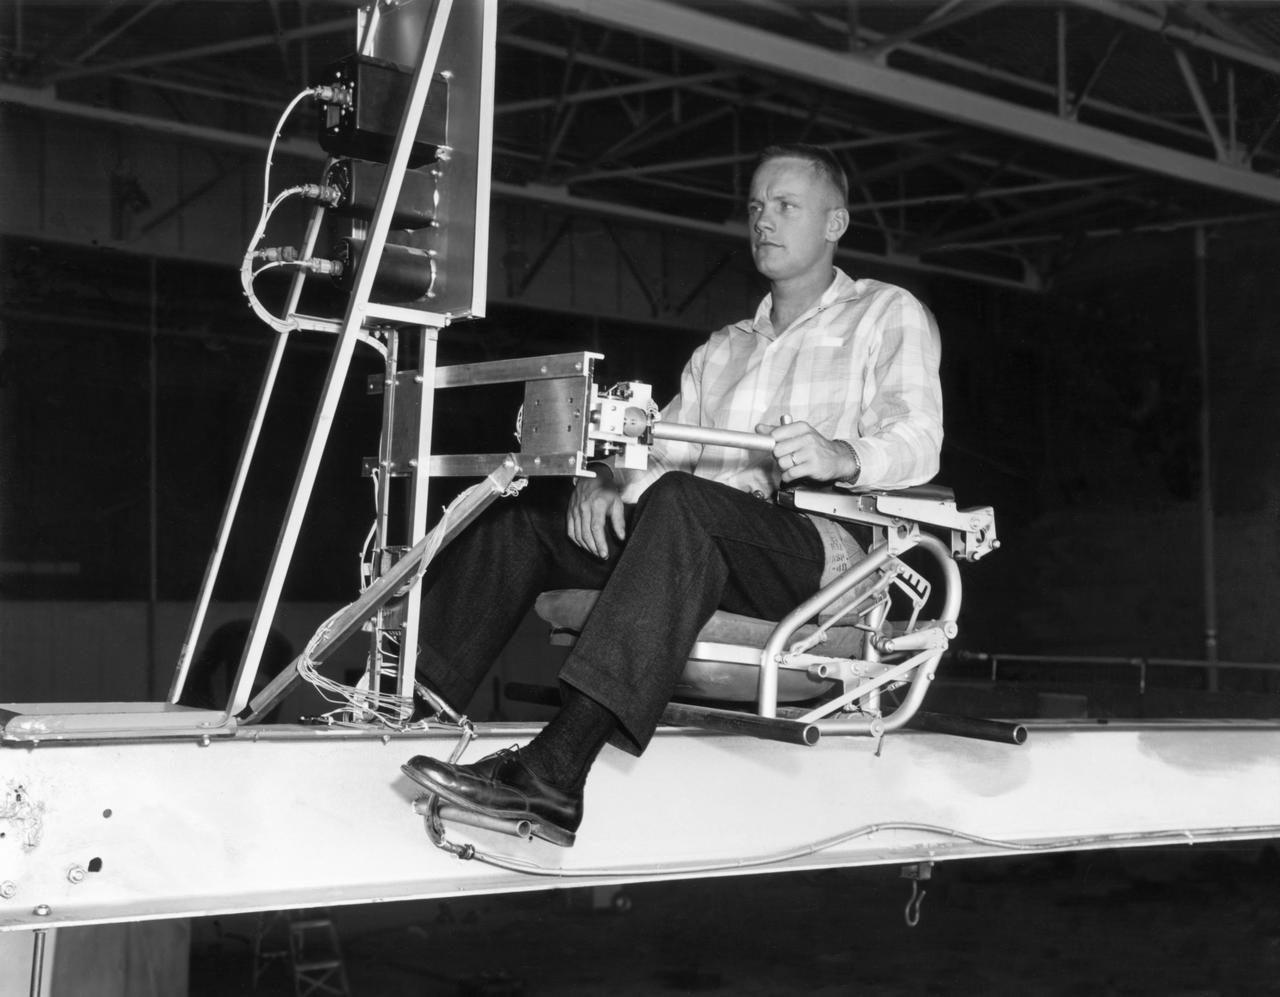
Famed astronaut Neil A. Armstrong, the first man to set foot on the moon during the historic Apollo 11 space mission in July 1969, served for seven years as a research pilot at the NACA-NASA High-Speed Flight Station, now the Dryden Flight Research Center, at Edwards, California, before he entered the space program. Armstrong joined the National Advisory Committee for Aeronautics (NACA) at the Lewis Flight Propulsion Laboratory (later NASA's Lewis Research Center, Cleveland, Ohio, and today the Glenn Research Center) in 1955. Later that year, he transferred to the High-Speed Flight Station at Edwards as an aeronautical research scientist and then as a pilot, a position he held until becoming an astronaut in 1962. He was one of nine NASA astronauts in the second class to be chosen. As a research pilot Armstrong served as project pilot on the F-100A and F-100C aircraft, F-101, and the F-104A. He also flew the X-1B, X-5, F-105, F-106, B-47, KC-135, and Paresev. He left Dryden with a total of over 2450 flying hours. He was a member of the USAF-NASA Dyna-Soar Pilot Consultant Group before the Dyna-Soar project was cancelled, and studied X-20 Dyna-Soar approaches and abort maneuvers through use of the F-102A and F5D jet aircraft. Armstrong was actively engaged in both piloting and engineering aspects of the X-15 program from its inception. He completed the first flight in the aircraft equipped with a new flow-direction sensor (ball nose) and the initial flight in an X-15 equipped with a self-adaptive flight control system. He worked closely with designers and engineers in development of the adaptive system, and made seven flights in the rocket plane from December 1960 until July 1962. During those fights he reached a peak altitude of 207,500 feet in the X-15-3, and a speed of 3,989 mph (Mach 5.74) in the X-15-1. Armstrong has a total of 8 days and 14 hours in space, including 2 hours and 48 minutes walking on the Moon. In March 1966 he was commander of the Gemini 8 or

STS035-13-008 (2-10 Dec. 1990) --- The various components of the Astro-1 payload are seen backdropped against the blue and white Earth in this 35mm scene photographed through Columbia's aft flight deck windows. Parts of the Hopkins Ultraviolet Telescope (HUT), Ultraviolet Imaging Telescope (UIT) and the Wisconsin Ultraviolet Photo-Polarimeter Experiment (WUPPE) are visible on the Spacelab Pallet in the foreground. The Broad Band X-Ray Telescope (BBXRT) is behind this pallet and is not visible in this scene. The smaller cylinder in the foreground is the "Igloo," which is a pressurized container housing the Command and Data Management System, which interfaces with the in-cabin controllers to control the Instrument Pointing System (IPS) and the telescopes.
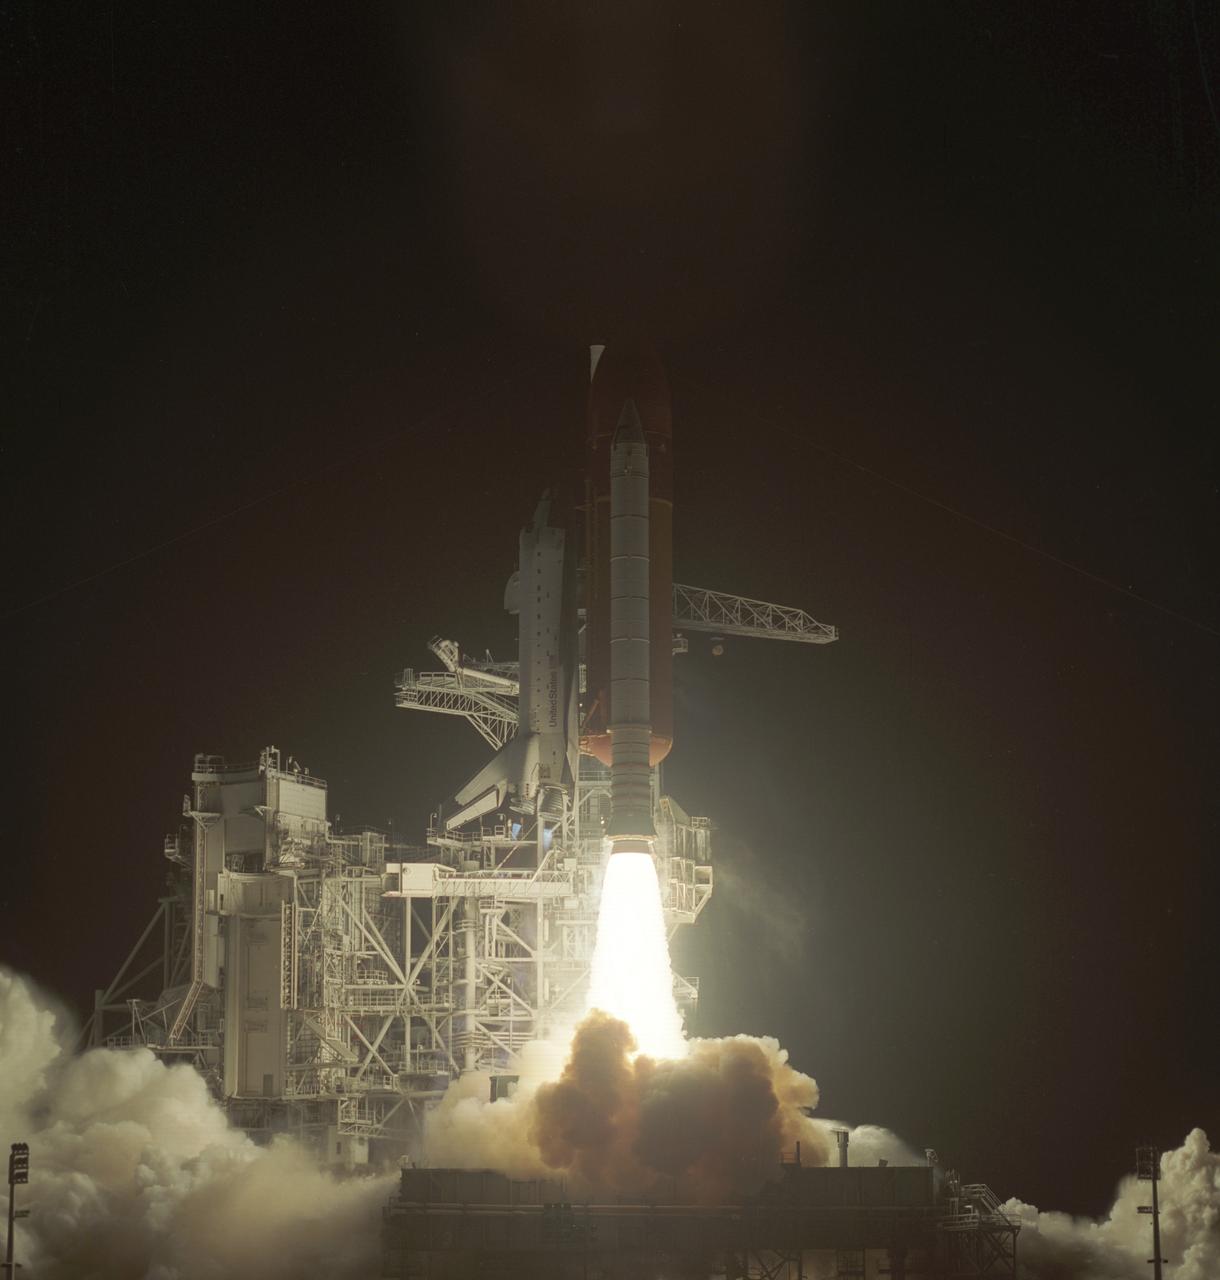
STS-35 lifted off December 2, 1990, at 1:19 am EST, aboard the Space Shuttle Orbiter Columbia. Her crew of eight included: Vance D. Brand, commander; Colonel Guy S. Gardner, pilot; mission specialists Dr. Robert A. R. Parker, John M. (Mike) Lounge, and Dr. Jeffery A. Hoffman; and payload specialists Dr. Kenneth H. Nordsieck, Dr. Samual T. Durrance, and Dr. Ronald A. Parise. The primary objective of the mission was round the clock observation of the celestial sphere in ultraviolet and X-Ray astronomy with the Astro-1 Observatory which consisted of four telescopes: the Hopkins Ultraviolet Telescope (HUT); the Wisconsin Ultraviolet Photo-Polarimeter Experiment (WUPPE); the Ultraviolet Imaging Telescope (UIT); and the Broad Band X-Ray Telescope (BBXRT). Due to loss of data used for pointing and operating the ultraviolet telescopes, Marshall Space Flight Center ground teams were forced to aim the telescopes with fine tuning by the flight crew.
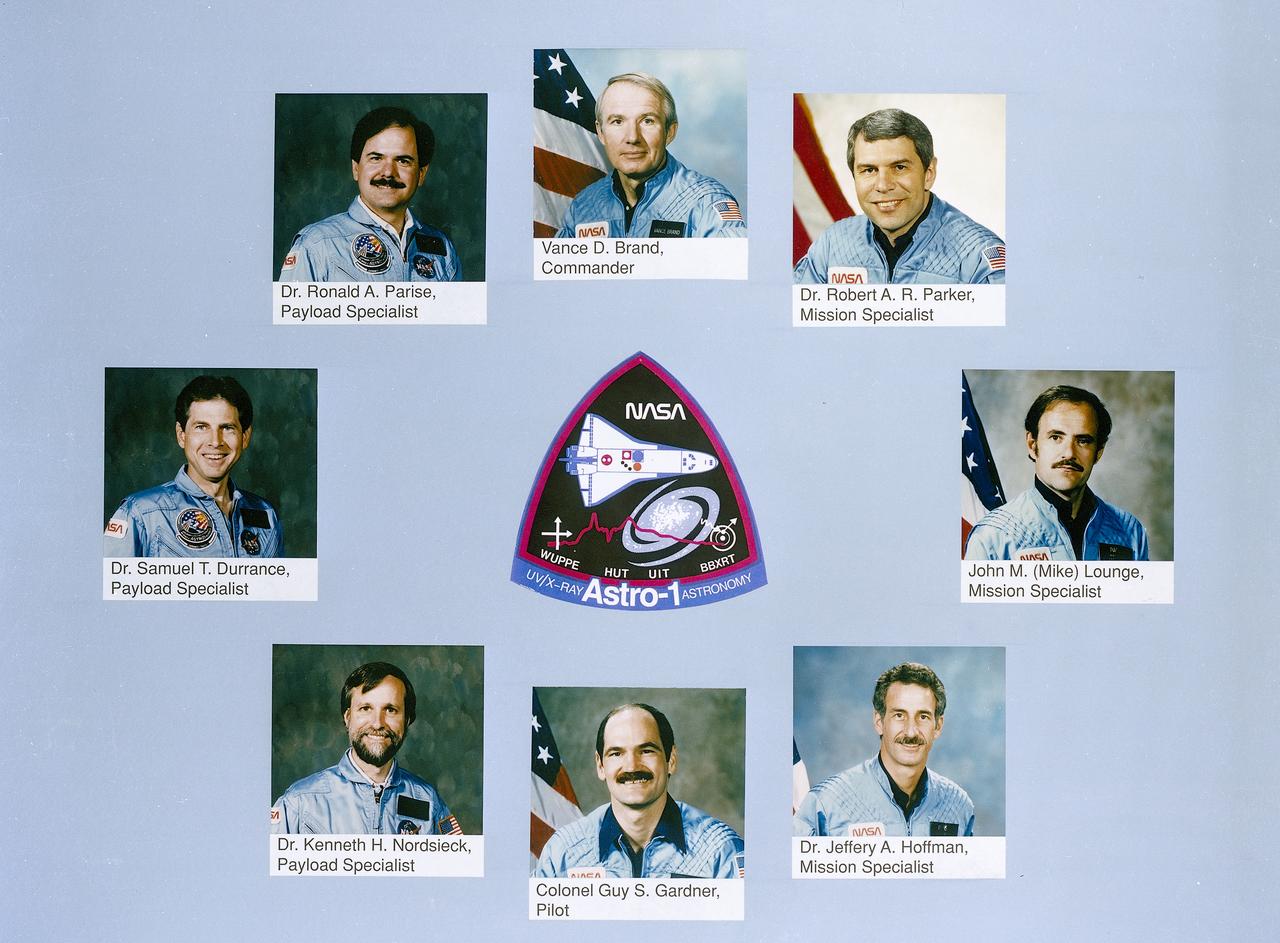
This montage consists of 8 individual STS-35 crew member portraits surrounding the mission’s insignia. Starting from top center, clockwise, are Vance D. Brand, commander; mission specialists Dr. Robert A. R. Parker, John M. (Mike) Lounge, and Dr. Jeffery A. Hoffman; Colonel Guy S. Gardner, pilot; and payload specialists Dr. Kenneth H. Nordsieck, Dr. Samual T. Durrance, and Dr. Ronald A. Parise. The crew of 8 launched aboard the Space Shuttle Orbiter Columbia on December 2, 1990 at 1:19:01am (EST). The primary objective of the mission was round the clock observation of the celestial sphere in ultrviolet and X-Ray astronomy with the Astro-1 observatory which consisted of four telescopes: the Hopkins Ultraviolet Telescope (HUT); the Wisconsin Ultraviolet Photo-Polarimeter Experiment (WUPPE); the Ultraviolet Imaging Telescope (UIT); and the Broad Band X-Ray Telescope (BBXRT). Due to loss of data used for pointing and operating the ultraviolet telescopes, Marshall Space Flight Center ground teams were forced to aim the telescopes with fine tuning by the flight crew.
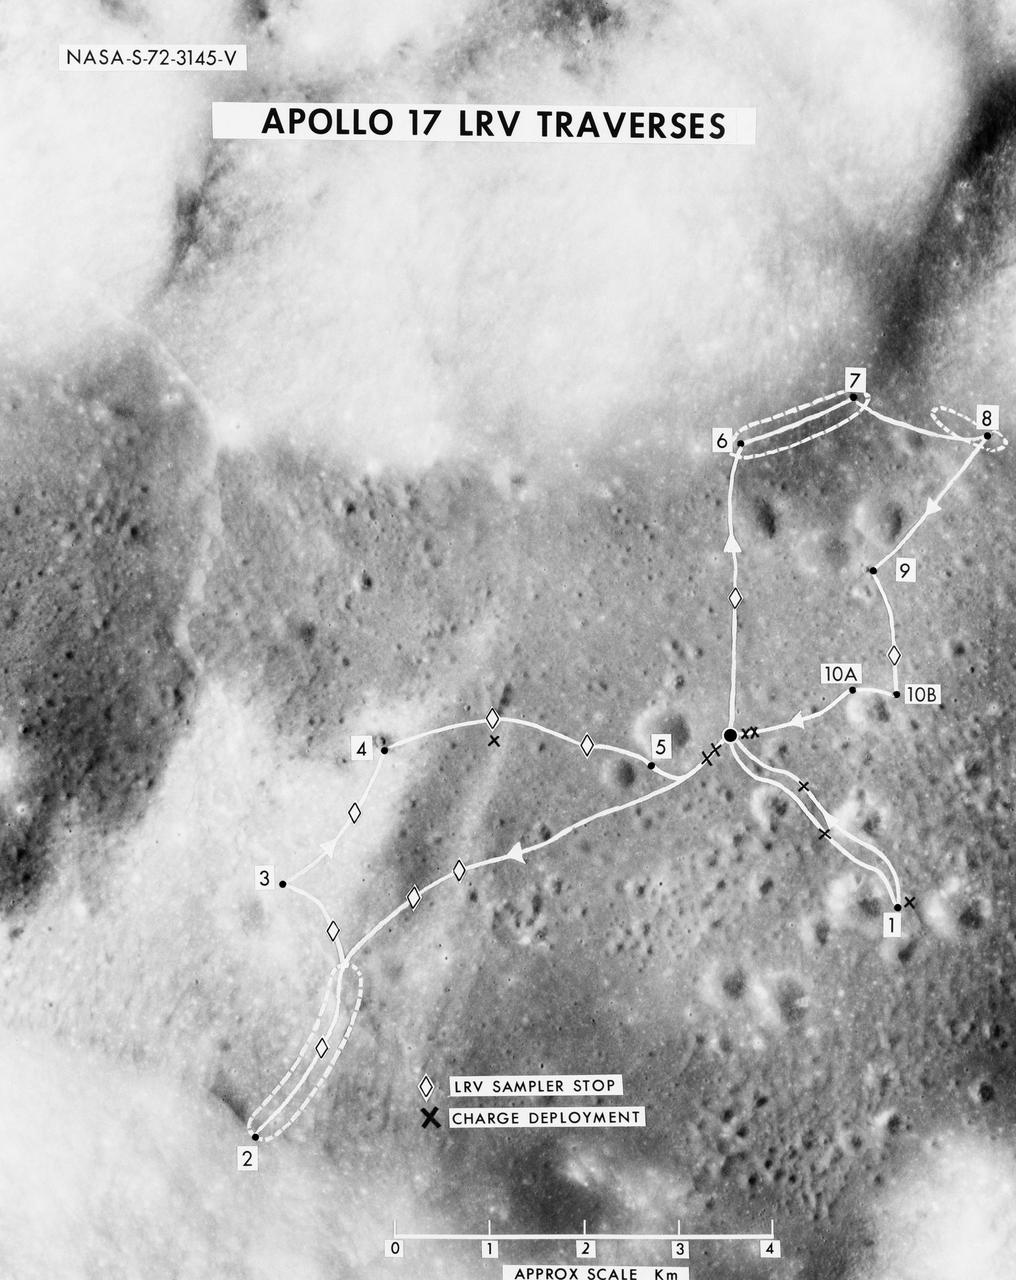
S72-03145 (October 1972) --- A vertical view of the Apollo 17 Taurus-Littrow site with an overlay to illustrate the three planned Apollo 17 traverses using the Lunar Roving Vehicle (LRV). The EVA-1 traverse has a single station (1); the EVA-2 traverse has four stations (2,3,4,5); and the EVA-3 traverse has five stations (6,7,8,9,10). Stations 10-A and 10-B are alternate locations for Station 10. In addition to the major stations mentioned above, brief stops are planned for sampling between stations using the LRV sampler tool (note diamond-shaped figures), and for deploying explosive charges associated with the Lunar Seismic Profiling Experiment (LSPE - note black x-marks).

This image, taken with the Wide Field Planetary Camera 2 on board the NASA/ESA Hubble Space Telescope, shows the globular cluster Terzan 1. Lying around 20 000 light-years from us in the constellation of Scorpius (The Scorpion), it is one of about 150 globular clusters belonging to our galaxy, the Milky Way. Typical globular clusters are collections of around a hundred thousand stars, held together by their mutual gravitational attraction in a spherical shape a few hundred light-years across. It is thought that every galaxy has a population of globular clusters. Some, like the Milky Way, have a few hundred, while giant elliptical galaxies can have several thousand. They contain some of the oldest stars in a galaxy, hence the reddish colours of the stars in this image — the bright blue ones are foreground stars, not part of the cluster. The ages of the stars in the globular cluster tell us that they were formed during the early stages of galaxy formation! Studying them can also help us to understand how galaxies formed. Terzan 1, like many globular clusters, is a source of X-rays. It is likely that these X-rays come from binary star systems that contain a dense neutron star and a normal star. The neutron star drags material from the companion star, causing a burst of X-ray emission. The system then enters a quiescent phase in which the neutron star cools, giving off X-ray emission with different characteristics, before enough material from the companion builds up to trigger another outburst.
John B. McKay was one of the first pilots assigned to the X-15 flight research program at NASA's Flight Research Center, Edwards, Calif. As a civilian research pilot and aeronautical engineer, he made 30 flights in X-15s from October 28, 1960, until September 8, 1966. His peak altitude was 295,600 feet, and his highest speed was 3863 mph (Mach 5.64). McKay was with the NACA and NASA from February 8,1951 until October 5, 1971 and specialized in high-speed flight research programs. He began as an NACA intern, but assumed pilot status on July 11, 1952. In addition to the X-l5, he flew such experimental aircraft as the D-558-1, D-558-2, X-lB, and the X-lE. He has also served as a research pilot on flight programs involving the F-100, F-102, F-104, and the F-107. Born on December 8, 1922, in Portsmouth, Va., McKay graduated from Virginia Polytechnic Institute in 195O with a Bachelor of Science degree in Aeronautical Engineering. During World War II he served as a Navy pilot in the Pacific Theater, earning the Air Medal and Two Clusters, and a Presidential Unit Citation. McKay wrote several technical papers, and was a member of the American Institute of Aeronautics and Astronautics, as well as the Society of Experimental Test Pilots. He passed away on April 27, 1975.

In 1986, NASA introduced a Shuttle-borne ultraviolet observatory called Astro. The Astro Observatory was designed to explore the universe by observing and measuring the ultraviolet radiation from celestial objects. Astronomical targets of observation selected for Astro missions included planets, stars, star clusters, galaxies, clusters of galaxies, quasars, remnants of exploded stars (supernovae), clouds of gas and dust (nebulae), and the interstellar medium. Astro-1 used a Spacelab pallet system with an instrument pointing system and a cruciform structure for bearing the three ultraviolet instruments mounted in a parallel configuration. The three instruments were: The Hopkins Ultraviolet Telescope (HUT), which was designed to obtain far-ultraviolet spectroscopic data from white dwarfs, emission nebulae, active galaxies, and quasars; the Wisconsin Ultraviolet Photo-Polarimeter Experiment (WUPPE) which was to study polarized ultraviolet light from magnetic white dwarfs, binary stars, reflection nebulae, and active galaxies; and the Ultraviolet Imaging Telescope (UIT) which was to record photographic images in ultraviolet light of galaxies, star clusters, and nebulae. The star trackers that supported the instrument pointing system were also mounted on the cruciform. Also in the payload bay was the Broad Band X-Ray Telescope (BBXRT), which was designed to obtain high-resolution x-ray spectra from stellar corona, x-ray binary stars, active galactic nuclei, and galaxy clusters. Managed by the Marshall Space Flight Center, the Astro-1 observatory was launched aboard the Space Shuttle Orbiter Columbia (STS-35) on December 2, 1990.
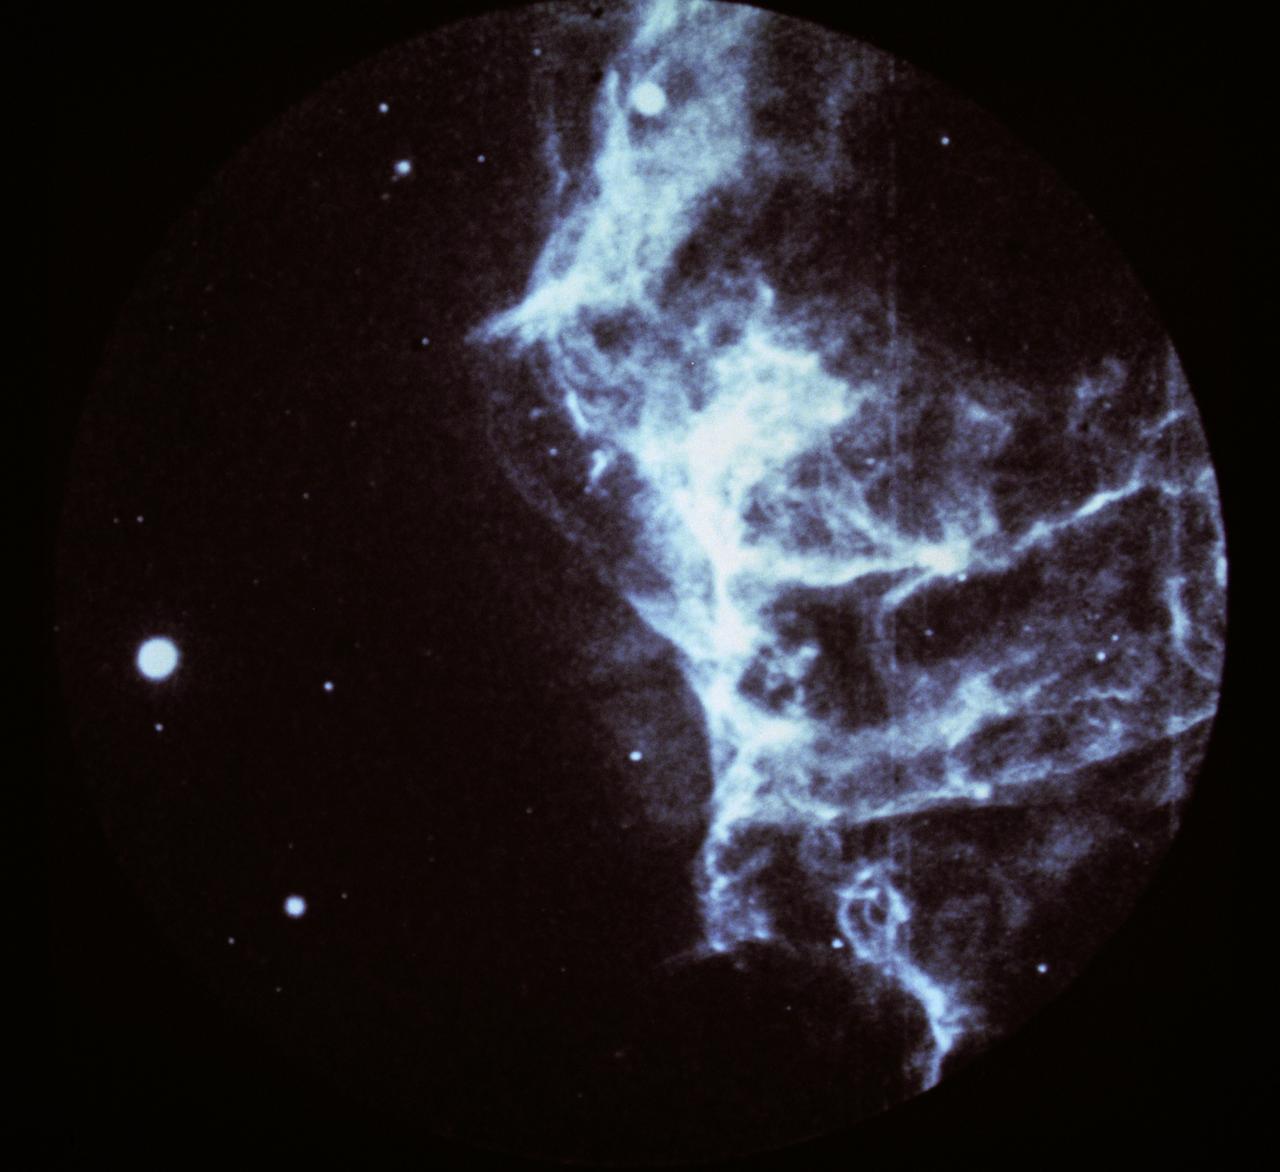
This image shows a part of the Cygnus loop supernova remnant, taken by the Ultraviolet Imaging Telescope (UIT) on the Astro Observatory during the Astro-1 mission (STS-35) on December 5, 1990. Pictured is a portion of the huge Cygnus loop, an array of interstellar gas clouds that have been blasted by a 900,000 mile per hour shock wave from a prehistoric stellar explosion, which occurred about 20,000 years ago, known as supernova. With ultraviolet and x-rays, astronomers can see emissions from extremely hot gases, intense magnetic fields, and other high-energy phenomena that more faintly appear in visible and infrared light or in radio waves that are crucial to deepening the understanding of the universe. The Astro Observatory was designed to explore the universe by observing and measuring the ultraviolet radiation from celestial objects. Three instruments make up the Astro Observatory: The Hopkins Ultraviolet Telescope (HUT), the Ultraviolet Imaging Telescope (UIT), and the Wisconsin Ultraviolet Photo-Polarimetry Experiment (WUPPE). The Marshall Space Flight Center had managment responsibilities for the Astro-1 mission. The Astro-1 Observatory was launched aboard the Space Shuttle Orbiter Columbia (STS-35) on December 2, 1990.

John McKay after flight in F-104B
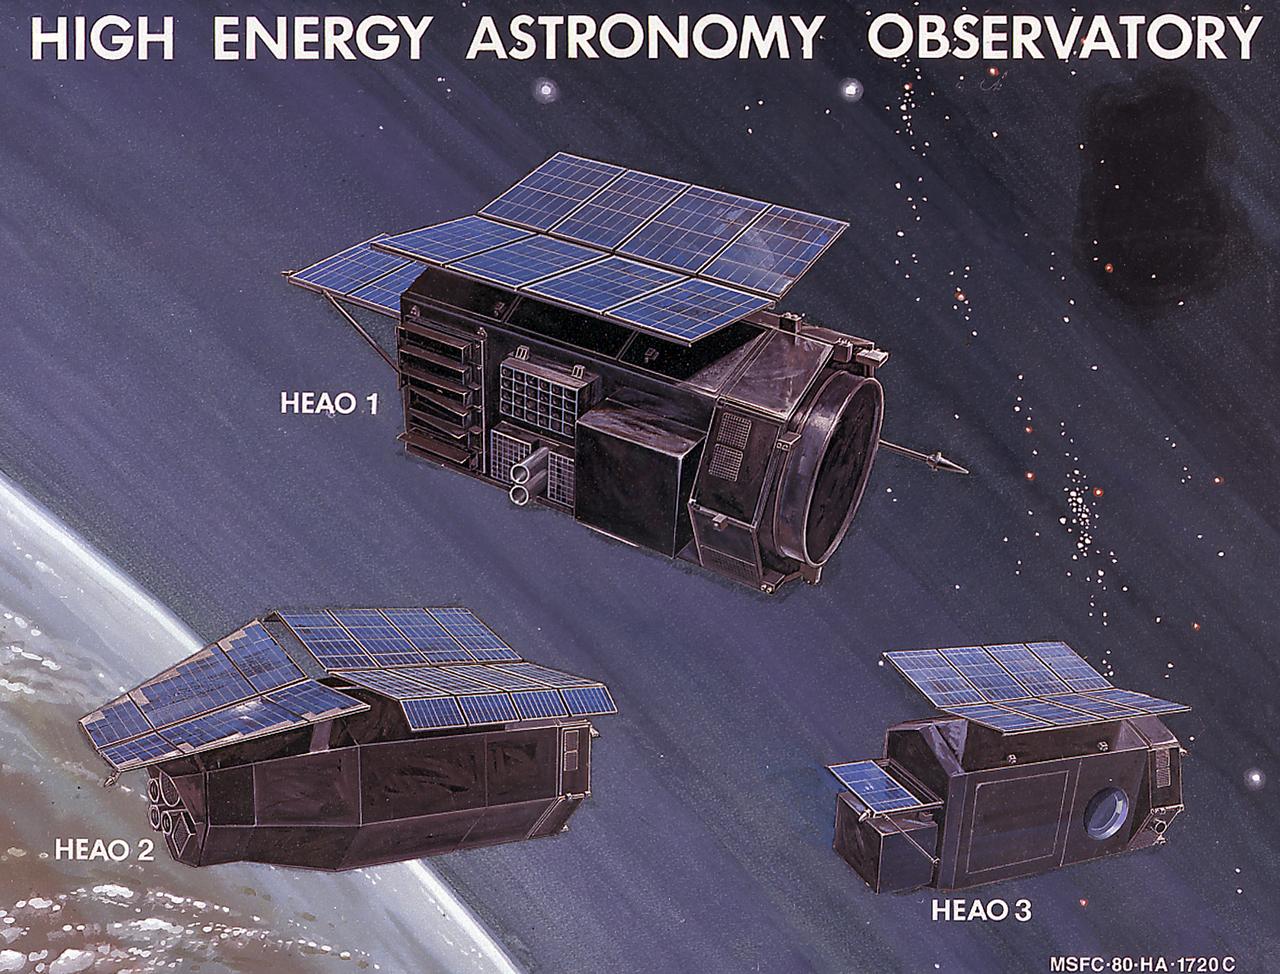
The family of High Energy Astronomy Observatory (HEAO) instruments consisted of three unmarned scientific observatories capable of detecting the x-rays emitted by the celestial bodies with high sensitivity and high resolution. The celestial gamma-ray and cosmic-ray fluxes were also collected and studied to learn more about the mysteries of the universe. High-Energy rays cannot be studied by Earth-based observatories because of the obscuring effects of the atmosphere that prevent the rays from reaching the Earth's surface. They had been observed initially by sounding rockets and balloons, and by small satellites that do not possess the needed instrumentation capabilities required for high data resolution and sensitivity. The HEAO carried the instrumentation necessary for this capability. In this photograph, an artist's concept of three HEAO spacecraft is shown: HEAO-1, launched on August 12, 1977; HEAO-2, launched on November 13, 1978; and HEAO-3, launched on September 20. 1979.
STS035-604-058 (2-10 Dec 1990) --- The various components of the Astro-1 payload are seen backdropped against the blue and white Earth in this scene photographed through Columbia's aft flight deck windows. Parts of the Hopkins Ultraviolet Telescope (HUT), Ultraviolet Imaging Telescope (UIT) and the Wisconsin Ultraviolet Photopolarimetry Experiment (WUPPE) are visible on the Spacelab pallet in the foreground. The Broad Band X-ray Telescope (BBXRT) is behind this pallet and is not visible in this scene. The smaller cylinder in the foreground is the "Igloo," which is a pressurized container housing the Command and Data Management System, which interfaces with the in-cabin controllers to control the Instrument Pointing System (IPS) and the telescopes. The photograph was made with a handheld Rolleiflex camera aimed through Columbia's aft flight deck windows.
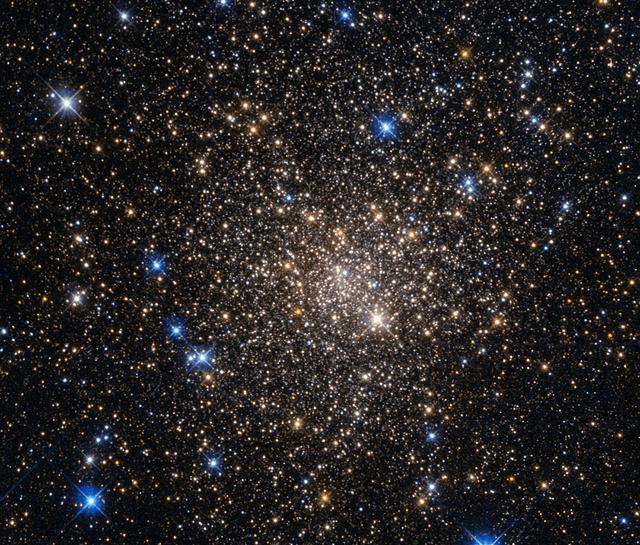
This image, taken with the Wide Field Planetary Camera 2 on board the NASA/ESA Hubble Space Telescope, shows the globular cluster Terzan 1. Lying around 20,000 light-years from us in the constellation of Scorpius (The Scorpion), it is one of about 150 globular clusters belonging to our galaxy, the Milky Way. Typical globular clusters are collections of around a hundred thousand stars, held together by their mutual gravitational attraction in a spherical shape a few hundred light-years across. It is thought that every galaxy has a population of globular clusters. Some, like the Milky Way, have a few hundred, while giant elliptical galaxies can have several thousand. They contain some of the oldest stars in a galaxy, hence the reddish colors of the stars in this image — the bright blue ones are foreground stars, not part of the cluster. The ages of the stars in the globular cluster tell us that they were formed during the early stages of galaxy formation! Studying them can also help us to understand how galaxies formed. Terzan 1, like many globular clusters, is a source of X-rays. It is likely that these X-rays come from binary star systems that contain a dense neutron star and a normal star. The neutron star drags material from the companion star, causing a burst of X-ray emission. The system then enters a quiescent phase in which the neutron star cools, giving off X-ray emission with different characteristics, before enough material from the companion builds up to trigger another outburst. Image credit: NASA & ESA, Acknowledgement: Judy Schmidt <b><a href="http://www.nasa.gov/audience/formedia/features/MP_Photo_Guidelines.html" rel="nofollow">NASA image use policy.</a></b> <b><a href="http://www.nasa.gov/centers/goddard/home/index.html" rel="nofollow">NASA Goddard Space Flight Center</a></b> enables NASA’s mission through four scientific endeavors: Earth Science, Heliophysics, Solar System Exploration, and Astrophysics. Goddard plays a leading role in NASA’s accomplishments by contributing compelling scientific knowledge to advance the Agency’s mission. <b>Follow us on <a href="http://twitter.com/NASAGoddardPix" rel="nofollow">Twitter</a></b> <b>Like us on <a href="http://www.facebook.com/pages/Greenbelt-MD/NASA-Goddard/395013845897?ref=tsd" rel="nofollow">Facebook</a></b> <b>Find us on <a href="http://instagrid.me/nasagoddard/?vm=grid" rel="nofollow">Instagram</a></b>
![In celebration of the International Year of Astronomy 2009, NASA's Great Observatories -- the Hubble Space Telescope, the Spitzer Space Telescope, and the Chandra X-ray Observatory -- have produced a matched trio of images of the central region of our Milky Way galaxy. Each image shows the telescope's different wavelength view of the galactic center region, illustrating the unique science each observatory conducts. In this spectacular image, observations using infrared light and X-ray light see through the obscuring dust and reveal the intense activity near the galactic core. Note that the center of the galaxy is located within the bright white region to the right of and just below the middle of the image. The entire image width covers about one-half a degree, about the same angular width as the full moon. Spitzer's infrared-light observations provide a detailed and spectacular view of the galactic center region [Figure 1 (top frame of poster)]. The swirling core of our galaxy harbors hundreds of thousands of stars that cannot be seen in visible light. These stars heat the nearby gas and dust. These dusty clouds glow in infrared light and reveal their often dramatic shapes. Some of these clouds harbor stellar nurseries that are forming new generations of stars. Like the downtown of a large city, the center of our galaxy is a crowded, active, and vibrant place. Although best known for its visible-light images, Hubble also observes over a limited range of infrared light [Figure 2 (middle frame of poster)]. The galactic center is marked by the bright patch in the lower right. Along the left side are large arcs of warm gas that have been heated by clusters of bright massive stars. In addition, Hubble uncovered many more massive stars across the region. Winds and radiation from these stars create the complex structures seen in the gas throughout the image.This sweeping panorama is one of the sharpest infrared pictures ever made of the galactic center region. X-rays detected by Chandra expose a wealth of exotic objects and high-energy features [Figure 3 (bottom frame of poster)]. In this image, pink represents lower energy X-rays and blue indicates higher energy. Hundreds of small dots show emission from material around black holes and other dense stellar objects. A supermassive black hole -- some four million times more massive than the Sun -- resides within the bright region in the lower right. The diffuse X-ray light comes from gas heated to millions of degrees by outflows from the supermassive black hole, winds from giant stars, and stellar explosions. This central region is the most energetic place in our galaxy. http://photojournal.jpl.nasa.gov/catalog/PIA12348](https://images-assets.nasa.gov/image/PIA12348/PIA12348~medium.jpg)
In celebration of the International Year of Astronomy 2009, NASA's Great Observatories -- the Hubble Space Telescope, the Spitzer Space Telescope, and the Chandra X-ray Observatory -- have produced a matched trio of images of the central region of our Milky Way galaxy. Each image shows the telescope's different wavelength view of the galactic center region, illustrating the unique science each observatory conducts. In this spectacular image, observations using infrared light and X-ray light see through the obscuring dust and reveal the intense activity near the galactic core. Note that the center of the galaxy is located within the bright white region to the right of and just below the middle of the image. The entire image width covers about one-half a degree, about the same angular width as the full moon. Spitzer's infrared-light observations provide a detailed and spectacular view of the galactic center region [Figure 1 (top frame of poster)]. The swirling core of our galaxy harbors hundreds of thousands of stars that cannot be seen in visible light. These stars heat the nearby gas and dust. These dusty clouds glow in infrared light and reveal their often dramatic shapes. Some of these clouds harbor stellar nurseries that are forming new generations of stars. Like the downtown of a large city, the center of our galaxy is a crowded, active, and vibrant place. Although best known for its visible-light images, Hubble also observes over a limited range of infrared light [Figure 2 (middle frame of poster)]. The galactic center is marked by the bright patch in the lower right. Along the left side are large arcs of warm gas that have been heated by clusters of bright massive stars. In addition, Hubble uncovered many more massive stars across the region. Winds and radiation from these stars create the complex structures seen in the gas throughout the image.This sweeping panorama is one of the sharpest infrared pictures ever made of the galactic center region. X-rays detected by Chandra expose a wealth of exotic objects and high-energy features [Figure 3 (bottom frame of poster)]. In this image, pink represents lower energy X-rays and blue indicates higher energy. Hundreds of small dots show emission from material around black holes and other dense stellar objects. A supermassive black hole -- some four million times more massive than the Sun -- resides within the bright region in the lower right. The diffuse X-ray light comes from gas heated to millions of degrees by outflows from the supermassive black hole, winds from giant stars, and stellar explosions. This central region is the most energetic place in our galaxy. http://photojournal.jpl.nasa.gov/catalog/PIA12348
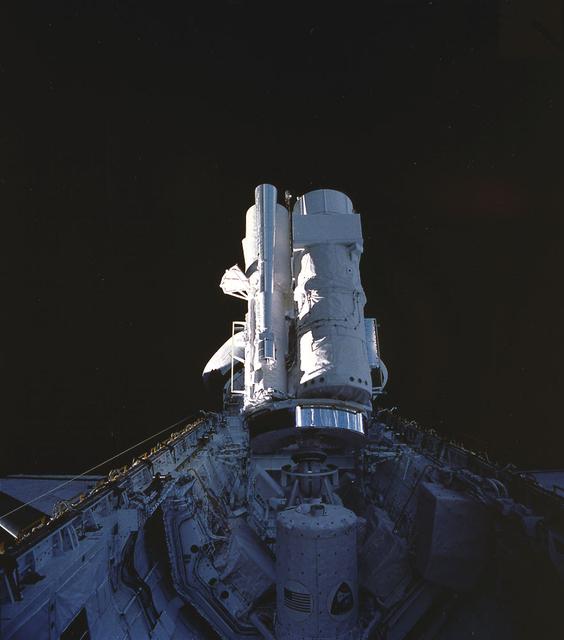
Onboard the Space Shuttle Orbiter Columbia (STS-35), the various components of the Astro-1 payload are seen backdropped against dark space. Parts of the Hopkins Ultraviolet Telescope (HUT), Ultraviolet Imaging Telescope (UIT), and the Wisconsin Ultraviolet Photo-Polarimetry Experiment (WUPPE) are visible on the Spacelab pallet. The Broad-Band X-Ray Telescope (BBXRT) is behind the pallet and is not visible in this scene. The smaller cylinder in the foreground is the igloo. The igloo was a pressurized container housing the Command Data Management System, that interfaced with the in-cabin controllers to control the Instrument Pointing System (IPS) and the telescopes. The Astro Observatory was designed to explore the universe by observing and measuring the ultraviolet radiation from celestial objects. Astronomical targets of observation selected for Astro missions included planets, stars, star clusters, galaxies, clusters of galaxies, quasars, remnants of exploded stars (supernovae), clouds of gas and dust (nebulae), and the interstellar medium. Managed by the Marshall Space Flight Center, the Astro-1 was launched aboard the Space Shuttle Orbiter Columbia (STS-35) on December 2, 1990.

Onboard the Space Shuttle Orbiter Columbia (STS-35), the various components of the Astro-1 payload are seen backdropped against a blue and white Earth. Parts of the Hopkins Ultraviolet Telescope (HUT), the Ultraviolet Imaging Telescope (UIT), and the Wisconsin Ultraviolet Photo-Polarimetry Experiment (WUPPE) are visible on the Spacelab pallet. The Broad-Band X-Ray Telescope (BBXRT) is behind the pallet and is not visible in this scene. The smaller cylinder in the foreground is the igloo. The igloo was a pressurized container housing the Command Data Management System, that interfaced with the in-cabin controllers to control the Instrument Pointing System (IPS) and the telescopes. The Astro Observatory was designed to explore the universe by observing and measuring the ultraviolet radiation from celestial objects. Astronomical targets of observation selected for Astro missions included planets, stars, star clusters, galaxies, clusters of galaxies, quasars, remnants of exploded stars (supernovae), clouds of gas and dust (nebulae), and the interstellar medium. Managed by the Marshall Space Flight Center, the Astro-1 was launched aboard the Space Shuttle Orbiter Columbia (STS-35) on December 2, 1990.
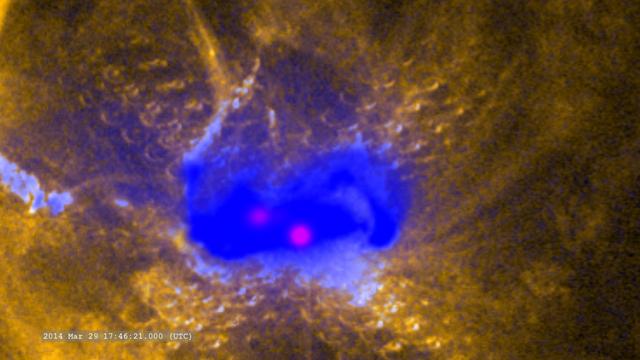
Zoom in on the flare in ultraviolet (SDO/AIA), X-rays (Hinode) and gamma-rays (RHESSI) -- On March 29, 2014 the sun released an X-class flare. It was observed by NASA's Interface Region Imaging Spectrograph, or IRIS; NASA's Solar Dynamics Observatory, or SDO; NASA's Reuven Ramaty High Energy Solar Spectroscopic Imager, or RHESSI; the Japanese Aerospace Exploration Agency's Hinode; and the National Solar Observatory's Dunn Solar Telescope located at Sacramento Peak in New Mexico. To have a record of such an intense flare from so many observatories is unprecedented. Such research can help scientists better understand what catalyst sets off these large explosions on the sun. Perhaps we may even some day be able to predict their onset and forewarn of the radio blackouts solar flares can cause near Earth - blackouts that can interfere with airplane, ship and military communications. Read more: <a href="http://1.usa.gov/1kMDQbO" rel="nofollow">1.usa.gov/1kMDQbO</a> Join our Google+ Hangout on May 8 at 2:30pm EST: <a href="http://go.nasa.gov/1mwbBEZ" rel="nofollow">go.nasa.gov/1mwbBEZ</a> Credit: NASA Goddard <b><a href="http://www.nasa.gov/audience/formedia/features/MP_Photo_Guidelines.html" rel="nofollow">NASA image use policy.</a></b> <b><a href="http://www.nasa.gov/centers/goddard/home/index.html" rel="nofollow">NASA Goddard Space Flight Center</a></b> enables NASA’s mission through four scientific endeavors: Earth Science, Heliophysics, Solar System Exploration, and Astrophysics. Goddard plays a leading role in NASA’s accomplishments by contributing compelling scientific knowledge to advance the Agency’s mission. <b>Follow us on <a href="http://twitter.com/NASAGoddardPix" rel="nofollow">Twitter</a></b> <b>Like us on <a href="http://www.facebook.com/pages/Greenbelt-MD/NASA-Goddard/395013845897?ref=tsd" rel="nofollow">Facebook</a></b> <b>Find us on <a href="http://instagram.com/nasagoddard?vm=grid" rel="nofollow">Instagram</a></b>

In this photograph, the instruments of the Astro-1 Observatory are erected in the cargo bay of the Columbia orbiter. Astro-1 was launched aboard the the Space Shuttle Orbiter Columbia (STS-35) mission on December 2, 1990. The Astro Observatory was designed to explore the universe by observing and measuring the ultraviolet radiation from celestial objects. Astronomical targets of observation selected for Astro missions included planets, stars, star clusters, galaxies, clusters of galaxies, quasars, remnants of exploded stars (supernovae), clouds of gas and dust (nebulae), and the interstellar medium. Astro-1 used a Spacelab pallet system with an instrument pointing system and a cruciform structure for bearing the three ultraviolet instruments mounted in a parallel configuration. The three instruments were:The Hopkins Ultraviolet Telescope (HUT), the Wisconsin Ultraviolet Photo-Polarimeter Experiment (WUPPE), and the Ultraviolet Imaging Telescope (UIT). Also in the payload bay was the Broad Band X-Ray Telescope (BBXRT). Scientific return included approximately 1,000 photographs of the ultraviolet sky in the most extensive ultraviolet imagery ever attempted, the longest ultraviolet spectral observation of a comet ever made, and data never before seen on types of active galaxies called Seyfert galaxies. The mission also provided data on a massive supergiant star captured in outburst and confirmed that a spectral feature observed in the interstellar medium was due to graphite. In addition, Astro-1 acquired superb observations of the Jupiter magnetic interaction with one of its satellites.
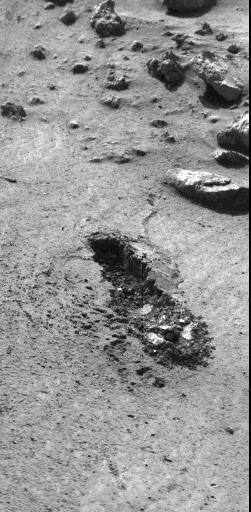
This image, received today, shows the trench excavated by NASA's Viking 1 surface sampler. The trench was dug by extending the surface sampler collection head in a direction from lower right toward the upper left and then withdrawing the surface sampler collector head. Lumpy piles of material at end of trench at lower right was pulled by plowing from trench by the backhoe which will be used to dig trenches later in the mission. Area around trench has ripple marks produced by Martian wind. The trench which was dug early on Sol 8, is about 3 inches wide, 2 inches deep and 6 inches long. Steep dark crater walls show the grains of the Martian surface material stick together (have adhesion). The doming of the surface at far end of the trench show the granular material is dense. The Martian surface material behaves somewhat like moist sand on Earth. Evidence from the trench indicate a sample was collected and delivered to the experiments after repeated tries. The biology experiment level full indicator indicates a sample was received for analysis. The X-Ray fluorescence experiment has no indication to show it received a sample. The GCMS experiment level full indicator suggests no sample was received but this matter is being investigated. http://photojournal.jpl.nasa.gov/catalog/PIA00389
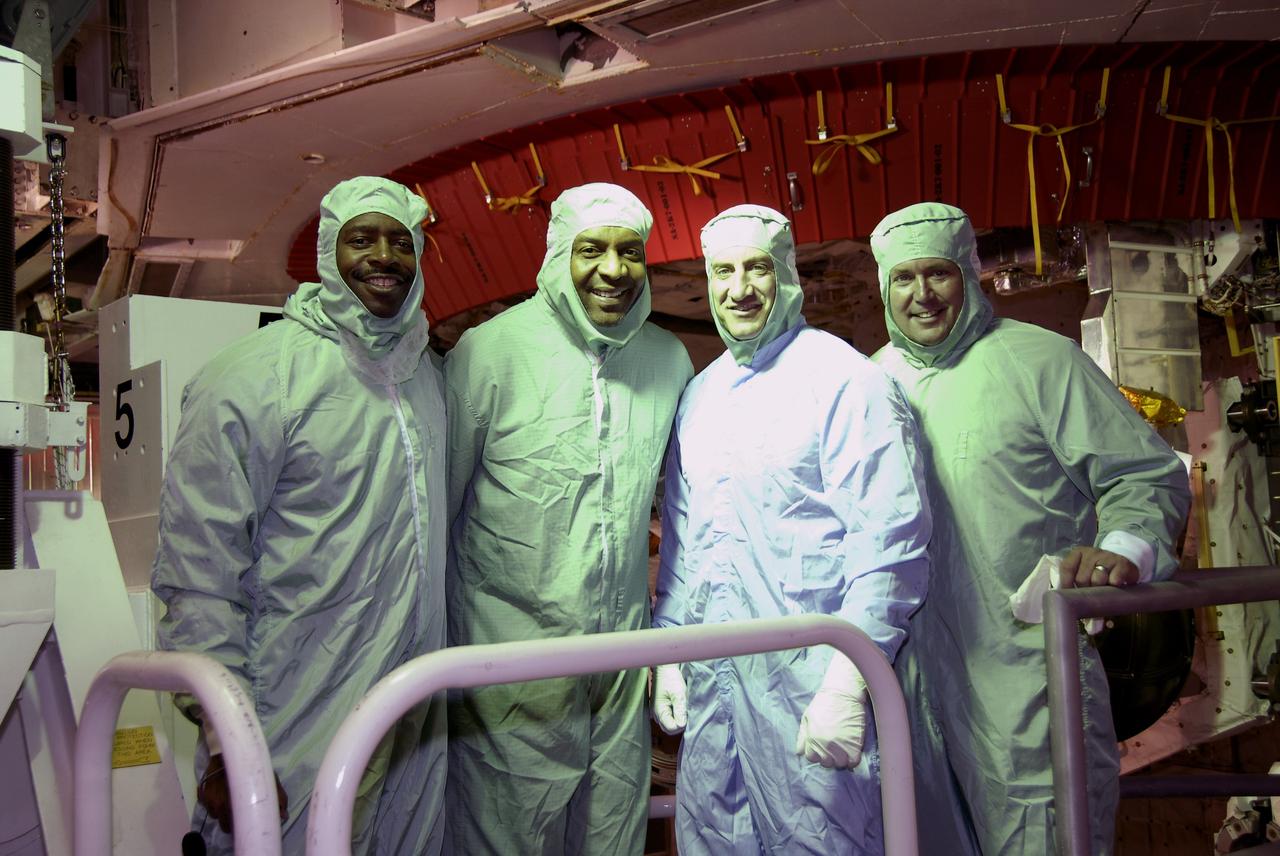
CAPE CANAVERAL, Fla. - In the Payload Changeout Room on Launch Pad 39A at NASA's Kennedy Space Center in Florida, members of the STS-129 crew, dressed in clean-room attire known as "bunny suits," take a break from their payload familiarization training for a photo. From left are Mission Specialists Leland Melvin and Robert L. Satcher Jr., Commander Charles O. Hobaugh and Mission Specialist Mike Foreman. The training affords the crew an opportunity to observe the placement of the Express Logistics Carriers 1 and 2 in space shuttle Atlantis' payload bay before launch. The six astronauts for space shuttle Atlantis’ STS-129 mission came to Kennedy to participate in their launch dress rehearsal, the Terminal Countdown Demonstration Test. Additional training associated with the test was done last month, but the simulated countdown was postponed because of a scheduling conflict with the launch of NASA’s Ares I-X test rocket. Launch of Atlantis on its STS-129 mission to the International Space Station is set for Nov. 16. On STS-129, the crew will deliver to the station two spare gyroscopes, two nitrogen tank assemblies, two pump modules, an ammonia tank assembly and a spare latching end effector for the station's robotic arm. For information on the STS-129 crew and mission objectives, visit http://www.nasa.gov/mission_pages/shuttle/shuttlemissions/sts129/index.html. Photo credit: NASA/Kim Shiflett
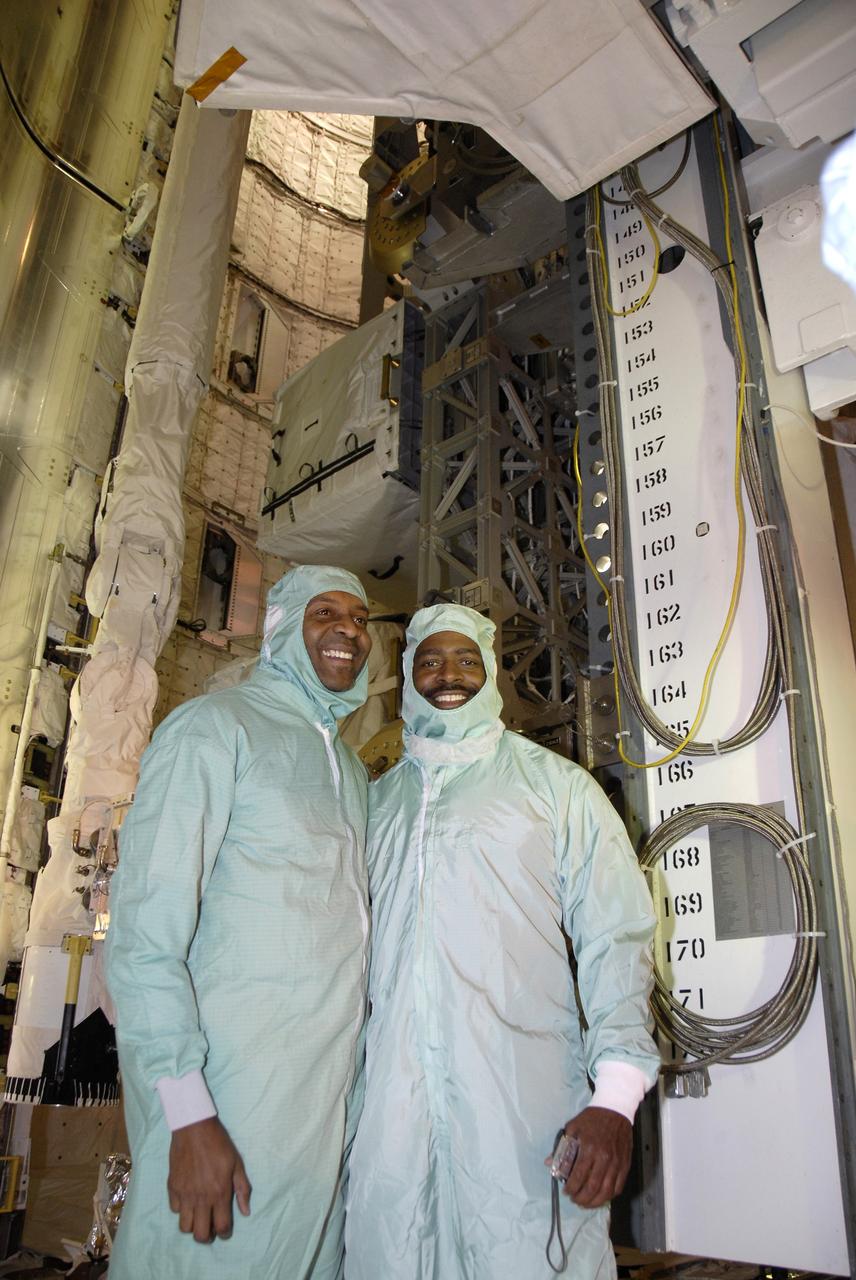
CAPE CANAVERAL, Fla. - In the Payload Changeout Room on Launch Pad 39A at NASA's Kennedy Space Center in Florida, members of the STS-129 crew, dressed in clean-room attire known as "bunny suits," pause a moment during their payload familiarization training for a photo. From left are Mission Specialists Robert L. Satcher Jr. and Leland Melvin. The training affords the crew an opportunity to observe the placement of the Express Logistics Carriers 1 and 2 in space shuttle Atlantis' payload bay before launch. The six astronauts for space shuttle Atlantis’ STS-129 mission came to Kennedy to participate in their launch dress rehearsal, the Terminal Countdown Demonstration Test. Additional training associated with the test was done last month, but the simulated countdown was postponed because of a scheduling conflict with the launch of NASA’s Ares I-X test rocket. Launch of Atlantis on its STS-129 mission to the International Space Station is set for Nov. 16. On STS-129, the crew will deliver to the station two spare gyroscopes, two nitrogen tank assemblies, two pump modules, an ammonia tank assembly and a spare latching end effector for the station's robotic arm. For information on the STS-129 crew and mission objectives, visit http://www.nasa.gov/mission_pages/shuttle/shuttlemissions/sts129/index.html. Photo credit: NASA/Kim Shiflett
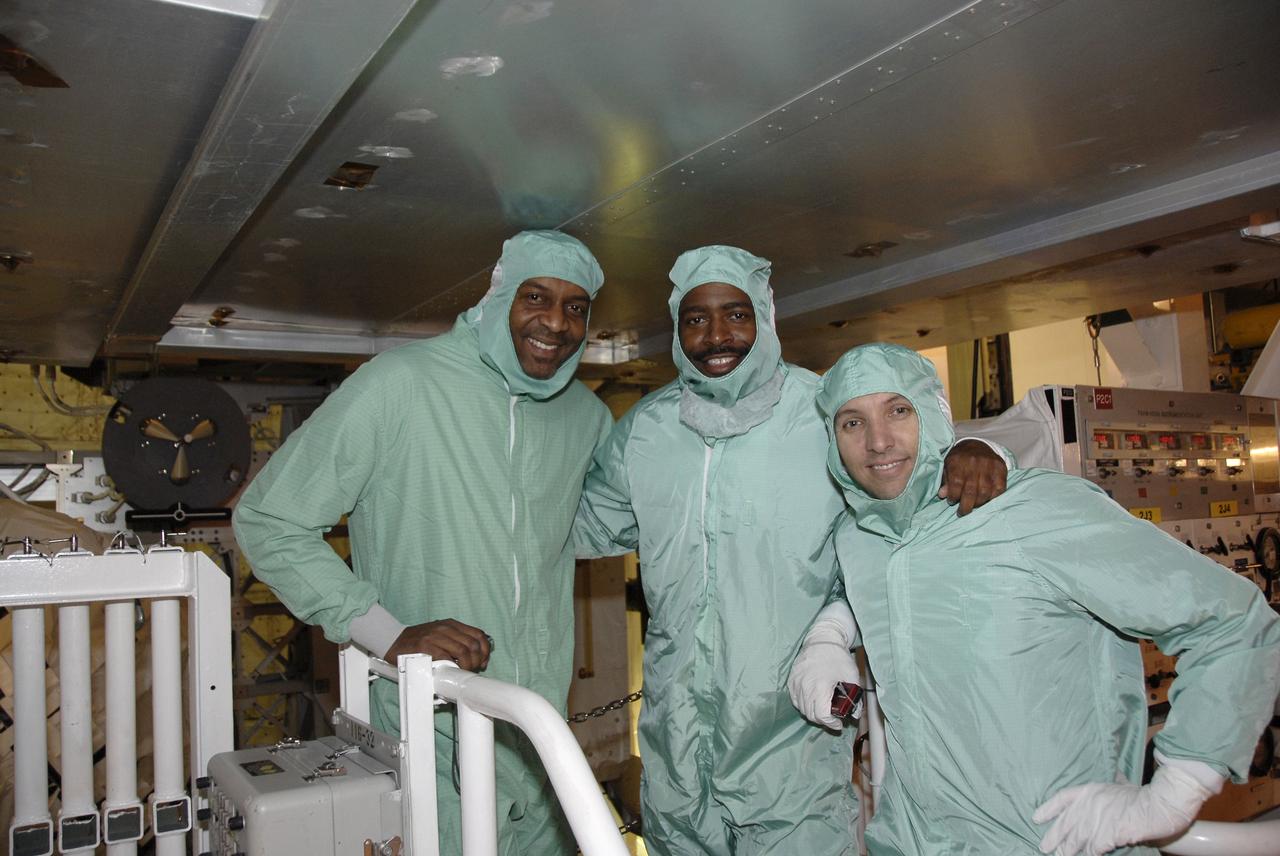
CAPE CANAVERAL, Fla. - In the Payload Changeout Room on Launch Pad 39A at NASA's Kennedy Space Center in Florida, members of the STS-129 crew, dressed in clean-room attire known as "bunny suits," take time out from their payload familiarization training for a photo. From left are Mission Specialists Robert L. Satcher Jr., Leland Melvin, and Randy Bresnik. The training affords the crew an opportunity to observe the placement of the Express Logistics Carriers 1 and 2 in space shuttle Atlantis' payload bay before launch. The six astronauts for space shuttle Atlantis’ STS-129 mission came to Kennedy to participate in their launch dress rehearsal, the Terminal Countdown Demonstration Test. Additional training associated with the test was done last month, but the simulated countdown was postponed because of a scheduling conflict with the launch of NASA’s Ares I-X test rocket. Launch of Atlantis on its STS-129 mission to the International Space Station is set for Nov. 16. On STS-129, the crew will deliver to the station two spare gyroscopes, two nitrogen tank assemblies, two pump modules, an ammonia tank assembly and a spare latching end effector for the station's robotic arm. For information on the STS-129 crew and mission objectives, visit http://www.nasa.gov/mission_pages/shuttle/shuttlemissions/sts129/index.html. Photo credit: NASA/Kim Shiflett
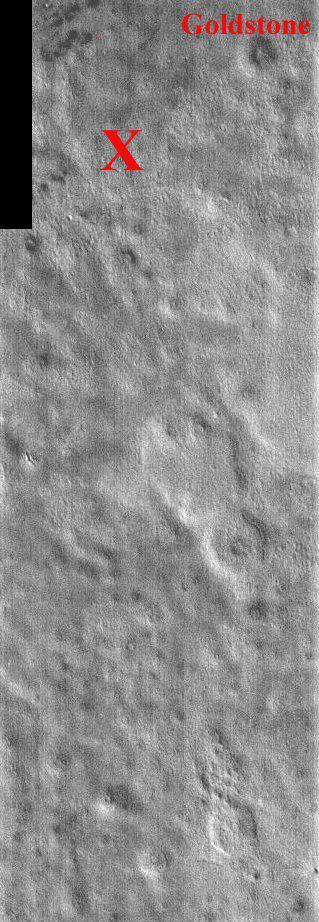
This portion of NASA Mars Odyssey image covers NASA Viking 2 landing site shown with the X. The second landing on Mars took place September 3, 1976 in Utopia Planitia. The exact location of Lander 2 is not as well established as Lander 1 because there were no clearly identifiable features in the lander images as there were for the site of Lander 1. The Utopia landing site region contains pedestal craters, shallow swales and gentle ridges. The crater Goldstone was named in honor of the Tracking Station in the desert of California. The two Viking Landers operated for over 6 years (nearly four martian years) after landing. This one band IR (band 9 at 12.6 microns) image shows bright and dark textures, which are primarily due to differences in the abundance of rocks on the surface. The relatively cool (dark) regions during the day are rocky or indurated materials, fine sand and dust are warmer (bright). Many of the temperature variations are due to slope effects, with sun-facing slopes warmer than shaded slopes. The dark rings around several of the craters are due to the presence of rocky (cool) material ejected from the crater. These rocks are well below the resolution of any existing Mars camera, but THEMIS can detect the temperature variations they produce. Daytime temperature variations are produced by a combination of topographic (solar heating) and thermophysical (thermal inertia and albedo) effects. Due to topographic heating the surface morphologies seen in THEMIS daytime IR images are similar to those seen in previous imagery and MOLA topography. http://photojournal.jpl.nasa.gov/catalog/PIA04023
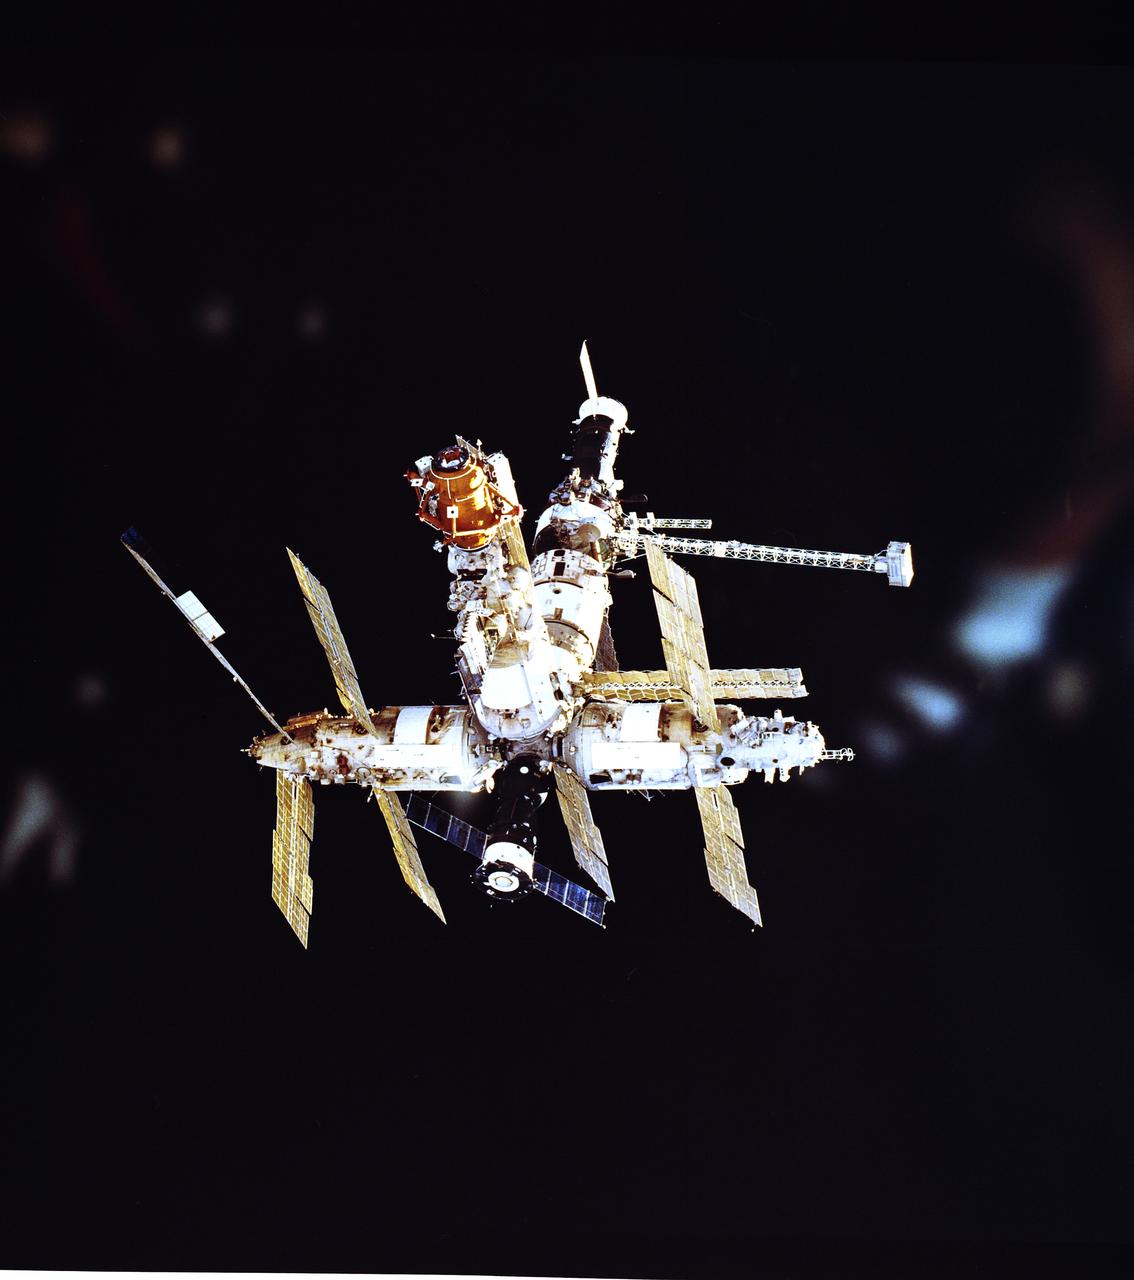
This is a view of the Russian Mir Space Station photographed by a crewmember of the second Shuttle/Mir docking mission, STS-74. The image shows: top - Progress supply vehicle, Kvant-1 module, and the Core module; middle left - Spektr module; middle center - Kristall module and Docking module; middle right - Kvant-2 module; and bottom - Soyuz. The Progress was an unmarned, automated version of the Soyuz crew transfer vehicle, designed to resupply the Mir. The Kvant-1 provided research in the physics of galaxies, quasars, and neutron stars by measuring electromagnetic spectra and x-ray emissions. The Core module served as the heart of the space station and contained the primary living and working areas, life support, and power, as well as the main computer, communications, and control equipment. The Spektr module provided Earth observation. It also supported research into biotechnology, life sciences, materials science, and space technologies. American astronauts used the Spektr as their living quarters. A main purpose of the Kristall module was to develop biological and materials production technologies in the space environment. The Docking module made it possible for the Space Shuttle to dock easily with the Mir. Kvant-2 was a scientific and airlock module, providing biological research, Earth observations, and EVA (extravehicular activity) capability. The Soyuz typically ferried three crewmembers to and from the Mir. The journey of the 15-year-old Russian Mir Space Station ended March 23, 2001, as the Mir re-entered the Earth's atmosphere and fell into the south Pacific Ocean.
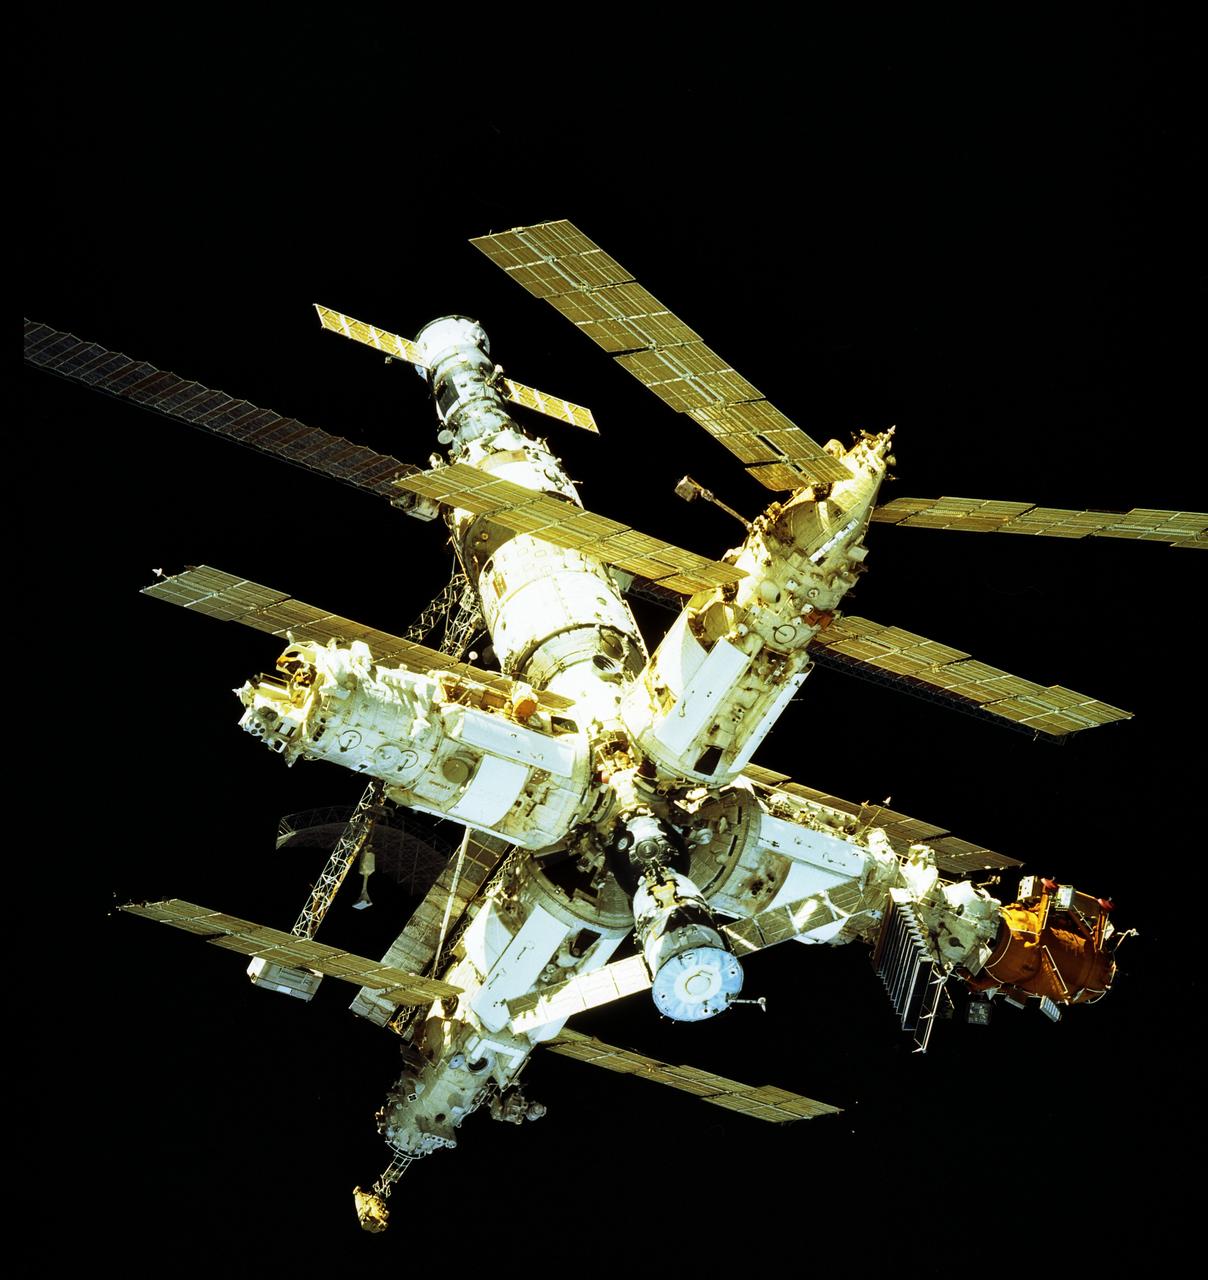
This is a view of the Russian Mir Space Station photographed by a crewmember of the fifth Shuttle/Mir docking mission, STS-81. The image shows: upper center - Progress supply vehicle, Kvant-1 module, and Core module; center left - Priroda module; center right - Spektr module; bottom left - Kvant-2 module; bottom center - Soyuz; and bottom right - Kristall module and Docking module. The Progress was an unmarned, automated version of the Soyuz crew transfer vehicle, designed to resupply the Mir. The Kvant-1 provided research in the physics of galaxies, quasars, and neutron stars, by measuring electromagnetic spectra and x-ray emissions. The Core module served as the heart of the space station and contained the primary living and working areas, life support, and power, as well as the main computer, communications, and control equipment. Priroda's main purpose was Earth remote sensing. The Spektr module provided Earth observation. It also supported research into biotechnology, life sciences, materials science, and space technologies. American astronauts used the Spektr as their living quarters. Kvant-2 was a scientific and airlock module, providing biological research, Earth observations, and EVA (extravehicular activity) capability. The Soyuz typically ferried three crewmembers to and from the Mir. A main purpose of the Kristall module was to develop biological and materials production technologies in the space environment. The Docking module made it possible for the Space Shuttle to dock easily with the Mir. The journey of the 15-year-old Russian Mir Space Station ended March 23, 2001, as the Mir re-entered the Earth's atmosphere and fell into the south Pacific Ocean.
The March 29, 2014, X-class flare appears as a bright light on the upper right in this image from SDO, showing light in the 304 Angstrom wavelength. This wavelength shows material on the sun in what's called the transition region, where the chromosphere transitions into the upper solar atmosphere, the corona. Some light of the flare is clearly visible, but the flare appears brighter in other images that show hotter temperature material. Credit: NASA/SDO/AIA -- On March 29, 2014 the sun released an X-class flare. It was observed by NASA's Interface Region Imaging Spectrograph, or IRIS; NASA's Solar Dynamics Observatory, or SDO; NASA's Reuven Ramaty High Energy Solar Spectroscopic Imager, or RHESSI; the Japanese Aerospace Exploration Agency's Hinode; and the National Solar Observatory's Dunn Solar Telescope located at Sacramento Peak in New Mexico. To have a record of such an intense flare from so many observatories is unprecedented. Such research can help scientists better understand what catalyst sets off these large explosions on the sun. Perhaps we may even some day be able to predict their onset and forewarn of the radio blackouts solar flares can cause near Earth - blackouts that can interfere with airplane, ship and military communications. Read more: <a href="http://1.usa.gov/1kMDQbO" rel="nofollow">1.usa.gov/1kMDQbO</a> Join our Google+ Hangout on May 8 at 2:30pm EST: <a href="http://go.nasa.gov/1mwbBEZ" rel="nofollow">go.nasa.gov/1mwbBEZ</a> <b><a href="http://www.nasa.gov/audience/formedia/features/MP_Photo_Guidelines.html" rel="nofollow">NASA image use policy.</a></b> <b><a href="http://www.nasa.gov/centers/goddard/home/index.html" rel="nofollow">NASA Goddard Space Flight Center</a></b> enables NASA’s mission through four scientific endeavors: Earth Science, Heliophysics, Solar System Exploration, and Astrophysics. Goddard plays a leading role in NASA’s accomplishments by contributing compelling scientific knowledge to advance the Agency’s mission. <b>Follow us on <a href="http://twitter.com/NASAGoddardPix" rel="nofollow">Twitter</a></b> <b>Like us on <a href="http://www.facebook.com/pages/Greenbelt-MD/NASA-Goddard/395013845897?ref=tsd" rel="nofollow">Facebook</a></b> <b>Find us on <a href="http://instagram.com/nasagoddard?vm=grid" rel="nofollow">Instagram</a></b>
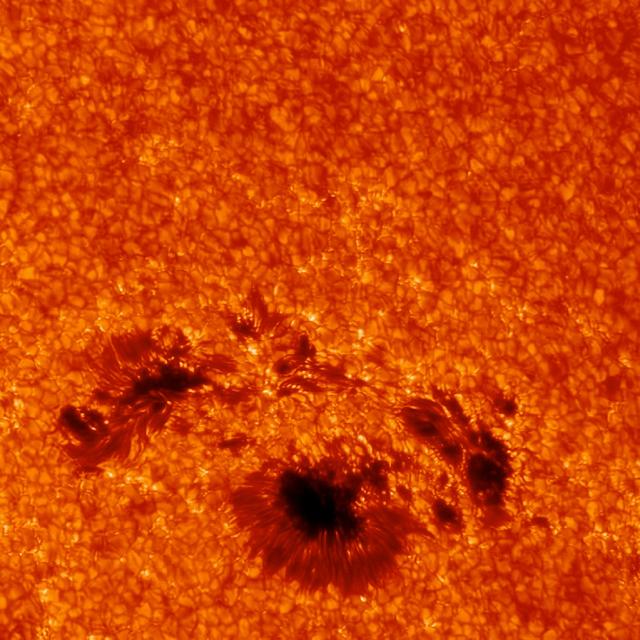
This close-up of the sunspot underneath the March 29, 2014, flare shows incredible detail. The image was captured by the G-band camera at Sacramento Peak in New Mexico. This instrument can focus on only a small area at once, but provide very high resolution. Ground-based telescope data can be hindered by Earth's atmosphere, which blocks much of the sun's ultraviolet and X-ray light, and causes twinkling even in the light it does allow through. As it happens, the March 29 flare occurred at a time of day in New Mexico that often results in the best viewing times from the ground. Credit: Kevin Reardon (National Solar Observatory), Lucia Kleint (BAER Institute) -- On March 29, 2014 the sun released an X-class flare. It was observed by NASA's Interface Region Imaging Spectrograph, or IRIS; NASA's Solar Dynamics Observatory, or SDO; NASA's Reuven Ramaty High Energy Solar Spectroscopic Imager, or RHESSI; the Japanese Aerospace Exploration Agency's Hinode; and the National Solar Observatory's Dunn Solar Telescope located at Sacramento Peak in New Mexico. To have a record of such an intense flare from so many observatories is unprecedented. Such research can help scientists better understand what catalyst sets off these large explosions on the sun. Perhaps we may even some day be able to predict their onset and forewarn of the radio blackouts solar flares can cause near Earth - blackouts that can interfere with airplane, ship and military communications. Read more: <a href="http://1.usa.gov/1kMDQbO" rel="nofollow">1.usa.gov/1kMDQbO</a> Join our Google+ Hangout on May 8 at 2:30pm EST: <a href="http://go.nasa.gov/1mwbBEZ" rel="nofollow">go.nasa.gov/1mwbBEZ</a> Credit: NASA Goddard <b><a href="http://www.nasa.gov/audience/formedia/features/MP_Photo_Guidelines.html" rel="nofollow">NASA image use policy.</a></b> <b><a href="http://www.nasa.gov/centers/goddard/home/index.html" rel="nofollow">NASA Goddard Space Flight Center</a></b> enables NASA’s mission through four scientific endeavors: Earth Science, Heliophysics, Solar System Exploration, and Astrophysics. Goddard plays a leading role in NASA’s accomplishments by contributing compelling scientific knowledge to advance the Agency’s mission. <b>Follow us on <a href="http://twitter.com/NASAGoddardPix" rel="nofollow">Twitter</a></b> <b>Like us on <a href="http://www.facebook.com/pages/Greenbelt-MD/NASA-Goddard/395013845897?ref=tsd" rel="nofollow">Facebook</a></b> <b>Find us on <a href="http://instagram.com/nasagoddard?vm=grid" rel="nofollow">Instagram</a></b>
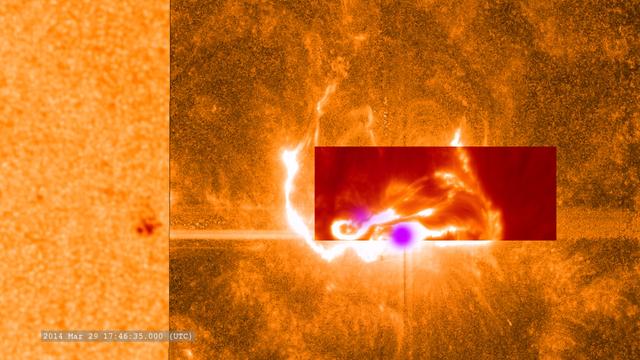
This combined image shows the March 29, 2014, X-class flare as seen through the eyes of different observatories. SDO is on the bottom/left, which helps show the position of the flare on the sun. The darker orange square is IRIS data. The red rectangular inset is from Sacramento Peak. The violet spots show the flare's footpoints from RHESSI. -- On March 29, 2014 the sun released an X-class flare. It was observed by NASA's Interface Region Imaging Spectrograph, or IRIS; NASA's Solar Dynamics Observatory, or SDO; NASA's Reuven Ramaty High Energy Solar Spectroscopic Imager, or RHESSI; the Japanese Aerospace Exploration Agency's Hinode; and the National Solar Observatory's Dunn Solar Telescope located at Sacramento Peak in New Mexico. To have a record of such an intense flare from so many observatories is unprecedented. Such research can help scientists better understand what catalyst sets off these large explosions on the sun. Perhaps we may even some day be able to predict their onset and forewarn of the radio blackouts solar flares can cause near Earth - blackouts that can interfere with airplane, ship and military communications. Read more: <a href="http://1.usa.gov/1kMDQbO" rel="nofollow">1.usa.gov/1kMDQbO</a> Join our Google+ Hangout on May 8 at 2:30pm EST: <a href="http://go.nasa.gov/1mwbBEZ" rel="nofollow">go.nasa.gov/1mwbBEZ</a> Credit: NASA Goddard <b><a href="http://www.nasa.gov/audience/formedia/features/MP_Photo_Guidelines.html" rel="nofollow">NASA image use policy.</a></b> <b><a href="http://www.nasa.gov/centers/goddard/home/index.html" rel="nofollow">NASA Goddard Space Flight Center</a></b> enables NASA’s mission through four scientific endeavors: Earth Science, Heliophysics, Solar System Exploration, and Astrophysics. Goddard plays a leading role in NASA’s accomplishments by contributing compelling scientific knowledge to advance the Agency’s mission. <b>Follow us on <a href="http://twitter.com/NASAGoddardPix" rel="nofollow">Twitter</a></b> <b>Like us on <a href="http://www.facebook.com/pages/Greenbelt-MD/NASA-Goddard/395013845897?ref=tsd" rel="nofollow">Facebook</a></b> <b>Find us on <a href="http://instagram.com/nasagoddard?vm=grid" rel="nofollow">Instagram</a></b>
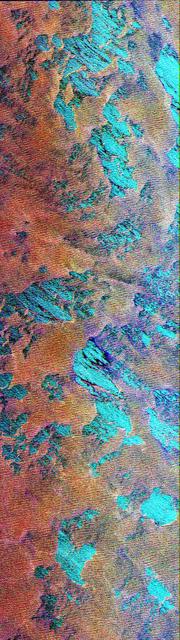
This Spaceborne Imaging Radar-C/X-band Synthetic Aperture Radar color composite shows a portion of the Weddell Sea, which is adjacent to the continent of Antarctica. The image shows extensive coverage of first-year sea ice mixtures and patches of open water inside the ice margin. The image covers a 100 kilometer by 30 kilometer (62 mile by 18.5 mile) region of the southern ocean, centered at approximately 57 degrees south latitude and 3 degrees east longitude, which was acquired on October 3, 1994. Data used to create this image were obtained using the L-band (horizontally transmitted and vertically received) in red; the L-band (horizontally transmitted and received) in green; and the C-band (horizontally transmitted and received) in blue. The sea ice, which appears rust-brown in the image, is composed of loosely packed floes from approximately 1 meter to 2 meters (3 feet to 6.5 feet) thick and ranging from 1 meter to 20 meters (3 feet to 65.5 feet) in diameter. Large patches of open water, shown as turquoise blue, are scattered throughout the area, which is typical for ice margins experiencing off-ice winds. The thin, well-organized lines clearly visible in the ice pack are caused by radar energy reflected by floes riding the crest of ocean swells. The wispy, black features seen throughout the image represent areas where new ice is forming. Sea ice, because it acts as an insulator, reduces the loss of heat between the relatively warm ocean and cold atmosphere. This interaction is an important component of the global climate system. Because of the unique combination of winds, currents and temperatures found in this region, ice can extend many hundreds of kilometers north of Antarctica each winter, which classifies the Weddell Sea as one of nature's greatest ice-making engines. During the formation of sea ice, great quantities of salt are expelled from the frozen water. The salt increases the density of the upper layer of sea water, which then sinks to great depths. Oceanographers believe this process forms most of the oceans' deep water. Sea ice covering all of the southern oceans, including the Weddell Sea, typically reaches its most northerly extent in about September. As periods of daylight become gradually longer in the Southern Hemisphere, ice formation stops and the ice edge retreats southward. By February, most of the sea ice surrounding Antarctica disappears. Imaging radar is extremely useful for studying the polar regions because of the long periods of darkness and extensive cloud cover. The multiple frequencies of the SIR-C/X-SAR instruments allow further study into ways of improving the separation of the various thickness ranges of sea ice, which are vital to understanding the heat balance in the ice, ocean and atmospheric system. http://photojournal.jpl.nasa.gov/catalog/PIA01737
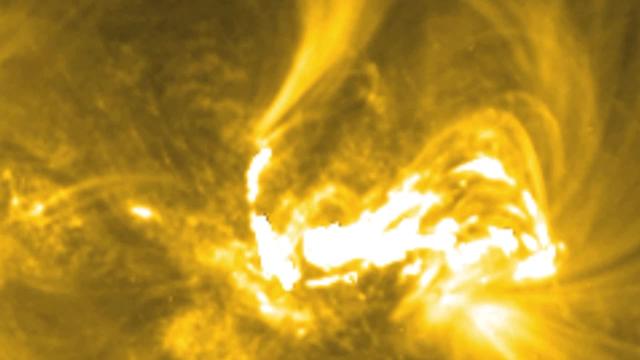
On March 29, 2014 the sun released an X-class flare. It was observed by NASA's Interface Region Imaging Spectrograph, or IRIS; NASA's Solar Dynamics Observatory, or SDO; NASA's Reuven Ramaty High Energy Solar Spectroscopic Imager, or RHESSI; the Japanese Aerospace Exploration Agency's Hinode; and the National Solar Observatory's Dunn Solar Telescope located at Sacramento Peak in New Mexico. To have a record of such an intense flare from so many observatories is unprecedented. Such research can help scientists better understand what catalyst sets off these large explosions on the sun. Perhaps we may even some day be able to predict their onset and forewarn of the radio blackouts solar flares can cause near Earth - blackouts that can interfere with airplane, ship and military communications. Read more: <a href="http://1.usa.gov/1kMDQbO" rel="nofollow">1.usa.gov/1kMDQbO</a> Join our Google+ Hangout on May 8 at 2:30pm EST: <a href="http://go.nasa.gov/1mwbBEZ" rel="nofollow">go.nasa.gov/1mwbBEZ</a> Credit: NASA Goddard <b><a href="http://www.nasa.gov/audience/formedia/features/MP_Photo_Guidelines.html" rel="nofollow">NASA image use policy.</a></b> <b><a href="http://www.nasa.gov/centers/goddard/home/index.html" rel="nofollow">NASA Goddard Space Flight Center</a></b> enables NASA’s mission through four scientific endeavors: Earth Science, Heliophysics, Solar System Exploration, and Astrophysics. Goddard plays a leading role in NASA’s accomplishments by contributing compelling scientific knowledge to advance the Agency’s mission. <b>Follow us on <a href="http://twitter.com/NASAGoddardPix" rel="nofollow">Twitter</a></b> <b>Like us on <a href="http://www.facebook.com/pages/Greenbelt-MD/NASA-Goddard/395013845897?ref=tsd" rel="nofollow">Facebook</a></b> <b>Find us on <a href="http://instagram.com/nasagoddard?vm=grid" rel="nofollow">Instagram</a></b>
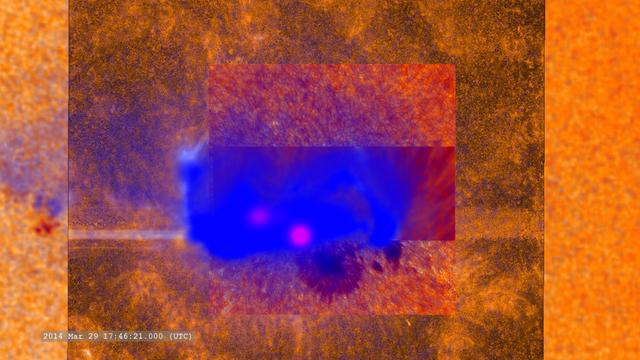
A combination of many (but not all) of the datasets which observed this flare. -- On March 29, 2014 the sun released an X-class flare. It was observed by NASA's Interface Region Imaging Spectrograph, or IRIS; NASA's Solar Dynamics Observatory, or SDO; NASA's Reuven Ramaty High Energy Solar Spectroscopic Imager, or RHESSI; the Japanese Aerospace Exploration Agency's Hinode; and the National Solar Observatory's Dunn Solar Telescope located at Sacramento Peak in New Mexico. To have a record of such an intense flare from so many observatories is unprecedented. Such research can help scientists better understand what catalyst sets off these large explosions on the sun. Perhaps we may even some day be able to predict their onset and forewarn of the radio blackouts solar flares can cause near Earth - blackouts that can interfere with airplane, ship and military communications. Read more: <a href="http://1.usa.gov/1kMDQbO" rel="nofollow">1.usa.gov/1kMDQbO</a> Join our Google+ Hangout on May 8 at 2:30pm EST: <a href="http://go.nasa.gov/1mwbBEZ" rel="nofollow">go.nasa.gov/1mwbBEZ</a> Credit: NASA Goddard <b><a href="http://www.nasa.gov/audience/formedia/features/MP_Photo_Guidelines.html" rel="nofollow">NASA image use policy.</a></b> <b><a href="http://www.nasa.gov/centers/goddard/home/index.html" rel="nofollow">NASA Goddard Space Flight Center</a></b> enables NASA’s mission through four scientific endeavors: Earth Science, Heliophysics, Solar System Exploration, and Astrophysics. Goddard plays a leading role in NASA’s accomplishments by contributing compelling scientific knowledge to advance the Agency’s mission. <b>Follow us on <a href="http://twitter.com/NASAGoddardPix" rel="nofollow">Twitter</a></b> <b>Like us on <a href="http://www.facebook.com/pages/Greenbelt-MD/NASA-Goddard/395013845897?ref=tsd" rel="nofollow">Facebook</a></b> <b>Find us on <a href="http://instagram.com/nasagoddard?vm=grid" rel="nofollow">Instagram</a></b>
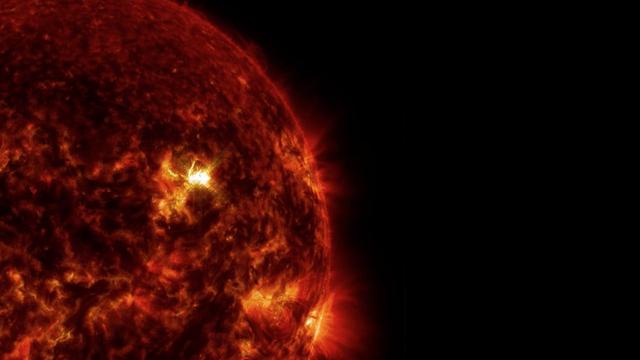
On March 29, 2014 the sun released an X-class flare. It was observed by NASA's Interface Region Imaging Spectrograph, or IRIS; NASA's Solar Dynamics Observatory, or SDO; NASA's Reuven Ramaty High Energy Solar Spectroscopic Imager, or RHESSI; the Japanese Aerospace Exploration Agency's Hinode; and the National Solar Observatory's Dunn Solar Telescope located at Sacramento Peak in New Mexico. To have a record of such an intense flare from so many observatories is unprecedented. Such research can help scientists better understand what catalyst sets off these large explosions on the sun. Perhaps we may even some day be able to predict their onset and forewarn of the radio blackouts solar flares can cause near Earth - blackouts that can interfere with airplane, ship and military communications. Read more: <a href="http://1.usa.gov/1kMDQbO" rel="nofollow">1.usa.gov/1kMDQbO</a> Join our Google+ Hangout on May 8 at 2:30pm EST: <a href="http://go.nasa.gov/1mwbBEZ" rel="nofollow">go.nasa.gov/1mwbBEZ</a> Credit: NASA Goddard <b><a href="http://www.nasa.gov/audience/formedia/features/MP_Photo_Guidelines.html" rel="nofollow">NASA image use policy.</a></b> <b><a href="http://www.nasa.gov/centers/goddard/home/index.html" rel="nofollow">NASA Goddard Space Flight Center</a></b> enables NASA’s mission through four scientific endeavors: Earth Science, Heliophysics, Solar System Exploration, and Astrophysics. Goddard plays a leading role in NASA’s accomplishments by contributing compelling scientific knowledge to advance the Agency’s mission. <b>Follow us on <a href="http://twitter.com/NASAGoddardPix" rel="nofollow">Twitter</a></b> <b>Like us on <a href="http://www.facebook.com/pages/Greenbelt-MD/NASA-Goddard/395013845897?ref=tsd" rel="nofollow">Facebook</a></b> <b>Find us on <a href="http://instagram.com/nasagoddard?vm=grid" rel="nofollow">Instagram</a></b>
![This image from NASA's Mars Reconnaissance Orbiter (MRO) shows Mars' surface in detail. Mars has captured the imagination of astronomers for thousands of years, but it wasn't until the last half a century that we were able to capture images of its surface in detail. This particular site on Mars was first imaged in 1965 by the Mariner 4 spacecraft during the first successful fly-by mission to Mars. From an altitude of around 10,000 kilometers, this image (the ninth frame taken) achieved a resolution of approximately 1.25 kilometers per pixel. Since then, this location has been observed by six other visible cameras producing images with varying resolutions and sizes. This includes HiRISE (highlighted in yellow), which is the highest-resolution and has the smallest "footprint." This compilation, spanning Mariner 4 to HiRISE, shows each image at full-resolution. Beginning with Viking 1 and ending with our HiRISE image, this animation documents the historic imaging of a particular site on another world. In 1976, the Viking 1 orbiter began imaging Mars in unprecedented detail, and by 1980 had successfully mosaicked the planet at approximately 230 meters per pixel. In 1999, the Mars Orbiter Camera onboard the Mars Global Surveyor (1996) also imaged this site with its Wide Angle lens, at around 236 meters per pixel. This was followed by the Thermal Emission Imaging System on Mars Odyssey (2001), which also provided a visible camera producing the image we see here at 17 meters per pixel. Later in 2012, the High-Resolution Stereo Camera on the Mars Express orbiter (2003) captured this image of the surface at 25 meters per pixel. In 2010, the Context Camera on the Mars Reconnaissance Orbiter (2005) imaged this site at about 5 meters per pixel. Finally, in 2017, HiRISE acquired the highest resolution image of this location to date at 50 centimeters per pixel. When seen at this unprecedented scale, we can discern a crater floor strewn with small rocky deposits, boulders several meters across, and wind-blown deposits in the floors of small craters and depressions. This compilation of Mars images spanning over 50 years gives us a visual appreciation of the evolution of orbital Mars imaging over a single site. The map is projected here at a scale of 50 centimeters (19.7 inches) per pixel. [The original image scale is 52.2 centimeters (20.6 inches) per pixel (with 2 x 2 binning); objects on the order of 156 centimeters (61.4 inches) across are resolved.] North is up. https://photojournal.jpl.nasa.gov/catalog/PIA22115](https://images-assets.nasa.gov/image/PIA22115/PIA22115~medium.jpg)
This image from NASA's Mars Reconnaissance Orbiter (MRO) shows Mars' surface in detail. Mars has captured the imagination of astronomers for thousands of years, but it wasn't until the last half a century that we were able to capture images of its surface in detail. This particular site on Mars was first imaged in 1965 by the Mariner 4 spacecraft during the first successful fly-by mission to Mars. From an altitude of around 10,000 kilometers, this image (the ninth frame taken) achieved a resolution of approximately 1.25 kilometers per pixel. Since then, this location has been observed by six other visible cameras producing images with varying resolutions and sizes. This includes HiRISE (highlighted in yellow), which is the highest-resolution and has the smallest "footprint." This compilation, spanning Mariner 4 to HiRISE, shows each image at full-resolution. Beginning with Viking 1 and ending with our HiRISE image, this animation documents the historic imaging of a particular site on another world. In 1976, the Viking 1 orbiter began imaging Mars in unprecedented detail, and by 1980 had successfully mosaicked the planet at approximately 230 meters per pixel. In 1999, the Mars Orbiter Camera onboard the Mars Global Surveyor (1996) also imaged this site with its Wide Angle lens, at around 236 meters per pixel. This was followed by the Thermal Emission Imaging System on Mars Odyssey (2001), which also provided a visible camera producing the image we see here at 17 meters per pixel. Later in 2012, the High-Resolution Stereo Camera on the Mars Express orbiter (2003) captured this image of the surface at 25 meters per pixel. In 2010, the Context Camera on the Mars Reconnaissance Orbiter (2005) imaged this site at about 5 meters per pixel. Finally, in 2017, HiRISE acquired the highest resolution image of this location to date at 50 centimeters per pixel. When seen at this unprecedented scale, we can discern a crater floor strewn with small rocky deposits, boulders several meters across, and wind-blown deposits in the floors of small craters and depressions. This compilation of Mars images spanning over 50 years gives us a visual appreciation of the evolution of orbital Mars imaging over a single site. The map is projected here at a scale of 50 centimeters (19.7 inches) per pixel. [The original image scale is 52.2 centimeters (20.6 inches) per pixel (with 2 x 2 binning); objects on the order of 156 centimeters (61.4 inches) across are resolved.] North is up. https://photojournal.jpl.nasa.gov/catalog/PIA22115

This Chandra X-Ray Observatory image of the mysterious superstar Eta Carinae reveals a surprising hot irner core, creating more questions than answers for astronomers. The image shows three distinct structures: An outer, horseshoe shaped ring about 2 light-years in diameter, a hot inner core about 3 light-months in diameter, and a hot central source less than a light-month in diameter which may contain the superstar. In 1 month, light travels a distance of approximately 489 billion miles (about 788 billion kilometers). All three structures are thought to represent shock waves produced by matter rushing away from the superstar at supersonic speeds. The temperature of the shock-heated gas ranges from 60 million degrees Kelvin in the central regions to 7 million degrees Kelvin on the outer structure. Eta Carinae is one of the most enigmatic and intriguing objects in our galaxy. Between 1837 and 1856, it increased dramatically in brightness to become the most prominent star in the sky except for Sirius, even through it is 7,500 light-years away, more than 80 times the distance to Sirius. This "Great Eruption," as it is called, had an energy comparable to a supernova, yet did not destroy the star, which faded to become a dim star, invisible to the naked eye. Since 1940, Eta Carinae has begun to brighten again, becoming visible to the naked eye. Photo credit: NASA/CXC/SAO
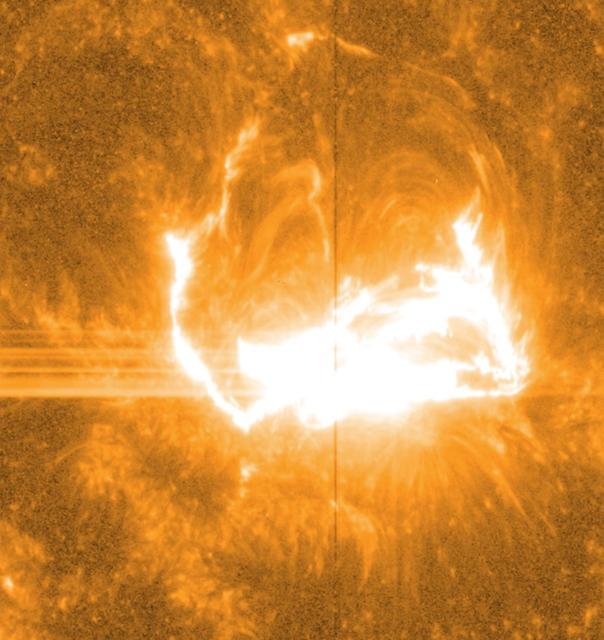
Like almost all solar observatories, NASA's IRIS can provide images of different layers of the sun's atmosphere, which together create a whole picture of what's happening. This image shows light at a wavelength of 1400 Angstrom, which highlights material some 650 miles above the sun's surface. The vertical line in the middle shows the slit for IRIS's spectrograph, which can separate light into its many wavelengths to provide even more information about the temperature and velocity of material during a flare. Credit: NASA/IRIS/Goddard Space Flight Center -- On March 29, 2014 the sun released an X-class flare. It was observed by NASA's Interface Region Imaging Spectrograph, or IRIS; NASA's Solar Dynamics Observatory, or SDO; NASA's Reuven Ramaty High Energy Solar Spectroscopic Imager, or RHESSI; the Japanese Aerospace Exploration Agency's Hinode; and the National Solar Observatory's Dunn Solar Telescope located at Sacramento Peak in New Mexico. To have a record of such an intense flare from so many observatories is unprecedented. Such research can help scientists better understand what catalyst sets off these large explosions on the sun. Perhaps we may even some day be able to predict their onset and forewarn of the radio blackouts solar flares can cause near Earth - blackouts that can interfere with airplane, ship and military communications. Read more: <a href="http://1.usa.gov/1kMDQbO" rel="nofollow">1.usa.gov/1kMDQbO</a> Join our Google+ Hangout on May 8 at 2:30pm EST: <a href="http://go.nasa.gov/1mwbBEZ" rel="nofollow">go.nasa.gov/1mwbBEZ</a> Credit: NASA Goddard <b><a href="http://www.nasa.gov/audience/formedia/features/MP_Photo_Guidelines.html" rel="nofollow">NASA image use policy.</a></b> <b><a href="http://www.nasa.gov/centers/goddard/home/index.html" rel="nofollow">NASA Goddard Space Flight Center</a></b> enables NASA’s mission through four scientific endeavors: Earth Science, Heliophysics, Solar System Exploration, and Astrophysics. Goddard plays a leading role in NASA’s accomplishments by contributing compelling scientific knowledge to advance the Agency’s mission. <b>Follow us on <a href="http://twitter.com/NASAGoddardPix" rel="nofollow">Twitter</a></b> <b>Like us on <a href="http://www.facebook.com/pages/Greenbelt-MD/NASA-Goddard/395013845897?ref=tsd" rel="nofollow">Facebook</a></b> <b>Find us on <a href="http://instagram.com/nasagoddard?vm=grid" rel="nofollow">Instagram</a></b>
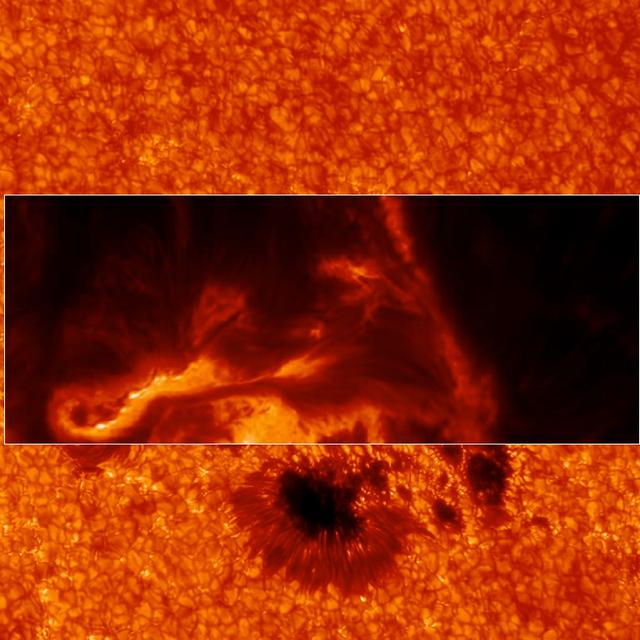
IBIS can focus in on different wavelengths of light, and so reveal different layers at different heights in the sun's lower atmosphere, the chromosphere. This image shows a region slightly higher than the former one. Credit: Lucia Kleint (BAER Institute), Paul Higgins (Trinity College Dublin, Ireland) -- On March 29, 2014 the sun released an X-class flare. It was observed by NASA's Interface Region Imaging Spectrograph, or IRIS; NASA's Solar Dynamics Observatory, or SDO; NASA's Reuven Ramaty High Energy Solar Spectroscopic Imager, or RHESSI; the Japanese Aerospace Exploration Agency's Hinode; and the National Solar Observatory's Dunn Solar Telescope located at Sacramento Peak in New Mexico. To have a record of such an intense flare from so many observatories is unprecedented. Such research can help scientists better understand what catalyst sets off these large explosions on the sun. Perhaps we may even some day be able to predict their onset and forewarn of the radio blackouts solar flares can cause near Earth - blackouts that can interfere with airplane, ship and military communications. Read more: <a href="http://1.usa.gov/1kMDQbO" rel="nofollow">1.usa.gov/1kMDQbO</a> Join our Google+ Hangout on May 8 at 2:30pm EST: <a href="http://go.nasa.gov/1mwbBEZ" rel="nofollow">go.nasa.gov/1mwbBEZ</a> Credit: NASA Goddard <b><a href="http://www.nasa.gov/audience/formedia/features/MP_Photo_Guidelines.html" rel="nofollow">NASA image use policy.</a></b> <b><a href="http://www.nasa.gov/centers/goddard/home/index.html" rel="nofollow">NASA Goddard Space Flight Center</a></b> enables NASA’s mission through four scientific endeavors: Earth Science, Heliophysics, Solar System Exploration, and Astrophysics. Goddard plays a leading role in NASA’s accomplishments by contributing compelling scientific knowledge to advance the Agency’s mission. <b>Follow us on <a href="http://twitter.com/NASAGoddardPix" rel="nofollow">Twitter</a></b> <b>Like us on <a href="http://www.facebook.com/pages/Greenbelt-MD/NASA-Goddard/395013845897?ref=tsd" rel="nofollow">Facebook</a></b> <b>Find us on <a href="http://instagram.com/nasagoddard?vm=grid" rel="nofollow">Instagram</a></b>
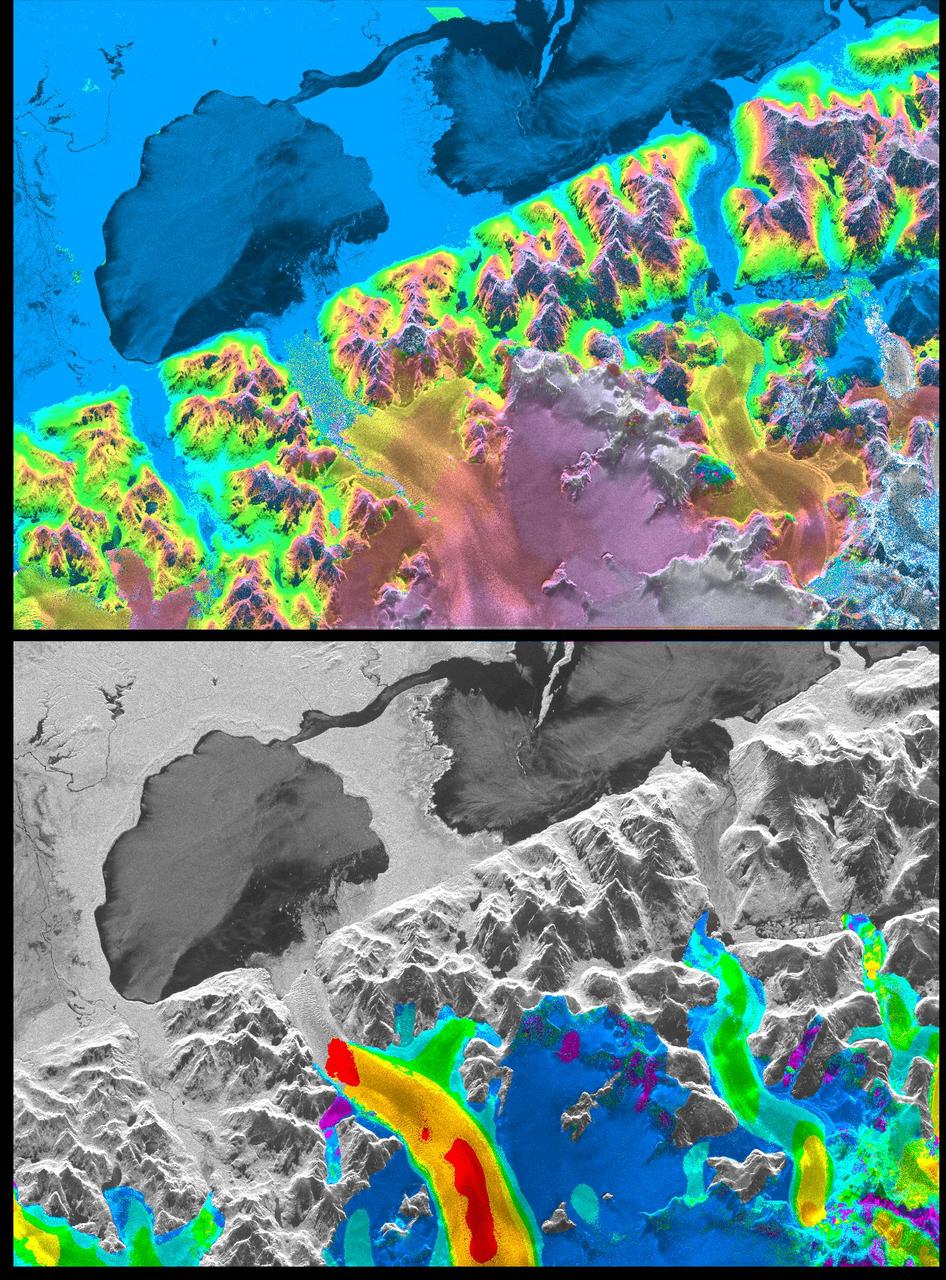
A NASA radar instrument has been successfully used to measure some of the fastest moving and most inaccessible glaciers in the world -- in Chile's huge, remote Patagonia ice fields -- demonstrating a technique that could produce more accurate predictions of glacial response to climate change and corresponding sea level changes. This image, produced with interferometric measurements made by the Spaceborne Imaging Radar-C and X-band Synthetic Aperture Radar (SIR-C/X-SAR) flown on the Space Shuttle last fall, has provided the first detailed measurements of the mass and motion of the San Rafael Glacier. Very few measurements have been made of the Patagonian ice fields, which are the world's largest mid-latitude ice masses and account for more than 60 percent of the Southern Hemisphere's glacial area outside of Antarctica. These features make the area essential for climatologists attempting to understand the response of glaciers on a global scale to changes in climate, but the region's inaccessibility and inhospitable climate have made it nearly impossible for scientists to study its glacial topography, meteorology and changes over time. Currently, topographic data exist for only a few glaciers while no data exist for the vast interior of the ice fields. Velocity has been measured on only five of the more than 100 glaciers, and the data consist of only a few single-point measurements. The interferometry performed by the SIR-C/X-SAR was used to generate both a digital elevation model of the glaciers and a map of their ice motion on a pixel-per-pixel basis at very high resolution for the first time. The data were acquired from nearly the same position in space on October 9, 10 and 11, 1994, at L-band frequency (24-cm wavelength), vertically transmitted and received polarization, as the Space Shuttle Endeavor flew over several Patagonian outlet glaciers of the San Rafael Laguna. The area shown in these two images is 50 kilometers by 30 kilometers (30 miles by 18 miles) in size and is centered at 46.6 degrees south latitude, 73.8 degrees west longitude. North is toward the upper right. The top image is a digital elevation model of the scene, where color and saturation represent terrain height (between 0 meters and 2,000 meters or up to 6,500 feet) and brightness represents radar backscatter. Low elevations are shown in blue and high elevations are shown in pink. The digital elevation map of the glacier surface has a horizontal resolution of 15 meters (50 feet) and a vertical resolution of 10 meters (30 feet). High-resolution maps like these acquired over several years would allow scientists to calculate directly long-term changes in the mass of the glacier. The bottom image is a map of ice motion parallel to the radar look direction only, which is from the top of the image. Purple indicates ice motion away from the radar at more than 6 centimeters per day; dark blue is ice motion toward or away at less than 6 cm per day; light blue is motion toward the radar of 6 cm to 20 cm (about 2 to 8 inches) per day; green is motion toward the radar of 20 cm to 45 cm (about 8 to 18 inches) per day; yellow is 45 cm to 85 cm (about 18 to 33 inches) per day; orange is 85 cm to 180 cm (about 33 to 71 inches) per day; red is greater than 180 cm (71 inches) per day. The velocity estimates are accurate to within 5 millimeters per day. The largest velocities are recorded on the San Rafael Glacier in agreement with previous work. Other outlet glaciers exhibit ice velocities of less than 1 meter per day. Several kilometers before its terminus, (left of center) the velocity of the San Rafael Glacier exceeds 10 meters (32 feet) per day, and ice motion cannot be estimated from the data. There, a revisit time interval of less than 12 hours would have been necessary to estimate ice motion from interferometry data. The results however demonstrate that the radar interferometry technique permits the monitoring of glacier characteristics unattainable by any other means. http://photojournal.jpl.nasa.gov/catalog/PIA01781
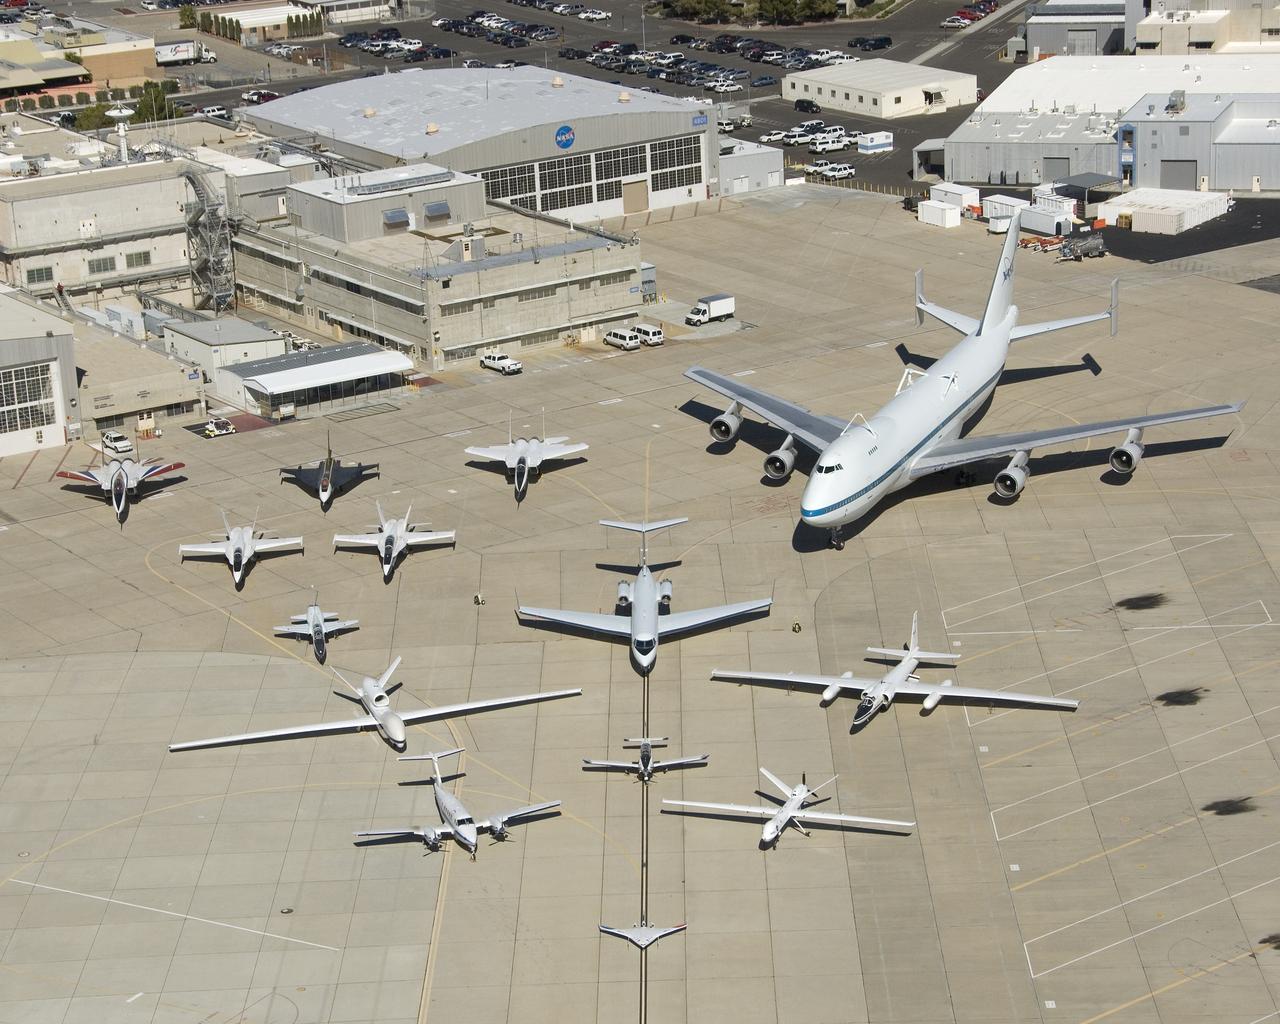
Dryden Flight Research Center - aircraft fleet on ramp