
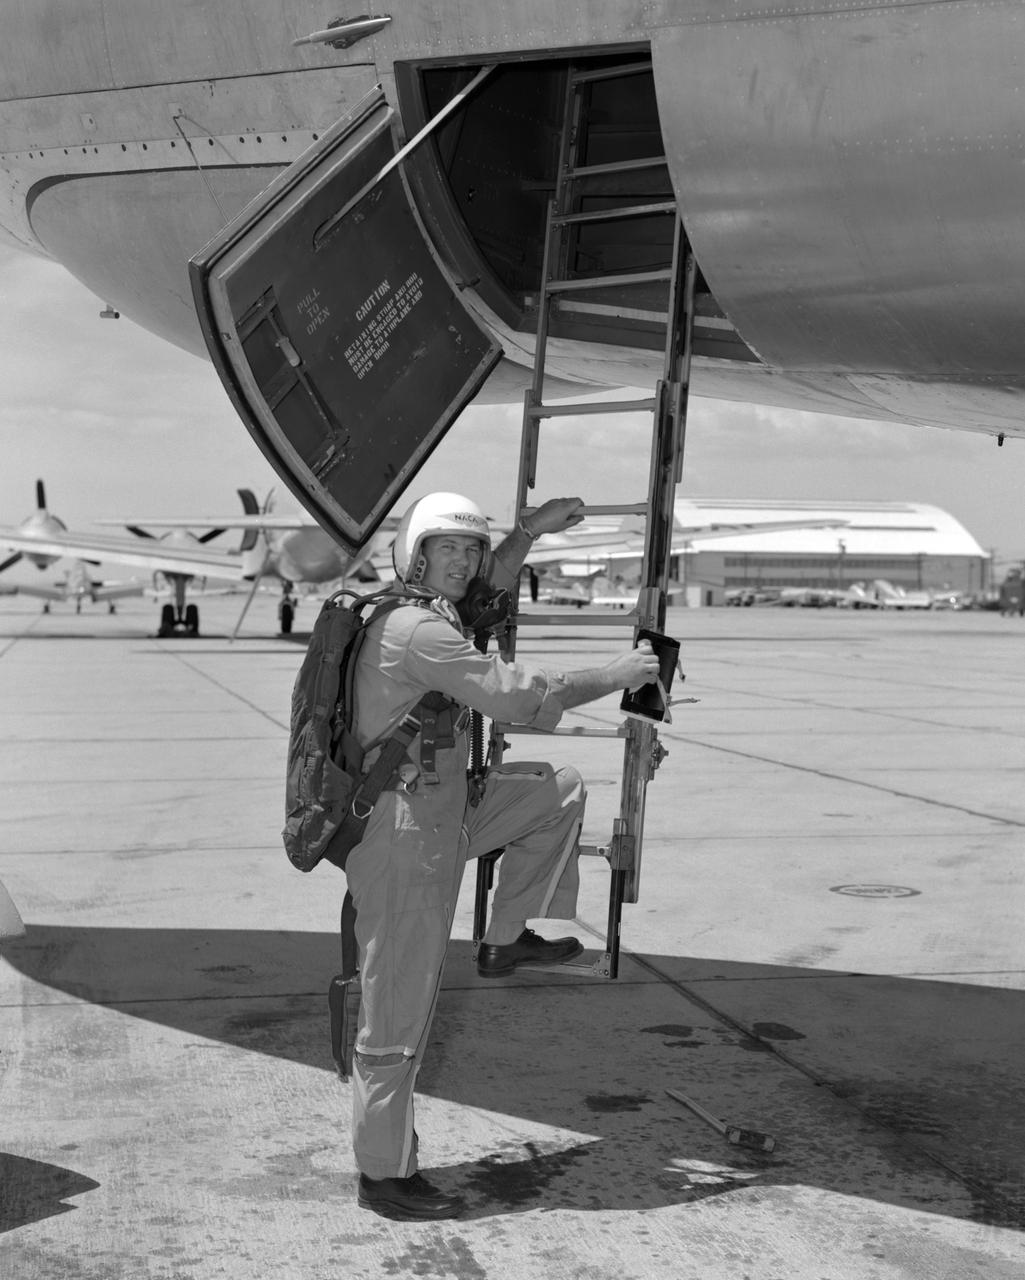
Woody Cook standing by X-14

Woody Cook standing by X-14
X-14 Aircraft during hover flight tests at VTOL test pad
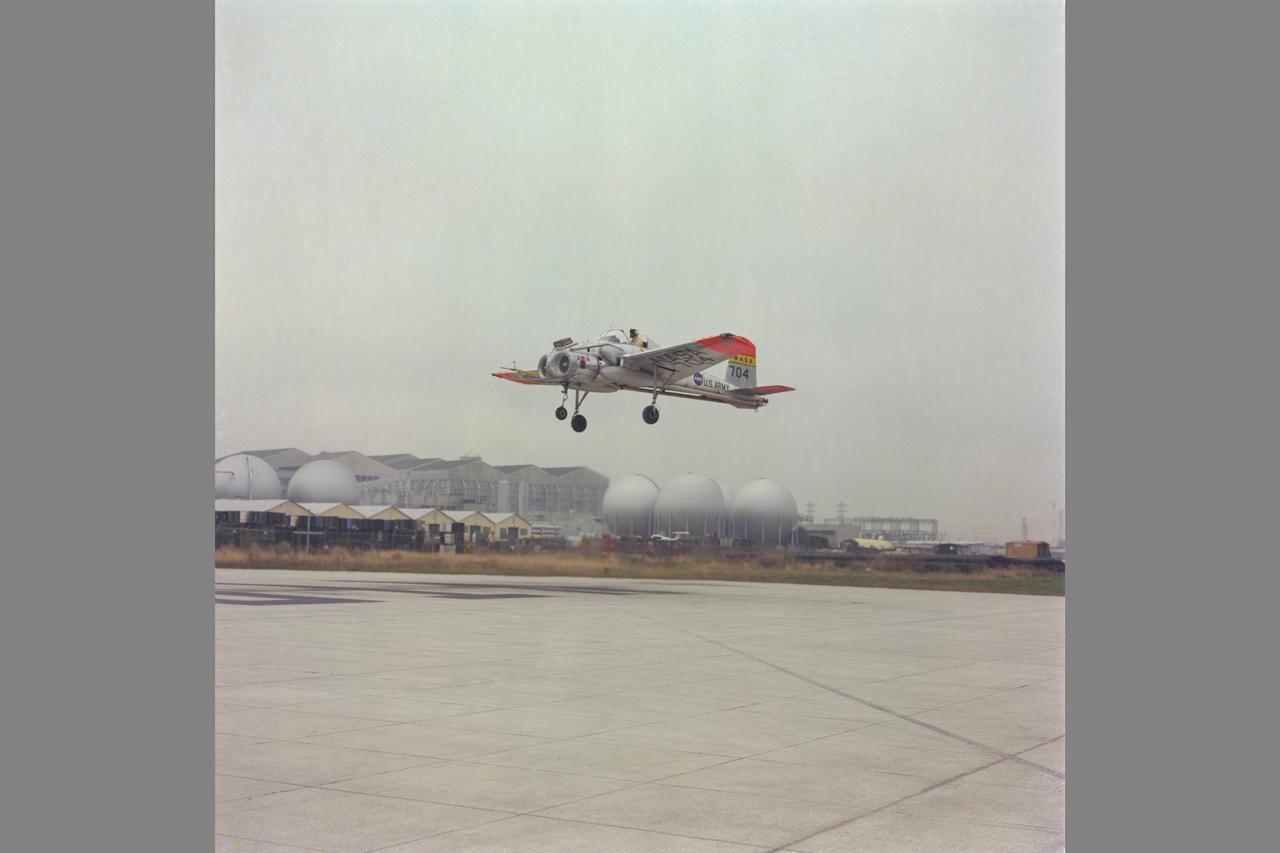
X-14 Aircraft during hover flight tests at VTOL test pad
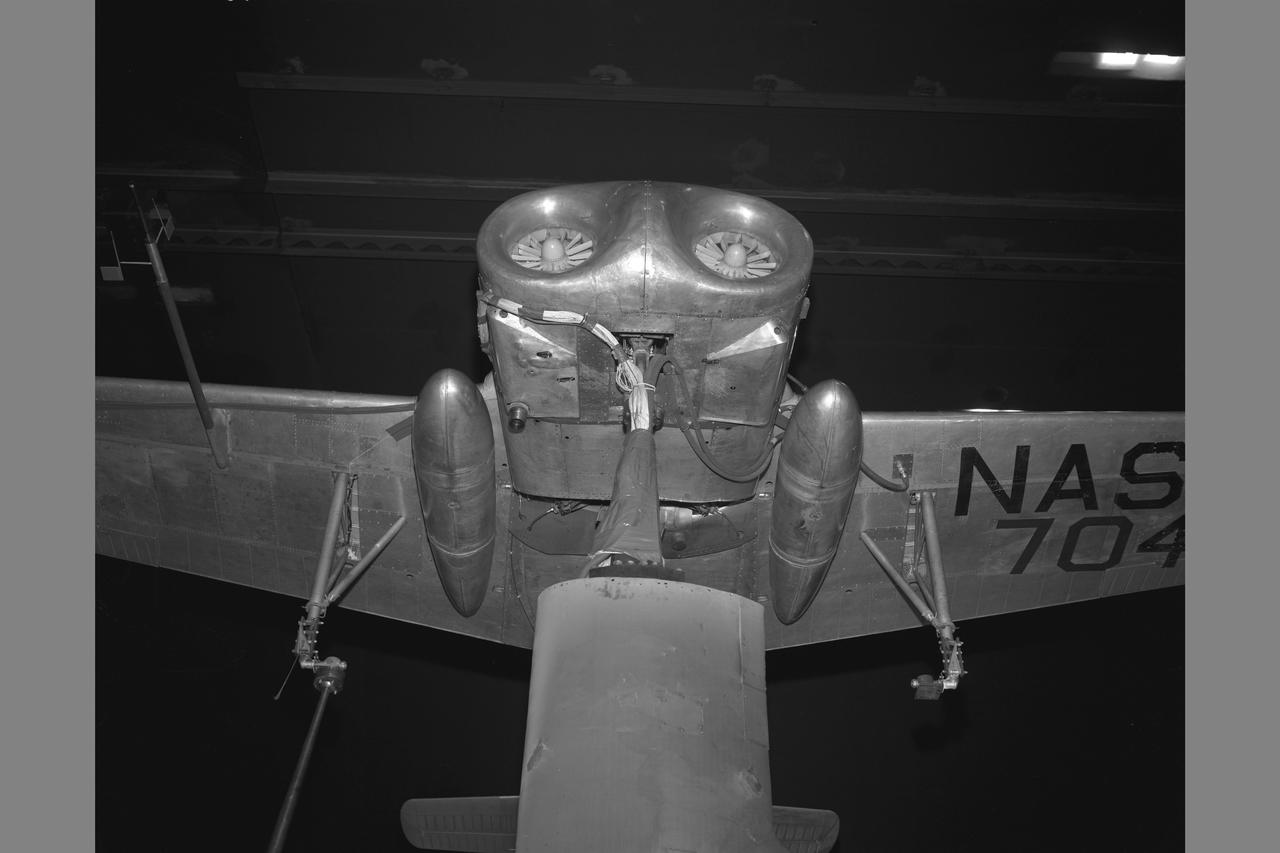
X-14 NASA 704 Full Scale Airplane tests in 40x80ft. Wind Tunnel (NORMAL MOUNTING) jet inlets
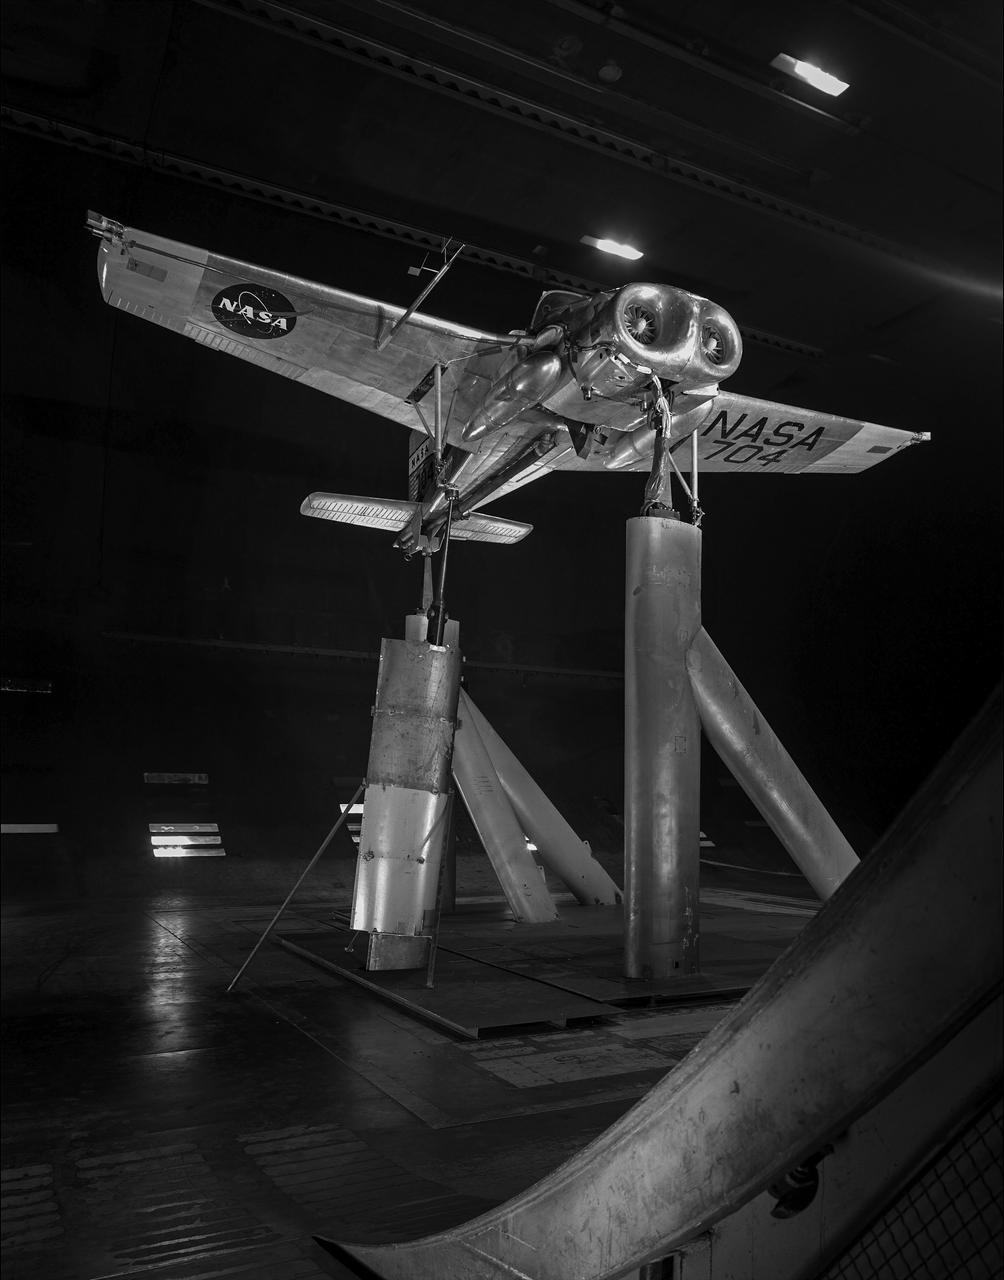
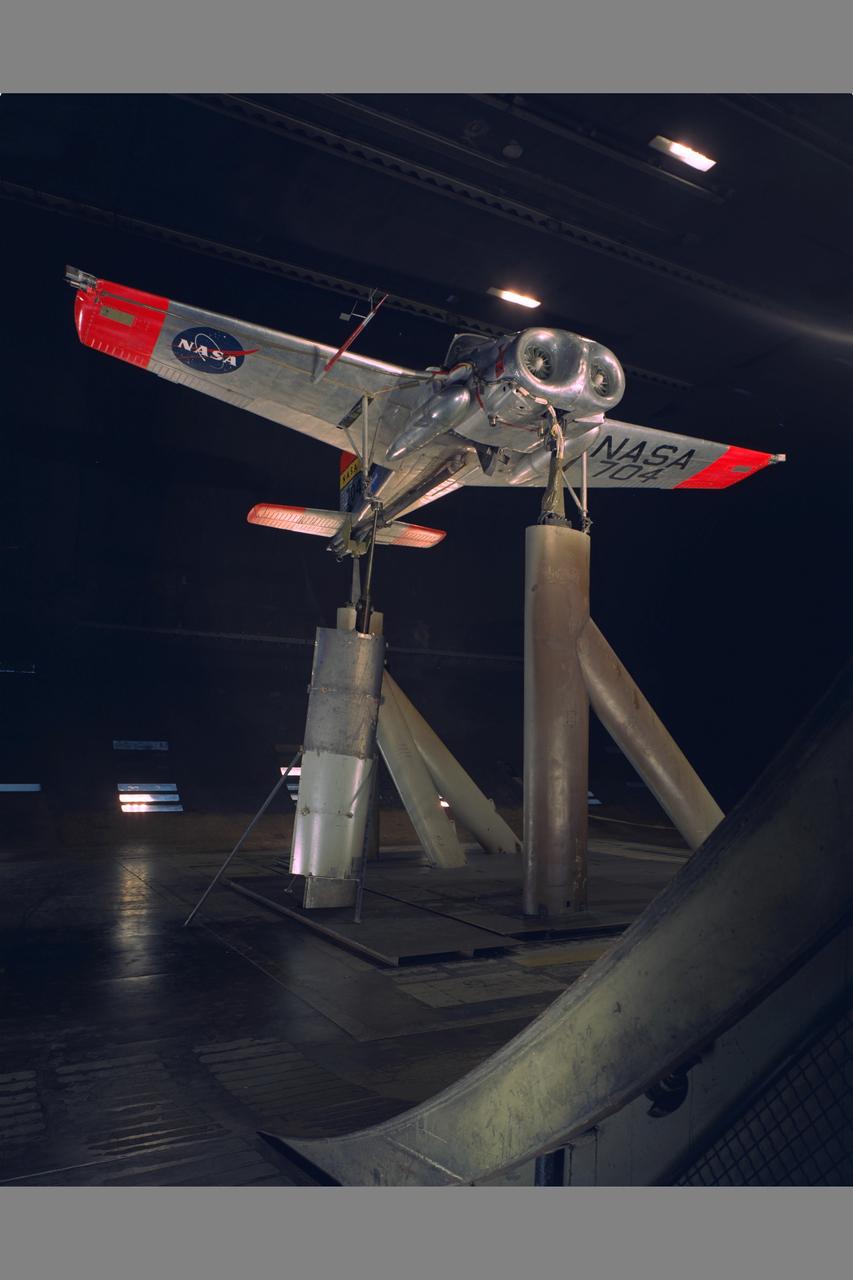
Bell V/STOL X-14 airplane mounted at 90 degrees yaw in 40x80 foot wind tunnel.
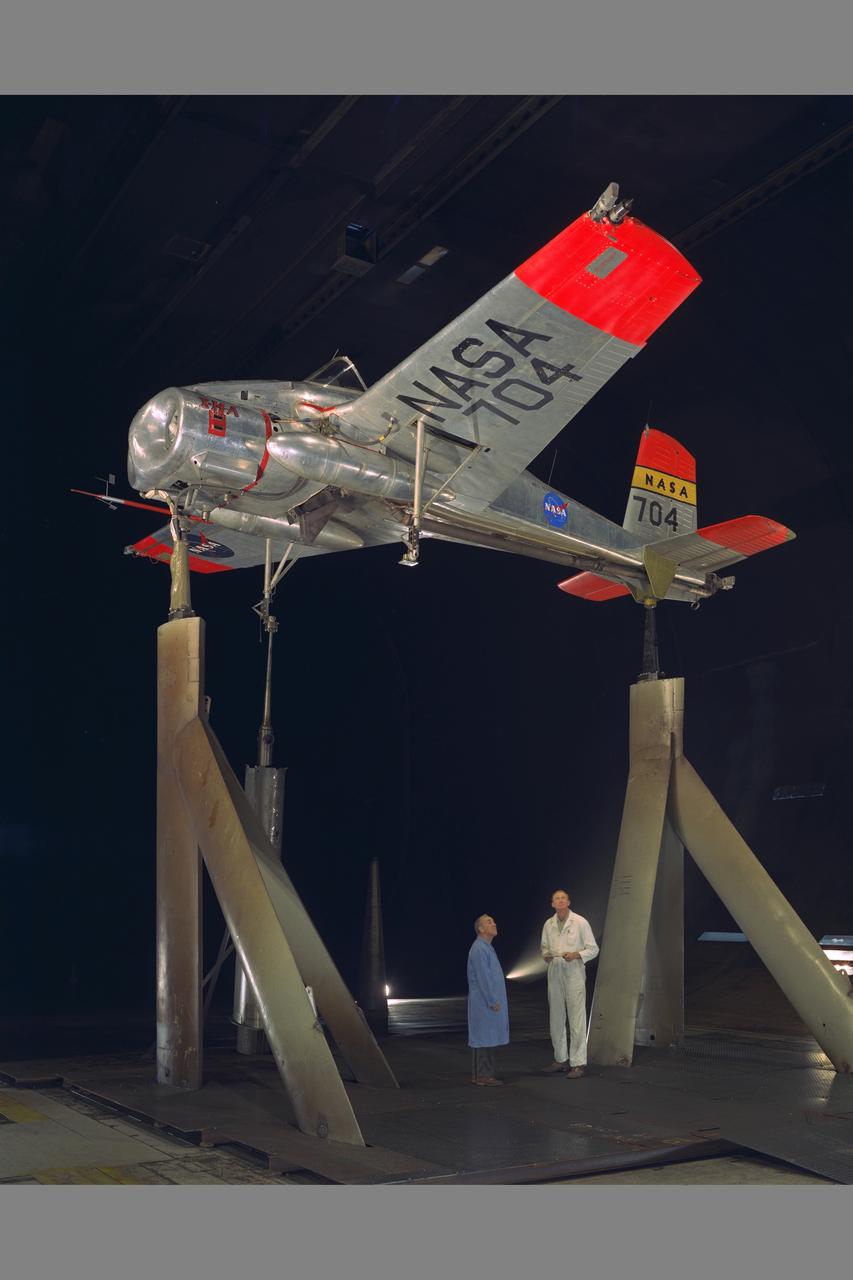
X-14 NASA 704 Full Scale Airplane tests in 40x80ft. Subsonic Wind Tunnel (NORMAL MOUNTING) with Sy Sewell, NASA (left) and Ed Varette, Army (right)
X-14 NASA 704 Full Scale Airplane tests in 40x80ft. Wind Tunnel (NORMAL MOUNTING) with Sy Sewell, NASA (left) and Ed Varette, Army (right)
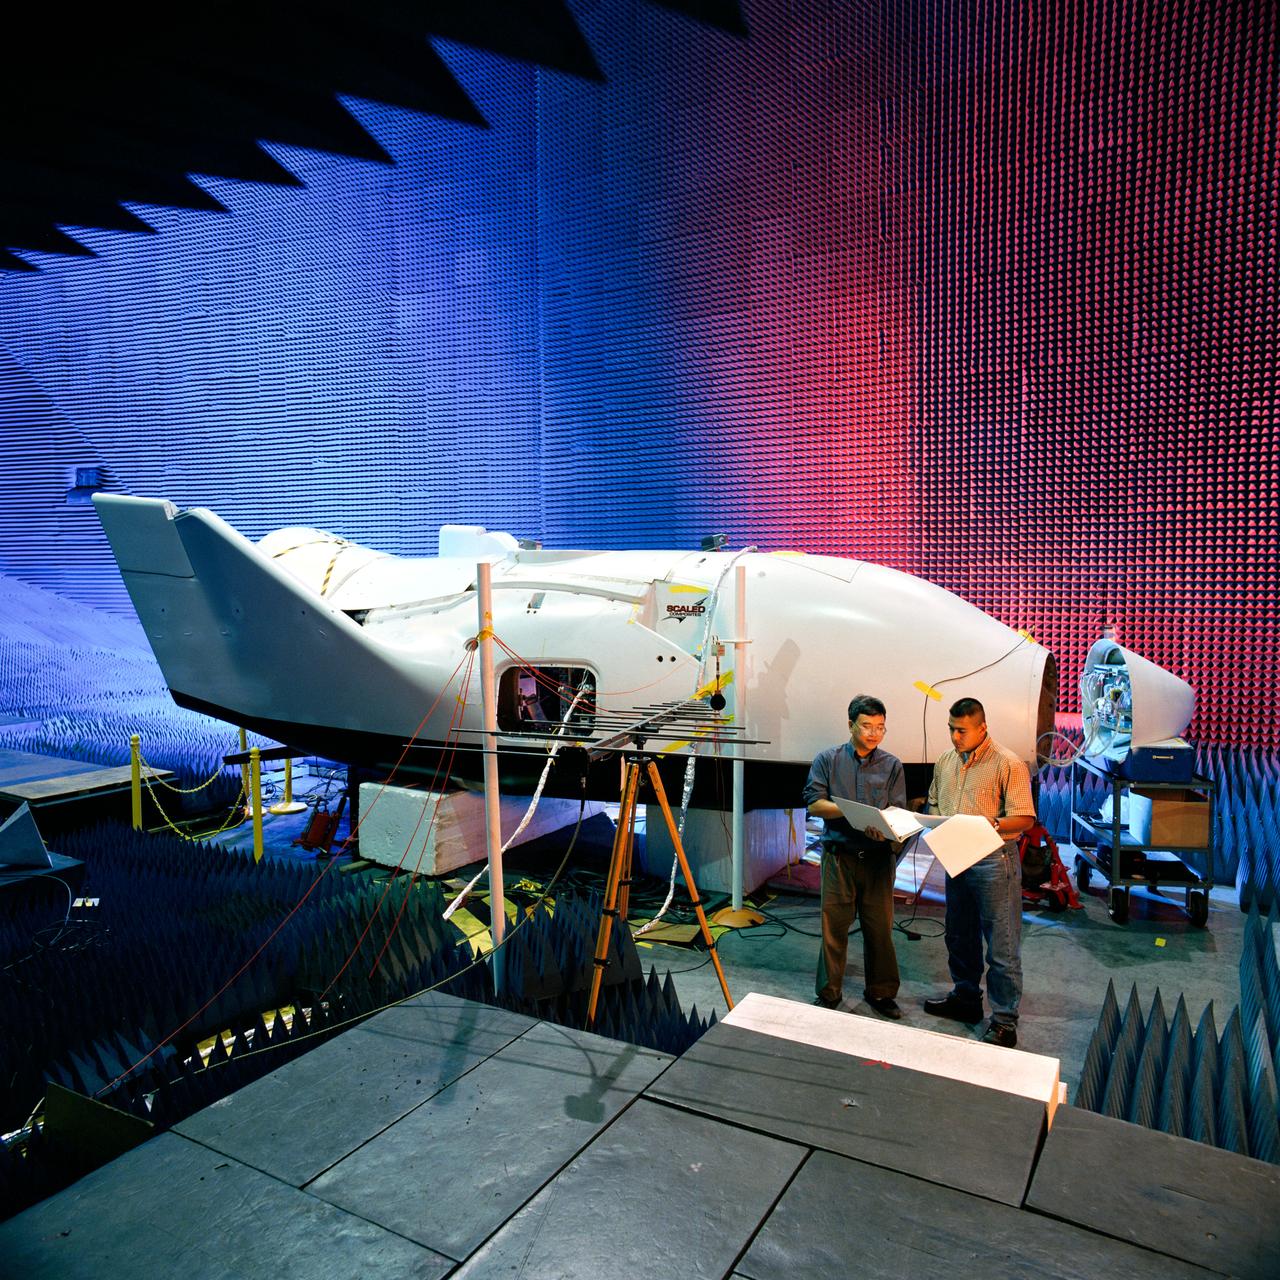
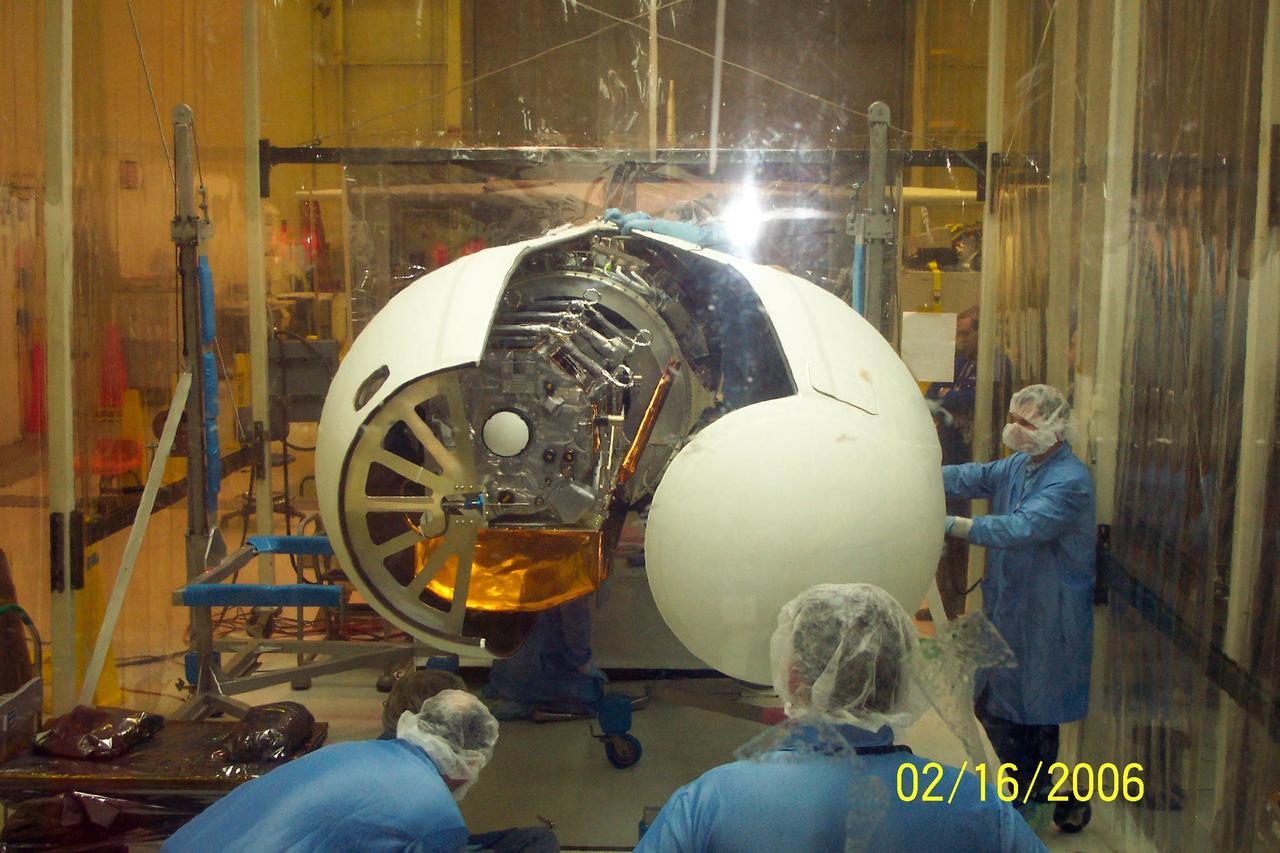
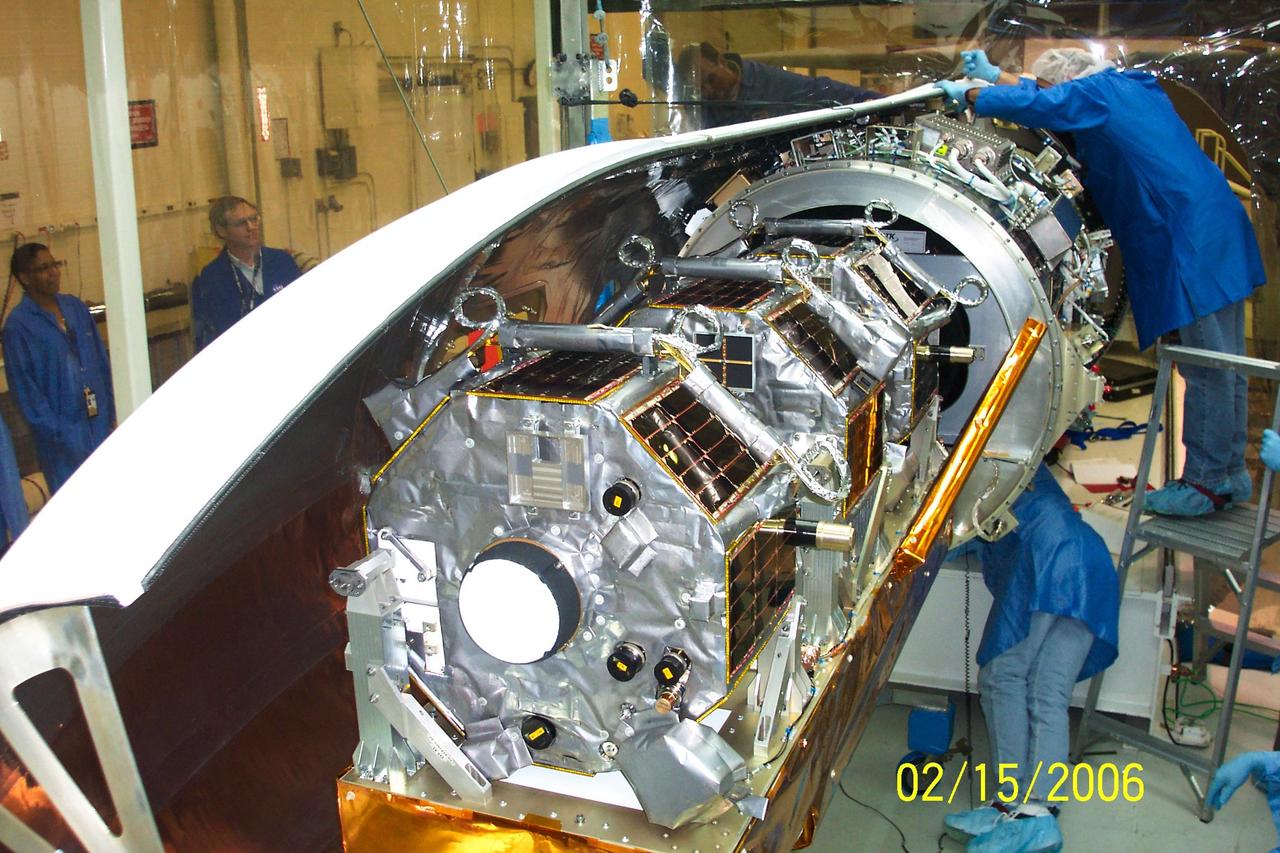
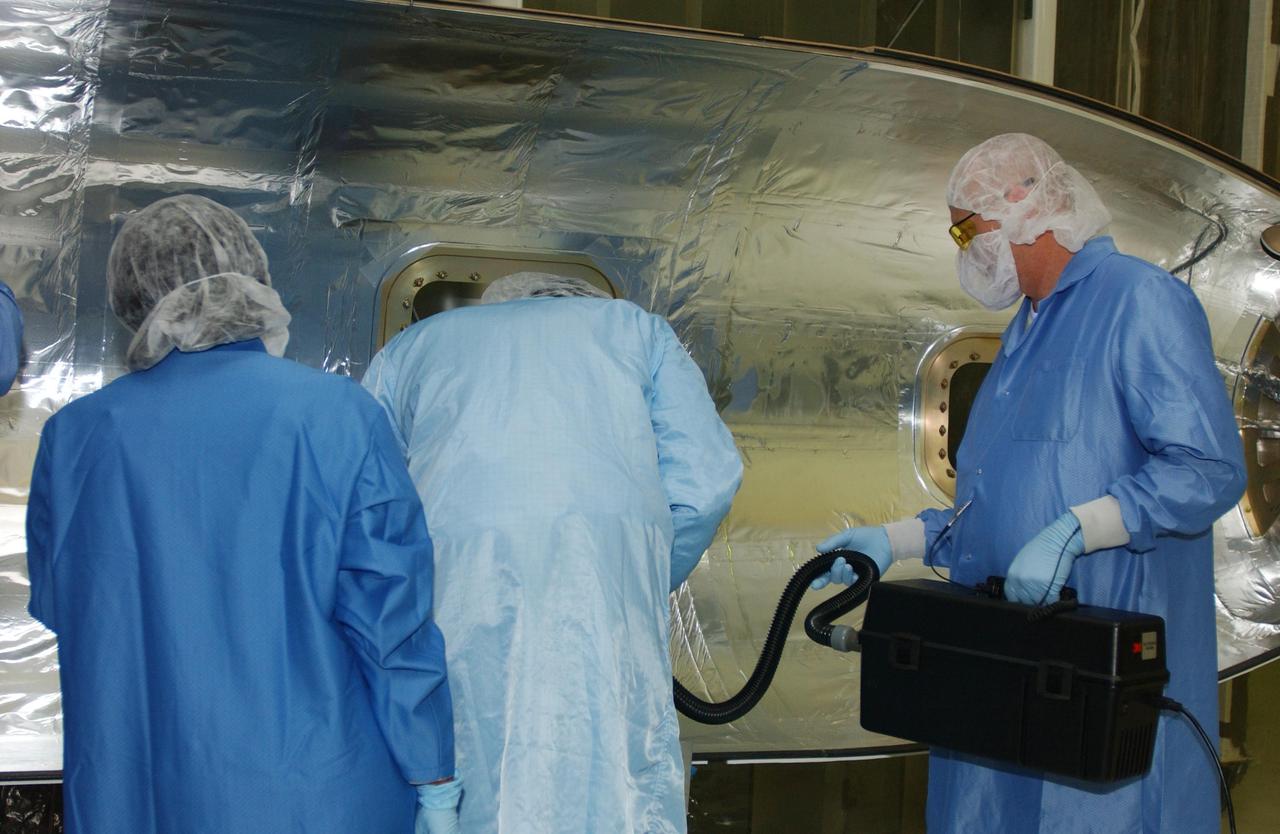
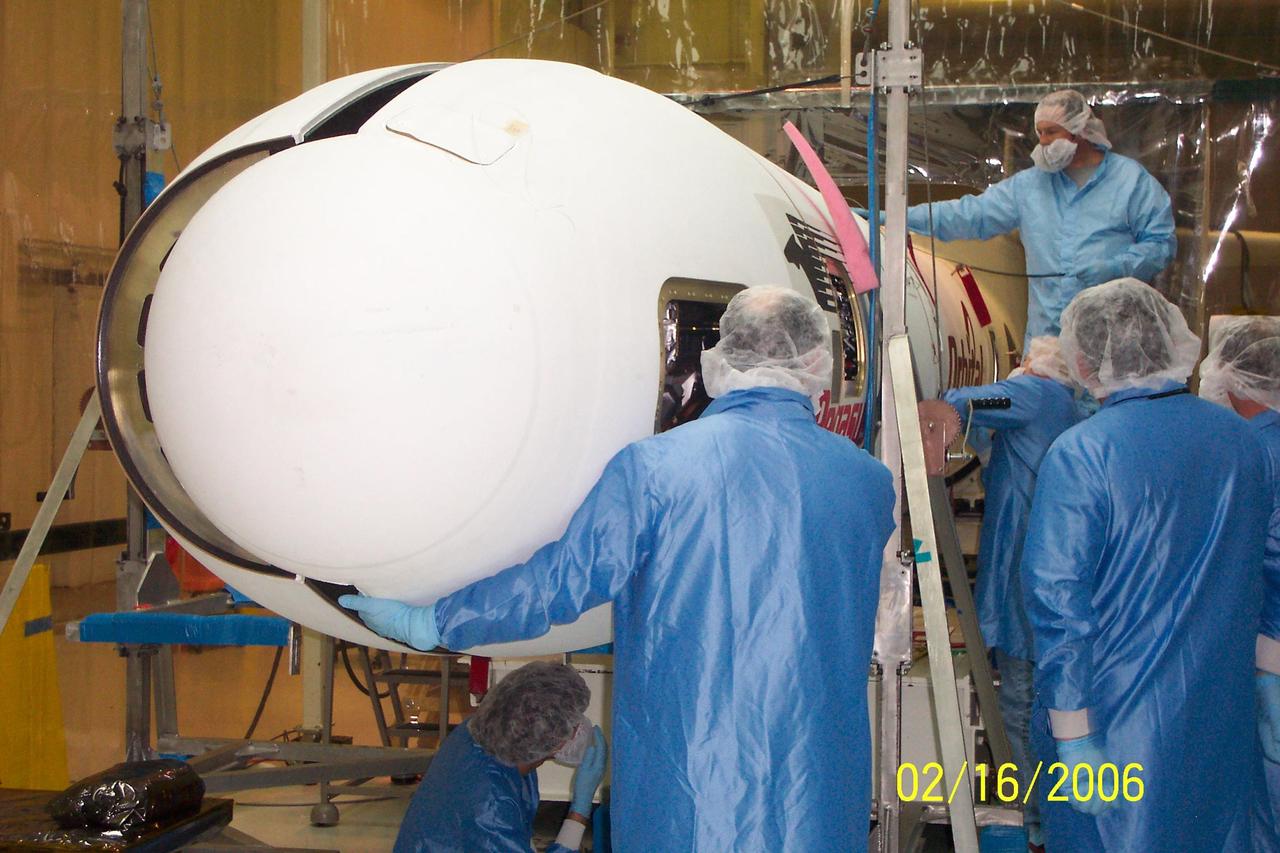
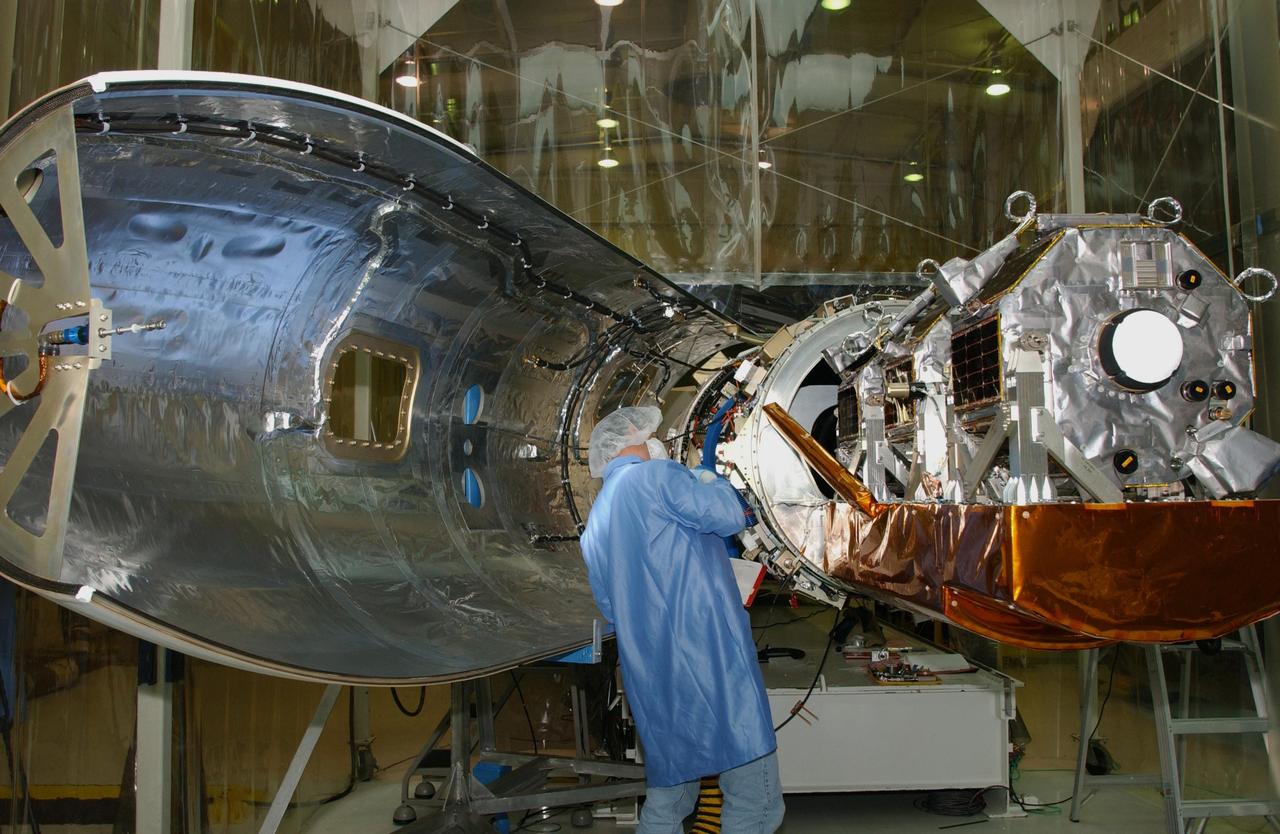
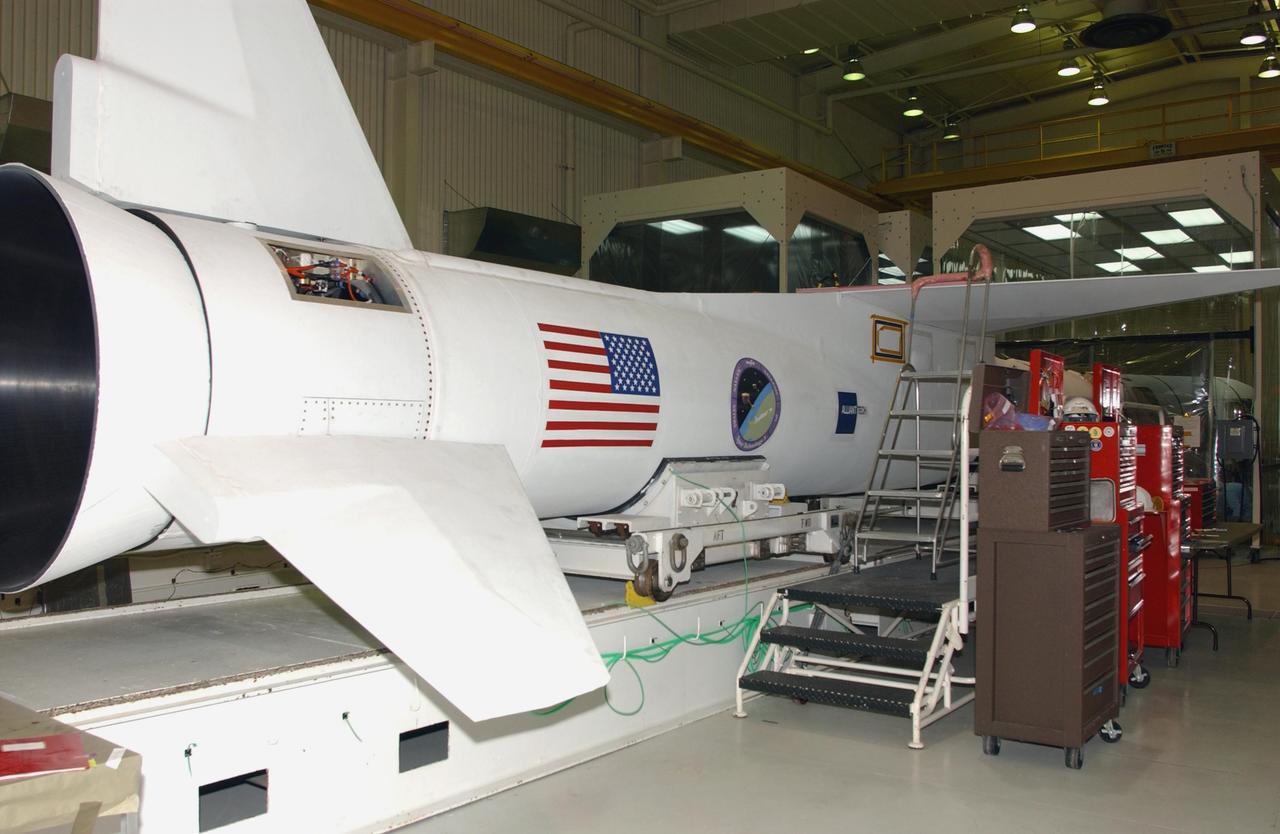
Photographic documentation showing the X-38 Crew Return Vehicle (CRV) undergoing testing in the anechoic chamber in bldg. 14.
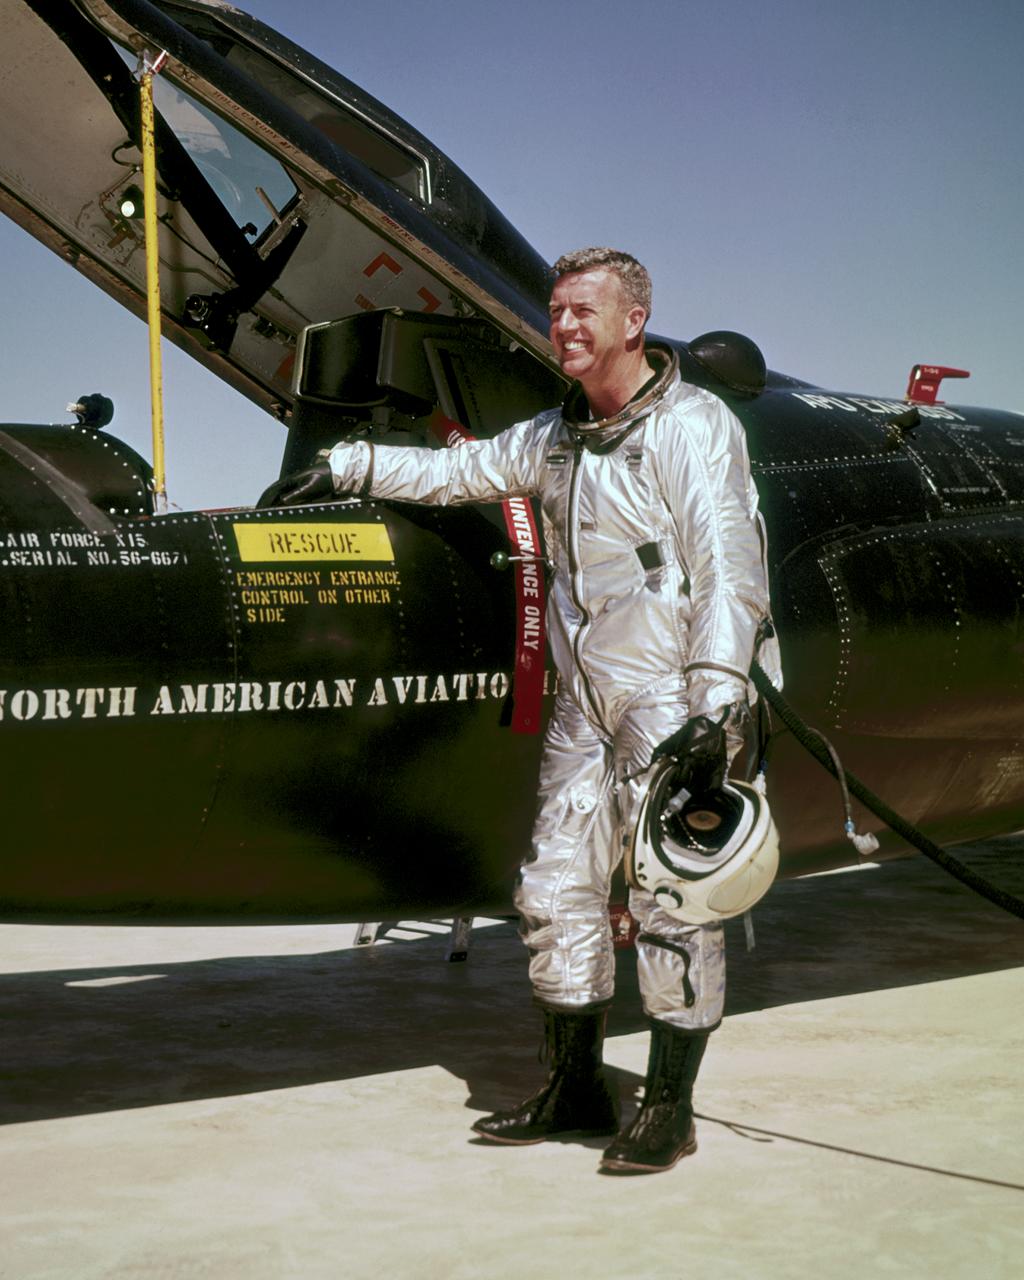
Joseph A. Walker was a Chief Research Pilot at the NASA Dryden Flight Research Center during the mid-1960s. He joined the NACA in March 1945, and served as project pilot at the Edwards flight research facility on such pioneering research projects as the D-558-1, D-558-2, X-1, X-3, X-4, X-5, and the X-15. He also flew programs involving the F-100, F-101, F-102, F-104, and the B-47. Walker made the first NASA X-15 flight on March 25, 1960. He flew the research aircraft 24 times and achieved its fastest speed and highest altitude. He attained a speed of 4,104 mph (Mach 5.92) during a flight on June 27, 1962, and reached an altitude of 354,300 feet on August 22, 1963 (his last X-15 flight). He was the first man to pilot the Lunar Landing Research Vehicle (LLRV) that was used to develop piloting and operational techniques for lunar landings. Walker was born February 20, 1921, in Washington, Pa. He lived there until graduating from Washington and Jefferson College in 1942, with a B.A. degree in Physics. During World War II he flew P-38 fighters for the Air Force, earning the Distinguished Flying Cross and the Air Medal with Seven Oak Clusters. Walker was the recipient of many awards during his 21 years as a research pilot. These include the 1961 Robert J. Collier Trophy, 1961 Harmon International Trophy for Aviators, the 1961 Kincheloe Award and 1961 Octave Chanute Award. He received an honorary Doctor of Aeronautical Sciences degree from his alma mater in June of 1962. Walker was named Pilot of the Year in 1963 by the National Pilots Association. He was a charter member of the Society of Experimental Test Pilots, and one of the first to be designated a Fellow. He was fatally injured on June 8, 1966, in a mid-air collision between an F-104 he was piloting and the XB-70.
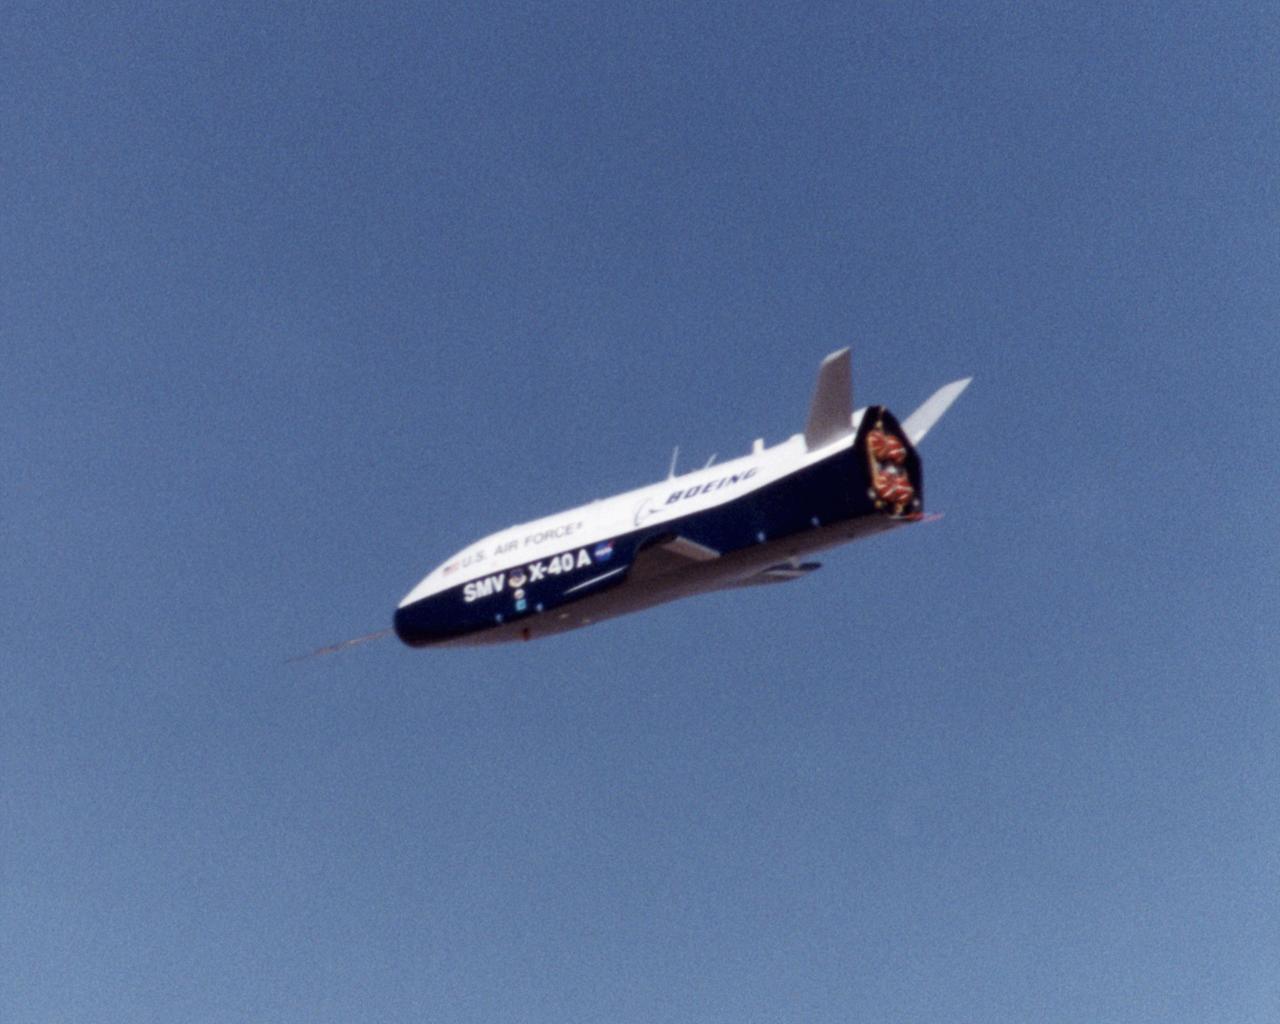
First flight at NASA's Dryden Flight Research Center for the X-40A was a 74 second glide from 15,000 feet on March 14, 2001. The unpiloted X-40 is a risk-reduction vehicle for the X-37, which is intended to be a reusable space vehicle. NASA's Marshall Space Flight Center in Huntsville, Ala, manages the X-37 project. At Dryden, the X-40A will undergo a series of ground and air tests to reduce possible risks to the larger X-37, including drop tests from a helicopter to check guidance and navigation systems planned for use in the X-37. The X-37 is designed to demonstrate technologies in the orbital and reentry environments for next-generation reusable launch vehicles that will increase both safety and reliability, while reducing launch costs from $10,000 per pound to $1,000 per pound.

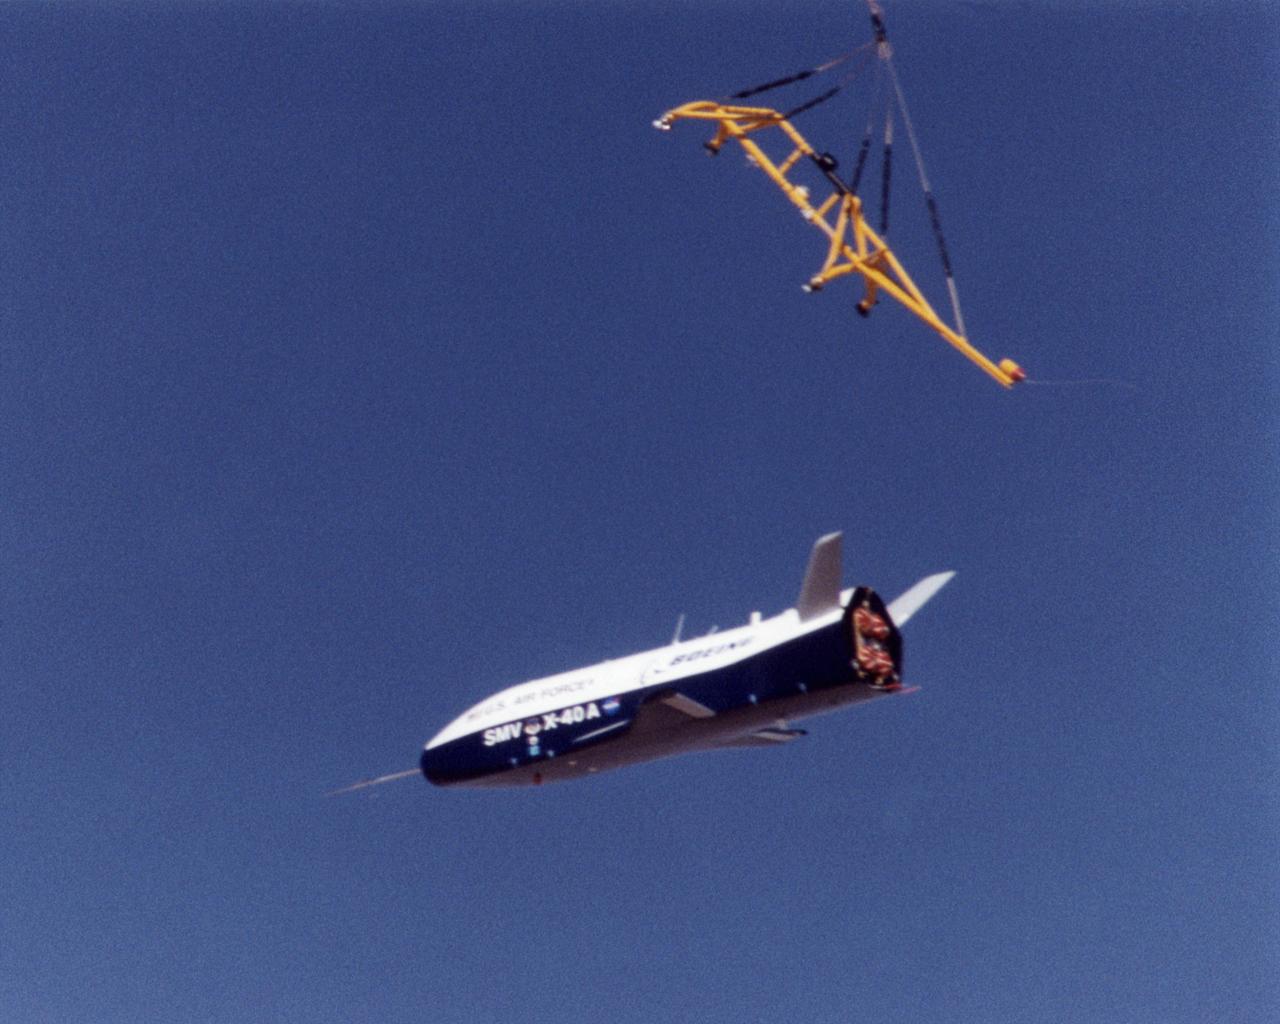
Wranglers steadied the X-40A at NASA's Dryden Flight Research Center, Edwards, California, March 14, 2001, as the experimental craft was carried to 15,000 feet for an unpiloted glide flight. The unpiloted X-40 is a risk-reduction vehicle for the X-37, which is intended to be a reusable space vehicle. NASA's Marshall Space Flight Center in Huntsville, Ala, manages the X-37 project. At Dryden, the X-40A will undergo a series of ground and air tests to reduce possible risks to the larger X-37, including drop tests from a helicopter to check guidance and navigation systems planned for use in the X-37. The X-37 is designed to demonstrate technologies in the orbital and reentry environments for next-generation reusable launch vehicles that will increase both safety and reliability, while reducing launch costs from $10,000 per pound to $1,000 per pound.
The X-40A immediately after release from its harness suspended from a helicopter 15,000 feet above NASA's Dryden Flight Research Center at Edwards Air Force Base, California, on March 14, 2001. The unpiloted X-40 is a risk-reduction vehicle for the X-37, which is intended to be a reusable space vehicle. NASA's Marshall Space Flight Center in Huntsville, Ala, manages the X-37 project. At Dryden, the X-40A will undergo a series of ground and air tests to reduce possible risks to the larger X-37, including drop tests from a helicopter to check guidance and navigation systems planned for use in the X-37. The X-37 is designed to demonstrate technologies in the orbital and reentry environments for next-generation reusable launch vehicles that will increase both safety and reliability, while reducing launch costs from $10,000 per pound to $1,000 per pound.
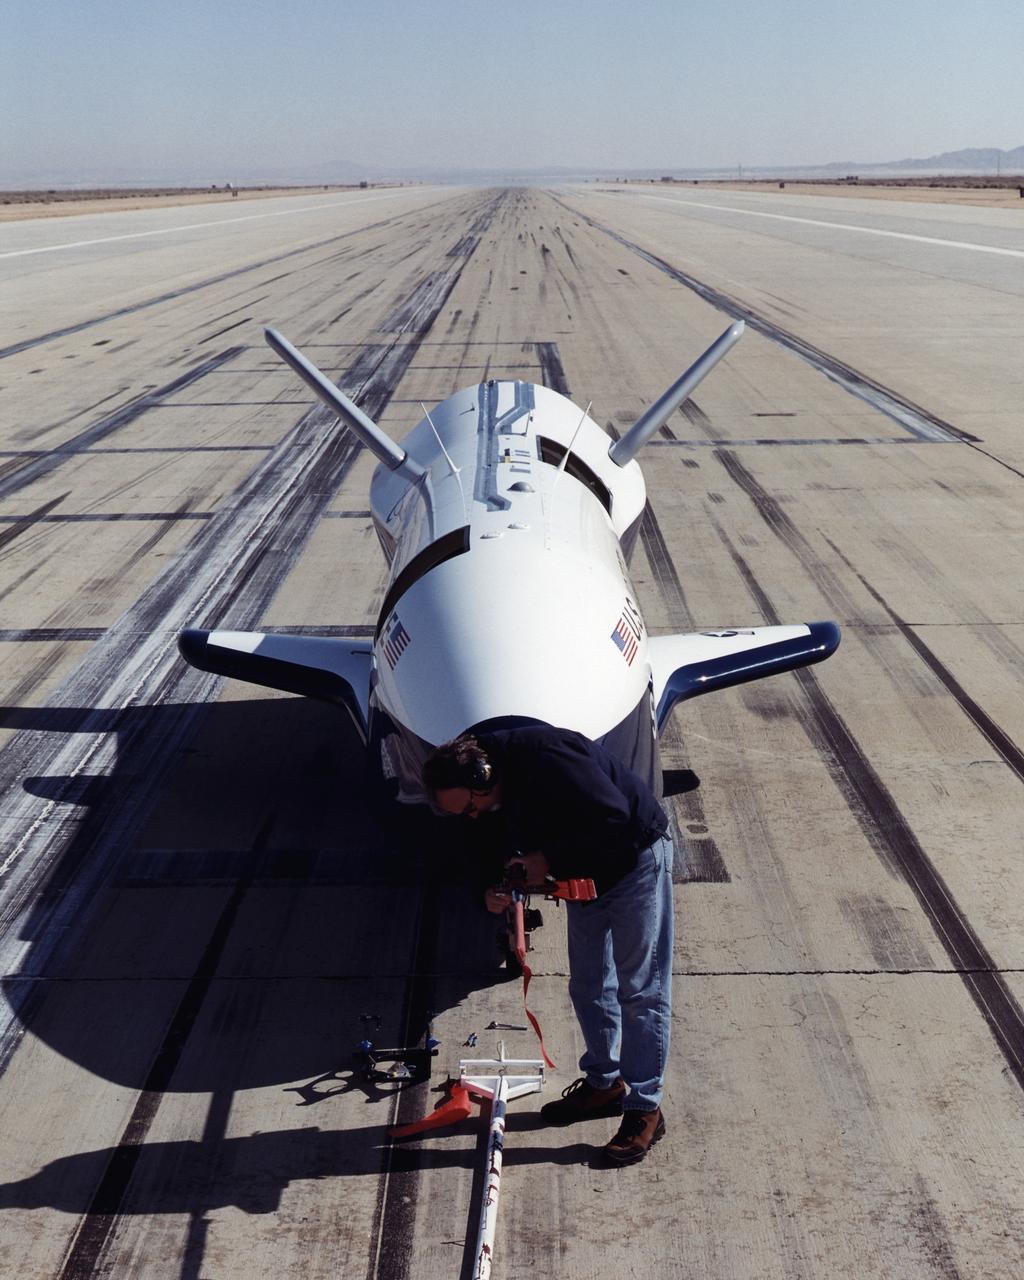
A worker attaches covers for the nose pitot boom before removing the unpiloted X-40 from the runway at Edwards Air Force Base, California, following its successful free-flight on March 14, 2001. The unpiloted X-40 is a risk-reduction vehicle for the X-37, which is intended to be a reusable space vehicle. NASA's Marshall Space Flight Center in Huntsville, Ala, manages the X-37 project. At Dryden, the X-40A will undergo a series of ground and air tests to reduce possible risks to the larger X-37, including drop tests from a helicopter to check guidance and navigation systems planned for use in the X-37. The X-37 is designed to demonstrate technologies in the orbital and reentry environments for next-generation reusable launch vehicles that will increase both safety and reliability, while reducing launch costs from $10,000 per pound to $1,000 per pound.

Boeing's sub-scale X-48B Blended Wing Body aircraft flies over the edge of Rogers Dry Lake at Edwards Air Force Base during its fifth flight on Aug. 14, 2007.
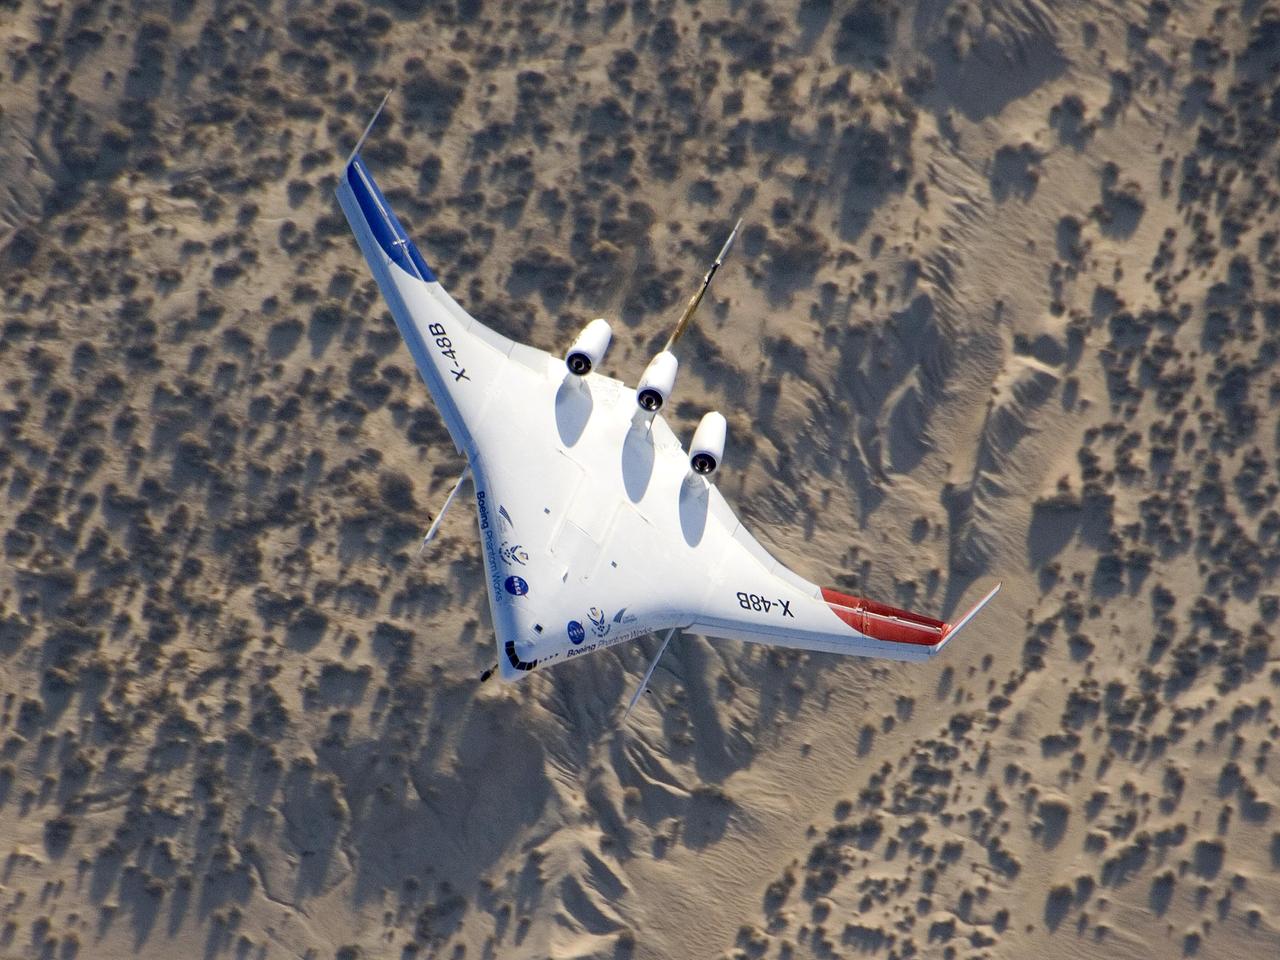
The unique X-48B Blended Wing Body subscale demonstrator banked over desert scrub at Edwards AFB during the aircraft's fifth test flight Aug. 14, 2007.

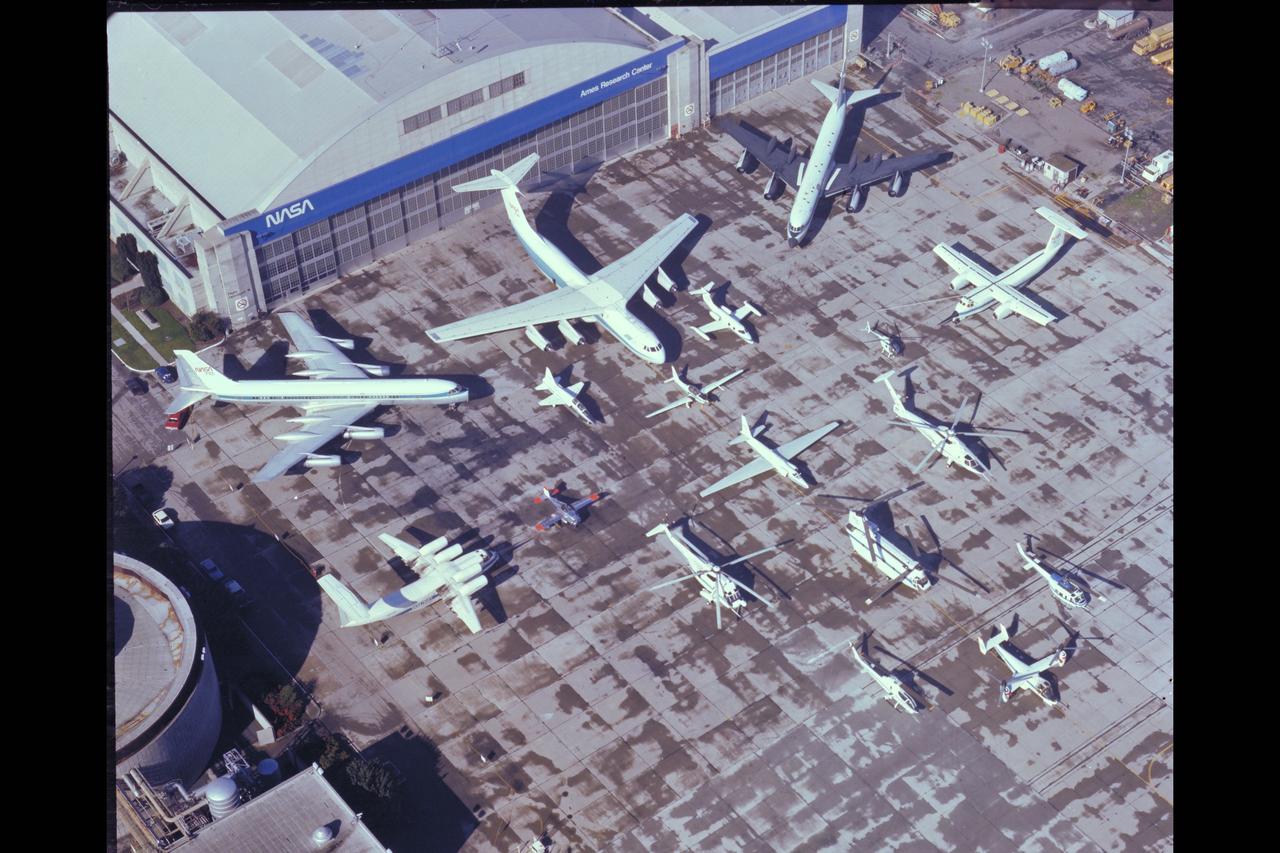
NASA Aircraft on ramp (Aerial view) Sides: (L) QSRA (R) C-8A AWJSRA - Back to Front: CV-990 (711) C-141 KAO, CV-990 (712) Galileo, T-38, YO-3A, Lear Jet, X-14, U-2, OH-6, CH-47, SH-3G, RSRA, AH-1G, XV-15, UH-1H
NASA Aircraft on ramp (Aerial view) Sides: (L) QSRA (R) C-8A AWJSRA - Back to Front: CV-990 (711) C-141 KAO, CV-990 (712) Galileo, T-38, YO-3A, Lear Jet, X-14, U-2, OH-6, CH-47, SH-3G, RSRA, AH-1G, XV-15, UH-1H
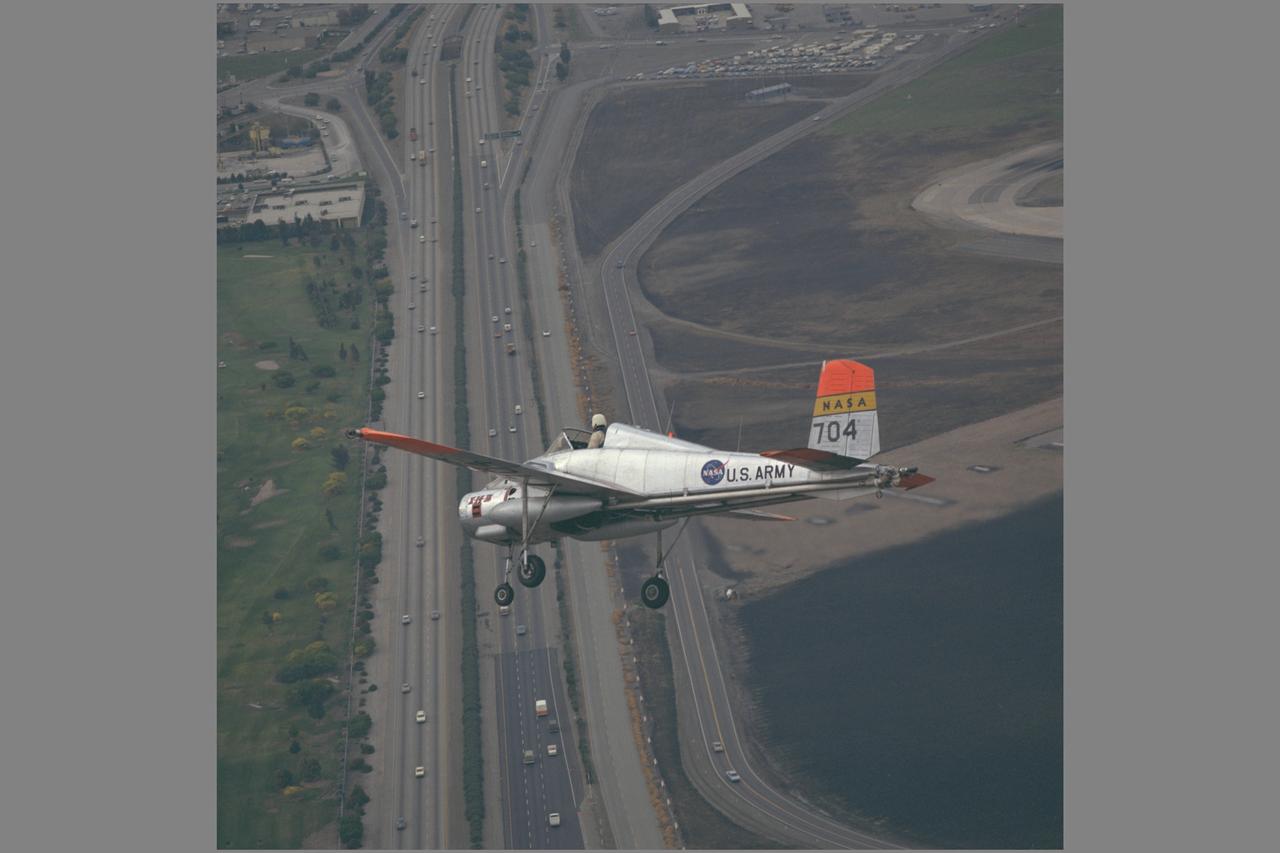
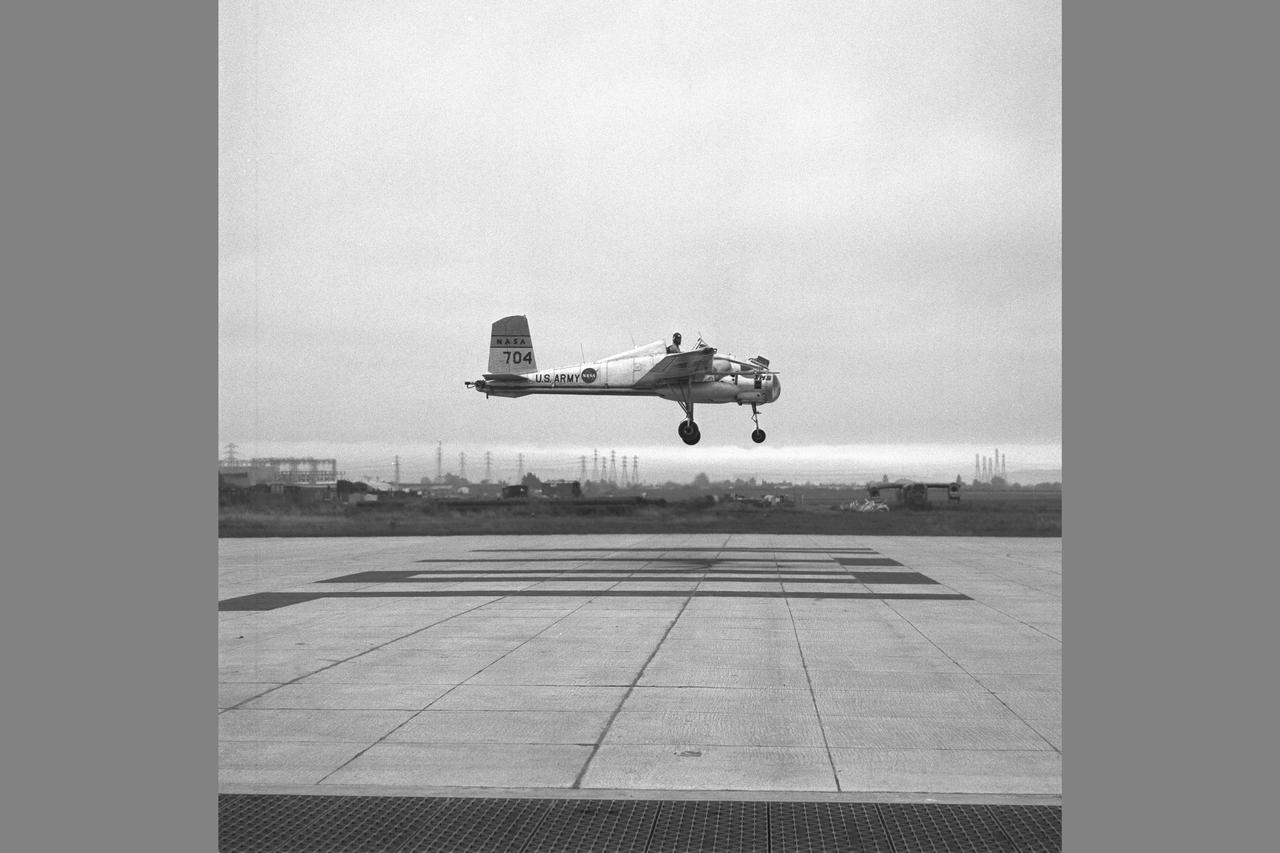
X-14B NASA-704: A Bell single-place, open cockpit, twin-engine, jet-lift VTOL aircraft over Highway 101 in approach to Moffett Field, California. The X-14 was used by NASA Ames Research Center to advance state-of-the-art jet-powered VTOL aircraft.
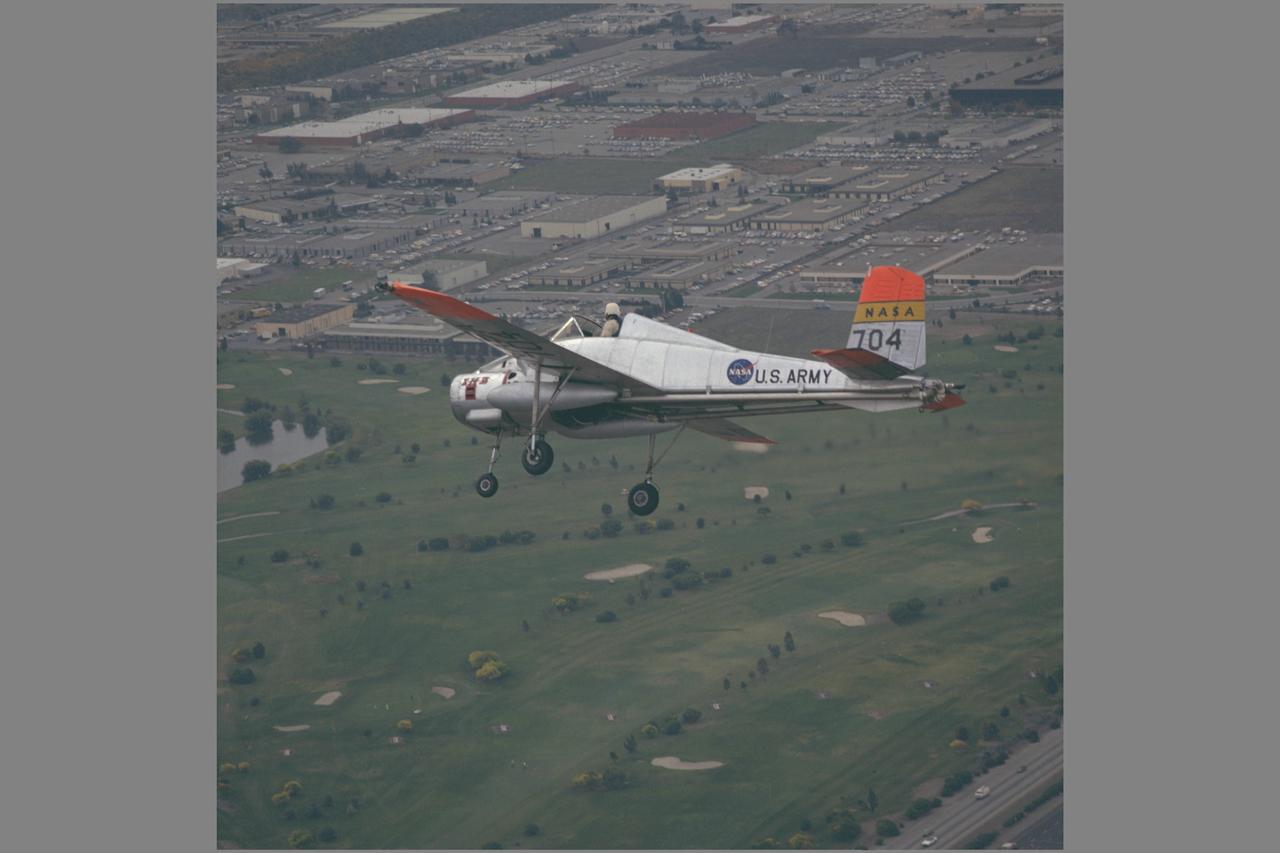
X-14B NASA-704: A Bell single-place, open cockpit, twin-engine, jet-lift VTOL aircraft in flight over Sunnyvale golf course. The X-14 was used by NASA Ames Research Center to advance state-of-the-art jet-powered VTOL aircraft.
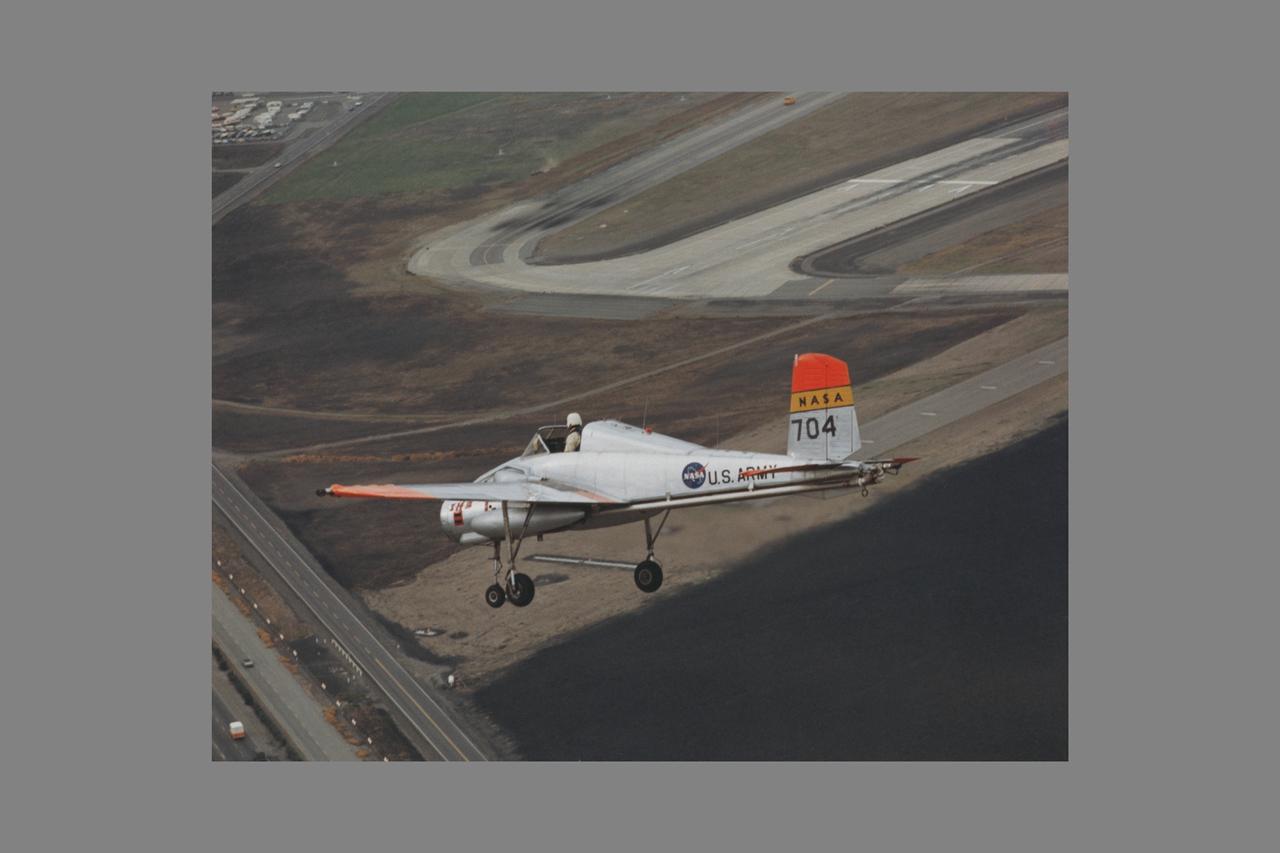
X-14B NASA-704: A Bell single-place, open cockpit, twin-engine, jet-lift VTOL aircraft over Highway 101 in approach to Moffett Field, California. The X-14 was used by NASA Ames Research Center to advance state-of-the-art jet-powered VTOL aircraft.
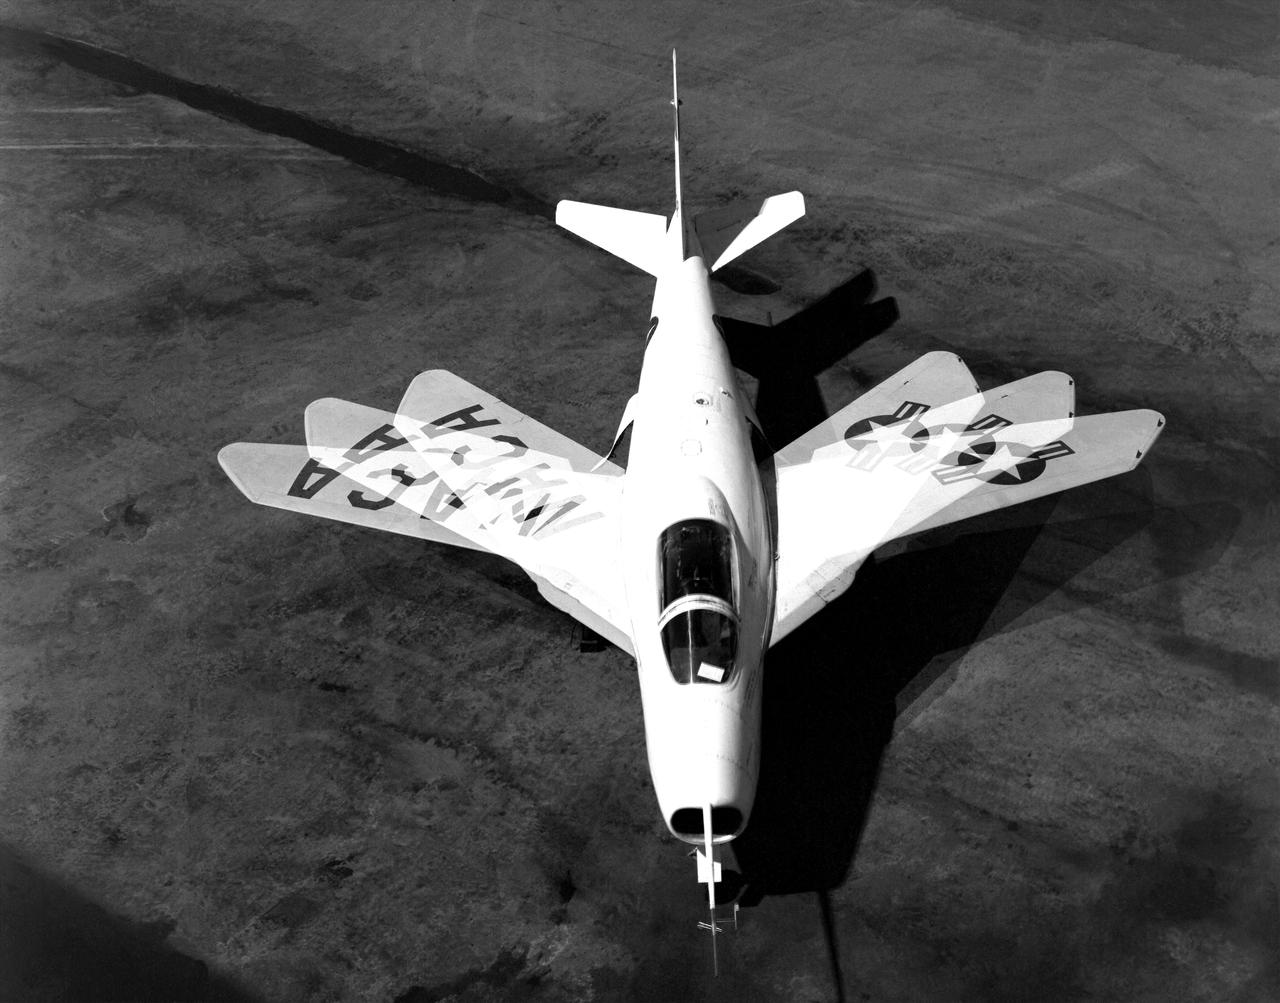
The Bell X-5 swings its wings in this multiple exposure photograph. Variable-sweep wing technology later appeared on the F-111, F-14 and B-1.
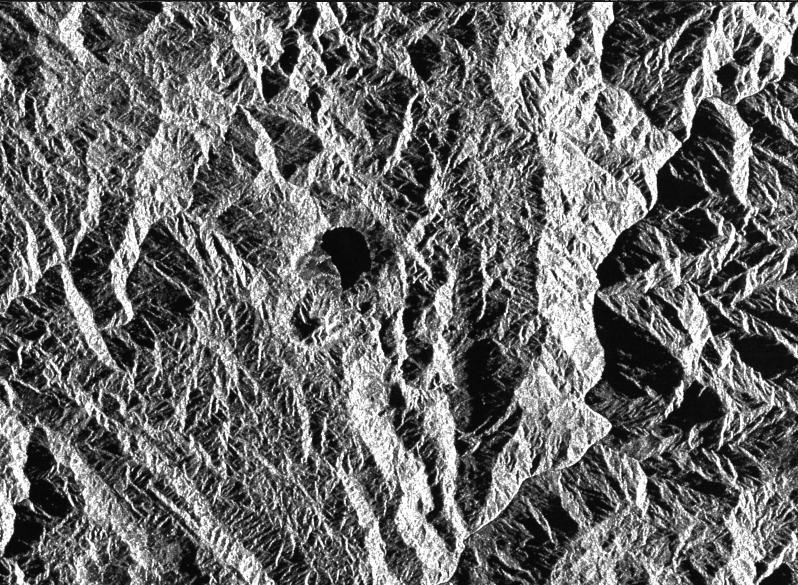
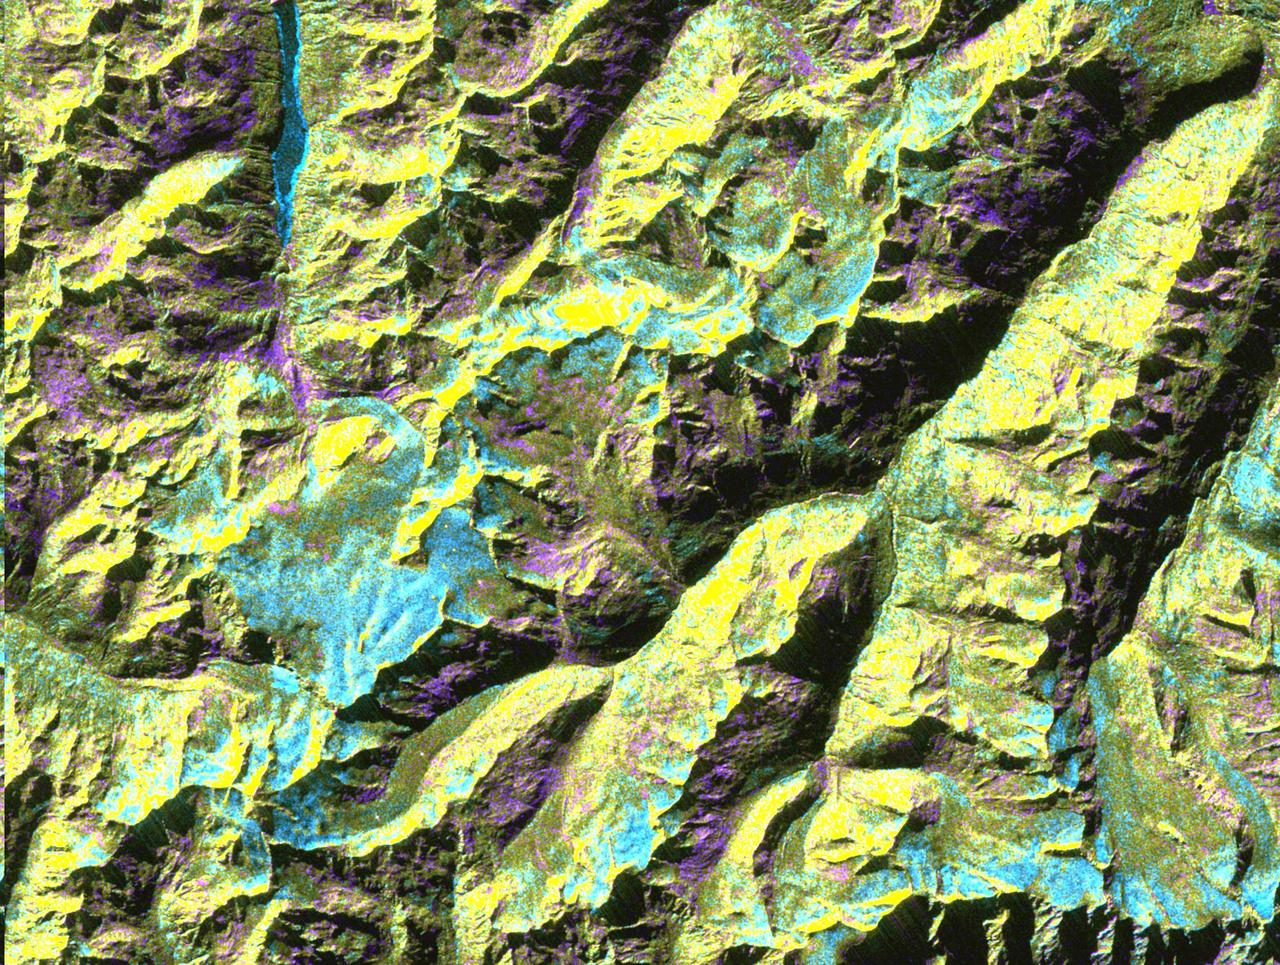
This is a radar image of a little known volcano in northern Colombia. The image was acquired on orbit 80 of space shuttle Endeavour on April 14, 1994, by NASA Spaceborne Imaging Radar C/X-Band Synthetic Aperture Radar SIR-C/X-SAR. The volcano near the center of the image is located at 5.6 degrees north latitude, 75.0 degrees west longitude, about 100 kilometers (65 miles) southeast of Medellin, Colombia. The conspicuous dark spot is a lake at the bottom of an approximately 3-kilometer-wide (1.9-mile) volcanic collapse depression or caldera. A cone-shaped peak on the bottom left (northeast rim) of the caldera appears to have been the source for a flow of material into the caldera. This is the northern-most known volcano in South America and because of its youthful appearance, should be considered dormant rather than extinct. The volcano's existence confirms a fracture zone proposed in 1985 as the northern boundary of volcanism in the Andes. The SIR-C/X-SAR image reveals another, older caldera further south in Colombia, along another proposed fracture zone. Although relatively conspicuous, these volcanoes have escaped widespread recognition because of frequent cloud cover that hinders remote sensing imaging in visible wavelengths. Four separate volcanoes in the Northern Andes nations of Colombia and Ecuador have been active during the last 10 years, killing more than 25,000 people, including scientists who were monitoring the volcanic activity. Detection and monitoring of volcanoes from space provides a safe way to investigate volcanism. The recognition of previously unknown volcanoes is important for hazard evaluations because a number of major eruptions this century have occurred at mountains that were not previously recognized as volcanoes. http://photojournal.jpl.nasa.gov/catalog/PIA01722
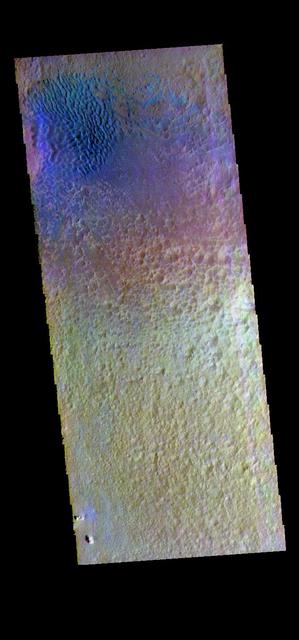
This false color image shows sand dunes on the floor of Hale Crater. This 150 km x 125 km (93 miles x 77 miles) crater is located north of Argyre Planitia. Dark blue in this false color combination usually indicates basaltic sand. The THEMIS VIS camera contains 5 filters. The data from different filters can be combined in multiple ways to create a false color image. These false color images may reveal subtle variations of the surface not easily identified in a single band image. Orbit Number: 66554 Latitude: -35.7883 Longitude: 323.039 Instrument: VIS Captured: 2016-12-14 22:52 https://photojournal.jpl.nasa.gov/catalog/PIA23629
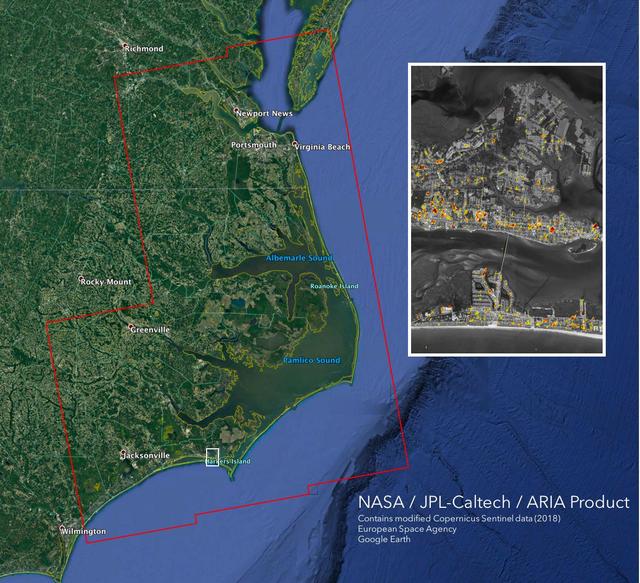
The Advanced Rapid Imaging and Analysis (ARIA) team at NASA's Jet Propulsion Laboratory in Pasadena, California, created this Damage Proxy Map (DPM) depicting areas of the Carolinas that are likely damaged (shown by red and yellow pixels) as a result of Hurricane Florence. The map is derived from synthetic aperture radar (SAR) images from the Copernicus Sentinel-1 satellites, operated by the European Space Agency (ESA). The images were taken before (September 02, 2016) and 12 hours after the hurricane's landfall (September 14, 2018 7:06 PM local time). The map covers an area of 155 miles x 210 miles (250 km x 340 km), indicated with the big red polygon. Each pixel measures about 33 yards x 33 yards (30 m x 30 m). The color variation from yellow to red indicates increasingly more significant ground surface change. Media reports provided anecdotal preliminary validation. This damage proxy map should be used as guidance to identify damaged areas, and may be less reliable over vegetated areas and flooded areas. For example, the scattered single colored pixels over vegetated areas may be false positives, and the lack of colored pixels over vegetated areas does not necessarily mean no damage. https://photojournal.jpl.nasa.gov/catalog/PIA22702
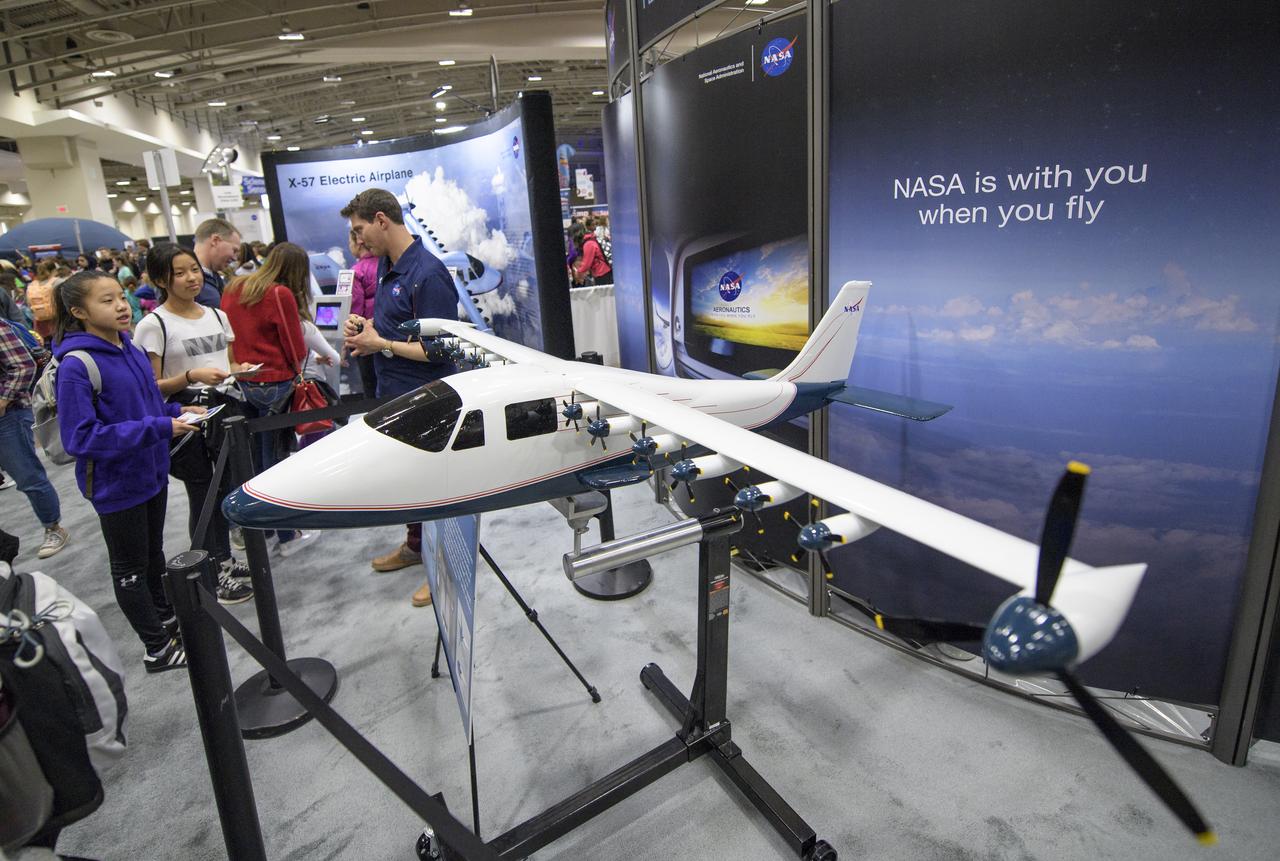
Attendees listen to a NASA staff member speak about the X-57, a research aircraft powered by 14 electric motors, during Sneak Peek Friday at the USA Science and Engineering Festival, Friday, April 6, 2018 at the Walter E. Washington Convention Center in Washington, DC. The festival is open to the public April 7-8. Photo Credit: (NASA/Joel Kowsky)
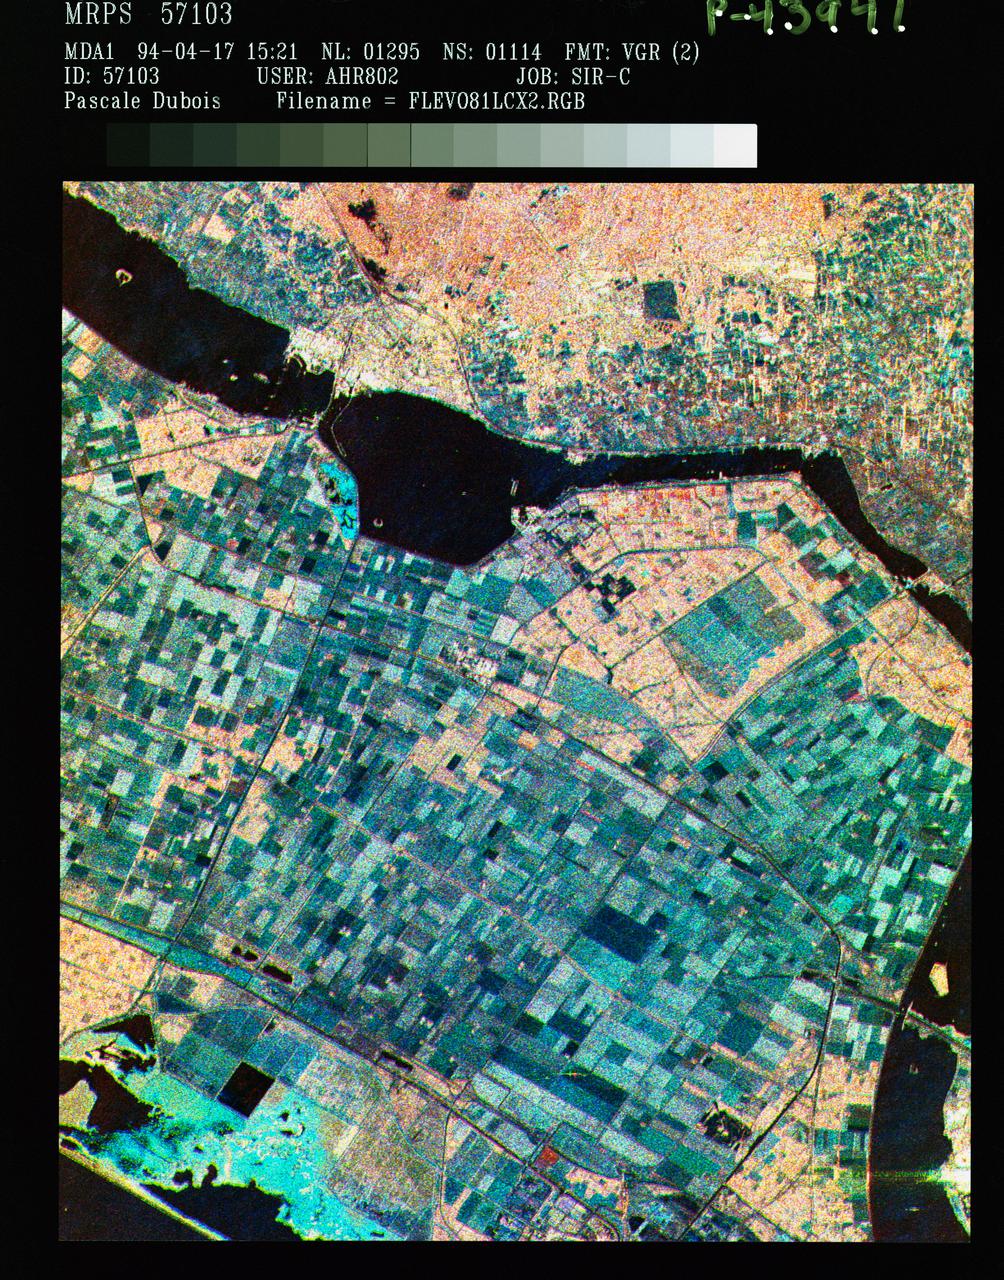
STS059-S-086 (18 April 1994) --- This is a three-frequency false-color image of Flevoland, the Netherlands, centered at 52.4 degrees north latitude, and 5.4 degrees east longitude. This image was acquired by the Spaceborne Imaging Radar-C and X-Band Synthetic Aperture Radar (SIR-C/X-SAR) aboard the Space Shuttle Endeavour on April 14, 1994. It was produced by combining data from the X-Band, C-Band and L-Band radar's. The area shown is approximately 25 by 28 kilometers (15 1/2 by 17 1/2 miles). Flevoland, which fills the lower two-thirds of the image, is a very flat area that is made up of reclaimed land that is used for agriculture and forestry. At the top of the image, across the canal from Flevoland, is an older forest shown in red; the city of Harderwijk is shown in white on the shore of the canal. At this time of the year, the agricultural fields are bare soil, and they show up in this images in blue. The changes in the brightness of the blue areas are equal to the changes in roughness. The dark blue areas are water and the small dots in the canal are boats. This SIR-C/X-SAR supersite is being used for both calibration and agricultural studies. Several soil and crop ground-truth studies will be conducted during the Shuttle flight. In addition, about 10 calibration devices and 10 corner reflectors have been deployed to calibrate and monitor the radar signal. One of these transponders can be seen as a bright star in the lower right quadrant of the image. This false-color image was made using L-Band total power in the red channel, C-Band total power in the green channel, and X-Band VV polarization in the blue channel. SIR-C/X-SAR is part of NASA's Mission to Planet Earth (MTPE). SIR-C/X-SAR radars illuminate Earth with microwaves allowing detailed observations at any time, regardless of weather or sunlight conditions. SIR-C/X-SAR uses three microwave wavelengths: L-Band (24 cm), C-Band (6 cm), and X-Band (3 cm). The multi-frequency data will be used by the international scientific community to better understand the global environment and how it is changing. The SIR-C/X-SAR data, complemented by aircraft and ground studies, will give scientists clearer insights into those environmental changes which are caused by nature and those changes which are induced by human activity. SIR-C was developed by NASA's Jet Propulsion Laboratory (JPL). X-SAR was developed by the Dornire and Alenia Spazio Companies for the German Space Agency, Deutsche Agentur fuer Raumfahrtangelegenheiten (DARA), and the Italian Space Agency, Agenzia Spaziale Italiana (ASI). JPL Photo ID: P-43941
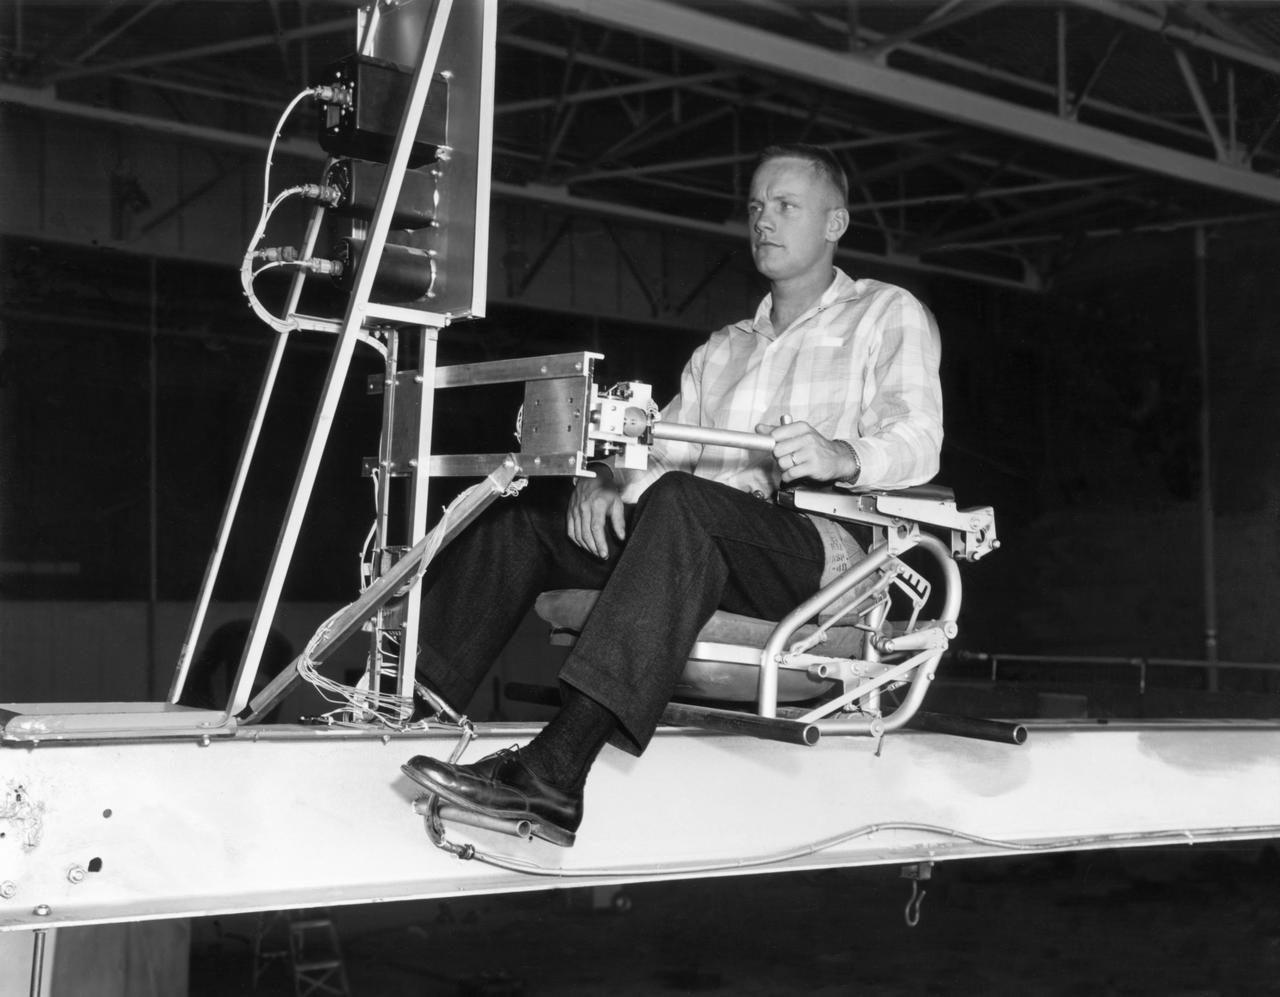
Famed astronaut Neil A. Armstrong, the first man to set foot on the moon during the historic Apollo 11 space mission in July 1969, served for seven years as a research pilot at the NACA-NASA High-Speed Flight Station, now the Dryden Flight Research Center, at Edwards, California, before he entered the space program. Armstrong joined the National Advisory Committee for Aeronautics (NACA) at the Lewis Flight Propulsion Laboratory (later NASA's Lewis Research Center, Cleveland, Ohio, and today the Glenn Research Center) in 1955. Later that year, he transferred to the High-Speed Flight Station at Edwards as an aeronautical research scientist and then as a pilot, a position he held until becoming an astronaut in 1962. He was one of nine NASA astronauts in the second class to be chosen. As a research pilot Armstrong served as project pilot on the F-100A and F-100C aircraft, F-101, and the F-104A. He also flew the X-1B, X-5, F-105, F-106, B-47, KC-135, and Paresev. He left Dryden with a total of over 2450 flying hours. He was a member of the USAF-NASA Dyna-Soar Pilot Consultant Group before the Dyna-Soar project was cancelled, and studied X-20 Dyna-Soar approaches and abort maneuvers through use of the F-102A and F5D jet aircraft. Armstrong was actively engaged in both piloting and engineering aspects of the X-15 program from its inception. He completed the first flight in the aircraft equipped with a new flow-direction sensor (ball nose) and the initial flight in an X-15 equipped with a self-adaptive flight control system. He worked closely with designers and engineers in development of the adaptive system, and made seven flights in the rocket plane from December 1960 until July 1962. During those fights he reached a peak altitude of 207,500 feet in the X-15-3, and a speed of 3,989 mph (Mach 5.74) in the X-15-1. Armstrong has a total of 8 days and 14 hours in space, including 2 hours and 48 minutes walking on the Moon. In March 1966 he was commander of the Gemini 8 or
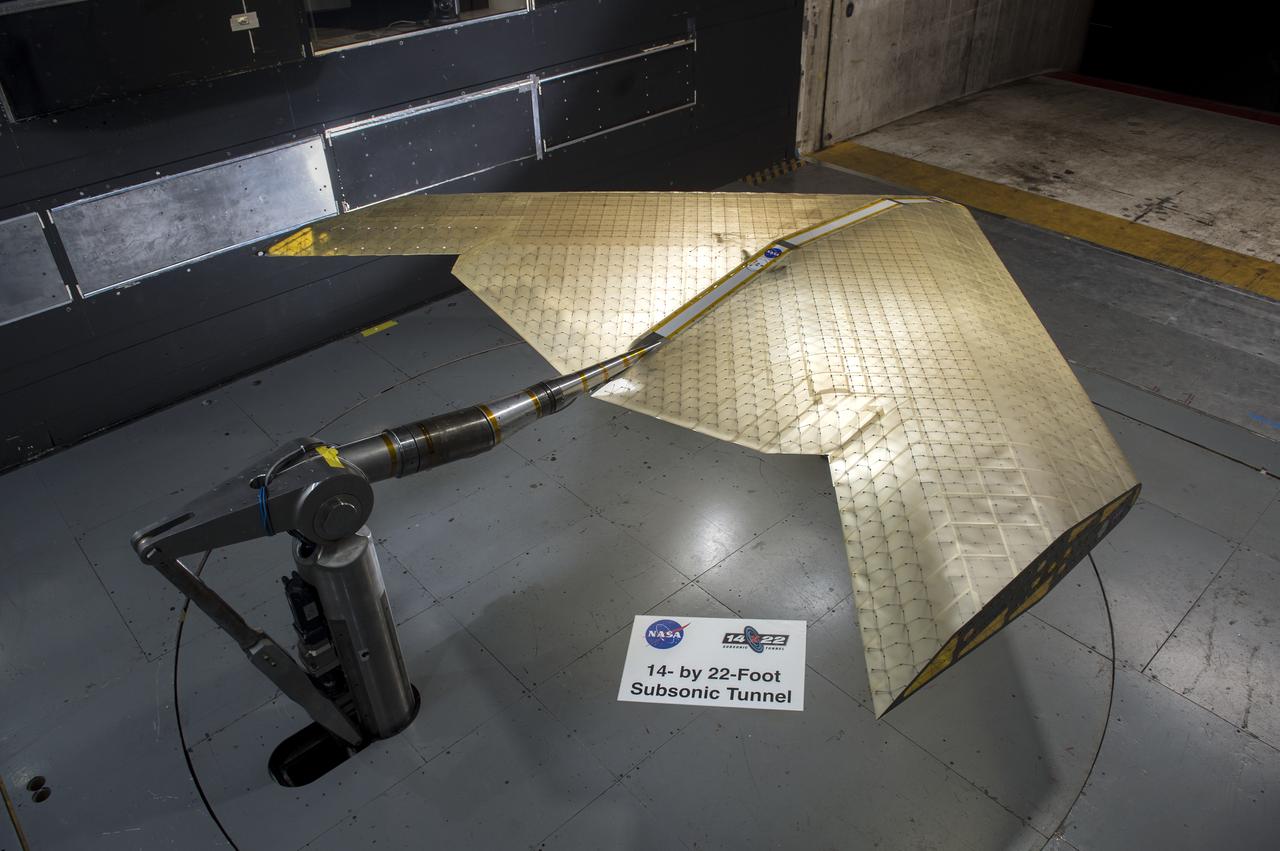
Mission Adaptive Digital Composite Aerostructure Technologies (MADCAT) model in the 14x22 test section, building 1212C For more information go to NASA.gov article. April 3, 2019 "What is MADCAT?" Flexing Wings for Efficient Flight
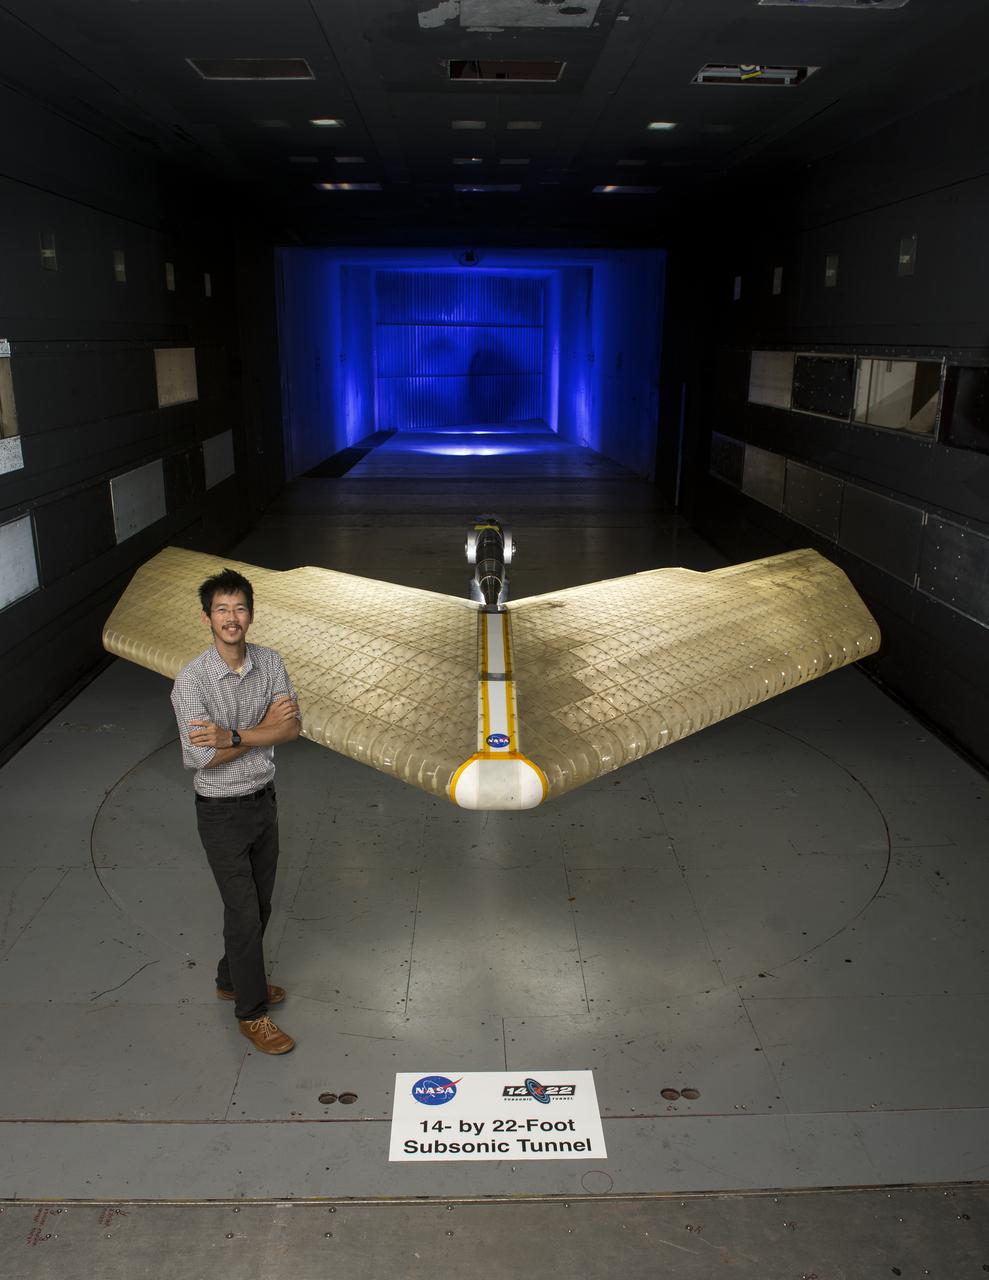
Mission Adaptive Digital Composite Aerostructure Technologies (MADCAT) model in the 14x22 test section, building 1212C, Kenny Cheung from Ames Research Center in photograph. For more information go to NASA.gov article. April 3, 2019 "What is MADCAT?" Flexing Wings for Efficient Flight

Mission Adaptive Digital Composite Aerostructure Technologies (MADCAT) model in the 14x22 test section. Interior of Structure. For more information go to NASA.gov article. April 3, 2019 "What is MADCAT?" Flexing Wings for Efficient Flight

Mission Adaptive Digital Composite Aerostructure Technologies (MADCAT) model in the 14x22 test section, building 1212C For more information go to NASA.gov article. April 3, 2019 "What is MADCAT?" Flexing Wings for Efficient Flight.
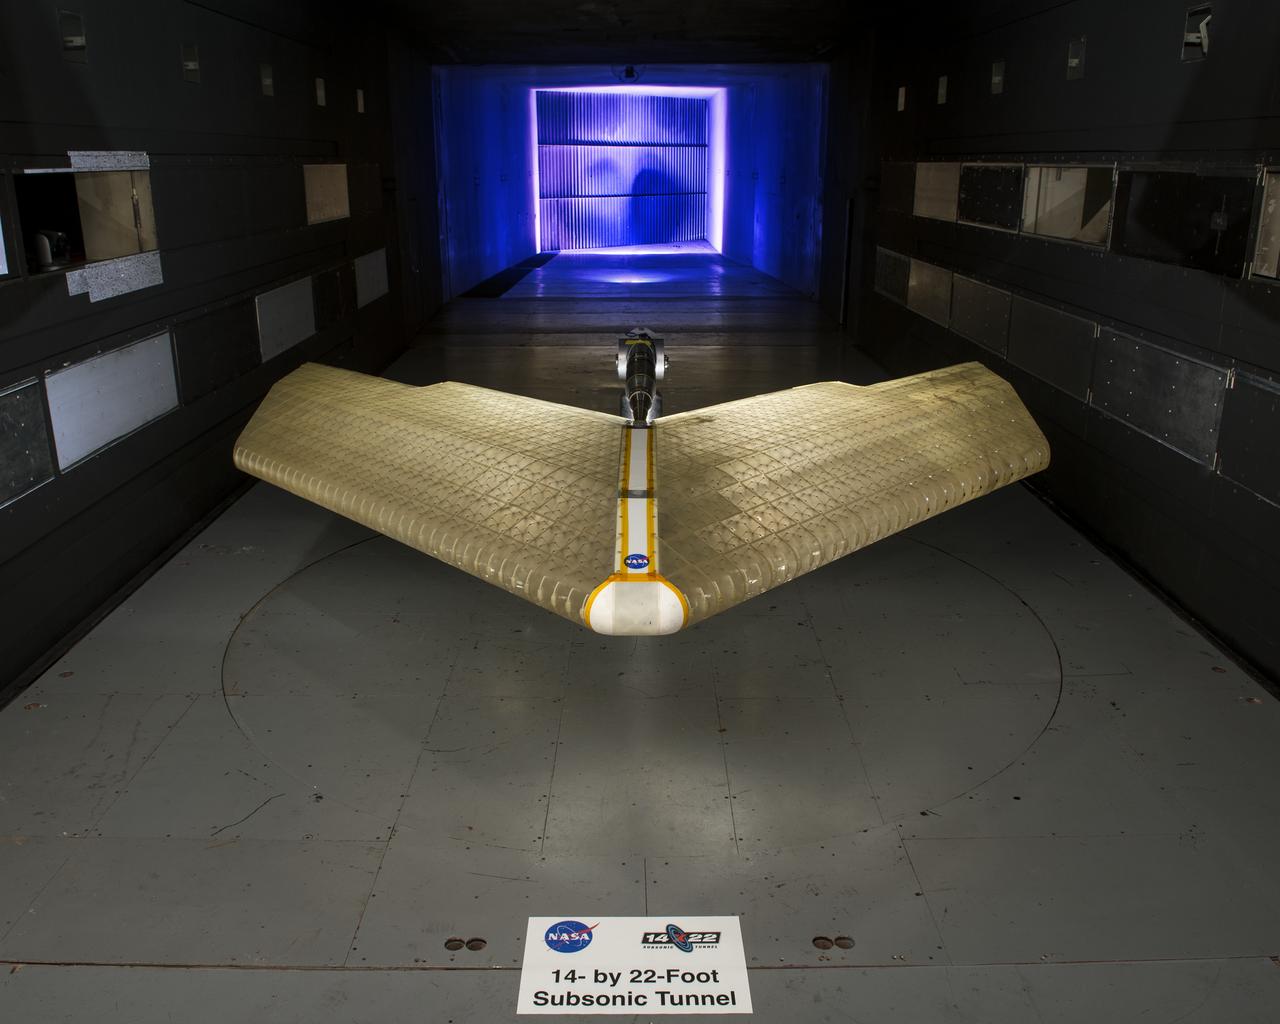
Mission Adaptive Digital Composite Aerostructure Technologies (MADCAT) model in the 14x22 test section, building 1212C. For more information go to NASA.gov article. April 3, 2019 " What is MADCAT? " Flexing Wings for Efficient Flight.

In southern California, the combined ports of Los Angeles and Long Beach account for 33% of the nation containerized imports. This image from NASA Terra spacecraft shows the large backlog of waiting cargo ships being slowly unloaded. The left image was acquired July 4, 2014 during normal operations: 14 ships are being unloaded, while 7 wait their turns near the facilities. The right image was acquired on March 8, 2015: 19 ships are moored at unloading docks, while 47 ships wait their turns. The images cover an area of 16.7 x 18.6 km, and are located at 33.7 degrees north, 118.2 degrees west. http://photojournal.jpl.nasa.gov/catalog/PIA19249
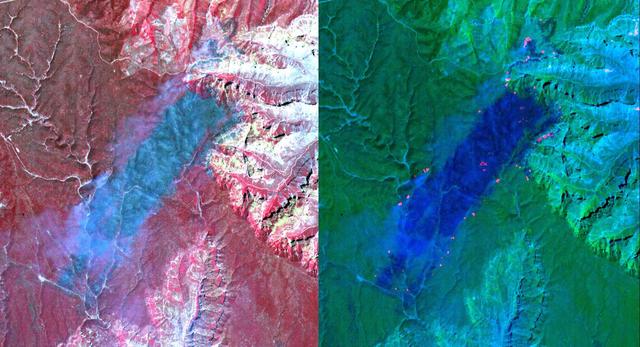
These ASTER images cover an area of 11 x 14 km on the north rim of the Grand Canyon, Arizona, and were acquired May 12, 2000. The left image displays bands 3,2,1 in RGB, displaying vegetation as red. The large dark area is burned forest, and small smoke plumes can be seen at the edges where active fires are burning. The right display substitutes SWIR band 8 for band 3. The bright red spots are the active fires, visible because the SWIR wavelength region has the capability to penetrate through the smoke. This image is located at 35.9 degrees north latitude and 113.4 degrees west longitude. http://photojournal.jpl.nasa.gov/catalog/PIA11092
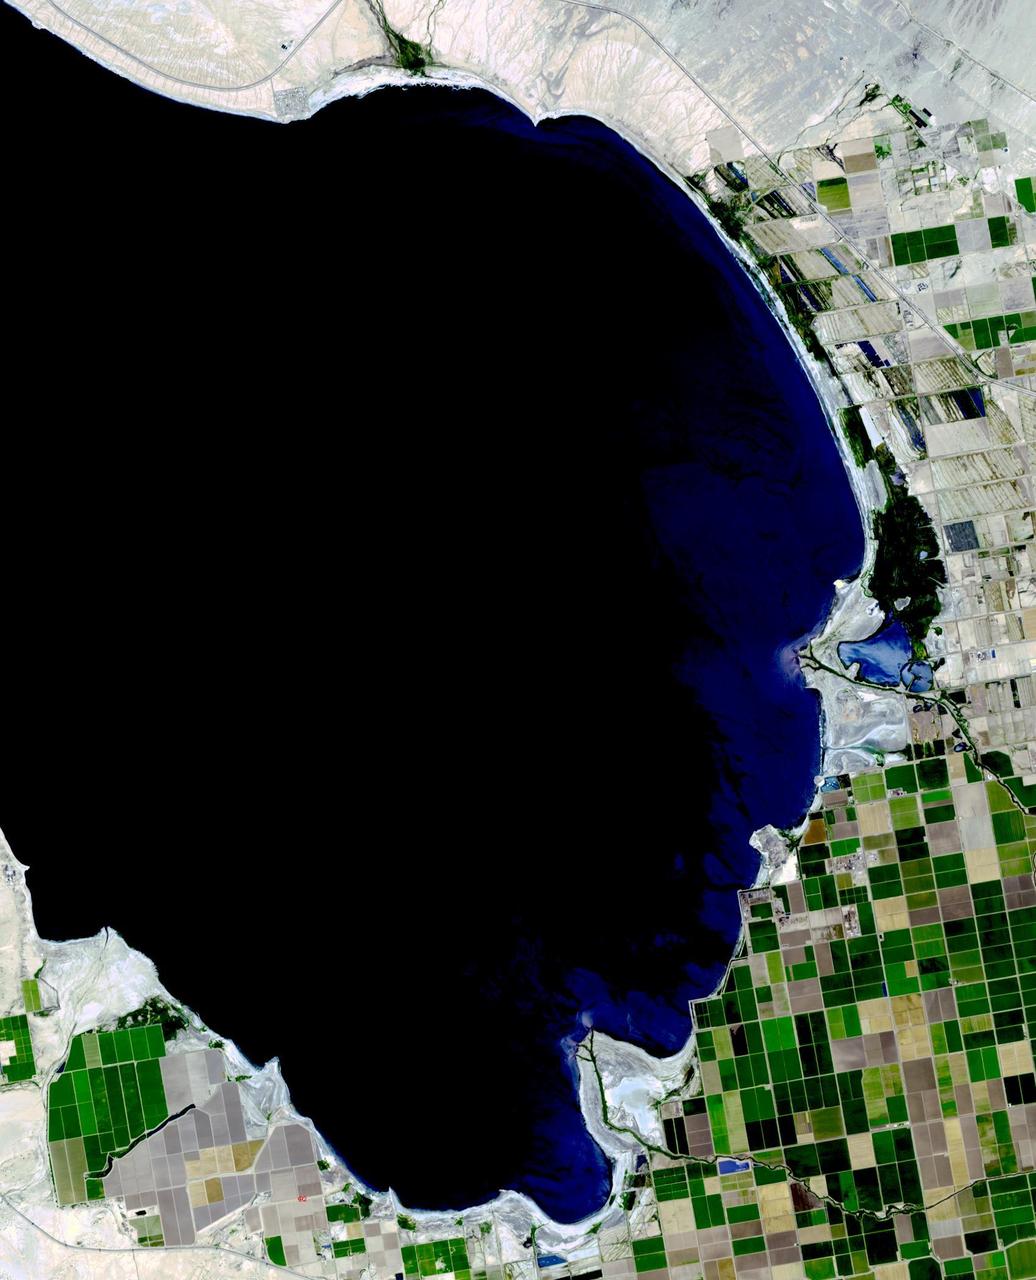
The Salton Sea in south California was created in 1905 when spring flooding on the Colorado River breached a canal. For 18 months the entire volume of the river rushed into the Salton Trough, creating a lake 32 km wide and 72 km long. In the 1950s, resorts sprang up along the shores. However, shrinking of the lake and increased salinity led to the abandonment of the resorts. The two images show the shrinking lake on May 31, 1984 (Landsat) and June 14, 2015 (ASTER). The images cover an area of 37.5 x 27 km, and are located at 33.2 degrees north, 115.7 degrees west. http://photojournal.jpl.nasa.gov/catalog/PIA19786
From December 10, 1966, until his retirement on February 27, 1976, Stanley P. Butchart served as Chief (later, Director) of Flight Operations at NASA's Flight Research Center (renamed on March 26, 1976, the Hugh L. Dryden Flight Research Center). Initially, his responsibilities in this position included the Research Pilots Branch, a Maintenance and Manufacturing Branch, and an Operations Engineering Branch, the last of which not only included propulsion and electrical/electronic sections but project engineers for the X-15 and lifting bodies. During his tenure, however, the responsibilities of his directorate came to include not only Flight Test Engineering Support but Flight Systems and Loads laboratories. Before becoming Chief of Flight Operations, Butchart had served since June of 1966 as head of the Research Pilots Branch (Chief Pilot) and then as acting chief of Flight Operations. He had joined the Center (then known as the National Advisory Committee for Aeronautics' High-Speed Flight Research Station) as a research pilot on May 10, 1951. During his career as a research pilot, he flew a great variety of research and air-launch aircraft including the D-558-I, D-558-II, B-29 (plus its Navy version, the P2B), X-4, X-5, KC-135, CV-880, CV-990, B-47, B-52, B-747, F-100A, F-101, F-102, F-104, PA-30 Twin Comanche, JetStar, F-111, R4D, B-720, and B-47. Although previously a single-engine pilot, he became the Center's principal multi-engine pilot during a period of air-launches in which the pilot of the air-launch aircraft (B-29 or P2B) basically directed the operations. It was he who called for the chase planes before each drop, directed the positioning of fire rescue vehicles, and released the experimental aircraft after ensuring that all was ready for the drop. As pilot of the B-29 and P2B, Butchart launched the X-1A once, the X-1B 13 times, the X-1E 22 times, and the D-558-II 102 times. In addition, he towed the M2-F1 lightweight lifting body 14 times behind an R4
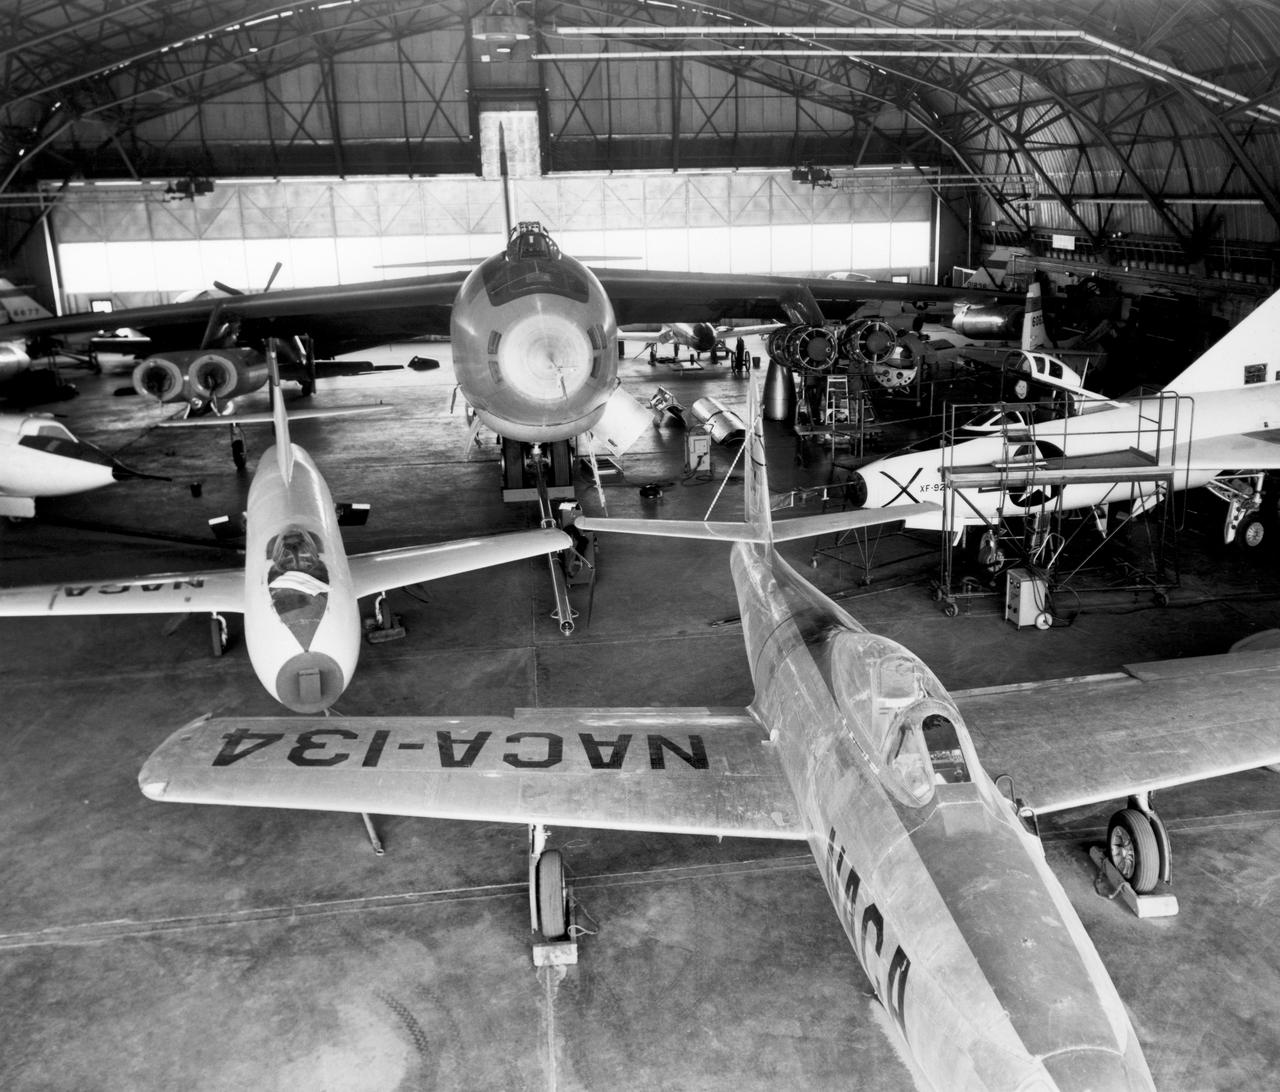
In the center foreground of this 1953 hangar photo is the YF-84A (NACA 134/Air Force 45-59490) used for vortex generator research. It arrived on November 28, 1949, and departed on April 21, 1954. Beside it is the third D-558-1 aircraft (NACA 142/Navy 37972). This aircraft was used for a total of 78 transonic research flights from April 1949 to June 1954. It replaced the second D-558-1, lost in the crash which killed Howard Lilly. Just visible on the left edge is the nose of the first D-558-2 (NACA 143/Navy 37973). Douglas turned the aircraft over to NACA on August 31, 1951, after the contractor had completed its initial test flights. NACA only made a single flight with the aircraft, on September 17, 1956, before the program was cancelled. In the center of the photo is the B-47A (NACA 150/Air Force 49-1900). The B-47 jet bomber, with its thin, swept-back wings, and six podded engines, represented the state of the art in aircraft design in the early 1950s. The aircraft undertook a number of research activities between May 1953 and its 78th and final research flight on November 22, 1957. The tests showed that the aircraft had a buffeting problem at speeds above Mach 0.8. Among the pilots who flew the B-47 were later X-15 pilots Joe Walker, A. Scott Crossfield, John B. McKay, and Neil A. Armstrong. On the right side of the B-47 is NACA's X-1 (Air Force 46-063). The second XS-1 aircraft built, it was fitted with a thicker wing than that on the first aircraft, which had exceeded Mach 1 on October 14, 1947. Flight research by NACA pilots indicated that this thicker wing produced 30 percent more drag at transonic speeds compared to the thinner wing on the first X-1. After a final flight on October 23, 1951, the aircraft was grounded due to the possibility of fatigue failure of the nitrogen spheres used to pressurize the fuel tanks. At the time of this photo, in 1953, the aircraft was in storage. In 1955, the aircraft was extensively modified, becoming the X-1E. In front o

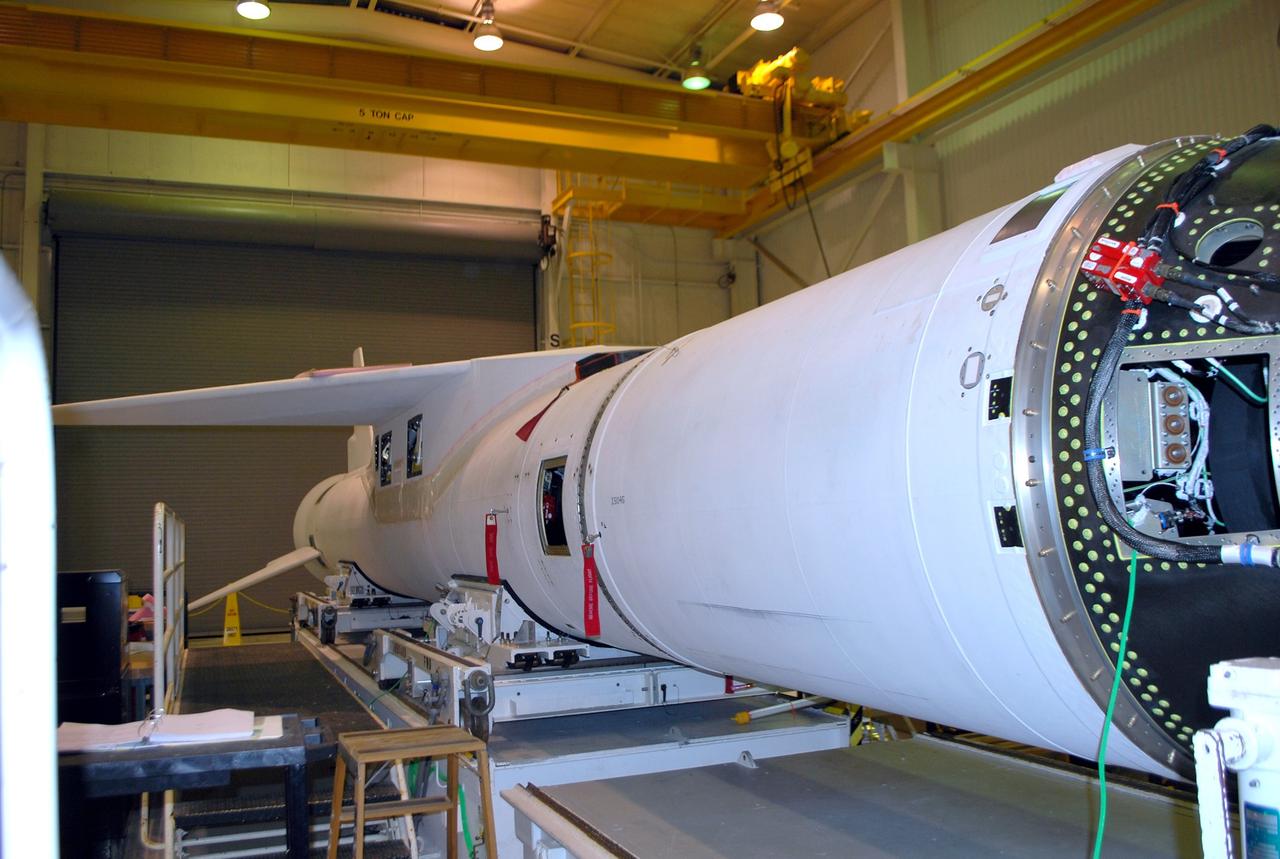
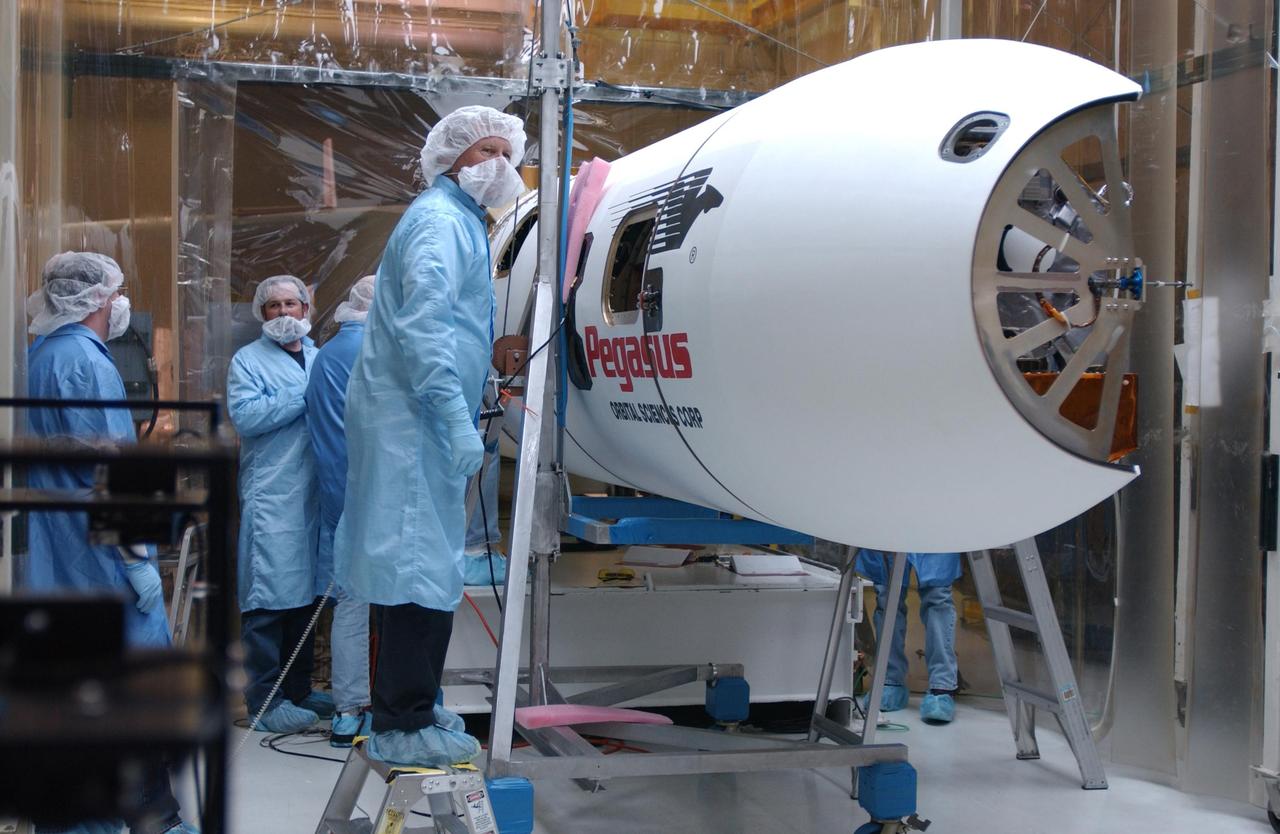
VANDENBERG AIR FORCE BASE, Calif. -- Processing and integration of a three-stage Orbital Sciences Corp. Pegasus rocket are complete in processing facility 1555 at Vandenberg Air Force Base (VAFB) in California. The rocket is being prepared to launch NASA's Nuclear Spectroscopic Telescope Array (NuSTAR) into space. After the rocket and spacecraft are processed at Vandenberg, they will be flown on the Orbital Sciences' L-1011 carrier aircraft to the Ronald Reagan Ballistic Missile Defense Test Site at the Pacific Ocean's Kwajalein Atoll for launch, targeted for no earlier than March 14. The high-energy x-ray telescope will conduct a census for black holes, map radioactive material in young supernovae remnants, and study the origins of cosmic rays and the extreme physics around collapsed stars. For more information, visit http://www.nasa.gov/nustar. Photo credit: NASA/Randy Beaudoin, VAFB
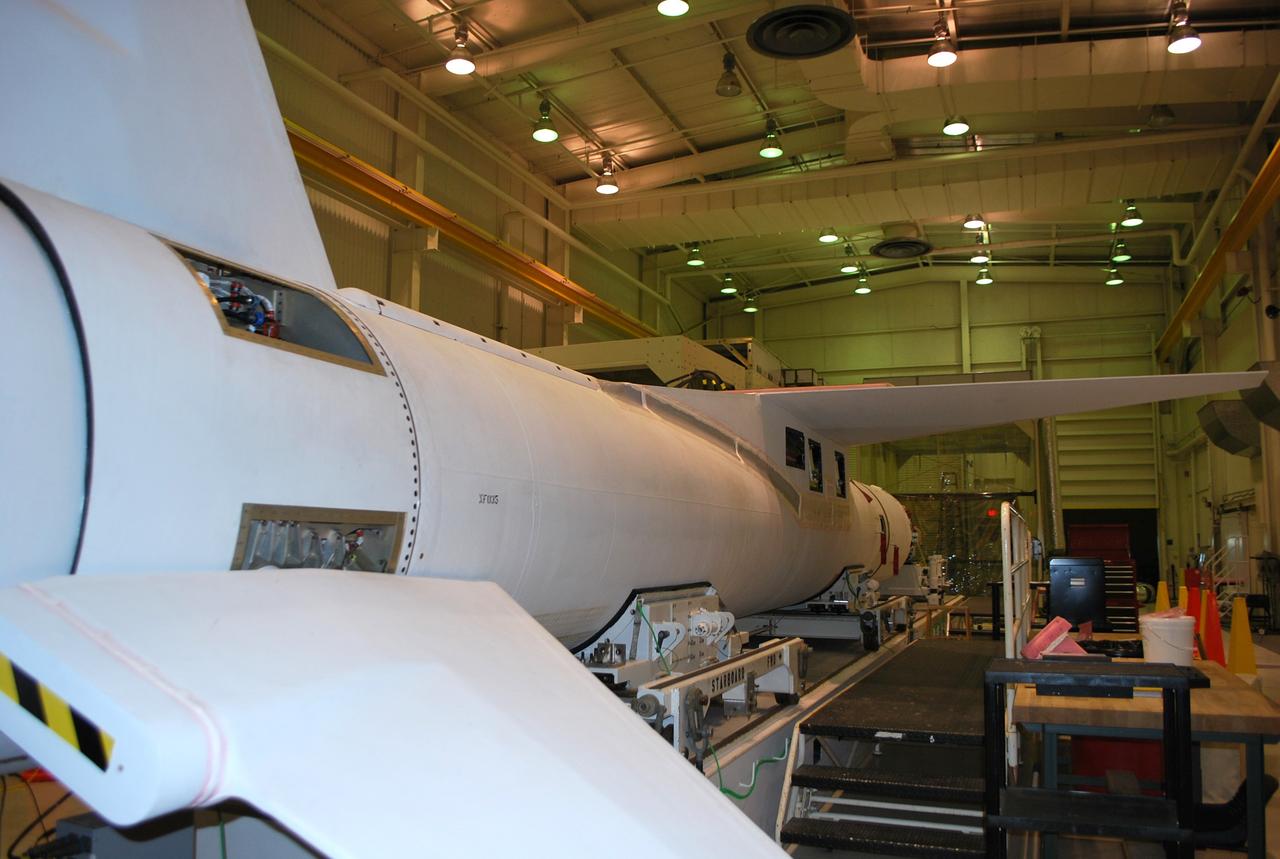
VANDENBERG AIR FORCE BASE, Calif. -- Stage 2 is separated from stage 3 of an Orbital Sciences Corp. Pegasus rocket in processing facility 1555 at Vandenberg Air Force Base (VAFB) in California to reinstall some RF cabling. The stages were remated after the installation was complete. The rocket is being prepared to launch NASA's Nuclear Spectroscopic Telescope Array (NuSTAR) into space. After the rocket and spacecraft are processed at Vandenberg, they will be flown on the Orbital Sciences' L-1011 carrier aircraft to the Ronald Reagan Ballistic Missile Defense Test Site at the Pacific Ocean's Kwajalein Atoll for launch, targeted for no earlier than March 14. The high-energy x-ray telescope will conduct a census for black holes, map radioactive material in young supernovae remnants, and study the origins of cosmic rays and the extreme physics around collapsed stars. For more information, visit http://www.nasa.gov/nustar. Photo credit: NASA/Randy Beaudoin, VAFB
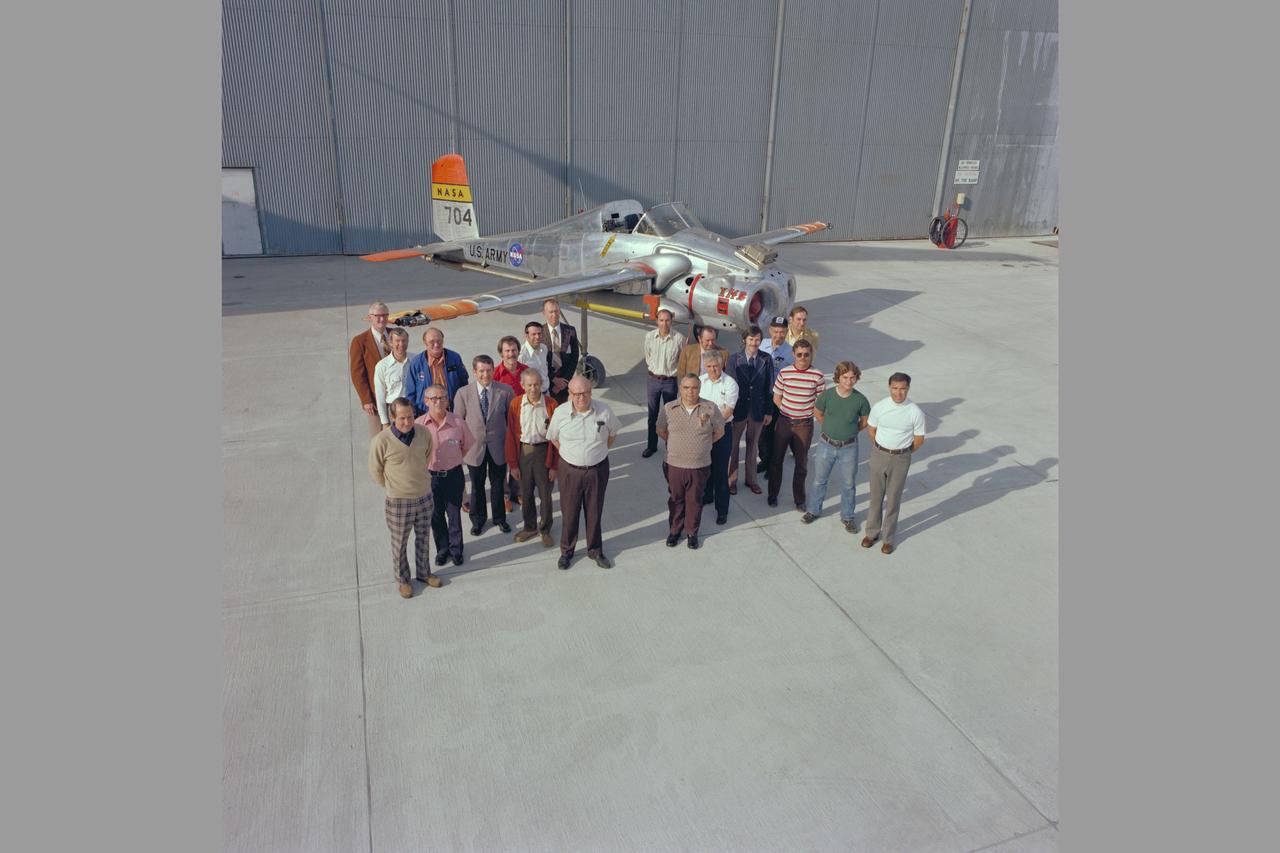
Olczak Bell X-14 AIRCRAFT TWENTIETH ANNIVERSARY. Research Team: Front Row: Fred Drinkwater, Jim Meeks, Lonnie Phillips, Jim Kozalski, Vic Bravo. Second Row: Bill Carpenter, Sid Selan, Dick Gallant, Terry Stoeffler. Third row: Ron Gerdes, Lloyd Corliss. Fourth row: Cy Sewell, Dick Greif, Ed Vernon, Lee Jones. Fifth Row: Dan Dugan, Jim Rogers, Dave Walton, Terry Feistel. Back Row: Frank Pauli, Seth Anderson. Not pictured: Terry Gossett, Bob Innis, Stew Rolls, Lawson Williamson. Note: Used in publication in Flight Research at Ames; 57 Years of Development and Validation of Aeronautical Technology NASA SP-1998-3300 fig. 118
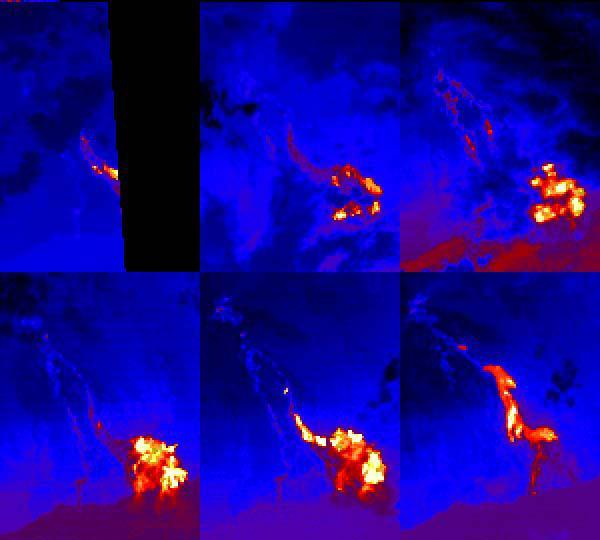
This sequence of ASTER nighttime thermal images shows the Pu'u O'o lava flows entering the sea at Kamokuna on the southeast side of the Island of Hawaii. Each image covers an area of 9 x 12 km. The acquisition dates are April 4 2000, May 13 2000, May 22 2000 (upper row) and June 30 2000, August 1 2000 and January 1 2001 (lower row). Thermal band 14 has been color coded from black (coldest) through blue, red, yellow and white (hottest). The first 5 images show a time sequence of a single eruptive phase; the last image shows flows from a later eruptive phase. The images are located at 19.3 degrees north latitude, 155 degrees west longitude. http://photojournal.jpl.nasa.gov/catalog/PIA11093
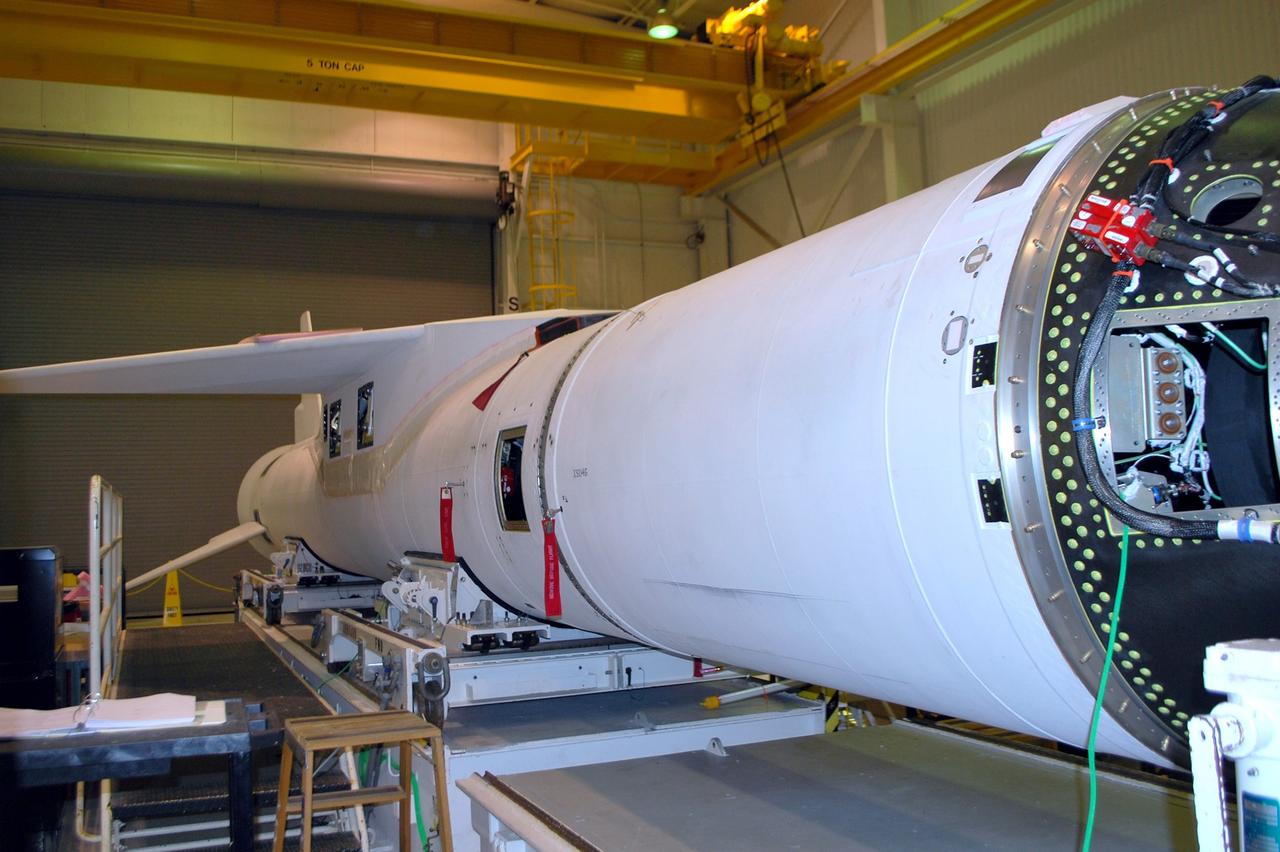
VANDENBERG AIR FORCE BASE, Calif. -- The three stages of an Orbital Sciences Corp. Pegasus rocket have been mated in processing facility 1555 at Vandenberg Air Force Base (VAFB) in California. The rocket is being prepared to launch NASA's Nuclear Spectroscopic Telescope Array (NuSTAR) into space. After the rocket and spacecraft are processed at Vandenberg, they will be flown on the Orbital Sciences' L-1011 carrier aircraft to the Ronald Reagan Ballistic Missile Defense Test Site at the Pacific Ocean's Kwajalein Atoll for launch, targeted for no earlier than March 14. The high-energy x-ray telescope will conduct a census for black holes, map radioactive material in young supernovae remnants, and study the origins of cosmic rays and the extreme physics around collapsed stars. For more information, visit http://www.nasa.gov/nustar. Photo credit: NASA/Randy Beaudoin, VAFB

The junctions of the Amazon and the Rio Negro Rivers at Manaus, Brazil. The Rio Negro flows 2300 km from Columbia, and is the dark current forming the north side of the river. It gets its color from the high tannin content in the water. The Amazon is sediment laden, appearing brown in this simulated natural color image. Manaus is the capital of Amazonas state, and has a population in excess of one million. The ASTER image covers an area of 60 x 45 km. This image was acquired on July 16, 2000 by the Advanced Spaceborne Thermal Emission and Reflection Radiometer (ASTER) on NASA's Terra satellite. With its 14 spectral bands from the visible to the thermal infrared wavelength region, and its high spatial resolution of 15 to 90 meters (about 50 to 300 feet), ASTER will image Earth for the next 6 years to map and monitor the changing surface of our planet. http://photojournal.jpl.nasa.gov/catalog/PIA03851
VANDENBERG AIR FORCE BASE, Calif. -- Processing and integration of the three stages comprising an Orbital Sciences Corp. Pegasus rocket are complete in processing facility 1555 at Vandenberg Air Force Base (VAFB) in California. The rocket is being prepared to launch NASA's Nuclear Spectroscopic Telescope Array (NuSTAR) into space. After the rocket and spacecraft are processed at Vandenberg, they will be flown on the Orbital Sciences' L-1011 carrier aircraft to the Ronald Reagan Ballistic Missile Defense Test Site at the Pacific Ocean's Kwajalein Atoll for launch, targeted for no earlier than March 14. The high-energy x-ray telescope will conduct a census for black holes, map radioactive material in young supernovae remnants, and study the origins of cosmic rays and the extreme physics around collapsed stars. For more information, visit http://www.nasa.gov/nustar. Photo credit: NASA/Randy Beaudoin, VAFB
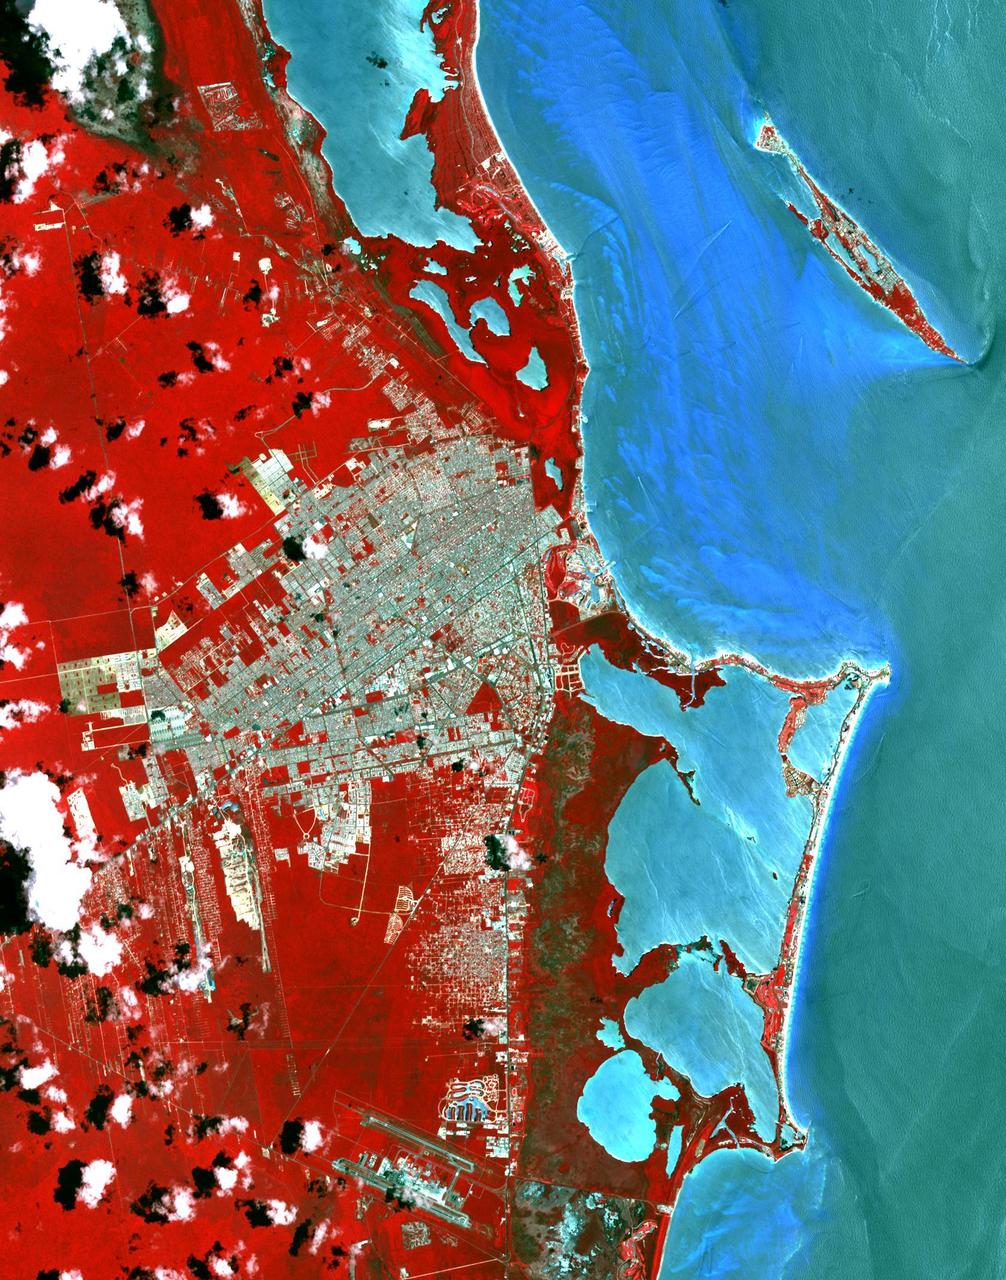
This image from NASA Terra spacecraft shows Cancun, a resort city on the east side of Mexico Yucatan Peninsula. In 1970, the population was 120 people. The city began as a tourism project in 1974. Since then, it has undergone a comprehensive transformation from being a fisherman's island surrounded by virgin forest and undiscovered shores to being one of the two most well-known Mexican resorts, along with Acapulco. In 1990 the city had grown to 167,000 inhabitants, and by 2014 to 723,000 inhabitants. These two images show the area on March 28, 1985, acquired by Landsat; and May 14, 2014, acquired by ASTER. The images cover an area of 25 x 36 km, and are located at 21.1 degrees north, 86.8 degrees west. http://photojournal.jpl.nasa.gov/catalog/PIA20086
VANDENBERG AIR FORCE BASE, Calif. -- Preparations for the second flight simulation of an Orbital Sciences Corp. Pegasus rocket are under way in processing facility 1555 at Vandenberg Air Force Base (VAFB) in California. The rocket is being prepared to launch NASA's Nuclear Spectroscopic Telescope Array (NuSTAR) into space. After the rocket and spacecraft are processed at Vandenberg, they will be flown on the Orbital Sciences' L-1011 carrier aircraft to the Ronald Reagan Ballistic Missile Defense Test Site at the Pacific Ocean's Kwajalein Atoll for launch, targeted for no earlier than March 14. The high-energy x-ray telescope will conduct a census for black holes, map radioactive material in young supernovae remnants, and study the origins of cosmic rays and the extreme physics around collapsed stars. For more information, visit http://www.nasa.gov/nustar. Photo credit: NASA/Randy Beaudoin, VAFB
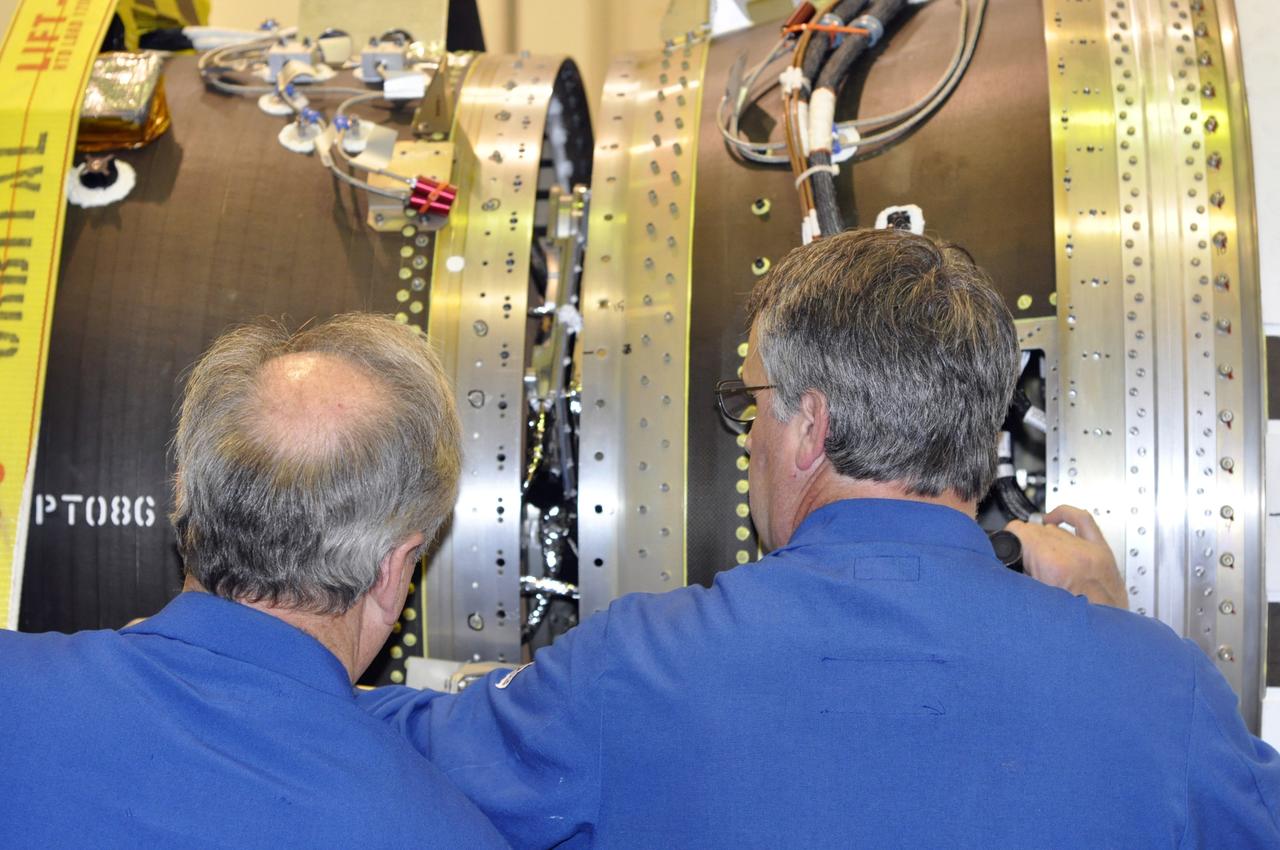
VANDENBERG AIR FORCE BASE, Calif. -- Orbital Sciences Corp. engineers oversee the remating of stages 2 and 3 of the Pegasus rocket in processing facility 1555 at Vandenberg Air Force Base (VAFB) in California. The stages were remated after some RF electrical cabling was reinstalled. The rocket is being prepared to launch NASA's Nuclear Spectroscopic Telescope Array (NuSTAR) into space. After the rocket and spacecraft are processed at Vandenberg, they will be flown on the Orbital Sciences' L-1011 carrier aircraft to the Ronald Reagan Ballistic Missile Defense Test Site at the Pacific Ocean's Kwajalein Atoll for launch, targeted for no earlier than March 14. The high-energy x-ray telescope will conduct a census for black holes, map radioactive material in young supernovae remnants, and study the origins of cosmic rays and the extreme physics around collapsed stars. For more information, visit http://www.nasa.gov/nustar. Photo credit: NASA/Randy Beaudoin, VAFB
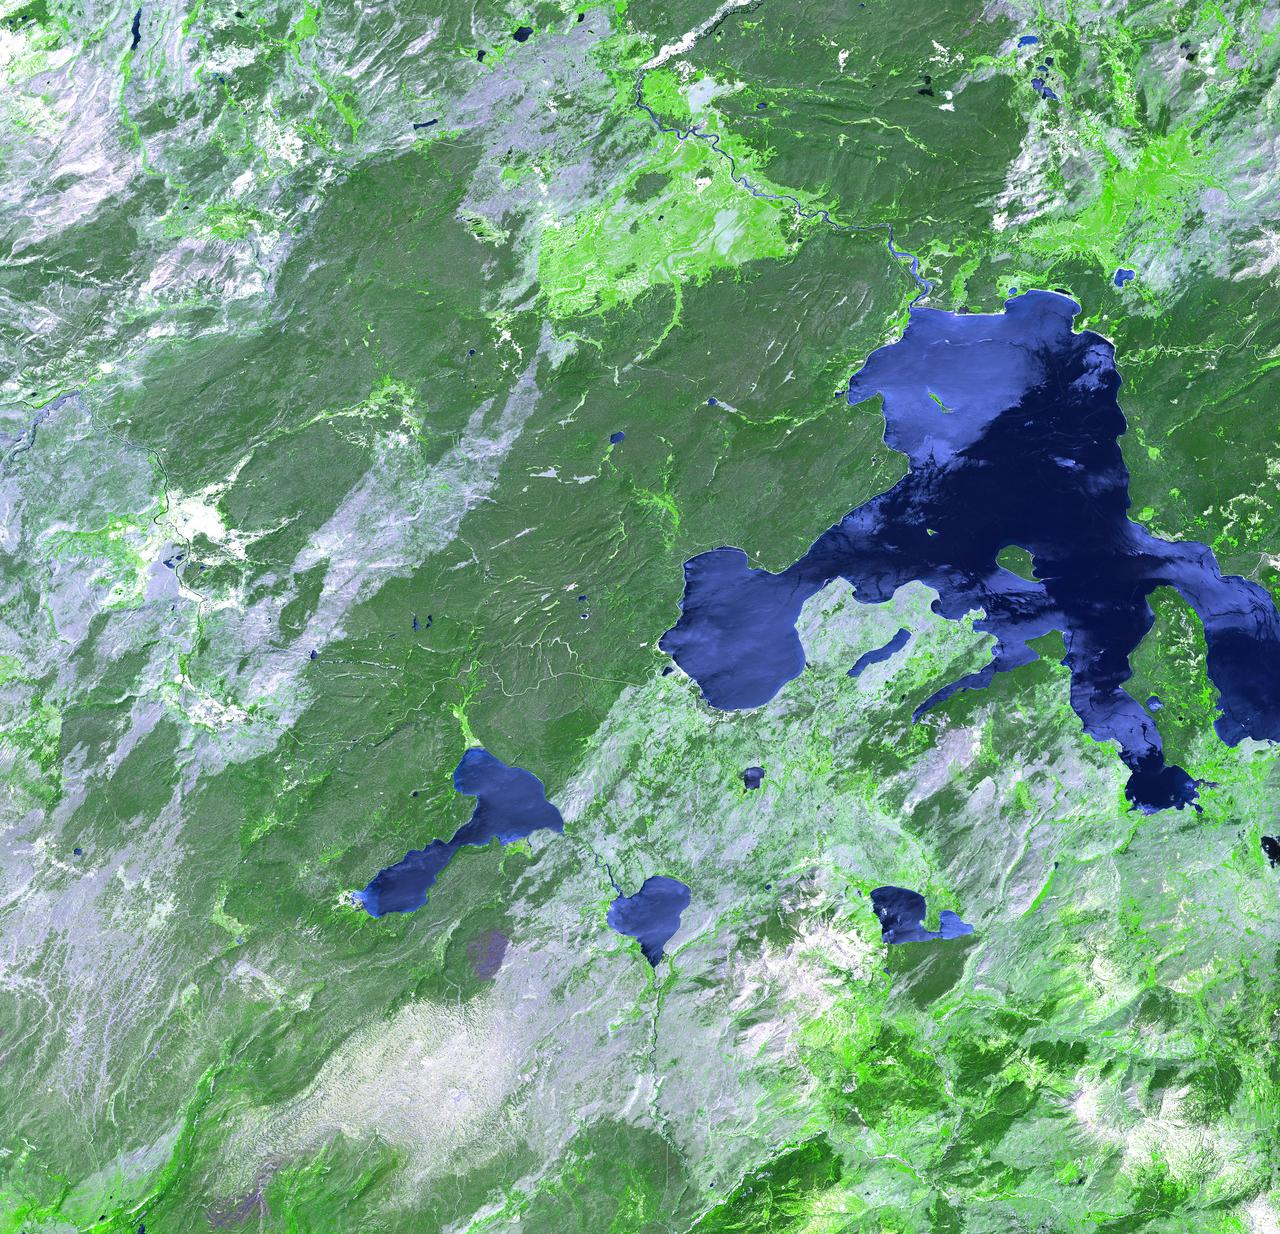
Thirteen years after devastating forest fires burned over 1.6 million acres in Yellowstone National Park, the scars are still evident. In this simulated natural color ASTER image, burned areas appear gray, in contrast to the dark green of unburned forests. The image covers an area of 60 x 63 km. This image was acquired on July 2, 2001 by the Advanced Spaceborne Thermal Emission and Reflection Radiometer (ASTER) on NASA's Terra satellite. With its 14 spectral bands from the visible to the thermal infrared wavelength region, and its high spatial resolution of 15 to 90 meters (about 50 to 300 feet), ASTER images Earth to map and monitor the changing surface of our planet. http://photojournal.jpl.nasa.gov/catalog/PIA03875
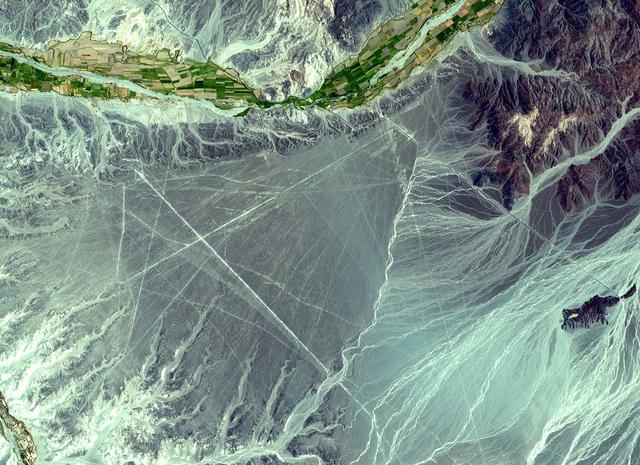
The Nasca Lines are located in the Pampa region of Peru, the desolate plain of the Peruvian coast 400 km south of Lima. The Lines were first spotted when commercial airlines began flying across the Peruvian desert in the 1920's. Passengers reported seeing 'primitive landing strips' on the ground below. The Lines were made by removing the iron-oxide coated pebbles which cover the surface of the desert. When the gravel is removed, they contrast with the light color underneath. In this way the lines were drawn as furrows of a lighter color. On the pampa, south of the Nasca Lines, archaeologists have now uncovered the lost city of the line-builders, Cahuachi. It was built nearly two thousand years ago and was mysteriously abandoned 500 years later. This ASTER sub-image covers an area of 14 x 18 km, was acquired on December 22, 2000, and is located at 14.7 degrees south latitude and 75.1 degrees west longitude. http://photojournal.jpl.nasa.gov/catalog/PIA11097
![This image from NASA's Mars Reconnaissance Orbiter (MRO) shows the eastern rim of a small 3.5-kilometer crater which appears to have collapsed into a much larger crater (about 14-kilometers wide). The larger crater has a large ice flow around its central peak, and is non-circular, with large blocks further suggesting structural collapse of the terrain due to what are called periglacial processes. Understanding the composition of this small crater may inform us of the ice content of the surrounding terrain. The map is projected here at a scale of 50 centimeters (19.7 inches) per pixel. [The original image scale is 50.8 centimeters (20 inches) per pixel (with 2 x 2 binning); objects on the order of 152 centimeters (59.8 inches) across are resolved.] North is up. https://photojournal.jpl.nasa.gov/catalog/PIA22116](https://images-assets.nasa.gov/image/PIA22116/PIA22116~medium.jpg)
This image from NASA's Mars Reconnaissance Orbiter (MRO) shows the eastern rim of a small 3.5-kilometer crater which appears to have collapsed into a much larger crater (about 14-kilometers wide). The larger crater has a large ice flow around its central peak, and is non-circular, with large blocks further suggesting structural collapse of the terrain due to what are called periglacial processes. Understanding the composition of this small crater may inform us of the ice content of the surrounding terrain. The map is projected here at a scale of 50 centimeters (19.7 inches) per pixel. [The original image scale is 50.8 centimeters (20 inches) per pixel (with 2 x 2 binning); objects on the order of 152 centimeters (59.8 inches) across are resolved.] North is up. https://photojournal.jpl.nasa.gov/catalog/PIA22116

Mission Adaptive Digital Composite Aerostructure Technologies (MADCAT) model in the 14x22 test section. Interior of structure. For more information go to NASA.gov article. April 3, 2019 "What is MADCAT?" Flexing Wings for Efficient Flight
This is a radar image of the southwest portion of the buried Chicxulub impact crater in the Yucatan Peninsula, Mexico. The radar image was acquired on orbit 81 of space shuttle Endeavour on April 14, 1994 by the Spaceborne Imaging Radar C/X-Band Synthetic Aperture Radar (SIR-C/X-SAR). The image is centered at 20 degrees north latitude and 90 degrees west longitude. Scientists believe the crater was formed by an asteroid or comet which slammed into the Earth more than 65 million years ago. It is this impact crater that has been linked to a major biological catastrophe where more than 50 percent of the Earth's species, including the dinosaurs, became extinct. The 180-to 300-kilometer-diameter (110- to 180-mile) crater is buried by 300 to 1,000 meters (1,000 to 3,000 feet) of limestone. The exact size of the crater is currently being debated by scientists. This is a total power radar image with L-band in red, C-band in green, and the difference between C-band L-band in blue. The 10-kilometer-wide (6-mile) band of yellow and pink with blue patches along the top left (northwestern side) of the image is a mangrove swamp. The blue patches are islands of tropical forests created by freshwater springs that emerge through fractures in the limestone bedrock and are most abundant in the vicinity of the buried crater rim. The fracture patterns and wetland hydrology in this region are controlled by the structure of the buried crater. Scientists are using the SIR-C/X-SAR imagery to study wetland ecology and help determine the exact size of the impact crater. http://photojournal.jpl.nasa.gov/catalog/PIA01723
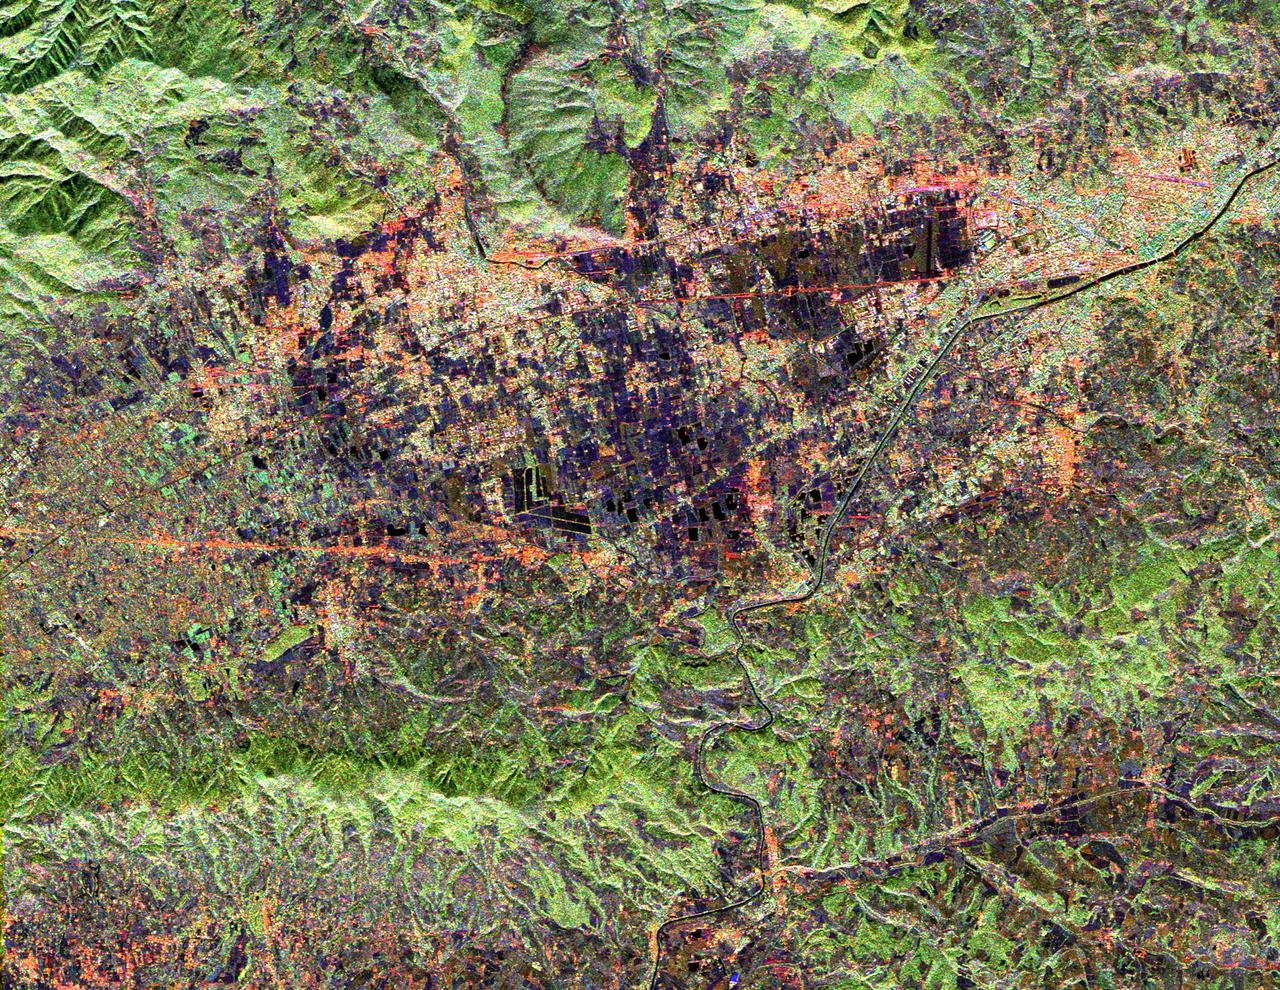
This radar image shows land use patterns in and around the city of Florence, Italy, shown here in the center of the image. Florence is situated on a plain in the Chianti Hill region of Central Italy. The Arno River flows through town and is visible as the dark line running from the upper right to the bottom center of the image. The city is home to some of the world's most famous art museums. The bridges seen crossing the Arno, shown as faint red lines in the upper right portion of the image, were all sacked during World War II with the exception of the Ponte Vecchio, which remains as Florence's only covered bridge. The large, black V-shaped feature near the center of the image is the Florence Railroad Station. This image was acquired by the Spaceborne Imaging Radar-C/X-band Synthetic Aperture Radar (SIR-C/X-SAR) onboard the Space Shuttle Endeavour on April 14, 1994. SIR-C/X-SAR, a joint mission of the German, Italian, and United States space agencies, is part of NASA's Mission to Planet Earth. This image is centered at 43.7 degrees north latitude and 11.15 degrees east longitude with North toward the upper left of the image. The area shown measures 20 kilometers by 17 kilometers (12.4 miles by 10.6 miles). The colors in the image are assigned to different frequencies and polarizations of the radar as follows: red is L-band horizontally transmitted, horizontally received; green is L-band horizontally transmitted, vertically received; blue is C-band horizontally transmitted, vertically received. http://photojournal.jpl.nasa.gov/catalog/PIA01795
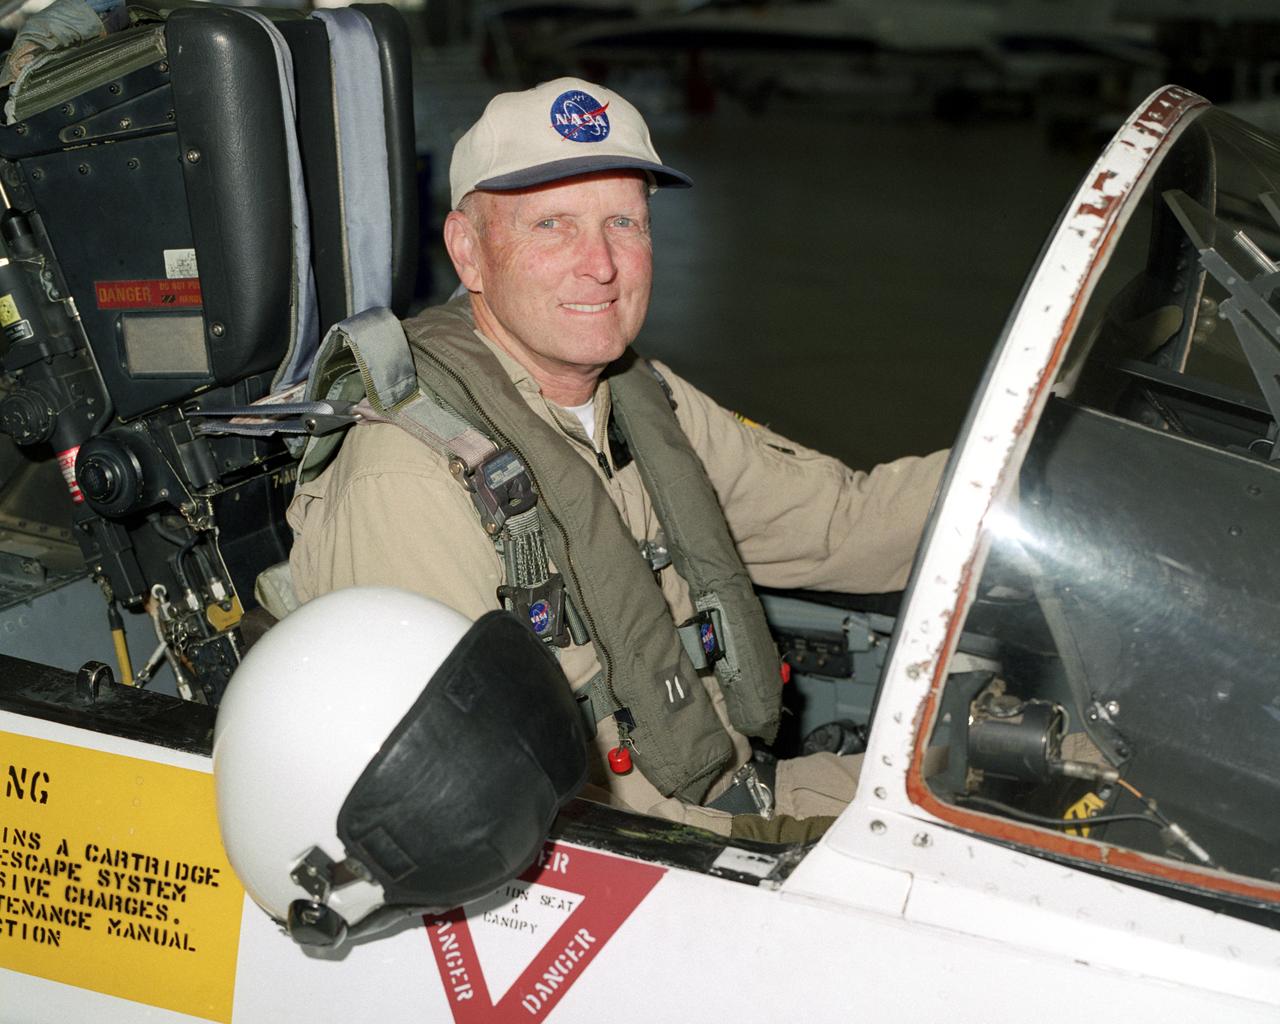
Former NASA astronaut C. Gordon Fullerton, seated in the cockpit of an F/A-18, is a research pilot at NASA's Dryden Flight Research Center, Edwards, Calif. Since transferring to Dryden in 1986, his assignments have included a variety of flight research and support activities piloting NASA's B-52 launch aircraft, the 747 Shuttle Carrier Aircraft (SCA), and other multi-engine and high performance aircraft. He flew a series of development air launches of the X-38 prototype Crew Return Vehicle and in the launches for the X-43A Hyper-X project. Fullerton also flies Dryden's DC-8 Airborne Science aircraft in support a variety of atmospheric physics, ground mapping and meteorology studies. Fullerton also was project pilot on the Propulsion Controlled Aircraft program, during which he successfully landed both a modified F-15 and an MD-11 transport with all control surfaces neutralized, using only engine thrust modulation for control. Fullerton also evaluated the flying qualities of the Russian Tu-144 supersonic transport during two flights in 1998, one of only two non-Russian pilots to fly that aircraft. With more than 15,000 hours of flying time, Fullerton has piloted 135 different types of aircraft in his career. As an astronaut, Fullerton served on the support crews for the Apollo 14, 15, 16, and 17 lunar missions. In 1977, Fullerton was on one of the two flight crews that piloted the Space Shuttle prototype Enterprise during the Approach and Landing Test Program at Dryden. Fullerton was the pilot on the STS-3 Space Shuttle orbital flight test mission in 1982, and commanded the STS-51F Spacelab 2 mission in 1985. He has logged 382 hours in space flight. In July 1988, he completed a 30-year career with the U.S. Air Force and retired as a colonel.
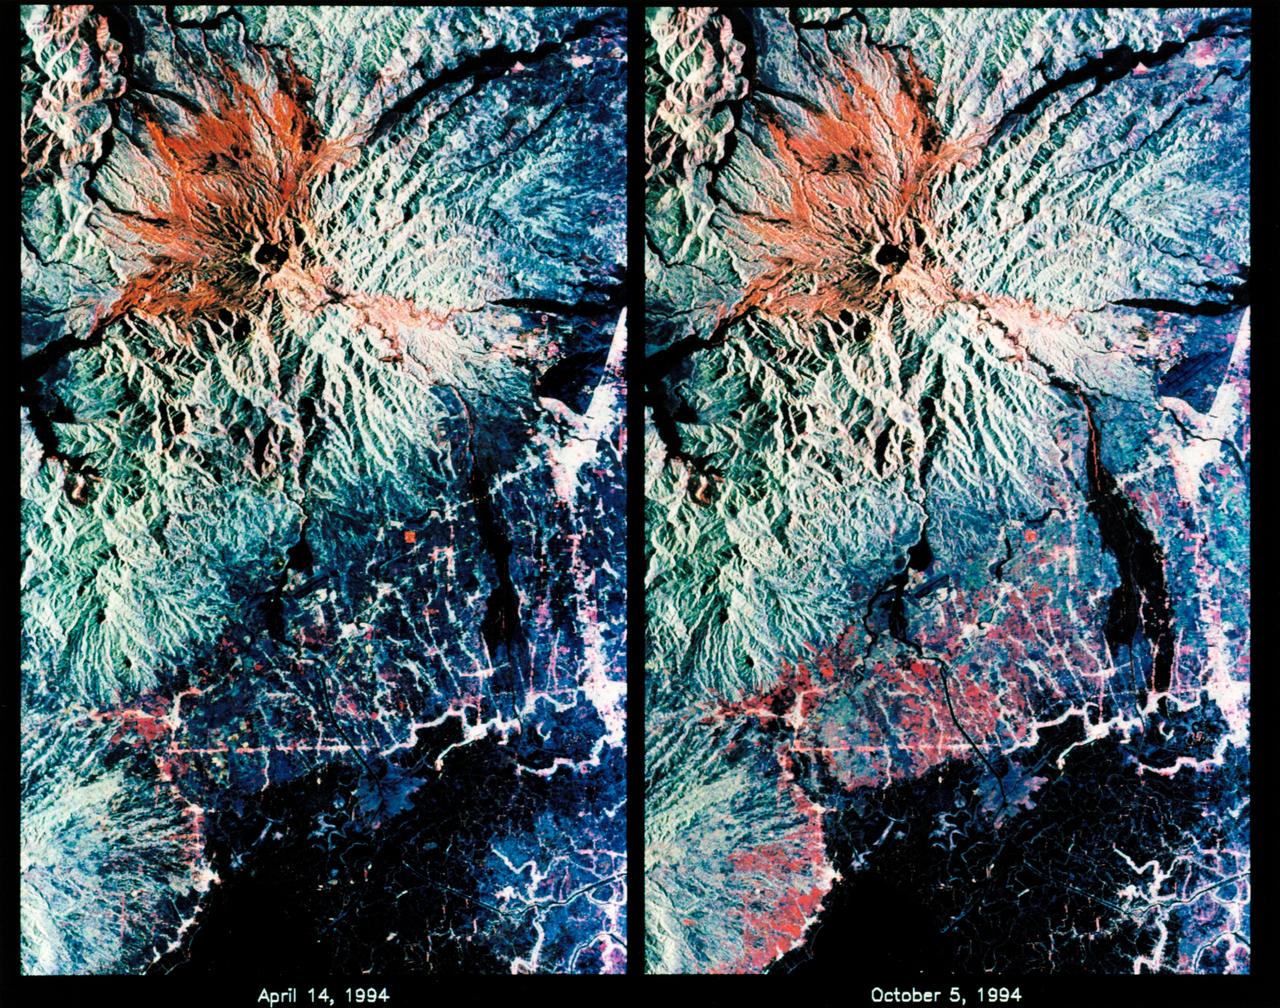
STS068-S-053 (7 October 1994) --- These are color composite radar images showing the area around Mount Pinatubo in the Philippines. The images were acquired by the Spaceborne Imaging Radar-C/X-Band Synthetic Aperture Radar (SIR-C/X-SAR) aboard the Space Shuttle Endeavour on April 14, 1994 (left image) and October 5, 1994 (right image). The images are centered at about 15 degrees north latitude and 120.5 degrees east longitude. Both images were obtained with the same viewing geometry. The color composites were made by displaying the L-Band (horizontally transmitted and received) in red; the L-Band (horizontally transmitted and vertically received) in green; and the C-Band (horizontally transmitted and vertically received) in blue. The area shown is approximately 40 by 65 kilometers (25 by 40 miles). The main volcanic crater on Mount Pinatubo produced by the June 1991 eruptions and the steep slopes on the upper flanks of the volcano are easily seen in these images. Red on the high slopes shows the distribution of the ash deposited during the 1991 eruption, which appears red because of the low cross-polarized radar returns at C and L Bands. The dark drainage's radiating away from the summit are smooth mud flows, which even three years after the eruption continue to flood the river valleys after heavy rain. Comparing the two images shows that significant changes have occurred in the intervening five months along the Pasig-Potero rivers (the dark area in the lower right of the images). Mud flows, called "lahars", that occurred during the 1994 monsoon season filled the river valleys, allowing the lahars to spread over the surrounding countryside. Three weeks before the second image was obtained, devastating lahars more than doubled the area affected in the Pasig-Potero rivers, which is clearly visible as the increase in dark area on the lower right of the images. Migration of deposition to the east (right) has affected many communities. Newly affected areas included the community of Bacolor, Pampanga, where thousands of homes were buried in meters of hot mud and rock as 80,000 people fled the lahar-stricken area. The 1991 Mount Pinatubo eruption is well known for its near-global effects on the atmosphere and short-term climate due to the large amount of sulfur dioxide that was injected into the upper atmosphere. Locally, however, the effects will most likely continue to impact surrounding areas for as long as the next 10 to 15 years. Mud flows, quite certainly, will continue to pose severe hazards to adjacent areas. Radar observations like those obtained by SIR-C/X-SAR will play a key role in monitoring these changes because of the radar's ability to see daylight or darkness and even in the worst weather conditions. Radar imaging will be particularly useful during the monsoon season, when the lahars form. Frequent imaging of these lahar fields will allow scientists to better predict when they are likely to begin flowing again and which communities might be at risk. Spaceborne Imaging Radar-C/X-Band Synthetic Aperture Radar (SIR-C/X-SAR) is part of NASA's Mission to Planet Earth. (P-44729)
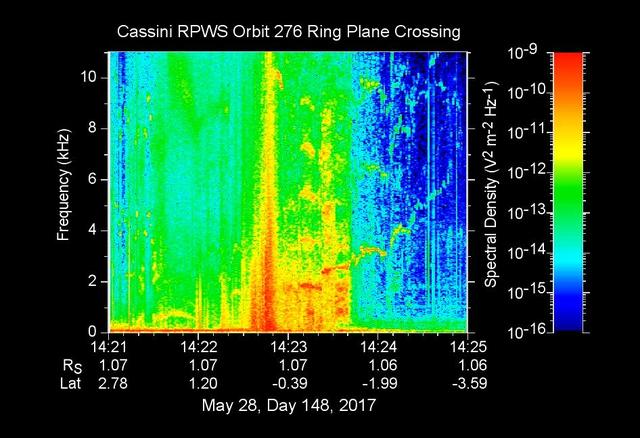
The sounds and colorful spectrogram in this still image and video represent data collected by the Radio and Plasma Wave Science, or RPWS, instrument on NASA's Cassini spacecraft, as it crossed through Saturn's D ring on May 28, 2017. This was the first of four passes through the inner edge of the D ring during the 22 orbits of Cassini's final mission phase, called the Grand Finale. During this ring plane crossing, the spacecraft was oriented so that its large high-gain antenna was used as a shield to protect more sensitive components from possible ring-particle impacts. The three 33-foot-long (10-meter-long) RPWS antennas were exposed to the particle environment during the pass. As tiny, dust-sized particles strike Cassini and the RPWS antennas, the particles are vaporized into tiny clouds of plasma, or electrically excited gas. These tiny explosions make a small electrical signal (a voltage impulse) that RPWS can detect. Researchers on the RPWS team convert the data into visible and audio formats, some like those seen here, for analysis. Ring particle hits sound like pops and cracks in the audio. Particle impacts are seen to increase in frequency in the spectrogram and in the audible pops around the time of ring crossing as indicated by the red/orange spike just before 14:23 on the x-axis. Labels on the x-axis indicate time (top line), distance from the planet's center in Saturn radii, or Rs (middle), and latitude on Saturn beneath the spacecraft (bottom). These data can be compared to those recorded during Cassini's first dive through the gap between Saturn and the D ring, on April 26. While it appeared from those earlier data that there were essentially no particles in the gap, scientists later determined the particles there are merely too small to create a voltage detectable by RPWS, but could be detected using Cassini's dust analyzer instrument. After ring plane crossing (about 14:23 onward) a series of high pitched whistles are heard. The RPWS instrument detects such tones during each of the Grand Finale orbits and the team is working to understand their source. The D ring proved to contain larger ring particles, as expected and recorded here, although the environment was determined to be relatively benign -- with less dust than other faint Saturnian rings Cassini has flown through. https://photojournal.jpl.nasa.gov/catalog/PIA21620
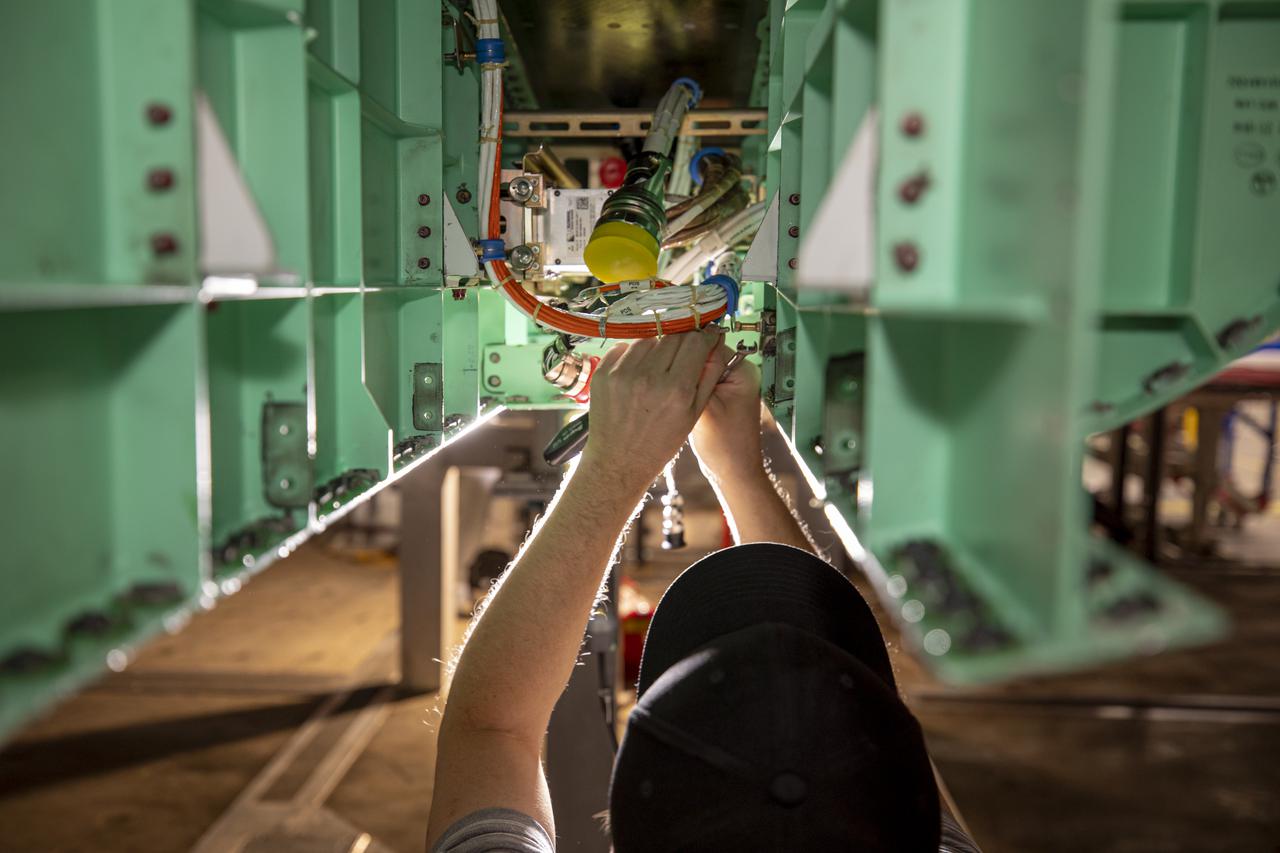
A technician is shown working on the underside of the X-59. The aircraft, under construction at Lockheed Martin Skunk Works in Palmdale, California, will fly to demonstrate the ability to fly supersonic while reducing the loud sonic boom to a quiet sonic thump. Lockheed Martin Photography By Garry Tice 1011 Lockheed Way, Palmdale, Ca. 93599 Event: SEG 450 Mid Bay - PDS Fit Check Date: 5/03/2021
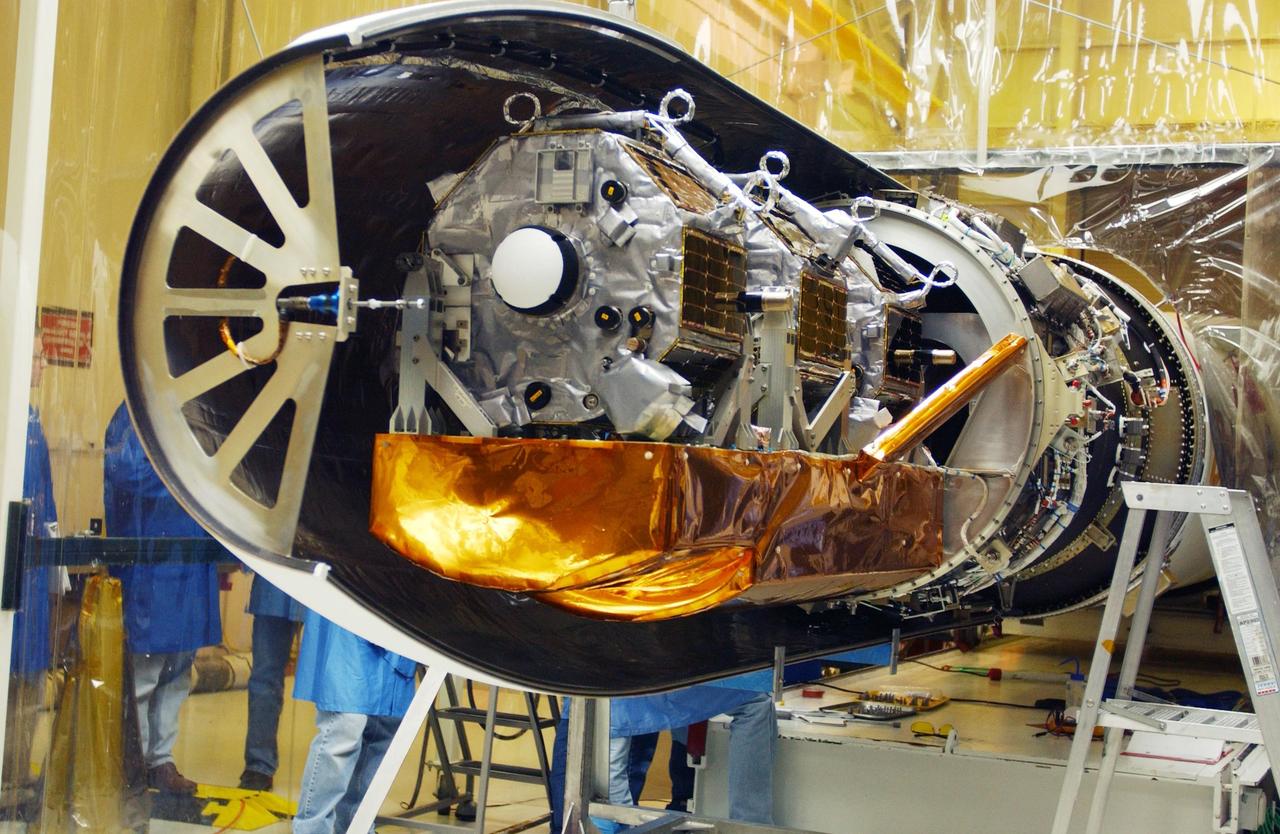
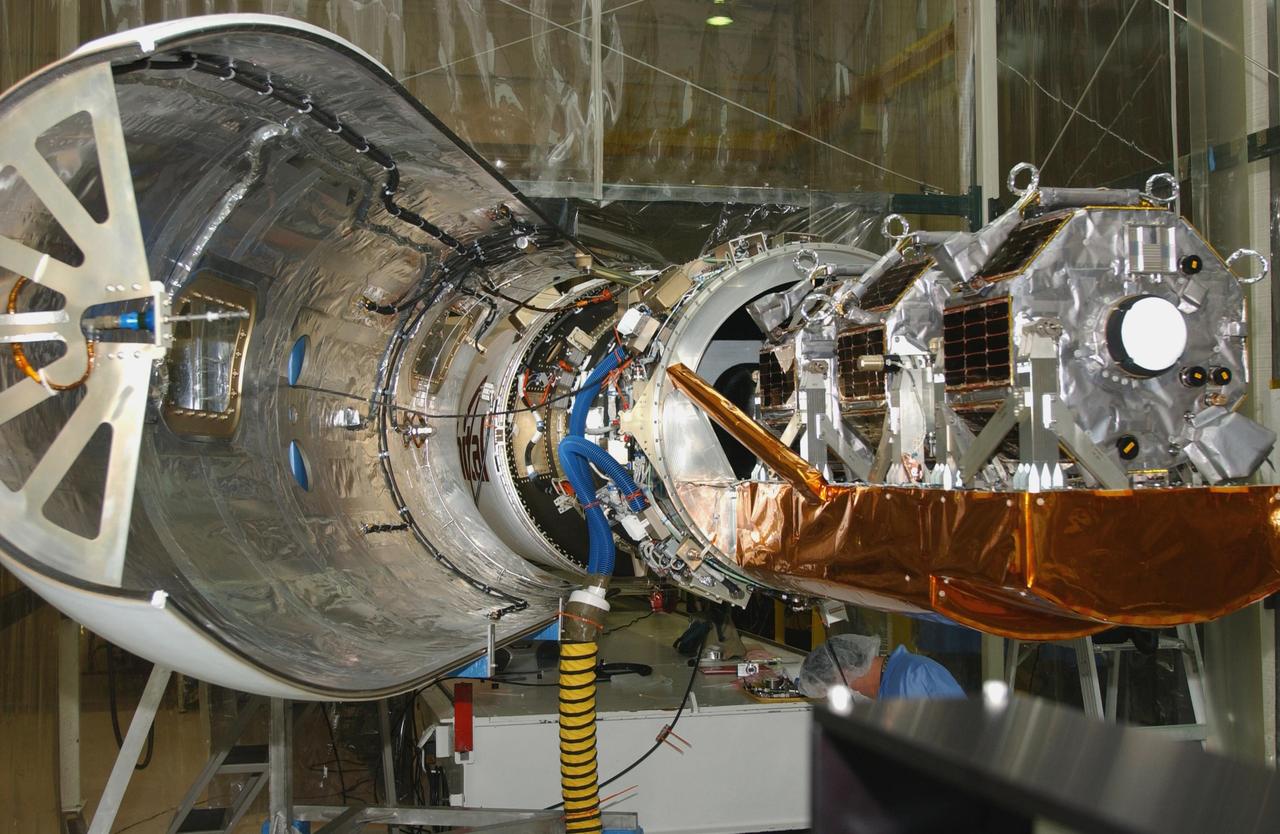
VANDENBERG AIR FORCE BASE, CALIF. -Inside Orbital Sciences’ Building 1555 at Vandenberg Air Force Base in California is the Pegasus XL launch vehicle and the Space Technology 5 (ST5) spacecraft being prepared for encapsulation before launch. The ST5, mated to Orbital Sciences' Pegasus XL launch vehicle, contains three microsatellites with miniaturized redundant components and technologies. Each will validate New Millennium Program selected technologies, such as the Cold Gas Micro-Thruster and X-Band Transponder Communication System. After deployment from the Pegasus, the micro-satellites will be positioned in a “string of pearls” constellation that demonstrates the ability to position them to perform simultaneous multi-point measurements of the magnetic field using highly sensitive magnetometers. The data will help scientists understand and map the intensity and direction of the Earth’s magnetic field, its relation to space weather events, and affects on our planet. With such missions, NASA hopes to improve scientists’ ability to accurately forecast space weather and minimize its harmful effects on space- and ground-based systems. Launch of ST5 is scheduled from the belly of an L-1011 carrier aircraft no earlier than March 14 from Vandenberg Air Force Base.
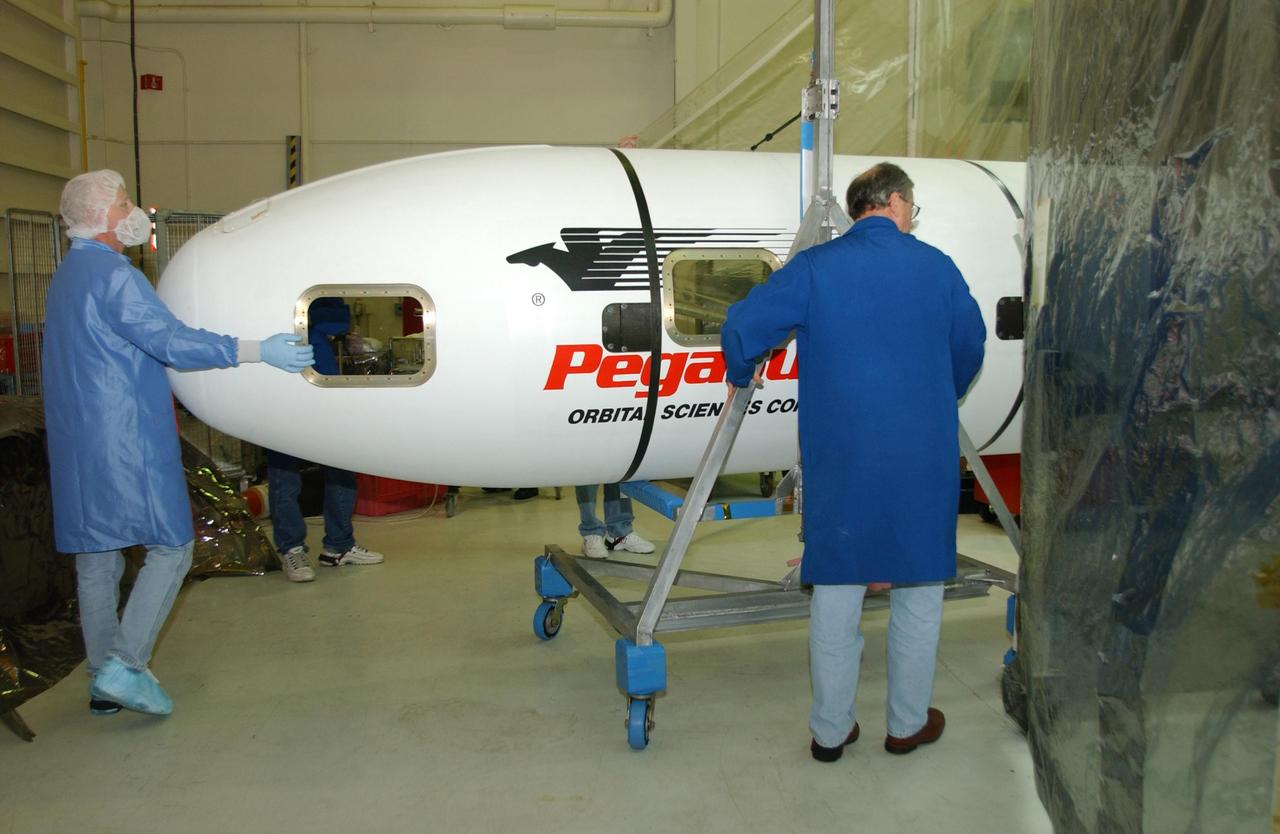
VANDENBERG AIR FORCE BASE, CALIF. - Inside Orbital Sciences’ Building 1555 at Vandenberg Air Force Base in California, workers continue the installation of the second half of the fairing around the Space Technology 5 (ST5) spacecraft. The ST5, which contains three microsatellites with miniaturized redundant components and technologies, is mated to its launch vehicle, Orbital Sciences' Pegasus XL. Each of the ST5 microsatellites will validate New Millennium Program selected technologies, such as the Cold Gas Micro-Thruster and X-Band Transponder Communication System. After deployment from the Pegasus, the micro-satellites will be positioned in a “string of pearls” constellation that demonstrates the ability to position them to perform simultaneous multi-point measurements of the magnetic field using highly sensitive magnetometers. The data will help scientists understand and map the intensity and direction of the Earth’s magnetic field, its relation to space weather events, and affects on our planet. Launch of ST5 and the Pegasus XL will be from underneath the belly of an L-1011 carrier aircraft on March 14 from Vandenberg Air Force Base.
VANDENBERG AIR FORCE BASE, CALIF. - Inside Orbital Sciences’ Building 1555 at Vandenberg Air Force Base in California, workers move the second half of the fairing into position around the Space Technology 5 (ST5) spacecraft. The ST5, which contains three microsatellites with miniaturized redundant components and technologies, is mated to its launch vehicle, Orbital Sciences' Pegasus XL. Each of the ST5 microsatellites will validate New Millennium Program selected technologies, such as the Cold Gas Micro-Thruster and X-Band Transponder Communication System. After deployment from the Pegasus, the micro-satellites will be positioned in a “string of pearls” constellation that demonstrates the ability to position them to perform simultaneous multi-point measurements of the magnetic field using highly sensitive magnetometers. The data will help scientists understand and map the intensity and direction of the Earth’s magnetic field, its relation to space weather events, and affects on our planet. Launch of ST5 and the Pegasus XL will be from underneath the belly of an L-1011 carrier aircraft on March 14 from Vandenberg Air Force Base.
CAPE CANAVERAL, Fla. - In the Remote Manipulator System Lab inside the Vehicle Assembly Building at NASA's Kennedy Space Center in Florida, this close-up shows the forward transition and X-guide restraint of the inspection boom assembly, or IBA, on space shuttle Atlantis' orbiter boom sensor system, or OBSS. The IBA is removed from the shuttle every other processing flow for a detailed inspection. After five consecutive flights, all IBA internal components are submitted to a thorough electrical checkout in the lab. The 50-foot-long OBSS attaches to the end of the shuttle’s robotic arm and supports the cameras and laser systems used to inspect the shuttle’s thermal protection system while in space. Atlantis is next slated to deliver an Integrated Cargo Carrier and Russian-built Mini Research Module to the International Space Station on the STS-132 mission. The second in a series of new pressurized components for Russia, the module will be permanently attached to the Zarya module. Three spacewalks are planned to store spare components outside the station, including six spare batteries, a boom assembly for the Ku-band antenna and spares for the Canadian Dextre robotic arm extension. A radiator, airlock and European robotic arm for the Russian Multi-purpose Laboratory Module also are payloads on the flight. Launch is targeted for May 14, 2010. Photo credit: NASA/Jack Pfaller
VANDENBERG AIR FORCE BASE, CALIF. - Inside Orbital Sciences’ Building 1555 at Vandenberg Air Force Base in California, workers adjust the first half of the fairing around the Space Technology 5 (ST5) spacecraft. The ST5, which contains three microsatellites with miniaturized redundant components and technologies, is mated to its launch vehicle, Orbital Sciences' Pegasus XL. Each of the ST5 microsatellites will validate New Millennium Program selected technologies, such as the Cold Gas Micro-Thruster and X-Band Transponder Communication System. After deployment from the Pegasus, the micro-satellites will be positioned in a “string of pearls” constellation that demonstrates the ability to position them to perform simultaneous multi-point measurements of the magnetic field using highly sensitive magnetometers. The data will help scientists understand and map the intensity and direction of the Earth’s magnetic field, its relation to space weather events, and affects on our planet. Launch of ST5 and the Pegasus XL will be from underneath the belly of an L-1011 carrier aircraft on March 14 from Vandenberg Air Force Base.
CAPE CANAVERAL, Fla. - In the Remote Manipulator System Lab inside the Vehicle Assembly Building at NASA's Kennedy Space Center in Florida, this close-up shows the electrical flight grapple fixture which will be installed in the forward transition and X-guide restraint of the inspection boom assembly, or IBA, on space shuttle Atlantis' orbiter boom sensor system, or OBSS. The IBA is removed from the shuttle every other processing flow for a detailed inspection. After five consecutive flights, all IBA internal components are submitted to a thorough electrical checkout in the lab. The 50-foot-long OBSS attaches to the end of the shuttle’s robotic arm and supports the cameras and laser systems used to inspect the shuttle’s thermal protection system while in space. Atlantis is next slated to deliver an Integrated Cargo Carrier and Russian-built Mini Research Module to the International Space Station on the STS-132 mission. The second in a series of new pressurized components for Russia, the module will be permanently attached to the Zarya module. Three spacewalks are planned to store spare components outside the station, including six spare batteries, a boom assembly for the Ku-band antenna and spares for the Canadian Dextre robotic arm extension. A radiator, airlock and European robotic arm for the Russian Multi-purpose Laboratory Module also are payloads on the flight. Launch is targeted for May 14, 2010. Photo credit: NASA/Jack Pfaller
VANDENBERG AIR FORCE BASE, CALIF. - Inside Orbital Sciences’ Building 1555 at Vandenberg Air Force Base in California, workers check the Orbital Sciences' Pegasus XL launch vehicle before encapsulation of the Space Technology 5 (ST5) spacecraft. The ST5 contains three microsatellites with miniaturized redundant components and technologies. Each will validate New Millennium Program selected technologies, such as the Cold Gas Micro-Thruster and X-Band Transponder Communication System. After deployment from the Pegasus, the micro-satellites will be positioned in a “string of pearls” constellation that demonstrates the ability to position them to perform simultaneous multi-point measurements of the magnetic field using highly sensitive magnetometers. The data will help scientists understand and map the intensity and direction of the Earth’s magnetic field, its relation to space weather events, and affects on our planet. With such missions, NASA hopes to improve scientists’ ability to accurately forecast space weather and minimize its harmful effects on space- and ground-based systems. Launch of ST5 is scheduled from the belly of an L-1011 carrier aircraft no earlier than March 14 from Vandenberg Air Force Base.
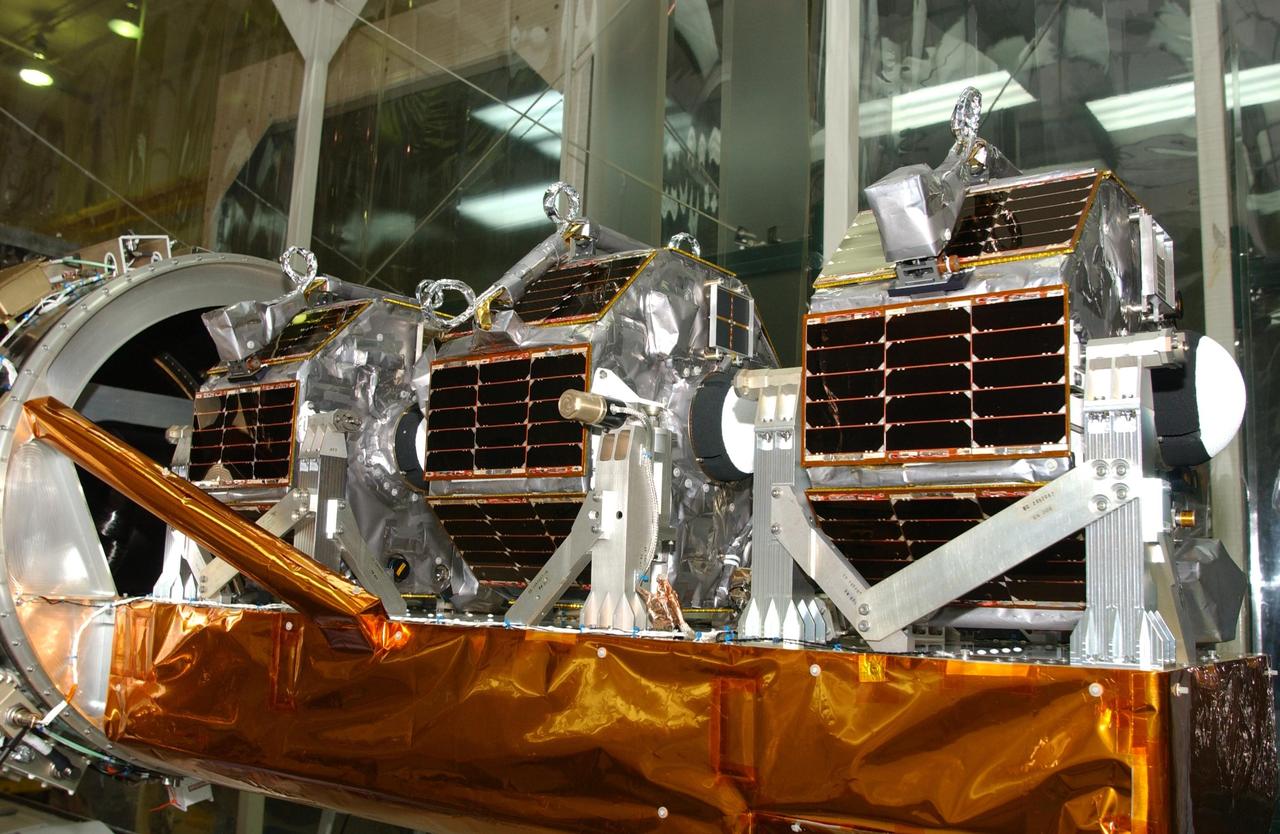
VANDENBERG AIR FORCE BASE, CALIF. - Inside Orbital Sciences’ Building 1555 at Vandenberg Air Force Base in California, this closeup shows the Space Technology 5 (ST5) spacecraft's microsatellites mounted on the payload structure. The spacecraft will be enclosed for launch. The ST5 contains three microsatellites with miniaturized redundant components and technologies. Each will validate New Millennium Program selected technologies, such as the Cold Gas Micro-Thruster and X-Band Transponder Communication System. After deployment from the Pegasus, the micro-satellites will be positioned in a “string of pearls” constellation that demonstrates the ability to position them to perform simultaneous multi-point measurements of the magnetic field using highly sensitive magnetometers. The data will help scientists understand and map the intensity and direction of the Earth’s magnetic field, its relation to space weather events, and affects on our planet. With such missions, NASA hopes to improve scientists’ ability to accurately forecast space weather and minimize its harmful effects on space- and ground-based systems. Launch of ST5 is scheduled from the belly of an L-1011 carrier aircraft no earlier than March 14 from Vandenberg Air Force Base.
VANDENBERG AIR FORCE BASE, CALIF. - Inside Orbital Sciences’ Building 1555 at Vandenberg Air Force Base in California, workers adjust the first half of the fairing being installed around the Space Technology 5 (ST5) spacecraft. The ST5 contains three microsatellites with miniaturized redundant components and technologies. Each will validate New Millennium Program selected technologies, such as the Cold Gas Micro-Thruster and X-Band Transponder Communication System. After deployment from the Pegasus, the micro-satellites will be positioned in a “string of pearls” constellation that demonstrates the ability to position them to perform simultaneous multi-point measurements of the magnetic field using highly sensitive magnetometers. The data will help scientists understand and map the intensity and direction of the Earth’s magnetic field, its relation to space weather events, and affects on our planet. With such missions, NASA hopes to improve scientists’ ability to accurately forecast space weather and minimize its harmful effects on space- and ground-based systems. Launch of ST5 is scheduled from the belly of an L-1011 carrier aircraft no earlier than March 14 from Vandenberg Air Force Base.

VANDENBERG AIR FORCE BASE, CALIF. - Inside Orbital Sciences’ Building 1555 at Vandenberg Air Force Base in California, the Pegasus XL launch vehicle stands ready for mating with the Space Technology 5 (ST5) spacecraft. The ST5 contains three microsatellites with miniaturized redundant components and technologies. Each will validate New Millennium Program selected technologies, such as the Cold Gas Micro-Thruster and X-Band Transponder Communication System. After deployment from the Pegasus, the micro-satellites will be positioned in a “string of pearls” constellation that demonstrates the ability to position them to perform simultaneous multi-point measurements of the magnetic field using highly sensitive magnetometers. The data will help scientists understand and map the intensity and direction of the Earth’s magnetic field, its relation to space weather events, and affects on our planet. With such missions, NASA hopes to improve scientists’ ability to accurately forecast space weather and minimize its harmful effects on space- and ground-based systems. Launch of ST5 is scheduled from the belly of an L-1011 carrier aircraft no earlier than March 14 from Vandenberg Air Force Base.
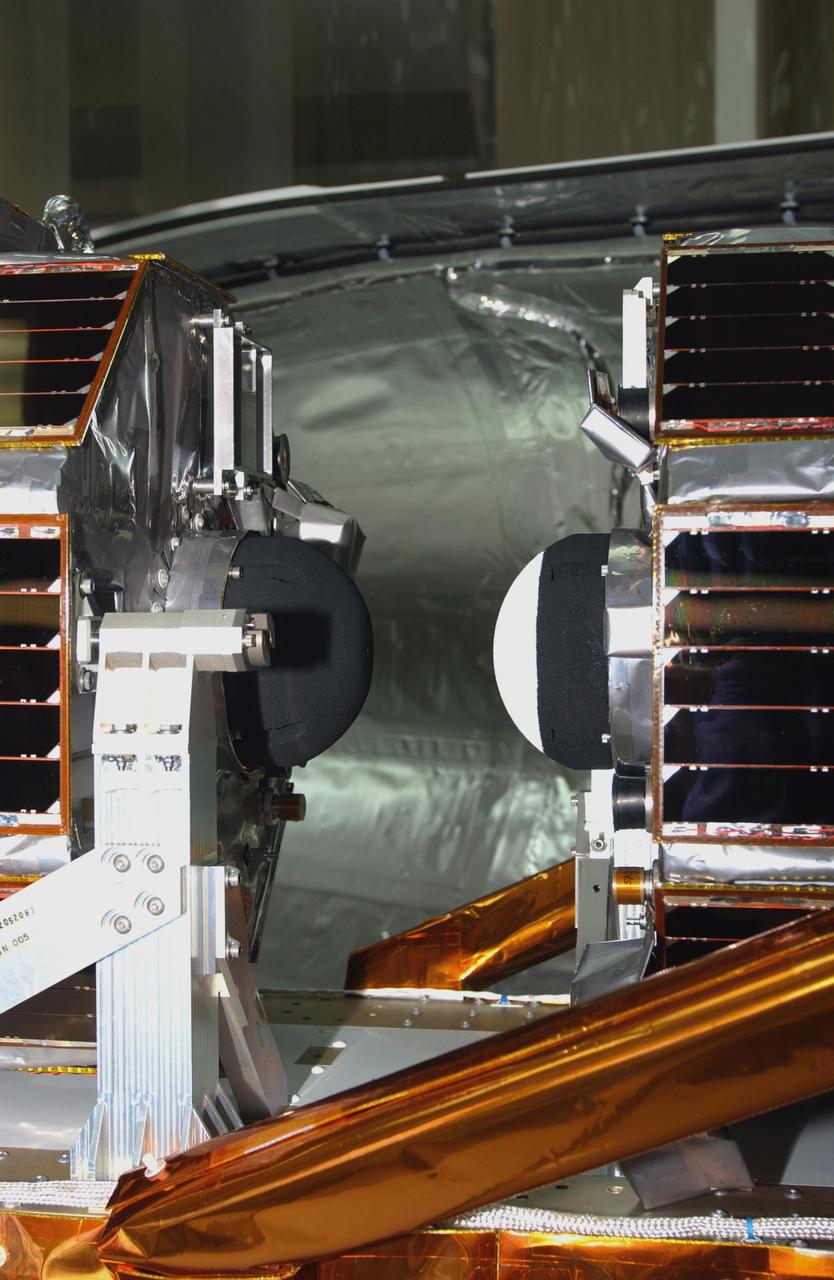
VANDENBERG AIR FORCE BASE, CALIF. - Inside Orbital Sciences’ Building 1555 at Vandenberg Air Force Base in California, this closeup shows two of the Space Technology 5 (ST5) spacecraft's microsatellites mounted on the payload structure that is mated to the Orbital Sciences' Pegasus XL launch vehicle. In the background is the fairing that will enclose the ST5 for launch. The ST5 contains three microsatellites with miniaturized redundant components and technologies. Each will validate New Millennium Program selected technologies, such as the Cold Gas Micro-Thruster and X-Band Transponder Communication System. After deployment from the Pegasus, the micro-satellites will be positioned in a “string of pearls” constellation that demonstrates the ability to position them to perform simultaneous multi-point measurements of the magnetic field using highly sensitive magnetometers. The data will help scientists understand and map the intensity and direction of the Earth’s magnetic field, its relation to space weather events, and affects on our planet. With such missions, NASA hopes to improve scientists’ ability to accurately forecast space weather and minimize its harmful effects on space- and ground-based systems. Launch of ST5 is scheduled from the belly of an L-1011 carrier aircraft no earlier than March 14 from Vandenberg Air Force Base.
VANDENBERG AIR FORCE BASE, CALIF. - Inside Orbital Sciences’ Building 1555 at Vandenberg Air Force Base in California, one half of the fairing is being installed around the Space Technology 5 (ST5) spacecraft. The ST5 contains three microsatellites with miniaturized redundant components and technologies. Each will validate New Millennium Program selected technologies, such as the Cold Gas Micro-Thruster and X-Band Transponder Communication System. After deployment from the Pegasus, the micro-satellites will be positioned in a “string of pearls” constellation that demonstrates the ability to position them to perform simultaneous multi-point measurements of the magnetic field using highly sensitive magnetometers. The data will help scientists understand and map the intensity and direction of the Earth’s magnetic field, its relation to space weather events, and affects on our planet. With such missions, NASA hopes to improve scientists’ ability to accurately forecast space weather and minimize its harmful effects on space- and ground-based systems. Launch of ST5 is scheduled from the belly of an L-1011 carrier aircraft no earlier than March 14 from Vandenberg Air Force Base.
VANDENBERG AIR FORCE BASE, CALIF. - Inside Orbital Sciences’ Building 1555 at Vandenberg Air Force Base in California, workers prepare the fairing to be installed around the Space Technology 5 (ST5) spacecraft. The ST5 contains three microsatellites with miniaturized redundant components and technologies. Each will validate New Millennium Program selected technologies, such as the Cold Gas Micro-Thruster and X-Band Transponder Communication System. After deployment from the Pegasus, the micro-satellites will be positioned in a “string of pearls” constellation that demonstrates the ability to position them to perform simultaneous multi-point measurements of the magnetic field using highly sensitive magnetometers. The data will help scientists understand and map the intensity and direction of the Earth’s magnetic field, its relation to space weather events, and affects on our planet. With such missions, NASA hopes to improve scientists’ ability to accurately forecast space weather and minimize its harmful effects on space- and ground-based systems. Launch of ST5 is scheduled from the belly of an L-1011 carrier aircraft no earlier than March 14 from Vandenberg Air Force Base.
VANDENBERG AIR FORCE BASE, CALIF. - Inside Orbital Sciences’ Building 1555 at Vandenberg Air Force Base in California, workers clean and prepare the fairing to be installed around the Space Technology 5 (ST5) spacecraft. The ST5 contains three microsatellites with miniaturized redundant components and technologies. Each will validate New Millennium Program selected technologies, such as the Cold Gas Micro-Thruster and X-Band Transponder Communication System. After deployment from the Pegasus, the micro-satellites will be positioned in a “string of pearls” constellation that demonstrates the ability to position them to perform simultaneous multi-point measurements of the magnetic field using highly sensitive magnetometers. The data will help scientists understand and map the intensity and direction of the Earth’s magnetic field, its relation to space weather events, and affects on our planet. With such missions, NASA hopes to improve scientists’ ability to accurately forecast space weather and minimize its harmful effects on space- and ground-based systems. Launch of ST5 is scheduled from the belly of an L-1011 carrier aircraft no earlier than March 14 from Vandenberg Air Force Base.
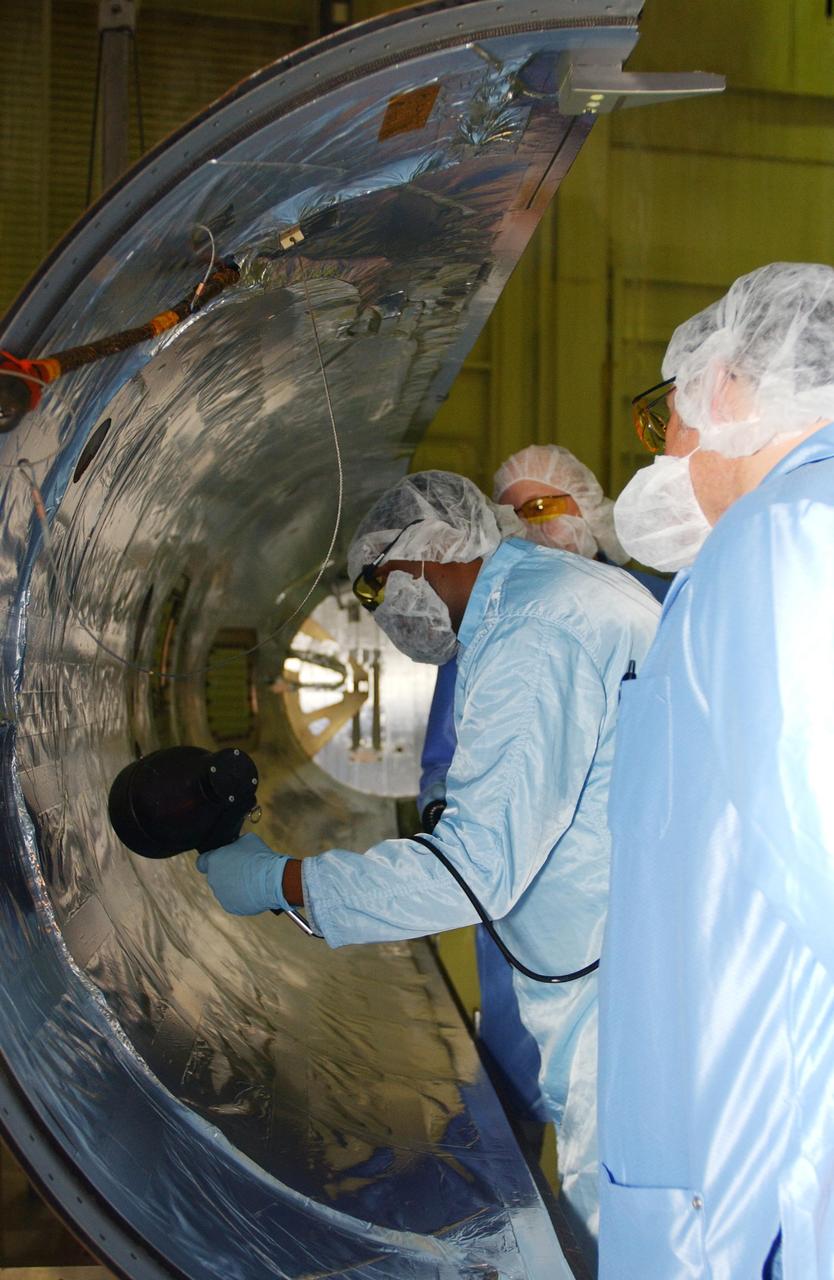
VANDENBERG AIR FORCE BASE, CALIF. - Inside Orbital Sciences’ Building 1555 at Vandenberg Air Force Base in California, workers clean and prepare the fairing to be installed around the Space Technology 5 (ST5) spacecraft. The ST5 contains three microsatellites with miniaturized redundant components and technologies. Each will validate New Millennium Program selected technologies, such as the Cold Gas Micro-Thruster and X-Band Transponder Communication System. After deployment from the Pegasus, the micro-satellites will be positioned in a “string of pearls” constellation that demonstrates the ability to position them to perform simultaneous multi-point measurements of the magnetic field using highly sensitive magnetometers. The data will help scientists understand and map the intensity and direction of the Earth’s magnetic field, its relation to space weather events, and affects on our planet. With such missions, NASA hopes to improve scientists’ ability to accurately forecast space weather and minimize its harmful effects on space- and ground-based systems. Launch of ST5 is scheduled from the belly of an L-1011 carrier aircraft no earlier than March 14 from Vandenberg Air Force Base.

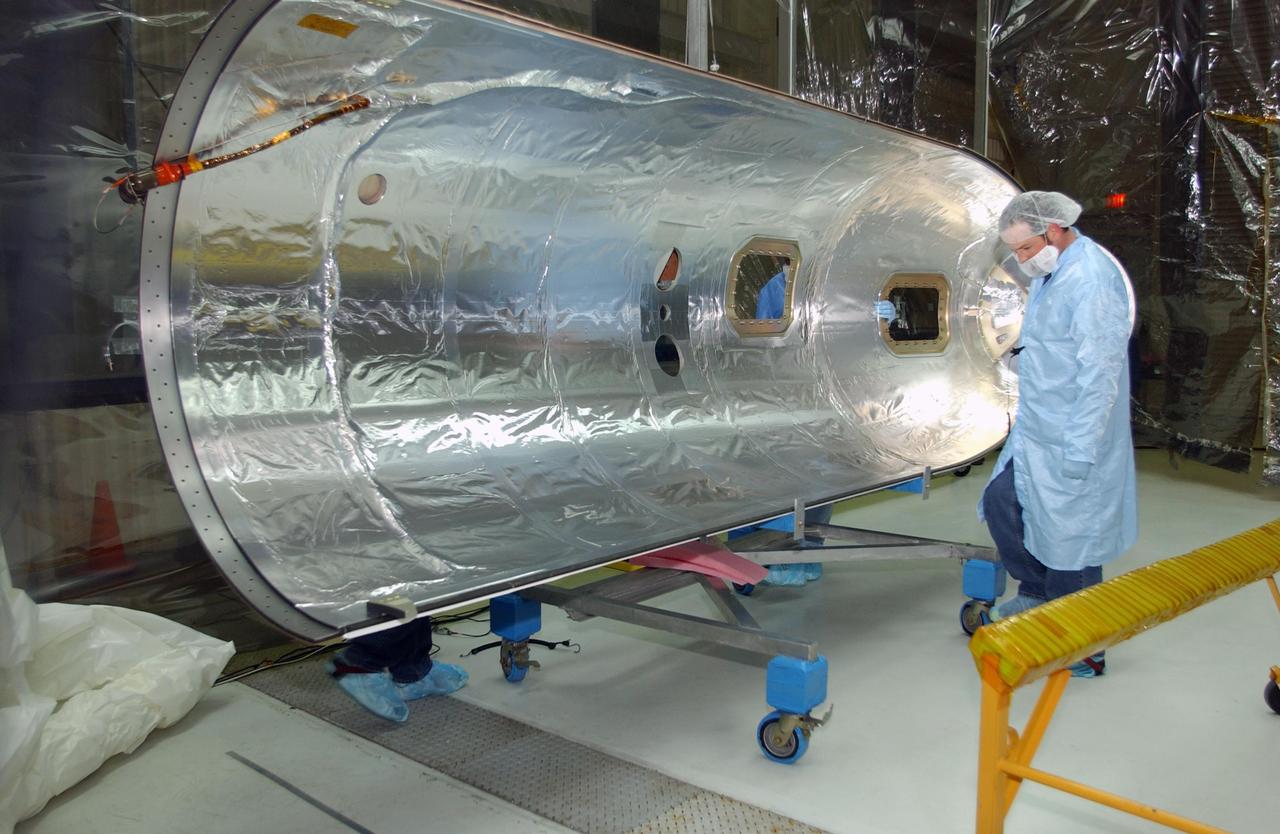
VANDENBERG AIR FORCE BASE, CALIF. - Inside Orbital Sciences’ Building 1555 at Vandenberg Air Force Base in California, workers check the placement of the second half of the fairing around the Space Technology 5 (ST5) spacecraft. The ST5, which contains three microsatellites with miniaturized redundant components and technologies, is mated to its launch vehicle, Orbital Sciences' Pegasus XL. Each of the ST5 microsatellites will validate New Millennium Program selected technologies, such as the Cold Gas Micro-Thruster and X-Band Transponder Communication System. After deployment from the Pegasus, the micro-satellites will be positioned in a “string of pearls” constellation that demonstrates the ability to position them to perform simultaneous multi-point measurements of the magnetic field using highly sensitive magnetometers. The data will help scientists understand and map the intensity and direction of the Earth’s magnetic field, its relation to space weather events, and affects on our planet. Launch of ST5 and the Pegasus XL will be from underneath the belly of an L-1011 carrier aircraft on March 14 from Vandenberg Air Force Base.
VANDENBERG AIR FORCE BASE, CALIF. - Inside Orbital Sciences’ Building 1555 at Vandenberg Air Force Base in California, workers clean and prepare the fairing to be installed around the Space Technology 5 (ST5) spacecraft. The ST5 contains three microsatellites with miniaturized redundant components and technologies. Each will validate New Millennium Program selected technologies, such as the Cold Gas Micro-Thruster and X-Band Transponder Communication System. After deployment from the Pegasus, the micro-satellites will be positioned in a “string of pearls” constellation that demonstrates the ability to position them to perform simultaneous multi-point measurements of the magnetic field using highly sensitive magnetometers. The data will help scientists understand and map the intensity and direction of the Earth’s magnetic field, its relation to space weather events, and affects on our planet. With such missions, NASA hopes to improve scientists’ ability to accurately forecast space weather and minimize its harmful effects on space- and ground-based systems. Launch of ST5 is scheduled from the belly of an L-1011 carrier aircraft no earlier than March 14 from Vandenberg Air Force Base.
VANDENBERG AIR FORCE BASE, CALIF. - Inside Orbital Sciences’ Building 1555 at Vandenberg Air Force Base in California, workers position the second half of the fairing into place around the Space Technology 5 (ST5) spacecraft. The ST5, which contains three microsatellites with miniaturized redundant components and technologies, is mated to its launch vehicle, Orbital Sciences' Pegasus XL. Each of the ST5 microsatellites will validate New Millennium Program selected technologies, such as the Cold Gas Micro-Thruster and X-Band Transponder Communication System. After deployment from the Pegasus, the micro-satellites will be positioned in a “string of pearls” constellation that demonstrates the ability to position them to perform simultaneous multi-point measurements of the magnetic field using highly sensitive magnetometers. The data will help scientists understand and map the intensity and direction of the Earth’s magnetic field, its relation to space weather events, and affects on our planet. Launch of ST5 and the Pegasus XL will be from underneath the belly of an L-1011 carrier aircraft on March 14 from Vandenberg Air Force Base.
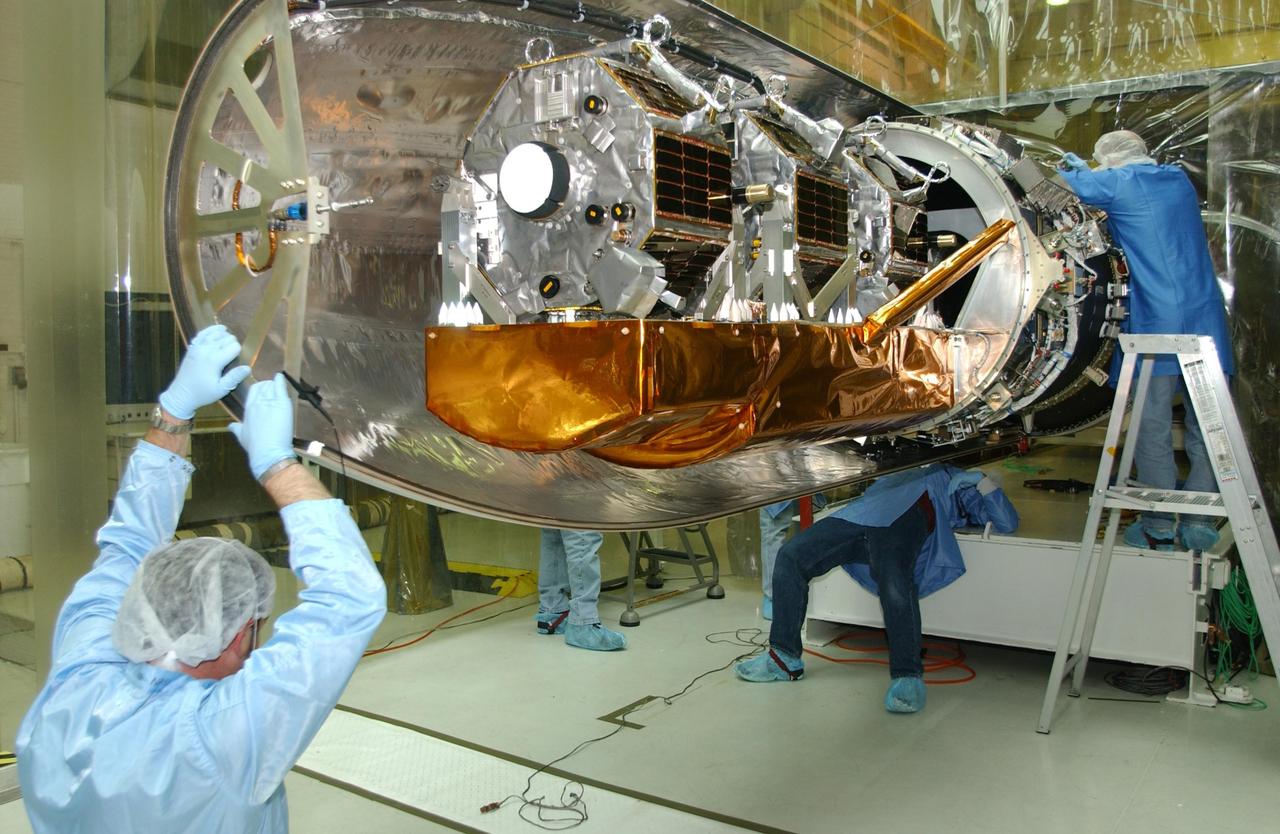
VANDENBERG AIR FORCE BASE, CALIF. - Inside Orbital Sciences’ Building 1555 at Vandenberg Air Force Base in California, a worker completes connections on the Space Technology 5 (ST5) spacecraft before enclosure. The ST5, mated to Orbital Sciences' Pegasus XL launch vehicle, contains three microsatellites with miniaturized redundant components and technologies. Each will validate New Millennium Program selected technologies, such as the Cold Gas Micro-Thruster and X-Band Transponder Communication System. After deployment from the Pegasus, the micro-satellites will be positioned in a “string of pearls” constellation that demonstrates the ability to position them to perform simultaneous multi-point measurements of the magnetic field using highly sensitive magnetometers. The data will help scientists understand and map the intensity and direction of the Earth’s magnetic field, its relation to space weather events, and affects on our planet. With such missions, NASA hopes to improve scientists’ ability to accurately forecast space weather and minimize its harmful effects on space- and ground-based systems. Launch of ST5 is scheduled from the belly of an L-1011 carrier aircraft no earlier than March 14 from Vandenberg Air Force Base.
VANDENBERG AIR FORCE BASE, CALIF. - Inside Orbital Sciences’ Building 1555 at Vandenberg Air Force Base in California, the Pegasus XL launch vehicle stands ready for mating with the Space Technology 5 (ST5) spacecraft. The ST5 contains three microsatellites with miniaturized redundant components and technologies. Each will validate New Millennium Program selected technologies, such as the Cold Gas Micro-Thruster and X-Band Transponder Communication System. After deployment from the Pegasus, the micro-satellites will be positioned in a “string of pearls” constellation that demonstrates the ability to position them to perform simultaneous multi-point measurements of the magnetic field using highly sensitive magnetometers. The data will help scientists understand and map the intensity and direction of the Earth’s magnetic field, its relation to space weather events, and affects on our planet. With such missions, NASA hopes to improve scientists’ ability to accurately forecast space weather and minimize its harmful effects on space- and ground-based systems. Launch of ST5 is scheduled from the belly of an L-1011 carrier aircraft no earlier than March 14 from Vandenberg Air Force Base.
VANDENBERG AIR FORCE BASE, CALIF. - Inside Orbital Sciences’ Building 1555 at Vandenberg Air Force Base in California, the Space Technology 5 (ST5) spacecraft waits for encapsulation after mating with the Orbital Sciences' Pegasus XL launch vehicle. The ST5 contains three microsatellites with miniaturized redundant components and technologies. Each will validate New Millennium Program selected technologies, such as the Cold Gas Micro-Thruster and X-Band Transponder Communication System. After deployment from the Pegasus, the micro-satellites will be positioned in a “string of pearls” constellation that demonstrates the ability to position them to perform simultaneous multi-point measurements of the magnetic field using highly sensitive magnetometers. The data will help scientists understand and map the intensity and direction of the Earth’s magnetic field, its relation to space weather events, and affects on our planet. With such missions, NASA hopes to improve scientists’ ability to accurately forecast space weather and minimize its harmful effects on space- and ground-based systems. Launch of ST5 is scheduled from the belly of an L-1011 carrier aircraft no earlier than March 14 from Vandenberg Air Force Base.
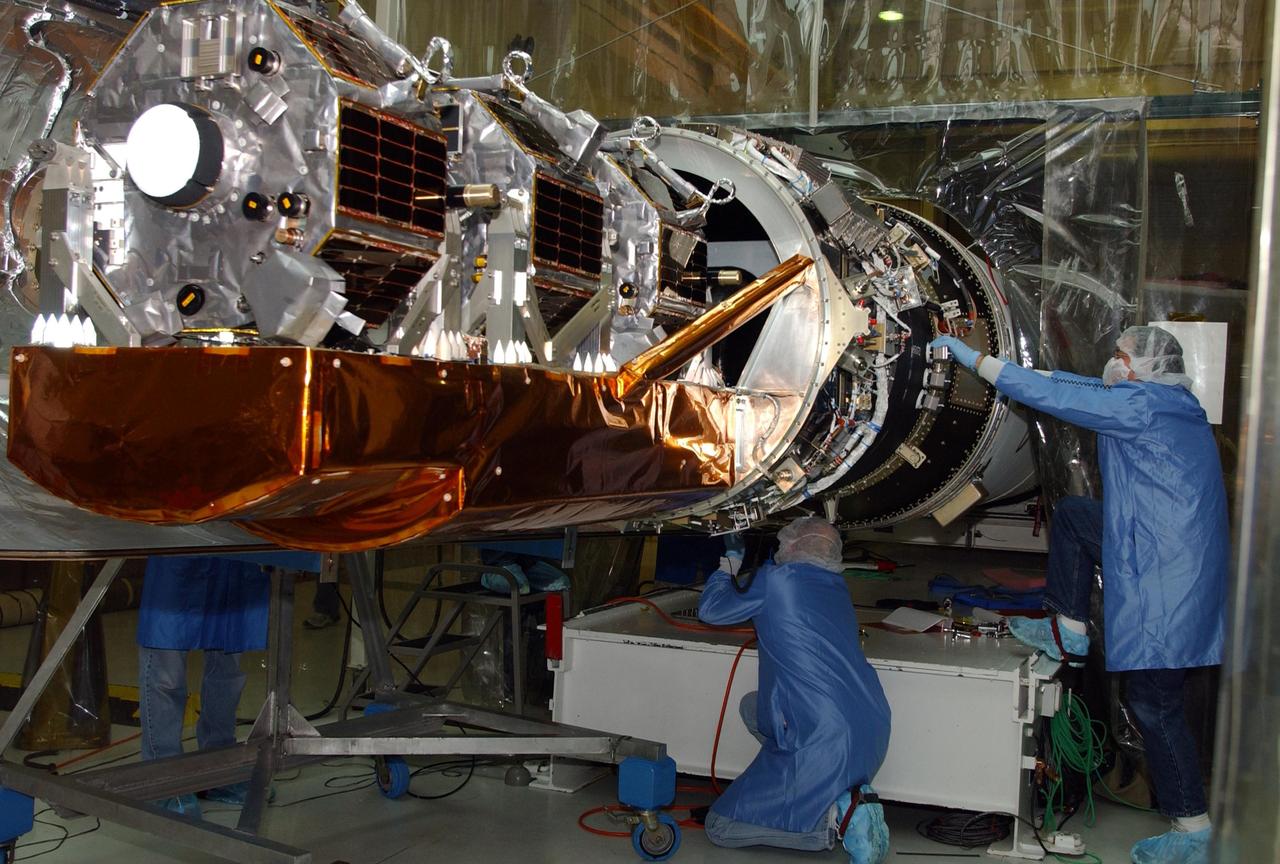
VANDENBERG AIR FORCE BASE, CALIF. -Inside Orbital Sciences’ Building 1555 at Vandenberg Air Force Base in California, a worker checks connections on the Space Technology 5 (ST5) spacecraft before encapsulation with the fairing. The ST5, mated to Orbital Sciences' Pegasus XL launch vehicle, contains three microsatellites with miniaturized redundant components and technologies. Each will validate New Millennium Program selected technologies, such as the Cold Gas Micro-Thruster and X-Band Transponder Communication System. After deployment from the Pegasus, the micro-satellites will be positioned in a “string of pearls” constellation that demonstrates the ability to position them to perform simultaneous multi-point measurements of the magnetic field using highly sensitive magnetometers. The data will help scientists understand and map the intensity and direction of the Earth’s magnetic field, its relation to space weather events, and affects on our planet. With such missions, NASA hopes to improve scientists’ ability to accurately forecast space weather and minimize its harmful effects on space- and ground-based systems. Launch of ST5 is scheduled from the belly of an L-1011 carrier aircraft no earlier than March 14 from Vandenberg Air Force Base.
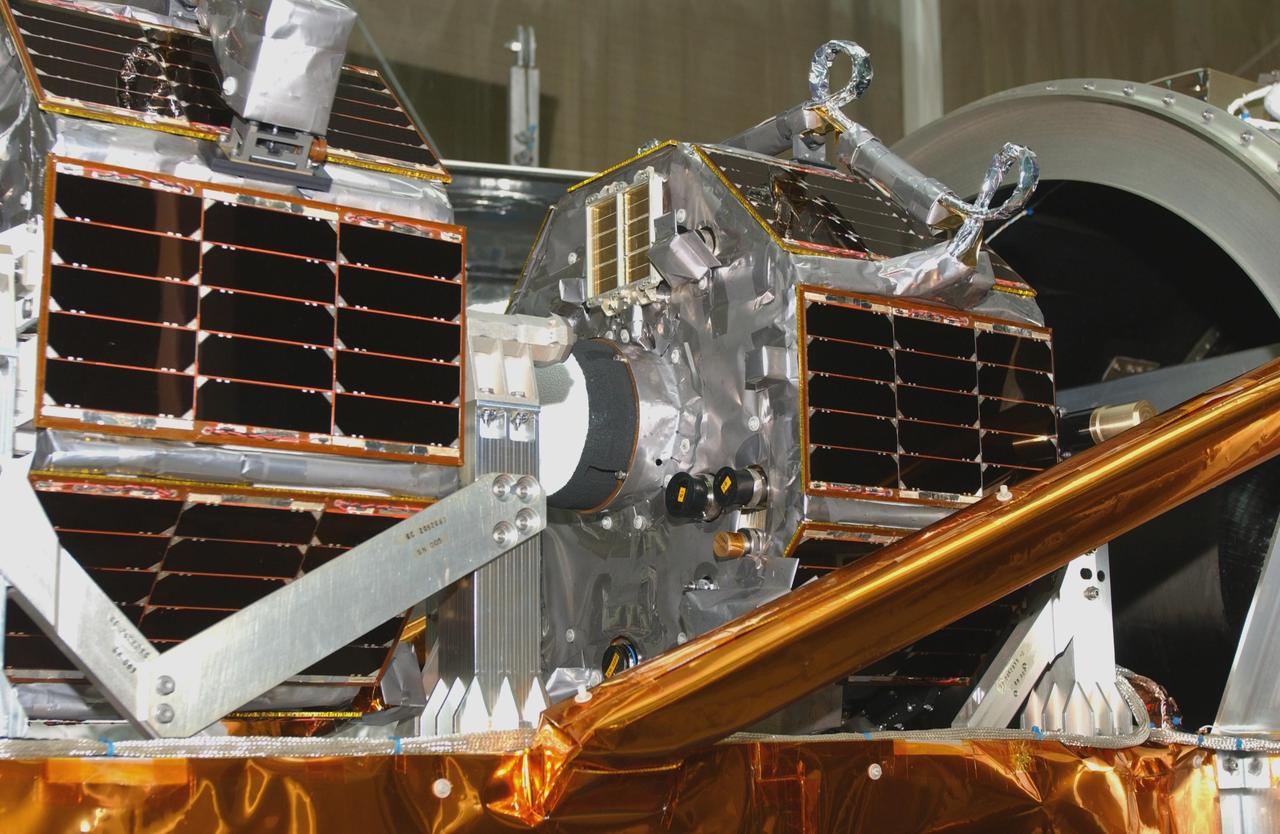
VANDENBERG AIR FORCE BASE, CALIF. - Inside Orbital Sciences’ Building 1555 at Vandenberg Air Force Base in California, this photo shows two of the Space Technology 5 (ST5) spacecraft's microsatellites mounted on the payload structure that is mated to the Orbital Sciences' Pegasus XL launch vehicle. The ST5 contains three microsatellites with miniaturized redundant components and technologies. Each will validate New Millennium Program selected technologies, such as the Cold Gas Micro-Thruster and X-Band Transponder Communication System. After deployment from the Pegasus, the micro-satellites will be positioned in a “string of pearls” constellation that demonstrates the ability to position them to perform simultaneous multi-point measurements of the magnetic field using highly sensitive magnetometers. The data will help scientists understand and map the intensity and direction of the Earth’s magnetic field, its relation to space weather events, and affects on our planet. With such missions, NASA hopes to improve scientists’ ability to accurately forecast space weather and minimize its harmful effects on space- and ground-based systems. Launch of ST5 is scheduled from the belly of an L-1011 carrier aircraft no earlier than March 14 from Vandenberg Air Force Base.
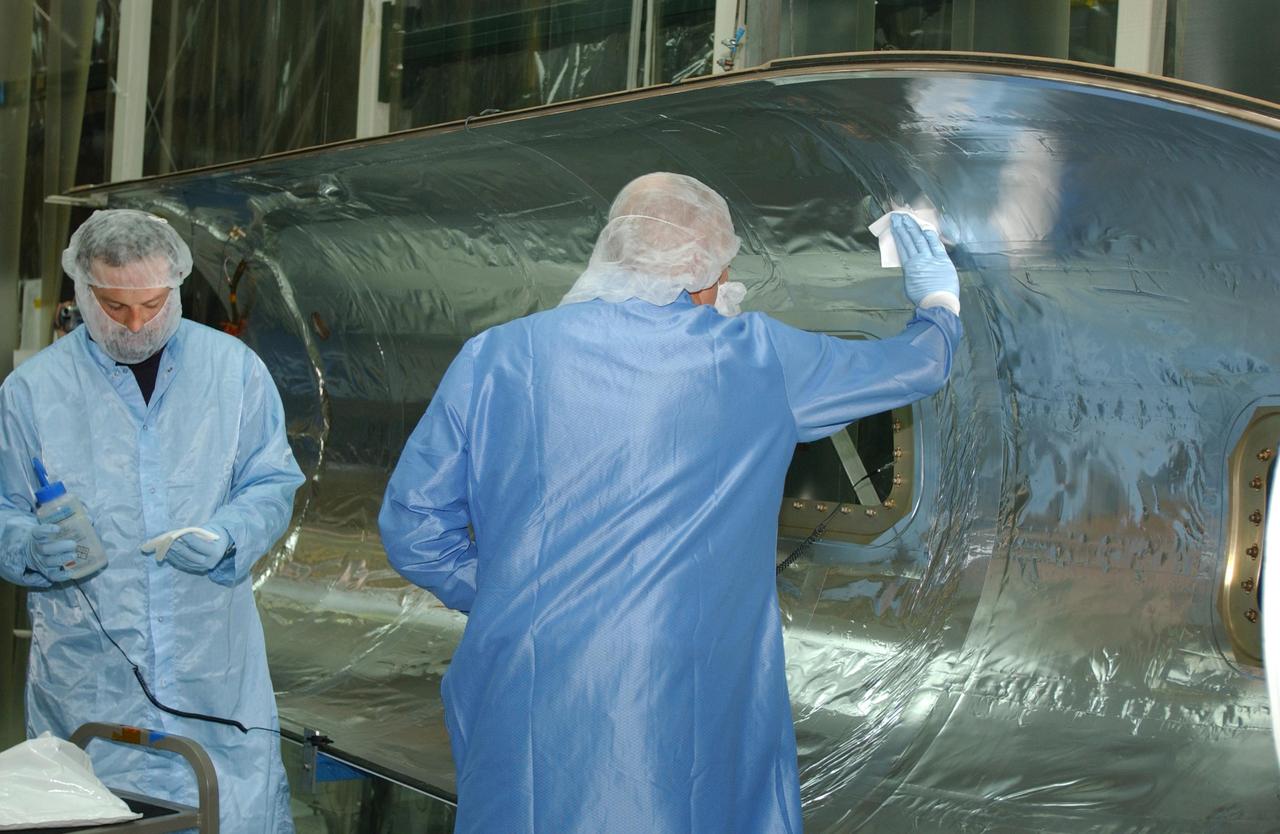
VANDENBERG AIR FORCE BASE, CALIF. - Inside Orbital Sciences’ Building 1555 at Vandenberg Air Force Base in California, workers clean and prepare the fairing to be installed around the Space Technology 5 (ST5) spacecraft. The ST5 contains three microsatellites with miniaturized redundant components and technologies. Each will validate New Millennium Program selected technologies, such as the Cold Gas Micro-Thruster and X-Band Transponder Communication System. After deployment from the Pegasus, the micro-satellites will be positioned in a “string of pearls” constellation that demonstrates the ability to position them to perform simultaneous multi-point measurements of the magnetic field using highly sensitive magnetometers. The data will help scientists understand and map the intensity and direction of the Earth’s magnetic field, its relation to space weather events, and affects on our planet. With such missions, NASA hopes to improve scientists’ ability to accurately forecast space weather and minimize its harmful effects on space- and ground-based systems. Launch of ST5 is scheduled from the belly of an L-1011 carrier aircraft no earlier than March 14 from Vandenberg Air Force Base.
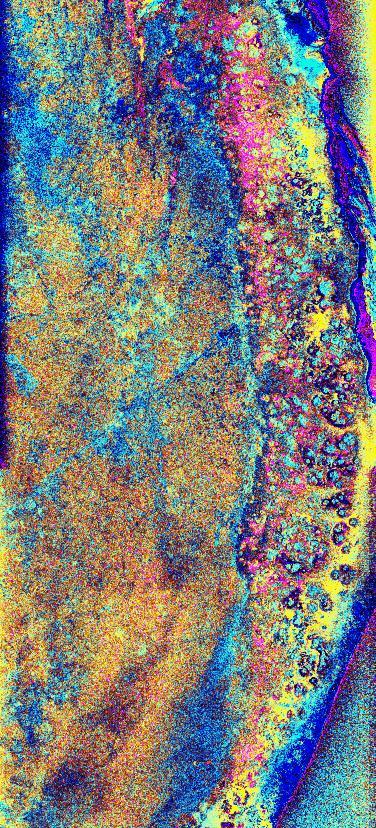
This is a digital elevation model that was geometrically coded directly onto an X-band seasonal change image of the Oetztal supersite in Austria. The image is centered at 46.82 degrees north latitude and 10.79 degrees east longitude. This image is located in the Central Alps at the border between Switzerland, Italy and Austria, 50 kilometers (31 miles) southwest of Innsbruck. It was acquired by the Spaceborne Imaging Radar-C/X-band Synthetic Aperture aboard the space shuttle Endeavour on April 14, 1994 and on October 5, 1994. It was produced by combining data from these two different data sets. Data obtained in April is green; data obtained in October appears in red and blue, and was used as an enhancement based on the ratio of the two data sets. Areas with a decrease in backscatter from April to October appear in light blue (cyan), such as the large Gepatschferner glacier seen at the left of the image center, and most of the other glaciers in this view. A light blue hue is also visible at the east border of the dark blue Lake Reschensee at the upper left side. This shows a significant rise in the water level. Magenta represents areas with an increase of backscatter from April 10 to October 5. Yellow indicates areas with high radar signal response during both passes, such as the mountain slopes facing the radar. Low radar backscatter signals refer to smooth surface (lakes) or radar grazing areas to radar shadow areas, seen in the southeast slopes. The area is approximately 29 kilometers by 21 kilometers (18 miles by 13.5 miles). The summit of the main peaks reaches elevations of 3,500 to 3,768 meters (xx feet to xx feet) above sea level. The test site's core area is the glacier region of Venter Valley, which is one of the most intensively studied areas for glacier research in the world. Research in Venter Valley (below center) includes studies of glacier dynamics, glacier-climate regions, snowpack conditions and glacier hydrology. About 25 percent of the core test site is covered by glaciers. Corner reflectors are set up for calibration. Five corner reflectors can be seen on the Gepatschferner and two can be seen on the Vernagtferner. http://photojournal.jpl.nasa.gov/catalog/PIA01760
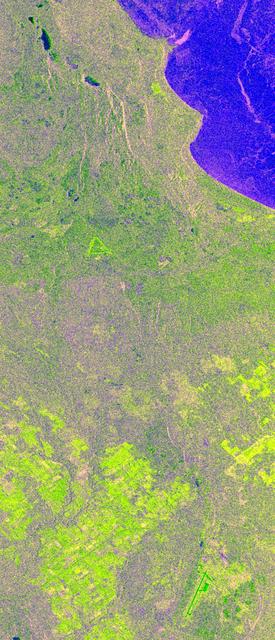
This is an X-band image of seasonal changes at the ecological test site of Raco, Michigan, located south of Whitefish Bay on Lake Superior. The image is centered at about 46 degrees north latitude and 85 degrees west longitude. This image was acquired by the X-band Synthetic Aperture Radar onboard the space shuttle Endeavour on April 10th, 1994, and on October 1, 1994. The areas shown in red correspond to the April 10th data; the areas in blue correspond to data acquired on October 1, 1994; green indicates the ratio of data acquired on April 10 and October 1, 1994. The area shown is 22.7 kilometers by 53 kilometers (14 miles by 33 miles). Lake Superior in the upper right was frozen in April and had small waves (ripples) on its surface in October. The land area contains mostly forests and, to a lesser extent, agricultural regions. In April the area was covered in wet snow. By October, there agricultural areas were covered with grass. Vegetation and soils were moist due to rainfalls three days before the data was acquired on October 1, 1994. The bright light green/yellow tones in the lower half of the image show the stronger reflections of the snow-covered agricultural fields. The pinkish color corresponds to the coniferous and deciduous forests. The green area represents red pines. These trees are smaller than the surrounding forest cover and allow more radar penetration. The area is green because the radar is sensing the surface, which undergoes great change from snow to grass and fern undergrowth between April and October. The bright green triangle in the upper half of the image is an old airstrip, while the modern airport can be seen on the bottom right side of the image. The Raco site is an important location for monitoring seasonal changes and future global change because it is situated at the ecological transition zone between the boreal forests and the northern temperate forests. This transitional zone is expected to be ecologically sensitive to anticipated global changes resulting from climatic warming. Baseline studies of vegetation are essential in monitoring these expected changes. http://photojournal.jpl.nasa.gov/catalog/PIA01734
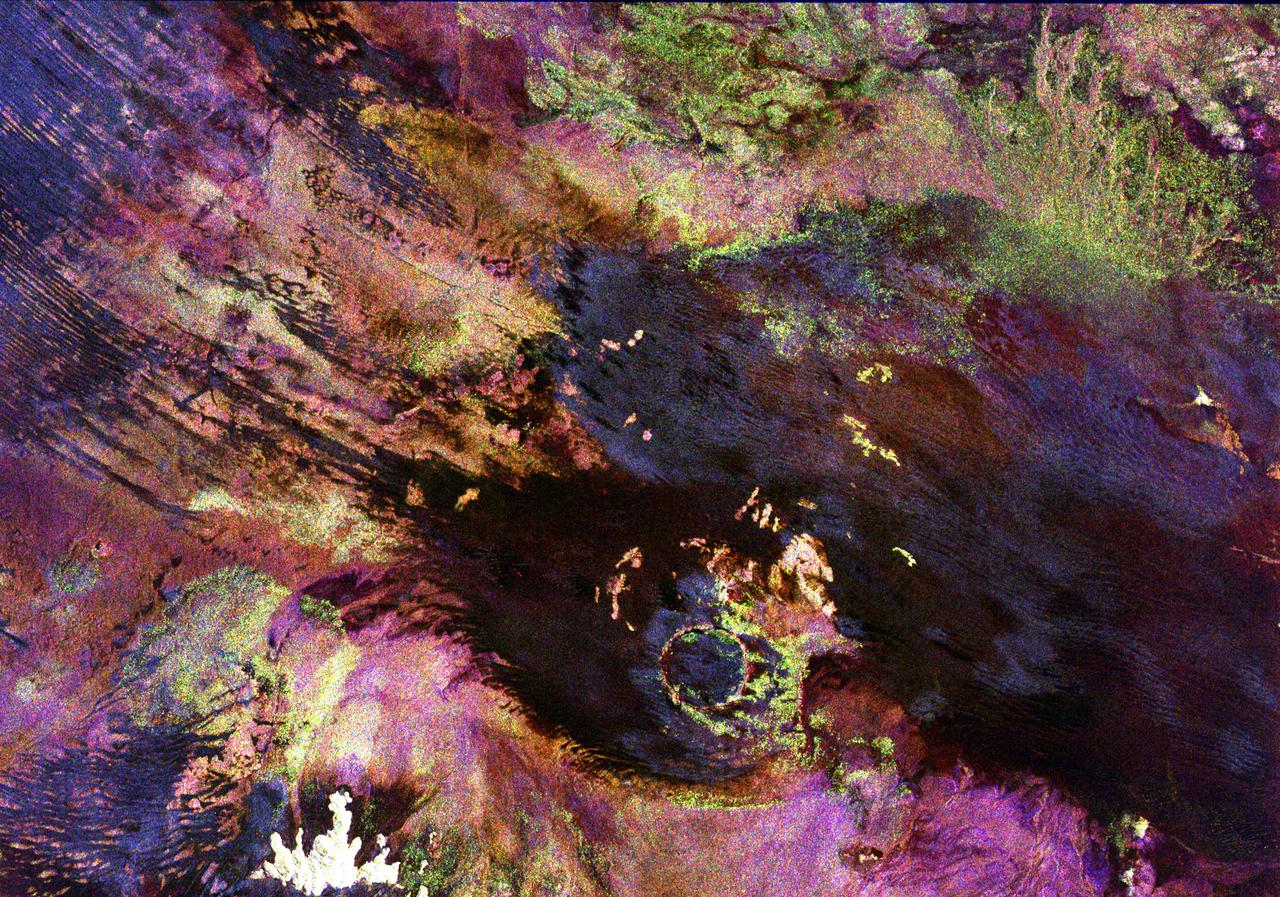
This space radar image shows the Roter Kamm impact crater in southwest Namibia. The crater rim is seen in the lower center of the image as a radar-bright, circular feature. Geologists believe the crater was formed by a meteorite that collided with Earth approximately 5 million years ago. The data were acquired by the Spaceborne Imaging Radar-C/X-Band Synthetic Aperture Radar (SIR-C/X-SAR) instrument onboard space shuttle Endeavour on April 14, 1994. The area is located at 27.8 degrees south latitude and 16.2 degrees east longitude in southern Africa. The colors in this image were obtained using the following radar channels: red represents the L-band (horizontally transmitted and received); green represents the L-band (horizontally transmitted and vertically received); and blue represents the C-band (horizontally transmitted and vertically received). The area shown is approximately 25.5 kilometers (15.8 miles) by 36.4 kilometers (22.5 miles), with north toward the lower right. The bright white irregular feature in the lower left corner is a small hill of exposed rock outcrop. Roter Kamm is a moderate sized impact crater, 2.5 kilometers (1.5 miles) in diameter rim to rim, and is 130 meters (400 feet) deep. However, its original floor is covered by sand deposits at least 100 meters (300 feet) thick. In a conventional aerial photograph, the brightly colored surfaces immediately surrounding the crater cannot be seen because they are covered by sand. The faint blue surfaces adjacent to the rim may indicate the presence of a layer of rocks ejected from the crater during the impact. The darkest areas are thick windblown sand deposits which form dunes and sand sheets. The sand surface is smooth relative to the surrounding granite and limestone rock outcrops and appears dark in radar image. The green tones are related primarily to larger vegetation growing on sand soil, and the reddish tones are associated with thinly mantled limestone outcrops. Studies of impact craters on the surface of the Earth help geologists understand the role of the impact process in the Earth's evolution, including effects on the atmosphere and on biological evolution. http://photojournal.jpl.nasa.gov/catalog/PIA00503
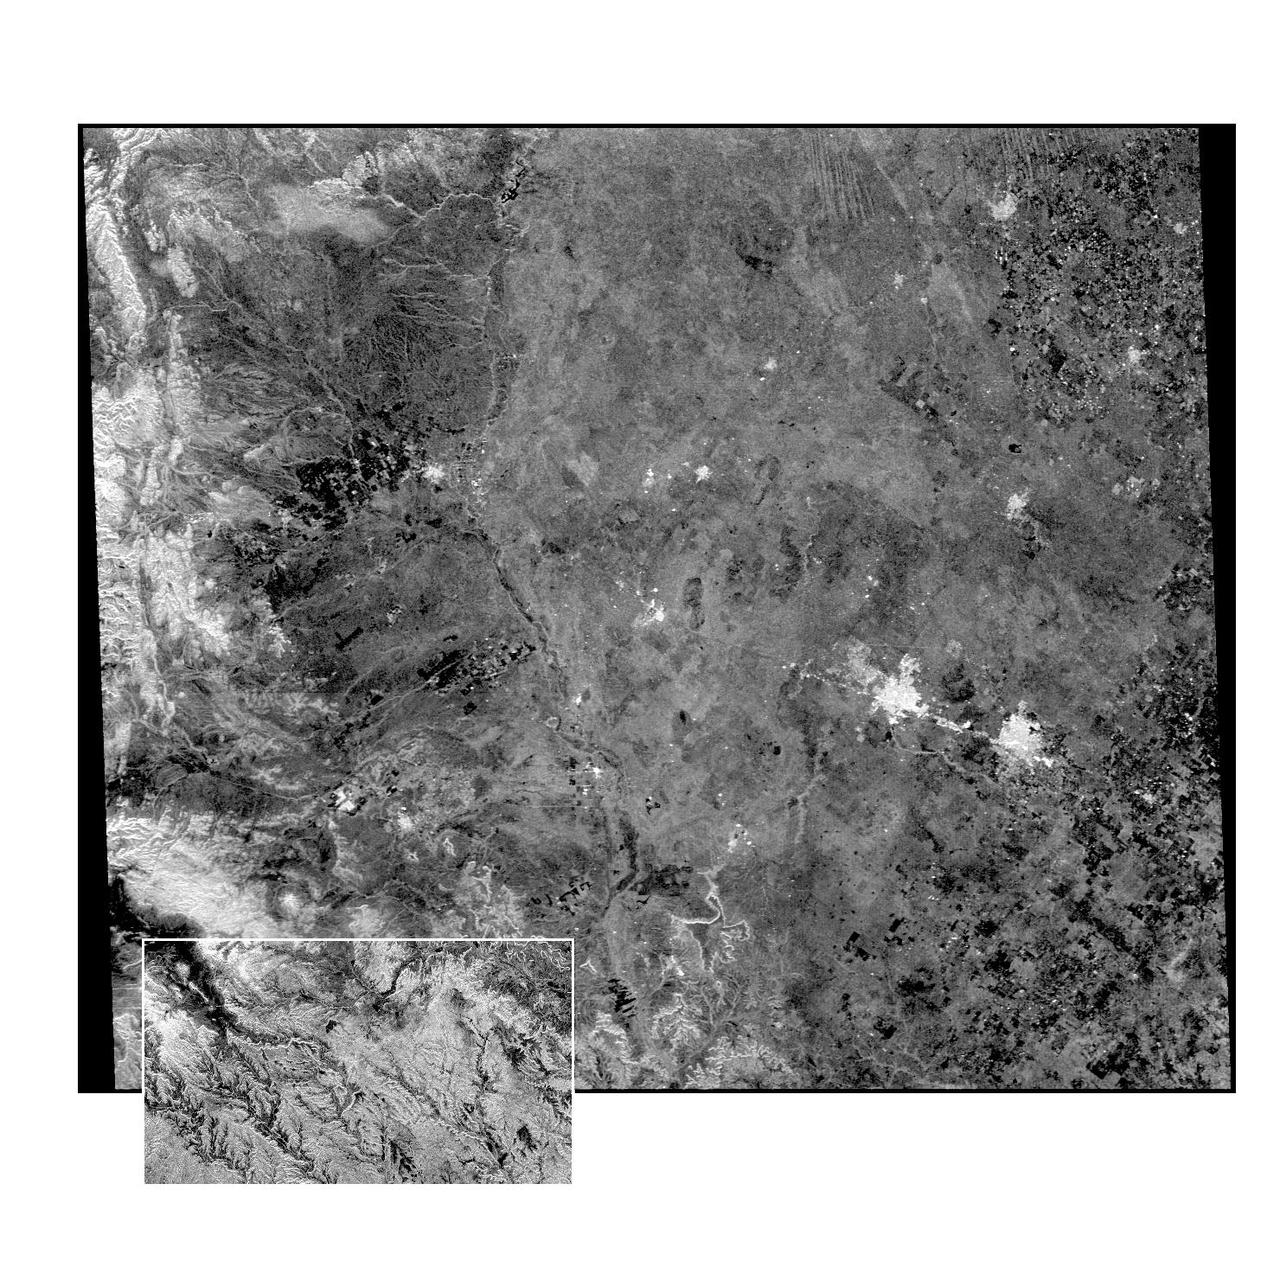
This radar image of the Midland/Odessa region of West Texas, demonstrates an experimental technique, called ScanSAR, that allows scientists to rapidly image large areas of the Earth's surface. The large image covers an area 245 kilometers by 225 kilometers (152 miles by 139 miles). It was obtained by the Spaceborne Imaging Radar-C/X-Band Synthetic Aperture Radar (SIR-C/X-SAR) flying aboard the space shuttle Endeavour on October 5, 1994. The smaller inset image is a standard SIR-C image showing a portion of the same area, 100 kilometers by 57 kilometers (62 miles by 35 miles) and was taken during the first flight of SIR-C on April 14, 1994. The bright spots on the right side of the image are the cities of Odessa (left) and Midland (right), Texas. The Pecos River runs from the top center to the bottom center of the image. Along the left side of the image are, from top to bottom, parts of the Guadalupe, Davis and Santiago Mountains. North is toward the upper right. Unlike conventional radar imaging, in which a radar continuously illuminates a single ground swath as the space shuttle passes over the terrain, a Scansar radar illuminates several adjacent ground swaths almost simultaneously, by "scanning" the radar beam across a large area in a rapid sequence. The adjacent swaths, typically about 50 km (31 miles) wide, are then merged during ground processing to produce a single large scene. Illumination for this L-band scene is from the top of the image. The beams were scanned from the top of the scene to the bottom, as the shuttle flew from left to right. This scene was acquired in about 30 seconds. A normal SIR-C image is acquired in about 13 seconds. The ScanSAR mode will likely be used on future radar sensors to construct regional and possibly global radar images and topographic maps. The ScanSAR processor is being designed for 1996 implementation at NASA's Alaska SAR Facility, located at the University of Alaska Fairbanks, and will produce digital images from the forthcoming Canadian RADARSAT satellite. http://photojournal.jpl.nasa.gov/catalog/PIA01787
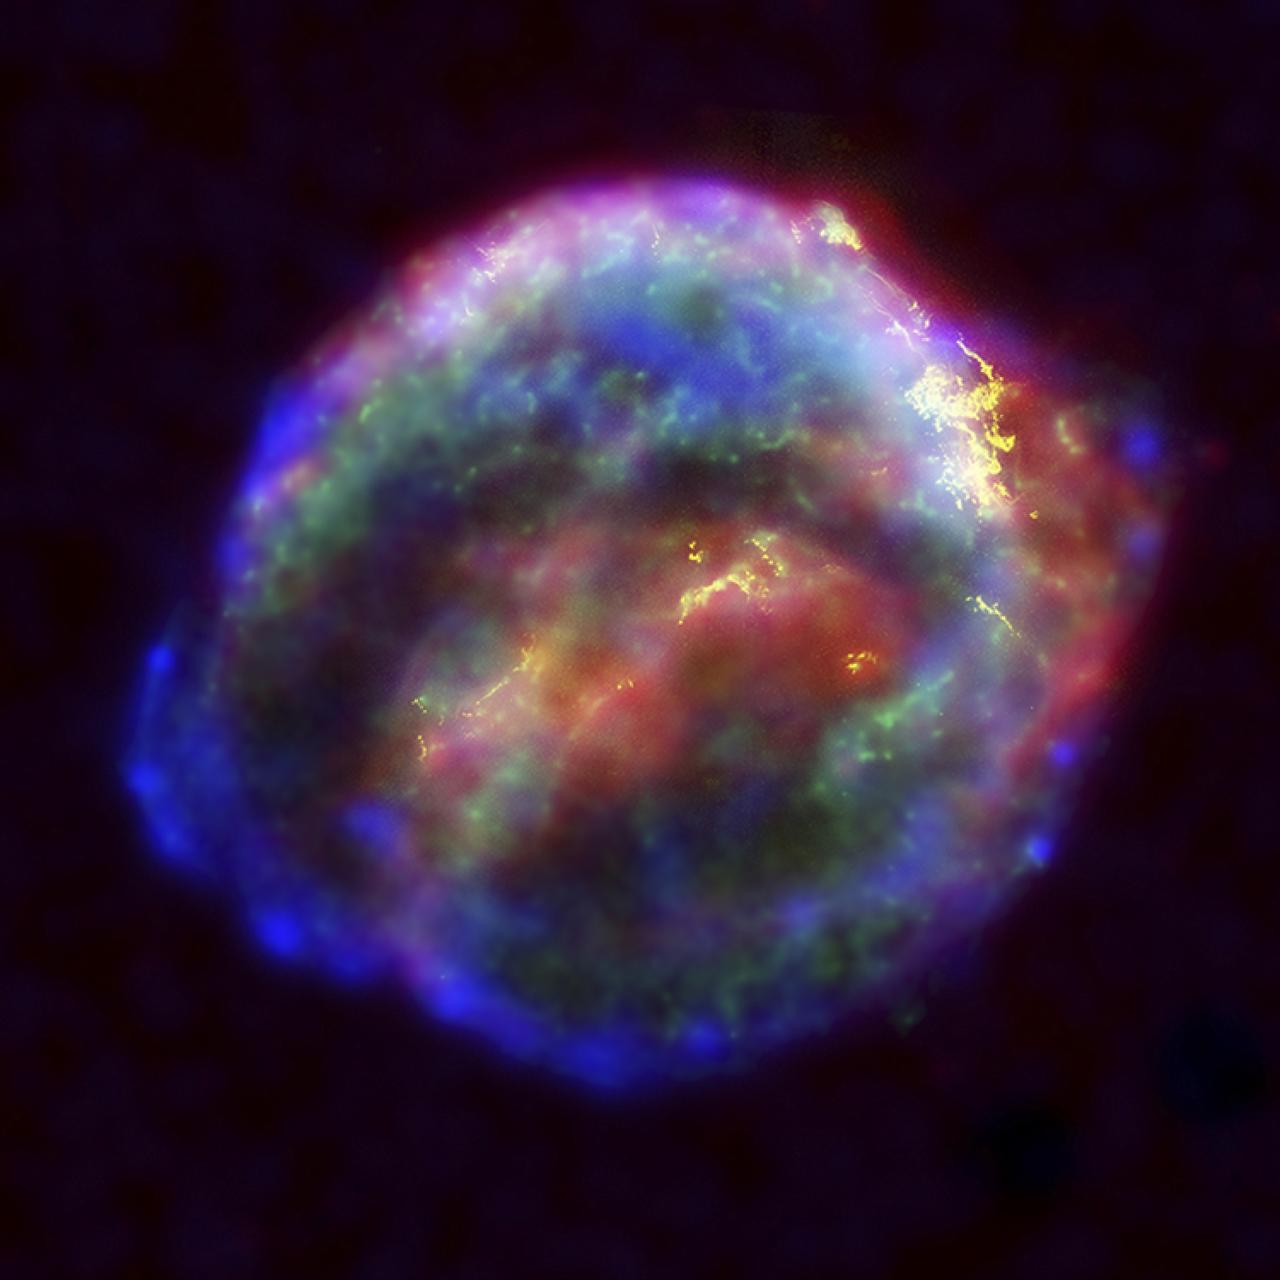
Four hundred years ago, sky watchers, including the famous astronomer Johannes Kepler, best known as the discoverer of the laws of planetary motion, were startled by the sudden appearance of a new star in the western sky, rivaling the brilliance of the nearby planets. Modern astronomers, using NASA's three orbiting Great Observatories, are unraveling the mysteries of the expanding remains of Kepler's supernova, the last such object seen to explode in our Milky Way galaxy. When a new star appeared Oct. 9, 1604, observers could use only their eyes to study it. The telescope would not be invented for another four years. A team of modern astronomers has the combined abilities of NASA's Great Observatories, the Spritzer Space Telescope (SST), Hubble Space Telescope (HST), and Chandra X-Ray Observatory (CXO), to analyze the remains in infrared radiation, visible light, and X-rays. Visible-light images from Hubble's Advanced Camera for Surveys reveal where the supernova shock wave is slamming into the densest regions of surrounding gas. The astronomers used the SST to probe for material that radiates in infrared light, which shows heated microscopic dust particles that have been swept up by the supernova shock wave. The CXO data show regions of very hot gas. The combined image unveils a bubble-shaped shroud of gas and dust, 14 light-years wide and expanding at 4 million mph. There have been six known supernovas in our Milky Way over the past 1,000 years. Kepler's is the only one in which astronomers do not know what type of star exploded. By combining information from all three Great Observatories, astronomers may find the clues they need. Project management for both the HST and CXO programs is the responsibility of NASA’s Marshall Space Flight Center in Huntsville, Alabama.
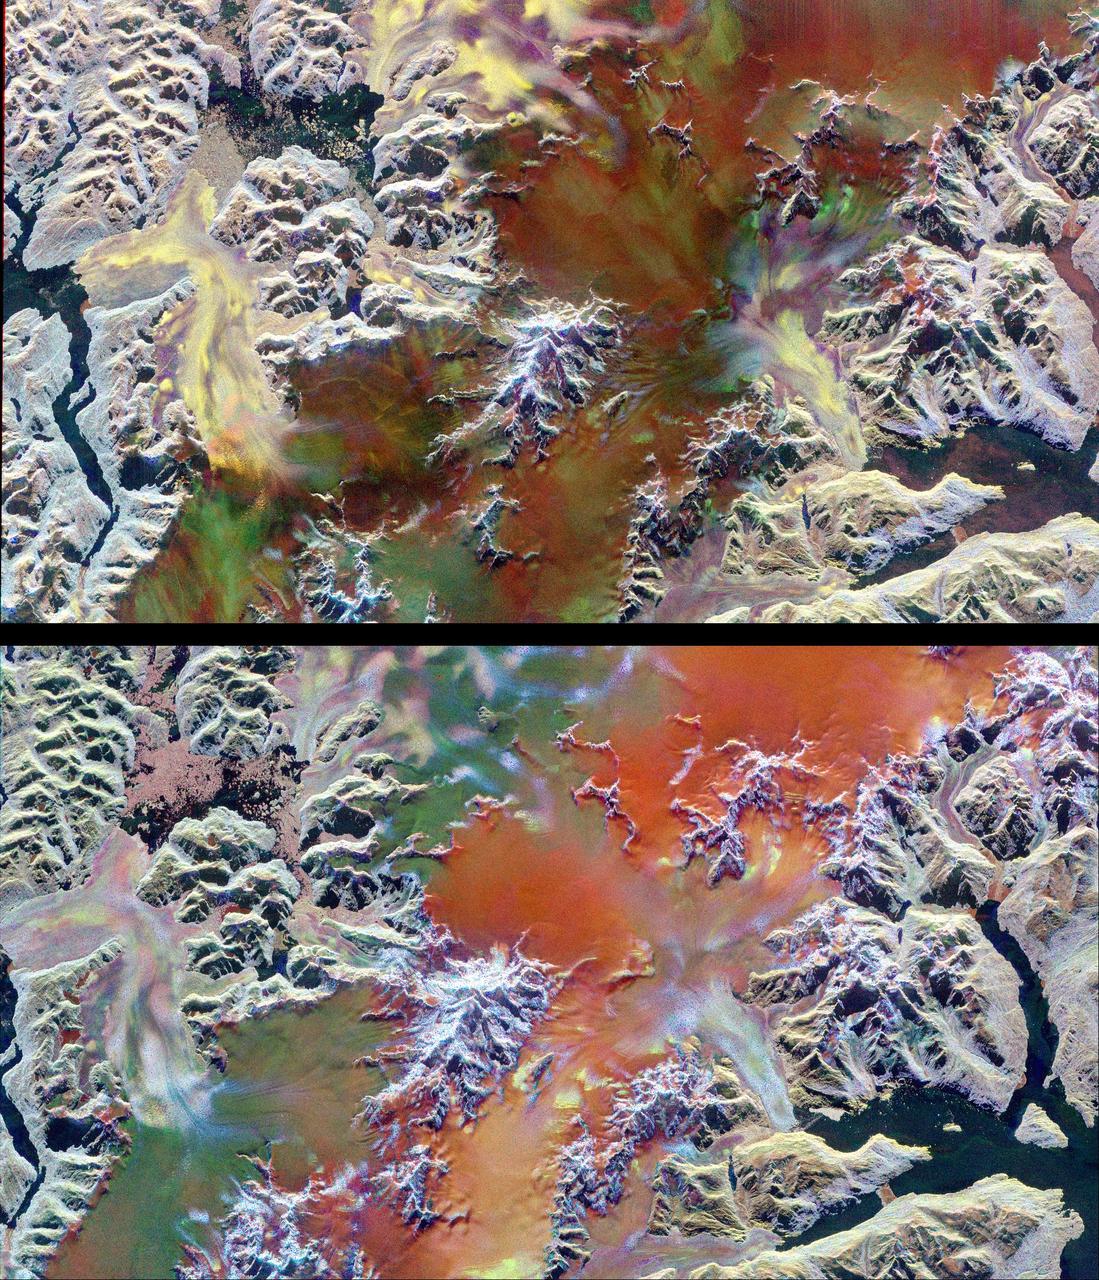
This pair of images illustrates the ability of multi-parameter radar imaging sensors such as the Spaceborne Imaging Radar-C/X-band Synthetic Aperture radar to detect climate-related changes on the Patagonian ice fields in the Andes Mountains of Chile and Argentina. The images show nearly the same area of the south Patagonian ice field as it was imaged during two space shuttle flights in 1994 that were conducted five-and-a-half months apart. The images, centered at 49.0 degrees south latitude and 73.5degrees west longitude, include several large outlet glaciers. The images were acquired by SIR-C/X-SAR on board the space shuttle Endeavour during April and October 1994. The top image was acquired on April 14, 1994, at 10:46 p.m. local time, while the bottom image was acquired on October 5,1994, at 10:57 p.m. local time. Both were acquired during the 77th orbit of the space shuttle. The area shown is approximately 100 kilometers by 58 kilometers (62 miles by 36 miles) with north toward the upper right. The colors in the images were obtained using the following radar channels: red represents the C-band (horizontally transmitted and received); green represents the L-band (horizontally transmitted and received); blue represents the L-band (horizontally transmitted and vertically received). The overall dark tone of the colors in the central portion of the April image indicates that the interior of the ice field is covered with thick wet snow. The outlet glaciers, consisting of rough bare ice, are the brightly colored yellow and purple lobes which terminate at calving fronts into the dark waters of lakes and fiords. During the second mission the temperatures were colder and the corresponding change in snow and ice conditions is readily apparent by comparing the images. The interior of the ice field is brighter because of increased radar return from the dryer snow. The distinct green/orange boundary on the ice field indicates an abrupt change in the structure of the snowcap, a direct indication of the steep meteorological gradients known to exist in this region. The bluer color of the outlet glaciers is probably due to a thin snow cover. A portion of the terminus of the outlet glacier at the top left center of the images has advanced approximately 600 meters (1,970 feet) in the five-and-a-half months between the two missions. Because of the persistent cloud cover this observation was only possible by using the orbiting, remote imaging radar system. http://photojournal.jpl.nasa.gov/catalog/PIA01778
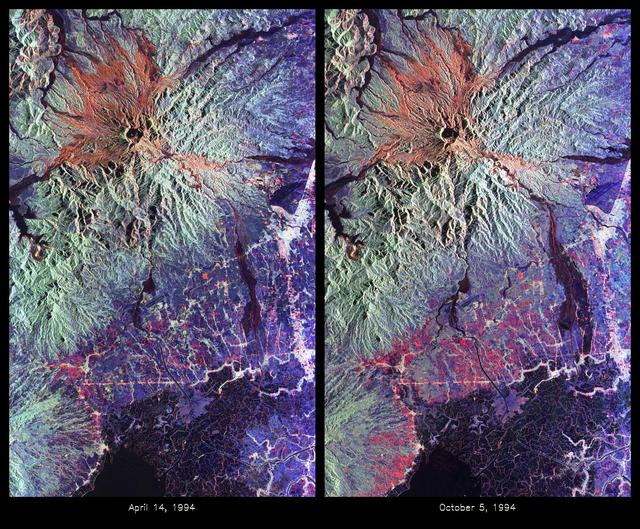
These are color composite radar images showing the area around Mount Pinatubo in the Philippines. The images were acquired by the Spaceborne Imaging Radar-C and X-band Synthetic Aperture Radar (SIR-C/X-SAR) aboard the space shuttle Endeavour on April 14, 1994 (left image) and October 5,1994 (right image). The images are centered at about 15 degrees north latitude and 120.5 degrees east longitude. Both images were obtained with the same viewing geometry. The color composites were made by displaying the L-band (horizontally transmitted and received) in red; the L-band (horizontally transmitted and vertically received) in green; and the C-band (horizontally transmitted and vertically received) in blue. The area shown is approximately 40 kilometers by 65 kilometers (25 miles by 40 miles). The main volcanic crater on Mount Pinatubo produced by the June 1991 eruptions and the steep slopes on the upper flanks of the volcano are easily seen in these images. Red on the high slopes shows the distribution of the ash deposited during the 1991 eruption, which appears red because of the low cross-polarized radar returns at C and L bands. The dark drainages radiating away from the summit are the smooth mudflows, which even three years after the eruptions continue to flood the river valleys after heavy rain. Comparing the two images shows that significant changes have occurred in the intervening five months along the Pasig-Potrero rivers (the dark area in the lower right of the images). Mudflows, called "lahars," that occurred during the 1994 monsoon season filled the river valleys, allowing the lahars to spread over the surrounding countryside. Three weeks before the second image was obtained, devastating lahars more than doubled the area affected in the Pasig-Potrero rivers, which is clearly visible as the increase in dark area on the lower right of the images. Migration of deposition to the east (right) has affected many communities. Newly affected areas included the community of Bacolor, Pampanga, where thousands of homes were buried in meters of hot mud and rock as 80,000 people fled the lahar-stricken area. Scientists are closely monitoring the westward migration ( toward the left in this image) of the lahars as the Pasig-Potrero rivers seek to join with the Porac River, an area that has not seen laharic activity since the eruption. This could be devastating because the Pasig-Potrero rivers might be permanently redirected to lower elevations along the Porac River where communities are located. Ground saturation with water during the rainy season reveals inactive channels that were dry in the April image. A small lake has turned into a pond in the lower reaches of the Potrero River because the channels are full of lahar deposits and the surface runoff has no where to flow. Changes in the degree of erosion in ash and pumice deposits from the 1991 eruption can also be seen in the channels that deliver the mudflow material to the Pasig-Potrero rivers. The 1991 Mount Pinatubo eruption is well known for its near-global effects on the atmosphere and short-term climate due to the large amount of sulfur dioxide that was injected into the upper atmosphere. Locally, however, the effects will most likely continue to impact surrounding areas for as long as the next 10 to 15 years. Mudflows, quite certainly, will continue to pose severe hazards to adjacent areas. Radar observations like those obtained by SIR-C/X-SAR will play a key role in monitoring these changes because of the radar's ability to see in daylight or darkness and even in the worst weather conditions. Radar imaging will be particularly useful, for example, during the monsoon season, when the lahars form. Frequent imaging of these lahar fields will allow scientists to better predict when they are likely to begin flowing again and which communities might be at risk. http://photojournal.jpl.nasa.gov/catalog/PIA01743

ISS022-E-058538 (31 Jan. 2010) --- Sir Bani Yas Island is featured in this image photographed by an Expedition 22 crew member on the International Space Station. Sir Bani Yas Island is located in the Persian Gulf near the western coastline of the United Arab Emirates (UAE). The approximately 14-kilometers x nine-kilometers island is the surface expression of a salt dome, and is one of several such islands in the Persian Gulf. During past periods of alternating wet and dry climate, sometimes involving areas with high rates of evaporation in enclosed basins, thick layers of salt minerals (such as halite ? common table salt, or gypsum ? a major component of wallboard) were deposited. These layers were subsequently buried by sediments; with enough overlaying material and depth of burial, the salt layers can begin to flow. Salt has lower density than the surrounding rock and it tends to flow upwards, pushing up the overlaying layers of rock to form a salt dome. While many salt domes retain a cap of the youngest rock layers at the surface, in some cases the underlaying salt extrudes onto the surface. This photograph illustrates the varying character of surfaces on the island. The central mountains of Jebel Wahid (center) mark the location of the Sir Bani Yas salt dome. The dome has breached the surface but exposed salt - primarily gypsum - is removed by erosion, leaving a rugged, insoluble cap formed from fragments of the overlaying sedimentary and volcanic rocks. Sand and silt derived from the Jebel Wahid area and surrounding gravel cover forms beaches along the outer edge of the island.
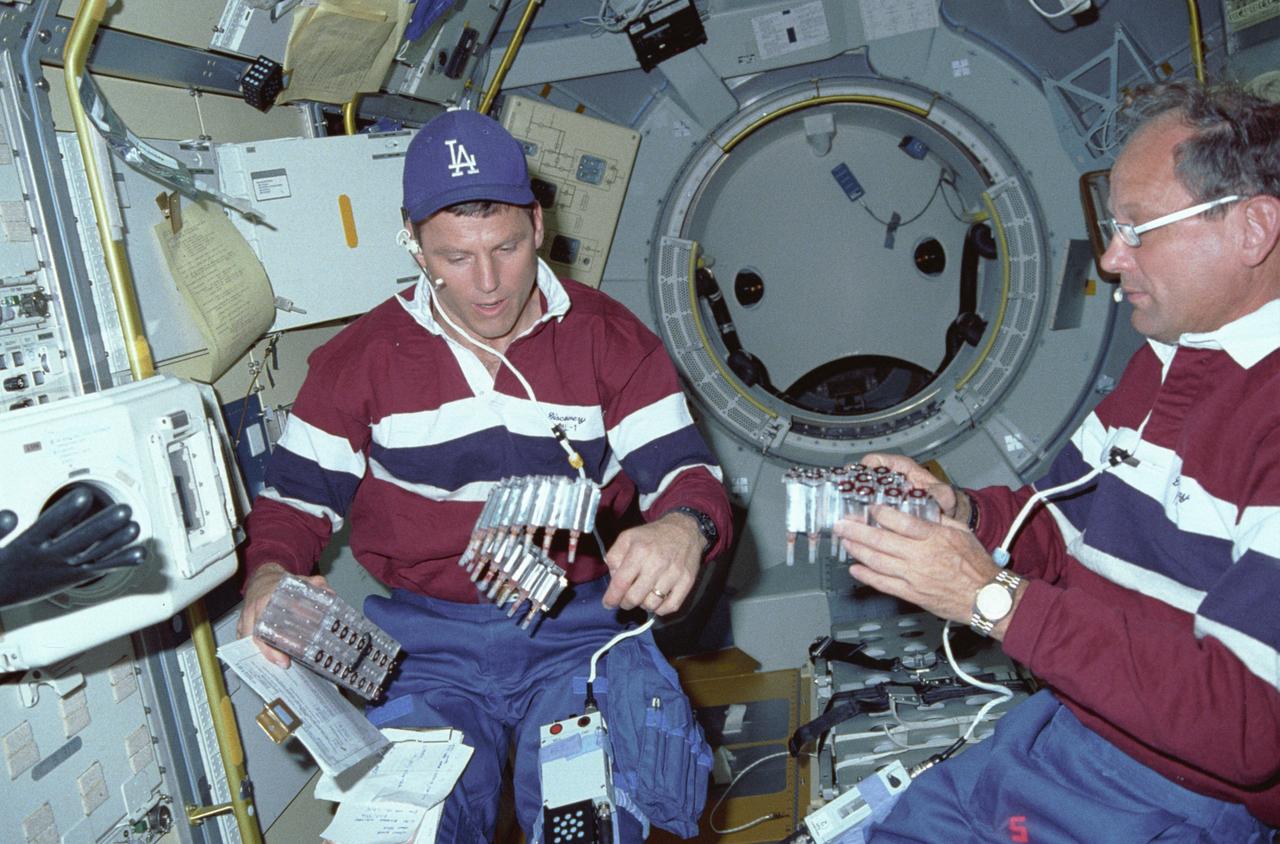
International Microgravity Laboratory-1 (IML-1) was the first in a series of Shuttle flights dedicated to fundamental materials and life sciences research with the international partners. The participating space agencies included: NASA, the 14-nation European Space Agency (ESA), the Canadian Space Agency (CSA), the French National Center of Space Studies (CNES), the German Space Agency and the German Aerospace Research Establishment (DAR/DLR), and the National Space Development Agency of Japan (NASDA). Dedicated to the study of life and materials sciences in microgravity, the IML missions explored how life forms adapt to weightlessness and investigated how materials behave when processed in space. Both life and materials sciences benefited from the extended periods of microgravity available inside the Spacelab science module in the cargo bay of the Space Shuttle Orbiter. In this photograph, Astronauts Stephen S. Oswald and Norman E. Thagard handle ampoules used in the Mercuric Iodide Crystal Growth (MICG) experiment. Mercury Iodide crystals have practical uses as sensitive x-ray and gamma-ray detectors. In addition to their exceptional electronic properties, these crystals can operate at room temperature rather than at the extremely low temperatures usually required by other materials. Because a bulky cooling system is urnecessary, these crystals could be useful in portable detector devices for nuclear power plant monitoring, natural resource prospecting, biomedical applications in diagnosis and therapy, and astronomical observation. Managed by the Marshall Space Flight Center, IML-1 was launched on January 22, 1992 aboard the Space Shuttle Orbiter Discovery (STS-42 mission).

Lake Mackay is the largest of hundreds of ephemeral lakes scattered throughout Western Australia and the Northern Territory, and is the second largest lake in Australia. The darker areas indicate some form of desert vegetation or algae, moisture within the soils, and lowest elevations where water pools. The image was acquired on September 19, 2010 and covers an area of 27 x 41 km. With its 14 spectral bands from the visible to the thermal infrared wavelength region and its high spatial resolution of 15 to 90 meters (about 50 to 300 feet), ASTER images Earth to map and monitor the changing surface of our planet. ASTER is one of five Earth-observing instruments launched Dec. 18, 1999, on Terra. The instrument was built by Japan's Ministry of Economy, Trade and Industry. A joint U.S./Japan science team is responsible for validation and calibration of the instrument and data products. The broad spectral coverage and high spectral resolution of ASTER provides scientists in numerous disciplines with critical information for surface mapping and monitoring of dynamic conditions and temporal change. Example applications are: monitoring glacial advances and retreats; monitoring potentially active volcanoes; identifying crop stress; determining cloud morphology and physical properties; wetlands evaluation; thermal pollution monitoring; coral reef degradation; surface temperature mapping of soils and geology; and measuring surface heat balance. The U.S. science team is located at NASA's Jet Propulsion Laboratory, Pasadena, Calif. The Terra mission is part of NASA's Science Mission Directorate, Washington, D.C. More information about ASTER is available at <a href="http://asterweb.jpl.nasa.gov/" rel="nofollow">asterweb.jpl.nasa.gov/</a>. Image Credit: NASA/GSFC/METI/ERSDAC/JAROS, and U.S./Japan ASTER Science Team
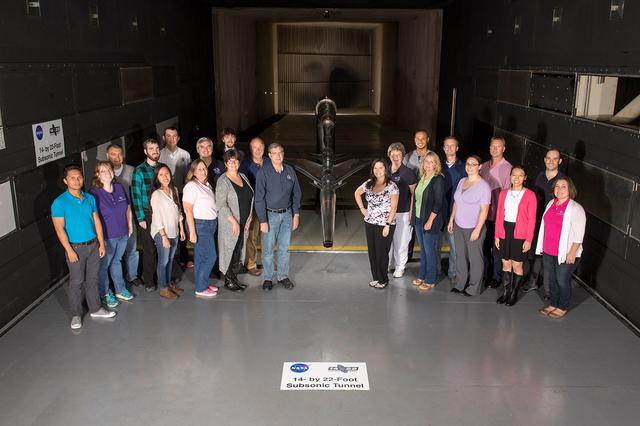

NASA test pilot Nils Larson walks around an F-15B research aircraft for a rehearsal flight supporting the agency’s Quesst mission at NASA’s Armstrong Flight Research Center in Edwards, California. The flight was part of a full-scale dress rehearsal for Phase 2 of the mission, which will eventually measure quiet sonic thumps generated by the X-59. The flight series helped NASA teams refine procedures and practice data collection ahead of future X-59 flights.
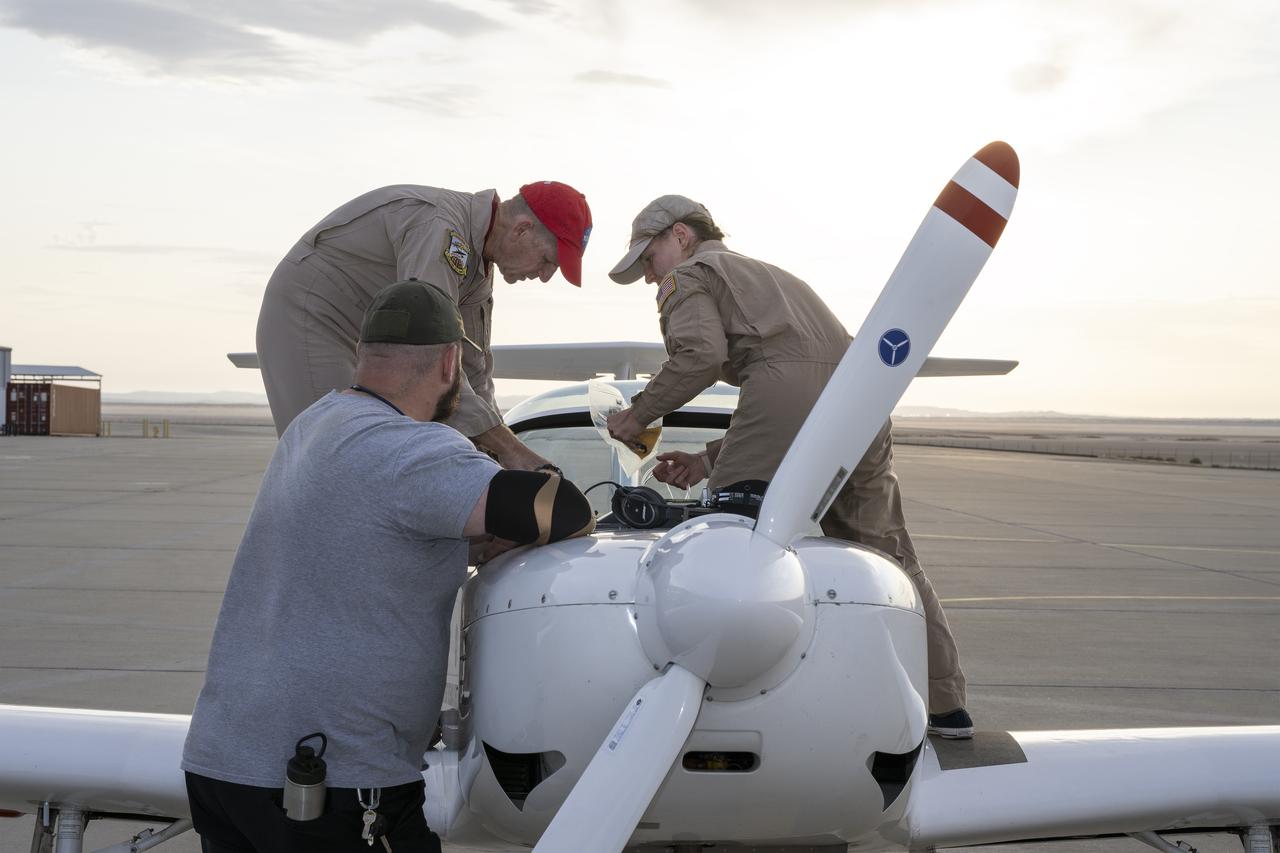
A NASA TG-14 glider aircraft is prepared for flight at NASA’s Armstrong Flight Research Center in Edwards, California, in support of the agency’s Quesst mission. The aircraft is equipped with onboard microphones to capture sonic boom noise generated during rehearsal flights, helping researchers measure the acoustic signature of supersonic aircraft closer to the ground.
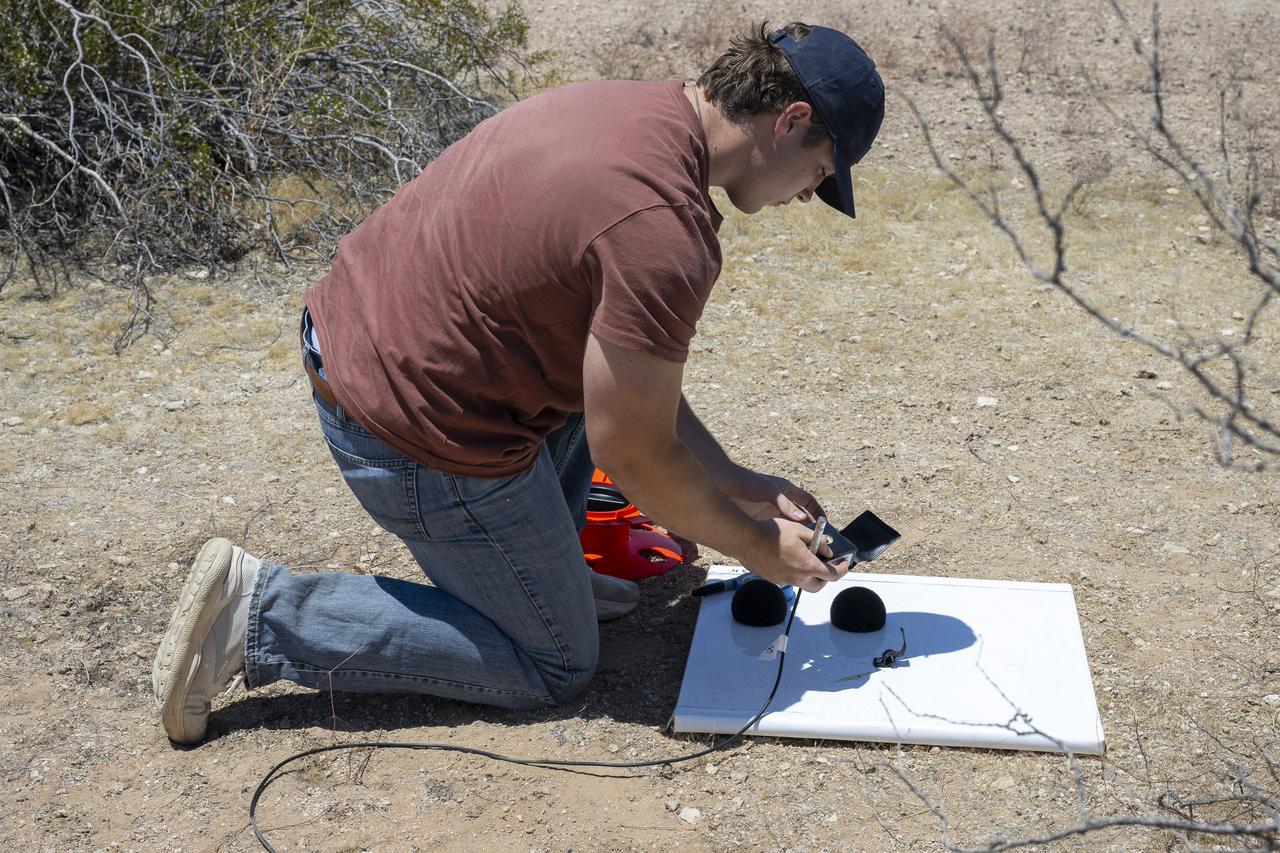
A NASA intern sets up ground recording system (GRS) units in California’s Mojave Desert during a Phase 2 rehearsal of the agency’s Quesst mission. The GRS units were placed across miles of desert terrain to capture the acoustic signature of supersonic aircraft during rehearsal flights and in preparation for the start of the actual tests.
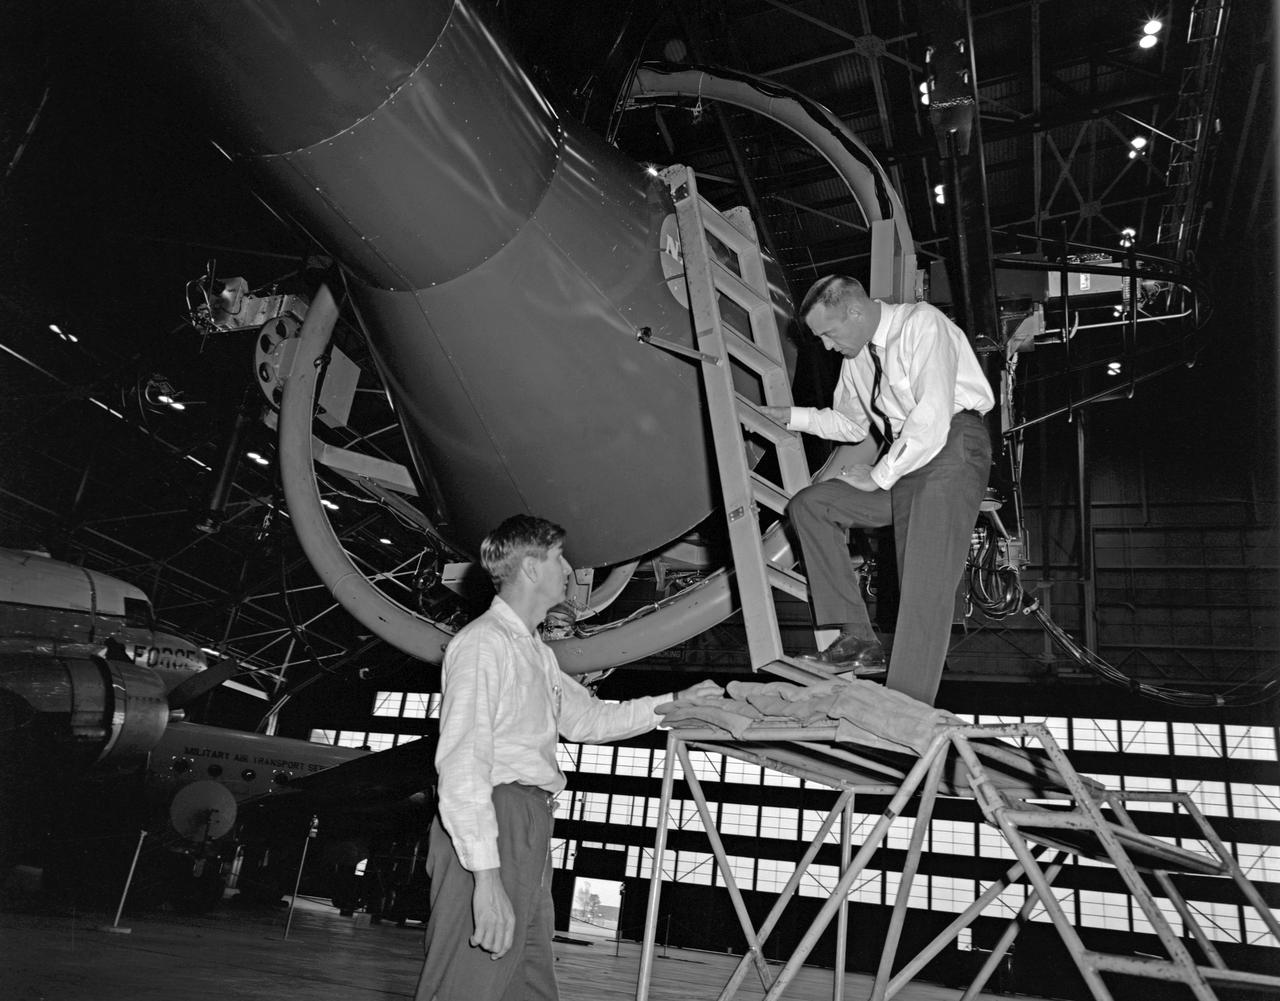
Astronaut Alan Shepard (right) was one of 14 astronauts, 8 NASA test pilots, and 2 McDonnell test pilots who took part in simulator studies. Shepard flew the simulator on November 14, 1963. A.W. Vogeley wrote: "Many of the astronauts have flown this simulator in support of the Gemini studies and they, without exception, appreciated the realism of the visual scene. The simulator has also been used in the development of pilot techniques to handle certain jet malfunctions in order that aborts could be avoided. In these situations large attitude changes are sometimes necessary and the false motion cues that were generated due to earth gravity were somewhat objectionable; however, the pilots were readily able to overlook these false motion cues in favor of the visual realism." Roy F. Brissenden noted that: "The basic Gemini control studies developed the necessary techniques and demonstrated the ability of human pilots to perform final space docking with the specified Gemini-Agena systems using only visual references. ... Results... showed that trained astronauts can effect the docking with direct acceleration control and even with jet malfunctions as long as good visual conditions exist.... Probably more important than data results was the early confidence that the astronauts themselves gained in their ability to perform the maneuver in the ultimate flight mission." Shepard commented: "I had the feeling tonight - a couple of times - that I was actually doing the space mission instead of the simulation. As I said before, I think it is a very good simulation." Shepard also commented on piloting techniques. Most astronauts arrived at this same preferred technique: Shepard: "I believe I have developed the preferred technique for these conditions and the technique appeared to me to be best was to come in slightly above the target so that I was able to use the longitudinal marks on the body of the target as a reference, particularly for a lateral translation and, of course, I used the foreshortening effect for a vertical translation, and this appeared to give me the best results. By that I mean the least number of control motions and the lowest fuel usage and the best end techniques, or the best end conditions, I should say." Engineer: "When you started to run you didn't start thrusting immediately I don't believe. It looked like you started working on your attitudes, then started closing in." Shepard: "That is correct. I did that because I felt that I wanted to get the X-axis translation in the most effective vector and for minimum fuel usage that wouldn't introduce any other lateral or vertical offsets that did not already exist." -- Published in Barton C. Hacker and James M. Grimwood, On the Shoulders of Titans: A History of Project Gemini, NASA SP-4203; A.W. Vogeley, "Discussion of Existing and Planned Simulators For Space Research," Paper presented at the Conference on the Role of Simulation in Space Technology, August 17-21, 1964; Roy F. Brissenden, "Initial Operations with Langley's Rendezvous Docking Facility," Langley Working Paper, LWP-21, 1964.
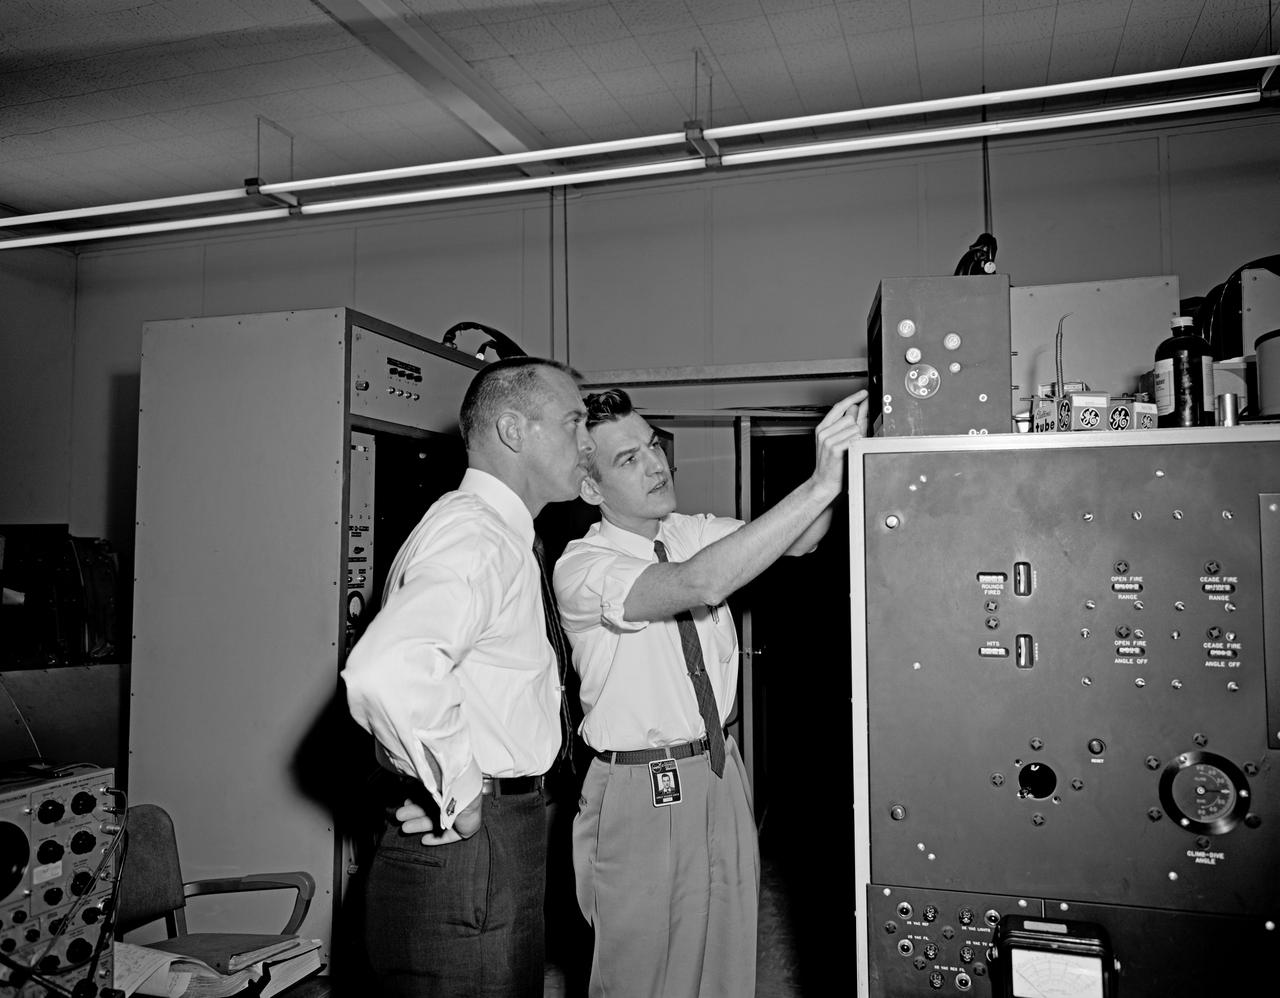
Astronaut Alan Shepard (right) was one of 14 astronauts, 8 NASA test pilots, and 2 McDonnell test pilots who took part in simulator studies. Shepard flew the simulator on November 14, 1963. A.W. Vogeley wrote: "Many of the astronauts have flown this simulator in support of the Gemini studies and they, without exception, appreciated the realism of the visual scene. The simulator has also been used in the development of pilot techniques to handle certain jet malfunctions in order that aborts could be avoided. In these situations large attitude changes are sometimes necessary and the false motion cues that were generated due to earth gravity were somewhat objectionable; however, the pilots were readily able to overlook these false motion cues in favor of the visual realism." Roy F. Brissenden noted that: "The basic Gemini control studies developed the necessary techniques and demonstrated the ability of human pilots to perform final space docking with the specified Gemini-Agena systems using only visual references. ... Results... showed that trained astronauts can effect the docking with direct acceleration control and even with jet malfunctions as long as good visual conditions exist.... Probably more important than data results was the early confidence that the astronauts themselves gained in their ability to perform the maneuver in the ultimate flight mission." Shepard commented: "I had the feeling tonight - a couple of times - that I was actually doing the space mission instead of the simulation. As I said before, I think it is a very good simulation." Shepard also commented on piloting techniques. Most astronauts arrived at this same preferred technique: Shepard: "I believe I have developed the preferred technique for these conditions and the technique appeared to me to be best was to come in slightly above the target so that I was able to use the longitudinal marks on the body of the target as a reference, particularly for a lateral translation and, of course, I used the foreshortening effect for a vertical translation, and this appeared to give me the best results. By that I mean the least number of control motions and the lowest fuel usage and the best end techniques, or the best end conditions, I should say." Engineer: "When you started to run you didn't start thrusting immediately I don't believe. It looked like you started working on your attitudes, then started closing in." Shepard: "That is correct. I did that because I felt that I wanted to get the X-axis translation in the most effective vector and for minimum fuel usage that wouldn't introduce any other lateral or vertical offsets that did not already exist." -- Published in Barton C. Hacker and James M. Grimwood, On the Shoulders of Titans: A History of Project Gemini, NASA SP-4203; A.W. Vogeley, "Discussion of Existing and Planned Simulators For Space Research," Paper presented at the Conference on the Role of Simulation in Space Technology, August 17-21, 1964; Roy F. Brissenden, "Initial Operations with Langley's Rendezvous Docking Facility," Langley Working Paper, LWP-21, 1964.
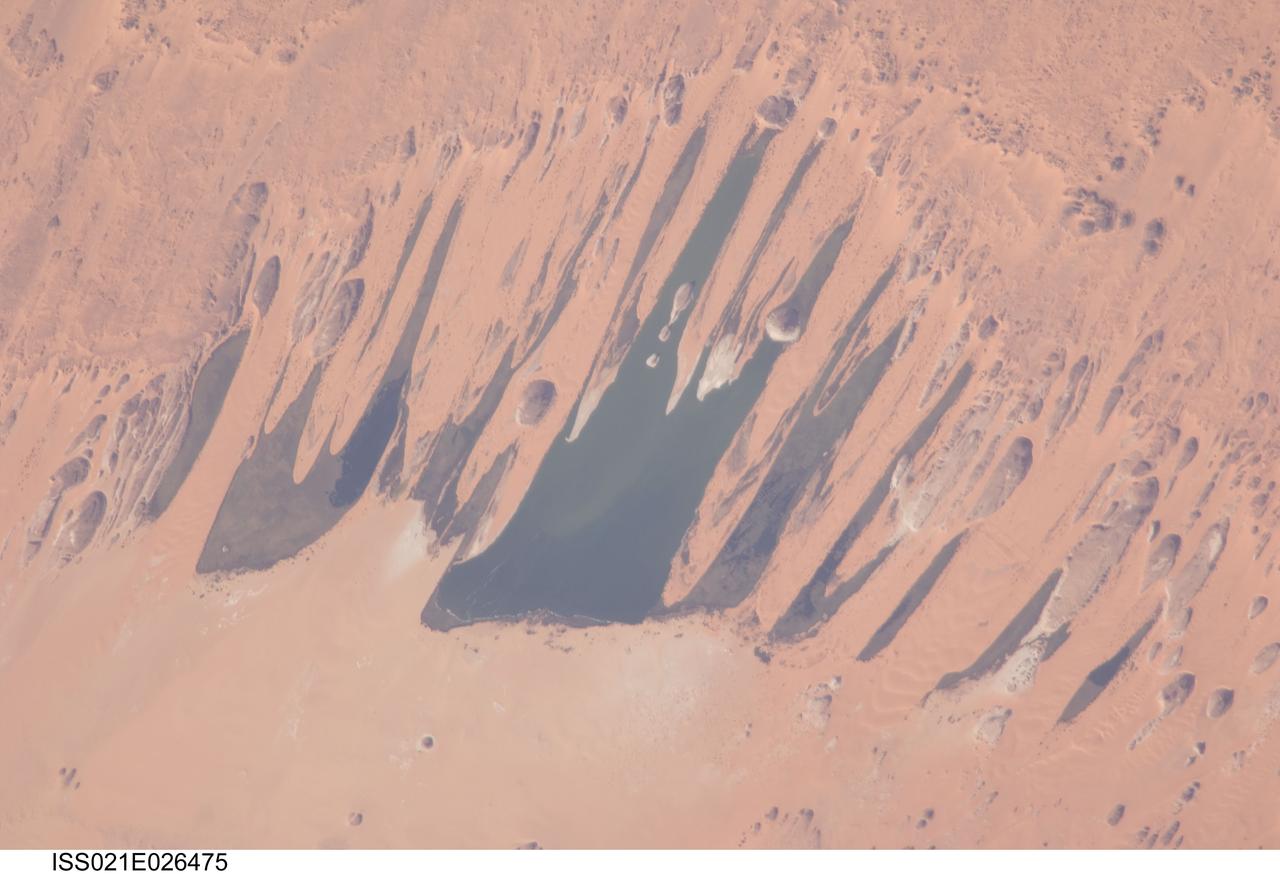
ISS021-E-026475 (14 Nov. 2009) --- Ounianga Lakes in the Sahara Desert, in the nation of Chad are featured in this image photographed by an Expedition 21 crew member on the International Space Station. This view features one of the largest of a series of ten, mostly fresh water lakes in the Ounianga basin in the heart of the Sahara Desert of northeastern Chad. According to scientists, the lakes are the remnant of a single large lake, probably tens of kilometers long that once occupied this remote area approximately 14,800 to 5,500 years ago. As the climate dried out during the subsequent millennia, the lake was reduced in size and large wind-driven sand dunes invaded the original depression dividing it into several smaller basins. The area shown in this image measures approximately 11 x 9 kilometers, with the dark water surfaces of the lake segregated almost completely by orange linear sand dunes that stream into the depression from the northeast. The almost year-round northeast winds and cloudless skies make for very high evaporation (an evaporation rate of greater than six meters per year has been measured in one of the nearby lakes). Despite this, only one of the ten lakes is saline. According to scientists, the reason for the apparent paradox of fresh water lakes in the heart of the desert lies in the fact that fresh water from a very large aquifer reaches the surface in the Ounianga depression in the form of the lakes. The aquifer is large enough to keep supplying the small lakes with water despite the high evaporation rate. Mats of floating reeds also reduce the evaporation in places. The lakes form a hydrological system that is unique in the Sahara Desert. Scientists believe the aquifer was charged with fresh water, and the large original lake evolved, during the so-called African Humid Period (approximately 14,800 to 5,500 years ago) when the West African summer monsoon was stronger than it is today. Associated southerly winds brought Atlantic moisture well north of modern limits, producing sufficient rainfall in the central Sahara to foster an almost complete savanna vegetation cover. Pollen data from lake sediments of the original 50-meters-deep Ounianga Lake suggests to scientists that a mild tropical climate with a wooded grassland savanna existed in the region. This vegetation association is now only encountered 300 kilometers further south. Ferns grew in the stream floodplains which must have been occasionally flooded. Even shrubs that now occur only on the very high, cool summits (greater than 2,900 meters, greater than 9,500 feet) of the Tibesti Mts. have been found in the Ounianga lake sediments.

Nearly all black holes come in one of two sizes: stellar mass black holes that weigh up to a few dozen times the mass of our sun or supermassive black holes ranging from a million to several billion times the sun’s mass. Astronomers believe that medium-sized black holes between these two extremes exist, but evidence has been hard to come by, with roughly a half-dozen candidates described so far. A team led by astronomers at the University of Maryland and NASA’s Goddard Space Flight Center has found evidence for a new intermediate-mass black hole about 5,000 times the mass of the sun. The discovery adds one more candidate to the list of potential medium-sized black holes, while strengthening the case that these objects do exist. The team reported its findings in the September 21, 2015 online edition of Astrophysical Journal Letters. This image, taken with the European Southern Observatory’s Very Large Telescope, shows the central region of galaxy NGC1313. This galaxy is home to the ultraluminous X-ray source NCG1313X-1, which astronomers have now determined to be an intermediate-mass black hole candidate. NGC1313 is 50,000 light-years across and lies about 14 million light-years from the Milky Way in the southern constellation Reticulum. Read more: <a href="http://www.nasa.gov/feature/goddard/astronomers-identify-a-new-mid-size-black-hole" rel="nofollow">www.nasa.gov/feature/goddard/astronomers-identify-a-new-m...</a> Image credit: European Southern Observatory #nasagoddard #blackhole #space <b><a href="http://www.nasa.gov/audience/formedia/features/MP_Photo_Guidelines.html" rel="nofollow">NASA image use policy.</a></b> <b><a href="http://www.nasa.gov/centers/goddard/home/index.html" rel="nofollow">NASA Goddard Space Flight Center</a></b> enables NASA’s mission through four scientific endeavors: Earth Science, Heliophysics, Solar System Exploration, and Astrophysics. Goddard plays a leading role in NASA’s accomplishments by contributing compelling scientific knowledge to advance the Agency’s mission. <b>Follow us on <a href="http://twitter.com/NASAGoddardPix" rel="nofollow">Twitter</a></b> <b>Like us on <a href="http://www.facebook.com/pages/Greenbelt-MD/NASA-Goddard/395013845897?ref=tsd" rel="nofollow">Facebook</a></b> <b>Find us on <a href="http://instagrid.me/nasagoddard/?vm=grid" rel="nofollow">Instagram</a></b>