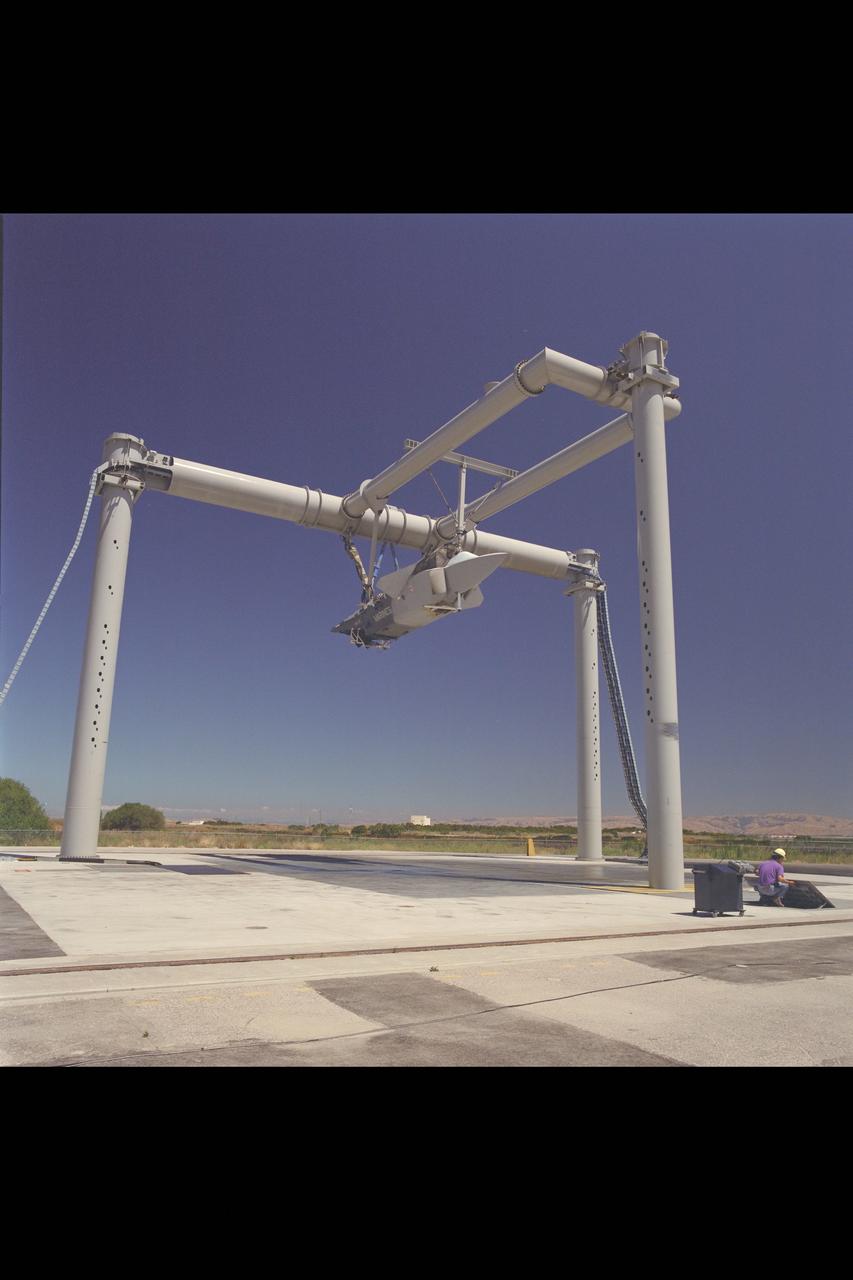
JAST (Joint Advanced Strike Technology) X-32 Test Program: Lockheed ASTOVL / CALF X-32, N-246 Test #930 arrival, unloading and test prep.
CALF (Common Affordable Lightweight Fighter) / JAST (Joint Advanced Strike Technology) X-32 Test Program: Lockheed ASTOVL / CALF X-32, N-246 Test-930 . (12S Wingless, Highest position)
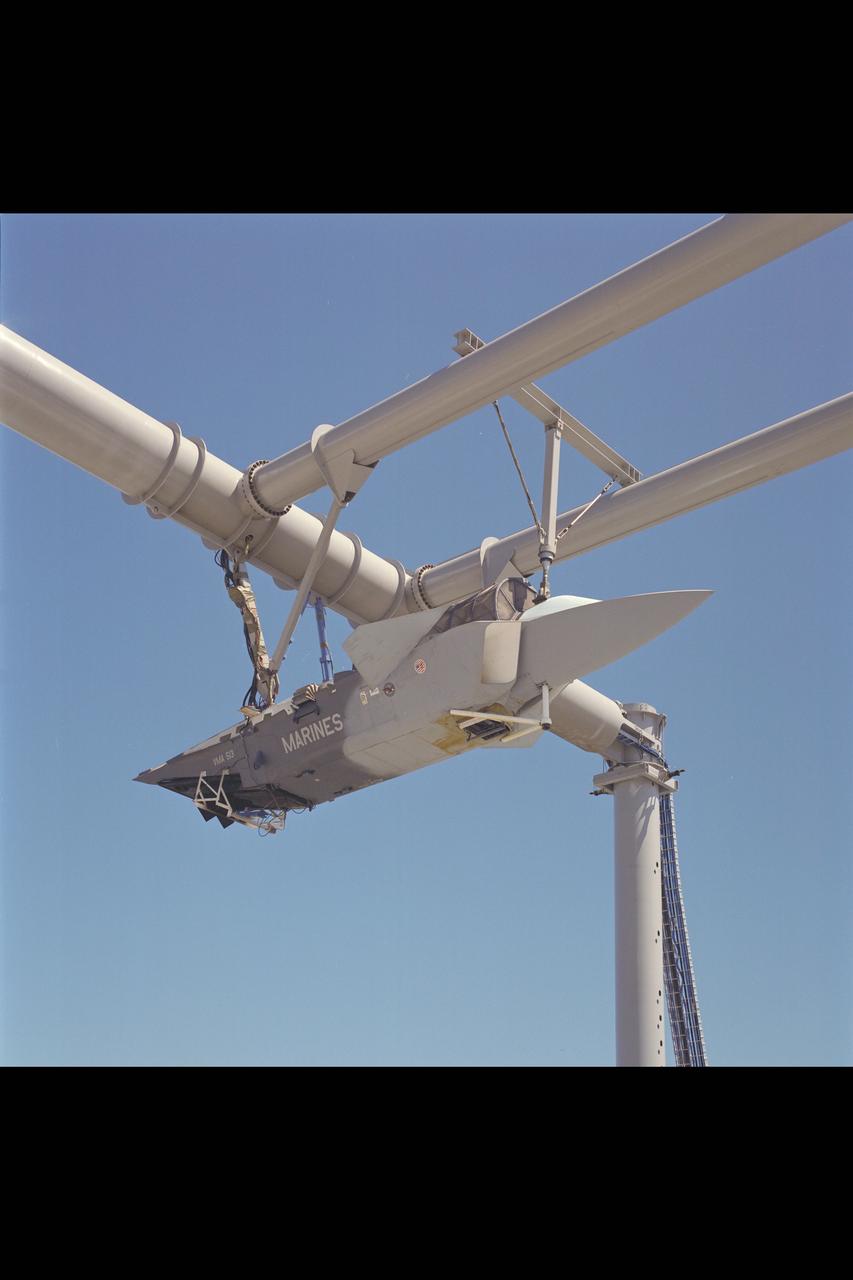
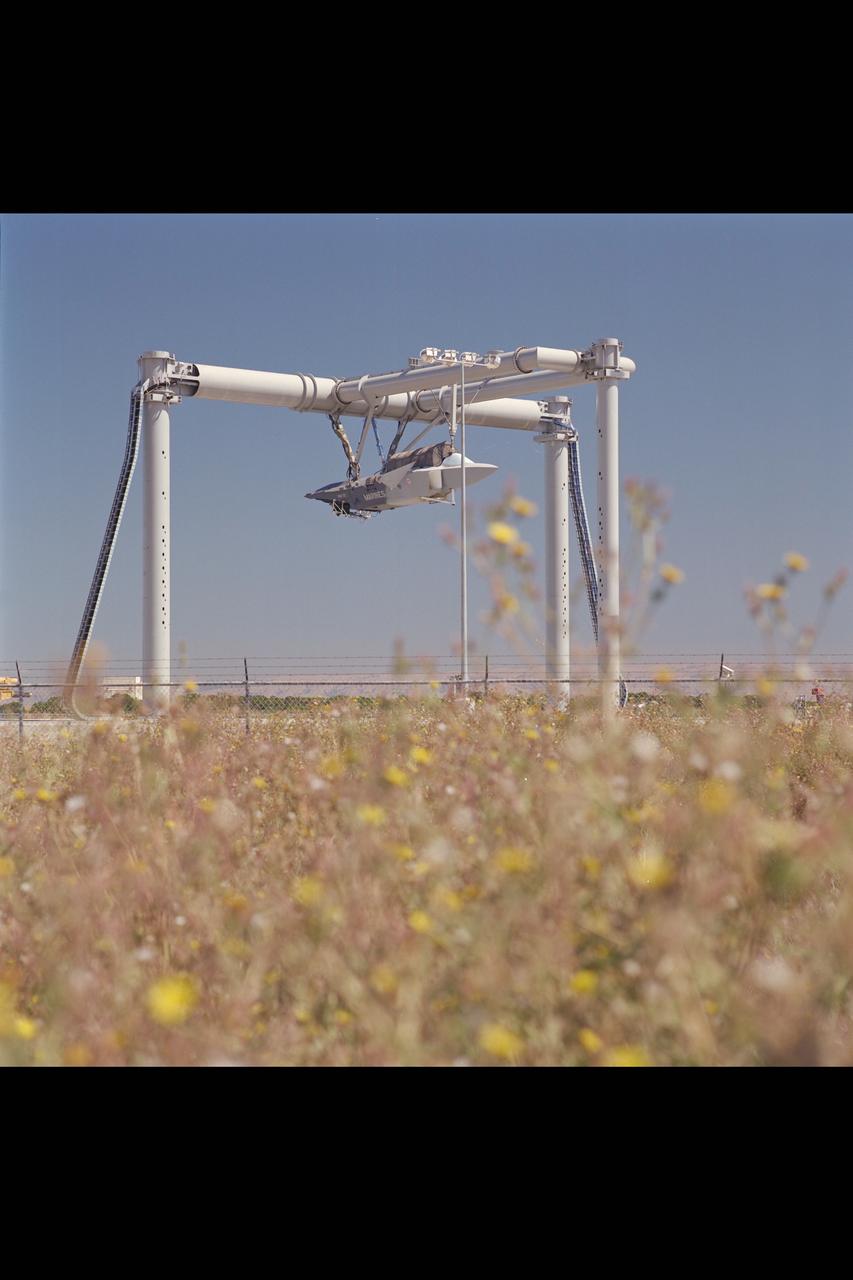
CALF (Common Affordable Lightweight Fighter) / JAST (Joint Advanced Strike Technology) X-32 test-930 mounted at OARF

CALF (Common Affordable Lightweight Fighter) / JAST (Joint Advanced Strike Technology) X-32 test-930 mounted at OARF
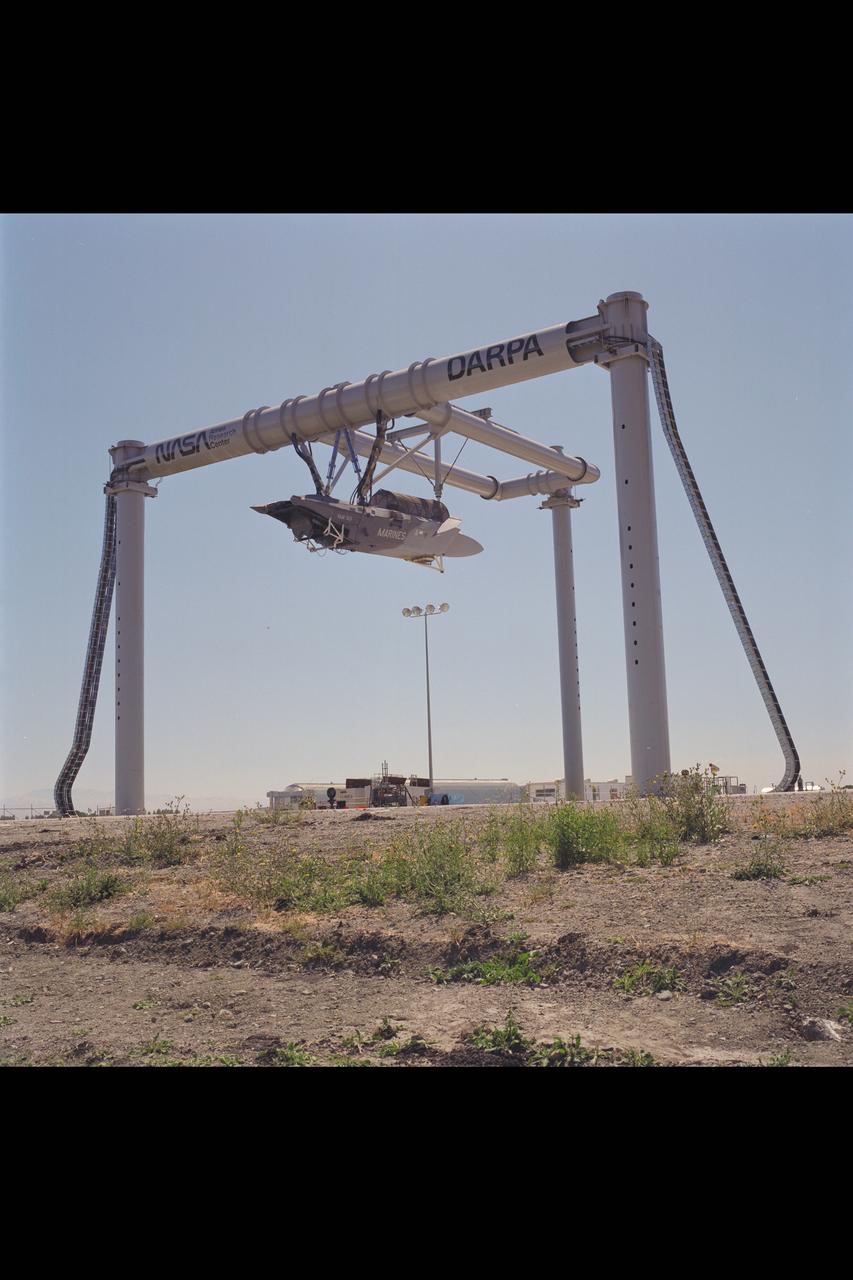
CALF (Common Affordable Lightweight Fighter) / JAST (Joint Advanced Strike Technology) X-32 test-930 mounted at OARF
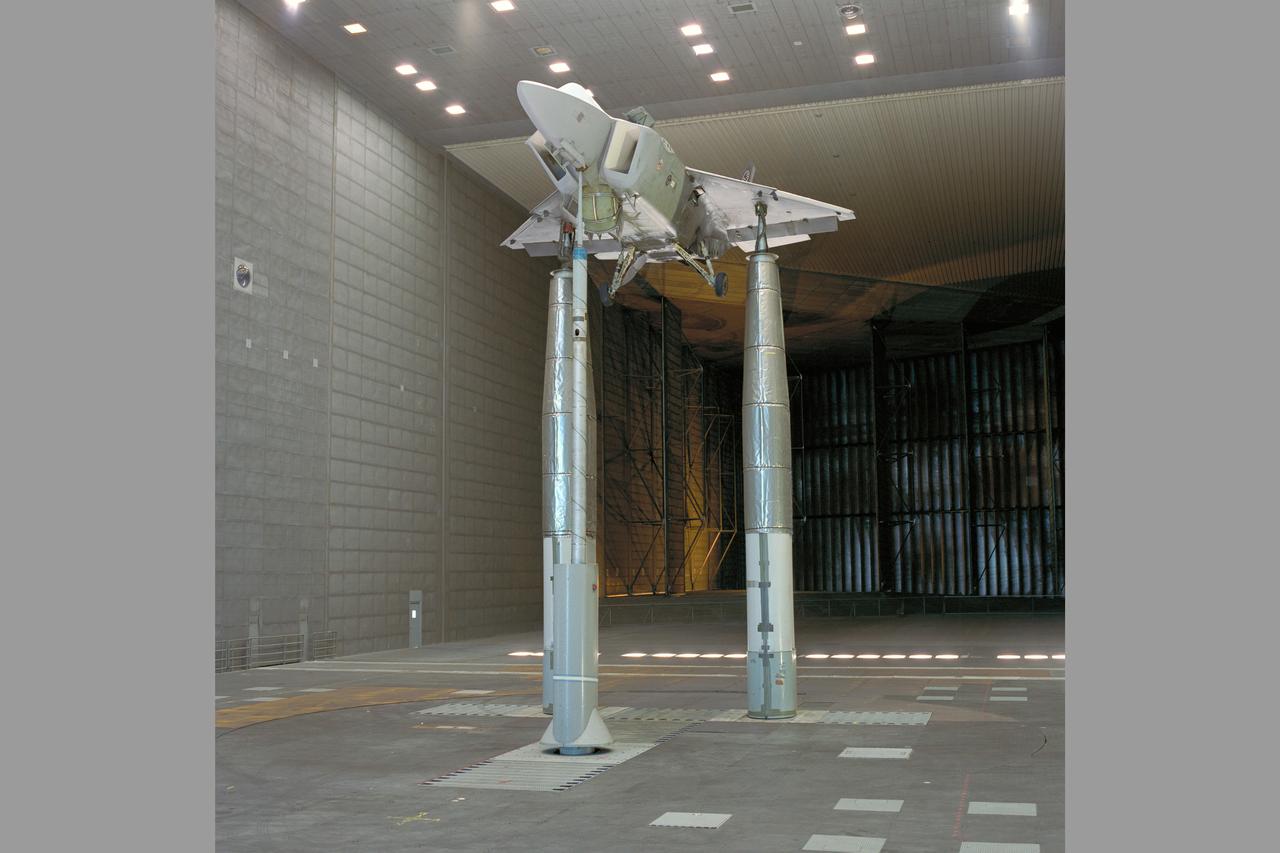
CALF/JAST X-32 test program: the LSPM (Large Scale Powered Model), Lockheed's concept for a tri-service aircraft (Air Force, Navy, Marines) CALF (Common Affordable Lightweight Fighter) as part of the Department of Defense's Joint Advanced Strike Technology (JAST) is being tested in the 80x120ft w.t. test-930 with rear horizontal stabilizer

The blue dots in this field of galaxies, known as the COSMOS field, show galaxies that contain supermassive black holes emitting high-energy X-rays. The black holes were detected by NASA's Nuclear Spectroscopic Array, or NuSTAR, which spotted 32 such black holes in this field and has observed hundreds across the whole sky so far. The other colored dots are galaxies that host black holes emitting lower-energy X-rays, and were spotted by NASA's Chandra X-ray Observatory. Chandra data show X-rays with energies between 0.5 to 7 kiloelectron volts, while NuSTAR data show X-rays between 8 to 24 kiloelectron volts. http://photojournal.jpl.nasa.gov/catalog/PIA20865
The blue dots in this field of galaxies, known as the COSMOS field, show galaxies that contain supermassive black holes emitting high-energy X-rays. The black holes were detected by NASA's Nuclear Spectroscopic Array, or NuSTAR, which spotted 32 such black holes in this field and has observed hundreds across the whole sky so far. The other colored dots are galaxies that host black holes emitting lower-energy X-rays, and were spotted by NASA's Chandra X-ray Observatory. Chandra data show X-rays with energies between 0.5 to 7 kiloelectron volts, while NuSTAR data show X-rays between 8 to 24 kiloelectron volts. http://photojournal.jpl.nasa.gov/catalog/PIA20865
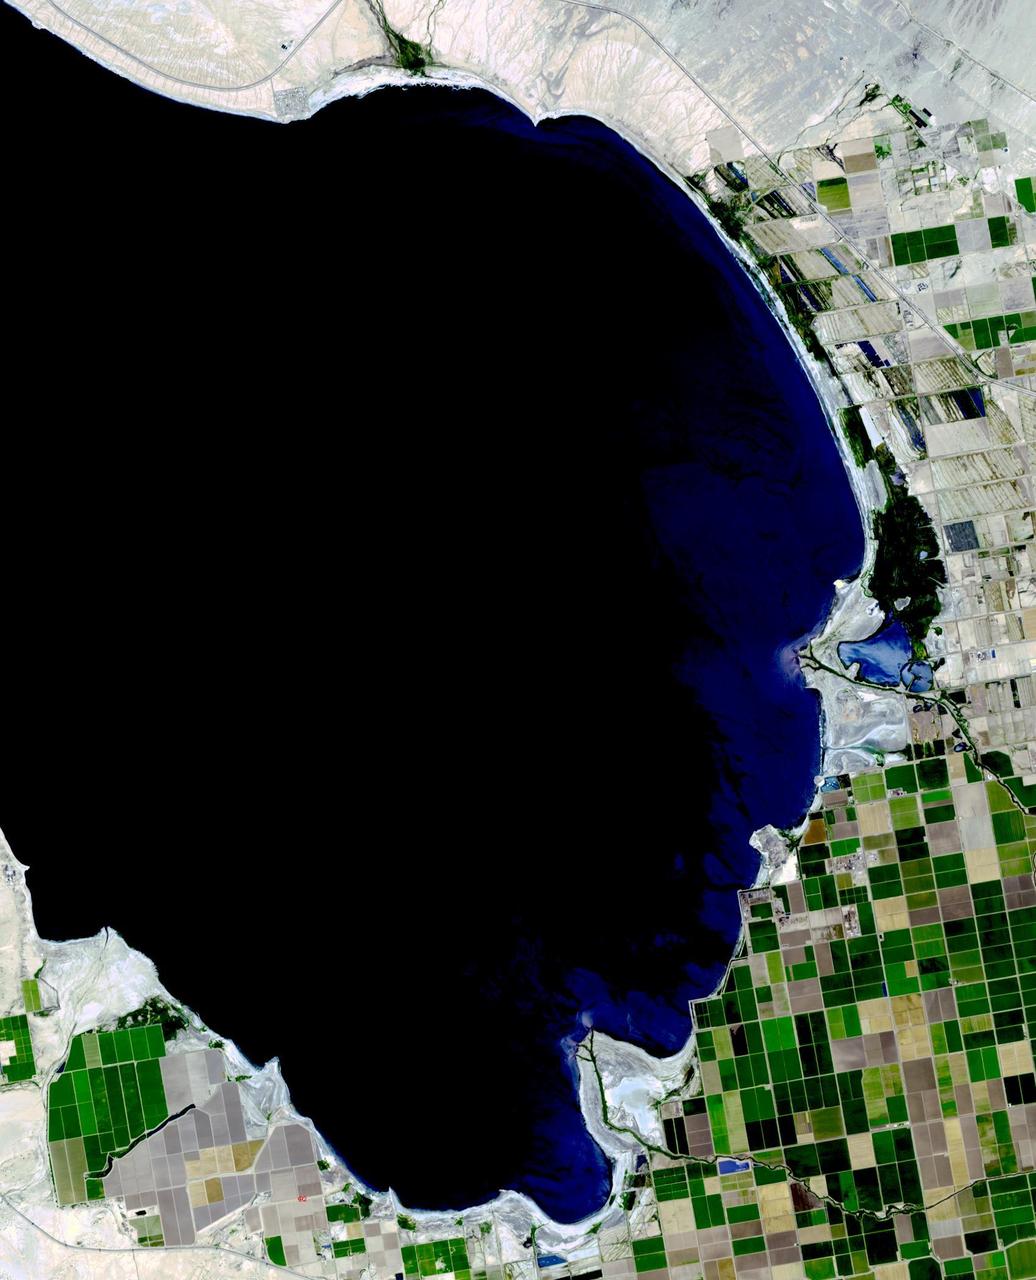
The Salton Sea in south California was created in 1905 when spring flooding on the Colorado River breached a canal. For 18 months the entire volume of the river rushed into the Salton Trough, creating a lake 32 km wide and 72 km long. In the 1950s, resorts sprang up along the shores. However, shrinking of the lake and increased salinity led to the abandonment of the resorts. The two images show the shrinking lake on May 31, 1984 (Landsat) and June 14, 2015 (ASTER). The images cover an area of 37.5 x 27 km, and are located at 33.2 degrees north, 115.7 degrees west. http://photojournal.jpl.nasa.gov/catalog/PIA19786
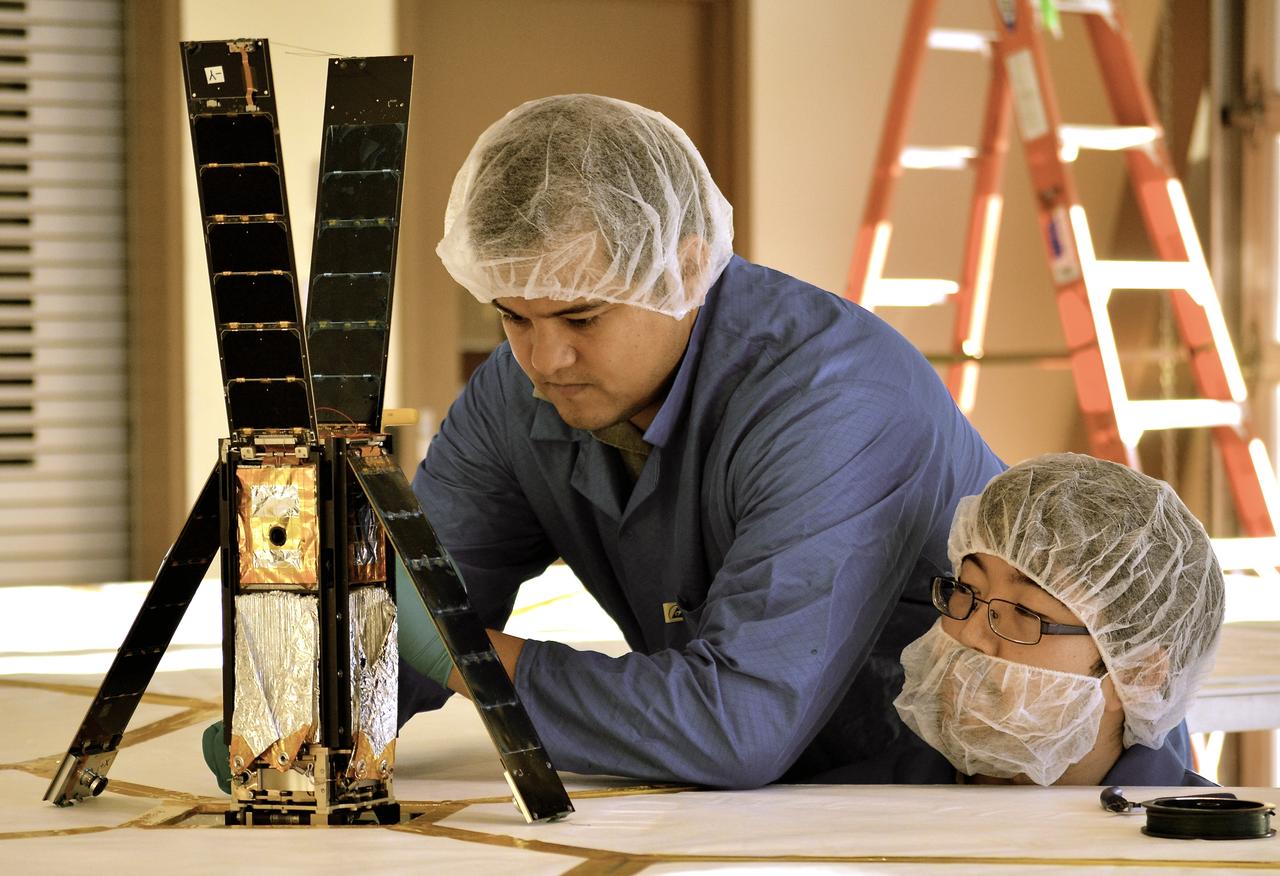
Students Alex Diaz and Riki Munakata of California Polytechnic State University testing the LightSail CubeSat. LightSail is a citizen-funded technology demonstration mission sponsored by the Planetary Society using solar propulsion for CubeSats. The spacecraft is designed to “sail” on the energy of solar photons striking the thin, reflective sail material. The first LightSail mission is designed to test the spacecraft’s critical systems, including the sequence to autonomously deploy a Mylar solar sail with an area of 32 square meters (344 square feet). The Planetary Society is planning a second, full solar sailing demonstration flight for 2016. Light is made of packets of energy called photons. While photons have no mass, they have energy and momentum. Solar sails use this momentum as a method of propulsion, creating flight by light. LightSail’s solar sail is packaged into a three-unit CubeSat about the size of a loaf of bread. Launched by NASA’s CubeSat Launch Initiative on the ELaNa XI mission as an auxiliary payload aboard the U.S. Air Force X-37B space plane mission on May 20, 2015.
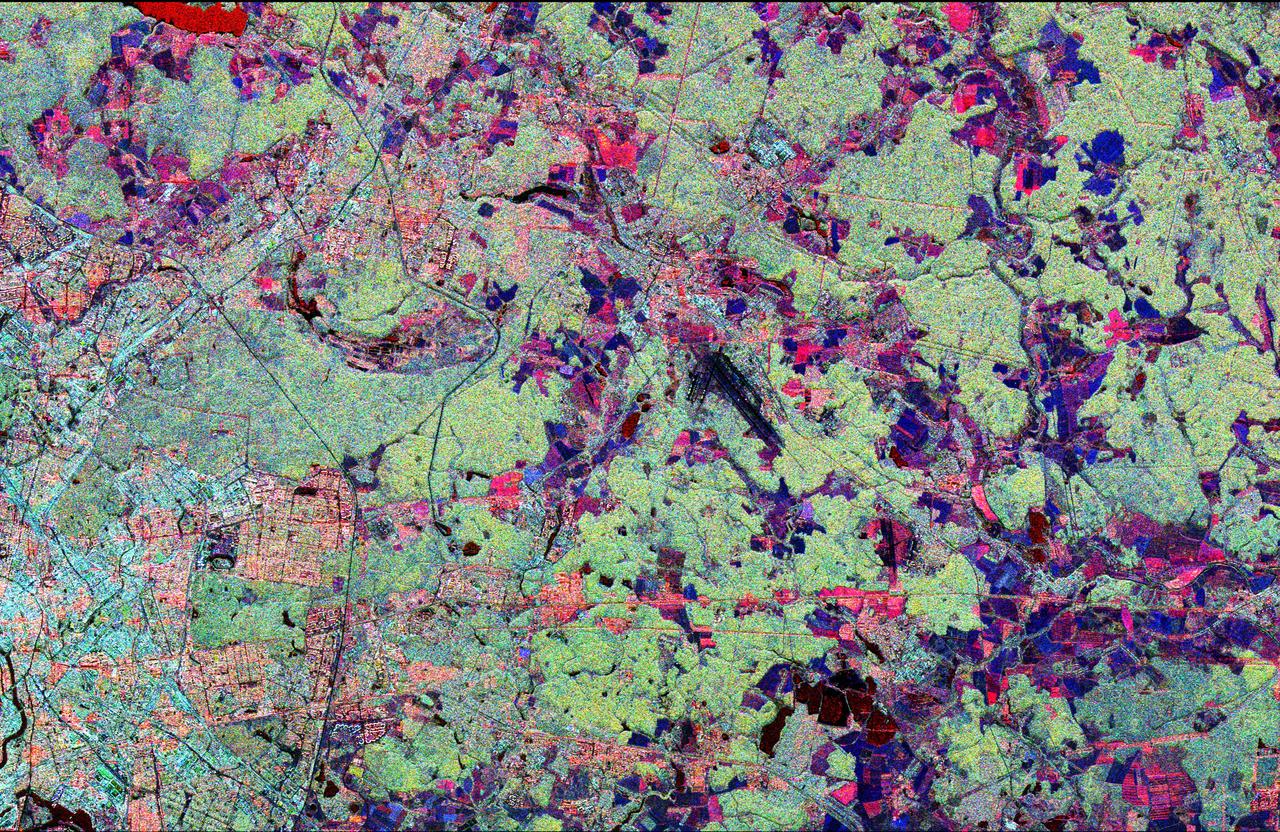
This radar image shows the Star City cosmonaut training center, east of Moscow, Russia. Four American astronauts are training here for future long-duration flights aboard the Russian Mir space station. These joint flights are giving NASA and the Russian Space Agency experience necessary for the construction of the international Alpha space station, beginning in late 1997. This image was acquired by the Spaceborne Imaging Radar-C/X-band Synthetic Aperture Radar (SIR-C/X-SAR), on its 62nd orbit on October 3, 1994. This Star City image is centered at 55.55 degrees north latitude and 38.0 degrees east longitude. The area shown is approximately 32 kilometers by 49 kilometers (20 miles by 30 miles). North is to the top in this image. The radar illumination is from the top of the image. The image was produced using three channels of SIR-C radar data: red indicates L-band (23 cm wavelength, horizontally transmitted and received); green indicates L-band (horizontally transmitted and vertically received); blue indicates C-band (6 cm wavelength, horizontally transmitted and vertically received). In general, dark pink areas are agricultural; pink and light blue areas are urban communities; black areas represent lakes and rivers; dark blue areas are cleared forest; and light green areas are forested. The prominent black runways just right of center are Shchelkovo Airfield, about 4 km long. The textured pale blue-green area east and southeast of Shchelkovo Airfield is forest. Just east of the runways is a thin railroad line running southeast; the Star City compound lies just east of the small bend in the rail line. Star City contains the living quarters and training facilities for Russian cosmonauts and their families. Moscow's inner loop road is visible at the lower left edge of the image. The Kremlin is just off the left edge, on the banks of the meandering Moskva River. The Klyazma River snakes to the southeast from the reservoir in the upper left (shown in bright red), passing just east of Star City and flowing off the lower right edge of the image. The dark blue band of the Vorya River runs north-south in the upper right quadrant, east of Star City. http://photojournal.jpl.nasa.gov/catalog/PIA01775
![In many ways, Mars bears remarkable similarities to Earth, but in some ways it is drastically different. Scientists often use Earth as an example, or analog, to help us to understand the geologic history of the Red Planet. As we continue to study Mars, it is vitally important to remember in what ways it differs from Earth. One very apparent way, readily observed from orbit, has to do with its preservation of numerous craters of all sizes, which are densest in its Southern hemisphere. Earth has comparatively little preserved craters -- about 1,000 to 1,500 times fewer -- due to very active geologic processes, especially involving water. When it comes to impact craters, there are some things that can no longer be observed on Earth, but can be observed on Mars. This color composite shows one such example. It covers a portion of the northern central peak of an unnamed, 20-kilometer crater that contains abundant fragmental bedrock called "breccia." The geological relationships here suggest that these breccias include ones formed by the host crater, and others formed from numerous impacts in the distant past. Because there are fewer craters preserved on Earth, terrestrial central uplifts do not expose bedrock formed by previous craters. It may have been the case in the past, but such craters were destroyed over geologic time. The map is projected here at a scale of 25 centimeters (9.9 inches) per pixel. [The original image scale is 28 centimeters (11 inches) per pixel (with 1 x 1 binning); objects on the order of 82 centimeters (32 inches) across are resolved.] North is up. http://photojournal.jpl.nasa.gov/catalog/PIA21455](https://images-assets.nasa.gov/image/PIA21455/PIA21455~medium.jpg)
In many ways, Mars bears remarkable similarities to Earth, but in some ways it is drastically different. Scientists often use Earth as an example, or analog, to help us to understand the geologic history of the Red Planet. As we continue to study Mars, it is vitally important to remember in what ways it differs from Earth. One very apparent way, readily observed from orbit, has to do with its preservation of numerous craters of all sizes, which are densest in its Southern hemisphere. Earth has comparatively little preserved craters -- about 1,000 to 1,500 times fewer -- due to very active geologic processes, especially involving water. When it comes to impact craters, there are some things that can no longer be observed on Earth, but can be observed on Mars. This color composite shows one such example. It covers a portion of the northern central peak of an unnamed, 20-kilometer crater that contains abundant fragmental bedrock called "breccia." The geological relationships here suggest that these breccias include ones formed by the host crater, and others formed from numerous impacts in the distant past. Because there are fewer craters preserved on Earth, terrestrial central uplifts do not expose bedrock formed by previous craters. It may have been the case in the past, but such craters were destroyed over geologic time. The map is projected here at a scale of 25 centimeters (9.9 inches) per pixel. [The original image scale is 28 centimeters (11 inches) per pixel (with 1 x 1 binning); objects on the order of 82 centimeters (32 inches) across are resolved.] North is up. http://photojournal.jpl.nasa.gov/catalog/PIA21455
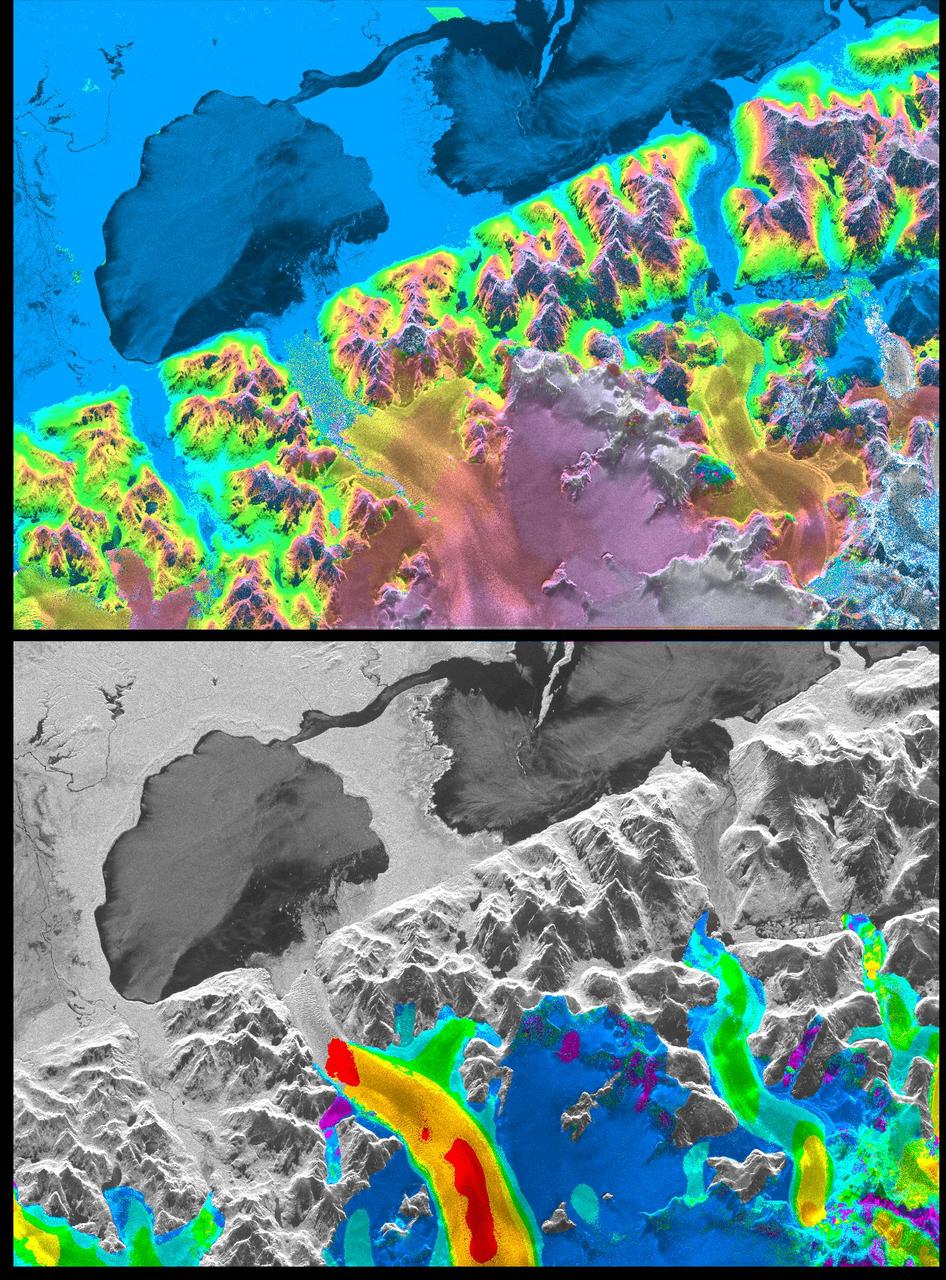
A NASA radar instrument has been successfully used to measure some of the fastest moving and most inaccessible glaciers in the world -- in Chile's huge, remote Patagonia ice fields -- demonstrating a technique that could produce more accurate predictions of glacial response to climate change and corresponding sea level changes. This image, produced with interferometric measurements made by the Spaceborne Imaging Radar-C and X-band Synthetic Aperture Radar (SIR-C/X-SAR) flown on the Space Shuttle last fall, has provided the first detailed measurements of the mass and motion of the San Rafael Glacier. Very few measurements have been made of the Patagonian ice fields, which are the world's largest mid-latitude ice masses and account for more than 60 percent of the Southern Hemisphere's glacial area outside of Antarctica. These features make the area essential for climatologists attempting to understand the response of glaciers on a global scale to changes in climate, but the region's inaccessibility and inhospitable climate have made it nearly impossible for scientists to study its glacial topography, meteorology and changes over time. Currently, topographic data exist for only a few glaciers while no data exist for the vast interior of the ice fields. Velocity has been measured on only five of the more than 100 glaciers, and the data consist of only a few single-point measurements. The interferometry performed by the SIR-C/X-SAR was used to generate both a digital elevation model of the glaciers and a map of their ice motion on a pixel-per-pixel basis at very high resolution for the first time. The data were acquired from nearly the same position in space on October 9, 10 and 11, 1994, at L-band frequency (24-cm wavelength), vertically transmitted and received polarization, as the Space Shuttle Endeavor flew over several Patagonian outlet glaciers of the San Rafael Laguna. The area shown in these two images is 50 kilometers by 30 kilometers (30 miles by 18 miles) in size and is centered at 46.6 degrees south latitude, 73.8 degrees west longitude. North is toward the upper right. The top image is a digital elevation model of the scene, where color and saturation represent terrain height (between 0 meters and 2,000 meters or up to 6,500 feet) and brightness represents radar backscatter. Low elevations are shown in blue and high elevations are shown in pink. The digital elevation map of the glacier surface has a horizontal resolution of 15 meters (50 feet) and a vertical resolution of 10 meters (30 feet). High-resolution maps like these acquired over several years would allow scientists to calculate directly long-term changes in the mass of the glacier. The bottom image is a map of ice motion parallel to the radar look direction only, which is from the top of the image. Purple indicates ice motion away from the radar at more than 6 centimeters per day; dark blue is ice motion toward or away at less than 6 cm per day; light blue is motion toward the radar of 6 cm to 20 cm (about 2 to 8 inches) per day; green is motion toward the radar of 20 cm to 45 cm (about 8 to 18 inches) per day; yellow is 45 cm to 85 cm (about 18 to 33 inches) per day; orange is 85 cm to 180 cm (about 33 to 71 inches) per day; red is greater than 180 cm (71 inches) per day. The velocity estimates are accurate to within 5 millimeters per day. The largest velocities are recorded on the San Rafael Glacier in agreement with previous work. Other outlet glaciers exhibit ice velocities of less than 1 meter per day. Several kilometers before its terminus, (left of center) the velocity of the San Rafael Glacier exceeds 10 meters (32 feet) per day, and ice motion cannot be estimated from the data. There, a revisit time interval of less than 12 hours would have been necessary to estimate ice motion from interferometry data. The results however demonstrate that the radar interferometry technique permits the monitoring of glacier characteristics unattainable by any other means. http://photojournal.jpl.nasa.gov/catalog/PIA01781