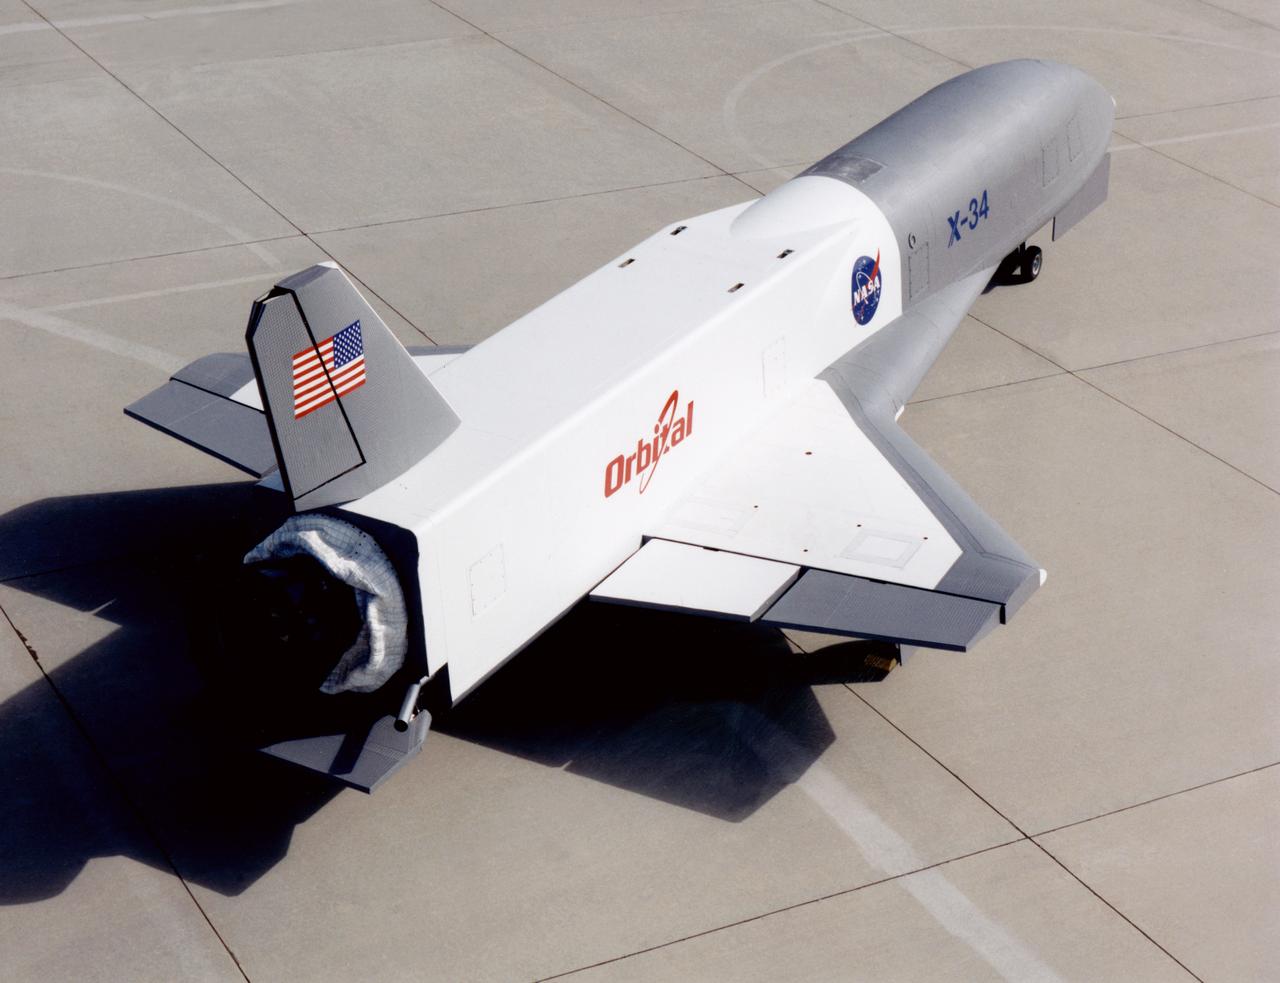
X-34 Technology Testbed Demonstrator on NASA Dryden ramp

X-34 mated to modified L-1011 during takeoff on first captive carry flight

X-34 mated to modified L-1011 during takeoff on first captive carry flight

X-34 mated to modified L-1011 during takeoff on first captive carry flight

Atlas Image mosaic, covering 34 x 34 on the sky, of the Coma cluster, aka Abell 1656. This is a particularly rich cluster of individual galaxies over 1000 members, most prominently the two giant ellipticals, NGC 4874 right and NGC 4889 left.
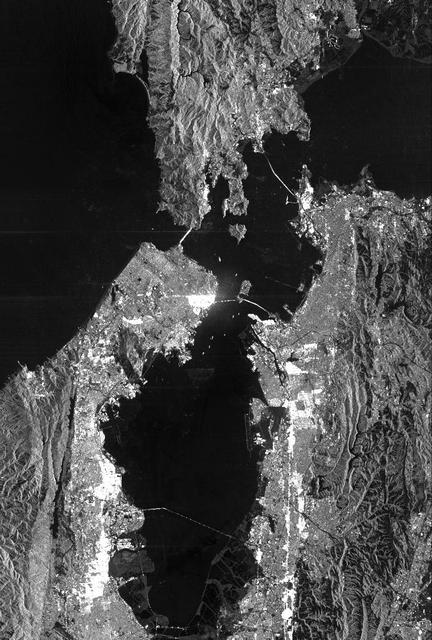
This is a radar image of San Francisco, California, taken on October 3,1994. The image is about 40 kilometers by 55 kilometers (25 miles by 34 miles) with north toward the upper right. Downtown San Francisco is visible in the center of the image with the city of Oakland east (to the right) across San Francisco Bay. Also visible in the image is the Golden Gate Bridge (left center) and the Bay Bridge connecting San Francisco and Oakland. North of the Bay Bridge is Treasure Island. Alcatraz Island appears as a small dot northwest of Treasure Island. This image was acquired by the Spaceborne Imaging Radar-C and X-band Synthetic Aperture Radar (SIR-C/X-SAR) aboard the space shuttle Endeavour on orbit 56. The image is centered at 37 degrees north latitude, 122degrees west longitude. This single-frequency SIR-C image was obtained by the L-band (24 cm) radar channel, horizontally transmitted and received. Portions of the Pacific Ocean visible in this image appear very dark as do other smooth surfaces such as airport runways. Suburban areas, with the low-density housing and tree-lined streets that are typical of San Francisco, appear as lighter gray. Areas with high-rise buildings, such as those seen in the downtown areas, appear in very bright white, showing a higher density of housing and streets which run parallel to the radar flight track. http://photojournal.jpl.nasa.gov/catalog/PIA01751
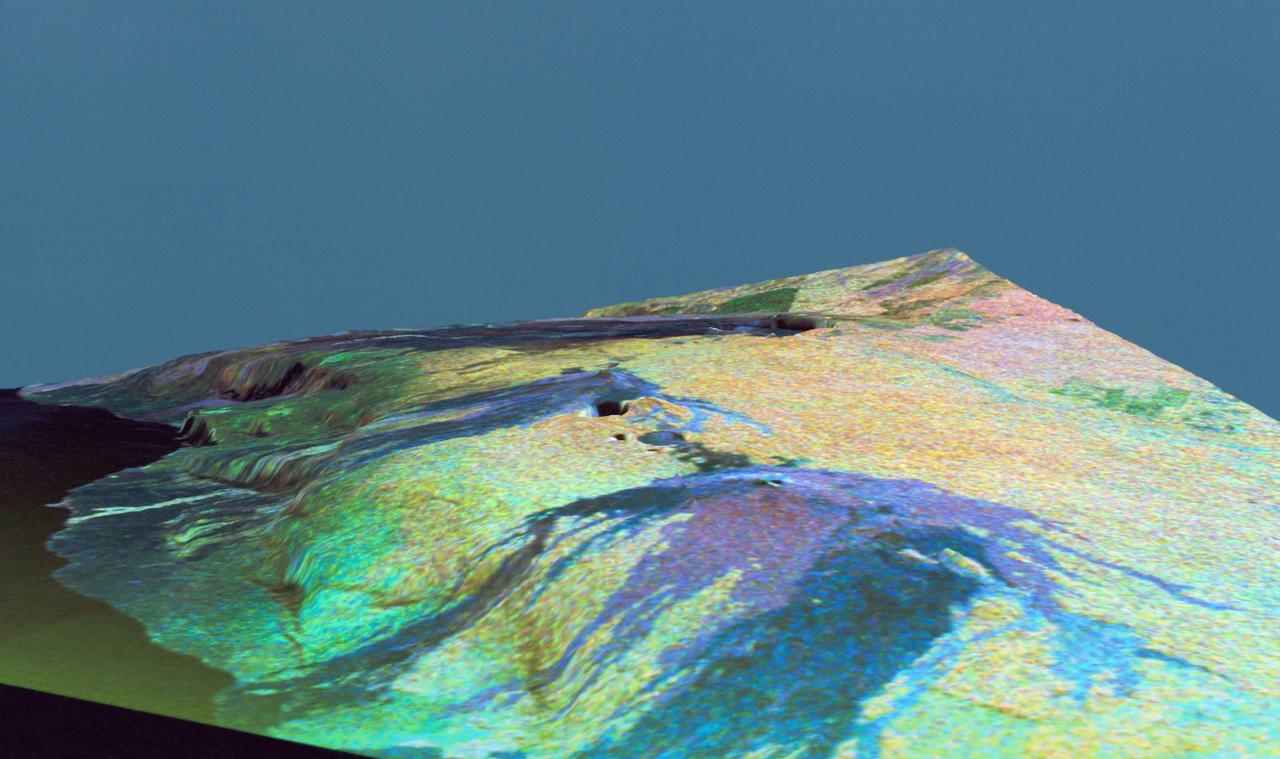
This is a three dimensional perspective view of false-color image of the eastern part of the Big Island of Hawaii. It was produced using all three radar frequencies C-Band and L-Band. This view was constructed by overlaying a SIR-C radar image on a U.S. Geological Survey digital elevation map. The image was acquired on April 12, 1994 during the 52nd orbit of the Shuttle Endeavour by the Spaceborne Imaging Radar-C and X-Band Synthetic Aperture Radar (SIR-C/X-SAR). The area shown is approximately 34 by 57 kilomters with the top of the image pointing toward north-west. The image is centered at about 155.25 degrees west longitude and 19.5 degrees north latitude. Visible in the center of the image in blue are the summit crater (Kilauea Caidera) which contains the smaller Halemaumau Crater, and the line of collapsed craters below them that form the Chain of Craters Road. The rain forest appears bright in the image while green areas correspond to lower vegetation. The lava flows have different colors depending on their types and are easily recognizable due to their shapes. The flows at the top of the image originated from the Muana Loa volcano. The Jet Propulsion Laboratory alternative photo number is P-43932.
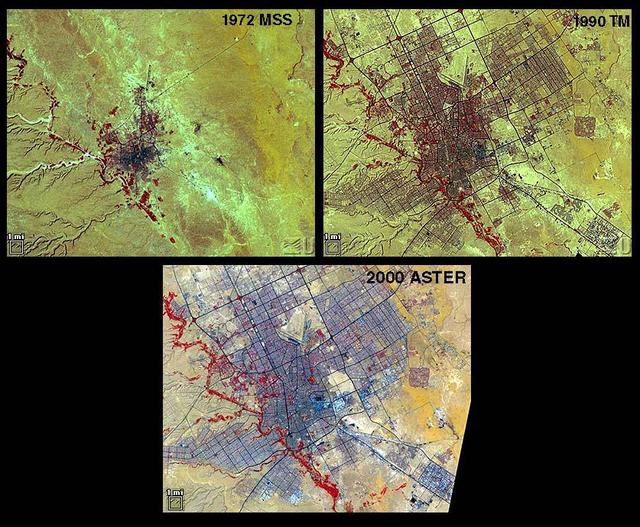
Riyadh, the national capital of Saudi Arabia, is shown in 1972, 1990 and 2000. Its population grew in these years from about a half million to more than two million. Saudi Arabia experienced urbanization later than many other countries; in the early 1970s its urban-rural ratio was still about 1:3. By 1990 that had reversed to about 3:1. The city grew through in-migration from rural areas, and from decreases in the death rate while birthrates remained high. The 1972 image is a Landsat MSS scene; the 1990 image is a Landsat Thematic Mapper scene; and the 2000 image is an ASTER scene. All three images cover an area of about 27 x 34 km. The image is centered at 24.6 degrees north latitude, 46.6 degrees east longitude. http://photojournal.jpl.nasa.gov/catalog/PIA11087
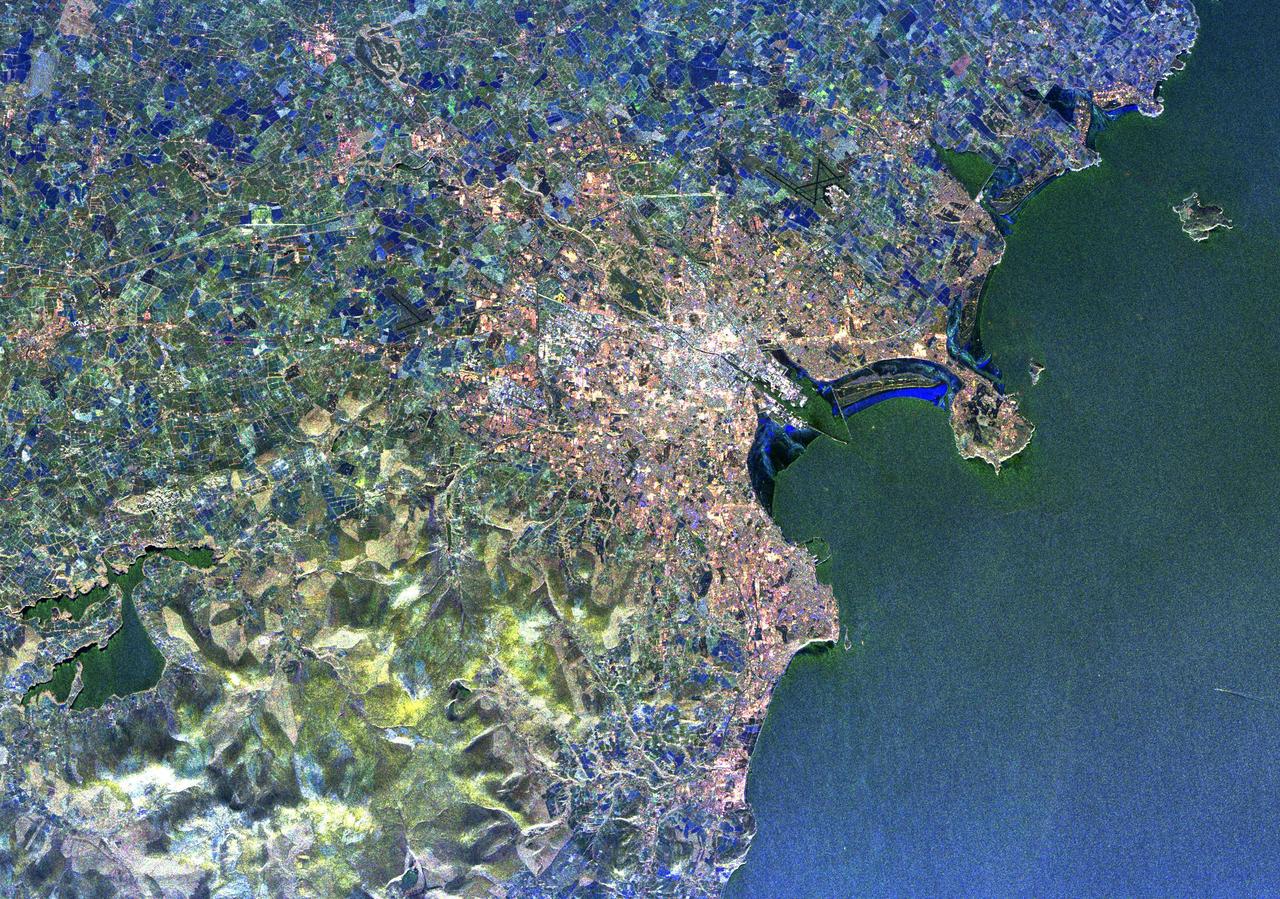
Visualization Date 1994-04-11 This radar image of Dublin, Ireland, shows how the radar distingishes between densely populated urban areas and nearby areas that are relatively unsettled. In the center of the image is the city's natural harbor along the Irish Sea. The pinkish areas in the center are the densely populated parts of the city and the blue/green areas are the suburbs. The two ends of the Dublin Bay are Howth Point, the circular peninsula near the upper right side of the image, and Dun Laoghaire, the point to the south. The small island just north of Howth is called "Ireland's Eye," and the larger island, near the upper right corner of the image is Lambay Island. The yellow/green mountains in the lower left of the image (south) are the Wicklow Mountains. The large lake in the lower left, nestled within these mountains, is the Poulaphouca Reservoir along River Liffey. The River Liffey, the River Dodder and the Tolka River are the three rivers that flow into Dublin. The straight features west of the city are the Grand Canal and the three rivers are the faint lines above and below these structures. The dark X-shaped feature just to the north of the city is the Dublin International Airport. The image was acquired by the Spaceborne Imaging Radar-C/X-band Synthetic Aperture (SIR-C/X-SAR) when it flew aboard the space shuttle Endeavour on April 11, 1994. This area is centered at 53.3 degrees north latitude, 6.2 degrees west longitude. The area shown is approximately 55 kilometers by 42 kilometers (34 miles by 26 miles). The colors are assigned to different frequencies and polarizations of the radar as follows: Red is L-band horizontally transmitted, horizontally received; green is L-band vertically transmitted, vertically received; and blue is C-band vertically transmitted, vertically received. SIR-C/X-SAR, a joint mission of the German, Italian, and the United States space agencies, is part of NASA's Mission to Planet Earth. Credit: NASA/GSFC For more information go to: <a href="http://visibleearth.nasa.gov/view_rec.php?id=467" rel="nofollow">visibleearth.nasa.gov/view_rec.php?id=467</a>

This is an image of Taal volcano, near Manila on the island of Luzon in the Philippines. The black area in the center is Taal Lake, which nearly fills the 30-kilometer-diameter (18-mile) caldera. The caldera rim consists of deeply eroded hills and cliffs. The large island in Taal Lake, which itself contains a crater lake, is known as Volcano Island. The bright yellow patch on the southwest side of the island marks the site of an explosion crater that formed during a deadly eruption of Taal in 1965. The image was acquired by the Spaceborne Imaging Radar-C/X-band Synthetic Aperture Radar (SIR-C/X-SAR) aboard the space shuttle Endeavour on its 78th orbit on October 5, 1994. The image shows an area approximately 56 kilometers by 112 kilometers (34 miles by 68 miles) that is centered at 14.0 degrees north latitude and 121.0 degrees east longitude. North is toward the upper right of the image. The colors in this image were obtained using the following radar channels: red represents the L-band (horizontally transmitted and received); green represents the L-band (horizontally transmitted and vertically received); blue represents the C-band (horizontally transmitted and vertically received). Since 1572, Taal has erupted at least 34 times. Since early 1991, the volcano has been restless, with swarms of earthquakes, new steaming areas, ground fracturing, and increases in water temperature of the lake. Volcanologists and other local authorities are carefully monitoring Taal to understand if the current activity may foretell an eruption. Taal is one of 15 "Decade Volcanoes" that have been identified by the volcanology community as presenting large potential hazards to population centers. The bright area in the upper right of the image is the densely populated city of Manila, only 50 kilometers (30 miles) north of the central crater. http://photojournal.jpl.nasa.gov/catalog/PIA01768
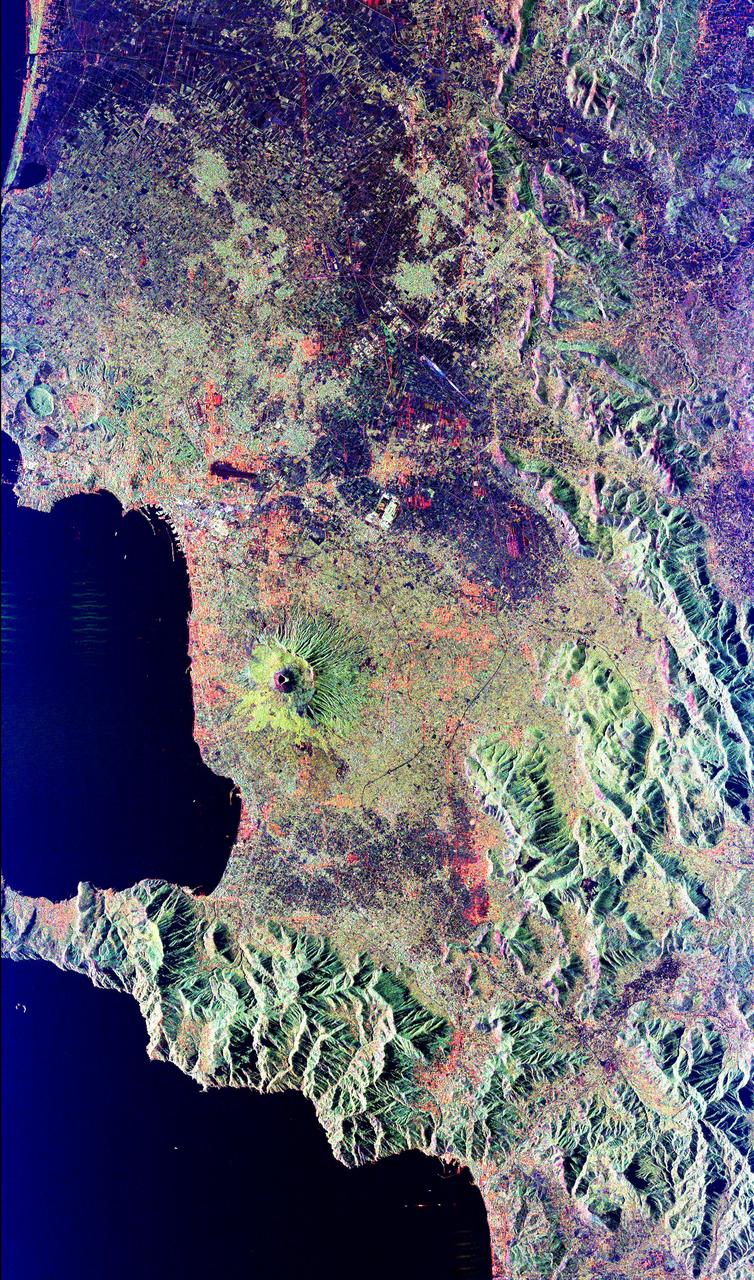
Mt. Vesuvius, one of the best known volcanoes in the world primarily for the eruption that buried the Roman city of Pompeii, is shown in the center of this radar image. The central cone of Vesuvius is the dark purple feature in the center of the volcano. This cone is surrounded on the northern and eastern sides by the old crater rim, called Mt. Somma. Recent lava flows are the pale yellow areas on the southern and western sides of the cone. Vesuvius is part of a large volcanic zone which includes the Phalagrean Fields, the cluster of craters seen along the left side of the image. The Bay of Naples, on the left side of the image, is separated from the Gulf of Salerno, in the lower left, by the Sorrento Peninsula. Dense urban settlement can be seen around the volcano. The city of Naples is above and to the left of Vesuvius; the seaport of the city can be seen in the top of the bay. Pompeii is located just below the volcano on this image. The rapid eruption in 79 A.D. buried the victims and buildings of Pompeii under several meters of debris and killed more than 2,000 people. Due to the violent eruptive style and proximity to populated areas, Vesuvius has been named by the international scientific community as one of fifteen Decade Volcanoes which are being intensively studied during the 1990s. The image is centered at 40.83 degrees North latitude, 14.53 degrees East longitude. It shows an area 100 kilometers by 55 kilometers (62 miles by 34 miles.) This image was acquired on April 15, 1994 by the Spaceborne Imaging Radar-C/X-Band Synthetic Aperture Radar (SIR-C/X-SAR) aboard the Space Shuttle Endeavour. SIR-C/X-SAR, a joint mission of the German, Italian and the United States space agencies, is part of NASA's Mission to Planet Earth. http://photojournal.jpl.nasa.gov/catalog/PIA01780
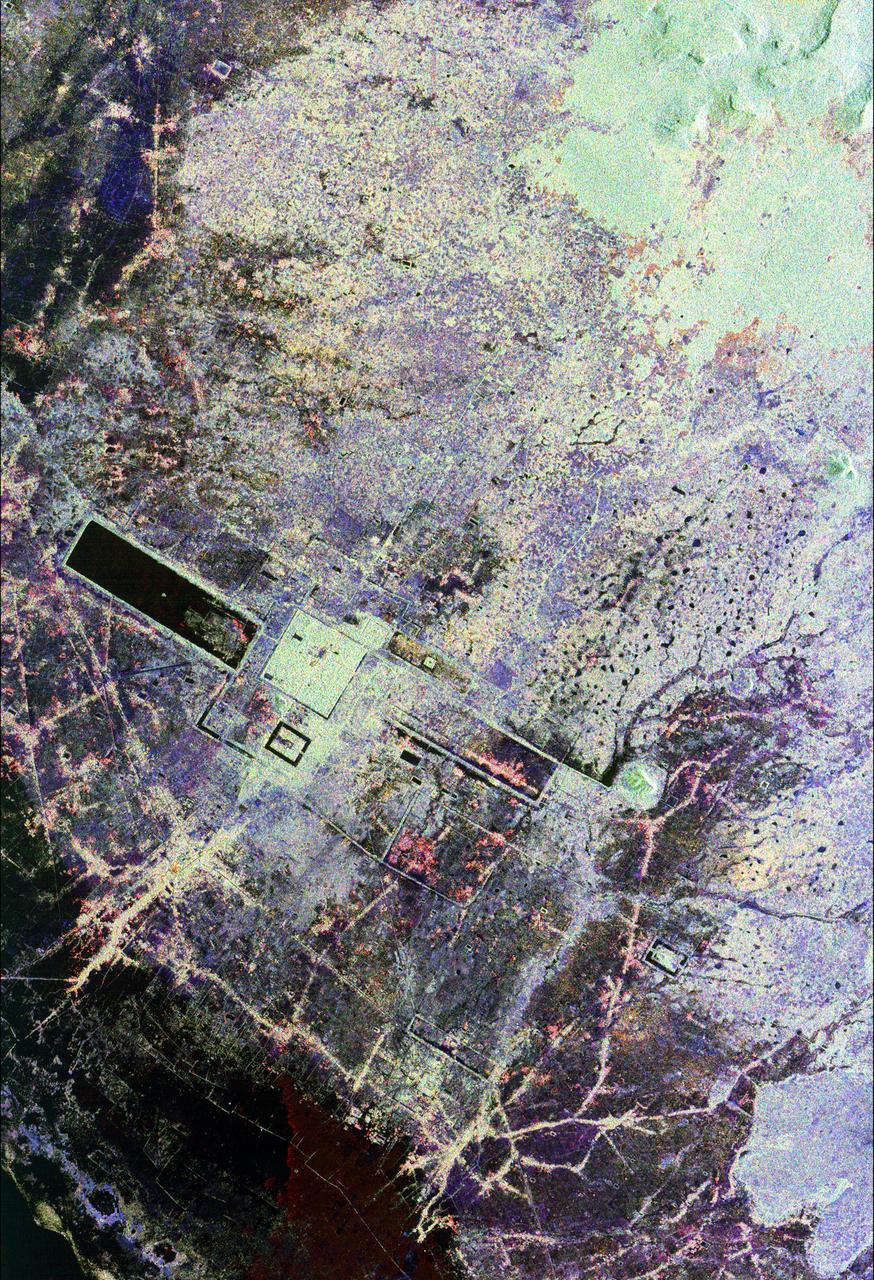
This is an image of the area around the city of Angkor, Cambodia. The city houses an ancient complex of more than 60 temples dating back to the 9th century. The principal complex, Angkor Wat, is the bright square just left of the center of the image. It is surrounded by a reservoir that appears in this image as a thick black line. The larger bright square above Angkor Wat is another temple complex called Angkor Thom. Archeologists studying this image believe the blue-purple area slightly north of Angkor Thom may be previously undiscovered structures. In the lower right is a bright rectangle surrounded by a dark reservoir, which houses the temple complex Chau Srei Vibol. In its heyday, Angkor had a population of 1 million residents and was the spiritual center for the Khmer people until it was abandoned in the 15th century. The image was acquired by the Spaceborne Imaging Radar-C/X-band Synthetic Aperture Radar (SIR-C/X-SAR) on the 15th orbit of the space shuttle Endeavour on September 30, 1994. The image shows an area approximately 55 kilometers by 85 kilometers (34 miles by 53 miles) that is centered at 13.43 degrees north latitude and 103.9 degrees east longitude. The colors in this image were obtained using the following radar channels: red represents the L-band (horizontally transmitted and received); green represents the L-band (horizontally transmitted and vertically received); blue represents the C-band (horizontally transmitted and vertically received). The body of water in the south-southwest corner is Tonle Sap, Cambodia's great central lake. The urban area at the lower left of the image is the present-day town of Siem Reap. The adjoining lines are both modern and ancient roads and the remains of Angkor's vast canal system that was used for both irrigation and transportation. The large black rectangles are ancient reservoirs. Today the Angkor complex is hidden beneath a dense rainforest canopy, making it difficult for researchers on the ground to study the ancient city. The SIR-C/X-SAR data are being used by archaeologists at the World Monuments Fund and the Royal Angkor Foundation to understand how the city grew, flourished and later fell into disuse over an 800-year period. The data are also being used to help reconstruct the vast system of hydrological works, canals and reservoirs, which have gone out of use over time. Research teams from more than 11 countries will be using this data to study the Angkor complex. http://photojournal.jpl.nasa.gov/catalog/PIA00505
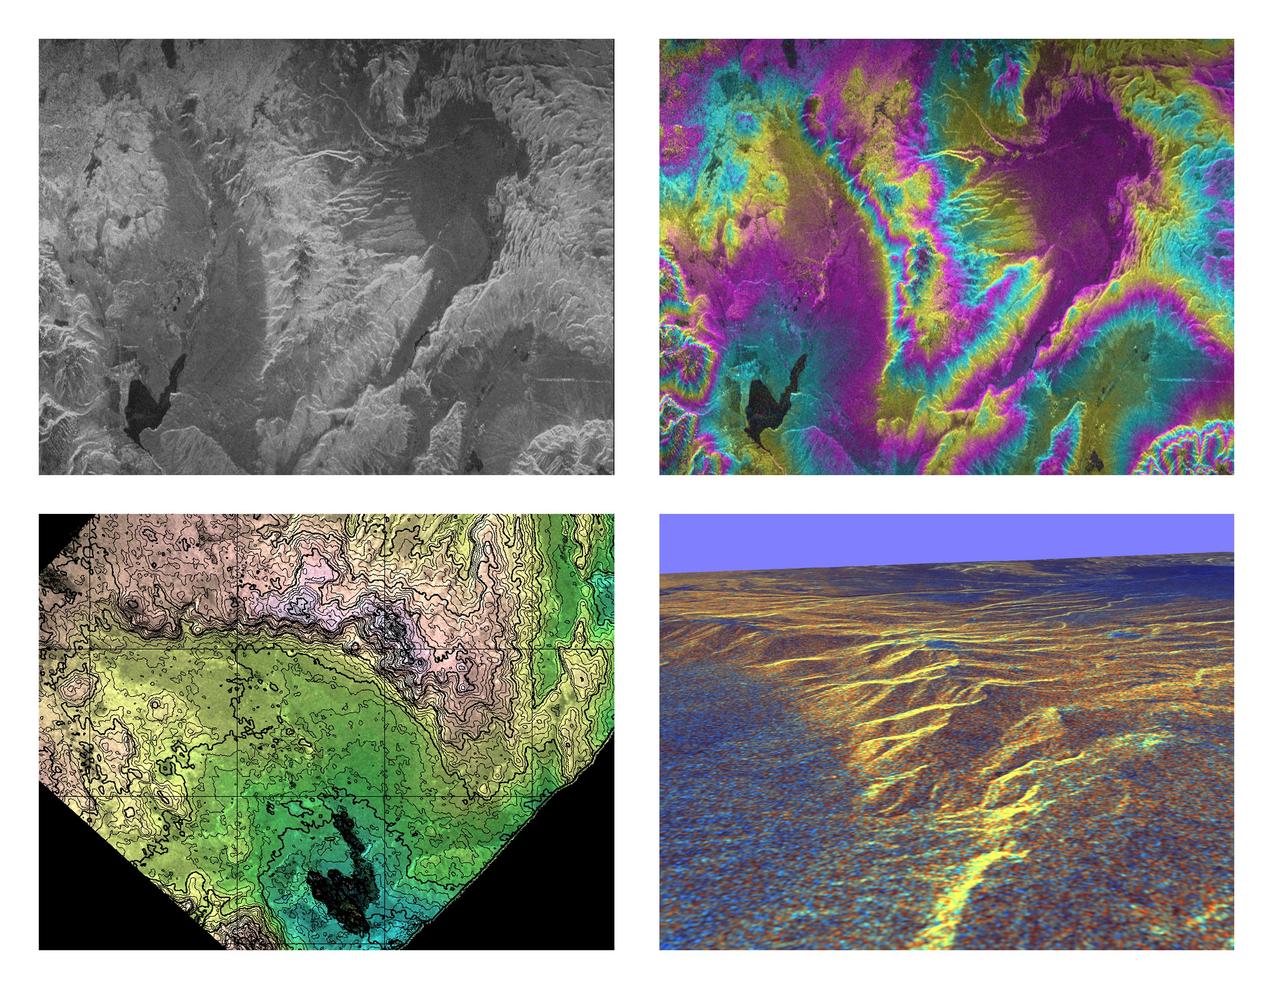
These four images of the Long Valley region of east-central California illustrate the steps required to produced three dimensional data and topographics maps from radar interferometry. All data displayed in these images were acquired by the Spaceborne Imaging Radar-C/X-band Synthetic Aperture Radar (SIR-C/X-SAR) aboard the space shuttle Endeavour during its two flights in April and October, 1994. The image in the upper left shows L-band (horizontally transmitted and received) SIR-C radar image data for an area 34 by 59 kilometers (21 by 37 miles). North is toward the upper right; the radar illumination is from the top of the image. The bright areas are hilly regions that contain exposed bedrock and pine forest. The darker gray areas are the relatively smooth, sparsely vegetated valley floors. The dark irregular patch near the lower left is Lake Crowley. The curving ridge that runs across the center of the image from top to bottom is the northeast rim of the Long Valley Caldera, a remnant crater from a massive volcanic eruption that occurred about 750,000 years ago. The image in the upper right is an interferogram of the same area, made by combining SIR-C L-band data from the April and October flights. The colors in this image represent the difference in the phase of the radar echoes obtained on the two flights. Variations in the phase difference are caused by elevation differences. Formation of continuous bands of phase differences, known as interferometric "fringes," is only possible if the two observations were acquired from nearly the same position in space. For these April and October data takes, the shuttle tracks were less than 100 meters (328 feet) apart. The image in the lower left shows a topographic map derived from the interferometric data. The colors represent increments of elevation, as do the thin black contour lines, which are spaced at 50-meter (164-foot) elevation intervals. Heavy contour lines show 250-meter intervals (820-foot). Total relief in this area is about 1,320 meters (4,330 feet). Brightness variations come from the radar image, which has been geometrically corrected to remove radar distortions and rotated to have north toward the top. The image in the lower right is a three-dimensional perspective view of the northeast rim of the Long Valley caldera, looking toward the northwest. SIR-C C-band radar image data are draped over topographic data derived from the interferometry processing. No vertical exaggeration has been applied. Combining topographic and radar image data allows scientists to examine relationships between geologic structures and landforms, and other properties of the land cover, such as soil type, vegetation distribution and hydrologic characteristics. http://photojournal.jpl.nasa.gov/catalog/PIA01770

The city of Calcutta appears in this 24 by 34 km (15 by 21 mile) sub-scene, acquired March 29, 2000. In 1690 the British East India Company founded Calcutta as a trading post on the marshy east bank of the Hugli River. Chosen for its easily defensible location and its access to the Bay of Bengal, the site developed into an important trading port. In 1773 Calcutta was made the capital of British India. As merchants and workers from all over the Indian subcontinent flocked to the city, British interests prospered, and British colonizers built mansions and palaces on land reclaimed from the marshes and swampland. In 1912, however, Calcutta lost its position as the colonial capital to Delhi. The end of British rule in India in 1947 cut off many of Calcutta's sources of trade and brought a deluge of immigrants to the city. The Bangladesh war in 1971 exacerbated the influx of refugees. Today this vibrant city has a population of over 5 million, and continues to sprawl to the north and south from the central grid of its old European section. This image was acquired on June 23, 2002, covers an area of 33 x 27 km, and is located at 22.6 degrees north latitude and 88.3 degrees east longitude. http://photojournal.jpl.nasa.gov/catalog/PIA11157
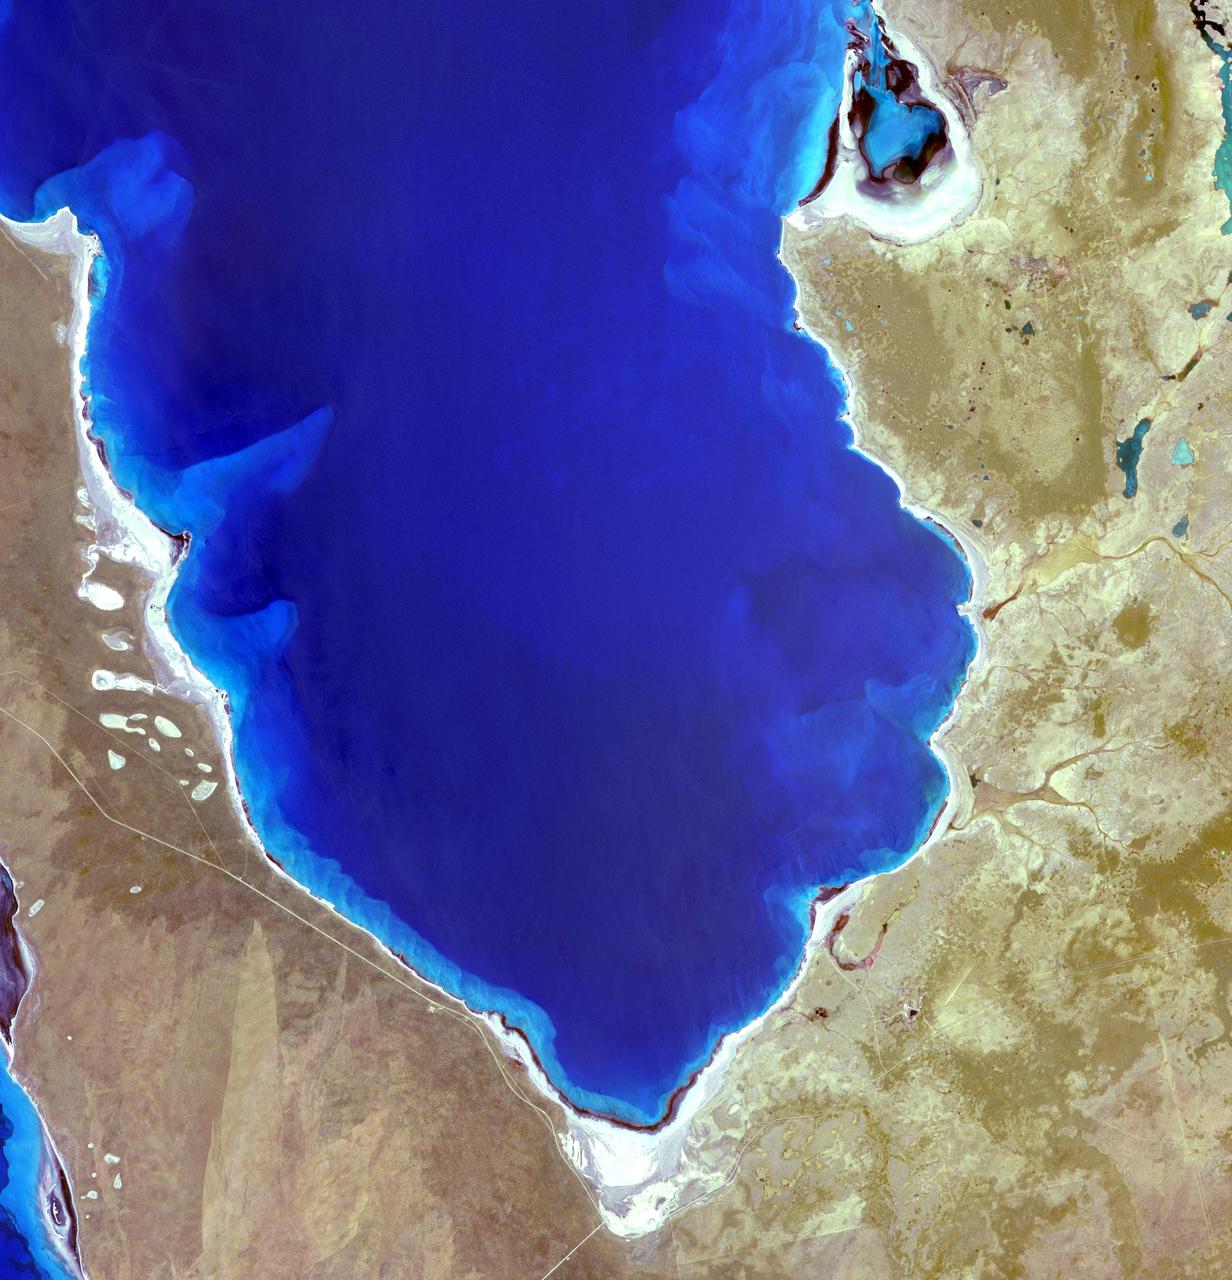
Hamelin Pool Marine Nature Reserve is located in the Shark Bay World Heritage Site in Western Australia. It is one of the very few places in the world where living stromatolites can be found. These are the first living examples of structures built by cyanobacteria. These bacteria are direct descendants of the oldest form of photosynthetic life on earth, dating back 3,500 million years (Wikipedia). The image was acquired December 30, 2010, covers an area of 34 x 46 km, and is located at 26.4 degrees south latitude, 114.1 degrees east longitude. With its 14 spectral bands from the visible to the thermal infrared wavelength region and its high spatial resolution of 15 to 90 meters (about 50 to 300 feet), ASTER images Earth to map and monitor the changing surface of our planet. ASTER is one of five Earth-observing instruments launched Dec. 18, 1999, on Terra. The instrument was built by Japan's Ministry of Economy, Trade and Industry. A joint U.S./Japan science team is responsible for validation and calibration of the instrument and data products. The broad spectral coverage and high spectral resolution of ASTER provides scientists in numerous disciplines with critical information for surface mapping and monitoring of dynamic conditions and temporal change. Example applications are: monitoring glacial advances and retreats; monitoring potentially active volcanoes; identifying crop stress; determining cloud morphology and physical properties; wetlands evaluation; thermal pollution monitoring; coral reef degradation; surface temperature mapping of soils and geology; and measuring surface heat balance. The U.S. science team is located at NASA's Jet Propulsion Laboratory, Pasadena, Calif. The Terra mission is part of NASA's Science Mission Directorate, Washington, D.C. More information about ASTER is available at <a href="http://asterweb.jpl.nasa.gov/" rel="nofollow">asterweb.jpl.nasa.gov/</a>. Credit: NASA/GSFC/METI/ERSDAC/JAROS, and U.S./Japan ASTER Science Team Image Addition Date: 2013-03-15 <b><a href="http://www.nasa.gov/audience/formedia/features/MP_Photo_Guidelines.html" rel="nofollow">NASA image use policy.</a></b> <b><a href="http://www.nasa.gov/centers/goddard/home/index.html" rel="nofollow">NASA Goddard Space Flight Center</a></b> enables NASA’s mission through four scientific endeavors: Earth Science, Heliophysics, Solar System Exploration, and Astrophysics. Goddard plays a leading role in NASA’s accomplishments by contributing compelling scientific knowledge to advance the Agency’s mission. <b>Follow us on <a href="http://twitter.com/NASA_GoddardPix" rel="nofollow">Twitter</a></b> <b>Like us on <a href="http://www.facebook.com/pages/Greenbelt-MD/NASA-Goddard/395013845897?ref=tsd" rel="nofollow">Facebook</a></b> <b>Find us on <a href="http://instagram.com/nasagoddard?vm=grid" rel="nofollow">Instagram</a></b>