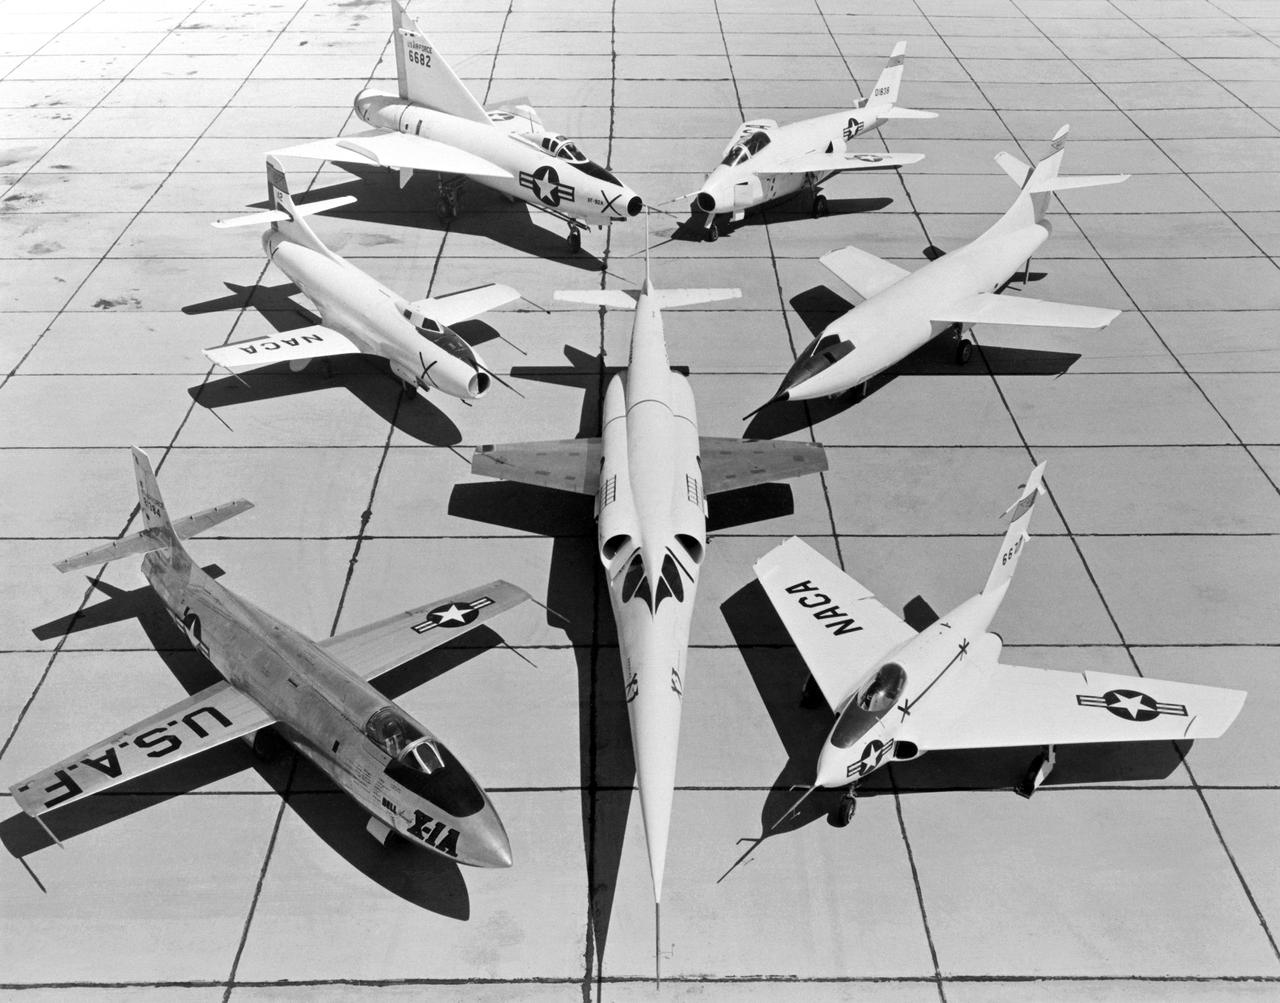
A 1953 photo of some of the research aircraft at the NACA High-Speed Flight Research Station (now known as the the Dryden Flight Research Center). The photo shows the X-3 (center) and, clockwise from left: X-1A (Air Force serial number 48-1384), the third D-558-1 (NACA tail number 142), XF-92A, X-5, D-558-2, and X-4.

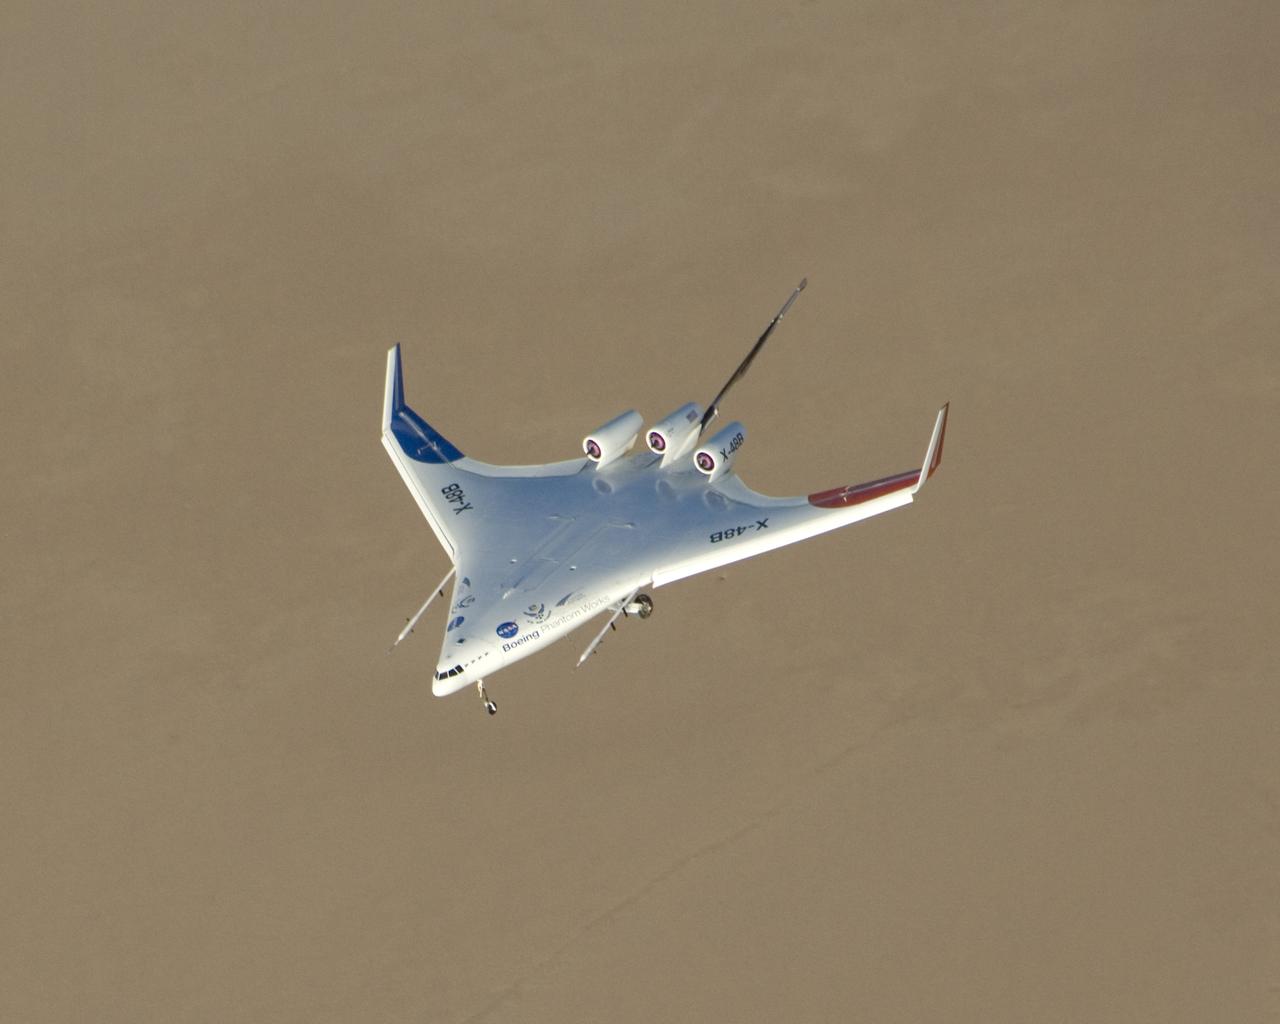
Boeing's sub-scale X-48B Blended Wing Body aircraft flies over the edge of Rogers Dry Lake at Edwards Air Force Base during its fifth flight on Aug. 14, 2007.
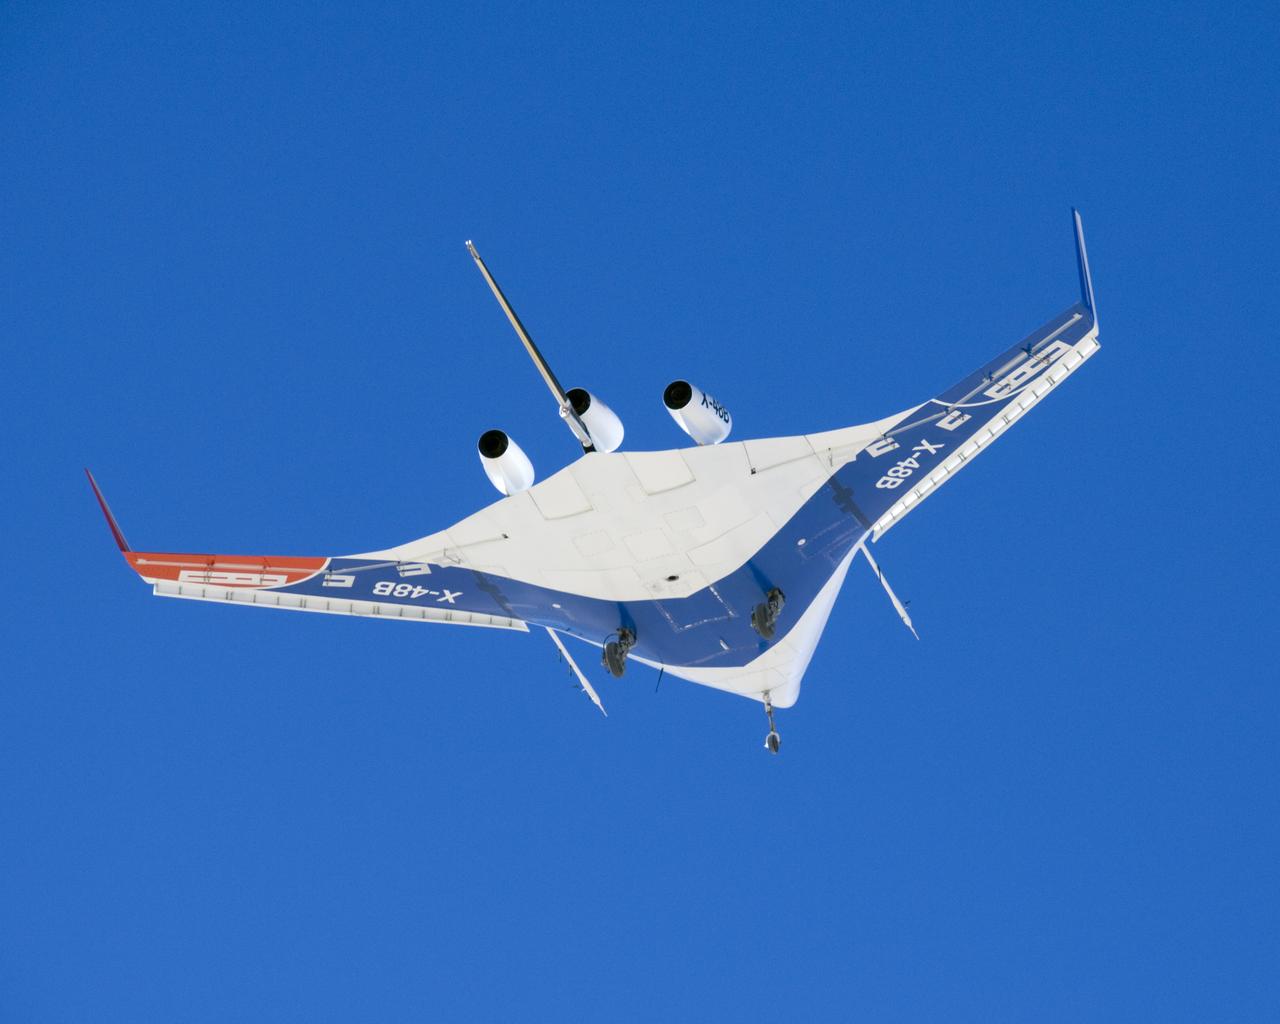
A pristine blue sky backdrops the X-48B Blended Wing Body aircraft during the aircraft's first flight July 20, 2007, from NASA's Dryden Flight Research Center.

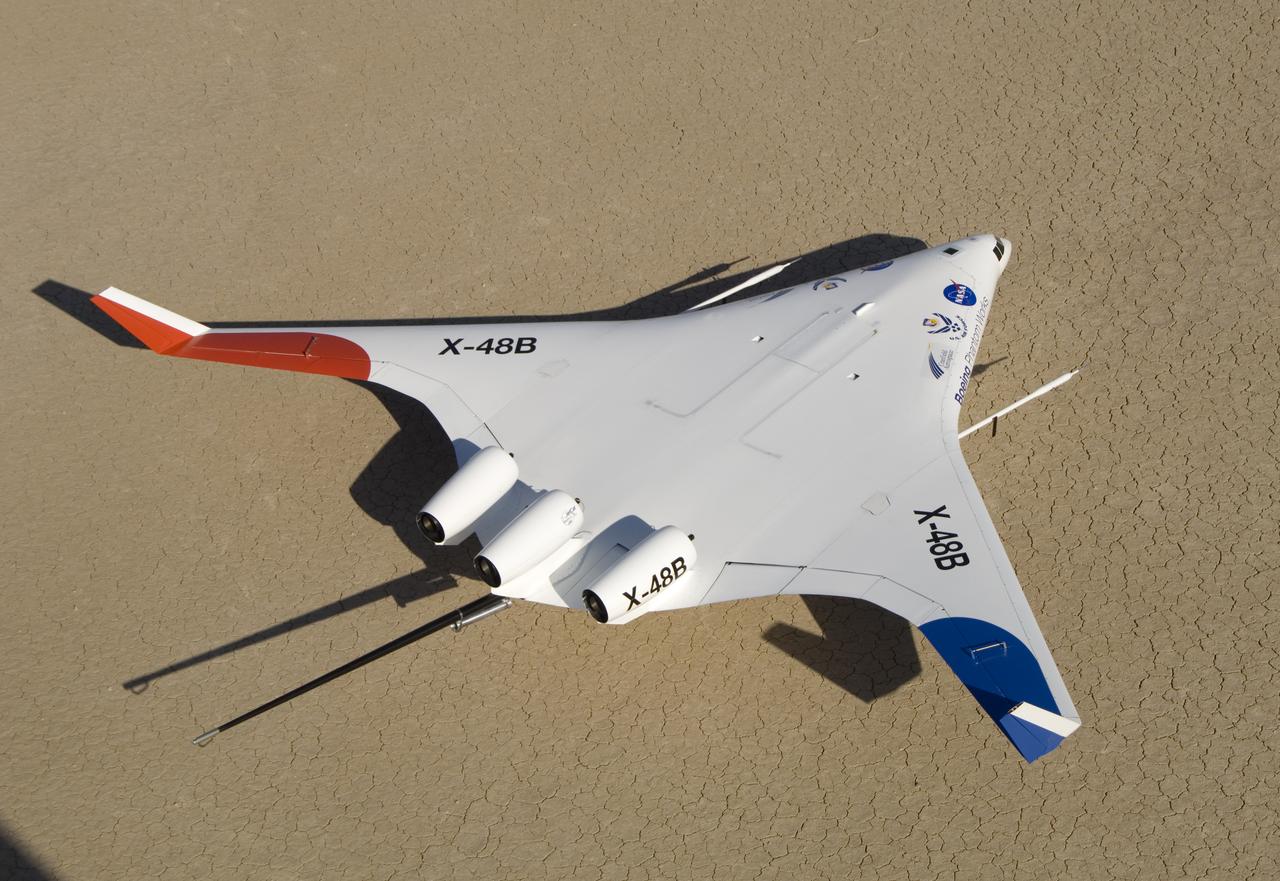
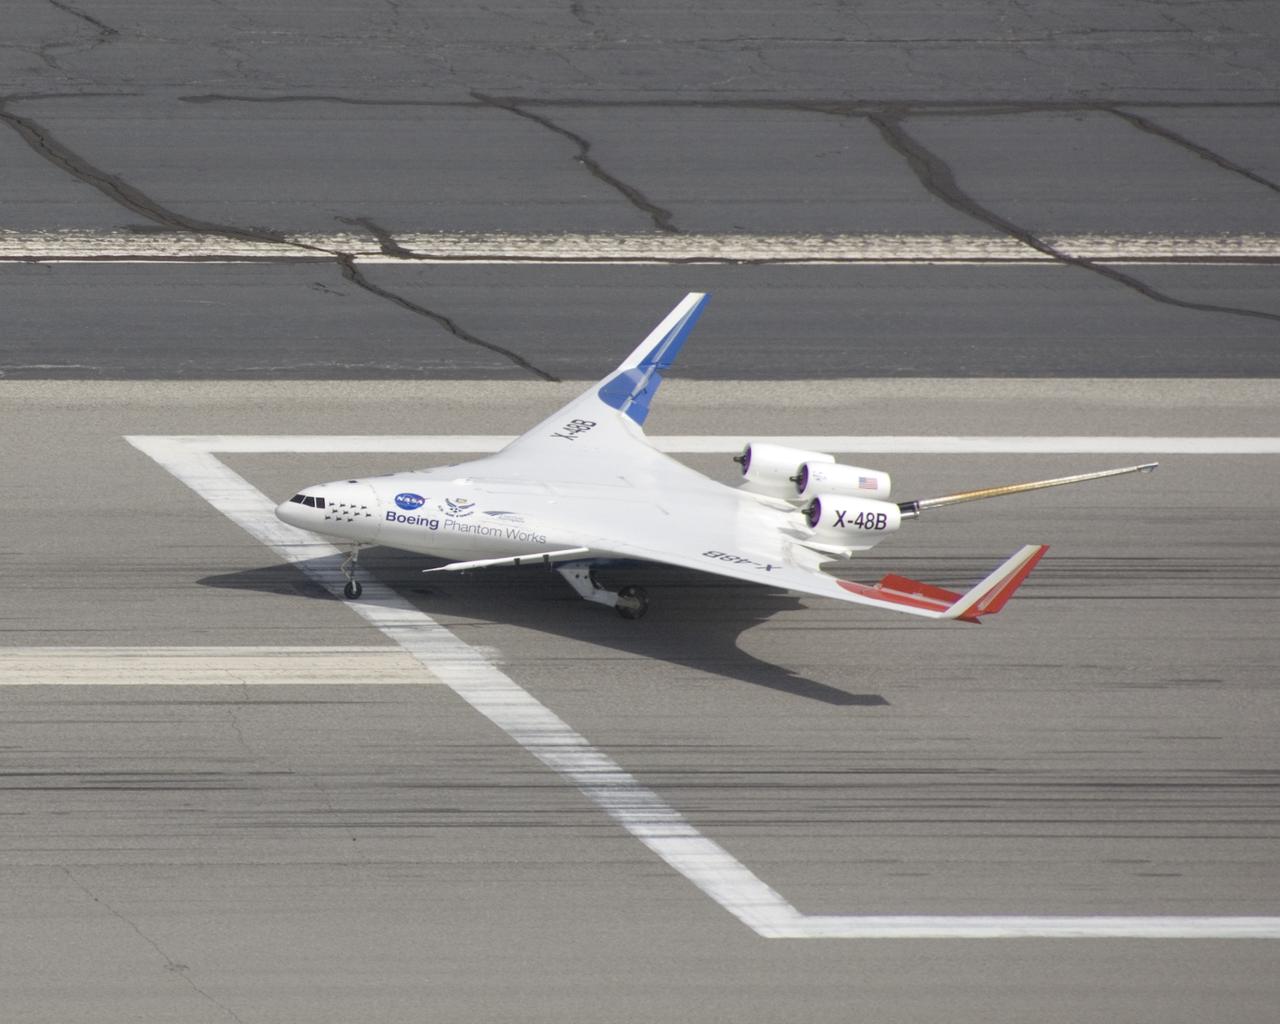
This closeup of Boeing Phantom Works' unique X-48B Blended Wing Body technology demonstrator shows off its unusual engine placement and supercritical airfoil.

Boeing's X-48B Blended Wing Body technology demonstrator shows off its unique lines at sunset on Rogers Dry Lake adjacent to NASA's Dryden Flight Research Center. (Boeing photo # SMF06_F_KOEH_X48B-0900a)
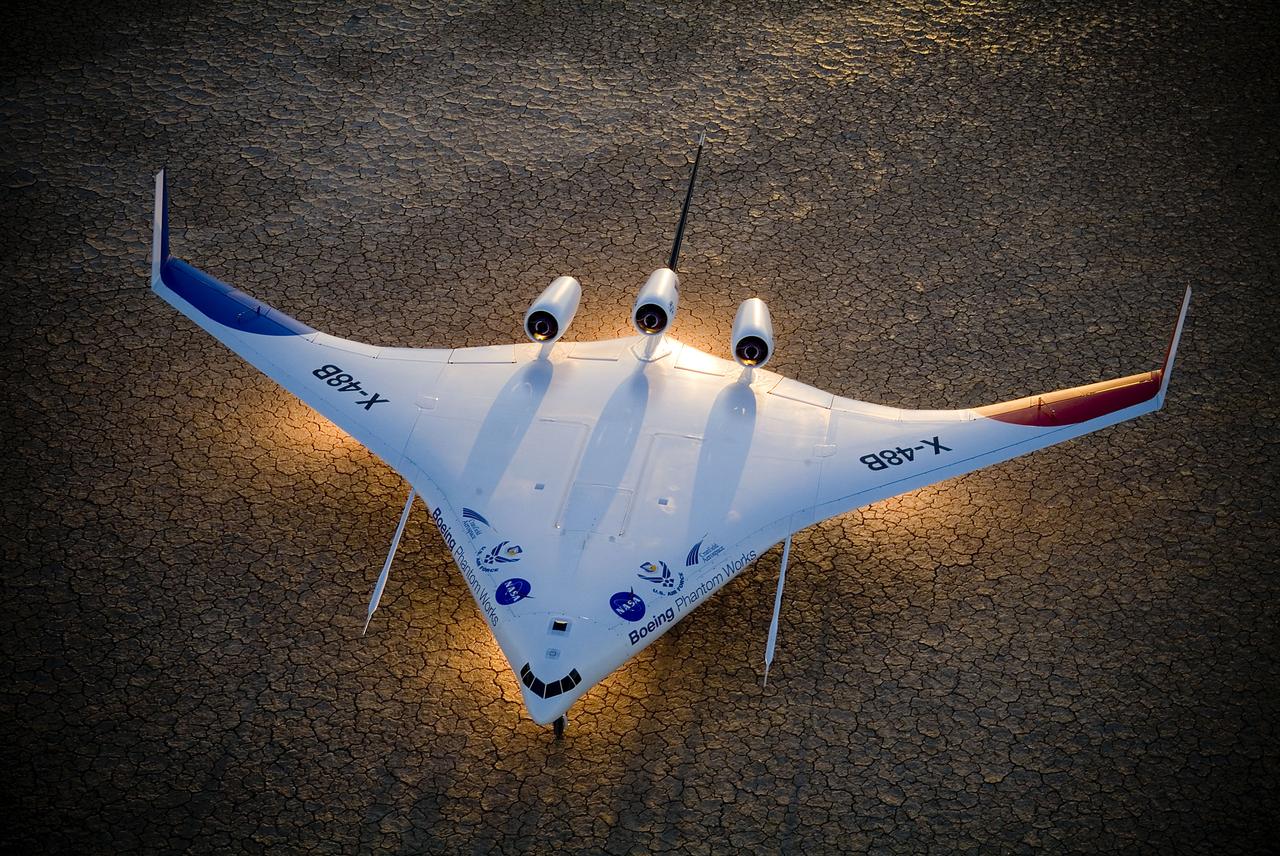
Boeing's X-48B Blended Wing Body technology demonstrator shows off its unique lines at sunset on Rogers Dry Lake adjacent to NASA's Dryden Flight Research Center. (Boeing photo # SMF06_F_KOEH_X48B-0955)
This rear-quarter view shows off the unique lines of Boeing's X-48B Blended Wing Body technology demonstrator on Rogers Dry Lake adjacent to NASA Dryden.
Making a nice landing, the X-48B Blended Wing Body research aircraft team ends another successful Block 2 flight.

The unique manta-ray shaped planform of the Blended Wing Body X-48B is evidenced as the subscale demonstrator soars over Edwards AFB on its first test flight.
Boeing Phantom Works' subscale Blended Wing Body technology demonstration aircraft began its initial flight tests from NASA's Dryden Flight Research Center at Edwards Air Force Base, Calif. in the summer of 2007. The 8.5 percent dynamically scaled unmanned aircraft, designated the X-48B by the Air Force, is designed to mimic the aerodynamic characteristics of a full-scale large cargo transport aircraft with the same blended wing body shape. The initial flight tests focused on evaluation of the X-48B's low-speed flight characteristics and handling qualities. About 25 flights were planned to gather data in these low-speed flight regimes. Based on the results of the initial flight test series, a second set of flight tests was planned to test the aircraft's low-noise and handling characteristics at transonic speeds.

The X-48B Blended Wing Body research aircraft banks smartly in this Block 2 flight phase image.
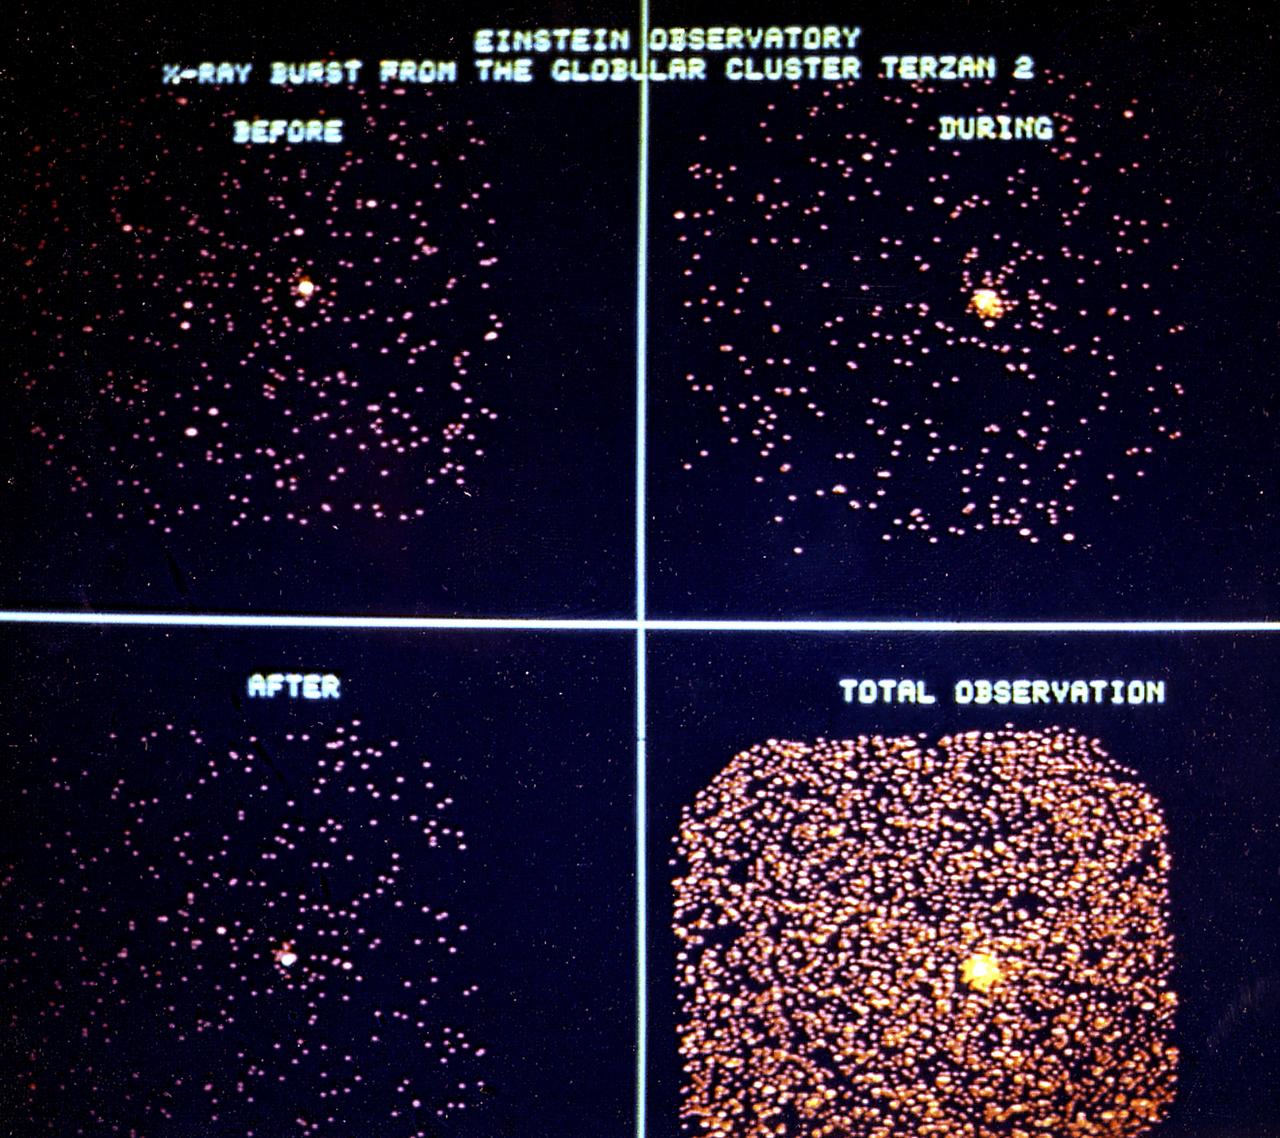
The dramatic change in x-ray emission from the Terzan 2 cluster is shown in this series of 2.5-minute exposures taken with the High Energy Astronomy Observatory (HEAO)-2/Einstein Observatory immediately before, during, and after the burst. Total exposure (20 minutes) of the object, including the outburst, is shown in the fourth photograph. These images represent the first observation of an x-ray burst in progress. The actual burst lasted 50 seconds. Among the rarest, and most bizarre, phenomena observed by x-ray astronomers are the so-called cosmic bursters (x-ray sources that suddenly and dramatically increase in intensity then subside). These sudden bursts of intense x-ray radiation apparently come from compact objects with a diameter smaller than 30 miles (48 kilometers). Yet, despite their minuscule size, a typical x-ray burster can release more x-ray energy in a single brief burst than our Sun does in an entire week. The HEAO-2, the first imaging and largest x-ray telescope built to date, was capable of producing actual photographs of x-ray objects. Shortly after launch, the HEAO-2 was nicknamed the Einstein Observatory by its scientific experimenters in honor of the centernial of the birth of Albert Einstein, whose concepts of relativity and gravitation have influenced much of modern astrophysics, particularly x-ray astronomy. The HEAO was designed and developed by TRW, Inc. under the project management of the Marshall Space Flight Center.
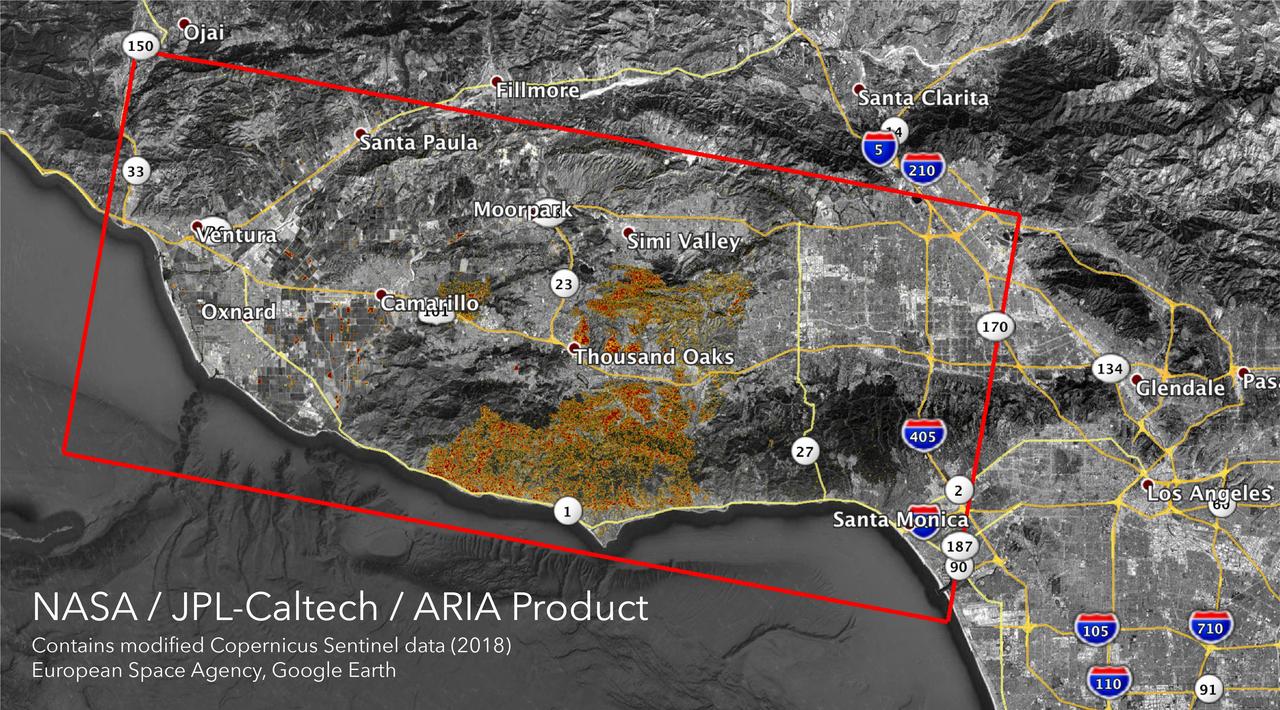
The Advanced Rapid Imaging and Analysis (ARIA) team at NASA's Jet Propulsion Laboratory in Pasadena, California, created these Damage Proxy Maps (DPMs) depicting areas in California likely damaged by the Woolsey and Camp Fires. They are derived from synthetic aperture radar (SAR) images from the Copernicus Sentinel-1 satellites, operated by the European Space Agency (ESA). The pre-event images for the Woolsey Fire in Southern California were taken before the fire on Oct. 30, 2018 and the post-event image was acquired during the fire on Nov. 11, 2018. The map covers an area of 50 miles x 25 miles (80 km x 40 km), indicated with the big red polygon. Each pixel measures about 33 yards x 33 yards (30 m x 30 m). The color variation from yellow to red indicates increasingly more significant ground surface change. The pre-event images for the Camp Fire in Northern California were taken on Nov. 4, 2018 and the post-event images were acquired during the fire on Nov. 10, 2018. The map covers an area of 55 miles x 48 miles (88 km x 77 km). As in the previous image, each pixel measures about 33 yards x 33 yards (30 m x 30 m). The color variation from yellow to red indicates increasingly more significant ground surface change. Preliminary validation for both maps was done by comparing approximate location data to Google's Crisismap. These damage proxy maps can be used as guidance to identify damaged areas with the understanding that they may be less reliable over vegetated areas including farmlands. For example, the scattered single colored pixels over vegetated areas may be false positives, and the lack of colored pixels over vegetated areas does not necessarily mean no damage. https://photojournal.jpl.nasa.gov/catalog/PIA22816
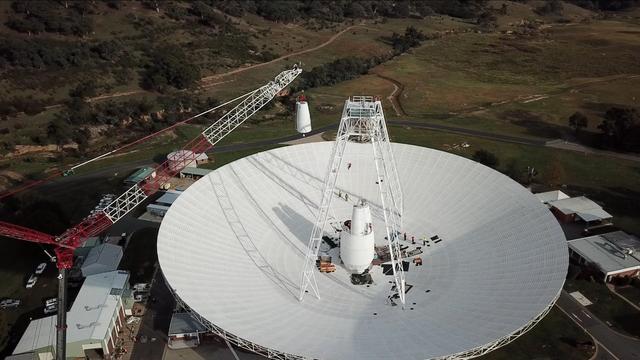
In a delicate operation, a 400-ton crane lifts the new X-band cone into the 70-meter (230-foot) Deep Space Network's Deep Space Station 43 (DSS-43) dish in Canberra, Australia. The new cone houses upgraded receiver and transmitter equipment for the 48-year-old antenna. One of several antennas located at the Canberra site, DSS-43 is the largest and responsible for transmitting commands to NASA's Voyager spacecraft. Since early March 2020, DSS43 has been offline for upgrades, which are expected to continue until January 2021. https://photojournal.jpl.nasa.gov/catalog/PIA23796
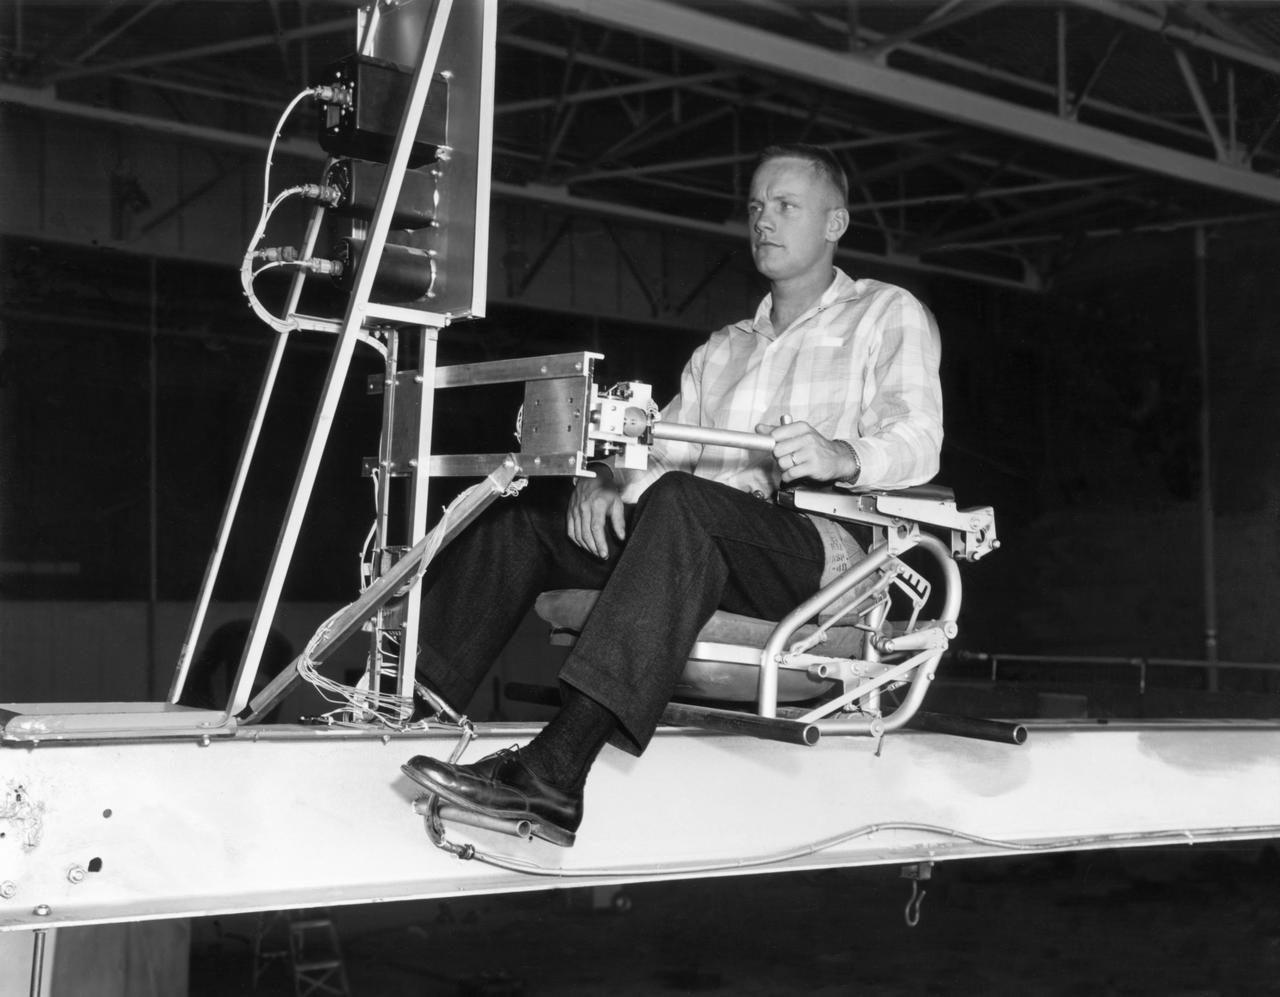
Famed astronaut Neil A. Armstrong, the first man to set foot on the moon during the historic Apollo 11 space mission in July 1969, served for seven years as a research pilot at the NACA-NASA High-Speed Flight Station, now the Dryden Flight Research Center, at Edwards, California, before he entered the space program. Armstrong joined the National Advisory Committee for Aeronautics (NACA) at the Lewis Flight Propulsion Laboratory (later NASA's Lewis Research Center, Cleveland, Ohio, and today the Glenn Research Center) in 1955. Later that year, he transferred to the High-Speed Flight Station at Edwards as an aeronautical research scientist and then as a pilot, a position he held until becoming an astronaut in 1962. He was one of nine NASA astronauts in the second class to be chosen. As a research pilot Armstrong served as project pilot on the F-100A and F-100C aircraft, F-101, and the F-104A. He also flew the X-1B, X-5, F-105, F-106, B-47, KC-135, and Paresev. He left Dryden with a total of over 2450 flying hours. He was a member of the USAF-NASA Dyna-Soar Pilot Consultant Group before the Dyna-Soar project was cancelled, and studied X-20 Dyna-Soar approaches and abort maneuvers through use of the F-102A and F5D jet aircraft. Armstrong was actively engaged in both piloting and engineering aspects of the X-15 program from its inception. He completed the first flight in the aircraft equipped with a new flow-direction sensor (ball nose) and the initial flight in an X-15 equipped with a self-adaptive flight control system. He worked closely with designers and engineers in development of the adaptive system, and made seven flights in the rocket plane from December 1960 until July 1962. During those fights he reached a peak altitude of 207,500 feet in the X-15-3, and a speed of 3,989 mph (Mach 5.74) in the X-15-1. Armstrong has a total of 8 days and 14 hours in space, including 2 hours and 48 minutes walking on the Moon. In March 1966 he was commander of the Gemini 8 or
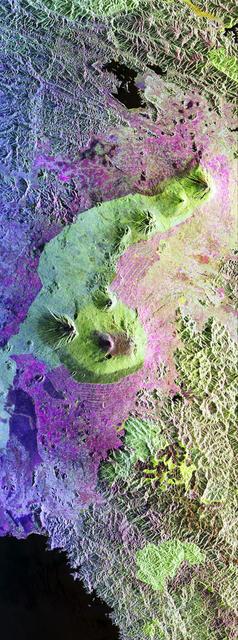
This is a false-color radar image of Central Africa, showing the Virunga Volcano chain along the borders of Rwanda, Zaire and Uganda. This area is home to the endangered mountain gorillas. This C-band L-band image was acquired on April 12, 1994, on orbit 58 of space shuttle Endeavour by the Spaceborne Imaging Radar-C/X-band Synthetic Aperture Radar (SIR-C/X-SAR). The area is centered at about 1.75 degrees south latitude and 29.5 degrees east longitude. The image covers an area 58 kilometers by 178 kilometers (48 miles by 178 miles). The false-color composite is created by displaying the L-band HH return in red, the L-band HV return in green and the C-band HH return in blue. The dark area in the bottom of the image is Lake Kivu, which forms the border between Zaire (to the left) and Rwanda (to the right). The airport at Goma, Zaire is shown as a dark line just above the lake in the bottom left corner of the image. Volcanic flows from the 1977 eruption of Mt. Nyiragongo are shown just north of the airport. Mt. Nyiragongo is not visible in this image because it is located just to the left of the image swath. Very fluid lava flows from the 1977 eruption killed 70 people. http://photojournal.jpl.nasa.gov/catalog/PIA01724
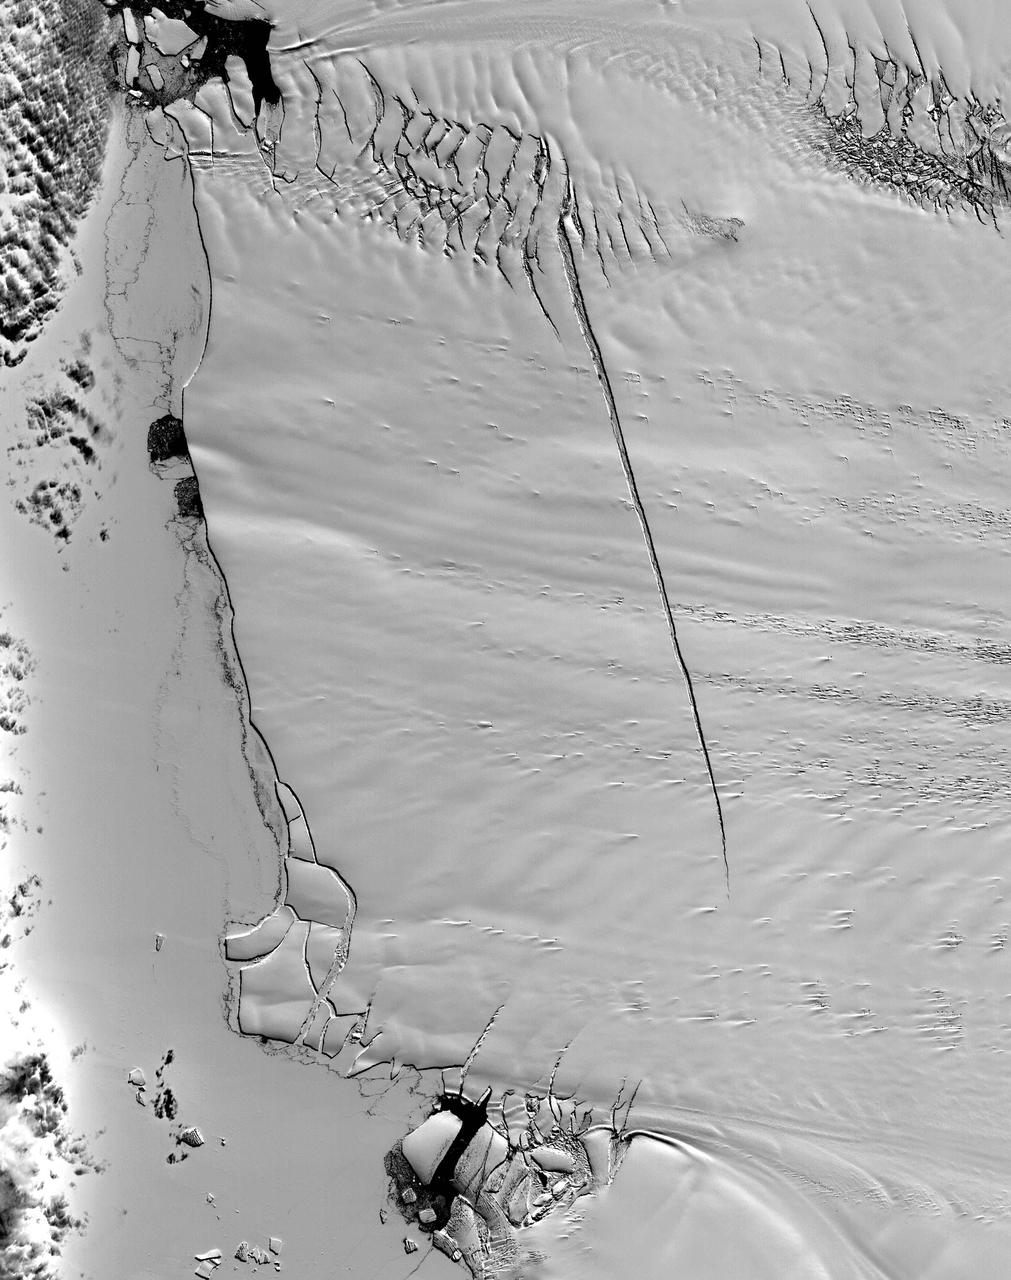
This ASTER image was acquired on December 12, 2000, and covers an area of 38 x 48 km. Pine Island Glacier has undergone a steady loss of elevation with retreat of the grounding line in recent decades. Now, space imagery has revealed a wide new crack that some scientists think will soon result in a calving event. Glaciologist Robert Bindschadler of NASA's Goddard Space Flight Center predicts this crack will result in the calving of a major iceberg, probably in less than 18 months. Discovery of the crack was possible due to multi-year image archives and high resolution imagery. This image is located at 74.1 degrees south latitude and 105.1 degrees west longitude. http://photojournal.jpl.nasa.gov/catalog/PIA11095
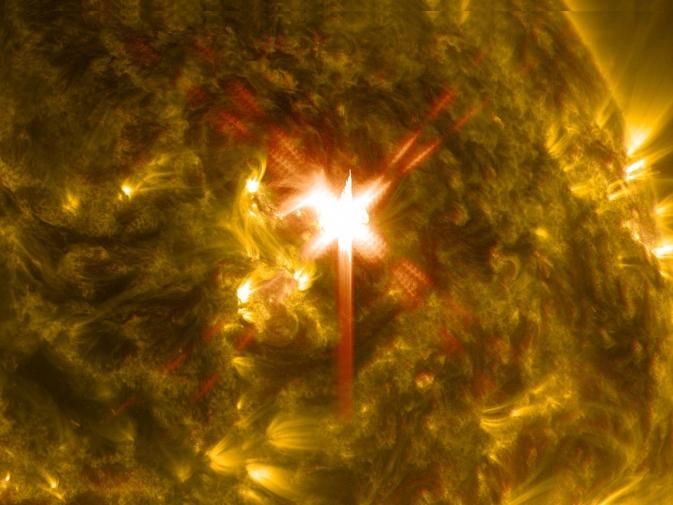
Extreme ultraviolet light streams out of an X-class solar flare as seen in this image captured on March 29, 2014, by NASA's Solar Dynamics Observatory. This image blends two wavelengths of light: 304 and 171 Angstroms, which help scientists observe the lower levels of the sun's atmosphere. More info: The sun emitted a significant solar flare, peaking at 1:48 p.m. EDT March 29, 2014, and NASA's Solar Dynamics Observatory captured images of the event. Solar flares are powerful bursts of radiation. Harmful radiation from a flare cannot pass through Earth's atmosphere to physically affect humans on the ground, however -- when intense enough -- they can disturb the atmosphere in the layer where GPS and communications signals travel. To see how this event impacted Earth, please visit NOAA's Space Weather Prediction Center at <a href="http://spaceweather.gov" rel="nofollow">spaceweather.gov</a>, the U.S. government's official source for space weather forecasts, alerts, watches and warnings. This flare is classified as an X.1-class flare. X-class denotes the most intense flares, while the number provides more information about its strength. An X2 is twice as intense as an X1, an X3 is three times as intense, etc. Credit: NASA/SDO <b><a href="http://www.nasa.gov/audience/formedia/features/MP_Photo_Guidelines.html" rel="nofollow">NASA image use policy.</a></b> <b><a href="http://www.nasa.gov/centers/goddard/home/index.html" rel="nofollow">NASA Goddard Space Flight Center</a></b> enables NASA’s mission through four scientific endeavors: Earth Science, Heliophysics, Solar System Exploration, and Astrophysics. Goddard plays a leading role in NASA’s accomplishments by contributing compelling scientific knowledge to advance the Agency’s mission. <b>Follow us on <a href="http://twitter.com/NASAGoddardPix" rel="nofollow">Twitter</a></b> <b>Like us on <a href="http://www.facebook.com/pages/Greenbelt-MD/NASA-Goddard/395013845897?ref=tsd" rel="nofollow">Facebook</a></b> <b>Find us on <a href="http://instagram.com/nasagoddard?vm=grid" rel="nofollow">Instagram</a></b>

Extreme ultraviolet light streams out of an X-class solar flare as seen in this image captured on March 29, 2014, by NASA's Solar Dynamics Observatory. This image blends two wavelengths of light: 304 and 171 Angstroms, which help scientists observe the lower levels of the sun's atmosphere. More info: The sun emitted a significant solar flare, peaking at 1:48 p.m. EDT March 29, 2014, and NASA's Solar Dynamics Observatory captured images of the event. Solar flares are powerful bursts of radiation. Harmful radiation from a flare cannot pass through Earth's atmosphere to physically affect humans on the ground, however -- when intense enough -- they can disturb the atmosphere in the layer where GPS and communications signals travel. To see how this event impacted Earth, please visit NOAA's Space Weather Prediction Center at <a href="http://spaceweather.gov" rel="nofollow">spaceweather.gov</a>, the U.S. government's official source for space weather forecasts, alerts, watches and warnings. This flare is classified as an X.1-class flare. X-class denotes the most intense flares, while the number provides more information about its strength. An X2 is twice as intense as an X1, an X3 is three times as intense, etc. Credit: NASA/SDO <b><a href="http://www.nasa.gov/audience/formedia/features/MP_Photo_Guidelines.html" rel="nofollow">NASA image use policy.</a></b> <b><a href="http://www.nasa.gov/centers/goddard/home/index.html" rel="nofollow">NASA Goddard Space Flight Center</a></b> enables NASA’s mission through four scientific endeavors: Earth Science, Heliophysics, Solar System Exploration, and Astrophysics. Goddard plays a leading role in NASA’s accomplishments by contributing compelling scientific knowledge to advance the Agency’s mission. <b>Follow us on <a href="http://twitter.com/NASAGoddardPix" rel="nofollow">Twitter</a></b> <b>Like us on <a href="http://www.facebook.com/pages/Greenbelt-MD/NASA-Goddard/395013845897?ref=tsd" rel="nofollow">Facebook</a></b> <b>Find us on <a href="http://instagram.com/nasagoddard?vm=grid" rel="nofollow">Instagram</a></b>
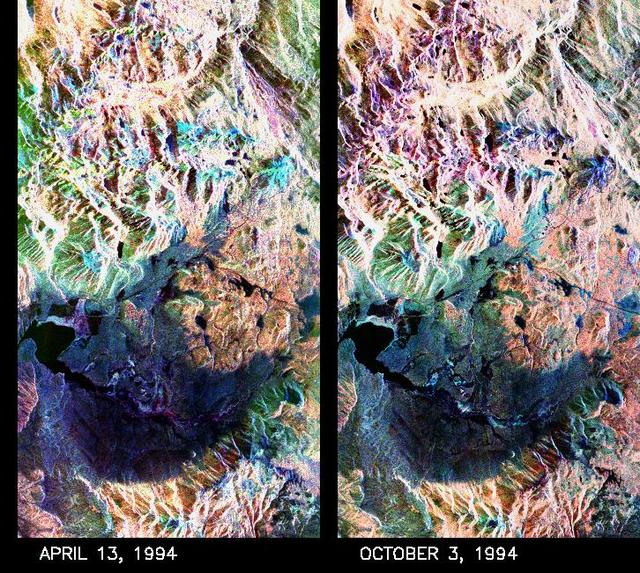
These two false-color composite images of the Mammoth Mountain area in the Sierra Nevada Mountains, Calif., show significant seasonal changes in snow cover. The image at left was acquired by the Spaceborne Imaging Radar-C and X-band Synthetic Aperture Radar aboard the space shuttle Endeavour on its 67th orbit on April 13, 1994. The image is centered at 37.6 degrees north latitude and 119 degrees west longitude. The area is about 36 kilometers by 48 kilometers (22 miles by 29 miles). In this image, red is L-band (horizontally transmitted and vertically received) polarization data; green is C-band (horizontally transmitted and vertically received) polarization data; and blue is C-band (horizontally transmitted and received) polarization data. The image at right was acquired on October 3, 1994, on the space shuttle Endeavour's 67th orbit of the second radar mission. Crowley Lake appears dark at the center left of the image, just above or south of Long Valley. The Mammoth Mountain ski area is visible at the top right of the scene. The red areas correspond to forests, the dark blue areas are bare surfaces and the green areas are short vegetation, mainly brush. The changes in color tone at the higher elevations (e.g. the Mammoth Mountain ski area) from green-blue in April to purple in September reflect changes in snow cover between the two missions. The April mission occurred immediately following a moderate snow storm. During the mission the snow evolved from a dry, fine-grained snowpack with few distinct layers to a wet, coarse-grained pack with multiple ice inclusions. Since that mission, all snow in the area has melted except for small glaciers and permanent snowfields on the Silver Divide and near the headwaters of Rock Creek. On October 3, 1994, only discontinuous patches of snow cover were present at very high elevations following the first snow storm of the season on September 28, 1994. For investigations in hydrology and land-surface climatology, seasonal snow cover and alpine glaciers are critical to the radiation and water balances. SIR-C/X-SAR is a powerful tool because it is sensitive to most snowpack conditions and is less influenced by weather conditions than other remote sensing instruments, such as Landsat. In parallel with the operational SIR-C data processing, an experimental effort is being conducted to test SAR data processing using the Jet Propulsion Laboratory's massively parallel supercomputing facility, centered around the Cray Research T3D. These experiments will assess the abilities of large supercomputers to produce high throughput SAR processing in preparation for upcoming data-intensive SAR missions. The images released here were produced as part of this experimental effort. http://photojournal.jpl.nasa.gov/catalog/PIA01753
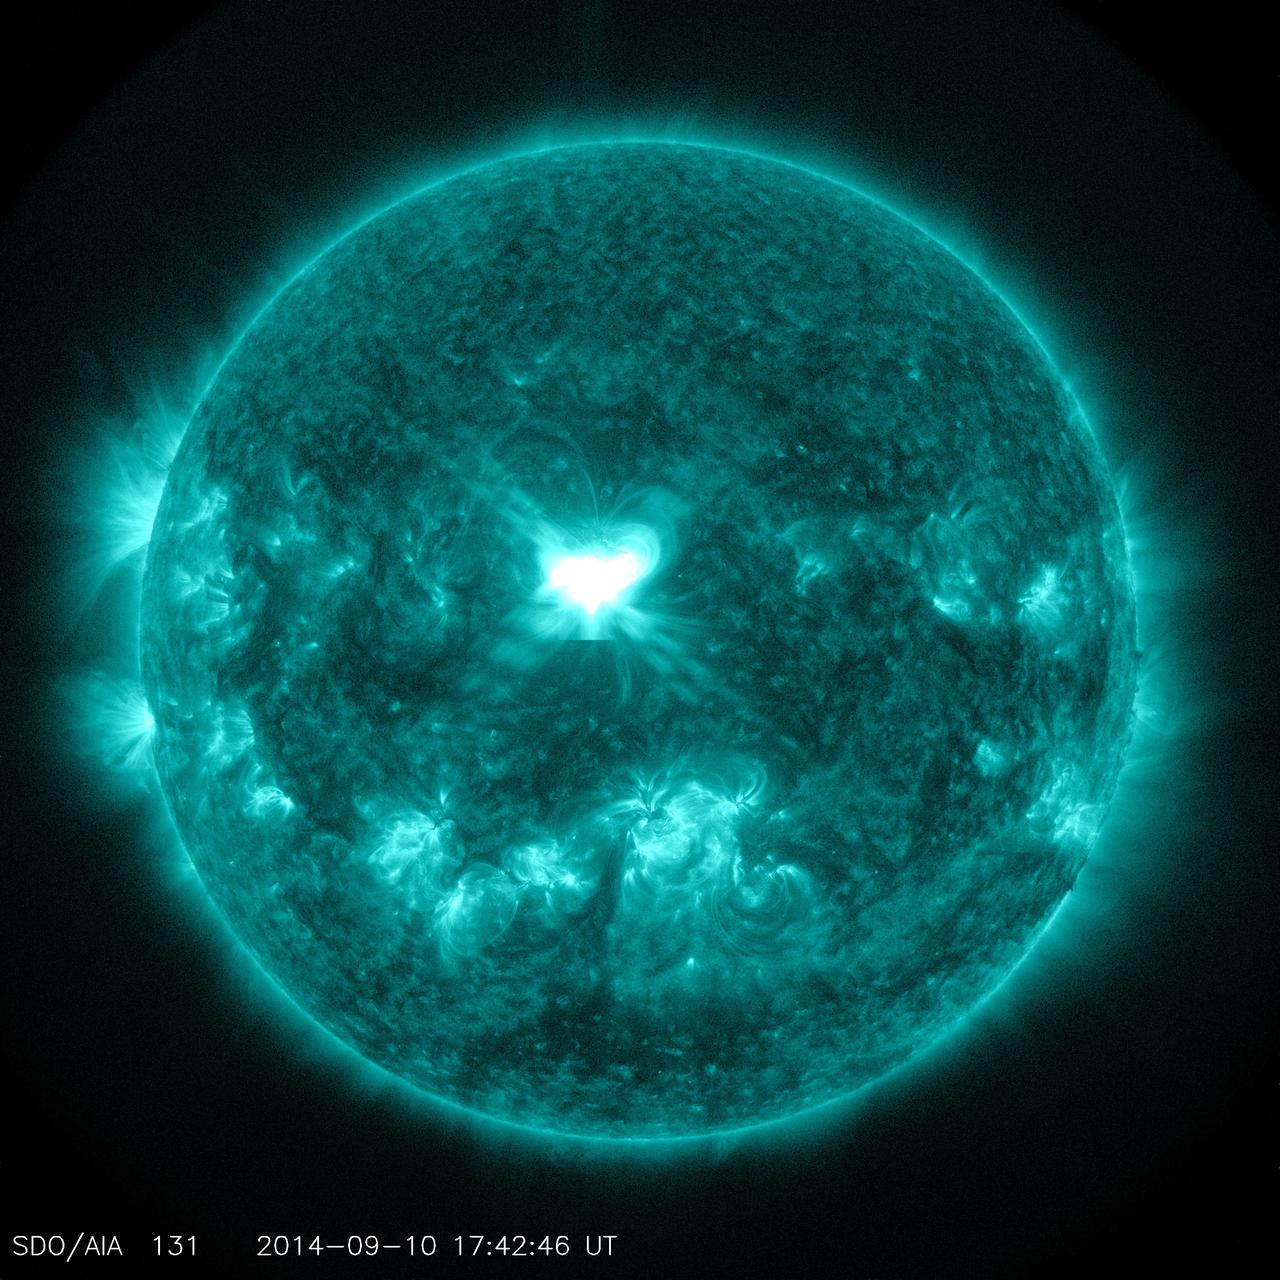
The sun emitted a significant solar flare, peaking at 1:48 p.m. EDT on Sept. 10, 2014. NASA's Solar Dynamics Observatory captured images of the event. Solar flares are powerful bursts of radiation. Harmful radiation from a flare cannot pass through Earth's atmosphere to physically affect humans on the ground. However -- when intense enough -- they can disturb the atmosphere in the layer where GPS and communications signals travel. To see how this event may affect Earth, please visit NOAA's Space Weather Prediction Center at <a href="http://spaceweather.gov" rel="nofollow">spaceweather.gov</a>, the U.S. government's official source for space weather forecasts, alerts, watches and warnings. This flare is classified as an X1.6 class flare. "X-class" denotes the most intense flares, while the number provides more information about its strength. An X2 is twice as intense as an X1, an X3 is three times as intense, etc. Credit: NASA/Goddard/SDO <b><a href="http://www.nasa.gov/audience/formedia/features/MP_Photo_Guidelines.html" rel="nofollow">NASA image use policy.</a></b> <b><a href="http://www.nasa.gov/centers/goddard/home/index.html" rel="nofollow">NASA Goddard Space Flight Center</a></b> enables NASA’s mission through four scientific endeavors: Earth Science, Heliophysics, Solar System Exploration, and Astrophysics. Goddard plays a leading role in NASA’s accomplishments by contributing compelling scientific knowledge to advance the Agency’s mission. <b>Follow us on <a href="http://twitter.com/NASAGoddardPix" rel="nofollow">Twitter</a></b> <b>Like us on <a href="http://www.facebook.com/pages/Greenbelt-MD/NASA-Goddard/395013845897?ref=tsd" rel="nofollow">Facebook</a></b> <b>Find us on <a href="http://instagram.com/nasagoddard?vm=grid" rel="nofollow">Instagram</a></b>