
A wood router cuts precise holes in plywood for temporary floorboards on Aug. 26, 2024, in the Experimental Fabrication Shop at NASA’s Armstrong Flight Research Center in Edwards, California. The flooring was designed for the X-66 experimental demonstrator aircraft.
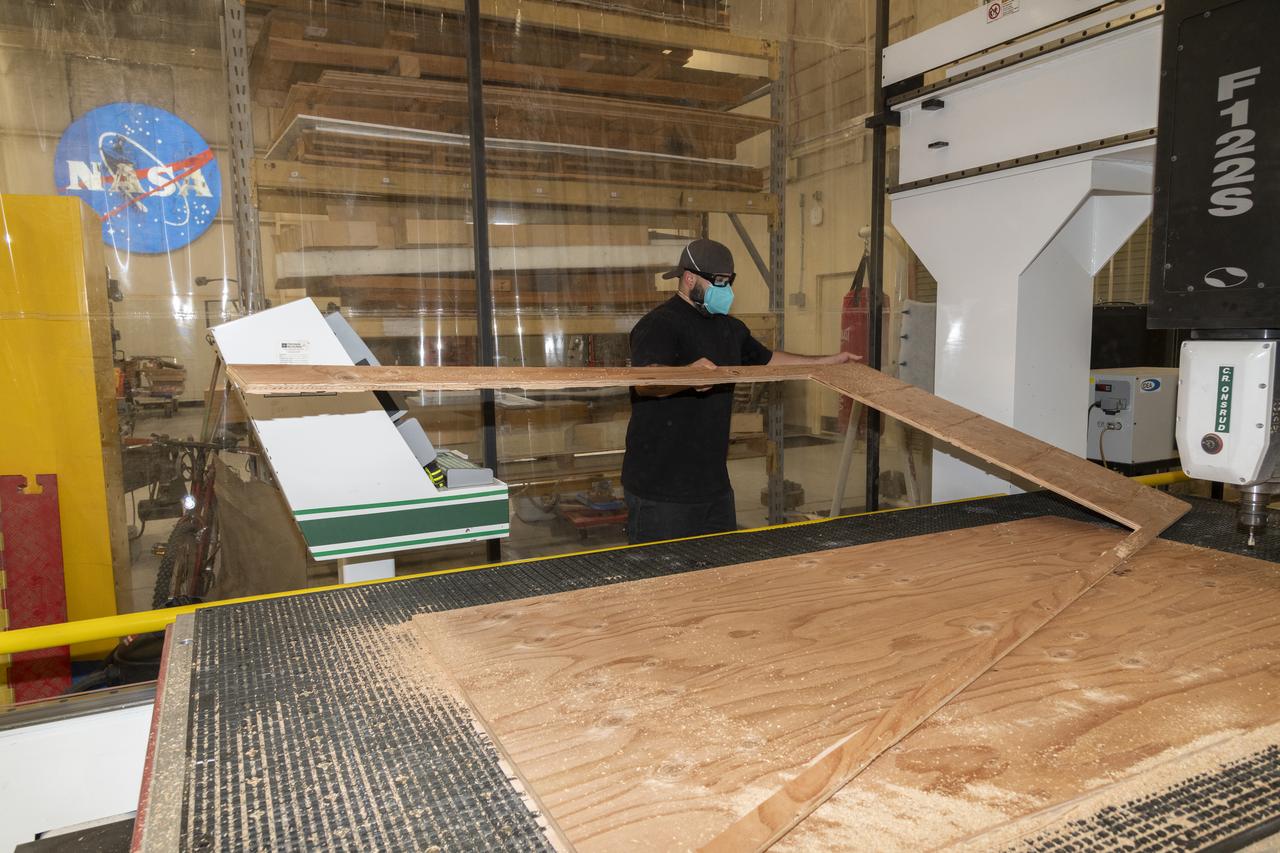
Eric Garza, an engineering technician in the Experimental Fabrication Shop at NASA’s Armstrong Flight Research Center in Edwards, California, cuts plywood to size for temporary floorboards for the X-66 experimental demonstrator aircraft on Aug. 26, 2024.

Eric Garza, an engineering technician in the Experimental Fabrication Shop at NASA’s Armstrong Flight Research Center in Edwards, California, observes a wood router cut holes for temporary floorboards on Aug. 26, 2024. The flooring was designed for the X-66 experimental demonstrator aircraft.
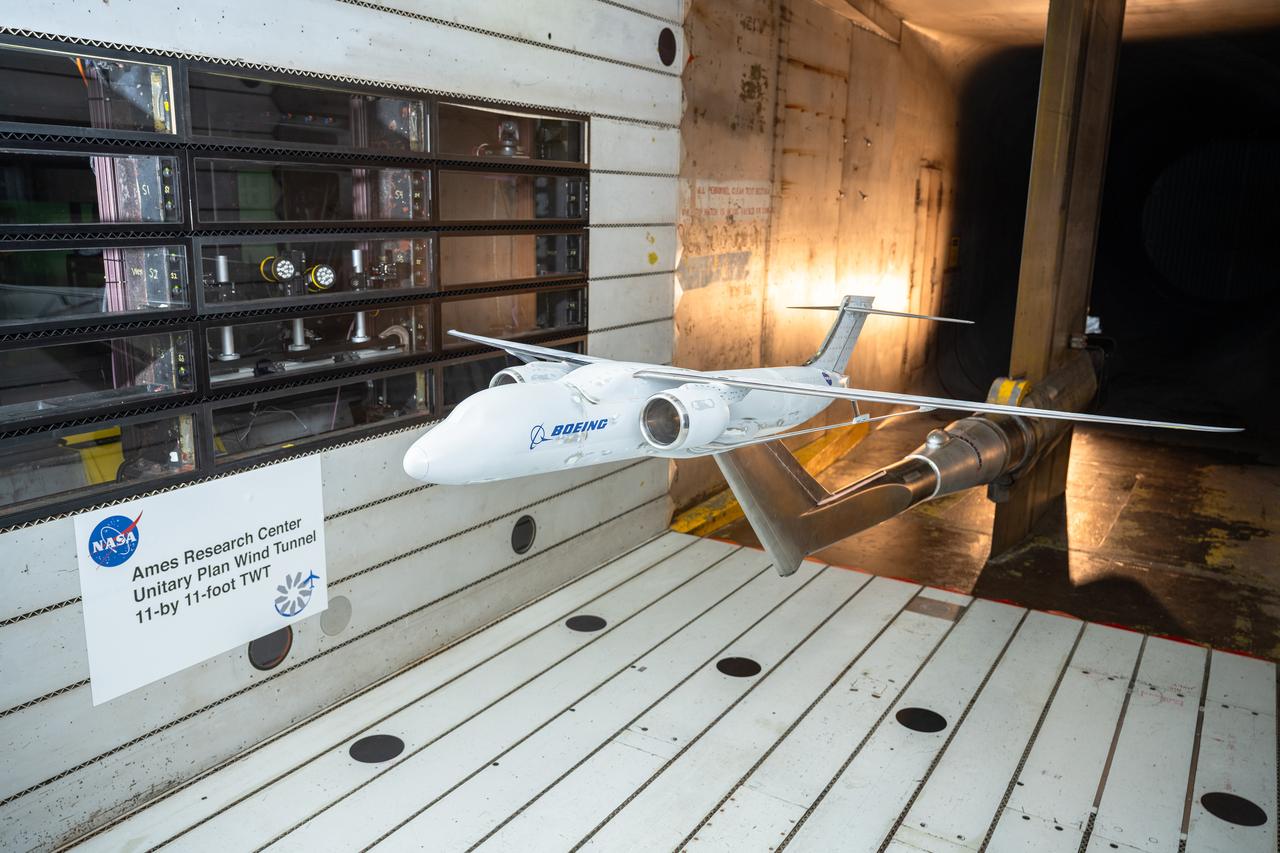
NASA’s Sustainable Flight Demonstrator project completed wind tunnel tests on a Boeing-built X-66 full-span model during a 13-week campaign between January and March 2025. The tests were completed in the 11-Foot Transonic Unitary Plan Facility at NASA’s Ames Research Center in California’s Silicon Valley. The model underwent tests in expected flight conditions to obtain engineering data to help improve the aircraft’s design and flight simulators.
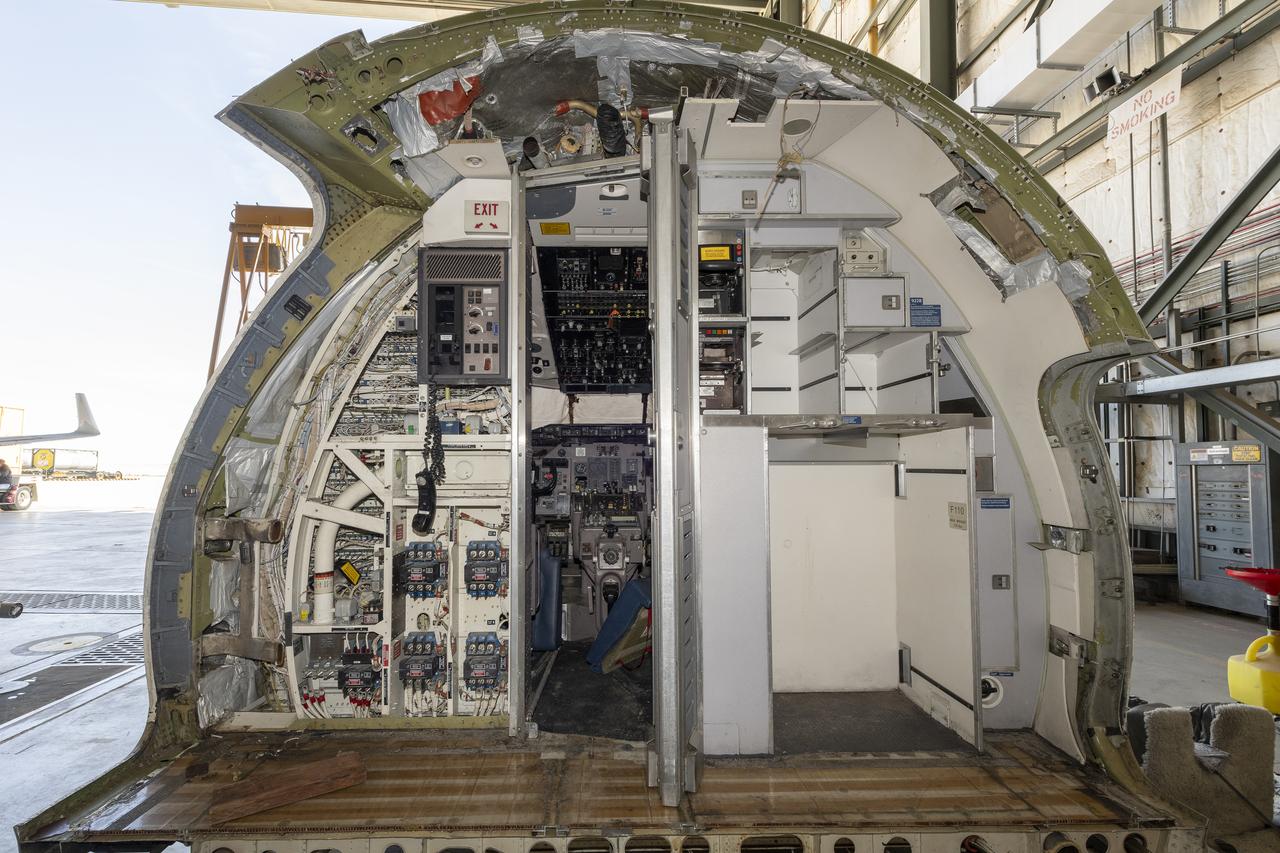
The cockpit of an old MD-90 aircraft arrived at NASA’s Armstrong Flight Research Center in Edwards, California, in March 2024. Parts will be used to build a simulator for NASA’s X-66, the demonstration aircraft for the Sustainable Flight Demonstrator project.

The cockpit of an old MD-90 aircraft arrived at NASA’s Armstrong Flight Research Center in Edwards, California, in March 2024. Parts will be used to build a simulator for NASA’s X-66, the demonstration aircraft for the Sustainable Flight Demonstrator project.
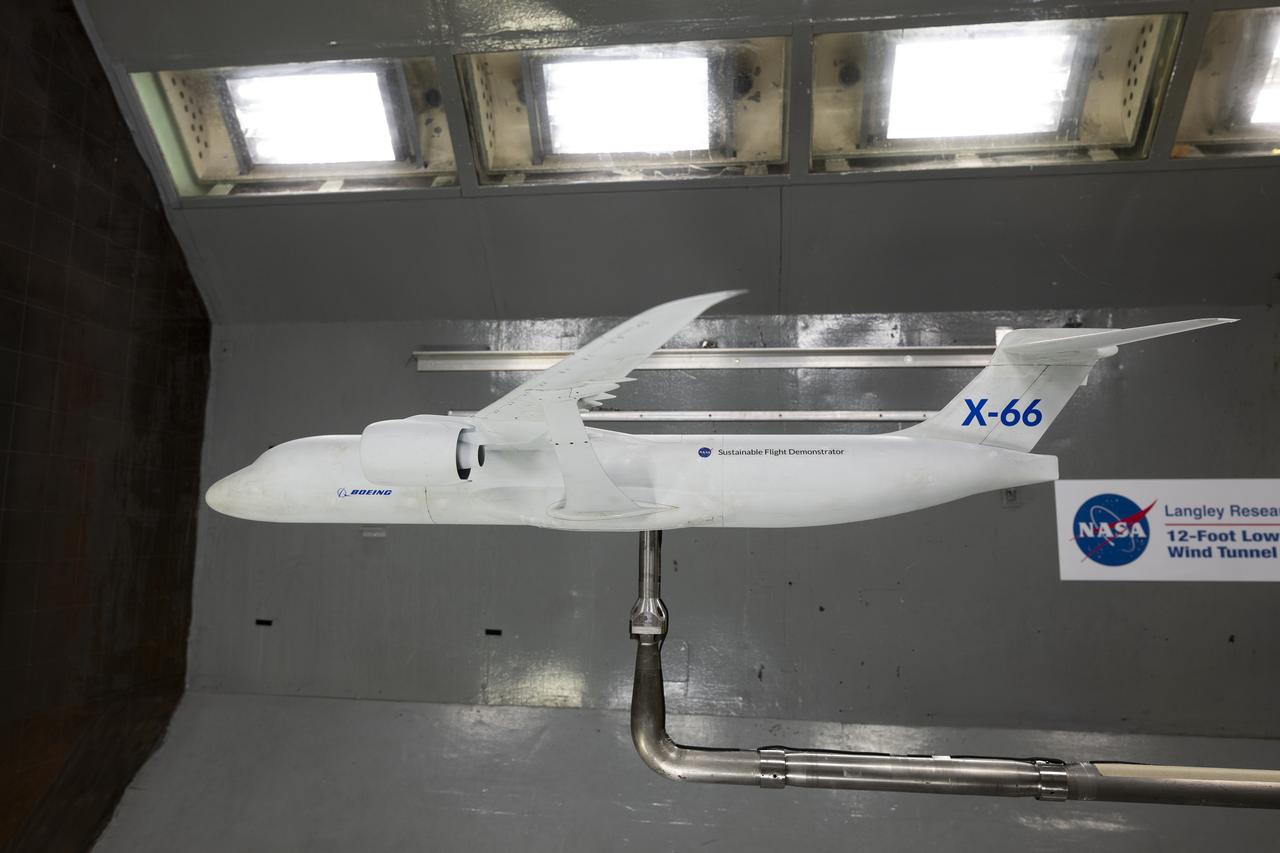
A model of the X-66 aircraft with a wingspan of almost 6 feet was placed in the 12-Foot Low-Speed Wind Tunnel at NASA’s Langley Research Center in Hampton, Virginia on October 30, 2024. During the tests, the team captured measurements of forces such as lift and drag over many aerodynamic configurations and flight conditions.
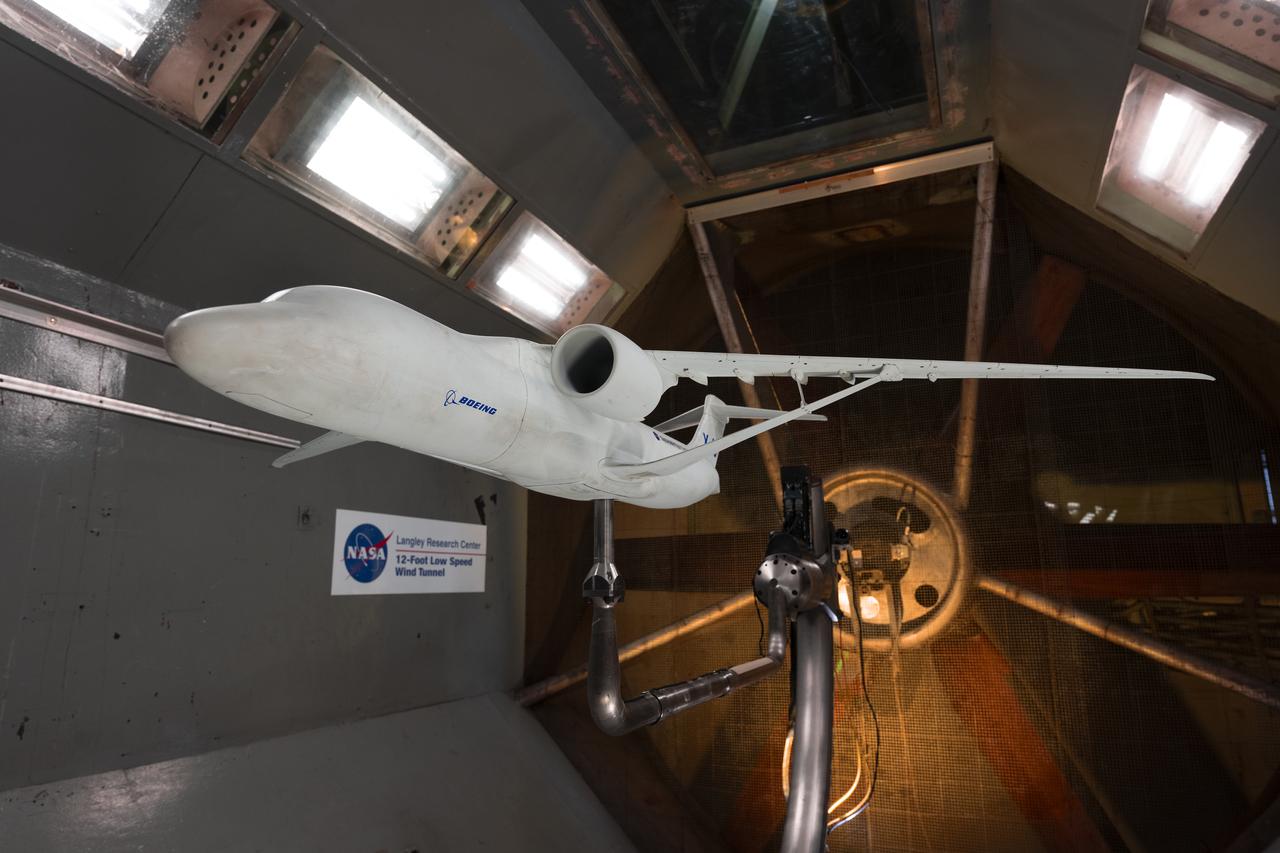
A model of the X-66 aircraft with a wingspan of almost 6 feet was placed in the 12-Foot Low-Speed Wind Tunnel at NASA’s Langley Research Center in Hampton, Virginia on October 30, 2024. During the tests, the team captured measurements of forces such as lift and drag over many aerodynamic configurations and flight conditions.
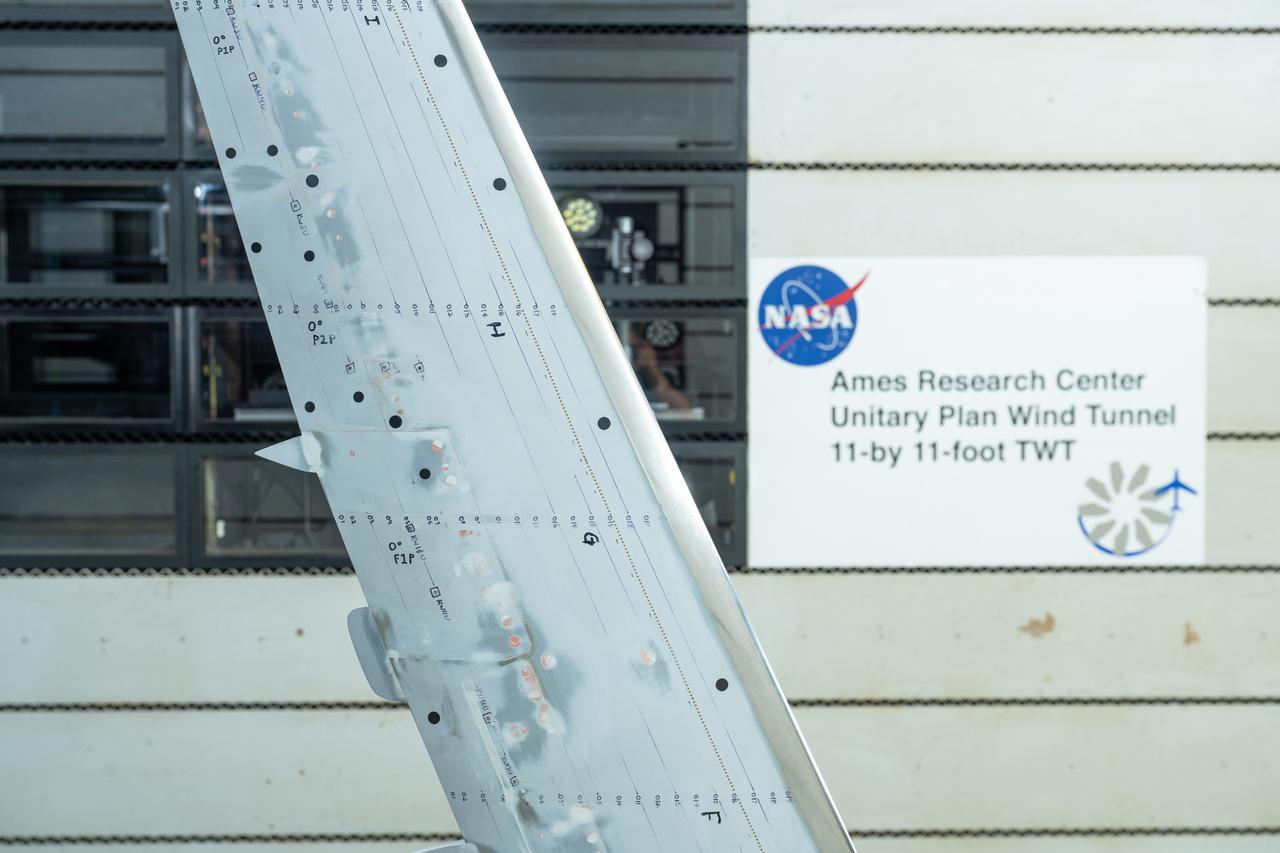
NASA’s Sustainable Flight Demonstrator project concluded wind tunnel testing in the fall of 2024. Tests on a Boeing-built X-66 model were completed at NASA’s Ames Research Center in Silicon Valley, California, in the 11-Foot Transonic Unitary Plan Facility. Pressure points, which are drilled holes with data sensors attached, are installed along the edge of the wing and allow engineers to understand the characteristics of airflow and will influence the final design of the wing.
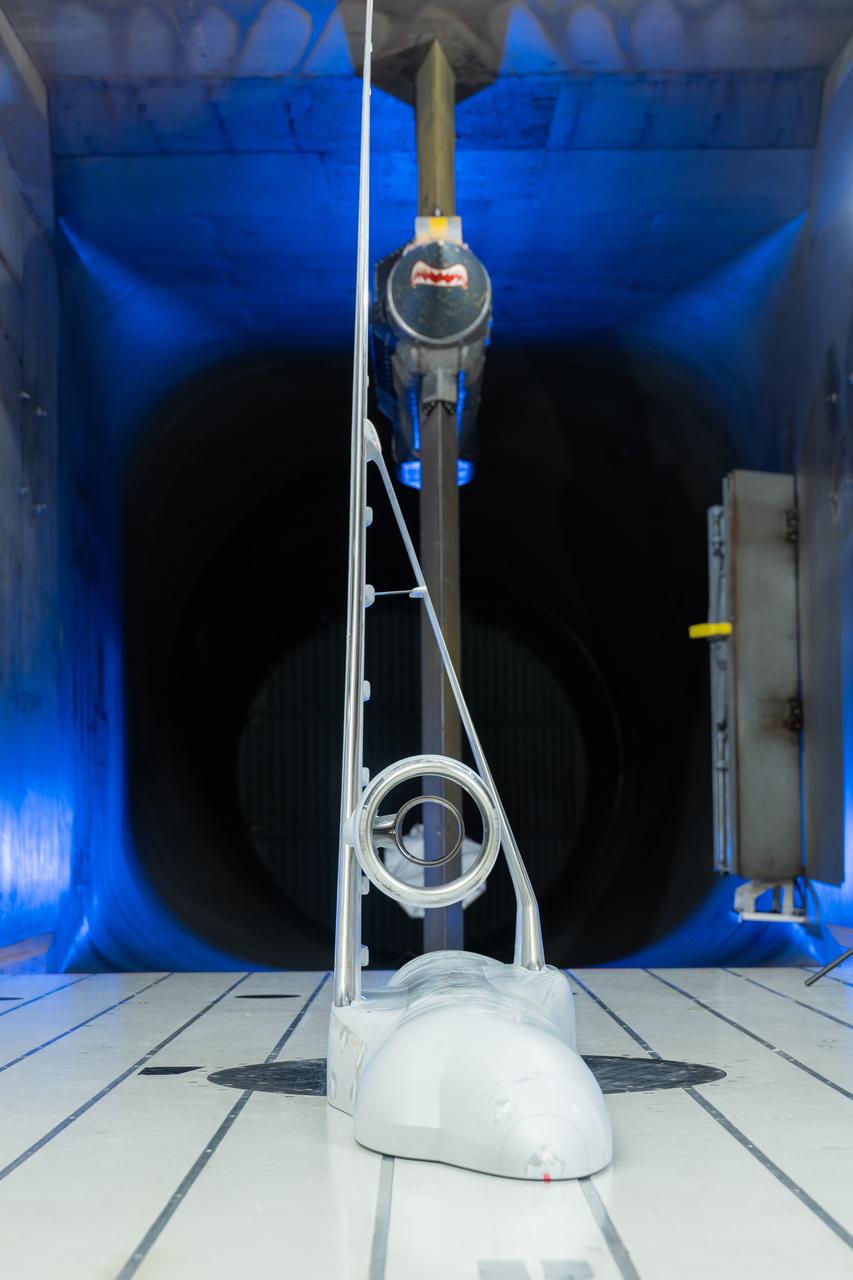
NASA’s Sustainable Flight Demonstrator project concluded wind tunnel testing in the fall of 2024. Tests on a Boeing-built X-66 model were completed at NASA’s Ames Research Center in California’s Silicon Valley in the 11-Foot Transonic Unitary Plan Facility. The model underwent tests representing expected flight conditions to obtain engineering information to influence design of the wing and provide data for flight simulators.
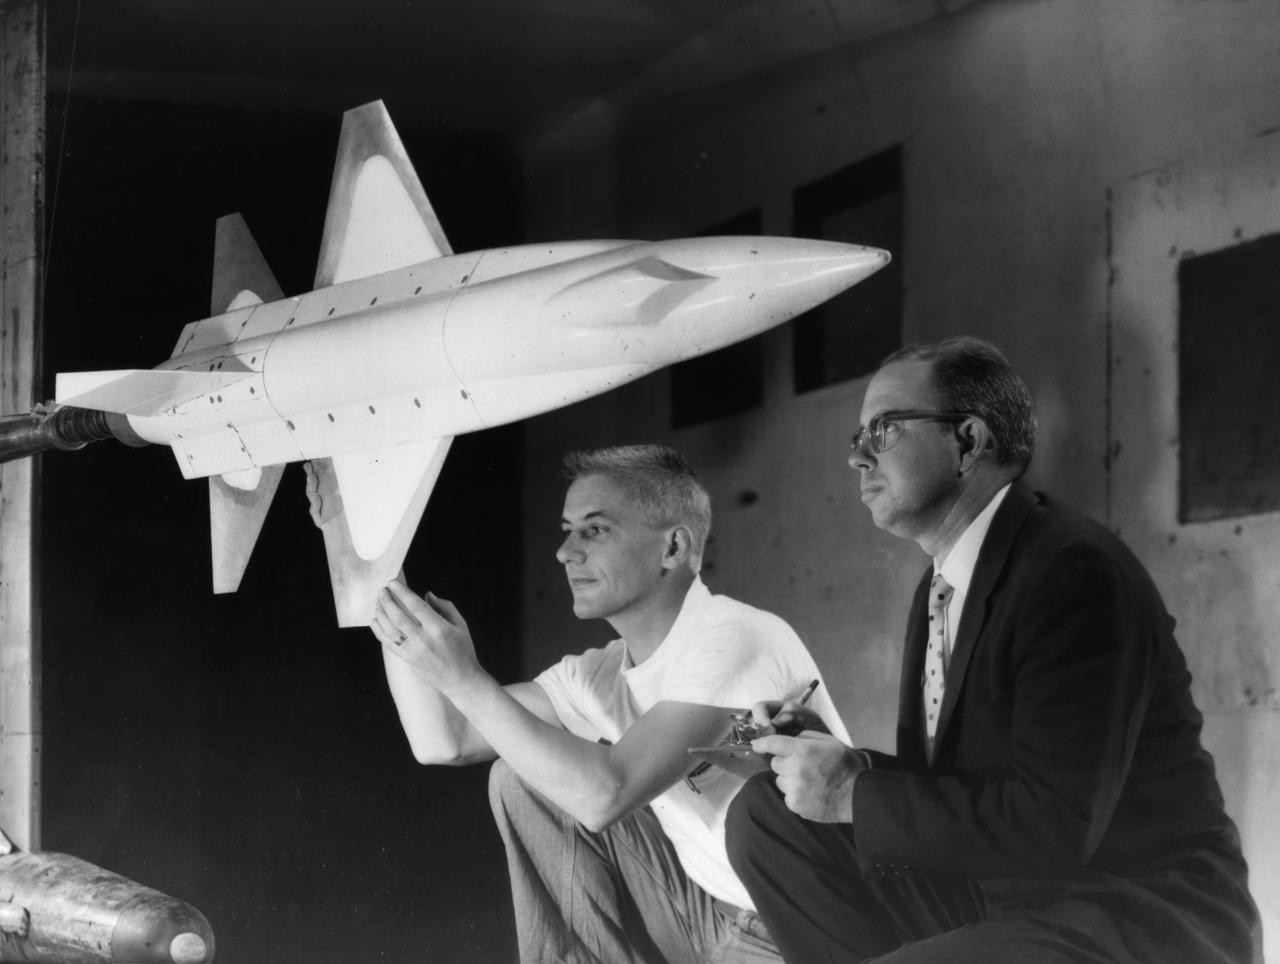
A 1/10th Scale Model of the X-15 research plane is prepared in Langley's 7 x 10 Foot Wind Tunnel for studies relating to spin characteristics. -- Photograph published in Winds of Change, 75th Anniversary NASA publication (page 66), by James Schultz.
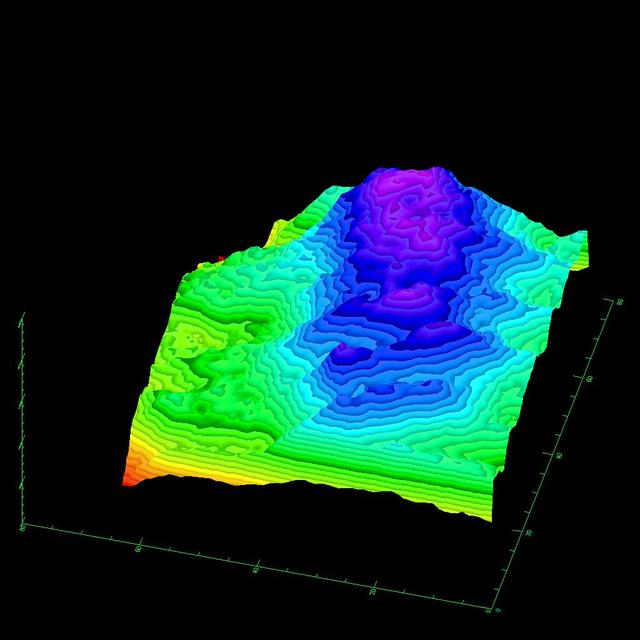
This three-dimensional image of the volcano Kilauea was generated based on interferometric fringes derived from two X-band Synthetic Aperture Radar data takes on April 13, 1994 and October 4, 1994. The altitude lines are based on quantitative interpolation of the topographic fringes. The level difference between neighboring altitude lines is 20 meters (66 feet). The ground area covers 12 kilometers by 4 kilometers (7.5 miles by 2.5 miles). The altitude difference in the image is about 500 meters (1,640 feet). The volcano is located around 19.58 degrees north latitude and 155.55 degrees west longitude. http://photojournal.jpl.nasa.gov/catalog/PIA01761
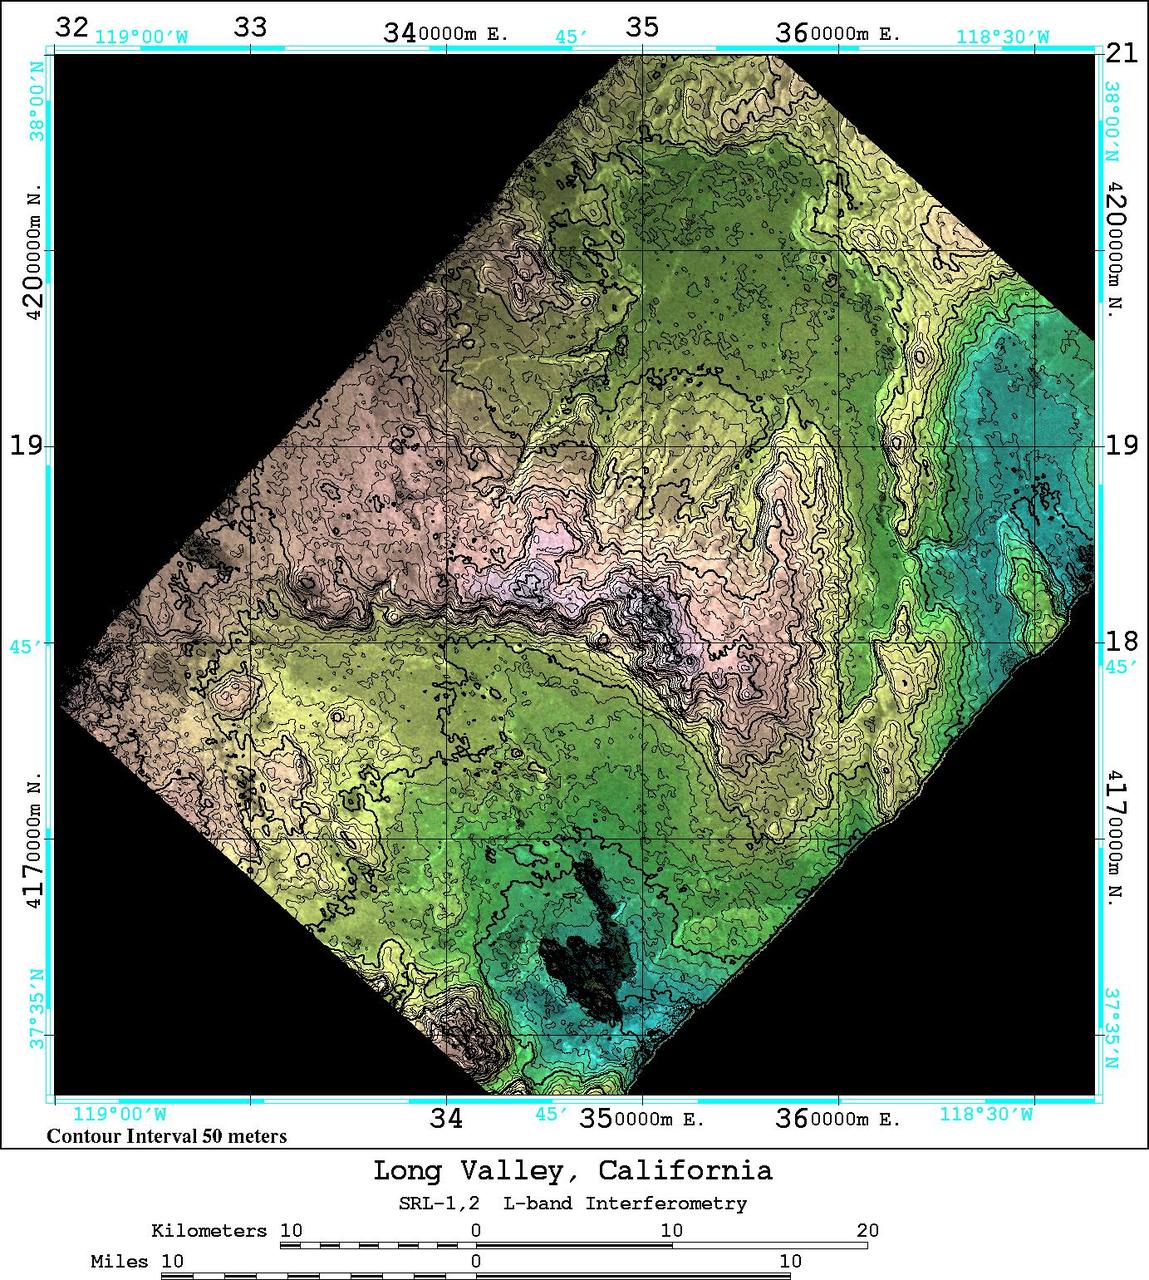
An area near Long Valley, California, was mapped by the Spaceborne Imaging Radar-C and X-band Synthetic Aperture Radar aboard the space shuttle Endeavor on April 13, 1994, during the first flight of the radar instrument, and on October 4, 1994, during the second flight of the radar instrument. The orbital configurations of the two data sets were ideal for interferometric combination -- that is overlaying the data from one image onto a second image of the same area to create an elevation map and obtain estimates of topography. Once the topography is known, any radar-induced distortions can be removed and the radar data can be geometrically projected directly onto a standard map grid for use in a geographical information system. The 50 kilometer by 50 kilometer (31 miles by 31 miles) map shown here is entirely derived from SIR-C L-band radar (horizontally transmitted and received) results. The color shown in this image is produced from the interferometrically determined elevations, while the brightness is determined by the radar backscatter. The map is in Universal Transverse Mercator (UTM) coordinates. Elevation contour lines are shown every 50 meters (164 feet). Crowley Lake is the dark feature near the south edge of the map. The Adobe Valley in the north and the Long Valley in the south are separated by the Glass Mountain Ridge, which runs through the center of the image. The height accuracy of the interferometrically derived digital elevation model is estimated to be 20 meters (66 feet) in this image. http://photojournal.jpl.nasa.gov/catalog/PIA01749