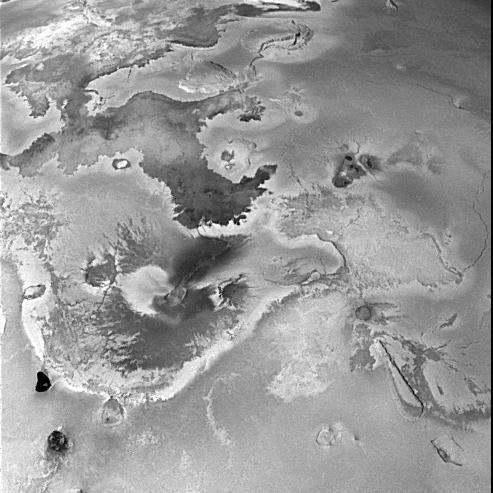
Volcanically Active Regions on Io
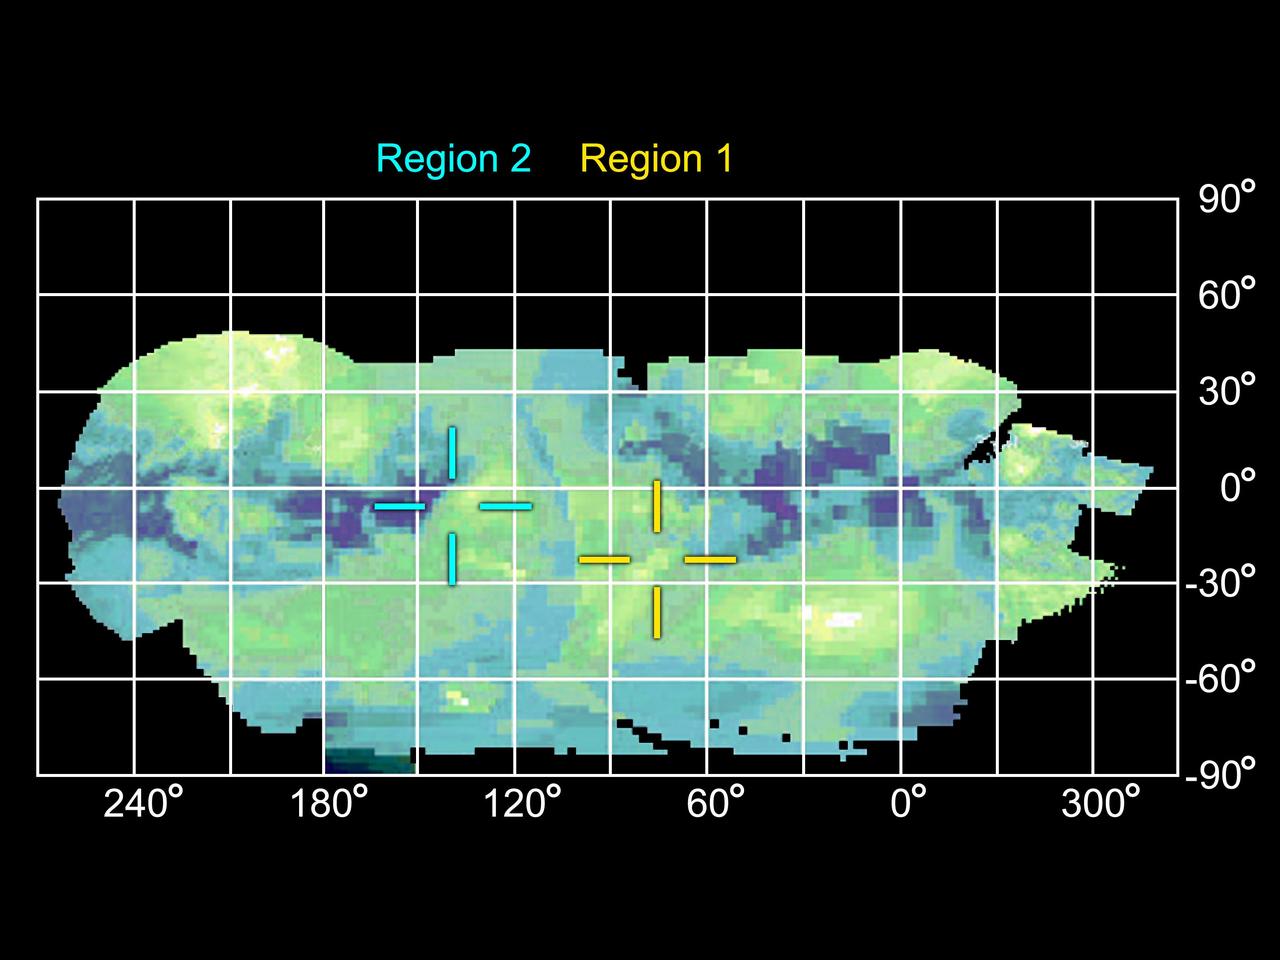
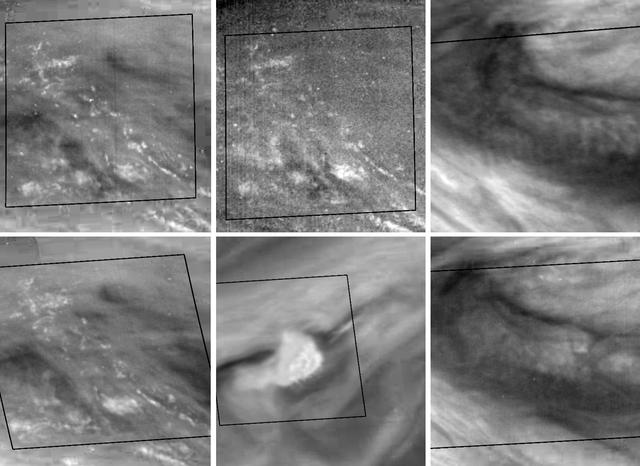
Infrared Map of Titan Active Regions
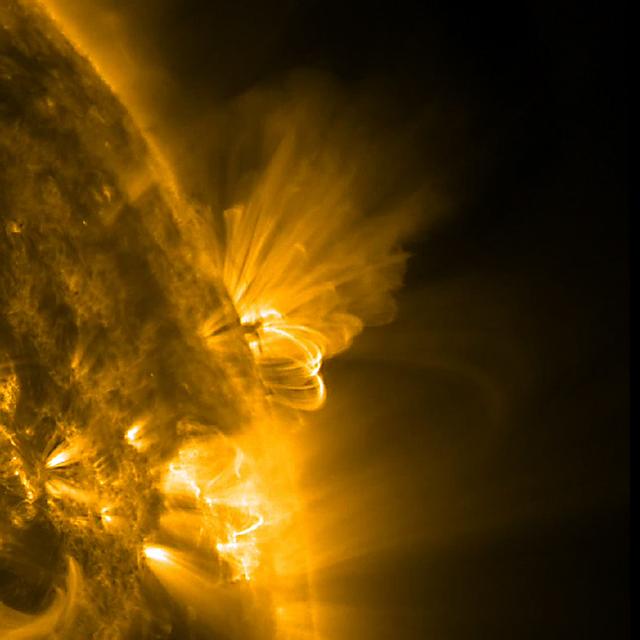
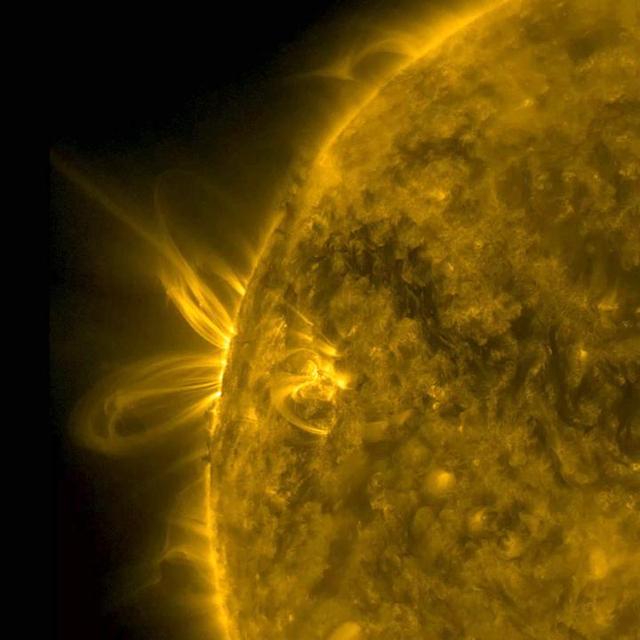
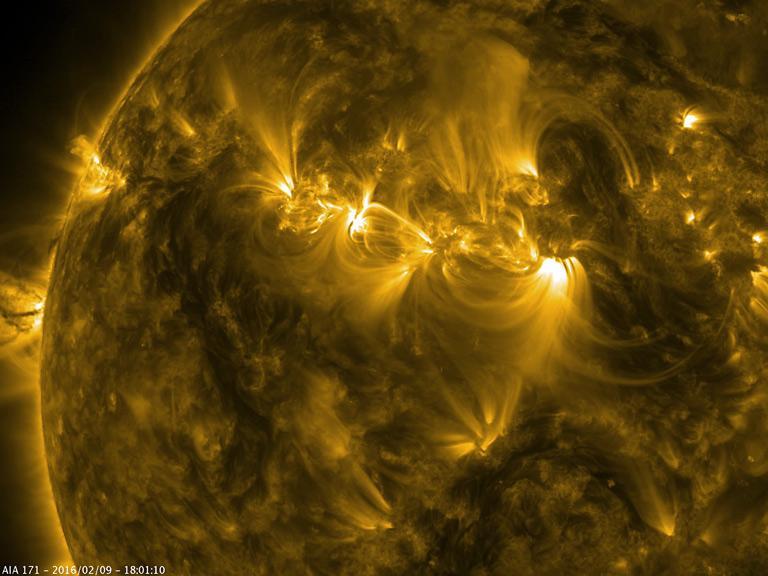
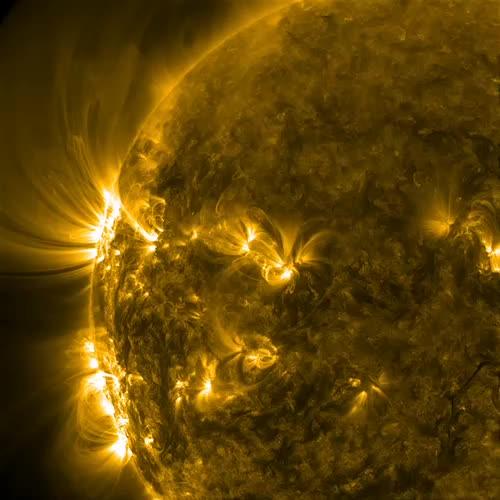
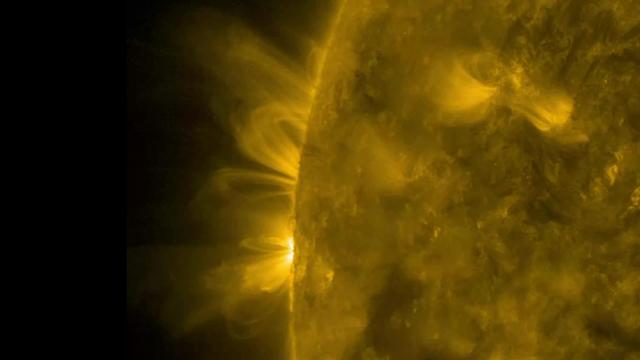
This close-up image of the sun presents an active region in profile as it rotated out of view. We can observe both the bright arching field lines and smaller pieces of darker matter in their midst being pulled back and forth just above the Sun's surface over about 36 hours (July 20-22, 2011). Both of these physical responses were caused by strong, tangled magnetic forces that are constantly evolving and reorganizing within the active region. Other active regions can be seen in the foreground as well. The image and movie were taken in extreme ultraviolet light of ionized iron heated to one million degrees. To view a hd video of this event go here: <a href="http://www.flickr.com/photos/gsfc/6006013038">www.flickr.com/photos/gsfc/6006013038</a> Credit: NASA/GSFC/SDO <b><a href="http://www.nasa.gov/centers/goddard/home/index.html" rel="nofollow">NASA Goddard Space Flight Center</a></b> enables NASA’s mission through four scientific endeavors: Earth Science, Heliophysics, Solar System Exploration, and Astrophysics. Goddard plays a leading role in NASA’s accomplishments by contributing compelling scientific knowledge to advance the Agency’s mission. <b>Follow us on <a href="http://twitter.com/NASA_GoddardPix" rel="nofollow">Twitter</a></b> <b>Like us on <a href="http://www.facebook.com/pages/Greenbelt-MD/NASA-Goddard/395013845897?ref=tsd" rel="nofollow">Facebook</a></b> <b>Find us on <a href="http://web.stagram.com/n/nasagoddard/?vm=grid" rel="nofollow">Instagram</a></b>
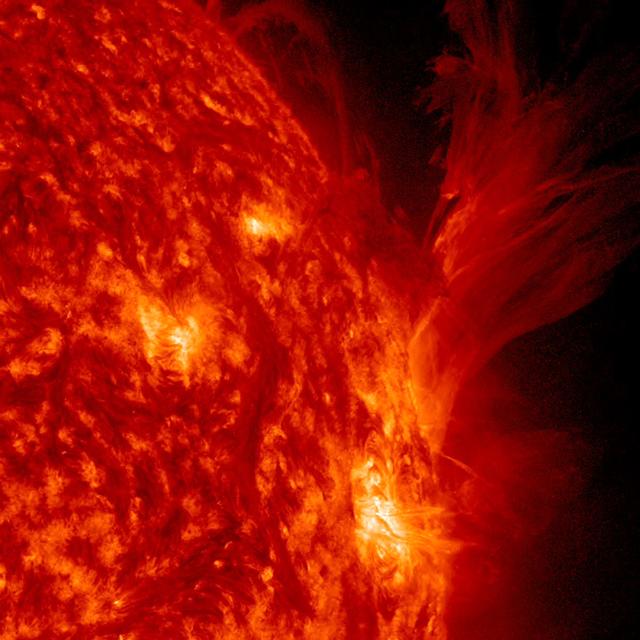
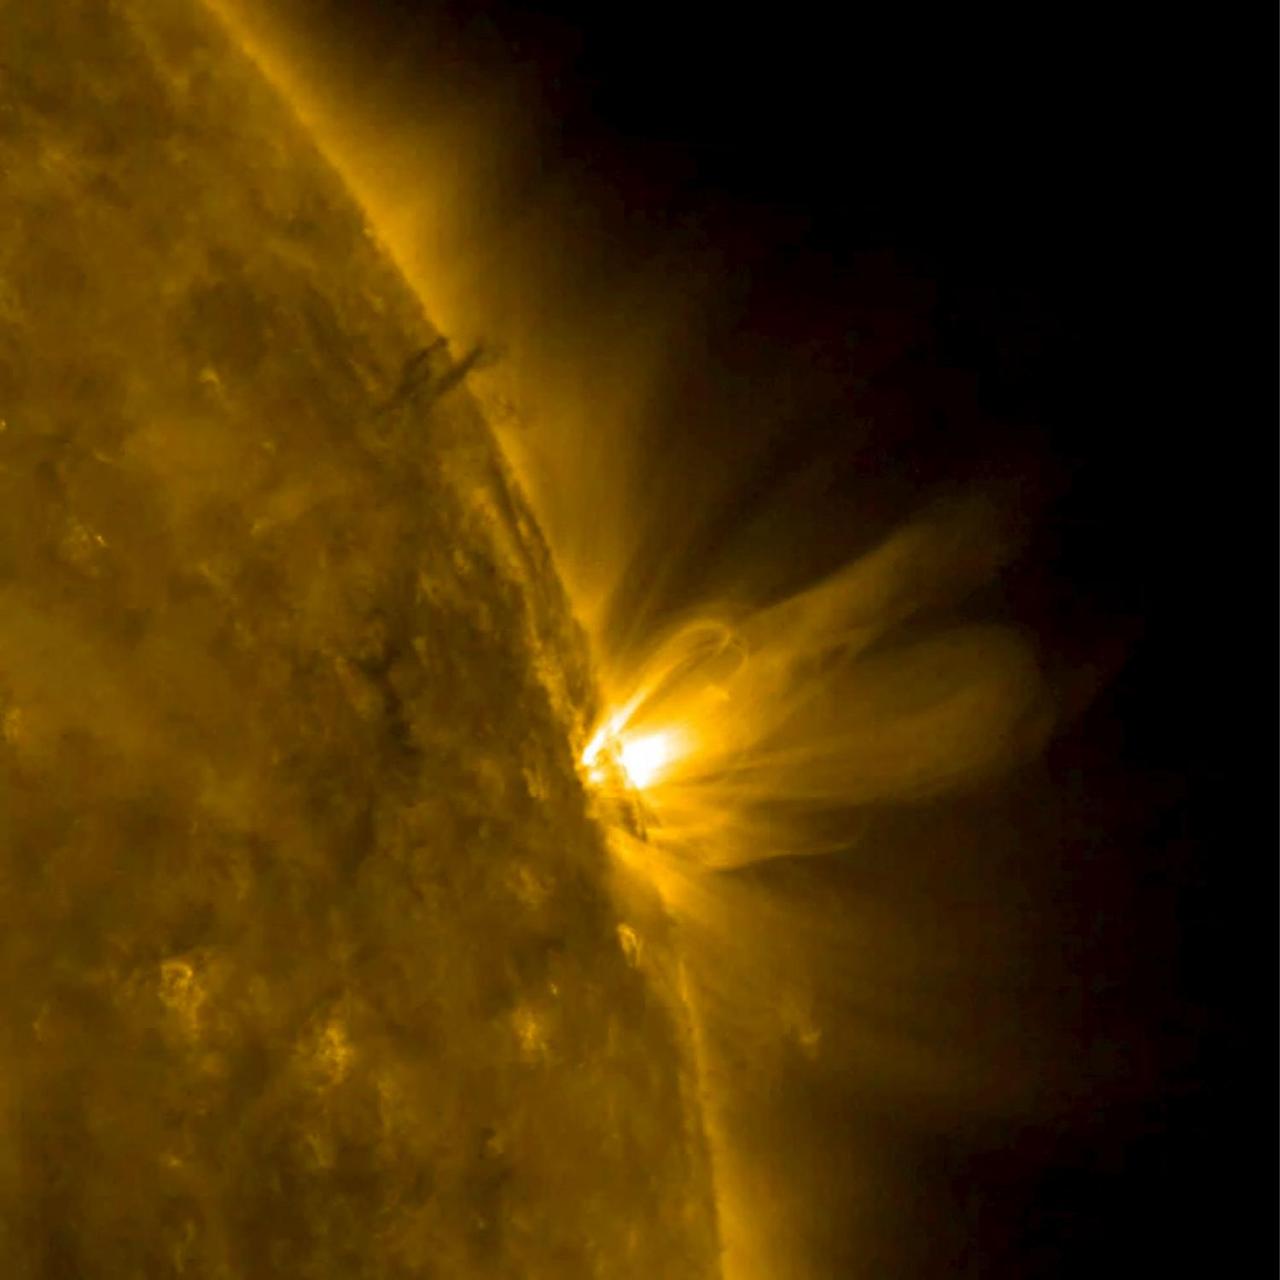
An active region that was rotating out of view off the sun's western limb, displayed a dazzling variety of dozens of spurts and eruptions in about 2.5 days (Apr. 19-21, 2014). The frames, taken in extreme ultraviolet light, show ionized Helium not far above the Sun's surface. All of the activity near this region was caused by intense magnetic forces in a powerful struggling with each other. Credit: NASA/Goddard/SDO <b><a href="http://www.nasa.gov/audience/formedia/features/MP_Photo_Guidelines.html" rel="nofollow">NASA image use policy.</a></b> <b><a href="http://www.nasa.gov/centers/goddard/home/index.html" rel="nofollow">NASA Goddard Space Flight Center</a></b> enables NASA’s mission through four scientific endeavors: Earth Science, Heliophysics, Solar System Exploration, and Astrophysics. Goddard plays a leading role in NASA’s accomplishments by contributing compelling scientific knowledge to advance the Agency’s mission. <b>Follow us on <a href="http://twitter.com/NASAGoddardPix" rel="nofollow">Twitter</a></b> <b>Like us on <a href="http://www.facebook.com/pages/Greenbelt-MD/NASA-Goddard/395013845897?ref=tsd" rel="nofollow">Facebook</a></b> <b>Find us on <a href="http://instagram.com/nasagoddard?vm=grid" rel="nofollow">Instagram</a></b>
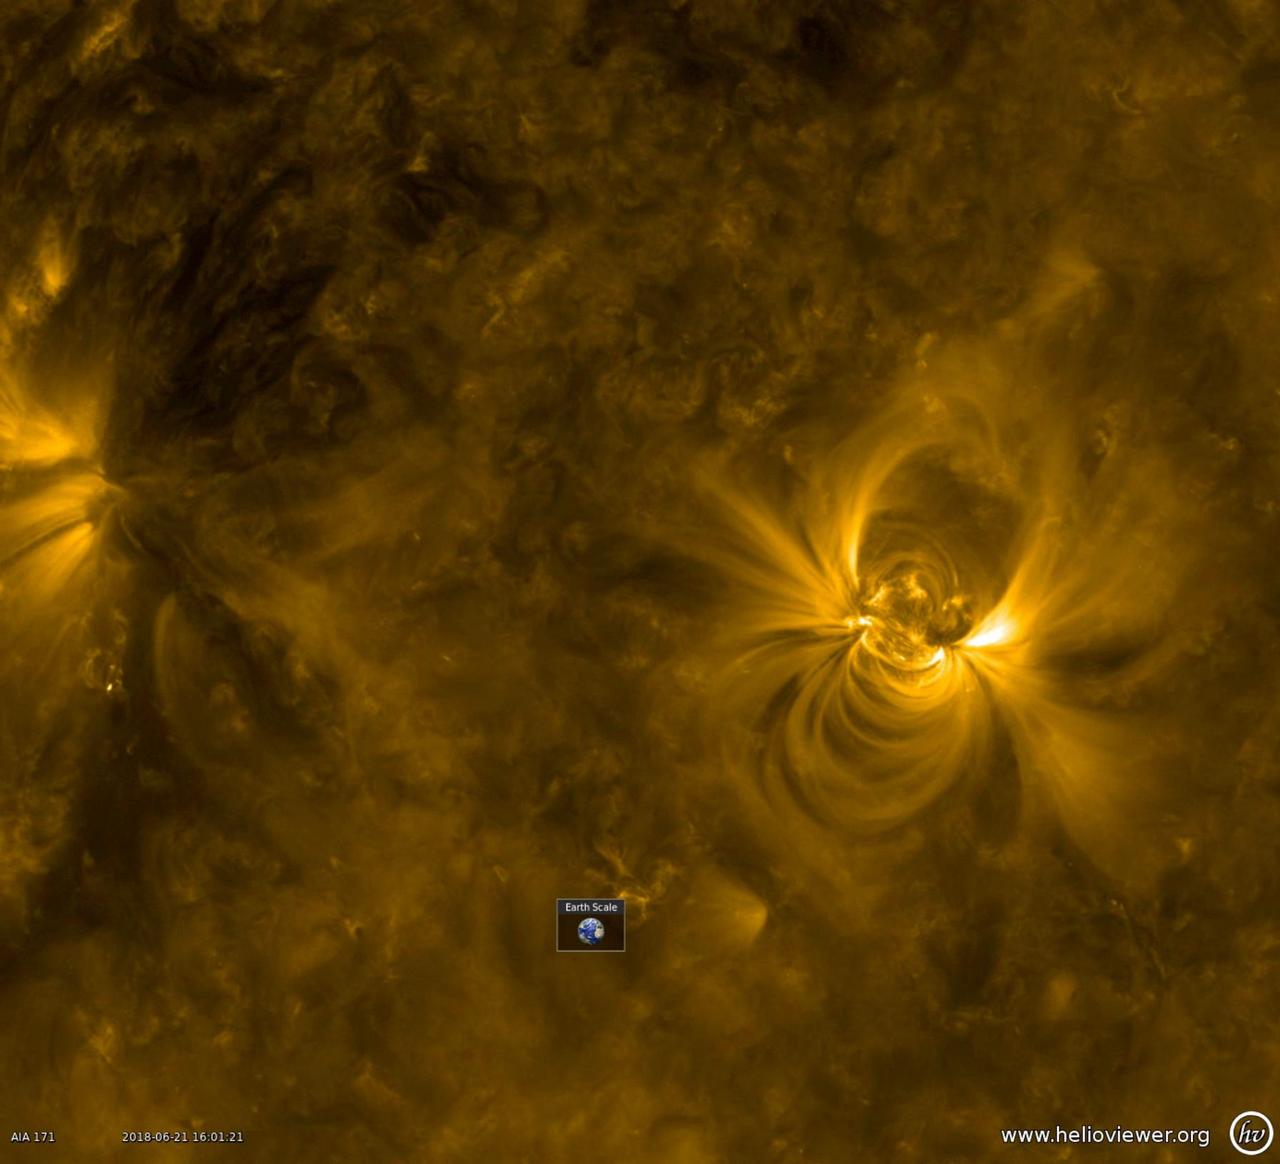
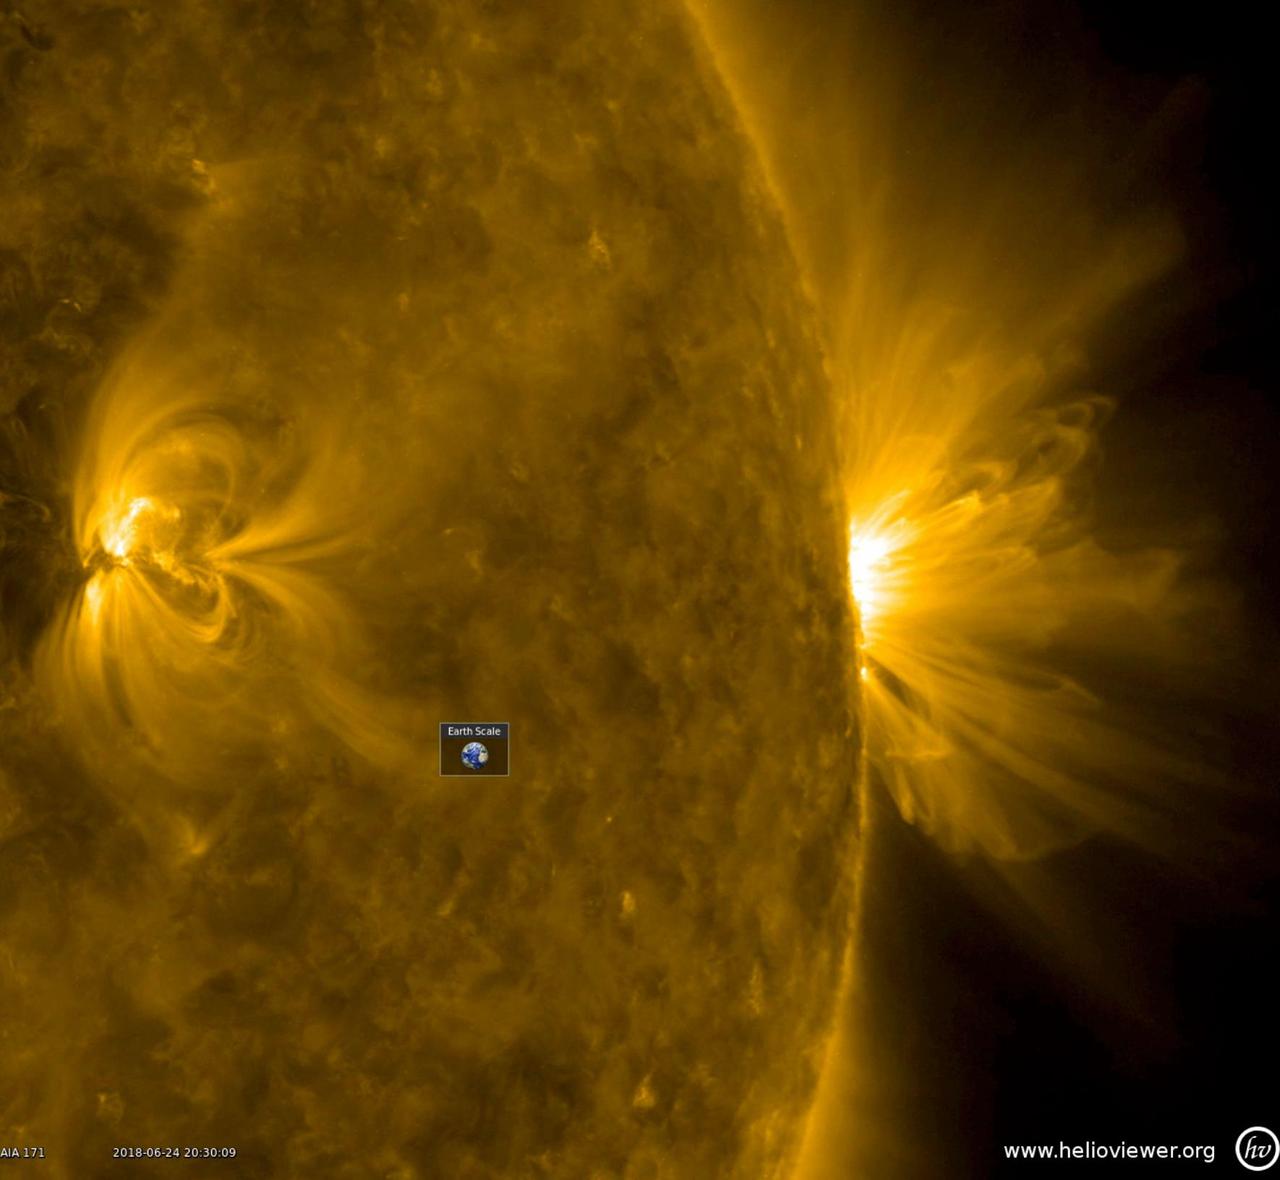
A new active region appeared on June 19th, quickly growing in size over two days (June 20-22, 2018). Active regions are areas of enhanced magnetic activity on the Sun's surface, generating the huge loops and dynamic surges observed here. Charged particles spinning along the field lines above the active region are illuminated in this wavelength of extreme ultraviolet light. The superimposed Earth icon gives a sense of just how large these loops are. Movies are available at https://photojournal.jpl.nasa.gov/catalog/PIA22582
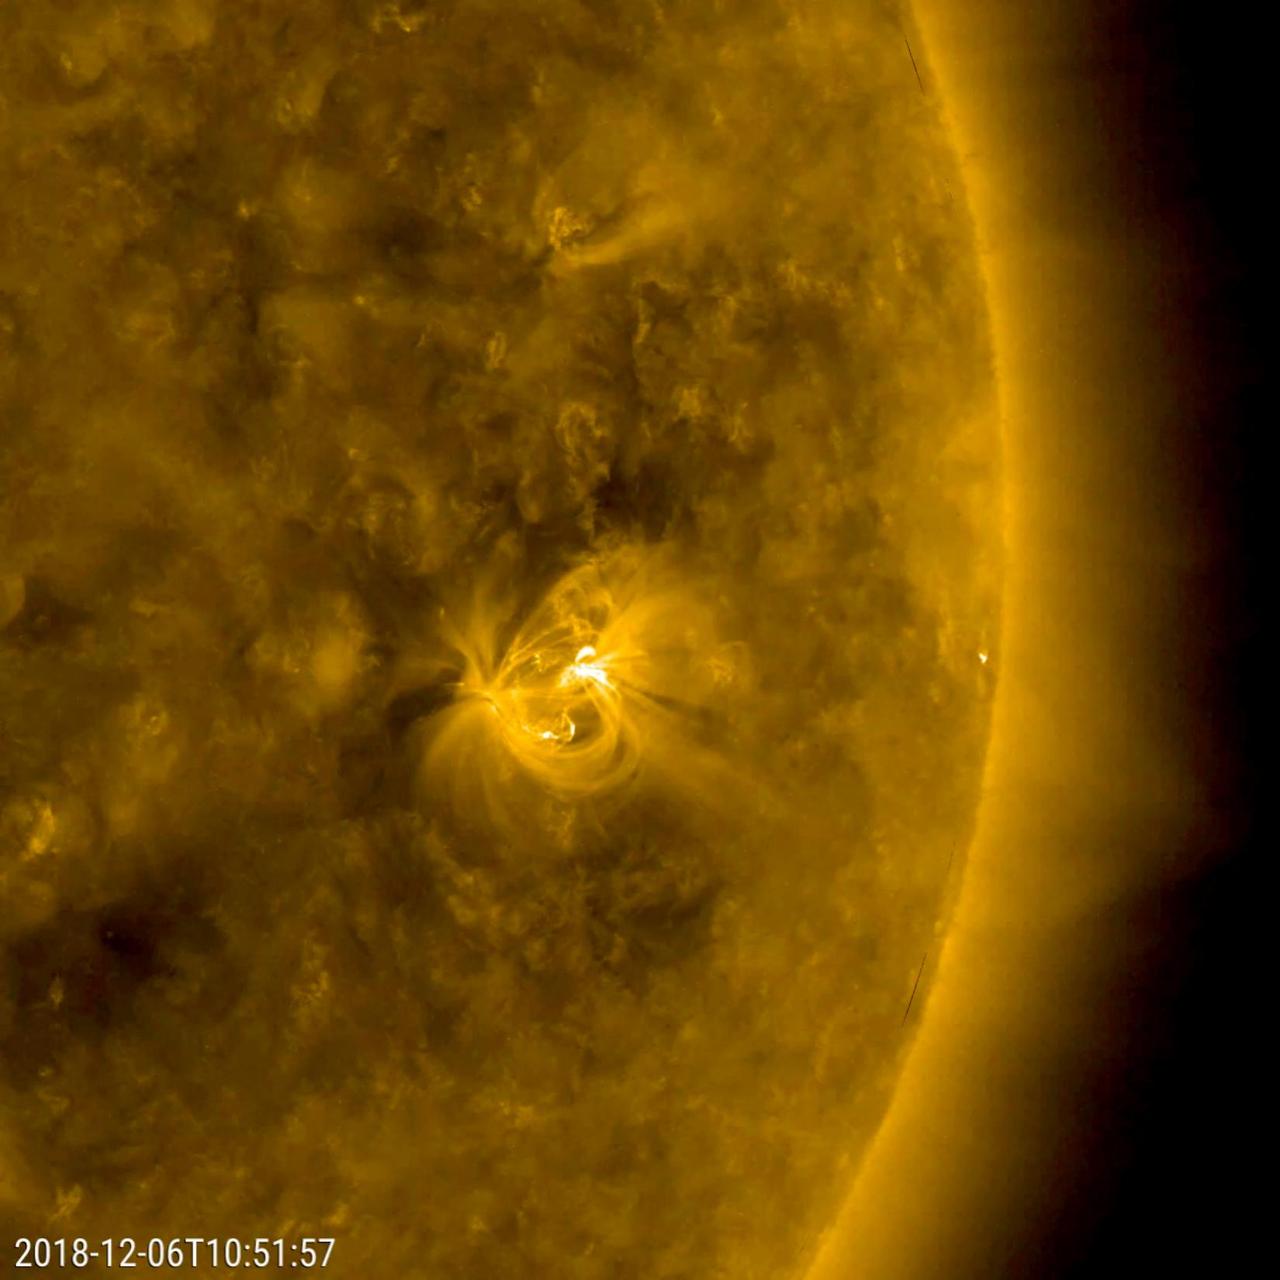
The only active region observed this week appeared on Dec. 5, 2018 and grew into an average size display of dynamic activity (Dec. 6-7, 2018). As viewed in a wavelength of extreme ultraviolet light, the region presented numerous magnetic loops of charged particles, rapidly changing their shapes and directions. As the sun is approaching its minimum level of activity in its 11 year solar cycle, we expect to see fewer and fewer active regions for quite a while. However, this active region is in the southern hemisphere of the Sun and has the North magnetic pole in the lead, so it is a sunspot of Solar Cycle 24. Movies available at https://photojournal.jpl.nasa.gov/catalog/PIA21211
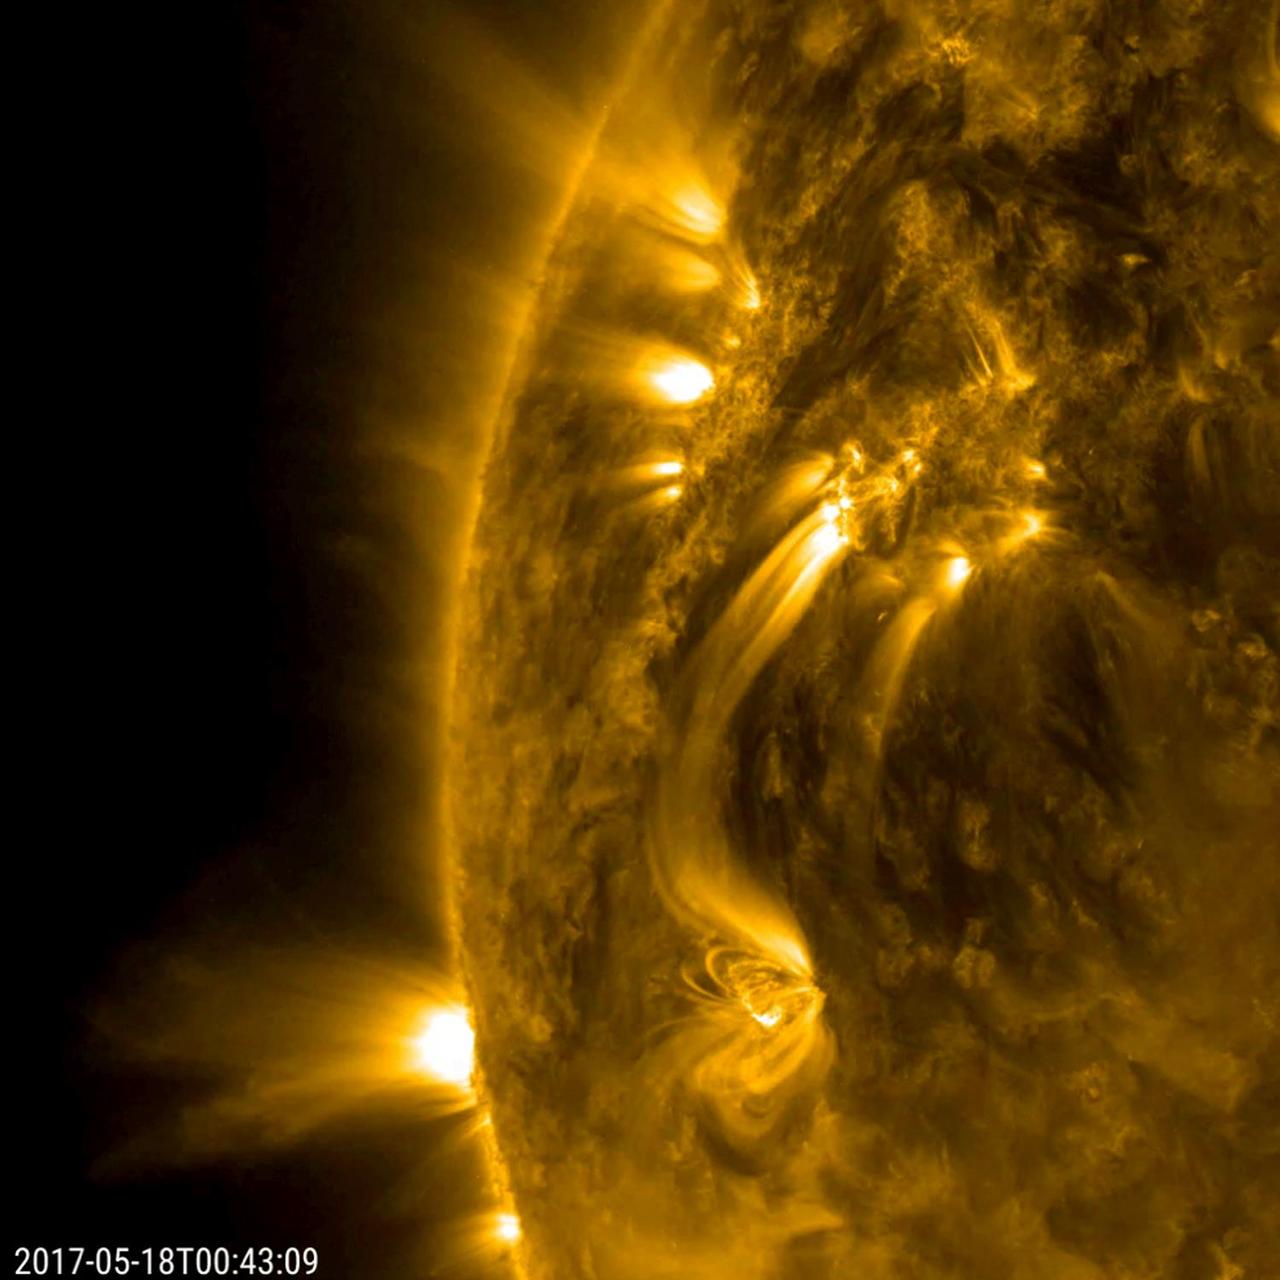
Several bright bands of plasma connect from one active region to another, even though they are tens of thousands of miles away from each other (May 17-18, 2017). Active regions are, by their nature, strong magnetic areas with north and south poles. The plasma consists of charged particles that stream along the magnetic field lines between these two regions. These connecting lines are clearly visible in this wavelength of extreme ultraviolet light. Other loops and strands of bright plasma can be seen rising up and out of smaller active regions as well. The video covers about one day's worth of activity. Movies are available at https://photojournal.jpl.nasa.gov/catalog/PIA21638
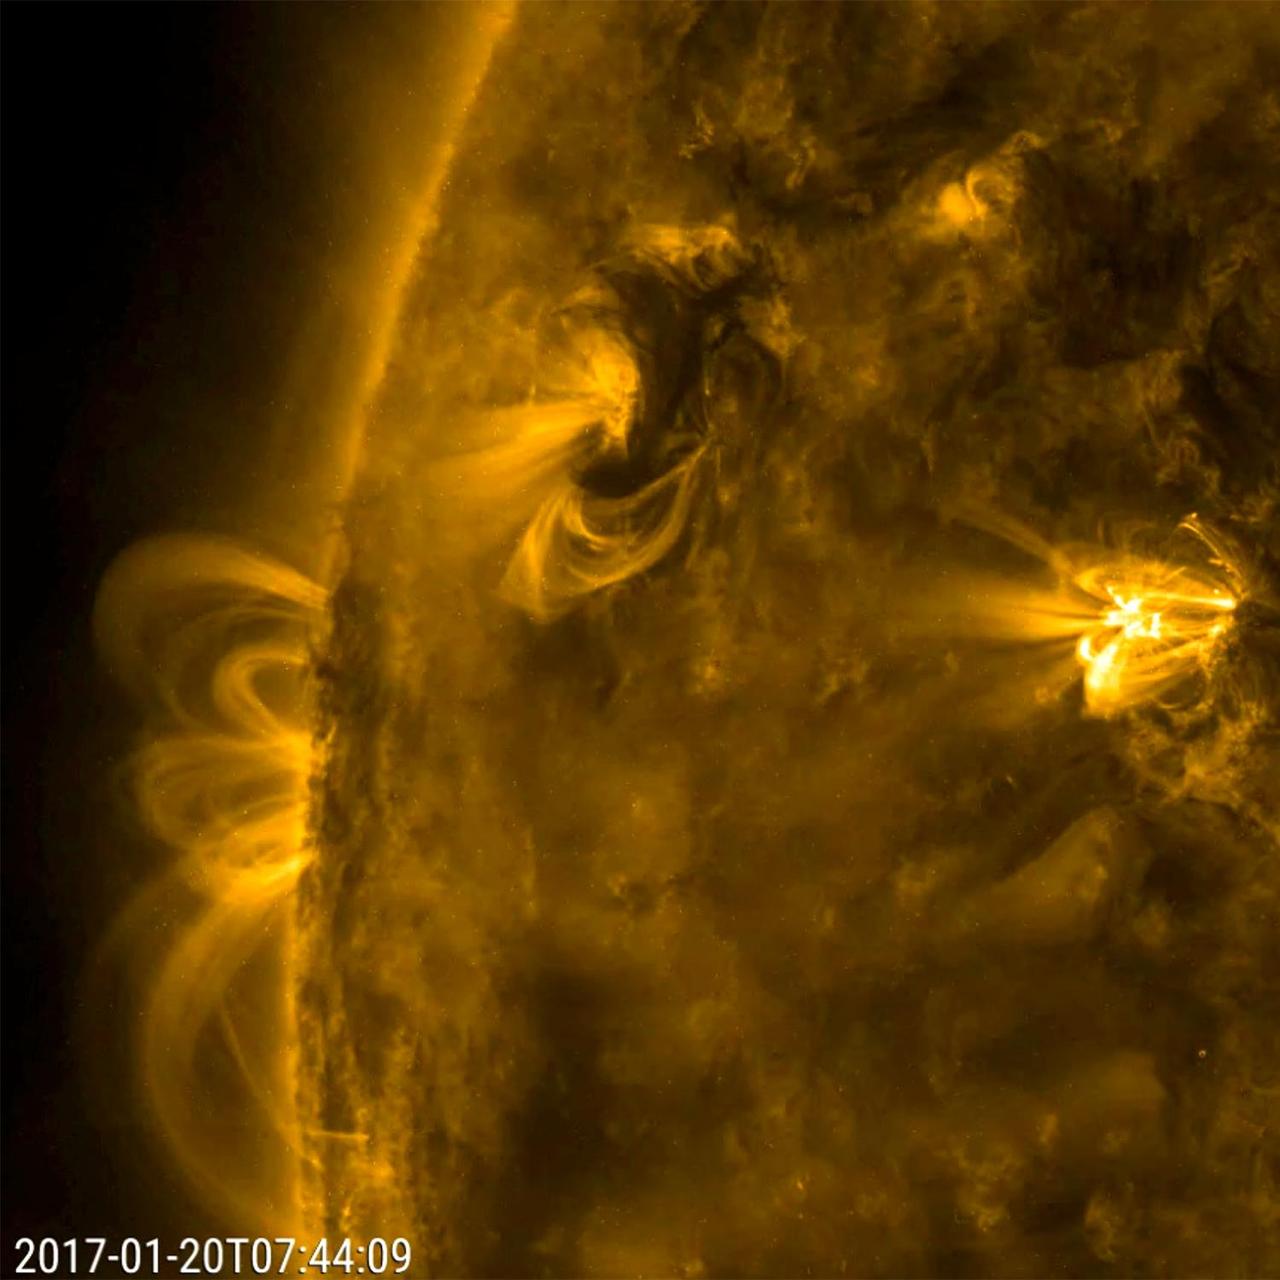
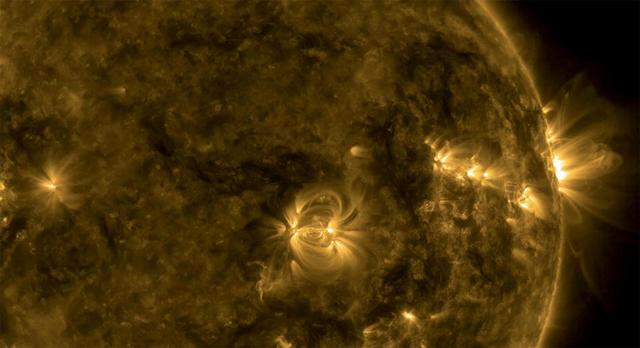
On Jan. 20, 2017, NASA Solar Dynamics Observatory captured a small area of the sun highlighted three active region. Over half a day this active region sent dark swirls of plasma and bright magnetic arches twisting and turning above it. All the activity in the three areas was driven by competing magnetic forces. The dynamic action was observed in a wavelength of extreme ultraviolet light. Movies are available at http://photojournal.jpl.nasa.gov/catalog/PIA11703
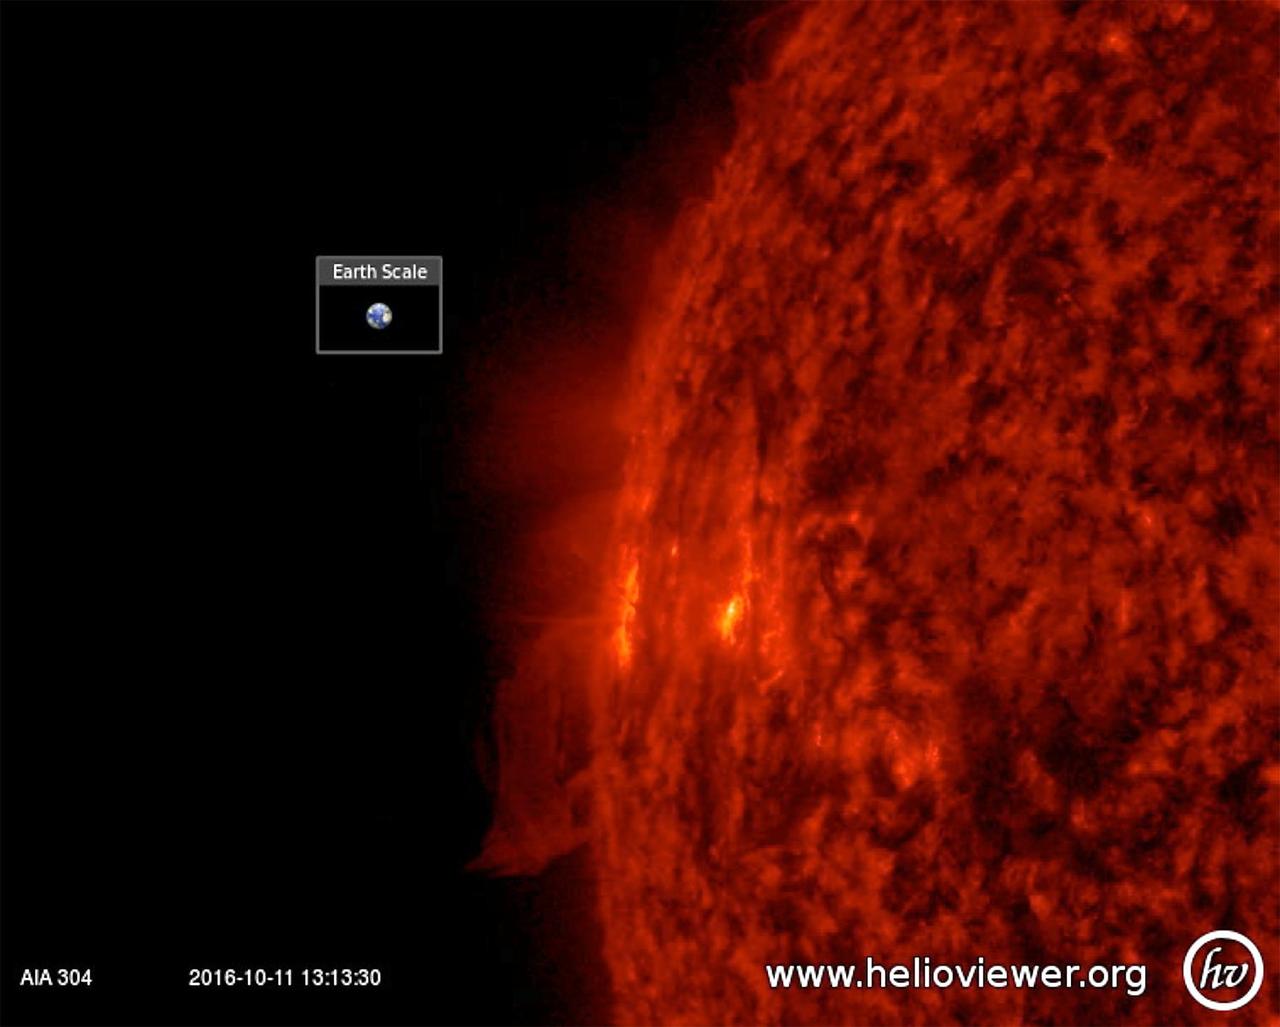
An active region just rotating into view gave us a perfect view of the tussle of magnetic field lines above it (Oct. 10-11, 2016). The particles spiraling along the magnetic field lines become visible in extreme ultraviolet light, helping us to see the struggle going on. There were no eruptions during this period, although active regions are usually the source for solar storms. The video clip covers just one day's worth of activity. Movies are available at http://photojournal.jpl.nasa.gov/catalog/PIA21109
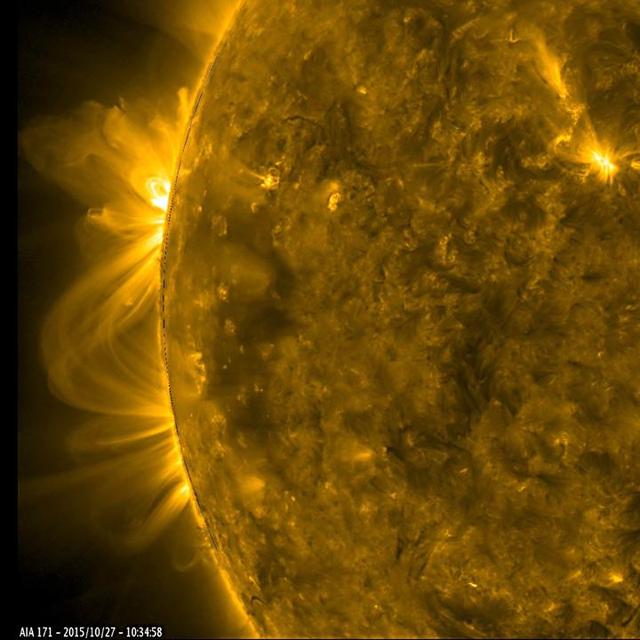
As a pair of active regions began to rotate into view, their towering magnetic field lines above them bloomed into a dazzling display of twisting arches (Oct. 27-28, 2015). Some of the lines reached over and connected with the neighboring active region. Active regions are usually the source of solar storms. The images were taken in a wavelength of extreme ultraviolet light. http://photojournal.jpl.nasa.gov/catalog/PIA20048
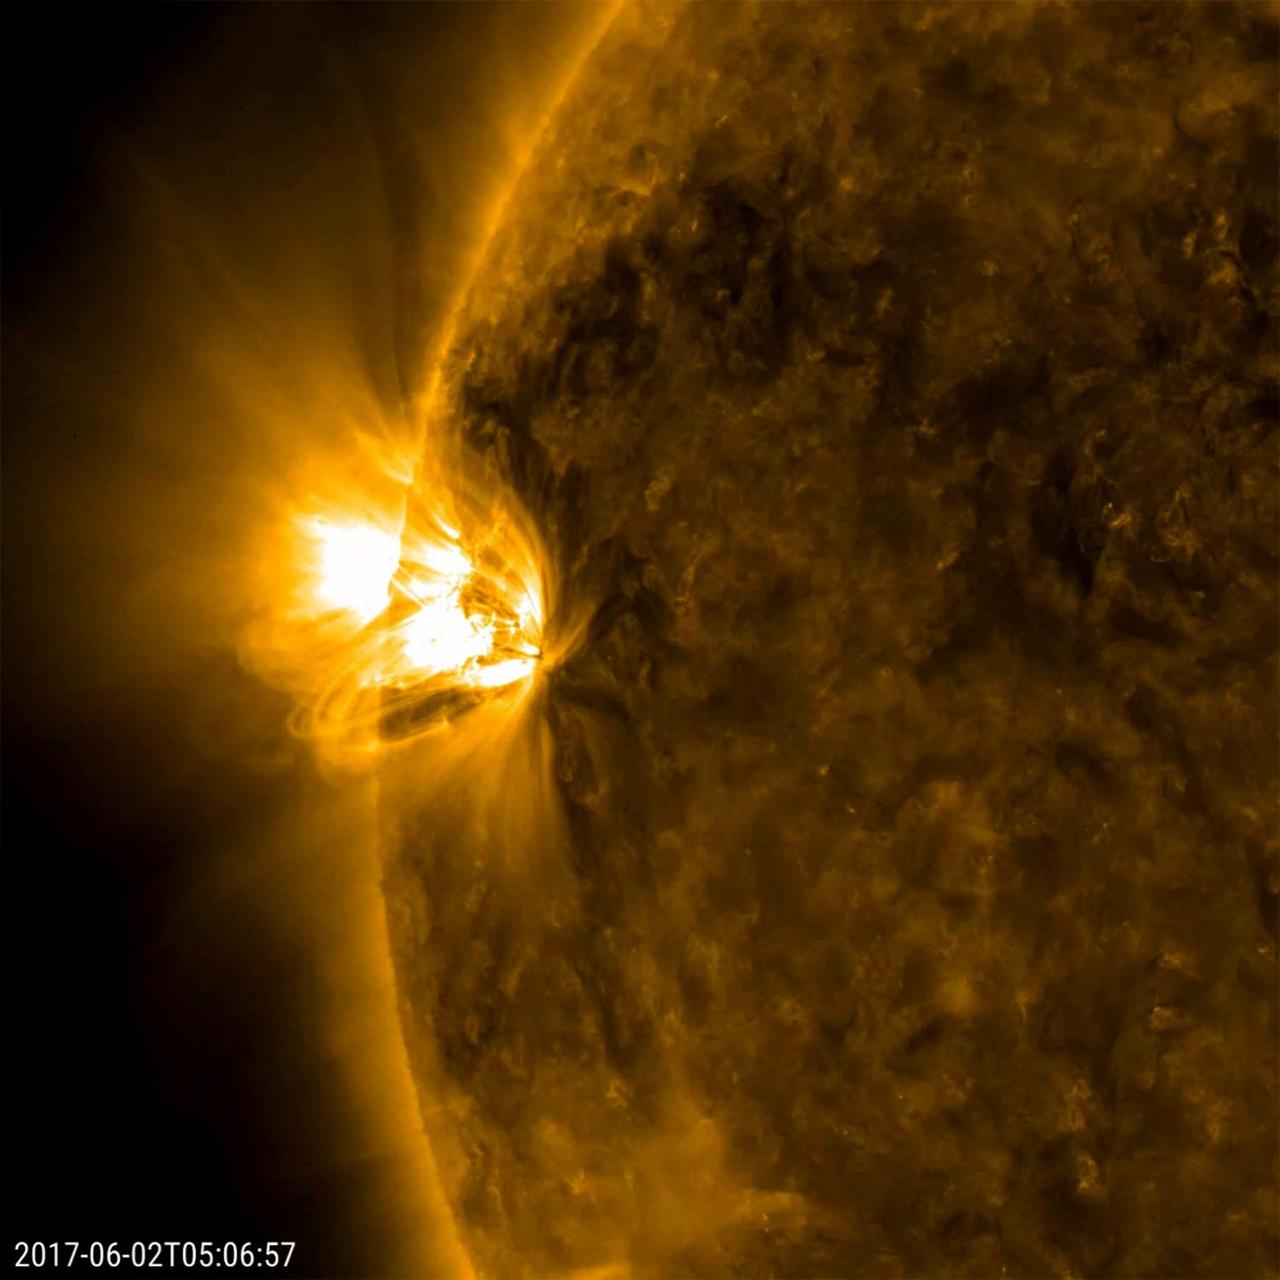
A pair of relatively small (but frenetic) active regions rotated into view, spouting off numerous small flares and sweeping loops of plasma (May 31-June 2, 2017). At first, only the one active region was observed, but mid-way though the video clip a second one behind the first can be picked out. The dynamic regions were easily the most remarkable areas on the sun during this 42-hour period. The images were taken in a wavelength of extreme ultraviolet light. Movies are available at https://photojournal.jpl.nasa.gov/catalog/PIA21756
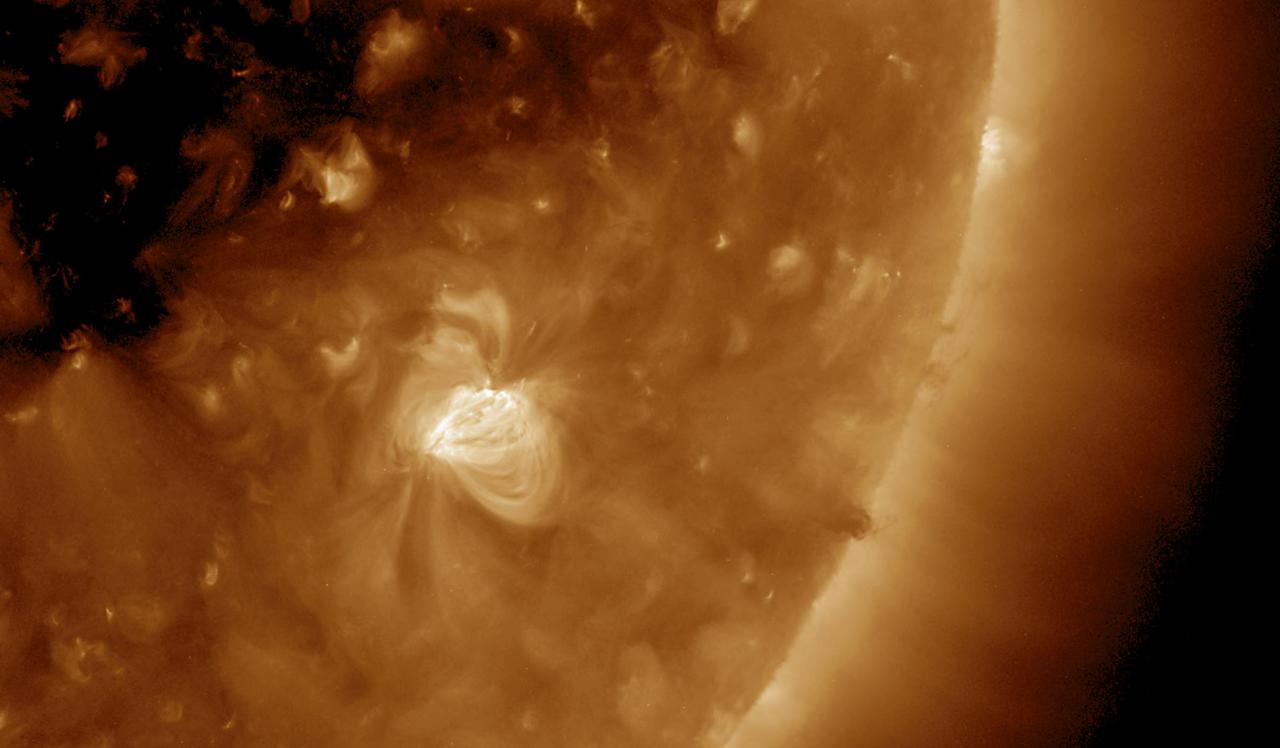
A close-up view of one day in the life of a rather small active region shows the agitation and dynamism of its magnetic field (Dec. 21, 2016). This wavelength of extreme ultraviolet light reveals particles as they spin along the cascading arches of magnetic field lines above the active region. Some darker plasma rises up and spins around at the edge of the sun near the end of the video clip also being pulled by unseen magnetic forces. Movies are available at http://photojournal.jpl.nasa.gov/catalog/PIA15032
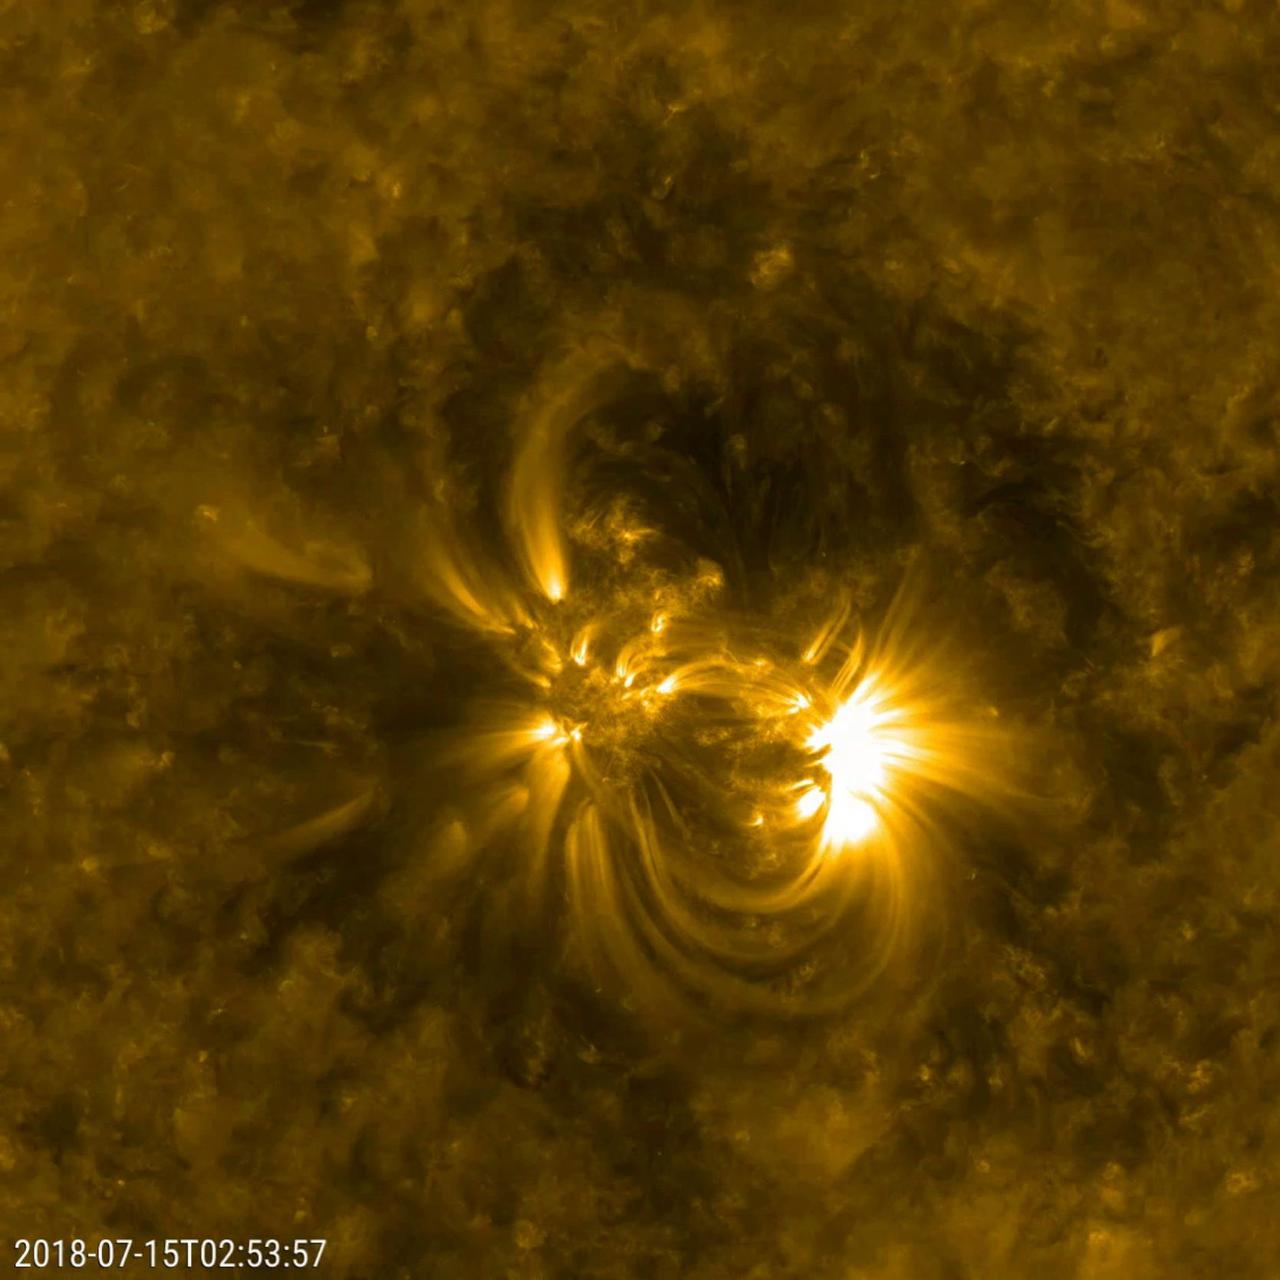
NASA's Solar Dynamics Observatory (SDO) zoomed in to watch close-up the dynamics of this single active region on the sun over a two-day period (July 14-16, 2018). The loops SDO observed in extreme ultraviolet light are illuminated by charged particles spinning along the magnetic field lines above an active region. Active regions are magnetically intense areas that are pushed up to the surface of the sun from below. These regions are often the sources of large eruptions that cause solar storms, though no large eruptions seem to have occurred during this period. To give a sense of scale, these loops are rising up many times the diameter of Earth. Movies are available at https://photojournal.jpl.nasa.gov/catalog/PIA22645

The Sun's rotation brought a new active region into view, revealing the dynamic arches and twisting streams of its magnetic field (Oct. 10-11, 2018). A new active region is becoming more of a rare sight, as the Sun is currently approaching solar minimum -- the point of the 11-year solar cycle when activity is most reduced. The video clip, showing images taken in a wavelength of extreme ultraviolet light covers 33 hours and consists of over 500 frames (i.e., one frame selected every 4 minutes). Animations are available at https://photojournal.jpl.nasa.gov/catalog/PIA18139
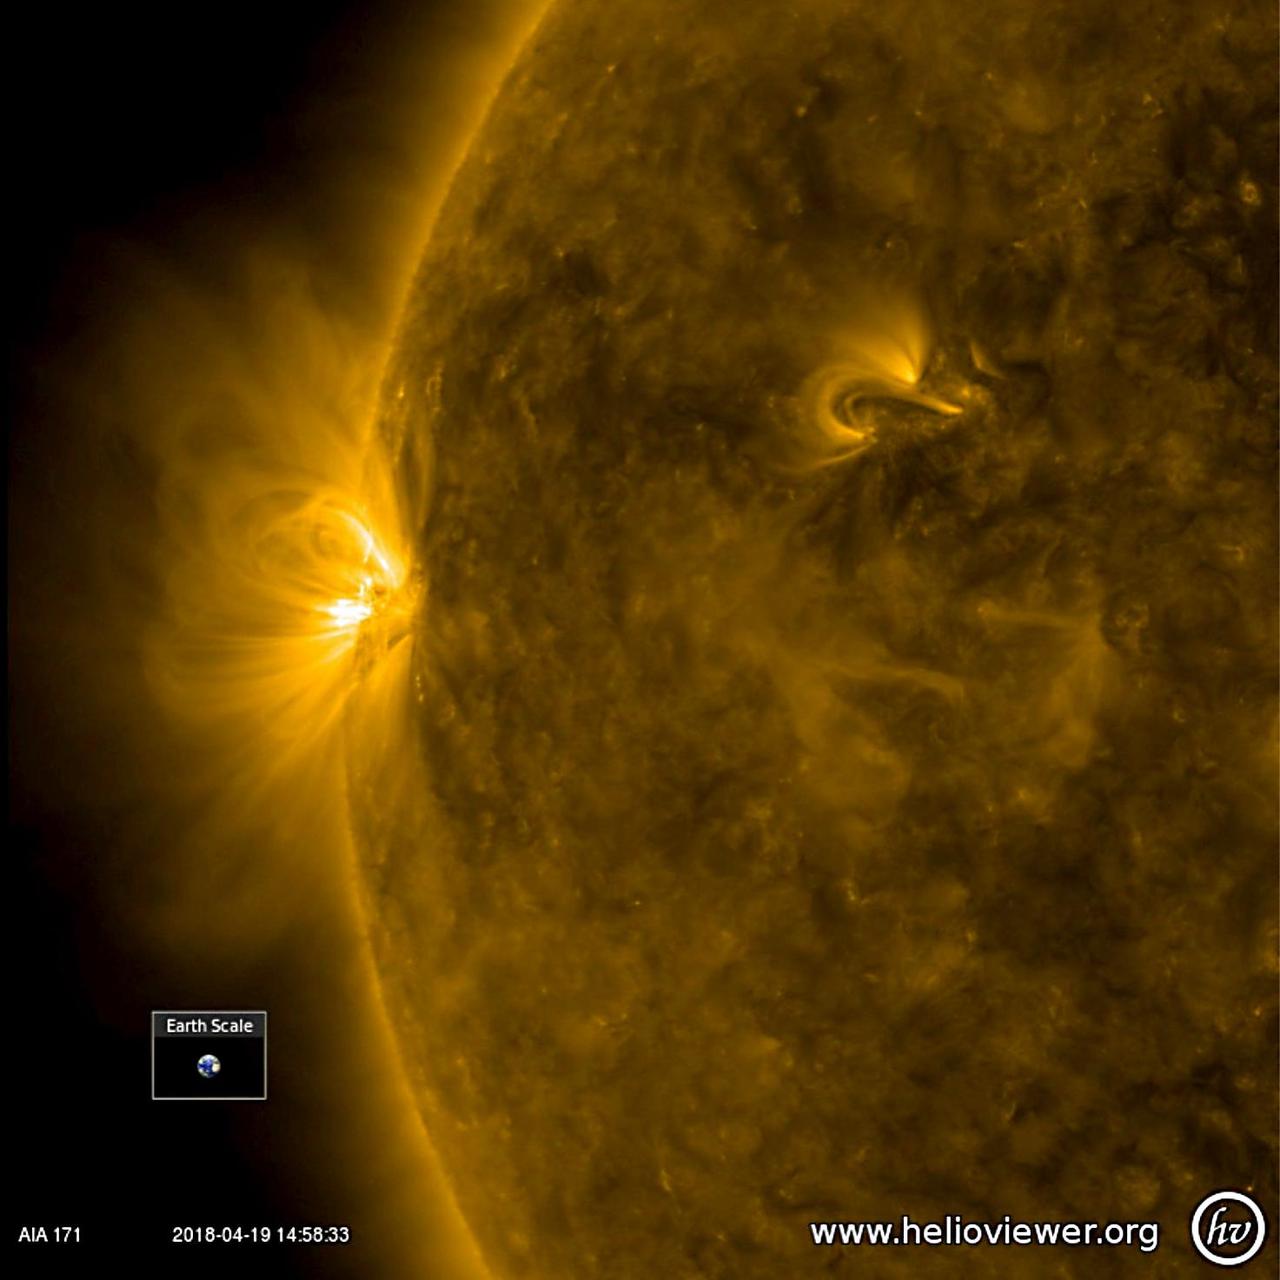
A good-sized active region with bright, towering arches began to rotate into view (Apr. 18-19, 2018). The arches consist of charged particles spiraling along magnetic field lines revealed in this wavelength of extreme ultraviolet light. They rise up above the sun's surface many times the size of Earth. The video covers just 16 hours of activity. We will keep our eyes on this region to see if it has the kind of dynamism to produce solar storms. Videos are available at https://photojournal.jpl.nasa.gov/catalog/PIA22430
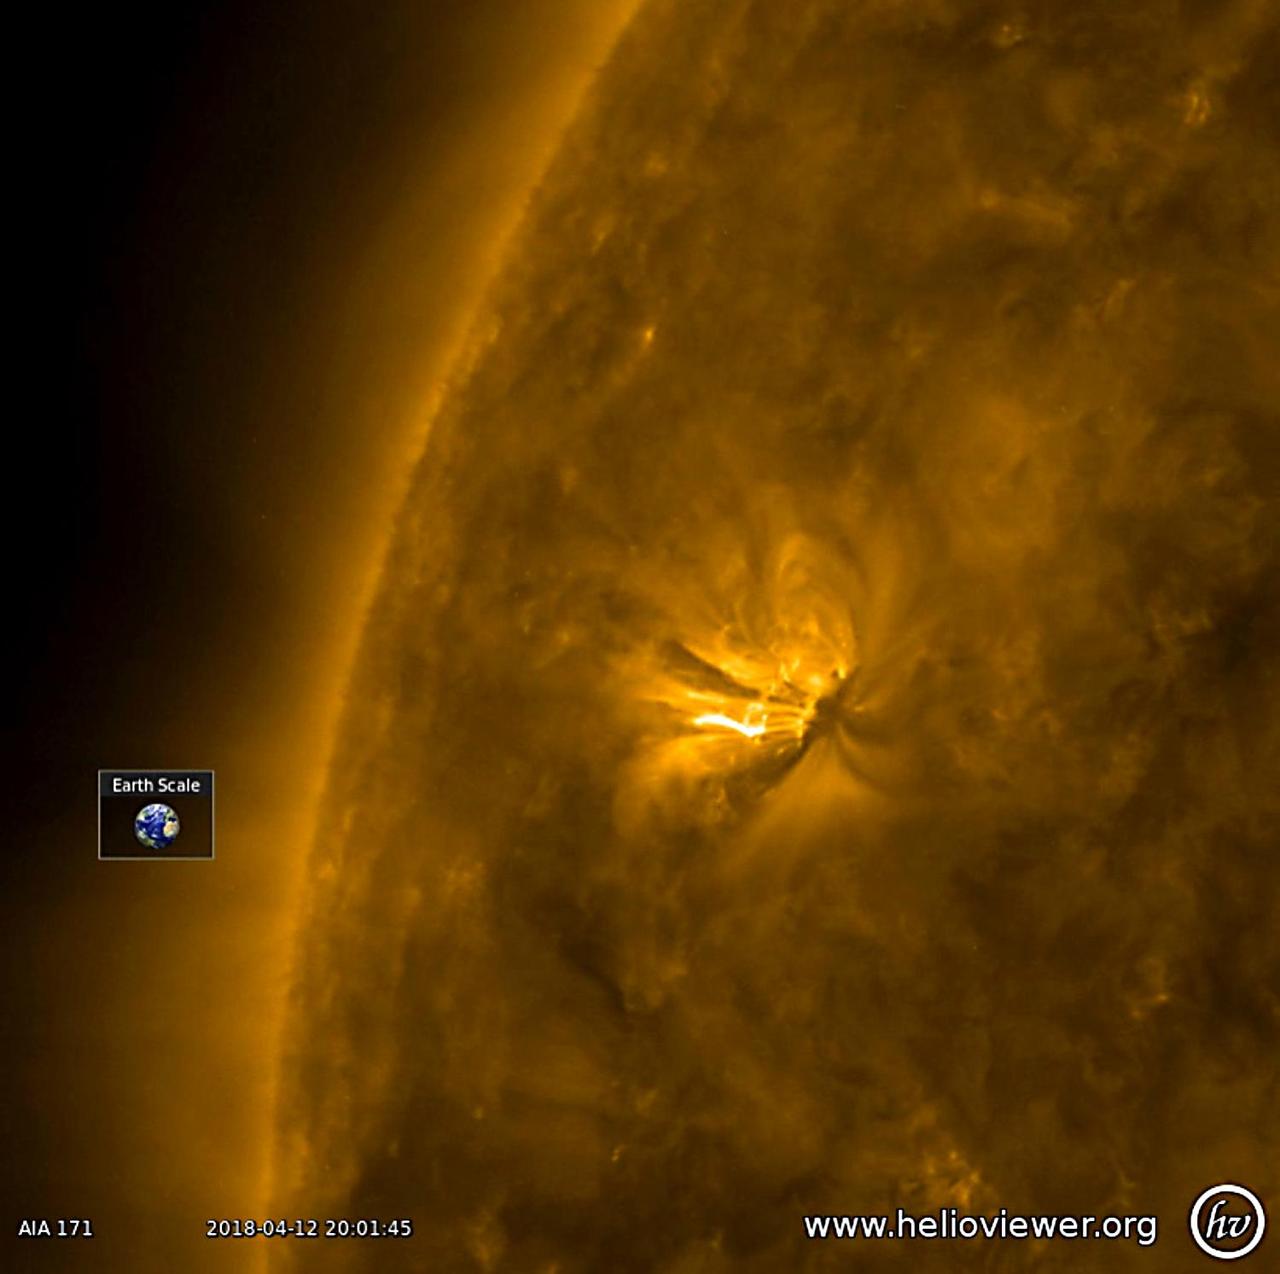
The sun featured just one, rather small active region over the past few days, but it developed rapidly and sported a lot of magnetic activity in just one day (Apr. 11-12, 2018). The activity was observed in a wavelength of extreme ultraviolet light. The loops and twisting arches above it are evidence of magnetic forces tangling with each other. The video clip was produced using Helioviewer software. Movies are available at https://photojournal.jpl.nasa.gov/catalog/PIA06676
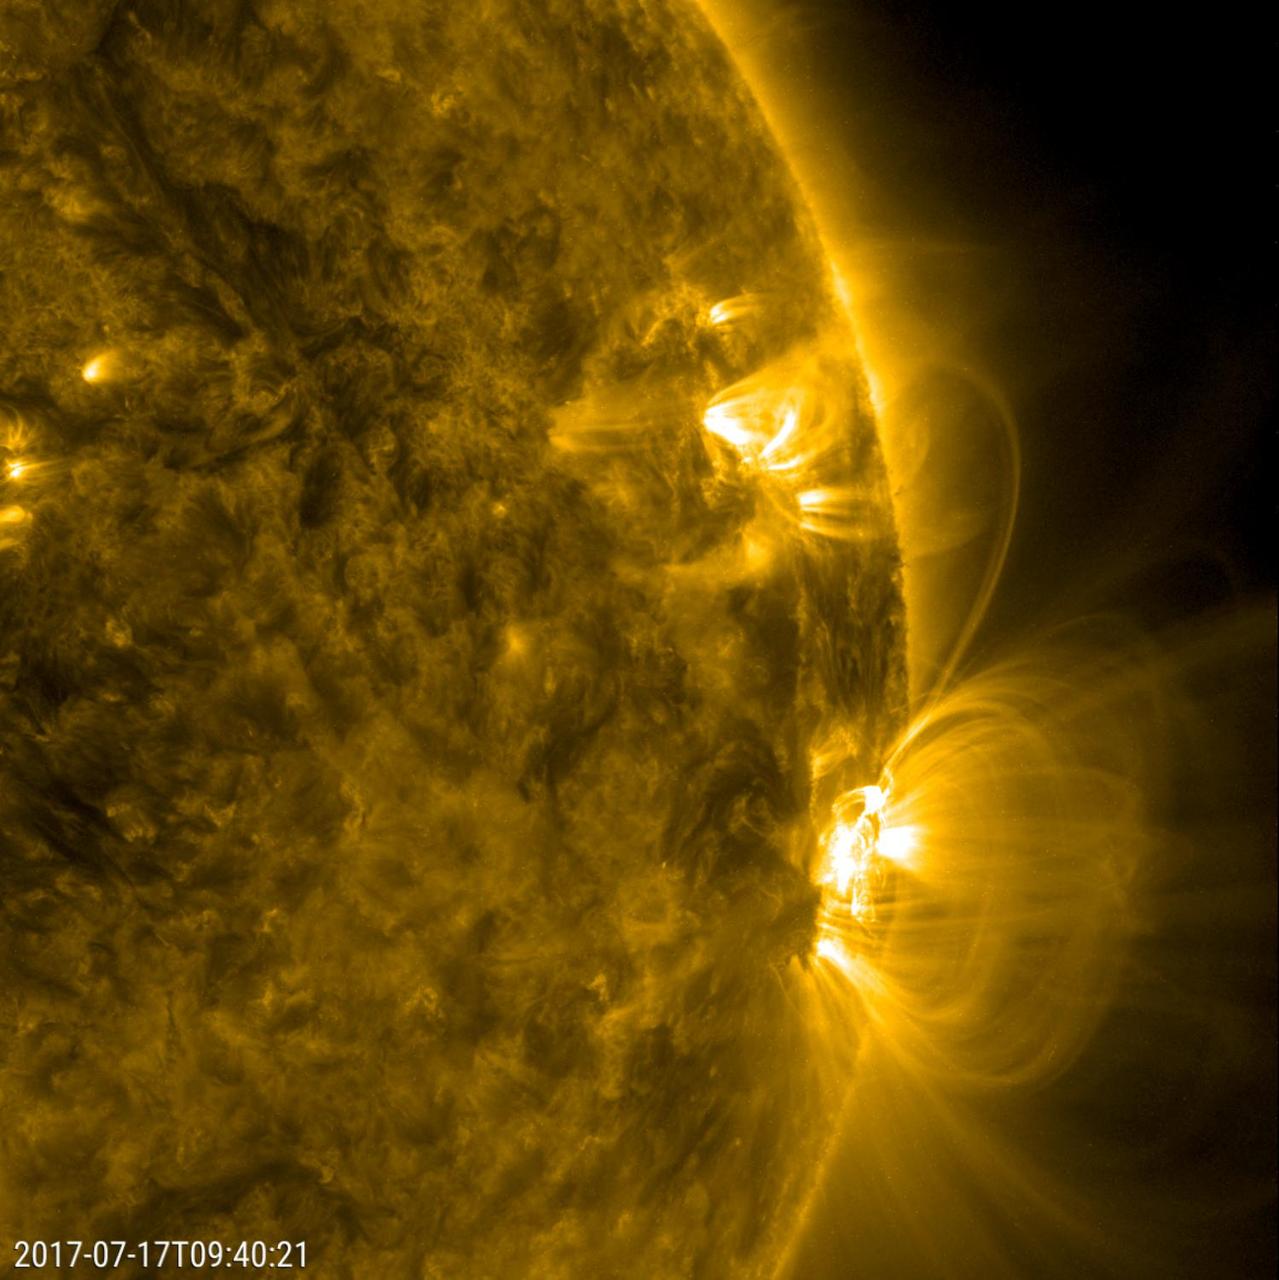
Numerous arches of magnetic field lines danced and swayed above a large active region over about a 30-hour period (July 17-18, 2017). We can also see the magnetic field lines from the large active region reached out and connected with a smaller active region. Those linked lines then strengthened (become brighter), but soon began to develop a kink in them and rather swiftly faded from view. All of this activity is driven by strong magnetic forces associated with the active regions. The images were taken in a wavelength of extreme ultraviolet light. https://photojournal.jpl.nasa.gov/catalog/PIA21838
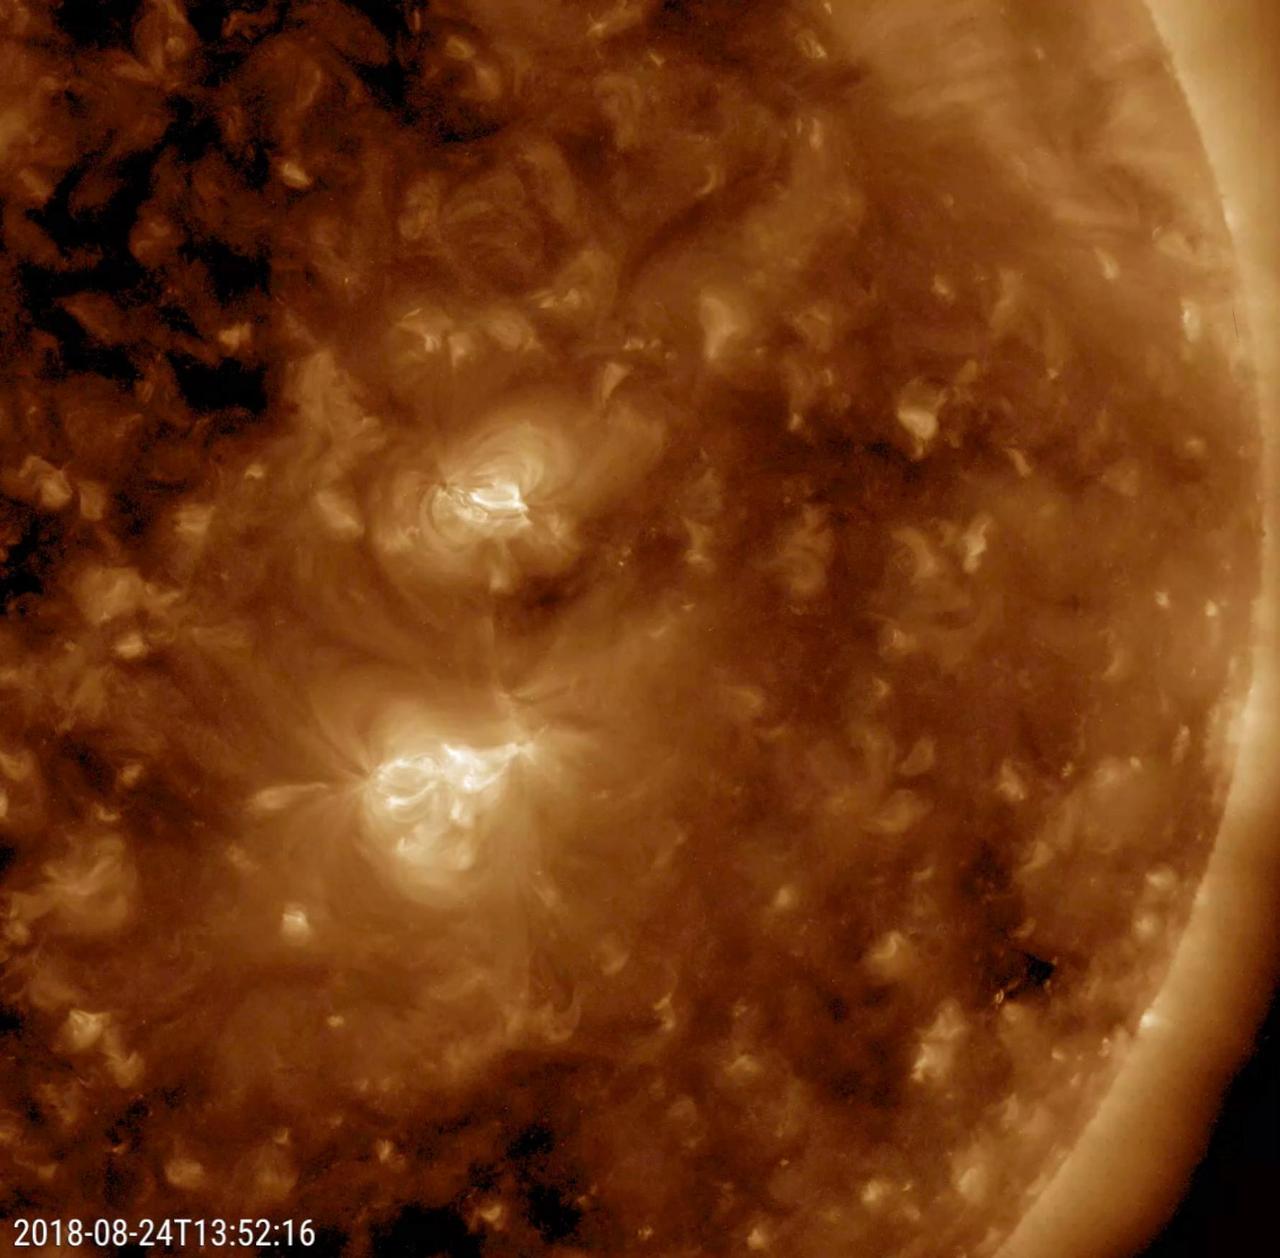
Over the course of just one day a tiny active region grew to became almost as large as its many-days-old neighbor (Aug. 23-24, 2018). Active regions, which are areas of intense magnetism, appear brighter in wavelengths of extreme ultraviolet light and are often the source of solar storms. Movies are available at https://photojournal.jpl.nasa.gov/catalog/PIA22680
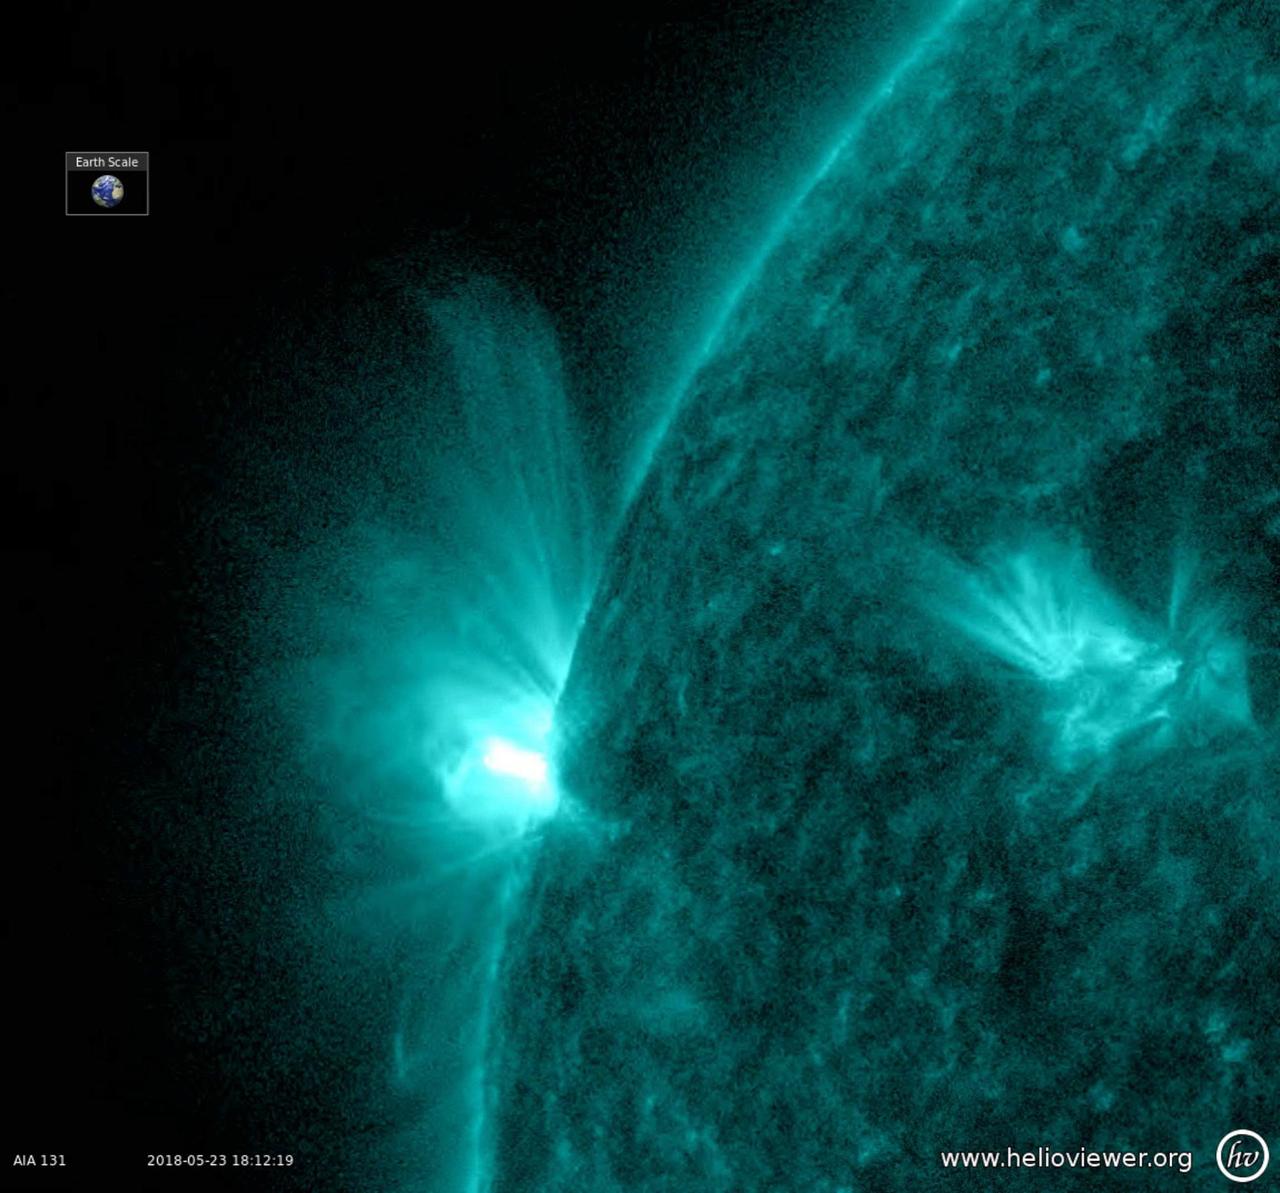
An active region rotated into view and sputtered with numerous small flares and towering magnetic field lines that stretched out many times the diameter of Earth (May 23-25, 2018). Active regions are areas of intense magnetic energy. The field lines are illuminated by charged particles spiraling along them and easiest to discern when viewed in profile. The colorized images were taken in a wavelength of extreme ultraviolet light. Movies are available at https://photojournal.jpl.nasa.gov/catalog/PIA22461
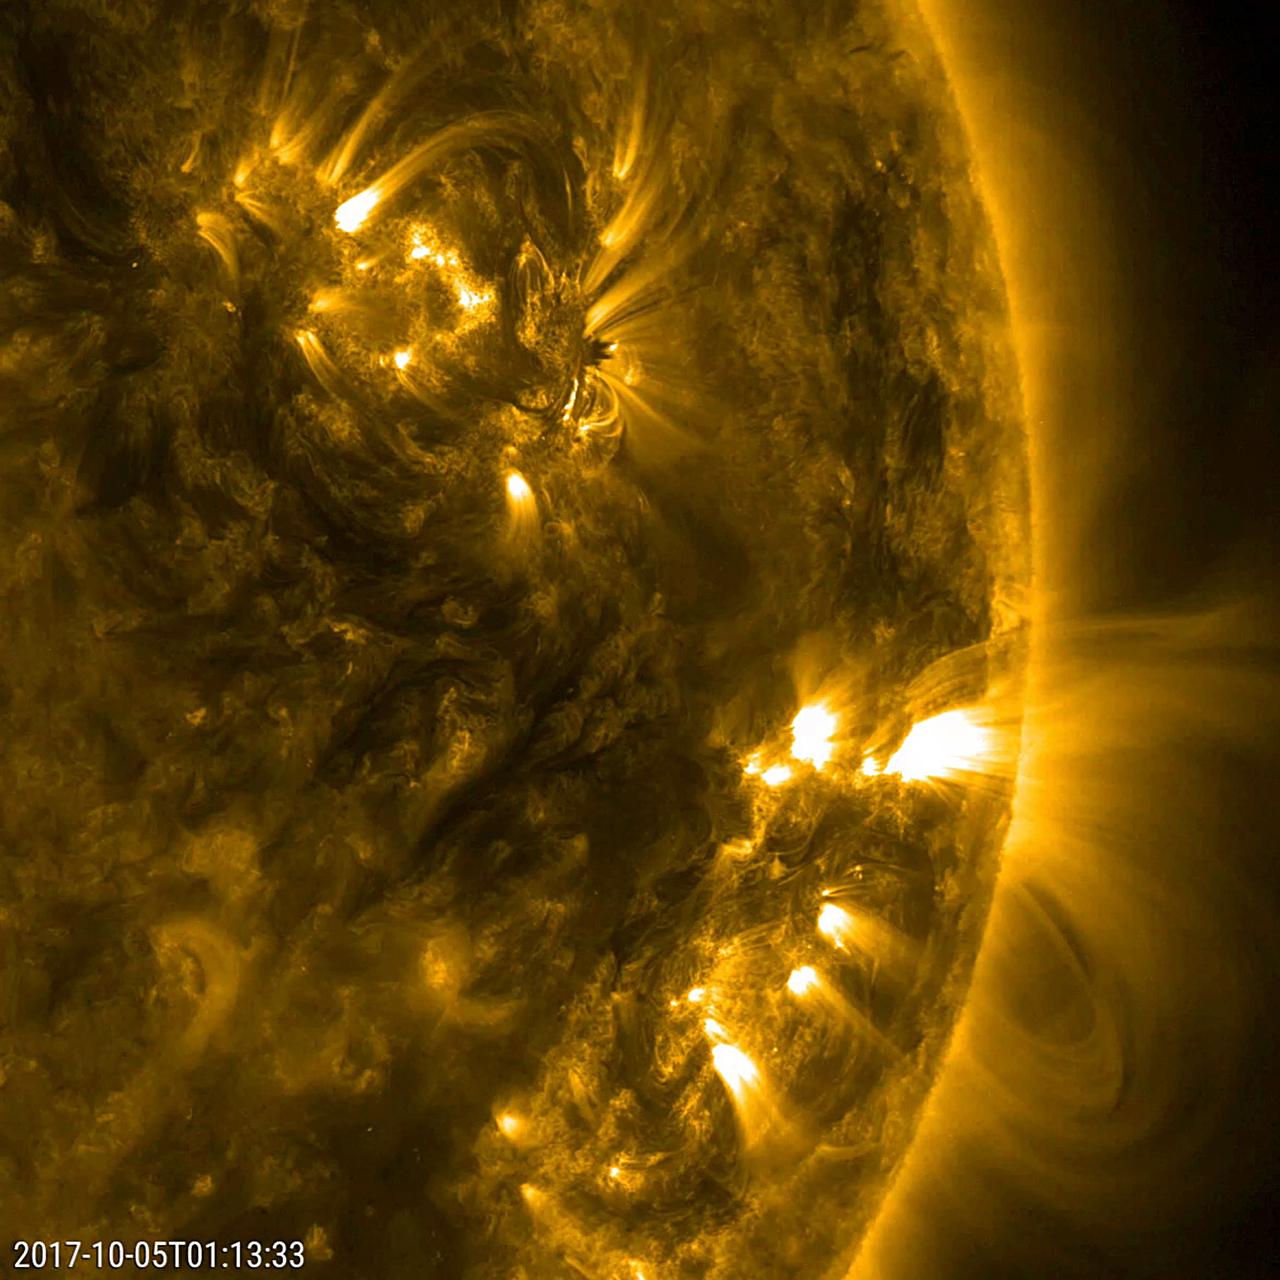
This close-up video clip shows a pair of active regions (the brighter areas) move and change as they rotate with the sun over just a 17-hour period (Oct. 4-5, 2017). They were observed in a wavelength of extreme ultraviolet light that reveals plasma heated to over a million degrees. The arches above the regions consist of charge particles spinning along and revealing magnetic field lines. Each one shows a few minor bursts of material none of them were serious. Animations are available at https://photojournal.jpl.nasa.gov/catalog/PIA22039
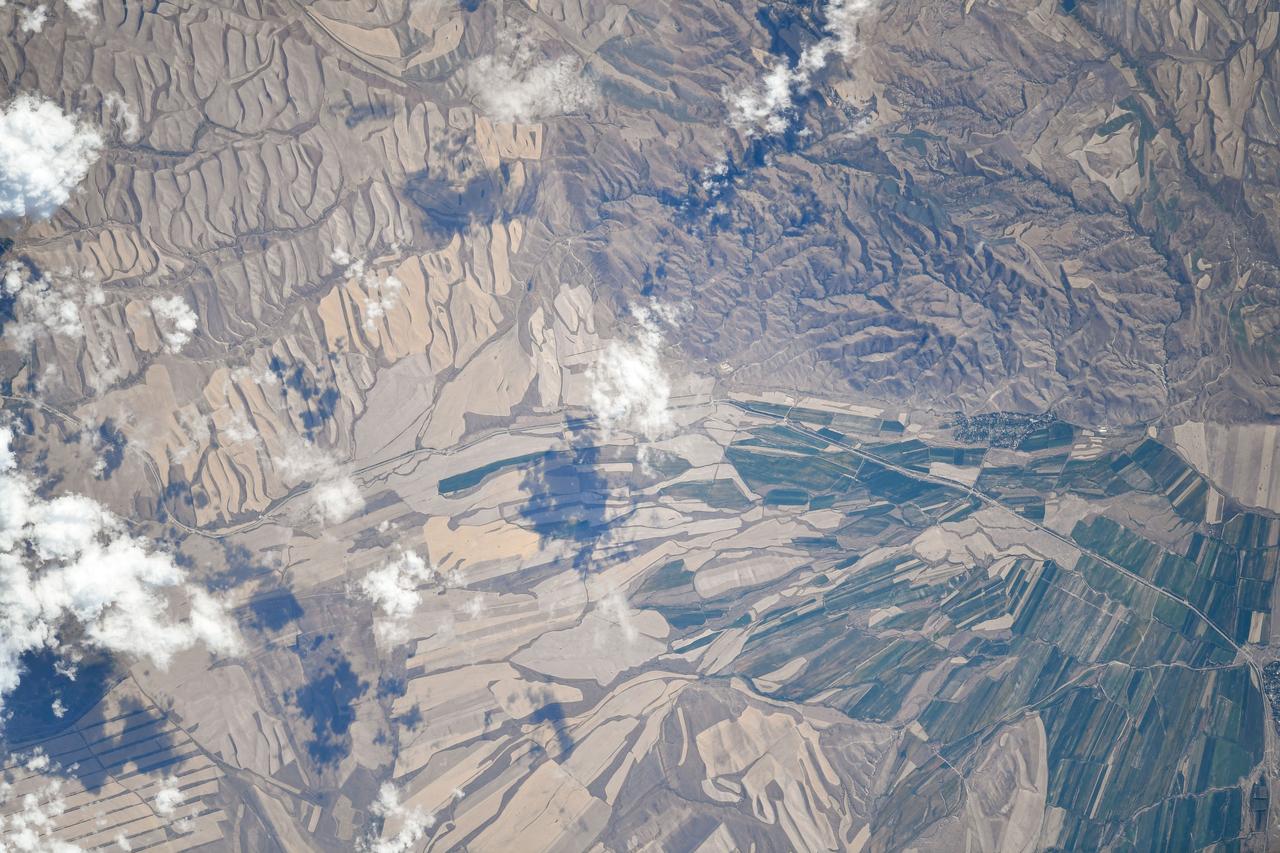
iss073e0510447 (Aug. 19, 2025) --- Agricultural activities in the diverse landscape of Kazakhstan's Jetisu region, near the Chinese border and once a key corridor of the ancient Silk Road, are pictured from the International Space Station as it orbited 263 miles above the Central Asian nation. Credit: Roscosmos
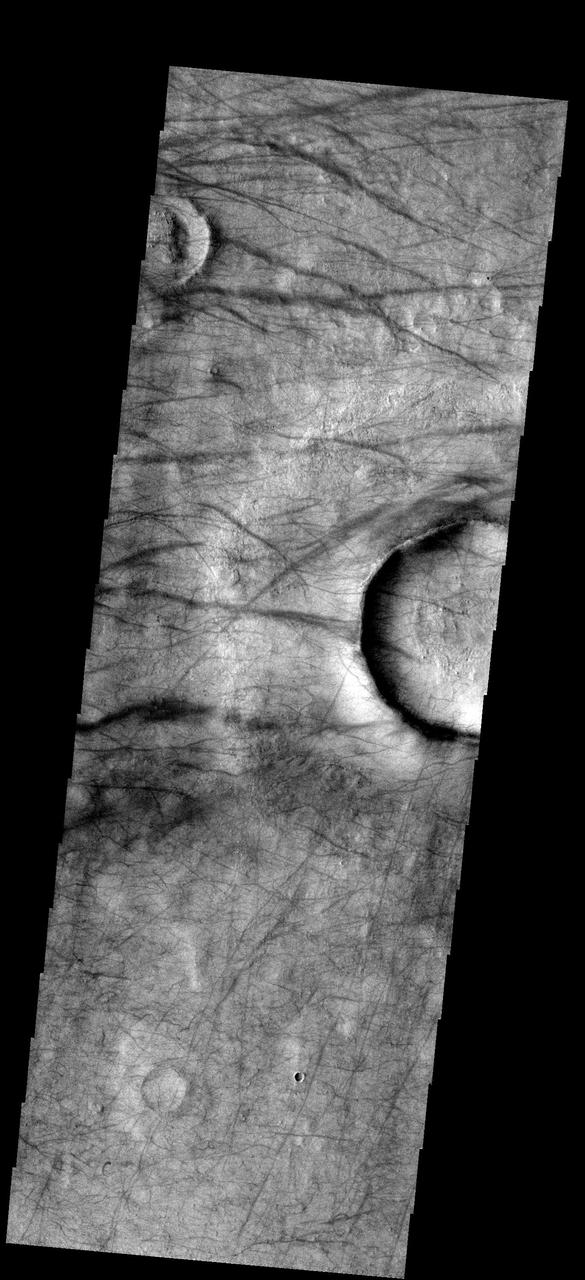
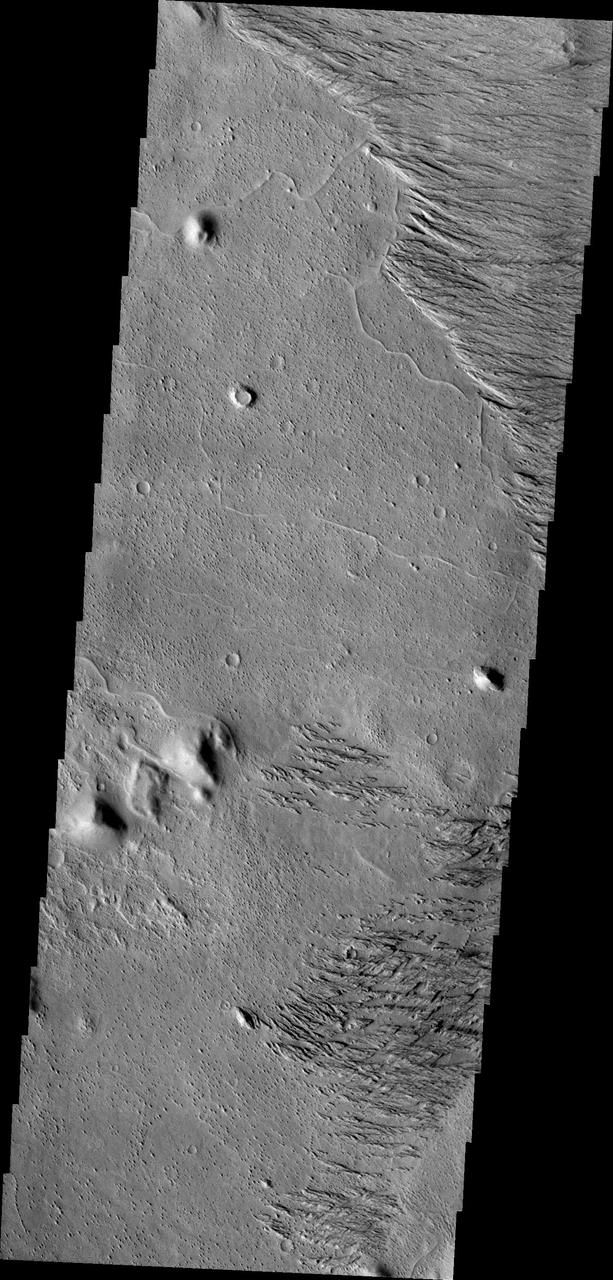
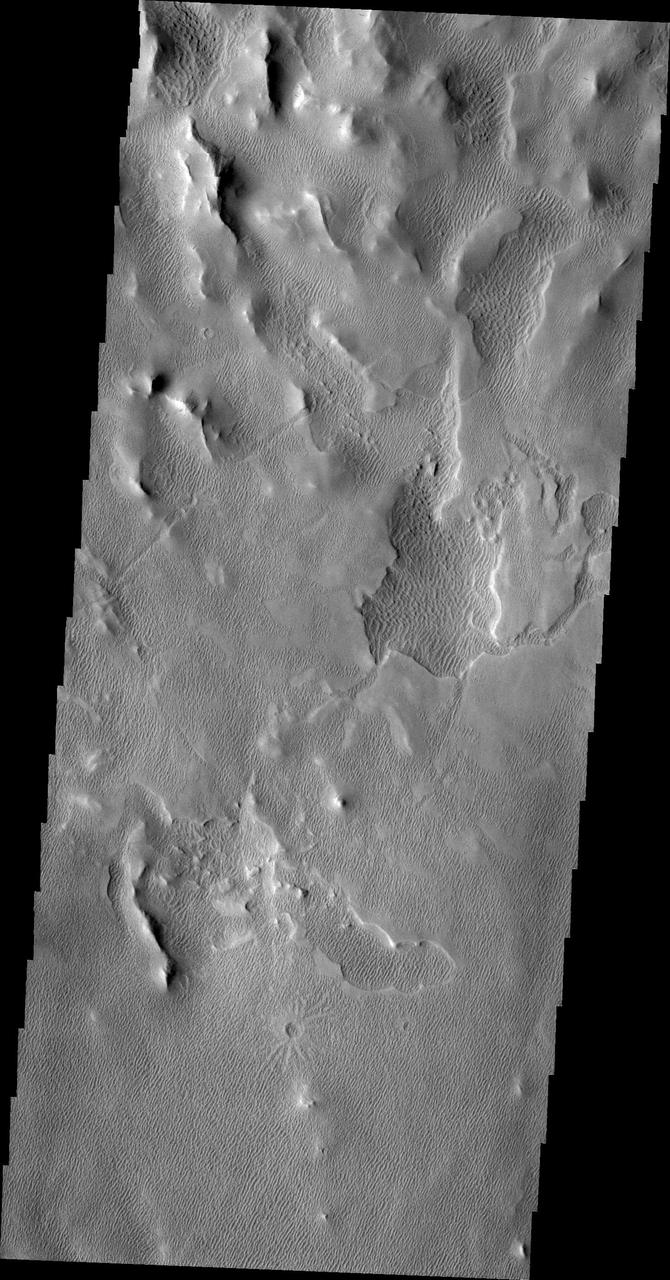
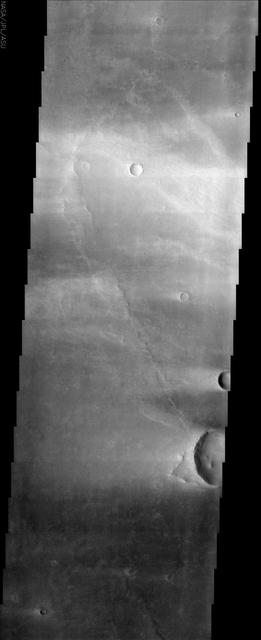
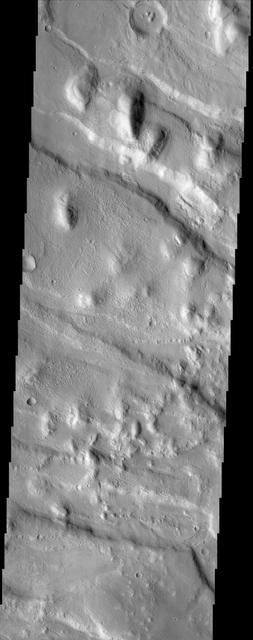
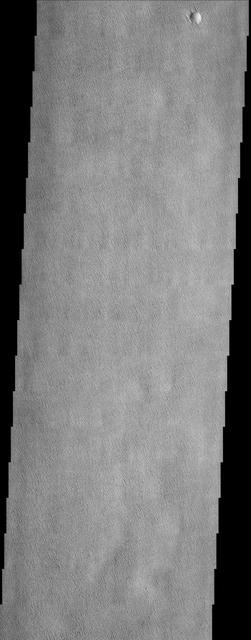
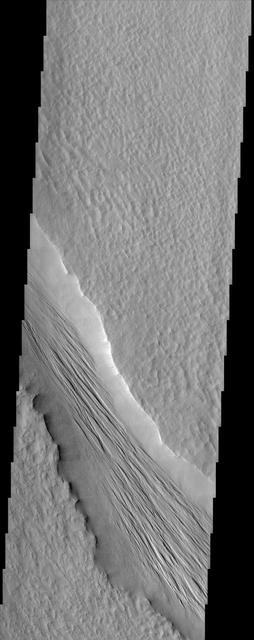
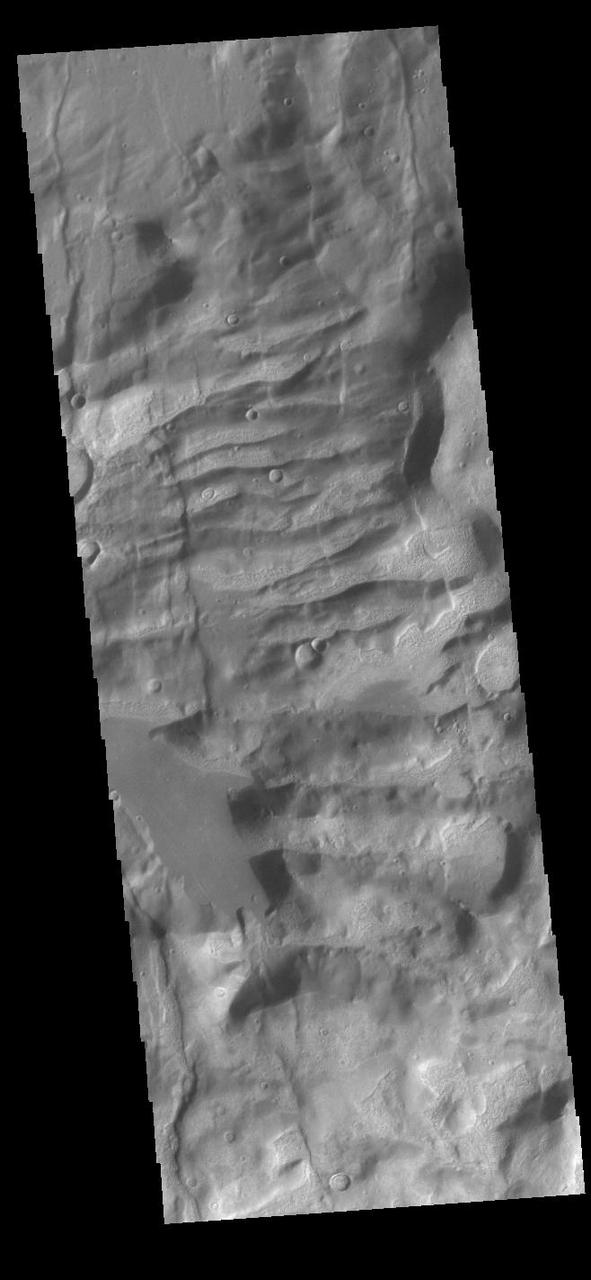
Dust Devil activity in this region between Brashear and Ross Craters is very common. Large regions of dust devil tracks surround the south polar region of Mars
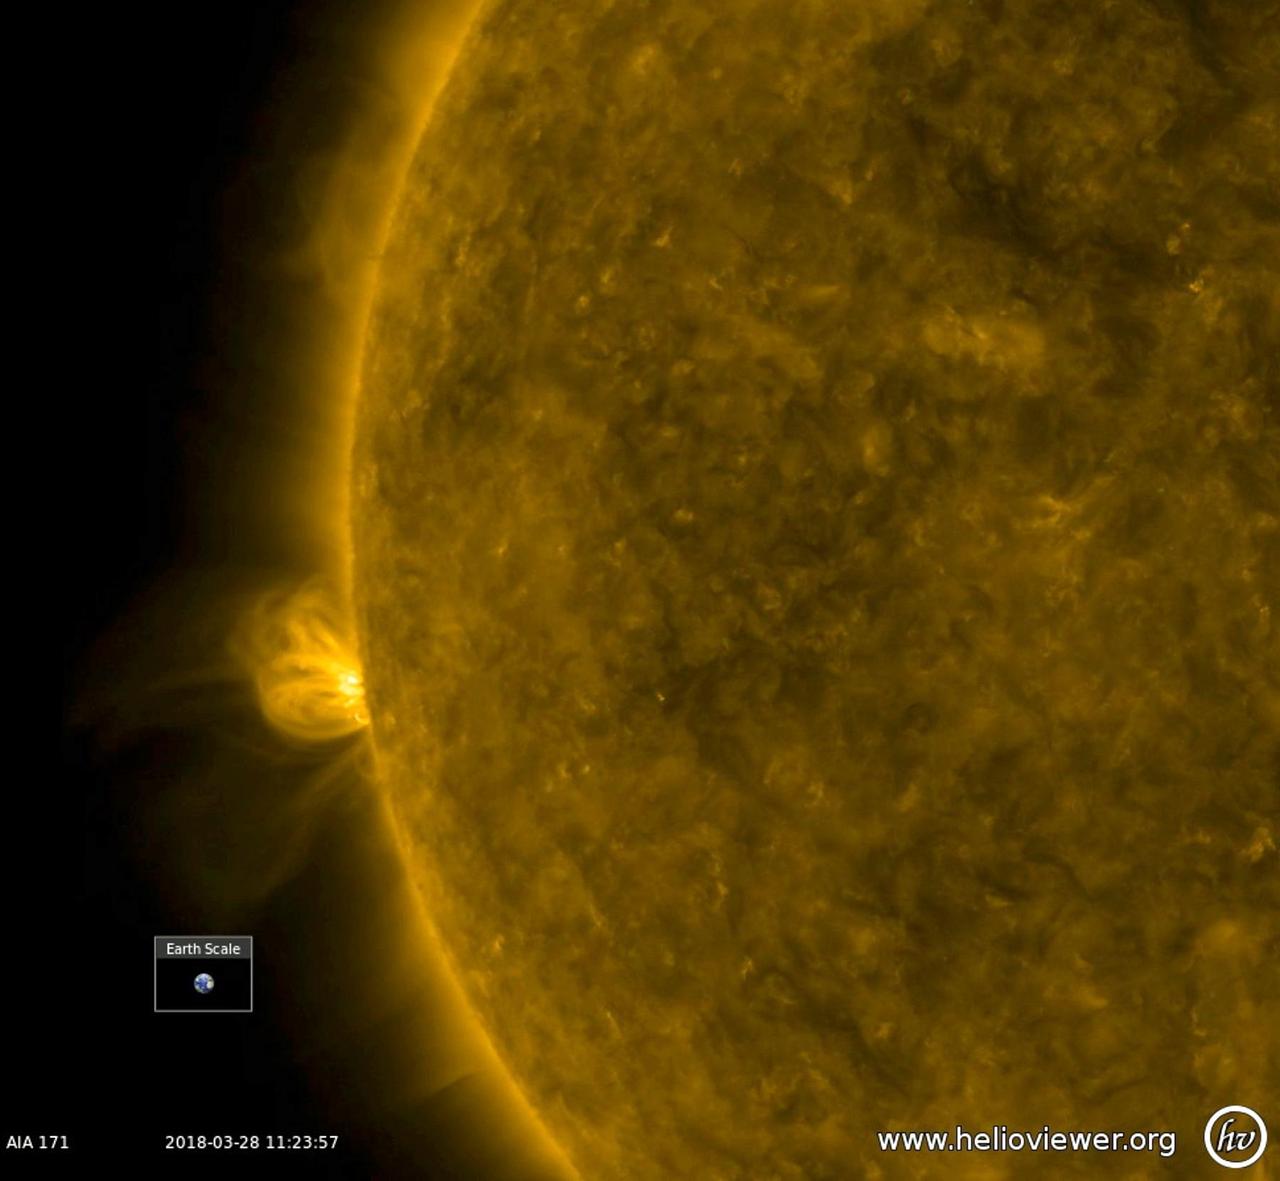
With no active regions currently on the face of the sun, a bristling active region has begun to rotate into view (Mar. 27-28, 2018). In this extreme ultraviolet view, the active region has numerous arches of bright, magnetic field lines blossoming out and towering above it. Whether this region will produce solar storms remains to be seen, but at least there is some new activity to observe. The video was produced with Helioviewer software. Animations are available at https://photojournal.jpl.nasa.gov/catalog/PIA22411
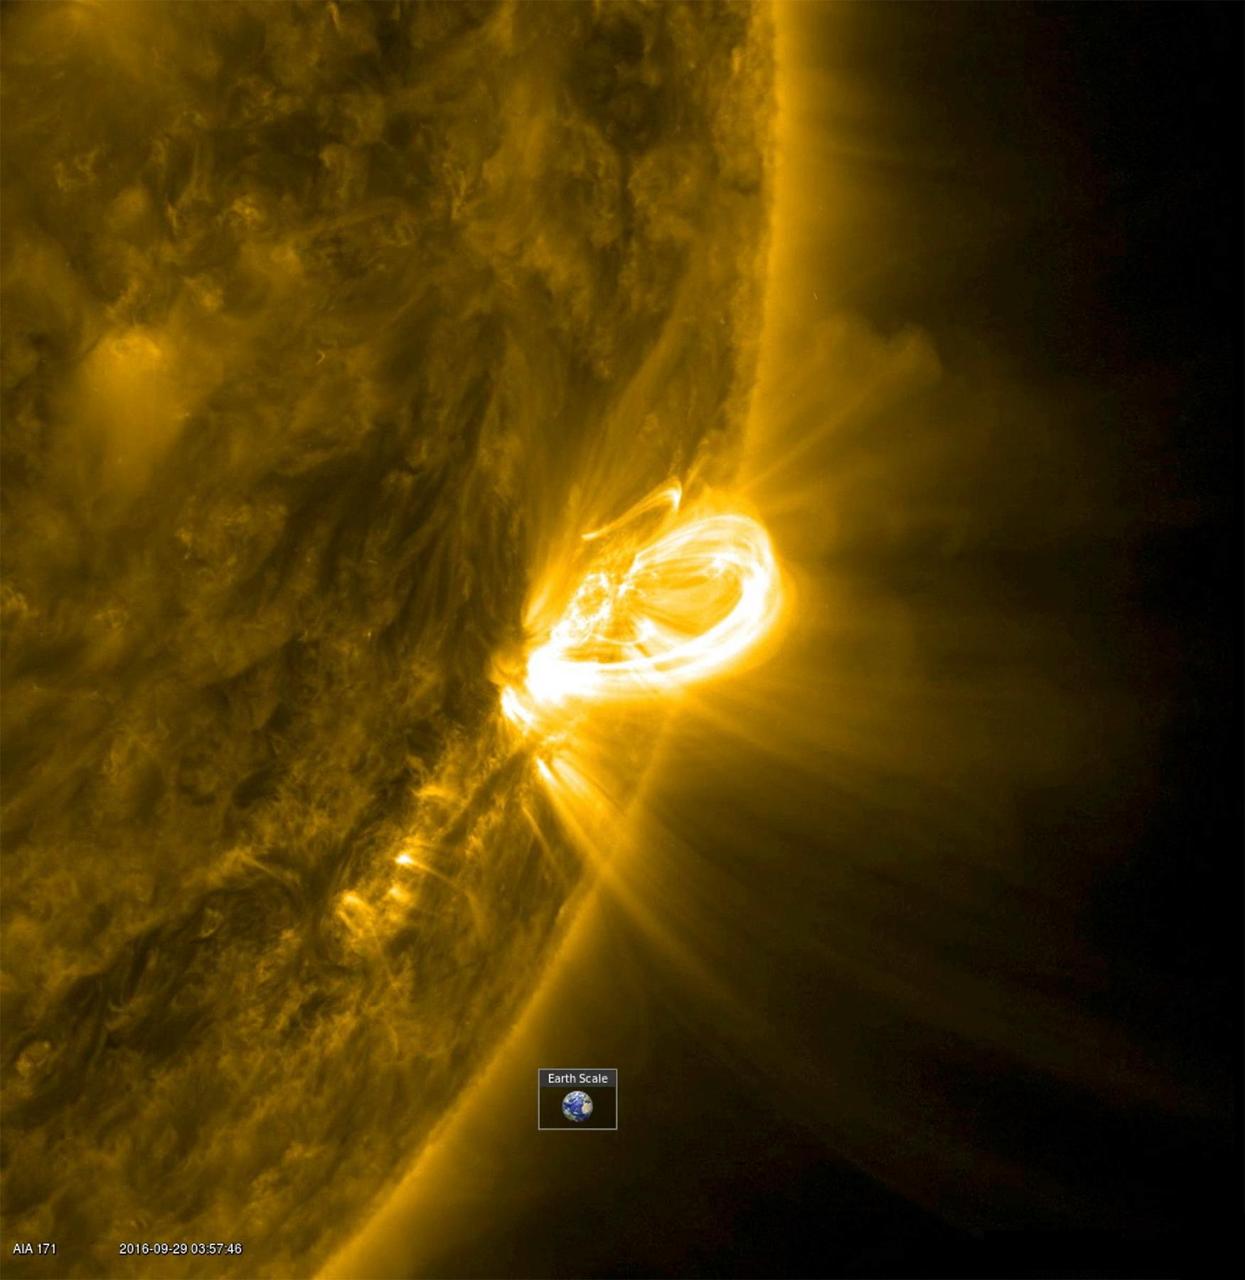
When an active region rotated into a profile view, SDO was able to capture the magnificent loops arching above an active region (Sept. 28-29, 2016). Active region are areas of strong magnetic fields. The magnetic field lines above these regions are illuminated by charged particles spiraling along them. The images were taken in a wavelength of extreme ultraviolet light. The video covers 12 hours of activity. The Earth was inset to give a sense of the scale of these towering arches. Movies are available at http://photojournal.jpl.nasa.gov/catalog/PIA21101
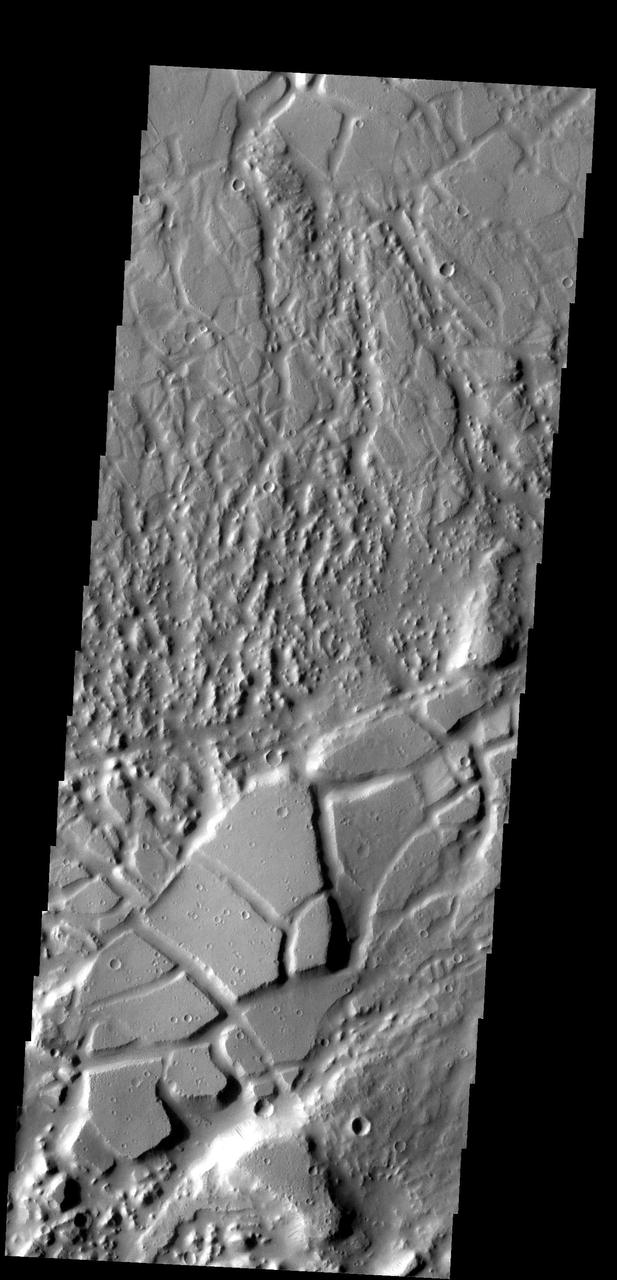
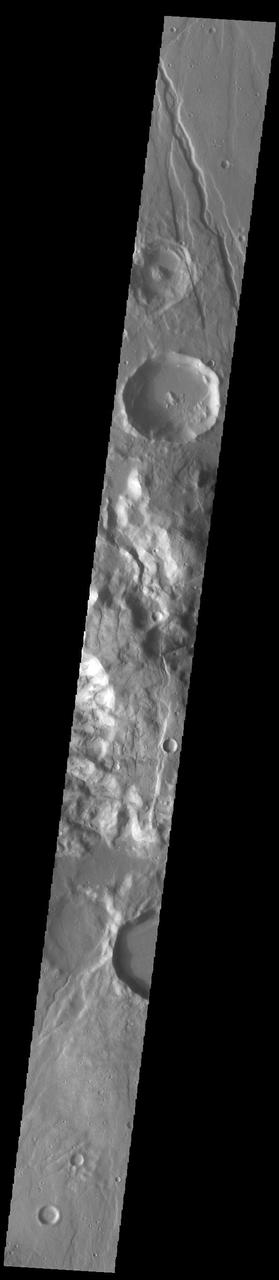
Tectonic activity in this region has not only fractured the surface, but has tilted some of the fracture blocks
Several arcing loops rotated into view and swirled above an active region, which gave us a nice profile view of the action (June 26-27, 2016). The arcing plasma is tracing magnetic field lines extending out from the active region. Some darker matter also jiggled back and forth near the active region as well, pulled about by magnetic forces. At one point a lick of plasma pushed its way out from the region but quickly fell back into the sun. The images were taken in a wavelength of extreme ultraviolet light. Movies are also available at the Photojournal. http://photojournal.jpl.nasa.gov/catalog/PIA20882
When an active region rotated over to the edge of the sun, it presented us with a nice profile view of its elongated loops stretching and swaying above it (Mar. 8-9, 2017). These loops are actually charged particles (made visible in extreme ultraviolet light) swirling along the magnetic field lines of the active region. The video covers about 30 hours of activity. Also of note is a darker twisting mass of plasma to the left of the active region being pulled and spun about by magnetic forces. Video is available at http://photojournal.jpl.nasa.gov/catalog/PIA21562
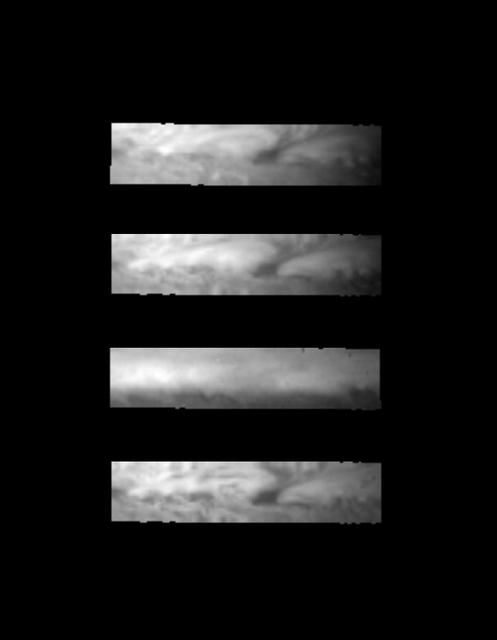
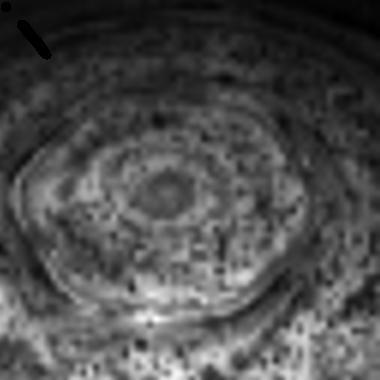
These images, acquired December 17, 1996 by NASA Galileo orbiter, show a small portion of the equatorial region of Jupiter of a dark clearing of clouds in the meteorologically-active troposphere.
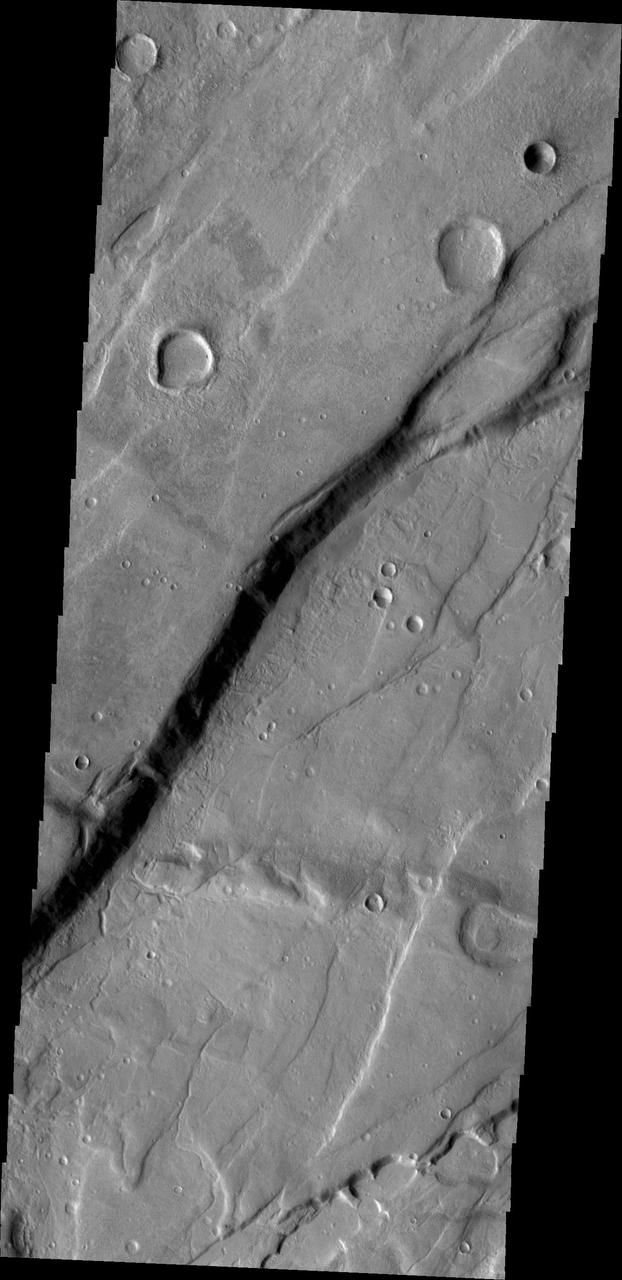
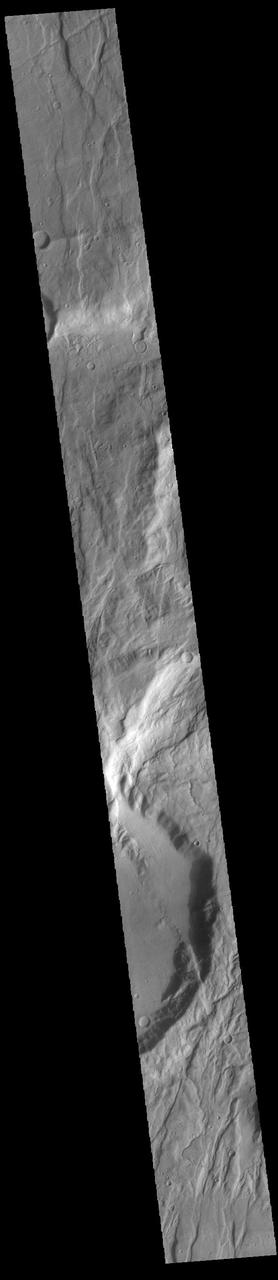
The cliff face in this image from NASA 2001 Mars Odyssey spacecraft was created by tectonic activity and is located in a region of Tempe Terra that is complexly fractured.
As an active region rotated into view, NASA Solar Dynamics Observatory was able to observe well-defined magnetic loops gyrating above the sun between Mar, 23-24, 2017. These loops appear because charged particles spinning along the magnetic field lines above this active region are made visible in this wavelength of extreme ultraviolet light. The video clip covers about a day and a half of activity. Movies are available at https://photojournal.jpl.nasa.gov/catalog/PIA21583

This image from NASA Spitzer Space Telescope shows young stars plus diffuse emission from dust. The Corona Australis region containing, at its heart, the Coronet cluster is one of the nearest and most active regions of ongoing star formation.
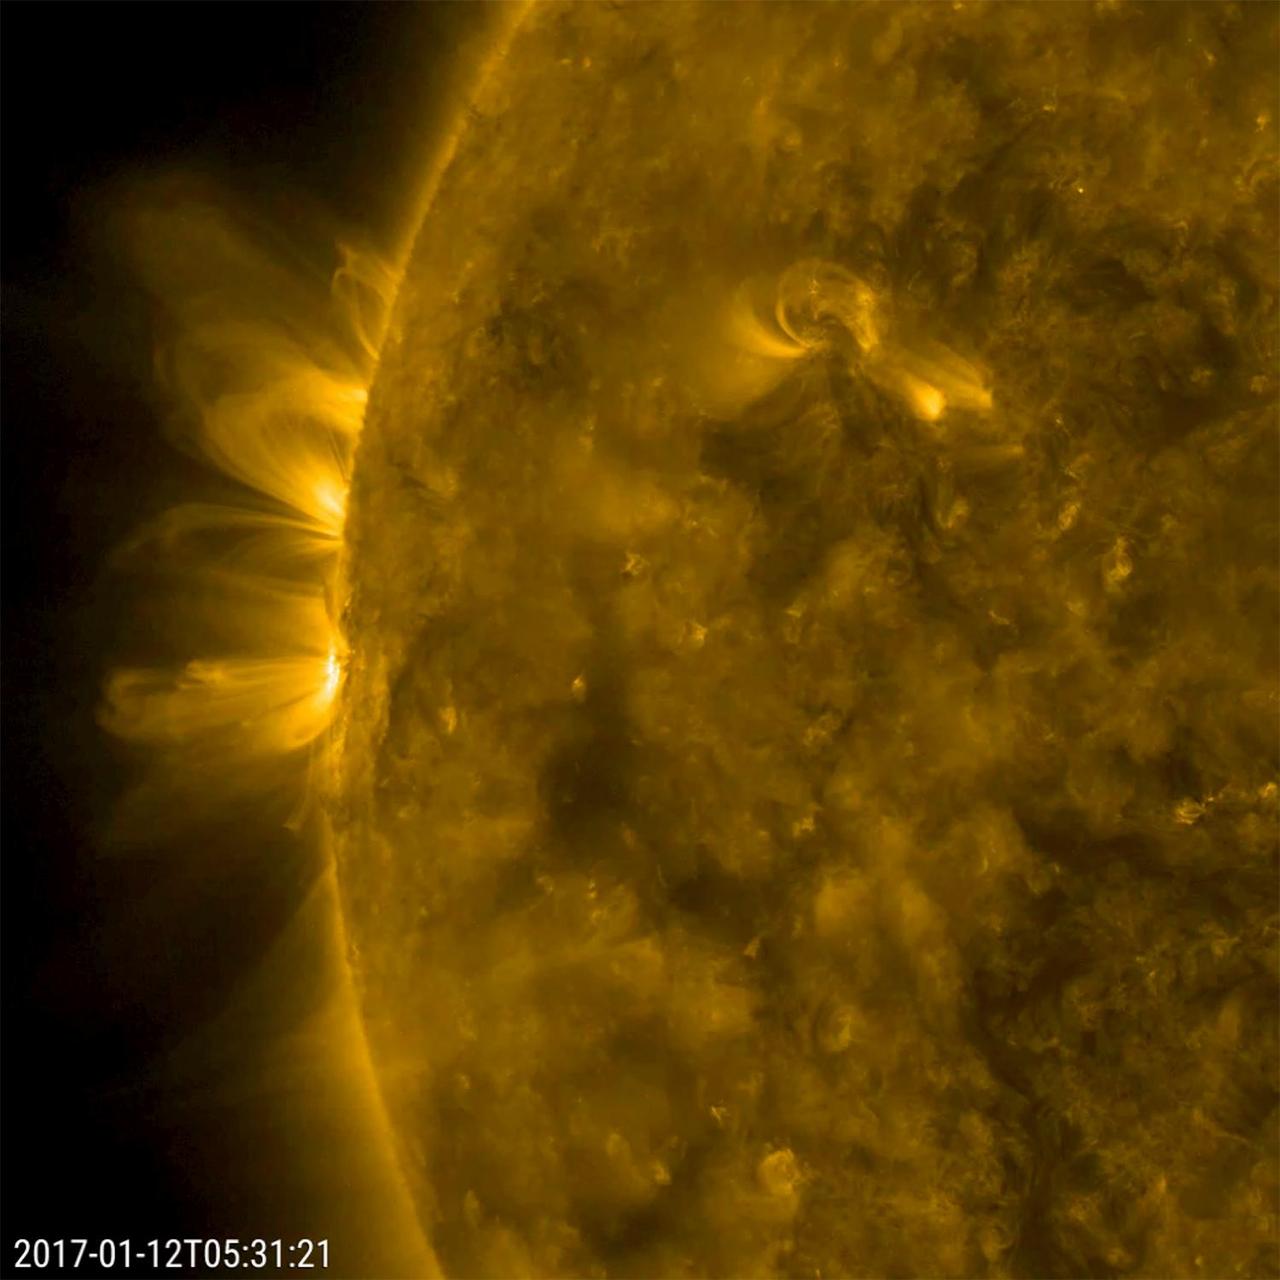
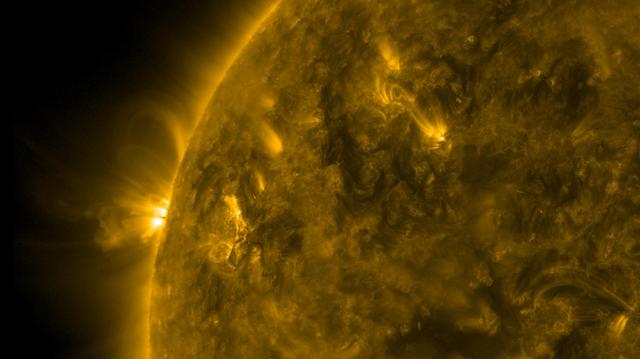
Magnetic arcs of plasma that spiraled above two active regions held their shape fairly well over 18 hours (Jan. 11-12, 2017). The charged plasma is being controlled the magnetic field lines of the active regions. The field lines become clearly visible when viewed in this wavelength of extreme ultraviolet light. Often the arches bend and twist more dynamically than the relatively stable ones seen here. Movies are available at http://photojournal.jpl.nasa.gov/catalog/PIA12327
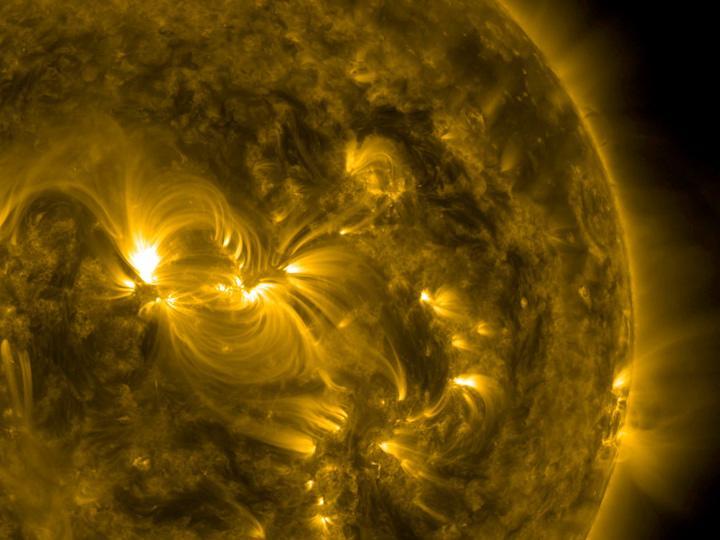
One broad active region sported a wonderful example of coiled magnetic field lines over almost a four-day period (July 15-18, 2016). The magnetic lines are easily visible in this 171 Angstrom wavelength of extreme ultraviolet light be cause charged particles are spiraling along the lines. The active region is a hotbed of struggling magnetic forces that were pushing out above the sun's surface. http://photojournal.jpl.nasa.gov/catalog/PIA17911
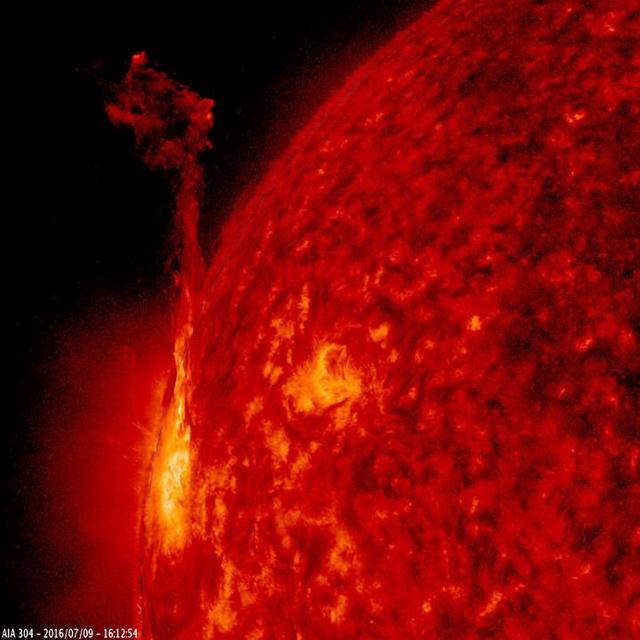
One active region at the edge of the Sun pushed out about ten thrusts of plasma in just over a day long period (July 9-10, 2016). All of them, propelled by magnetic forces, quickly withdrew back into the active region. The images were taken in a wavelength of extreme ultraviolet light. Movies are also available at the Photojournal. http://photojournal.jpl.nasa.gov/catalog/PIA20883
This image from NASA Mars Odyssey is located west of Zephyria Planum. Surfaces in this region have undergone extensive erosion by the wind. Wind is one of the most active processes of erosion on the surface of Mars today.
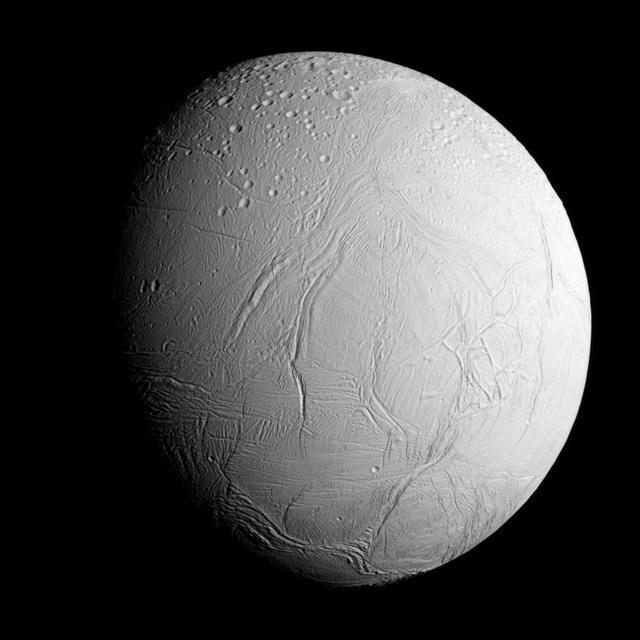
From a distant perspective, NASA Cassini spacecraft sees hints of the unusual surface of Saturn moon Enceladus, a moon where new terrain is created around a geologically active south polar region.
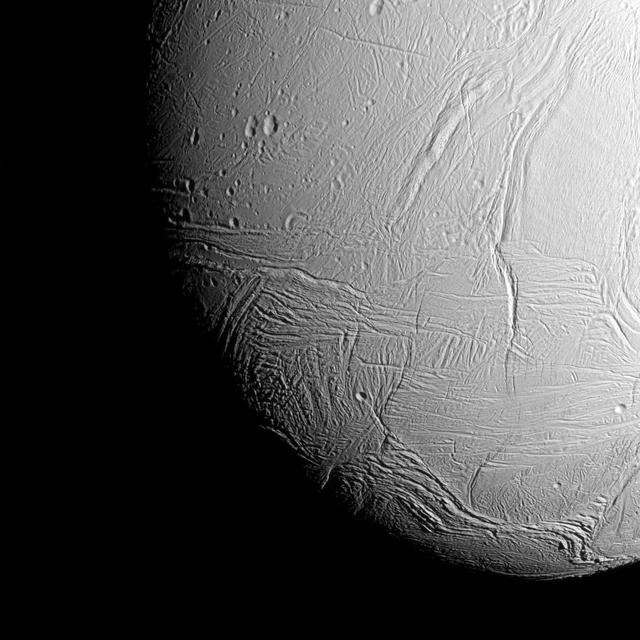
The south polar region of Saturn active, icy moon Enceladus awaits NASA Cassini spacecraft in this view, acquired on approach to the mission deepest-ever dive through the moon plume of icy spray.
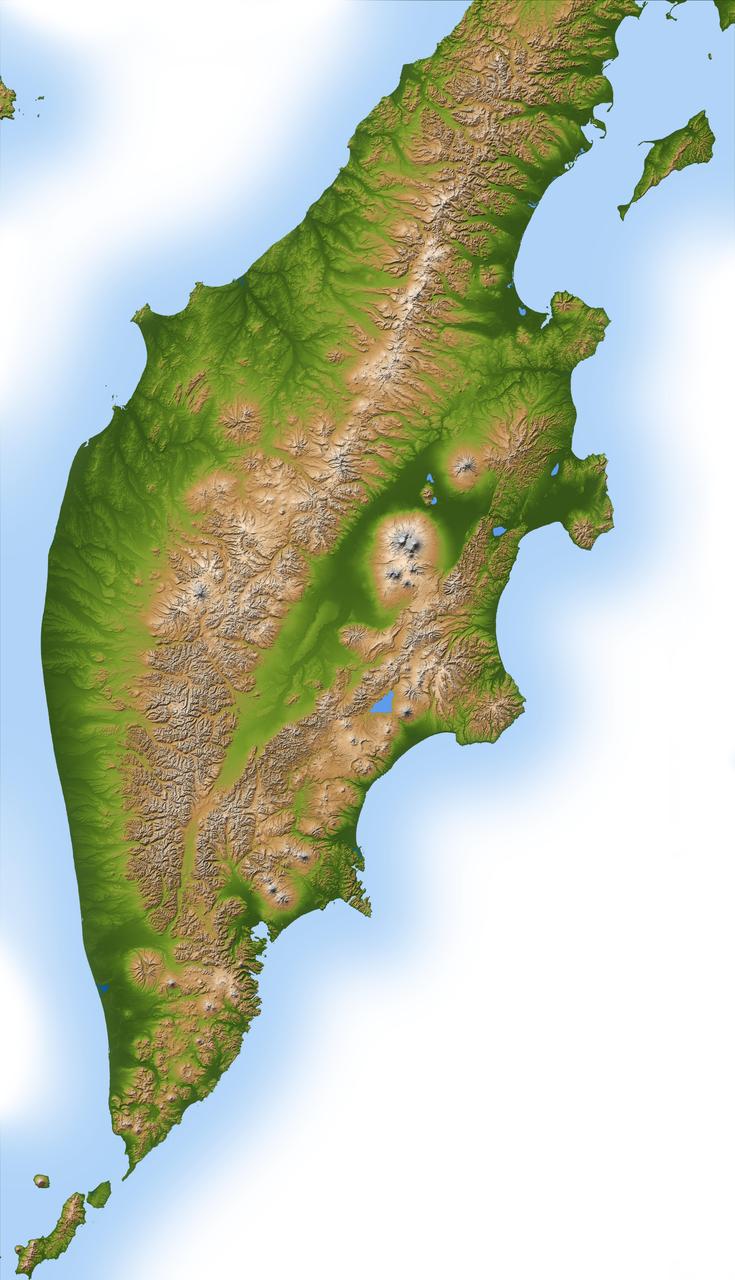
Russia Kamchatka Peninsula, lying between the Sea of Okhotsk to the west and the Bering Sea and Pacific Ocean to the east, is one of the most active volcanic regions along the Pacific Ring of Fire.
This montage features activity in the turbulent region of Jupiter Great Red Spot GRS. Four sets of images of the GRS were taken by NASA Galileo imaging system over an 11.5 hour period on 26 June, 1996.
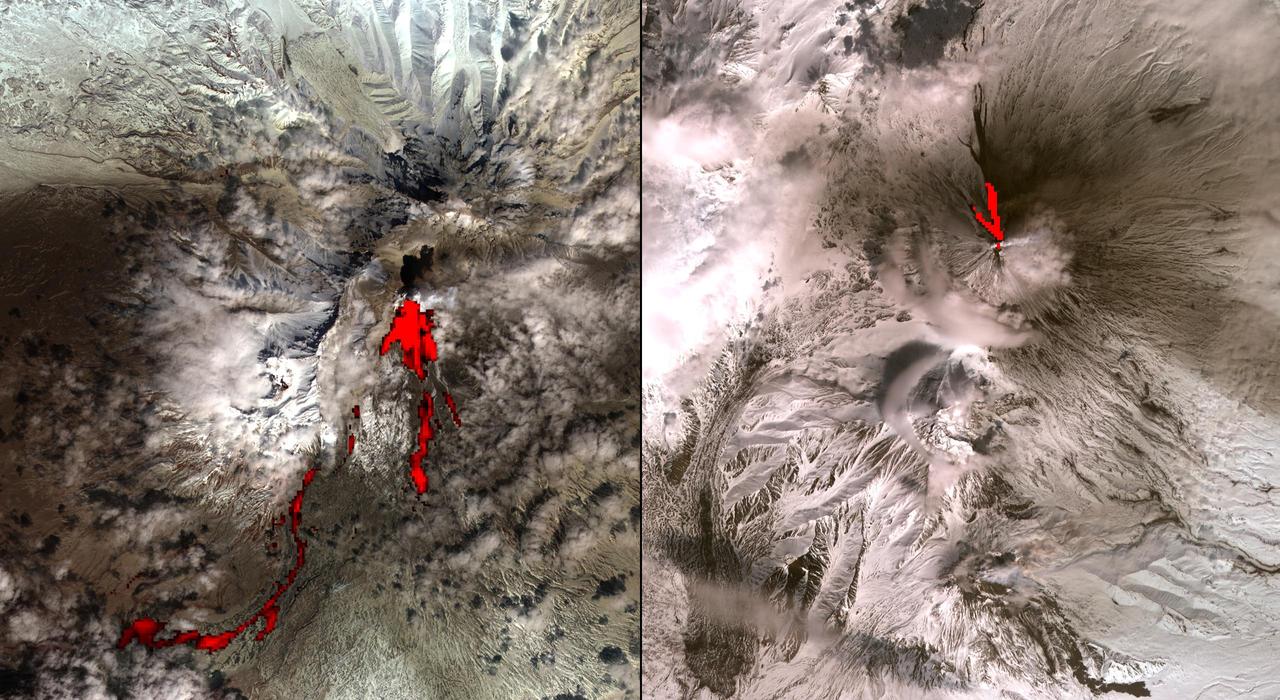
One of the most volcanically active regions of the world is the Kamchatka Peninsula in eastern Siberia, Russia. It is not uncommon for several volcanoes to be erupting at the same time. NASA Terra satellite acquired this image on April 26, 2007
This nighttime movie of the depths of the north pole of Saturn reveals a dynamic, active planet lurking underneath the ubiquitous cover of upper-level hazes. The defining feature of Saturn north polar regions
This image of an area south of Olympus Mons shows a region where the wind has been an active agent in modifying the surface. Small linear dunes cover the surface in this image taken by NASA 2001 Mars Odyssey spacecraft.
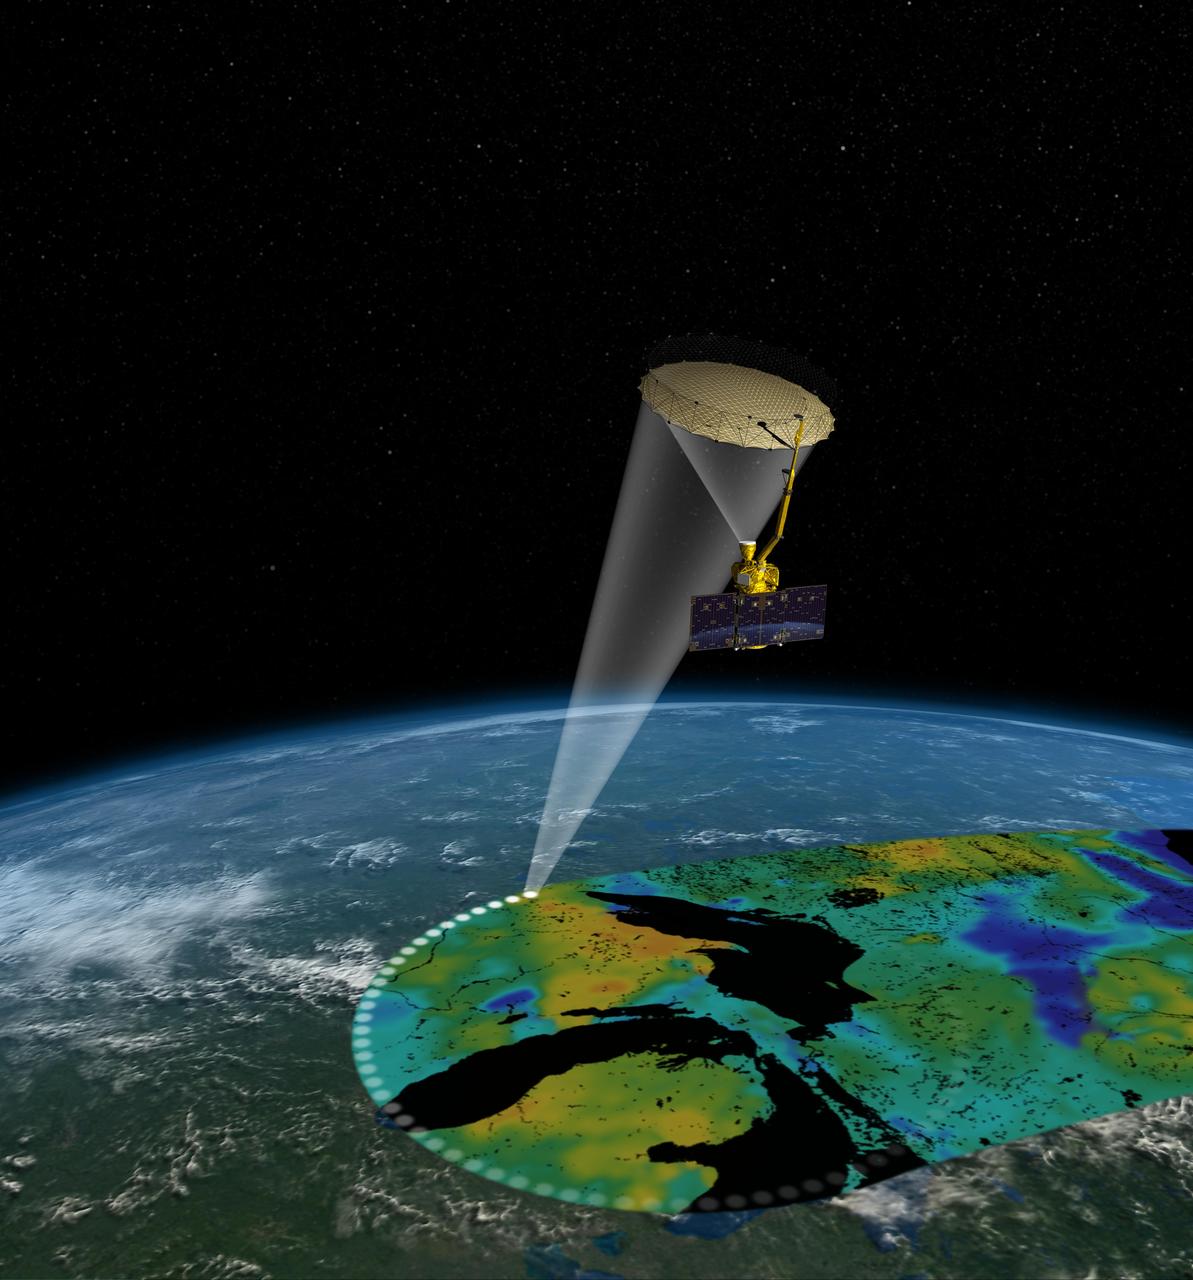
Artist rendering of the Soil Moisture Active Passive SMAP satellite. The width of the region scanned on Earth surface during each orbit is about 620 miles 1,000 kilometers.
This image captured by NASA 2001 Mars Odyssey spacecraft shows part of Cavi Angusti, a region of depressions near the south polar cap. The linear ridges in the image were likely formed by tectonic activity.

An enhanced close-up view shows at least two distinct jets spraying a mist of fine particles from the south polar region of Enceladus. This image shows the night side of Saturn and the active moon against dark sky
One of the most active agent of erosion on Mars today is the wind. This region, near Nicholson crater, has been sculpted by untold years of blowing grit and wind, as shown in this image captured by NASA Mars Odyssey.
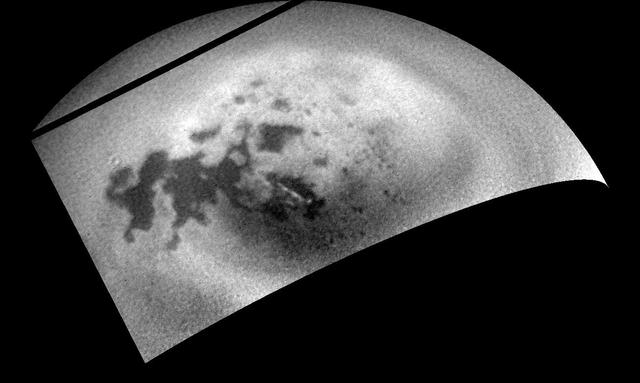
As NASA Cassini spacecraft sped away from Titan following a relatively close flyby, its cameras monitored the moon northern polar region, capturing signs of renewed cloud activity.
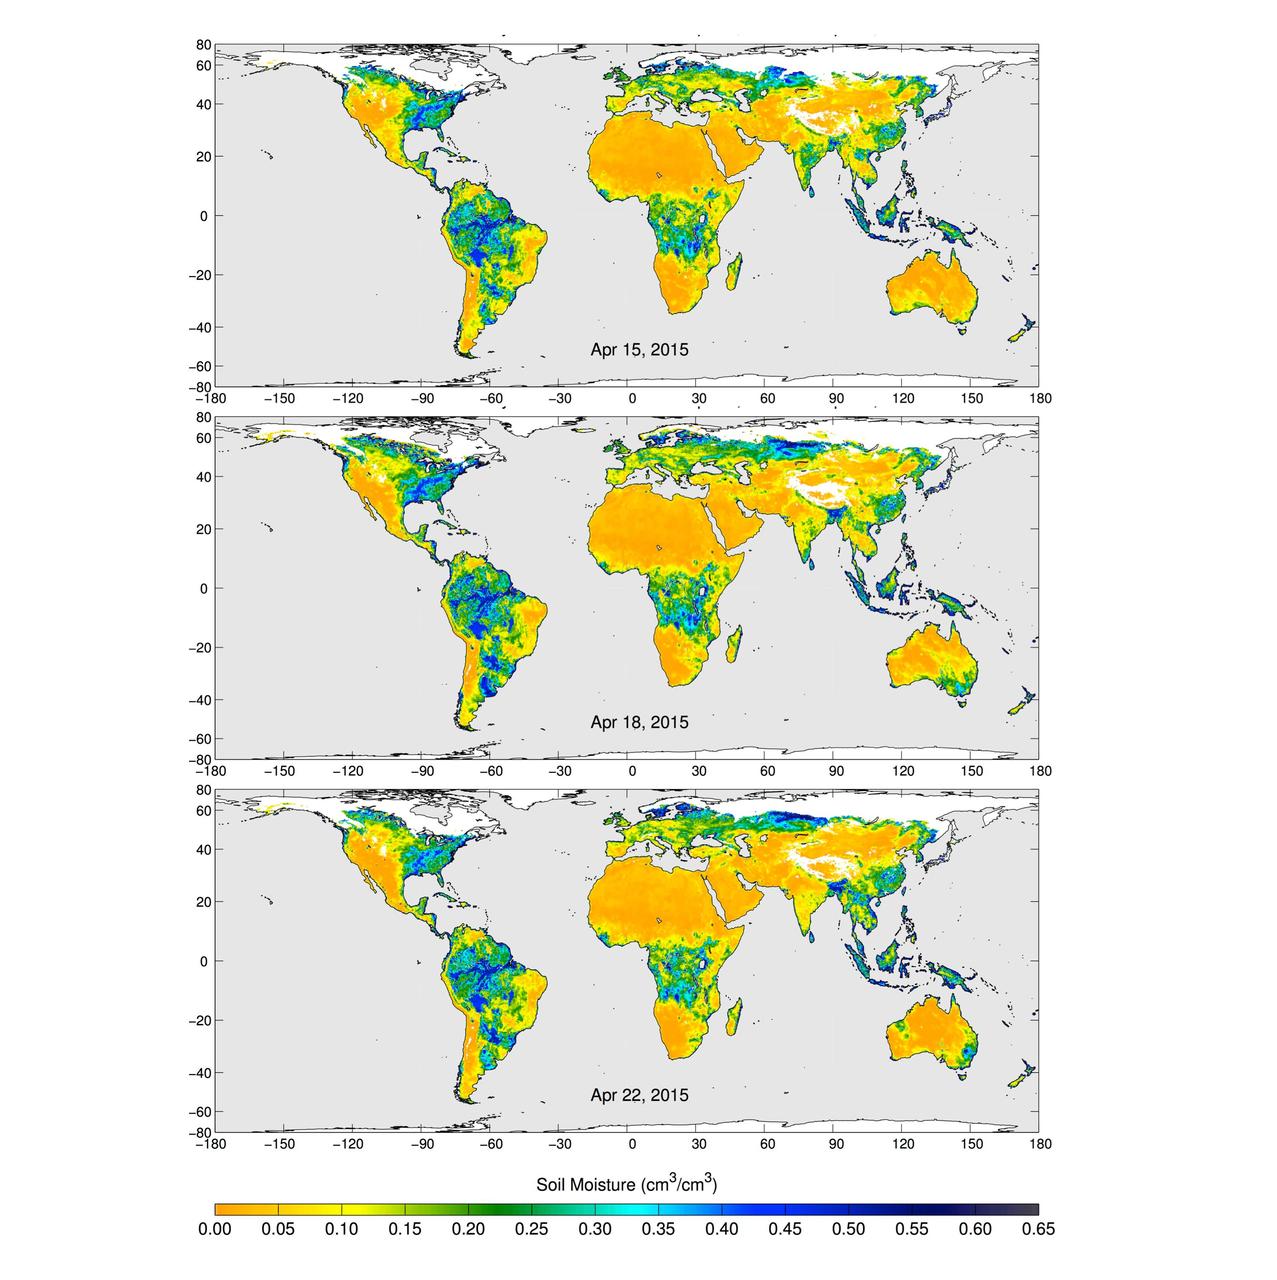
These maps of global soil moisture were created using data from the radiometer instrument on NASA Soil Moisture Active Passive SMAP observatory. Evident are regions of increased soil moisture and flooding during April, 2015.
This image from NASA Mars Odyssey spacecraft is from the region of Syrtis Major, which is dominated by a low-relief shield volcano and believed to be an area of vigorous aeolian activity with strong winds in the east-west direction.

This artist concept illustrates the frenzied activity at the core of our Milky Way galaxy. The galactic center hosts a supermassive black hole in the region known as Sagittarius A*, or Sgr A*, with a mass of about four million times that of our sun.
The magnetic field lines of three active regions in close proximity to one another interacted with each other over two and a half days Feb. 8-10, 2016. This image is from NASA Solar Dynamics Observatory.
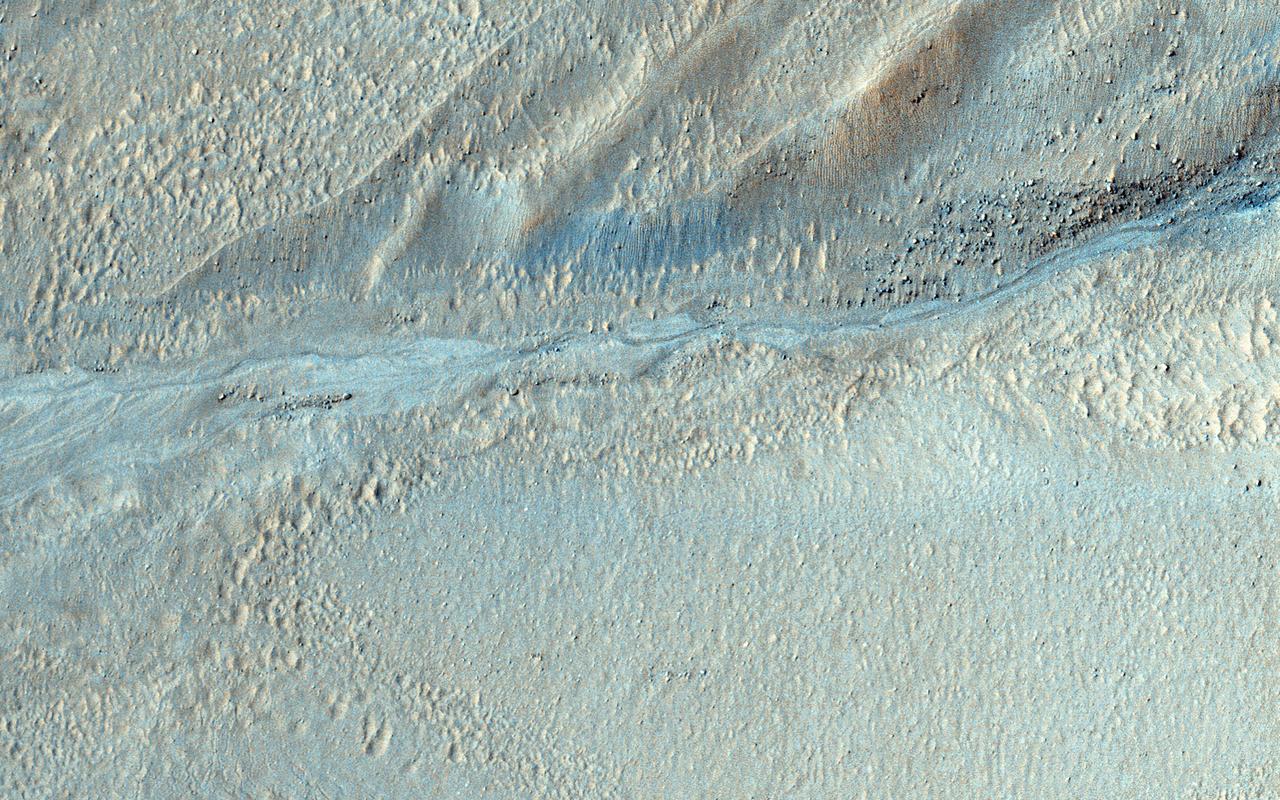
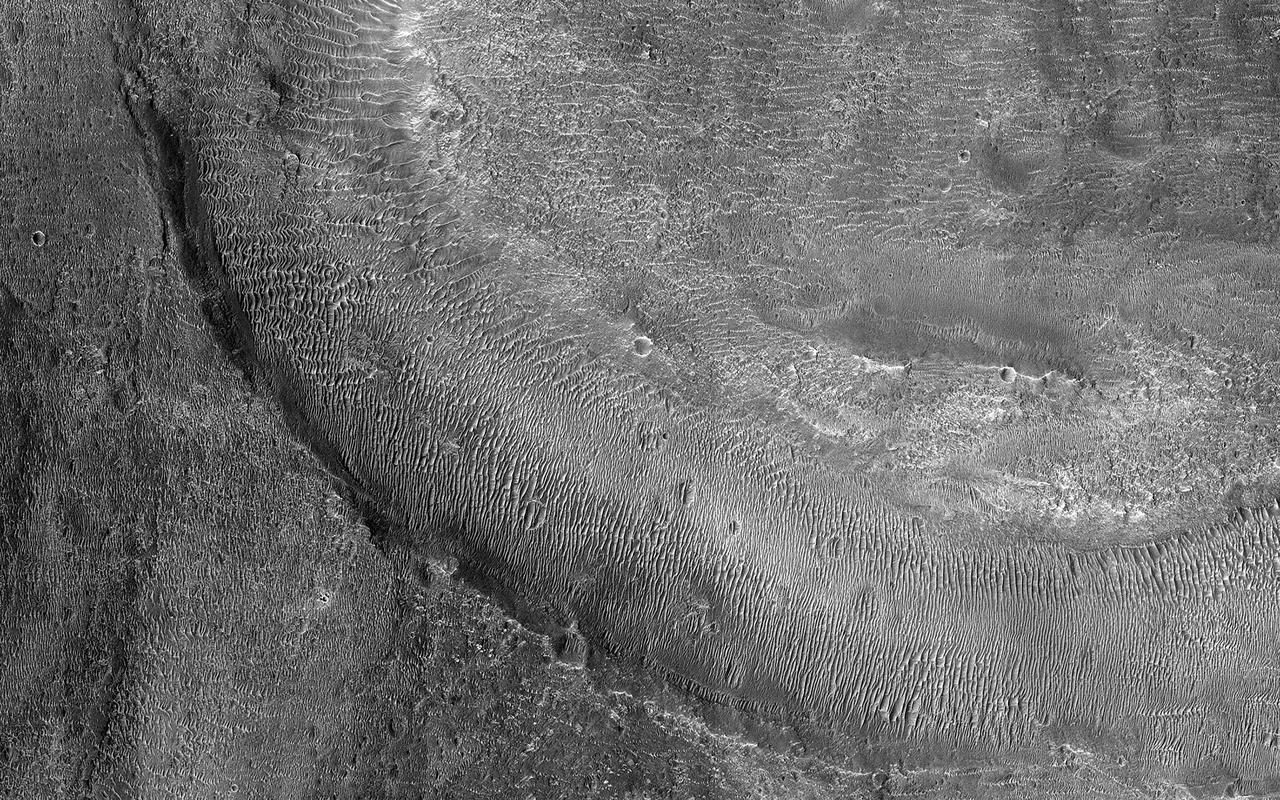
This image from NASA Mars Reconnaissance Orbiter shows several seemingly active gullies and their associated fans near the Argyre region. As gullies form on slopes, sediment can become deposited to form lobe-shaped fans. Gullies can form with flowing water, but don't have to: sometimes they can be formed by the dry flow of sand and dust grains. This HiRISE image shows several seemingly active gullies and their associated fans. These particular gullies have many fine channels that are resolved nicely with a high resolution image. http://photojournal.jpl.nasa.gov/catalog/PIA19286
A series of active regions stretched along the right side of the sun exhibited a wide variety of loops cascading above them (Sept. 12-14, 2016). The active region near the center has tightly coiled loops, while the region rotating over the right edge has some elongated and some very stretched loops above it. The loops are actually charged particles spiraling along magnetic field lines, observed here in a wavelength of extreme ultraviolet light. Near the middle of the video the Earth quickly passes in front of a portion of the sun as viewed by SDO. http://photojournal.jpl.nasa.gov/catalog/PIA16997
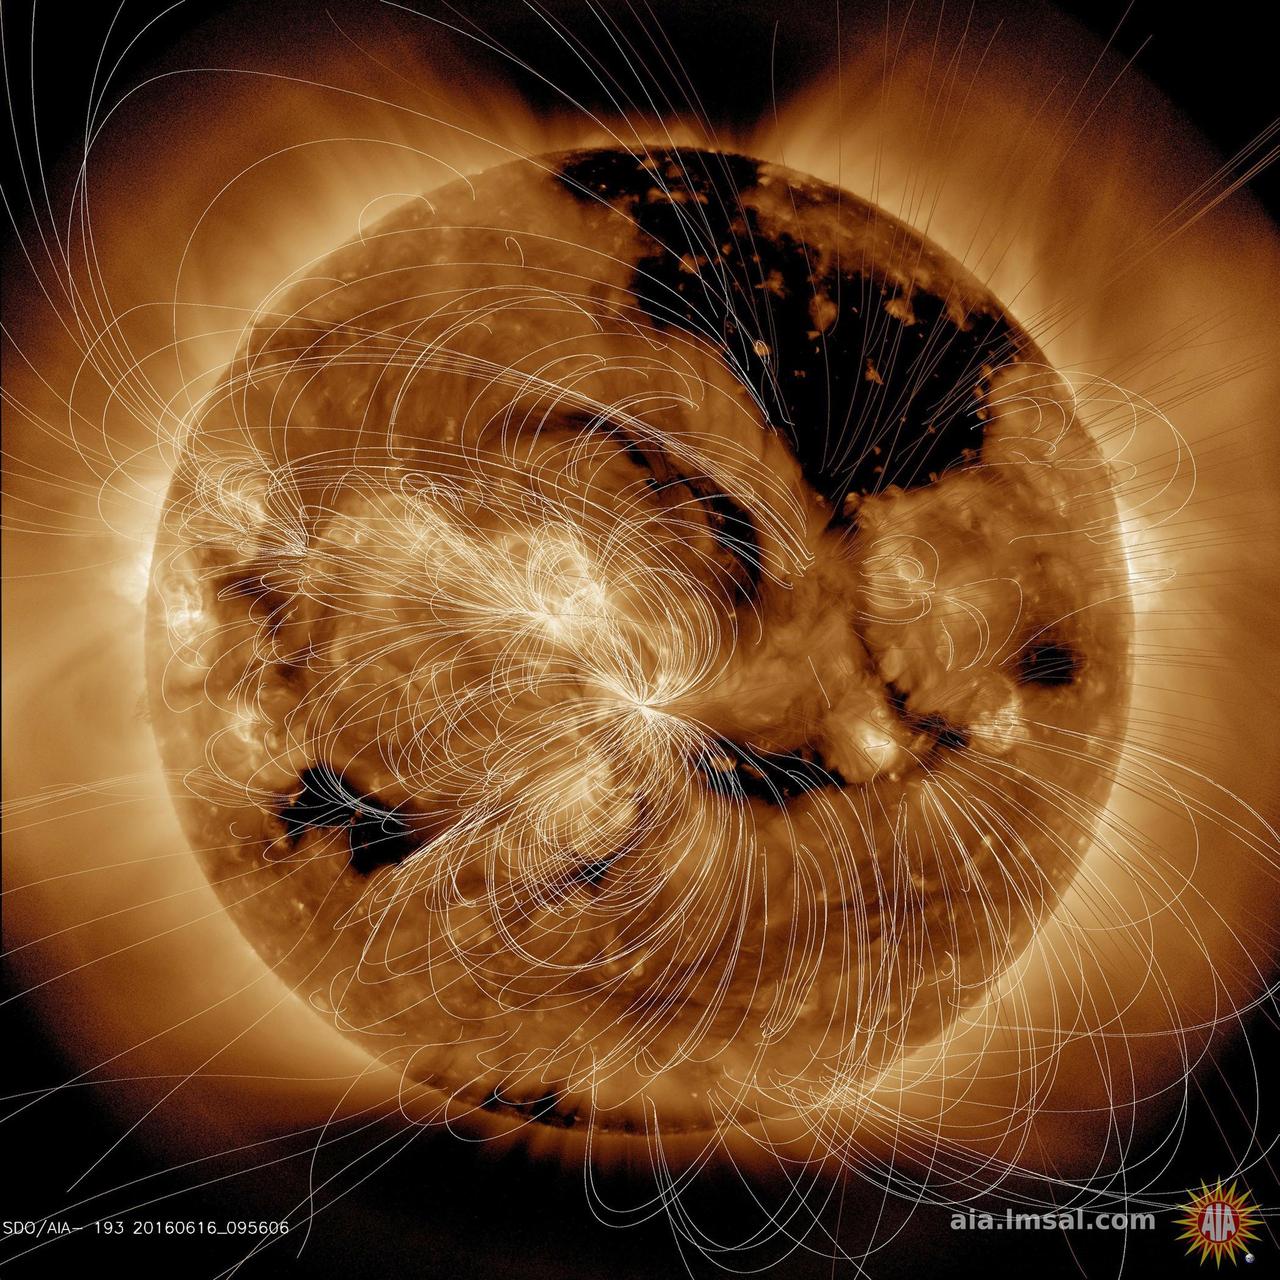
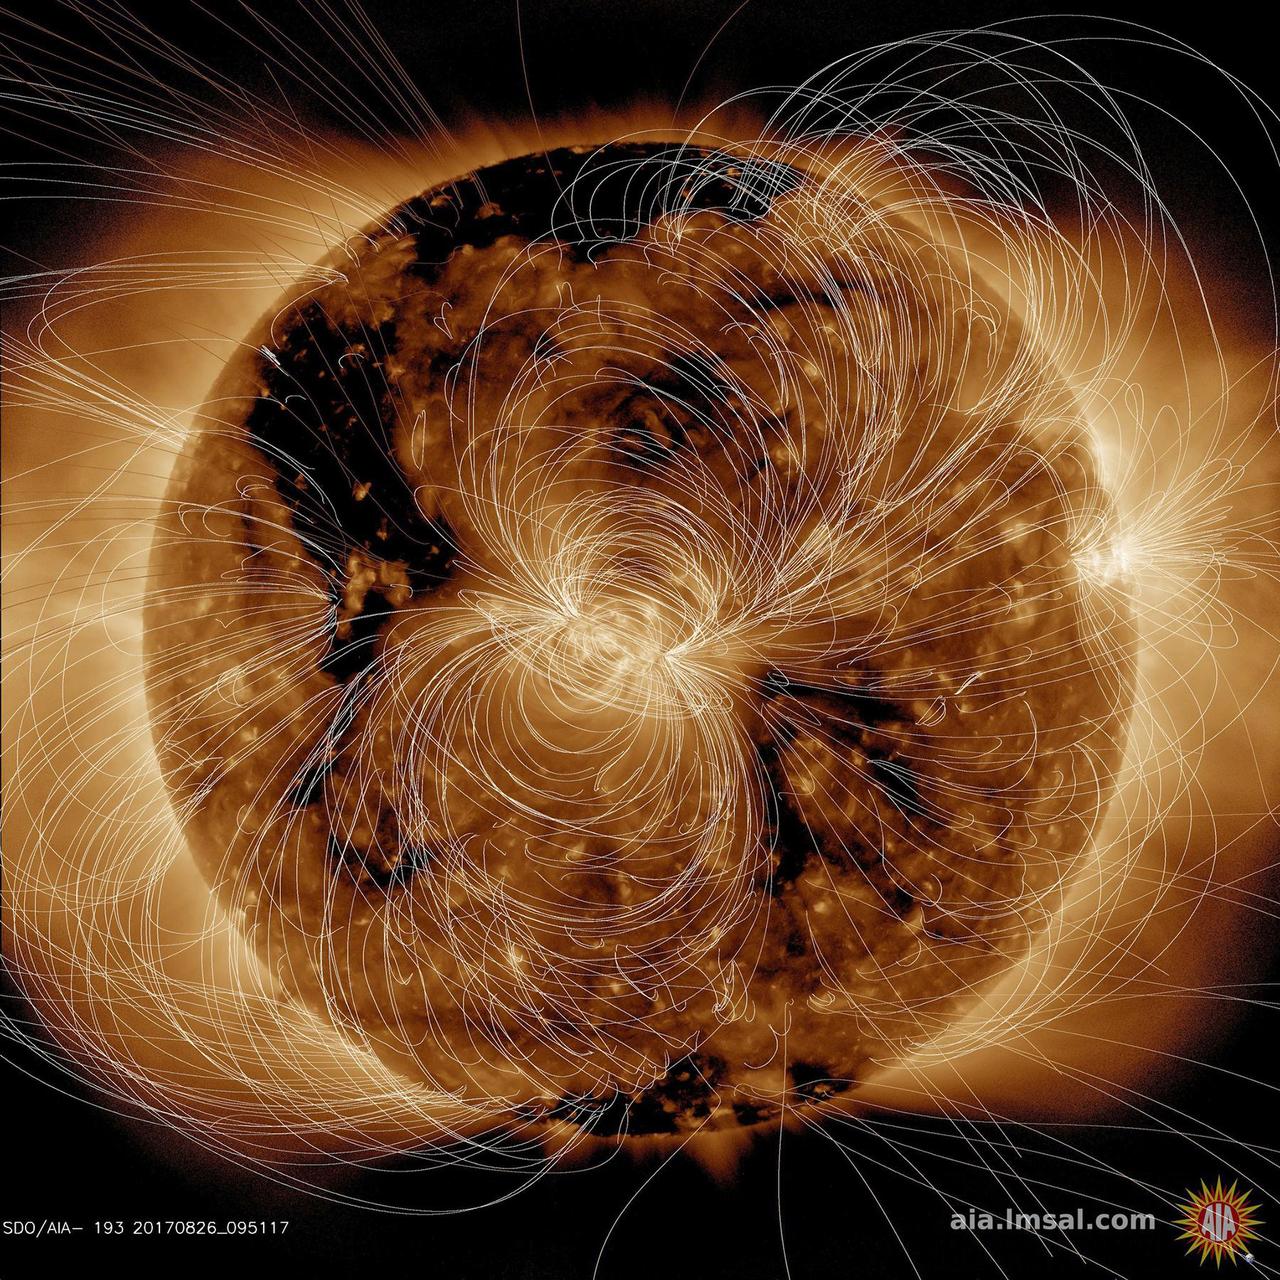
Each day NASA solar scientists produce overlays (in white lines) that show their estimation of how the magnetic field lines above the sun are configured (June16, 2016). In the video clip we show the sun in a wavelength of extreme ultraviolet light, then reveal the magnetic field line configuration in the same wavelength. Notice how the lines are tightly bundled near the lighter-toned active regions, which are magnetically intense regions. The magnetic lines from the darker areas, called coronal holes, open out into space and the extended lines show that. Our magnetically active sun is a dynamic body that changes all the time. Movie are also available at the Photojournal. http://photojournal.jpl.nasa.gov/catalog/PIA20881
This profile perspective of an active region revealed above it (June 24-25, 2018). Charged particles spinning along these field lines are illuminated in this wavelength of extreme ultraviolet light. The little Earth superimposed on the image and videos gives one a sense of just how humongous these loops really are. Our eyes cannot see extreme ultraviolet light, but our instruments can. The images are colorized to distinguish between these from images taken in other wavelengths by SDO. Note there is another, smaller active region on the left side of the image. Movies are available at https://photojournal.jpl.nasa.gov/catalog/PIA22589
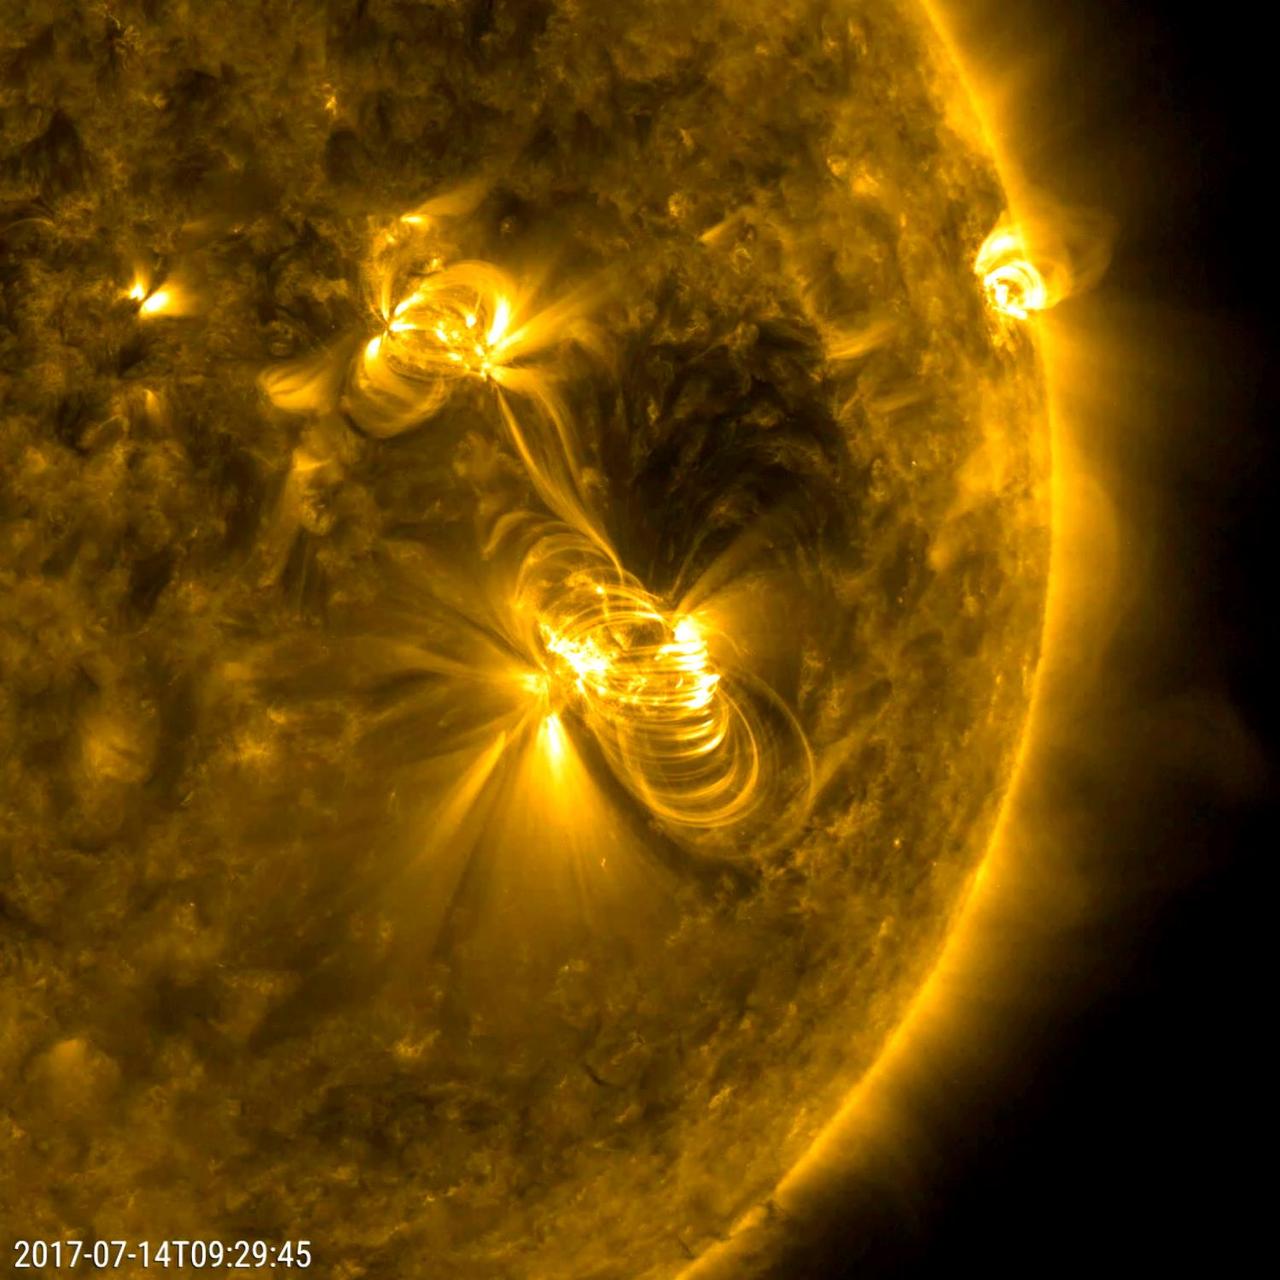
A flare medium-sized (M2) flare and a coronal mass ejection erupted from the same, large active region (July 14, 2017). The flare lasted almost two hours, quite a long duration. Coronagraphs on the SOHO spacecraft show a substantial cloud of charged particles blasting into space just after the blast. The coils arcing over this active region are particles spiraling along magnetic field lines, which were reorganizing themselves after the magnetic field was disrupted by the blast. Images were taken in a wavelength of extreme ultraviolet light. Movies are available at https://photojournal.jpl.nasa.gov/catalog/PIA21836
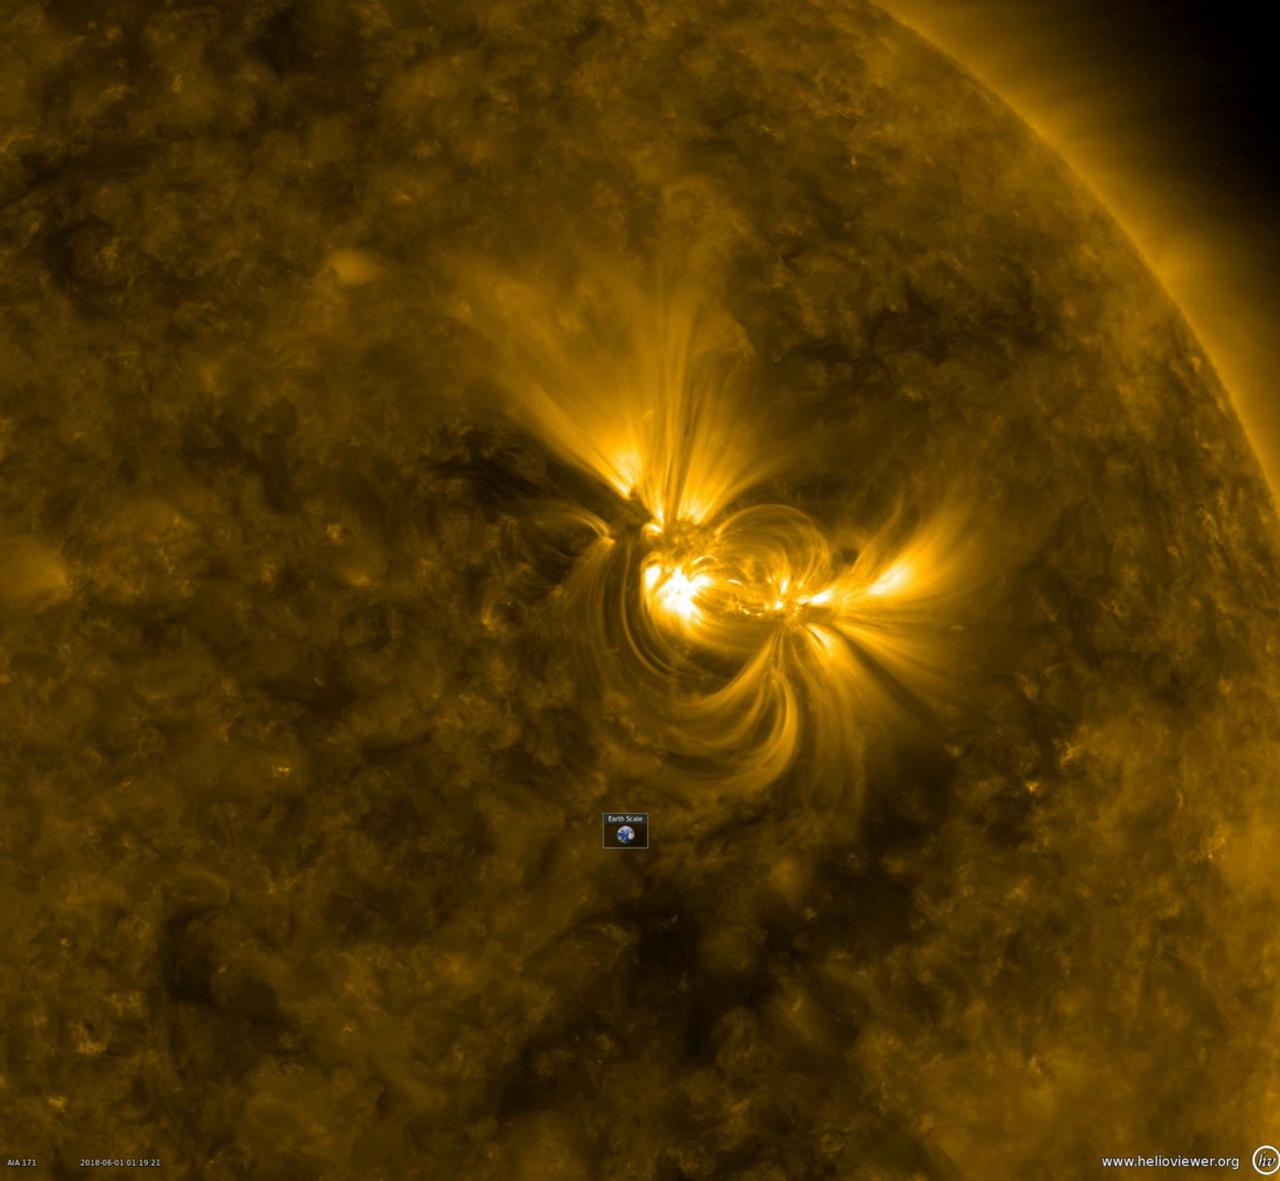
This close-up from a video clip taken May 30-June 1, 2018 shows a large active region in extreme ultraviolet light as the bright magnetic field lines above it shift and twist. Note the Earth scale below the active region: the longest loops extend about 10 times the diameter of Earth. When the magnetic field lines get themselves tangled up enough, they can erupt with a solar storm. Videos are available at https://photojournal.jpl.nasa.gov/catalog/PIA22475
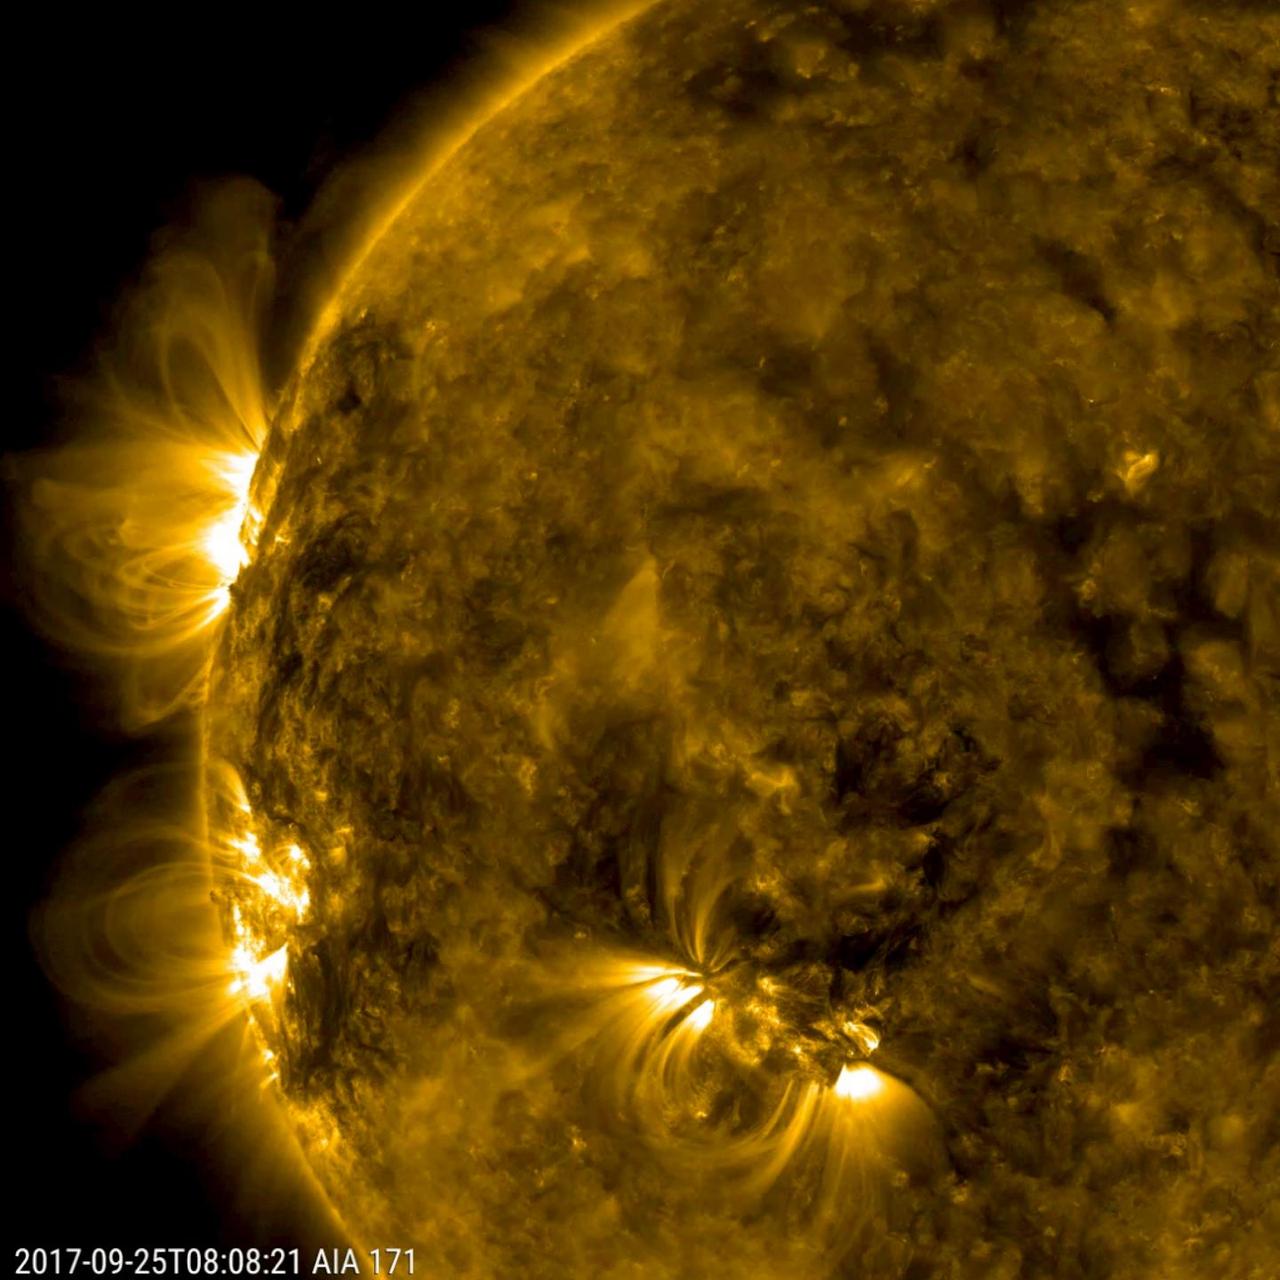
Three distinct active regions with towering arches above them rotated into view over a three-day period (Sept. 24-26, 2017). In extreme ultraviolet light, charged particles that are spinning along the ever-changing magnetic field lines above the active regions make the lines visible. To give some sense of scale, the largest arches rose up many times the size of Earth. Movies are available at https://photojournal.jpl.nasa.gov/catalog/PIA22038
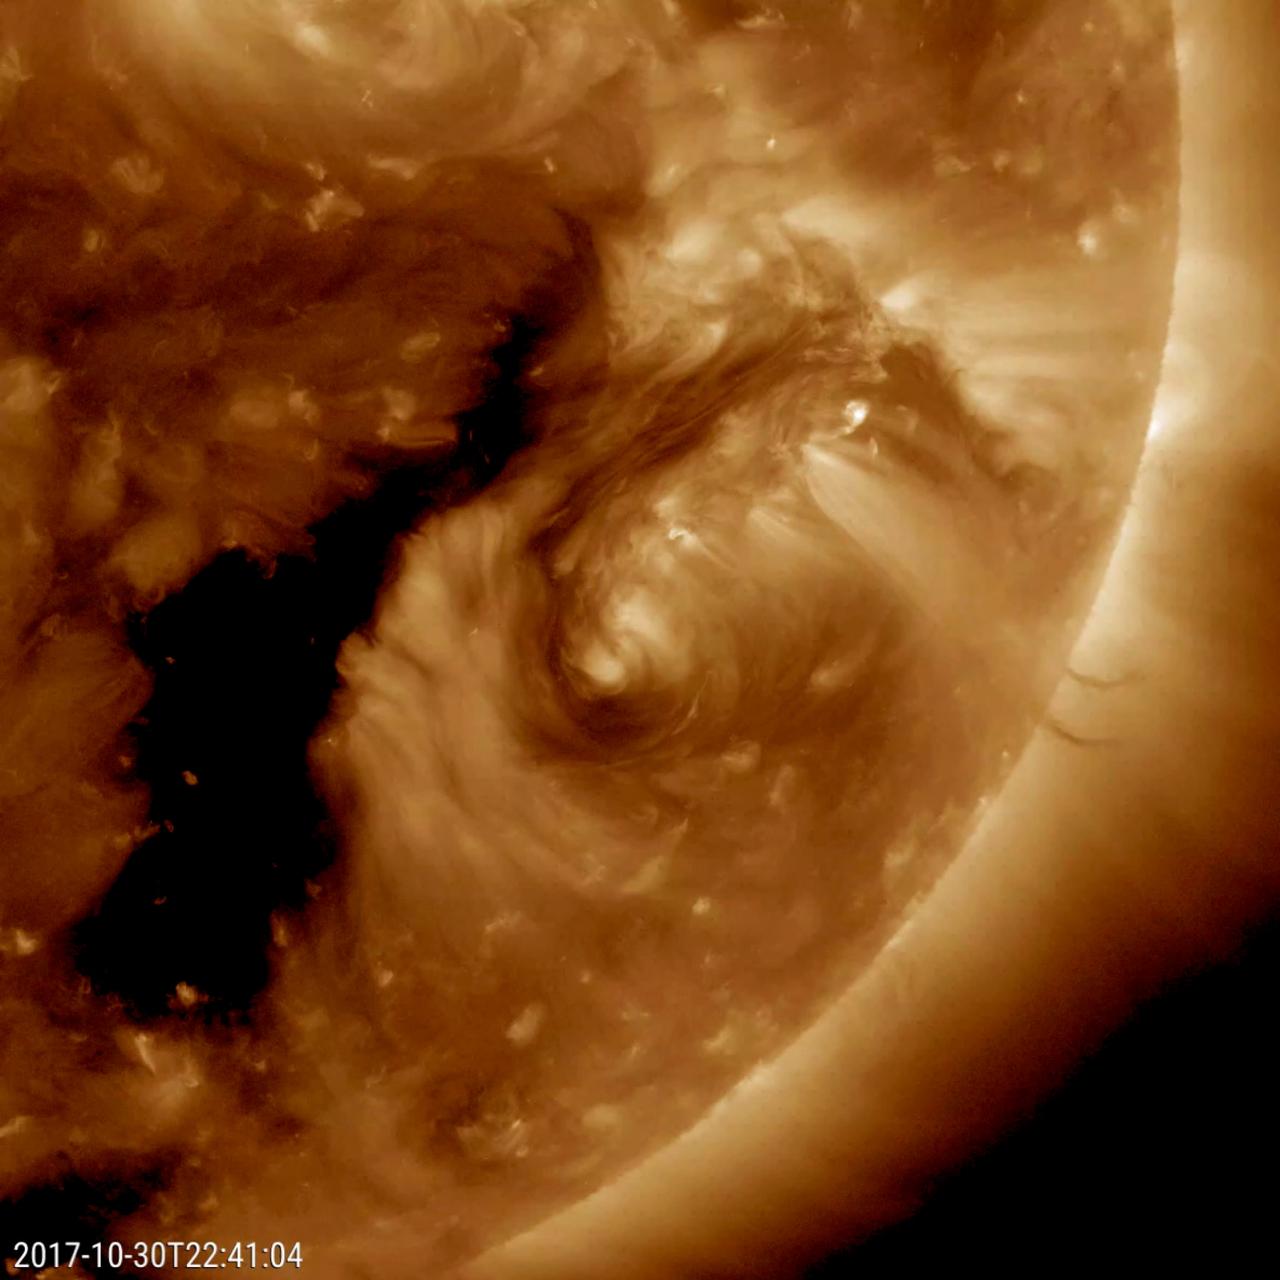
NASA's Solar Dynamics Observatory came across an oddity this week that the spacecraft has rarely observed before: a dark filament encircling an active region (Oct. 29-31, 2017). Solar filaments are clouds of charged particles that float above the sun, tethered to it by magnetic forces. They are usually elongated and uneven strands. Only a handful of times before have we seen one shaped like a circle. (The black area to the left of the brighter active region is a coronal hole, a magnetically open region of the sun). While it may no major scientific value, it is noteworthy because of its rarity. The still and video clip were taken in a wavelength of extreme ultraviolet light. Movies are available at https://photojournal.jpl.nasa.gov/catalog/PIA22104

This still image from an animation from NASA GSFC Solar Dynamics Observatory shows magnetically charged particles forming a nicely symmetrical arch at the edge of the Sun as they followed the magnetic field lines of an active region Aug.4-5, 2015. Before long the arch begins to fade, but a fainter and taller arch appears for a time in the same place. Note that several other bright active regions display similar kinds of loops above them. These images of ionized iron at about one million degrees were taken in a wavelength of extreme ultraviolet light. The video covers about 30 hours of activity. http://photojournal.jpl.nasa.gov/catalog/PIA19874
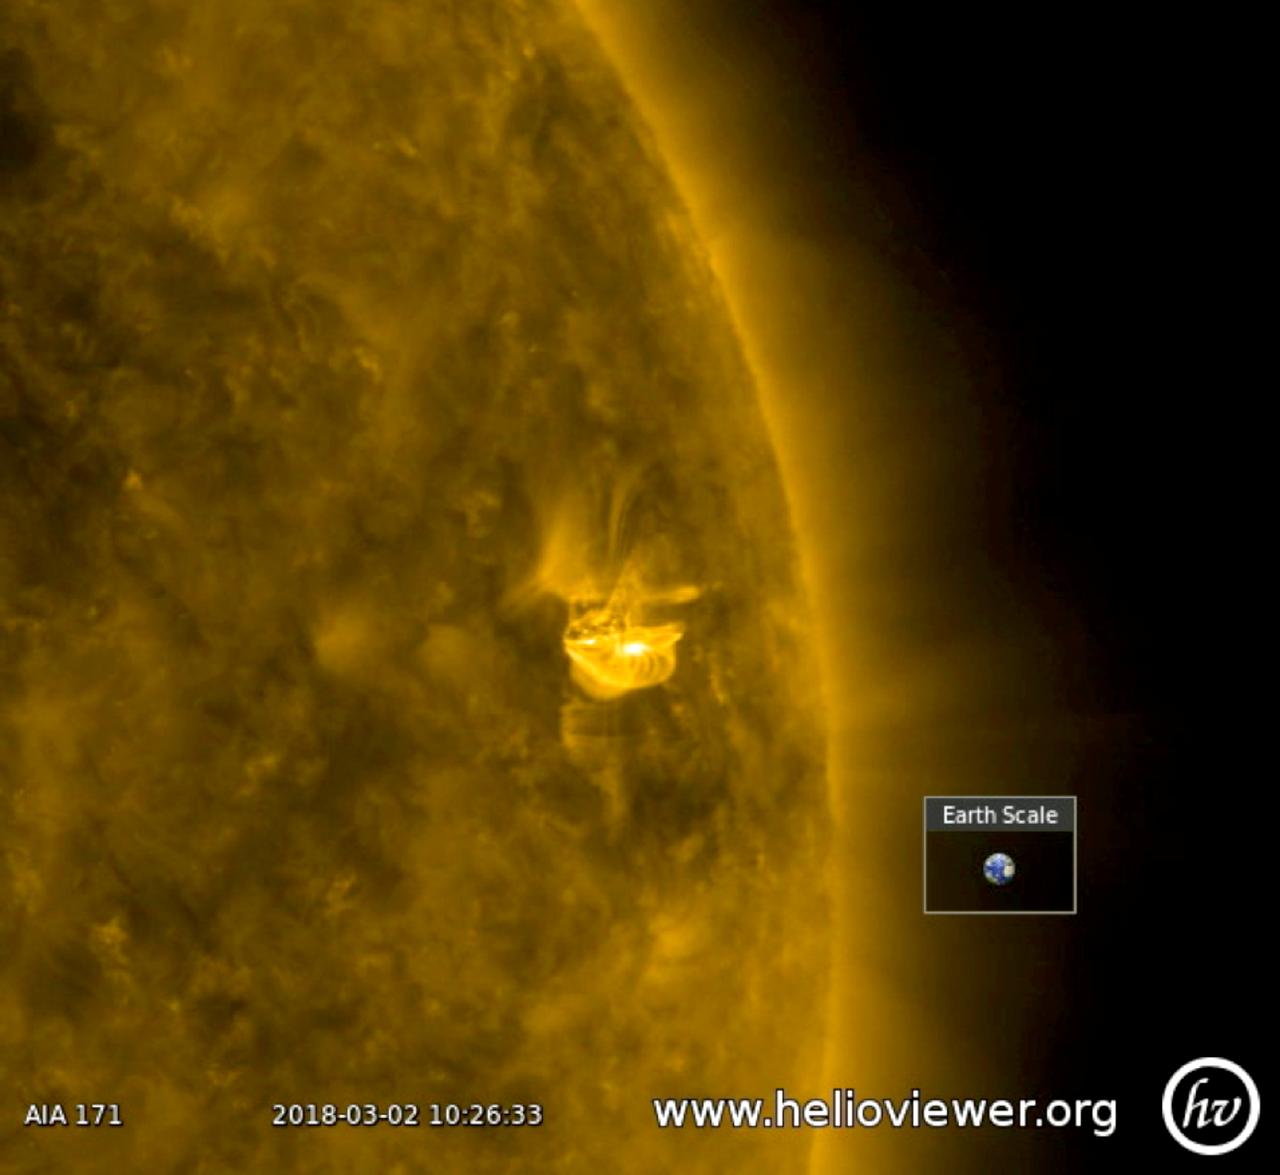
A relatively small active region erupted twice in 18 hours (Mar. 2, 2018). After each burst, one can see the magnetic fields lines, which appear as bright coils, spiraling around the region. They are reorganizing the disrupted magnetic field. The quick second when the screen goes black was caused by the Earth passing between the spacecraft and the sun. Images were taken in a wavelength of extreme ultraviolet light. The video was produced using the free Helioviewer software at Helioviewer.org. Videos are available at https://photojournal.jpl.nasa.gov/catalog/PIA22260
Two active regions with their intense magnetic fields produced towering arches and spiraling coils of solar loops above them (June 29 - July 1, 2014) as they rotated into view. When viewed in extreme ultraviolet light, magnetic field lines are revealed by charged particles that travel along them. These active regions appear as dark sunspots when viewed in filtered light. Note the small blast in the upper of the two major active regions, followed by more coils of loops as the region reorganizes itself. The still was taken on June 30 at 10:33 UT. Credit: NASA/Solar Dynamics Observatory Two active regions with their intense magnetic fields produced towering arches and spiraling coils of solar loops above them (June 29 - July 1, 2014) as they rotated into view. When viewed in extreme ultraviolet light, magnetic field lines are revealed by charged particles that travel along them. These active regions appear as dark sunspots when viewed in filtered light. Note the small blast in the upper of the two major active regions, followed by more coils of loops as the region reorganizes itself. The still was taken on June 30 at 10:33 UT. Credit: Solar Dynamics Observatory/NASA.
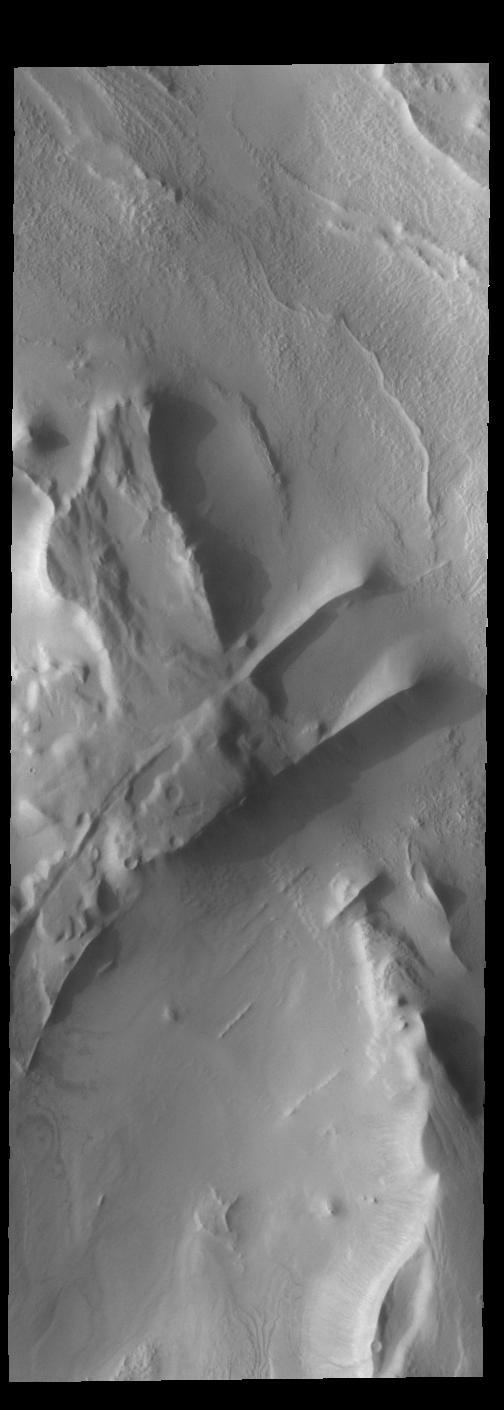
The elongated hills in this VIS image are a feature termed yardangs. Yardangs are formed by wind activity in regions where the surface material is not well cemented. The elongation indicates the direction of the wind. Orbit Number: 65299 Latitude: -10.1078 Longitude: 183.91 Instrument: VIS Captured: 2016-09-02 13:39 http://photojournal.jpl.nasa.gov/catalog/PIA21019
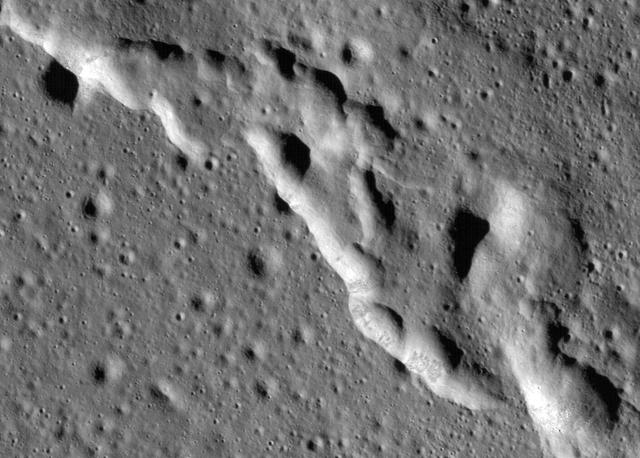
Scientists have discovered these wrinkle ridges in a region of the Moon called Mare Frigoris. These ridges add to evidence that the Moon has an actively changing surface. This image was taken by NASA's Lunar Reconnaissance Orbiter (LRO). https://photojournal.jpl.nasa.gov/catalog/PIA23210
Margaritifer Terra is the most impressive water-modified landscape on Mars that preserves the highest density of valley networks on the planet. Fluvial activity began in the Noachian period, likely peaked in the late Noachian-to-Hesperian, and then persisted, at least locally, into the Late Hesperian or Amazonian epoch. (This time period goes back at least 4 billion years to the present.) Our image shows fluvial channels that cut through the ejecta from Jones Crater, indicating relatively younger water activity in the region. https://photojournal.jpl.nasa.gov/catalog/PIA25360
This VIS image shows a linear depression in Syria Planum. Volcanic activity, including broad shield volcanoes and extensive volcanic plains created this region of the Tharsis system south of Noctis Labyrinthus. Linear features, like the one in this image, can be caused by several different processes. In this case a combination of tectonic forces and lava emplacement created the depression. Orbit Number: 74800 Latitude: -14.4492 Longitude: 260.323 Instrument: VIS Captured: 2018-10-25 07:10 https://photojournal.jpl.nasa.gov/catalog/PIA22883
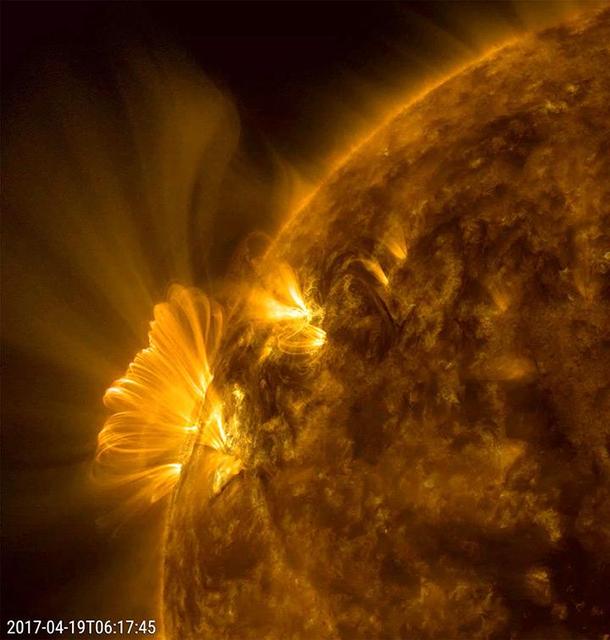
An active region that had just rotated into view blasted out a coronal mass ejection, which was immediately followed by a bright series of post-coronal loops seeking to reorganize that region's magnetic field (April 19, 2017). We have observed this phenomenon numerous times, but this one was one of the longest and clearest sequences we have seen in years. The bright loops are actually charged particles spinning along the magnetic field lines. The action was captured in a combination of two wavelengths of extreme ultraviolet light over a period of about 20 hours. Movies are available at https://photojournal.jpl.nasa.gov/catalog/PIA21598
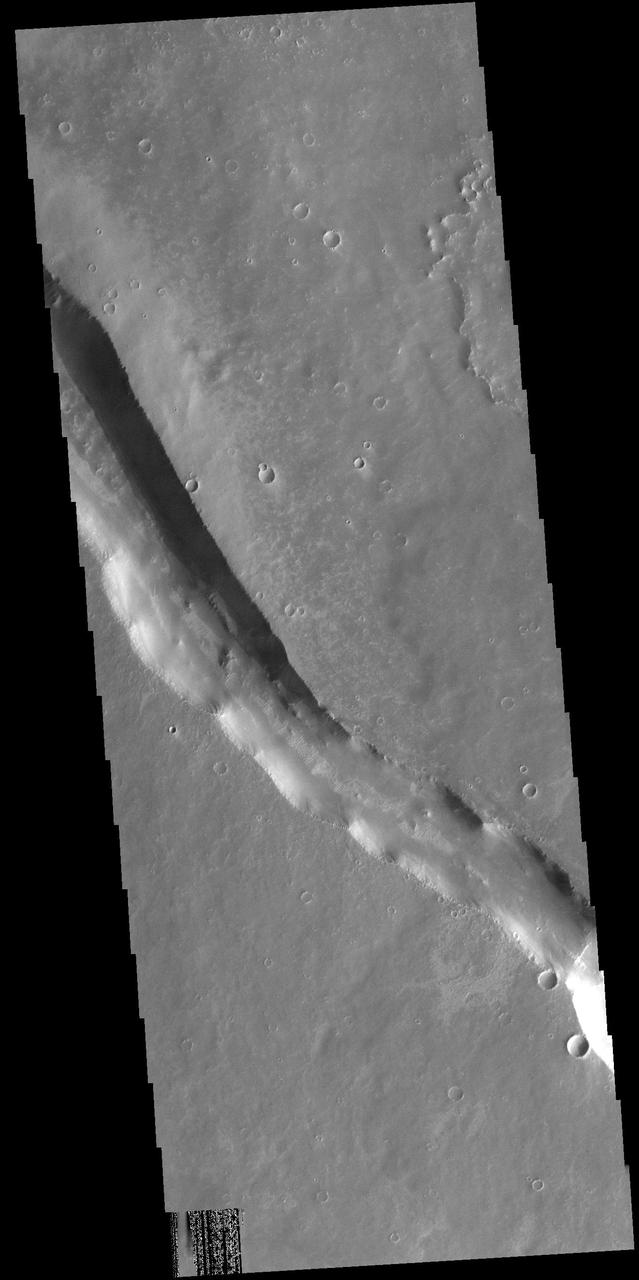
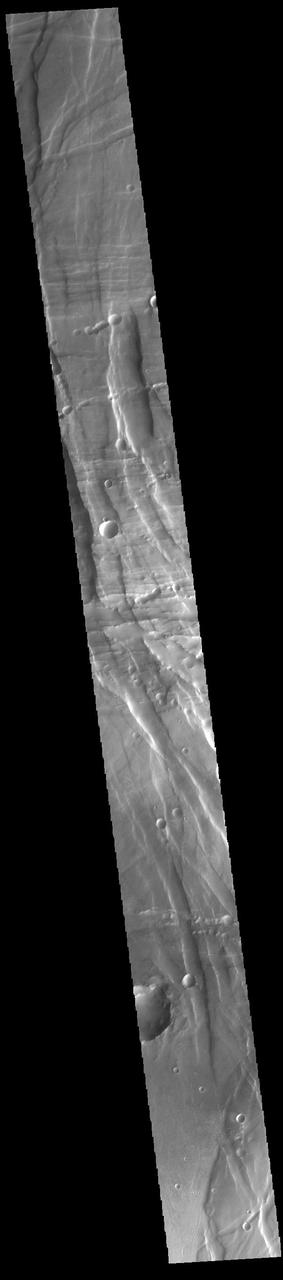
Located north of Olympus Mons and west of Alba Patera, Acheron Fossae provides a record of early tectonic activity in the Tharsis region. Acheron Fossae is a relatively high standing region characterized by multiple subparallel graben. As seen in the image, the graben trend generally to the northwest. The entire area predates the Alba Patera flows (which embay the eastern most Acheron grabens) and the Olympus Mons volcano (one of the youngest Tharsis features). The subdued nature of the highstanding hills, the erosion the graben walls, the eroded rims of all the visible craters, and the wind etching of the flat surfaces all help indicate the great age of Acheron Fossae. http://photojournal.jpl.nasa.gov/catalog/PIA04034

The lone active region visible on the sun put on a fine display with its tangled magnetic field lines swaying and twisting above it (Apr. 24-26, 2018) when viewed in a wavelength of extreme ultraviolet light. The charged particles spinning along these field lines illuminate them. The region did not erupt with any significant solar storms, although it still might. Videos are available at https://photojournal.jpl.nasa.gov/catalog/PIA22449
Two active regions with their intense magnetic fields produced towering arches and spiraling coils of solar loops above them (June 29 - July 1, 2014) as they rotated into view. When viewed in extreme ultraviolet light, magnetic field lines are revealed by charged particles that travel along them. These active regions appear as dark sunspots when viewed in filtered light. This image was taken on June 30 at 10:33 UT. Credit: NASA/Solar Dynamics Observatory Two active regions with their intense magnetic fields produced towering arches and spiraling coils of solar loops above them (June 29 - July 1, 2014) as they rotated into view. When viewed in extreme ultraviolet light, magnetic field lines are revealed by charged particles that travel along them. These active regions appear as dark sunspots when viewed in filtered light. Note the small blast in the upper of the two major active regions, followed by more coils of loops as the region reorganizes itself. The still was taken on June 30 at 10:33 UT. Credit: Solar Dynamics Observatory/NASA.
NASA Cassini spacecraft captured this view as it neared icy Enceladus for its closest-ever dive past the moon active south polar region. The view shows heavily cratered northern latitudes at top, transitioning to fractured, wrinkled terrain.

RCW 108 is a region where stars are actively forming within the Milky Way galaxy about 4,000 light years from Earth. This image is part of a large collection of images of merging galaxies taken by NASA Hubble Space Telescope.
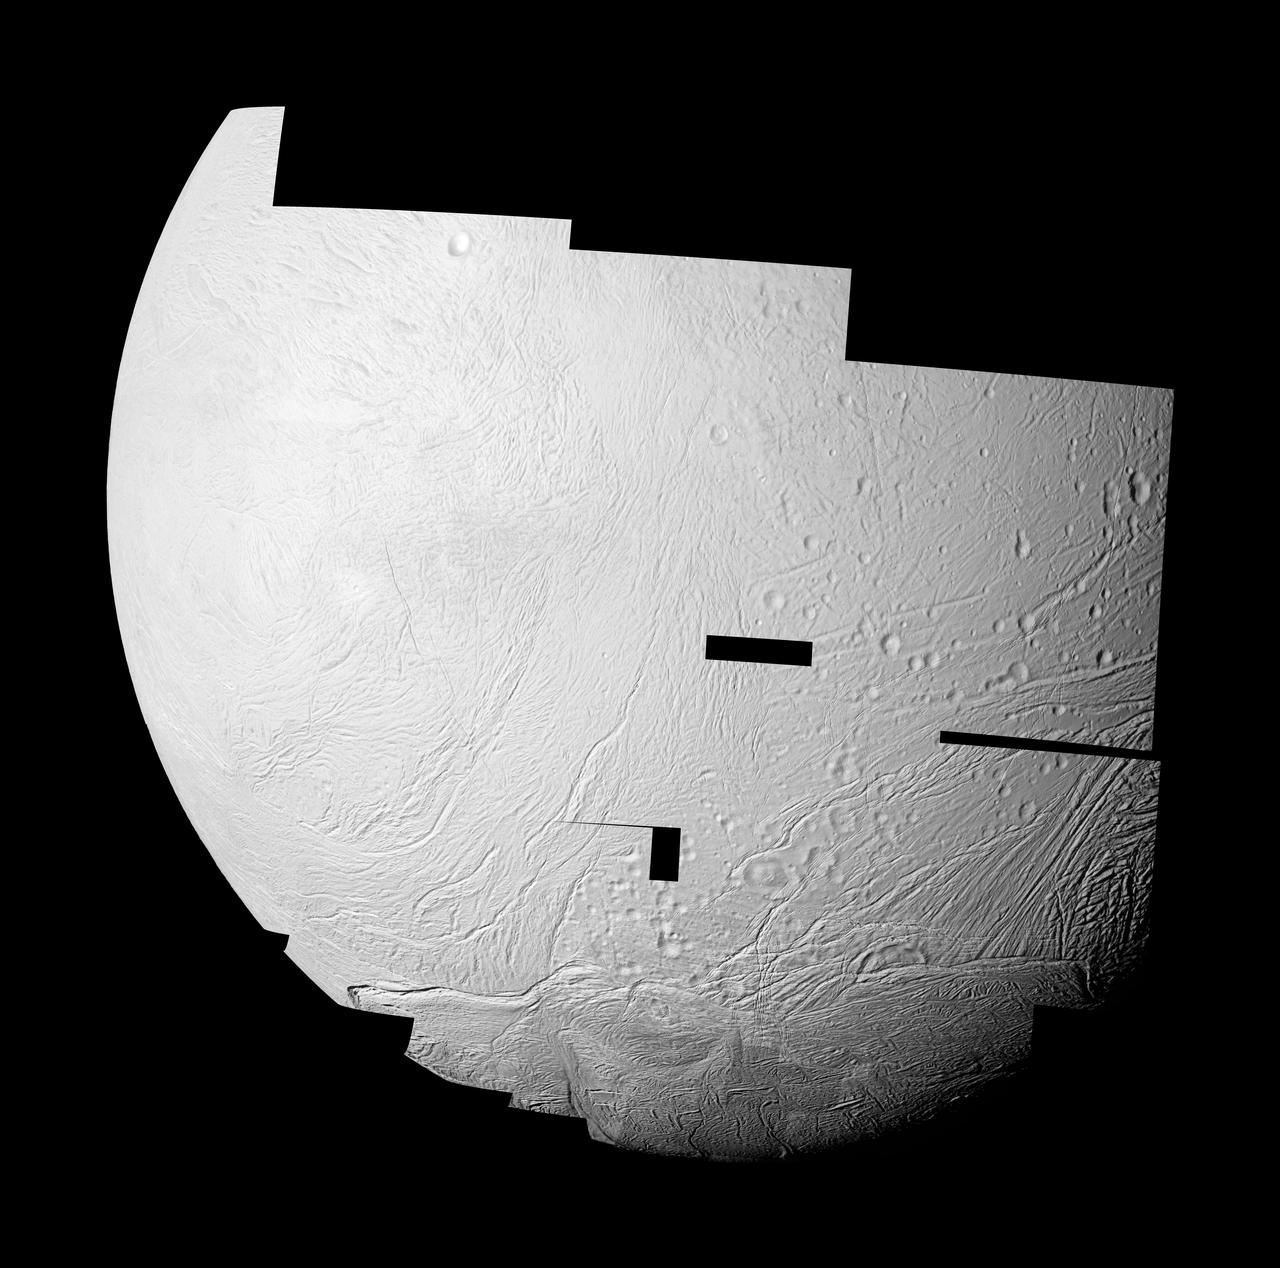
NASA Cassini spacecraft captured this high resolution image of the western hemisphere of Saturn moon Enceladus where newly created terrain of this geologically active moon south polar region meets older, crater-filled terrain further north.
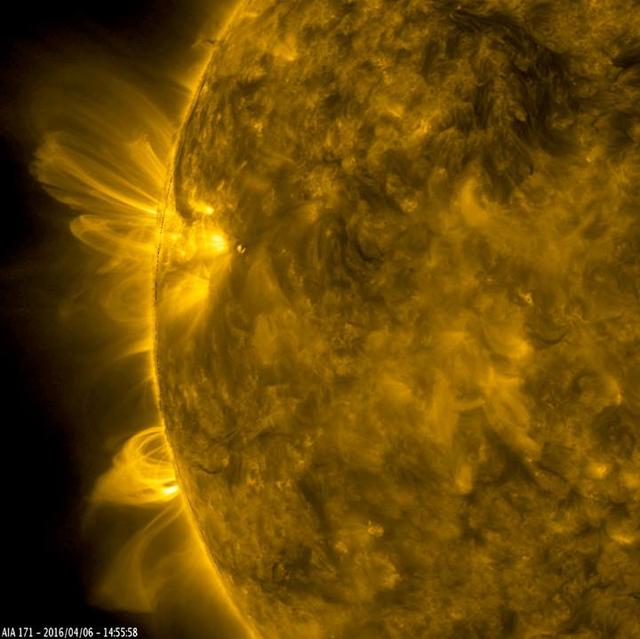
This still image from an animation from NASA GSFC Solar Dynamics Observatory shows arches of magnetic field lines towered over the edge of the Sun as a pair of active regions began to rotate into view Apr. 5-6, 2016.
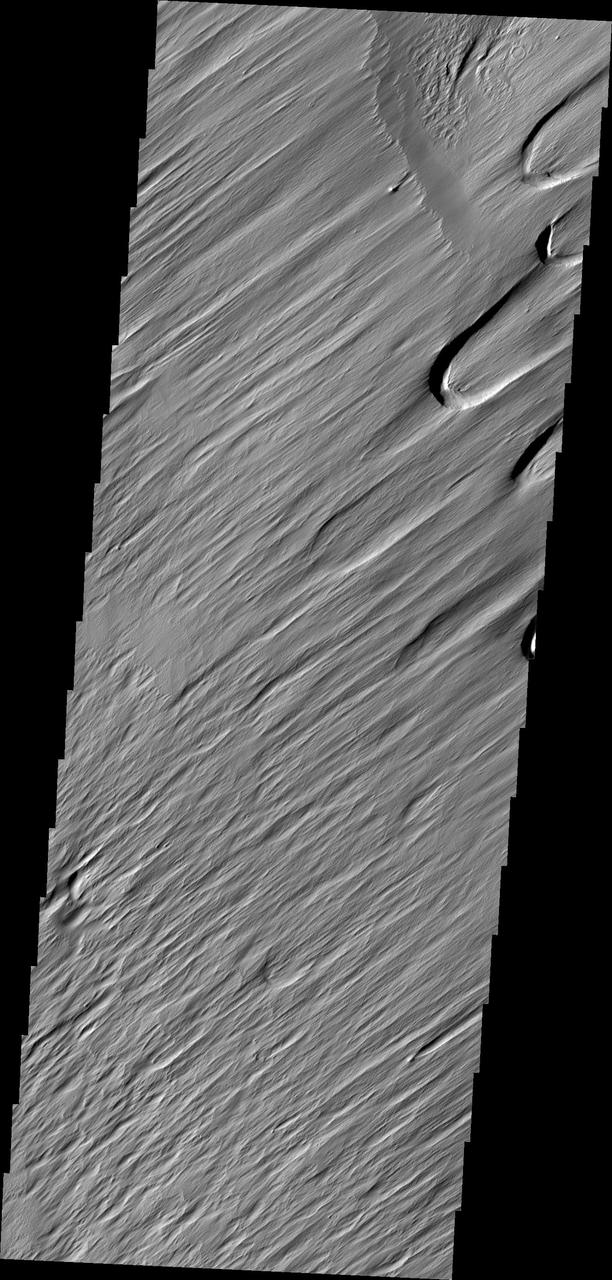
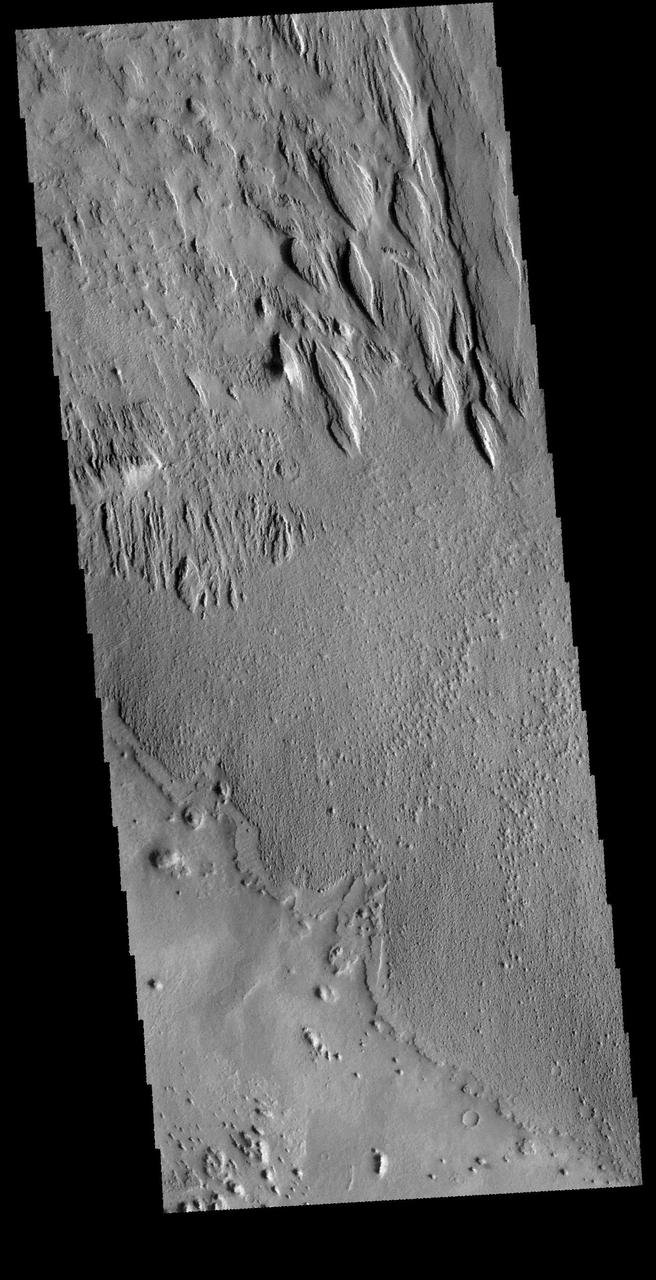
This wind-swept region of Amazonis Planitia, imaged here by NASA Mars Odyssey spacecraft, has been so uniformly dissected into yardangs that only two craters provide any indication that other processes have ever been active on the surface. http://photojournal.jpl.nasa.gov/catalog/PIA04010
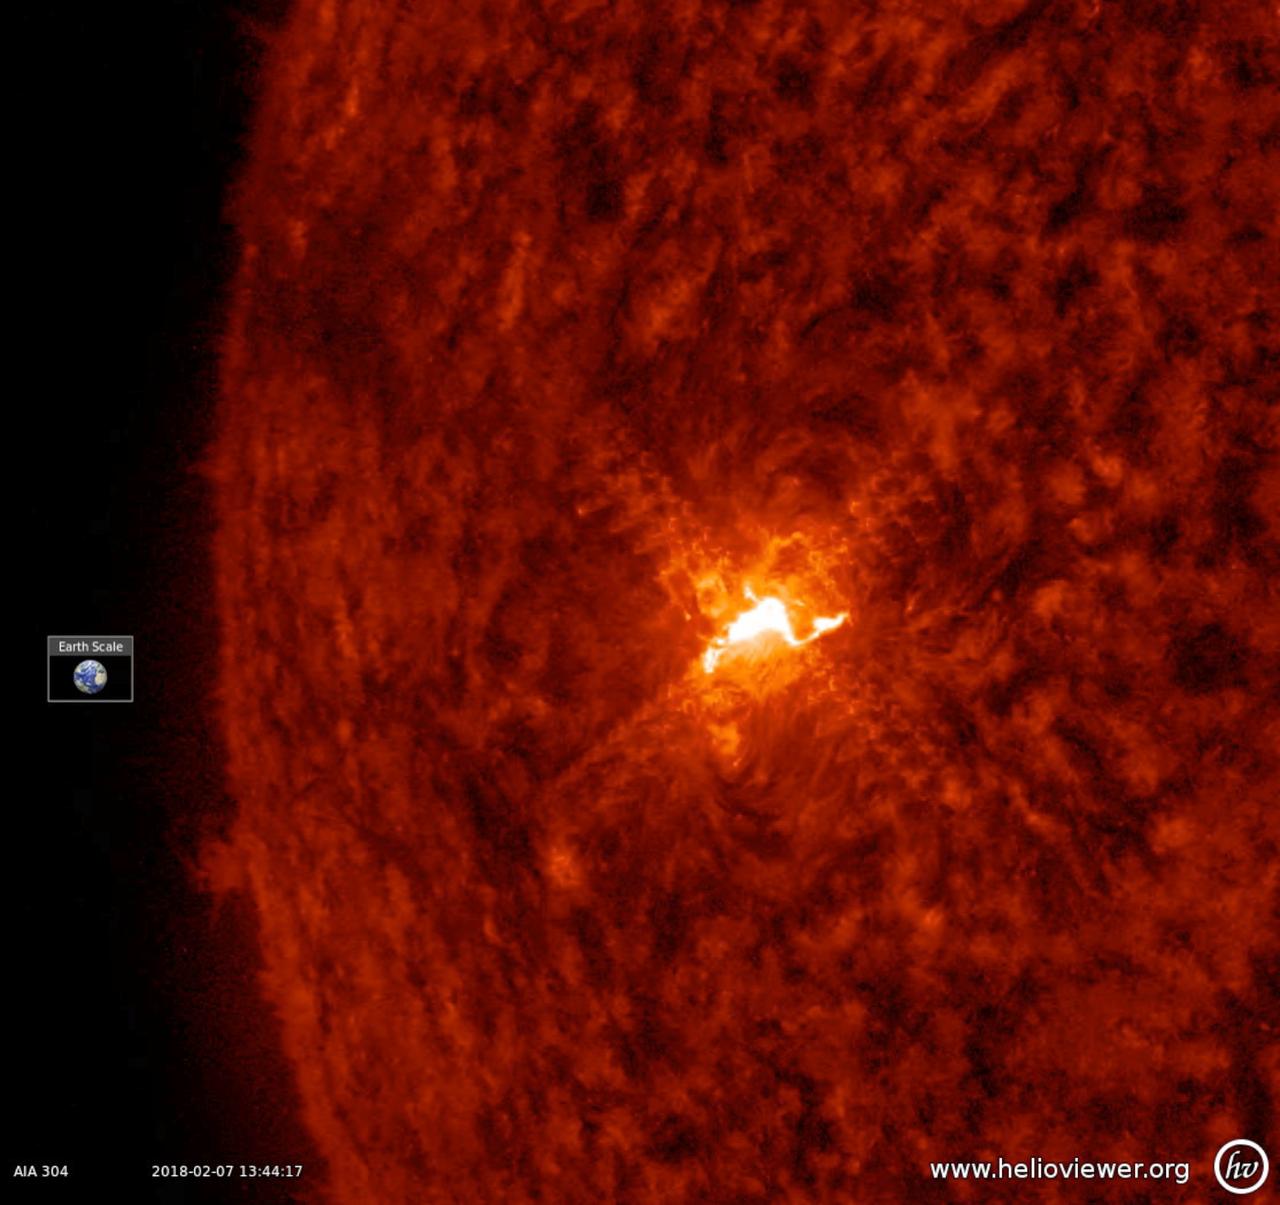
The sun's only visible active region sputtered and spurted and eventually unleashed a small (C-class) flare (Feb. 7, 2018). The flare appears as a brief, bright flash about mid-way through the half-day clip. Normally, we do not pay much attention to flares this small, but it was just about the only real solar activity over the past week as the sun is slowly approaching its quiet period of the 11-year solar cycle. These images were taken in a wavelength of extreme ultraviolet light. Movies are available at https://photojournal.jpl.nasa.gov/catalog/PIA22244

Several small sunspots appeared this week, giving NASA Solar Dynamics Observatory a chance to illustrate their sources Mar. 2, 2017. The first image is a magnetogram or magnetic image of the sun's surface. The MDI instrument can observe where positive and negative particles are moving toward or away from strong magnetic areas. These active regions have stronger magnetic fields and appear as strongly black or white. The yellow image shows the surface in filtered light, and there the same active regions appear as dark, cooler splotches called sunspots. Higher up in the sun's atmosphere, the golden image (in extreme ultraviolet light) shows arches of light above the active regions, which are charged particles spinning along magnetic field lines. Note that they all align very well with each other. Magnetic forces are the dynamic drivers here in these regions of the sun. Movies are available at http://photojournal.jpl.nasa.gov/catalog/PIA21557

The magnetic field lines between a pair of active regions formed a beautiful set of swaying arches rising up above them Apr. 24-26, 2017, as seen by NASA Solar Dynamics Observatory. The connection between opposing poles of polarity is visible in exquisite detail in this wavelength of extreme ultraviolet light. What we are really seeing are charged particles spinning along the magnetic field lines. Other field lines are traced as they reach out in other directions as well. Videos can be seen at https://photojournal.jpl.nasa.gov/catalog/PIA21604

A prominence rose up above the sun, sent an arch of plasma to link up magnetically with an active region over a one-day period (Jan, 9-10, 2017). Then the flow of plasma seemed to largely change direction and head back where it came from. Finally, amidst the confused patterns of movement, it dissipated and fell away. Prominences are cooler clouds of charged particles tenuously tethered to the sun by magnetic forces. Images were taken in a wavelength of extreme ultraviolet light. Movies are available at https://photojournal.jpl.nasa.gov/catalog/PIA22199
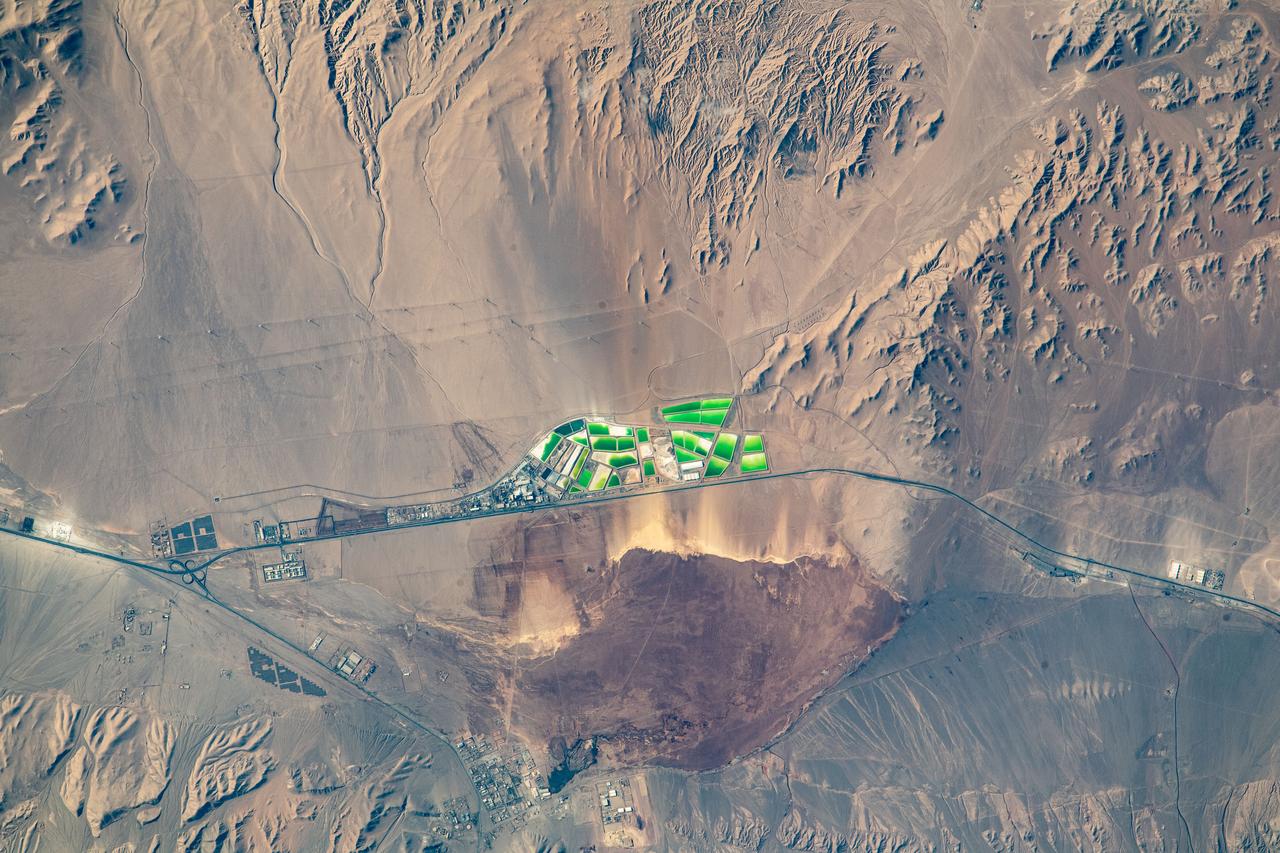
iss069e030002 (July 7, 2023) --- Mining activities in the northern Chilean region of Antofagasta are pictured from the International Space Station as it orbited 264 miles above.

The sun emitted a significant solar flare, peaking at 5:40 p.m. EDT on Oct. 24, 2014. The flare erupted from a particularly large active region -- labeled AR 12192 -- on the sun that is the largest in 24 years. This is the fourth substantial flare from this active region since Oct. 19. Read more: <a href="http://www.nasa.gov/content/goddard/giant-sunspot-erupts-with-4th-substantial-flare" rel="nofollow">www.nasa.gov/content/goddard/giant-sunspot-erupts-with-4t...</a>

Flaring, active regions of our sun are highlighted in this image combining observations from several telescopes. High-energy X-rays from NASA's Nuclear Spectroscopic Telescope Array (NuSTAR) are shown in blue; low-energy X-rays from Japan's Hinode spacecraft are green; and extreme ultraviolet light from NASA's Solar Dynamics Observatory (SDO) is yellow and red. All three telescopes captured their solar images around the same time on April 29, 2015. The NuSTAR image is a mosaic made from combining smaller images. The active regions across the sun's surface contain material heated to several millions of degrees. The blue-white areas showing the NuSTAR data pinpoint the most energetic spots. During the observations, microflares went off, which are smaller versions of the larger flares that also erupt from the sun's surface. The microflares rapidly release energy and heat the material in the active regions. NuSTAR typically stares deeper into the cosmos to observe X-rays from supernovas, black holes and other extreme objects. But it can also look safely at the sun and capture images of its high-energy X-rays with more sensitivity than before. Scientists plan to continue to study the sun with NuSTAR to learn more about microflares, as well as hypothesized nanoflares, which are even smaller. In this image, the NuSTAR data shows X-rays with energies between 2 and 6 kiloelectron volts; the Hinode data, which is from the X-ray Telescope instrument, has energies of 0.2 to 2.4 kiloelectron volts; and the Solar Dynamics Observatory data, taken using the Atmospheric Imaging Assembly instrument, shows extreme ultraviolet light with wavelengths of 171 and 193 Angstroms. Note the green Hinode image frame edge does not extend as far as the SDO ultraviolet image, resulting in the green portion of the image being truncated on the right and left sides. http://photojournal.jpl.nasa.gov/catalog/PIA19821
NASA's Solar Dynamics Observatory (SDO) scientists use their computer models to generate a view of the sun's magnetic field (Aug. 10, 2018). We took the opportunity to compare an extreme ultraviolet view of the sun with the same image showing the superimposed field lines. The bright active region right at the central area of the sun clearly shows a concentration of field lines, as well as the small active region at the sun's right edge, but to a lesser extent. Magnetism drives the dynamic activity near the sun's surface. Movies are available at https://photojournal.jpl.nasa.gov/catalog/PIA22662
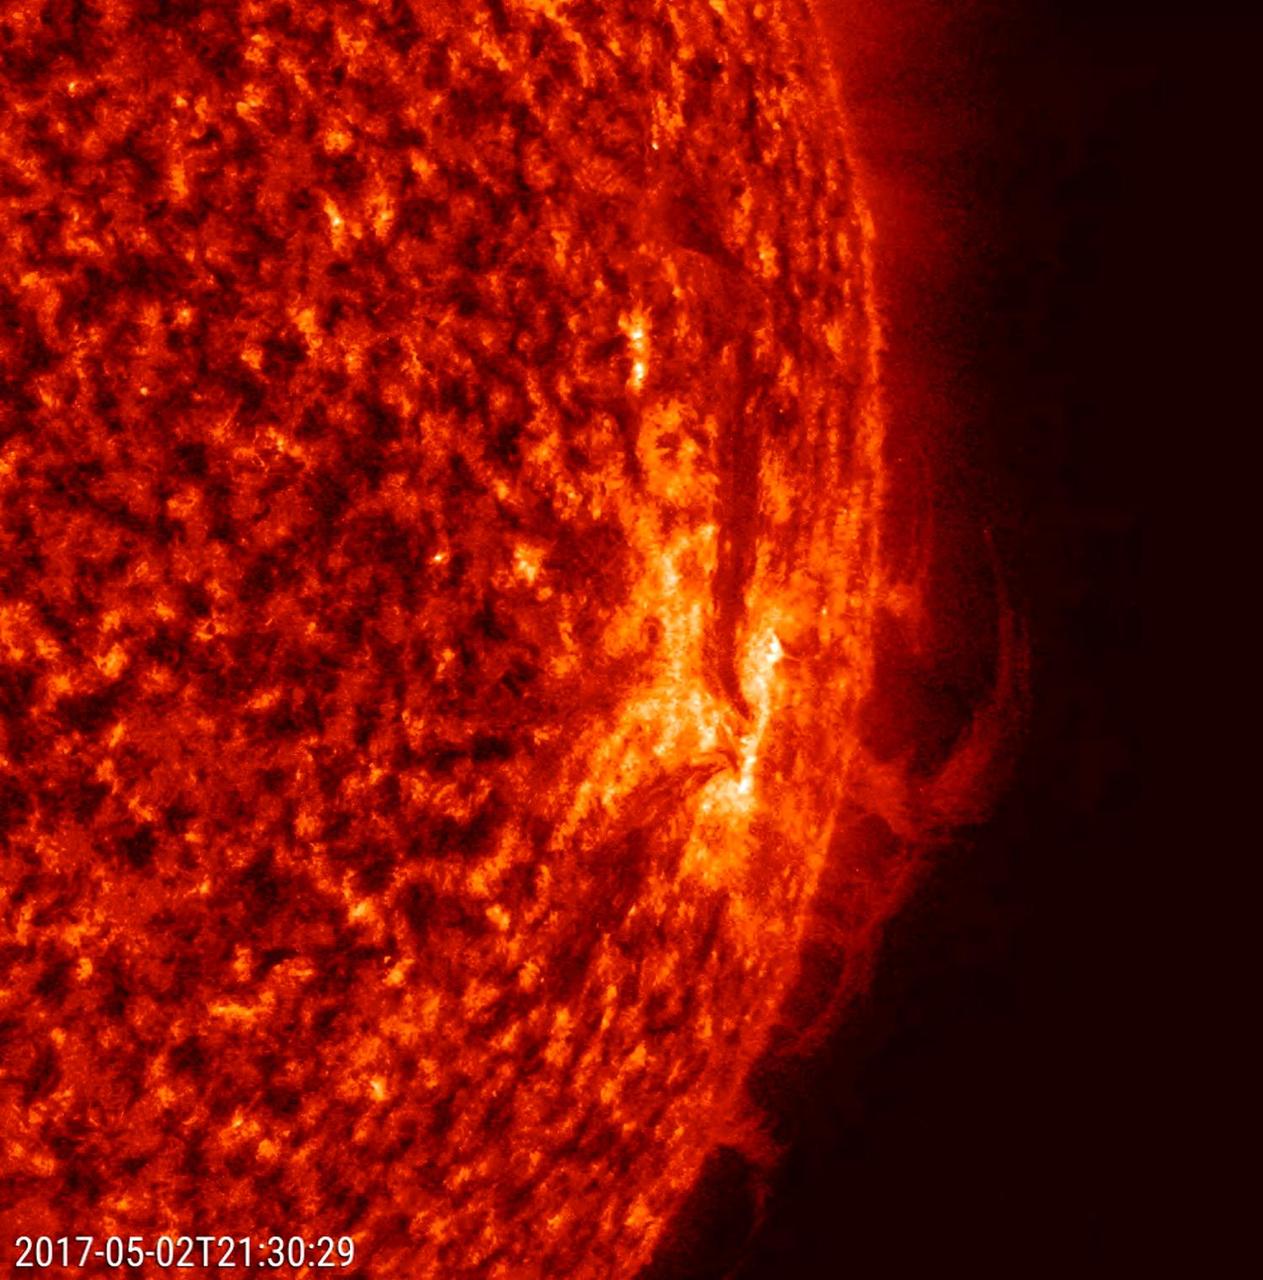
Strands of plasma at the sun edge shifted and twisted back and forth over a 22-hour period, May 2-3, 2017. In this close-up from NASA Solar Dynamics Observatory, the strands are being manipulated by strong magnetic forces associated with active region. This kind of activity is not at all uncommon, but best viewed in profile. The images were taken in a wavelength of extreme ultraviolet light. To give a sense of scale, the strands hover above the sun more than several times the size of Earth. Movies are available at https://photojournal.jpl.nasa.gov/catalog/PIA21632
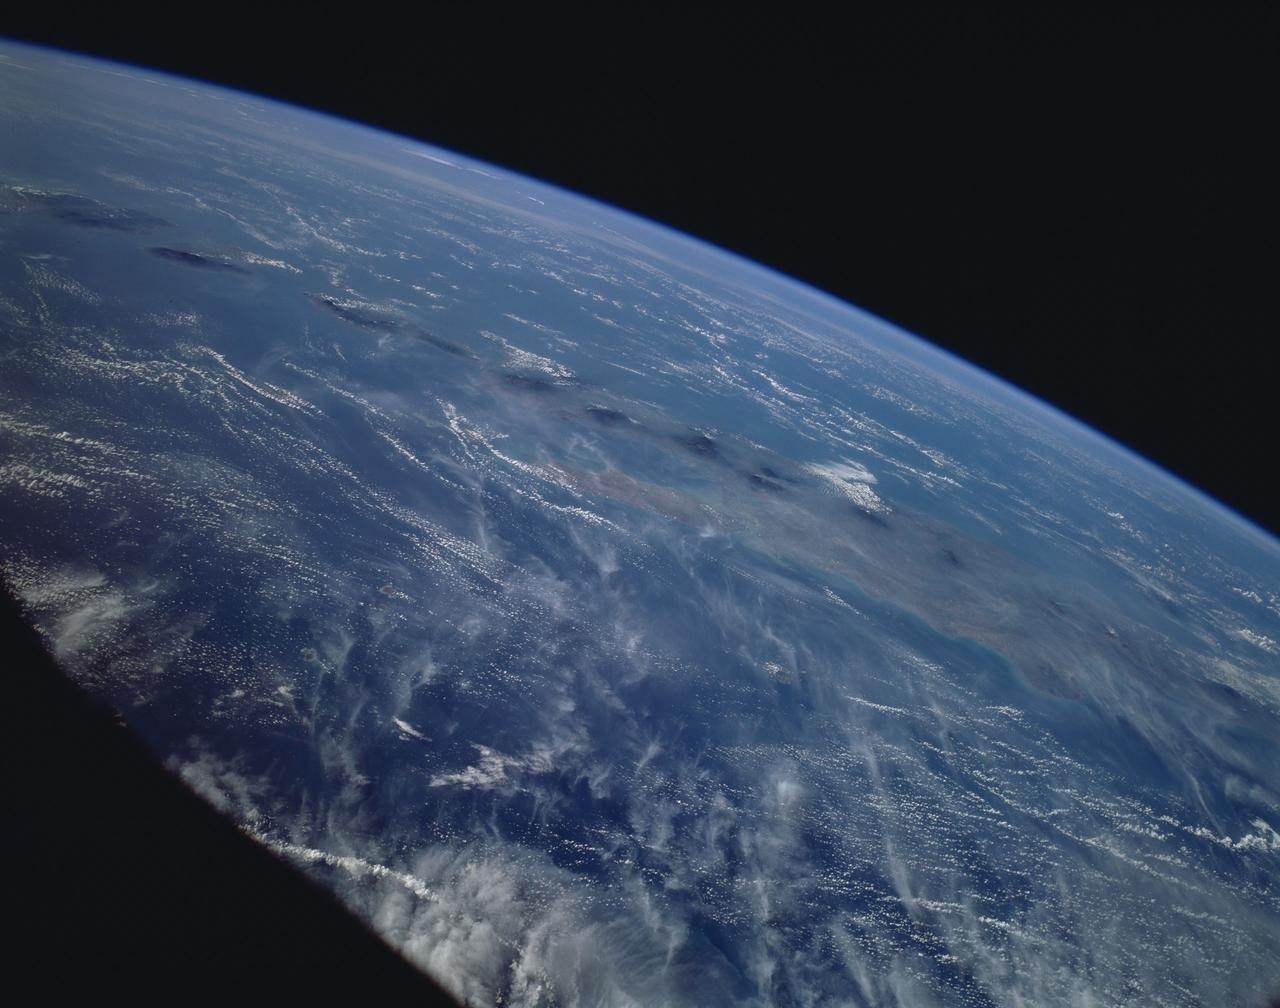
This is a striking, oblique view to the south of the Indonesian islands of Java (right), Bali and Lombok (upper left). The linear array of dark regions across the photo is a chain of volcanoes which make up the back bone of this part of the Indonesian Islands. This chain has been quite active over the past six months. Plumes of steam can be seen rising from the summits of Arjuno (west-central Java) and Merapi (central Java, near the right side of this photo). The region appears hazy due to an extended drought over Indonesia and Australia. Because of drought conditions, huge fires continue to burn over other regions of Indonesia, New Guinea and norther Australia, producing a regional smoke pall.

Giant, bright coronal loops trace out the magnetic field lines above an active region from June 4-6, 2018. The wavelength of extreme ultraviolet light shown here is emitted by ionized iron travelling along the field lines, super-heated to approximately 1 million degrees K. Coronal loops were not seen in this level of detail until the Solar Dynamics Observatory was launched in 2010 and came online, giving solar scientists new data with which to study the Sun and its processes. Videos are available at https://photojournal.jpl.nasa.gov/catalog/PIA22508
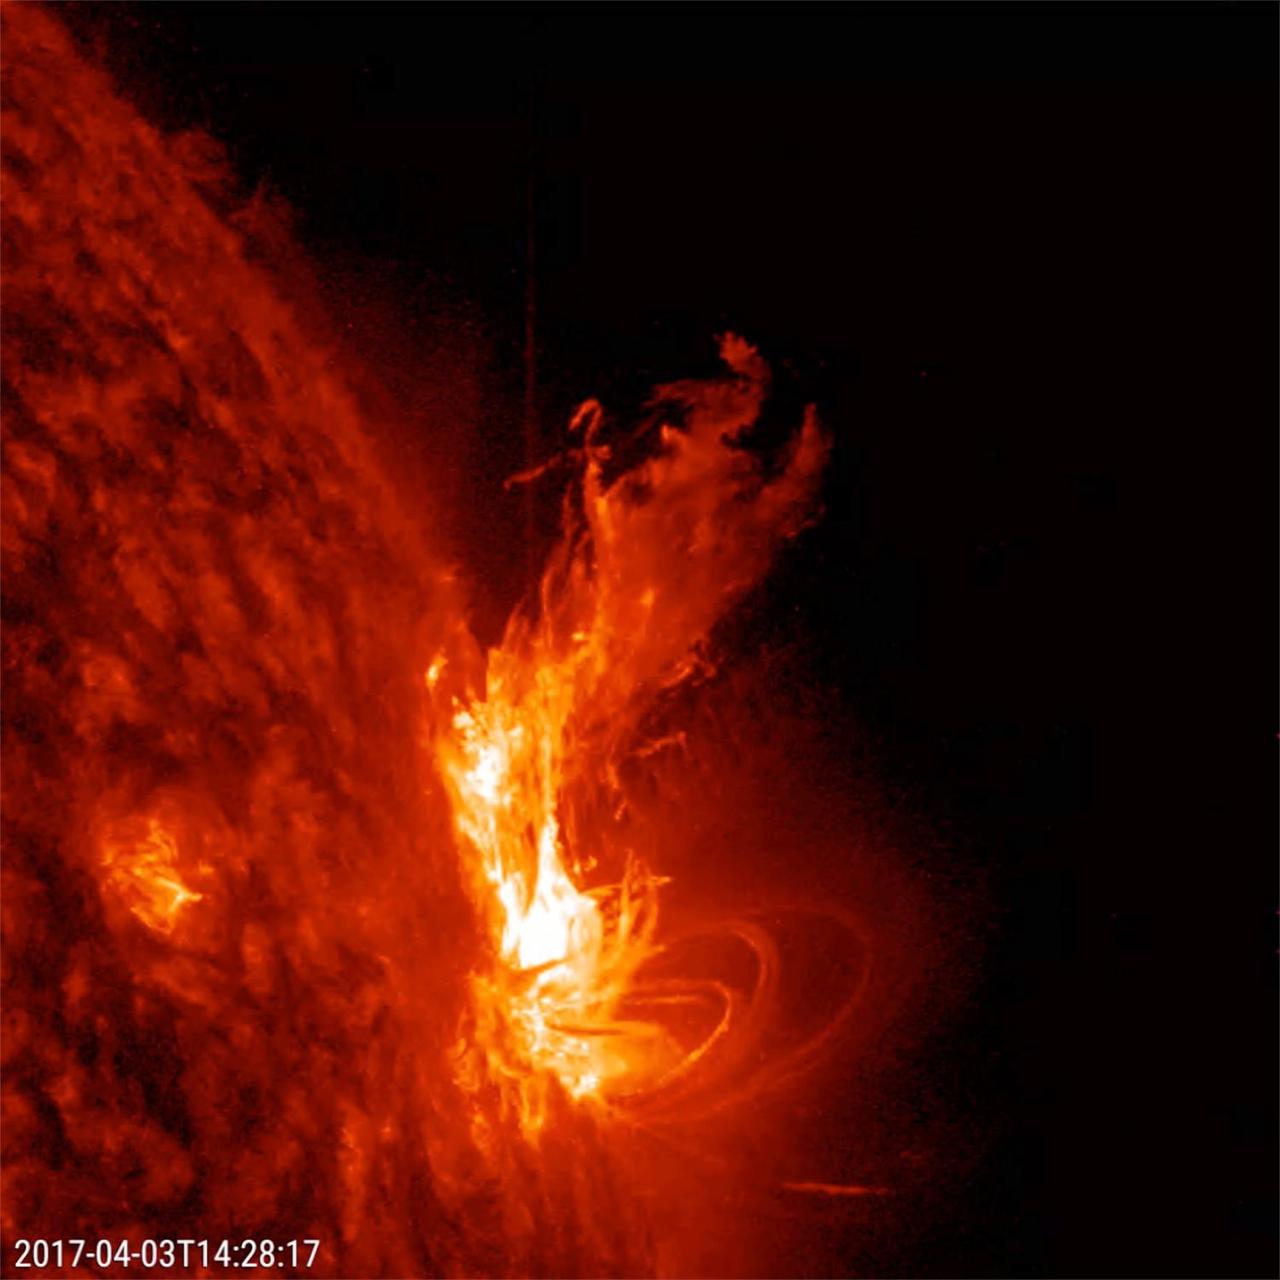
An active region at the sun's edge produced several M5-class (medium sized) flares over a ten-hour period (Apr. 3, 2017). The most dramatic flare occurs about half way through the video clip, when it shoots up a bright towering plume of plasma. These were the strongest flares of the year so far. Some coronal mass ejections (which hurled clouds of plasma into space) were also associated with some of these flares. The images were taken in a wavelength of extreme ultraviolet light. Movies are available at https://photojournal.jpl.nasa.gov/catalog/PIA21584
The Tharsis Montes region on Mars is a major center of volcanic and tectonic activity. The channel in this image from NASA Mars Odyssey is west of the relatively small volcano called Biblis Patera although it shows no obvious relationship to that volcano. Instead, it may be related to the more distant, but more massive volcano Olympus Mons to the north. The channel may have hosted flowing lava at one time but now contains a material that has eroded into an impressive ridge-and-groove pattern. These features may be yardangs, landforms produced from the erosion by wind of sedimentary material. http://photojournal.jpl.nasa.gov/catalog/PIA04020
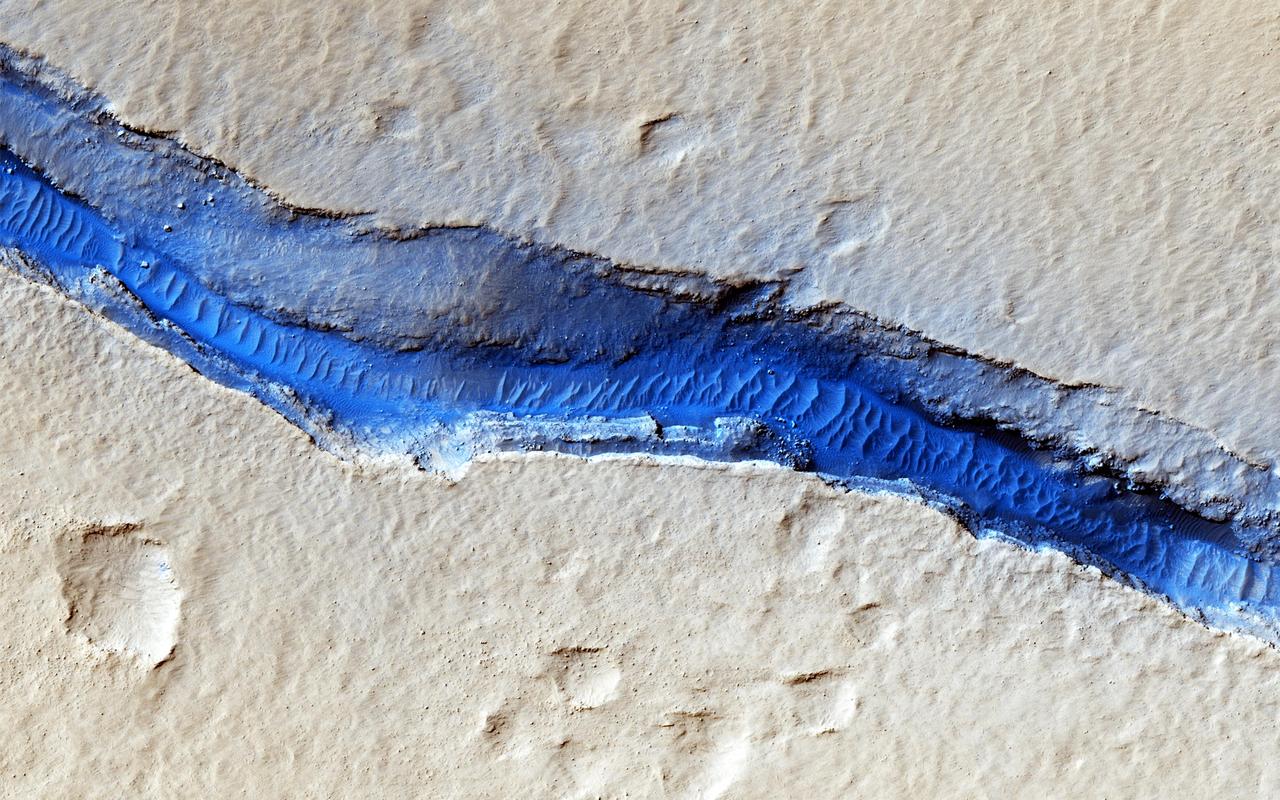
A dominant driver of surface processes on Mars today is aeolian (wind) activity. In many cases, sediment from this activity is trapped in low-lying areas, such as craters. Aeolian features in the form of dunes and ripples can occur in many places on Mars depending upon regional wind regimes. The Cerberus Fossae are a series of discontinuous fissures along dusty plains in the southeastern region of Elysium Planitia. This rift zone is thought to be the result of combined volcano-tectonic processes. Dark sediment has accumulated in areas along the floor of these fissures as well as inactive ripple-like aeolian bedforms known as "transverse aeolian ridges" (TAR). Viewed through HiRISE infrared color, the basaltic sand lining the fissures' floor stands out as deep blue against the light-toned dust covering the region. This, along with the linearity of the fissures and the wave-like appearance of the TAR, give the viewer an impression of a river cutting through the Martian plains. However, this river of sand does not appear to be flowing. Analyses of annual monitoring images of this region have not detected aeolian activity in the form of ripple migration thus far. http://photojournal.jpl.nasa.gov/catalog/PIA21063
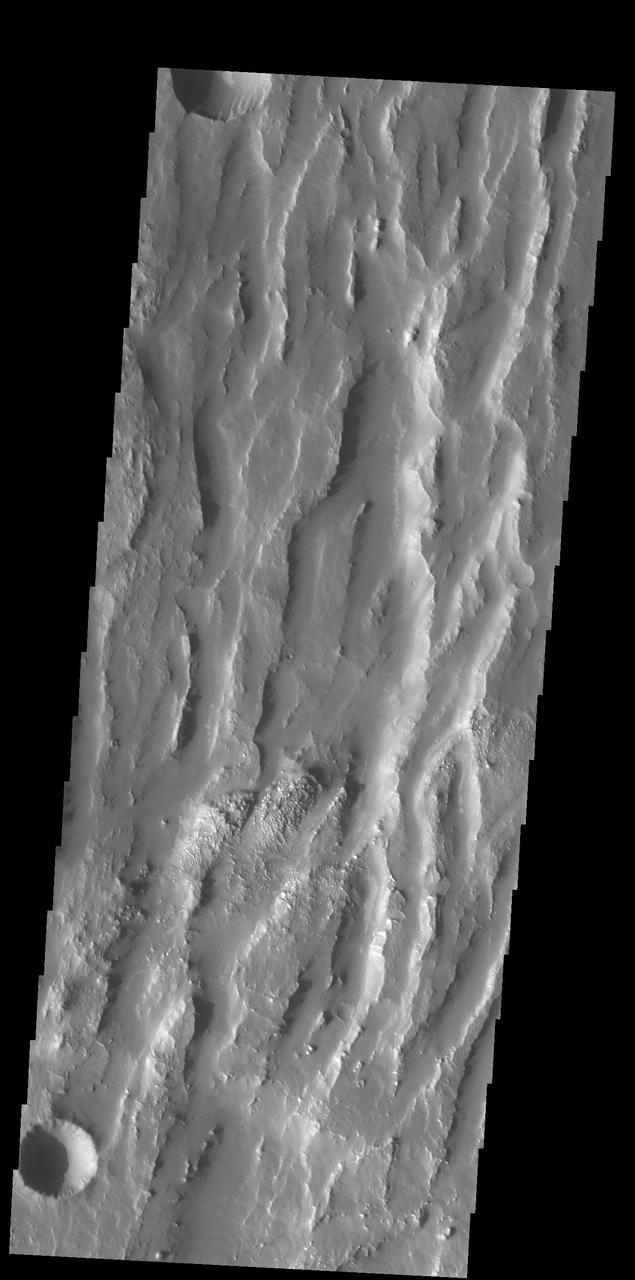
Located between the lava plains of Daedalia Planum and Solis Planum, Claritas Fossae is a graben filled highland. Graben are formed by tectonic activity, where extensional forces stretch the surface allowing blocks of material to slide down between paired faults. These linear grabens are termed fossae. This region of Mars had very active tectonism and volcanism, resulting in the huge volcanos like Arsia Mons and deep chasmata of Valles Marineris. Claritas Fossae was formed prior to the large lava flows of the Tharsis region. Orbit Number: 92164 Latitude: -26.3031 Longitude: 253.828 Instrument: VIS Captured: 2022-09-24 01:20 https://photojournal.jpl.nasa.gov/catalog/PIA25757
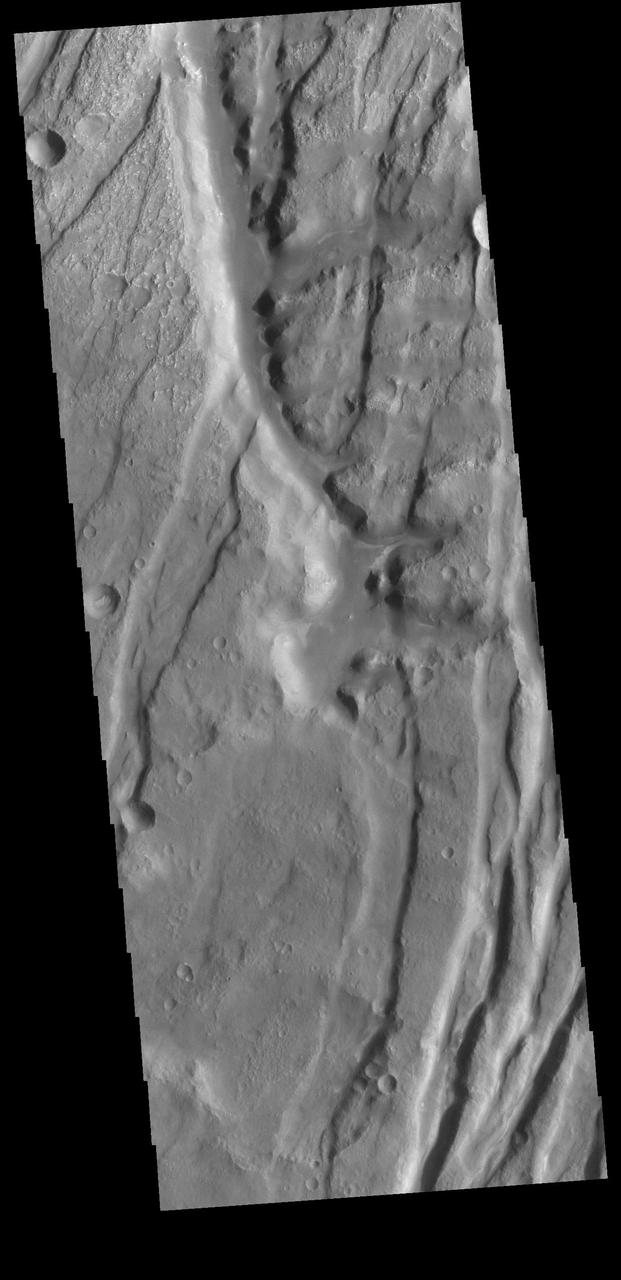
Located between the lava plains of Daedalia Planum and Solis Planum, Claritas Fossae is a graben filled highland. Graben are formed by tectonic activity, where extensional forces stretch the surface allowing blocks of material to slide down between paired faults. These linear grabens are termed fossae. This region of Mars had very active tectonism and volcanism, resulting in the huge volcanos like Arsia Mons and deep chasmata of Valles Marineris. Claritas Fossae was formed prior to the large lava flows of the Tharsis region. Orbit Number: 81376 Latitude: -35.6385 Longitude: 253.121 Instrument: VIS Captured: 2020-04-18 15:46 https://photojournal.jpl.nasa.gov/catalog/PIA23957
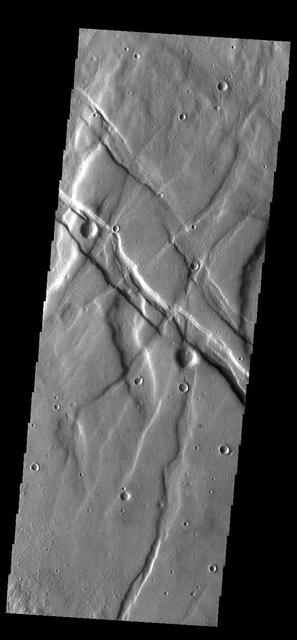
Located between the lava plains of Daedalia Planum and Solis Planum, Claritas Fossae is a graben filled highland. Graben are formed by tectonic activity, where extensional forces stretch the surface allowing blocks of material to slide down between paired faults. These linear grabens are termed fossae. This region of Mars had very active tectonism and volcanism, resulting in the huge volcanos like Arsia Mons and deep chasmata of Valles Marineris. Claritas Fossae was formed prior to the large lava flows of the Tharsis region. Orbit Number: 84439 Latitude: -41.4956 Longitude: 272.168 Instrument: VIS Captured: 2020-12-26 23:43 https://photojournal.jpl.nasa.gov/catalog/PIA24402
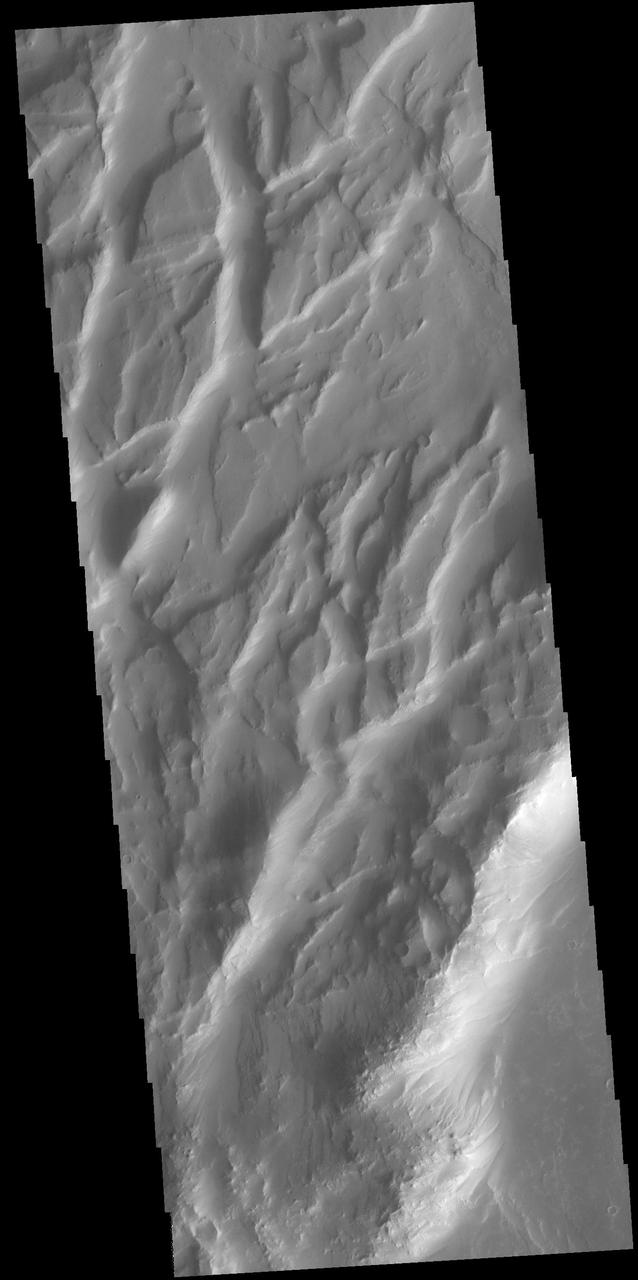
Located between the lava plains of Daedalia Planum and Solis Planum, Claritas Fossae is a graben filled highland. Graben are formed by tectonic activity. In this region of Mars extensive and long lived volcanic and tectonic activity created the largest volcanoes and the longest canyon system on Mars. Volcanic and tectonic forces coexist and tectonic faults are often utilized by subsurface magma to reach the surface. Claritas Fossae was formed prior to the large lava flows of the Tharsis region. Orbit Number: 74950 Latitude: -17.7366 Longitude: 252.095 Instrument: VIS Captured: 2018-11-06 15:40 https://photojournal.jpl.nasa.gov/catalog/PIA22974
Located between the lava plains of Daedalia Planum and Solis Planum, Claritas Fossae is a graben filled highland. Graben are formed by tectonic activity, where extensional forces stretch the surface allowing blocks of material to slide down between paired faults. These linear grabens are termed fossae. This region of Mars had very active tectonism and volcanism, resulting in the huge volcanos like Arsia Mons and deep chasmata of Valles Marineris. Claritas Fossae was formed prior to the large lava flows of the Tharsis region. Orbit Number: 91646 Latitude: -14.0577 Longitude: 249.123 Instrument: VIS Captured: 2022-08-12 10:26 https://photojournal.jpl.nasa.gov/catalog/PIA25612

Located between the lava plains of Daedalia Planum and Solis Planum, Claritas Fossae is a graben filled highland. Graben are formed by tectonic activity, where extensional forces stretch the surface allowing blocks of material to slide down between paired faults. These linear grabens are termed fossae. This region of Mars had very active tectonism and volcanism, resulting in the huge volcanos like Arsia Mons and deep chasmata of Valles Marineris. Claritas Fossae was formed prior to the large lava flows of the Tharsis region. Orbit Number: 91852 Latitude: -35.0327 Longitude: 253.577 Instrument: VIS Captured: 2022-08-29 08:49 https://photojournal.jpl.nasa.gov/catalog/PIA25713
Located between the lava plains of Daedalia Planum and Solis Planum, Claritas Fossae is a graben filled highland. Graben are formed by tectonic activity, where extensional forces stretch the surface allowing blocks of material to slide down between paired faults. These linear grabens are termed fossae. This region of Mars had very active tectonism and volcanism, resulting in the huge volcanos like Arsia Mons and deep chasmata of Valles Marineris. Claritas Fossae was formed prior to the large lava flows of the Tharsis region. Orbit Number: 91733 Latitude: -42.0473 Longitude: 263.442 Instrument: VIS Captured: 2022-08-19 14:12 https://photojournal.jpl.nasa.gov/catalog/PIA25620
Located between the lava plains of Daedalia Planum and Solis Planum, Claritas Fossae is a graben filled highland. Graben are formed by tectonic activity, where extensional forces stretch the surface allowing blocks of material to slide down between paired faults. These linear grabens are termed fossae. This region of Mars had very active tectonism and volcanism, resulting in the huge volcanos like Arsia Mons and deep chasmata of Valles Marineris. Claritas Fossae was formed prior to the large lava flows of the Tharsis region. Orbit Number: 92825 Latitude: -36.7944 Longitude: 262.701 Instrument: VIS Captured: 2022-11-17 11:37 https://photojournal.jpl.nasa.gov/catalog/PIA25801

These banana-shaped loops are part of a computer-generated snapshot of our sun's magnetic field. The solar magnetic-field lines loop through the sun's corona, break through the sun's surface, and cornect regions of magnetic activity, such as sunspots. This image --part of a magnetic-field study of the sun by NASA's Allen Gary -- shows the outer portion (skins) of interconnecting systems of hot (2 million degrees Kelvin) coronal loops within and between two active magnetic regions on opposite sides of the sun's equator. The diameter of these coronal loops at their foot points is approximately the same size as the Earth's radius (about 6,000 kilometers).
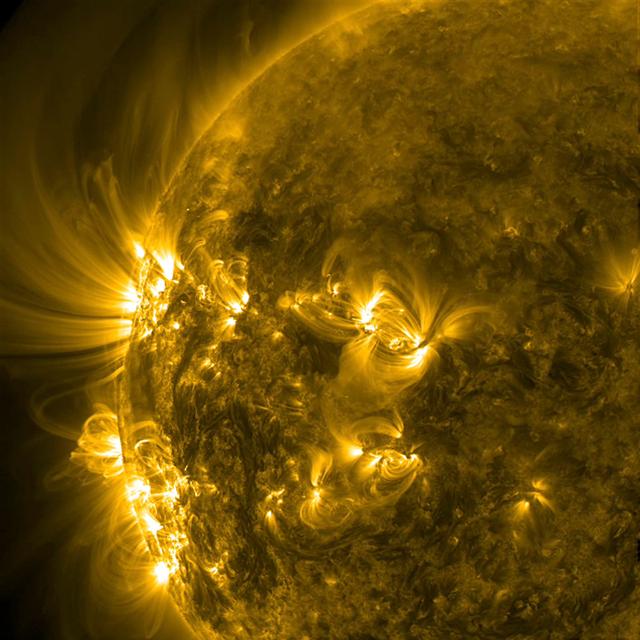
Magnetic arcs of solar material spewing from our favorite sphere of hot plasma, the sun. Magnetic arcs of solar material held their shapes fairly well as they spiraled above two solar active regions over 18 hours on Jan. 11-12, 2017. The charged solar material, called plasma, traces out the magnetic field lines above the active regions when viewed in wavelengths of extreme ultraviolet light, captured here by NASA’s Solar Dynamics Observatory. Extreme ultraviolet light is typically invisible to our eyes, but is colorized here in gold for easy viewing. Credit: NASA/SDO
Located between the lava plains of Daedalia Planum and Solis Planum, Claritas Fossae is a graben filled highland. Graben are formed by tectonic activity, where extensional forces stretch the surface allowing blocks of material to slide down between paired faults. These linear grabens are termed fossae. This region of Mars had very active tectonism and volcanism, resulting in the huge volcanos like Arsia Mons and deep chasmata of Valles Marineris. Claritas Fossae was formed prior to the large lava flows of the Tharsis region. Orbit Number: 91446 Latitude: -36.8955 Longitude: 262.397 Instrument: VIS Captured: 2022-07-26 23:05 https://photojournal.jpl.nasa.gov/catalog/PIA25572