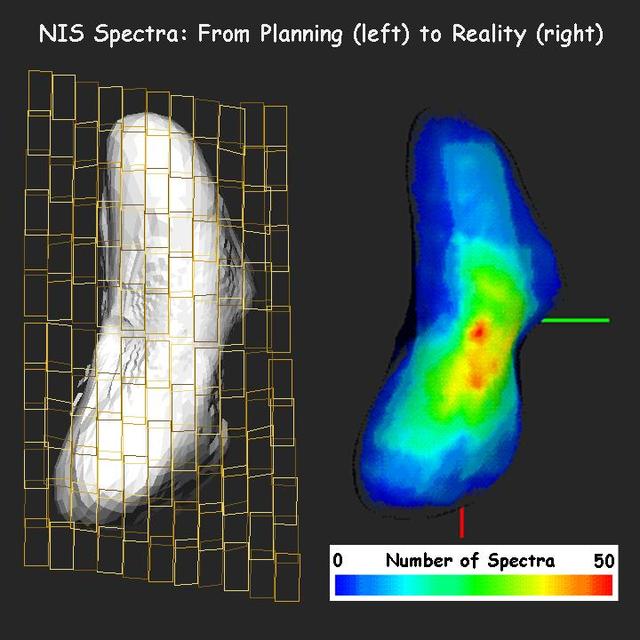
NEAR: From Planning to Data Analysis
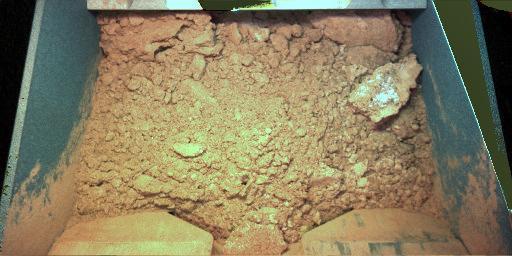
Martian Soil Ready for Robotic Laboratory Analysis
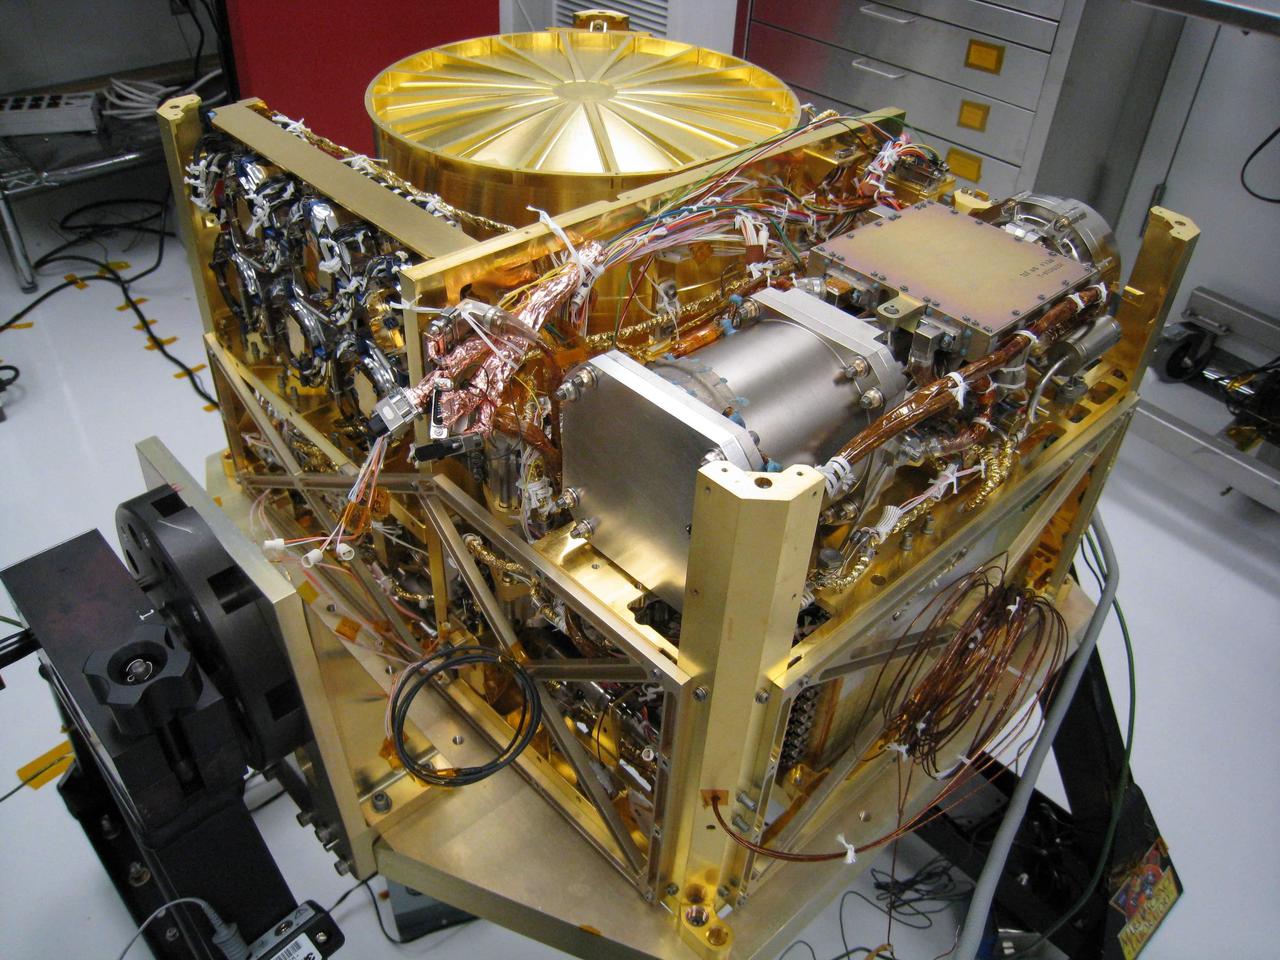
The Sample Analysis at Mars SAM instrument will analyze samples of Martian rock and soil collected by the rover arm to assess carbon chemistry through a search for organic compounds, and to look for clues about planetary change.
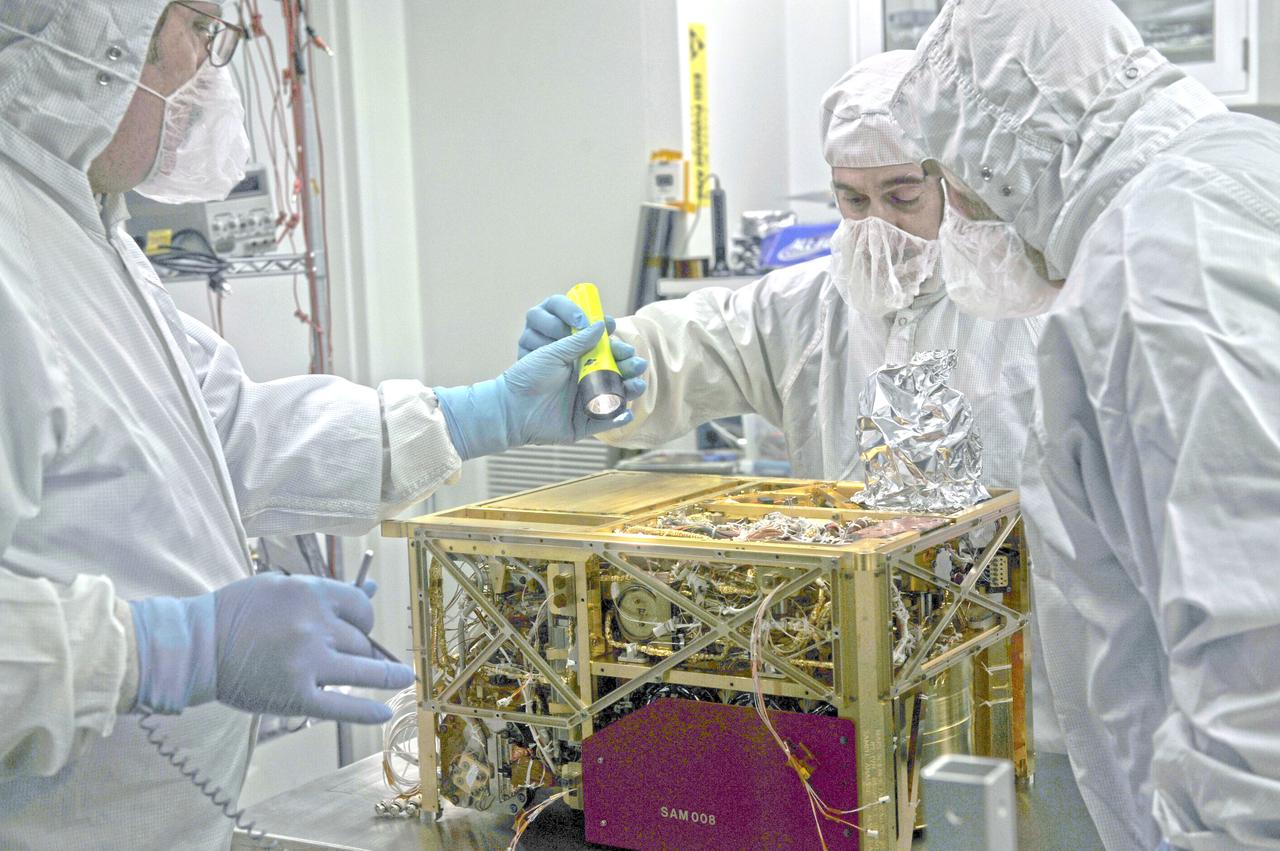
On Saturday, November 26, NASA is scheduled to launch the Mars Science Laboratory (MSL) mission featuring Curiosity, the largest and most advanced rover ever sent to the Red Planet. The Curiosity rover bristles with multiple cameras and instruments, including Goddard's Sample Analysis at Mars (SAM) instrument suite. By looking for evidence of water, carbon, and other important building blocks of life in the Martian soil and atmosphere, SAM will help discover whether Mars ever had the potential to support life. Curiosity will be delivered to Gale crater, a 96-mile-wide crater that contains a record of environmental changes in its sedimentary rock, in August 2012. ----- NASA image November 18, 2010 The Sample Analysis at Mars (SAM) instrument is considered one of the most complicated instruments ever to land on the surface of another planet. Equipped with a gas chromatograph, a quadruple mass spectrometer, and a tunable laser spectrometer, SAM will carry out the initial search for organic compounds when the Mars Science Laboratory (MSL) rover lands in 2012. Credit: NASA/GSFC/Ed Campion <b><a href="http://www.nasa.gov/audience/formedia/features/MP_Photo_Guidelines.html" rel="nofollow">NASA image use policy.</a></b> <b><a href="http://www.nasa.gov/centers/goddard/home/index.html" rel="nofollow">NASA Goddard Space Flight Center</a></b> enables NASA’s mission through four scientific endeavors: Earth Science, Heliophysics, Solar System Exploration, and Astrophysics. Goddard plays a leading role in NASA’s accomplishments by contributing compelling scientific knowledge to advance the Agency’s mission. <b>Follow us on <a href="http://twitter.com/NASA_GoddardPix" rel="nofollow">Twitter</a></b> <b>Like us on <a href="http://www.facebook.com/pages/Greenbelt-MD/NASA-Goddard/395013845897?ref=tsd" rel="nofollow">Facebook</a></b> <b>Find us on <a href="http://instagrid.me/nasagoddard/?vm=grid" rel="nofollow">Instagram</a></b>
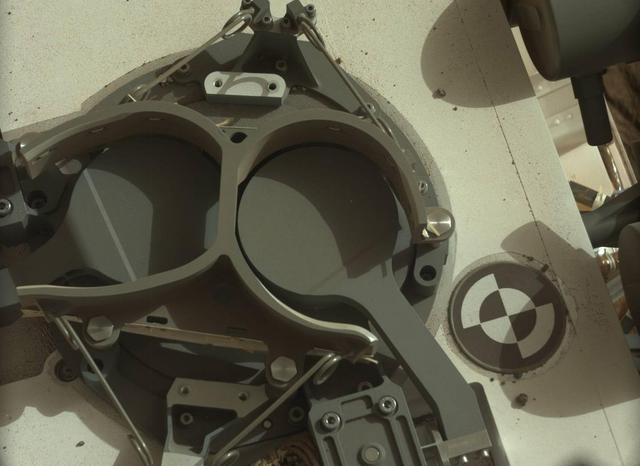
This subframe image from the left Mastcam on NASA Mars rover Curiosity shows the covers in place over two sample inlet funnels of the rover Sample Analysis at Mars SAM instrument suite.
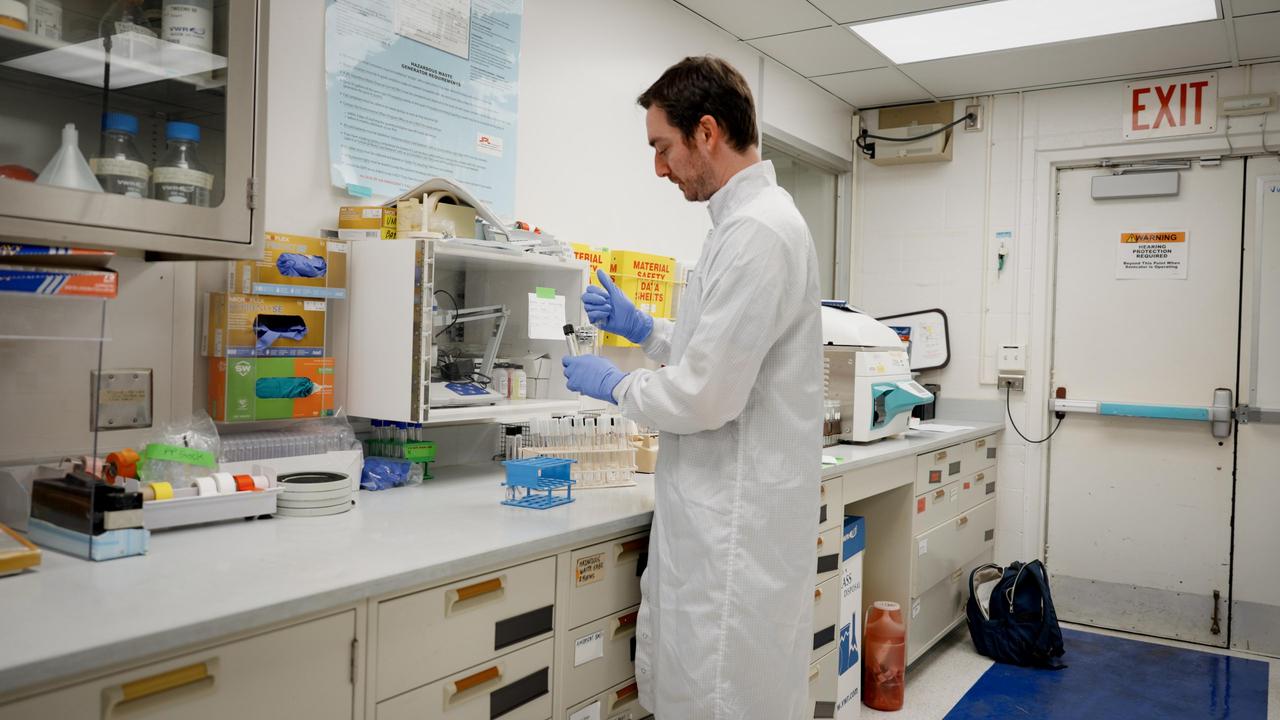
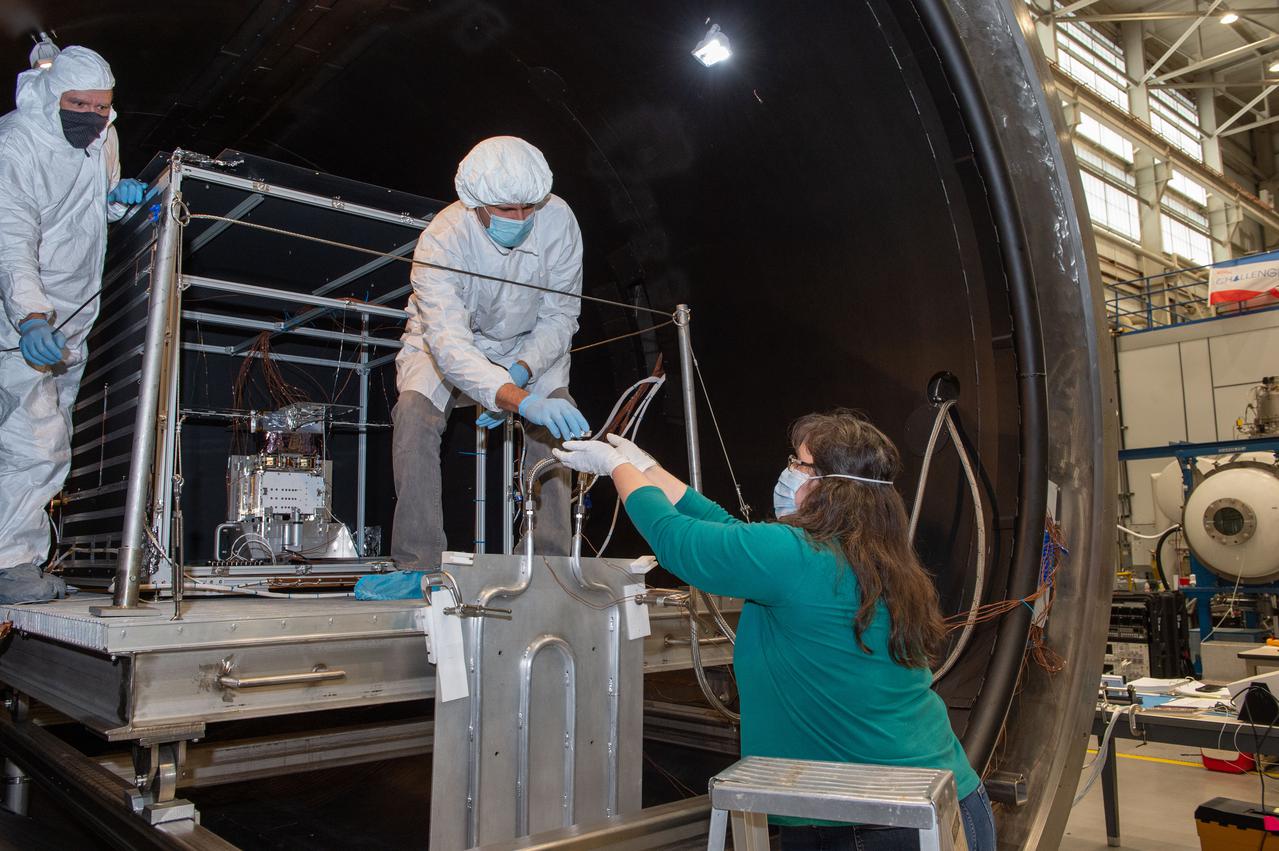
A planetary protection engineer at NASA's Jet Propulsion Laboratory prepares samples for analysis on March 20, 2024. The samples, swabbed from the surfaces of the agency's Europa Clipper spacecraft during its construction, were collected to help monitor the mission's adherence to strict standards for biological cleanliness. Created in keeping with the international 1967 Outer Space Treaty, the mission's planetary protection protocols are designed to minimize the chance that microbes brought from Earth could compromise future scientific investigations at its target destination: Jupiter's icy moon Europa. Europa Clipper's three main science objectives are to determine the thickness of the moon's icy shell and its interactions with the ocean below, to investigate its composition, and to characterize its geology. The mission's detailed exploration of Europa will help scientists better understand the astrobiological potential for habitable worlds beyond our planet. https://photojournal.jpl.nasa.gov/catalog/PIA26441
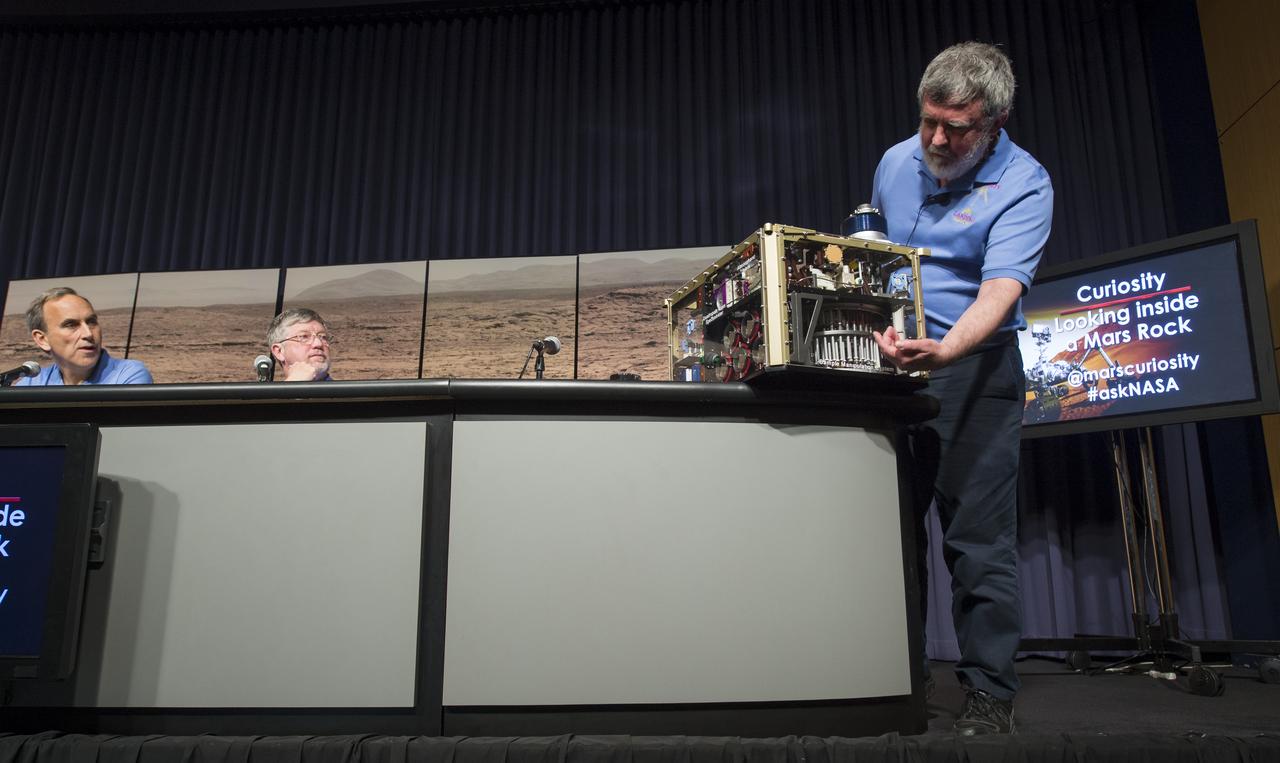
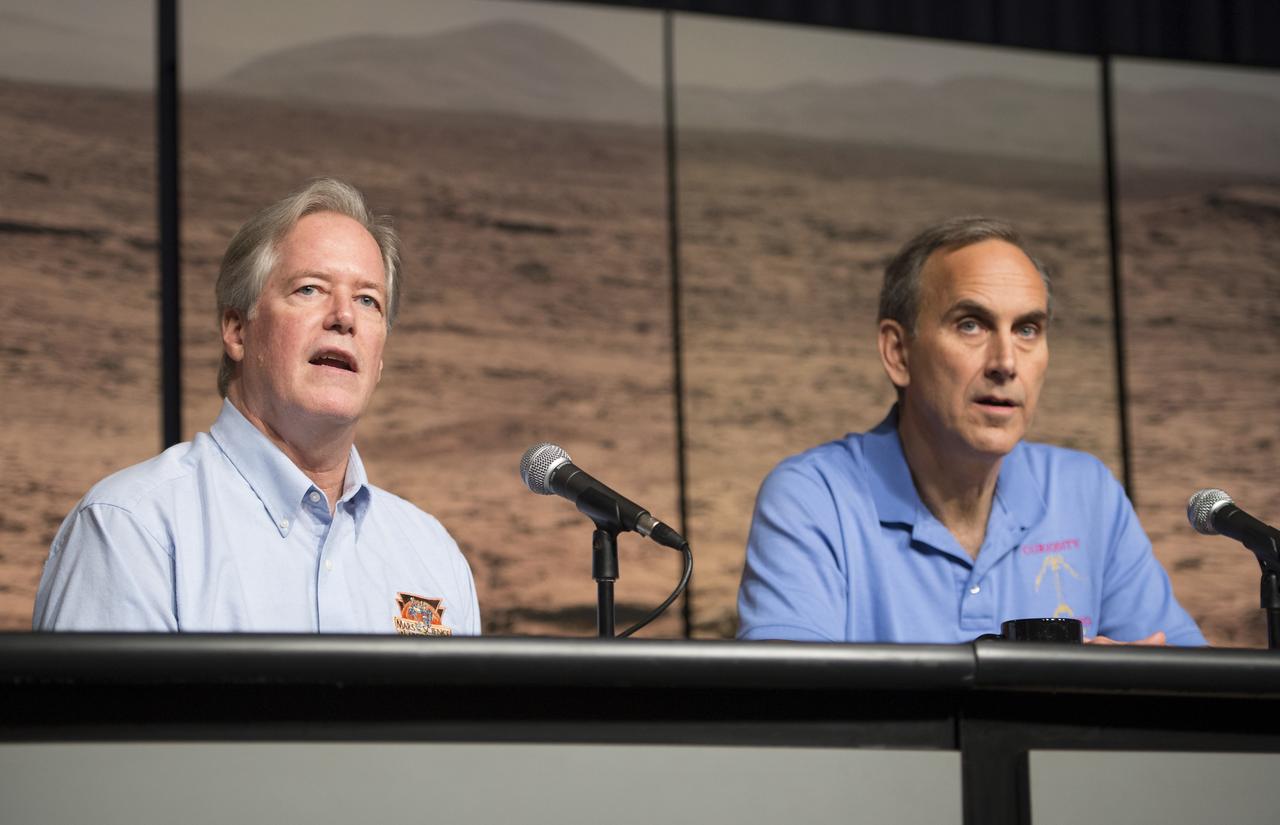
Paul Mahaffy (right), principal investigator for Curiosity's Sample Analysis at Mars (SAM) investigation at NASA's Goddard Space Flight Center in Maryland, demonstrates how the SAM instrument drilled and captured rock samples on the surface of Mars at a news conference, Tuesday, March 12, 2013 at NASA Headquarters in Washington. The analysis of the rock sample collected shows ancient Mars could have supported living microbes. Photo Credit: (NASA/Carla Cioffi)
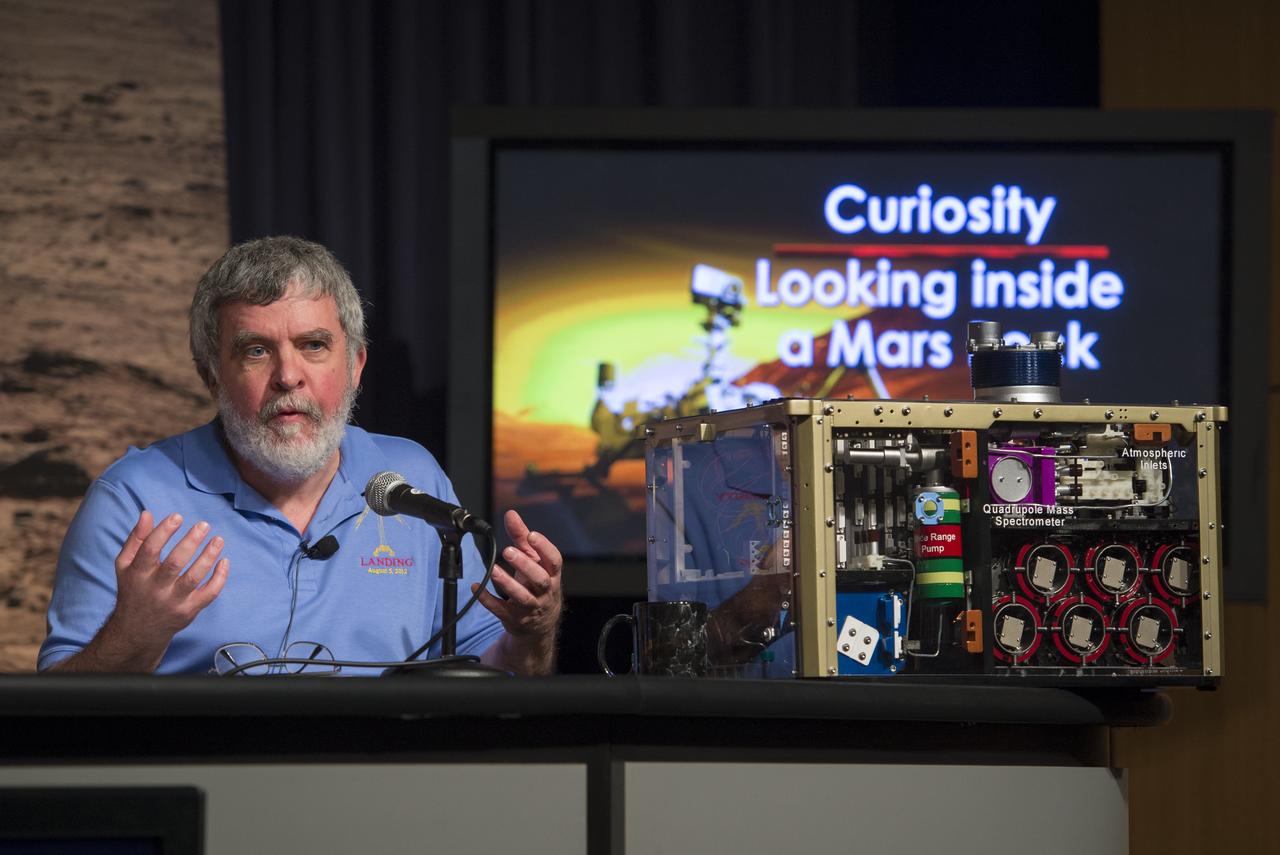
Paul Mahaffy, principal investigator for Curiosity's Sample Analysis at Mars (SAM) investigation at NASA's Goddard Space Flight Center in Maryland, answer's a reporters question at a news conference, Tuesday, March 12, 2013 at NASA Headquarters in Washington. The news conference covered the findings that the analysis of the rock sample collected shows ancient Mars could have supported living microbes. Photo Credit: (NASA/Carla Cioffi)

Jeff Thon, an SRB mechanic with United Space Alliance, is lowered into a mockup of a segment of a solid rocket booster. He is testing a technique for vertical SRB propellant grain inspection. The inspection of segments is required as part of safety analysis.
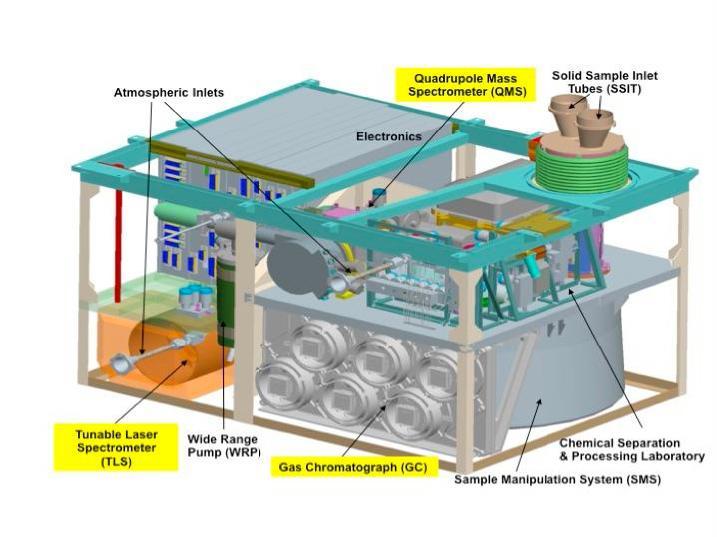
This schematic illustration for NASA Mars Science Laboratory Sample Analysis at Mars SAM instrument shows major components of the microwave-oven-size instrument, which will examine samples of Martian rocks, soil and atmosphere.
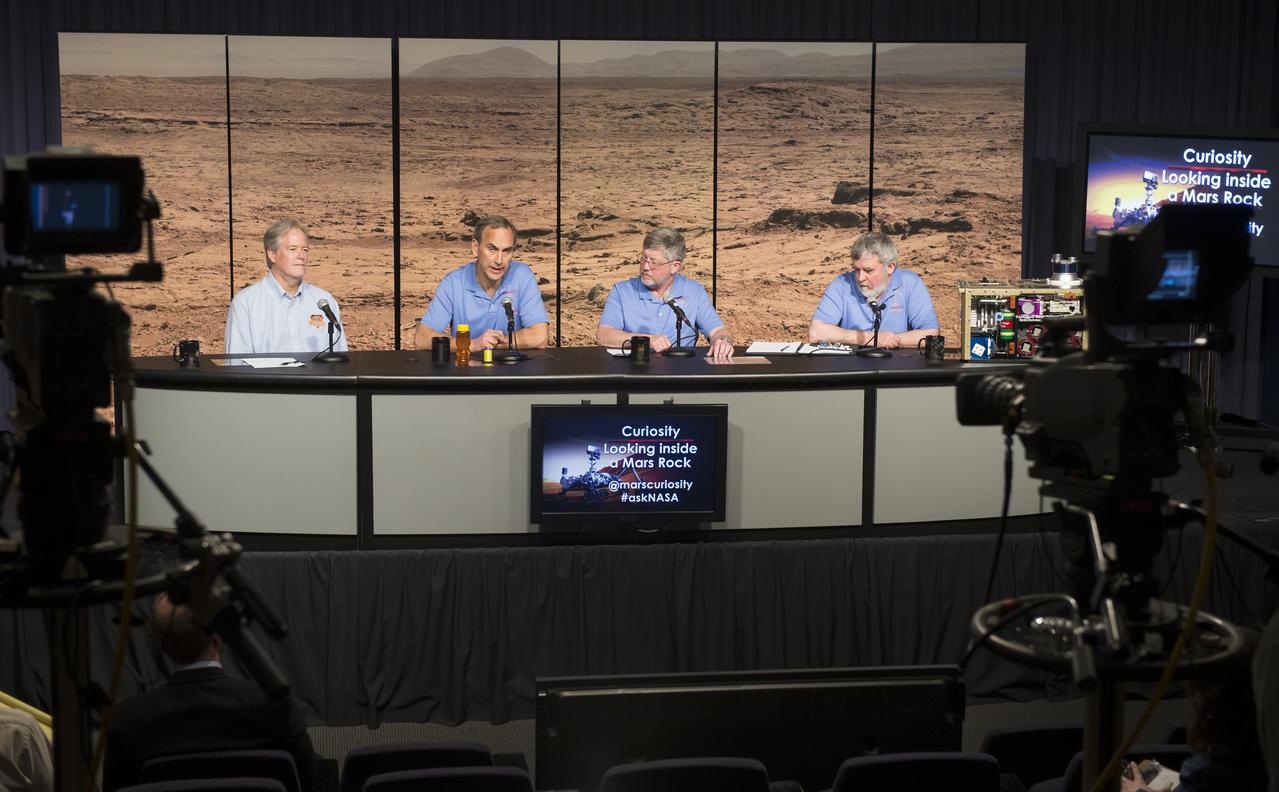
Participants at a news conference discussing findings of the analysis of a rock sample from Mars are seen, Tuesday, March 12, 2013 at NASA Headquarters in Washington. From left to right are seen: Michael Meyer, lead scientist, Mars Exploration Program at NASA Headquarters; John Grotzinger, Curiosity project scientist, California Institute of Technology in Pasadena; David Blake, principal investigator for Curiosity's Chemistry and Mineralogy investigation at NASA's Ames Research Center in Calif.; and Paul Mahaffy, principal investigator for Curiosity's Sample Analysis at Mars (SAM) investigation at NASA's Goddard Space Flight Center in Maryland. Photo Credit: (NASA/Carla Cioffi)

ISS019-E-005711 (9 April 2009) --- Japan Aerospace Exploration Agency (JAXA) astronaut Koichi Wakata, Expedition 19/20 flight engineer, is pictured near a microbial analysis packet floating freely in the Destiny laboratory of the International Space Station.
JOEY NORWOOD WITH VARIABLE ANGLE SPECTROSCOPIC ELLIPSOMETER (VASE) FOR THIN FILM ANALYSIS.
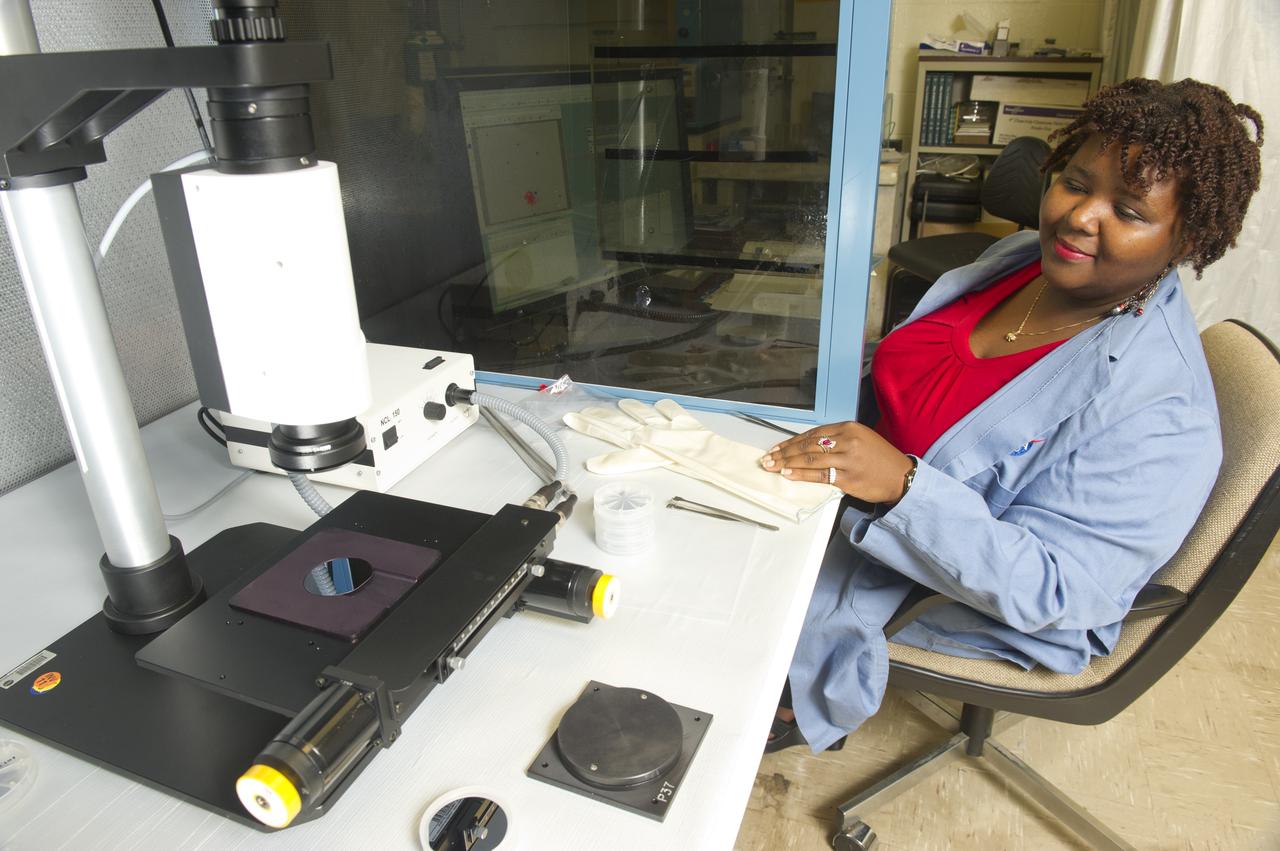
LAQUIETA HUEY WITH IMAGE ANALYSIS SYSTEM FOR AUTOMATED PARTICLE COUNTING.
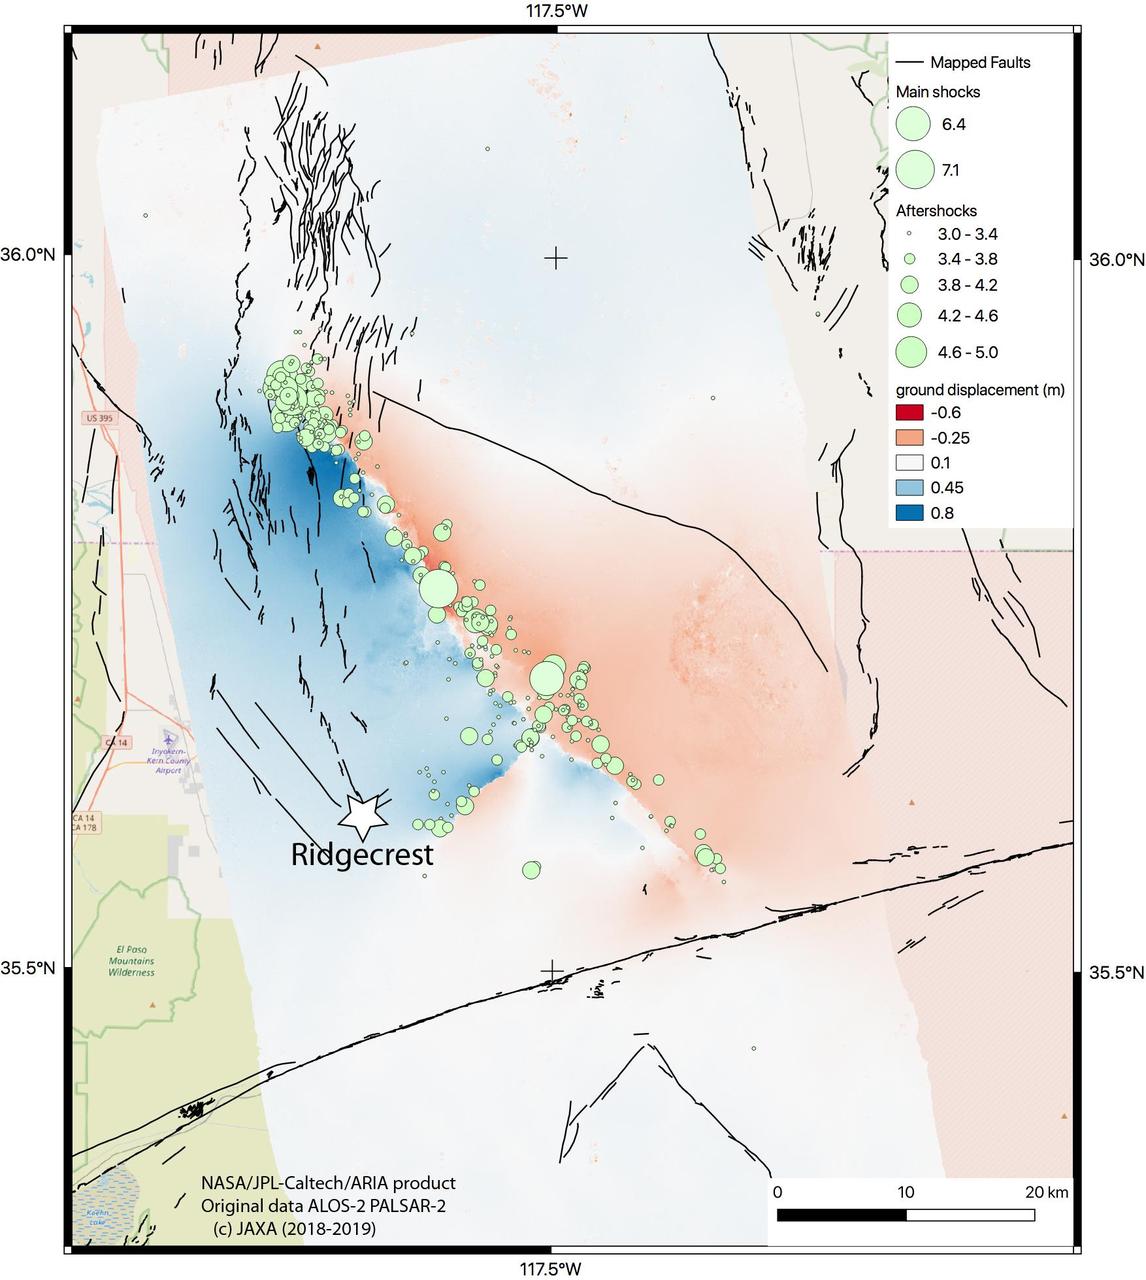
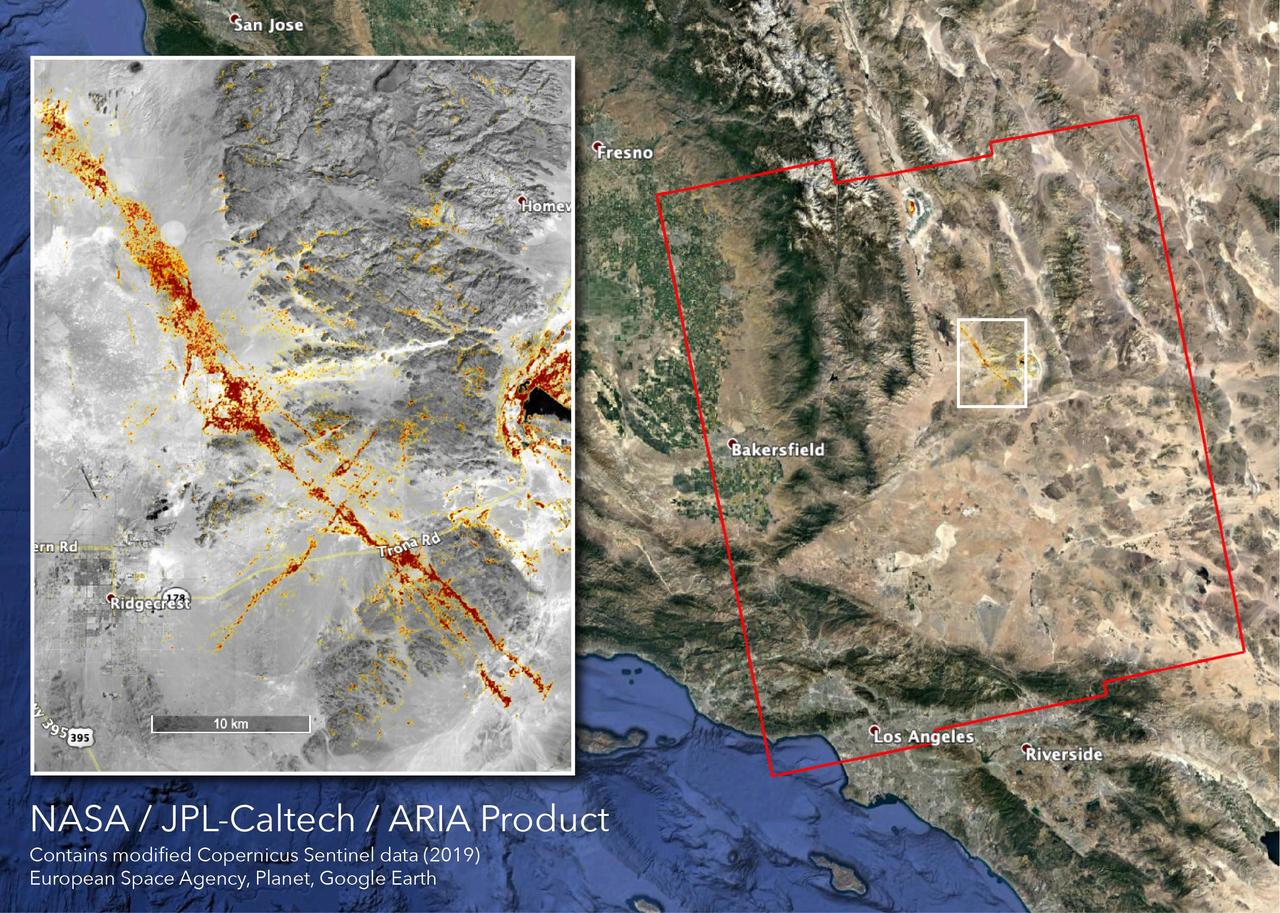
The Advanced Rapid Imaging and Analysis (ARIA) team at NASA's Jet Propulsion Laboratory in Pasadena, California, created this map of the Ridgecrest area of Southern California following two strong earthquakes — a magnitude 6.4 on July 4 and a magnitude 7.1 on July 5, 2019. The map shows how much and in what direction the ground moved in various places, displayed in meters. The blue tones show that the ground west of the main fault rupture, which runs from the lower right to the upper left, moved toward the northwest by as much as 0.8 meters (2.7 feet) during the 7.1-magnitude quake. The ground in the red and pink areas moved southeast by as much as 0.6 meters (2 feet). Black lines show faults that were mapped before the 2019 earthquakes. The 6.4-magnitude quake moved a shorter fault that runs perpendicular to the main fault — shown slightly down and to the left of center on the map. The colors in this area show that the north side of the fault moved to the west (blue) and the south side moved to the east (pink). The green circles correspond to aftershocks of a magnitude of 3.0 or higher, which were detected along both faults, between July 4 and July 9. The larger the circle, the stronger the aftershock. The ARIA team used interferometric synthetic aperture radar (InSAR) analysis of data from the ALOS-2 satellite, operated by the Japan Aerospace Exploration Agency (JAXA) to create the map. They used images captured before the quakes (on April 16, 2018) and after the quakes (on July 8, 2019) for this analysis. https://photojournal.jpl.nasa.gov/catalog/PIA23351
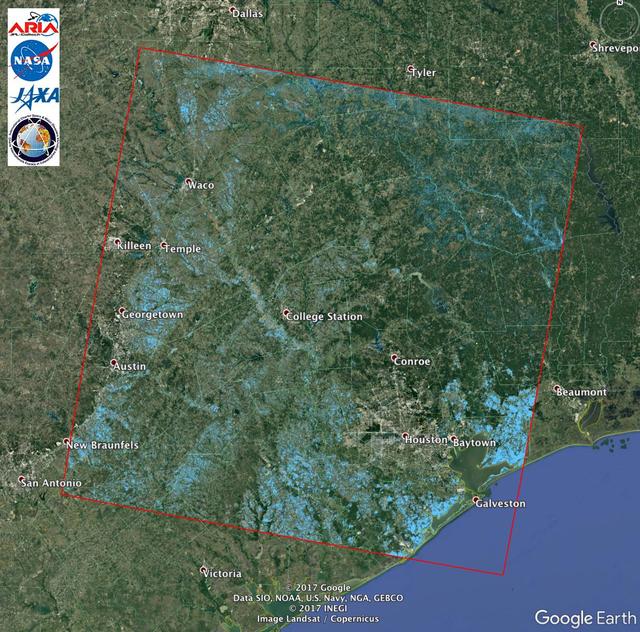
The Advanced Rapid Imaging and Analysis (ARIA) team at NASA's Jet Propulsion Laboratory in Pasadena, California, created this Flood Proxy Map depicting areas of Southeastern Texas that are likely flooded as a result of Hurricane Harvey, shown by light blue pixels. The map is derived from synthetic aperture radar amplitude images from the Japan Aerospace Exploration Agency's (JAXA) ALOS-2 PALSAR-2 satellite, taken before (July 30, 2017) and after (August 27, 2017) Hurricane Harvey made landfall. The map covers an area of 135 square miles (350 square kilometers). Each pixel measures about 538 square feet (50 square meters). Local ground observations provided anecdotal preliminary validation. This flood proxy map should be used as guidance to identify areas that are likely flooded, and may be less reliable over urban areas. ALOS-2 data were accessed through the International Charter. https://photojournal.jpl.nasa.gov/catalog/PIA21928
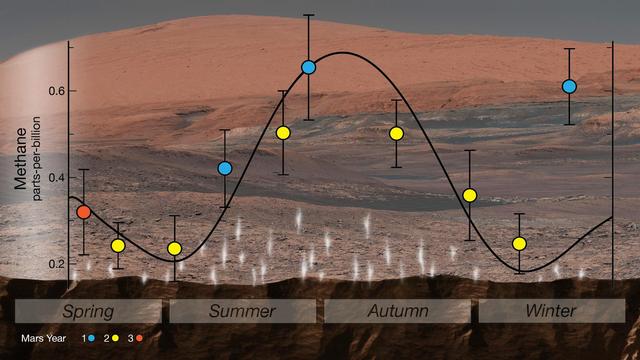
NASA's Curiosity rover used an instrument called SAM (Sample Analysis at Mars) to detect seasonal changes in atmospheric methane in Gale Crater. The methane signal has been observed for nearly three Martian years (nearly six Earth years), peaking each summer. https://photojournal.jpl.nasa.gov/catalog/PIA22328
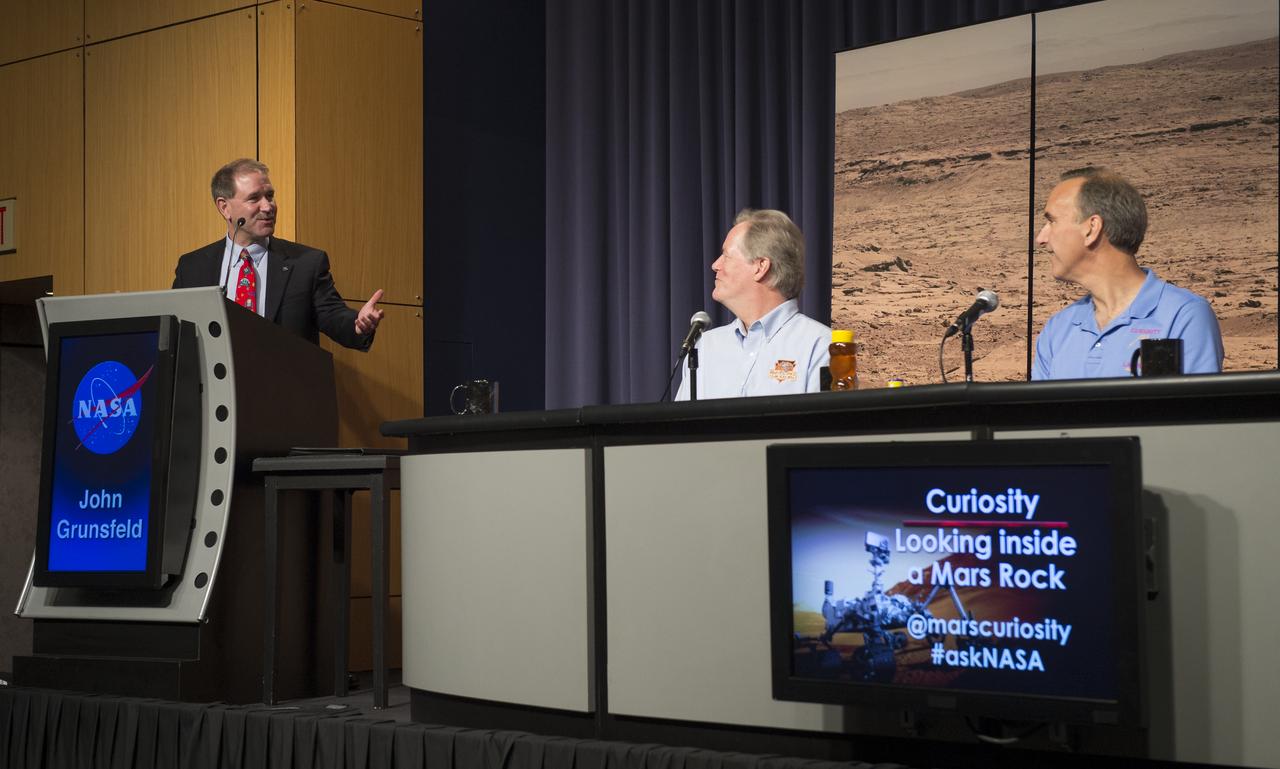
John Grunsfeld (at podium), Associate Administrator for the Science Mission Directorate at NASA Headquarters, asks one last question of the Mars Curiosity rover panel, Tuesday, March 12, 2013 in Washington. The news conference covered the findings that the analysis of the rock sample collected shows ancient Mars could have supported living microbes. Photo Credit: (NASA/Carla Cioffi)
Michael Meyer (left), lead scientist, Mars Exploration Program at NASA Headquarters, speaks at a news conference presenting findings of the Curiosity rover's analysis of the first sample of rock powder collected on Mars, Tuesday, March 12, 2013 in Washington. The rock sample collected shows ancient Mars could have supported living microbes. John Grotzinger, Curiosity project scientist, California Institute of Technology is seen on the right. Photo Credit: (NASA/Carla Cioffi)

David Blake, principal investigator for Curiosity's Chemistry and Mineralogy investigation at NASA's Ames Research Center in Calif., speaks at a news conference presenting findings of the Curiosity rover's analysis of the first sample of rock powder collected on Mars, Tuesday, March 12, 2013 in Washington. The rock sample collected shows ancient Mars could have supported living microbes. Photo Credit: (NASA/Carla Cioffi)

John Grotzinger (center), Curiosity project scientist, California Institute of Technology in Pasadena, speaks at a news conference presenting findings of the Curiosity rover's analysis of the first sample of rock powder collected on Mars, Tuesday, March 12, 2013 in Washington. The rock sample collected shows ancient Mars could have supported living microbes. Photo Credit: (NASA/Carla Cioffi)

John Grotzinger, Curiosity project scientist, California Institute of Technology in Pasadena, answers a reporter's question at a news conference where findings of the Curiosity rover's analysis of the first sample of rock powder collected on Mars were presented, Tuesday, March 12, 2013 in Washington. The rock sample collected shows ancient Mars could have supported living microbes. Photo Credit: (NASA/Carla Cioffi)

John Grotzinger (second from left), Curiosity project scientist, California Institute of Technology in Pasadena, speaks at a news conference presenting findings of the Curiosity rover's analysis of the first sample of rock powder collected on Mars, Tuesday, March 12, 2013 in Washington. The rock sample collected shows ancient Mars could have supported living microbes. Photo Credit: (NASA/Carla Cioffi)
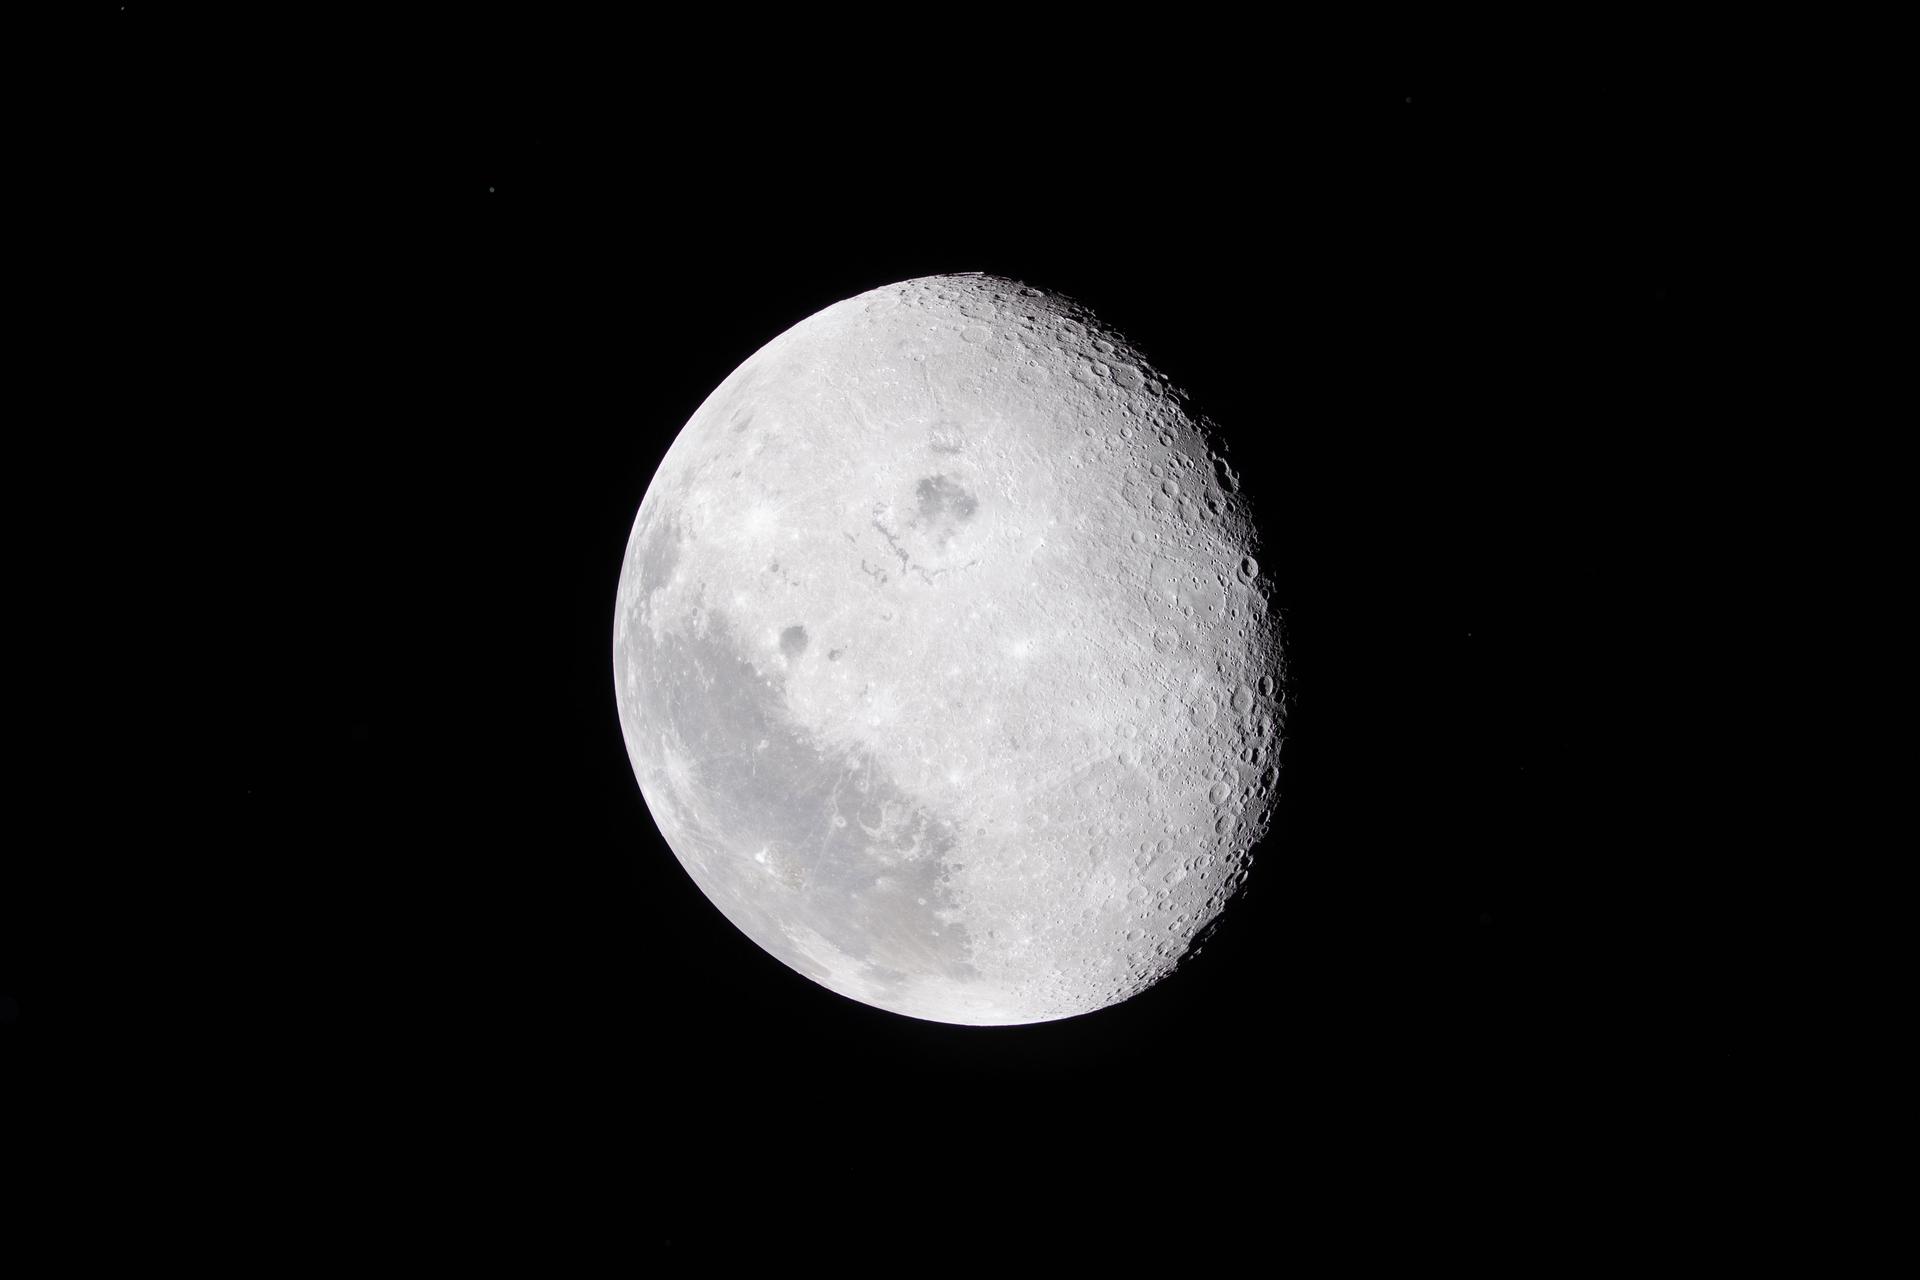
art002e009582 (April 6, 2026) – In this view, most of the Moon’s surface is illuminated as captured by the Artemis II crew during their flyby. To support scientific analysis, the lunar science team requested a series of images of the same scene using different exposure settings—including overexposed, underexposed, and standard images. Each variation highlights different aspects of the surface: brighter exposures can reveal faint features in shadowed regions, while darker exposures help preserve detail in highly reflective areas. Together, these images provide complementary data that allow scientists to better analyze the Moon’s surface composition, texture, and geologic features.
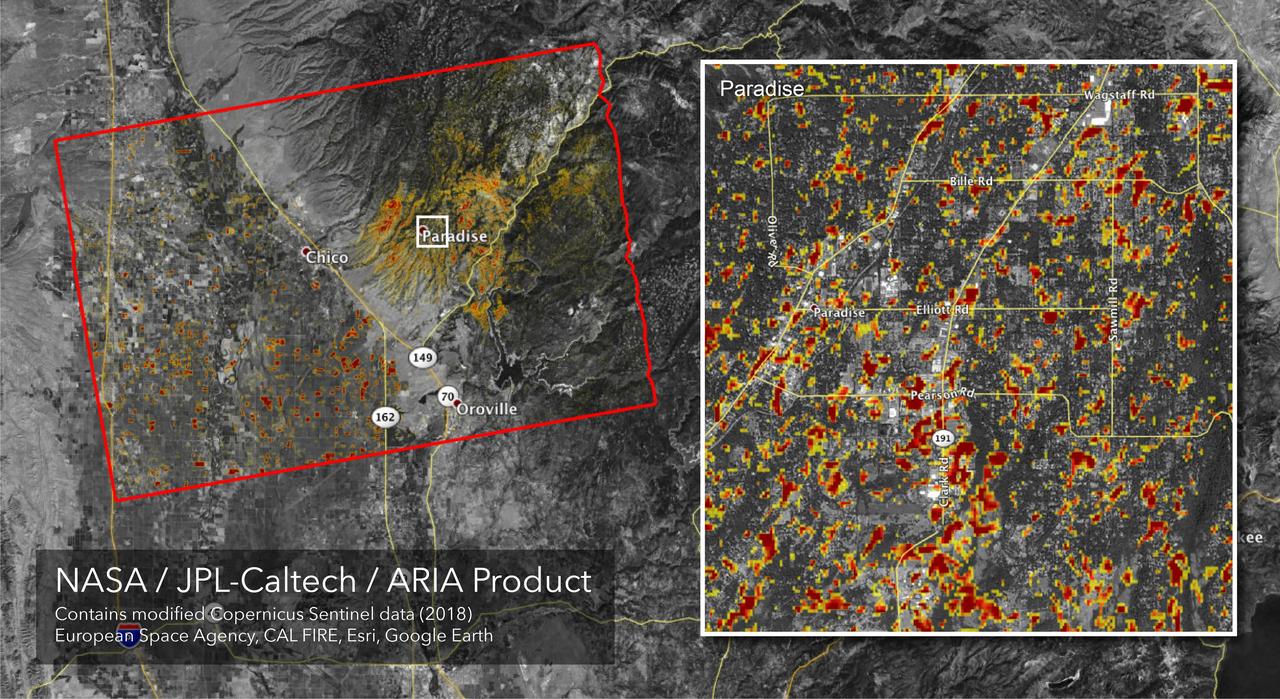
The Advanced Rapid Imaging and Analysis (ARIA) team at NASA's Jet Propulsion Laboratory in Pasadena, California, created this Damage Proxy Map (DPM) depicting areas of Northern California that are likely damaged (shown by red and yellow pixels) as a result of the Camp Fire. The map is derived from synthetic aperture radar (SAR) images from the Copernicus Sentinel-1 satellites, operated by the European Space Agency (ESA). The pre-event images were taken before (November 4, 2018) and the post-event image was acquired during the fire (6pm November 16, 2018, both local time). https://photojournal.jpl.nasa.gov/catalog/PIA22819
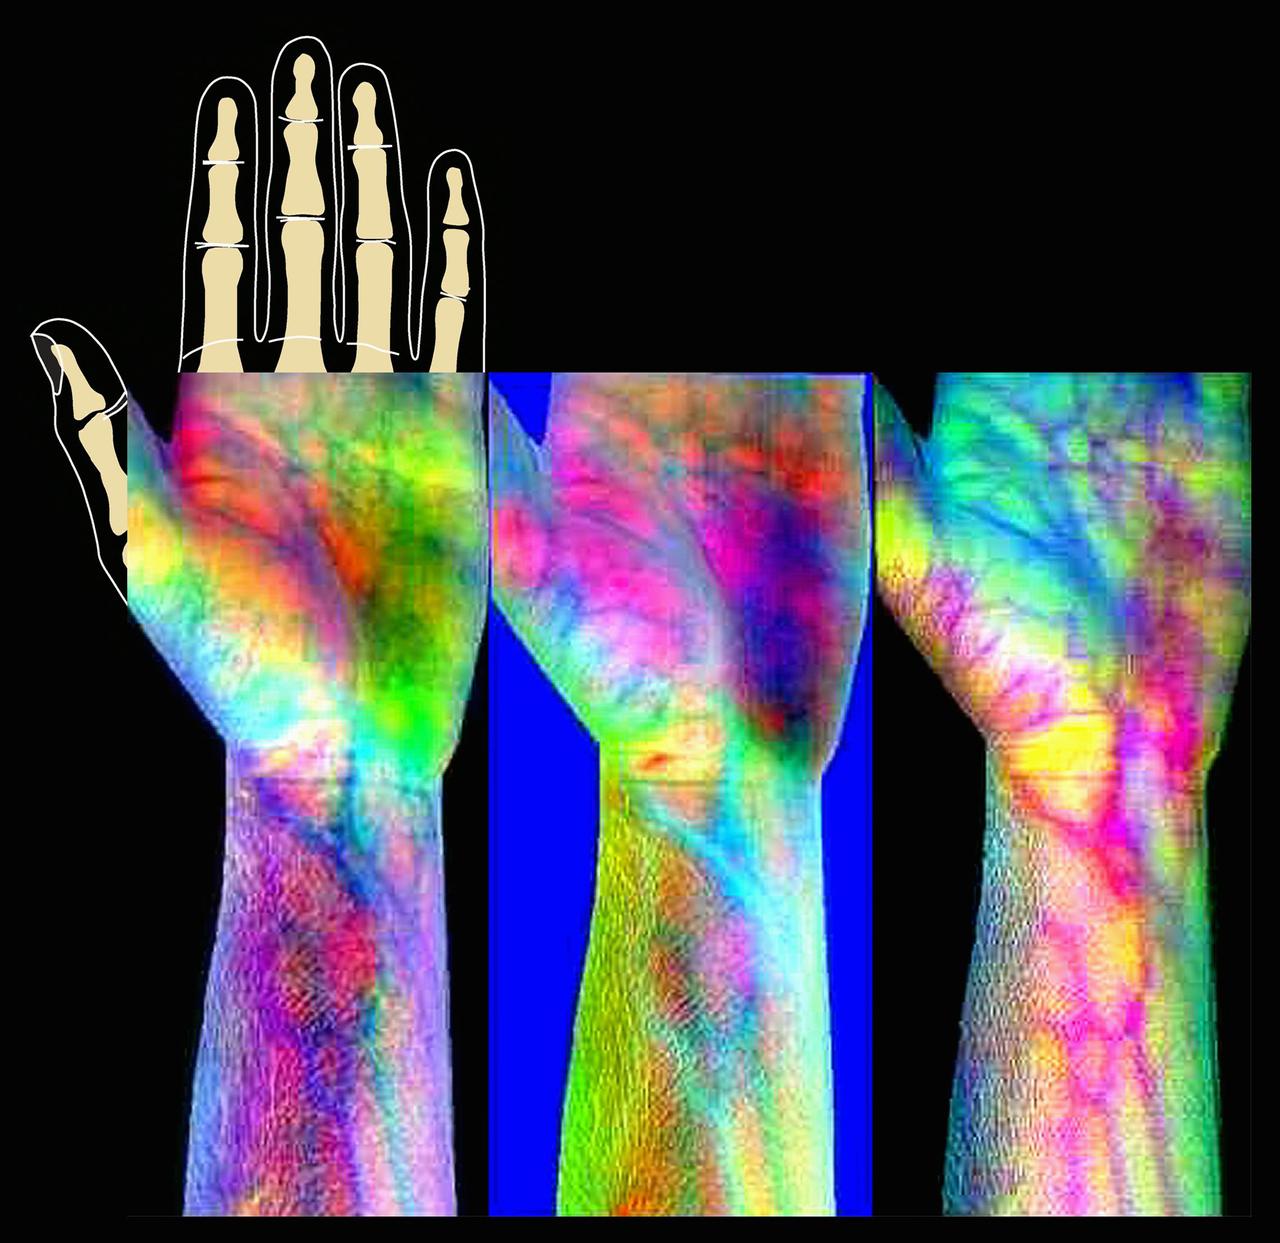
ProVision Technologies, a NASA research partnership center at Sternis Space Center in Mississippi, has developed a new hyperspectral imaging (HSI) system that is much smaller than the original large units used aboard remote sensing aircraft and satellites. The new apparatus is about the size of a breadbox. Health-related applications of HSI include non-invasive analysis of human skin to characterize wounds and wound healing rates (especially important for space travelers who heal more slowly), determining if burns are first-, second-, or third degree (rather than painful punch biopsies). The work is sponsored under NASA's Space Product Development (SPD) program.
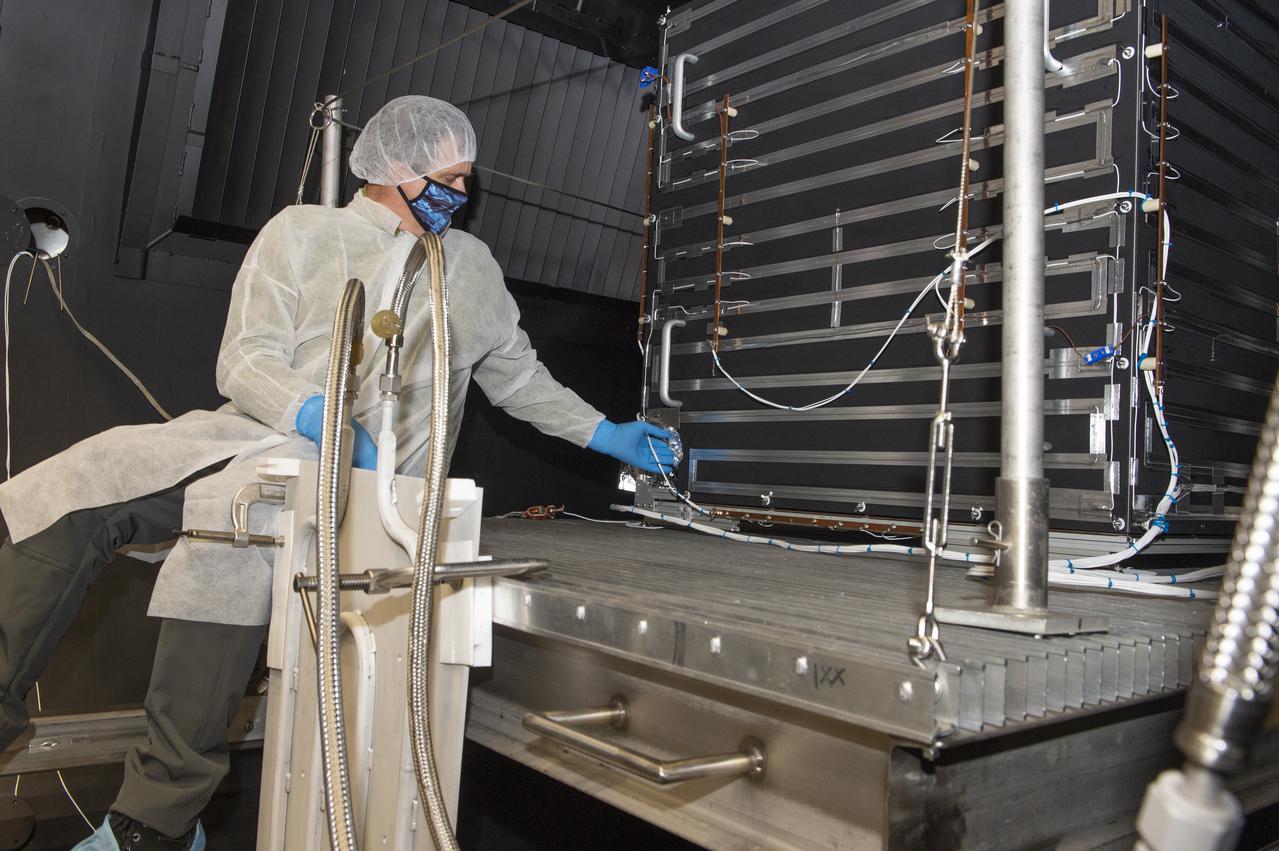
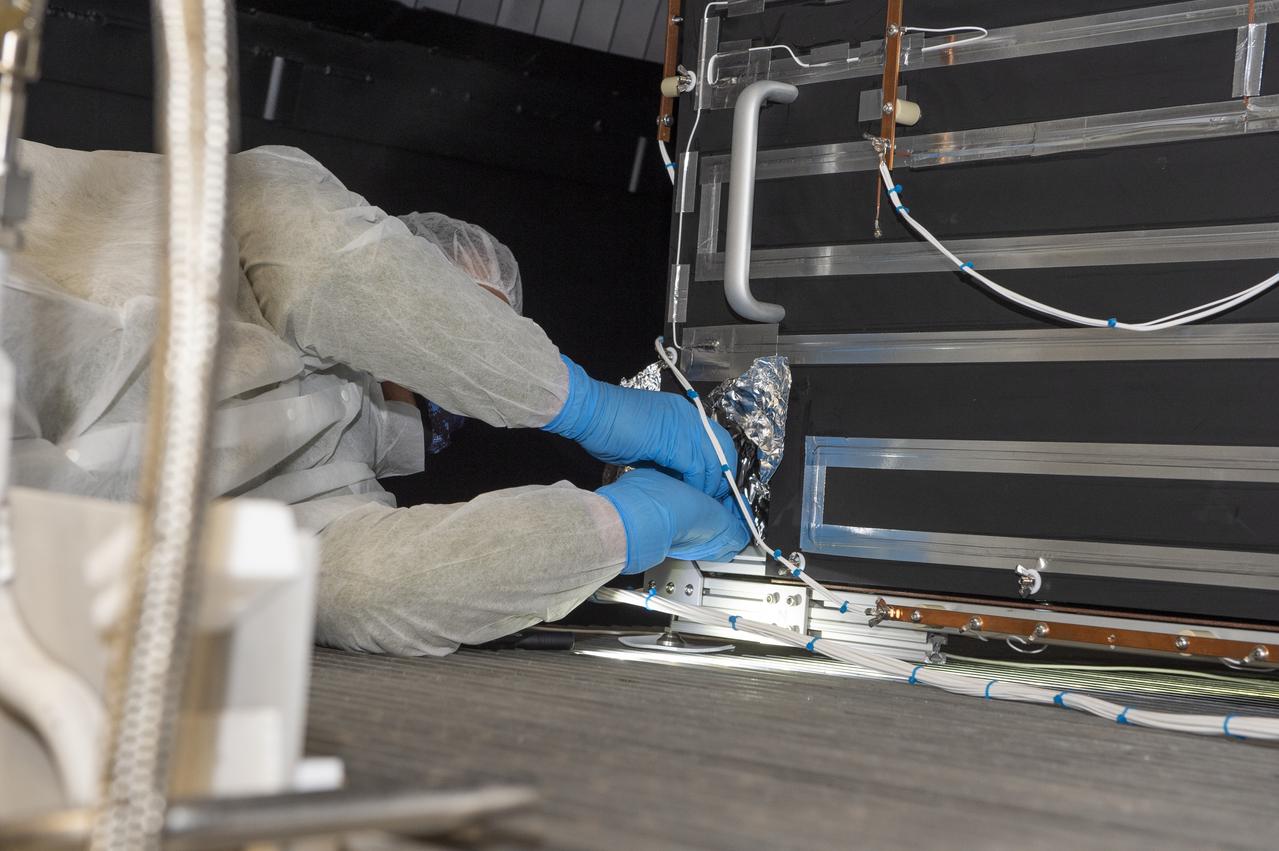
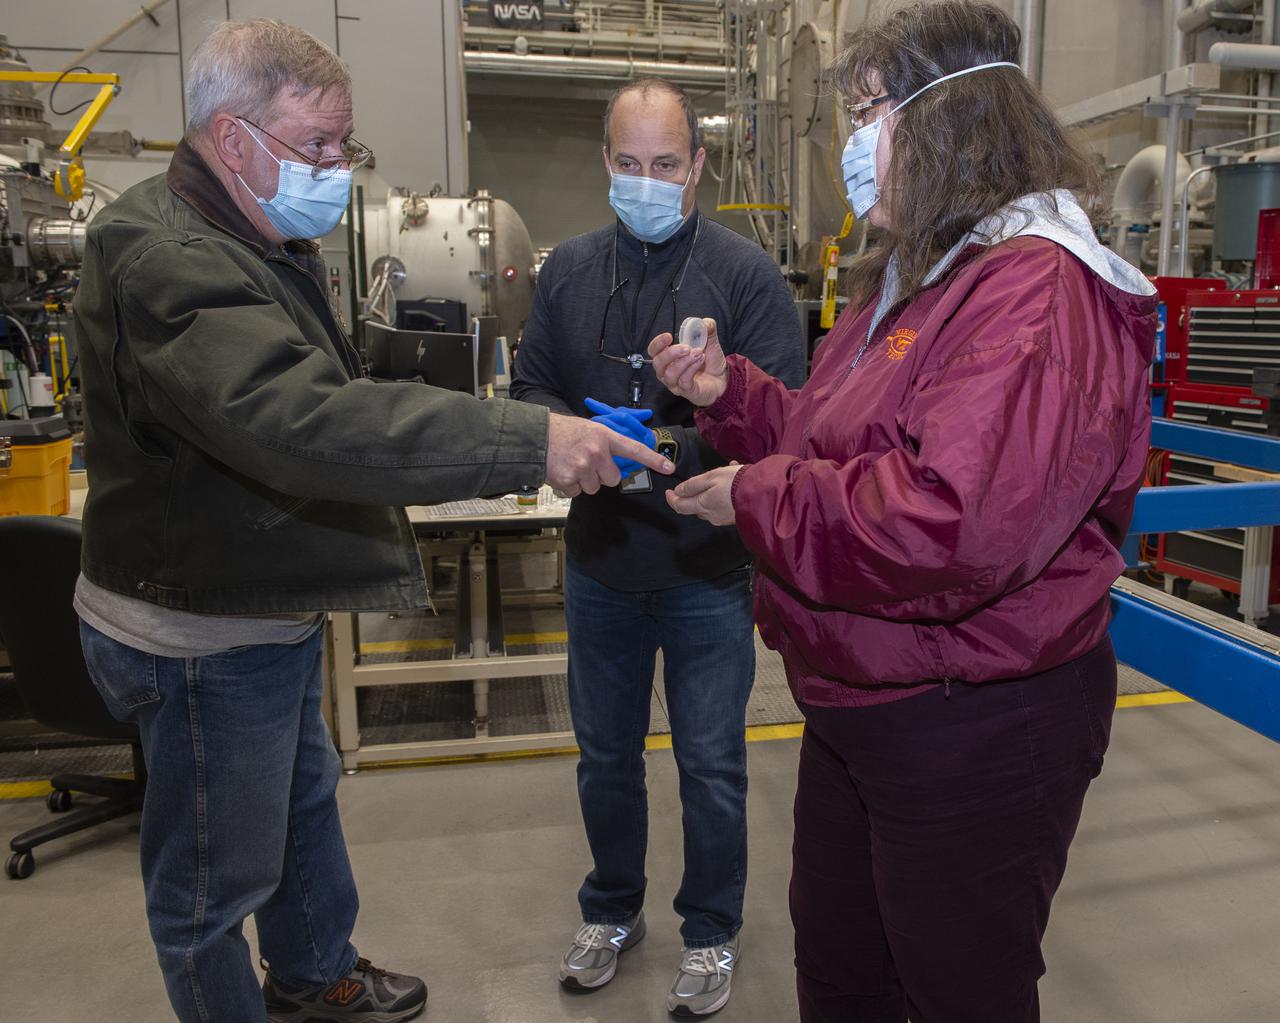
Miria Finckenor collects Optical Witness Samples and swab samples for analysis to verify that the NEA Scout thermal vacuum bake-out is complete and the chamber is clean.
NEA (Near Earth Asteroid) Scout Hot Box – Repress Chamber V-15 and removal of Optical Witness Samples, (OWS), for analysis
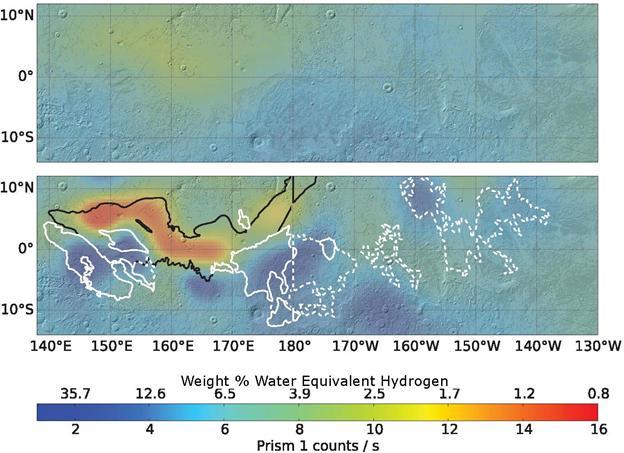
Re-analysis of 2002-2009 data from a hydrogen-finding instrument on NASA's Mars Odyssey orbiter increased the resolution of maps of hydrogen abundance. The reprocessed data (lower map) shows more "water-equivalent hydrogen" (darker blue) in some parts of this equatorial region of Mars. Puzzingly, this suggests the possible presence of water ice just beneath the surface near the equator, though it would not be thermodynamically stable there. The upper map uses raw data from Odyssey's neutron spectrometer instrument, which senses the energy state of neutrons coming from Mars, providing an indication of how much hydrogen is present in the top 3 feet (1 meter) of the surface. Hydrogen detected by Odyssey at high latitudes of Mars in 2002 was confirmed to be in the form of water ice by the follow-up NASA Phoenix Mars Lander mission in 2008. A 2017 reprocessing of the older data applied image-reconstruction techniques often used to reduce blurring from medical imaging data. The results are shown here for an area straddling the equator for about one-fourth the circumference of the planet, centered at 175 degrees west longitude. The white contours outline lobes of a formation called Medusae Fossae, coinciding with some areas of higher hydrogen abundance in the enhanced-resolution analysis. The black line indicates the limit of a relatively young lava plain, coinciding with areas of lower hydrogen abundance in the enhanced-resolution analysis. The color-coding key for hydrogen abundance in both maps is indicated by the horizontal bar, in units expressed as how much water would be present in the ground if the hydrogen is all in the form of water. Units of the equivalent water weight, as a percentage of the material in the ground, are correlated with counts recorded by the spectrometer, ranging from less than 1 weight-percent water equivalent (red) to more than 30 percent (dark blue). https://photojournal.jpl.nasa.gov/catalog/PIA21848
The Advanced Rapid Imaging and Analysis (ARIA) team at NASA's Jet Propulsion Laboratory in Pasadena, California, created this map depicting areas that are likely damaged as a result of the recent major earthquakes in Southern California. The color variation from yellow to red indicates increasingly more significant surface change, or damage. The map covers an area of 155 by 186 miles (250 by 300 kilometers), shown by the large red polygon. Each pixel measures about 33 yards (30 meters) across. To make the map, the team used synthetic aperture radar (SAR) images from the European Space Agency's Copernicus Sentinel-1 satellites from before and after the sequence of quakes — July 4, 2019 and July 10, 2019 respectively. The map may be less reliable over vegetated areas but can provide useful guidance in identifying damaged areas. https://photojournal.jpl.nasa.gov/catalog/PIA23354

The Advanced Rapid Imaging and Analysis (ARIA) team at NASA's Jet Propulsion Laboratory in Pasadena, California, created these flood proxy maps depicting areas of Mozambique that are likely flooded as a result of Cyclone Idai. The likely flooding zones are indicated by light blue pixels. The maps were derived from synthetic aperture radar (SAR) images from the ICEYE-X2 (March 18), Sentinel-1 (March 19, 20), and ALOS-2 (March 23) satellites operated by ICEYE (Finnish satellite manufacturer Every Square Meter, Every Hour), European Space Agency (ESA), and Japan Aerospace Exploration Agency (JAXA), respectively. The processed images were compared to each other for cross-validation. These flood proxy maps should be used as guidance to identify areas that are likely flooded, and may be less reliable over urban and vegetated areas. https://photojournal.jpl.nasa.gov/catalog/PIA23142
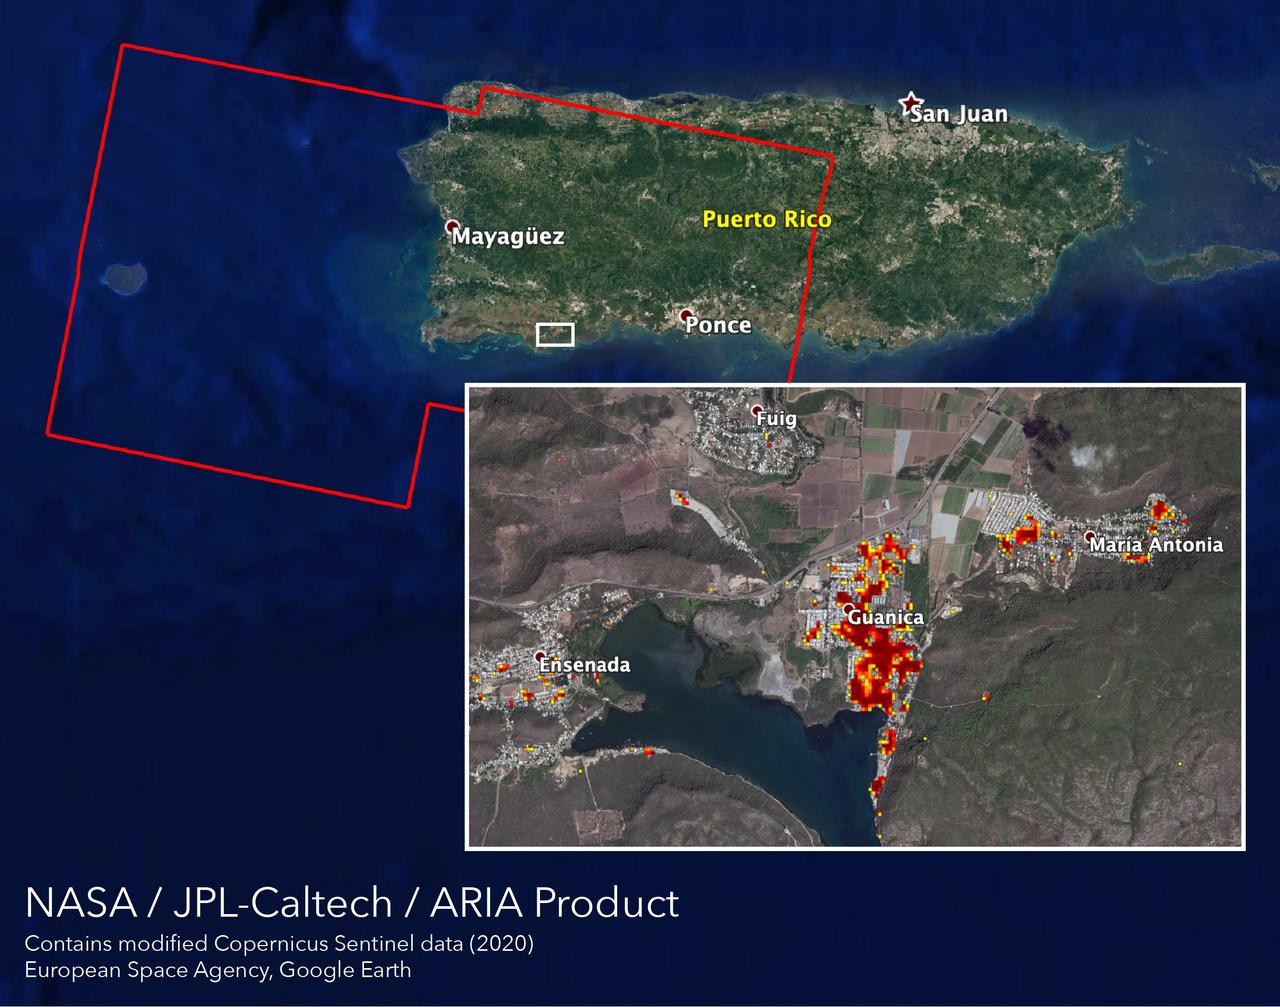
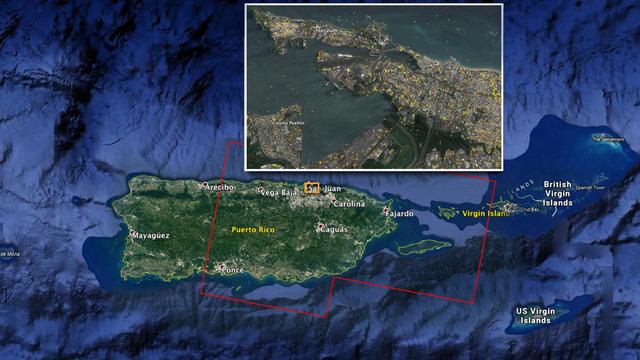
NASA scientists are helping local and federal agencies assess the extent of the damage in Puerto Rico following a 6.4-magnitude earthquake and hundreds of aftershocks. Using synthetic aperture radar data from the Copernicus Sentinel-1 satellites operated by the European Space Agency (ESA), the Advanced Rapid Imaging and Analysis (ARIA) team at NASA's Jet Propulsion Laboratory and Caltech in Pasadena, California created a new damage map that includes the southwestern coast near the main quake's epicenter. The ARIA team compared post-quake satellite data acquired on Jan. 14 with data as far back as Sept. 2019 to produce the map. The color variation from yellow to dark red indicates increasingly more significant damage. Their analysis shows that Guanica, west of the city of Ponce, was particularly hard hit. The map covers an area of 107 by 47 miles (172 by 76 kilometers), shown with the large red polygon, with each pixel measuring about 100 feet (30 meters) across. The data is most sensitive to building damage rather than small scale changes or partial structural damage. It is also less reliable over heavy vegetation. Even with these limitations, the map can still serve an important role in identifying the areas that may need help the most. The map contains modified Copernicus Sentinel data processed by ESA and analyzed by ARIA team scientists at NASA JPL and Caltech. https://photojournal.jpl.nasa.gov/catalog/PIA23429
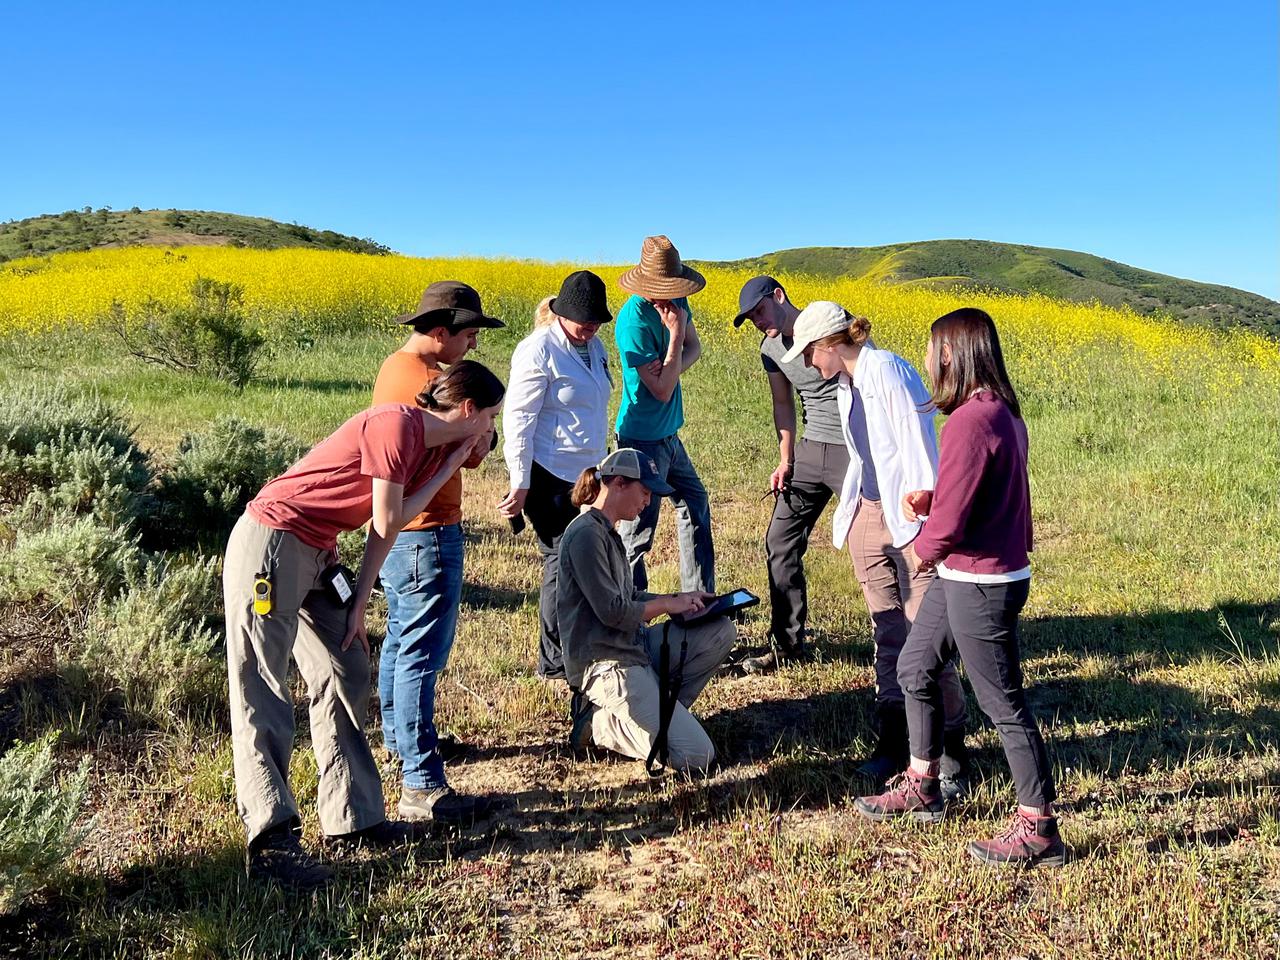
Dana Chadwick, a scientist in the water and ecosystems group at NASA's Jet Propulsion Laboratory, center, advises a field team of researchers from JPL; University of Wisconsin, Madison (UWM); University of California, Los Angeles (UCLA); University of Maryland, Baltimore County (UMBC); and University of California, Santa Barbara (UCSB) on vegetation-sampling locations at the Jack and Laura Dangermond Preserve in Santa Barbara County, California, on March 24, 2022. Chadwick and the team are working on the Surface Biology and Geology High-Frequency Time Series (SHIFT) campaign, which is jointly led by JPL, UCSB, and The Nature Conservancy. Chadwick is surrounded by, from left: Natalie Queally, a forest and wildlife ecology graduate student at UWM; Francisco Ochoa, a geography graduate student at UCLA; Petya Campbell, a research associate professor at UMBC and a research associate at NASA's Goddard Space Flight Center; Brendan Heberlein, a research intern at UWM; Renato Braghiere, a postdoctoral research scientist at JPL; Cassandra Nickles, a postdoctoral fellow at JPL; and Clare Saiki, a doctoral student at UCSB. Operating between late February and late May 2022, SHIFT combines the ability of airborne science instruments to gather data over widespread areas with the more concentrated observations scientists conduct in the field to study the functional characteristics, health, and resilience of plant communities. The sampling and analysis done by researchers on the ground and in the ocean is intended to validate data taken by AVIRIS-NG (Airborne Visible/Infrared Imaging Spectrometer-Next Generation). The instrument, designed at JPL, is collecting spectral data of vegetation it observes during weekly flights in an aircraft over a 640-square-mile (1,656-square-kilometer) study area in Santa Barbara County and coastal Pacific waters. The campaign is a pathfinder for NASA's proposed Surface Biology and Geology (SBG) mission. SHIFT will help scientists design data collection and processing algorithms for that mission, which would launch no earlier than 2028. The SHIFT data is also intended to support the research and conservation objectives of The Nature Conservancy, which owns the Dangermond Preserve, and UCSB, which operates the Sedgwick Reserve, another nature preserve within the study area. More than 60 scientists from institutions around the U.S. have indicated they intend to use the SHIFT data in their research. https://photojournal.jpl.nasa.gov/catalog/PIA25141
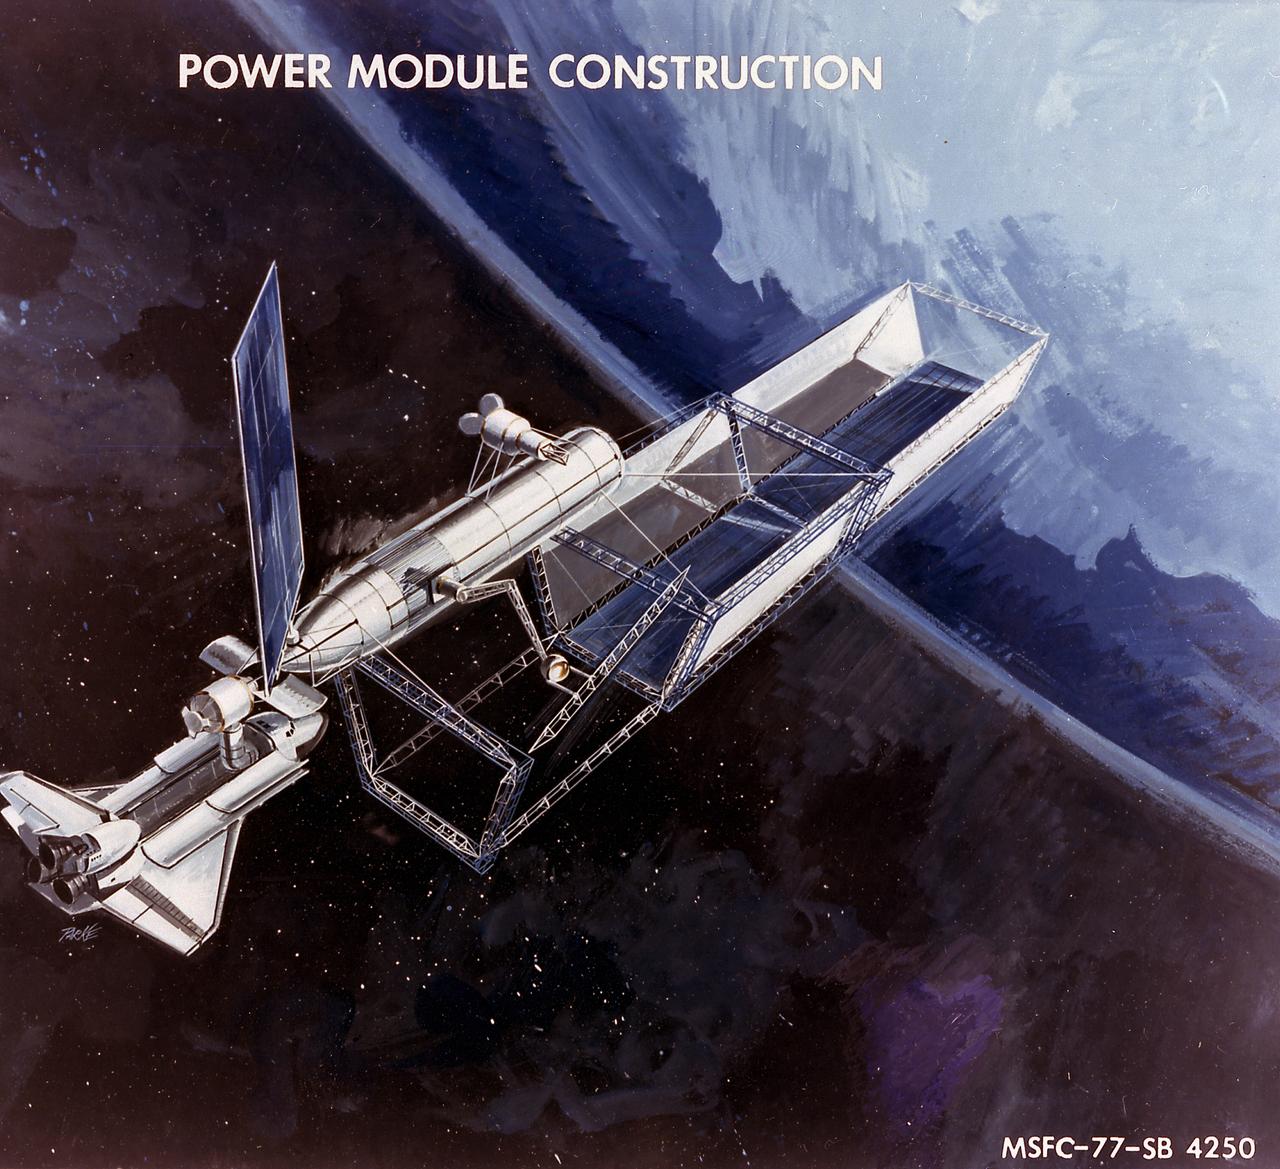
The Marshall Space Flight Center (MSFC) and the Johnson Space Center (JSC) were each awarded 16-month contracts in April 1976 for the Space Station Systems Analysis Study (SSSAS). Grumman Aerospace Corporation was MSFC's contractor and McDornell Douglas Aerospace Company was JSC's contractor. The goal of this study was to formulate plans for a permanent operational base and laboratory facility in Earth orbit in addition to developing a space construction base design for implementing the program. An expended Space Shuttle external tank was to be the central core platform of the base, and additional pressurized modules could be added to provide laboratory facilities. This artist's concept depicts a space construction base design for implementing the SSSAS.
NEA (Near Earth Asteroid) Scout Hot Box – Repress Chamber V-15 and removal of Optical Witness Samples, (OWS), for analysis
NEA (Near Earth Asteroid) Scout Hot Box – Repress Chamber V-15 and removal of Optical Witness Samples, (OWS), for analysis

NEA (Near Earth Asteroid) Scout Hot Box – Repress Chamber V-15 and removal of Optical Witness Samples, (OWS), for analysis
NEA (Near Earth Asteroid) Scout Hot Box – Repress Chamber V-15 and removal of Optical Witness Samples, (OWS), for analysis
NEA (Near Earth Asteroid) Scout Hot Box – Repress Chamber V-15 and removal of Optical Witness Samples, (OWS), for analysis
NEA (Near Earth Asteroid) Scout Hot Box – Repress Chamber V-15 and removal of Optical Witness Samples, (OWS), for analysis
NEA (Near Earth Asteroid) Scout Hot Box – Repress Chamber V-15 and removal of Optical Witness Samples, (OWS), for analysis
NEA (Near Earth Asteroid) Scout Hot Box – Repress Chamber V-15 and removal of Optical Witness Samples, (OWS), for analysis
NEA (Near Earth Asteroid) Scout Hot Box – Repress Chamber V-15 and removal of Optical Witness Samples, (OWS), for analysis

Typhoon Hagibis, one of the most destructive storms to hit Japan in decades, made landfall on Saturday, Oct. 12, 2019 southwest of Tokyo with wind speeds equivalent to a Category 3 hurricane. The damage it left in its wake is visible from space. NASA's Advance Rapid Imaging and Analysis (ARIA) team, in collaboration with the Earth Observatory of Singapore (EOS), used satellite data to create this map showing areas in Japan that are likely damaged as a result of Typhoon Hagibis. The color variation from yellow to red indicates increasingly more significant ground surface change, or damage. The map was produced using synthetic aperture radar (SAR) data from the Copernicus Sentinel-1 satellites operated by the European Space Agency (ESA). The pre-event images were taken on Oct. 7, 2019, and the post-event image was acquired about 12 hours after the typhoon's landfall. The map covers an area of 155 miles by 220 miles (250 kilometers by 350 kilometers) indicated by the red polygon. The map was delivered to Sentinel Asia, a consortium that supports disaster management across the Asia-Pacific region using space-based technologies. Maps like this one can be used as guidance to help responders identify damaged areas and to allocate resources accordingly. The map may be less reliable over vegetated or badly flooded areas. https://photojournal.jpl.nasa.gov/catalog/PIA23424
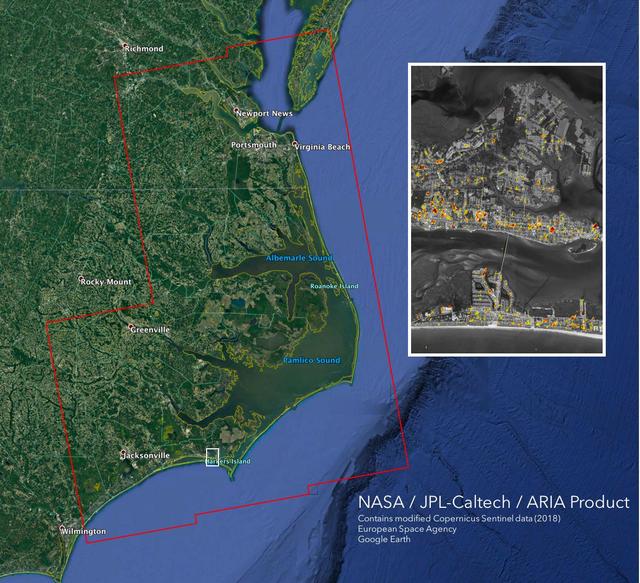
The Advanced Rapid Imaging and Analysis (ARIA) team at NASA's Jet Propulsion Laboratory in Pasadena, California, created this Damage Proxy Map (DPM) depicting areas of the Carolinas that are likely damaged (shown by red and yellow pixels) as a result of Hurricane Florence. The map is derived from synthetic aperture radar (SAR) images from the Copernicus Sentinel-1 satellites, operated by the European Space Agency (ESA). The images were taken before (September 02, 2016) and 12 hours after the hurricane's landfall (September 14, 2018 7:06 PM local time). The map covers an area of 155 miles x 210 miles (250 km x 340 km), indicated with the big red polygon. Each pixel measures about 33 yards x 33 yards (30 m x 30 m). The color variation from yellow to red indicates increasingly more significant ground surface change. Media reports provided anecdotal preliminary validation. This damage proxy map should be used as guidance to identify damaged areas, and may be less reliable over vegetated areas and flooded areas. For example, the scattered single colored pixels over vegetated areas may be false positives, and the lack of colored pixels over vegetated areas does not necessarily mean no damage. https://photojournal.jpl.nasa.gov/catalog/PIA22702
The Advanced Rapid Imaging and Analysis (ARIA) team at NASA's Jet Propulsion Laboratory in Pasadena, California, created this Flood Proxy Map depicting areas of the Carolinas that are likely flooded as a result of Hurricane Florence, shown by light blue pixels. The map is derived from synthetic aperture radar (SAR) images from the Copernicus Sentinel-1 satellites, operated by the European Space Agency (ESA). The images were taken before (September 09, 2018) and 36 hours after the hurricane's landfall (September 15, 2018 18:57 PM local time). The map covers an area of 53 miles x 152 miles (85 km x 245 km), indicated with the big red polygon. Each pixel measures about 33 yards x 33 yards (30 m x 30 m). Media reports provided anecdotal preliminary validation. This flood proxy map should be used as guidance to identify areas that are likely flooded and may be less reliable over urban and vegetated areas. https://photojournal.jpl.nasa.gov/catalog/PIA22704

The Advanced Rapid Imaging and Analysis (ARIA) team at NASA's Jet Propulsion Laboratory in Pasadena, California, in collaboration with the Earth Observatory of Singapore (EOS), created this flood map depicting areas of the Bahamas that are likely flooded (shown by light blue pixels) as a result of Hurricane Dorian. The map was derived from synthetic aperture radar (SAR) data acquired on Sept. 2, 2019, by the European Union's Copernicus Sentinel-1 satellites operated by the European Space Agency (ESA). The map covers an area of 109 miles by 106 miles (176 kilometers by 170 kilometers) shown by the large red polygon. Each pixel measures about 32 yards (30 meters) across. This map can be used as guidance to identify areas that are likely flooded, and may be less reliable over urban and vegetated areas. The image contains modified Copernicus Sentinel data (2019) processed by ESA and analyzed by NASA, JPL-Caltech, ARIA, and EOS. This work was funded by NASA along with the Earth Observatory of Singapore and a Singapore National Research Foundation Investigatorship. https://photojournal.jpl.nasa.gov/catalog/PIA23360
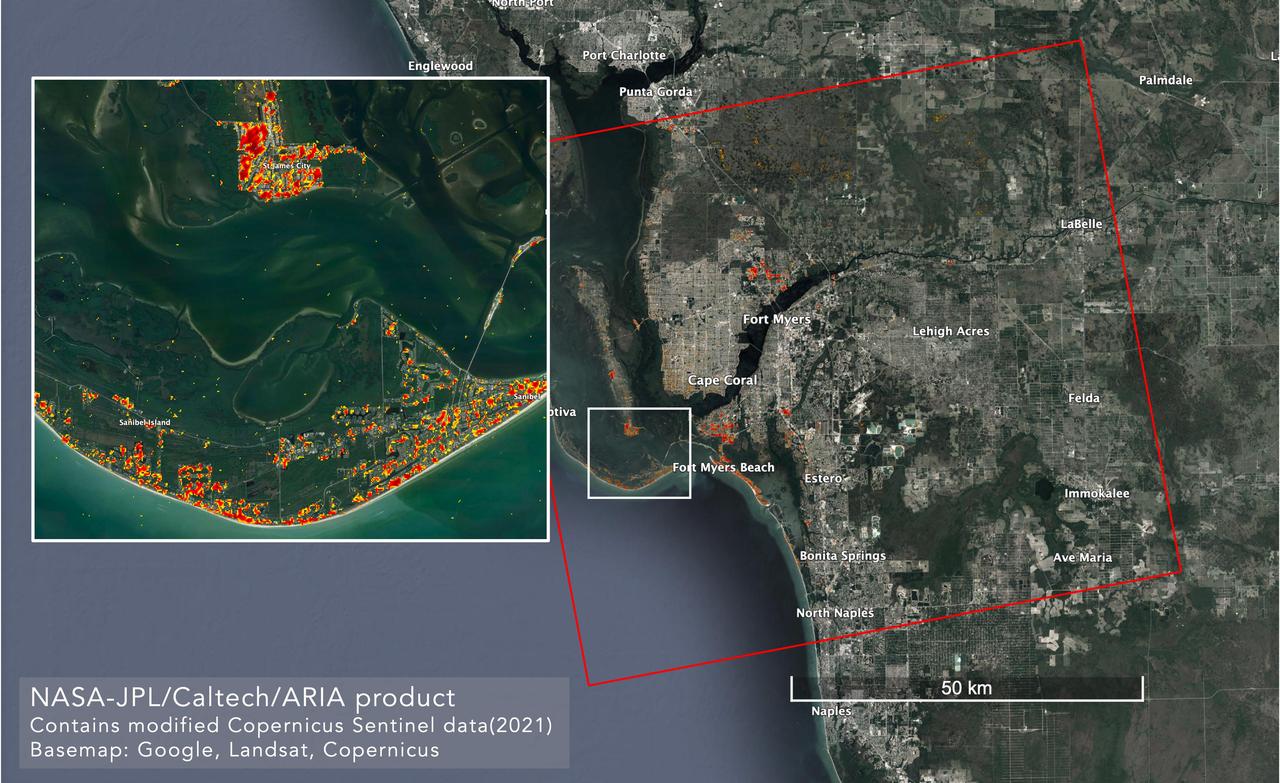
NASA scientists are using satellite data to assess the damage on Florida's Gulf Coast after Hurricane Ian, which made landfall in the state as a Category 4 storm on Sept. 28, 2022. The Advanced Rapid Imaging and Analysis (ARIA) team at NASA's Jet Propulsion Laboratory and Caltech created this damage proxy map on Oct. 2, 2022, showing which parts of the Fort Myers area likely suffered storm damage. The map was derived from synthetic aperture radar (SAR) images acquired by the Copernicus Sentinel-1 satellites, which are operated by the European Space Agency (ESA). Data from the satellites covered an area of approximately 2,491 square miles (6,452 square kilometers) outlined by the red rectangle. The color variation from pale yellow to red indicates greater drops in radar reflections compared with pre-storm imagery, an indication of possible damage. Preliminary validation was done by comparing the map with media reports and other images. https://photojournal.jpl.nasa.gov/catalog/PIA25426
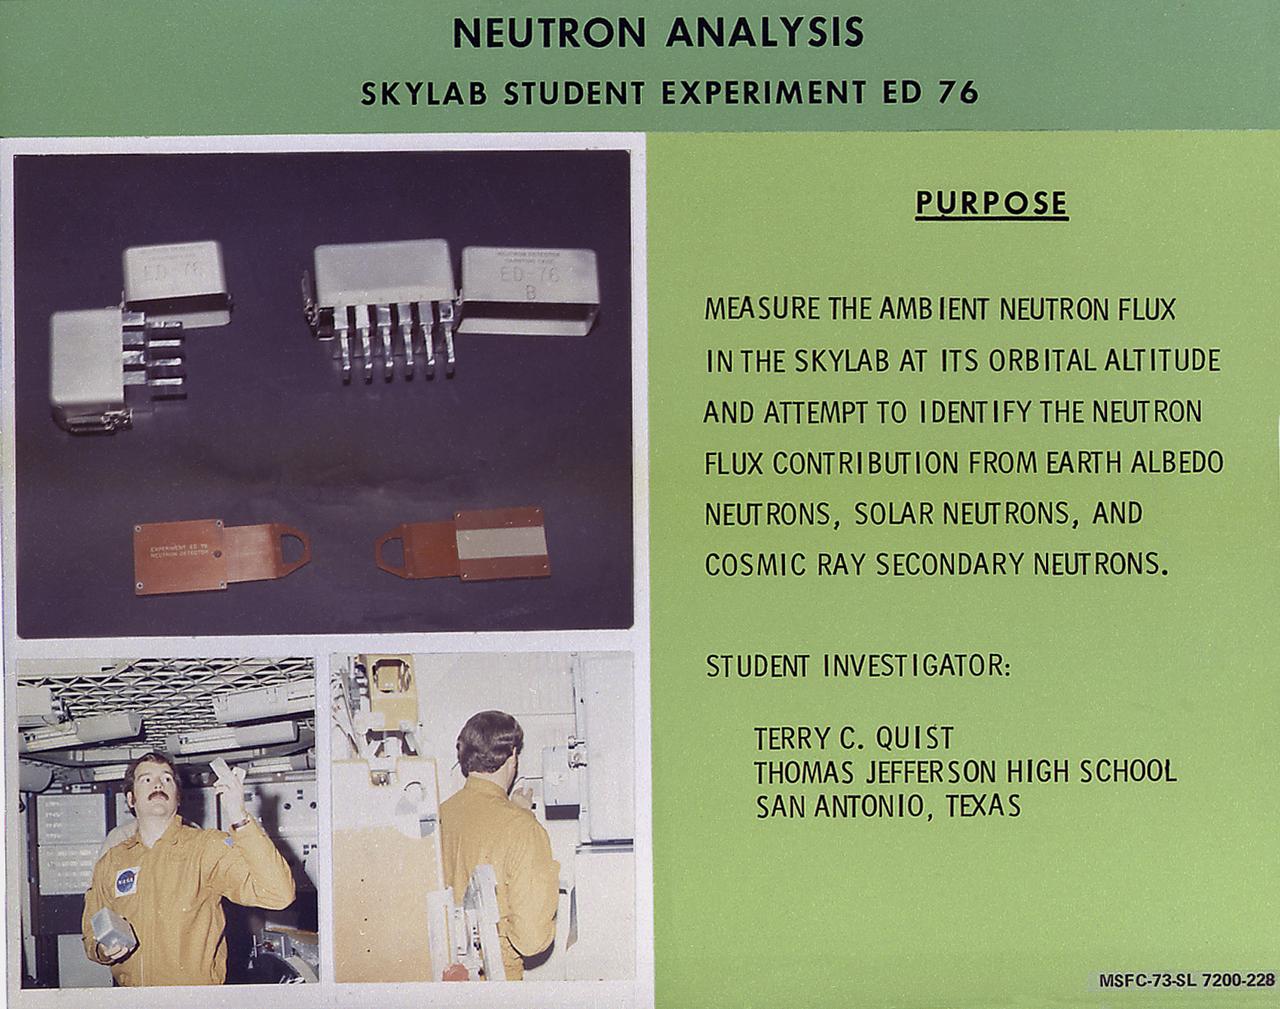
The rate of neutron flow is commonly referred to as a flux. The measurement of neutron fluxes in Skylab was the subject of a proposal by Terry Quist of San Antonio, Texas. This chart describes Quist's experiment, Neutron Analysis, Skylab student experiment ED-76. These measurements were considered important not only by NASA but also by the scientific community for four reasons. High energy neutrons can be harmful to human tissue if they are present in significant quantities. Fluxes of neutrons can damage film and other sensitive experimental equipment in a marner similar to those produced by x-rays or other radiation. Furthermore, neutron fluxes can be used as a calibration source for other space-oriented particle physics experiments. Finally, neutron fluxes can affect sensitive x-ray and gamma-ray astronomy observations. Quist's objectives were to measure the neutron fluxes present in Skylab and, with the assistance of NASA and other physicists, to attempt determination of their origin as well as their energy range or spectrum. This experiment had stimulated interest in further studies of neutron phenomena in space. In March 1972, NASA and the National Science Teachers Association selected 25 experiment proposals for flight on Skylab. Science advisors from the Marshall Space Flight Center aided and assisted the students in developing the proposals for flight on Skylab.

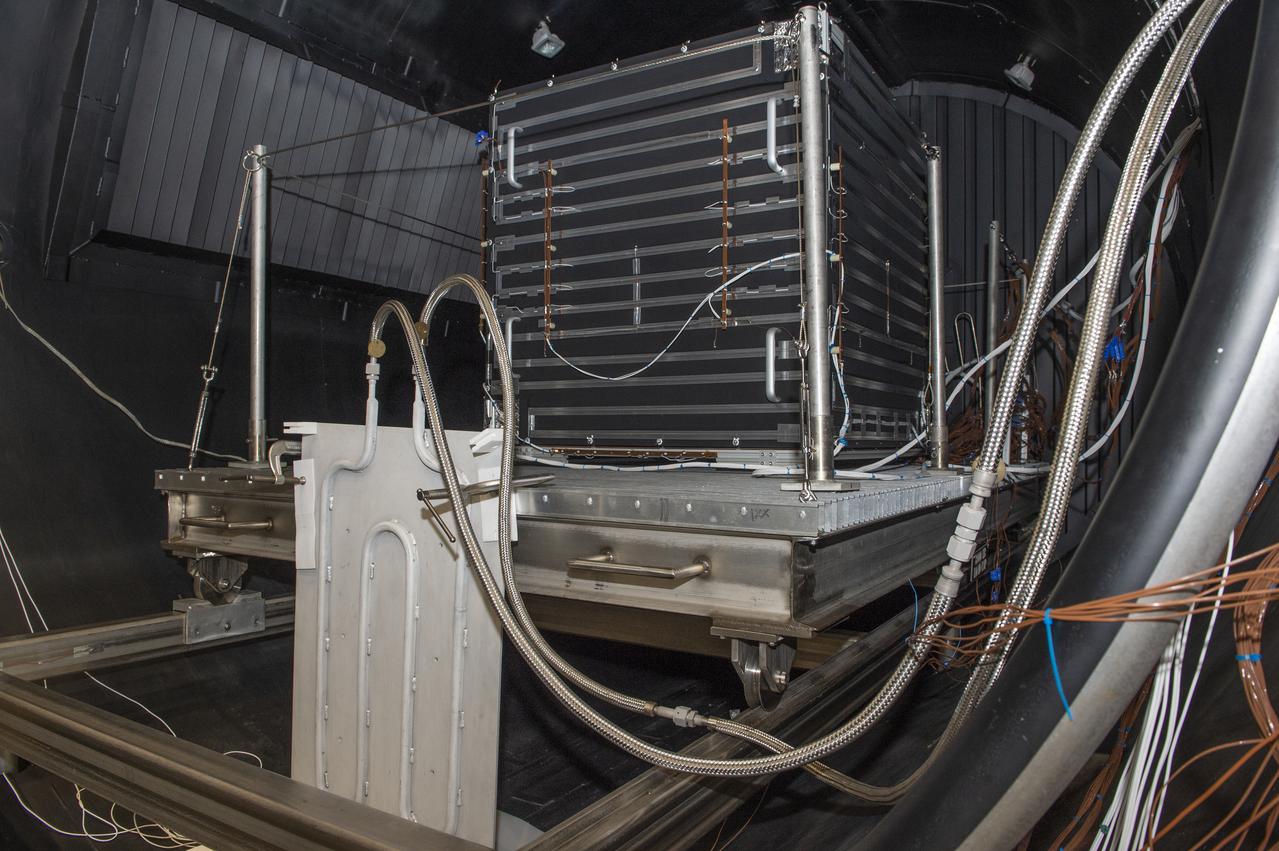
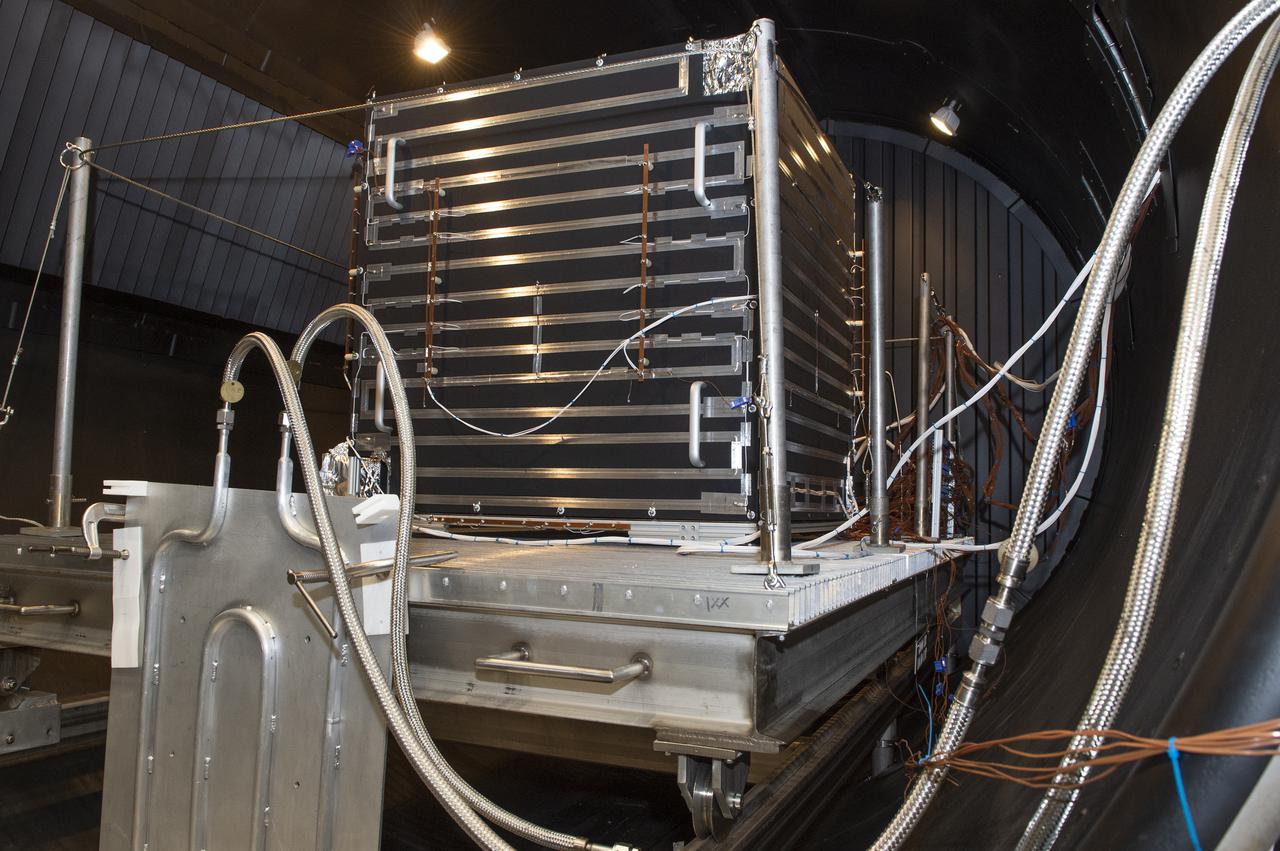
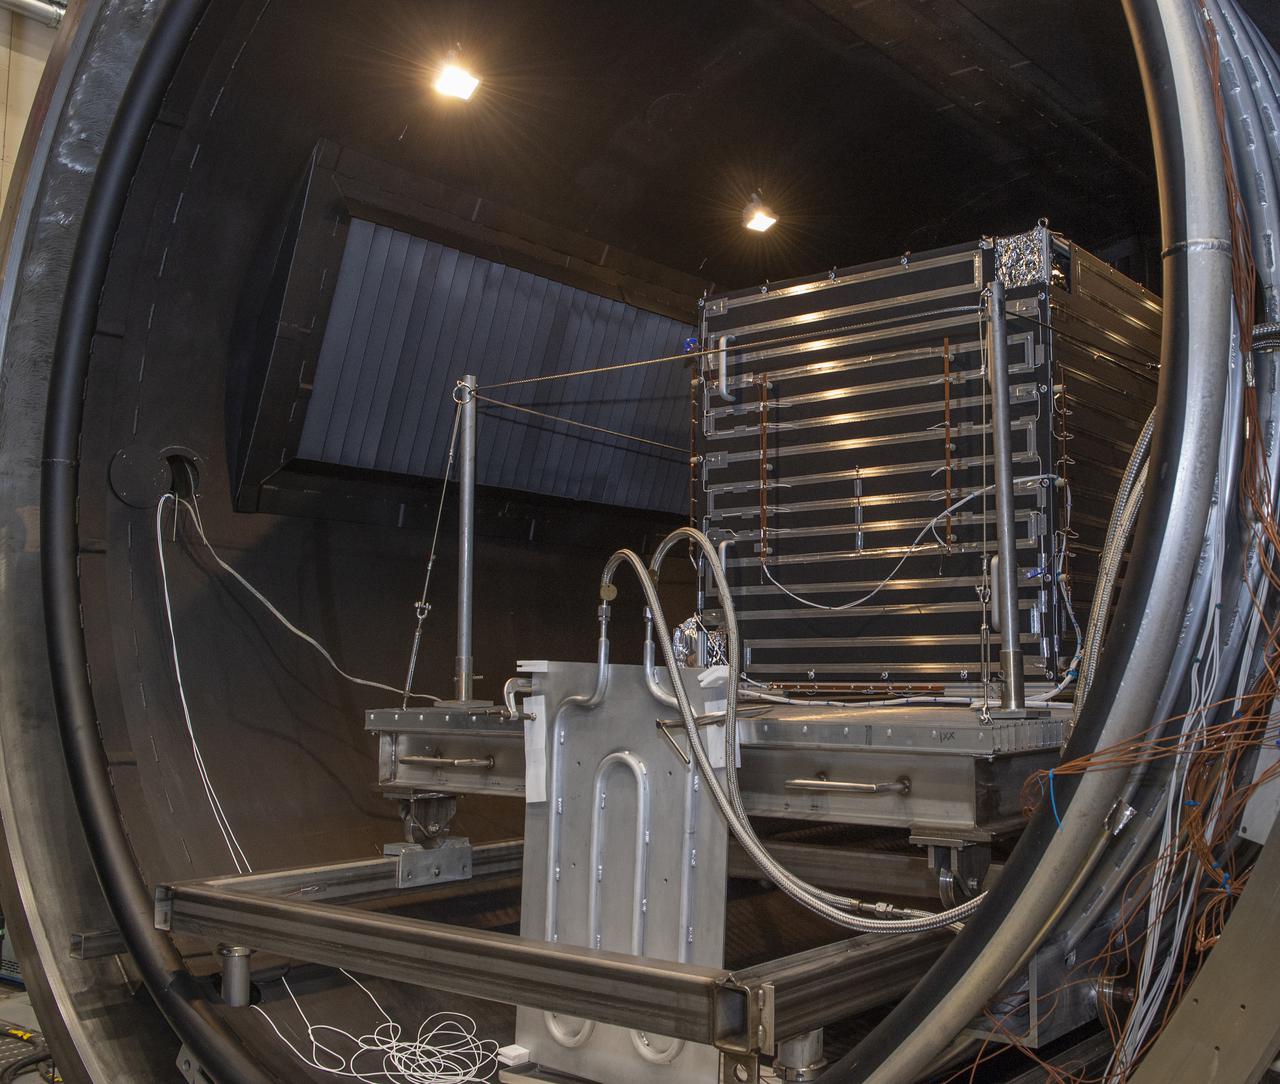
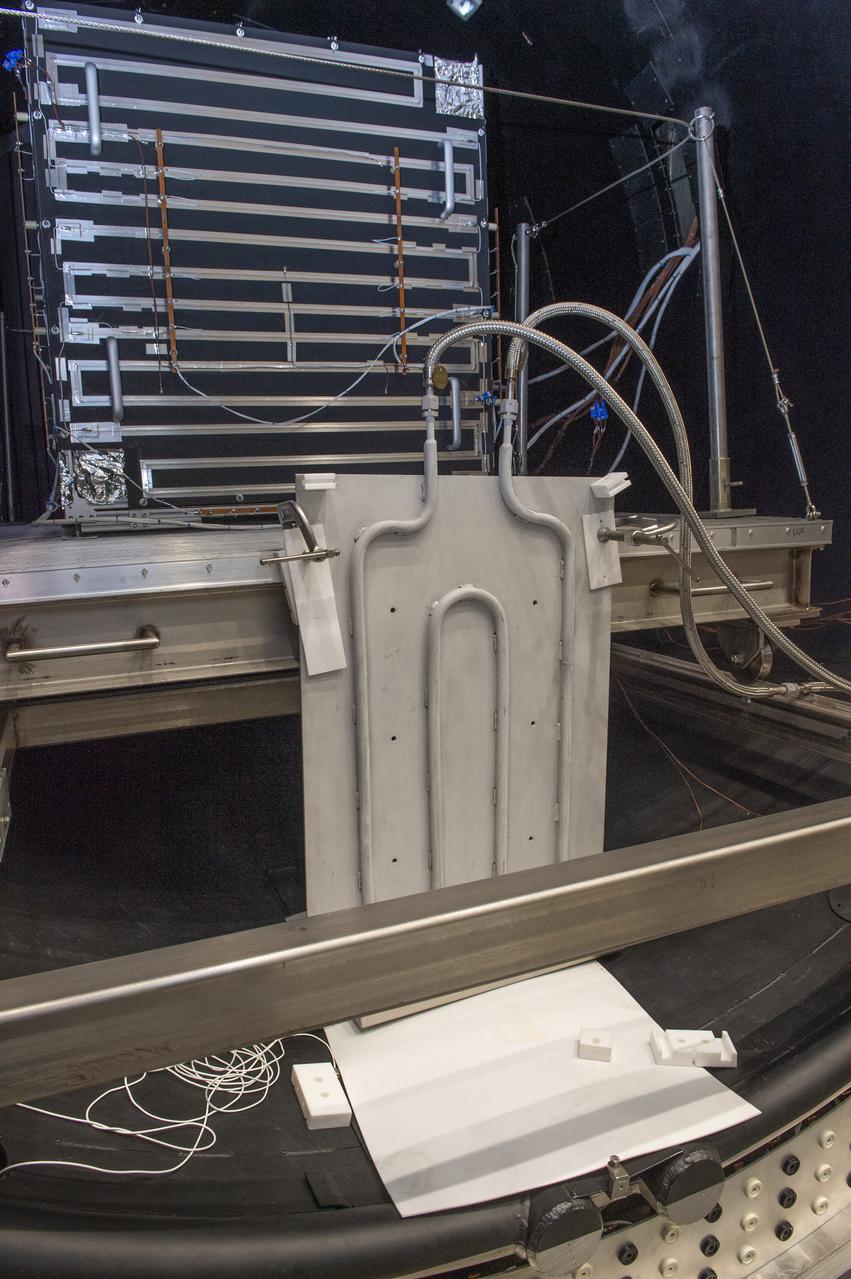
NASA Deputy Administrator Dr. Dava Newman tours Goddard Space Flight Center with Center Director Chris Scolese; Sample Analysis at Mars (SAM) instrument Test Bed; Dr. Melissa Trainer
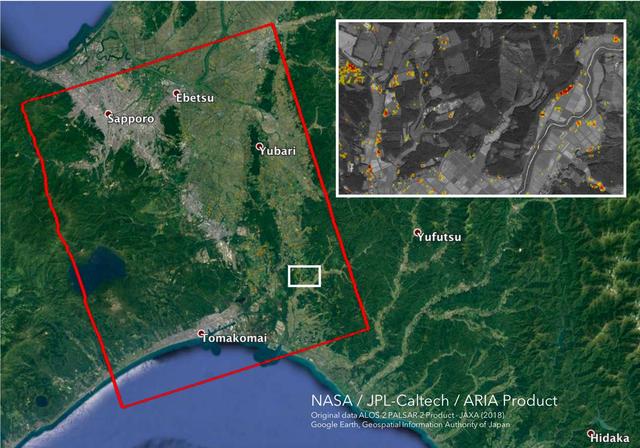
The Advanced Rapid Imaging and Analysis (ARIA) team at NASA's Jet Propulsion Laboratory in Pasadena, California, and Caltech, also in Pasadena, created this Damage Proxy Map (DPM) depicting areas in the southwestern part of Hokkaido, Japan, that are likely damaged as a result of the M6.6 September 5 earthquake in 2018 (shown by red and yellow pixels). The map is derived from synthetic aperture radar (SAR) images from the ALOS-2 satellites, operated by Japan Aerospace Exploration Agency (JAXA). The images were taken before and after the earthquake -- August 23 and September 6, respectively. The map covers an area of 70 by 57 kilometers, shown by the large red polygon. Each pixel measures about 30 meters across. The color variation from yellow to red indicates increasingly more significant ground surface change. Preliminary validation was done by comparing with the high-resolution airborne optical imagery provided by the Geospatial Information Authority of Japan. This damage proxy map should be used as guidance to identify damaged areas, and may be less reliable over vegetated areas. For example, pixels over vegetated areas and farmlands may be false positives, and the lack of colored pixels over vegetated areas does not necessarily mean no damage. The DPM was created by the NASA-JPL/Caltech ARIA team, and the ALOS-2 data were provided by JAXA. The algorithm development was carried out at JPL under a contract with NASA. https://photojournal.jpl.nasa.gov/catalog/PIA22696
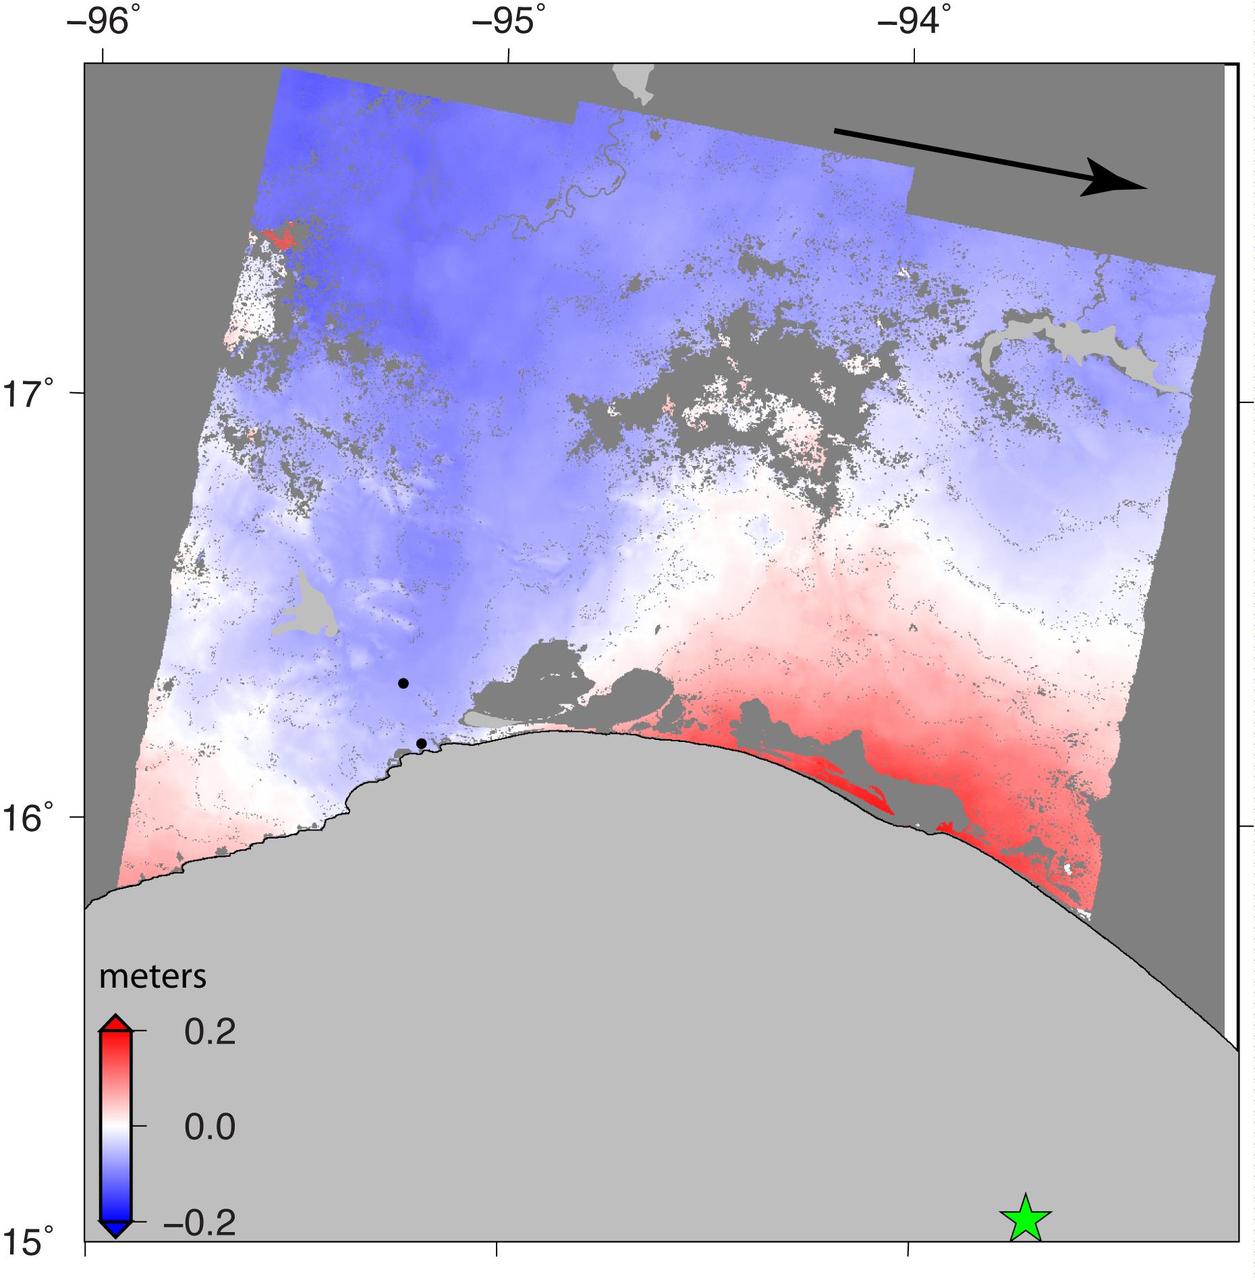
NASA and its partners are contributing important observations and expertise to the ongoing response to the Sept. 7, 2017 (local time), magnitude 8.1 Oaxaca-Chiapas earthquake in Mexico. This earthquake was the strongest in more than a century in Mexico. It has caused a significant humanitarian crisis, with widespread building damage and triggered landslides throughout the region. Scientists with the Advanced Rapid Imaging and Analysis project (ARIA), a collaboration between NASA's Jet Propulsion Laboratory in Pasadena, California; and Caltech, also in Pasadena, analyzed interferometric synthetic aperture radar images from the radar instrument on the Copernicus Sentinel-1A and Sentinel-1B satellites operated by the European Space Agency (ESA) to calculate a map of the deformation of Earth's surface caused by the quake. This false-color map shows the amount of permanent surface movement caused almost entirely by the earthquake, as viewed by the satellite, during a six-day interval between radar images acquired by the two Sentinel-1 satellites on Sept. 7 and Sept. 13, 2017. In this map, the colors of the surface displacements are proportional to the surface motion. The red tones show the areas along the coast of Chiapas and Oaxaca have moved toward the satellite by as much as 9 inches (22 centimeters) in a combination of up and eastward motion. The area in between and farther north with various shades of blue moved away from the satellite, mostly downward or westward, by as much as 6 inches (15 centimeters). Areas without color are open water or heavy vegetation, which prevent the radar from measuring change between the satellite images. Scientists use these maps to build detailed models of the fault slip at depth and associated land movements to better understand the impact on future earthquake activity. The green star shows the location of the earthquake epicenter estimated by the United States Geological Survey (USGS) National Earthquake Information Center. Map contains modified Copernicus Sentinel data 2017, processed by ESA and analyzed by the NASA-JPL/Caltech ARIA team. This research was carried out at JPL under a contract with NASA. Sentinel-1 data were accessed through the Copernicus Open Access Hub. An annotated figures is available at https://photojournal.jpl.nasa.gov/catalog/PIA21962
The Advanced Rapid Imaging and Analysis (ARIA) team at NASA's Jet Propulsion Laboratory in Pasadena, California, created these Damage Proxy Maps (DPMs) depicting areas in California likely damaged by the Woolsey and Camp Fires. They are derived from synthetic aperture radar (SAR) images from the Copernicus Sentinel-1 satellites, operated by the European Space Agency (ESA). The pre-event images for the Woolsey Fire in Southern California were taken before the fire on Oct. 30, 2018 and the post-event image was acquired during the fire on Nov. 11, 2018. The map covers an area of 50 miles x 25 miles (80 km x 40 km), indicated with the big red polygon. Each pixel measures about 33 yards x 33 yards (30 m x 30 m). The color variation from yellow to red indicates increasingly more significant ground surface change. The pre-event images for the Camp Fire in Northern California were taken on Nov. 4, 2018 and the post-event images were acquired during the fire on Nov. 10, 2018. The map covers an area of 55 miles x 48 miles (88 km x 77 km). As in the previous image, each pixel measures about 33 yards x 33 yards (30 m x 30 m). The color variation from yellow to red indicates increasingly more significant ground surface change. Preliminary validation for both maps was done by comparing approximate location data to Google's Crisismap. These damage proxy maps can be used as guidance to identify damaged areas with the understanding that they may be less reliable over vegetated areas including farmlands. For example, the scattered single colored pixels over vegetated areas may be false positives, and the lack of colored pixels over vegetated areas does not necessarily mean no damage. https://photojournal.jpl.nasa.gov/catalog/PIA22816
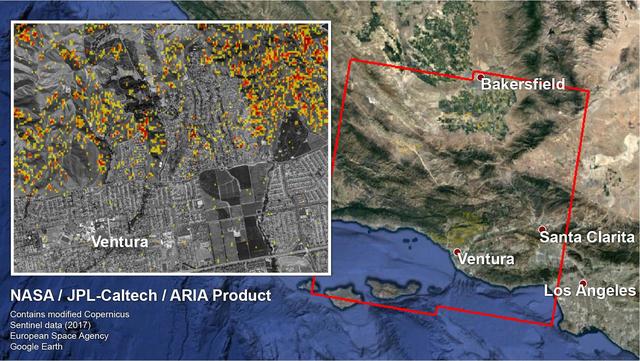
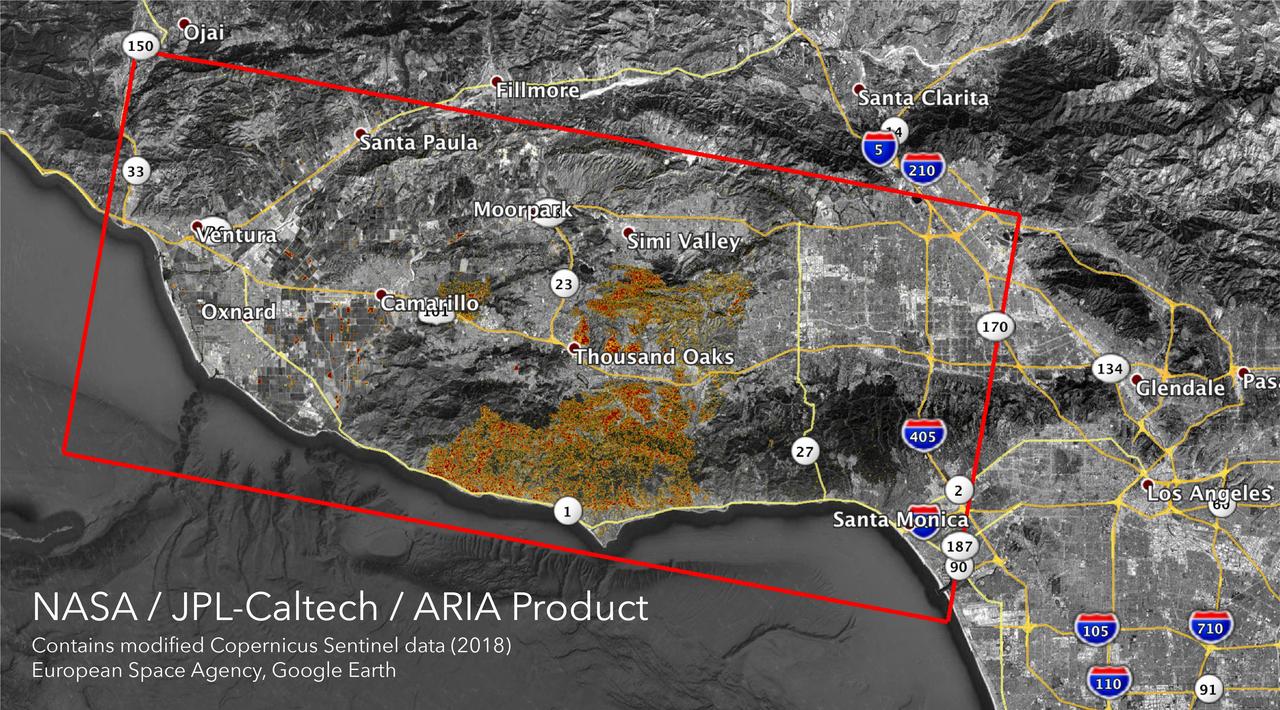
The Advanced Rapid Imaging and Analysis (ARIA) team at NASA's Jet Propulsion Laboratory in Pasadena, California, and Caltech, also in Pasadena, created a Damage Proxy Map (DPM) depicting areas in Southern California that are likely damaged (shown by red and yellow pixels) as a result of recent wildfires, including the Thomas Fire in Ventura and Santa Barbara Counties, highlighted in the attached image taken from the DPM. The map is derived from synthetic aperture radar (SAR) images from the Copernicus Sentinel-1 satellites, operated by the European Space Agency (ESA). The images were taken before (Nov. 28, 2017, 6 a.m. PST) and after (Dec. 10, 2017, 6 a.m. PST) the onset of the fires. The map covers an area of 107 by 107 miles (172 by 172 kilometers), shown by the large red polygon. Each pixel measures about 33 yards (30 meters) across. The color variation from yellow to red indicates increasingly more significant ground surface change. Preliminary validation was done by comparing the map to optical satellite imagery from DigitalGlobe. This damage proxy map should be used as guidance to identify damaged areas, and may be less reliable over vegetated areas. For example, the colored pixels seen over mountainous areas may seem a little scattered even though the reality could be that the contiguous areas were burned. Patches of farmland can also appear as signals due to plowing or irrigation. The full map is available to download from https://aria-share.jpl.nasa.gov/events/20171210-SoCal_Fire/. https://photojournal.jpl.nasa.gov/catalog/PIA22191
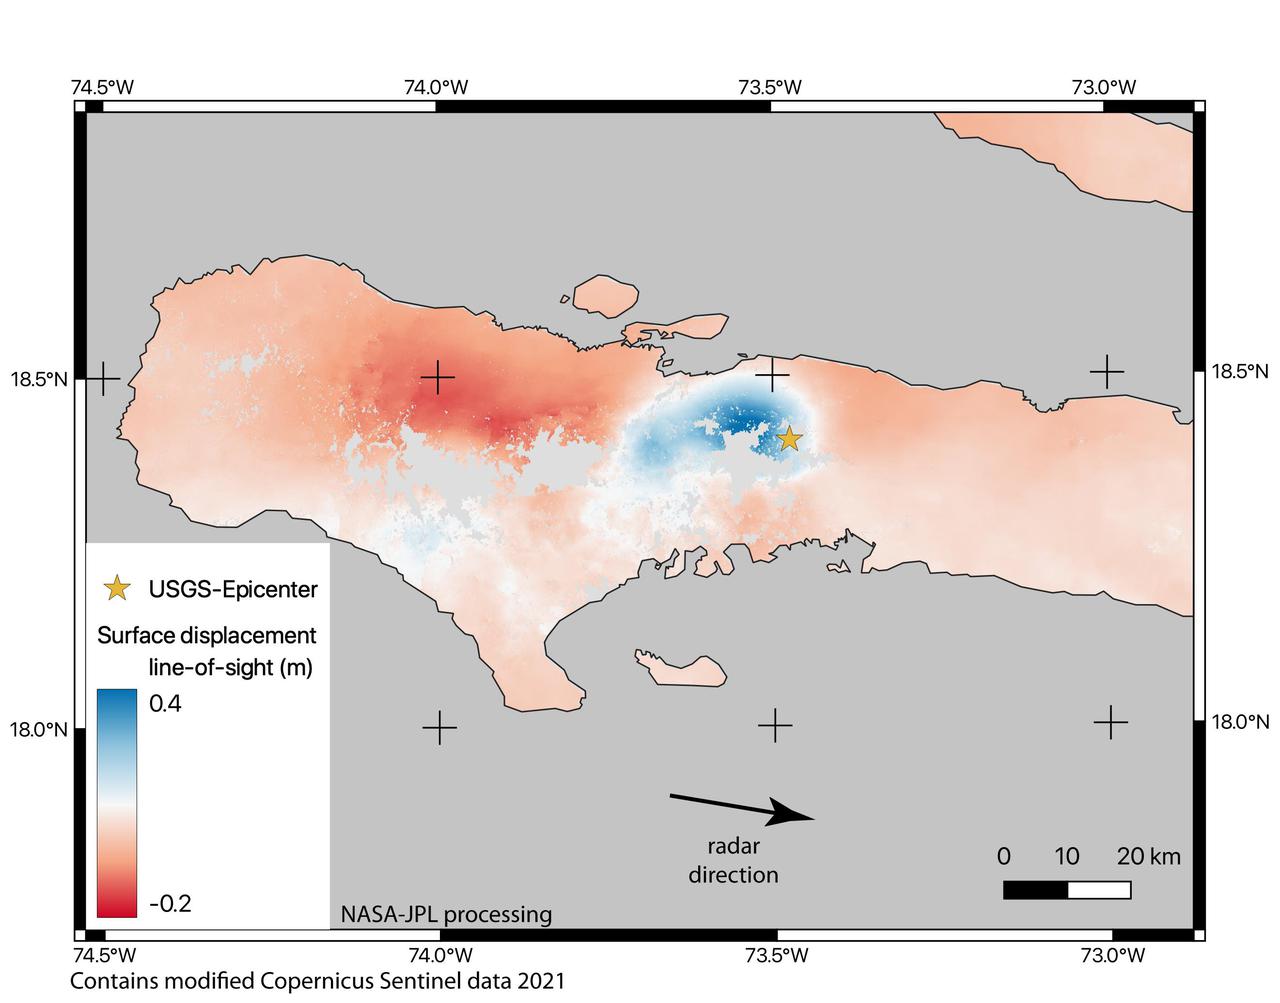
On August 14, 2021, a magnitude 7.2 earthquake struck western Haiti causing widespread damage and loss of life, and triggering landslides throughout the region. Scientists with the Advanced Rapid Imaging and Analysis project (ARIA), a collaboration between NASA's Jet Propulsion Laboratory and the California Institute of Technology analyzed interferometric synthetic aperture radar images from the Copernicus Sentinel-1A satellite operated by the European Space Agency (ESA) to calculate a map of the deformation of Earth's surface caused by the quake. Using images acquired before and after the earthquake – August 3 and 15, 2021, respectively – scientists produced this false-color map showing the amount of permanent surface movement the quake caused. Areas in blue moved toward the satellite by as much as 16 inches (50 centimeters) in a combination of up and eastward motion. These blue areas are close to the epicenter – marked with the orange star – indicating that there was likely a large slip on the fault beneath them. The areas to the west – shown with various shades of red – moved away from the satellite, mostly downward or westward, by as much as 8 inches (20 cm). The two areas of significant ground movement (darker red and blue) are both west of the epicenter and indicate the fault rupture proceeded westward from its starting point. Areas with gray are open water or heavy vegetation that prevents the instrument from measuring change between satellite images. Scientists use these maps to build detailed models of the fault slip at depth and associated land movements to better understand the impact on future earthquake activity. https://photojournal.jpl.nasa.gov/catalog/PIA23697
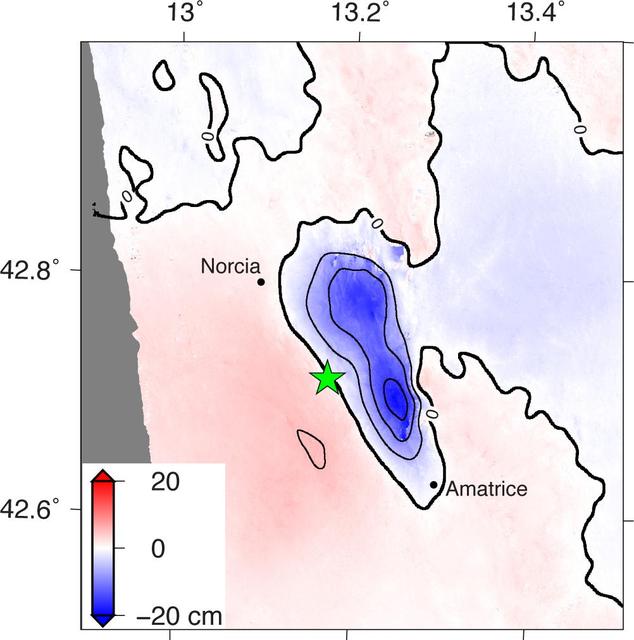
NASA and its partners are contributing observations and expertise to the ongoing response to the Aug. 23, 2016, magnitude 6.2 Amatrice earthquake in central Italy caused widespread building damage to several towns throughout the region. This earthquake was the strongest in that area since the 2009 earthquake that destroyed the city of L'Aquila. Scientists with the Advanced Rapid Imaging and Analysis project (ARIA), a collaboration between NASA's Jet Propulsion Laboratory, Pasadena, California, and the California Institute of Technology in Pasadena, analyzed interferometric synthetic aperture radar images from the PALSAR-2 instrument on the ALOS-2 satellite operated by the Japan Aerospace Exploration Agency (JAXA) to calculate a map of the deformation of Earth's surface caused by the quake. This false-color map shows the amount of permanent surface movement, as viewed by the satellite, during a seven-month interval between two ALOS-2 images acquired on Sept. 9, 2015 and Aug. 24, 2016. The movement was caused almost entirely by the earthquake. In this map, the colors of the surface displacements are proportional to the surface motion. The red and pink tones show the areas where the land moved toward the satellite by up to 2 inches (5 centimeters). The area with various shades of blue moved away from the satellite, mostly downward, by as much as 8 inches (20 centimeters). Contours on the surface motion are 2 inches (5 centimeters) The green star shows the epicenter where the earthquake started as located by the U.S. Geological Survey National Earthquake Information Center. Black dots show town locations. Scientists use these maps to build detailed models of the fault slip at depth and associated land movements to better understand the impact on future earthquake activity. The map shows the fault or faults that moved in the earthquake is about 14 miles (22 kilometers) long between Amatrice and Norcia and slopes to the west beneath the area that moved downward. The PALSAR-2 data were provided by JAXA through a science project. http://photojournal.jpl.nasa.gov/catalog/PIA20893
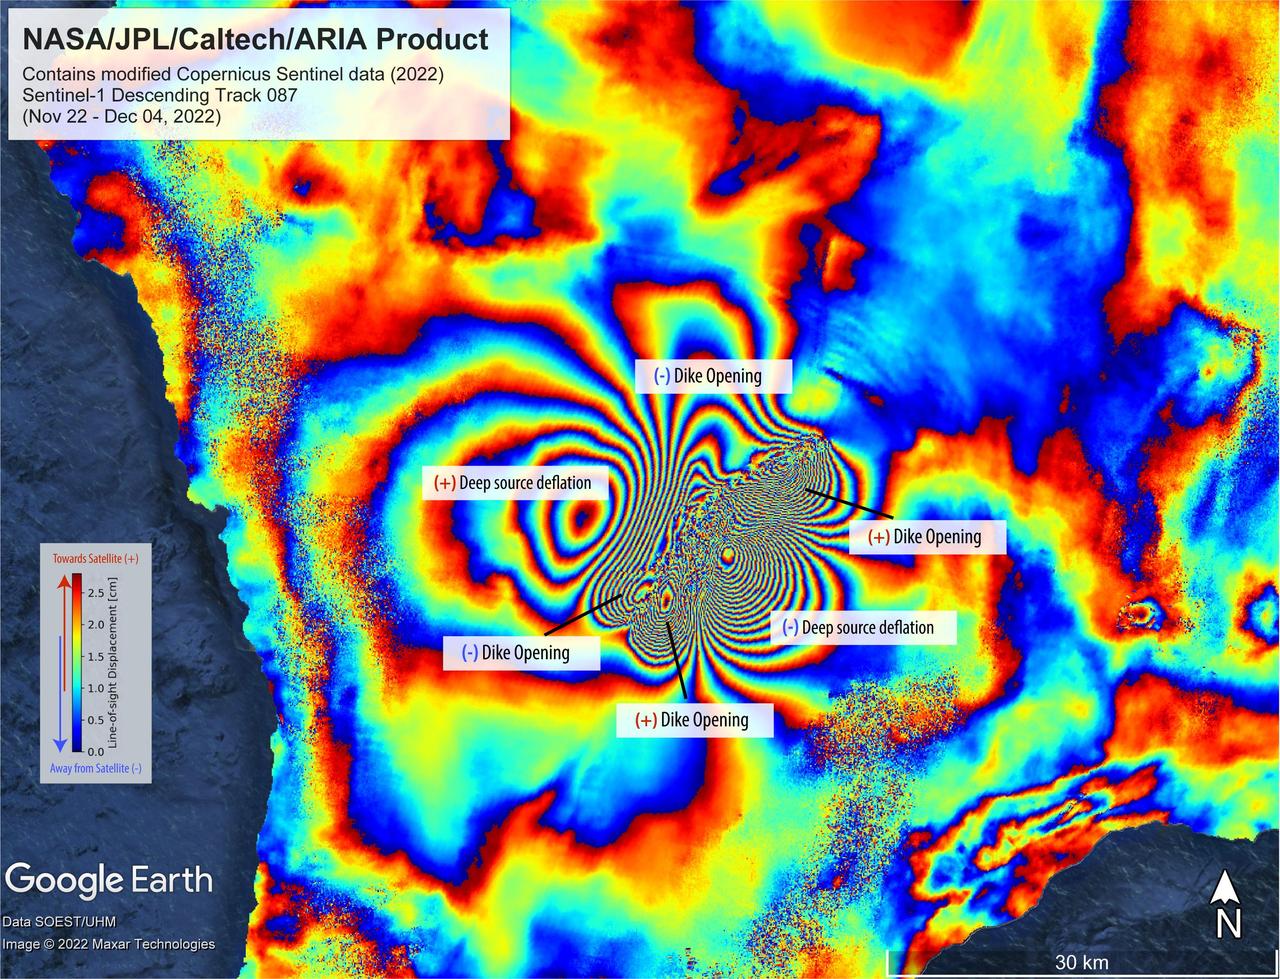
On Nov. 27, 2022, Mauna Loa, Earth's largest active volcano, began erupting from the summit caldera inside Hawaii Volcanoes National Park. Scientists with the Advanced Rapid Imaging and Analysis project (ARIA), a collaboration between NASA's Jet Propulsion Laboratory and the California Institute of Technology, which manages JPL for the agency, analyzed synthetic aperture radar images from the Copernicus Sentinel-1 satellites operated by ESA (European Space Agency) to calculate a map of the Earth's ground movement as a result of the eruption. Using images acquired before and after the start of the eruption – Nov. 22 and Dec. 4, 2022, respectively – scientists produced this false-color map showing the amount of ground surface movement, or displacement, the eruption caused. In the map, surface displacements are seen as color contours, or "fringes," where each color cycle represents about 2.8 centimeters of surface motion. The direction of the ground movement (whether toward or away from the satellite) is indicated by the color cycle (from outer to inner direction). A positive (+) indication, meaning "ground moved towards satellite," has a color cycle of blue-green-yellow-orange-red. A negative (-) indication, meaning "ground moved away from the satellite," has a color cycle of red-orange-yellow-green-blue. The broader fringes are representative of deep source processes within the volcano. In this case, a broad tabular source of magma deflated and fed the eruption as magma or lava was being supplied, somewhat like a deflating balloon (only tabular in shape) that shrank because pressure was relieved. The dense fringes marked as "dike opening" are a signature of the ground rupturing (or opening) as the magma made its way towards the Earth's surface. Scientists use these maps to build detailed models of subsurface volcanic processes to better forecast and understand the impact of future volcanic activity. The Sentinel-1 data were provided by ESA. The image contains modified Copernicus 2022 data, processed by ESA and analyzed by NASA-JPL. https://photojournal.jpl.nasa.gov/catalog/PIA25525
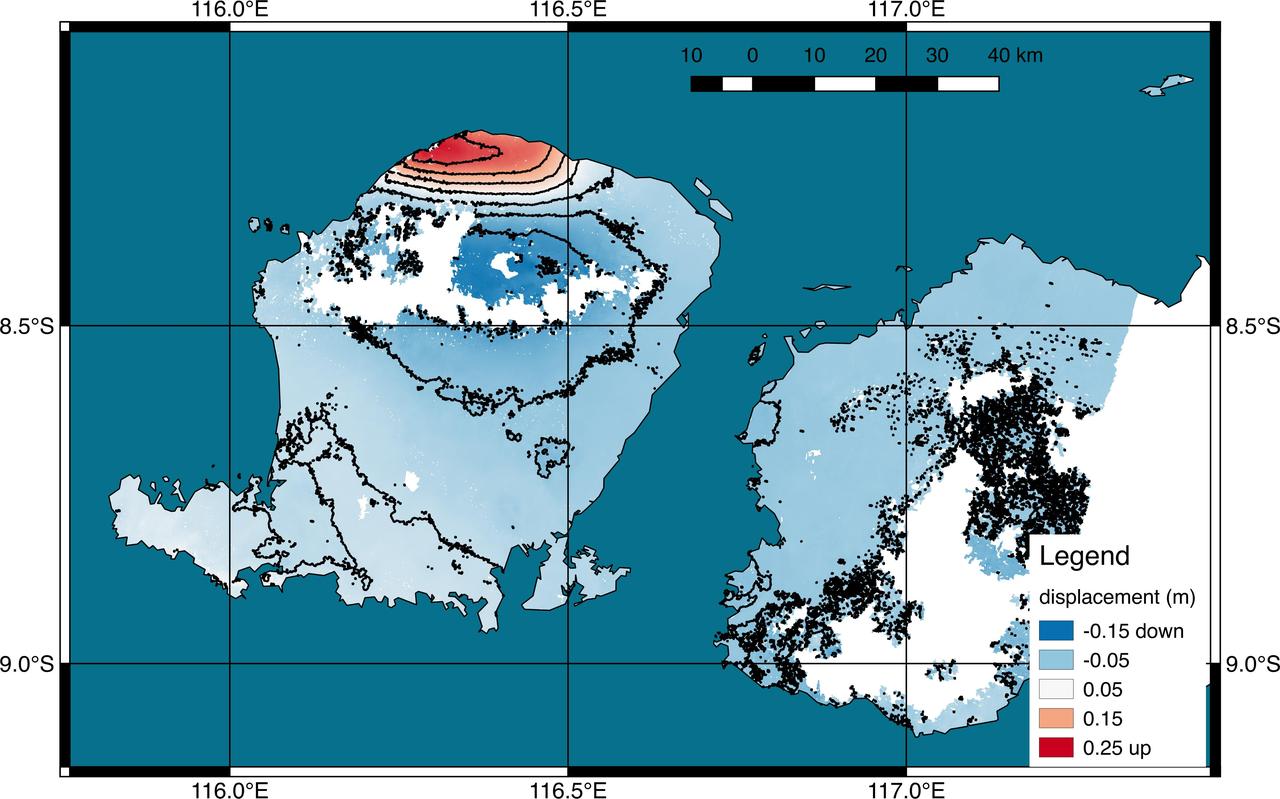
Scientists with the Advanced Rapid Imaging and Analysis project (ARIA), a collaboration between NASA's Jet Propulsion Laboratory in Pasadena, California, and Caltech, also in Pasadena, used synthetic aperture radar (SAR) data from the European Union's Copernicus Sentinel-1A and -1B satellites, operated by the European Space Agency. They generated a map of the deformation of Earth's surface caused by the Aug. 5, 2018 magnitude 6.9 earthquake under Lombok island, Indonesia. The deformation map is produced from automated interferometric processing of the SAR data using the JPL-Caltech ARIA data system in response to a signal received from the U.S. Geological Survey. The false-color map shows the amount of permanent surface movement that occurred almost entirely due to the quake, as viewed by the satellite, during a 6-day interval between two Sentinel-1 images acquired on July 30 and Aug. 5, 2018. The map shows that the earthquake fault was under the northwest corner of Lombok island, probably extending offshore to the west. Through these maps, NASA and its partners are contributing observations and expertise that can assist with response to earthquakes and other natural or human-produced hazards. From the pattern of deformation in the map, scientists have determined that the earthquake fault slip was on a fault beneath the northwestern part of Lombok Island and caused as much as 10 inches (25 centimeters) of uplift of the ground surface. The map depicts motion towards the satellite (up and west) in the direction of the radar's line-of-sight, with contours every 2 inches (5 centimeters). White areas are places where the radar measurement was not possible, largely due to dense forests in the middle of the islands. https://photojournal.jpl.nasa.gov/catalog/PIA22491
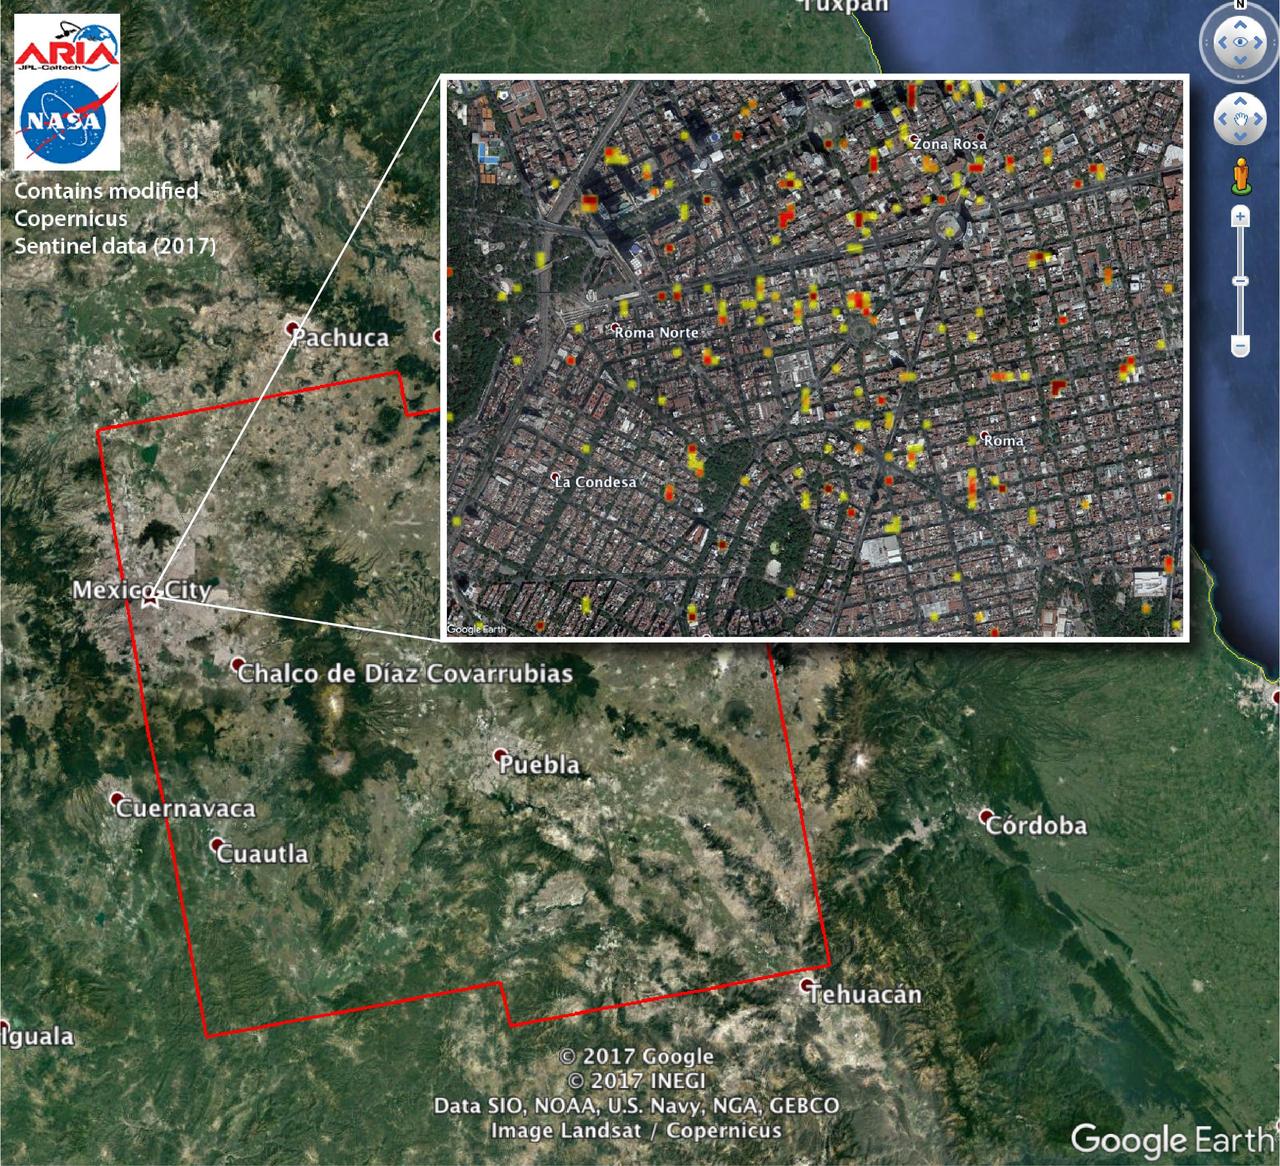
The Advanced Rapid Imaging and Analysis (ARIA) team at NASA's Jet Propulsion Laboratory in Pasadena, California, and Caltech, also in Pasadena, created this Damage Proxy Map (DPM) depicting areas of Central Mexico, including Mexico City, that are likely damaged (shown by red and yellow pixels) from the magnitude 7.1 Raboso earthquake of Sept. 19, 2017 (local time). The map is derived from synthetic aperture radar (SAR) images from the Copernicus Sentinel-1A and Sentinel-1B satellites, operated by the European Space Agency (ESA). The images were taken before (Sept. 8, 2017) and after (Sept. 20, 2017) the earthquake. The map covers an area of 109 by 106 miles (175 by 170 kilometers). Each pixel measures about 33 yards (30 meters) across. The color variation from yellow to red indicates increasingly more significant ground and building surface change. Preliminary validation was done by comparing the DPM to a crowd-sourced Google Map (https://www.google.com/maps/d/u/0/viewer?mid=1_-V97lbdgLFHpx-CtqhLWlJAnYY&ll=19.41452166501326%2C-99.16498240436704&z=16). This damage proxy map should be used as guidance to identify damaged areas, and may be less reliable over vegetated areas. Sentinel-1 data were accessed through the Copernicus Open Access Hub. The image contains modified Copernicus Sentinel data (2017), processed by ESA and analyzed by the NASA-JPL/Caltech ARIA team. This research was carried out at JPL under contract with NASA. https://photojournal.jpl.nasa.gov/catalog/PIA21963
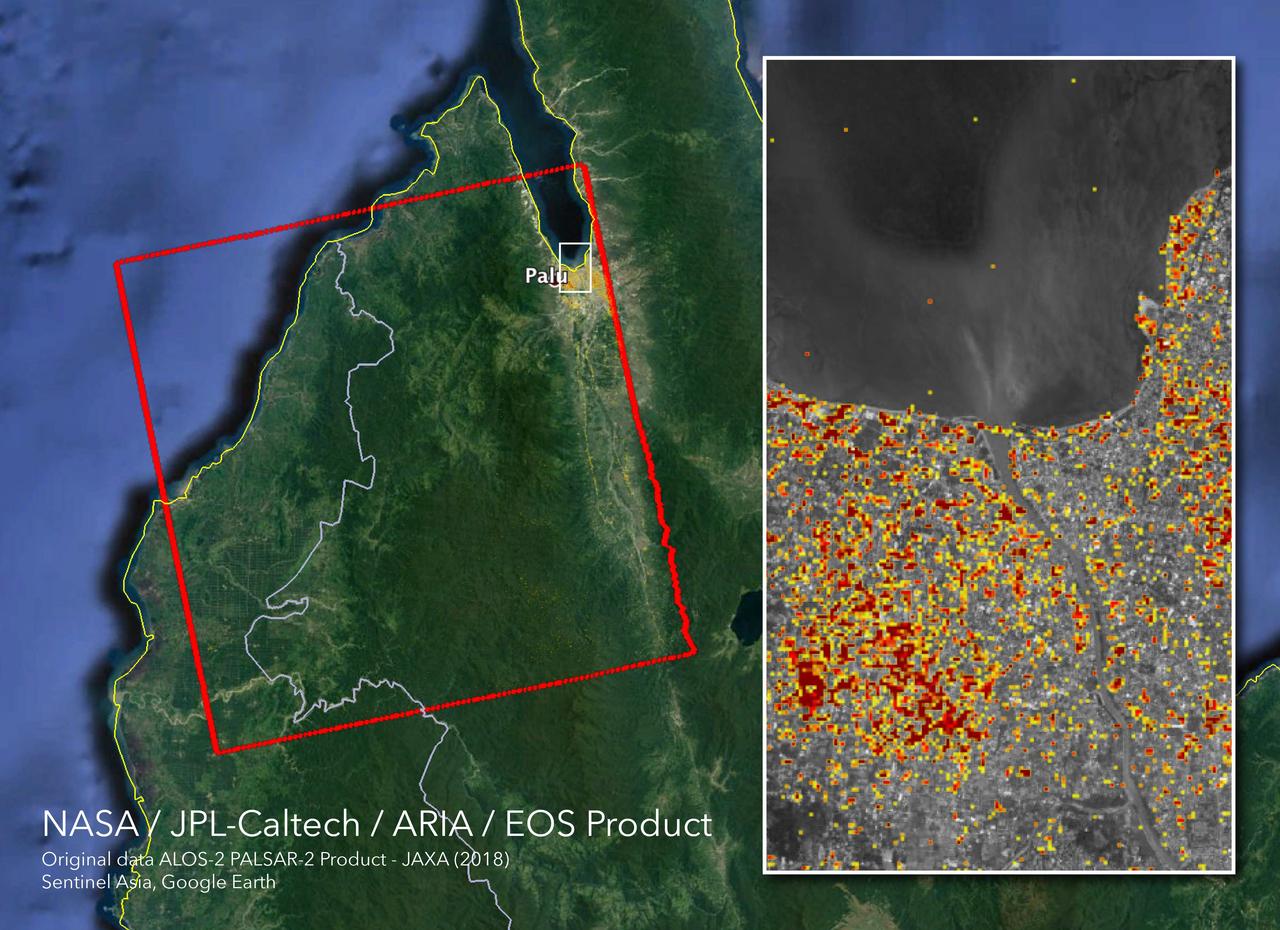
The Advanced Rapid Imaging and Analysis (ARIA) team at NASA's Jet Propulsion Laboratory in Pasadena, California, and Caltech, also in Pasadena, created this Damage Proxy Map (DPM) depicting areas in Central Sulawesi, Indonesia, including the city of Palu, that are likely damaged (shown by red and yellow pixels) as a result of the magnitude 7.5 September 28, 2018 earthquake. The map is derived from synthetic aperture radar (SAR) images from the ALOS-2 satellite, operated by Japan Aerospace Exploration Agency (JAXA). The images were taken before (Aug. 8, 2018) and after (Oct. 3, 2018) the earthquake. The map covers an area of 42 by 44 miles (67 by 70 kilometers), shown by the large red polygon. Each pixel measures about 33 yards (30 meters) across. The color variation from yellow to red indicates increasingly more significant ground surface change. Preliminary validation was done in collaboration with the Earth Observatory of Singapore by comparing with local media information and photos. This damage proxy map should be used as guidance to identify damaged areas, and may be less reliable over vegetated areas. For example, the scattered single colored pixels over vegetated areas may be false positives, and the lack of colored pixels over vegetated areas does not necessarily mean no damage. The DPM was created by the NASA-JPL/Caltech ARIA team, and the ALOS-2 data were provided by JAXA. The Earth Observatory of Singapore coordinated with the Sentinel Asia to timely task the ALOS-2 satellite. The algorithm development was carried out at JPL under a contract with NASA. https://photojournal.jpl.nasa.gov/catalog/PIA22746
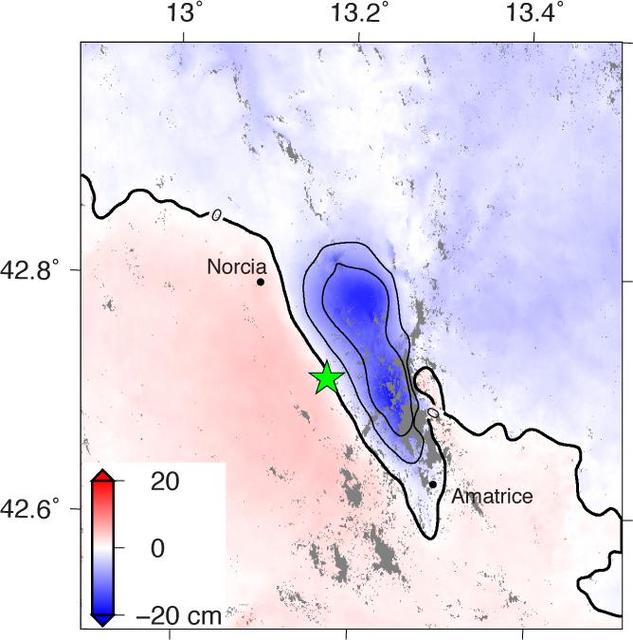
Amatrice earthquake in central Italy, which caused widespread building damage to several towns throughout the region. This earthquake was the strongest in that area since the 2009 earthquake that destroyed the city of L'Aquila. The Advanced Rapid Imaging and Analysis (ARIA) data system, a collaborative project between NASA's Jet Propulsion Laboratory, Pasadena, California, and the California Institute of Technology in Pasadena, automatically generated interferometric synthetic aperture radar images from the Copernicus Sentinel 1A satellite operated by the European Space Agency (ESA) for the European Commission to calculate a map of the deformation of Earth's surface caused by the quake. This false-color map shows the amount of permanent surface movement, as viewed by the satellite, during a 12-day interval between two Sentinel 1 images acquired on Aug. 15, 2016, and Aug. 27, 2016. The movement was caused almost entirely by the earthquake. In this map, the colors of the surface displacements are proportional to the surface motion. The red and pink tones show the areas where the land moved toward the satellite by up to 2 inches (5 centimeters). The area with various shades of blue moved away from the satellite, mostly downward, by as much as 8 inches (20 centimeters). Contours on the surface motion are 2 inches (5 centimeters) The green star shows the epicenter where the earthquake started as located by the U.S. Geological Survey National Earthquake Information Center. Black dots show town locations. Scientists use these maps to build detailed models of the fault slip at depth and associated land movements to better understand the impact on future earthquake activity. The map shows the fault or faults that moved in the earthquake is about 14 miles (22 kilometers) long between Amatrice and Norcia and slopes to the west beneath the area that moved downward. http://photojournal.jpl.nasa.gov/catalog/PIA20896
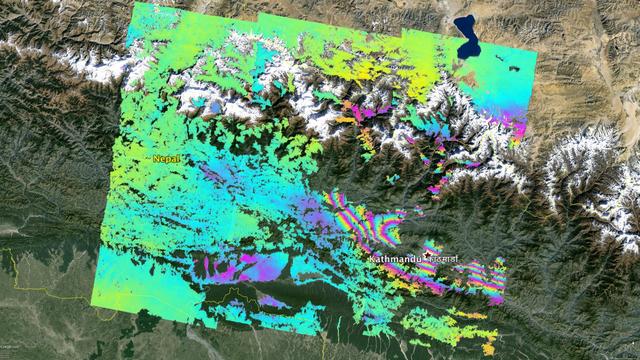
NASA and its partners are contributing important observations and expertise to the ongoing response to the April 25, 2015, magnitude 7.8 Gorkha earthquake in Nepal. The quake was the strongest to occur in that area since the 1934 Nepal-Bihar magnitude 8.0 event and caused significant regional damage and a humanitarian crisis. Scientists with the Advanced Rapid Imaging and Analysis project (ARIA), a collaboration between NASA's Jet Propulsion Laboratory, Pasadena, California, and the California Institute of Technology in Pasadena, analyzed interferometric synthetic aperture radar images from the European Union's Copernicus Sentinel-1A satellite, operated by the European Space Agency and also available from the Alaska Satellite Facility (https://www.asf.alaska.edu), to calculate a map of the deformation of Earth's surface caused by the quake. This false-color map shows the amount of permanent surface movement caused almost entirely by the earthquake, as viewed by the satellite, during a 12-day interval between two Sentinel-1 images acquired on April 17 and April 29, 2015. In the map, surface displacements are seen as color contours (or "fringes"), where each color cycle represents 8 inches (20 centimeters) of surface motion. The contours show the land around Kathmandu has moved upward by more than 40 inches (1 meter). Areas without the color contours have snow or heavy vegetation that affects the radar measurements. Scientists use these maps to build detailed models of the fault and associated land movements to better understand the impact on future earthquake activity. The background image is from Google Earth. The map contains Copernicus data (2015). http://photojournal.jpl.nasa.gov/catalog/PIA19535
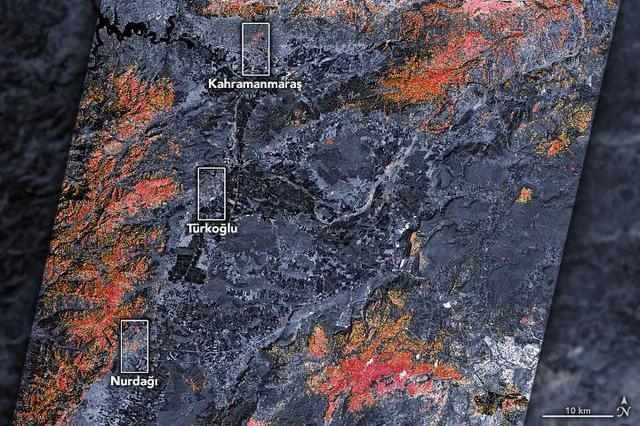
The magnitude 7.8 and 7.5 earthquakes that struck southern Turkey and western Syria on February 6, 2023, caused widespread destruction in both countries. The initial, stronger earthquake emanated from a fault 11 miles (18 kilometers) below the surface. The shallow depth meant the earthquake produced violent shaking that affected areas hundreds of miles from the epicenter, 16 miles (26 kilometers) east of the city of Nurdağı, Turkey. The second quake followed nine hours later, striking 6 miles (10 kilometers) deep, roughly 2.5 miles (4 kilometers) south-southeast of the Turkish town of Ekinözü. Hundreds of smaller aftershocks occurred in subsequent days. The preliminary damage proxy map above shows parts of the Turkish cities of Islahiye, Kahramanmaras, and Nurdağı. Dark red pixels represent areas likely to have severe damage to buildings, homes, and infrastructure or changes to landscape, while orange and yellow areas are moderately or partially damaged. Each pixel measures about 100 feet (30 meters) across (about the size of a baseball infield). The damage estimates are most accurate for urban areas and may be less accurate in the mountain and vegetated areas. The Earth Observatory of Singapore – Remote Sensing Lab and the Advanced Rapid Imaging and Analysis (ARIA) team at NASA's Jet Propulsion Laboratory and Caltech collaborated to derive the map from data collected by Japan's Advanced Land Observing Satellite-2 satellite (ALOS-2) on February 8, 2023. The satellite carries a synthetic aperture radar, a sensor that sends pulses of microwaves toward Earth's surface and records for the reflections of those waves to map the landscape, including buildings. By comparing the February 8 data to observations made by the same satellite before the earthquake (on April 7, 2021 and April 6, 2022), scientists tracked the changes and began to identify areas that were likely damaged. https://photojournal.jpl.nasa.gov/catalog/PIA25564

The Advanced Rapid Imaging and Analysis (ARIA) team at NASA's Jet Propulsion Laboratory in Pasadena, California, and Caltech, also in Pasadena, created this Damage Proxy Map (DPM) depicting areas in the northeastern part of Lombok Island, Indonesia, that are likely damaged (shown by red and yellow pixels) as a result of the major earthquake sequence (including the M6.4 July 29, the M6.9 August 5, the M5.9 August 9, and the M6.4 August 18 earthquakes) in 2018. The map is derived from synthetic aperture radar (SAR) images from the ALOS-2 satellites, operated by Japan Aerospace Exploration Agency (JAXA). The images were taken before the (May 13, 2018 00:30) and after the (August 19, 2018 00:30, both local time) earthquakes. The map covers an area of 73 by 70 kilometers, shown by the large red polygon. Each pixel measures about 30 meters across. The color variation from yellow to red indicates increasingly more significant ground surface change. Preliminary validation was done by comparing with the DigitalGlobe's high-resolution optical satellite imagery. This damage proxy map should be used as guidance to identify damaged areas, and may be less reliable over vegetated areas. For example, the scattered single colored pixels over vegetated areas may be false positives, and the lack of colored pixels over vegetated areas does not necessarily mean no damage. The DPM was created by the NASA-JPL/Caltech ARIA team, and the ALOS-2 data were provided by JAXA. The Earth Observatory of Singapore coordinated with the Sentinel Asia to timely task the ALOS-2 satellite. The algorithm development was carried out at JPL under a contract with NASA. https://photojournal.jpl.nasa.gov/catalog/PIA22495
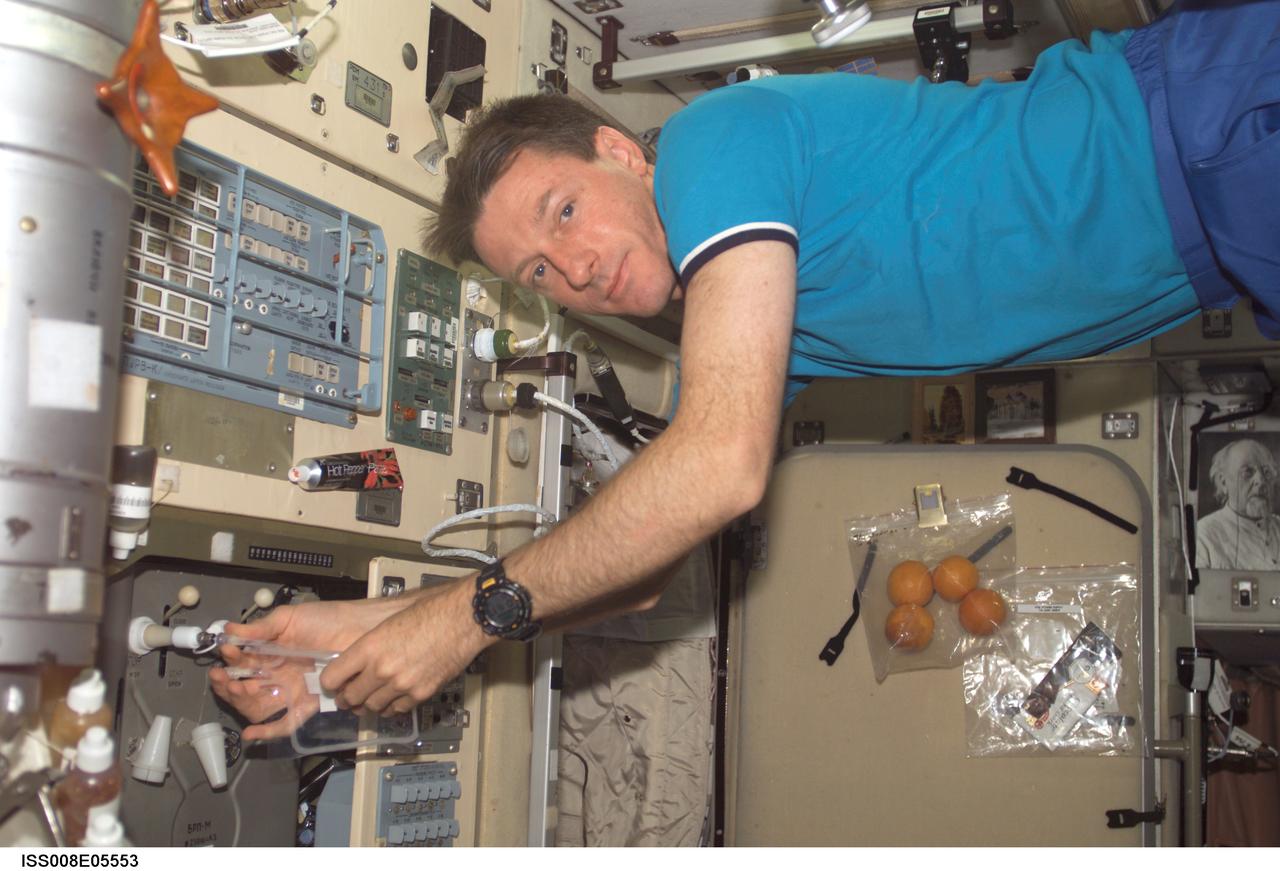
ISS008-E-05553 (7 November 2003) --- Astronaut C. Michael Foale, Expedition 8 mission commander and NASA ISS science officer, floats in front of the galley in the Zvezda Service Module on the International Space Station (ISS) as he fills a Crew Healthcare System (CheCSS) Water Microbiology (WMK) in-flight analysis bag from the potable warter dispenser.

ISS038-E-029082 (12 Jan. 2014) --- Japan Aerospace Exploration Agency astronaut Koichi Wakata, Expedition 38 flight engineer, performs microscopic analysis of the NanoRacks Module-38 Petri Dishes, using Celestron Reflective Microscope, in the Kibo laboratory of the International Space Station. These Module-38 experiments are designed by students as part of a competition sponsored by the International Space School Educational Trust (ISSET). This experiment examines three-dimensional growth of slime mold in petri dishes utilizing the NanoRacks Microscopes Facility.

S86-30336 (4 April 1986) --- Larue Forbes of CSC retrieves one of the MADS tapes for inputting into a nearby computer in the central data office.

When NASA started plarning for manned space travel in 1959, the myriad challenges of sustaining life in space included a seemingly mundane but vitally important problem: How and what do you feed an astronaut? There were two main concerns: preventing food crumbs from contaminating the spacecraft's atmosphere or floating into sensitive instruments, and ensuring complete freedom from potentially catastrophic disease-producing bacteria, viruses, and toxins. To solve these concerns, NASA enlisted the help of the Pillsbury Company. Pillsbury quickly solved the first problem by coating bite-size foods to prevent crumbling. They developed the hazard analysis and critical control point (HACCP) concept to ensure against bacterial contamination. Hazard analysis is a systematic study of product, its ingredients, processing conditions, handling, storage, packing, distribution, and directions for consumer use to identify sensitive areas that might prove hazardous. Hazard analysis provides a basis for blueprinting the Critical Control Points (CCPs) to be monitored. CCPs are points in the chain from raw materials to the finished product where loss of control could result in unacceptable food safety risks. In early 1970, Pillsbury plants were following HACCP in production of food for Earthbound consumers. Pillsbury's subsequent training courses for Food and Drug Administration (FDA) personnel led to the incorporation of HACCP in the FDA's Low Acid Canned Foods Regulations, set down in the mid-1970s to ensure the safety of all canned food products in the U.S.
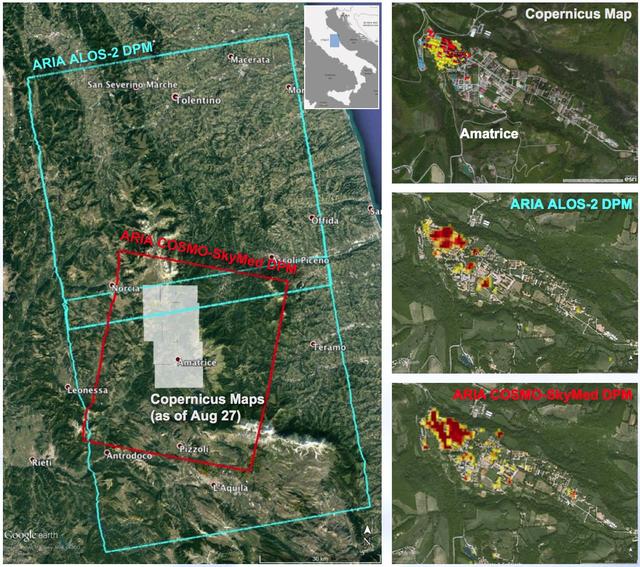
A NASA-funded program provided valuable information for responders and groups supporting the recovery efforts for the Aug. 24, 2016, magnitude 6.2 earthquake that struck central Italy. The earthquake caused significant loss of life and property damage in the town of Amatrice. To assist in the disaster response efforts, scientists at NASA's Jet Propulsion Laboratory and Caltech, both in Pasadena, California, obtained and used radar imagery of the earthquake's hardest-hit region to discriminate areas of damage from that event. The views indicate the extent of damage caused by the earthquake and subsequent aftershocks in and around Amatrice, based on changes to the ground surface detected by radar. The color variations from yellow to red indicate increasingly more significant ground surface change. The damage maps were created from data obtained before and after the earthquake by satellites belonging to the Italian Space Agency (ASI) and the Japan Aerospace Exploration Agency (JAXA). The radar-derived damage maps compare well with a damage map produced by the European Commission Copernicus Emergency Management Service based upon visual inspection of high-resolution pre-earthquake aerial photographs and post-earthquake satellite optical imagery, and provide broader geographic coverage of the earthquake's impact in the region. The X-band COSMO-SkyMed (CSK) data were provided through a research collaboration with ASI and were acquired on July 3, August 20, and August 28, 2016. The L-band ALOS/PALSAR-2 data were provided by JAXA through its science research program and were acquired on September 9, 2015, January 27, 2016, and August 24, 2016. The radar data were processed by the Advanced Rapid Imaging and Analysis (ARIA) team at JPL and Caltech. ARIA is a NASA-funded project that is building an automated system for demonstrating the ability to rapidly and reliably provide GPS and satellite data to support the local, national and international hazard monitoring and response communities. Using space-based imagery of disasters, ARIA data products can provide rapid assessments of the geographic region impacted by a disaster, as well as detailed imaging of the locations where damage occurred. Radar can "see" through clouds day and night and measure centimeter-level ground movements. NASA is partnering with the Indian Space Research Organization (ISRO) to develop the NASA ISRO Synthetic Aperture Radar (NISAR) mission that will routinely provide systematic SAR observations of Earth's land and ice-covered surfaces at least twice every 12 days, enabling greater scientific understanding of the dynamic processes that drive the Earth system and natural hazards, as well as providing actionable support for disaster response and recovery. http://photojournal.jpl.nasa.gov/catalog/PIA21091
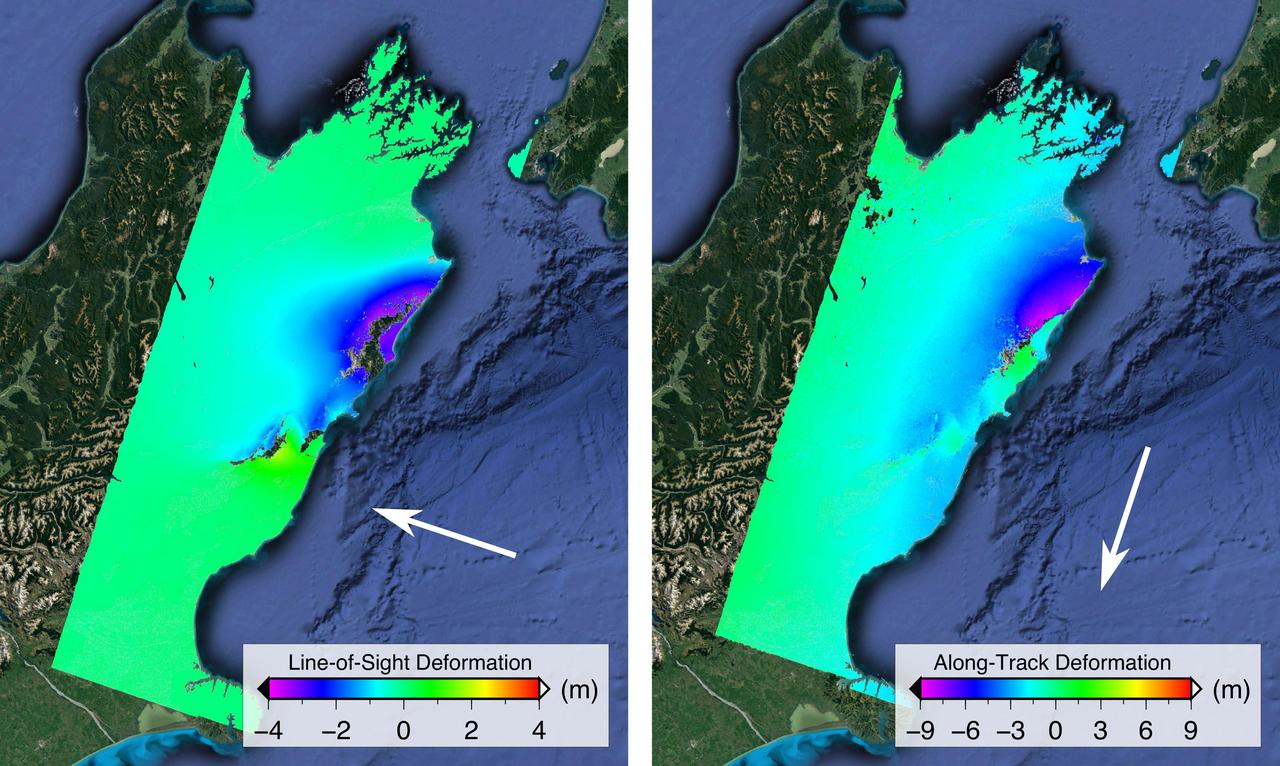
NASA and its partners are contributing important observations and expertise to the ongoing response to the Nov. 14, 2016, magnitude 7.8 Kaikoura earthquake in New Zealand. This shallow earthquake was so complex and unusual, it is likely to change how scientists think about earthquake hazards in plate boundary zones around the world. Scientists with the Advanced Rapid Imaging and Analysis project (ARIA), a collaboration between NASA's Jet Propulsion Laboratory, Pasadena, California, and Caltech in Pasadena, analyzed interferometric synthetic aperture radar images from the PALSAR-2 instrument on the ALOS-2 satellite operated by the Japan Aerospace Exploration Agency (JAXA) to calculate maps of the deformation of Earth's surface caused by the quake. Two maps show motion of the surface in two different directions. Each false-color map shows the amount of permanent surface movement caused almost entirely by the earthquake, as viewed by the satellite, during a 28-day interval between two ALOS-2 wide-swath images acquired on Oct. 18 and Nov. 15, 2016. In these two new maps made from the wide-swath images, the colors of the surface displacements are proportional to the surface motion. The wide-swath images cover the entire 106-mile (170-kilometer) length of the complex set of earthquake ruptures. The arrows show the direction of the radar motion measurement. In the left image, the blue and purple tones show the areas where the land around the Kaikoura peninsula in the Marlborough region of New Zealand's South Island has moved toward the satellite by up to 13.2 feet (4 meters), both eastward and upward. In the right image, the blue and purple tones show the areas that moved to the north by up to 30 feet (9 meters) and green tones show the area that moved to the south. The sharp line of color change is across the Kekerengu Fault, which had the largest amount of motion in the earthquake. Field studies found maximum rupture at the surface was measured at 39 feet (12 meters) of horizontal displacement. Several other faults have sharp color changes due to smaller amounts of motion, with a total of at least 12 faults rupturing in this single large earthquake. Areas without color have snow, heavy vegetation or open water that prevents the radar measurements from being coherent between satellite images – a required condition to measure ground displacement. Scientists use these maps to build detailed models of the fault slip at depth and associated land movements to better understand the impact on future earthquake activity. The PALSAR-2 data were provided by JAXA through the Committee on Earth Observation Satellites (CEOS) and through scientific research projects. The background image is from Google Earth. http://photojournal.jpl.nasa.gov/catalog/PIA21210
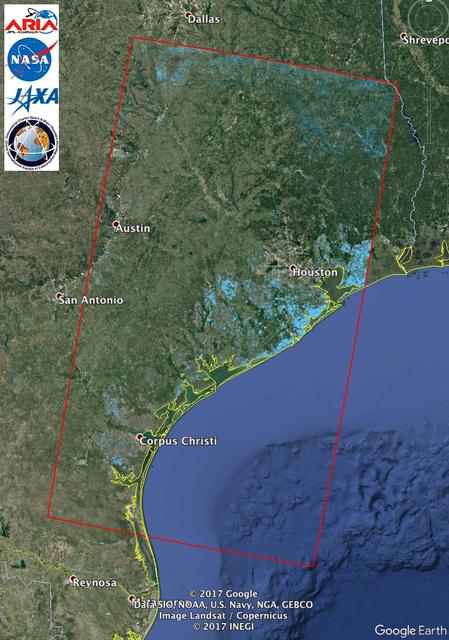
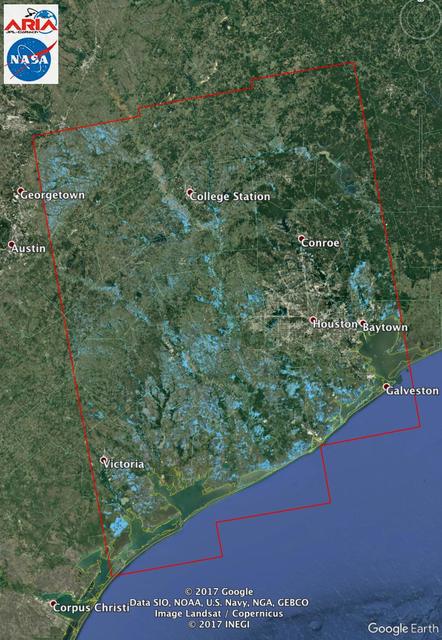
The Advanced Rapid Imaging and Analysis (ARIA) team at NASA's Jet Propulsion Laboratory in Pasadena, California, used synthetic aperture radar imagery from the Japan Aerospace Exploration Agency's (JAXA) ALOS-2 satellite to create this Flood Proxy Map depicting areas of Southeastern Texas that are likely flooded as a result of Hurricane Harvey (shown by light blue pixels). The map is derived images taken before (July 30, 2017) and after (Aug. 27, 2017) Hurricane Harvey made landfall. The map covers an area of 220 by 400 miles (350 by 640 kilometers). Each pixel measures about 55 yards (50 meters) across. Local ground observations provided anecdotal preliminary validation. The results are also cross-validated with ARIA Sentinel-1 flood proxy map v0.2. The map should be used as guidance, and may be less reliable over urban areas. ALOS-2 data were accessed through the International Charter. https://photojournal.jpl.nasa.gov/catalog/PIA21931
The Advanced Rapid Imaging and Analysis (ARIA) team at NASA's Jet Propulsion Laboratory created this Damage Proxy Map (DPM) of Tongatapu, the main island of Tonga, following the landfall of Cyclone Gita, a Category 4 storm that hit Tonga on Feb. 12-13, 2018. The map depicts areas that are likely damaged from the storm, shown by red and yellow pixels. The map was produced by comparing two pairs of interferometric synthetic aperture radar (InSAR) images from the COSMO-SkyMed satellites, operated by the Italian Space Agency (ASI). The pre- and post-cyclone images were acquired on Jan. 19 and Feb. 13, 2018, respectively. The later image was acquired just 4-1/2 hours after the peak damage by the cyclone. The map covers the entire island of Tongatapu (the 25-by-25-mile, or 40-by-40 kilometer SAR image footprint indicated with the large red polygon). Each pixel measures about 98 feet (30 meters) across. The color variation from yellow to red indicates increasingly more significant ground surface change. Preliminary validation of the SAR data was done by comparing them with high-resolution optical imagery acquired by DigitalGlobe. This Damage Proxy Map should be used as guidance to identify damaged areas and may be less reliable over vegetated and flooded areas. https://photojournal.jpl.nasa.gov/catalog/PIA22257
The Advanced Rapid Imaging and Analysis (ARIA) team at NASA's Jet Propulsion Laboratory in Pasadena, California, used synthetic aperture radar imagery from the European Space Agency's (ESA) Sentinel-1 satellite to create this Flood Proxy Map of Southeastern Texas, showing areas that are likely flooded as a result of Hurricane Harvey (light blue pixels). The images used to create the map were taken before (Aug. 5, 2017) and after (Aug. 29, 2017) Hurricane Harvey made landfall. The map covers an area of 155 by 211 miles (250 by 340 kilometers). Each pixel measures about 33 yards (30 meters) across. Local ground observations provided anecdotal preliminary validation. The results were also cross-validated with the ARIA ALOS-2 flood proxy map v0.2. The map should be used as guidance, and may be less reliable over urban areas. Sentinel-1 data were accessed through the Copernicus Open Access Hub. Contains modified Copernicus Sentinel data 2017. https://photojournal.jpl.nasa.gov/catalog/PIA21932
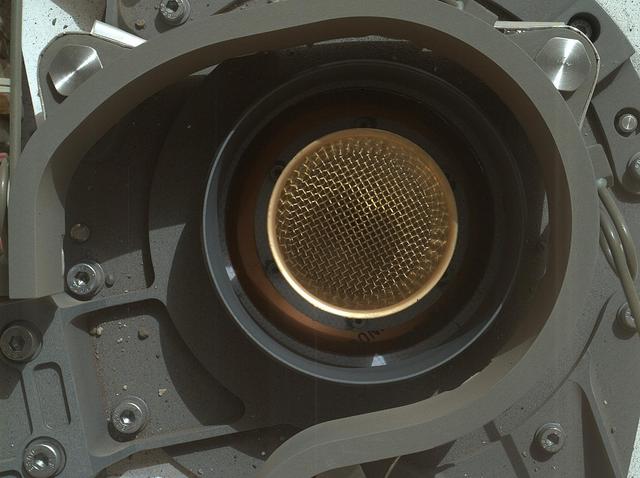
This image from NASA Curiosity rover shows the open inlet where powdered rock and soil samples will be funneled down for analysis.
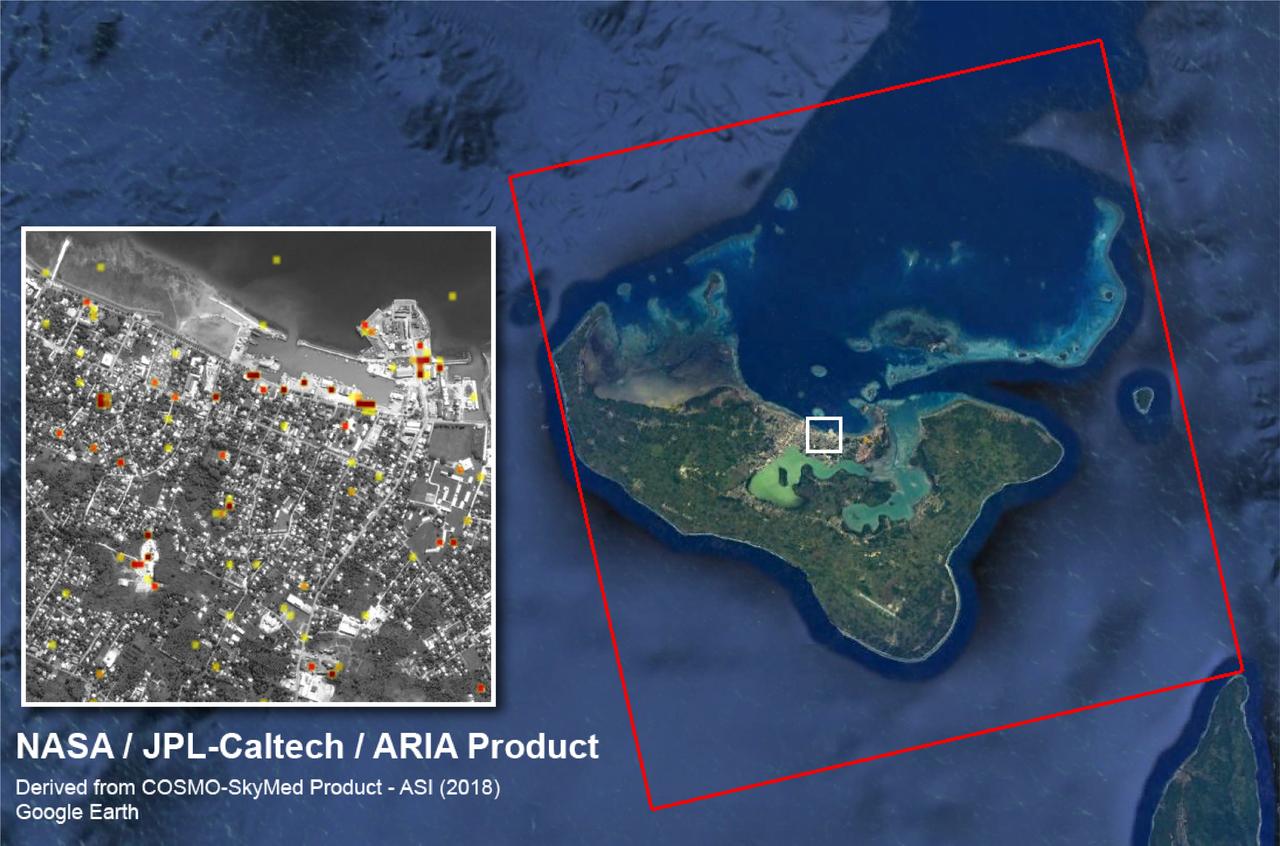
The Advanced Rapid Imaging and Analysis (ARIA) team at NASA's Jet Propulsion Laboratory in Pasadena, California, and Caltech, also in Pasadena, created this Damage Proxy Map (DPM) depicting areas of Eastern Puerto Rico that are likely damaged (shown by red and yellow pixels) as a result of Hurricane Maria (a Category 4 hurricane at landfall in Puerto Rico on Sept. 20, 2017). The map is derived from synthetic aperture radar (SAR) images from the Copernicus Sentinel-1A and Sentinel-1B satellites, operated by the European Space Agency (ESA). The images were taken before (March 25, 2017) and after (Sept. 21, 2017) the storm's landfall. The map was delivered to responding agencies, including the Federal Emergency Management Agency (FEMA), on Sept. 22, 2017. FEMA combined the map with building infrastructure data to estimate a damage density map, which was sent to its Urban Search and Rescue teams in the field in Puerto Rico. The map covers an area of 105 by 60 miles (169 by 96 kilometers), shown by the large red polygon in the figure. The inset, denoted by the orange rectangle, shows the extent of damage in and around the capital city of San Juan. Each pixel measures about 98 feet (30 meters) across. The color variation from yellow to red indicates increasingly more significant ground surface change. Preliminary validation was done by comparing the map with anecdotal reports of damage. This damage proxy map should be used as guidance to identify damaged areas, and may be less reliable over vegetated and flooded areas. Sentinel-1 data were accessed through the Copernicus Open Access Hub. The image contains modified Copernicus Sentinel data (2017), processed by ESA and analyzed by the NASA-JPL/Caltech ARIA team. This research was carried out at JPL under a contract with NASA. https://photojournal.jpl.nasa.gov/catalog/PIA21964
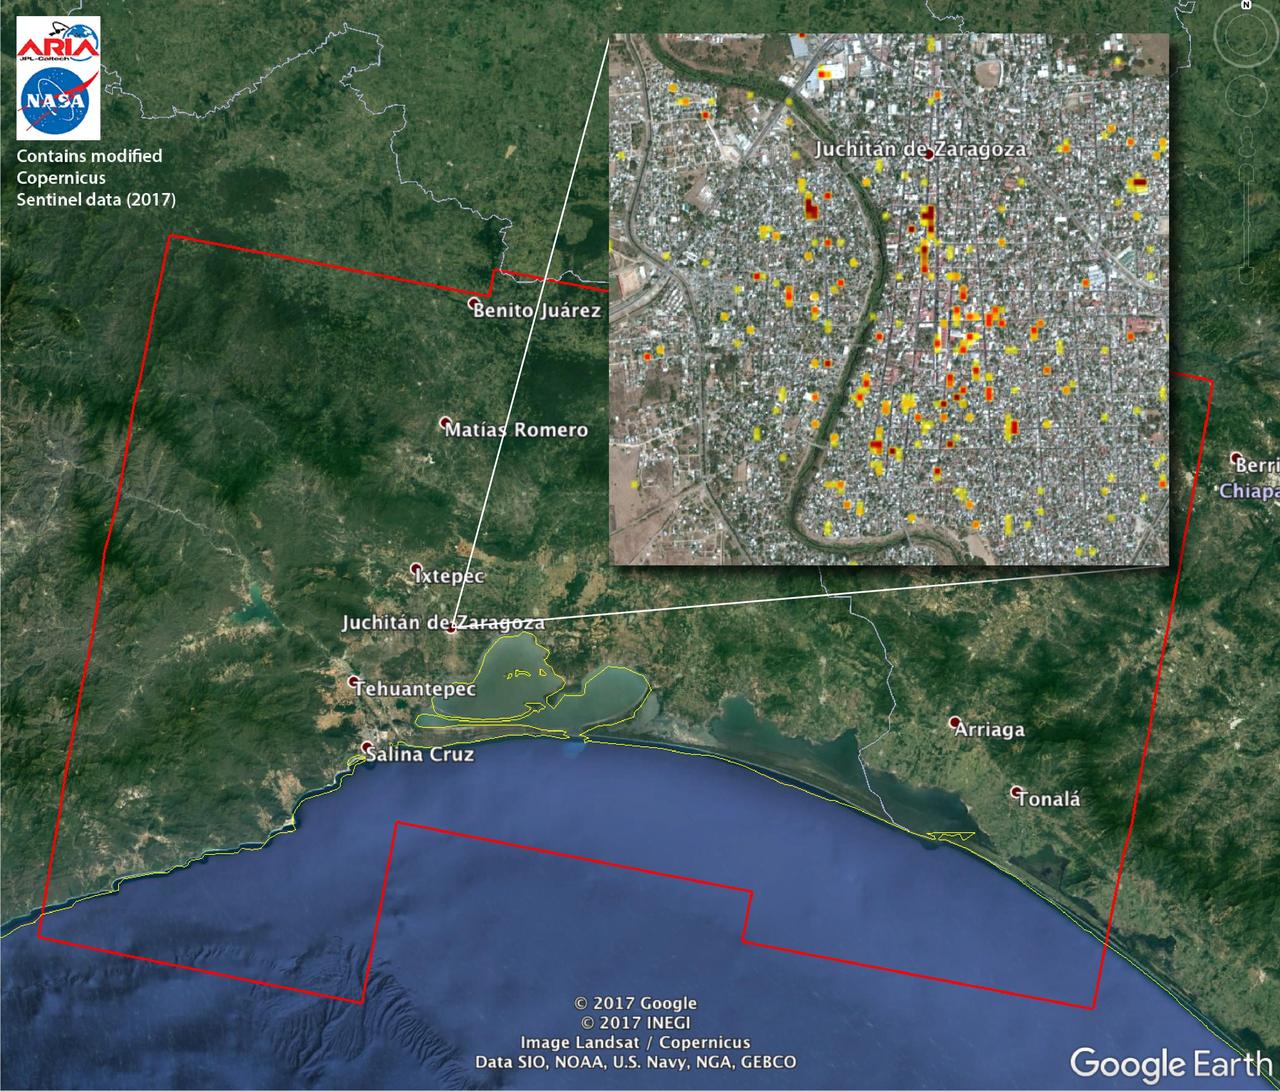
The Advanced Rapid Imaging and Analysis (ARIA) team at NASA's Jet Propulsion Laboratory in Pasadena, California, and Caltech, also in Pasadena, created this Damage Proxy Map (DPM) depicting areas of Southern Mexico that are likely damaged (shown by red and yellow pixels) from the magnitude 8.1 Chiapas earthquake of Sept. 7, 2017 (near midnight local time, early morning on Sept. 8 UTC). The map is derived from synthetic aperture radar (SAR) images from the Copernicus Sentinel-1A and Sentinel-1B satellites, operated by the European Space Agency (ESA). The images were taken before (Sept. 7, 2017 UTC) and after (Sept. 13, 2017 UTC) the earthquake. The map covers an area of 155 by 106 miles (250 by 170 kilometers). Each pixel measures about 33 yards (30 meters) across. The color variation from yellow to red indicates increasingly more significant ground surface change. Preliminary validation was done by comparing the SAR images to optical satellite imagery from DigitalGlobe. This damage proxy map should be used as guidance to identify damaged areas, and may be less reliable over vegetated areas. Sentinel-1 data were accessed through the Copernicus Open Access Hub. The image contains modified Copernicus Sentinel data (2017), processed by ESA and analyzed by the NASA-JPL/Caltech ARIA team. This research was carried out at JPL under a contract with NASA. https://photojournal.jpl.nasa.gov/catalog/PIA21956
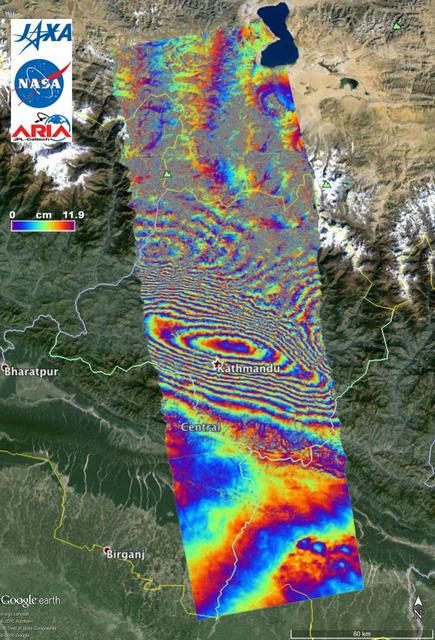
NASA and its partners are contributing important observations and expertise to the ongoing response to the April 25, 2015, magnitude 7.8 Gorkha earthquake in Nepal. The quake was the strongest to occur in that area since the 1934 Nepal-Bihar magnitude 8.0 event and caused significant regional damage and a humanitarian crisis. Scientists with the Advanced Rapid Imaging and Analysis project (ARIA), a collaboration between NASA's Jet Propulsion Laboratory, Pasadena, California, and the California Institute of Technology in Pasadena, analyzed interferometric synthetic aperture radar images from the PALSAR-2 instrument on the ALOS-2 satellite operated by the Japan Aerospace Exploration Agency (JAXA) to calculate a map of the deformation of Earth's surface caused by the quake. This false-color map shows the amount of permanent surface movement caused almost entirely by the earthquake, as viewed by the satellite, during a 70-day interval between two ALOS-2 images, acquired February 21 and May 2, 2015. In the map, surface displacements are seen as color contours (or "fringes"), where each color cycle represents 4.7 inches (11.9 centimeters) of surface motion. The contours show the land around Kathmandu has moved toward the satellite by up to 4.6 feet (1.4 meter), or 5.2 feet (1.6 meters) if we assume purely vertical motion. Areas without the color contours have snow or heavy vegetation that affects the radar measurements. Scientists use these maps to build detailed models of the fault and associated land movements to better understand the impact on future earthquake activity. The PALSAR-2 data were provided by JAXA through the Committee on Earth Observation Satellite (CEOS) in support of the response effort. The background image is from Google Earth. http://photojournal.jpl.nasa.gov/catalog/PIA19383
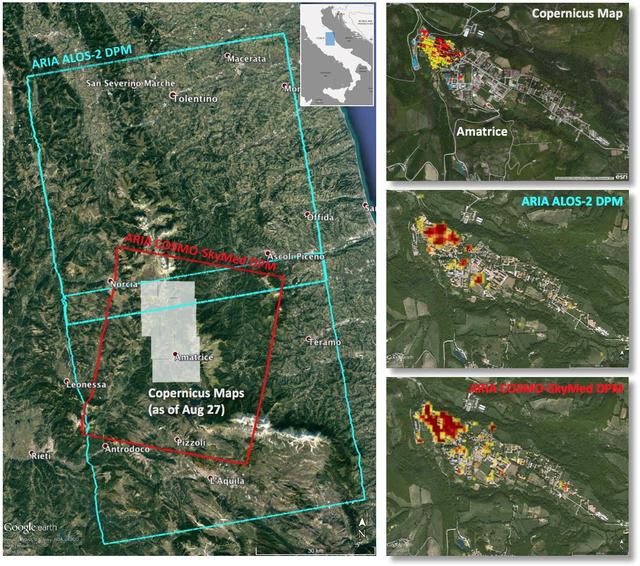
Italy earthquake. The quake has caused significant damage in the historic town of Amatrice. To assist in the disaster response efforts, scientists at NASA's Jet Propulsion Laboratory, Pasadena, California, and the California Institute of Technology in Pasadena, in collaboration with the Italian Space Agency (ASI), generated this image of the earthquake's hardest-hit region. The 40-by-75 mile (65-by-120 kilometer) Damage Proxy Map (DPM) was derived from two consecutive frames of the Japan Aerospace Exploration Agency's (JAXA's) L-band interferometric synthetic aperture radar (InSAR) data from the ALOS-2 satellite (cyan rectangles), and the 25-by-31 mile (40-by-50 kilometer) DPM was derived from InSAR data from the Agenzia Spaciale Italiana's (ASI's) X-band COSMO-SkyMed satellite (red rectangle). Both DPMs cover the historic town of Amatrice, revealing severe damage in the western side of the town (right panels). The time span of the data for the change is Jan. 27, 2016 to Aug. 24, 2016 for ALOS-2 and Aug. 20, 2016 to Aug. 28, 2016 for COSMO-SkyMed. Each pixel in the damage proxy map is about 100 feet (30 meters) across. The SAR data were processed by the Advanced Rapid Imaging and Analysis (ARIA) team at JPL and Caltech. The technique uses a prototype algorithm to rapidly detect surface changes caused by natural or human-produced damage. The assessment technique is most sensitive to destruction of the built environment. When the radar images areas with little to no destruction, its image pixels are transparent. Increased opacity of the radar image pixels reflects damage, with areas in red reflecting the heaviest damage to cities and towns. The color variations from yellow to red indicate increasingly more significant ground surface change. Preliminary validation was done by comparing the DPMs to a damage assessment map produced by the Copernicus Emergency Management Service, which is based on visual inspection of before and after high-resolution aerial imagery -- the extent indicated with gray boxes in the left panel. http://photojournal.jpl.nasa.gov/catalog/PIA20897
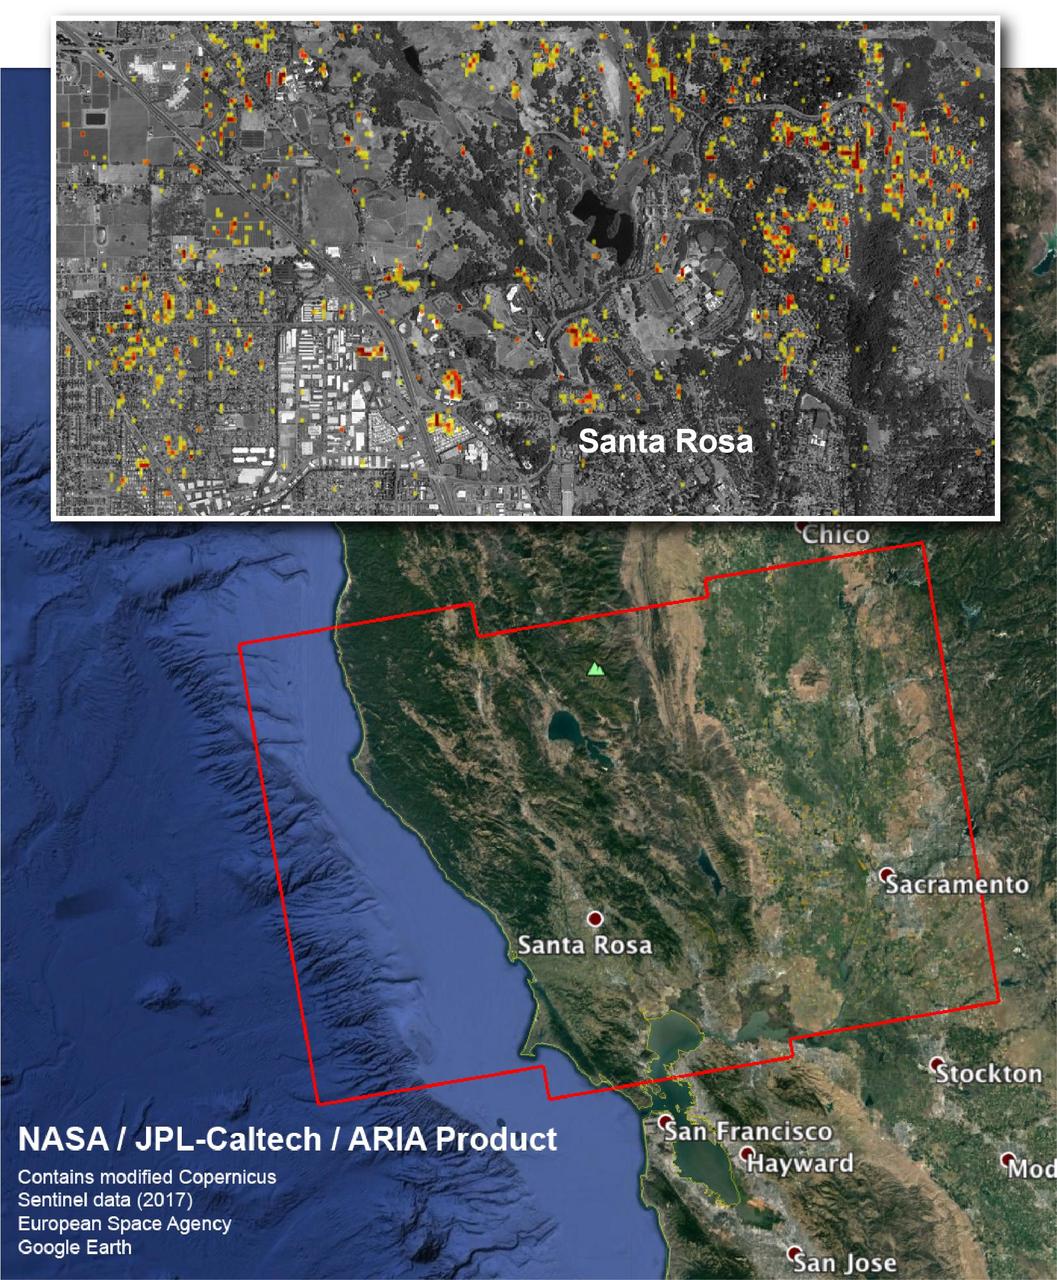
The Advanced Rapid Imaging and Analysis (ARIA) team at NASA's Jet Propulsion Laboratory in Pasadena, California, and Caltech, also in Pasadena, created this Damage Proxy Map depicting areas in Northern California that are likely damaged (shown by red and yellow pixels) as a result of the region's current outbreak of wildfires. The map is derived from synthetic aperture radar (SAR) images from the Copernicus Sentinel-1 satellites, operated by the European Space Agency (ESA). The images were taken before (Sep. 27, 2017, 7 p.m. PDT) and after (Oct. 9, 2017, 7 p.m. PDT) the onset of the fires. The map has been provided to various agencies to aid in the wildfire response. The map covers the area within the large red polygon, and measures 155 by 106 miles (250 by 170 kilometers). The illustrative figure from the map depicted in the inset shows damage in the city of Santa Rosa. Each pixel in the Damage Proxy Map measures about 98 feet (30 meters) across. The color variation from yellow to red indicates increasingly more significant ground surface change. Preliminary validation was done by comparing to optical satellite imagery from DigitalGlobe. This Damage Proxy Map should be used as guidance to identify damaged areas, and may be less reliable over vegetated areas. Sentinel-1 data were accessed through the Copernicus Open Access Hub. The image contains modified Copernicus Sentinel data (2017), processed by ESA and analyzed by the NASA-JPL/Caltech ARIA team. This research was carried out at JPL under a contract with NASA. https://photojournal.jpl.nasa.gov/catalog/PIA22048
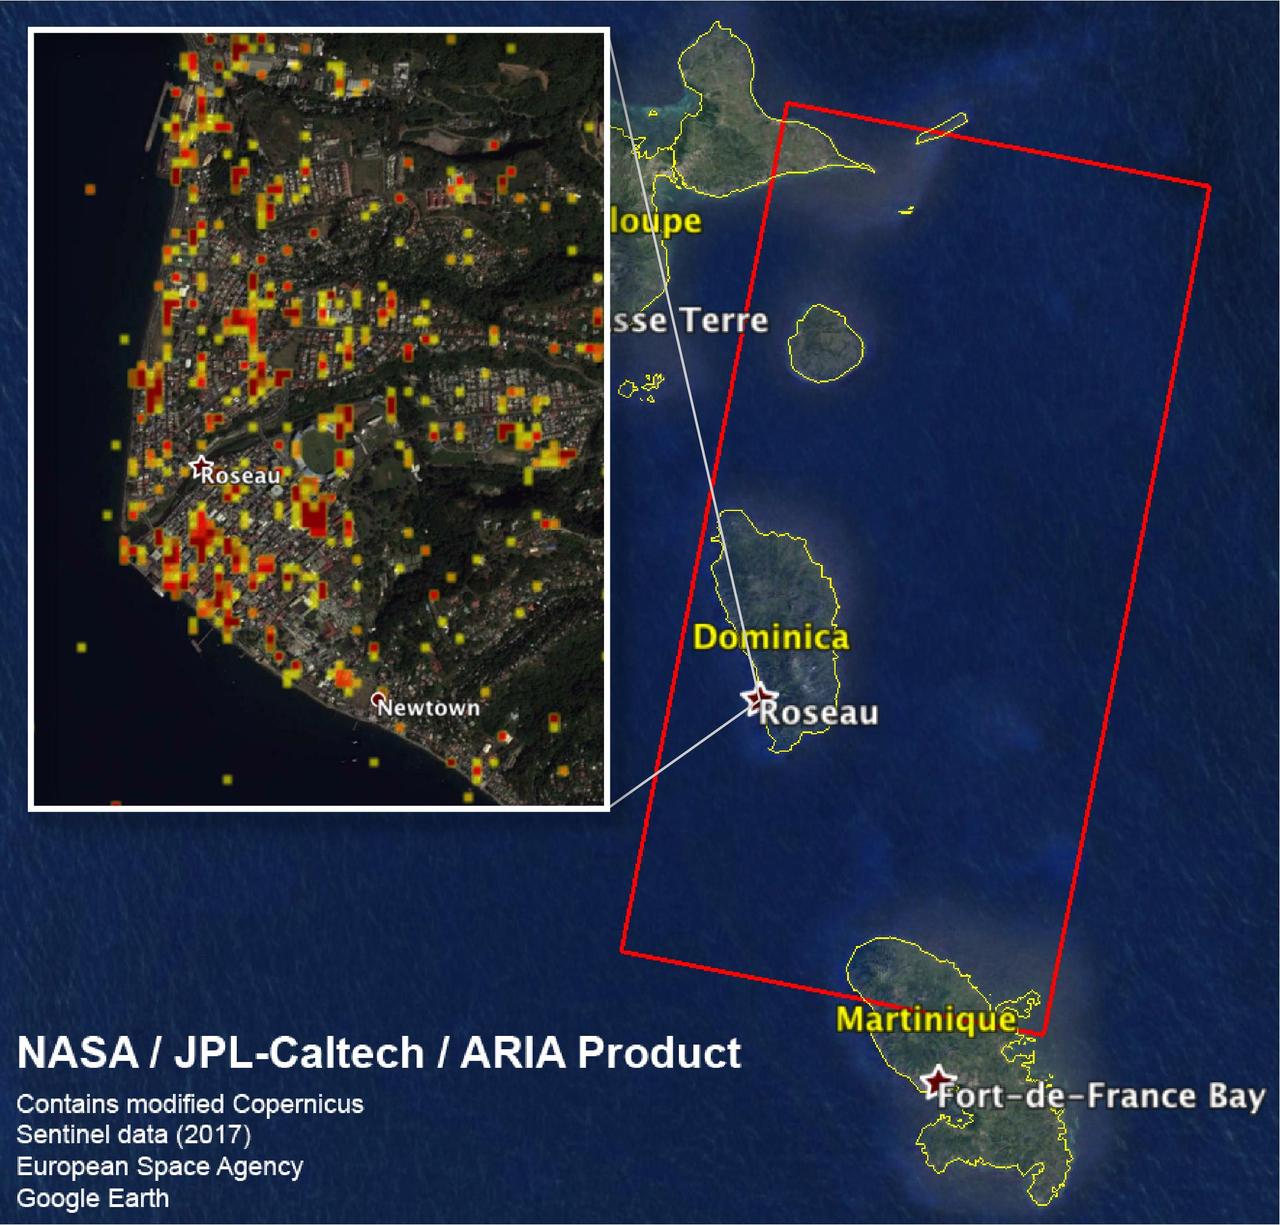
The Advanced Rapid Imaging and Analysis (ARIA) team at NASA's Jet Propulsion Laboratory in Pasadena, California, and Caltech, also in Pasadena, created this Damage Proxy Map (DPM) depicting areas including the Commonwealth of Dominica, that are likely damaged (shown by red and yellow pixels) as a result of Hurricane Maria (a Category 5 storm at landfall in Dominica on Sept. 18, 2017). The map is derived from synthetic aperture radar (SAR) images from the Copernicus Sentinel-1 satellites, operated by the European Space Agency (ESA). The images were taken before (March 27, 2017) and after (Sept. 23, 2017) the landfall of the storm. The map covers the area within the large red polygon, which measures 53 by 106 miles (85 by 170 kilometers). Each pixel measures about 98 feet (30 meters) across. The color variation from yellow to red indicates increasingly more significant ground surface change. Preliminary validation was done by comparing the data to a crowdsourced map by Clemson Center for Geospatial Technologies and optical satellite imagery feom DigitalGlobe. This damage proxy map should be used as guidance to identify damaged areas, and may be less reliable over vegetated areas. Sentinel-1 data were accessed through the Copernicus Open Access Hub. The image contains modified Copernicus Sentinel data (2017), processed by ESA and analyzed by the NASA/JPL-Caltech ARIA team. This research was carried out at JPL under a contract with NASA. https://photojournal.jpl.nasa.gov/catalog/PIA22037

Terry C. Quist (center), high school student from San Antonio, Texas, discusses his proposed Skylab experiment with Marshall Space Flight Center’s (MSFC) Henry Floyd (left), coordinator of the Skylab Student Experiment Project, and DR. Raymond Gause, scientific advisor to Quist. The student’s experiment, “Earth Orbital Neutron Analysis”, was aimed at learning more about the source of neutrons in the solar system by seeking the number and direction from which each comes. Quist was among the 25 winners of a contest in which some 3,500 high school students proposed experiments for the following year’s Skylab mission. Of the 25 students, 6 did not see their experiments conducted on Skylab because the experiments were not compatible with Skylab hardware and timelines. Of the 19 remaining, 11 experiments required the manufacture of equipment, such as Quist’s experiment, which required detector hardware.
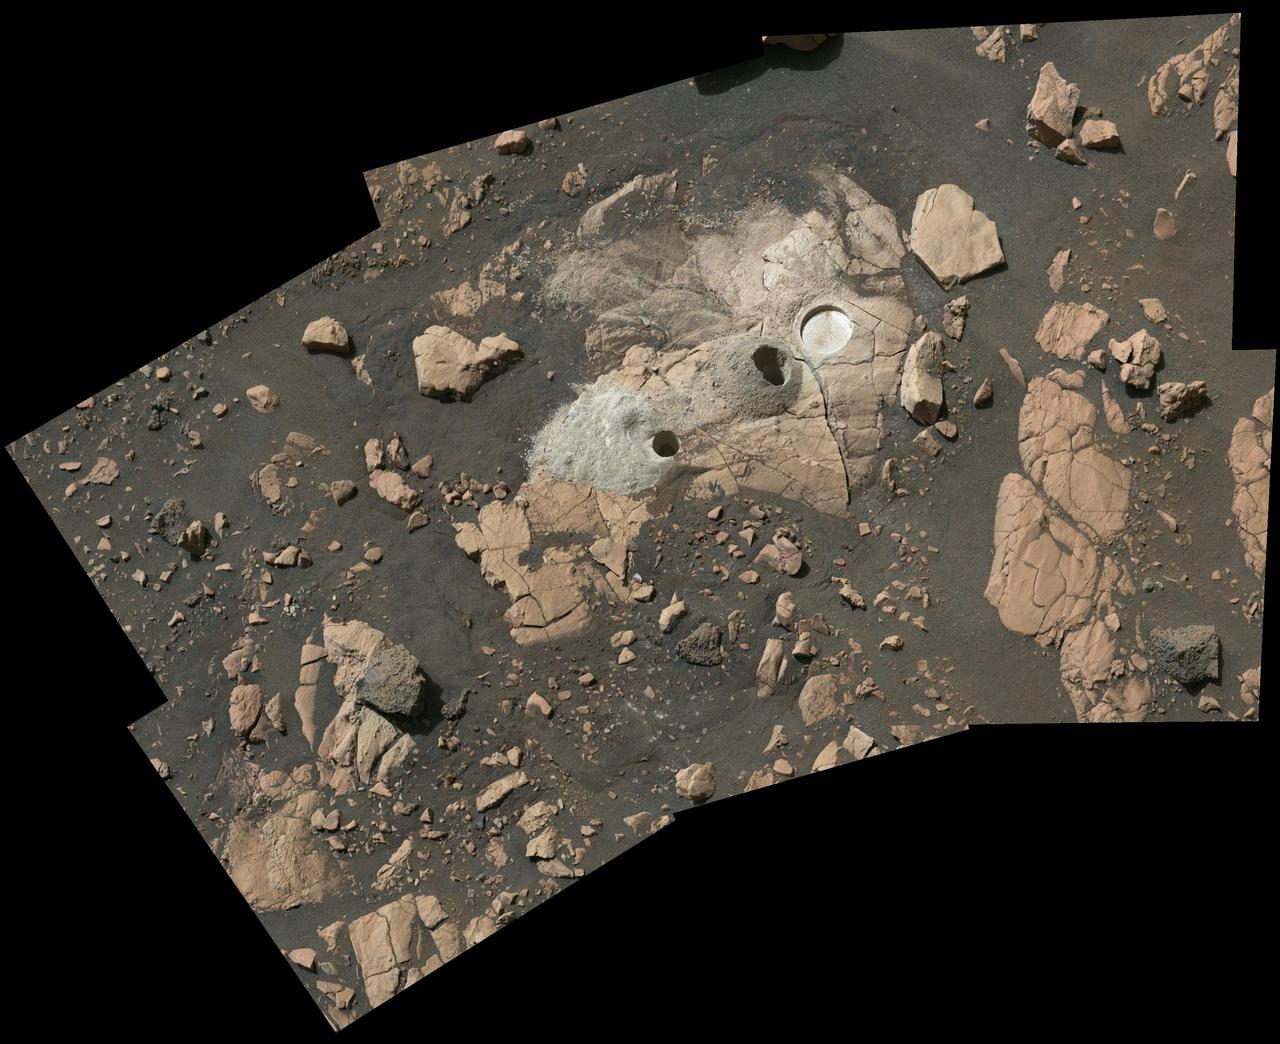
Composed of multiple images from NASA's Perseverance Mars rover, this mosaic shows a rocky outcrop called "Wildcat Ridge," where the rover extracted two rock cores and abraded a circular patch to investigate the rock's composition. The site is in the delta, a fan-shaped area where, billions of years ago, a river once flowed into a lake in Jezero Crater. Scientists consider this area one of the best places on Mars to search for potential signs of ancient microbial life. The images were obtained by the Mastcam-Z instrument on Aug. 4, 2022, the 518th Martian day, or sol, of the rover's mission. For scale, the bright circular abrasion patch on the right is approximately 2 inches (5 centimeters) in diameter. The color bands of the image have been processed to improve visual contrast and accentuate color differences. The rock cores obtained by Perseverance – each about the size of a piece of classroom chalk – were sealed in ultra-clean sample tubes. They are currently stored in the rover's Sampling and Caching System. The verification of ancient life on Mars carries an enormous burden of proof. A key objective for Perseverance's mission on Mars is astrobiology, including the search for signs of ancient microbial life. The rover will characterize the planet's geology and past climate, pave the way for human exploration of the Red Planet, and be the first mission to collect and cache Martian rock and regolith (broken rock and dust). Subsequent NASA missions, in cooperation with ESA (European Space Agency), would send spacecraft to Mars to collect these sealed samples from the surface and return them to Earth for in-depth analysis. The Mars 2020 Perseverance mission is part of NASA's Moon to Mars exploration approach, which includes Artemis missions to the Moon that will help prepare for human exploration of the Red Planet. https://photojournal.jpl.nasa.gov/catalog/PIA24928
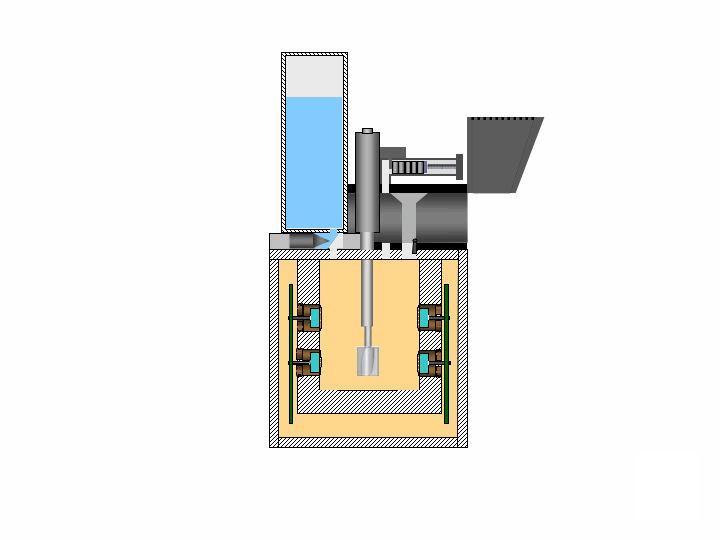
This is an illustration of soil analysis on NASA Phoenix Mars Lander Wet Chemistry Lab WCL on board the Microscopy, Electrochemistry, and Conductivity Analyzer MECA instrument.
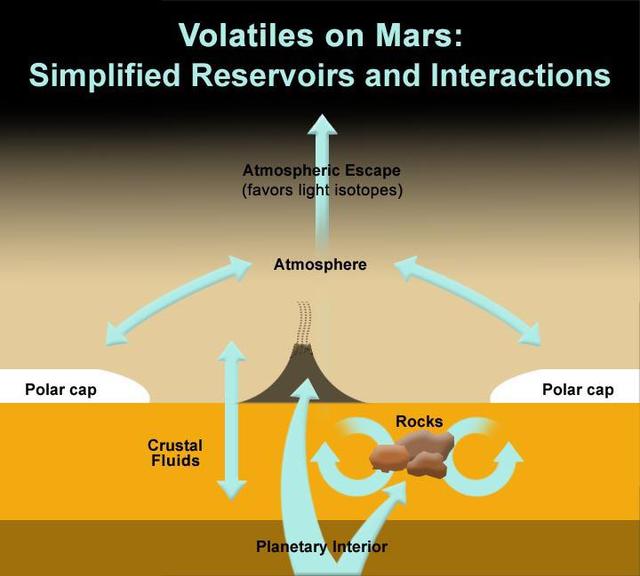
This illustration based on results from Sample Analysis at Mars, or SAM, instrument on NASA Curiosity rover shows the locations and interactions of volatiles on Mars.
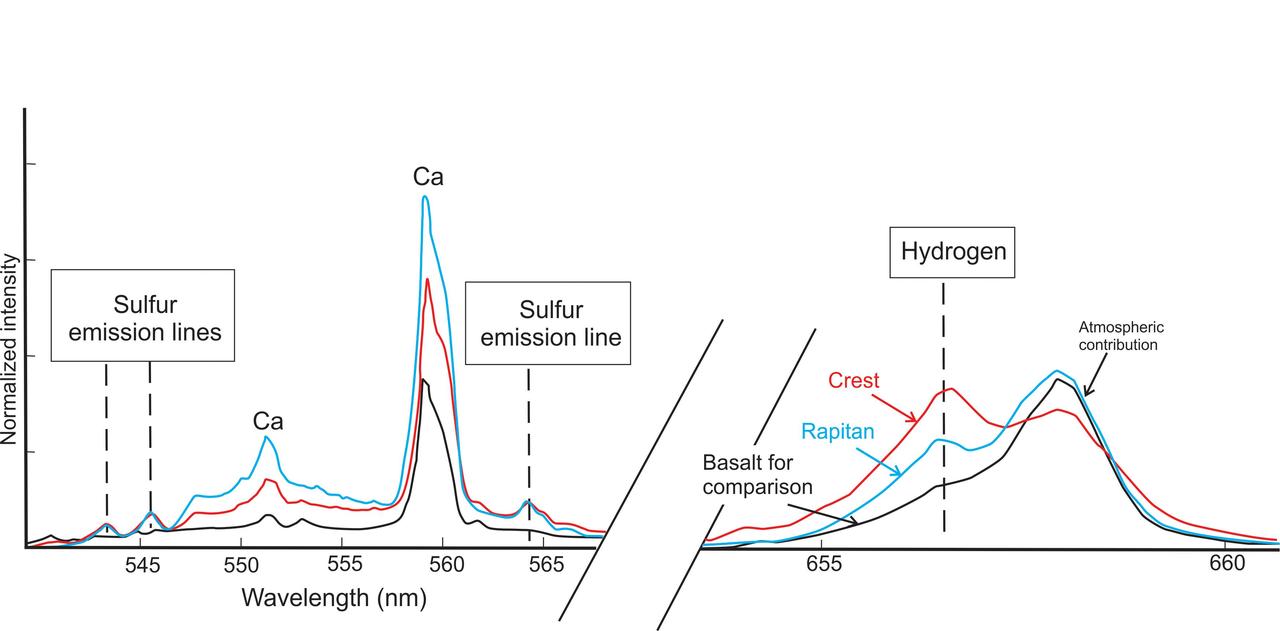
This graphic from NASA Curiosity mission shows an analysis of the composition of two rocks called Crest and Rapitan in the Yellowknife Bay area of Mars
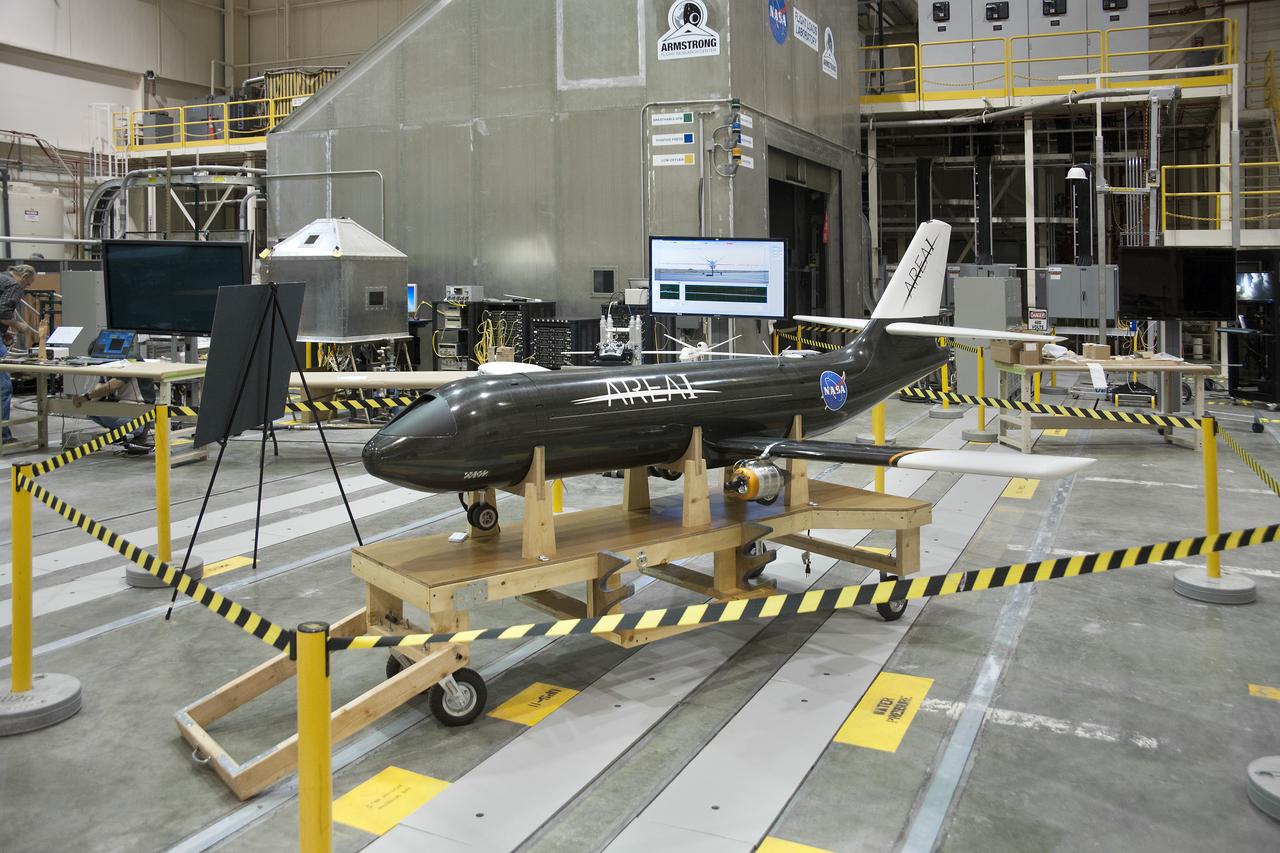
The objectives of testing on PTERA include the development of tools and vetting of system integration, evaluation of vehicle control law, and analysis of SAW airworthiness to examine benefits to in-flight efficiency.
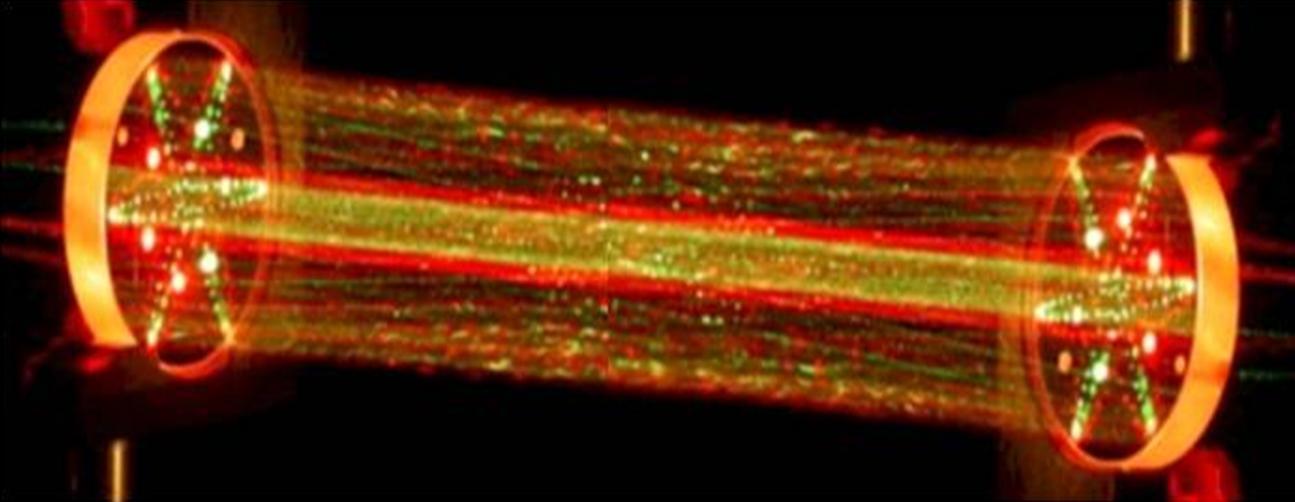
This picture shows a lab demonstration of the measurement chamber inside the Tunable Laser Spectrometer, an instrument that is part of the Sample Analysis at Mars investigation on NASA Curiosity rover.
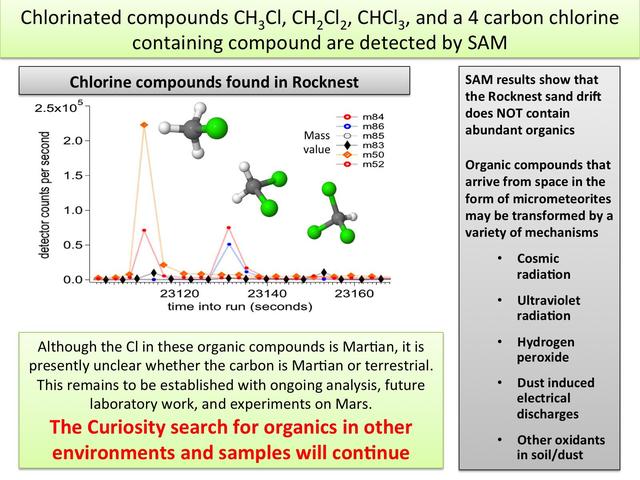
The first examinations of Martian soil by the Sample Analysis at Mars, or SAM, instrument on NASA Mars Curiosity rover show no definitive detection of Martian organic molecules at this point.
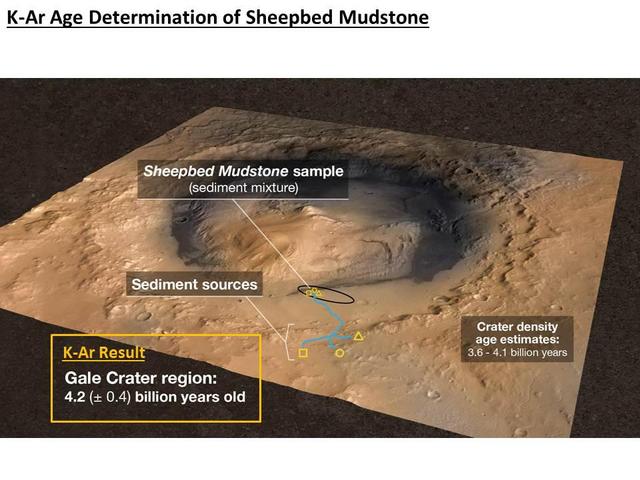
A rock in the Sheepbed mudstone deposit in the Yellowknife Bay area inside Gale Crater is the first rock on Mars ever to be dated by laboratory analysis of its ingredients.
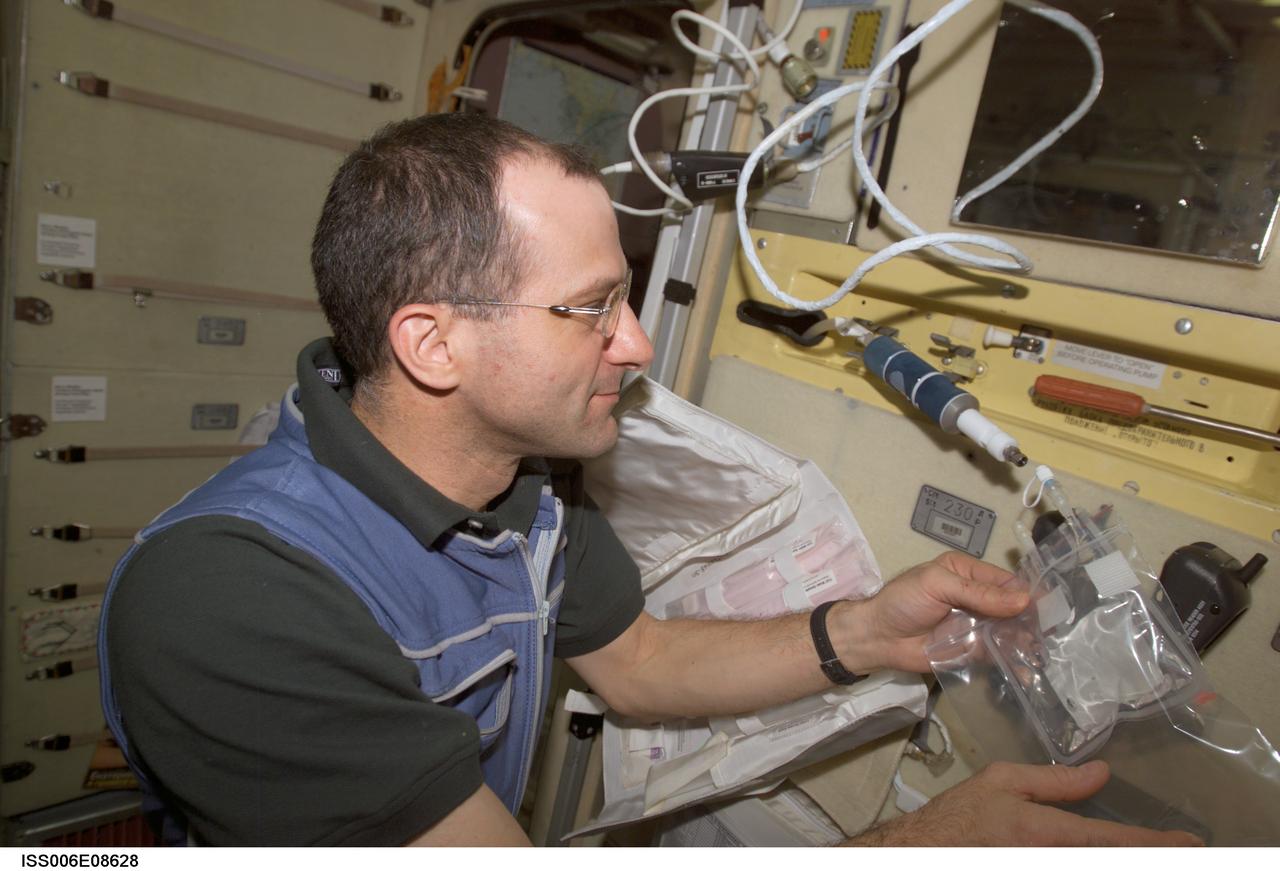
ISS006-E-08628 (18 December 2002) --- Astronaut Donald R. Pettit, Expedition Six NASA ISS science officer, is pictured in the Zvezda Service Module on the International Space Station (ISS) during the scheduled Week 3 potable water sampling and on-orbit chemical/microbial analysis of the SM environment control and life support system.
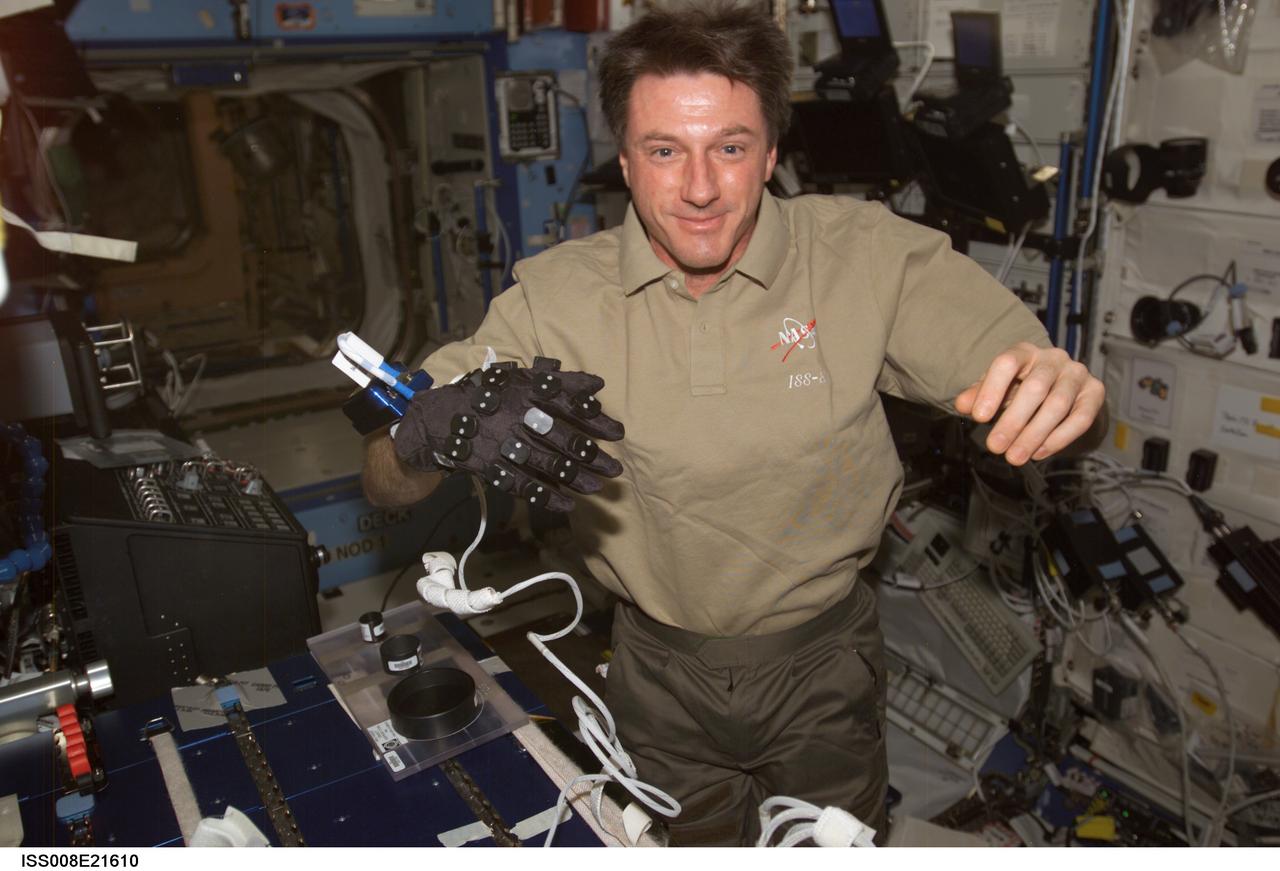
ISS008-E-21610 (15 April 2004) --- Astronaut C. Michael Foale, Expedition 8 commander and NASA ISS science officer, completes his third and final data collection with the Hand Posture Analysis (HPA) investigation in the Destiny laboratory on the International Space Station (ISS). After setting up the video tape recorder (VTR) for documenting the activities, Foale used the posture acquisition glove (PAG), which has delicate sensors attached to the tops of the fingers, to operate the handgrip dynamometer (HGD).
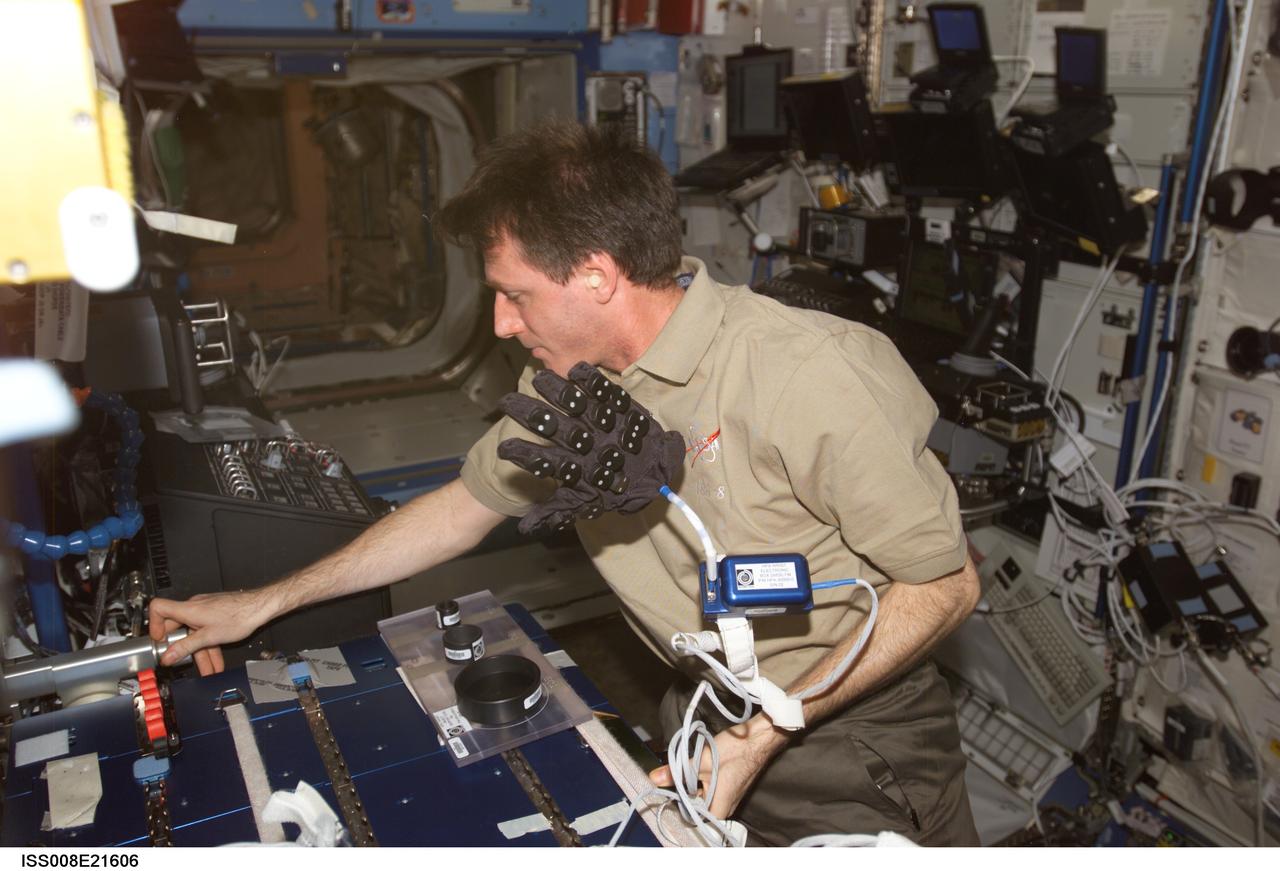
ISS008-E-21606 (15 April 2004) --- Astronaut C. Michael Foale, Expedition 8 commander and NASA ISS science officer, completes his third and final data collection with the Hand Posture Analysis (HPA) investigation in the Destiny laboratory on the International Space Station (ISS). After setting up the video tape recorder (VTR) for documenting the activities, Foale used the posture acquisition glove (PAG), which has delicate sensors attached to the tops of the fingers, to operate the handgrip dynamometer (HGD).
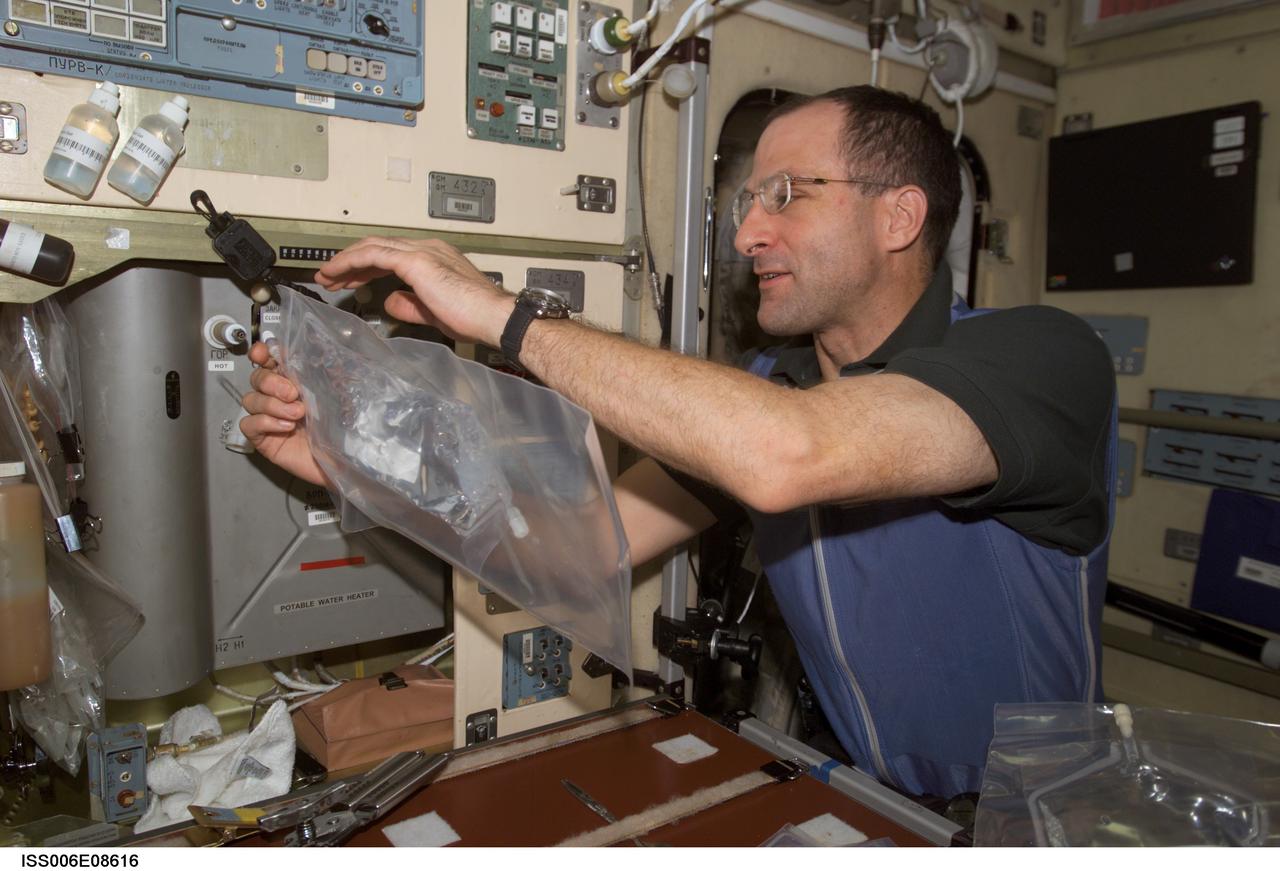
ISS006-E-08616 (18 December 2002) --- Astronaut Donald R. Pettit, Expedition Six NASA ISS science officer, is pictured in the Zvezda Service Module on the International Space Station (ISS) during the scheduled Week 3 potable water sampling and on-orbit chemical/microbial analysis of the SM environment control and life support system.
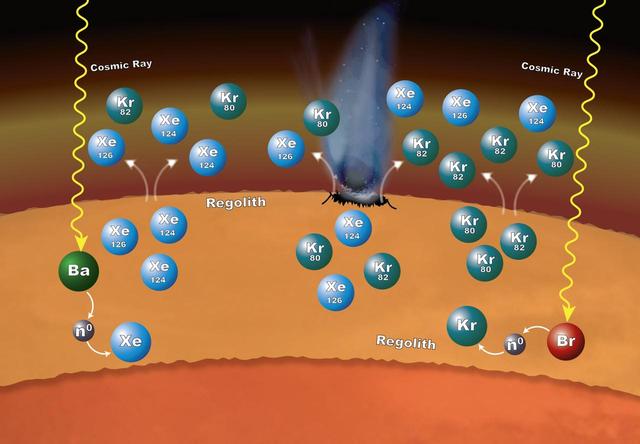
Chemistry that takes place in the surface material on Mars can explain why particular xenon (Xe) and krypton (Kr) isotopes are more abundant in the Martian atmosphere than expected. The isotopes -- variants that have different numbers of neutrons -- are formed in the loose rocks and material that make up the regolith -- the surface layer down to solid rock. The chemistry begins when cosmic rays penetrate into the surface material. If the cosmic rays strike an atom of barium (Ba), the barium can lose one or more of its neutrons (n0). Atoms of xenon can pick up some of those neutrons – a process called neutron capture – to form the isotopes xenon-124 and xenon-126. In the same way, atoms of bromine (Br) can lose some of their neutrons to krypton, leading to the formation of krypton-80 and krypton-82 isotopes. These isotopes can enter the atmosphere when the regolith is disturbed by impacts and abrasion, allowing gas to escape. http://photojournal.jpl.nasa.gov/catalog/PIA20847

KENNEDY SPACE CENTER, FLA. - Jeff Thon, an SRB mechanic with United Space Alliance, tests a technique for vertical solid rocket booster propellant grain inspection. The inspection of segments is required as part of safety analysis.
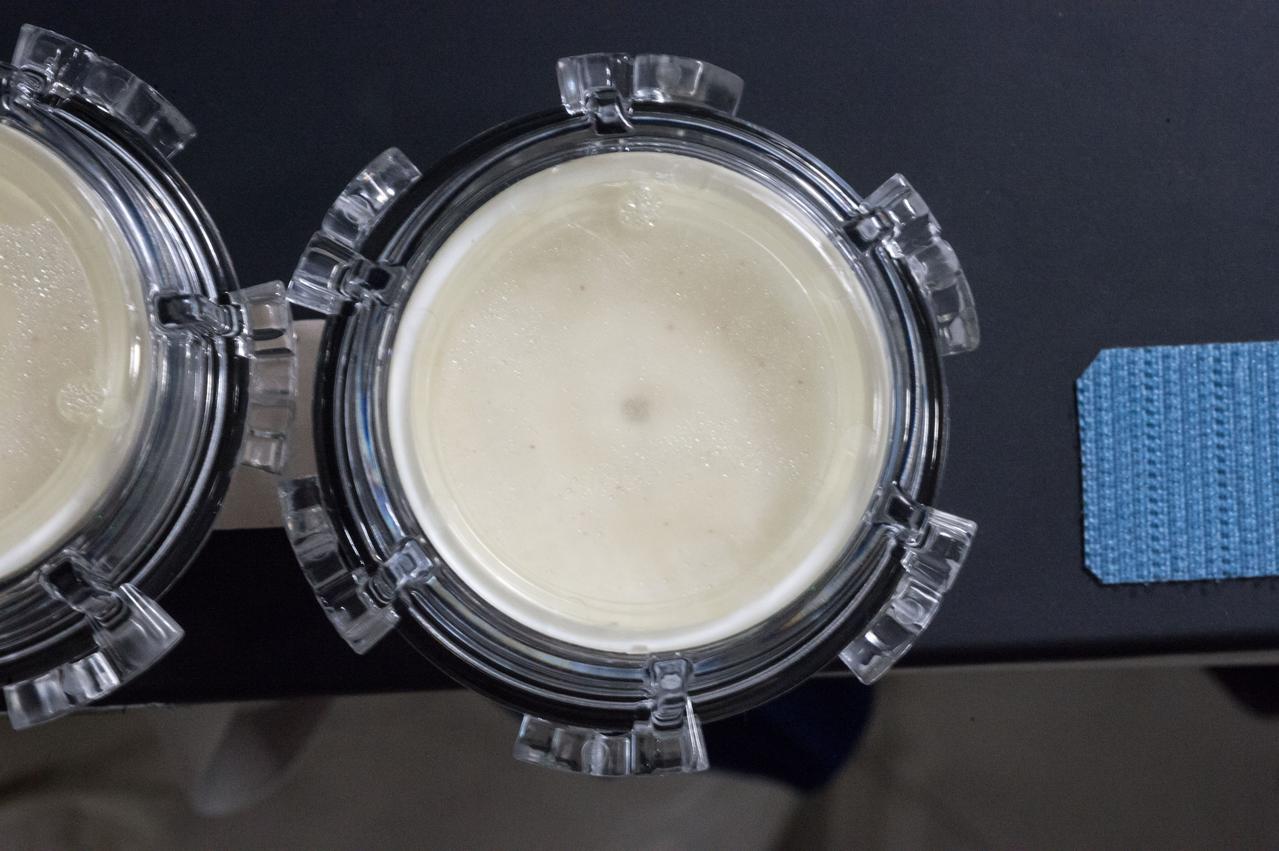
iss050e011727 (11/25/2016) --- View of Aquapad Microbial Contamination after incubation. Photo was taken during Expedition 40.
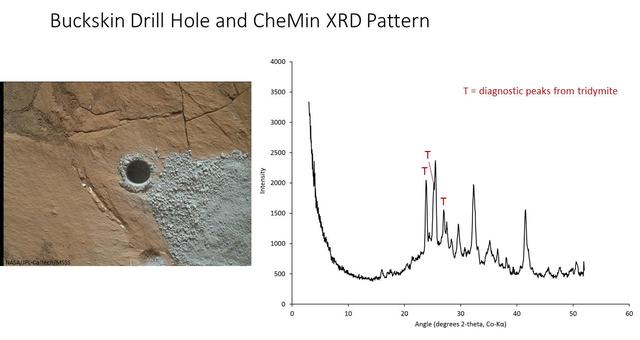
The graph at right presents information from the NASA Curiosity Mars rover's onboard analysis of rock powder drilled from the "Buckskin" target location, shown at left. X-ray diffraction analysis of the Buckskin sample inside the rover's Chemistry and Mineralogy (CheMin) instrument revealed the presence of a silica-containing mineral named tridymite. This is the first detection of tridymite on Mars. Peaks in the X-ray diffraction pattern are from minerals in the sample, and every mineral has a diagnostic set of peaks that allows identification. The image of Buckskin at left was taken by the rover's Mars Hand Lens Imager (MAHLI) camera on July 30, 2015, and is also available at PIA19804. http://photojournal.jpl.nasa.gov/catalog/PIA20271
San Antonio, Texas high school student, Terry C. Quist (left), and Dr. Raymond Gause of the Marshall Space Flight Center (MSFC), discuss the student’s experiment to be performed aboard the Skylab the following year. His experiment, “Earth Orbital Neutron Analysis” required detectors such as the one he is examining in this photo. The detector was to be attached to a water tank in Skylab. Neutrons striking the detectors left traces that were brought out by a chemical etching process after the Skylab mission. Quist’s experiment seeked to record neutron hits, count them, and determine their direction. This information was to help determine the source of neutrons in the solar system. Quist was among 25 winners of a contest in which some 3,500 high school students proposed experiments for the following year’s Skylab mission. The nationwide scientific competition was sponsored by the National Science Teachers Association and the National Aeronautics and Space Administration (NASA). The winning students, along with their parents and sponsor teachers, visited MSFC two months earlier where they met with scientists and engineers, participated in design reviews for their experiments, and toured MSFC facilities. Of the 25 students, 6 did not see their experiments conducted on Skylab because the experiments were not compatible with Skylab hardware and timelines. Of the 19 remaining, 11 experiments required the manufacture of additional equipment. The equipment for the experiments was manufactured at MSFC.

This satellite interferometric synthetic aperture radar image using COSMO-SkyMed radar data, depicts the relative deformation of Earth surface at Kilauea between Feb. 11, 2011 and March 7, 2011 two days following the start of the current eruption.
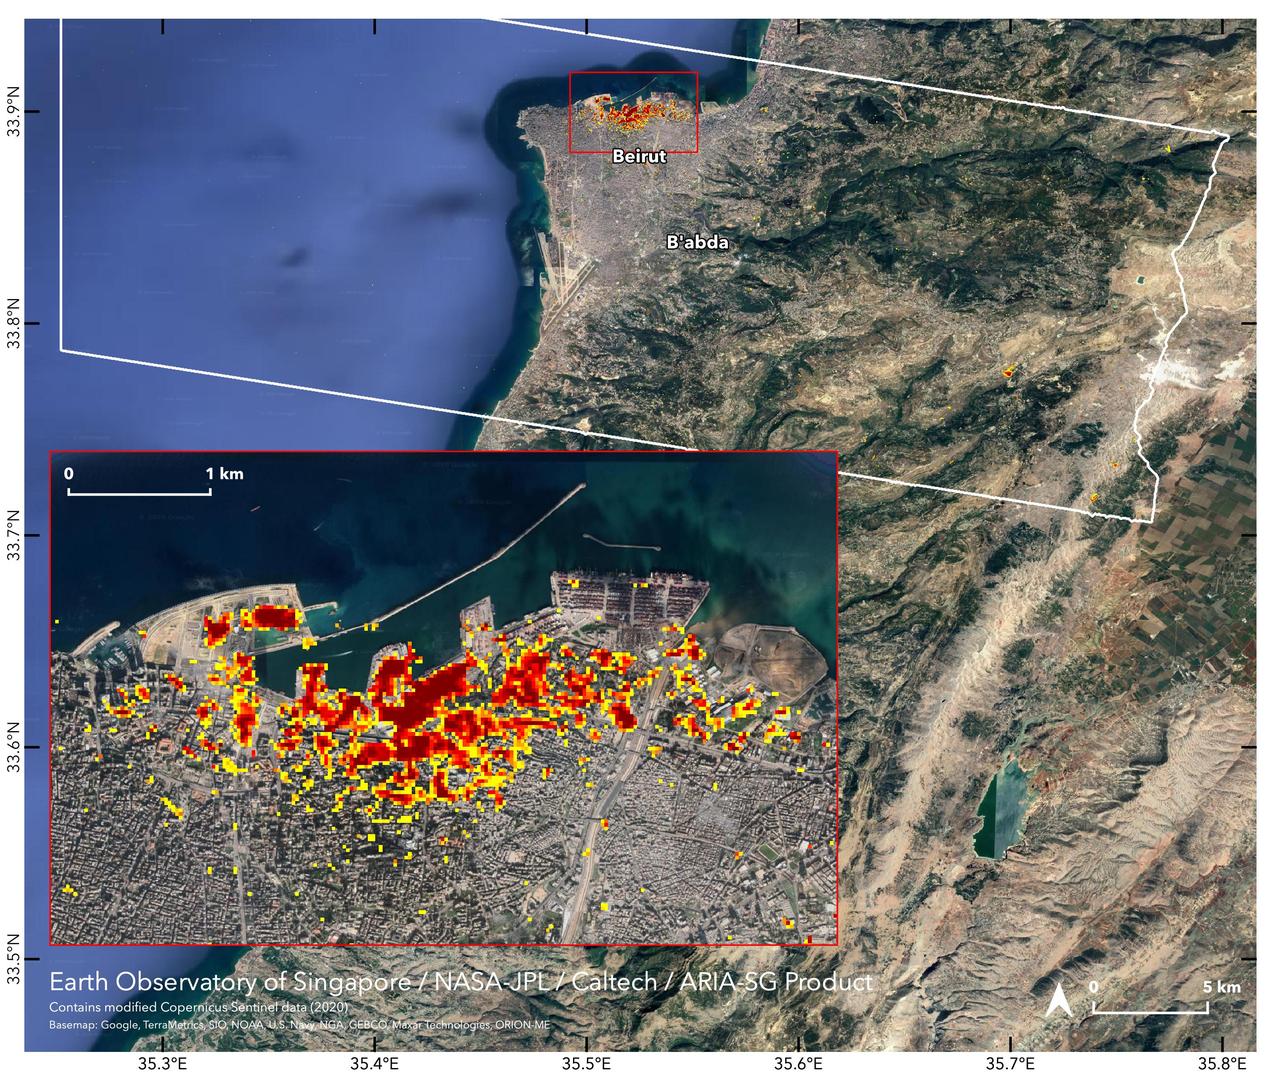
NASA's ARIA team, in collaboration with the Earth Observatory of Singapore, used satellite data to map the extent of likely damage following a massive explosion in Beirut. Dark red pixels represent the most severe damage. Areas in orange are moderately damaged, and areas in yellow are likely to have sustained somewhat less damage. Each colored pixel represents an area of 30 meters (33 yards). https://photojournal.jpl.nasa.gov/catalog/PIA23692