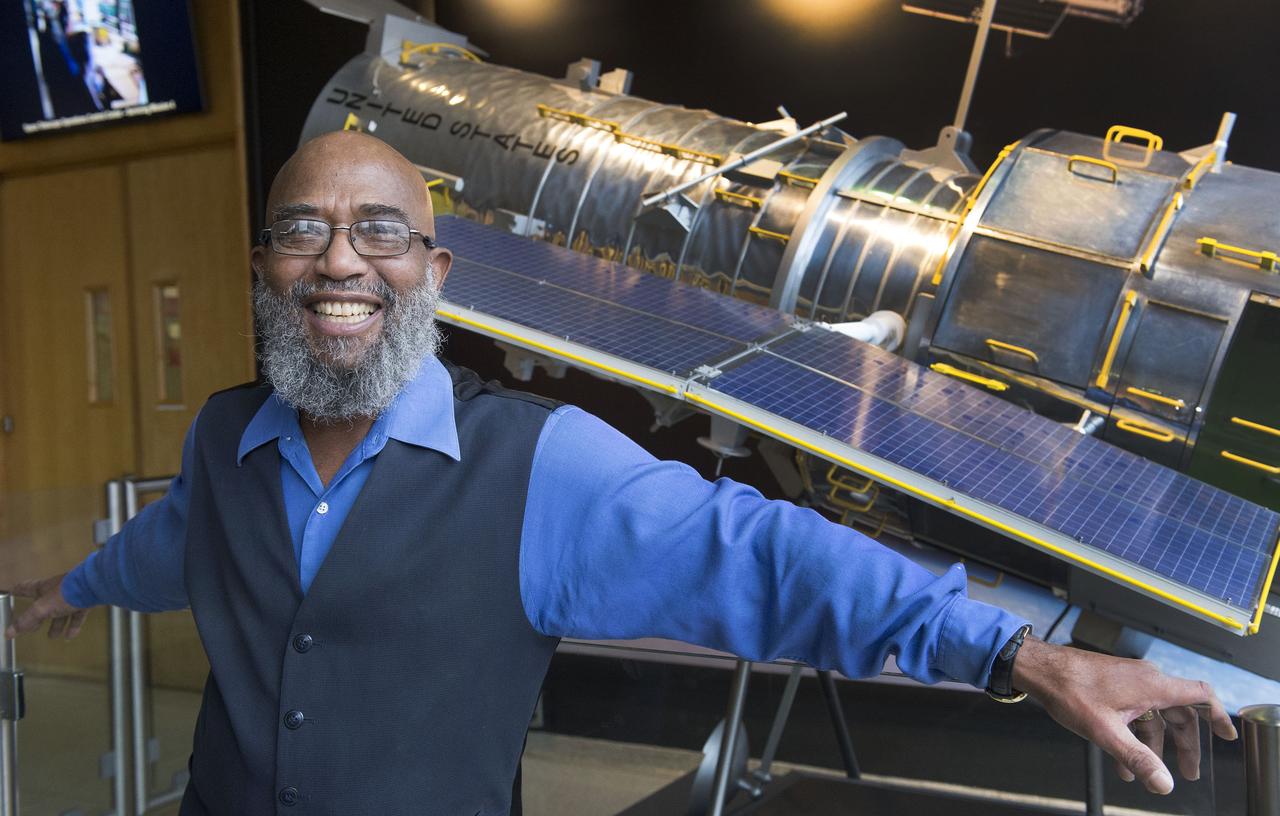
Josh White Jr. was keynote speaker for Exploring Leadership Colloquium, he performed “A Musical and Storytelling Walk Through Our Civil Rights History” at Goddard on January 19, 2017. He is a musician, vocalist, guitarist, songwriter, Tony Award-winning actor, Grammy-nominated recording artist, teacher, and social activist.

Josh White Jr. was keynote speaker for Exploring Leadership Colloquium “A Musical and Storytelling Walk Through Our Civil Rights History” at Goddard on January 19, 2017. He is a musician, vocalist, guitarist, Tony Award-winning actor, Grammy-nominated recording arist, teacher, and social activist.
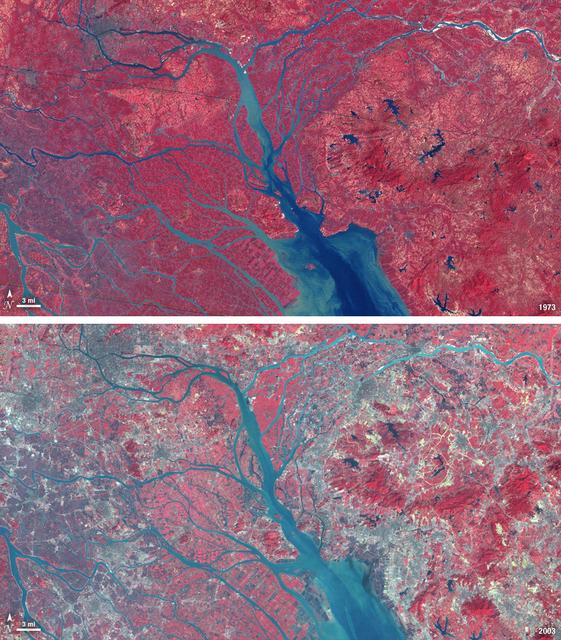
In 1979, China established two special economic zones around the Pearl River Delta, north of Hong Kong. This image, taken by Landsat 3 on October 19, 1973, shows that the region was rural when the zone was established. Plant-covered land, which is red in this false-color image, dominates the scene. Square grids are agriculture. By January 10, 2003, when Landsat 7 took this image, the Pearl River Delta was a densely populated urban corridor with several large cities. The urban areas are gray in this image. The region is a major manufacturing center with an economy the size of Taiwan’s. As of 2010, the Pearl River Economic Zone had a population of 36 million people. ---- NASA and the U.S. Department of the Interior through the U.S. Geological Survey (USGS) jointly manage Landsat, and the USGS preserves a 40-year archive of Landsat images that is freely available over the Internet. The next Landsat satellite, now known as the Landsat Data Continuity Mission (LDCM) and later to be called Landsat 8, is scheduled for launch in 2013. In honor of Landsat’s 40th anniversary in July 2012, the USGS released the LandsatLook viewer – a quick, simple way to go forward and backward in time, pulling images of anywhere in the world out of the Landsat archive. <b><a href="http://www.nasa.gov/audience/formedia/features/MP_Photo_Guidelines.html" rel="nofollow">NASA image use policy.</a></b> <b><a href="http://www.nasa.gov/centers/goddard/home/index.html" rel="nofollow">NASA Goddard Space Flight Center</a></b> enables NASA’s mission through four scientific endeavors: Earth Science, Heliophysics, Solar System Exploration, and Astrophysics. Goddard plays a leading role in NASA’s accomplishments by contributing compelling scientific knowledge to advance the Agency’s mission. <b>Follow us on <a href="http://twitter.com/NASA_GoddardPix" rel="nofollow">Twitter</a></b> <b>Like us on <a href="http://www.facebook.com/pages/Greenbelt-MD/NASA-Goddard/395013845897?ref=tsd" rel="nofollow">Facebook</a></b> <b>Find us on <a href="http://instagrid.me/nasagoddard/?vm=grid" rel="nofollow">Instagram</a></b>
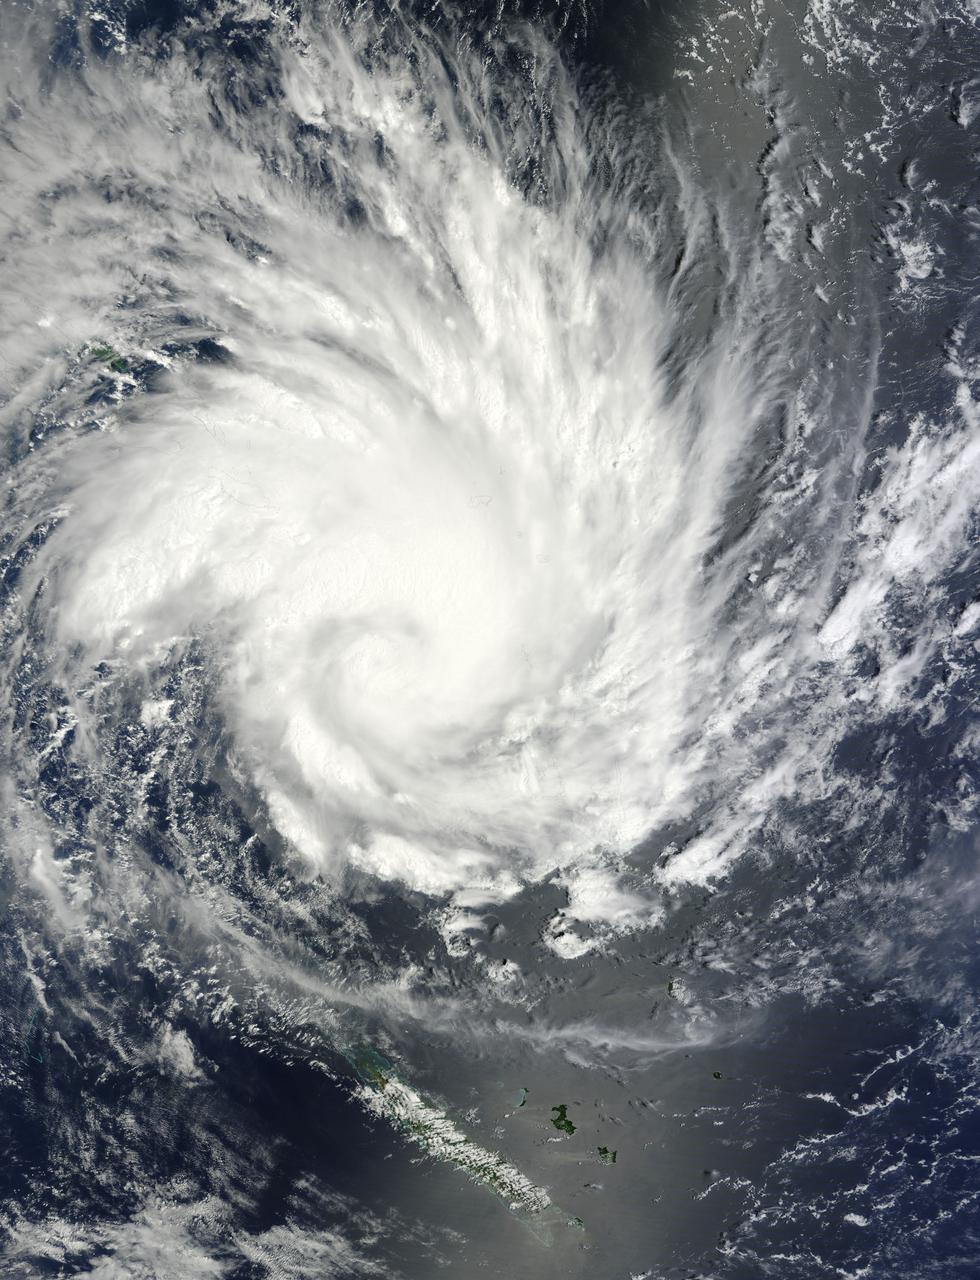
NASA image acquired January 30, 2011 at 23:20 UTC. Satellite: Terra <b> Click here to see the most recent image captured Feb. 1: <a href="http://www.flickr.com/photos/gsfc/5407540724/">www.flickr.com/photos/gsfc/5407540724/</a></b> Tropical Storm Anthony made landfall in Queensland, Australia this past weekend, and now the residents are watching a larger, more powerful cyclone headed their way. NASA's Terra satellite captured a visible image of the large Tropical Cyclone Yasi late yesterday as it makes its way west through the Coral Sea toward Queensland. The Moderate Resolution Imaging Spectroradiometer (MODIS) instrument that flies aboard NASA's Terra satellite captured an image of Cyclone Yasi on Jan. 30 at 23:20 UTC (6:20 p.m. EST/09:20 a.m., Monday, January 31 in Australia/Brisbane local time). Although the image did not reveal a visible eye, the storm appears to be well-formed and also appears to be strengthening. Warnings and watches are already in effect throughout the Coral Sea. The Solomon Islands currently have a Tropical Cyclone warning for the provinces of Temotu, Rennell & Bellona, Makira and Guadalcanal. The Australian Bureau of Meteorology has already posted a Tropical Cyclone Watch from Cooktown to Yeppoon and inland to between Georgetown and Moranbah in Queensland, Australia. The Australian Bureau of Meteorology expects damaging winds to develop in coastal and island communities between Cooktown and Yeppoon Wednesday morning, and inland areas on Wednesday afternoon. Updates from the Australian Bureau of Meteorology can be monitored at the Bureau's website at <a href="http://www.bom.gov.au" rel="nofollow">www.bom.gov.au</a>. On January 31 at 1500 UTC (10 a.m. EST/ 1:00 a.m. Tuesday February 1, 2011 in Australia/Brisbane local time), Tropical Cyclone Yasi had maximum sustained winds near 90 knots (103 mph/166 kmh). Yasi is a Category Two Cyclone on the Saffir-Simpson Scale. It was centered about 875 miles E of Cairns, Australia, near 13.4 South latitude and 160.4 East longitude. It was moving west near 19 knots (22 mph/35 kmh). Cyclone-force winds extend out to 30 miles (48 km) from the center. Animated infrared satellite imagery, such as that from the Atmospheric Infrared Sounder (AIRS) that flies on NASA's Aqua satellite, showed deep convective (thunderstorm) bands wrapping tighter into the low level circulation center. Wrapping bands of thunderstorms indicate strengthening. Yasi is forecast to move west then southwestward into an area of low vertical wind shear (strong wind shear can weaken a storm). Forecasters at the Joint Typhoon Warning Center (JTWC) expect Yasi to continue strengthening over the next 36 hours. JTWC forecasts a landfall just south of Cairns as a large 100-plus knot (115 mph/185 kmh)n system by Wednesday. Residents along the Queensland coast should now be making preparations now for the storm's arrival. Rob Gutro NASA's Goddard Space Flight Center Credit: NASA/GSFC/Jeff Schmaltz/MODIS Land Rapid Response Team Click here to see more images from <b><a href="http://rapidfire.sci.gsfc.nasa.gov/gallery/?latest" rel="nofollow">MODIS</a></b> <b><a href="http://www.nasa.gov/centers/goddard/home/index.html" rel="nofollow">NASA Goddard Space Flight Center</a></b> enables NASA’s mission through four scientific endeavors: Earth Science, Heliophysics, Solar System Exploration, and Astrophysics. Goddard plays a leading role in NASA’s accomplishments by contributing compelling scientific knowledge to advance the Agency’s mission. <b>Follow us on <a href="http://twitter.com/NASA_GoddardPix" rel="nofollow">Twitter</a></b> <b>Join us on <a href="http://www.facebook.com/pages/Greenbelt-MD/NASA-Goddard/395013845897?ref=tsd" rel="nofollow">Facebook</a></b>
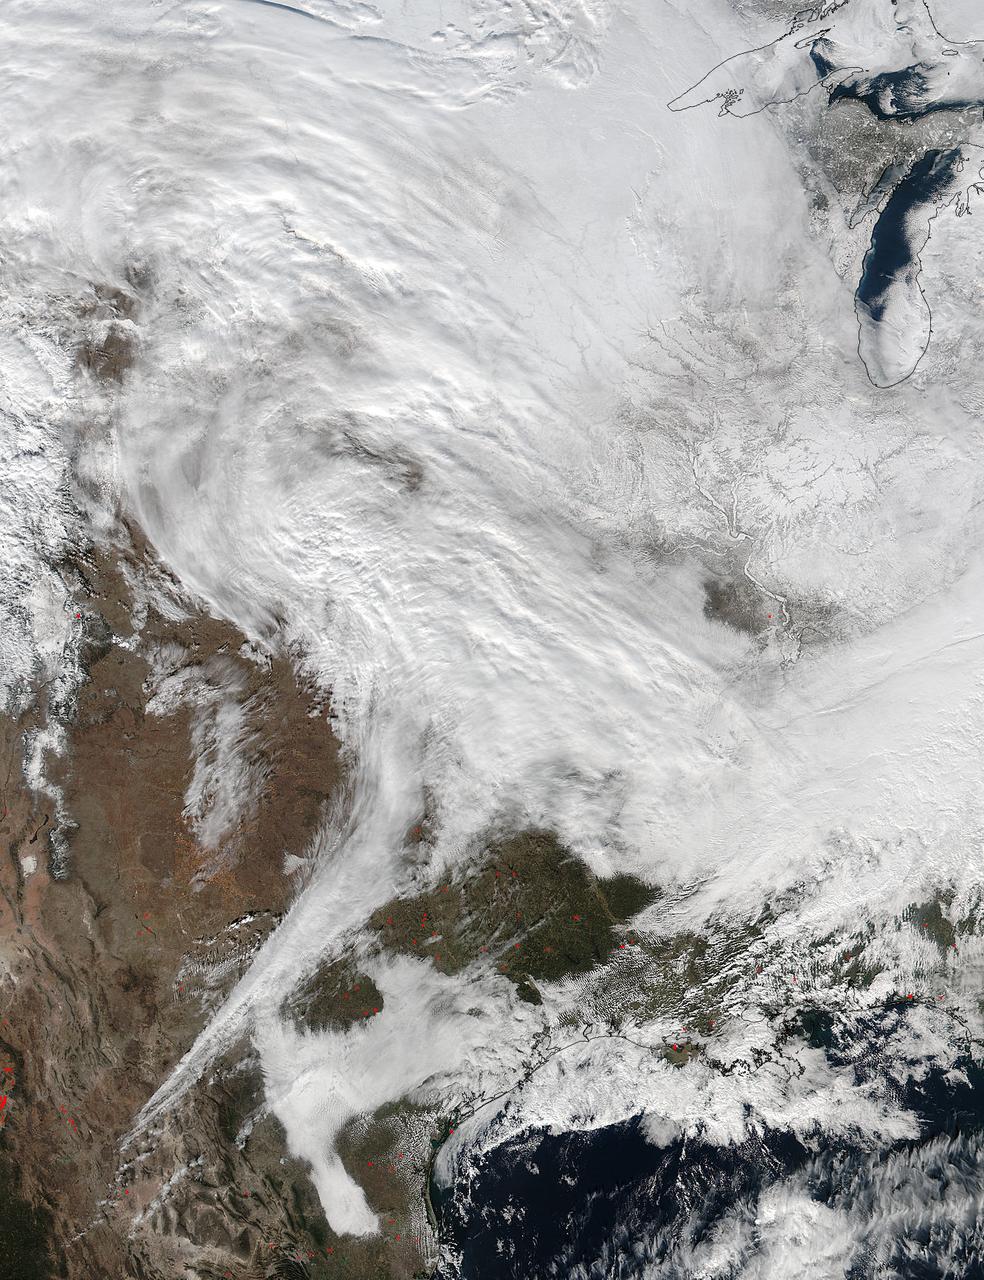
On Jan. 20 at 2:30 p.m. EST the VIIRS instrument aboard NASA-NOAA's Suomi NPP captured this image of the winter storm moving through the central U.S. Credits: NASA Goddard Rapid Response The low pressure area from the Eastern Pacific Ocean moved into the western U.S. and tracked across the four corners region into Texas where NASA-NOAA's Suomi NPP satellite observed the clouds associated with the storm. The Visible Infrared Imaging Radiometer Suite (VIIRS) instrument aboard Suomi NPP satellite captured the visible image on January 20, 2016 at 19:30 UTC (2:30 p.m. EST) when the storm was over the central U.S. In the image, snow cover is visible in the Rockies and southern Great Lakes states. VIIRS collects visible and infrared imagery and global observations of land, atmosphere, cryosphere and oceans. That low pressure system located over the south central United States on Jan. 21 is expected to track east across the Tennessee Valley and will give way to a deepening coastal low pressure area. The National Weather Service said "This latter feature takes over and becomes a dominant force in setting up heavy snow bands over the Mid-Atlantic and very gusty winds." The storm system is expected to bring an increased risk of severe weather from far southeastern Texas across southern Louisiana/Mississippi, and into the far western Florida Panhandle on Thursday, Jan. 21. That threat for severe weather will move east as the low pressure area continues heading in that direction. The National Weather Service Weather Prediction Center in College Park, Maryland said "A potentially crippling winter storm is anticipated for portions of the mid-Atlantic Friday into early Saturday. Snowfall may approach two feet for some locations, including the Baltimore and Washington, D.C. metro areas. Farther north, there is uncertainty in snowfall for the New York City-to-Boston corridor. Farther south, significant icing is likely for portions of Kentucky and North Carolina." <b><a href="http://www.nasa.gov/audience/formedia/features/MP_Photo_Guidelines.html" rel="nofollow">NASA image use policy.</a></b> <b><a href="http://www.nasa.gov/centers/goddard/home/index.html" rel="nofollow">NASA Goddard Space Flight Center</a></b> enables NASA’s mission through four scientific endeavors: Earth Science, Heliophysics, Solar System Exploration, and Astrophysics. Goddard plays a leading role in NASA’s accomplishments by contributing compelling scientific knowledge to advance the Agency’s mission. <b>Follow us on <a href="http://twitter.com/NASAGoddardPix" rel="nofollow">Twitter</a></b> <b>Like us on <a href="http://www.facebook.com/pages/Greenbelt-MD/NASA-Goddard/395013845897?ref=tsd" rel="nofollow">Facebook</a></b> <b>Find us on <a href="http://instagram.com/nasagoddard?vm=grid" rel="nofollow">Instagram</a></b>
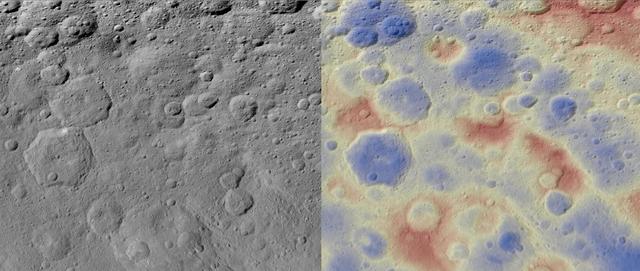
These images show a subtle feature on Ceres called Kwanzaa Tholus. Kwanzaa, meaning "first fruits" in Swahili, is an African-American festival based on ancient African harvest celebrations, and takes place from December 26 to January 1. A tholus is a type of small mountain. Kwanzaa Tholus measures about 22 by 12 miles (35 by 19 kilometers) and is elevated about 2 miles (3 km) above its surroundings. Because the mountain does not rise sharply above the ground, it is difficult to see in the mosaic on the left, although a small crescent-shaped shadow stands out. The image on the right, which is an elevation map of the area, shows where Kwanzaa Tholus is more prominently. The rounded shape of Kwanzaa Tholus is typical of tholi (plural of tholus) in general, but is different than other examples found on Ceres (like Dalien Tholus) and Mars. This region is particularly rich in this type of feature: The current Ceres map shows six named tholi and montes (slightly bigger mountains) in the region (centered around 32 degrees north, 327 degrees east) and several others including Ahuna Mons farther south. Scientists say Kwanzaa Tholus may have once been as prominent as Ahuna Mons, the tallest and most noticeable mountain on Ceres. Ahuna Mons is likely a cryovolcano, a volcano formed by the gradual accumulation of thick, slowly flowing icy materials. Because ice https://www.nasa.gov/feature/goddard/2016/ceres-cryo-volcano/is not strong enough to preserve an elevated structure for extended periods, cryovolcanoes on Ceres are expected to gradually collapse over tens of millions of years. This means Kwanzaa Tholus and other tholi in that area could be degraded mountains, which also formed from cryovolcanic activity. The mosaic on the left combines images taken by NASA's Dawn spacecraft in its high-altitude mapping orbit (HAMO) at about 915 miles (1,470 kilometers) above the surface. The spatial resolution is 450 feet (140 meters) per pixel. https://photojournal.jpl.nasa.gov/catalog/PIA21916