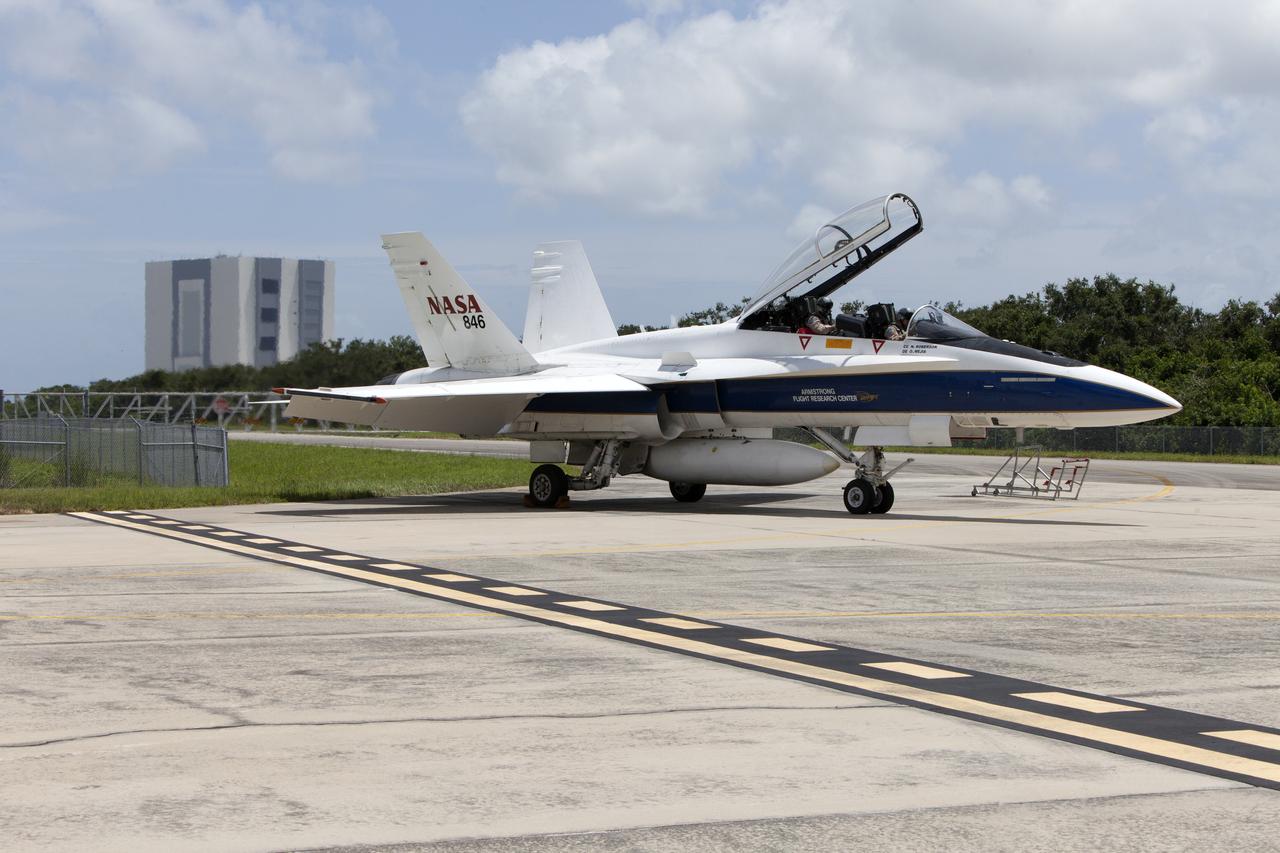
A NASA F-18 jet takes off from the agency's Shuttle Landing Facility at NASA's Kennedy Space Center in Florida. Several flights a day have been taking place the week of Aug. 21, 2017 to measure the effects of sonic booms. It is part of NASA's Sonic Booms in Atmospheric Turbulence, or SonicBAT II Program. NASA at Kennedy is partnering with the agency's Armstrong Flight Research Center in California, Langley Research Center in Virginia, and Space Florida for a program in which F-18 jets will take off from the Shuttle Landing Facility and fly at supersonic speeds while agency researchers measure the effects of low-altitude turbulence caused by sonic booms.
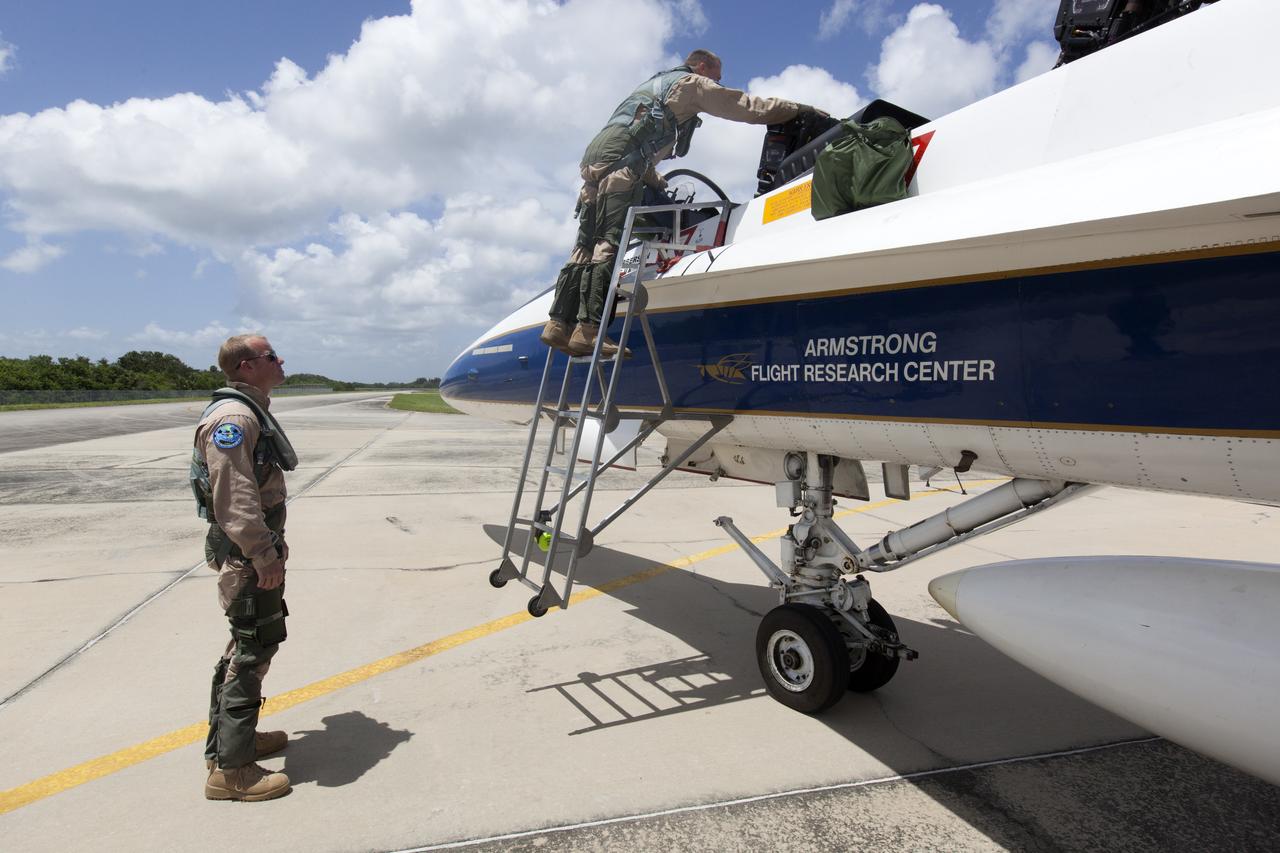
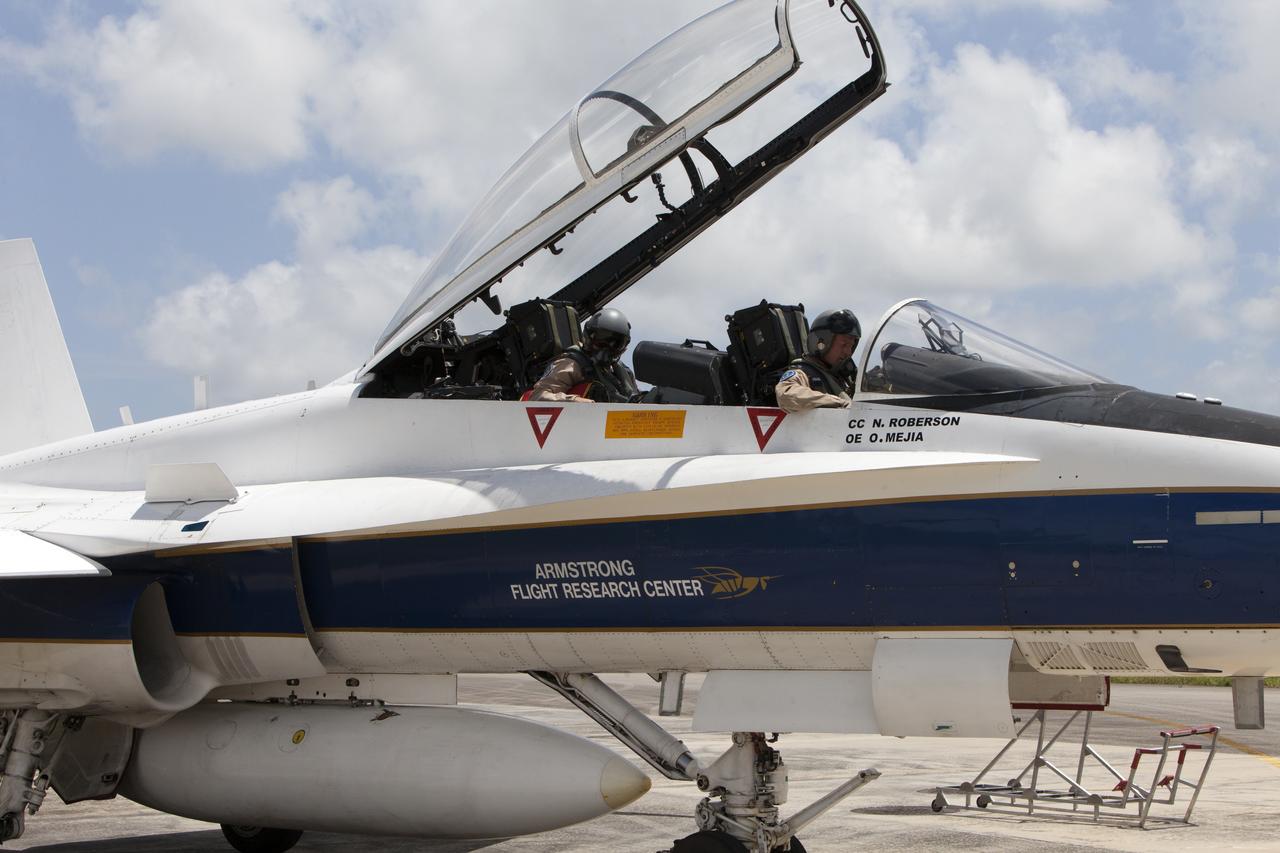
NASA pilots board an F-18 jet prior to take off from the agency's Shuttle Landing Facility at NASA's Kennedy Space Center in Florida. Several flights a day have been taking place the week of Aug. 21, 2017 to measure the effects of sonic booms. It is part of NASA's Sonic Booms in Atmospheric Turbulence, or SonicBAT II Program. NASA at Kennedy is partnering with the agency's Armstrong Flight Research Center in California, Langley Research Center in Virginia, and Space Florida for a program in which F-18 jets will take off from the Shuttle Landing Facility and fly at supersonic speeds while agency researchers measure the effects of low-altitude turbulence caused by sonic booms.
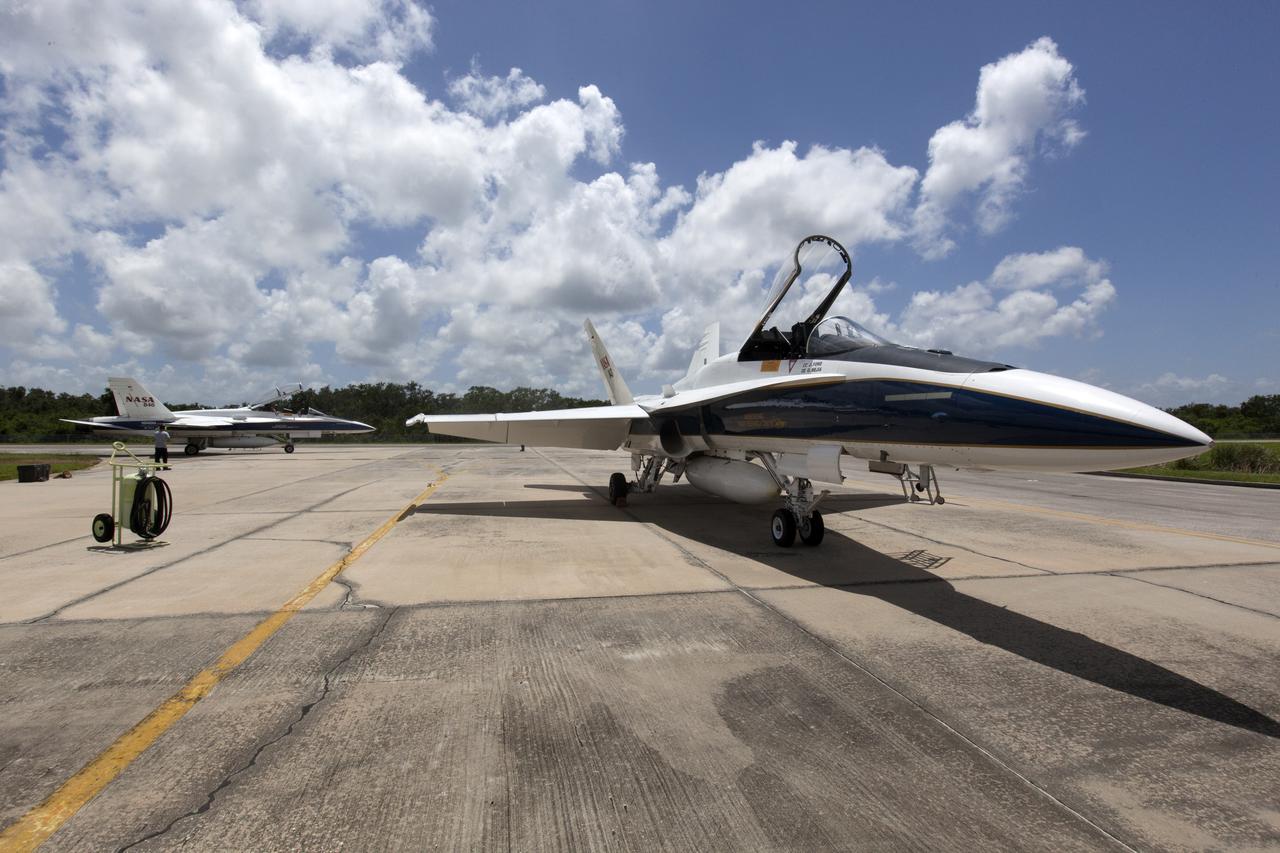
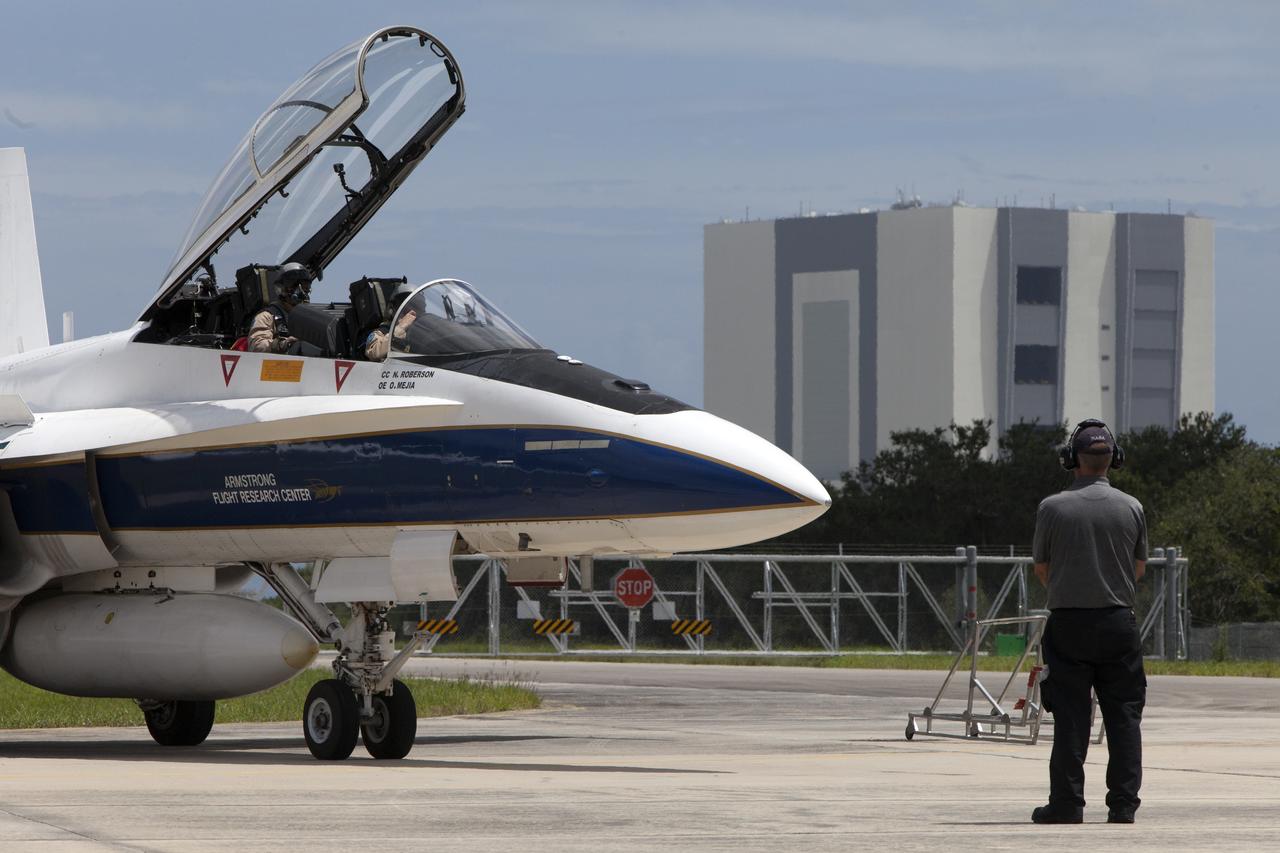
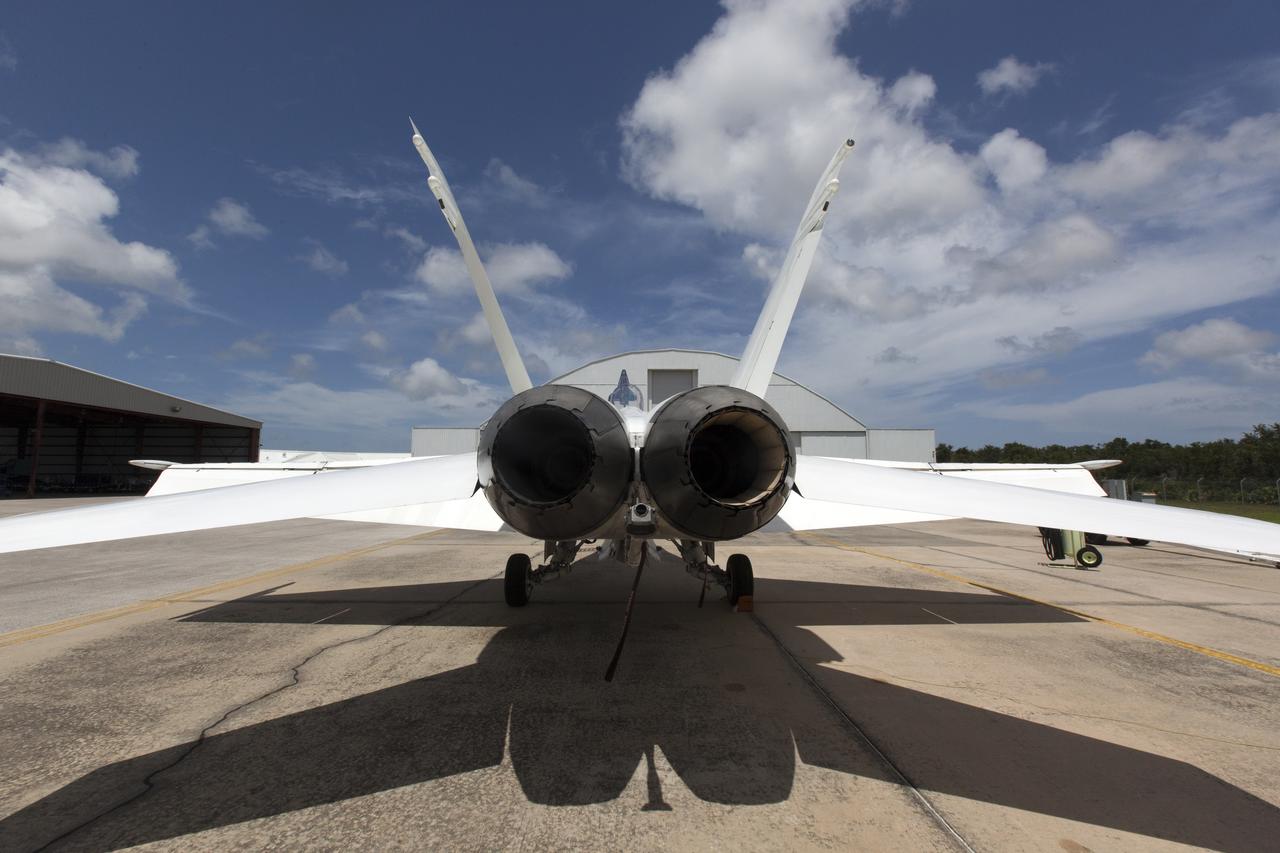
A NASA F-18 jet is prepared for takeoff from the agency's Shuttle Landing Facility at NASA's Kennedy Space Center in Florida. Several flights a day have been taking place the week of Aug. 21, 2017 to measure the effects of sonic booms. It is part of NASA's Sonic Booms in Atmospheric Turbulence, or SonicBAT II Program. NASA at Kennedy is partnering with the agency's Armstrong Flight Research Center in California, Langley Research Center in Virginia, and Space Florida for a program in which F-18 jets will take off from the Shuttle Landing Facility and fly at supersonic speeds while agency researchers measure the effects of low-altitude turbulence caused by sonic booms.
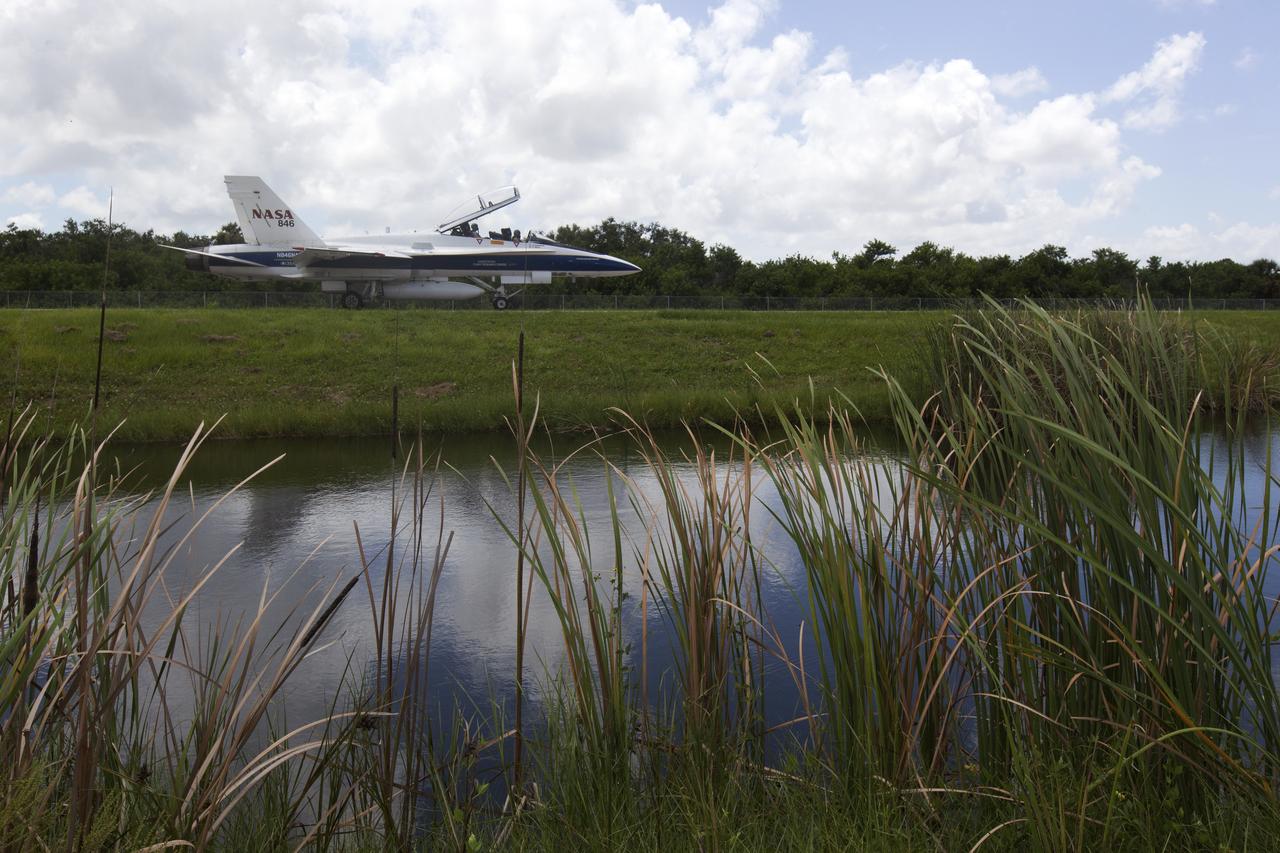
A NASA F-18 jet is prepared for takeoff from the agency's Shuttle Landing Facility at NASA's Kennedy Space Center in Florida. Several flights a day have been taking place the week of Aug. 21, 2017 to measure the effects of sonic booms. It is part of NASA's Sonic Booms in Atmospheric Turbulence, or SonicBAT II Program. NASA at Kennedy is partnering with the agency's Armstrong Flight Research Center in California, Langley Research Center in Virginia, and Space Florida for a program in which F-18 jets will take off from the Shuttle Landing Facility and fly at supersonic speeds while agency researchers measure the effects of low-altitude turbulence caused by sonic booms.
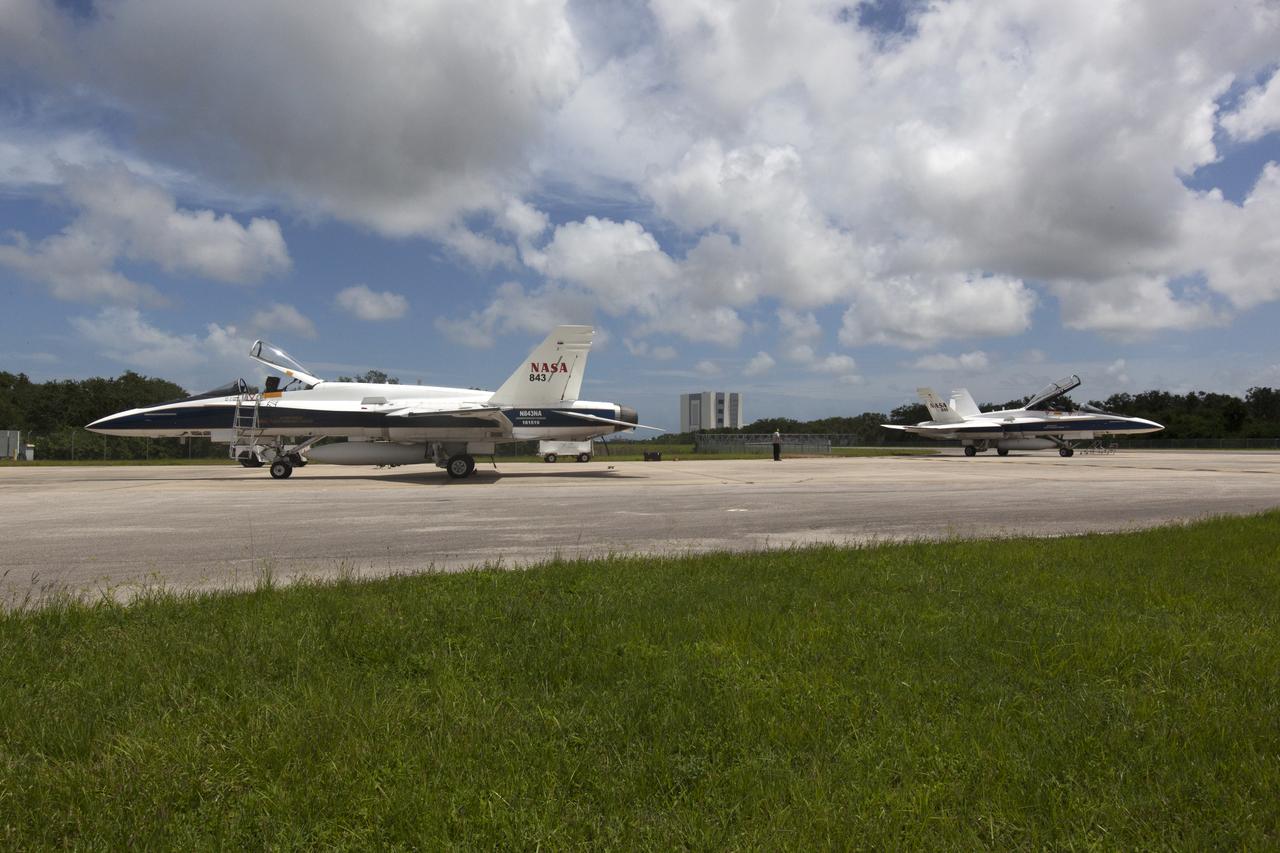
NASA F-18 jets prepare for takeoff from the agency's Shuttle Landing Facility at NASA's Kennedy Space Center in Florida. Several flights a day have been taking place the week of Aug. 21, 2017 to measure the effects of sonic booms. It is part of NASA's Sonic Booms in Atmospheric Turbulence, or SonicBAT II Program. NASA at Kennedy is partnering with the agency's Armstrong Flight Research Center in California, Langley Research Center in Virginia, and Space Florida for a program in which F-18 jets will take off from the Shuttle Landing Facility and fly at supersonic speeds while agency researchers measure the effects of low-altitude turbulence caused by sonic booms.
A NASA F-18 jet is prepared for takeoff from the agency's Shuttle Landing Facility at NASA's Kennedy Space Center in Florida. Several flights a day have been taking place the week of Aug. 21, 2017 to measure the effects of sonic booms. It is part of NASA's Sonic Booms in Atmospheric Turbulence, or SonicBAT II Program. NASA at Kennedy is partnering with the agency's Armstrong Flight Research Center in California, Langley Research Center in Virginia, and Space Florida for a program in which F-18 jets will take off from the Shuttle Landing Facility and fly at supersonic speeds while agency researchers measure the effects of low-altitude turbulence caused by sonic booms.
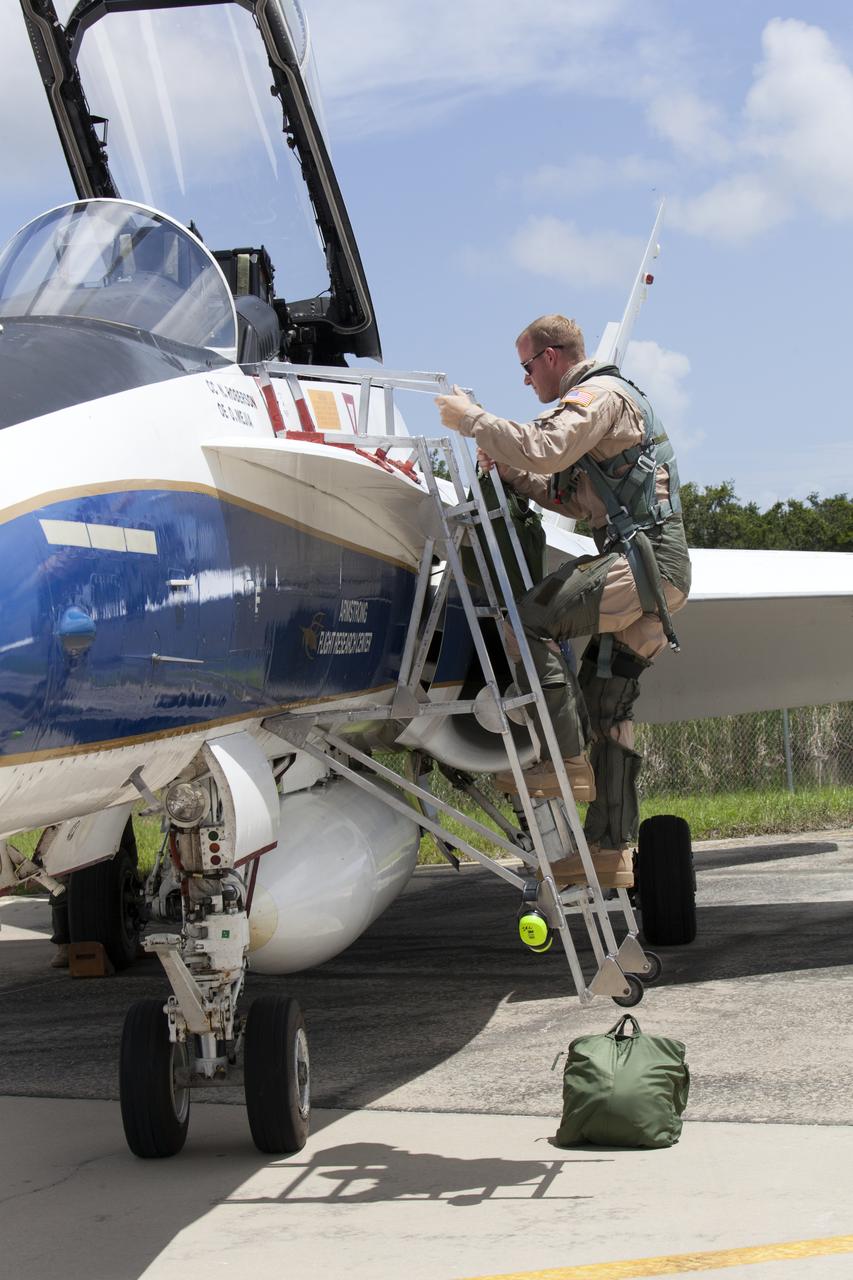
A NASA pilot boards an F-18 jet prior to take off from the agency's Shuttle Landing Facility at NASA's Kennedy Space Center in Florida. Several flights a day have been taking place the week of Aug. 21, 2017 to measure the effects of sonic booms. It is part of NASA's Sonic Booms in Atmospheric Turbulence, or SonicBAT II Program. NASA at Kennedy is partnering with the agency's Armstrong Flight Research Center in California, Langley Research Center in Virginia, and Space Florida for a program in which F-18 jets will take off from the Shuttle Landing Facility and fly at supersonic speeds while agency researchers measure the effects of low-altitude turbulence caused by sonic booms.
A NASA F-18 jet is prepared for takeoff from the agency's Shuttle Landing Facility at NASA's Kennedy Space Center in Florida. Several flights a day have been taking place the week of Aug. 21, 2017 to measure the effects of sonic booms. It is part of NASA's Sonic Booms in Atmospheric Turbulence, or SonicBAT II Program. NASA at Kennedy is partnering with the agency's Armstrong Flight Research Center in California, Langley Research Center in Virginia, and Space Florida for a program in which F-18 jets will take off from the Shuttle Landing Facility and fly at supersonic speeds while agency researchers measure the effects of low-altitude turbulence caused by sonic booms.
A NASA F-18 jet is prepared for takeoff from the agency's Shuttle Landing Facility at NASA's Kennedy Space Center in Florida. Several flights a day have been taking place the week of Aug. 21, 2017 to measure the effects of sonic booms. It is part of NASA's Sonic Booms in Atmospheric Turbulence, or SonicBAT II Program. NASA at Kennedy is partnering with the agency's Armstrong Flight Research Center in California, Langley Research Center in Virginia, and Space Florida for a program in which F-18 jets will take off from the Shuttle Landing Facility and fly at supersonic speeds while agency researchers measure the effects of low-altitude turbulence caused by sonic booms.
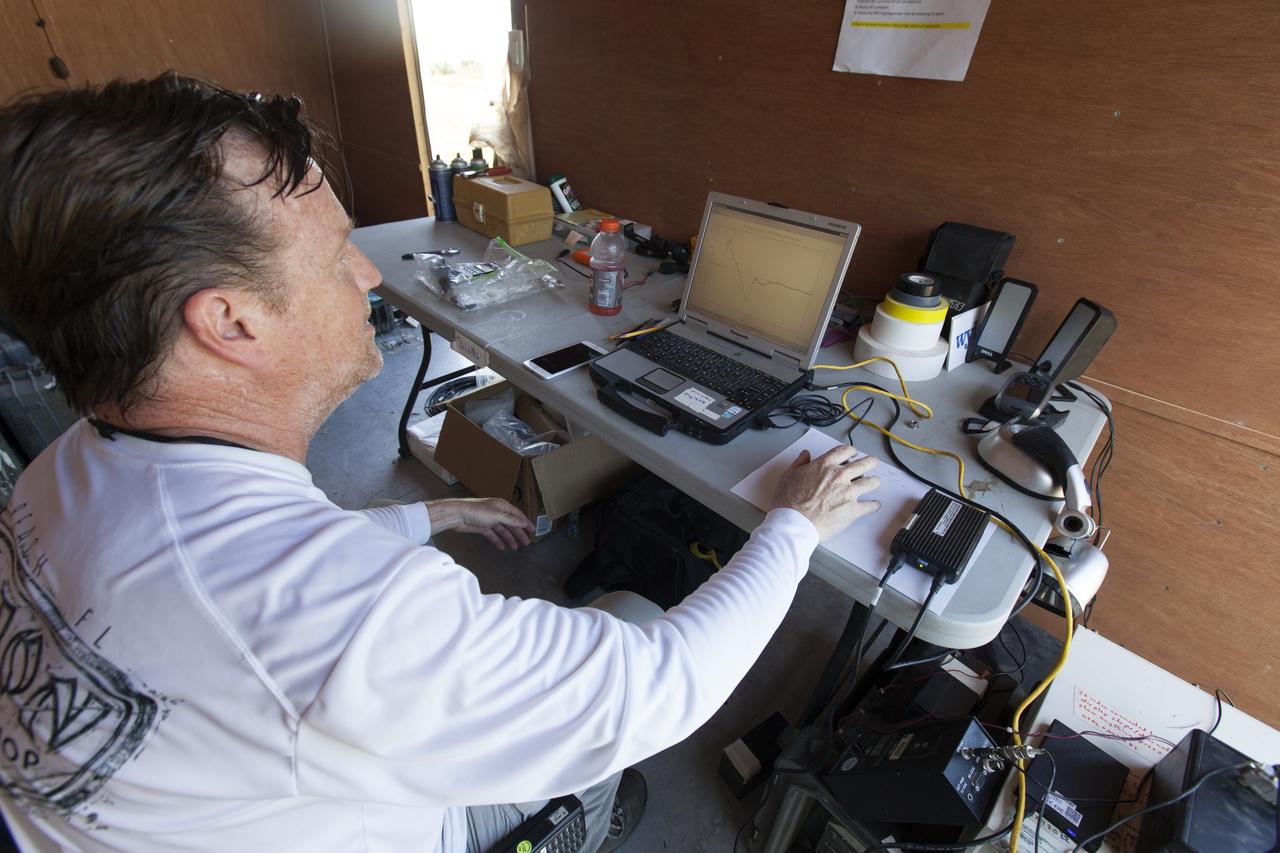
An engineer in a control trailer at NASA's Kennedy Space Center in Florida monitors data before flights of agency F-18 jets to measure the effects of sonic booms. Several flights a day have been taking place the week of Aug. 21, 2017 as part of NASA's Sonic Booms in Atmospheric Turbulence, or SonicBAT II Program. NASA at Kennedy is partnering with the agency's Armstrong Flight Research Center in California, Langley Research Center in Virginia, and Space Florida for a program in which F-18 jets will take off from the Shuttle Landing Facility and fly at supersonic speeds while agency researchers measure the effects of low-altitude turbulence caused by sonic booms.
A NASA F-18 jet is prepared for takeoff from the agency's Shuttle Landing Facility at NASA's Kennedy Space Center in Florida. Several flights a day have been taking place the week of Aug. 21, 2017 to measure the effects of sonic booms. It is part of NASA's Sonic Booms in Atmospheric Turbulence, or SonicBAT II Program. NASA at Kennedy is partnering with the agency's Armstrong Flight Research Center in California, Langley Research Center in Virginia, and Space Florida for a program in which F-18 jets will take off from the Shuttle Landing Facility and fly at supersonic speeds while agency researchers measure the effects of low-altitude turbulence caused by sonic booms.
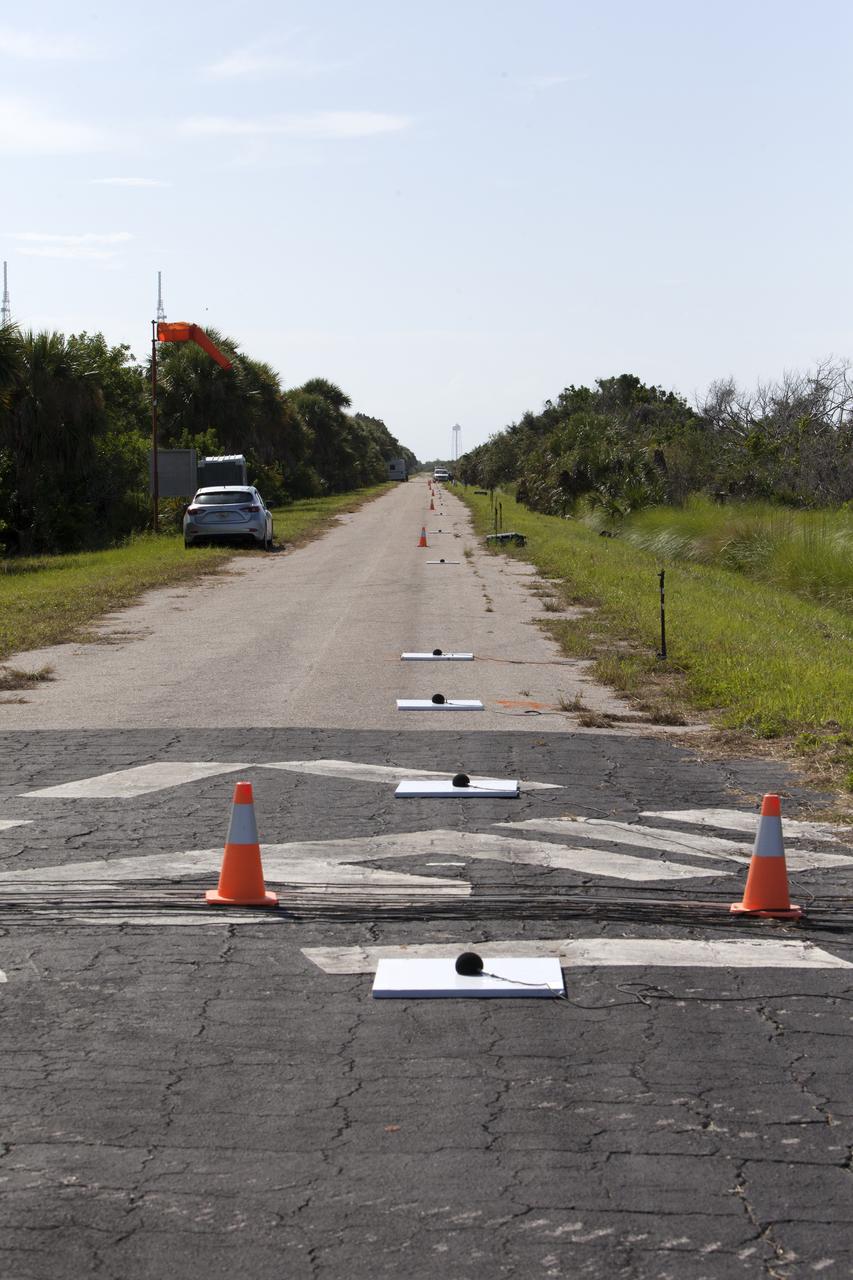
Microphone arrays and other instrumentation are strategically positioned along the ground at NASA's Kennedy Space Center in Florida. They have been set up to collect sound signatures from sonic booms created by agency F-18 jets flying faster than the speed of sound. Several flights a day have been taking place the week of Aug. 21, 2017 as part of NASA's Sonic Booms in Atmospheric Turbulence, or SonicBAT II Program. NASA at Kennedy is partnering with the agency's Armstrong Flight Research Center in California, Langley Research Center in Virginia, and Space Florida for a program in which F-18 jets will take off from the Shuttle Landing Facility and fly at supersonic speeds while agency researchers measure the effects of low-altitude turbulence caused by sonic booms.
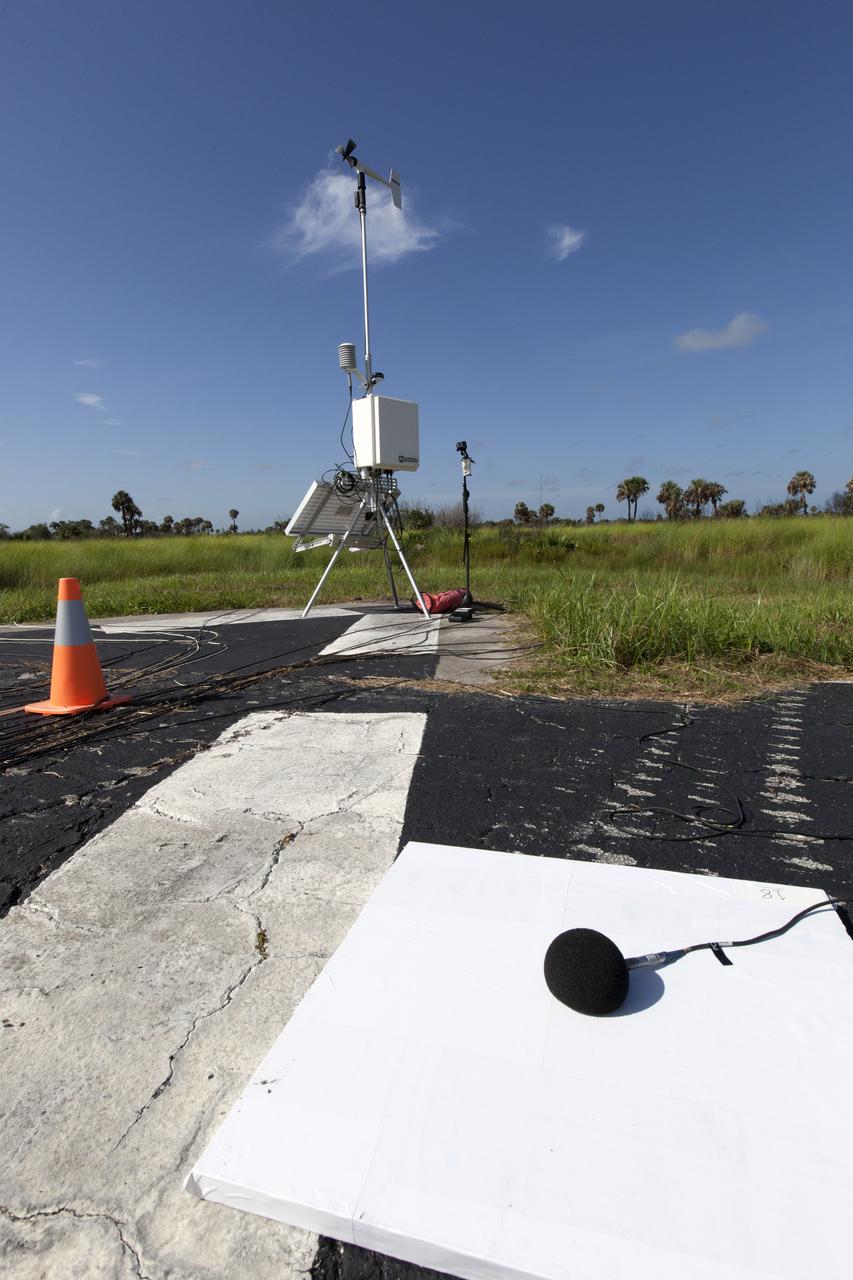
Microphone arrays and other instrumentation are strategically positioned along the ground at NASA's Kennedy Space Center in Florida. They have been set up to collect sound signatures from sonic booms created by agency F-18 jets flying faster than the speed of sound. Several flights a day have been taking place the week of Aug. 21, 2017 as part of NASA's Sonic Booms in Atmospheric Turbulence, or SonicBAT II Program. NASA at Kennedy is partnering with the agency's Armstrong Flight Research Center in California, Langley Research Center in Virginia, and Space Florida for a program in which F-18 jets will take off from the Shuttle Landing Facility and fly at supersonic speeds while agency researchers measure the effects of low-altitude turbulence caused by sonic booms.
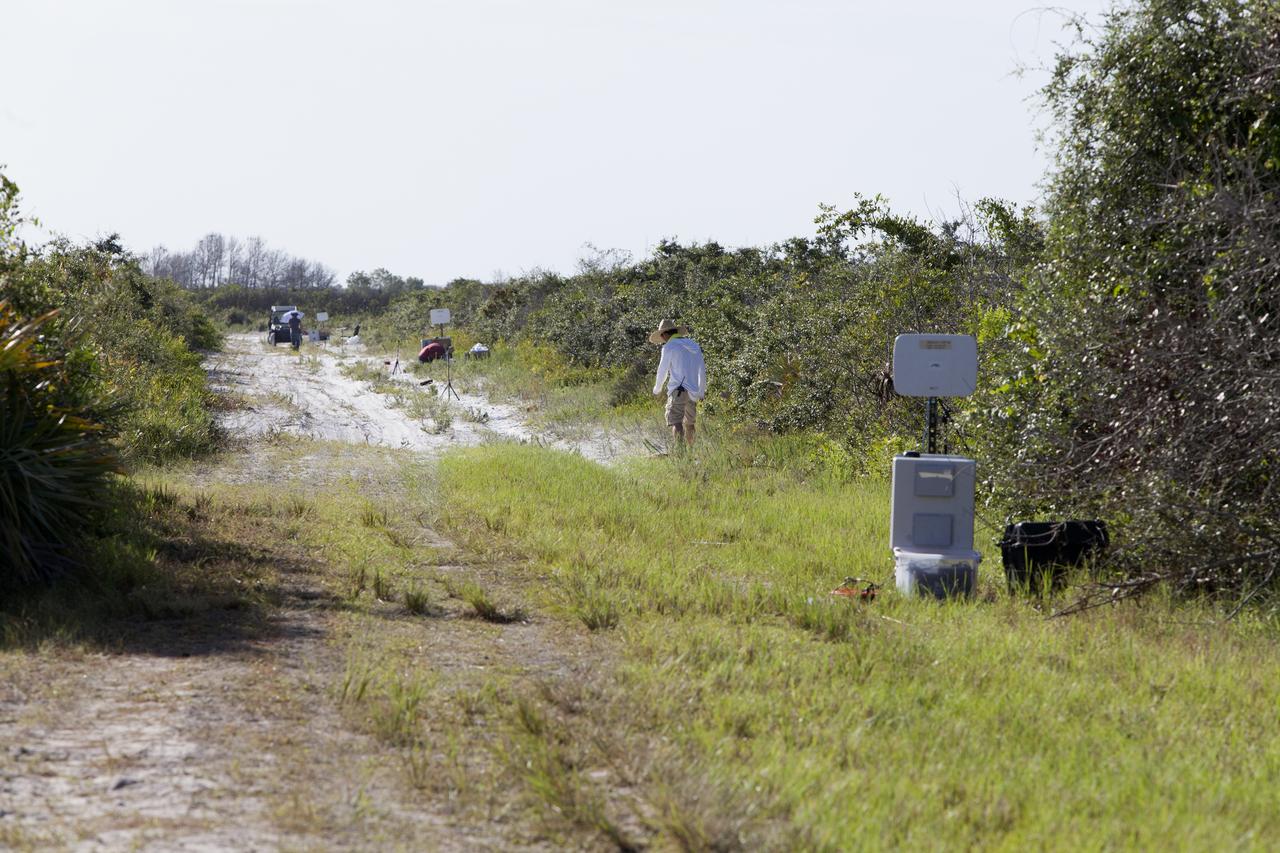
Microphone arrays are strategically positioned along the ground at NASA's Kennedy Space Center in Florida to collect sound signatures from sonic booms created by agency F-18 jets flying faster than the speed of sound. Several flights a day have been taking place the week of Aug. 21, 2017 as part of NASA's Sonic Booms in Atmospheric Turbulence, or SonicBAT II Program. NASA at Kennedy is partnering with the agency's Armstrong Flight Research Center in California, Langley Research Center in Virginia, and Space Florida for a program in which F-18 jets will take off from the Shuttle Landing Facility and fly at supersonic speeds while agency researchers measure the effects of low-altitude turbulence caused by sonic booms.
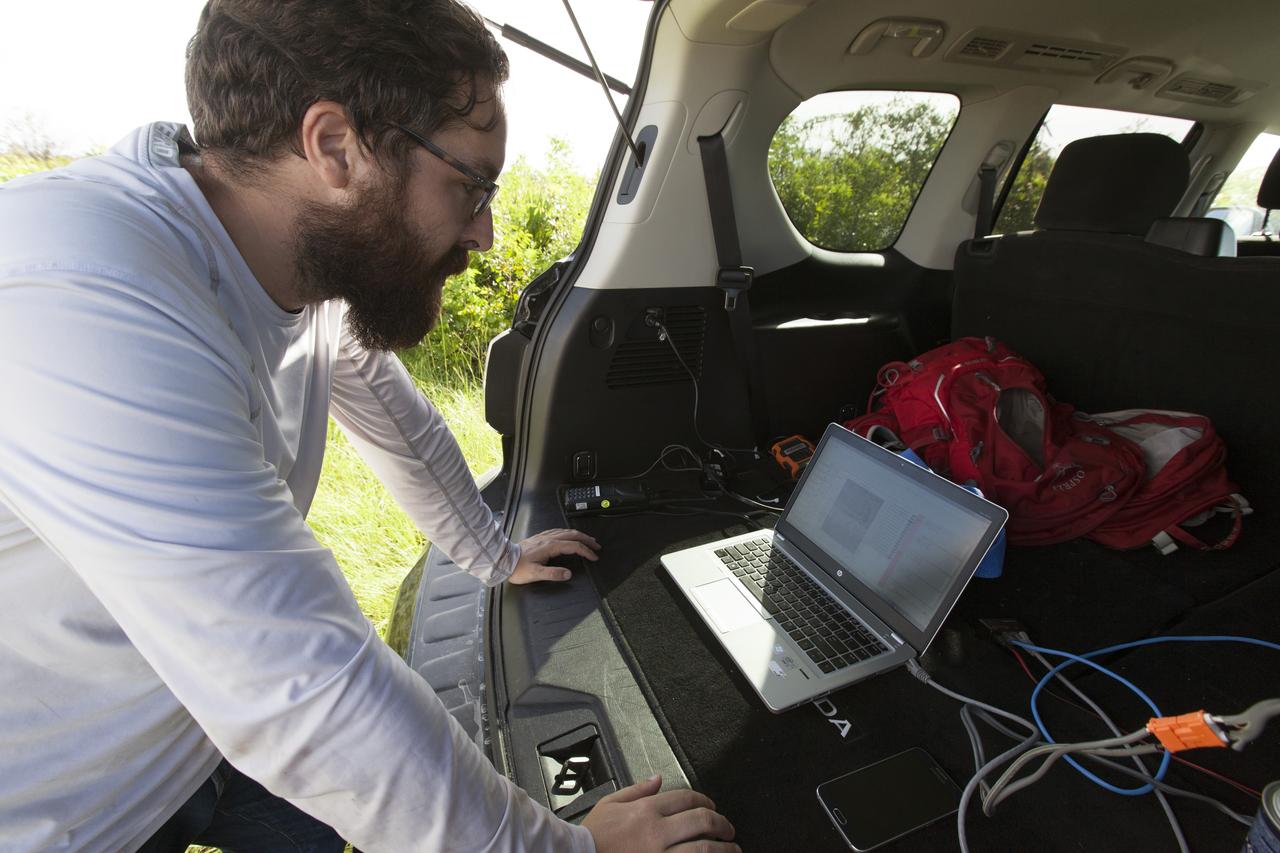
An engineer checks readings from microphone arrays that were strategically positioned along the ground at NASA's Kennedy Space Center in Florida to collect sound signatures from sonic booms created by agency F-18 jets flying faster than the speed of sound. Several flights a day have been taking place the week of Aug. 21, 2017 as part of NASA's Sonic Booms in Atmospheric Turbulence, or SonicBAT II Program. NASA at Kennedy is partnering with the agency's Armstrong Flight Research Center in California, Langley Research Center in Virginia, and Space Florida for a program in which F-18 jets will take off from the Shuttle Landing Facility and fly at supersonic speeds while agency researchers measure the effects of low-altitude turbulence caused by sonic booms.
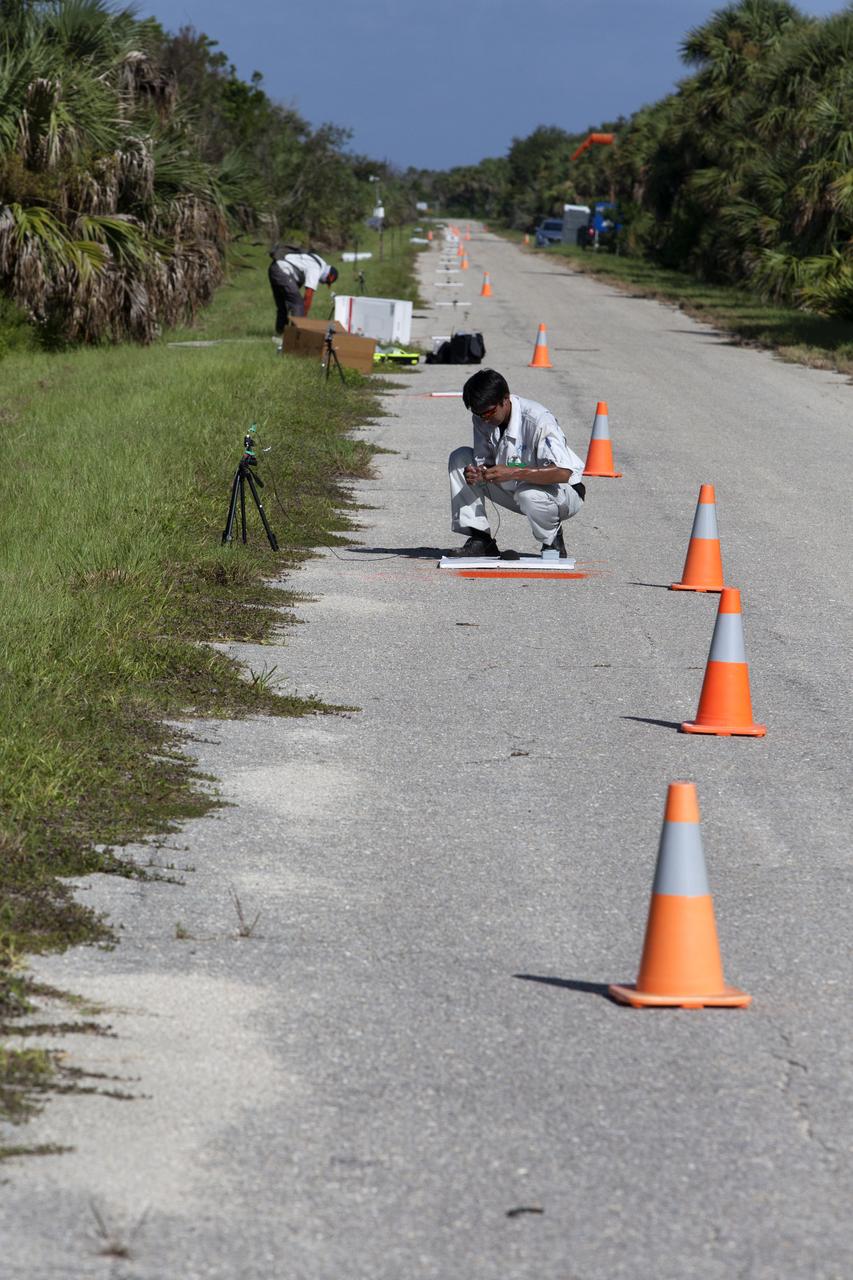
Microphone arrays are strategically positioned along the ground at NASA's Kennedy Space Center in Florida to collect sound signatures from sonic booms created by agency F-18 jets flying faster than the speed of sound. Several flights a day have been taking place the week of Aug. 21, 2017 as part of NASA's Sonic Booms in Atmospheric Turbulence, or SonicBAT II Program. NASA at Kennedy is partnering with the agency's Armstrong Flight Research Center in California, Langley Research Center in Virginia, and Space Florida for a program in which F-18 jets will take off from the Shuttle Landing Facility and fly at supersonic speeds while agency researchers measure the effects of low-altitude turbulence caused by sonic booms.
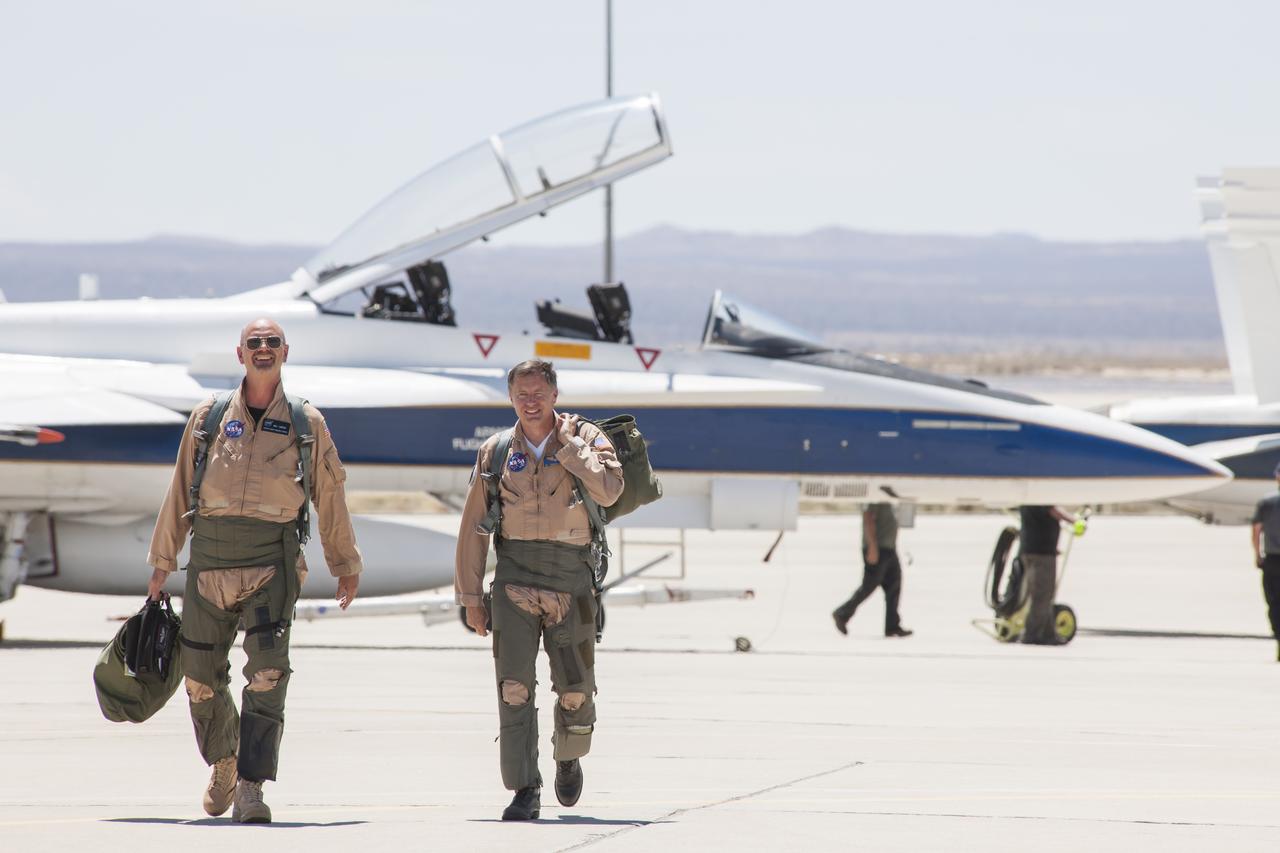
NASA pilot Nils Larson, and flight test engineer and pilot Wayne Ringelberg, head for a mission debrief after flying a NASA F/A-18 at Mach 1.38 to create sonic booms as part of the SonicBAT flight series at NASA’s Armstrong Flight Research Center in California, to study sonic boom signatures with and without the element of atmospheric turbulence.
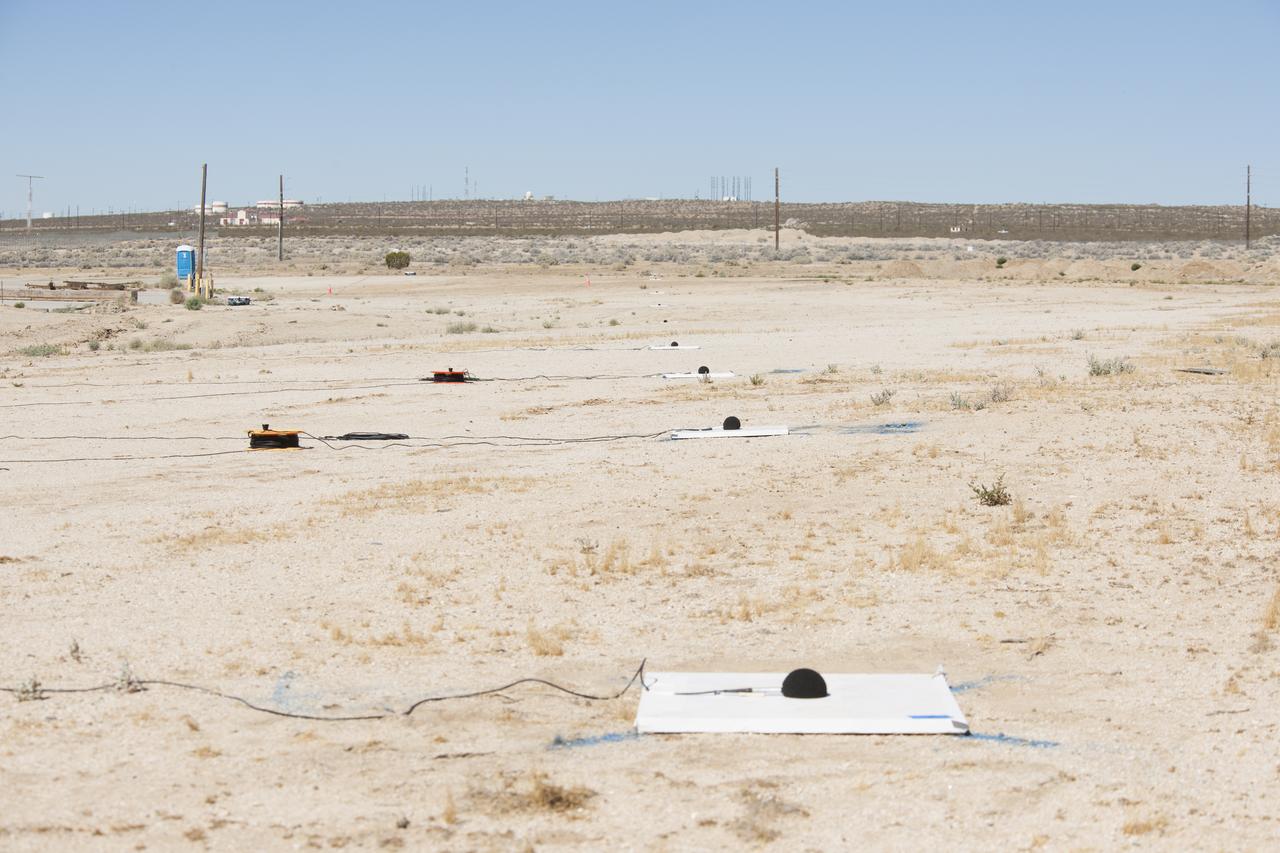
One of three microphone arrays positioned strategically along the ground at Edwards Air Force Base, California, sits ready to collect sound signatures from sonic booms created by a NASA F/A-18 during the SonicBAT flight series. The arrays collected the sound signatures of booms that had traveled through atmospheric turbulence before reaching the ground.
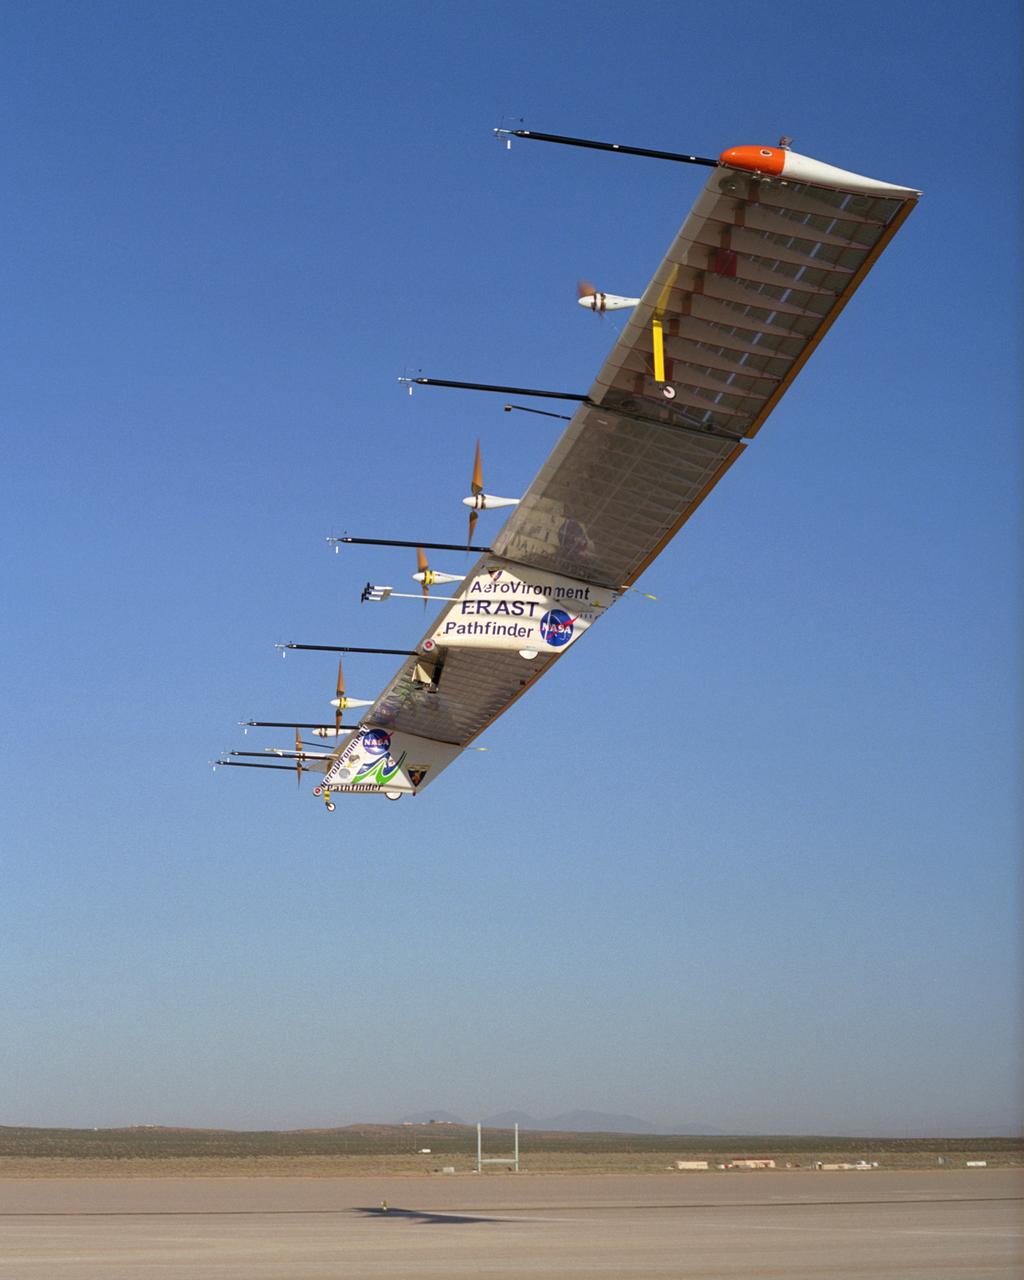
The Atmospheric Turbulence Measurement System booms extend forward from the Pathfinder-Plus solar wing as it soars over Rogers Dry Lake on its final flight.
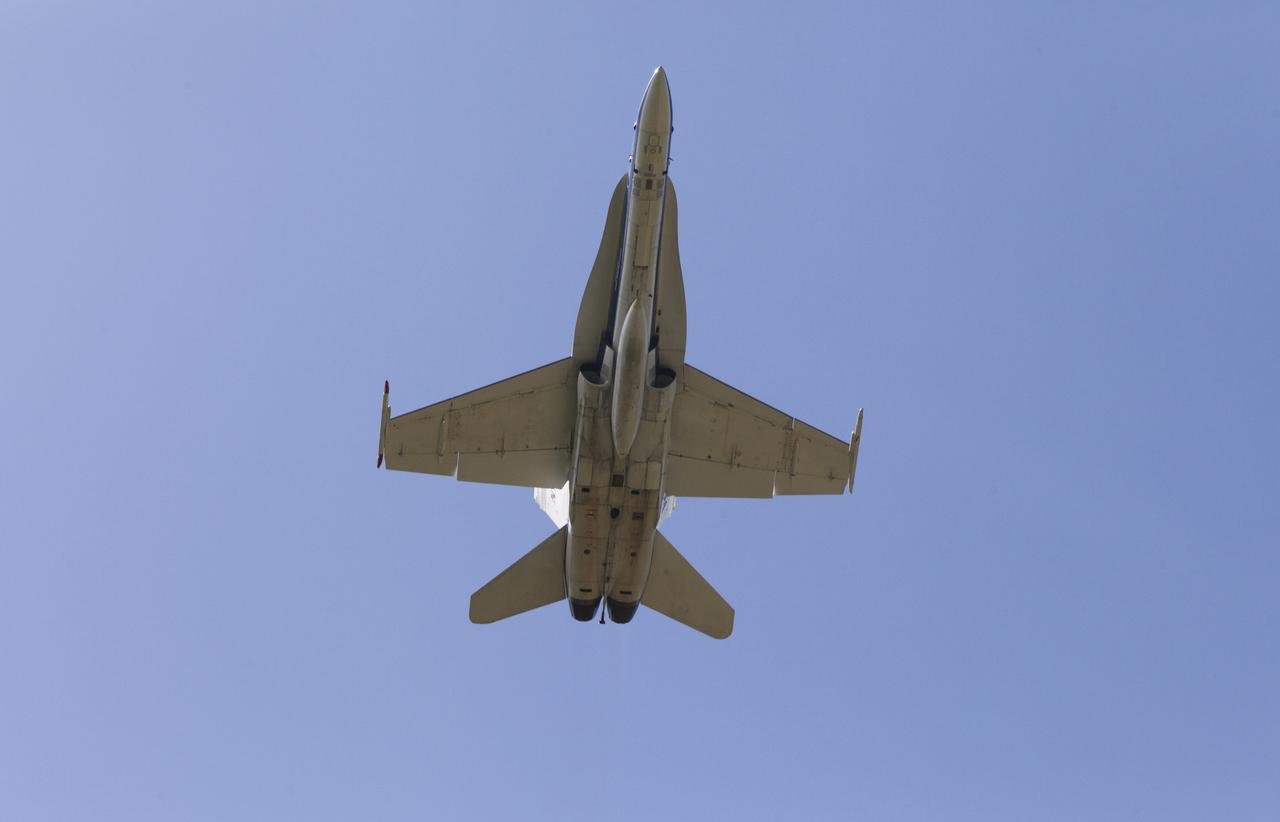
A NASA F-18 jet has taken off from the agency's Shuttle Landing Facility at NASA's Kennedy Space Center in Florida. Several flights a day have been taking place the week of Aug. 21, 2017 to measure the effects of sonic booms. It is part of NASA's Sonic Booms in Atmospheric Turbulence, or SonicBAT II Program. NASA at Kennedy is partnering with the agency's Armstrong Flight Research Center in California, Langley Research Center in Virginia, and Space Florida for a program in which F-18 jets will take off from the Shuttle Landing Facility and fly at supersonic speeds while agency researchers measure the effects of low-altitude turbulence caused by sonic booms.
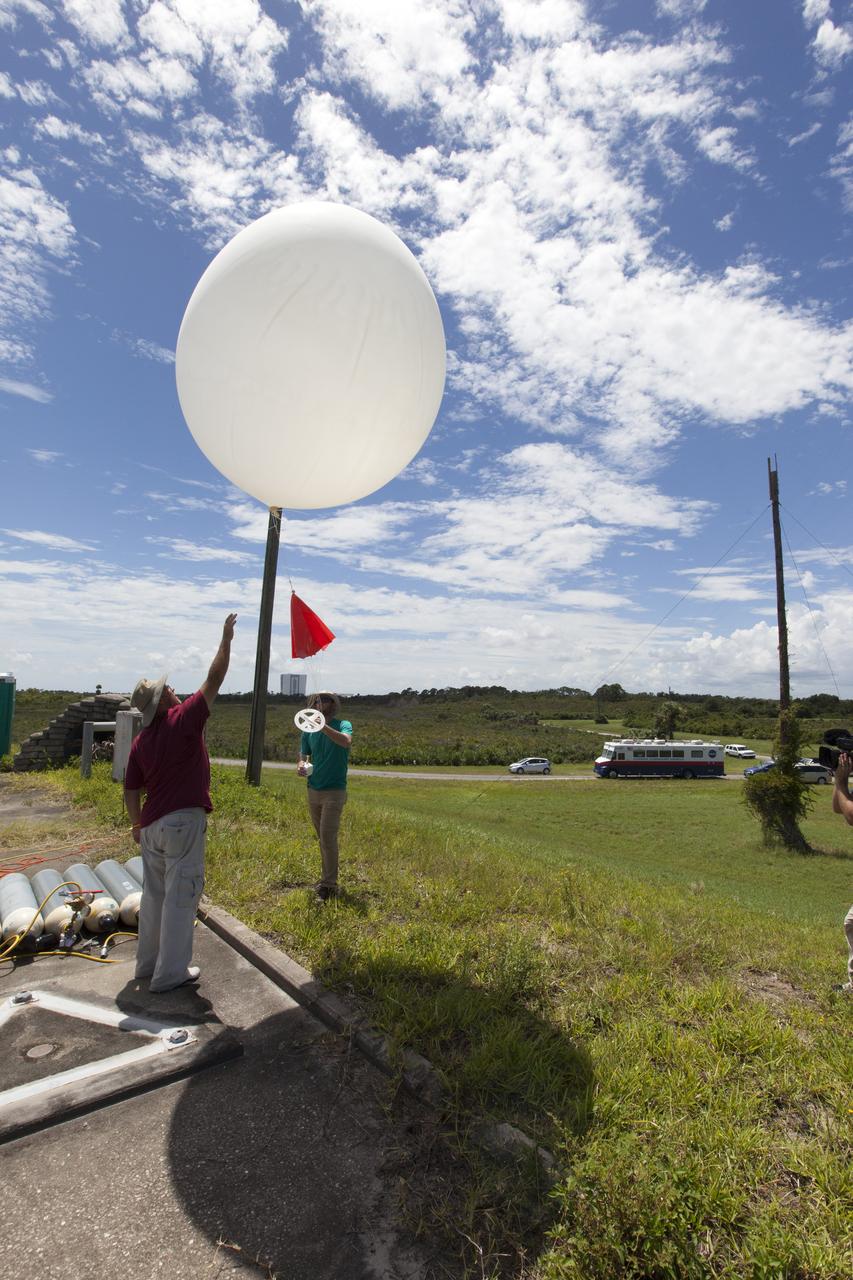
A weather balloon is released at NASA's Kennedy Space Center in Florida before flights of agency F-18 jets to measure the effects of sonic booms. Several flights a day have been taking place the week of Aug. 21, 2017 as part of NASA's Sonic Booms in Atmospheric Turbulence, or SonicBAT II Program. NASA at Kennedy is partnering with the agency's Armstrong Flight Research Center in California, Langley Research Center in Virginia, and Space Florida for a program in which F-18 jets will take off from the Shuttle Landing Facility and fly at supersonic speeds while agency researchers measure the effects of low-altitude turbulence caused by sonic booms.
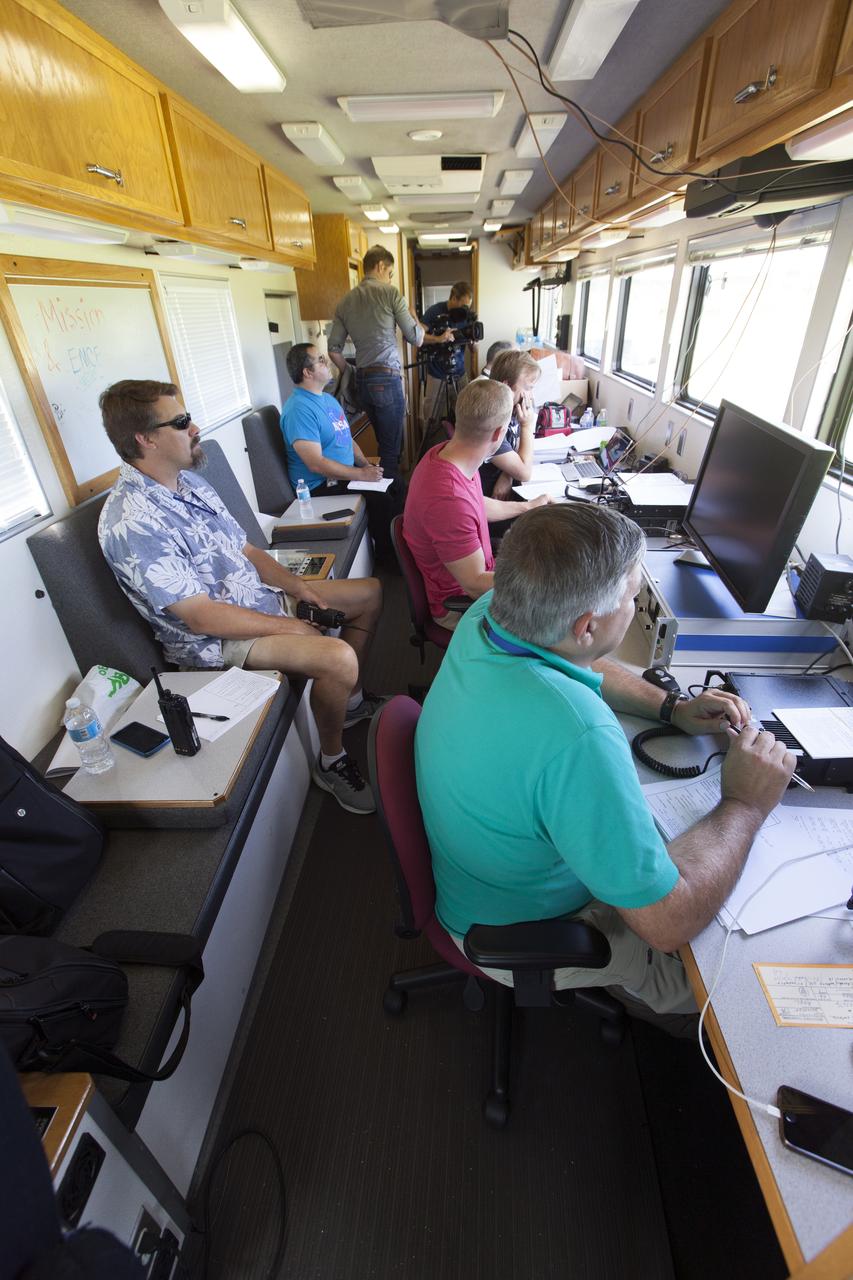
Engineers staff a control trailer at NASA's Kennedy Space Center in Florida before flights of agency F-18 jets to measure the effects of sonic booms. Several flights a day have been taking place the week of Aug. 21, 2017 as part of NASA's Sonic Booms in Atmospheric Turbulence, or SonicBAT II Program. NASA at Kennedy is partnering with the agency's Armstrong Flight Research Center in California, Langley Research Center in Virginia, and Space Florida for a program in which F-18 jets will take off from the Shuttle Landing Facility and fly at supersonic speeds while agency researchers measure the effects of low-altitude turbulence caused by sonic booms.
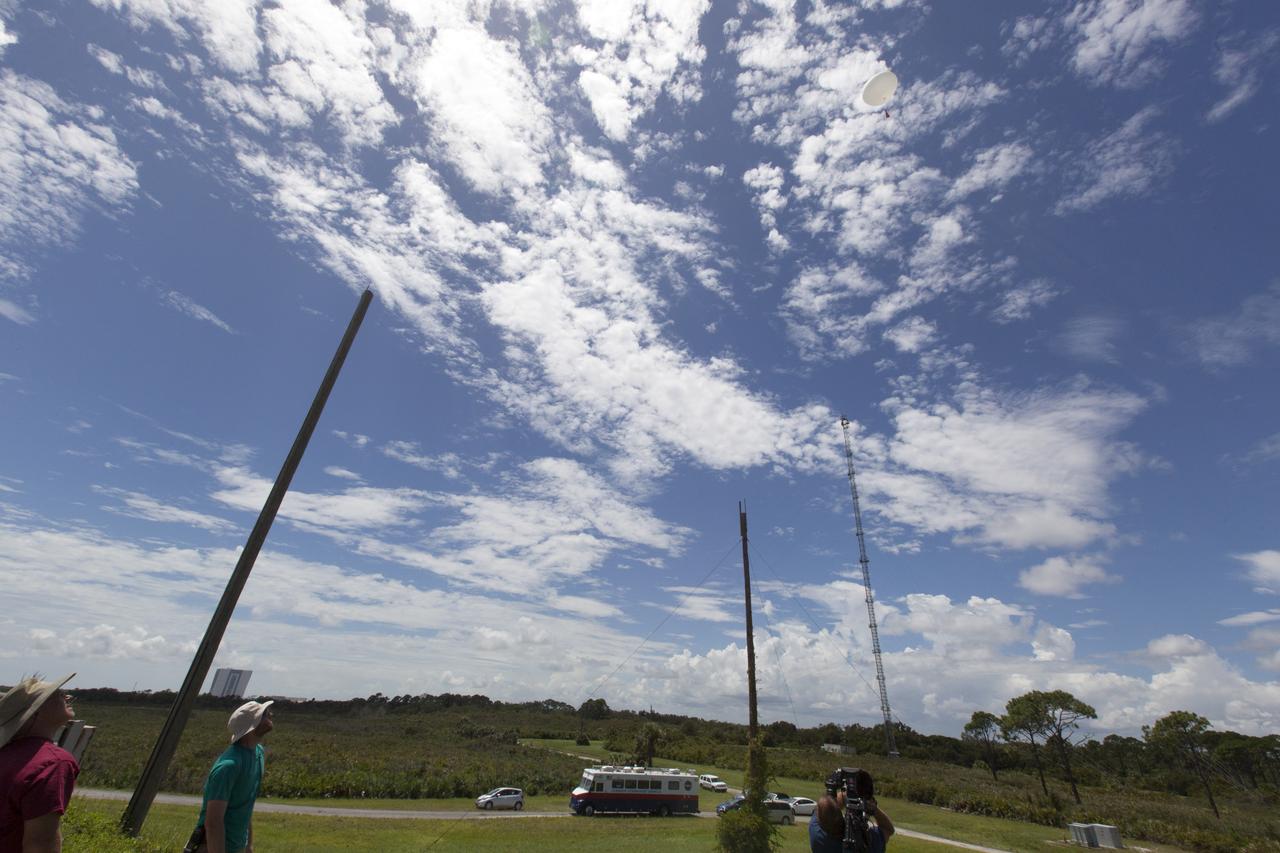
A weather balloon is released at NASA's Kennedy Space Center in Florida before flights of agency F-18 jets to measure the effects of sonic booms. Several flights a day have been taking place the week of Aug. 21, 2017 as part of NASA's Sonic Booms in Atmospheric Turbulence, or SonicBAT II Program. NASA at Kennedy is partnering with the agency's Armstrong Flight Research Center in California, Langley Research Center in Virginia, and Space Florida for a program in which F-18 jets will take off from the Shuttle Landing Facility and fly at supersonic speeds while agency researchers measure the effects of low-altitude turbulence caused by sonic booms.
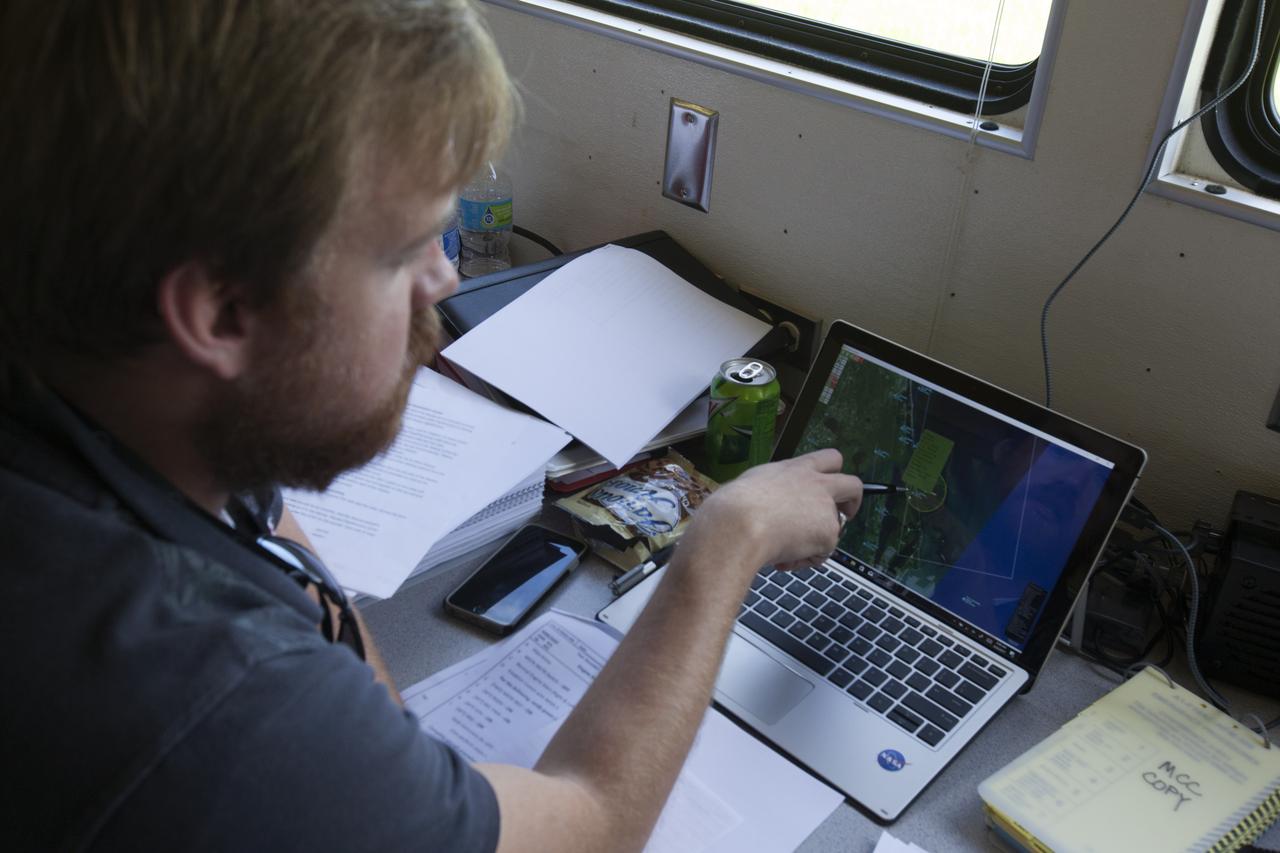
An engineer in a control trailer at NASA's Kennedy Space Center in Florida monitors data before flights of agency F-18 jets to measure the effects of sonic booms. Several flights a day have been taking place the week of Aug. 21, 2017 as part of NASA's Sonic Booms in Atmospheric Turbulence, or SonicBAT II Program. NASA at Kennedy is partnering with the agency's Armstrong Flight Research Center in California, Langley Research Center in Virginia, and Space Florida for a program in which F-18 jets will take off from the Shuttle Landing Facility and fly at supersonic speeds while agency researchers measure the effects of low-altitude turbulence caused by sonic booms.
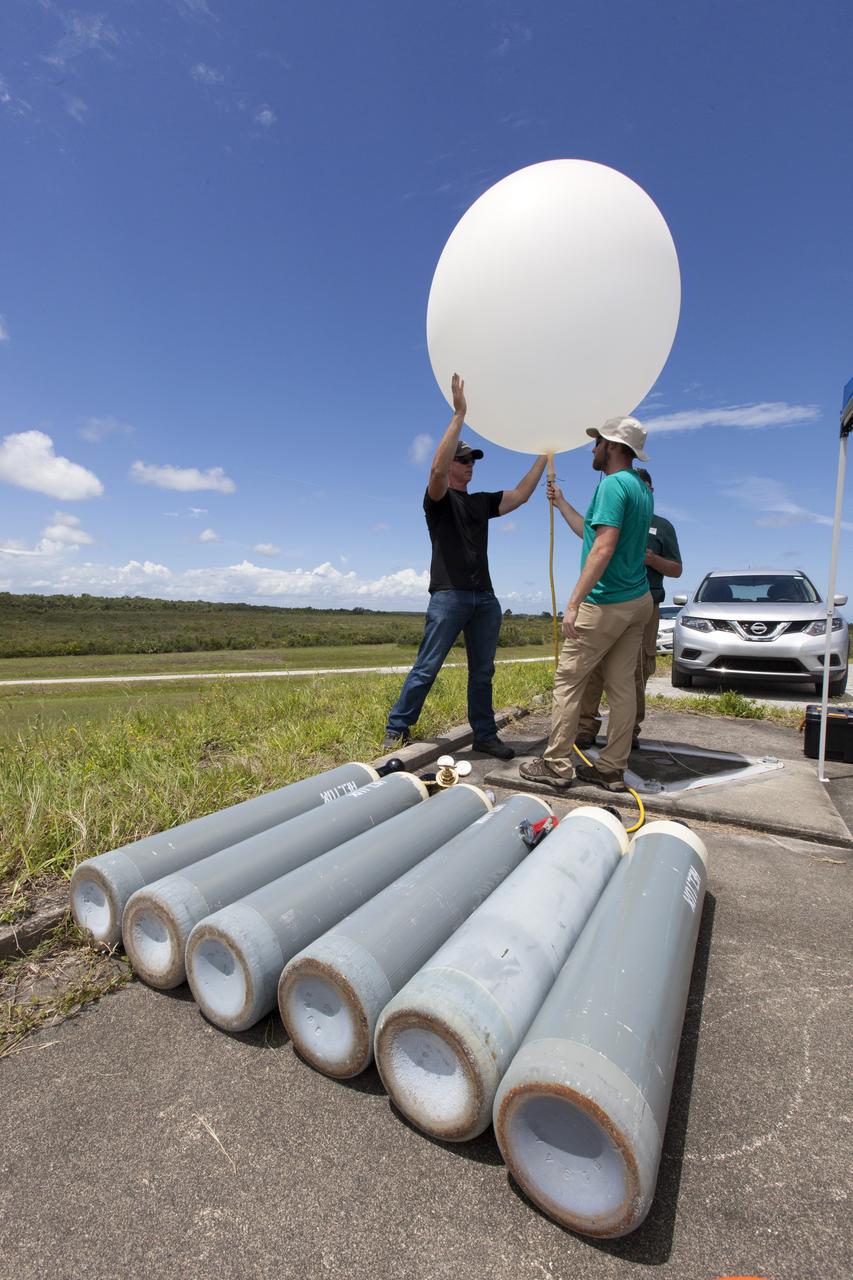
A weather balloon is about to be released at NASA's Kennedy Space Center in Florida before flights of agency F-18 jets to measure the effects of sonic booms. Several flights a day have been taking place the week of Aug. 21, 2017 as part of NASA's Sonic Booms in Atmospheric Turbulence, or SonicBAT II Program. NASA at Kennedy is partnering with the agency's Armstrong Flight Research Center in California, Langley Research Center in Virginia, and Space Florida for a program in which F-18 jets will take off from the Shuttle Landing Facility and fly at supersonic speeds while agency researchers measure the effects of low-altitude turbulence caused by sonic booms.
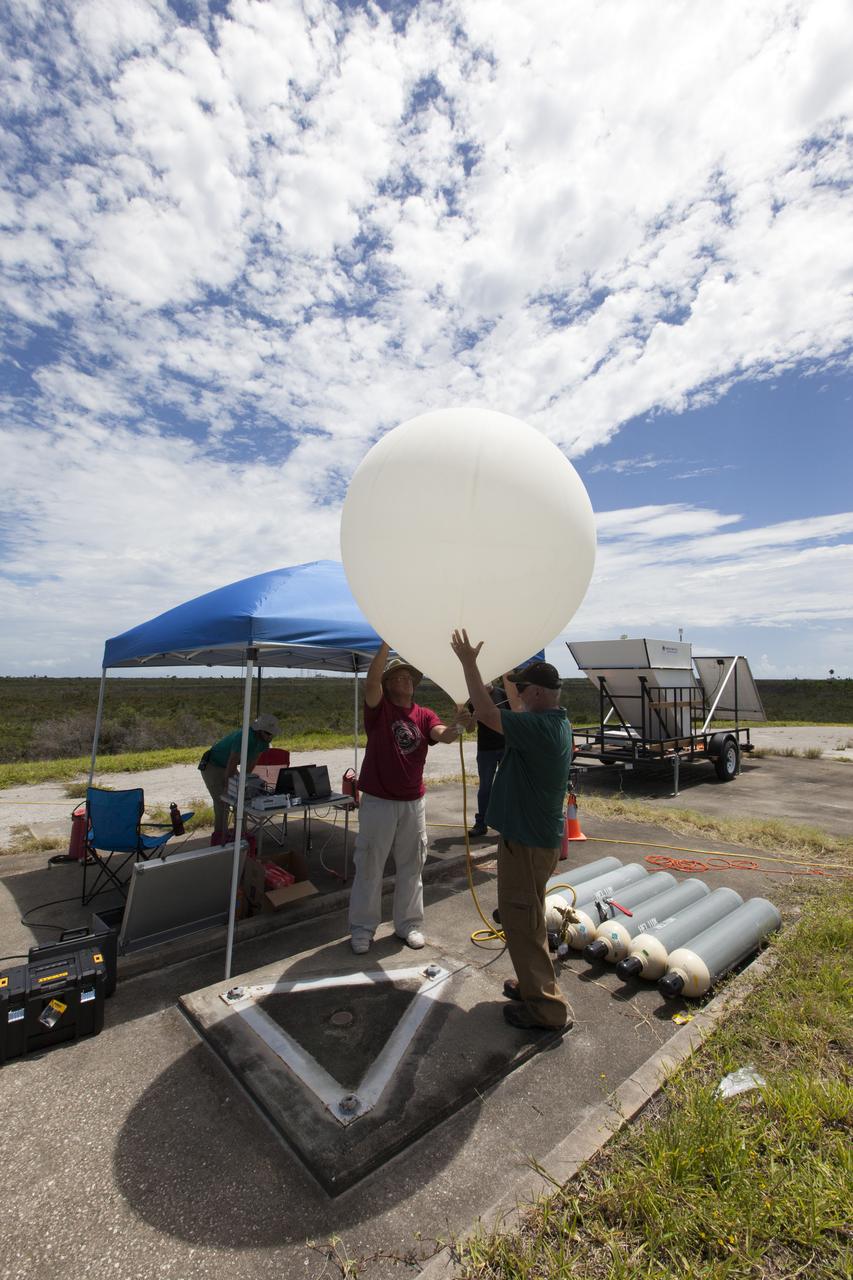
A weather balloon is about to be released at NASA's Kennedy Space Center in Florida before flights of agency F-18 jets to measure the effects of sonic booms. Several flights a day have been taking place the week of Aug. 21, 2017 as part of NASA's Sonic Booms in Atmospheric Turbulence, or SonicBAT II Program. NASA at Kennedy is partnering with the agency's Armstrong Flight Research Center in California, Langley Research Center in Virginia, and Space Florida for a program in which F-18 jets will take off from the Shuttle Landing Facility and fly at supersonic speeds while agency researchers measure the effects of low-altitude turbulence caused by sonic booms.
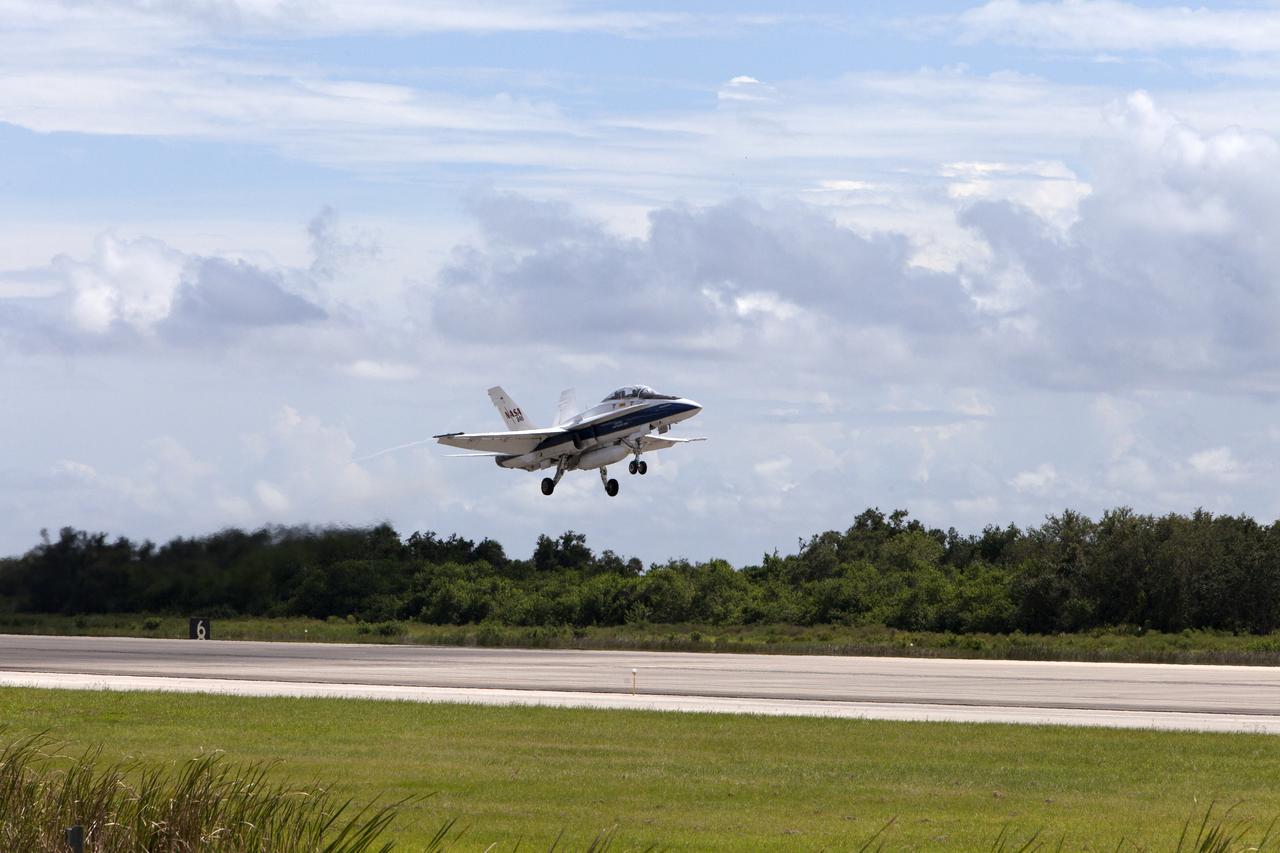
A NASA F-18 jet takes off from the agency's Shuttle Landing Facility at NASA's Kennedy Space Center in Florida. Several flights a day have been taking place the week of Aug. 21, 2017 to measure the effects of sonic booms. It is part of NASA's Sonic Booms in Atmospheric Turbulence, or SonicBAT II Program. NASA at Kennedy is partnering with the agency's Armstrong Flight Research Center in California, Langley Research Center in Virginia, and Space Florida for a program in which F-18 jets will take off from the Shuttle Landing Facility and fly at supersonic speeds while agency researchers measure the effects of low-altitude turbulence caused by sonic booms.
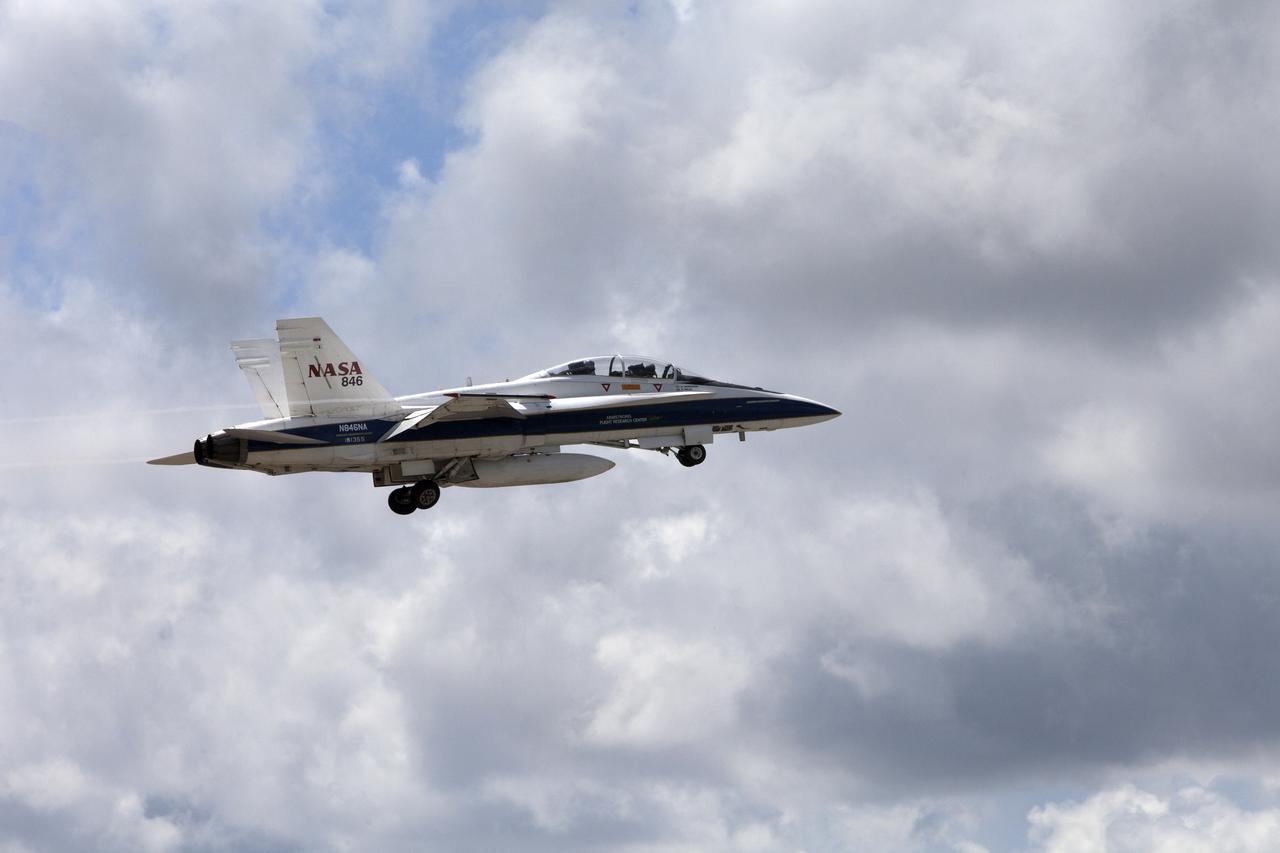
A NASA F-18 jet has taken off from the agency's Shuttle Landing Facility at NASA's Kennedy Space Center in Florida. Several flights a day have been taking place the week of Aug. 21, 2017 to measure the effects of sonic booms. It is part of NASA's Sonic Booms in Atmospheric Turbulence, or SonicBAT II Program. NASA at Kennedy is partnering with the agency's Armstrong Flight Research Center in California, Langley Research Center in Virginia, and Space Florida for a program in which F-18 jets will take off from the Shuttle Landing Facility and fly at supersonic speeds while agency researchers measure the effects of low-altitude turbulence caused by sonic booms.
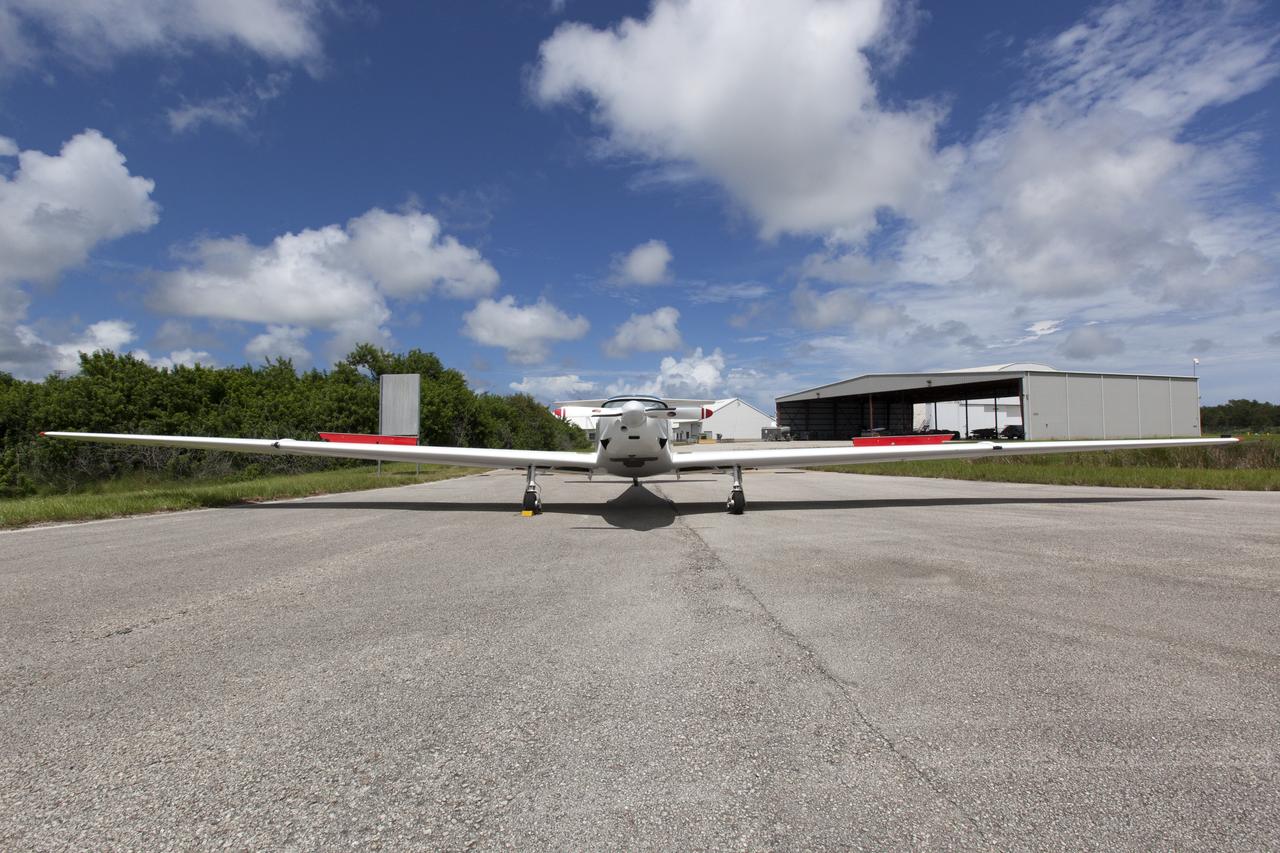
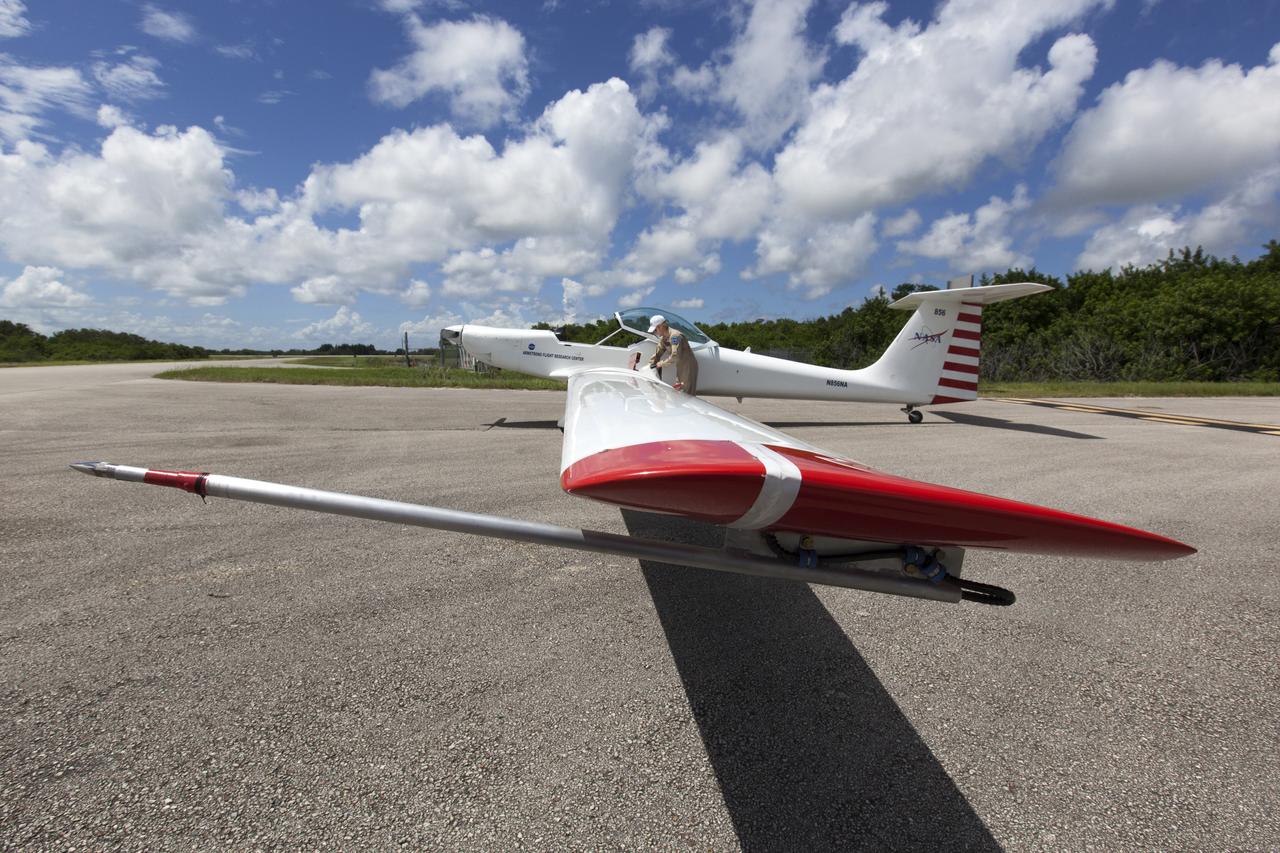
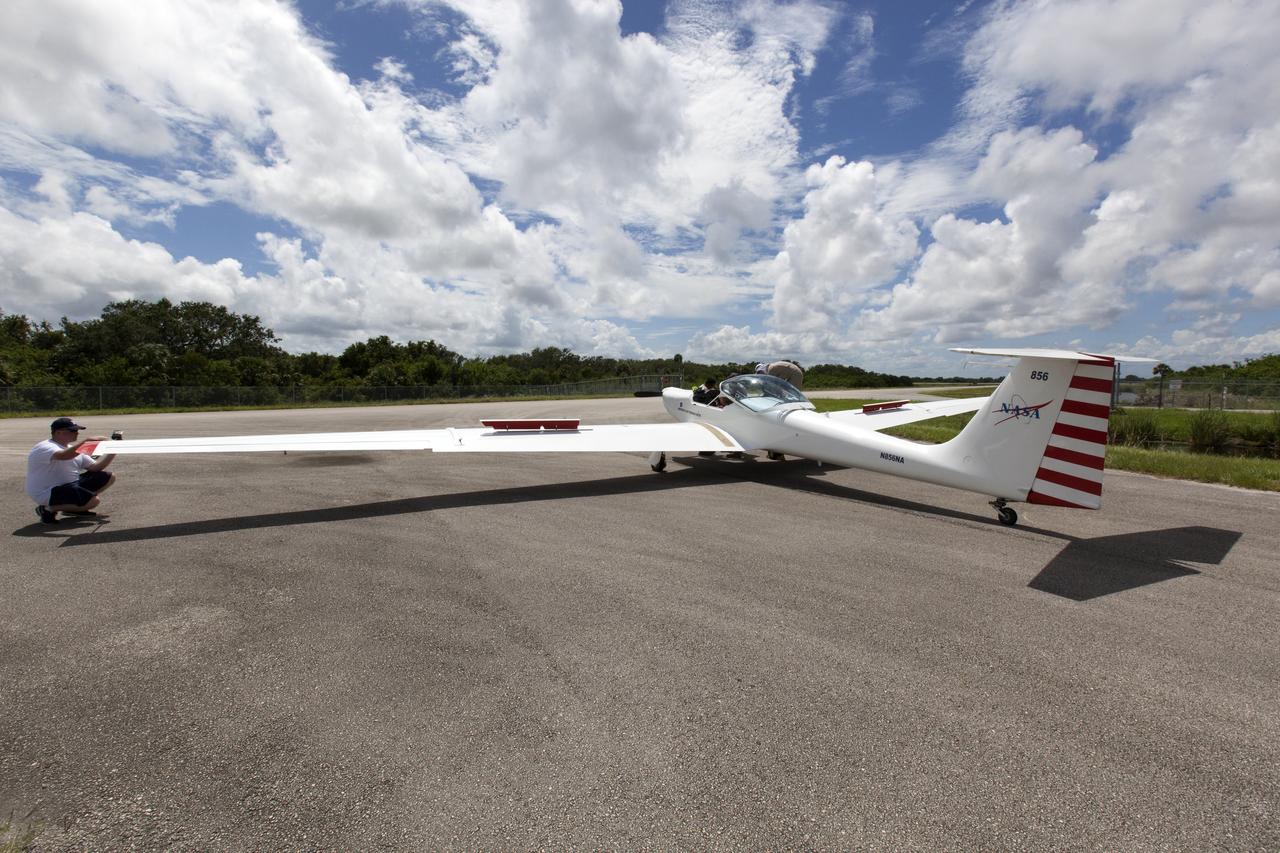
A motorized glider prepares to take off from the Shuttle Landing Facility at NASA's Kennedy Space Center in Florida. Flying with its engine off, the glider will be positioned above the 14,000-foot level to measure sonic booms created by agency F-18 jets to measure the effects of sonic booms. Several flights a day have been taking place the week of Aug. 21, 2017 as part of NASA's Sonic Booms in Atmospheric Turbulence, or SonicBAT II Program. NASA at Kennedy is partnering with the agency's Armstrong Flight Research Center in California, Langley Research Center in Virginia, and Space Florida for a program in which F-18 jets will take off from the Shuttle Landing Facility and fly at supersonic speeds while agency researchers measure the effects of low-altitude turbulence caused by sonic booms.
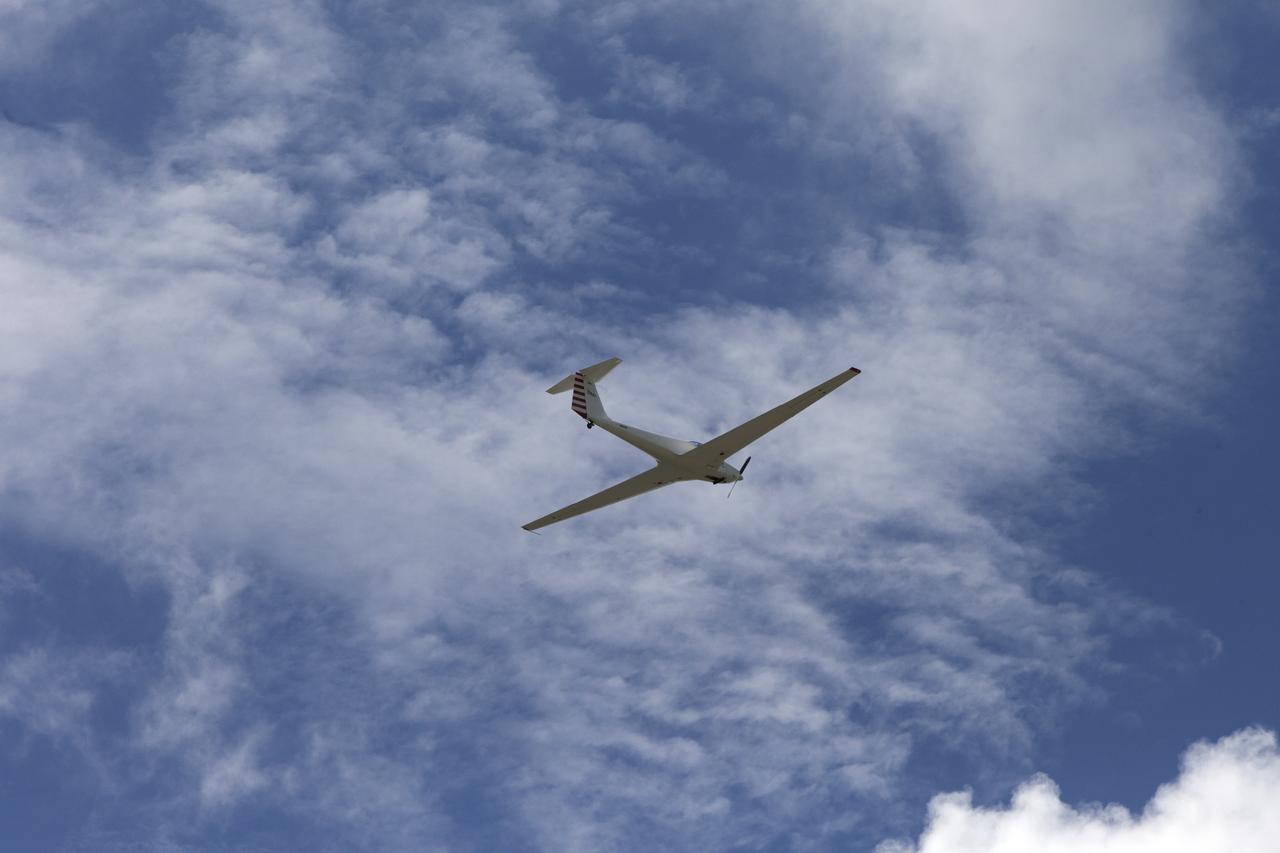
A motorized glider has taken off from the Shuttle Landing Facility at NASA's Kennedy Space Center in Florida. Flying with its engine off, the glider will be positioned above the 14,000-foot level to measure sonic booms created by agency F-18 jets to measure the effects of sonic booms. Several flights a day have been taking place the week of Aug. 21, 2017 as part of NASA's Sonic Booms in Atmospheric Turbulence, or SonicBAT II Program. NASA at Kennedy is partnering with the agency's Armstrong Flight Research Center in California, Langley Research Center in Virginia, and Space Florida for a program in which F-18 jets will take off from the Shuttle Landing Facility and fly at supersonic speeds while agency researchers measure the effects of low-altitude turbulence caused by sonic booms.
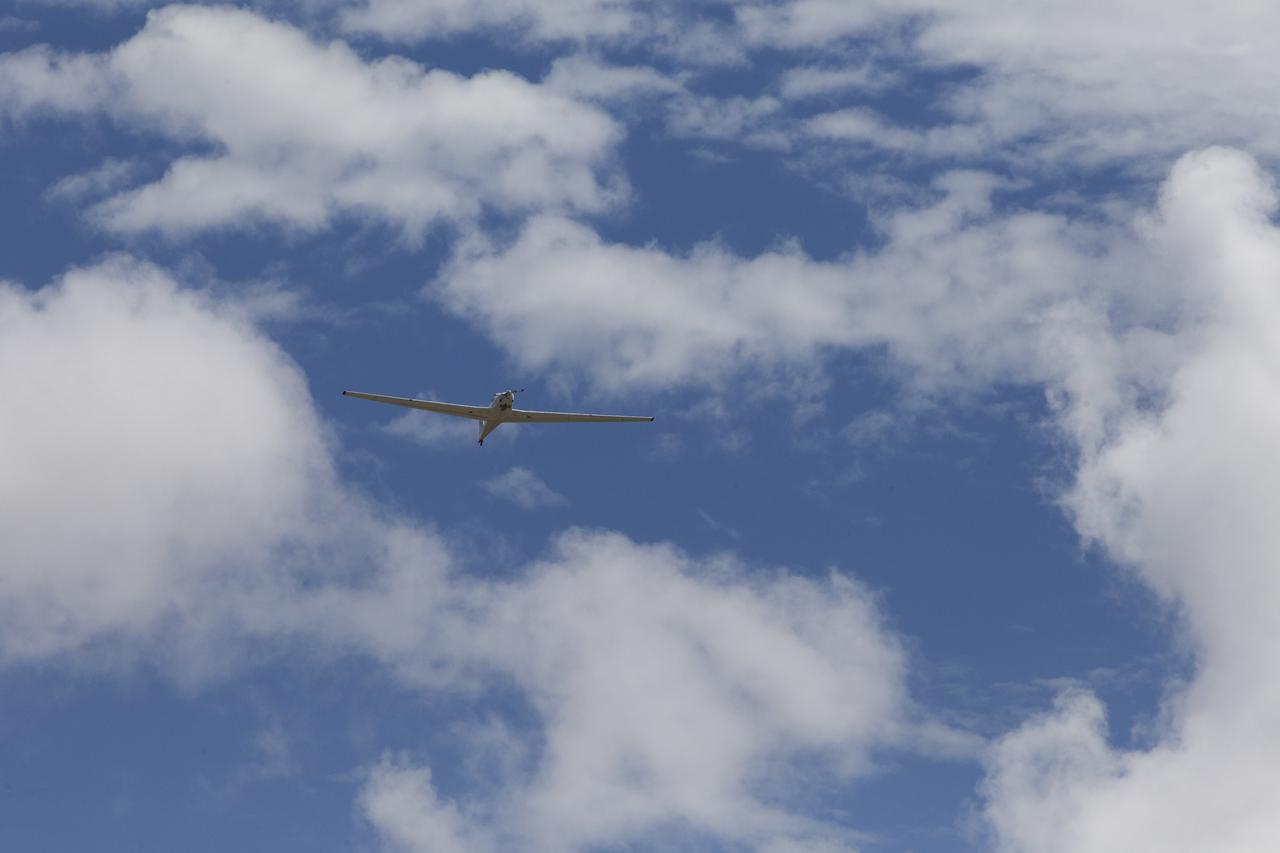
A motorized glider has taken off from the Shuttle Landing Facility at NASA's Kennedy Space Center in Florida. Flying with its engine off, the glider will be positioned above the 14,000-foot level to measure sonic booms created by agency F-18 jets to measure the effects of sonic booms. Several flights a day have been taking place the week of Aug. 21, 2017 as part of NASA's Sonic Booms in Atmospheric Turbulence, or SonicBAT II Program. NASA at Kennedy is partnering with the agency's Armstrong Flight Research Center in California, Langley Research Center in Virginia, and Space Florida for a program in which F-18 jets will take off from the Shuttle Landing Facility and fly at supersonic speeds while agency researchers measure the effects of low-altitude turbulence caused by sonic booms.
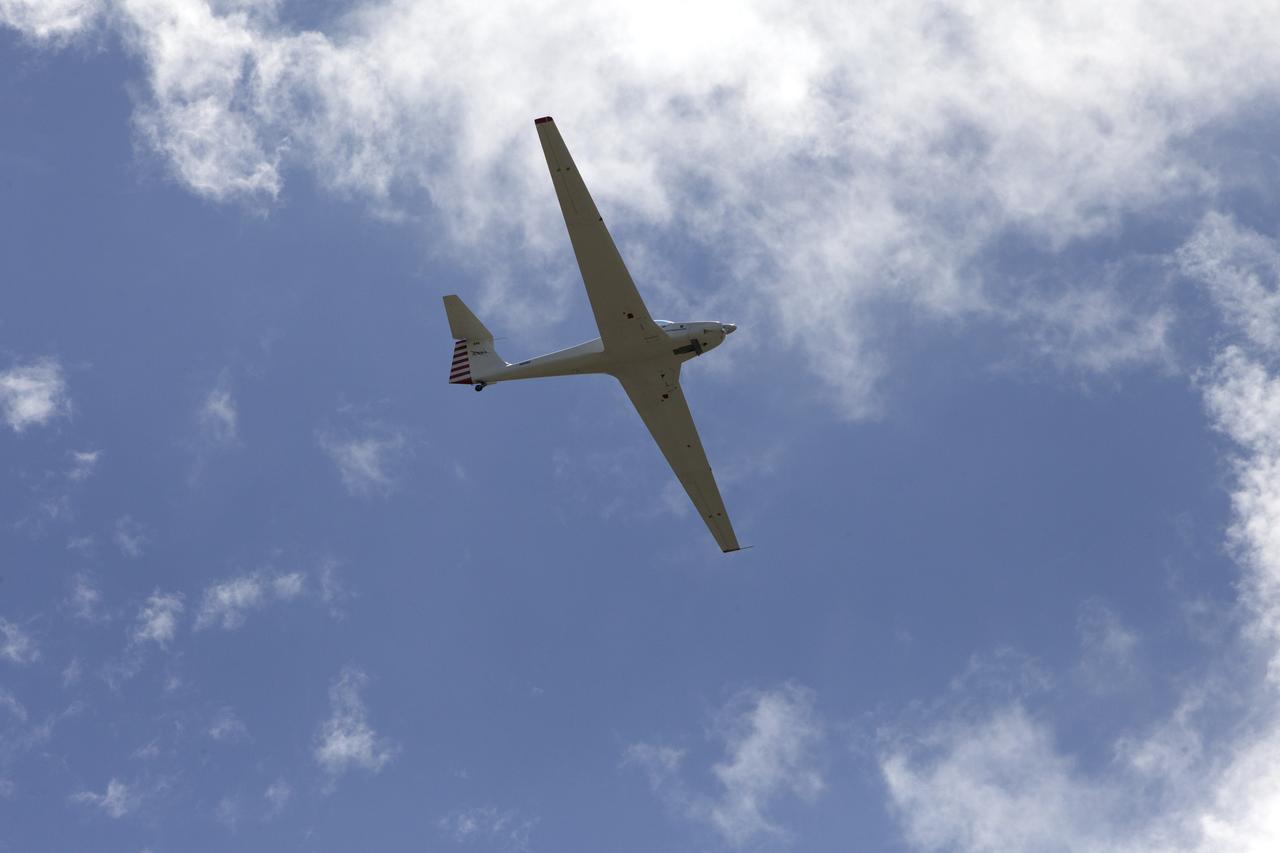
A motorized glider has taken off from the Shuttle Landing Facility at NASA's Kennedy Space Center in Florida. Flying with its engine off, the glider will be positioned above the 14,000-foot level to measure sonic booms created by agency F-18 jets to measure the effects of sonic booms. Several flights a day have been taking place the week of Aug. 21, 2017 as part of NASA's Sonic Booms in Atmospheric Turbulence, or SonicBAT II Program. NASA at Kennedy is partnering with the agency's Armstrong Flight Research Center in California, Langley Research Center in Virginia, and Space Florida for a program in which F-18 jets will take off from the Shuttle Landing Facility and fly at supersonic speeds while agency researchers measure the effects of low-altitude turbulence caused by sonic booms.
A motorized glider prepares to take off from the Shuttle Landing Facility at NASA's Kennedy Space Center in Florida. Flying with its engine off, the glider will be positioned above the 14,000-foot level to measure sonic booms created by agency F-18 jets to measure the effects of sonic booms. Several flights a day have been taking place the week of Aug. 21, 2017 as part of NASA's Sonic Booms in Atmospheric Turbulence, or SonicBAT II Program. NASA at Kennedy is partnering with the agency's Armstrong Flight Research Center in California, Langley Research Center in Virginia, and Space Florida for a program in which F-18 jets will take off from the Shuttle Landing Facility and fly at supersonic speeds while agency researchers measure the effects of low-altitude turbulence caused by sonic booms.
A motorized glider prepares to take off from the Shuttle Landing Facility at NASA's Kennedy Space Center in Florida. Flying with its engine off, the glider will be positioned above the 14,000-foot level to measure sonic booms created by agency F-18 jets to measure the effects of sonic booms. Several flights a day have been taking place the week of Aug. 21, 2017 as part of NASA's Sonic Booms in Atmospheric Turbulence, or SonicBAT II Program. NASA at Kennedy is partnering with the agency's Armstrong Flight Research Center in California, Langley Research Center in Virginia, and Space Florida for a program in which F-18 jets will take off from the Shuttle Landing Facility and fly at supersonic speeds while agency researchers measure the effects of low-altitude turbulence caused by sonic booms.

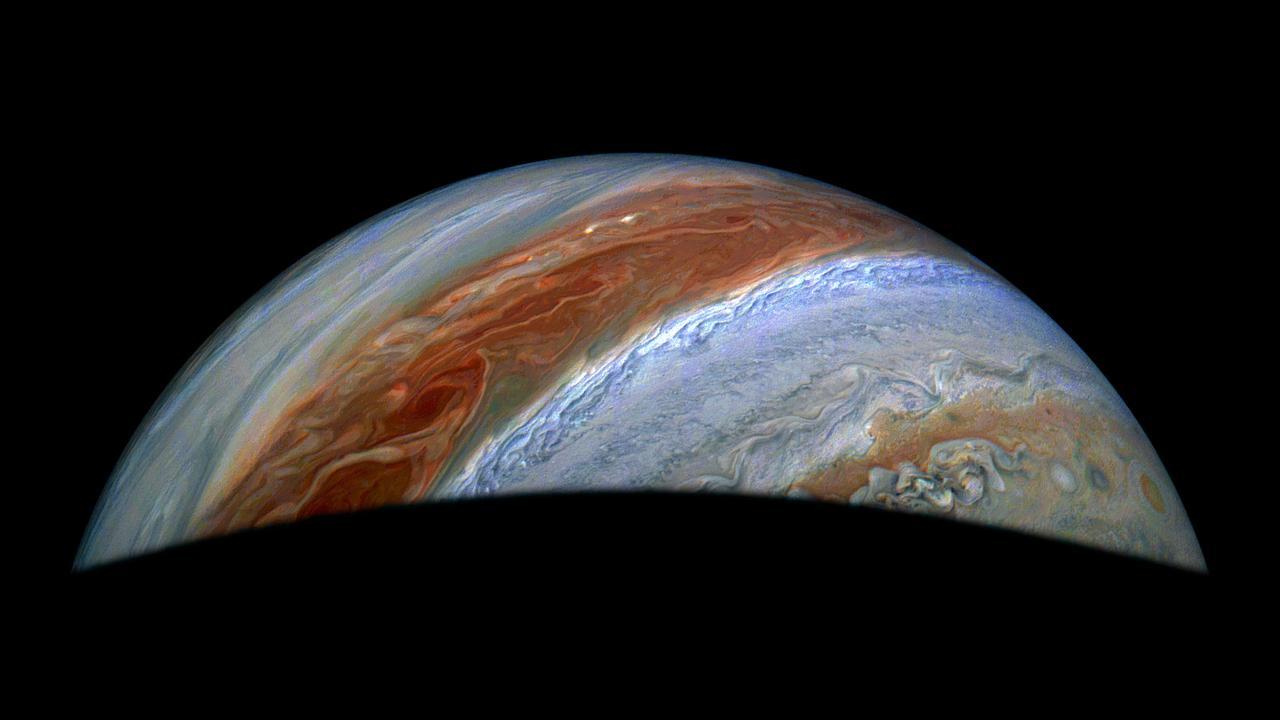
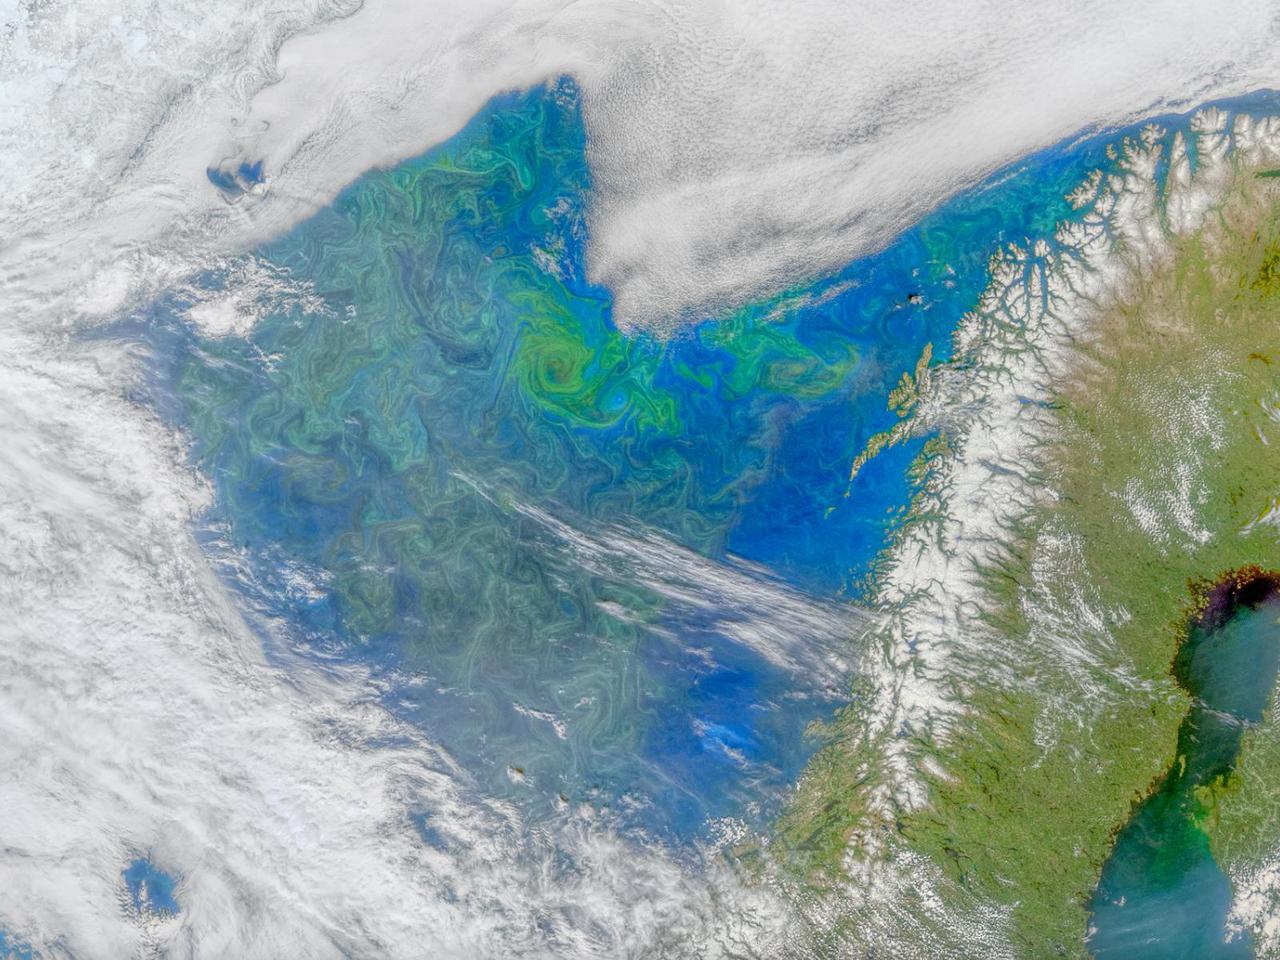
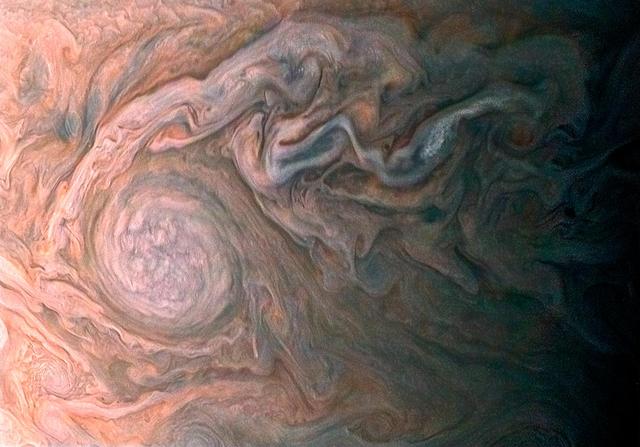
The left image shows a phytoplankton bloom in the Norwegian Sea. The right image shows turbulent clouds in Jupiter's atmosphere. Jupiter's atmosphere is one of the most turbulent places in the solar system. Orbiting Jupiter and its 79 moons is NASA's Juno spacecraft, which sends images from the largest planet in our solar system back to researchers on Earth. These images from Juno have given oceanographers the raw materials to study the rich turbulence at Jupiter's poles and the physical forces that drive large cyclones on Jupiter. Lia Siegelman, a physical oceanographer and postdoctoral scholar at Scripps Institution of Oceanography at the University of California, San Diego, observed similarities between the richness of turbulence around Jovian cyclones and the filaments around smaller eddies with turbulence seen in Earth's oceans. https://photojournal.jpl.nasa.gov/catalog/PIA25037
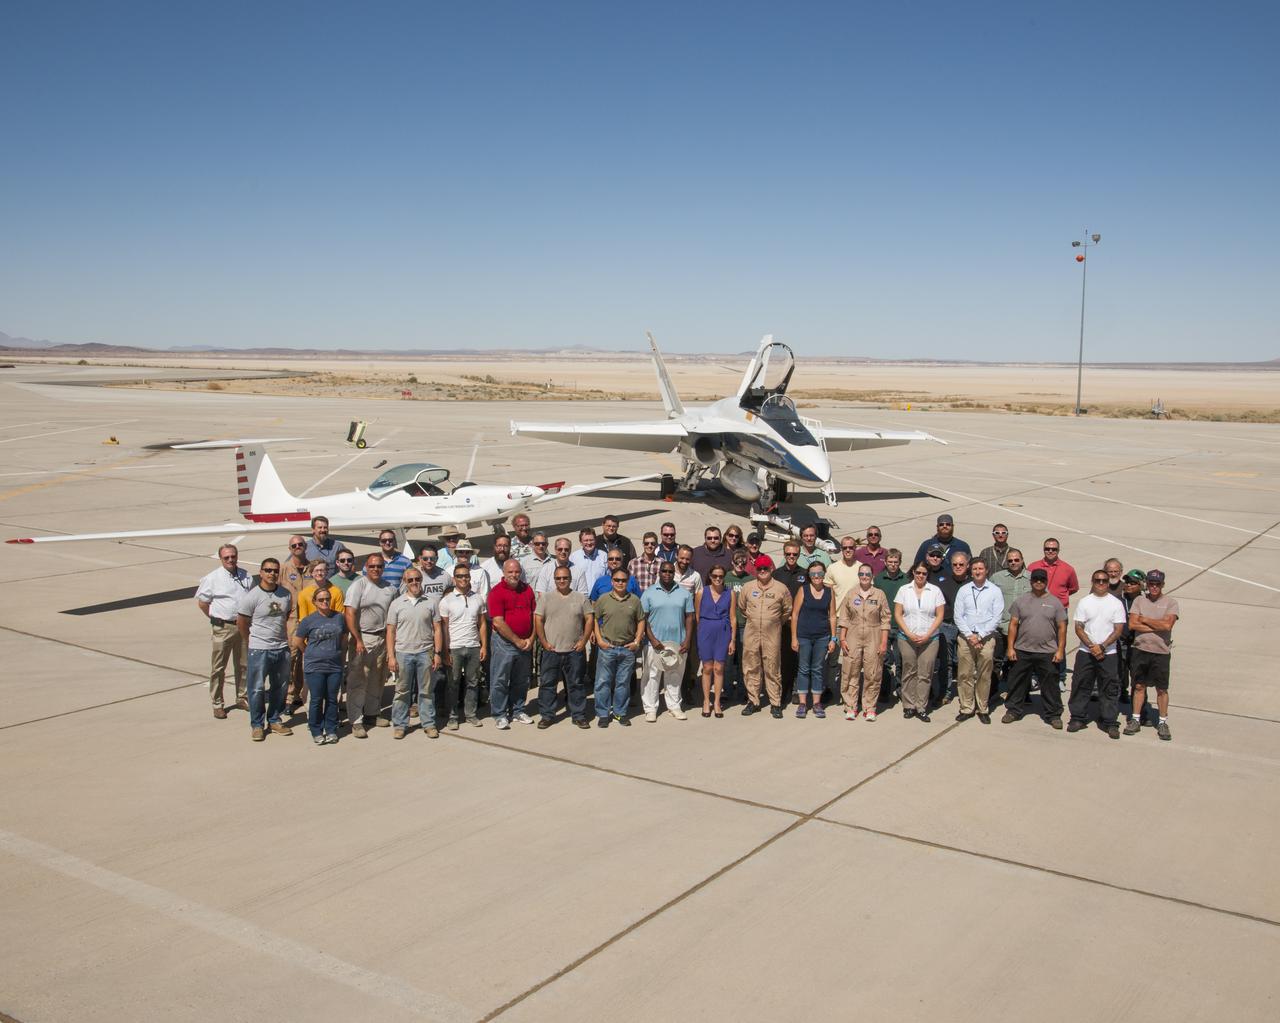
NASA’s SonicBAT team poses in front of the TG-14 motor glider and F/A-18 research aircraft, sitting side-by-side in front of Rogers Dry Lake prior to a SonicBAT flight at Armstrong Flight Research Center on Edwards Air Force Base, California. The TG-14 collected sound signatures of shockwaves created by the F/A-18, to compare with signatures collected on the ground.
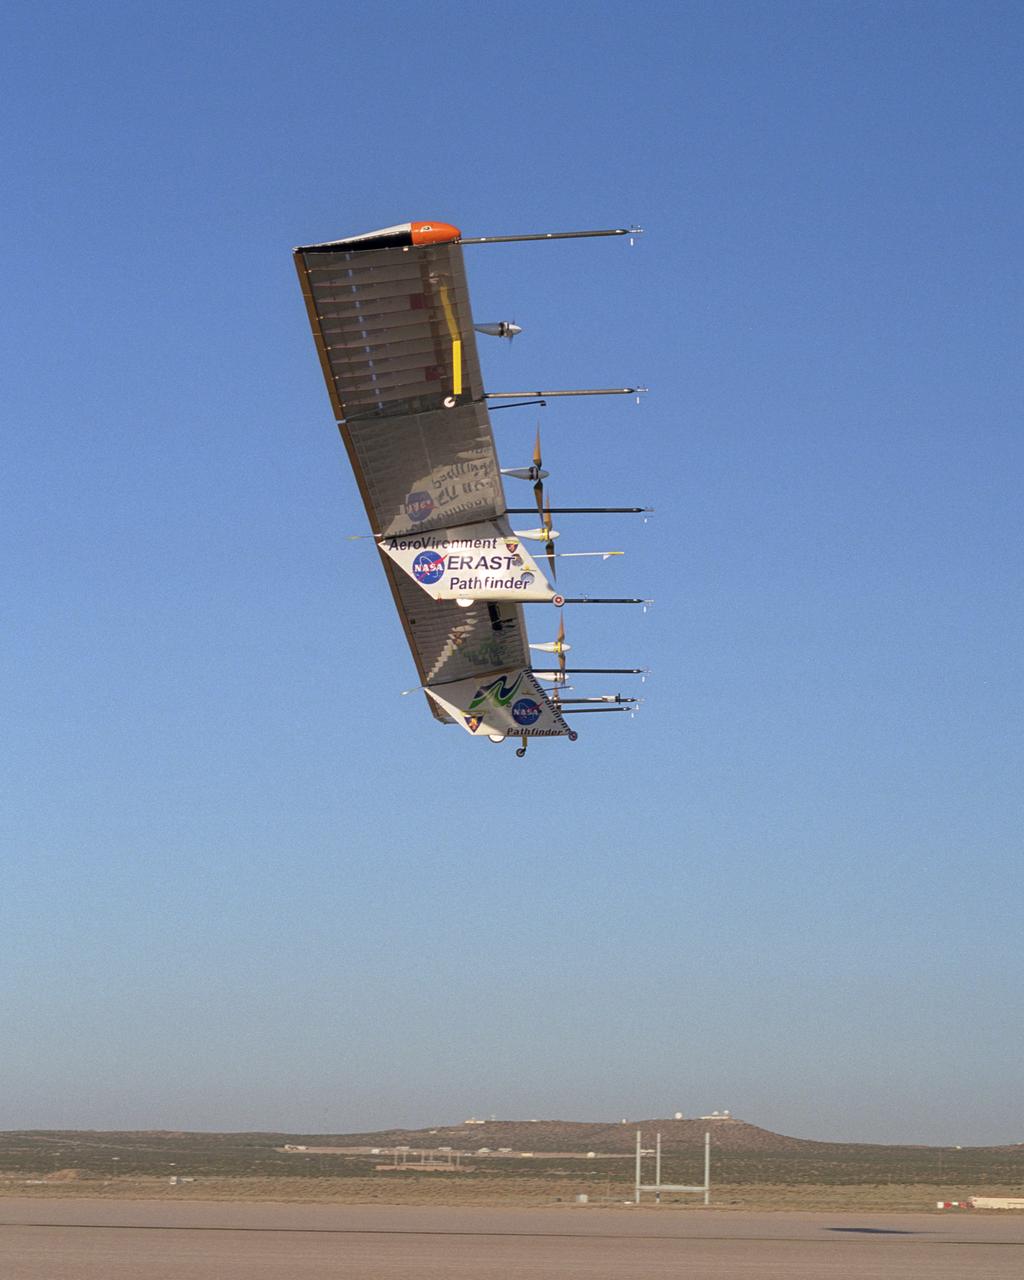
The Atmospheric Turbulence Measurement System booms are clearly evident in this view of the Pathfinder-Plus solar aircraft as it flies over Rogers Dry Lake.
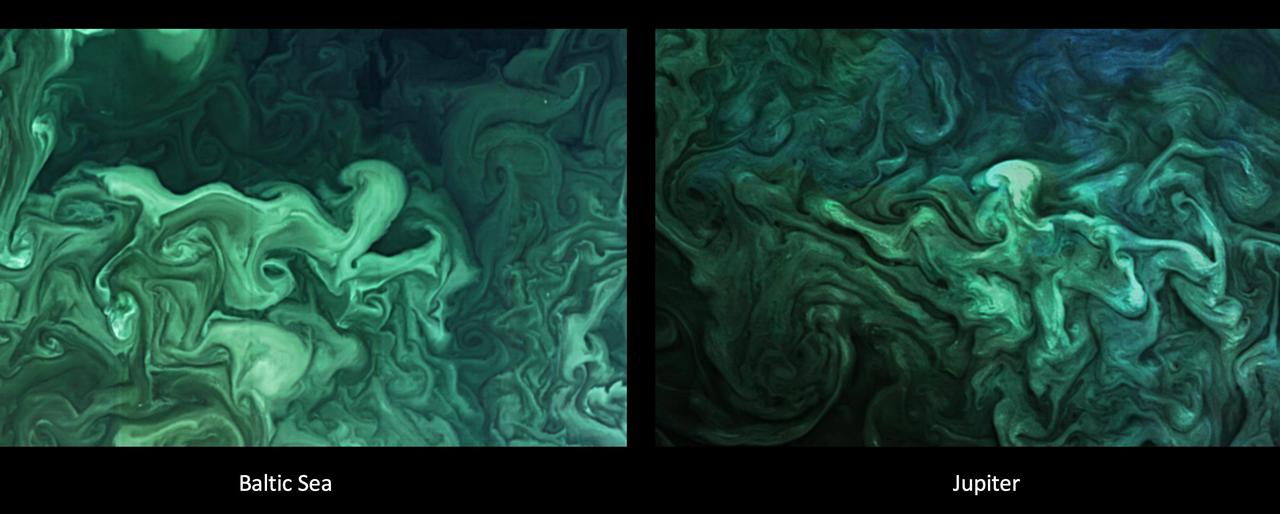
The left image shows a close-up of a phytoplankton blooming in the southern Gulf of Bothnia, in the Baltic Sea, between Sweden and Finland on April 14, 2019. The right image shows turbulent clouds in Jupiter's atmosphere. Jupiter's atmosphere is one of the most turbulent places in the solar system. Orbiting Jupiter and its 79 moons is NASA's Juno spacecraft, which sends images from the largest planet in our solar system back to researchers on Earth. These images from Juno have given oceanographers the raw materials to study the rich turbulence at Jupiter's poles and the physical forces that drive large cyclones on Jupiter. Lia Siegelman, a physical oceanographer and postdoctoral scholar at Scripps Institution of Oceanography at the University of California San Diego, observed similarities between the richness of turbulence around Jovian cyclones and the filaments around smaller eddies with turbulence seen in Earth's oceans. https://photojournal.jpl.nasa.gov/catalog/PIA25034
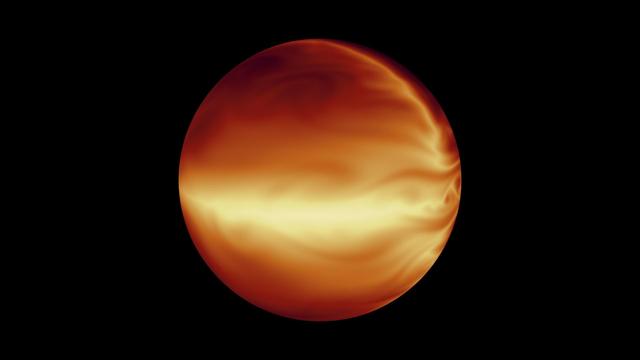
The turbulent atmosphere of a hot, gaseous planet known as HD 80606b is shown in this simulation based on data from NASA Spitzer Space Telescope.
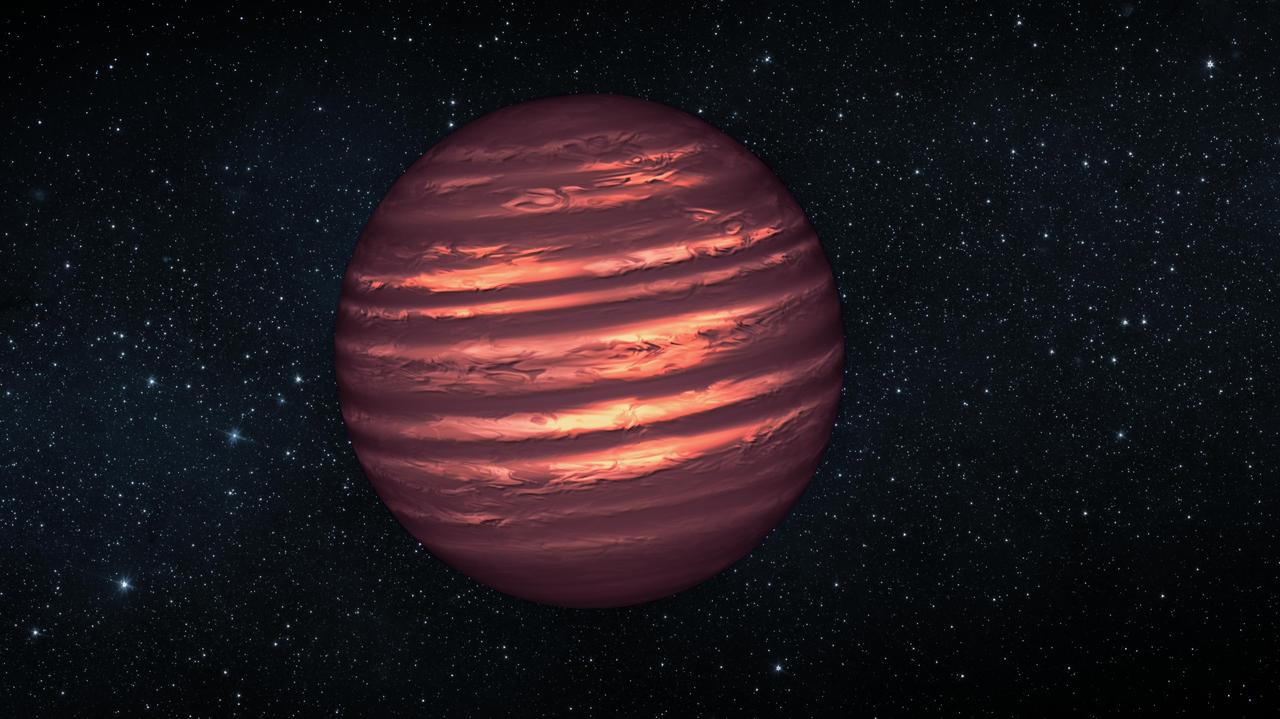
This artist conception illustrates the brown dwarf named 2MASSJ22282889-431026. NASA Hubble and Spitzer space telescopes observed the object to learn more about its turbulent atmosphere.

These images near Guadalupe Island from NASA Terra satellite from June 11, 2000 Terra orbit 2569 demonstrate a turbulent atmospheric flow pattern known as the von Karman vortex.
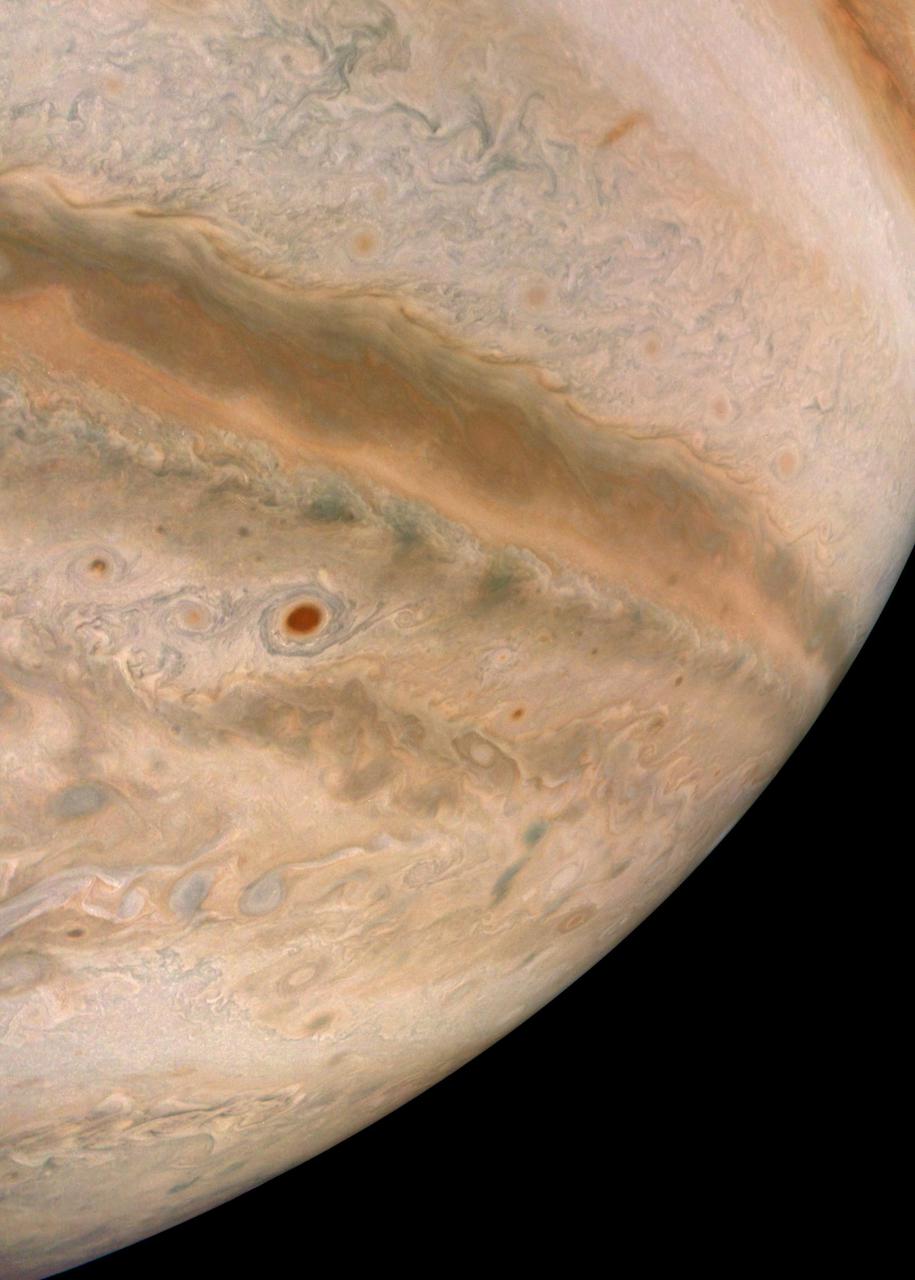
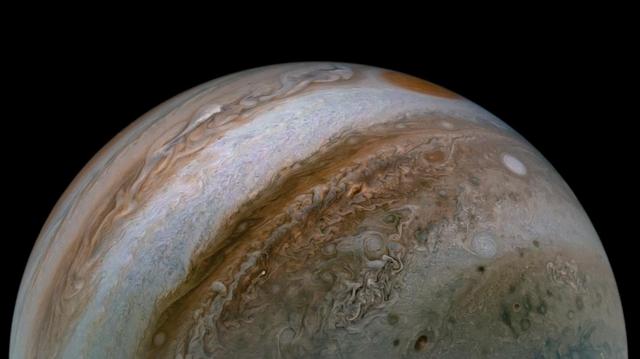
During its 36th low pass over Jupiter, NASA's Juno spacecraft captured this view of striking cloud bands and swirls in the giant planet's mid-southern latitudes. The dark, circular vortex near the center of the image is a cyclone that spans roughly 250 miles (about 400 kilometers). The color at its center is likely to be the result of descending winds that cleared out upper-level clouds, revealing darker material below. Citizen scientist Brian Swift used a raw JunoCam image digitally projected onto a sphere to create this view. It has been rotated so that north is up. The original image was taken on Sept. 2, 2021, at 4:09 p.m. PDT (7:09 p.m. EDT). At the time, the spacecraft was about 16,800 miles (about 27,000 kilometers) above Jupiter's cloud tops, at a latitude of about 31 degrees south. https://photojournal.jpl.nasa.gov/catalog/PIA23610
JunoCam, the visible light imager aboard NASA's Juno, captured this view of Jupiter's northern high latitudes during the spacecraft's 69th flyby of the giant planet on Jan. 28, 2025. Jupiter's belts and zones stand out in this enhanced color rendition, along with the turbulence along their edges caused by winds going in different directions. The original JunoCam image used to produce this view was taken from an altitude of about 36,000 miles (58,000 kilometers) above Jupiter's cloud tops. Citizen scientist Jackie Branc processed the image. https://photojournal.jpl.nasa.gov/catalog/PIA26595
This view of Jupiter's turbulent atmosphere from NASA's Juno spacecraft includes several of the planet's southern jet streams. Using data from Juno's instruments, scientists discovered that Jupiter's powerful atmospheric jet streams extend far deeper than previously imagined. Evidence from Juno shows the jet streams and belts penetrate about 1,800 miles (3,000 kilometers) down into the planet. The storm known as the Great Red Spot is also visible on the horizon, nearly rotated out of view as Juno sped away from Jupiter at about 30 miles per second (48 kilometers per second), which is more than 100,000 mph (160,900 kilometers per hour). Citizen scientist Tanya Oleksuik created this color-enhanced image using data from the JunoCam camera. The original image was taken on Dec. 30, 2020 as the Juno spacecraft performed its 31st close flyby of Jupiter. At the time, the spacecraft was about 31,000 miles (about 50,000 kilometers) from the planet's cloud tops, at a latitude of about 50 degrees South. https://photojournal.jpl.nasa.gov/catalog/PIA23809
This morphing animation compares the eddies in Earth's oceans to the turbulent clouds in Jupiter's atmosphere. In the movie, a zoom occurs around a vortex dipole: a typical structure consisting of a cyclone and an anticyclone that is present both in Earth's ocean and Jupiter's atmosphere. The ocean image showing the spring phytoplankton bloom in the southern Gulf of Bothnia was generated from data collected by the MODIS instrument about NASA's Aqua satellite. The Jupiter image is from JunoCam. Scientist Lia Siegelman observed the similarities between the richness of turbulence around Joviancyclones and the filaments around smaller eddies seen in Earth's oceans. These similarities were especially evident in high-resolution satellite images of plankton blooms. Movie available at https://photojournal.jpl.nasa.gov/catalog/PIA25069

In the Kennedy Space Center's Press Site auditorium, Dale Ketcham chief of Strategic Alliances for Space Florida, speaks to members of the media at a news conference to discuss upcoming flight tests to study the effects of sonic booms. Kennedy is partnering with Armstrong, Langley and Space Florida for a program called SonicBAT for Sonic Booms in Atmospheric Turbulence. Starting in August, NASA F-18 jets will take off from the Shuttle Landing Facility and fly at supersonic speeds while agency researchers on the ground measure the effects of low-altitude turbulence on sonic booms. The study could lead to technology mitigating the annoying sonic booms making possible supersonic flights over populated areas.

In the Kennedy Space Center's Press Site auditorium, Peter Coen, SonicBAT Mission Analysis at NASA’s Langley Research Center in Virginia, speaks to members of the media at a news conference to discuss upcoming flight tests to study the effects of sonic booms. Kennedy is partnering with Armstrong, Langley and Space Florida for a program called SonicBAT for Sonic Booms in Atmospheric Turbulence. Starting in August, NASA F-18 jets will take off from the Shuttle Landing Facility and fly at supersonic speeds while agency researchers on the ground measure the effects of low-altitude turbulence on sonic booms. The study could lead to technology mitigating the annoying sonic booms making possible supersonic flights over populated areas.

In the Kennedy Space Center's Press Site auditorium, Matthew Kamlet of NASA Communications at the Armstrong Flight Research Center in California, speaks to members of the media at a news conference to discuss upcoming flight tests to study the effects of sonic booms. Kennedy is partnering with Armstrong, Langley and Space Florida for a program called SonicBAT for Sonic Booms in Atmospheric Turbulence. Starting in August, NASA F-18 jets will take off from the Shuttle Landing Facility and fly at supersonic speeds while agency researchers on the ground measure the effects of low-altitude turbulence on sonic booms. The study could lead to technology mitigating the annoying sonic booms making possible supersonic flights over populated areas.

In the Kennedy Space Center's Press Site auditorium, Larry Cliatt, SonicBAT Fluid Mechanics at Armstrong Flight Research Center in California, speaks to members of the media at a news conference to discuss upcoming flight tests to study the effects of sonic booms. Kennedy is partnering with Armstrong, Langley and Space Florida for a program called SonicBAT for Sonic Booms in Atmospheric Turbulence. Starting in August, NASA F-18 jets will take off from the Shuttle Landing Facility and fly at supersonic speeds while agency researchers on the ground measure the effects of low-altitude turbulence on sonic booms. The study could lead to technology mitigating the annoying sonic booms making possible supersonic flights over populated areas.

In the Kennedy Space Center's Press Site auditorium, Laura Henning, public information officer for the Canaveral National Seashore, speaks to members of the media at a news conference to discuss upcoming flight tests to study the effects of sonic booms. Kennedy is partnering with Armstrong, Langley and Space Florida for a program called SonicBAT for Sonic Booms in Atmospheric Turbulence. Starting in August, NASA F-18 jets will take off from the Shuttle Landing Facility and fly at supersonic speeds while agency researchers on the ground measure the effects of low-altitude turbulence on sonic booms. The study could lead to technology mitigating the annoying sonic booms making possible supersonic flights over populated areas.
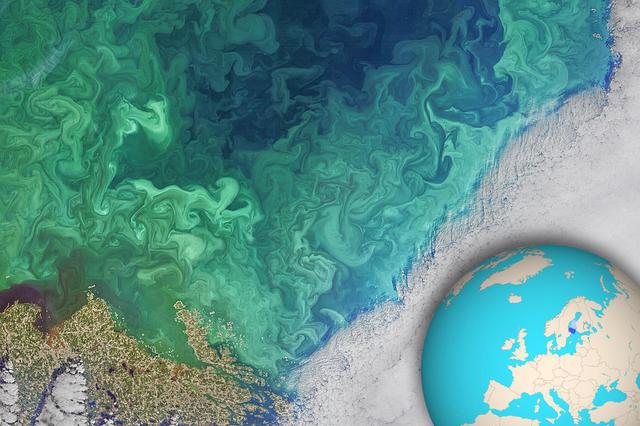
NASA's Landsat 8 satellite collected this view of phytoplankton blooming in the southern Gulf of Bothnia, in the Baltic Sea, between Sweden and Finland on April 14, 2019. Jupiter's atmosphere is one of the most turbulent places in the solar system. Orbiting Jupiter and its 79 moons is NASA's Juno spacecraft, which sends images from the largest planet in our solar system back to researchers on Earth. These images from Juno have given oceanographers the raw materials to study the rich turbulence at Jupiter's poles and the physical forces that drive large cyclones on the gas giant. Lia Siegelman, a physical oceanographer and postdoctoral scholar at Scripps Institution of Oceanography at the University of California, San Diego, observed similarities between the richness of turbulence around Jovian cyclones and the filaments around smaller eddies with turbulence seen in Earth's oceans. These similarities between the phenomena on Earth and Jupiter are especially evident on high-resolution images of plankton blooms, as seen above. https://photojournal.jpl.nasa.gov/catalog/PIA25033
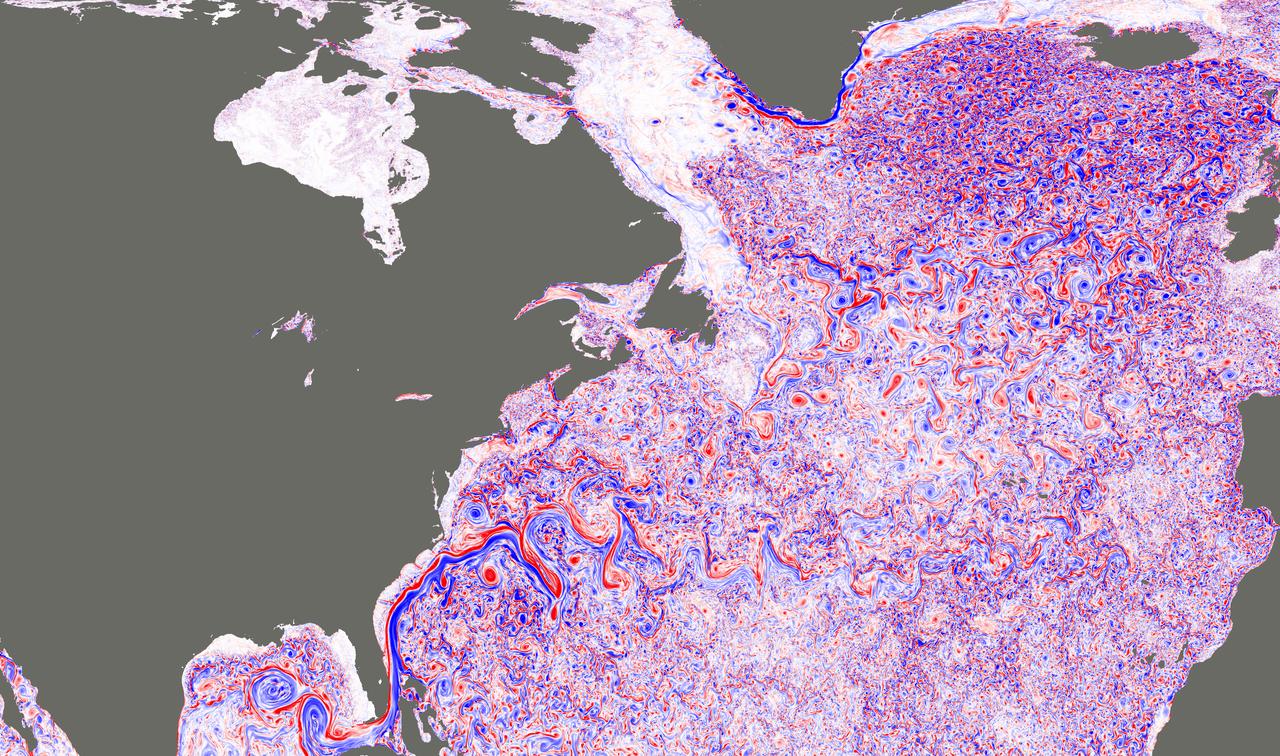
This image shows a simulated snapshot of ocean turbulence in the North Atlantic Ocean in March 2012, from a groundbreaking super-high-resolution global ocean simulation (approximately 1.2 miles, or 2 kilometers, horizontal resolution) developed at JPL (http://wwwcvs.mitgcm.org/viewvc/MITgcm/MITgcm_contrib/llc_hires/llc_4320/). The colors represent the magnitude of surface relative vorticity, a measure of the spin of fluid parcels. The image emphasizes fast-rotating, small-scale (defined here as 6.2 to 31-mile, or 10 to 50 kilometer, range) turbulence, especially during the winter. High levels of relative vorticity caused by small-scale turbulence are believed to strongly transport heat and carbon vertically in the ocean. The image appears in a study (Su et al. 2018), entitled "Ocean submesoscales as a key component of the global heat budget," published recently in Nature Communications. The study suggests that upper-ocean small-scale turbulence transports heat upward in the ocean at a level five times larger than larger-scale heat transport by ocean eddies, significantly affecting the exchange of heat between the ocean interior and atmosphere. Such interactions have a crucial impact on the Earth's climate. A movie is available at https://photojournal.jpl.nasa.gov/catalog/PIA22256
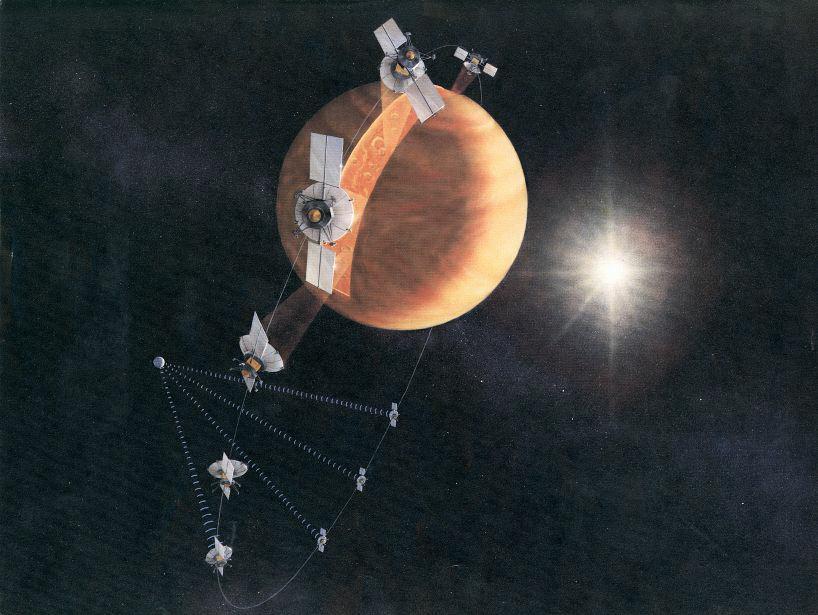
An artist's concept of the Magellan spacecraft making a radar map of Venus. Magellan mapped 98 percent of Venus' surface at a resolution of 100 to 150 meters (about the length of a football or soccer field), using synthetic aperture radar, a technique that simulates the use of a much larger radar antenna. It found that 85 percent of the surface is covered with volcanic flows and showed evidence of tectonic movement, turbulent surface winds, lava channels and pancake-shaped domes. Magellan also produced high-resolution gravity data for 95 percent of the planet and tested a new maneuvering technique called aerobraking, using atmospheric drag to adjust its orbit. The spacecraft was commanded to plunge into Venus' atmosphere in 1994 as part of a final experiment to gather atmospheric data. http://photojournal.jpl.nasa.gov/catalog/PIA18175
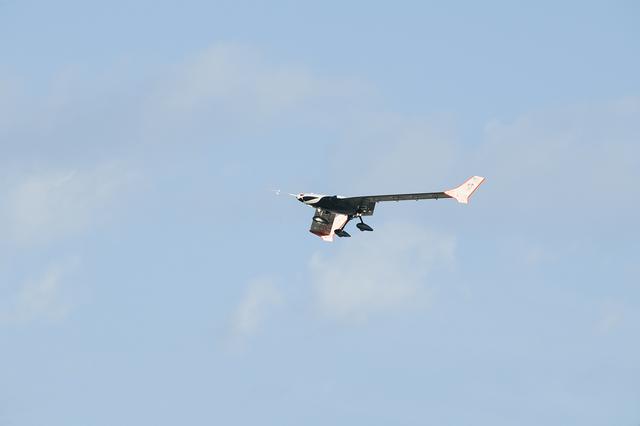
Long, thin, high-aspect-ratio wings are considered crucial to the design of future long-range aircraft, including fuel-efficient airliners and cargo transports. Unlike the short, stiff wings found on most aircraft today, slender, flexible airfoils are susceptible to uncontrollable vibrations, known as flutter, and may be stressed by bending forces from wind gusts and atmospheric turbulence. To improve ride quality, efficiency, safety, and the long-term health of flexible aircraft structures, NASA is using the X-56A Multi-Utility Technology Testbed (MUTT) to investigate key technologies for active flutter suppression and gust-load alleviation.
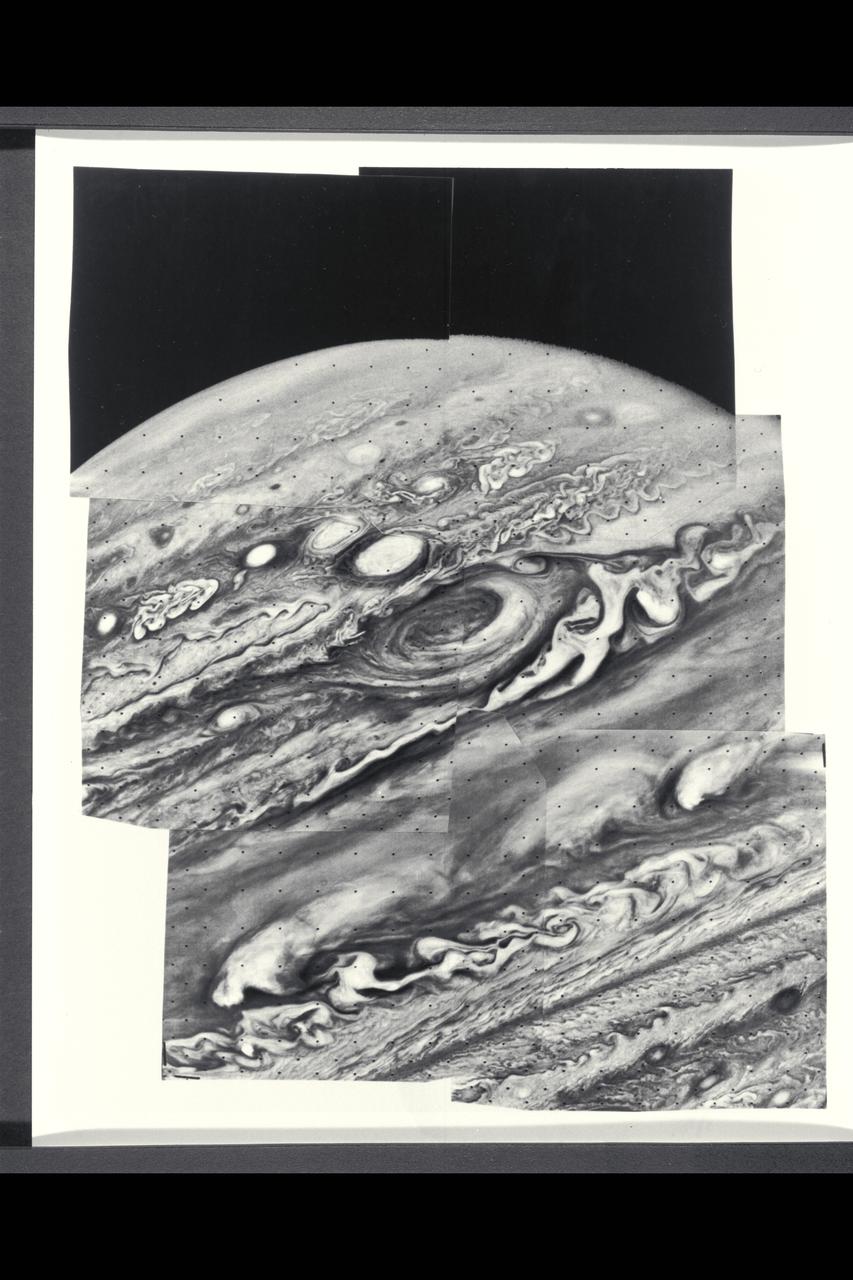
Range : 6.5 million kilometers (4 million miles) Six violet images of Jupiter makes the mosaic photo, showing the Great Red Spot as a swirling vortex type motion. This motion is also seen in several nearby white clouds. These bright white clouds and the Red Spot are rotating in a counter clockwise direction, except the peculiar filimentary cloud to the right of the Red Spot is going clockwise. The top of the picture shows the turbulence from the equatorial jet and more northerly atmospheric currents. The smallest clouds shown are only 70 miles (120 km) across.
NASA Juno spacecraft skimmed the upper wisps of Jupiter atmosphere when JunoCam snapped this image on Feb. 2, 2017. from an altitude of about 9,000 miles 14,500 kilometers above the giant planet swirling cloudtops. Streams of clouds spin off a rotating oval-shaped cloud system in the Jovian southern hemisphere. Citizen scientist Roman Tkachenko reconstructed the color and cropped the image to draw viewers' eyes to the storm and the turbulence around it. http://photojournal.jpl.nasa.gov/catalog/PIA21383 . - Enhanced image by Roman Tkachenko (CC-BY) based on images provided courtesy of NASA/JPL-Caltech/SwRI/MSSS
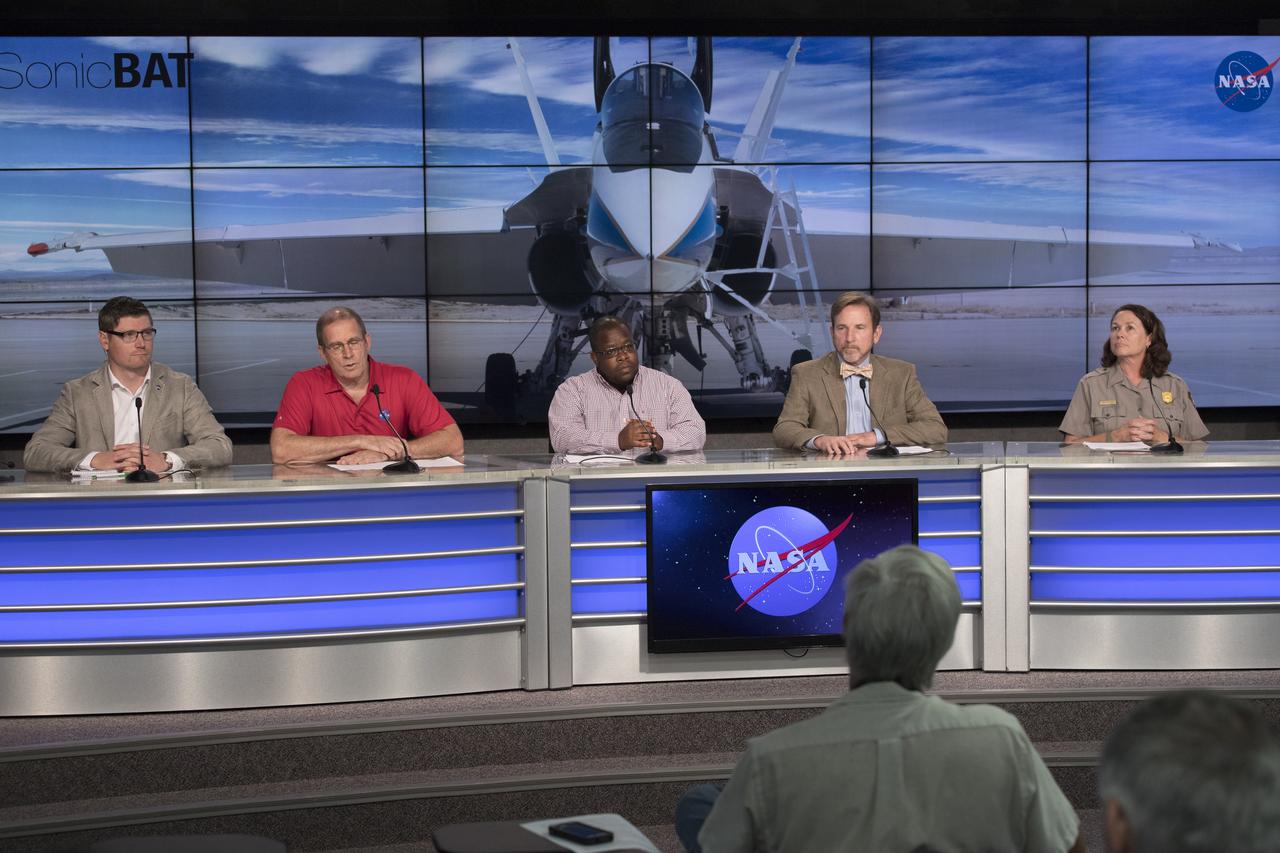
In the Kennedy Space Center's Press Site auditorium, NASA and other government leaders speak to members of the media at a news conference to discuss upcoming flight tests to study the effects of sonic booms. Participants from left are: Matthew Kamlet of NASA Communications at the Armstrong Flight Research Center in California; Peter Coen, SonicBAT Mission Analysis at NASA’s Langley Research Center in Virginia; Larry Cliatt, SonicBAT Fluid Mechanics at Armstrong; Dale Ketcham chief of Strategic Alliances for Space Florida; and Laura Henning, public information officer for the Canaveral National Seashore. Kennedy is partnering with Armstrong, Langley and Space Florida for a program called SonicBAT for Sonic Booms in Atmospheric Turbulence. Starting in August, NASA F-18 jets will take off from the Shuttle Landing Facility and fly at supersonic speeds while agency researchers on the ground measure the effects of low-altitude turbulence on sonic booms. The study could lead to technology mitigating the annoying sonic booms making possible supersonic flights over populated areas.
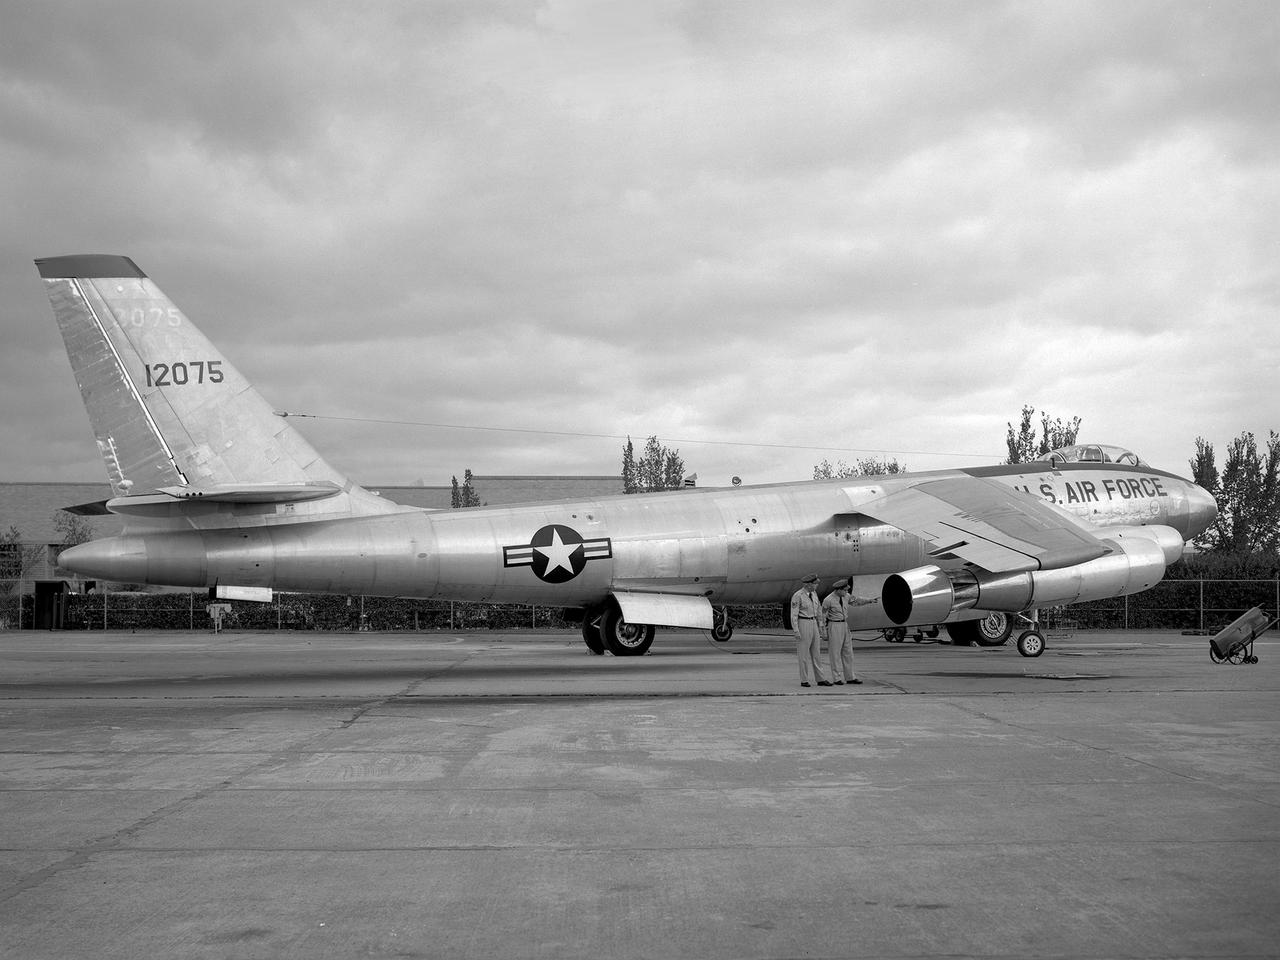
A Boeing B-47 Stratojet bomber with a noise-reducing ejector on its engine at the 1957 Inspection of the National Advisory Committee for Aeronautics (NACA) Lewis Flight Propulsion Laboratory. Representatives from the military, aeronautical industry, universities, and the press were invited to the laboratory to be briefed on the NACA’s latest research efforts and tour the state- of- the- art test facilities. Over 1700 people visited the NACA Lewis in Cleveland, Ohio during October 7 - 10, 1957. By the mid-1950s, the aircraft industry was close to introducing jet airliners to the nation’s airways. The noise produced by the large jet engines, however, would pose a considerable problem for communities near airports. This problem was demonstrated at the 1957 Inspection by an NACA Lewis researcher who played longplay (LP) audio records of military jet engines for an audience. Tests showed that the source of the loudest noise was not the engine itself, but the mixing of the engine’s exhaust with the surrounding air in the atmosphere. The pressures resulting from this turbulence produced sound waves. One of Lewis’ first studies sought to design an exhaust nozzle that reduced the turbulence. A Pratt and Whitney J57 was tested in the Altitude Wind Tunnel with many of these nozzle configurations from January to May 1957. Researchers found that the various nozzle types did reduce the noise levels but also reduced the aircraft’s thrust. Afterwards, they determined that the addition of an NACA-developed ejector reduced the noise levels without diminishing thrust.
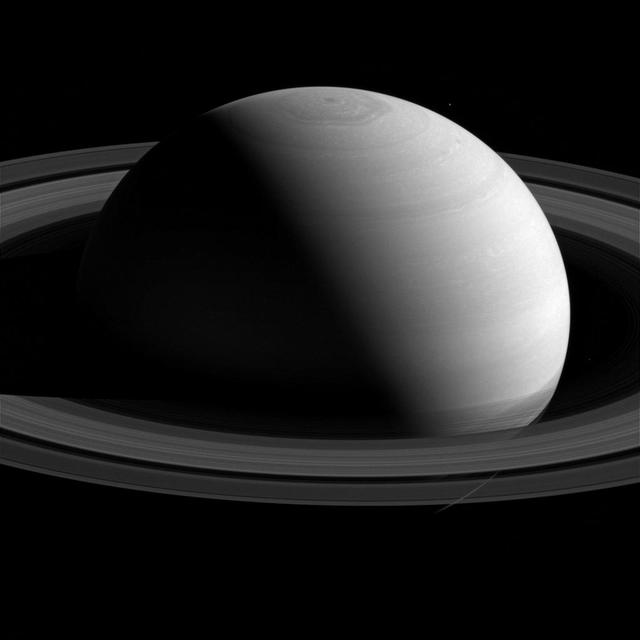
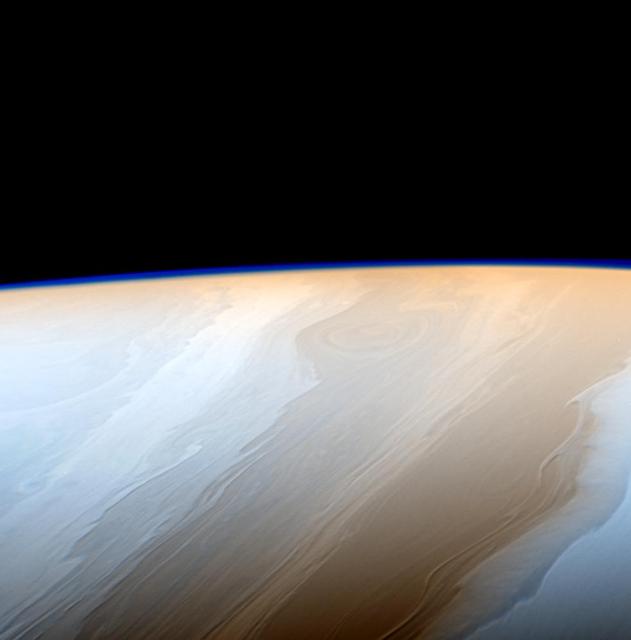
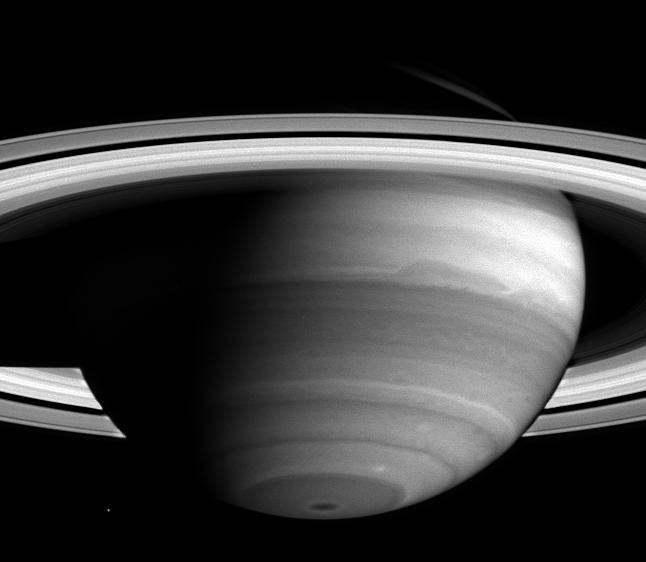
From a distance Saturn seems to exude an aura of serenity and peace. In spite of this appearance, Saturn is an active and dynamic world. Its atmosphere is a fast-moving and turbulent place with wind speeds in excess of 1,100 miles per hour (1,800 km per hour) in places. The lack of a solid surface to create drag means that there are fewer features to slow down the wind than on a planet like Earth. Mimas, to the upper-right of Saturn, has been brightened by a factor of 2 for visibility. In this view, Cassini was at a subspacecraft latitude of 19 degrees North. The image was taken with the Cassini spacecraft wide-angle camera on Feb. 4, 2015 using a spectral filter centered at 752 nanometers, in the near-infrared portion of the spectrum. The view was obtained at a distance of approximately 1.6 million miles (2.5 million kilometers) from Saturn. Image scale is 96 miles (150 kilometers) per pixel. http://photojournal.jpl.nasa.gov/catalog/pia18314

NASA's Juno spacecraft was a little more than one Earth diameter from Jupiter when it captured this mind-bending, color-enhanced view of the planet's tumultuous atmosphere. Jupiter completely fills the image, with only a hint of the terminator (where daylight fades to night) in the upper right corner, and no visible limb (the curved edge of the planet). Juno took this image of colorful, turbulent clouds in Jupiter's northern hemisphere on Dec. 16, 2017 at 9:43 a.m. PST (12:43 p.m. EST) from 8,292 miles (13,345 kilometers) above the tops of Jupiter's clouds, at a latitude of 48.9 degrees. The spatial scale in this image is 5.8 miles/pixel (9.3 kilometers/pixel).. Citizen scientists Gerald Eichstädt and Seán Doran processed this image using data from the JunoCam imager. https://photojournal.jpl.nasa.gov/catalog/PIA21973
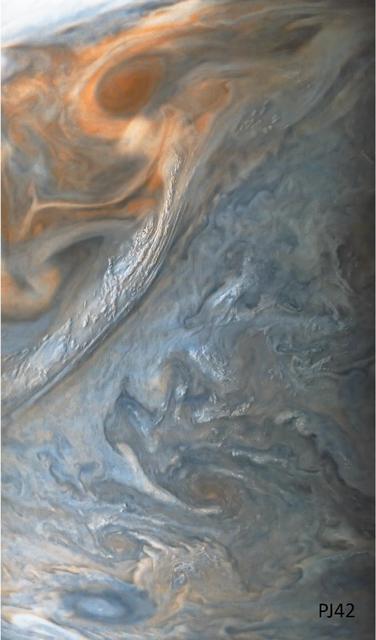
This image of a "jet" in Jupiter's atmosphere was taken by the JunoCam public engagement camera aboard NASA's Juno spacecraft on May 23, 2022. Jupiter's atmosphere is organized into belts and zones, separated by jets, which are associated with turbulence along belt-zone boundaries, leading to chaotic regions of multicolored clouds. In this image, the color in these two regions has been enhanced to bring out detail and show the different layers of cloud decks. Juno's orbit around Jupiter changes every time the spacecraft passes the giant planet, with the point of closest approach – the perijove, or "PJ" – moving steadily northward. As the perijove changes, the resolution of images taken in the northern hemisphere steadily increases. This image of Jet N3 was acquired on PJ42, Juno's 42nd pass by Jupiter, at 41.6 degrees north from an altitude of 2,361 miles (3,800 kilometers). It shows features as small as 1.6 miles (2.6 kilometers) across. Citizen scientist Sergio Díaz processed the image to enhance the color and contrast. https://photojournal.jpl.nasa.gov/catalog/PIA25693
Clouds on Saturn take on the appearance of strokes from a cosmic brush thanks to the wavy way that fluids interact in Saturn's atmosphere. Neighboring bands of clouds move at different speeds and directions depending on their latitudes. This generates turbulence where bands meet and leads to the wavy structure along the interfaces. Saturn's upper atmosphere generates the faint haze seen along the limb of the planet in this image. This false color view is centered on 46 degrees north latitude on Saturn. The images were taken with the Cassini spacecraft narrow-angle camera on May 18, 2017 using a combination of spectral filters which preferentially admit wavelengths of near-infrared light. The image filter centered at 727 nanometers was used for red in this image; the filter centered at 750 nanometers was used for blue. (The green color channel was simulated using an average of the two filters.) The view was obtained at a distance of approximately 750,000 miles (1.2 million kilometers) from Saturn. Image scale is about 4 miles (7 kilometers) per pixel. https://photojournal.jpl.nasa.gov/catalog/PIA21341
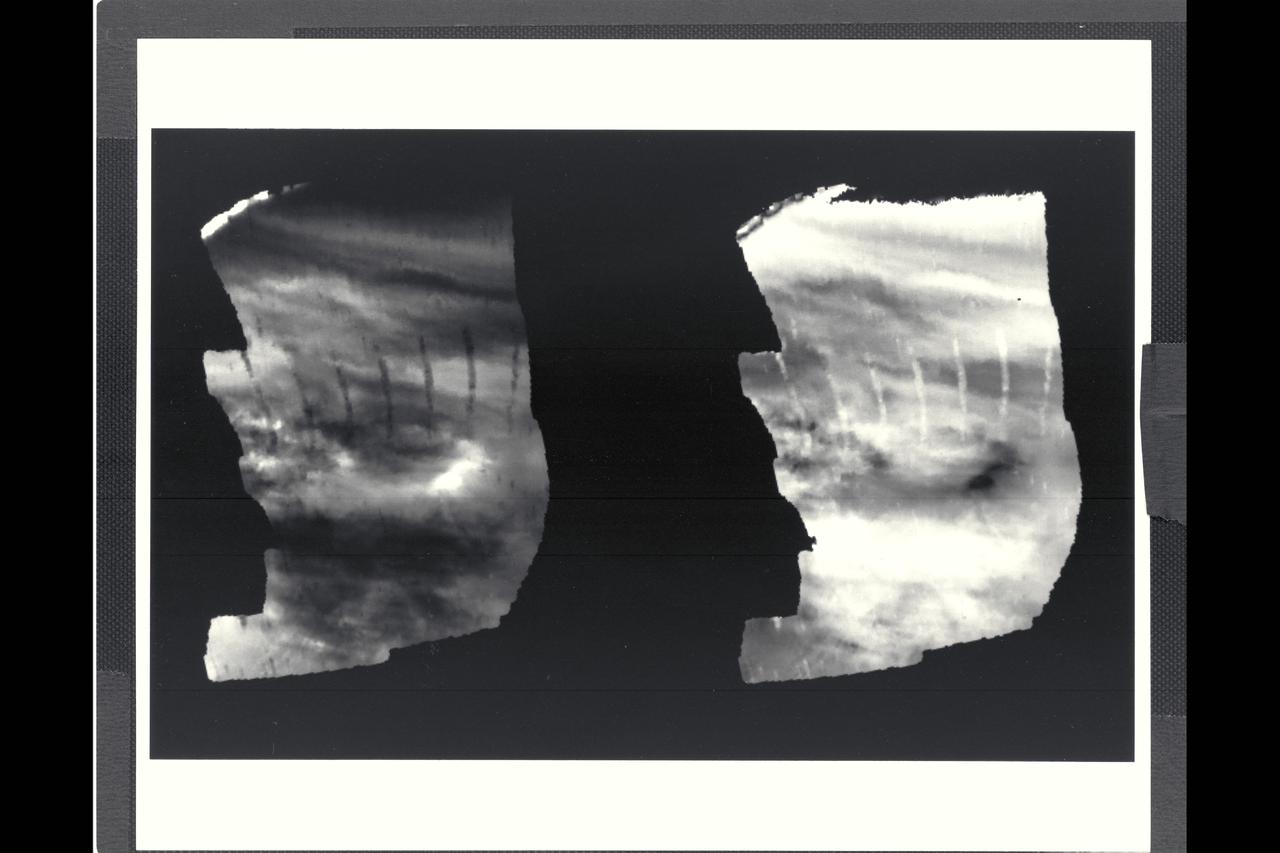
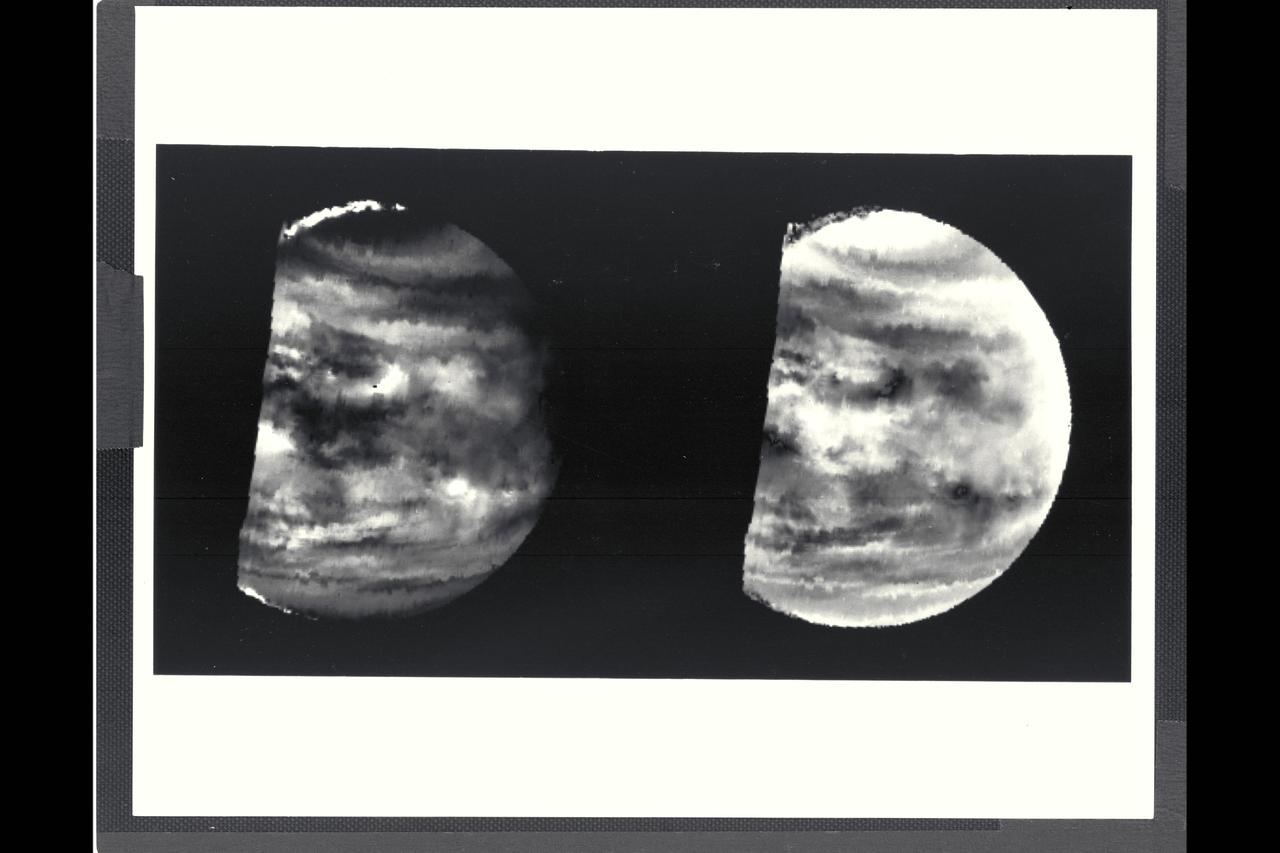
Range : 60,000 miles These images are two versions of a near-infrafed map of lower-level clouds on the night side of Venus, obtained by the Near Infrared Mapping Spectrometer aboard the Galileo spacecraft.The map shows the turbulent, cloudy middle atmosphere some 30-33 miles above the surface, 6-10 miles below the visible cloudtops. The image to the left shows the radiant heat from the lower atmosphere (about 400 degrees F) ahining through the sulfuric acid clouds, which appear as much as 10 times darker than the bright gaps between clouds. This cloud layer is at about 170 degrees F, at a pressure about 1/2 Earth's atmospheric pressure. About 2/3 of the dark hemisphere is visible, centered on longitude 350 West, with bright slsivers of daylit high clouds visible at top and bottom left. The right image, a modified negative, represents what scientists believe would be the visual appearance of this mid-level cloud deck in daylight, with the clouds reflecting sunlight instead of clocking out infrared from the hot planet and lower atmosphere. Near the equator, the clouds appear fluffy and clocky; farther north, they are stretched out into East-West filaments by winds estimated at more than 150 mph, while the poles are capped by thick clouds at this altitude. The Near Infrared Mapping Spectrometer (NIMS) on the Galileo is a combined mapping (imaging) and spectral instrument. It can sense 408 contiguous wavelengths from 0.7 microns (deep red) to 5.2 microns, and can construct a map or image by mechanical scanning. It can spectroscopic-ally analyze atmospheres and surfaces and construct thermal and chemical maps.
Range : 60,000 miles These images are two versions of a near-infrafed map of lower-level clouds on the night side of Venus, obtained by the Near Infrared Mapping Spectrometer aboard the Galileo spacecraft.The map shows the turbulent, cloudy middle atmosphere some 30-33 miles above the surface, 6-10 miles below the visible cloudtops. The image to the left shows the radiant heat from the lower atmosphere (about 400 degrees F) ahining through the sulfuric acid clouds, which appear as much as 10 times darker than the bright gaps between clouds. This cloud layer is at about 170 degrees F, at a pressure about 1/2 Earth's atmospheric pressure. About 2/3 of the dark hemisphere is visible, centered on longitude 350 West, with bright slsivers of daylit high clouds visible at top and bottom left. The right image, a modified negative, represents what scientists believe would be the visual appearance of this mid-level cloud deck in daylight, with the clouds reflecting sunlight instead of clocking out infrared from the hot planet and lower atmosphere. Near the equator, the clouds appear fluffy and clocky; farther north, they are stretched out into East-West filaments by winds estimated at more than 150 mph, while the poles are capped by thick clouds at this altitude. The Near Infrared Mapping Spectrometer (NIMS) on the Galileo is a combined mapping (imaging) and spectral instrument. It can sense 408 contiguous wavelengths from 0.7 microns (deep red) to 5.2 microns, and can construct a map or image by mechanical scanning. It can spectroscopic-ally analyze atmospheres and surfaces and construct thermal and chemical maps.
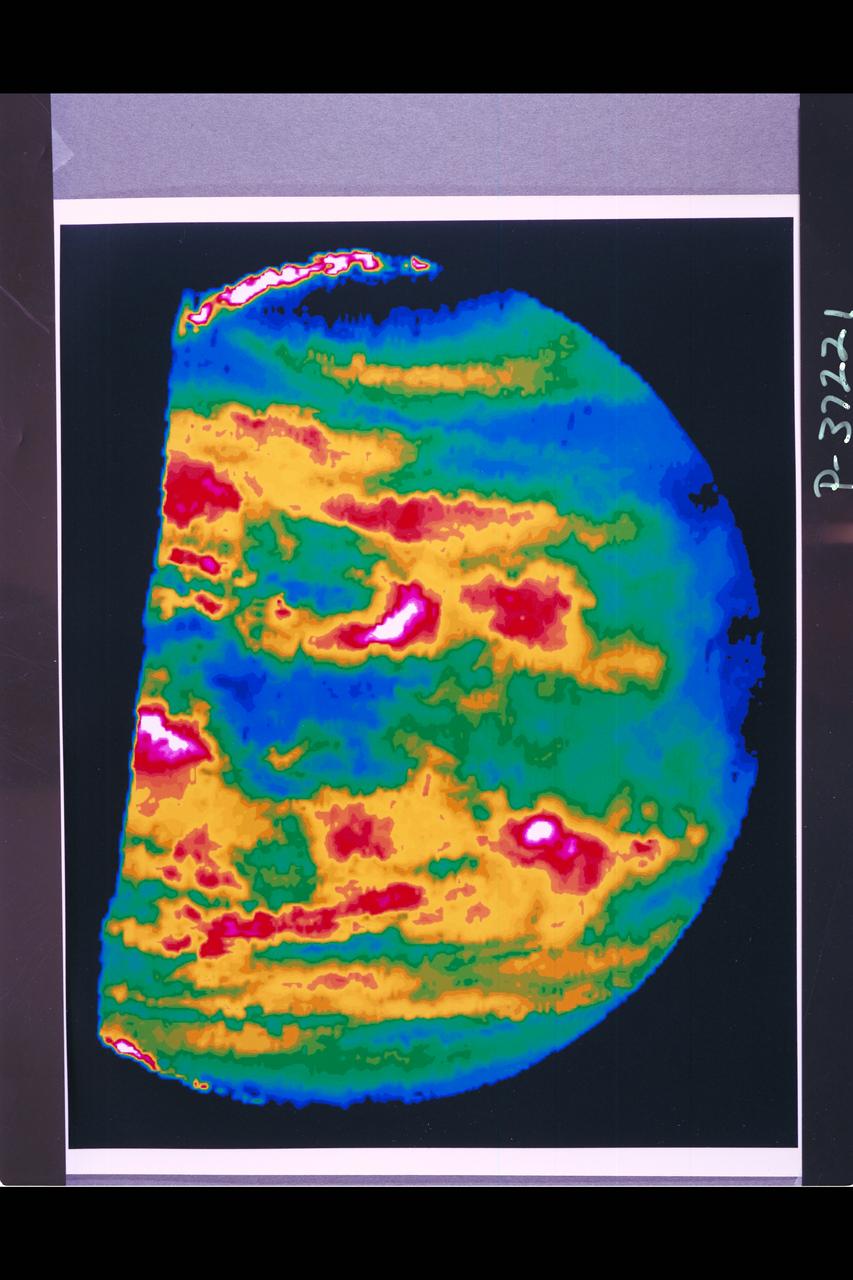
Range : 60,000 miles This image is a false-color version of a near- infrared map of lower-level clouds on the night side of Venus, obtained by the Near Infrared Mapping Spectrometer aboard Galileo. Taken at an infrared wavelength of 2.3 microns (about three times the longest wavelength visible to the human eye) the map shows the turbulent, cloudy middle atmosphere some 30-33 miles above the surface, 6-10 miles below the visible cloudtops. The image shows the radiant heat from the lower atmosphere (about 400 degrees F) shining through the sulfuric acid clouds, which appear as much as 10 times darker than the bright gaps between clouds. The colors indicate relative cloud transparency; white and red show thin cloud regions, while black and blue represent relatively this clouds. This cloud layer is at about 170 degrees F., at a pressure about 1/2 Earth's atmospheric pressure. About 2/3 of the dark hemisphere is visible, centered on longitude 350 West, with bright slivers of daylit high clouds visible at top and bottom left. Near the equator, the clouds appear fluffy and blocky; farther north, they are stretched out into East-West filaments by winds estimated at more than 150 mph, while the poles are capped by thick clouds at this altitude. The Near Infrared Mapping Spectrometer (NIMS) on the Galileo is a combined mapping (imaging) and spectral instrument. It can sense 408 contiguous wavelengths from 0.7 microns (deep red) to 5.2 microns, and can construct a map or image by mechanical scanning. It can spectroscopic-ally analyze atmospheres and surfaces and construct thermal and chemical maps. Designed and operated by scientists and engineers at the JPL, NIMS involves 15 scientists in the US, England and France.
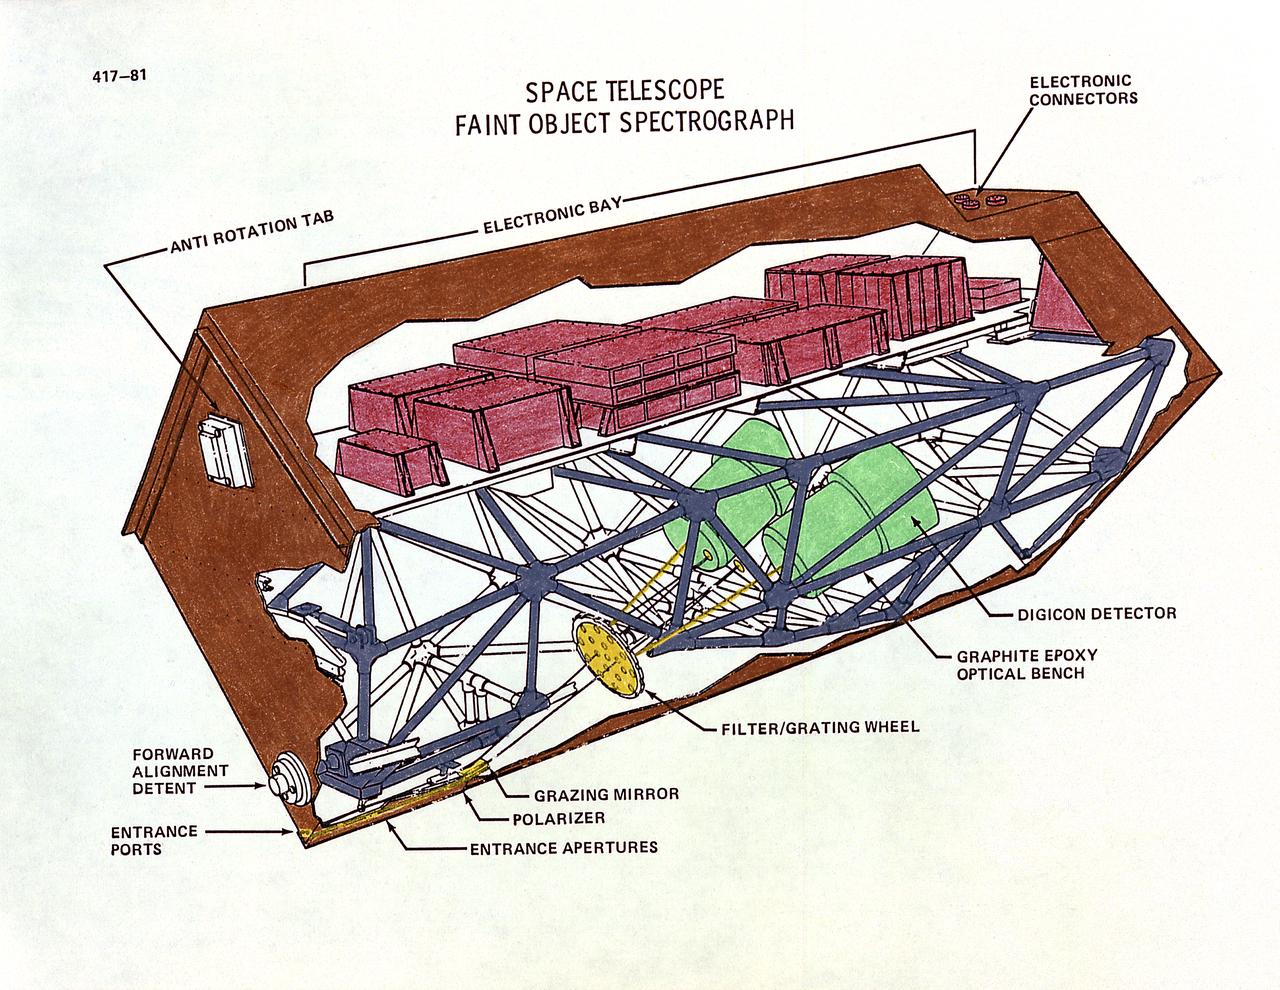
This drawing illustrates the Hubble Space Telescope's (HST's), Faint Object Spectrograph (FOS). The HST's two spectrographs, the Goddard High-Resolution Spectrograph and the FOS, can detect a broader range of wavelengths than is possible from the Earth because there is no atmosphere to absorb certain wavelengths. Scientists can determine the chemical composition, temperature, pressure, and turbulence of the stellar atmosphere producing the light, all from spectral data. The FOC can detect detail in very faint objects, such as those at great distances, and light ranging from ultraviolet to red spectral bands. Both spectrographs operate in essentially the same way. The incoming light passes through a small entrance aperture, then passes through filters and diffraction gratings, that work like prisms. The filter or grating used determines what range of wavelength will be examined and in what detail. Then the spectrograph detectors record the strength of each wavelength band and sends it back to Earth. The purpose of the HST, the most complex and sensitive optical telescope ever made, is to study the cosmos from a low-Earth orbit. By placing the telescope in space, astronomers are able to collect data that is free of the Earth's atmosphere. The HST views galaxies, stars, planets, comets, possibly other solar systems, and even unusual phenomena such as quasars, with 10 times the clarity of ground-based telescopes. The HST was deployed from the Space Shuttle Discovery (STS-31 mission) into Earth orbit in April 1990. The Marshall Space Flight Center had responsibility for design, development, and construction of the HST. The Perkin-Elmer Corporation, in Danbury, Cornecticut, developed the optical system and guidance sensors.
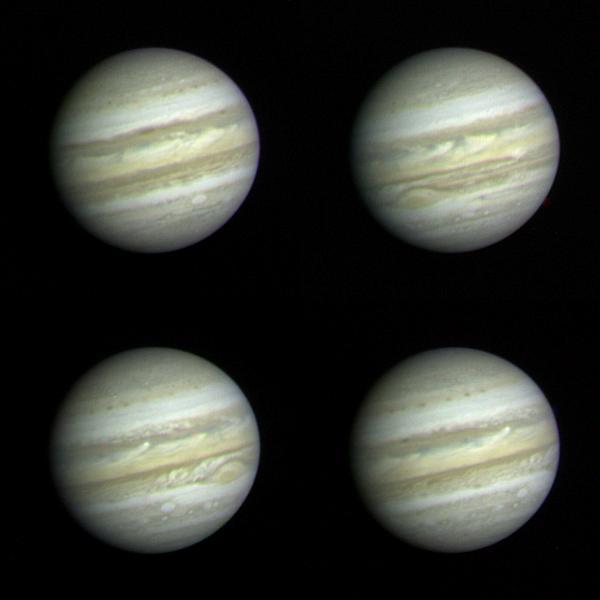
These Jupiter photographs are part of a set taken by NASA Voyager 1 on December 10 and 11, 1978 from a distance of 83 million km 52 million miles or more than half the distance from the Earth to the sun. At this range, Voyager 1 is able to record more detail on the giant planet than the very best ground-based telescopes. The highest resolution ever obtained on the Jovian disk was recorded by Pioneer 11 four years ago. Voyager, however, has longer focal-length optics than Pioneer, and while nearly three months from encounter (~ March 1979) was able to achieve higher resolution than that obtained by Pioneer only 24 hours from its encounter on 3 December 1974. Jupiter's colorful and turbulent atmosphere is evident in these photographs. The entire visible surface of the planet is made up of multiple layers of clouds, composed primarily of ammonia ice crystals colored by small amounts of materials of unknown composition. The Great Red Spot, seen to the lower left of 2 and lower right of 3, is now recovering from a period of relative inconspicuousness. An atmospheric system larger than the Earth and more than 100 years old, the Great Red Spot remains a mystery and a challenge to Voyager instruments. A bright convective cloud (center of and right of center in 4) displays a plume which has been swept westward (to the left) by local currents in the planet's equatorial wind system. Below and to the left and right of the Great Red Spot are a pair of white oval clouds; a third can be seen in 1. All three were formed almost 40 years ago and are the second oldest class of discrete features identified in the Jovian atmosphere. Each of the pictures was produced from blue, green, and orange originals in JPL's Image Processing Laboratory. http://photojournal.jpl.nasa.gov/catalog/PIA00454
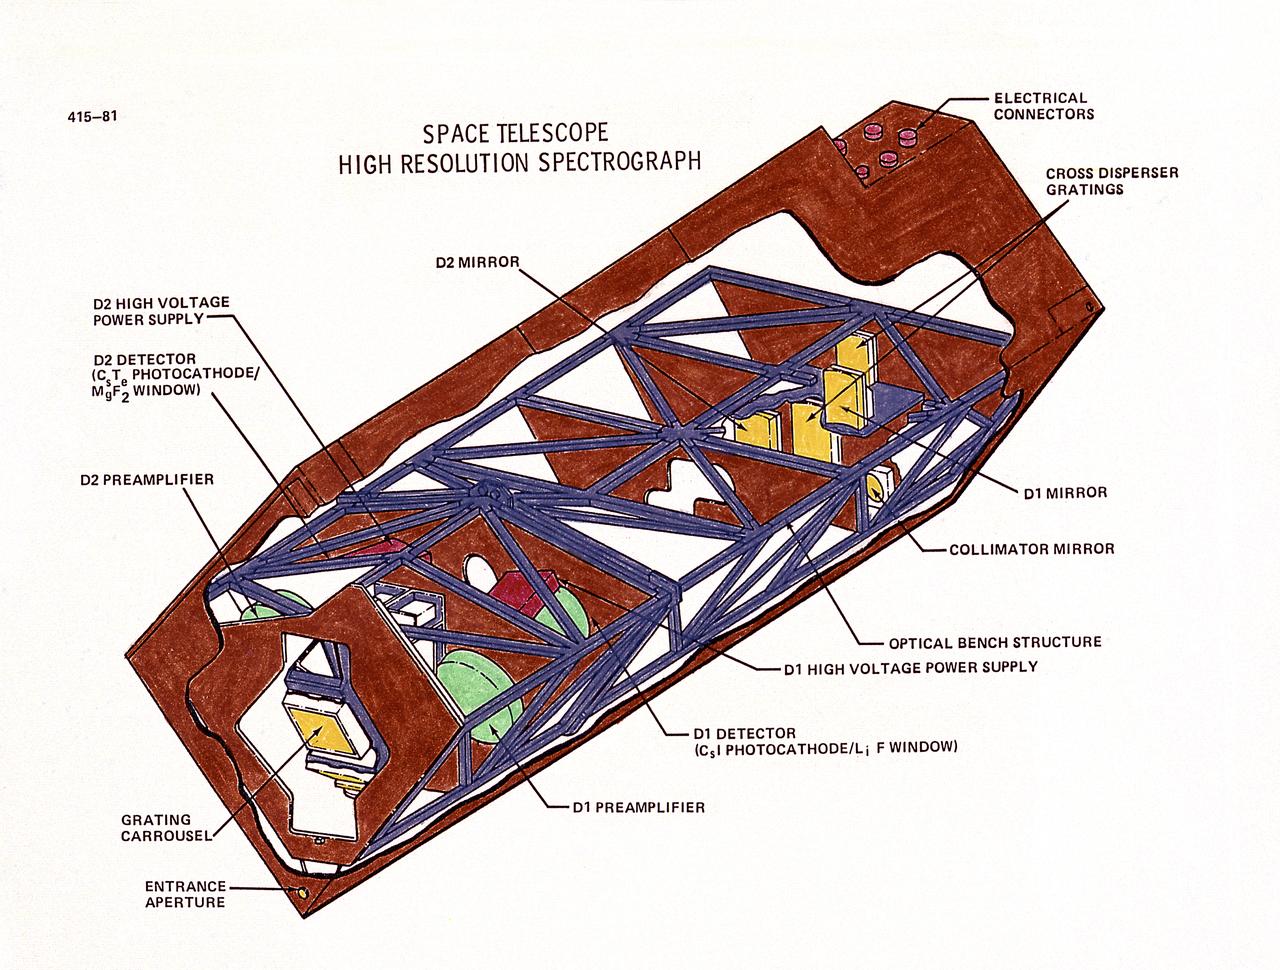
This drawing illustrates the Hubble Space Telescope's (HST's), Goddard High-Resolution Spectrograph (GHRS). The HST's two spectrographs, the GHRS and the Faint Object Spectrograph (FOS), can detect a broader range of wavelengths than is possible from Earth because there is no atmosphere to absorb certain wavelengths. Scientists can determine the chemical composition, temperature, pressure, and turbulence of the stellar atmosphere producing the light, all from spectral data. The GHRS can detect fine details in the light from somewhat brighter objects but only ultraviolet light. Both spectrographs operate in essentially the same way. The incoming light passes through a small entrance aperture, then passes through filters and diffraction gratings, that work like prisms. The filter or grating used determines what range of wavelength will be examined and in what detail. Then the spectrograph detectors record the strength of each wavelength band and sends it back to Earth. The purpose of the HST, the most complex and sensitive optical telescope ever made, is to study the cosmos from a low-Earth orbit. By placing the telescope in space, astronomers are able to collect data that is free of the Earth's atmosphere. The HST views galaxies, stars, planets, comets, possibly other solar systems, and even unusual phenomena such as quasars, with 10 times the clarity of ground-based telescopes. The HST was deployed from the Space Shuttle Discovery (STS-31 mission) into Earth orbit in April 1990. The Marshall Space Flight Center had responsibility for design, development, and construction of the HST. The Perkin-Elmer Corporation, in Danbury, Cornecticut, developed the optical system and guidance sensors.

This false-color image of Jupiter was taken on May 18, 2017, with a mid-infrared filter centered at a wavelength of 8.8 microns, at the Subaru Telescope in Hawaii, in collaboration with observations of Jupiter by NASA's Juno mission. The selected wavelength is sensitive to Jupiter's tropospheric temperatures and the thickness of a cloud near the condensation level of ammonia gas. The Great Red Spot appears distinctively at the lower center of the planet as a cold region with a thick cloud layer. It is surrounded by a warm and relatively clear periphery. To its northwest is a turbulent and chaotic region where bands of gas that is warm and dry alternate with bands of gas that is cold and moist. This image, taken a few hours before Juno's sixth close approach to Jupiter, shows the detailed atmospheric structure of the Great Red Spot and its surroundings that the Juno mission will encounter on its seventh closest approach to Jupiter on July 10, 2017, Pacific Time (July 11, Universal Time). The instrument used to take this image is Cooled Mid-Infrared Camera and Spectrometer (COMICS) of the National Astronomical Observatory of Japan's Subaru Telescope on Hawaii's Maunakea peak. https://photojournal.jpl.nasa.gov/catalog/PIA21714
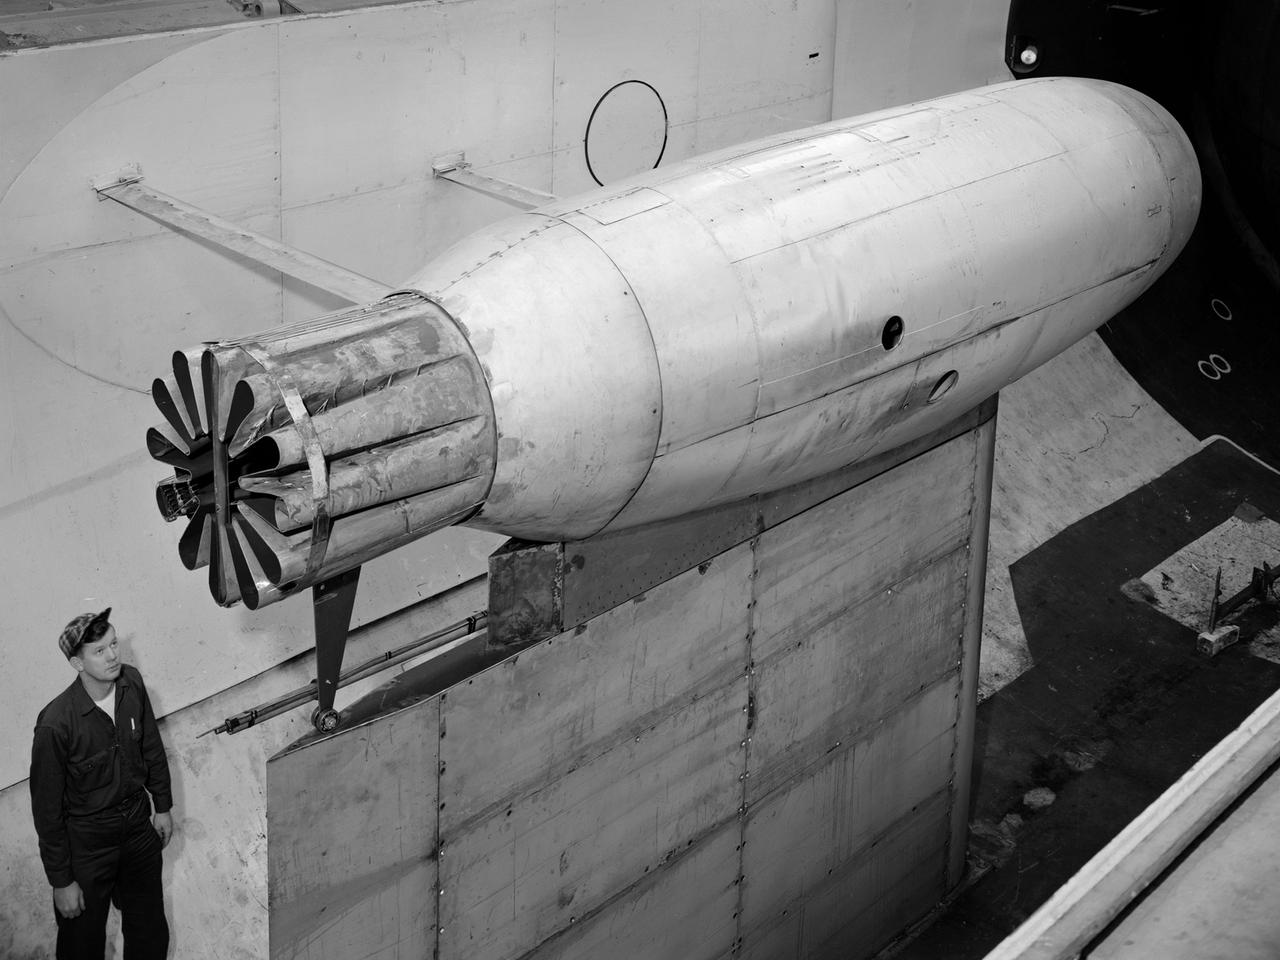
A Pratt and Whitney J57 engine is tested with a Greatex No.1 nozzle in the Altitude Wind Tunnel at the National Advisory Committee for Aeronautics (NACA) Lewis Flight Propulsion Laboratory. At the time the aircraft industry was preparing to introduce jet airliners to the nation’s airways. The noise produced by the large jet engines, however, posed a considerable problem for communities near airports. The NACA had formed a Special Subcommittee on Aircraft Noise to coordinate research on the issue. Preliminary tests showed that the source of the loudest noise was not the engine itself, but the mixing of the engine’s exhaust with the surrounding air in the atmosphere. The pressures resulting from this turbulence produced sound waves. Lewis researchers undertook a variety of noise-reduction studies involving engine design, throttling procedures, and noise suppressors. One of their first efforts focused on new types of nozzles to mix the exhaust with the surrounding air. The nozzles had a variety of shapes designed to slow down exhaust velocity before it combined with the air and thus decrease the noise. From January to May 1957 a Pratt and Whitney J57 engine was equipped with various shaped nozzles, as seen in this photograph, and run in simulated flight conditions in the Altitude Wind Tunnel. A number of nozzle configurations, including several multi-exit “organ pipe” designs, were created. It was found that the various nozzle types did reduce the noise levels, but they also reduced the aircraft’s thrust.
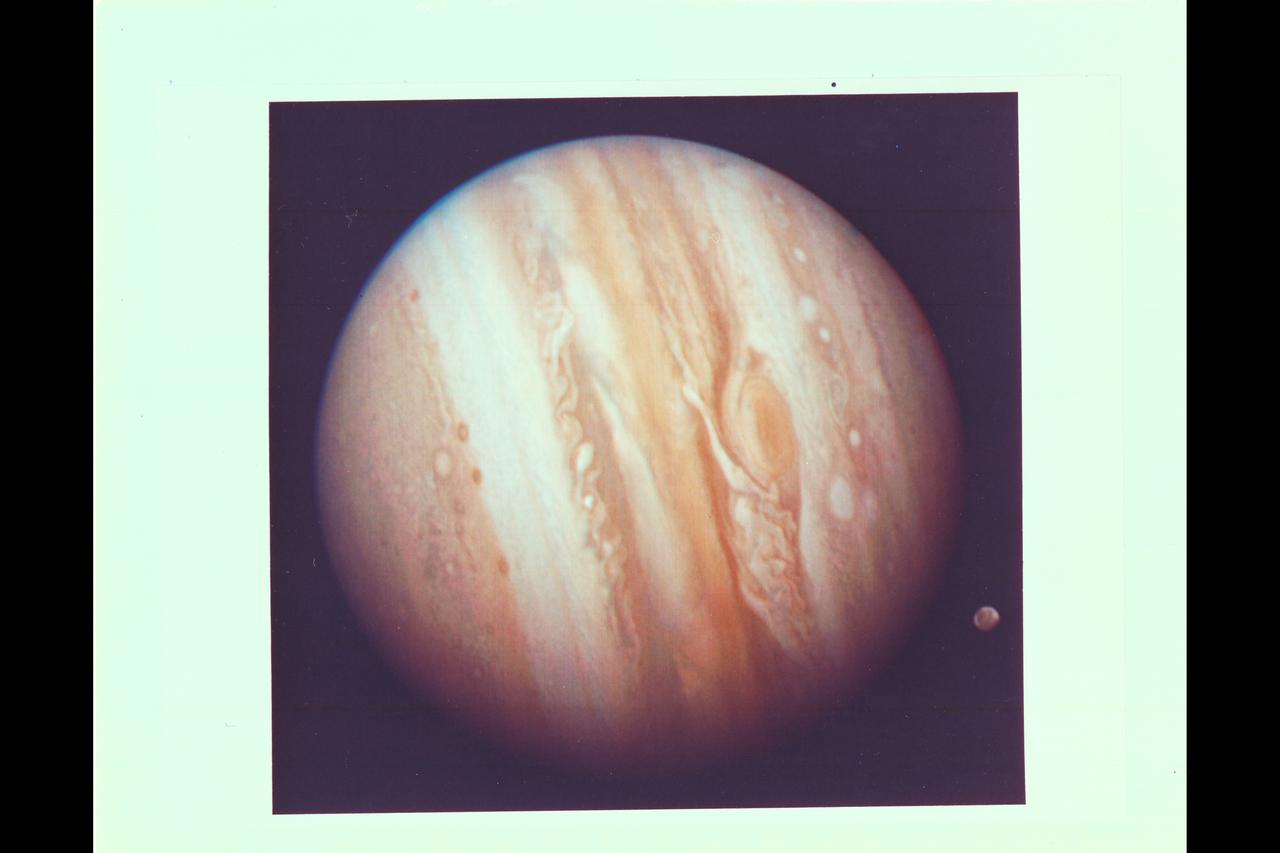
Photo by Voyager 1 (JPL) The spacecraft took this photo of the planet Jupiter on Jan 24, while still more than 25 million miles (40 million kilometers) away. As the spacecraft draws closer to the planet (about 1 million kilometers a day) more details are emergng in the turbulent clouds. The Great Red Spot shows prominently below center, surrounded by what scientists call a remarkably complex region of the giant planet's atmosphere. An elongated yellow cloud within the Great Red Spot is swirling around the spot's interior boundary in a counterclockwise direction with a period of a little less than six days, confirming the whirlpool-like circulation that astronomers have suspected from ground-based photographs. Ganymede, Jupiter's largest satellite, can be seen to the lower left of the planet. Ganymede is a planet-sized body larger than Mercury. This color photo was assembled at Jet Propulsion Laboratory's Image Processing Lab from there black and white images taken through filters. The Voyagers are managed for NASA's Office of Space Science by Jet Propulsion Laboratory. (ref: P-20945C Mission Image 1-9)
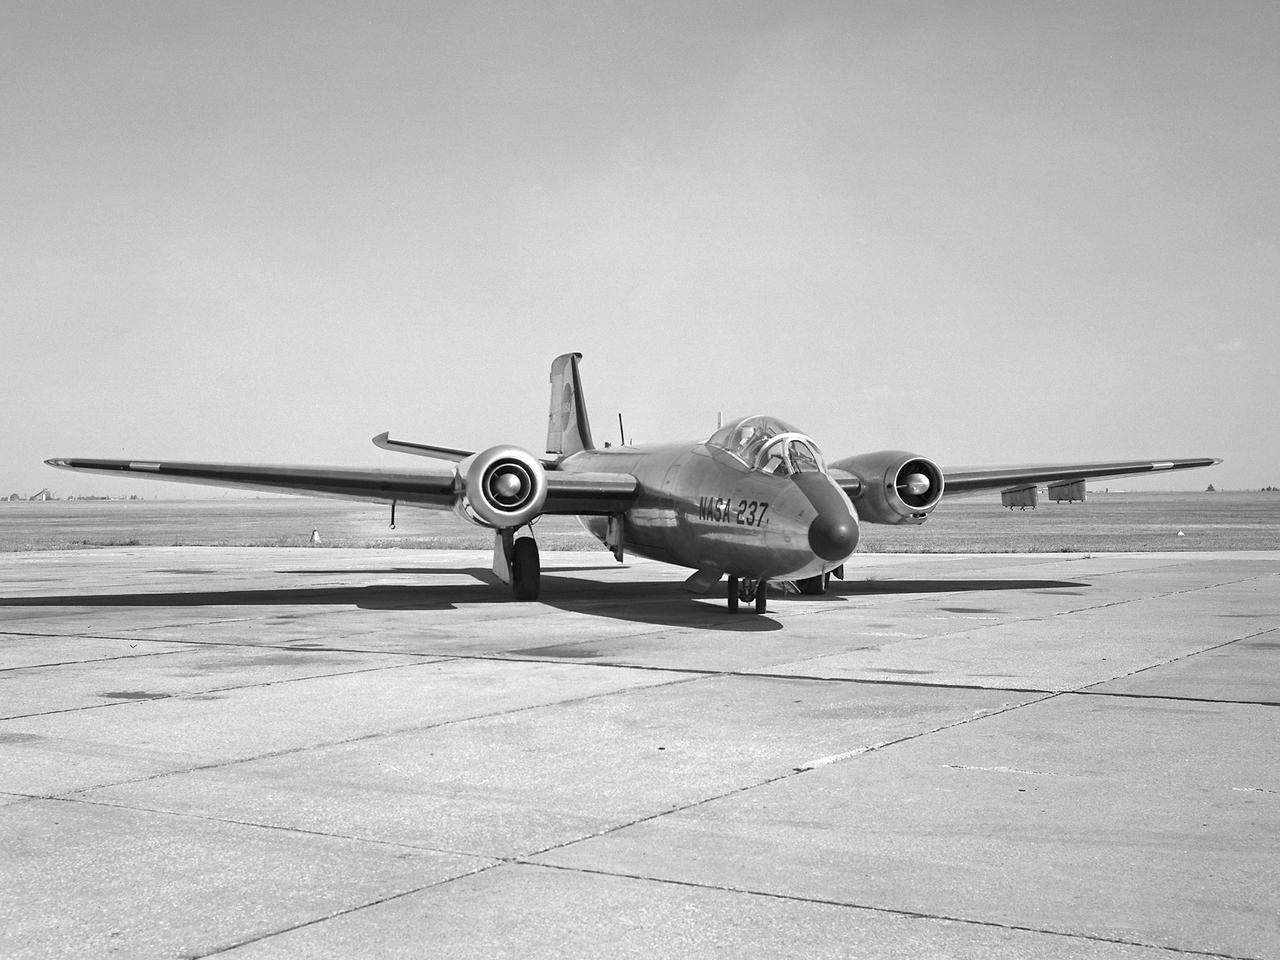
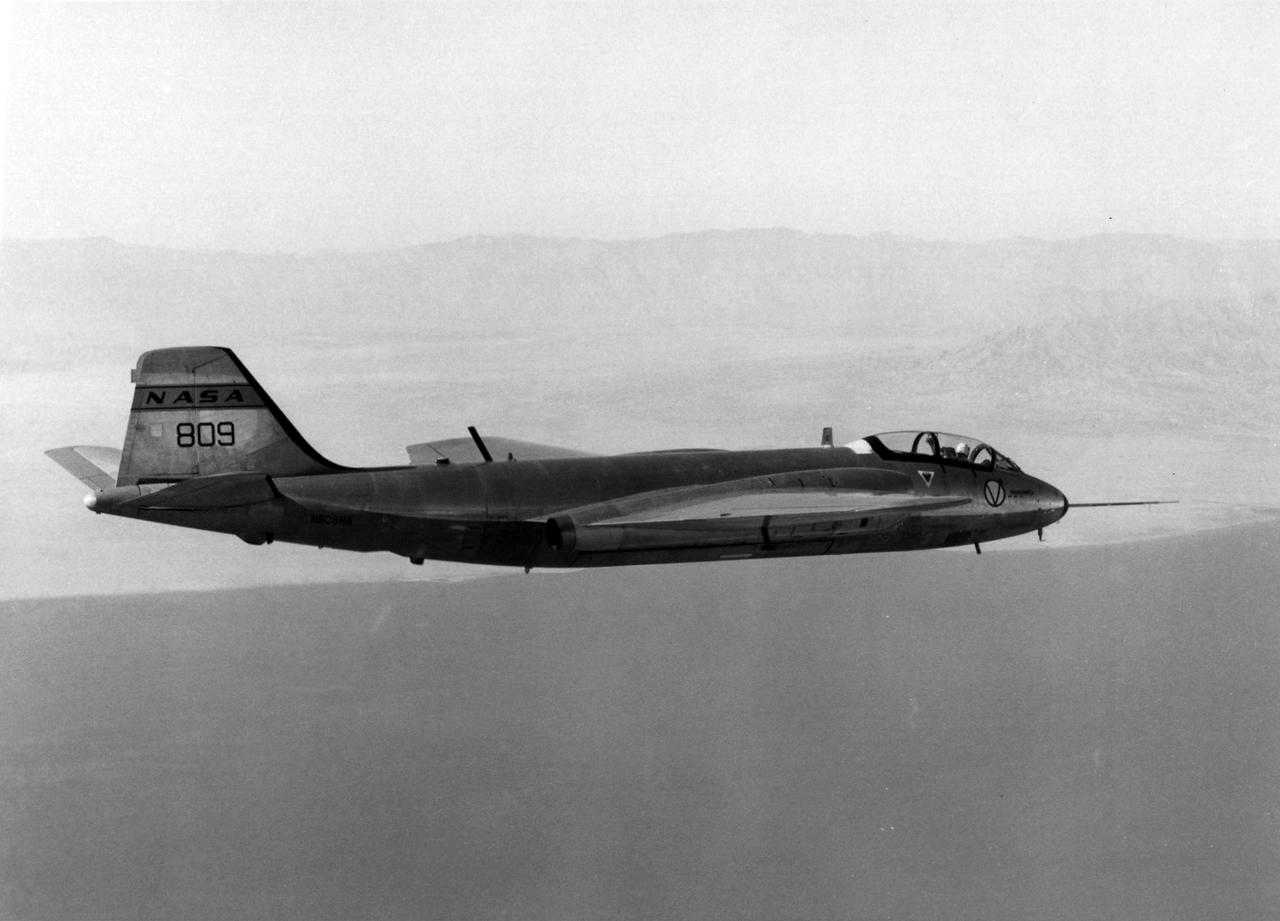
A Martin B-57B Canberra outfitted with a noise suppressor on its right engine at the National Aeronautics and Space Administration (NASA) Lewis Research Center. The aircraft was being prepared for the October 1966 Inspection of the center. The Inspection also marked Lewis’ twentieth anniversary. Lewis researchers had been studying engine noise for almost a decade, but the problem seemed to be increasing in the mid-1960s with heavier airline traffic and larger engines. Researchers discovered early on that the majority of the noise did not emanate from the engine itself, but from the mixing of the hot exhaust gasses with the atmosphere. Attempts to reduce the turbulence using new exhaust nozzles were successful but often resulted in decreased engine performance. The researchers decided to try to lower the jet nozzle exit velocity without decreasing its thrust. The inlet mass air flow had to be increased to accomplish this. The Lewis B-57B was powered by two Wright Aeronautical J65 turbojets. Lewis engineers modified the stators on the two engines to simulate the noise levels from more-modern turbofan engines. A noise suppressor was added to only one of the two engines, seen here on the left. The engines were run one at a time at power levels similar to landing while the aircraft sat on the Lewis hangar apron. A microphone and recording equipment was setup to capture the noise levels. The engine with the suppressor produced 13 fewer decibels than the standard engine.
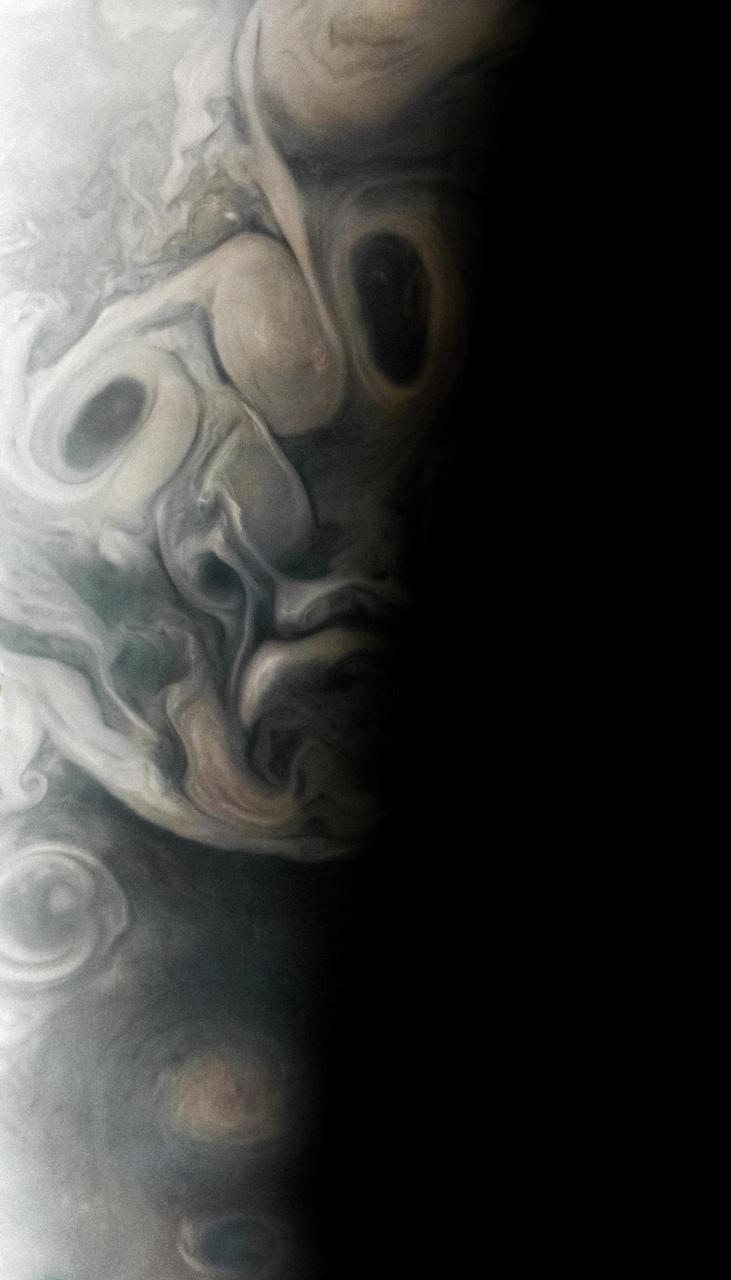
On Sept. 7, 2023, during its 54th close flyby of Jupiter, NASA's Juno mission captured this view of an area in the giant planet's far northern regions called Jet N7. The image shows turbulent clouds and storms along Jupiter's terminator, the dividing line between the day and night sides of the planet. The low angle of sunlight highlights the complex topography of features in this region, which scientists have studied to better understand the processes playing out in Jupiter's atmosphere. As often occurs in views from Juno, Jupiter's clouds in this picture lend themselves to pareidolia, the effect that causes observers to perceive faces or other patterns in largely random patterns. Citizen scientist Vladimir Tarasov made this image using raw data from the JunoCam instrument. At the time the raw image was taken, the Juno spacecraft was about 4,800 miles (about 7,700 kilometers) above Jupiter's cloud tops, at a latitude of about 69 degrees north. https://photojournal.jpl.nasa.gov/catalog/PIA25727
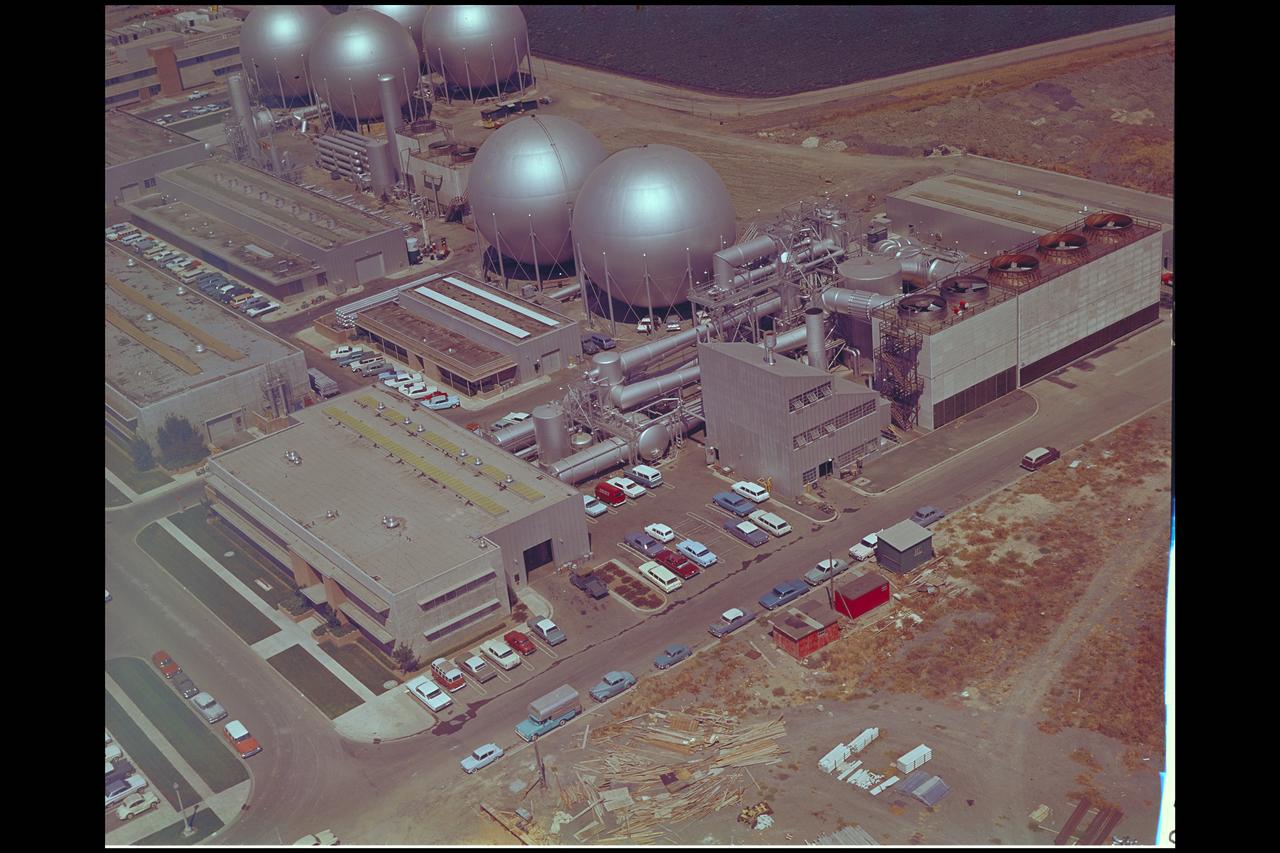
Aerial view of Gasdynamics facility in 1964 and the 20 inch helium tunnel Part of the Thermal Protection Laboratory used to research materials for heat shield applications and for aerodynamic heating and materials studies of vehicles in planetary atmospheres. This laboratory is comprised of five separate facilities: an Aerodynamic Heating Tunnel, a Heat Transfer Tunnel, two Supersonic Turbulent Ducts, and a High-Power CO2 Gasdynamic Laser. All these facilities are driven by arc-heaters, with the exception of the large, combustion-type laser. The arc-heated facilities are powered by a 20 Megawatt DC power supply. Their effluent gas stream (test gases; Air, N2, He, CO2 and mixtures; flow rates from 0.05 to 5.0 lbs/sec) discharges into a five-stage stream-ejector-driven vacuum system. The vacuum system and power supply are common to the test faciities in building N-238. All of the facilities have high pressure water available at flow rates up to 4, 000 gals/min. The data obtained from these facilities are recorded on magnetic tape or oscillographs. All forms of data can be handled whether from thermo-couples, pressure cells, pyrometers, or radiometers, etc. in addition, closed circuit T. V. monitors and various film cameras are available. (operational since 1962)
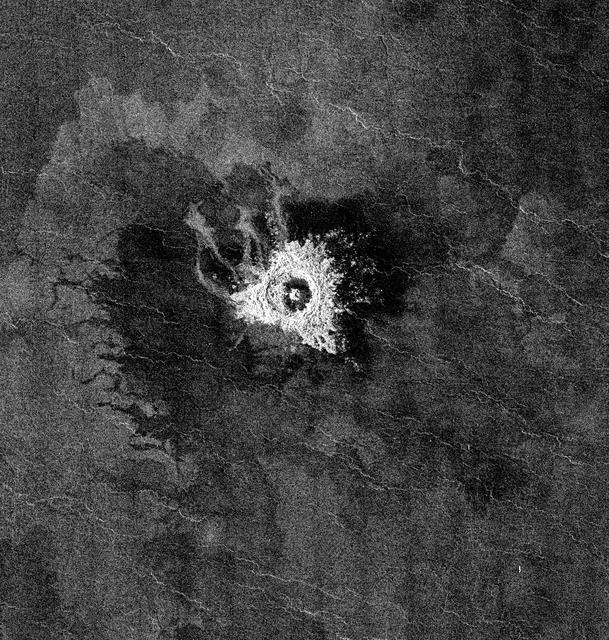
This full-resolution image from NASA Magellan spacecraft shows Jeanne crater, a 19.5 kilometer (12 mile) diameter impact crater. Jeanne crater is located at 40.0 degrees north latitude and 331.4 degrees longitude. The distinctive triangular shape of the ejecta indicates that the impacting body probably hit obliquely, traveling from southwest to northeast. The crater is surrounded by dark material of two types. The dark area on the southwest side of the crater is covered by smooth (radar-dark) lava flows which have a strongly digitate contact with surrounding brighter flows. The very dark area on the northeast side of the crater is probably covered by smooth material such as fine-grained sediment. This dark halo is asymmetric, mimicking the asymmetric shape of the ejecta blanket. The dark halo may have been caused by an atmospheric shock or pressure wave produced by the incoming body. Jeanne crater also displays several outflow lobes on the northwest side. These flow-like features may have formed by fine-grained ejecta transported by a hot, turbulent flow created by the arrival of the impacting object. Alternatively, they may have formed by flow of impact melt. http://photojournal.jpl.nasa.gov/catalog/PIA00472
As Cassini nears its rendezvous with Saturn, new detail in the banded clouds of the planet's atmosphere are becoming visible. Cassini began the journey to the ringed world of Saturn nearly seven years ago and is now less than two months away from orbit insertion on June 30. Cassini’s narrow-angle camera took this image on April 16, 2004, when the spacecraft was 38.5 million kilometers (23.9 million miles) from Saturn. Dark regions are generally areas free of high clouds, and bright areas are places with high, thick clouds which shield the view of the darker areas below. A dark spot is visible at the south pole, which is remarkable to scientists because it is so small and centered. The spot could be affected by Saturn's magnetic field, which is nearly aligned with the planet's rotation axis, unlike the magnetic fields of Jupiter and Earth. From south to north, other notable features are the two white spots just above the dark spot toward the right, and the large dark oblong-shaped feature that extends across the middle. The darker band beneath the oblong-shaped feature has begun to show a lacy pattern of lighter-colored, high altitude clouds, indicative of turbulent atmospheric conditions. The cloud bands move at different speeds, and their irregularities may be due to either the different motions between them or to disturbances below the visible cloud layer. Such disturbances might be powered by the planet's internal heat; Saturn radiates more energy than it receives from the Sun. The moon Mimas (396 kilometers, 245 miles across) is visible to the left of the south pole. Saturn currently has 31 known moons. Since launch, 13 new moons have been discovered by ground-based telescopes. Cassini will get a closer look and may discover new moons, perhaps embedded within the planet’s magnificent rings. This image was taken using a filter sensitive to light near 727 nanometers, one of the near-infrared absorption bands of methane gas, which is one of the ingredients in Saturn's atmosphere. The image scale is approximately 231 kilometers (144 miles) per pixel. Contrast has been enhanced to aid visibility of features in the atmosphere. http://photojournal.jpl.nasa.gov/catalog/PIA05391
B-57B in flight

B-57B on ramp
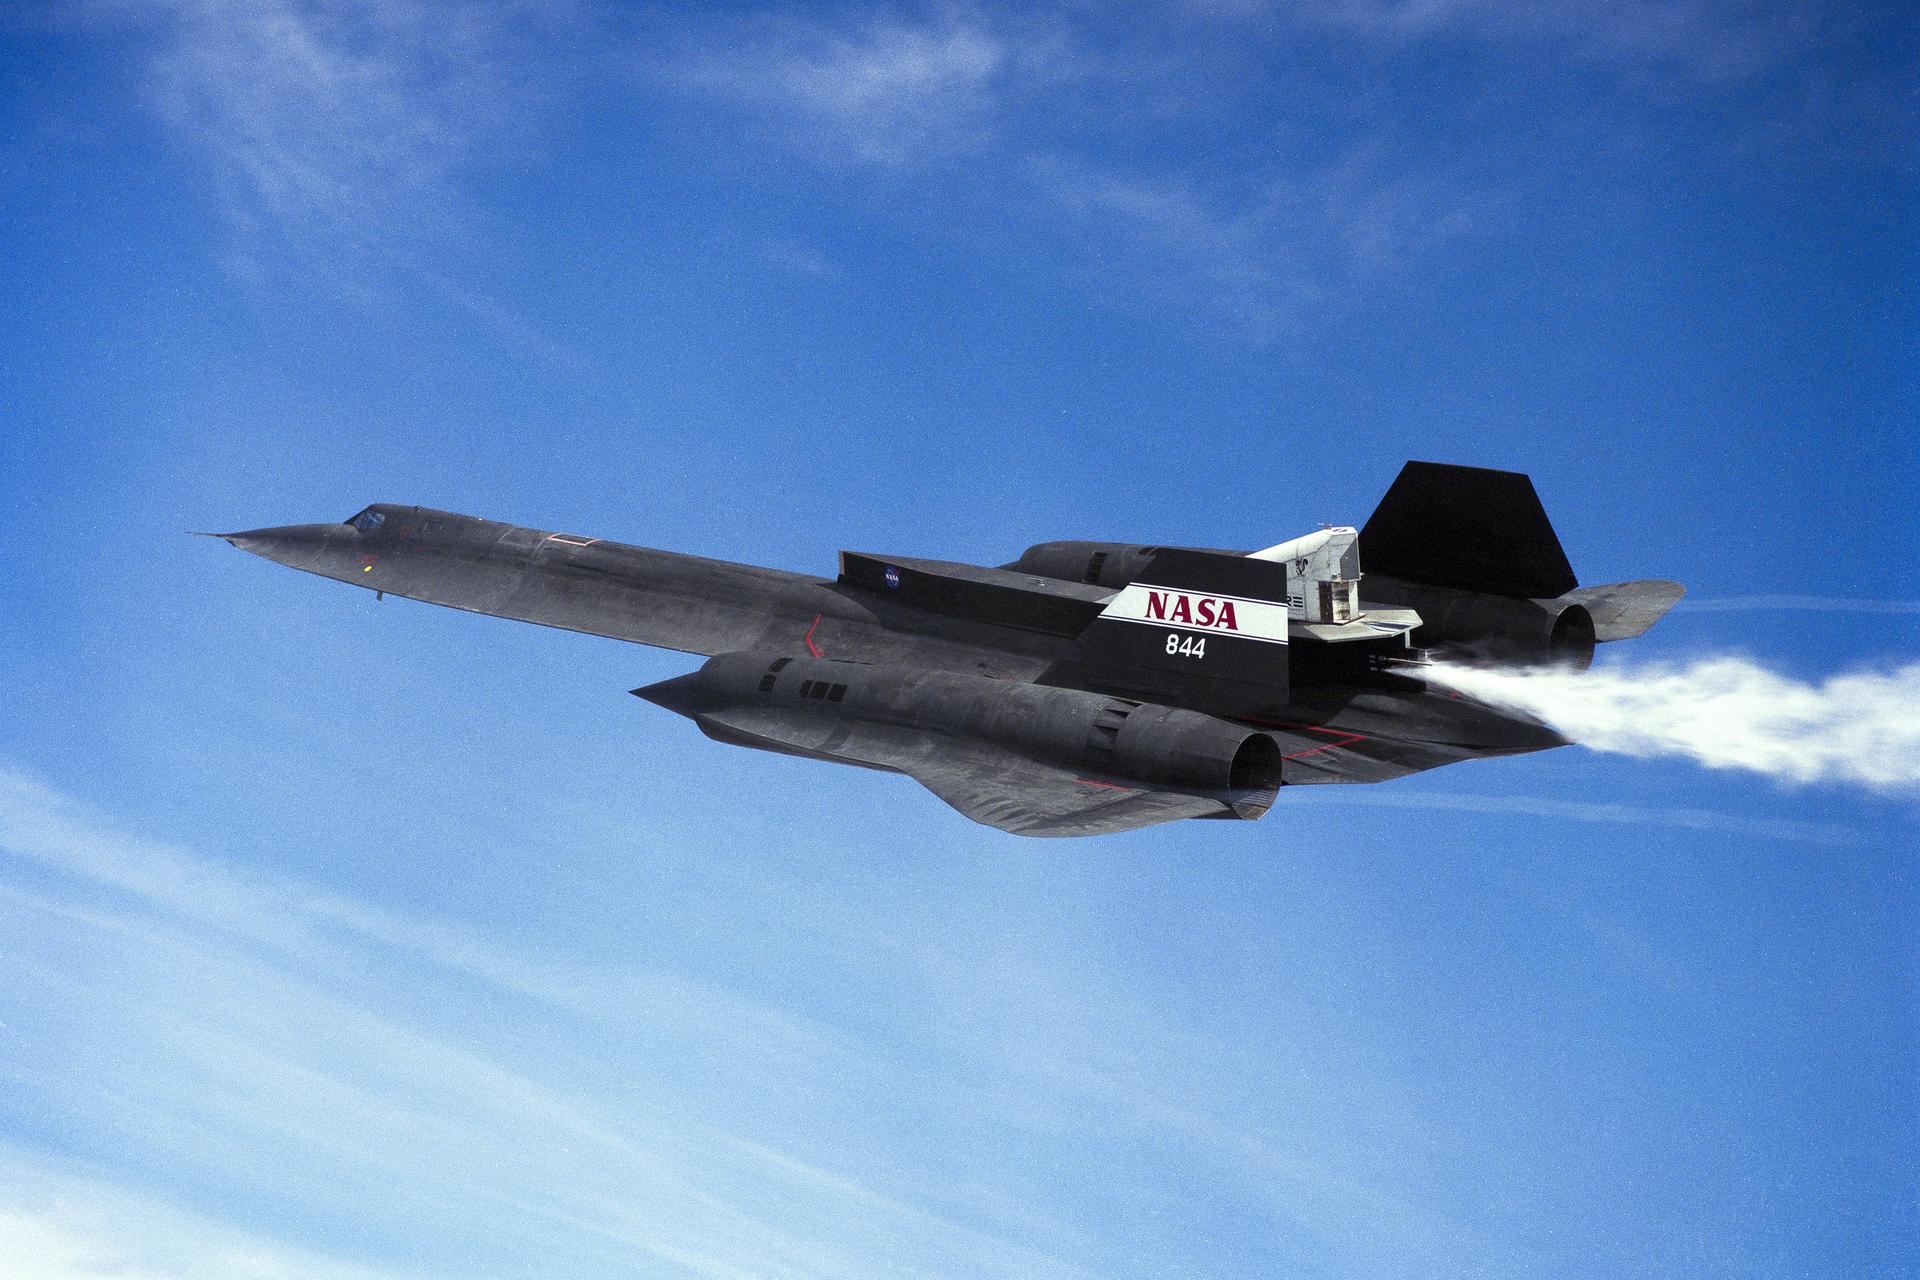
The NASA SR-71 triple-supersonic aircraft carries the Linear Aerospike Experiment on Wednesday, March 4, 1998, during a flight from NASA’s Armstrong (then Dryden) Flight Research Center in Edwards, California. Gaseous helium and liquid nitrogen cycled through the linear aerospike engine during the flight to check the engine’s plumbing system for leaks and to check the engine operating characteristics. Cold-flow tests must be accomplished successfully before firing the rocket engine experiment in flight.
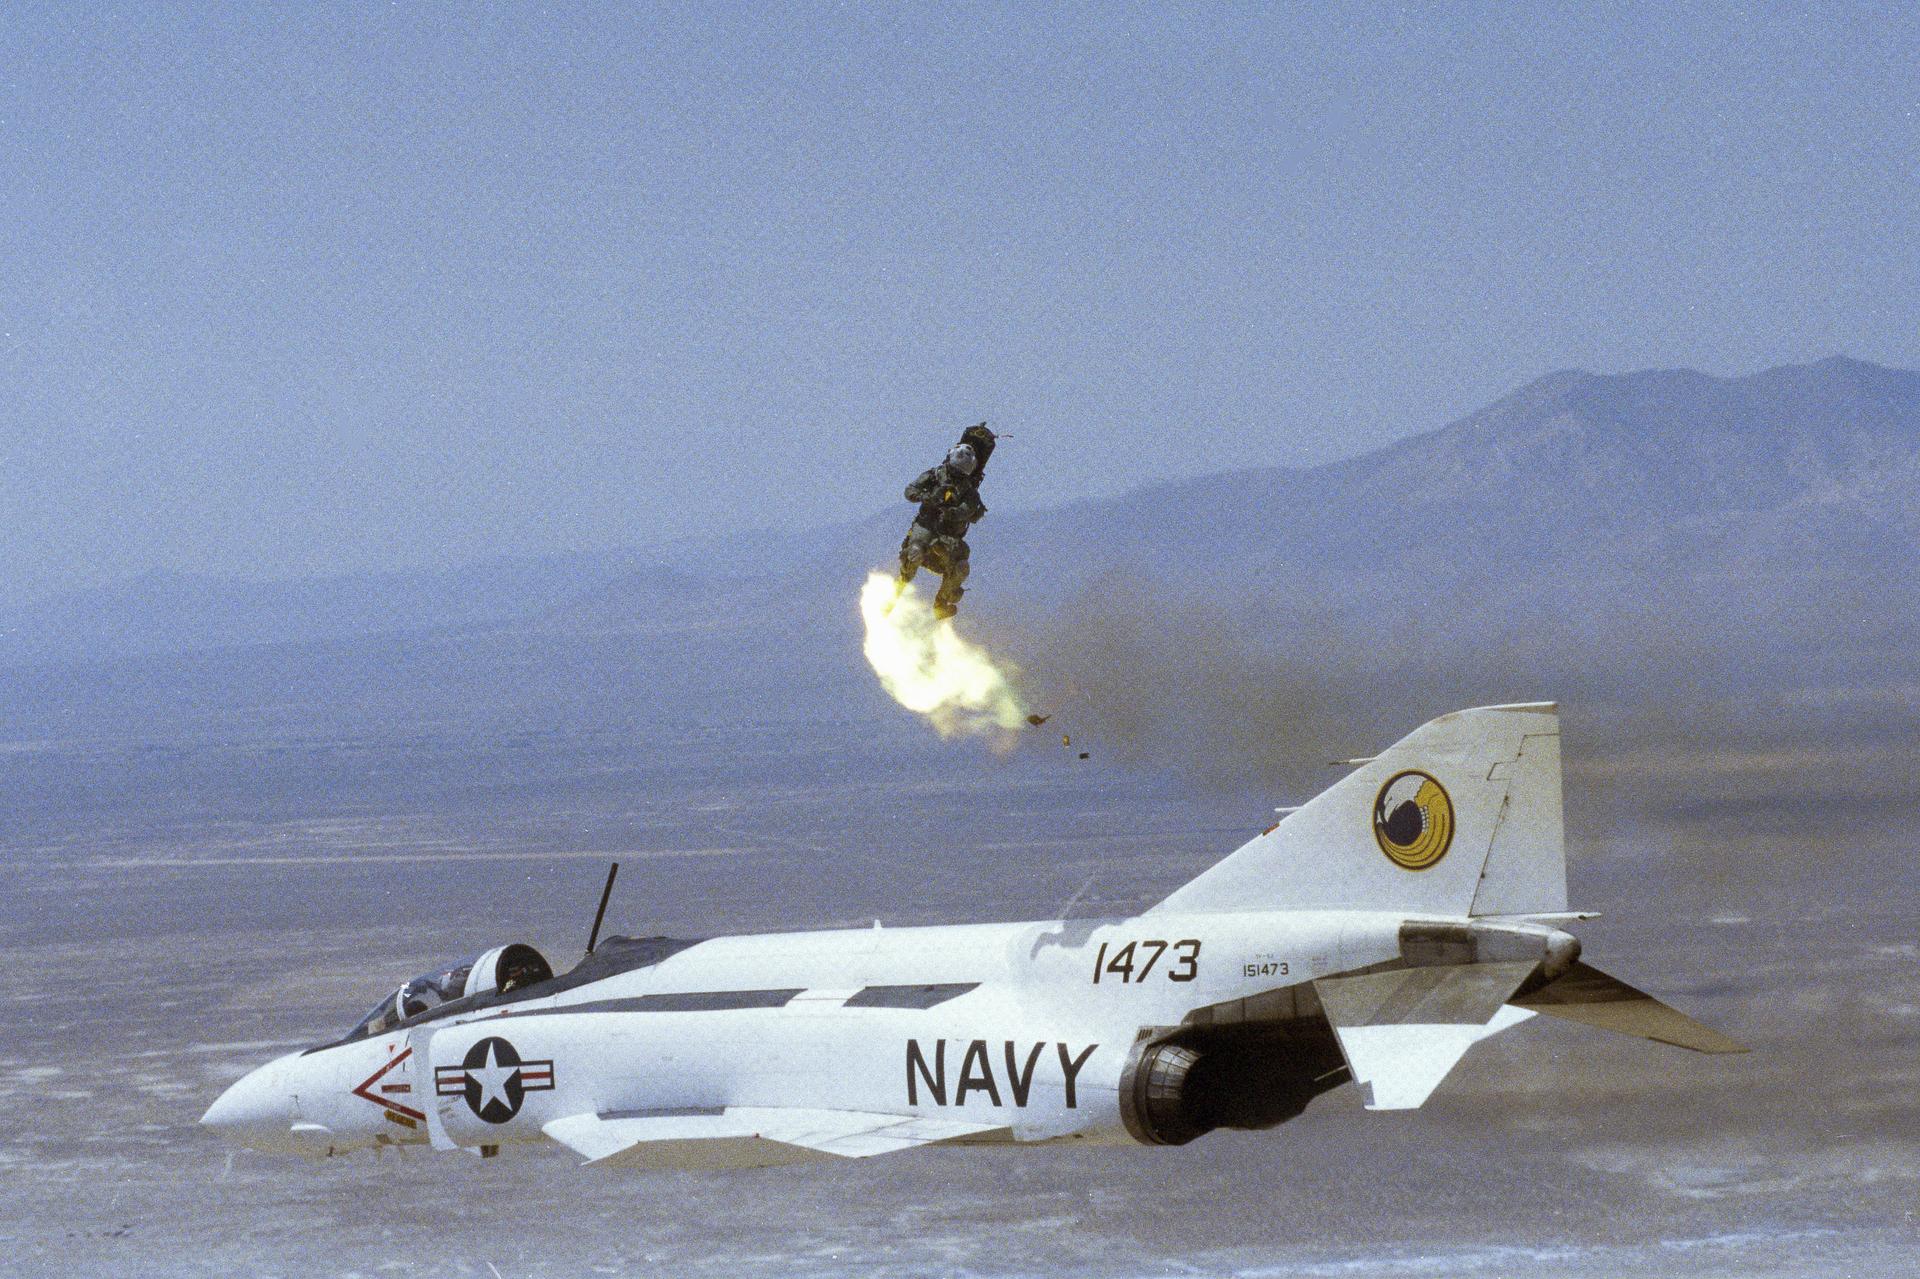
An instrumented mannequin ejects, with help of pyrotechnics, from a specially modified YF-4J drone at the Naval Warfare Center Weapons Division at China Lake, California, on Wednesday May 19, 1999. The test was the final flight in NASA’s ejection seat research, which began in 1995 at NASA’s Armstrong (then Dryden) Flight Research Center in Edwards, California. The project was a collaboration between NASA, the Naval Warfare Center, and the Canada’s Department of National Defense.
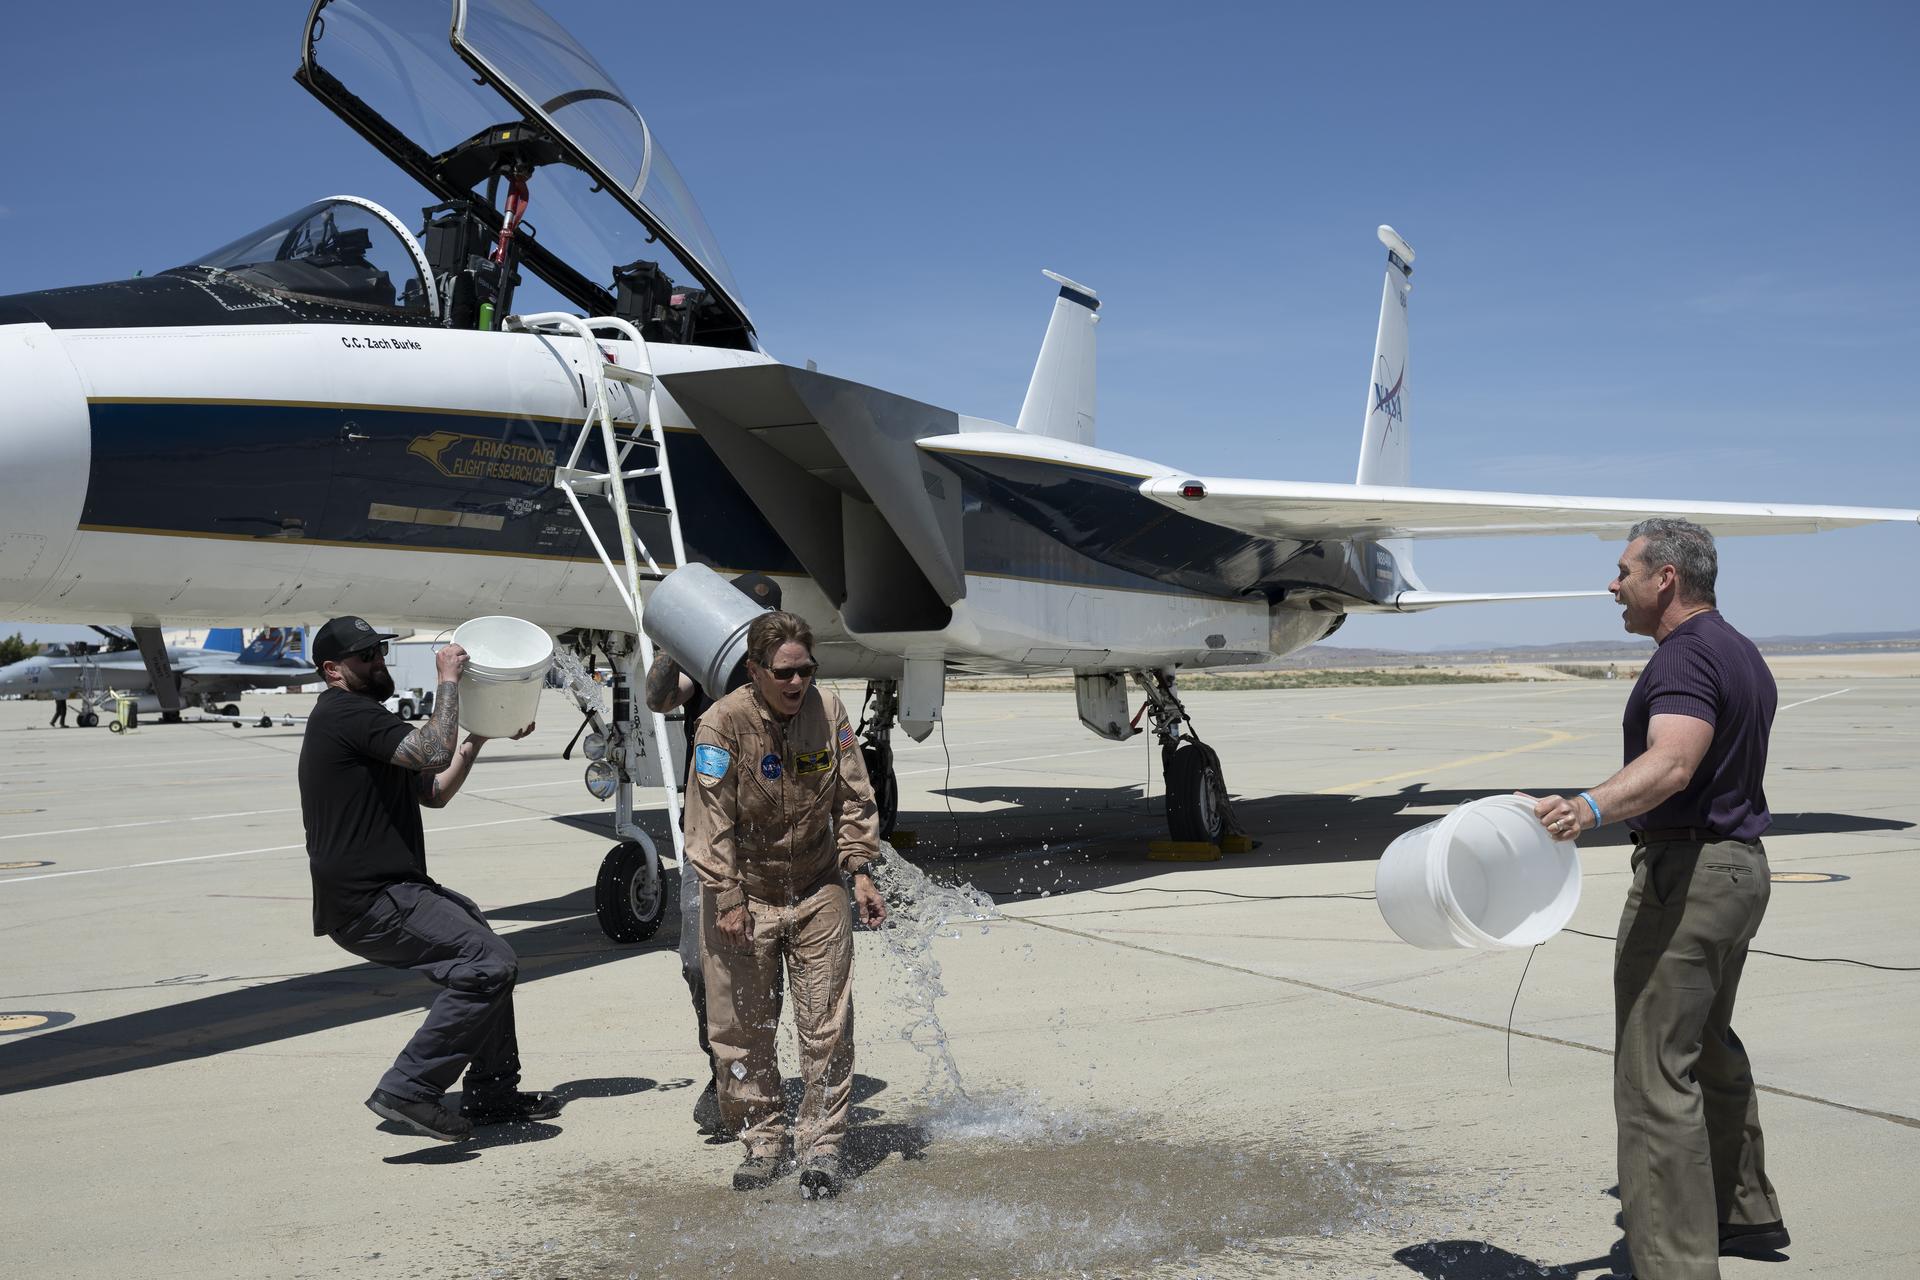
F-15 aircraft crew chief Zack Burke, left, and X-59 mechanic Jamie Trescott, center back, splash buckets of ice water on NASA aerial photographer Carla Thomas in celebration of her 1,000th flight at NASA’s Armstrong Flight Research Center in Edwards, California, on Monday, April 20, 2026. Tim Krall, NASA Armstrong support aircraft fleet manager, watches. Thomas completed her flight in the backseat of a NASA F-15 aircraft flown by NASA Armstrong chief pilot Wayne Ringelberg. For 38 years, Thomas has captured aerial photographs of research and science flights.
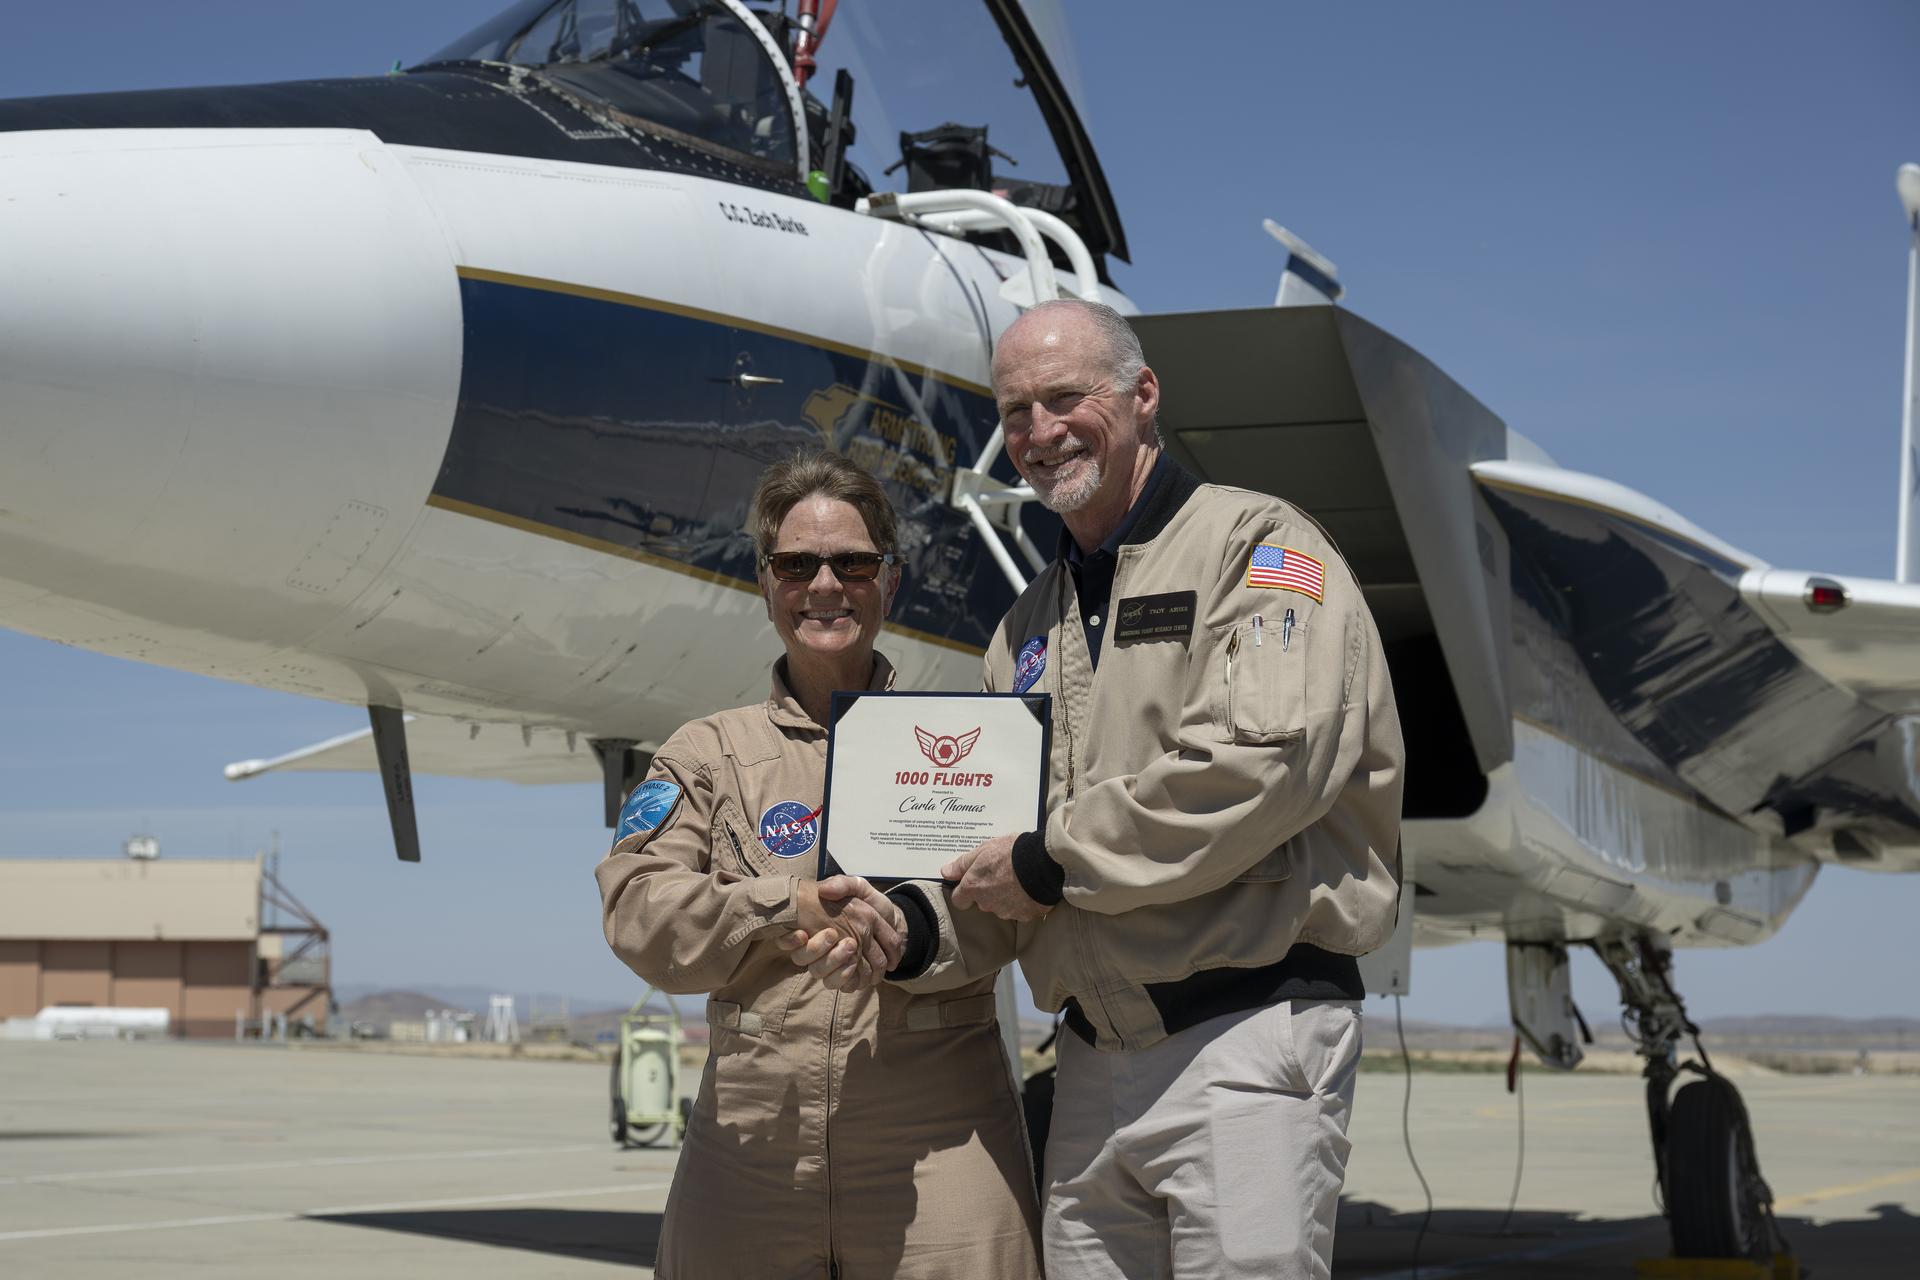
Troy Asher, acting center director, presents NASA aerial photographer Carla Thomas with an award commemorating her 1,000th flight at NASA’s Armstrong Flight Research Center in Edwards, California, on Monday, April 20, 2026. For 38 years, Thomas has captured aerial photographs of research and science flights. The milestone flight was completed in the backseat of a NASA F-15 aircraft piloted by NASA Armstrong chief pilot Wayne Ringelberg.
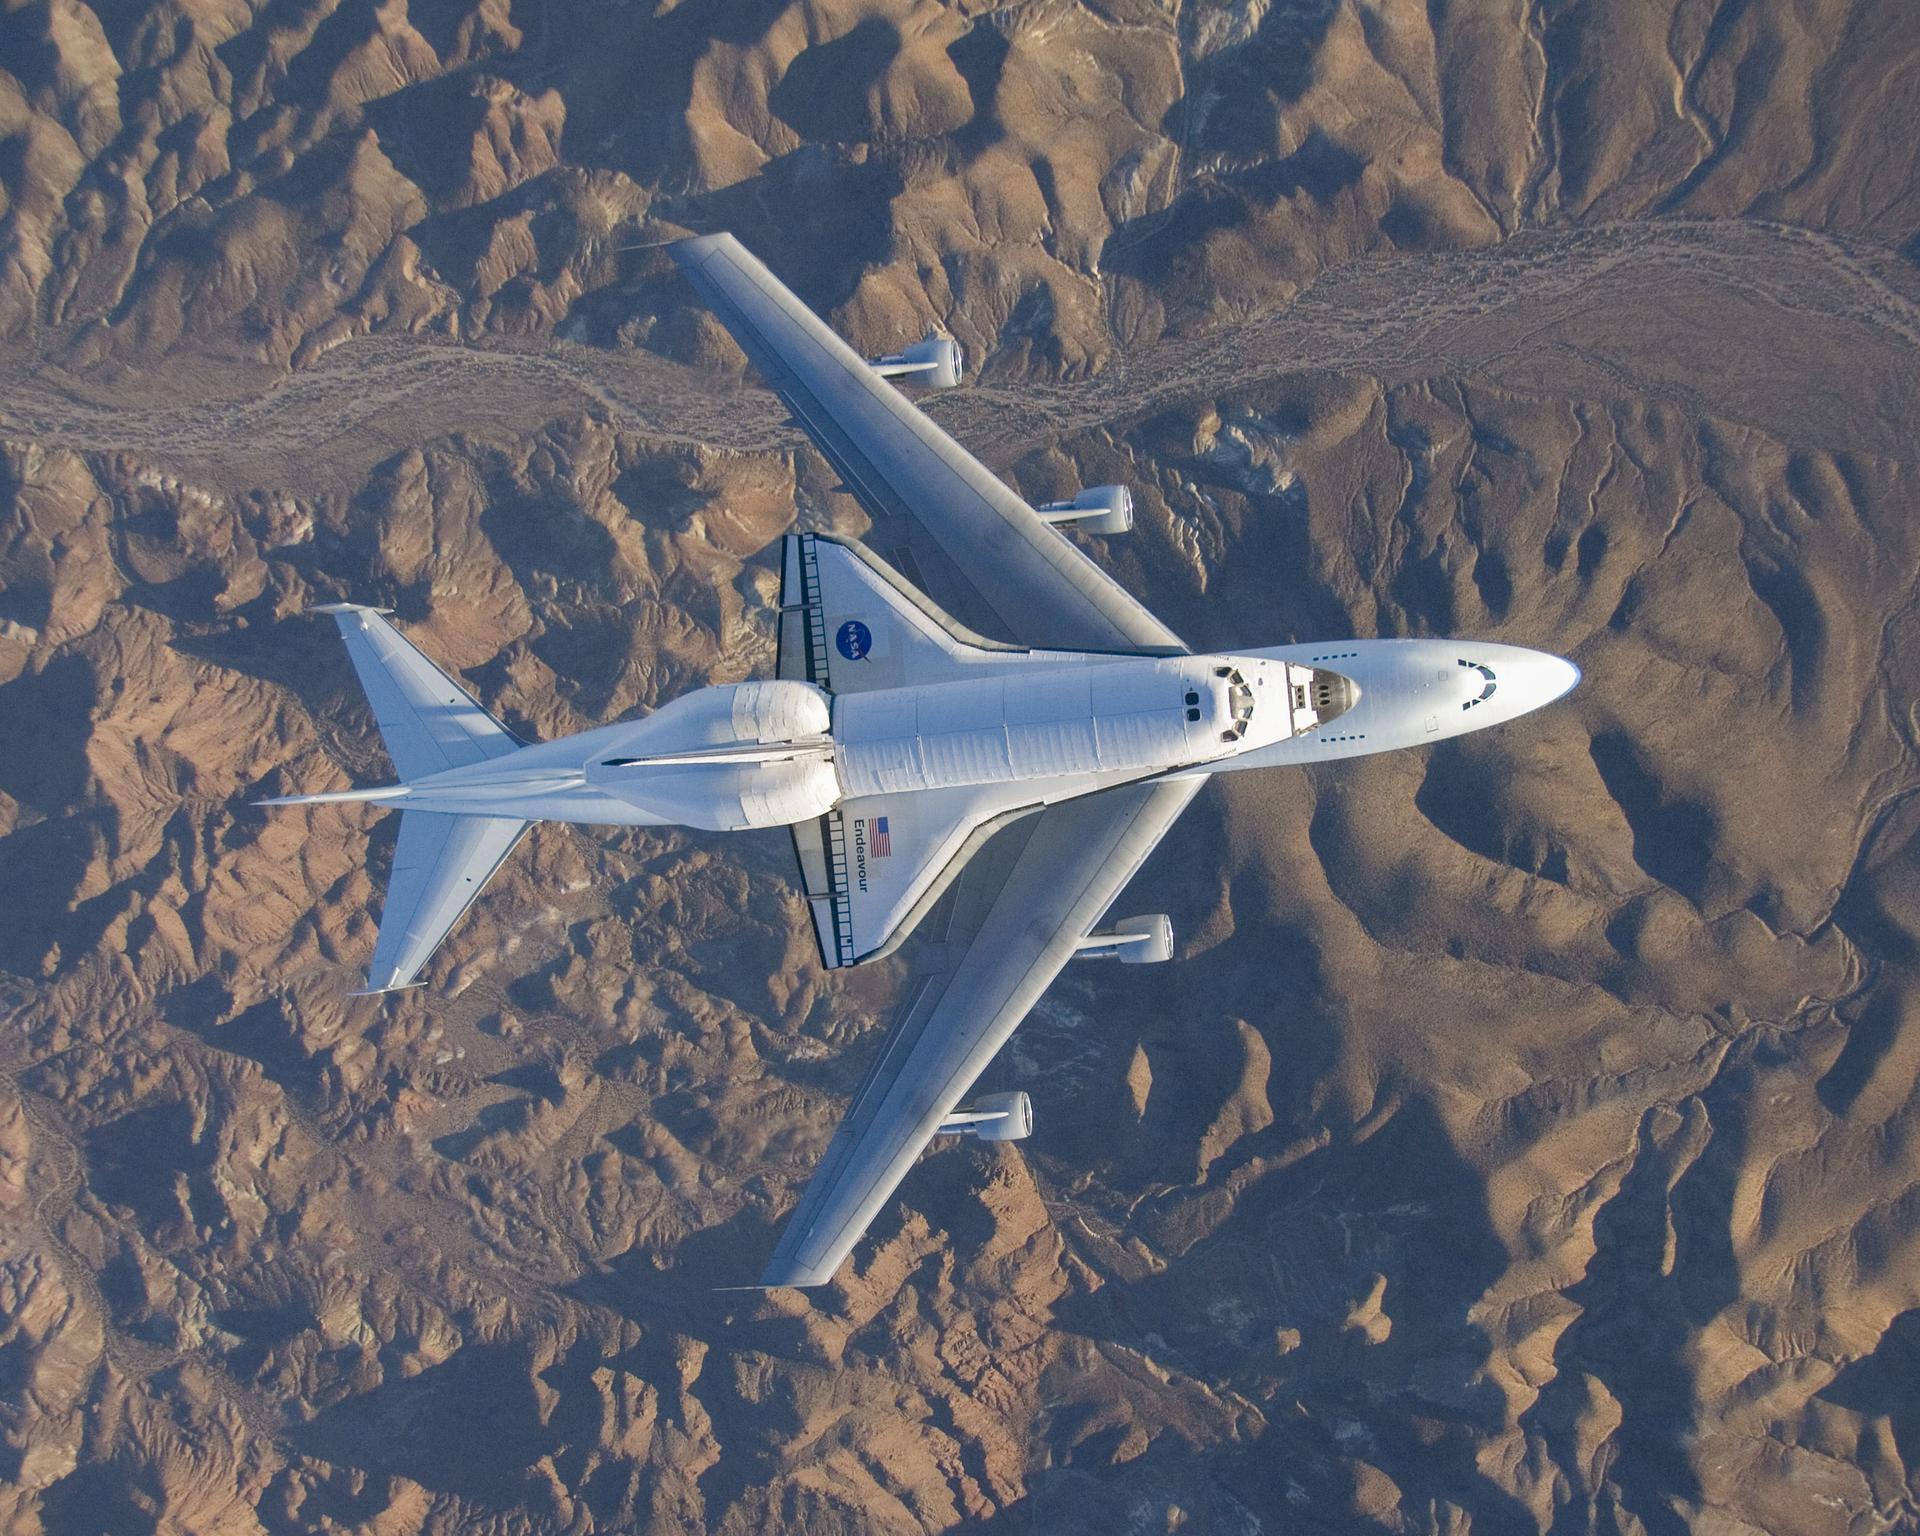
NASA aerial photographer Carla Thomas captured this top-down view of the Space Shuttle Endeavor mounted on a NASA 747 Shuttle Carrier Aircraft from an inverted F/A-18 on Wednesday, Dec. 10, 2008, over the Mojave Desert in California. The shuttle, returning to Kennedy Space Center in Florida, landed at Edwards Air Force Base in Edwards, California, and was prepared nearby at NASA’s Armstrong Flight Research Center for the return trip to Kennedy.
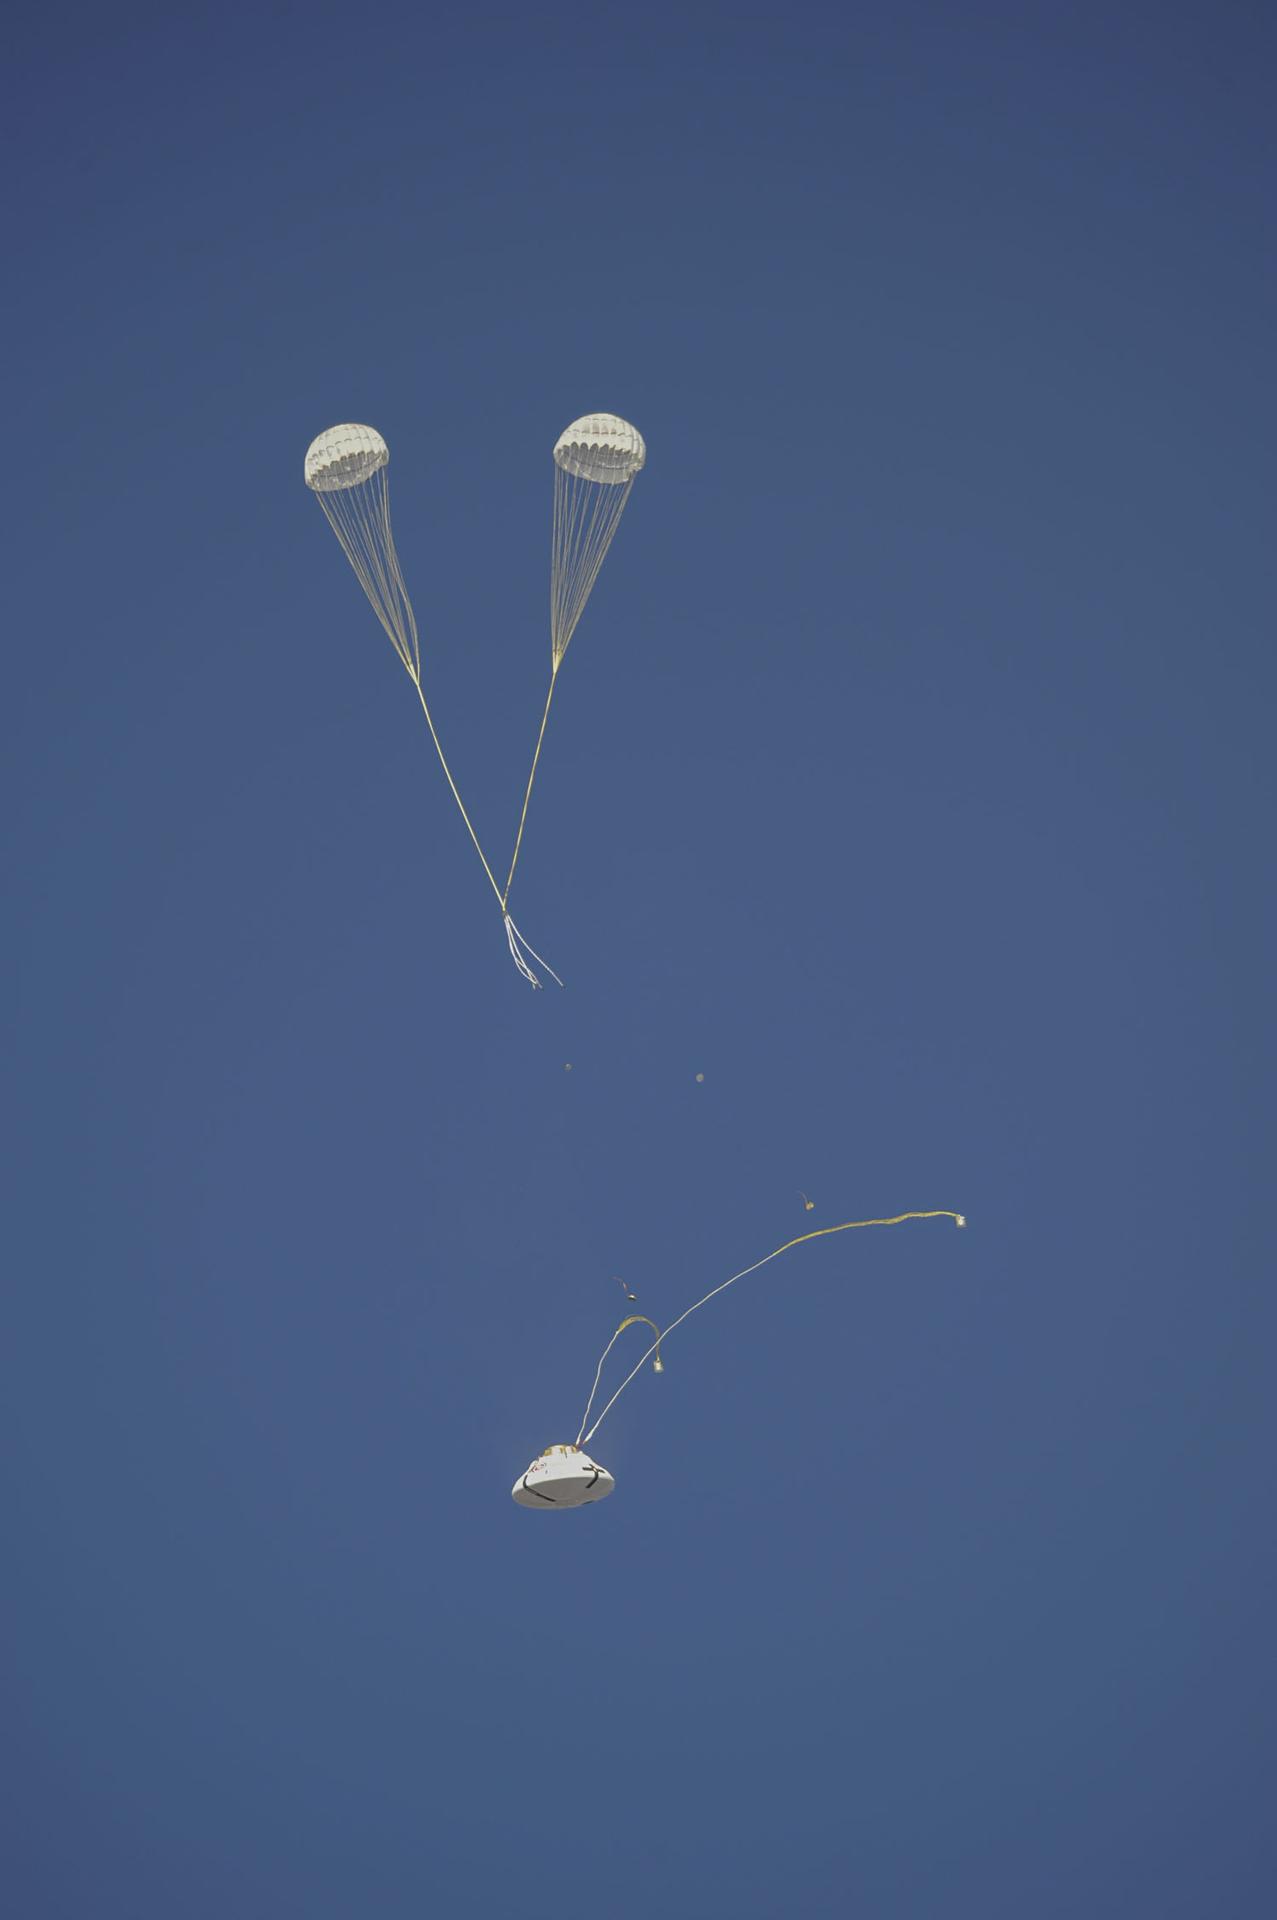
The Orion parachute system enters another phase of its descent after an air launch from a C-17 aircraft on Wednesday, July 18, 2012. Photographers and videographers from NASA’s Armstrong Flight Research Center in Edwards, California, and the agency’s Johnson Space Center in Houston documented a test version of the Orion during Capsule Parachute Assembly System project tests at the U.S. Army Proving Ground, near Yuma, Arizona.
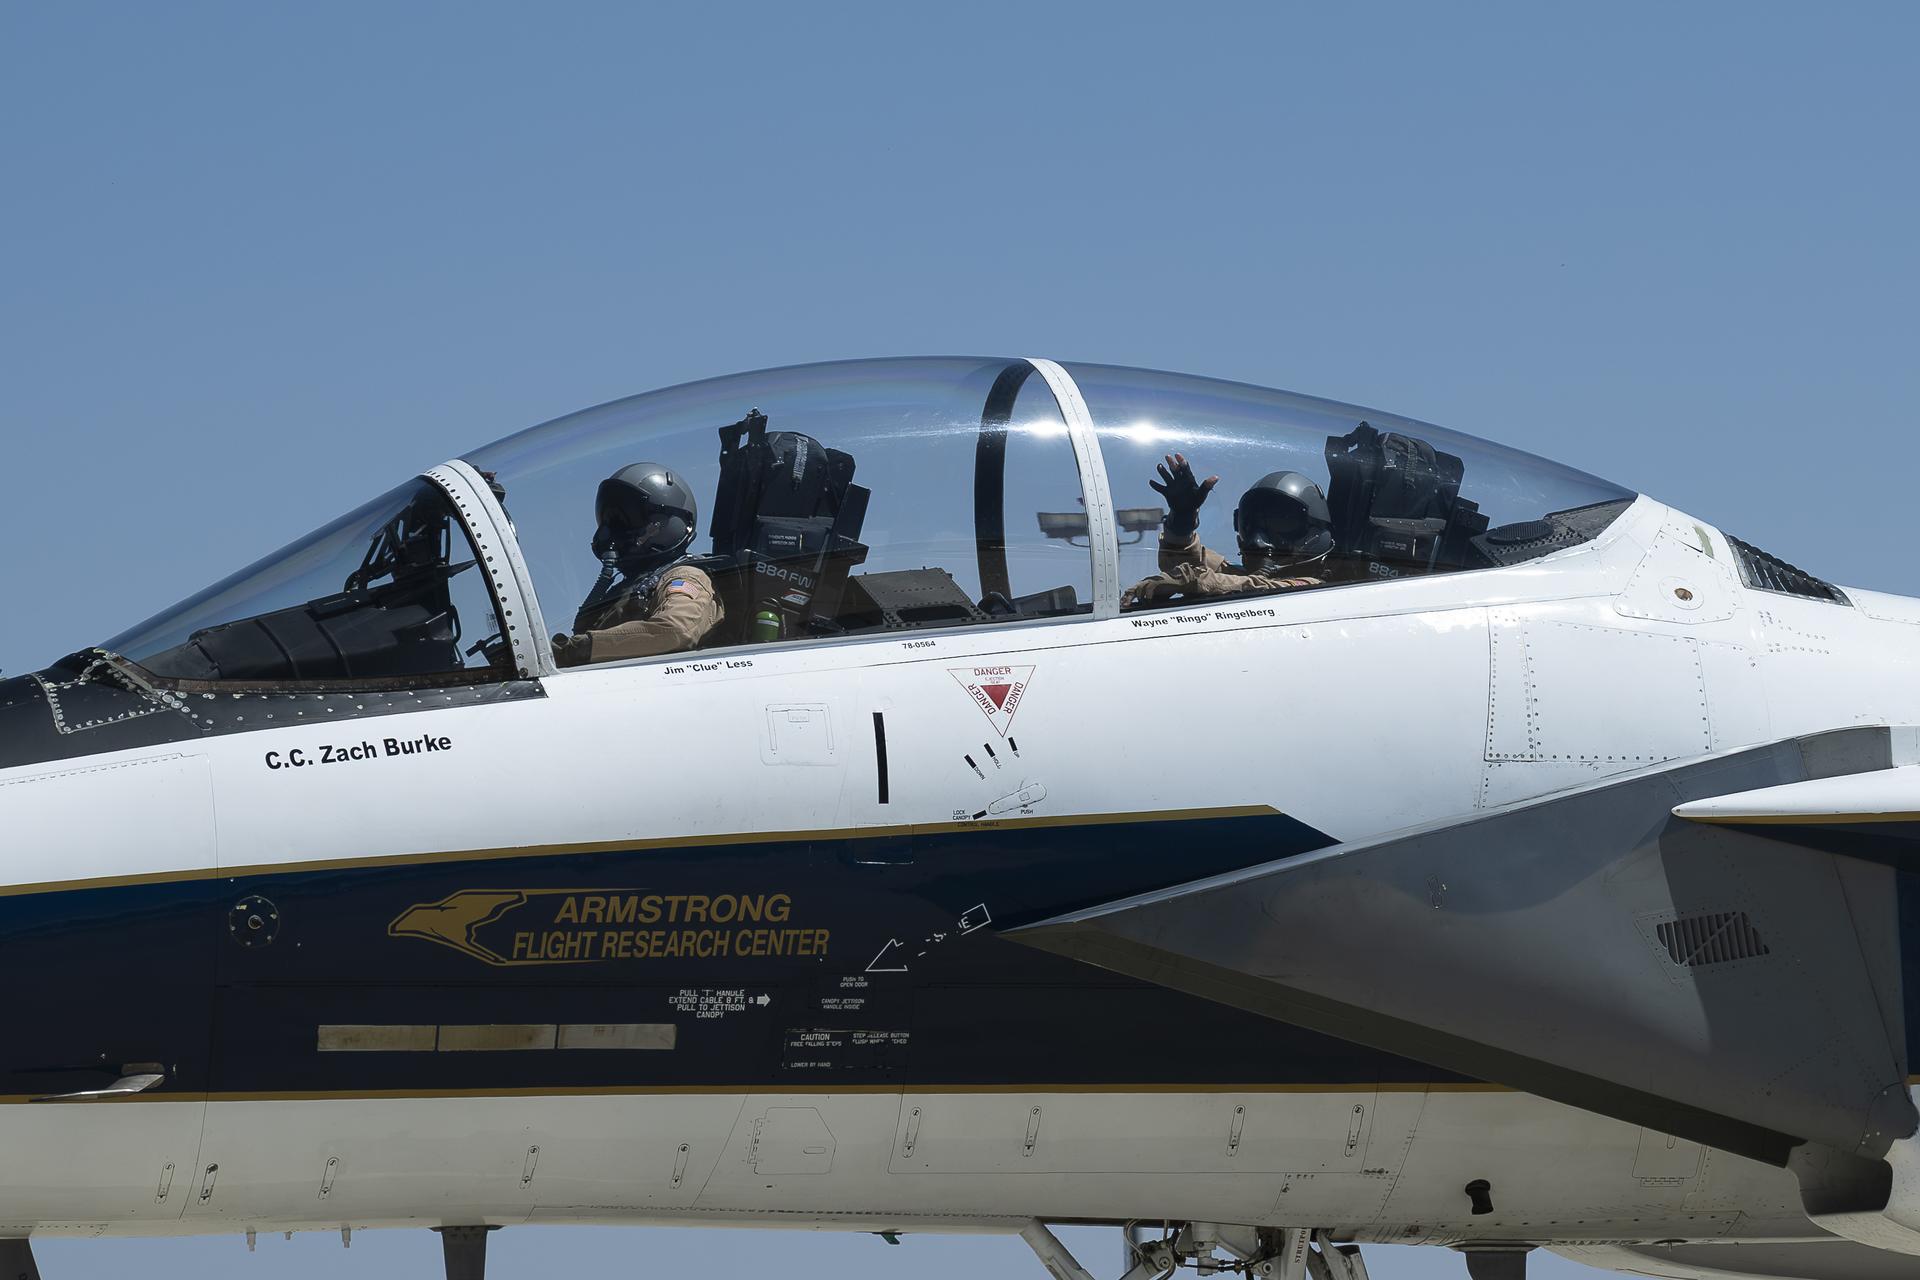
NASA aerial photographer Carla Thomas waves from the backseat of a NASA F-15 aircraft as chief pilot Wayne Ringelberg taxis following Thomas’ 1,000th flight at NASA’s Armstrong Flight Research Center in Edwards, California, on Monday, April 20, 2026. For 38 years, Thomas has captured aerial photographs of research and science flights.
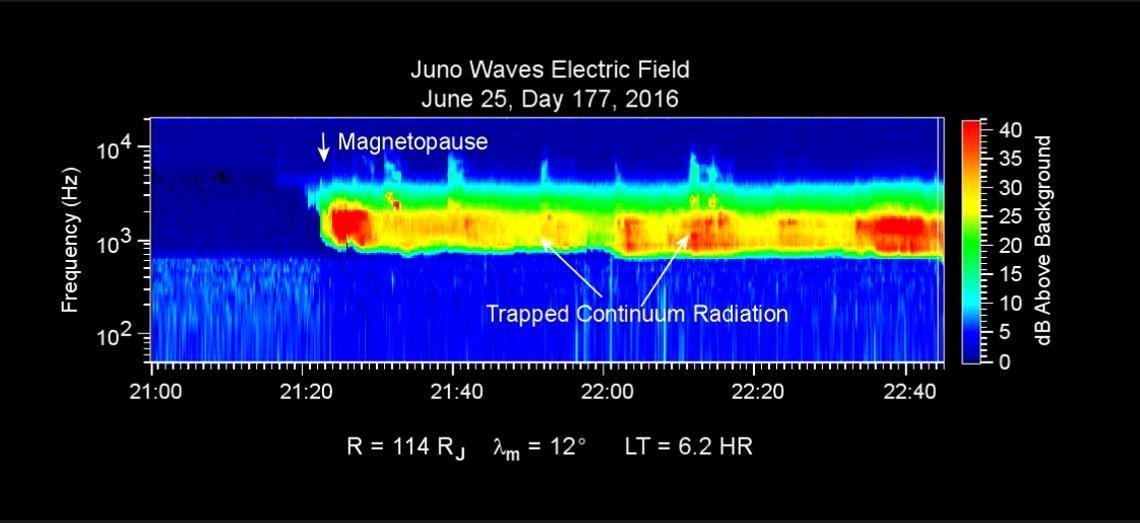
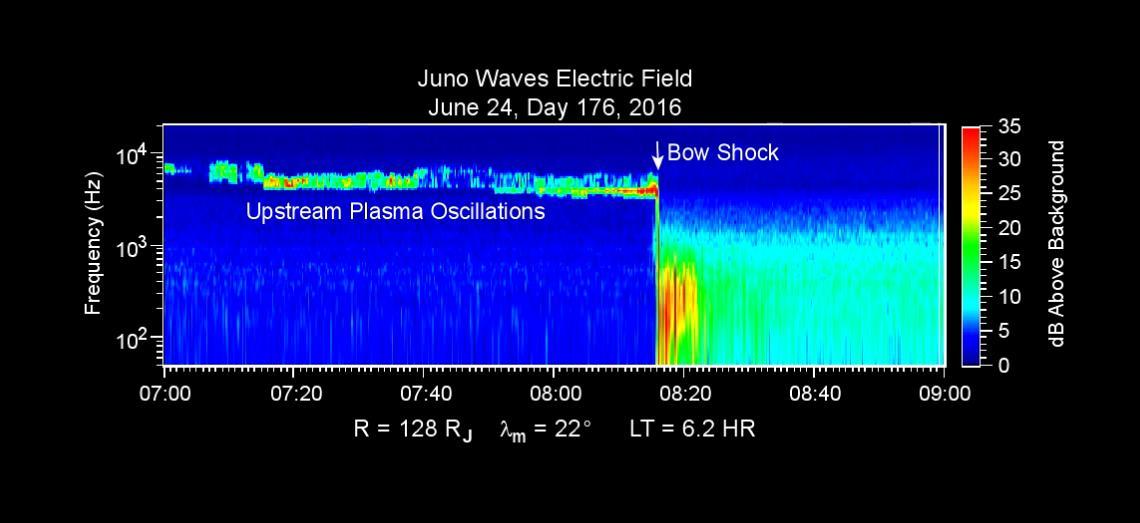
This chart presents data that the Waves investigation on NASA's Juno spacecraft recorded as the spacecraft crossed the bow shock just outside of Jupiter's magnetosphere on June 24, 2016, while approaching Jupiter. Audio accompanies the animation, with volume and pitch correlated to the amplitude and frequency of the recorded waves. The graph is a frequency-time spectrogram with color coding to indicate wave amplitudes as a function of wave frequency (vertical axis, in hertz) and time (horizontal axis, with a total elapsed time of two hours). During the hour before Juno reached the bow shock, the Waves instrument was detecting mainly plasma oscillations just below 10,000 hertz (10 kilohertz). The frequency of these oscillations is related to the local density of electrons; the data yield an estimate of approximately one electron per cubic centimeter (about 16 per cubic inch) in this region just outside Jupiter's bow shock. The broadband burst of noise marked "Bow Shock" is the region of turbulence where the supersonic solar wind is heated and slowed by encountering the Jovian magnetosphere. The shock is analogous to a sonic boom generated in Earth's atmosphere by a supersonic aircraft. The region after the shock is called the magnetosheath. The vertical bar to the right of the chart indicates the color coding of wave amplitude, in decibels (dB) above the background level detected by the Waves instrument. Each step of 10 decibels marks a tenfold increase in wave power. When Juno collected these data, the distance from the spacecraft to Jupiter was about 5.56 million miles (8.95 million kilometers), indicated on the chart as 128 times the radius of Jupiter. Jupiter's magnetic field is tilted about 10 degrees from the planet's axis of rotation. The note of 22 degrees on the chart indicates that at the time these data were recorded, the spacecraft was 22 degrees north of the magnetic-field equator. The "LT" notation is local time on Jupiter at the longitude of the planet directly below the spacecraft, with a value of 6.2 indicating approximately dawn. http://photojournal.jpl.nasa.gov/catalog/PIA20753
This chart presents data that the Waves investigation on NASA's Juno spacecraft recorded as the spacecraft crossed the bow shock just outside of Jupiter's magnetosphere on June 24, 2016, while approaching Jupiter. Audio accompanies the animation, with volume and pitch correlated to the amplitude and frequency of the recorded waves. The graph is a frequency-time spectrogram with color coding to indicate wave amplitudes as a function of wave frequency (vertical axis, in hertz) and time (horizontal axis, with a total elapsed time of two hours). During the hour before Juno reached the bow shock, the Waves instrument was detecting mainly plasma oscillations just below 10,000 hertz (10 kilohertz). The frequency of these oscillations is related to the local density of electrons; the data yield an estimate of approximately one electron per cubic centimeter (about 16 per cubic inch) in this region just outside Jupiter's bow shock. The broadband burst of noise marked "Bow Shock" is the region of turbulence where the supersonic solar wind is heated and slowed by encountering the Jovian magnetosphere. The shock is analogous to a sonic boom generated in Earth's atmosphere by a supersonic aircraft. The region after the shock is called the magnetosheath. The vertical bar to the right of the chart indicates the color coding of wave amplitude, in decibels (dB) above the background level detected by the Waves instrument. Each step of 10 decibels marks a tenfold increase in wave power. When Juno collected these data, the distance from the spacecraft to Jupiter was about 5.56 million miles (8.95 million kilometers), indicated on the chart as 128 times the radius of Jupiter. Jupiter's magnetic field is tilted about 10 degrees from the planet's axis of rotation. The note of 22 degrees on the chart indicates that at the time these data were recorded, the spacecraft was 22 degrees north of the magnetic-field equator. The "LT" notation is local time on Jupiter at the longitude of the planet directly below the spacecraft, with a value of 6.2 indicating approximately dawn. http://photojournal.jpl.nasa.gov/catalog/PIA20753

This illustration shows HD 189733b, a huge gas giant that orbits very close to its host star HD 189733. The planet's atmosphere is scorching with a temperature of over 1000 degrees Celsius, and it rains glass, sideways, in howling 7000 kilometre-per-hour winds. At a distance of 63 light-years from us, this turbulent alien world is one of the nearest exoplanets to Earth that can be seen crossing the face of its star. By observing this planet before, during, and after it disappeared behind its host star during orbit, astronomers were able to deduce that HD 189733b is a deep, azure blue — reminiscent of Earth's colour as seen from space. Credit: NASA, ESA, M. Kornmesser Read more: <a href="http://1.usa.gov/1dnDZPu" rel="nofollow">1.usa.gov/1dnDZPu</a> <b><a href="http://www.nasa.gov/audience/formedia/features/MP_Photo_Guidelines.html" rel="nofollow">NASA image use policy.</a></b> <b><a href="http://www.nasa.gov/centers/goddard/home/index.html" rel="nofollow">NASA Goddard Space Flight Center</a></b> enables NASA’s mission through four scientific endeavors: Earth Science, Heliophysics, Solar System Exploration, and Astrophysics. Goddard plays a leading role in NASA’s accomplishments by contributing compelling scientific knowledge to advance the Agency’s mission. <b>Follow us on <a href="http://twitter.com/NASA_GoddardPix" rel="nofollow">Twitter</a></b> <b>Like us on <a href="http://www.facebook.com/pages/Greenbelt-MD/NASA-Goddard/395013845897?ref=tsd" rel="nofollow">Facebook</a></b> <b>Find us on <a href="http://instagram.com/nasagoddard?vm=grid" rel="nofollow">Instagram</a></b>

This image captures swirling cloud belts and tumultuous vortices within Jupiter's northern hemisphere. NASA's Juno spacecraft took this color-enhanced image at 10:23 p.m. PDT on May 23, 2018 (1:23 a.m. EDT on May 24), as the spacecraft performed its 13th close flyby of Jupiter. At the time, Juno was about 9,600 miles (15,500 kilometers) from the planet's cloud tops, above a northern latitude of 56 degrees. The region seen here is somewhat chaotic and turbulent, given the various swirling cloud formations. In general, the darker cloud material is deeper in Jupiter's atmosphere, while bright cloud material is high. The bright clouds are most likely ammonia or ammonia and water, mixed with a sprinkling of unknown chemical ingredients. A bright oval at bottom center stands out in the scene. This feature appears uniformly white in ground-based telescope observations. However, with JunoCam we can observe the fine-scale structure within this weather system, including additional structures within it. There is not significant motion apparent in the interior of this feature; like the Great Red Spot, its winds probably slows down greatly toward the center. Citizen scientists Gerald Eichstädt and Seán Doran created this image using data from the spacecraft's JunoCam imager. The view is a composite of several separate JunoCam images that were re-projected, blended, and healed. https://photojournal.jpl.nasa.gov/catalog/PIA22424
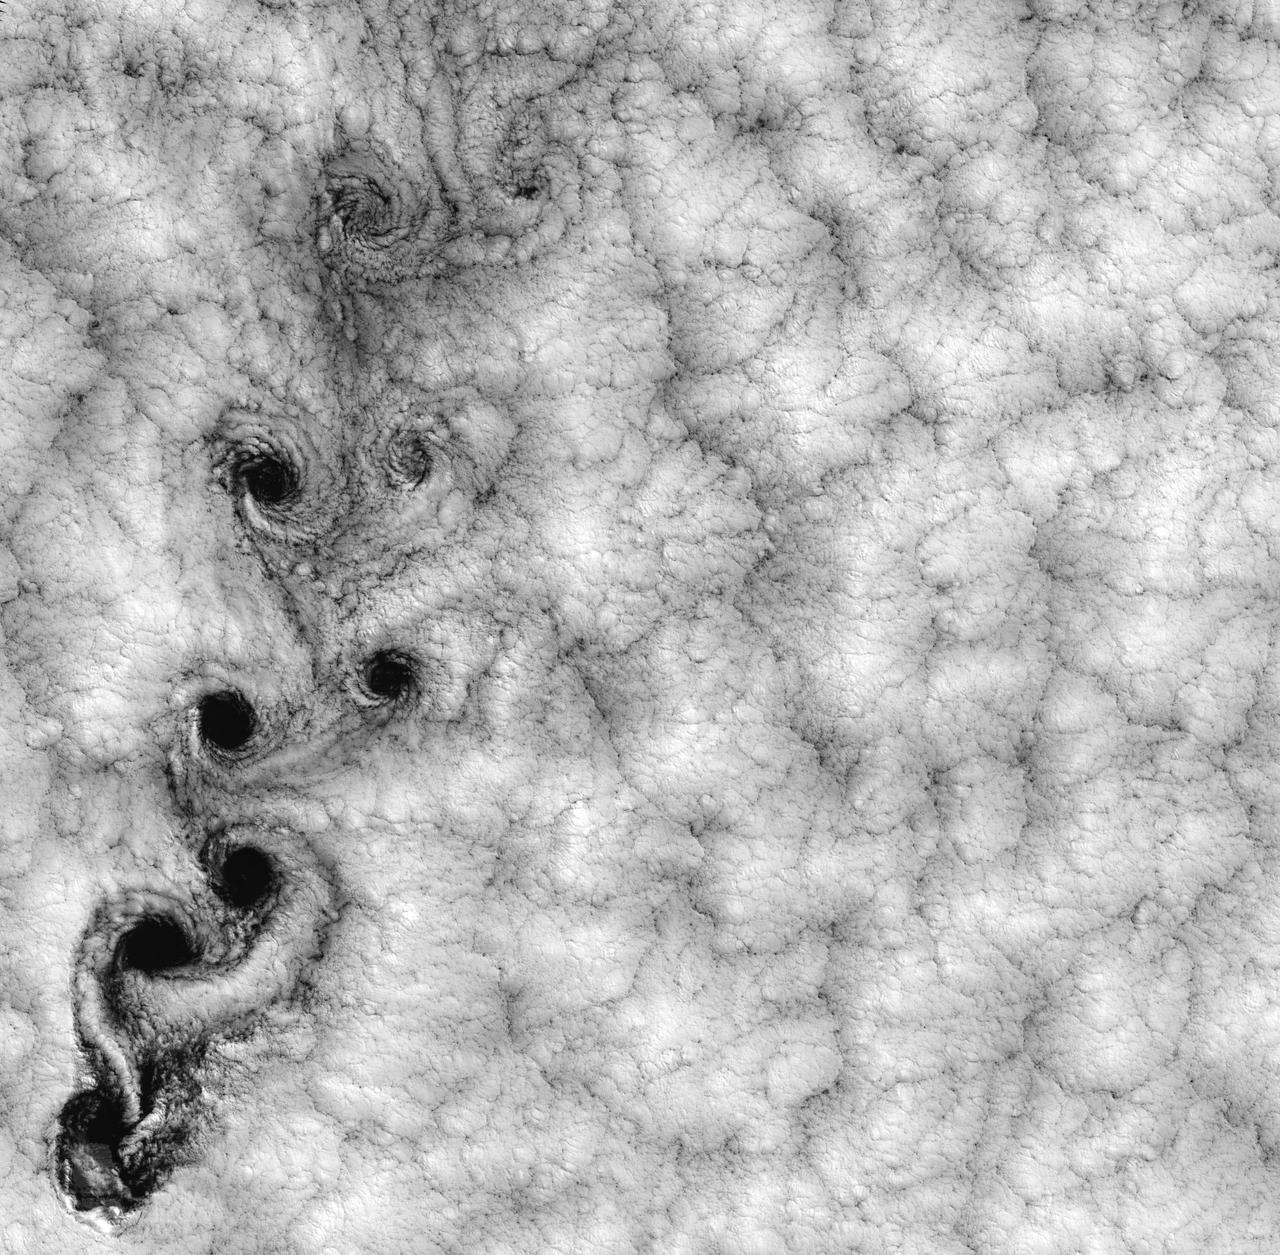
NASA image acquired September 15, 1999 This Landsat 7 image of clouds off the Chilean coast near the Juan Fernandez Islands (also known as the Robinson Crusoe Islands) on September 15, 1999, shows a unique pattern called a “von Karman vortex street.” This pattern has long been studied in the laboratory, where the vortices are created by oil flowing past a cylindrical obstacle, making a string of vortices only several tens of centimeters long. Study of this classic “flow past a circular cylinder” has been very important in the understanding of laminar and turbulent fluid flow that controls a wide variety of phenomena, from the lift under an aircraft wing to Earth’s weather. Here, the cylinder is replaced by Alejandro Selkirk Island (named after the true “Robinson Crusoe,” who was stranded here for many months in the early 1700s). The island is about 1.5 km in diameter, and rises 1.6 km into a layer of marine stratocumulus clouds. This type of cloud is important for its strong cooling of the Earth’s surface, partially counteracting the Greenhouse warming. An extended, steady equatorward wind creates vortices with clockwise flow off the eastern edge and counterclockwise flow off the western edge of the island. The vortices grow as they advect hundreds of kilometers downwind, making a street 10,000 times longer than those made in the laboratory. Observing the same phenomenon extended over such a wide range of sizes dramatizes the “fractal” nature of atmospheric convection and clouds. Fractals are characteristic of fluid flow and other dynamic systems that exhibit “chaotic” motions. Both clockwise and counter-clockwise vortices are generated by flow around the island. As the flow separates from the island’s leeward (away from the source of the wind) side, the vortices “swallow” some of the clear air over the island. (Much of the island air is cloudless due to a local “land breeze” circulation set up by the larger heat capacity of the waters surrounding the island.) The “swallowed” gulps of clear island air get carried along within the vortices, but these are soon mixed into the surrounding clouds. Landsat is unique in its ability to image both the small-scale eddies that mix clear and cloudy air, down to the 30 meter pixel size of Landsat, but also having a wide enough field-of-view, 180 km, to reveal the connection of the turbulence to large-scale flows such as the subtropical oceanic gyres. Landsat 7, with its new onboard digital recorder, has extended this capability away from the few Landsat ground stations to remote areas such as Alejandro Island, and thus is gradually providing a global dynamic picture of evolving human-scale phenomena. For more details on von Karman vortices, refer to <a href="http://climate.gsfc.nasa.gov/~cahalan" rel="nofollow">climate.gsfc.nasa.gov/~cahalan</a>. Image and caption courtesy Bob Cahalan, NASA GSFC Instrument: Landsat 7 - ETM+ Credit: NASA/GSFC/Landsat <b><a href="http://www.nasa.gov/centers/goddard/home/index.html" rel="nofollow">NASA Goddard Space Flight Center</a></b> enables NASA’s mission through four scientific endeavors: Earth Science, Heliophysics, Solar System Exploration, and Astrophysics. Goddard plays a leading role in NASA’s accomplishments by contributing compelling scientific knowledge to advance the Agency’s mission. <b>Follow us on <a href="http://twitter.com/NASA_GoddardPix" rel="nofollow">Twitter</a></b> <b>Join us on <a href="http://www.facebook.com/pages/Greenbelt-MD/NASA-Goddard/395013845897?ref=tsd" rel="nofollow">Facebook</a></b>