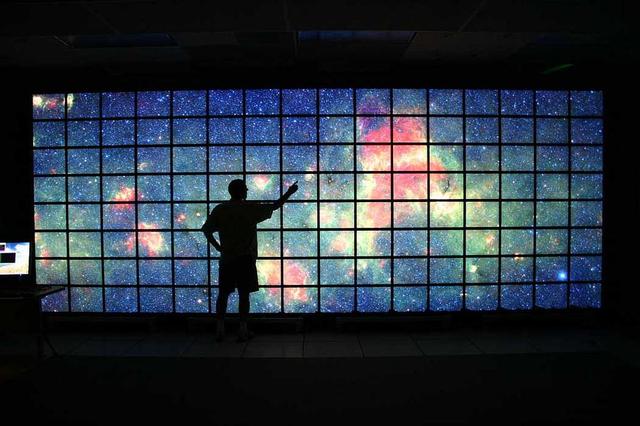
The center of the Milky Way galaxy imaged by NASA Spitzer Space Telescope is displayed on a quarter-of-a-billion-pixel, high-definition 23-foot-wide 7-meter LCD science visualization screen at NASA Ames Research Center.
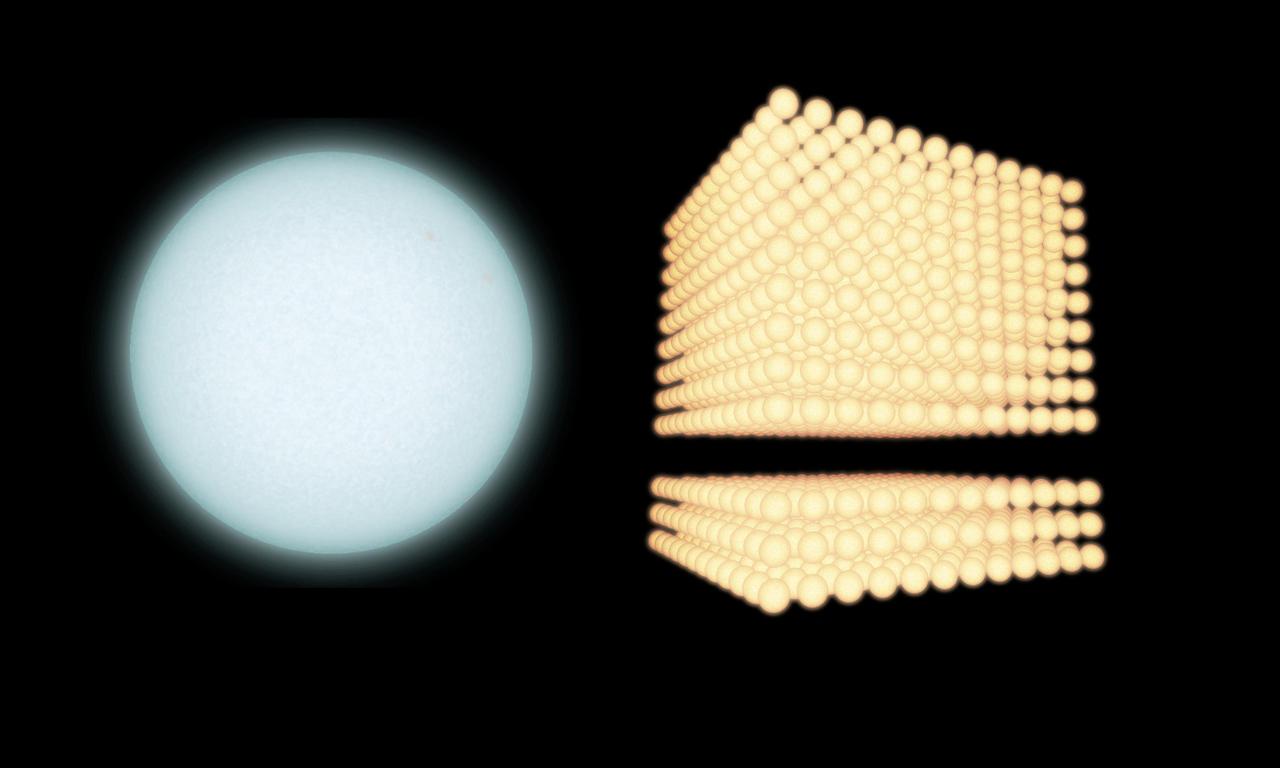
NASA Galaxy Evolution Explorer spacecraft and Cerro Tololo Inter-American Observatory combined data making this diagram illustratrating the extent to which astronomers have been underestimating the proportion of small to big stars in certain galaxies.

Dwane Roth of Big D Farms in Kansas, speaks before the ribbon cutting ceremony to open NASA’s Earth Information Center, Wednesday, June 21, 2023, at the Mary W. Jackson NASA Headquarters building in Washington. The Earth Information Center is new immersive experience that combines live data sets with cutting-edge data visualization and storytelling to allow visitors to see how our planet is changing. Photo Credit: (NASA/Joel Kowsky)

Dwane Roth of Big D Farms in Kansas, speaks before the ribbon cutting ceremony to open NASA’s Earth Information Center, Wednesday, June 21, 2023, at the Mary W. Jackson NASA Headquarters building in Washington. The Earth Information Center is new immersive experience that combines live data sets with cutting-edge data visualization and storytelling to allow visitors to see how our planet is changing. Photo Credit: (NASA/Joel Kowsky)

iss058e003984 (1/16/2019) --- Canadian Space Agency (CSA) astronaut David Saint-Jacques demonstrates the Bio-Monitor, a Canadian technology, which is utilized in the Autonomous Health Monitoring for Adaption Assessment on Long Range Missions Using Big Data Analytic.(Space Health) study. The innovative smart shirt system captures the astronauts' vital signs, and the data is used to assess the impact of spaceflight on the cardiovascular system. Image courtesy of CSA/NASA.
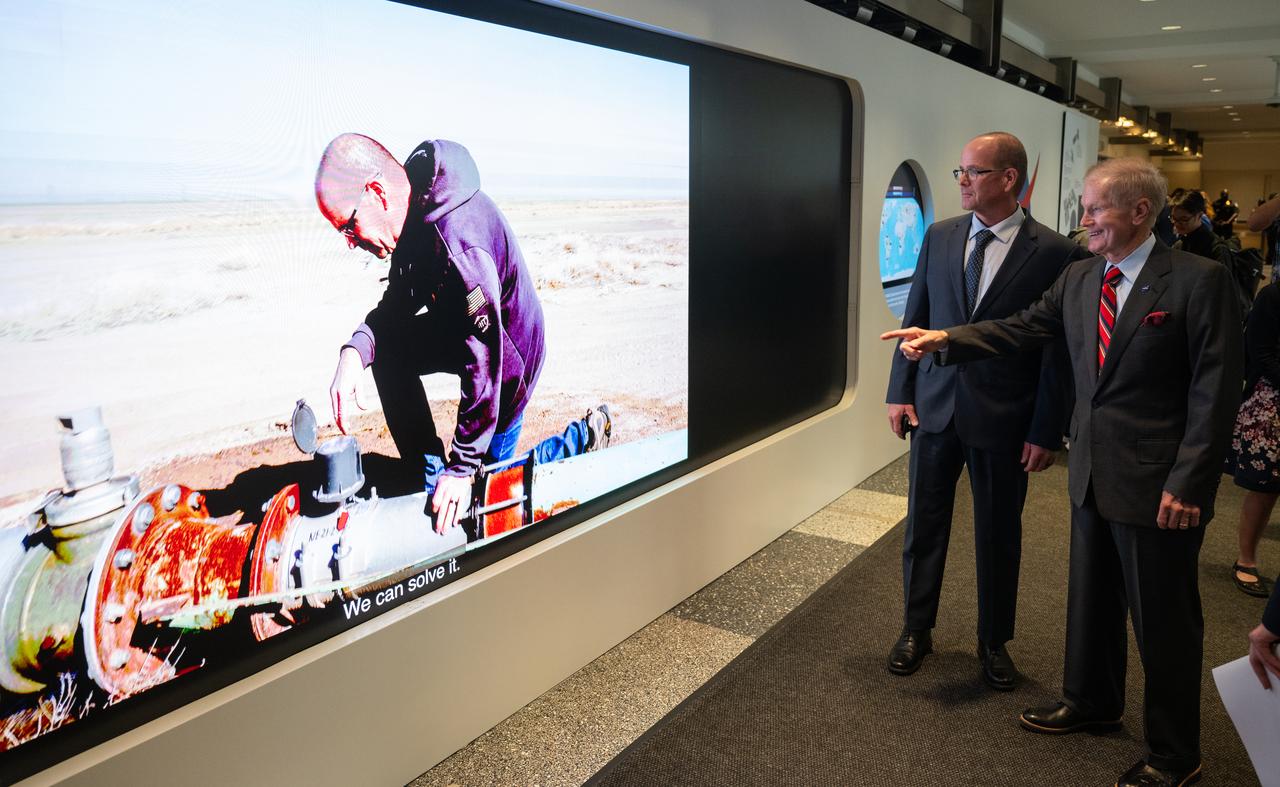
NASA Administrator Bill Nelson, right, and Dwane Roth of Big D Farms in Kansas are seen watching a video on the hyperwall that shows Roth’s farm following a ribbon cutting ceremony to open NASA’s Earth Information Center, Wednesday, June 21, 2023, at the Mary W. Jackson NASA Headquarters building in Washington. The Earth Information Center is new immersive experience that combines live data sets with cutting-edge data visualization and storytelling to allow visitors to see how our planet is changing. Photo Credit: (NASA/Joel Kowsky)
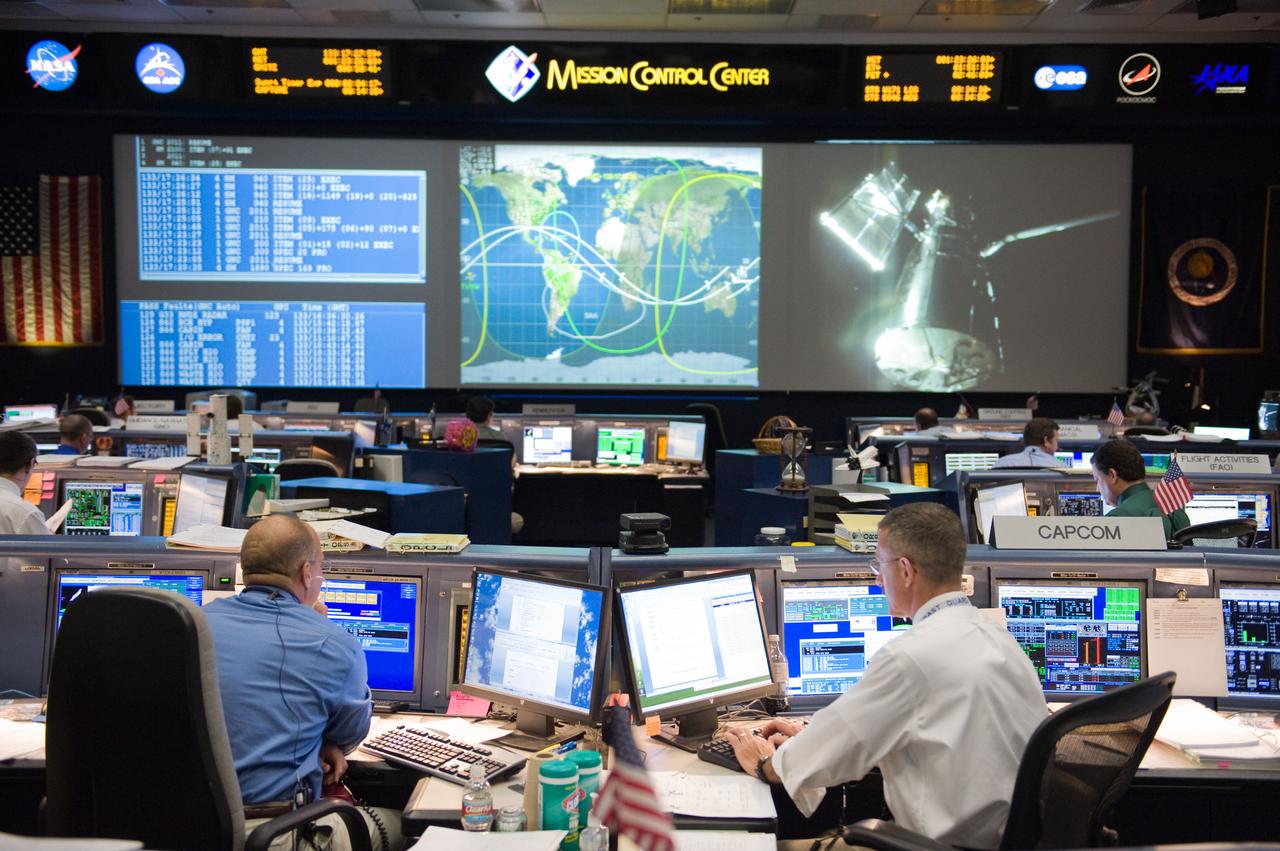
JSC2009-E-119745 (13 May 2009) --- Flight director Tony Ceccacci (left) and astronaut Dan Burbank, STS-125 spacecraft communicator (CAPCOM), monitor data at their consoles in the space shuttle flight control room in the Mission Control Center at NASA's Johnson Space Center during flight day three activities. The Hubble Space Telescope, grappled by Space Shuttle Atlantis? remote manipulator system (RMS), is visible on one of the big screens.
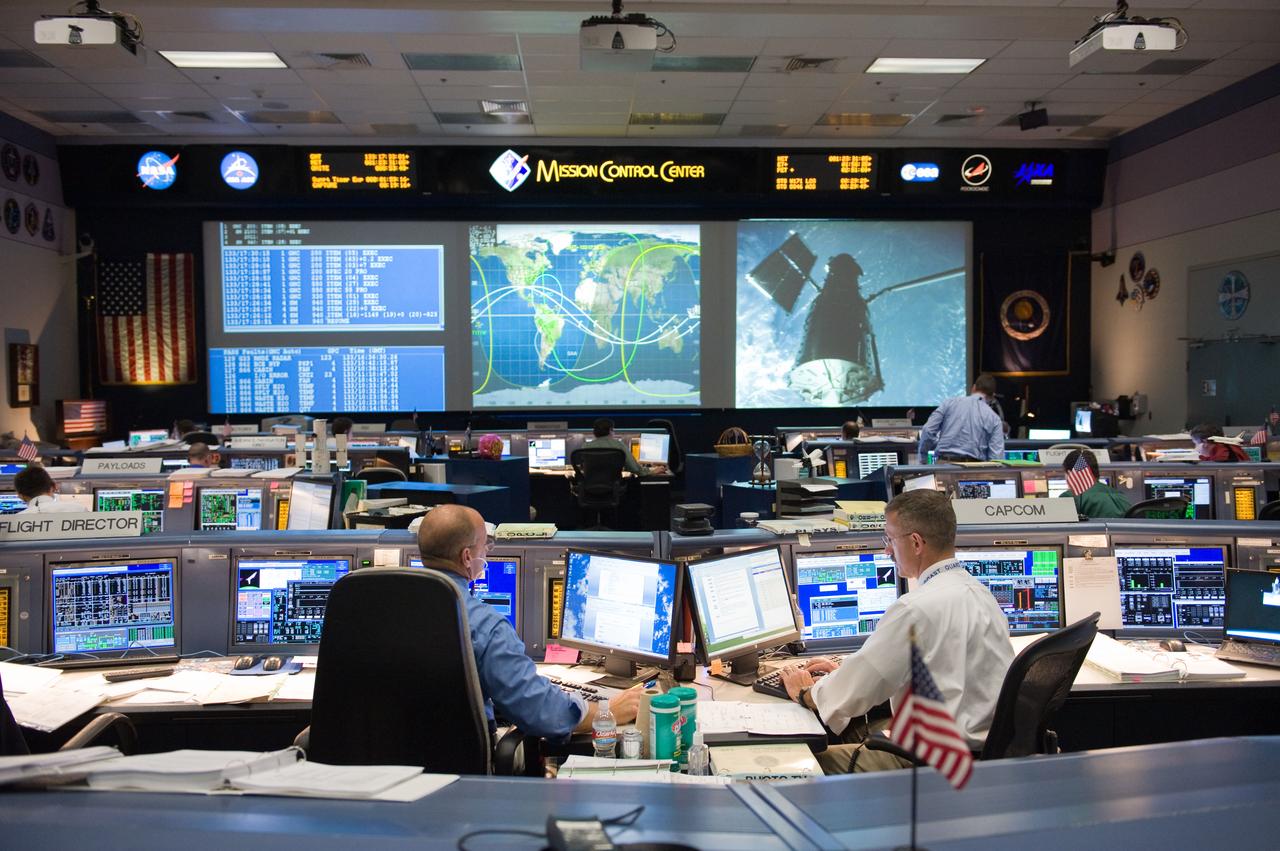
JSC2009-E-119746 (13 May 2009) --- Flight director Tony Ceccacci (left) and astronaut Dan Burbank, STS-125 spacecraft communicator (CAPCOM), monitor data at their consoles in the space shuttle flight control room in the Mission Control Center at NASA's Johnson Space Center during flight day three activities. The Hubble Space Telescope, grappled by Space Shuttle Atlantis? remote manipulator system (RMS), is visible on one of the big screens.
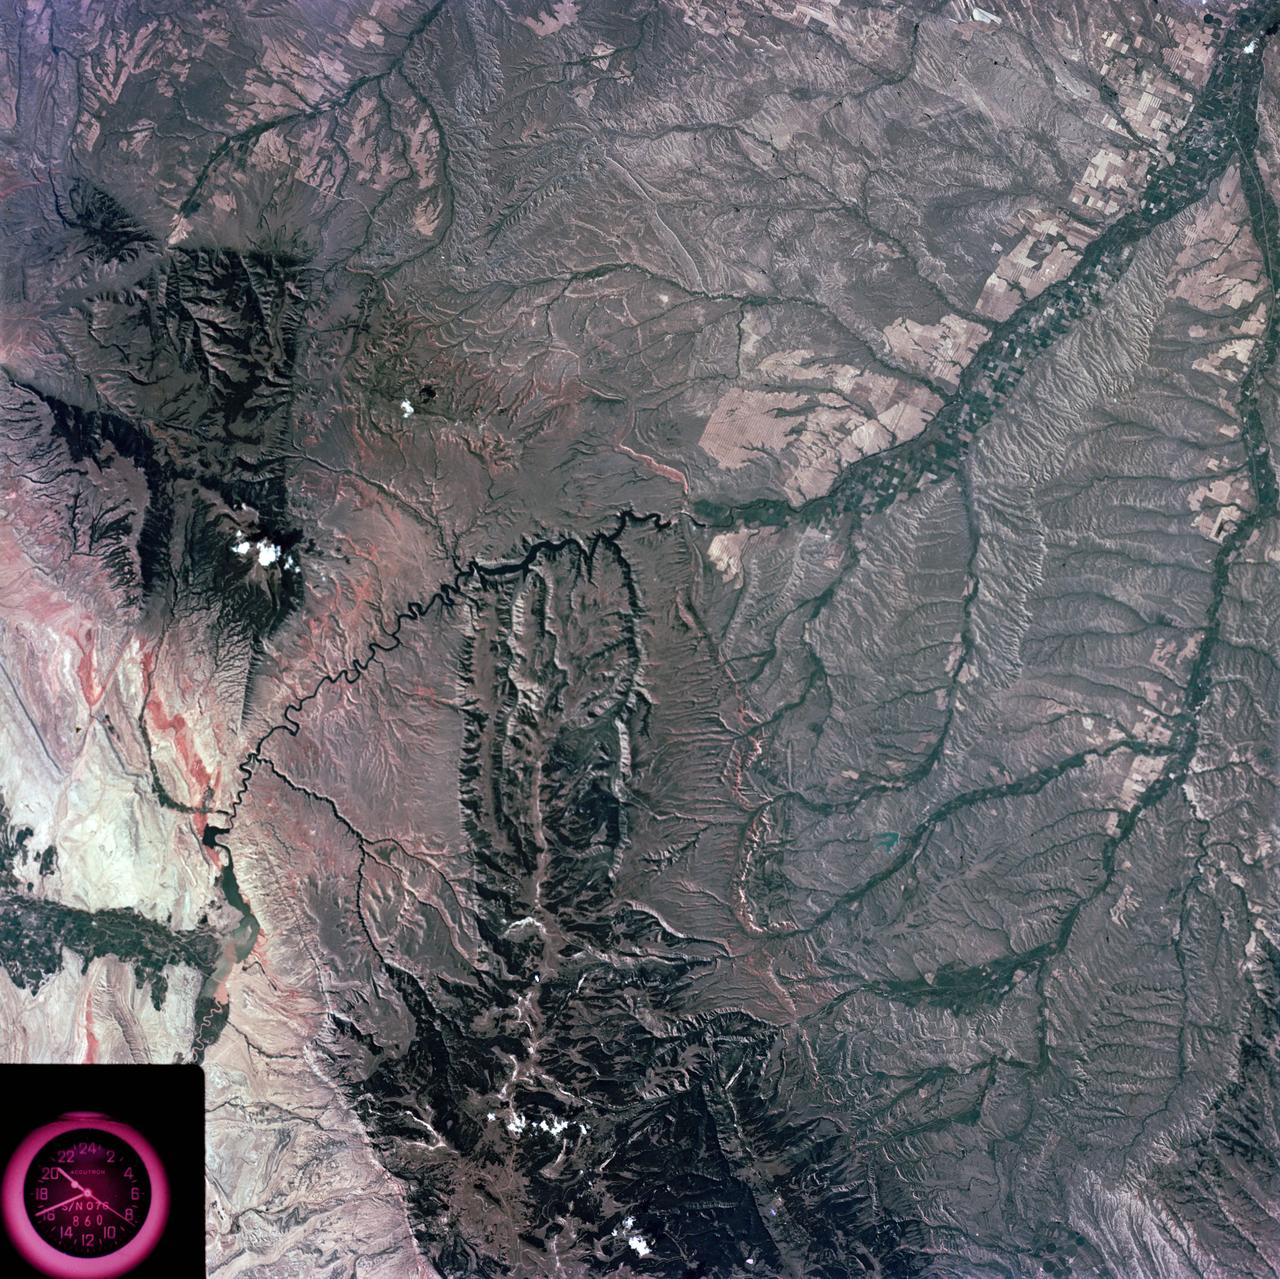
S73-35081 (July-September 1973) --- A view of approximately 3,600 square miles of north central Wyoming and southern Montana is seen in this Skylab 3 Earth Resources Experiments Package S190-B (five-inch Earth terrain camera) photograph taken from the Skylab space station in Earth orbit. The Big Horn River following northward crosses between the northwest trending Big Horn Mountains and the Pryor Mountains. Yellowtail Reservoir, named after a former chief of the Crow Indian tribe in the center of the picture is impounded by a dam across the small rectangular crop area along the Big Horn River (upper right) and the strip farming (yellow) practiced on the rolling hill along the Big Horn River and its tributaries (upper left corner and right edge). The low sun angle enhances the structural features of the mountains as well as the drainage patterns in the adjacent basins. Rock formation appears in this color photograph as they would to the eye from this altitude. The distinctive redbeds can be traced along the front of the Pryor Mountains and indicate the folding that occurred during mountain building. EREP investigators, Dr. Houston of the University of Wyoming and Dr. Hoppin of the University of Iowa, will analyze the photograph and use the results in geological mapping and mineral resource studies. Lowell, Wyoming (lower left corner) and Hardin, Montana (upper right corner) can be recognized. Federal agencies participating with NASA on the EREP project are the Departments of Agriculture, Commerce, Interior, the Environmental Protection Agency and the Corps of Engineers. All EREP photography is available to the public through the Department of Interior?s Earth Resources Observations Systems Data Center, Sioux Falls, South Dakota, 57198. (Alternate number SL3-86-337) Photo credit: NASA
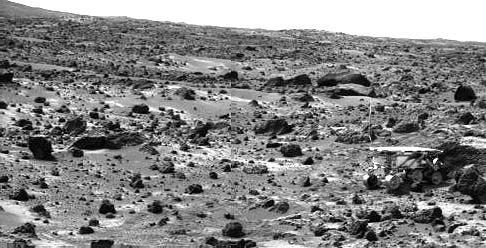
This image taken on the morning of Sol 80 (September 23) shows the Sojourner rover with its Alpha Proton X-ray Spectrometer (APXS) deployed against the rock "Chimp." On the left horizon is the rim of "Big Crater," 2.2 km away. Sojourner spent 83 days of a planned seven-day mission exploring the Martian terrain, acquiring images, and taking chemical, atmospheric and other measurements. The final data transmission received from Pathfinder was at 10:23 UTC on September 27, 1997. Although mission managers tried to restore full communications during the following five months, the successful mission was terminated on March 10, 1998. http://photojournal.jpl.nasa.gov/catalog/PIA00970

On top of Mauna Kea Volcano, Big Island of Hawai'I, are located the Mauna Kea Observatories, with thirteen telescopes. The site's 4205 m elevation, and lack of light pollution make it one of the most ideal locations for astronomical observations. Start of construction of the new Thirty Meter Telescope was delayed in July due to protests by Native Hawaiians who consider the mountain to be one of their most sacred sites. Image data for the perspective view was acquired April 23, 2019, and is located at 19.8 degrees north, 155.5 degrees west. https://photojournal.jpl.nasa.gov/catalog/PIA23339
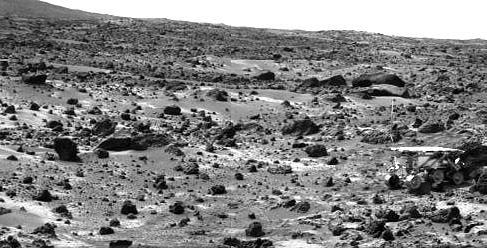
This image taken on the morning of Sol 80 (September 23, 1997) shows the Sojourner rover with its Alpha Proton X-ray Spectrometer (APXS) deployed against the rock "Chimp." On the left horizon is the rim of "Big Crater," 2.2 km away. Sojourner spent 83 days of a planned seven-day mission exploring the Martian terrain, acquiring images, and taking chemical, atmospheric and other measurements. The final data transmission received from Pathfinder was at 10:23 UTC on September 27, 1997. Although mission managers tried to restore full communications during the following five months, the successful mission was terminated on March 10, 1998. http://photojournal.jpl.nasa.gov/catalog/PIA01585
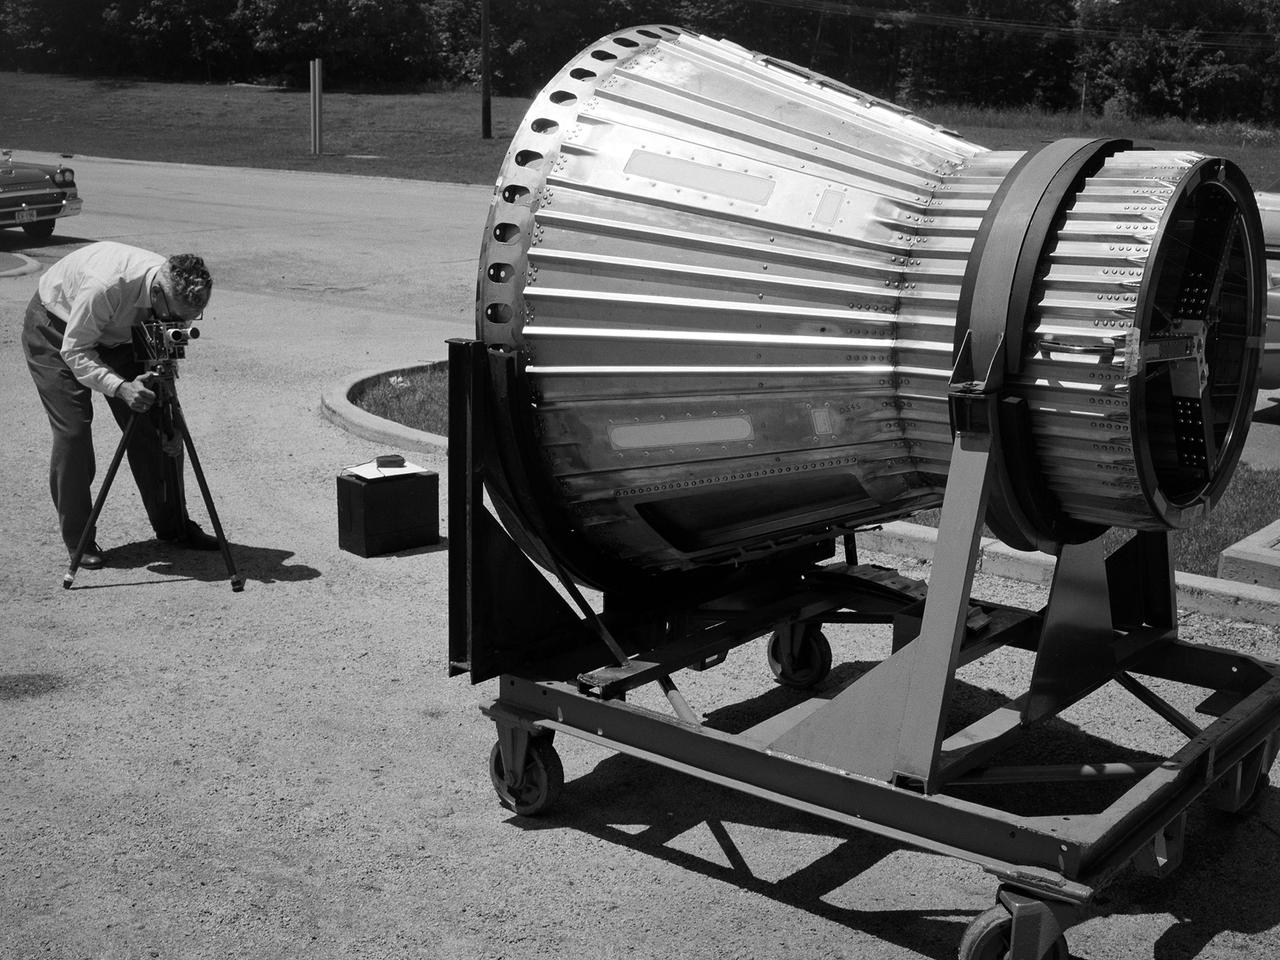
National Aeronautics and Space Administration (NASA) photographer Arthur Laufman sets up a camera to film a Mercury capsule that was constructed by the Lewis Research Center staff. Lewis engineers and mechanics built two of the capsules for the upcoming Big Joe launches in September 1959. Big Joe was an attempt early in Project Mercury to use a full-scale Atlas booster to simulate the reentry of a mock-up Mercury capsule without actually placing it in orbit. The Photographic Branch, referred to as the Photo Lab, was part of the center’s Technical Reports Division. Originally the group performed normal and high-speed still image and motion picture photography. The photographers documented construction, performed publicity work, created images for reports, photographed data on manometer boards, and recorded test footage. Laufman joined the Photo Lab staff in 1948 and began producing full-length technical films as a tool to educate those outside of the agency on the research being conducted at Lewis. He worked with engineers to determine proper subjects for these films and develop a script. Laufman not only filmed tests, but also supporting footage of facilities, models, and staff members. He then edited the footage and added audio, visuals, and narration. The film masters were assigned standard identification numbers and add to the Photo Lab’s catalogue.
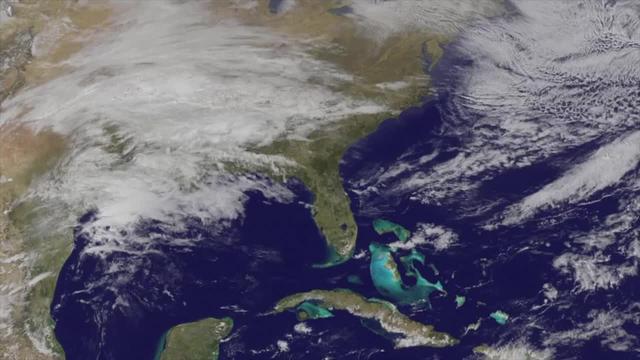
NASA and NOAA satellites are providing various views of the major winter storm marching toward the U.S. East coast on March 13. The storm is forecast to merge with another system and is expected to bring large snowfall totals from the Mid-Atlantic to New England. NASA's Aqua satellite gathered infrared data from the storm system and the area ahead of the storm for cloud and ground temperatures. NOAA's GOES-East satellite provided visible and infrared imagery that showed the extent and the movement of the system. Forecasters at the National Weather Service's Weather Prediction Center (WPC) noted that the low pressure system crossing the Midwest states and Ohio Valley is expected to merge with another low off the southeast U.S. coast. WPC stated "This will allow for a strong nor'easter to develop near the coast and cause a late-season snowstorm from the central Appalachians to New England, including many of the big cities in the Northeast U.S." Credits: NASA/NOAA GOES Project
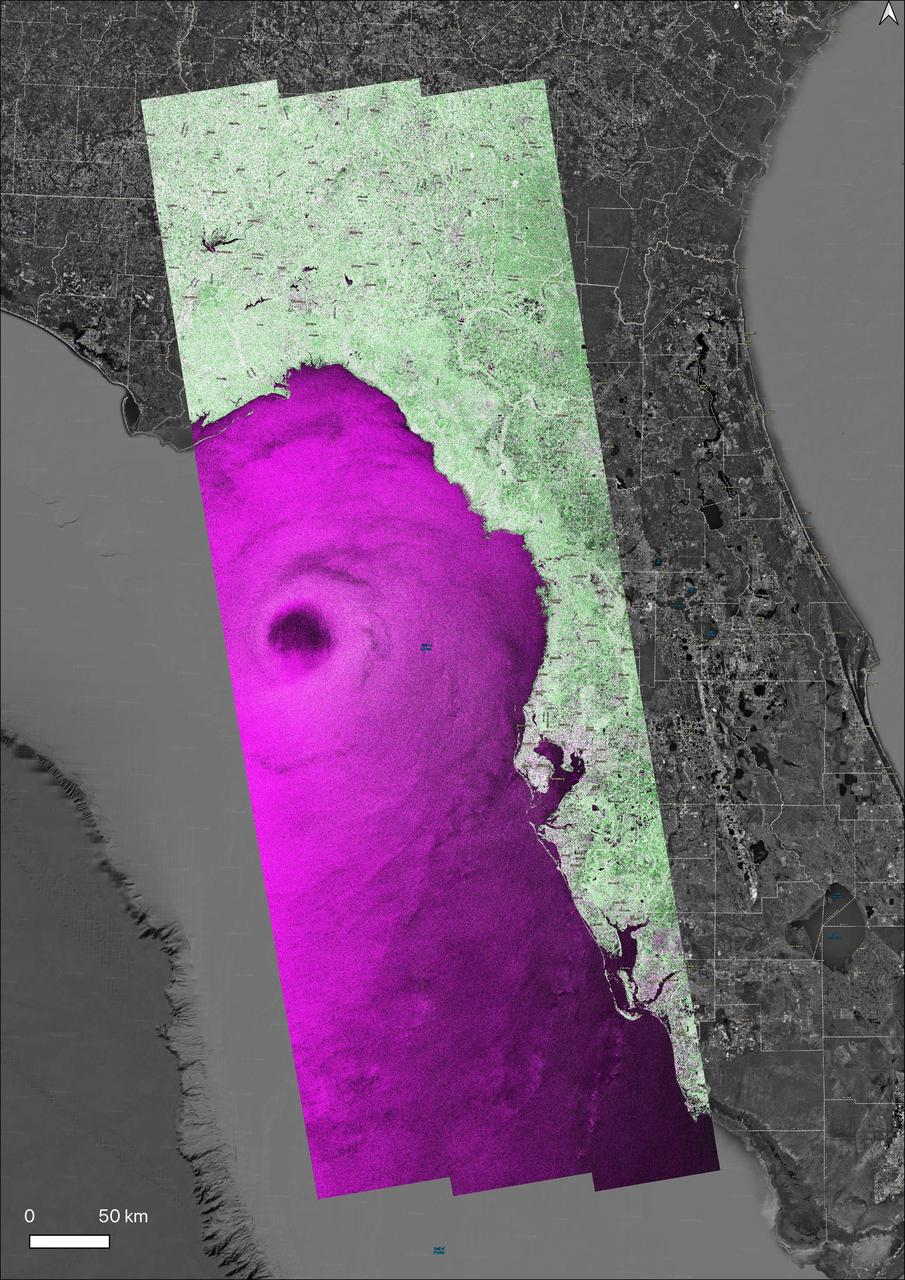
NASA's Observational Products for End-Users from Remote Sensing Analysis (OPERA) project generated a radar image of Hurricane Helene on Friday, Sept. 26, 2024, at 7:38 p.m. local time, as the storm approached the Florida coast. One of the largest storms to develop in the Gulf of Mexico in the last century, Helene made landfall as a Category 4 hurricane in the Big Bend area of Florida at about 11:10 p.m. The data shown in the image is from the synthetic aperture radar (SAR) instrument on the Copernicus Sentinel-1A satellite, operated by the European Space Agency (ESA), and processed by OPERA into a data product called OPERA RTC-S1. The OPERA RTC-S1 image was converted to a false color image. In this color scale, vegetated areas appear green, urban areas appear white/pink, calm water appears black, and rough water appears purple or magenta. The eye of the hurricane can be clearly seen as a large dark patch in the Gulf of Mexico. The OPERA RTC-S1 image was superimposed on a Google Earth satellite background shown in grayscale and the ESRI Boundaries Places layer. https://photojournal.jpl.nasa.gov/catalog/PIA26414
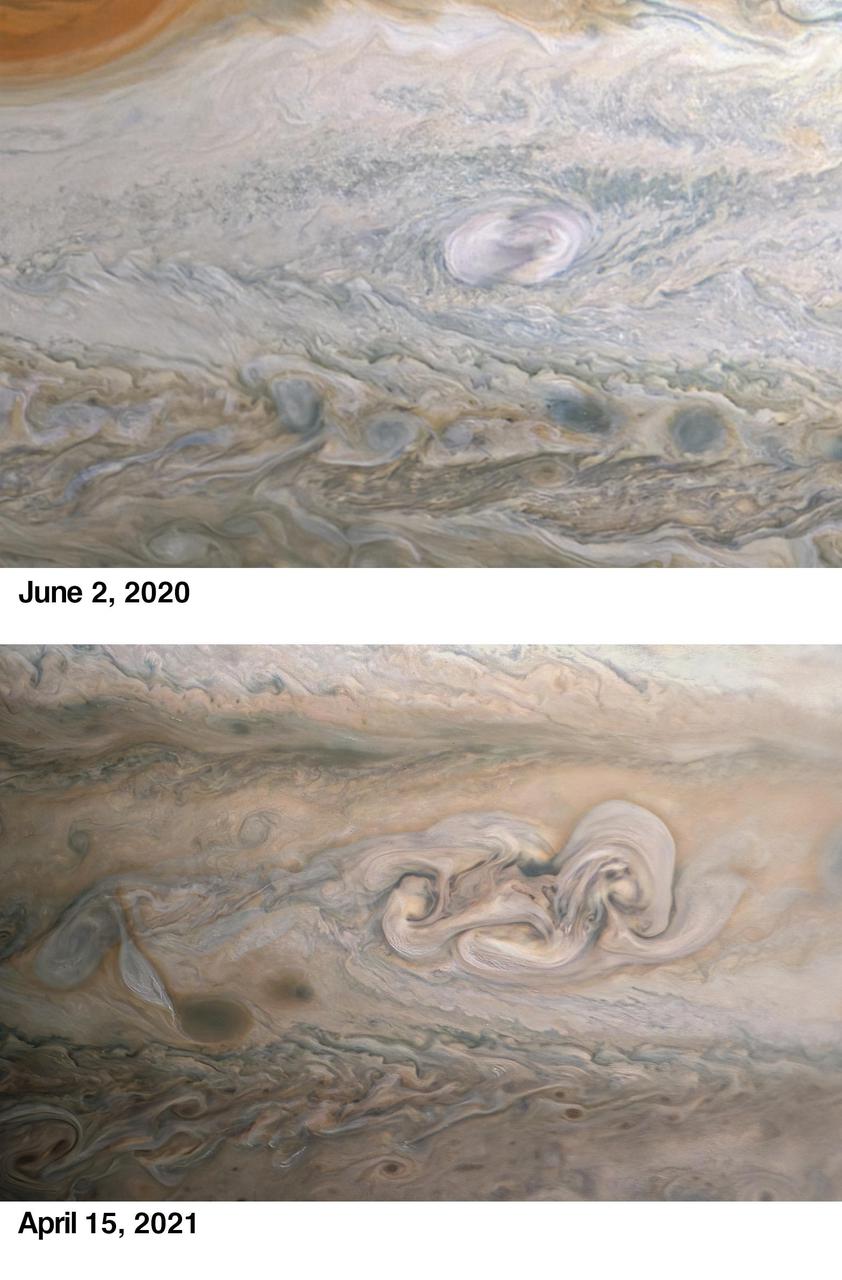
During its 33rd low pass over the cloud tops of Jupiter on April 15, 2021, NASA's Juno spacecraft captured the intriguing evolution of a feature in the giant planet's atmosphere known as "Clyde's Spot." The feature is informally named for amateur astronomer Clyde Foster of Centurion, South Africa, who discovered it in 2020 using his own 14-inch telescope. On June 2, 2020, just two days after Foster's initial discovery, Juno provided detailed observations of Clyde's Spot (upper image), which scientists determined was a plume of cloud material erupting above the top layers of the Jovian atmosphere just southeast of Jupiter's Great Red Spot, which is currently about 1.3 times as wide as Earth. These powerful convective outbreaks occasionally occur in this latitude band, known as the South Temperate Belt. The initial plume subsided quickly, and within a few weeks it was seen as a dark spot. Many features in Jupiter's highly dynamic atmosphere are short lived, but the April 2021 observation from the JunoCam instrument (lower image) revealed that nearly one year after its discovery, the remnant of Clyde's Spot had not only drifted away from the Great Red Spot but had also developed into a complex structure that scientists call a folded filamentary region. This region is twice as big in latitude and three times as big in longitude as the original spot, and has the potential to persist for an extended period of time. The upper image was taken on June 2, 2020, around 3:56 a.m. when the spacecraft was about 28,000 miles (45,000 kilometers) from Jupiter's cloud tops. The lower image was taken on April 15, 2021, at 4:58 p.m. PDT (7:58 p.m. EDT). At the time, the spacecraft was about 16,800 miles (27,000 kilometers) from Jupiter's cloud tops, at a latitude of about 30 degrees South. Another citizen scientist, Kevin M. Gill, processed both images from raw JunoCam data. https://photojournal.jpl.nasa.gov/catalog/PIA23609

On Sunday, February 3, roughly 800 million eyes from all over the world focused on the Louisiana Superdome in New Orleans as the New England Patriots battled the St. Louis Rams for the NFL Championship in Super Bowl XXXVI. This true color image of New Orleans was acquired on April 26, 2000, by the Enhanced Thematic Mapper plus (ETM+), flying aboard the Landsat 7 satellite. Lake Pontchartrain borders the city to the north. The big river winding its way east to west through the image is the Mississippi. The Louisiana Superdome, built in 1975, sits just inside the rightmost portion of the big river bend that cradles downtown New Orleans. The city, however, may not be around to hold a Super Bowl in 2102. New Orleans is slowly sinking into the Gulf of Mexico. The construction of flood walls and dams north of New Orleans over the past century have prevented sediments carried by the Mississippi River from reaching New Orleans and the Mississippi River Delta. Before the dams were built, river sediments would empty out onto the delta adding layer upon layer of new soil each year. The additional soil prevented the Gulf from subsuming the delta. Unless drastic measures are taken, the city and the delta could be awash in seawater by the end of this century. Image by Robert Simmon, based on data provided by the Landsat 7 Science Team Credit: NASA/GSFC/Landsat <b><a href="http://www.nasa.gov/centers/goddard/home/index.html" rel="nofollow">NASA Goddard Space Flight Center</a></b> enables NASA’s mission through four scientific endeavors: Earth Science, Heliophysics, Solar System Exploration, and Astrophysics. Goddard plays a leading role in NASA’s accomplishments by contributing compelling scientific knowledge to advance the Agency’s mission. <b>Follow us on <a href="http://twitter.com/NASA_GoddardPix" rel="nofollow">Twitter</a></b> <b>Join us on <a href="http://www.facebook.com/pages/Greenbelt-MD/NASA-Goddard/395013845897?ref=tsd" rel="nofollow">Facebook</a></b>

ISS038-E-023651 (26 Dec. 2013) --- Lake Sharpe near Lower Brule, South Dakota is featured in this image photographed by an Expedition 38 crew member on the International Space Station. The Missouri River rises in the Rocky Mountains of western Montana, and flows generally to the southeast for approximately 3,767 kilometers (2,341 miles) to its confluence with the Mississippi River north of St. Louis, Missouri -- making it the longest river in North America. The river does not follow a straight southeasterly course along this distance, but includes may meander bends such as illustrated in this photograph. This particular bend is occupied by Lake Sharpe, an approximately 130-kilometer (80 miles) long reservoir formed behind the Big Bend Dam on the Missouri River. The lake surface is frozen and covered with snow, presenting a uniform white appearance in the image. As meander bends develop, they tend to assume a distinctive U-shape when viewed from above. Over time, the river channel can continue to cut into the ends of the "U", eventually bringing them so close together that the river then cuts across the gap to achieve a shorter flow path, essentially short-circuiting or cutting off the meander bend. When this happens and the meander ceases to be part of the active river channel, it may become an oxbow lake. The distance across the narrow neck of land (lower right) associated with this meander near Lower Brule, South Dakota is approximately one kilometer (0.62 miles); however, as the river flow is controlled by the Big Bend Dam downstream, the natural process of meander cutoff has been significantly slowed. The snow cover also highlights circular agricultural fields on the small peninsula within the meander bend. This type of field indicates center-pivot irrigation, where water is distributed from a central point radially outwards using sprinklers to cover the field area. Crops grown here include corn and soybeans according to data from the US Department of Agriculture's CropScape database.
This single frame from a four-frame movie shows New Horizons' final deep search for hazardous material around Pluto, obtained on July 1, 2015. These data allow a highly sensitive search for any new moons. The images were taken with the spacecraft's Long Range Reconnaissance Imager (LORRI) over a 100-minute period, and were the final observations in the series of dedicated searches for hazards in the Pluto system which began on May 11. The images show all five known satellites of Pluto moving in their orbits around the dwarf planet, but analysis of these data has so far not revealed the existence of any additional moons. This means that any undiscovered Plutonian moons further than a few thousand miles from Pluto must be smaller than about 1 mile (1.6 kilometers) in diameter, if their surfaces have similar brightness to Pluto's big moon Charon. For comparison, Pluto's faintest known moon, Styx, which is conspicuous in the lower left quadrant of these images, is about 4 miles (7 kilometers) across, assuming the same surface brightness. The absence of additional moons, and also the absence of detectable rings in the hazard search data, imply that the spacecraft is very unlikely to be damaged by collisions with rings, or dust particles ejected from moons, during its high-speed passage through the Pluto system. The four movie frames were taken at 16:28, 16:38, 17:52, and 18:04 UTC on July 1, from a range of 9.4 million miles (15.2 million kilometers). Each frame is a mosaic of four sets of overlapping images, with a total exposure time of 120 seconds. The images have been heavily processed to remove the glare of Pluto and Charon, and the dense background of stars, though blemishes remain at the locations of many of the brighter stars. The "tails" extending to the right or downward from Pluto and Charon are camera artifacts caused by the extreme overexposure of both objects. Pluto and its five moons Charon, Styx, Nix, Kerberos and Hydra are identified by their initials, and their orbits around the center of gravity of the system (which is located just outside Pluto itself) are also shown. http://photojournal.jpl.nasa.gov/catalog/PIA19701
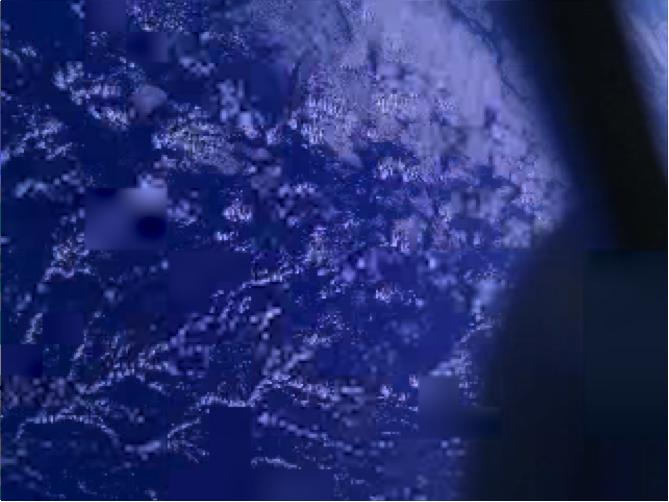
These images of Earth were reconstructed from photos taken by three smartphones in orbit, or "PhoneSats." The trio of PhoneSats launched on April 21, 2013, aboard the Antares rocket from NASA's Wallops Flight Facility and ended a successful mission on April 27. The ultimate goal of the PhoneSat mission was to determine whether a consumer-grade smartphone can be used as the main flight avionics for a satellite in space. During their time in orbit, the three miniature satellites used their smartphone cameras to take pictures of Earth and transmitted these "image-data packets" to multiple ground stations. Every packet held a small piece of the big picture. As the data became available, the PhoneSat Team and multiple amateur radio operators around the world collaborated to piece together photographs from the tiny data packets. Read more: <a href="http://1.usa.gov/ZsWnQG" rel="nofollow">1.usa.gov/ZsWnQG</a> Credit: NASA/Ames <b><a href="http://www.nasa.gov/audience/formedia/features/MP_Photo_Guidelines.html" rel="nofollow">NASA image use policy.</a></b> <b><a href="http://www.nasa.gov/centers/goddard/home/index.html" rel="nofollow">NASA Goddard Space Flight Center</a></b> enables NASA’s mission through four scientific endeavors: Earth Science, Heliophysics, Solar System Exploration, and Astrophysics. Goddard plays a leading role in NASA’s accomplishments by contributing compelling scientific knowledge to advance the Agency’s mission. <b>Follow us on <a href="http://twitter.com/NASA_GoddardPix" rel="nofollow">Twitter</a></b> <b>Like us on <a href="http://www.facebook.com/pages/Greenbelt-MD/NASA-Goddard/395013845897?ref=tsd" rel="nofollow">Facebook</a></b> <b>Find us on <a href="http://instagram.com/nasagoddard?vm=grid" rel="nofollow">Instagram</a></b>
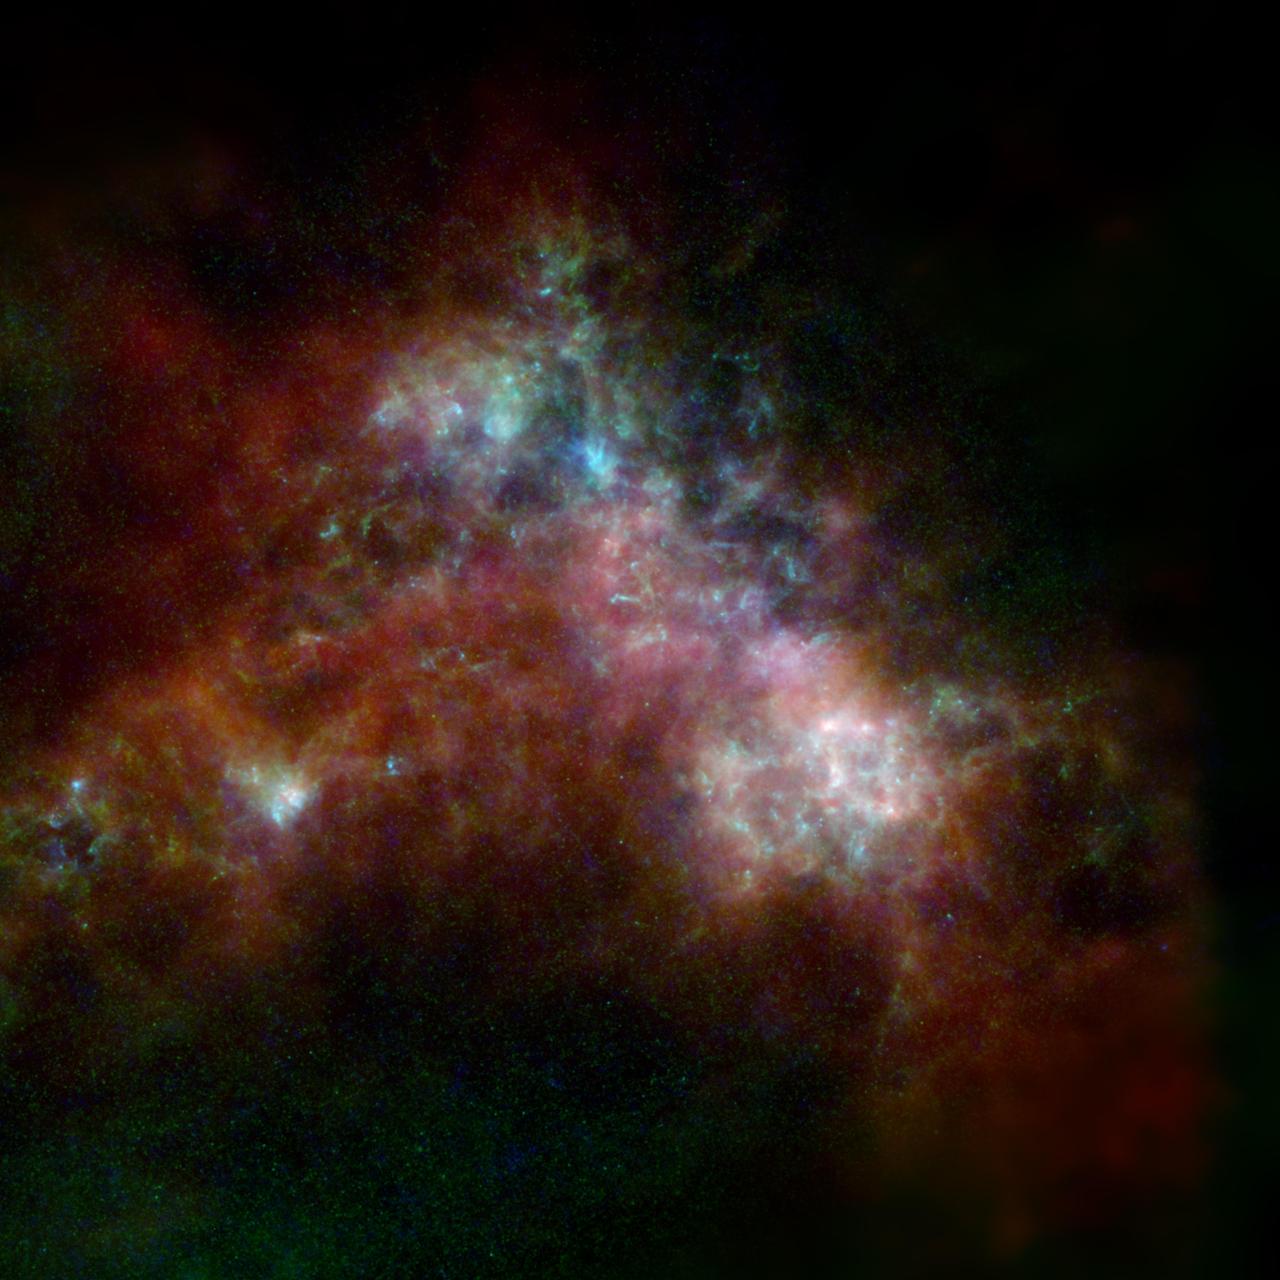
The Small Magellanic Cloud, shown here, is a dwarf galaxy orbiting the Milky Way. The image includes data from the ESA (European Space Agency) Herschel mission, supplemented with data from ESA's retired Planck observatory and two retired NASA missions: the Infrared Astronomical Satellite (IRAS) and Cosmic Background Explorer (COBE). Operated from 2009 to 2013, Herschel detected wavelengths of light in the far-infrared and microwave ranges, and was ideal for studying dust in nearby galaxies because it could capture small-scale structures in the dust clouds in high resolution. However, Herschel often couldn't detect light from diffuse dust clouds – especially in the outer regions of galaxies, where the gas and dust become sparse and thus fainter. As a result, the mission missed up to 30% of all the light given off by dust. Combining the Herschel observations with data from other observatories creates a more complete picture of the dust in the galaxy. In the image, red indicates hydrogen gas; green indicates cold dust; and warmer dust is shown in blue. Launched in 1983, IRAS was the first space telescope to detect infrared light, setting the stage for future observatories like NASA's Spitzer Space Telescope and James Webb Space Telescope. The Planck observatory, launched in 2009, and COBE, launched in 1989, both studied the cosmic microwave background, or light left over from the big bang. The hydrogen gas was detected using the Parkes Radio Telescope and the Australia Compact Telescope Array, located in Australia and managed by the Commonwealth Scientific and Industrial Research Organisation (CSIRO); and the NANTEN2 Observatory in the Atacama Desert in Chile. https://photojournal.jpl.nasa.gov/catalog/PIA25164
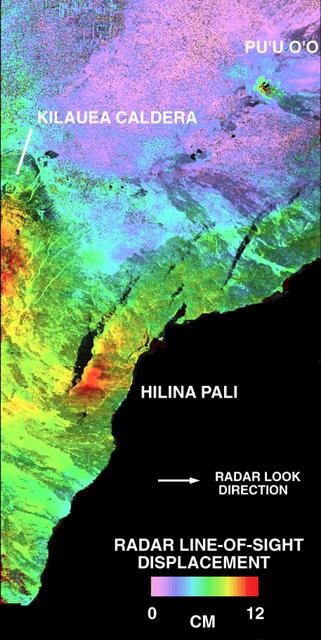
This is a deformation map of the south flank of Kilauea volcano on the big island of Hawaii, centered at 19.5 degrees north latitude and 155.25 degrees west longitude. The map was created by combining interferometric radar data -- that is data acquired on different passes of the space shuttle which are then overlayed to obtain elevation information -- acquired by the Spaceborne Imaging Radar-C/X-band Synthetic Aperture Radar during its first flight in April 1994 and its second flight in October 1994. The area shown is approximately 40 kilometers by 80 kilometers (25 miles by 50 miles). North is toward the upper left of the image. The colors indicate the displacement of the surface in the direction that the radar instrument was pointed (toward the right of the image) in the six months between images. The analysis of ground movement is preliminary, but appears consistent with the motions detected by the Global Positioning System ground receivers that have been used over the past five years. The south flank of the Kilauea volcano is among the most rapidly deforming terrains on Earth. Several regions show motions over the six-month time period. Most obvious is at the base of Hilina Pali, where 10 centimeters (4 inches) or more of crustal deformation can be seen in a concentrated area near the coastline. On a more localized scale, the currently active Pu'u O'o summit also shows about 10 centimeters (4 inches) of change near the vent area. Finally, there are indications of additional movement along the upper southwest rift zone, just below the Kilauea caldera in the image. Deformation of the south flank is believed to be the result of movements along faults deep beneath the surface of the volcano, as well as injections of magma, or molten rock, into the volcano's "plumbing" system. Detection of ground motions from space has proven to be a unique capability of imaging radar technology. Scientists hope to use deformation data acquired by SIR-C/X-SAR and future imaging radar missions to help in better understanding the processes responsible for volcanic eruptions and earthquakes. http://photojournal.jpl.nasa.gov/catalog/PIA01758

This image of the Andromeda galaxy, or M31, includes data from the ESA (European Space Agency) Herschel mission, supplemented with data from ESA's retired Planck observatory and two retired NASA missions: the Infrared Astronomical Satellite (IRAS) and Cosmic Background Explorer (COBE). Operated from 2009 to 2013, Herschel detected wavelengths of light in the far-infrared and microwave ranges, and was ideal for studying dust in nearby galaxies because it could capture small-scale structures in the dust clouds in high resolution. However, Herschel often couldn't detect light from diffuse dust clouds – especially in the outer regions of galaxies, where the gas and dust become sparse and thus fainter. As a result, the mission missed up to 30% of all the light given off by dust. Combining the Herschel observations with data from other observatories creates a more complete picture of the dust in the galaxy. In the image, red indicates hydrogen gas; green indicates cold dust; and warmer dust is shown in blue. Launched in 1983, IRAS was the first space telescope to detect infrared light, setting the stage for future observatories like NASA's Spitzer Space Telescope and James Webb Space Telescope. The Planck observatory, launched in 2009, and COBE, launched in 1989, both studied the cosmic microwave background, or light left over from the big bang. Red indicates hydrogen gas detected using the Green Bank Telescope in West Virginia, the Westerbork Synthesis Radio Telescope in the Netherlands, and the Institute for Radio Astronomy in the Millimeter Range 30-meter telescope in Spain. https://photojournal.jpl.nasa.gov/catalog/PIA25163
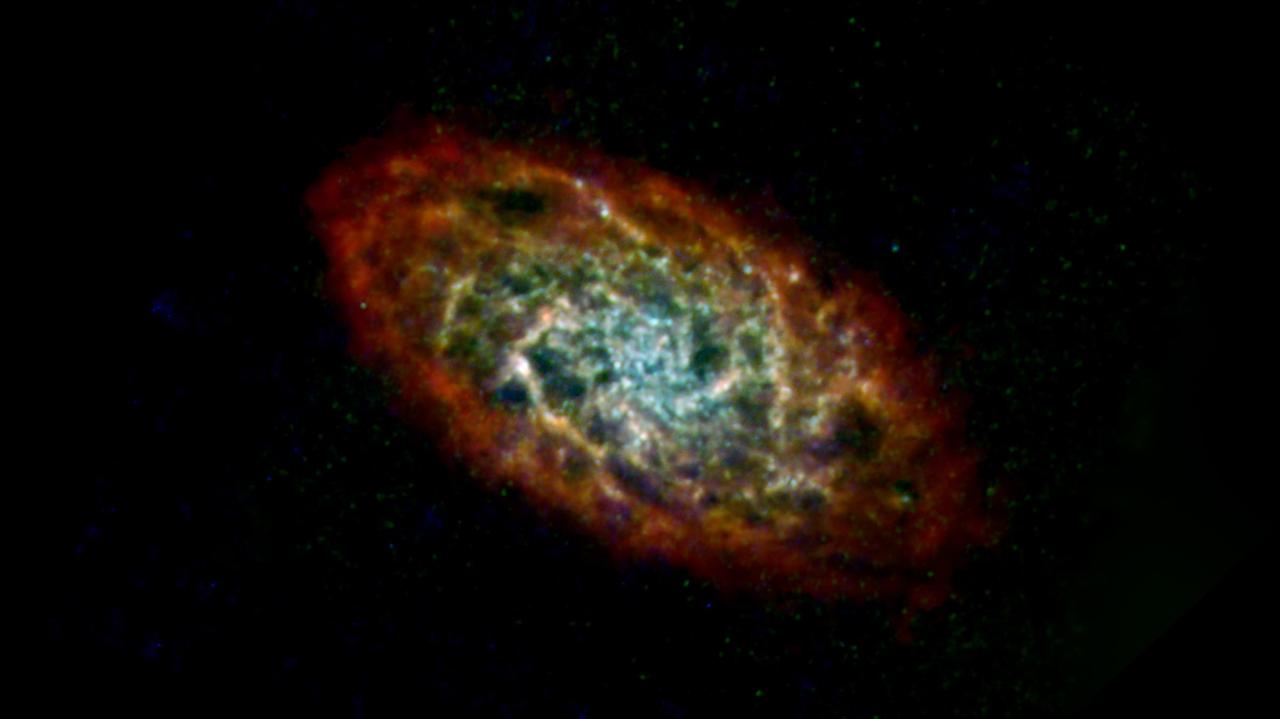
This image of the Triangulum galaxy, or M33, includes data from the ESA (European Space Agency) Herschel mission, supplemented with data from ESA's retired Planck observatory and two retired NASA missions: the Infrared Astronomical Satellite (IRAS) and Cosmic Background Explorer (COBE). Operated from 2009 to 2013, Herschel detected wavelengths of light in the far-infrared and microwave ranges, and was ideal for studying dust in nearby galaxies because it could capture small-scale structures in the dust clouds in high resolution. However, Herschel often couldn't detect light from diffuse dust clouds – especially in the outer regions of galaxies, where the gas and dust become sparse and thus fainter. As a result, the mission missed up to 30% of all the light given off by dust. Combining the Herschel observations with data from other observatories creates a more complete picture of the dust in the galaxy. In the image, red indicates hydrogen gas; green indicates cold dust; and warmer dust is shown in blue. Launched in 1983, IRAS was the first space telescope to detect infrared light, setting the stage for future observatories like NASA's Spitzer Space Telescope and James Webb Space Telescope. The Planck observatory, launched in 2009, and COBE, launched in 1989, both studied the cosmic microwave background, or light left over from the big bang. The hydrogen gas was detected using the Green Bank Telescope in West Virginia, the Karl G. Jansky Very Large Array in New Mexico, and the Institute for Radio Astronomy in the Millimeter Range 30-meter telescope in Spain. https://photojournal.jpl.nasa.gov/catalog/PIA25165
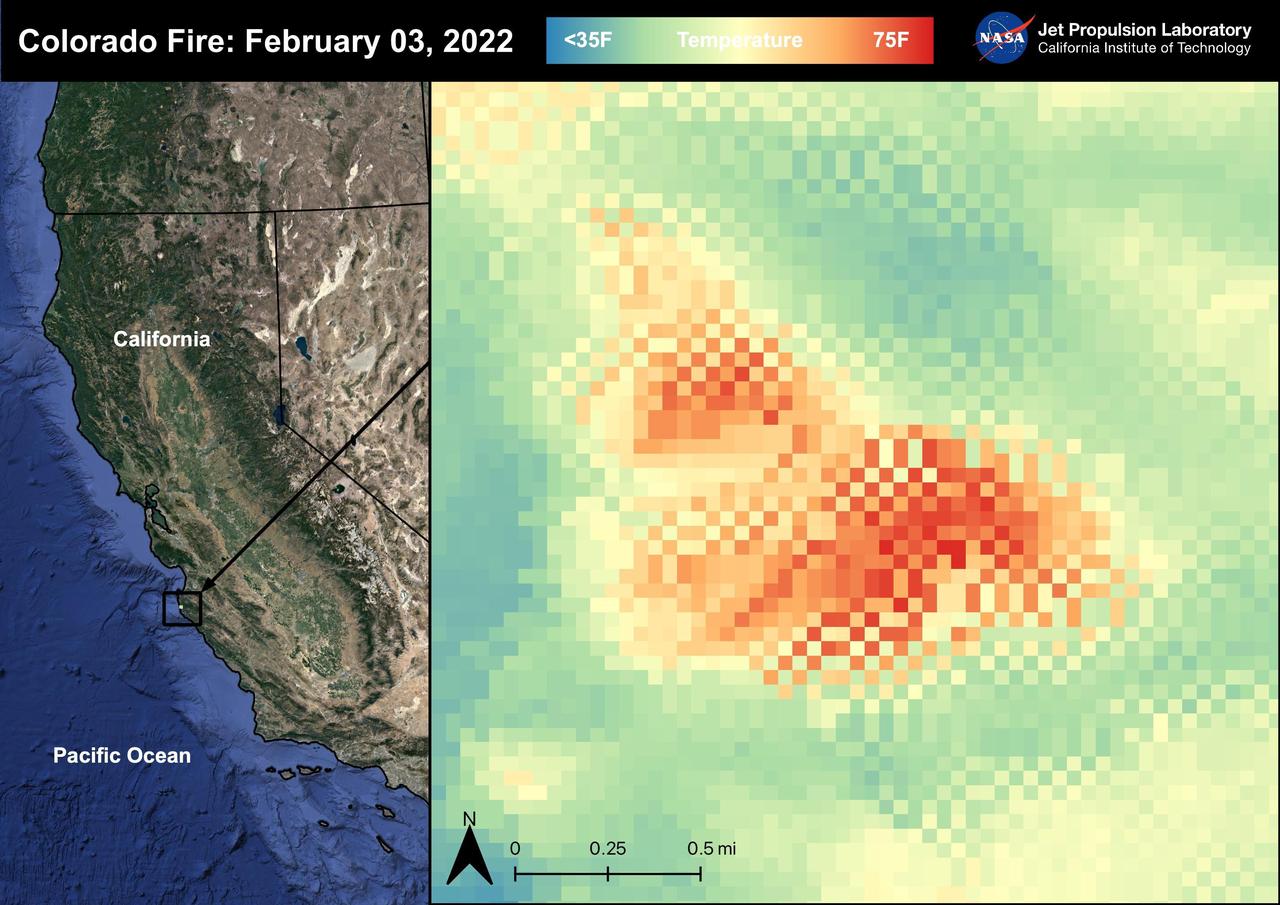
The Colorado Fire began on January 21st, 2022 was started by an escaped fire by the Palo Colorado Road. The wildfire burned 687 acres between Carmel-by-the-Sea and Big Sur. The Colorado Fire was driven towards the coast by strong winds leading to the shut down of the Bixby Bridge and a section of Highway 1. The fire was completely contained as of February 5th, 2022. No injuries or causalities have been reported; one structure was destroyed. The image above shows the fire captured in a Land Surface Temperature image from ECOSTRESS on February 3rd, 2022 at 01:11 PM PDT. As California is currently in a drought, there are concerns that 2022 will see a severe wildfire season; ECOSTRESS allows for the monitoring of the drought and of wildfires. ECOSTRESS is a thermal instrument on the International Space Station that measures the temperature of the ground, which is hotter than the air temperature during the day. It was launched to the space station in 2018. Its primary mission is to identify critical thresholds of water use and water stress in plants and to detect the timing, location, and predictive factors leading to plant water uptake decline and/or cessation. The nature of the high-resolution data provided by ECOSTRESS allows it to record heat related phenomena such as heat waves, droughts and wildfires. https://photojournal.jpl.nasa.gov/catalog/PIA25280

Data from NASA's ECOSTRESS (Ecosystem Spaceborne Thermal Radiometer Experiment on Space Station) instrument aboard the International Space Station shows three wildfires burning in the mountains east and southeast of the Los Angeles area on Sept. 10, 2024. The Bridge Fire started Sept. 8 in the Angeles National Forest during an intense heat wave that blanketed the area for about a week. As of Sept. 13, the fire was only 3% contained. The Line Fire started Sept. 5 in Highland, within San Bernardino County, and spread toward the mountain communities of Running Springs and Big Bear. After more than a week of battling the blaze, firefighters had the conflagration 21% contained. The Airport Fire ignited Sept. 9 in the foothills of the Santa Ana Mountains east of the Orange County city of Irvine and spread into Riverside County. As of Sept. 13, it was 8% contained. The ECOSTRESS instrument measures the temperature of the land rather than air temperatures that most people are familiar with in weather forecasts. Bright white spots in the active fire areas in the visual above indicate a land surface temperature of over 300 degrees Fahrenheit (149 degrees Celsius). Dark red represents areas closer to 100 F (38 C). https://photojournal.jpl.nasa.gov/catalog/PIA26187
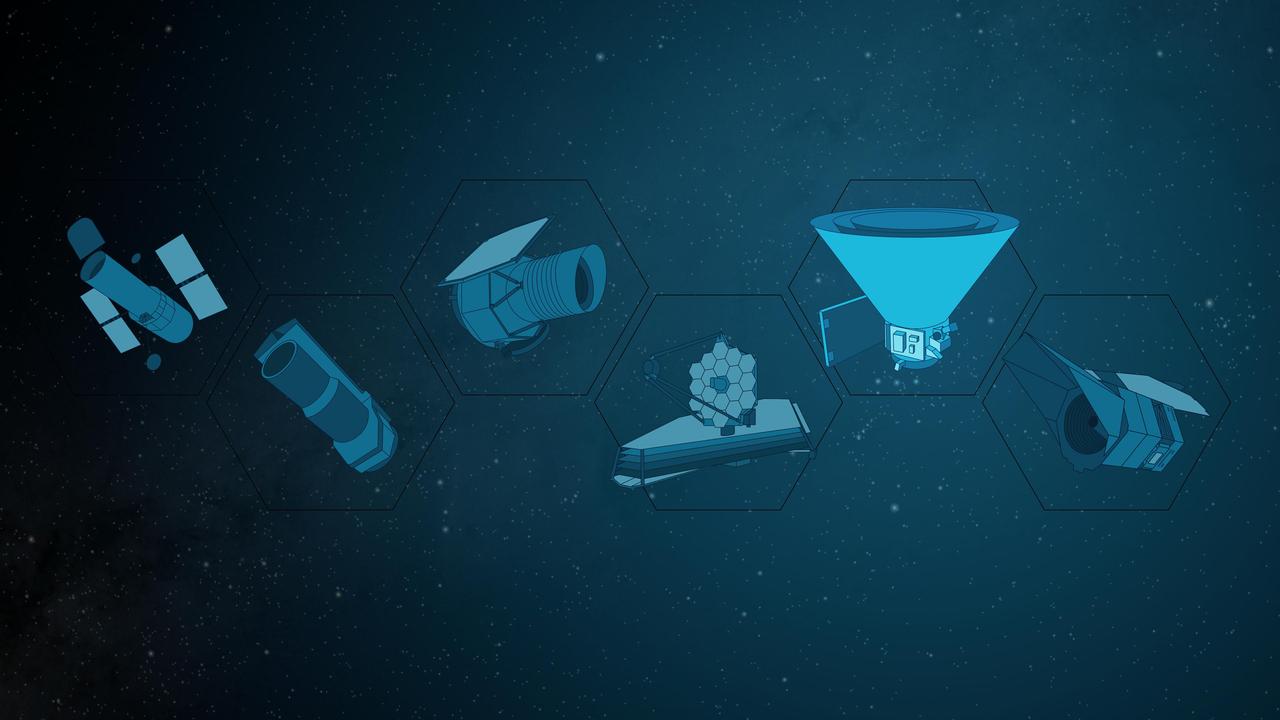
In this illustration, NASA's SPHEREx mission is highlighted among a line of other NASA space telescopes. The mission will survey the entire sky using spectroscopy, detecting hundreds of millions of stars and galaxies and generating a valuable data set that will complement the work of other NASA observatories such as those depicted here. Shown from left to right (and not to scale) are: Hubble Space Telescope, launched in April 1990 Spitzer Space Telescope, launch in August 2003 WISE (Wide-Field Infrared Survey Explorer), launched in December 2009 James Webb Space Telescope, launched in December 2021 SPHEREx (Spectro-Photometer for the History of the Universe, Epoch of Reionization and Ices Explorer), targeted for launch in February 2025 Nancy Grace Roman Space Telescope, targeted for launch by May 2027 The SPHEREx observatory will image the entire sky in 102 colors (each an individual wavelength of light) to help scientists answer big-picture questions about the origins of our universe, galaxies, and key ingredients for life in our galaxy, such as water. https://photojournal.jpl.nasa.gov/catalog/PIA26535
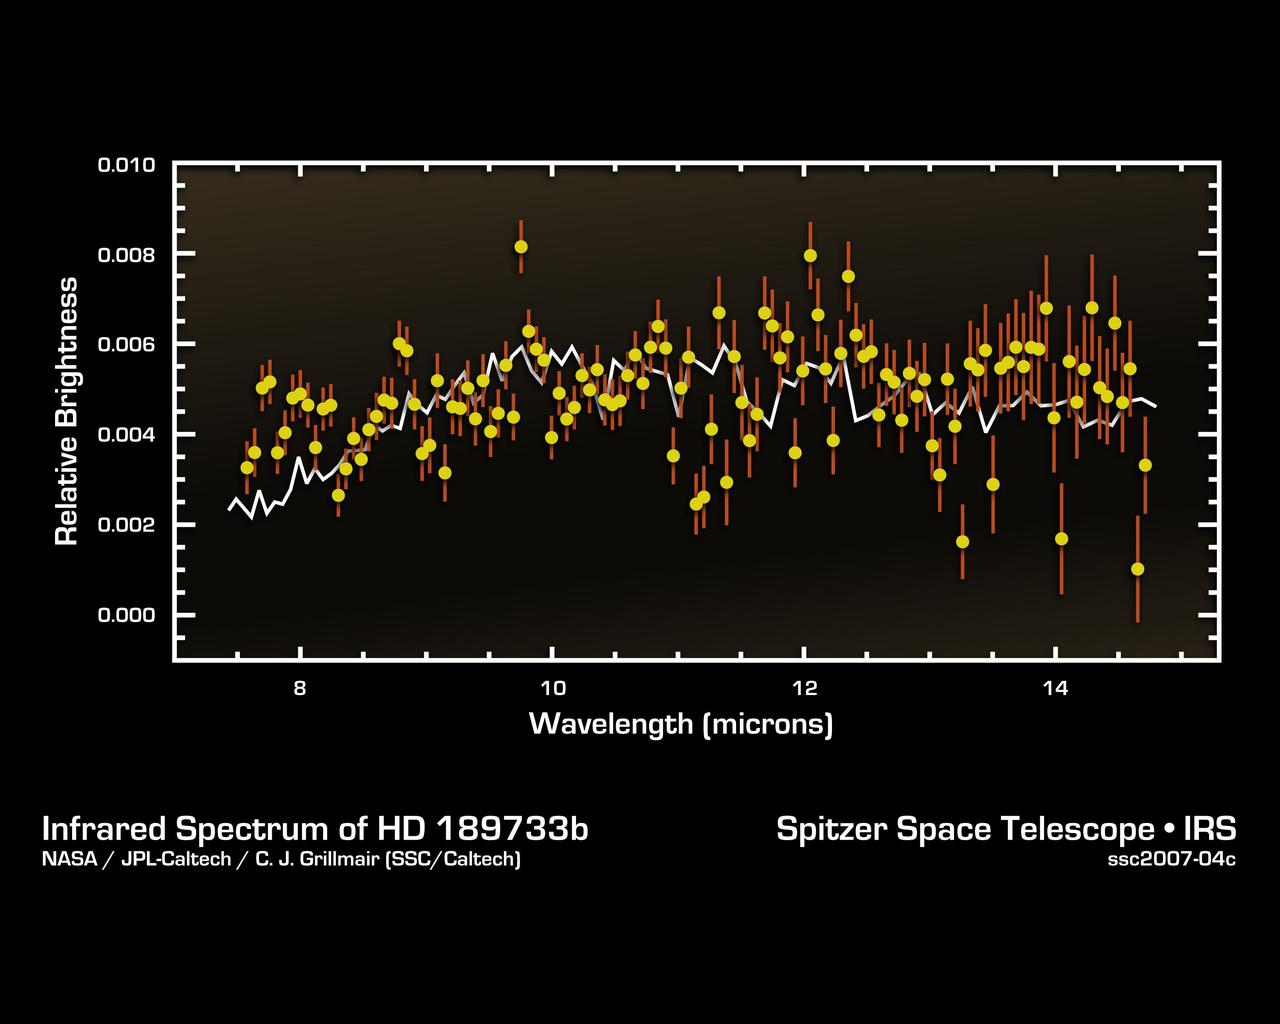
This infrared data from NASA's Spitzer Space Telescope -- called a spectrum -- tells astronomers that a distant gas planet, a so-called "hot Jupiter" called HD 189733b, might be smothered with high clouds. It is one of the first spectra of an alien world. A spectrum is created when an instrument called a spectrograph cracks light from an object open into a rainbow of different wavelengths. Patterns or ripples within the spectrum indicate the presence, or absence, of molecules making up the object. Astronomers using Spitzer's spectrograph were able to obtain infrared spectra for two so-called "transiting" hot-Jupiter planets using the "secondary eclipse" technique. In this method, the spectrograph first collects the combined infrared light from the planet plus its star, then, as the planet is eclipsed by the star, the infrared light of just the star. Subtracting the latter from the former reveals the planet's own rainbow of infrared colors. Astronomers were perplexed when they first saw the infrared spectrum above. It doesn't look anything like what theorists had predicted. Theorists thought the spectra of hot, Jupiter-like planets like this one would be filled with the signatures of molecules in the planets' atmospheres. But the spectrum doesn't show any molecules, and is instead what astronomers call "flat." For example, theorists thought there'd be a strong signature of water in the form of a big drop in the wavelength range between 7 and 10 microns. The fact that water is not detected may indicate that it is hidden underneath a thick blanket of high, dry clouds. The average brightness of the spectrum is also a bit lower than theoretical predictions, suggesting that very high winds are rapidly moving the terrific heat of the noonday sun from the day side of HD 189733b to the night side. This spectrum was produced by Dr. Carl Grillmair of NASA's Spitzer Science Center at the California Institute of Technology in Pasadena, Calif., and his colleagues. The data were taken by Spitzer's infrared spectrograph on November 22, 2006. http://photojournal.jpl.nasa.gov/catalog/PIA09199
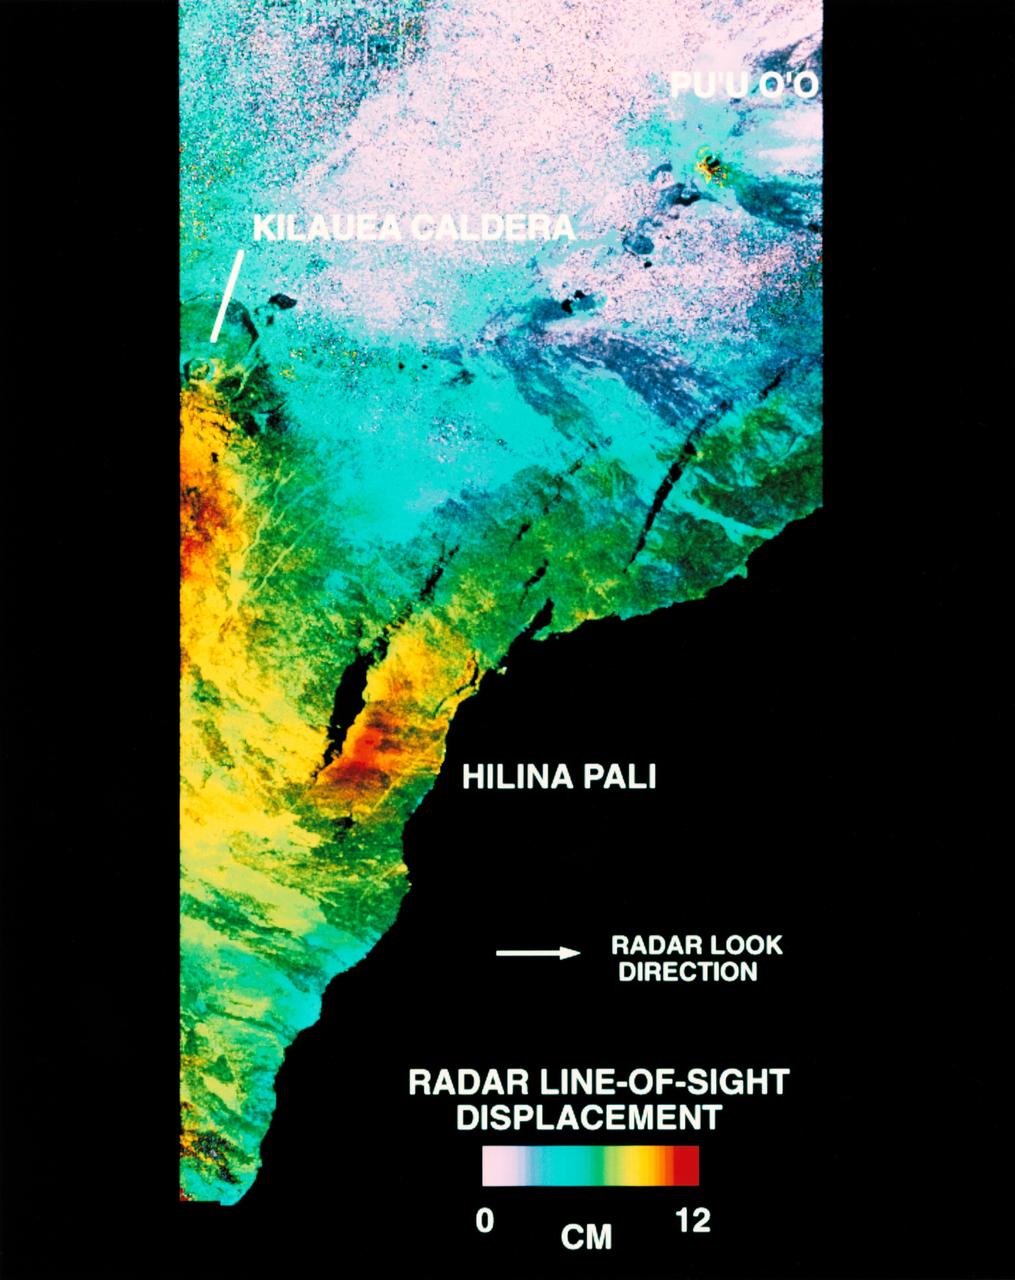
STS068-S-054 (10 October 1994) --- This is a deformation map of the south flank of Kilauea volcano on the big island of Hawaii, centered at 19.5 degrees north latitude and 155.25 degrees west longitude. The map was created by combining interferometric radar data - that is data acquired on different passes of the Space Shuttle Endeavour which are then overlaid to obtain elevation information - acquired by the Spaceborne Imaging Radar-C/X-Band Synthetic Aperture Radar (SIR-C/X-SAR) during its first flight in April 1994 and its second flight in October 1994. The area shown is approximately 40 by 80 kilometers (25 by 50 miles). North is toward the upper left of the image. The colors indicate the displacement of the surface in that direction that the radar instrument was pointed (toward the right of the image) in the six months between images. The analysis of ground movement is preliminary, but appears consistent with the motions detected by the Global Positioning System ground receivers that have been used over the past five years. The south flank of the Kilauea volcano is among the most rapidly deforming terrain's on Earth. Several regions show motion over the six-month time period. Most obvious is at the base of Hilina Pali, where 10 centimeters (4 inches) or more of crustal deformation can be seen in a concentrated area near the coastline. On a more localized scale, the currently active Pu'u O'o summit also shows about 10 centimeters (4 inches) of change near the vent area. Finally, there are indications of additional movement along the upper southwest rift zone, just below the Kilauea caldera in the image. Deformation of the south flank is believed to be the result of movements along faults deep beneath the surface of the volcano, as well as injections of magma, or molten rock, into the volcano's "plumbing" system. Detection of ground motions from space has proven to be a unique capability of imaging radar technology. Scientists hope to use deformation data acquired by SIR-C/X-SAR and future imaging radar missions to help in better understanding the processes responsible for volcanic eruptions and earthquakes. Spaceborne Imaging Radar-C/X-Band Synthetic Aperture Radar (SIR-C/X-SAR) is part of NASA's Mission to Planet Earth. (P-44753)
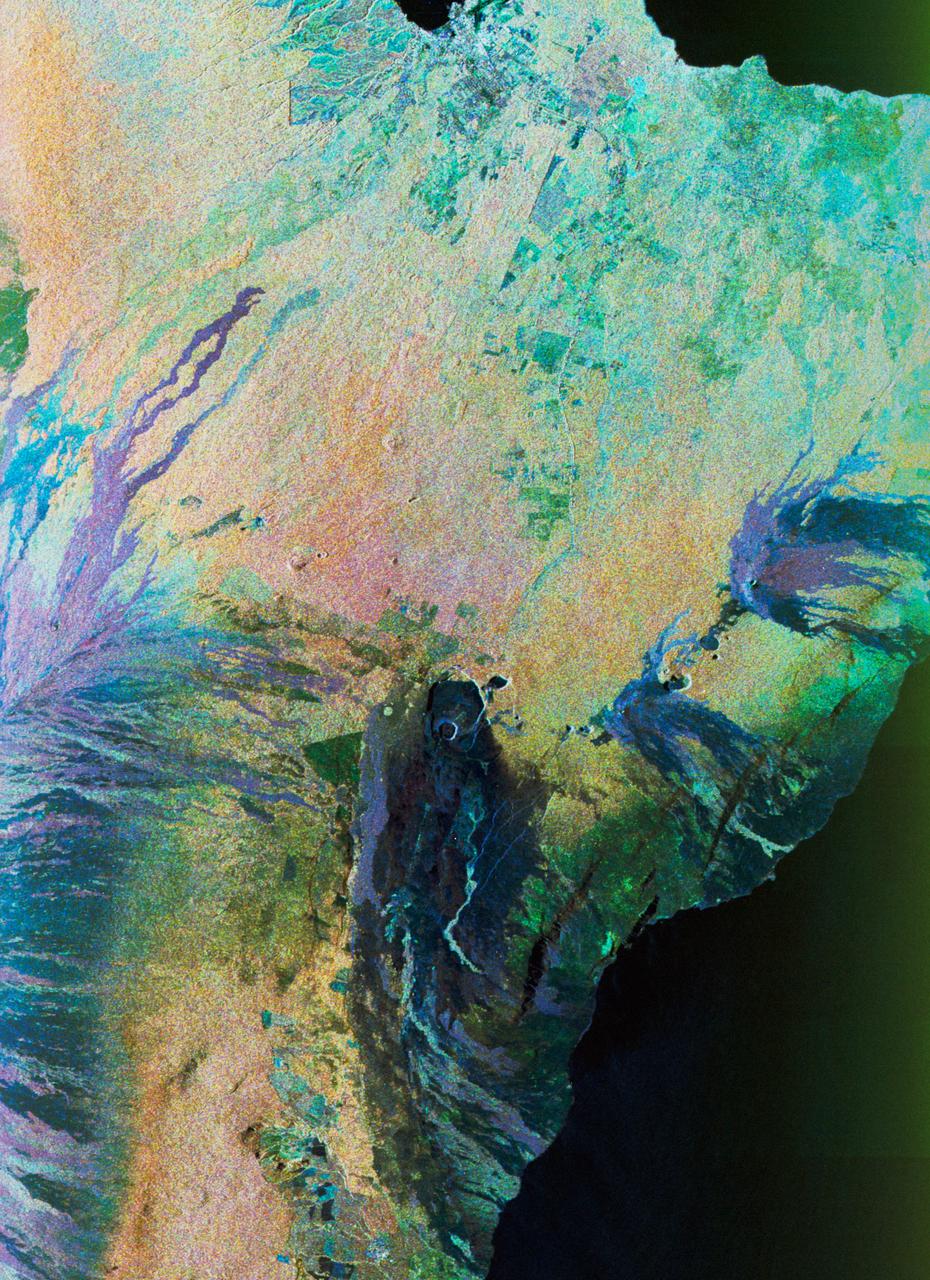
STS059-S-074 (15 April 1994) --- This color composite C-Band and L-Band image of the Kilauea volcano on the big island of Hawaii was acquired by the Spaceborne Imaging Radar-C and X-Band Synthetic Aperture Radar (SIR-C/X-SAR) flying on the Space Shuttle Endeavour. The city of Hilo can be seen at the top. The image shows the different types of lava flows around the crater Pu'u O'o. Ash deposits which erupted in 1790 from the summit of Kilauea volcano show up as dark in this image, and fine details associated with lava flows which erupted in 1919 and 1974 can be seen to the south of the summit in an area called the Ka'u Desert. In addition, the other historic lava flows created in 1881 and 1984 from Mauna Loa volcano (out of view to the left of this image) can easily be seen despite the fact that the surrounding area is covered by forest. Such information will be used to map the extent of such flows, which can pose a hazard to the subdivisions of Hilo. Highway 11 is the linear feature running from Hilo to the Kilauea volcano. The Kilauea volcano has been almost continuously active for more than the last 11 years. Field teams that were on the ground specifically to support these radar observations report that there was vigorous surface activity about 400 meters (one-quarter mile) inland from the coast. A moving lava flow about 200 meters (660 feet) in length was observed at the time of the Shuttle over flight, raising the possibility that subsequent images taken during this mission will show changes in the landscape. SIR-C/X-SAR is part of NASA's Mission to Planet Earth (MTPE). SIR-C/X-SAR radars illuminate Earth with microwaves allowing detailed observations at any time, regardless of weather or sunlight conditions. SIR-C/X-SAR uses three microwave wavelengths: L-Band (24 cm), C-Band (6 cm), and X-Band (3 cm). The multi-frequency data will be used by the international scientific community to better understand the global environment and how it is changing. The SIR-C/X-SAR data, complemented by aircraft and ground studies, will give scientists clearer insights into those environmental changes which are caused by nature and those changes which are induced by human activity. SIR-C was developed by NASA's Jet Propulsion Laboratory (JPL). X-SAR was developed by the Dornire and Alenia Spazio Companies for the German Space Agency, Deutsche Agentur fuer Raumfahrtangelegenheiten (DARA), and the Italian Space Agency, Agenzia Spaziale Italiana (ASI). JPL Photo ID: P-43918
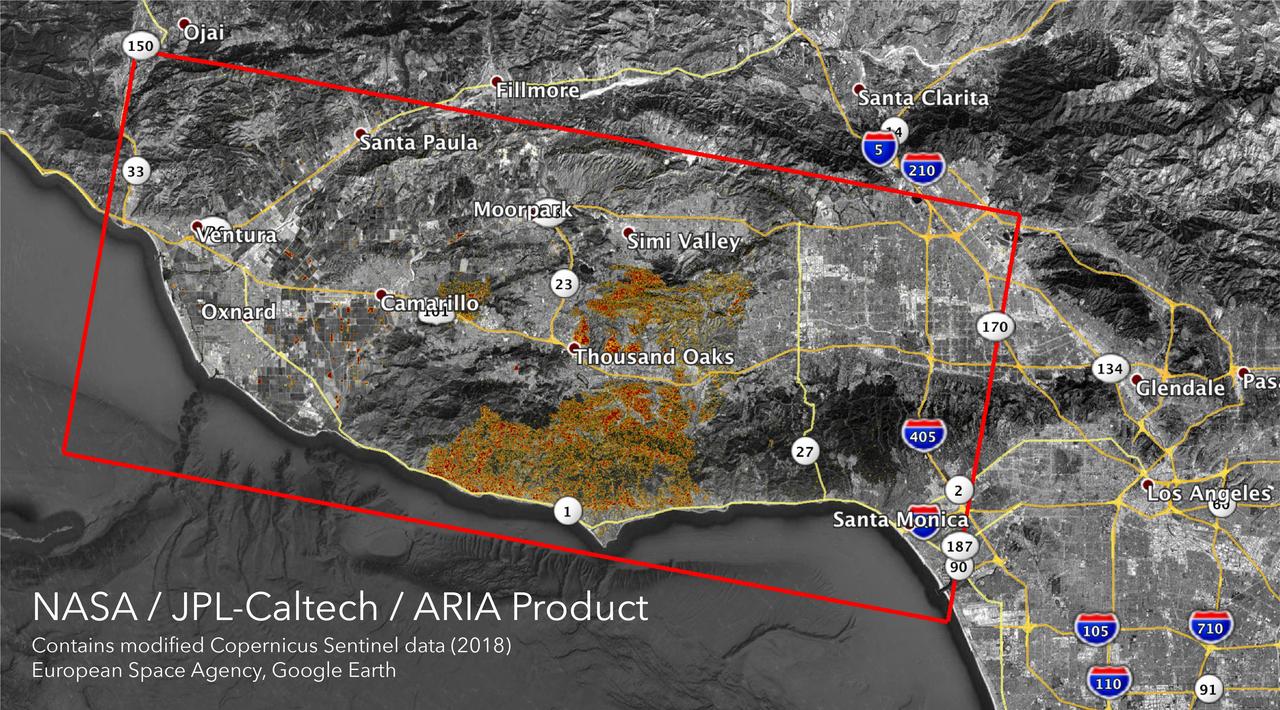
The Advanced Rapid Imaging and Analysis (ARIA) team at NASA's Jet Propulsion Laboratory in Pasadena, California, created these Damage Proxy Maps (DPMs) depicting areas in California likely damaged by the Woolsey and Camp Fires. They are derived from synthetic aperture radar (SAR) images from the Copernicus Sentinel-1 satellites, operated by the European Space Agency (ESA). The pre-event images for the Woolsey Fire in Southern California were taken before the fire on Oct. 30, 2018 and the post-event image was acquired during the fire on Nov. 11, 2018. The map covers an area of 50 miles x 25 miles (80 km x 40 km), indicated with the big red polygon. Each pixel measures about 33 yards x 33 yards (30 m x 30 m). The color variation from yellow to red indicates increasingly more significant ground surface change. The pre-event images for the Camp Fire in Northern California were taken on Nov. 4, 2018 and the post-event images were acquired during the fire on Nov. 10, 2018. The map covers an area of 55 miles x 48 miles (88 km x 77 km). As in the previous image, each pixel measures about 33 yards x 33 yards (30 m x 30 m). The color variation from yellow to red indicates increasingly more significant ground surface change. Preliminary validation for both maps was done by comparing approximate location data to Google's Crisismap. These damage proxy maps can be used as guidance to identify damaged areas with the understanding that they may be less reliable over vegetated areas including farmlands. For example, the scattered single colored pixels over vegetated areas may be false positives, and the lack of colored pixels over vegetated areas does not necessarily mean no damage. https://photojournal.jpl.nasa.gov/catalog/PIA22816
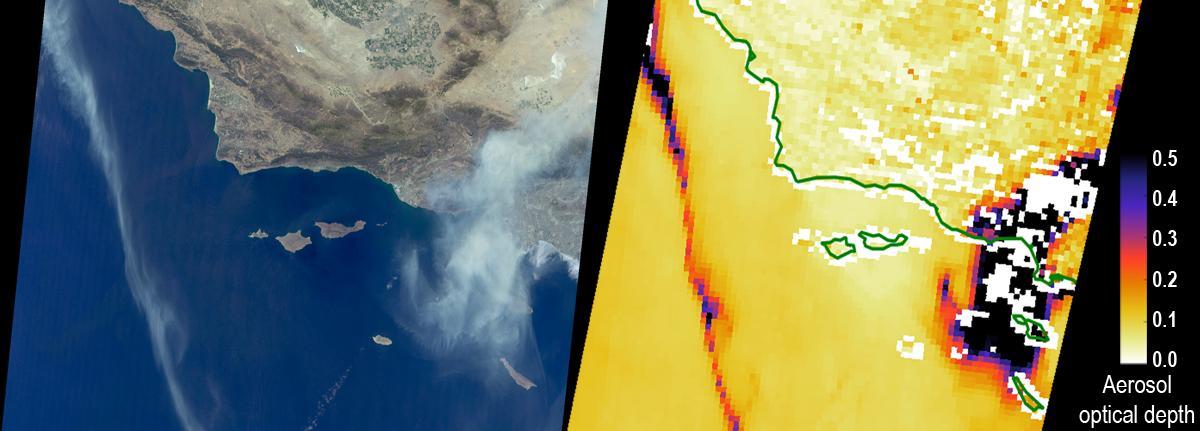
The Sand Fire in the Santa Clarita Valley area of Southern California erupted on Friday, July 22, 2016, and rapidly grew to more than 37,000 acres (58 square miles, or 150 square kilometers) over the weekend. As of Tuesday, July 26, hundreds of residents still remain under evacuation orders, and the fire claimed the life of a local resident. The fire is currently 25 percent contained. The Multi-angle Imaging SpectroRadiometer (MISR) instrument aboard NASA's Terra satellite passed over the region on July 23 around 11:50 a.m. PDT. At left is an image acquired by MISR's 60-degree forward-viewing camera. The oblique view angle makes the smoke more apparent than it would be in a more conventional vertical view. Smoke from the Sand Fire is visible on the right-hand side of the image, and a long streamer of smoke from the Soberanes Fire near Big Sur in Central California is visible over the ocean near the left-hand side of the image. Like the Sand Fire, the Soberanes Fire also broke out on July 22, and quickly grew to more than 19,000 acres (30 square miles, or 77 square kilometers), causing the evacuation of hundreds of people and closure of several state parks. The Soberanes Fire is currently only 10 percent contained. The swath width of the MISR image is 257 miles (414 kilometers). At right is a map of aerosol optical depth, a quantitative measure of the smoke abundance in the atmosphere, derived from the images acquired by MISR's nine differently angled cameras. The thick smoke from both fires is apparent. Individual squares making up this map measure 2.7 miles (4.4 kilometers) on a side. The product shown here is a prototype of a new version of the MISR aerosol product to be publicly released in the near future, and increases the spatial resolution of the aerosol information by a factor of 16 compared to the currently available product, making it possible to discern finer details in the distribution of the smoke. These data were captured during Terra orbit 88284. http://photojournal.jpl.nasa.gov/catalog/PIA20720

NASA image release April 12, 2011 Astronomers have uncovered one of the youngest galaxies in the distant universe, with stars that formed 13.5 billion years ago, a mere 200 million years after the Big Bang. The finding addresses questions about when the first galaxies arose, and how the early universe evolved. NASA's Hubble Space Telescope was the first to spot the newfound galaxy. Detailed observations from the W.M. Keck Observatory on Mauna Kea in Hawaii revealed the observed light dates to when the universe was only 950 million years old; the universe formed about 13.7 billion years ago. Infrared data from both Hubble and NASA's Spitzer Space Telescope revealed the galaxy's stars are quite mature, having formed when the universe was just a toddler at 200 million years old. The galaxy's image is being magnified by the gravity of a massive cluster of galaxies (Abell 383) parked in front of it, making it appear 11 times brighter. This phenomenon is called gravitational lensing. Hubble imaged the lensing galaxy Abell 383 with the Wide Field Camera 3 and the Advanced Camera for Surveys in November 2010 through March 2011. Credit: NASA, ESA, J. Richard (Center for Astronomical Research/Observatory of Lyon, France), and J.-P. Kneib (Astrophysical Laboratory of Marseille, France) <b><a href="http://www.nasa.gov/centers/goddard/home/index.html" rel="nofollow">NASA Goddard Space Flight Center</a></b> enables NASA’s mission through four scientific endeavors: Earth Science, Heliophysics, Solar System Exploration, and Astrophysics. Goddard plays a leading role in NASA’s accomplishments by contributing compelling scientific knowledge to advance the Agency’s mission. <b>Follow us on <a href="http://twitter.com/NASA_GoddardPix" rel="nofollow">Twitter</a></b> <b>Join us on <a href="http://www.facebook.com/pages/Greenbelt-MD/NASA-Goddard/395013845897?ref=tsd" rel="nofollow">Facebook</a></b>
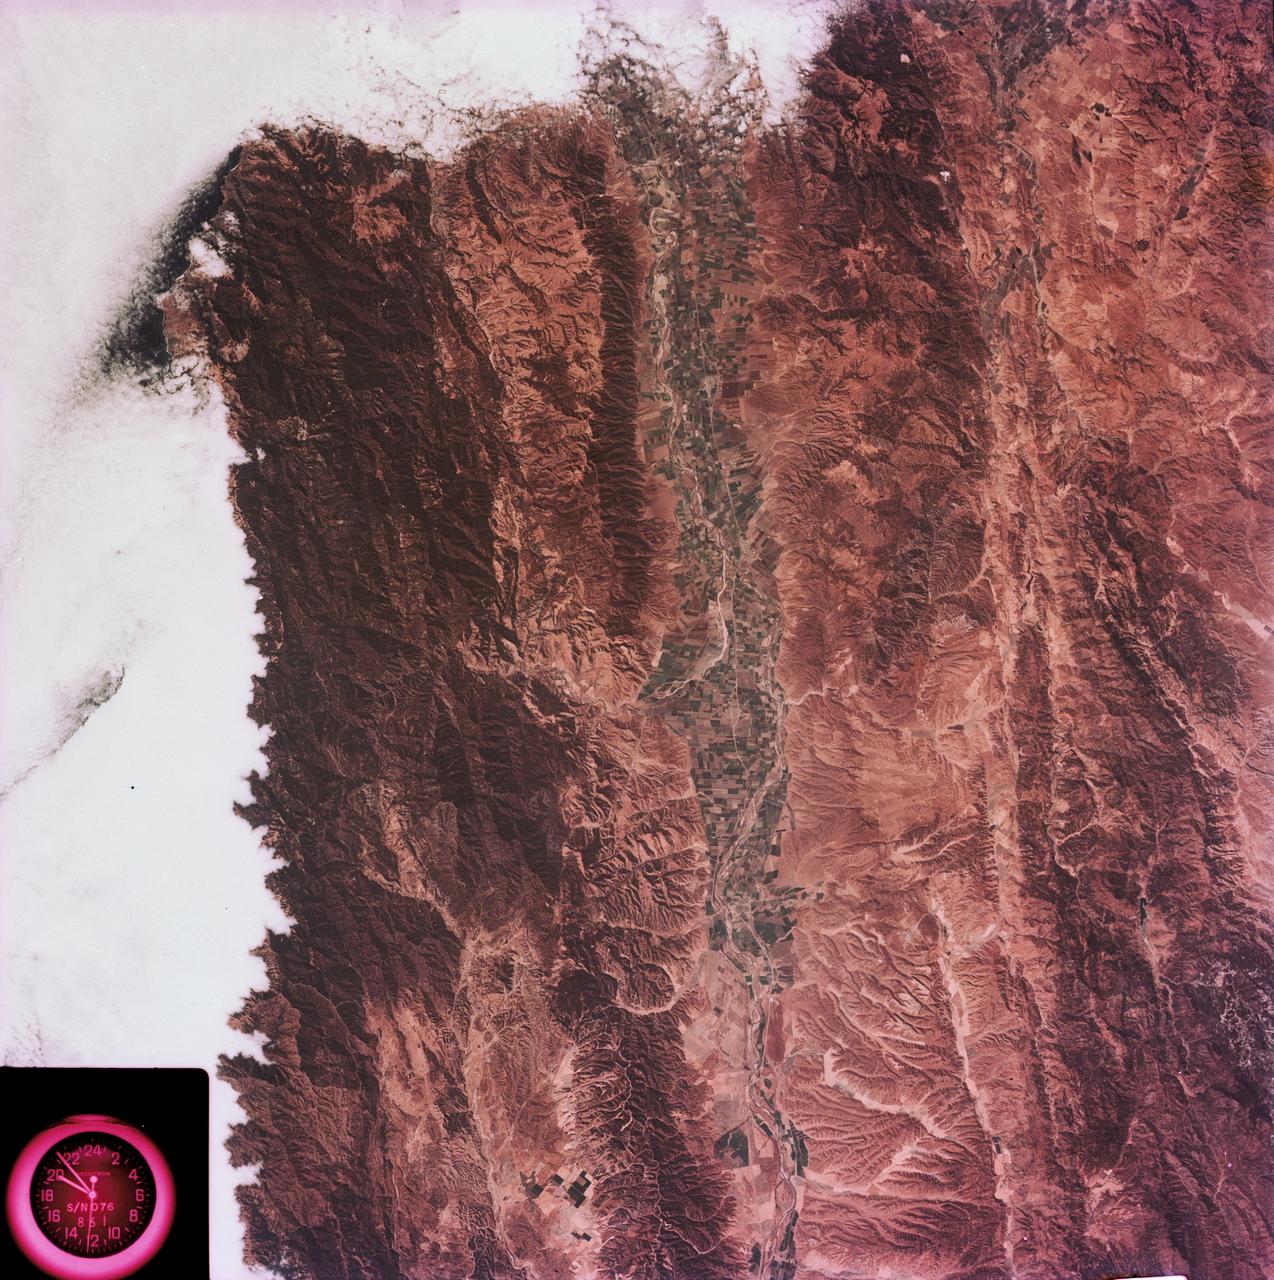
SL3-88-004 (July-September 1973) --- A vertical view of the Salinas River Valley area south of Monterey Bay, California area is seen in this Skylab 3 Earth Resources Experiments Package S190-B (five-inch Earth terrain camera) photograph taken from the Skylab space station in Earth orbit. The valley is an irrigated agricultural area, and is indicated by the dark-green and light-gray rectangular patterns in the centre of the picture. The city of Salinas is barely visible under the cloud cover at the top (north) end of the valley. The dark mass on the left (west) side of the valley is the Santa Lucia mountain range. The Big Sur area is on the left and partly covered by clouds. The Diablo Range forms the dark mass in the lower right (southeast) corner of the photograph. The town of Hollister is the gray area in the dark-green rectangular farm tracts which occupy the floor of the San Benito Valley in the upper right (northeast) corner of the photograph. The Salinas River flows northwestward toward Monterey Bay. The towns of Soledad, Greenfield and King City appear as gray areas along U.S. 101 in the Salinas Valley. The geology of the area is complex, and has been racked by several earthquakes resulting from movement along the San Andreas and subsidiary faults. Here, the surface expression of the San Andreas Fault can be traced from a point just west of Hollister at the contrast of dark brown and tan to a point about one inch left of the lower right (southeast) corner of the picture. Subsidiary faults are indicated by the curving trend of the rocks along the right side. The photograph will provide detailed information on land use patterns (Dr. R. Colwell, University of California, Berkeley) and fault tectonics (Dr. P. Merifield, Earth Science Res., Inc. and Dr. M. Abdel-Gawad, Rockwell International). Federal agencies participating with NASA on the EREP project are the Departments of Agriculture, Commerce, Interior, the Environmental Protection Agency and the Corps of Engineers. All EREP photography is available to the public through the Department of Interior’s Earth Resources Observations Systems Data Center, Sioux Falls, South Dakota, 57198. Photo credit: NASA

jsc2022e062020 (6/30/2022) --- Space Health will create a digital twin of the astronaut from the data collected by the Bio-Monitor and demonstrate how this could be used for autonomous health monitoring on future space missions. (Image courtesy of CSA)
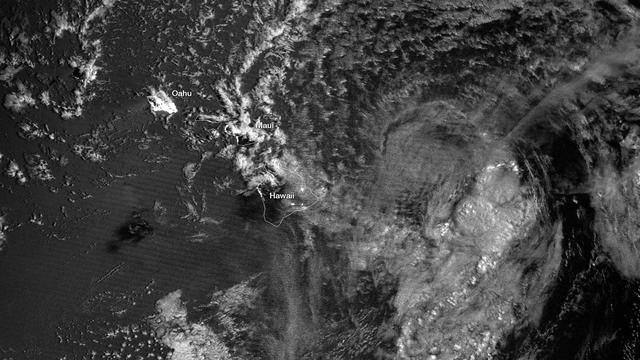
The enhanced capabilities of the Suomi NPP satellite's day-night band are really becoming clear, as was seen this week when Tropical Storm Flossie was heading toward Hawaii. On Monday, July 29th, the lack of organization of the system made it difficult to understand the storm’s central circulation. Infrared data, though able to provide cloud imagery during the night, is best at measuring cloud-top properties. Flossie, however, had a lower-level circulation that was evident in visible imagery earlier in the day. At nighttime that information was lost using traditional satellite technology, such as GOES West. The day-night-band on Suomi NPP provides visible-like information during nighttime hours when only moonlight is available. When Suomi NPP passed over the storm around 1:00am (local), the day-night band imagery allowed forecasters to identify a center of circulation that was more north than previously estimated. Two passes from Suomi NPP (at 11 and 12z, respectively) are shown here. The spiral of the lower level clouds and center of circulation can be seen northwest of Hawaii, whereas the more detailed and higher cloud top areas are due east of the Big Island. Also visible are the nighttime lights of Honolulu on Oahu, along with other cities throughout the island chain. Credit NASA/NOAA An unlabeled version may be downloaded here: <a href="http://1.usa.gov/1bOjhN6" rel="nofollow">1.usa.gov/1bOjhN6</a> <b><a href="http://www.nasa.gov/audience/formedia/features/MP_Photo_Guidelines.html" rel="nofollow">NASA image use policy.</a></b> <b><a href="http://www.nasa.gov/centers/goddard/home/index.html" rel="nofollow">NASA Goddard Space Flight Center</a></b> enables NASA’s mission through four scientific endeavors: Earth Science, Heliophysics, Solar System Exploration, and Astrophysics. Goddard plays a leading role in NASA’s accomplishments by contributing compelling scientific knowledge to advance the Agency’s mission. <b>Follow us on <a href="http://twitter.com/NASA_GoddardPix" rel="nofollow">Twitter</a></b> <b>Like us on <a href="http://www.facebook.com/pages/Greenbelt-MD/NASA-Goddard/395013845897?ref=tsd" rel="nofollow">Facebook</a></b> <b>Find us on <a href="http://instagram.com/nasagoddard?vm=grid" rel="nofollow">Instagram</a></b>
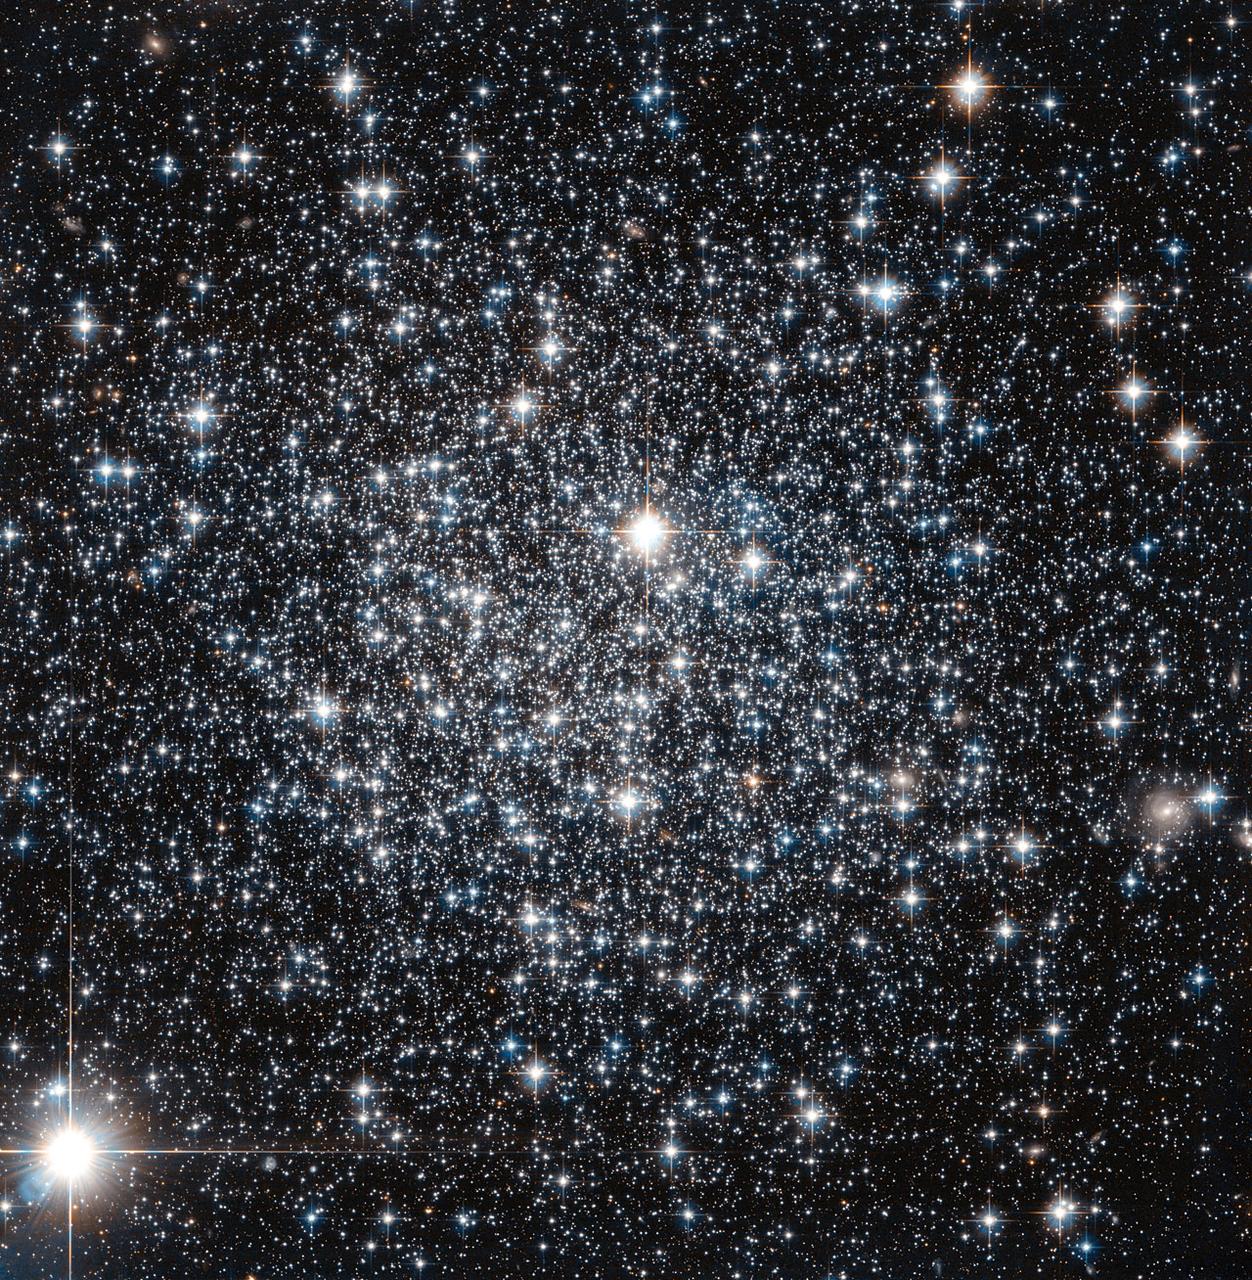
This new NASA/ESA Hubble Space Telescope image shows the globular cluster IC 4499. Globular clusters are big balls of old stars that orbit around their host galaxy. It has long been believed that all the stars within a globular cluster form at the about same time, a property which can be used to determine the cluster's age. For more massive globulars however, detailed observations have shown that this is not entirely true — there is evidence that they instead consist of multiple populations of stars born at different times. One of the driving forces behind this behavior is thought to be gravity: more massive globulars manage to grab more gas and dust, which can then be transformed into new stars. IC 4499 is a somewhat special case. Its mass lies somewhere between low-mass globulars, which show a single generation build-up, and the more complex and massive globulars which can contain more than one generation of stars. By studying objects like IC 4499 astronomers can therefore explore how mass affects a cluster's contents. Astronomers found no sign of multiple generations of stars in IC 4499 — supporting the idea that less massive clusters in general only consist of a single stellar generation. Hubble observations of IC 4499 have also helped to pinpoint the cluster's age: observations of this cluster from the 1990s suggested a puzzlingly young age when compared to other globular clusters within the Milky Way. However, since those first estimates new Hubble data have been obtained and it has been found to be much more likely that IC 4499 is actually roughly the same age as other Milky Way clusters at approximately 12 billion years old. Credit: ESA and NASA <b><a href="http://www.nasa.gov/audience/formedia/features/MP_Photo_Guidelines.html" rel="nofollow">NASA image use policy.</a></b> <b><a href="http://www.nasa.gov/centers/goddard/home/index.html" rel="nofollow">NASA Goddard Space Flight Center</a></b> enables NASA’s mission through four scientific endeavors: Earth Science, Heliophysics, Solar System Exploration, and Astrophysics. Goddard plays a leading role in NASA’s accomplishments by contributing compelling scientific knowledge to advance the Agency’s mission. <b>Follow us on <a href="http://twitter.com/NASAGoddardPix" rel="nofollow">Twitter</a></b> <b>Like us on <a href="http://www.facebook.com/pages/Greenbelt-MD/NASA-Goddard/395013845897?ref=tsd" rel="nofollow">Facebook</a></b> <b>Find us on <a href="http://instagram.com/nasagoddard?vm=grid" rel="nofollow">Instagram</a></b>

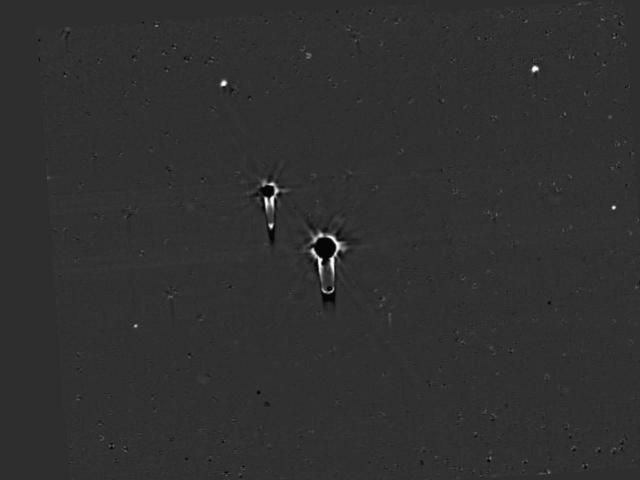
This stunning image, captured by the NASA/ESA Hubble Space Telescope’s Advanced Camera for Surveys (ACS), shows part of the sky in the constellation of Sagittarius (The Archer). The region is rendered in exquisite detail — deep red and bright blue stars are scattered across the frame, set against a background of thousands of more distant stars and galaxies. Two features are particularly striking: the colors of the stars, and the dramatic crosses that burst from the centers of the brightest bodies. While some of the colors in this frame have been enhanced and tweaked during the process of creating the image from the observational data, different stars do indeed glow in different colors. Stars differ in color according to their surface temperature: very hot stars are blue or white, while cooler stars are redder. They may be cooler because they are smaller, or because they are very old and have entered the red giant phase, when an old star expands and cools dramatically as its core collapses. The crosses are nothing to do with the stars themselves, and, because Hubble orbits above Earth’s atmosphere, nor are they due to any kind of atmospheric disturbance. They are actually known as diffraction spikes, and are caused by the structure of the telescope itself. Like all big modern telescopes, Hubble uses mirrors to capture light and form images. Its secondary mirror is supported by struts, called telescope spiders, arranged in a cross formation, and they diffract the incoming light. Diffraction is the slight bending of light as it passes near the edge of an object. Every cross in this image is due to a single set of struts within Hubble itself! Whilst the spikes are technically an inaccuracy, many astrophotographers choose to emphasize and celebrate them as a beautiful feature of their images. Image credit: ESA/Hubble & NASA <b><a href="http://www.nasa.gov/audience/formedia/features/MP_Photo_Guidelines.html" rel="nofollow">NASA image use policy.</a></b> <b><a href="http://www.nasa.gov/centers/goddard/home/index.html" rel="nofollow">NASA Goddard Space Flight Center</a></b> enables NASA’s mission through four scientific endeavors: Earth Science, Heliophysics, Solar System Exploration, and Astrophysics. Goddard plays a leading role in NASA’s accomplishments by contributing compelling scientific knowledge to advance the Agency’s mission. <b>Follow us on <a href="http://twitter.com/NASAGoddardPix" rel="nofollow">Twitter</a></b> <b>Like us on <a href="http://www.facebook.com/pages/Greenbelt-MD/NASA-Goddard/395013845897?ref=tsd" rel="nofollow">Facebook</a></b> <b>Find us on <a href="http://instagrid.me/nasagoddard/?vm=grid" rel="nofollow">Instagram</a></b>
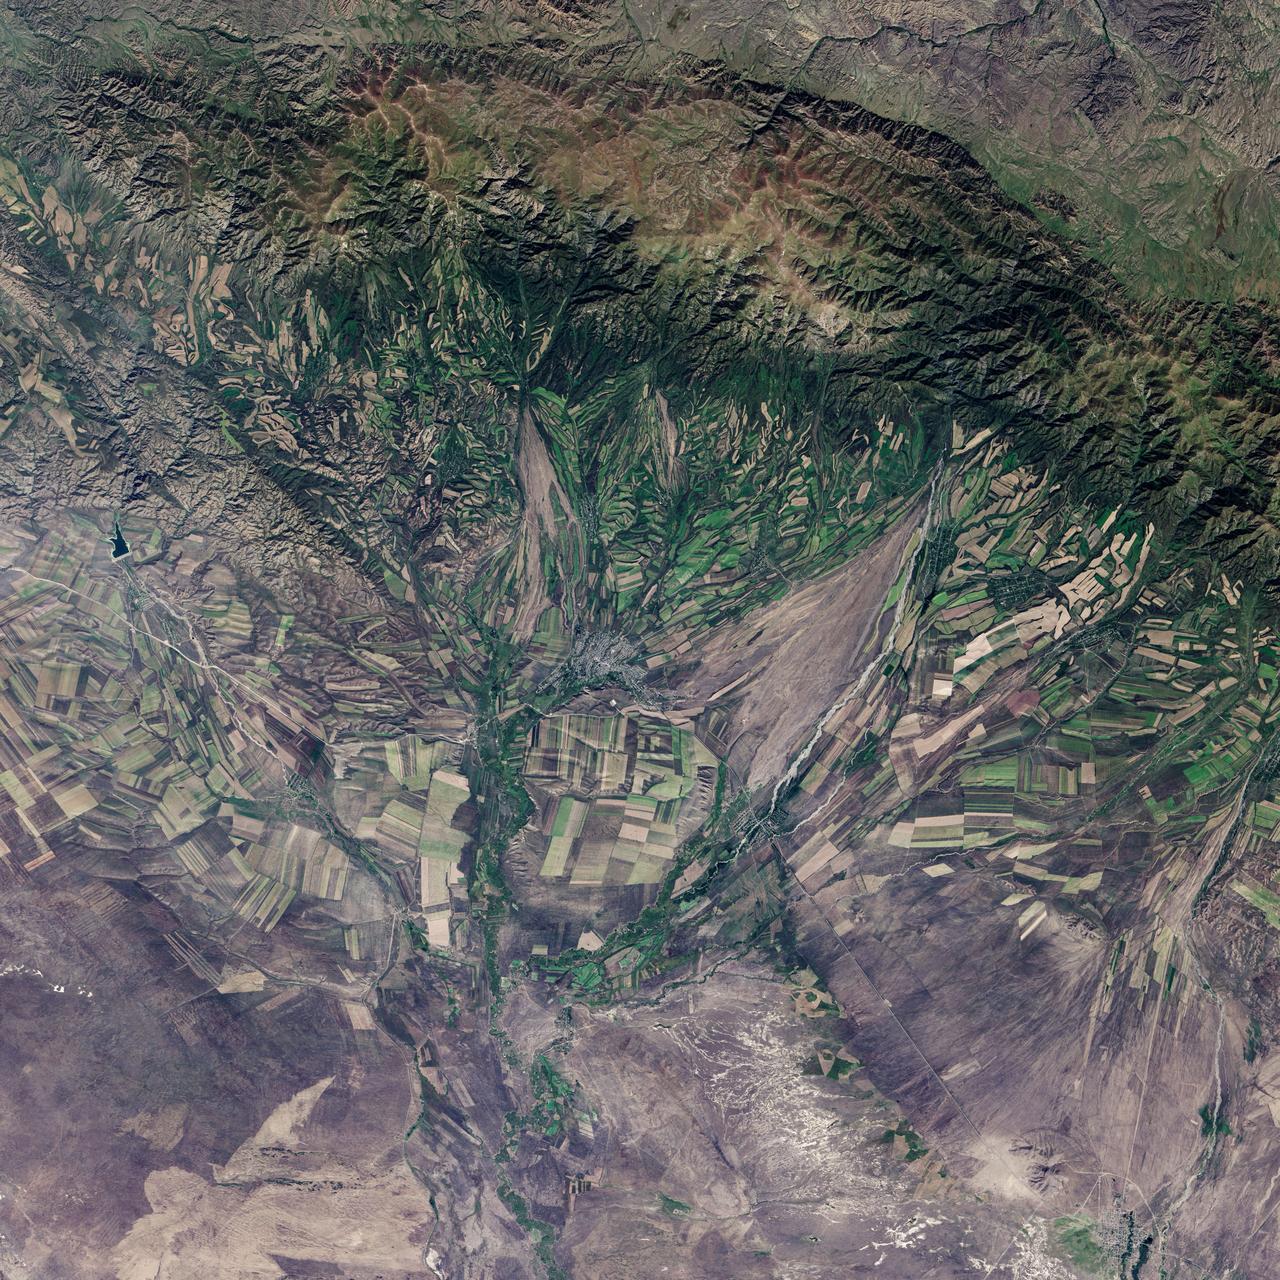
September 22, the autumnal equinox, marks the beginning of fall in the Northern Hemisphere, but the fall harvest begins early in the harsh continental climate of eastern Kazakhstan. By September 9, 2013, when the Operational Land Imager (OLI) on the Landsat 8 satellite acquired this image, several fields were already harvested and bare. Others were dark green with pasture grasses or ripening crops. The fields fill the contours of the land, running long and narrow down mountain valleys and spreading in large squares over the plains. Agriculture is an important segment of the economy in Kazakhstan: the country’s dry climate is ideal for producing high quality wheat for export. However, 61 percent of the country’s agricultural land is pasture for livestock. The area shown in this image, far eastern Kazakhstan near the Chinese border, is a minor wheat-growing region and may also produce sunflowers, barley, and other food crops. An artifact of Soviet-era collective farms, most of the farms in Kazakhstan are large, covering more than 5,000 hectares (12,500 acres). Some of the larger fields in the image reflect the big business side of agriculture. However, family farms and small agriculture businesses account for 35 percent of the country’s agricultural production, and some of these are visible as well, particularly in the uneven hills and mountains. Nearly all agriculture in Kazakhstan is rain fed. Farmers in this region have designed their fields to take advantage of rain flowing down hills, allowing the natural shape of the land to channel water to crops. The effect is a mosaic of green and tan with tones matching the natural vegetation in the mountains to the north. NASA Earth Observatory image by Jesse Allen using Landsat data from the U.S. Geological Survey. Caption by Holli Riebeek. Instrument: Landsat 8 - OLI More info: <a href="http://1.usa.gov/16IZ047" rel="nofollow">1.usa.gov/16IZ047</a> <b><a href="http://www.nasa.gov/audience/formedia/features/MP_Photo_Guidelines.html" rel="nofollow">NASA image use policy.</a></b> <b><a href="http://www.nasa.gov/centers/goddard/home/index.html" rel="nofollow">NASA Goddard Space Flight Center</a></b> enables NASA’s mission through four scientific endeavors: Earth Science, Heliophysics, Solar System Exploration, and Astrophysics. Goddard plays a leading role in NASA’s accomplishments by contributing compelling scientific knowledge to advance the Agency’s mission. <b>Follow us on <a href="http://twitter.com/NASA_GoddardPix" rel="nofollow">Twitter</a></b> <b>Like us on <a href="http://www.facebook.com/pages/Greenbelt-MD/NASA-Goddard/395013845897?ref=tsd" rel="nofollow">Facebook</a></b> <b>Find us on <a href="http://instagram.com/nasagoddard?vm=grid" rel="nofollow">Instagram</a></b>
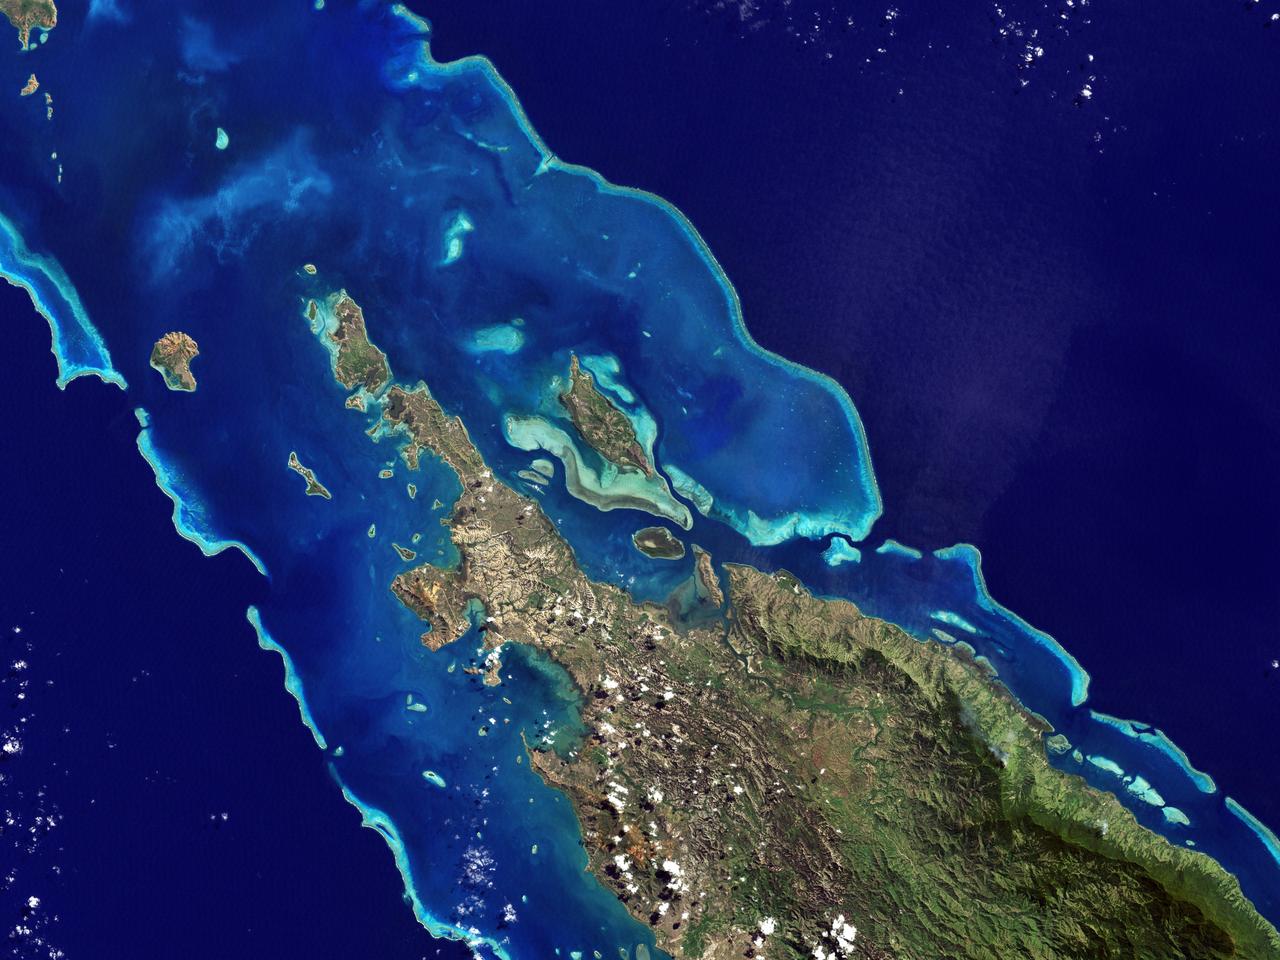
NASA image acquired May 10, 2001 In July 2008, the United Nations Educational, Scientific, and Cultural Organization (UNESCO) added 27 new areas to its list of World Heritage sites. One of those areas included the lagoons of New Caledonia. Some 1,200 kilometers (750 miles) east of Australia, this French-governed archipelago contains the world’s third-largest coral reef structure. The coral reefs enclose the waters near the islands in shallow lagoons of impressive biodiversity. On May 10, 2001, the Enhanced Thematic Mapper Plus on NASA’s Landsat 7 satellite captured this image of Île Balabio, off the northern tip of Grande Terra, New Caledonia’s main island. In this natural-color image, the islands appear in shades of green and brown—mixtures of vegetation and bare ground. The surrounding waters range in color from pale aquamarine to deep blue, and the color differences result from varying depths. Over coral reef ridges and sand bars, the water is shallowest and palest in color. Darker shades of blue characterize deeper waters. Reef-enclosed, shallow waters surround Île Balabio, and a larger, semi-enclosed lagoon appears immediately east of that island. Immediately north of Grande Terra, unenclosed, deeper waters predominate. The coral reefs around New Caledonia support an unusual diversity of species, including large numbers of predators and big fish, turtles, and the world’s third-largest dugong population. NASA image created by Jesse Allen, using Landsat data provided by the United States Geological Survey. Caption by Michon Scott. Instrument: Landsat 7 - ETM+ Credit: NASA/GSFC/Landsat <b><a href="http://www.nasa.gov/centers/goddard/home/index.html" rel="nofollow">NASA Goddard Space Flight Center</a></b> enables NASA’s mission through four scientific endeavors: Earth Science, Heliophysics, Solar System Exploration, and Astrophysics. Goddard plays a leading role in NASA’s accomplishments by contributing compelling scientific knowledge to advance the Agency’s mission. <b>Follow us on <a href="http://twitter.com/NASA_GoddardPix" rel="nofollow">Twitter</a></b> <b>Join us on <a href="http://www.facebook.com/pages/Greenbelt-MD/NASA-Goddard/395013845897?ref=tsd" rel="nofollow">Facebook</a></b>
The Soil Moisture Active Passive (SMAP) mission, scheduled for launch on Jan. 29, will measure the moisture in Earth's soil with greater accuracy and higher resolution than any preceding mission, producing a global map of soil moisture every three days. Here are five quick facts about the spacecraft and what it studies. 1. Soil moisture is a tiny fraction of water with a big punch. Only 0.001 percent of Earth's total water is lodged in the top few feet of soil. That tiny percentage, however, affects all living things on land and plays an important role in moving water, carbon and heat between land and atmosphere. 2. Soil moisture can compound water risks. A flood follows a heavy rainfall -- but only if the ground cannot soak up the rain. Waterlogged soil makes a region more flood-prone. Going to the opposite extreme, a drought can parch soil to such an extent that plants are unable to grow even after a few rains have fallen. Knowing soil moisture allows hydrologists to make better decisions related to the risk of flooding and drought, such as how much water to retain in reservoirs. 3. Soil moisture controls the on-off switch for carbon dioxide cleanup. The world's vast northern forests remove carbon dioxide from the air as they grow, helping to clean up our emissions from burning fossil fuels. But when the ground freezes, that process switches off. Carbon dioxide builds up in the atmosphere until the ground thaws in the spring and plants begin growing again. Knowing where and for how long the ground is frozen or thawed is an important part of understanding the role of the northern forests in reducing greenhouse warming. SMAP will map frozen and thawed soils north of 45 degrees north latitude (about the latitude of Minneapolis), around the globe. 4. SMAP is a twofer. The spacecraft's radiometer produces an accurate reading of how much moisture is in the top two inches (five centimeters) of soil, but it has low spatial resolution, that is, one measurement covers a large area. A radar instrument produces an image with higher spatial resolution, but it can't measure soil moisture as accurately as a radiometer. Through sophisticated data processing, SMAP combines observations from the two instruments into a very accurate measurement with high spatial resolution. 5. SMAP has a huge, folding, spinning antenna. At 19 feet 8 inches (6 meters) in diameter, SMAP's rotating mesh antenna dwarfs the size of the instruments and spacecraft and is the largest rotating antenna of its kind that NASA has yet deployed. But the entire dish furls into a cylinder one foot (diameter) by four feet (30 by 120 centimeters) to fit inside the rocket’s fairing for launch, and it weighs only 128 pounds (about 58 kilograms). For more information about SMAP, see: <a href="http://smap.jpl.nasa.gov/" rel="nofollow">smap.jpl.nasa.gov/</a> <a href="http://www.nasa.gov/smap/" rel="nofollow">www.nasa.gov/smap/</a> <b><a href="http://www.nasa.gov/audience/formedia/features/MP_Photo_Guidelines.html" rel="nofollow">NASA image use policy.</a></b> <b><a href="http://www.nasa.gov/centers/goddard/home/index.html" rel="nofollow">NASA Goddard Space Flight Center</a></b> enables NASA’s mission through four scientific endeavors: Earth Science, Heliophysics, Solar System Exploration, and Astrophysics. Goddard plays a leading role in NASA’s accomplishments by contributing compelling scientific knowledge to advance the Agency’s mission. <b>Follow us on <a href="http://twitter.com/NASAGoddardPix" rel="nofollow">Twitter</a></b> <b>Like us on <a href="http://www.facebook.com/pages/Greenbelt-MD/NASA-Goddard/395013845897?ref=tsd" rel="nofollow">Facebook</a></b> <b>Find us on <a href="http://instagram.com/nasagoddard?vm=grid" rel="nofollow">Instagram</a></b>
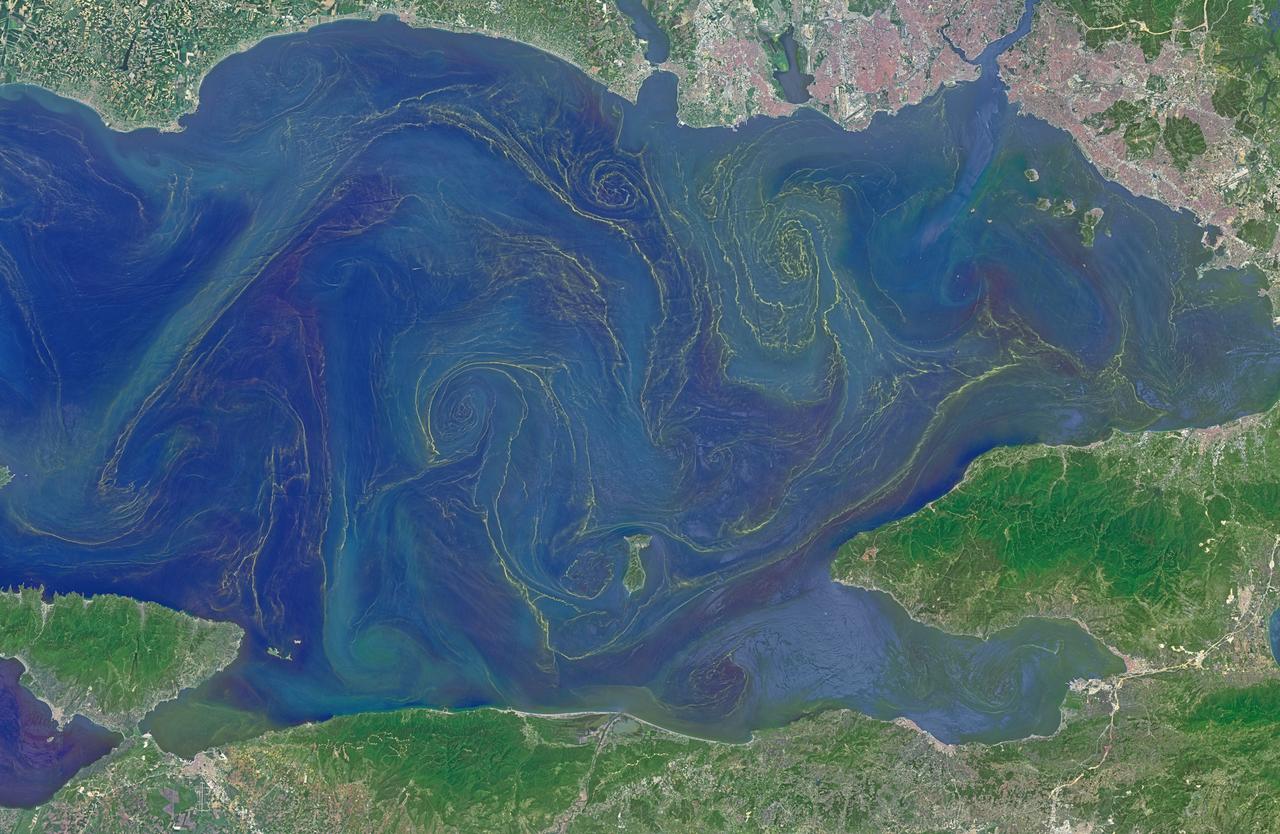
Situated between the Black Sea and the Aegean Sea, the Sea of Marmara is full of a rich soup of nutrients and life and surrounded by a rich history of civilization. Like the Black Sea to its northeast, the Marmara has an unusual layered structure with fresher water near the surface and much saltier water near the bottom. That fresh surface is fed by exchanges with the Black Sea and by flows from the Susurluk, Biga, and Gonen Rivers. The fresh water (just two thirds the salinity of the ocean) makes it easier for floating, plant-like organisms—phytoplankton—to grow, as does the abundance of nutrients pouring into the seas from European and Turkish rivers. The Operational Land Imager on the Landsat 8 satellite captured this image of a phytoplankton bloom in the Sea of Marmara on May 17, 2015. The sea is surrounded on all sides by the nation of Turkey. The swirling shapes on the water are phytoplankton, with the yellow-green and red-purple filaments likely (but not necessarily) representing different species. Those wavy colored lines not only show where the densest concentrations of plankton are floating, but also reveal the eddies and currents within the small sea. Waters rushing in through the narrow Bosphorous Strait (at Istanbul) and Dardanelles Strait (off the left side of the image), as well as a jagged coastline and tectonically fractured seafloor on this edge of the Asian and European continents, all conspire to create intricate mixing patterns. If you download the large image and open it in full resolution, you also can see ship tracks crossing the bloom lines. “I often see features in imagery and wonder: what could be causing that?” said Norman Kuring, an ocean color specialist at NASA Goddard. “Remote sensing is great for the big picture, but it still needs data from the surface for validation and interpretation.” According to scientists Baris Salihoglu of Turkey’s Institute of Marine Sciences and Ahsen Yuksek of Istanbul University, the blooms in the satellite image are mostly Prorocentrum micans and Noctiluca scintillans. They recently sampled the waters of the Marmara and found that Prorocentrum bloomed first, though Noctiluca eventually dominated. According to Ajit Subramaniam of the Lamont Doherty Earth Observatory, both species are dinoflagellates, known to discolor the water (red tides). Neither is directly toxic to humans, but they can kill marine life by becoming caught in fish gills, depleting the sea of oxygen, or excreting ammonia into the water. “Noctiluca is phagotrophic—a really interesting beast since it eats other phytoplankton that can then change its color,” Subramaniam noted. “It switches from being photosynthetic to becoming heterotrophic.” The Moderate Resolution Imaging Spectroradiometer (MODIS) on NASA’s Terra satellite captured wider views of bloom events in the Sea of Marmara on on May 23 and May 25. Credit: <b><a href="http://www.earthobservatory.nasa.gov/" rel="nofollow"> NASA Earth Observatory</a></b> Read more: <a href="http://earthobservatory.nasa.gov/IOTD/view.php?id=85947" rel="nofollow">earthobservatory.nasa.gov/IOTD/view.php?id=85947</a> <b><a href="http://www.nasa.gov/audience/formedia/features/MP_Photo_Guidelines.html" rel="nofollow">NASA image use policy.</a></b> <b><a href="http://www.nasa.gov/centers/goddard/home/index.html" rel="nofollow">NASA Goddard Space Flight Center</a></b> enables NASA’s mission through four scientific endeavors: Earth Science, Heliophysics, Solar System Exploration, and Astrophysics. Goddard plays a leading role in NASA’s accomplishments by contributing compelling scientific knowledge to advance the Agency’s mission. <b>Follow us on <a href="http://twitter.com/NASAGoddardPix" rel="nofollow">Twitter</a></b> <b>Like us on <a href="http://www.facebook.com/pages/Greenbelt-MD/NASA-Goddard/395013845897?ref=tsd" rel="nofollow">Facebook</a></b> <b>Find us on <a href="http://instagrid.me/nasagoddard/?vm=grid" rel="nofollow">Instagram</a></b>

This image from NASA Kepler mission shows the telescope full field of view an expansive star-rich patch of sky in the constellations Cygnus and Lyra stretching across 100 square degrees, or the equivalent of two side-by-side dips of the Big Dipper. A cluster of stars, called NGC 6791, and a star with a known planet, called TrES-2, are outlined. The cluster is eight billion years old, and located 13,000 light-years from Earth. It is called an open cluster because its stars are loosely bound and have started to spread out. TrES-2 is a hot Jupiter-like planet known to cross in front of, or transit, its star every 2.5 days. Kepler will hunt for transiting planets that are as small as Earth. Kepler was designed to hunt for planets like Earth. Of the approximately 4.5 million stars in the region pictured here, more than 100,000 were selected as candidates for Kepler's search. The mission will spend the next three-and-a-half years staring at these target stars, looking for periodic dips in brightness. Such dips occur when planets cross in front of their stars from our point of view in the galaxy, partially blocking the starlight. The area in the lower right of the image is brighter because it is closer to the plane of our galaxy and is jam-packed with stars. The area in upper left is farther from the galactic plane and contains fewer stars. The image has been color-coded so that brighter stars appear white, and fainter stars, red. It is a 60-second exposure, taken on April 8, 2009, one day after the spacecraft's dust cover was jettisoned. To achieve the level of precision needed to spot planets as small as Earth, Kepler's images are intentionally blurred slightly. This minimizes the number of saturated stars. Saturation, or "blooming," occurs when the brightest stars overload the individual pixels in the detectors, causing the signal to spill out into nearby pixels. These spills can be seen in the image as fine white lines extending above and below some of the brightest stars. Blooming is an expected side effect of Kepler's ultra-sensitive camera. Some of the lightly saturated stars are candidates for planet searches, while those that are heavily saturated are not. The grid lines across the picture show how the focal plane is laid out on Kepler's camera —the largest ever launched in space at 95 megapixels. There are 42 charge-coupled devices (CCDs), paired into square-shaped modules, whose outline can be seen in the image. A thin black line in each module shows adjacent pairs of CCDs. The thicker black lines that cross through the image are from structures holding the modules together, and were purposely oriented to block out the very brightest stars in Kepler's field of view. The four black corners of the image show where the fine-guidance sensors reside on the focal plane. These sensors are used to hold the telescope's gaze steady by measuring its position on the sky 10 times every second, and by feeding this information to the spacecraft's attitude control system. Ghost images also appear in the image, which are reflections off the lenses above the CCDs. These expected artifacts were mapped out during ground testing for Kepler, and will not affect science observations because they will be removed as the data are processed. http://photojournal.jpl.nasa.gov/catalog/PIA11984
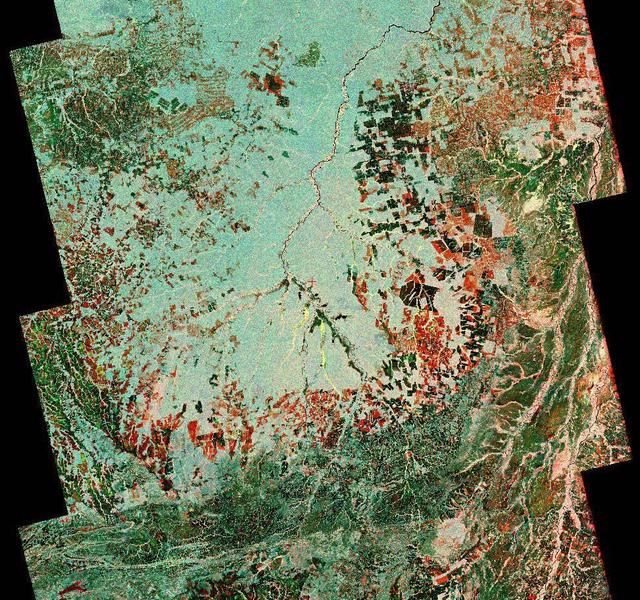
To show the kind of imagery that data from the NISAR (NASA-ISRO Synthetic Aperture Radar) satellite mission will produce, researchers pointed to this composite image of a portion of the so-called "arc of deforestation," a region on the southeast edge of the Amazonian jungle in Brazil where forests are being cleared at a fast pace through human activity. This three-color image shows change to the land cover in the Xingu River basin between 1996 (red) and 2007 (blue/green), using data from the Japanese L-band SAR satellites JERS-1 and ALOS-1, respectively. Black indicates areas converted from rainforest to agricultural land prior to 1996, and red shows the additional areas that had been cleared by 2007. NISAR will offer detailed insights into how the planet's forest ecosystems are changing over time, which will help researchers understand regional and global dynamics of deforestation and study the role of wooded areas in the global carbon cycle. NISAR could also help improve accounting of forest loss and growth, as countries that rely on logging try to shift toward more sustainable practices. NISAR is a joint mission of the U.S. and Indian space agencies. When in orbit, its sophisticated L- and S-band radar systems will scan nearly all of Earth's land and ice surfaces twice every 12 days with exquisite precision. Scheduled to launch in early 2024, NISAR is an equal collaboration between NASA and the Indian Space Research Organisation and marks the first time the two agencies have cooperated on hardware development for an Earth-observing mission. NASA's Jet Propulsion Laboratory, which is managed for the agency by Caltech in Pasadena, leads the U.S. component of the project and is providing the mission's L-band SAR. NASA is also providing the radar reflector antenna, the deployable boom, a high-rate communication subsystem for science data, GPS receivers, a solid-state recorder, and payload data subsystem. ISRO's U R Rao Satellite Centre in Bengaluru, which is leading the ISRO component of the mission, is providing the spacecraft bus, the S-band SAR electronics, the launch vehicle, and associated launch services and satellite mission operations. https://photojournal.jpl.nasa.gov/catalog/PIA26111

This is an illustration of a supermassive black hole, weighing as much as 21 million suns, located in the middle of the ultradense galaxy M60-UCD1. The dwarf galaxy is so dense that millions of stars fill the sky as seen by an imaginary visitor. Because no light can escape from the black hole, it appears simply in silhouette against the starry background. The black hole's intense gravitational field warps the light of the background stars to form ring-like images just outside the dark edges of the black hole's event horizon. Combined observations by the Hubble Space Telescope and Gemini North telescope determined the presence of the black hole inside such a small and dense galaxy. More info: Astronomers using data from NASA’s Hubble Space Telescope and ground observation have found an unlikely object in an improbable place -- a monster black hole lurking inside one of the tiniest galaxies ever known. The black hole is five times the mass of the one at the center of our Milky Way galaxy. It is inside one of the densest galaxies known to date -- the M60-UCD1 dwarf galaxy that crams 140 million stars within a diameter of about 300 light-years, which is only 1/500th of our galaxy’s diameter. If you lived inside this dwarf galaxy, the night sky would dazzle with at least 1 million stars visible to the naked eye. Our nighttime sky as seen from Earth’s surface shows 4,000 stars. The finding implies there are many other compact galaxies in the universe that contain supermassive black holes. The observation also suggests dwarf galaxies may actually be the stripped remnants of larger galaxies that were torn apart during collisions with other galaxies rather than small islands of stars born in isolation. “We don’t know of any other way you could make a black hole so big in an object this small,” said University of Utah astronomer Anil Seth, lead author of an international study of the dwarf galaxy published in Thursday’s issue of the journal Nature. Seth’s team of astronomers used the Hubble Space Telescope and the Gemini North 8-meter optical and infrared telescope on Hawaii’s Mauna Kea to observe M60-UCD1 and measure the black hole’s mass. The sharp Hubble images provide information about the galaxy’s diameter and stellar density. Gemini measures the stellar motions as affected by the black hole’s pull. These data are used to calculate the mass of the black hole. Black holes are gravitationally collapsed, ultra-compact objects that have a gravitational pull so strong that even light cannot escape. Supermassive black holes -- those with the mass of at least one million stars like our sun -- are thought to be at the centers of many galaxies. The black hole at the center of our Milky Way galaxy has the mass of four million suns. As heavy as that is, it is less than 0.01 percent of the Milky Way’s total mass. By comparison, the supermassive black hole at the center of M60-UCD1, which has the mass of 21 million suns, is a stunning 15 percent of the small galaxy’s total mass. “That is pretty amazing, given that the Milky Way is 500 times larger and more than 1,000 times heavier than the dwarf galaxy M60-UCD1,” Seth said. One explanation is that M60-UCD1 was once a large galaxy containing 10 billion stars, but then it passed very close to the center of an even larger galaxy, M60, and in that process all the stars and dark matter in the outer part of the galaxy were torn away and became part of M60. The team believes that M60-UCD1 may eventually be pulled to fully merge with M60, which has its own monster black hole that weighs a whopping 4.5 billion solar masses, or more than 1,000 times bigger than the black hole in our galaxy. When that happens, the black holes in both galaxies also likely will merge. Both galaxies are 50 million light-years away. The Hubble Space Telescope is a project of international cooperation between NASA and the European Space Agency. NASA's Goddard Space Flight Center in Greenbelt, Maryland, manages the telescope. The Space Telescope Science Institute (STScI) in Baltimore conducts Hubble science operations. STScI is operated for NASA by the Association of Universities for Research in Astronomy, Inc., in Washington. For images and more information about Hubble, visit: <a href="http://www.nasa.gov/hubble" rel="nofollow">www.nasa.gov/hubble</a> <b><a href="http://www.nasa.gov/audience/formedia/features/MP_Photo_Guidelines.html" rel="nofollow">NASA image use policy.</a></b> <b><a href="http://www.nasa.gov/centers/goddard/home/index.html" rel="nofollow">NASA Goddard Space Flight Center</a></b> enables NASA’s mission through four scientific endeavors: Earth Science, Heliophysics, Solar System Exploration, and Astrophysics. Goddard plays a leading role in NASA’s accomplishments by contributing compelling scientific knowledge to advance the Agency’s mission. <b>Follow us on <a href="http://twitter.com/NASAGoddardPix" rel="nofollow">Twitter</a></b> <b>Like us on <a href="http://www.facebook.com/pages/Greenbelt-MD/NASA-Goddard/395013845897?ref=tsd" rel="nofollow">Facebook</a></b> <b>Find us on <a href="http://instagram.com/nasagoddard?vm=grid" rel="nofollow">Instagram</a></b>

NASA image release March 11, 2011 Caption: The lunar farside as never seen before! LROC WAC orthographic projection centered at 180° longitude, 0° latitude. Credit: NASA/Goddard/Arizona State University. Because the moon is tidally locked (meaning the same side always faces Earth), it was not until 1959 that the farside was first imaged by the Soviet Luna 3 spacecraft (hence the Russian names for prominent farside features, such as Mare Moscoviense). And what a surprise - unlike the widespread maria on the nearside, basaltic volcanism was restricted to a relatively few, smaller regions on the farside, and the battered highlands crust dominated. A different world from what we saw from Earth. Of course, the cause of the farside/nearside asymmetry is an interesting scientific question. Past studies have shown that the crust on the farside is thicker, likely making it more difficult for magmas to erupt on the surface, limiting the amount of farside mare basalts. Why is the farside crust thicker? That is still up for debate, and in fact several presentations at this week's Lunar and Planetary Science Conference attempt to answer this question. The Clementine mission obtained beautiful mosaics with the sun high in the sky (low phase angles), but did not have the opportunity to observe the farside at sun angles favorable for seeing surface topography. This WAC mosaic provides the most complete look at the morphology of the farside to date, and will provide a valuable resource for the scientific community. And it's simply a spectacular sight! The Lunar Reconnaissance Orbiter Camera (LROC) Wide Angle Camera (WAC) is a push-frame camera that captures seven color bands (321, 360, 415, 566, 604, 643, and 689 nm) with a 57-km swath (105-km swath in monochrome mode) from a 50 km orbit. One of the primary objectives of LROC is to provide a global 100 m/pixel monochrome (643 nm) base map with incidence angles between 55°-70° at the equator, lighting that is favorable for morphological interpretations. Each month, the WAC provides nearly complete coverage of the Moon under unique lighting. As an added bonus, the orbit-to-orbit image overlap provides stereo coverage. Reducing all these stereo images into a global topographic map is a big job, and is being led by LROC Team Members from the German Aerospace Center (Deutsches Zentrum für Luft- und Raumfahrt; DLR). Several preliminary WAC topographic products have appeared in LROC featured images over the past year (Orientale basin, Sinus Iridum). For a sneak preview of the WAC global DEM with the WAC global mosaic, view a rotating composite moon (70 MB video from ASU's LROC website). The WAC topographic dataset will be completed and released later this year. The global mosaic released today is comprised of over 15,000 WAC images acquired between November 2009 and February 2011. The non-polar images were map projected onto the GLD100 shape model (WAC derived 100 m/pixel DTM), while polar images were map projected on the LOLA shape model. In addition, the LOLA derived crossover corrected ephemeris, and an improved camera pointing, provide accurate positioning (better than 100 m) of each WAC image. As part of the March 2011 PDS release, the LROC team posted the global map in ten regional tiles. Eight of the tiles are equirectangular projections that encompass 60° latitude by 90° longitude. In addition, two polar stereographic projections are available for each pole from ±60° to the pole. These reduced data records (RDR) products will be available for download on March 15, 2011. As the mission progresses, and our knowledge of the lunar photometric function increases, improved and new mosaics will be released! Work your way around the moon with these six orthographic projections constructed from WAC mosaics. The nearside view linked below is different from that released on 21 February. To read more con't here: <a href="http://www.nasa.gov/mission_pages/LRO/news/lro-farside.html" rel="nofollow">www.nasa.gov/mission_pages/LRO/news/lro-farside.html</a> <b><a href="http://www.nasa.gov/centers/goddard/home/index.html" rel="nofollow">NASA Goddard Space Flight Center</a></b> enables NASA’s mission through four scientific endeavors: Earth Science, Heliophysics, Solar System Exploration, and Astrophysics. Goddard plays a leading role in NASA’s accomplishments by contributing compelling scientific knowledge to advance the Agency’s mission. <b>Follow us on <a href="http://twitter.com/NASA_GoddardPix" rel="nofollow">Twitter</a></b> <b>Join us on <a href="http://www.facebook.com/pages/Greenbelt-MD/NASA-Goddard/395013845897?ref=tsd" rel="nofollow">Facebook</a></b>