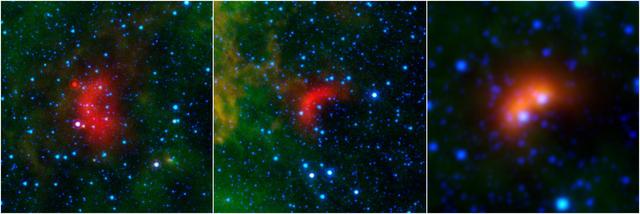
Bow shocks thought to mark the paths of massive, speeding stars are highlighted in these images from NASA's Spitzer Space Telescope and Wide-field Infrared Survey Explorer, or WISE. Cosmic bow shocks occur when massive stars zip through space, pushing material ahead of them in the same way that water piles up in front of a race boat. The stars also produce high-speed winds that smack into this compressed material. The end result is pile-up of heated material that glows in infrared light. In these images, infrared light has been assigned the colored red. Green shows wispy dust in the region and blue shows stars. The two images at left are from Spitzer, and the one on the right is from WISE. The speeding stars thought to be creating the bow shocks can be seen at the center of each arc-shaped feature. The image at right actually consists of two bow shocks and two speeding stars. All the speeding stars are massive, ranging from about 8 to 30 times the mass of our sun. http://photojournal.jpl.nasa.gov/catalog/PIA20062
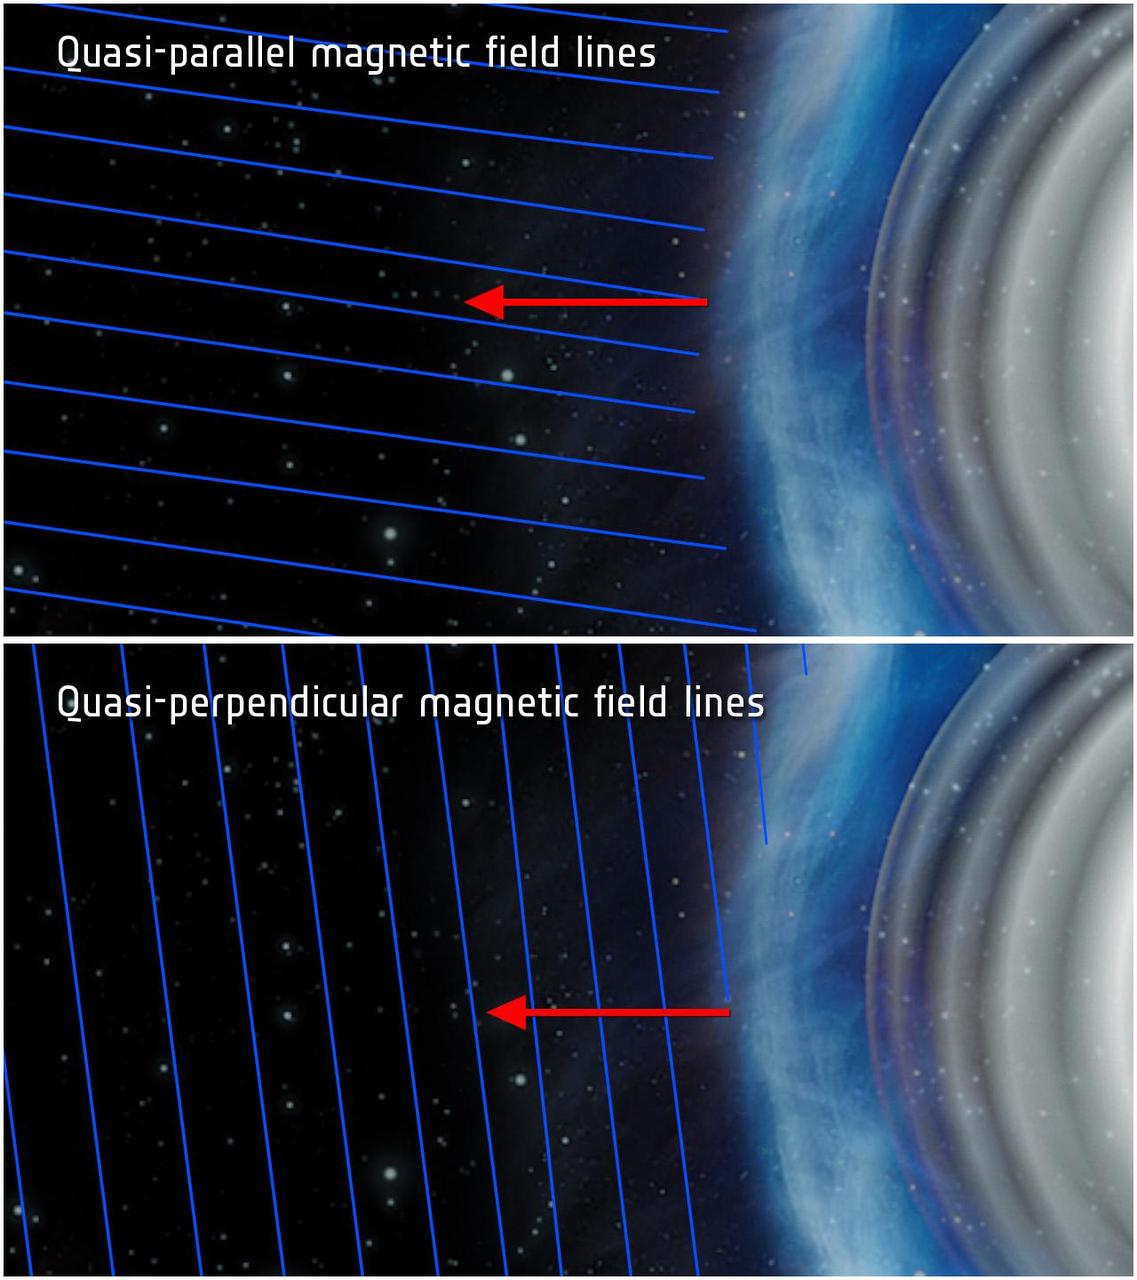
This illustration shows quasi-parallel top and quasi-perpendicular bottom magnetic field conditions at a planetary bow shock. Bow shocks are shockwaves created when the solar wind blows on a planet magnetic field.

This image, taken by the Hubble Space Telescope, shows a bow shock around a very young star, LL Ori. The bow shock shows where the star's heliosphere collides with the interstellar medium. Our star, the Sun, is also surrounded by a heliosphere. https://photojournal.jpl.nasa.gov/catalog/PIA22914

Astronomers using NASA Hubble Space Telescope have found a bow shock around a very young star in the nearby Orion nebula, an intense star-forming region of gas and dust.
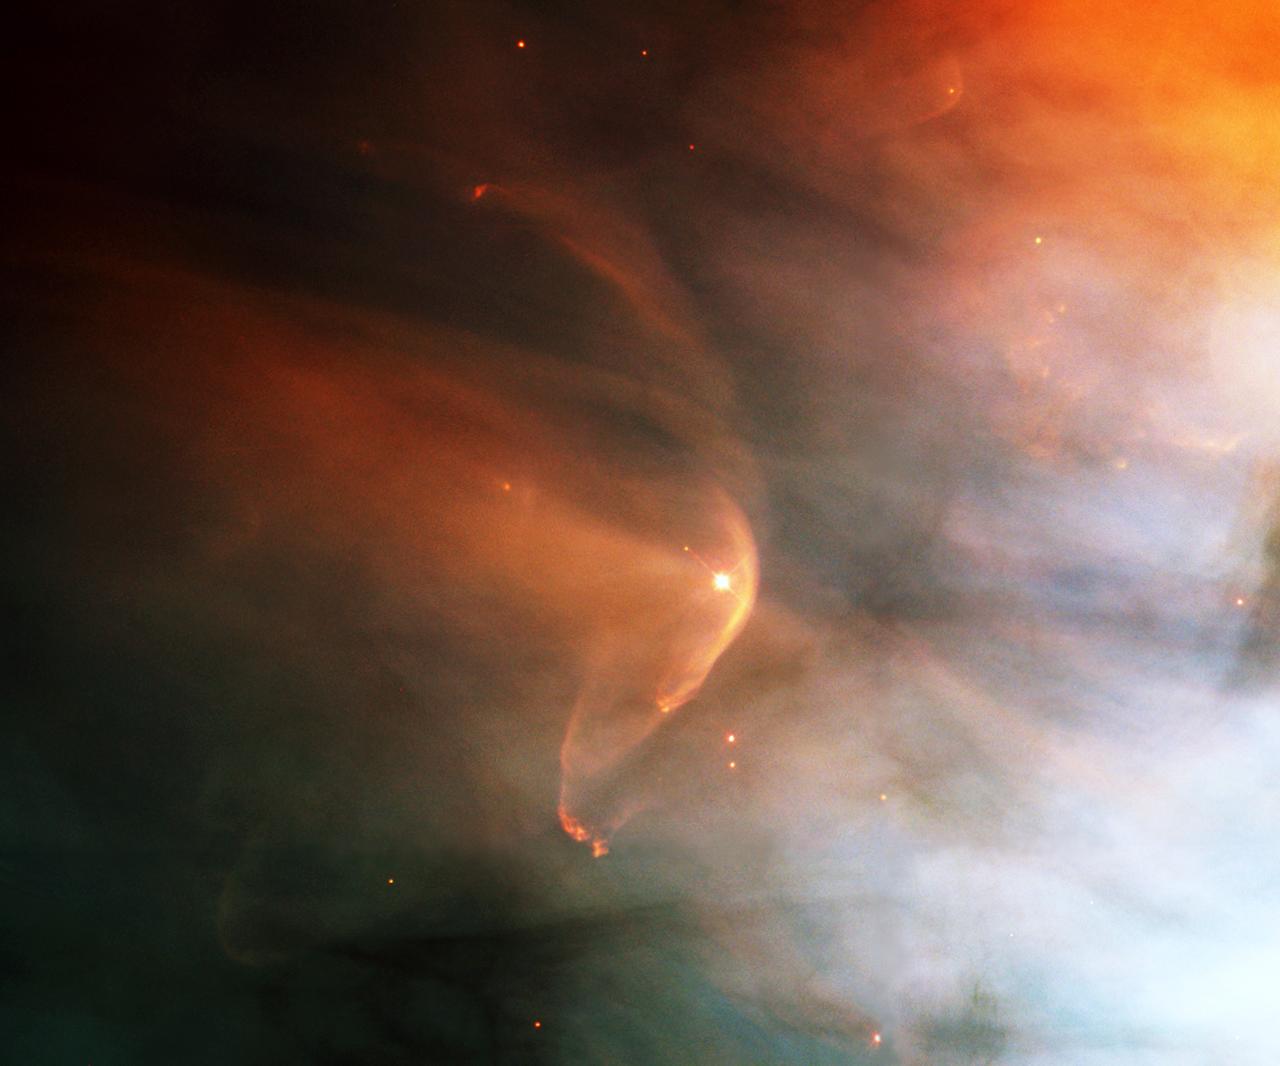
The nearby intense star-forming region known as the Great Nebula in the Orion constellation reveals a bow shock around a very young star as seen by NASA's Hubble Space Telescope (HST). Named for the crescent-shaped wave made by a ship as it moves through the water, a bow shock can be created in space where two streams of gas collide. LL Ori emits a vigorous solar wind, a stream of charged particles moving rapidly outward from the star. Our own sun has a less energetic version of this wind. The material in the fast wind from LL Ori collides with slow moving gas evaporating away form the center of the Orion Nebula, which is located in the lower right of this image, producing the crescent shaped bow shock seen in the image. Astronomers have identified numerous shock fronts in this complex star-forming region and are using this data to understand the many complex phenomena associated with the birth of stars. A close visitor in our Milky Way Galaxy, the nebula is only 1,500 light years away from Earth. The filters used in this color composite represent oxygen, nitrogen, and hydrogen emissions.
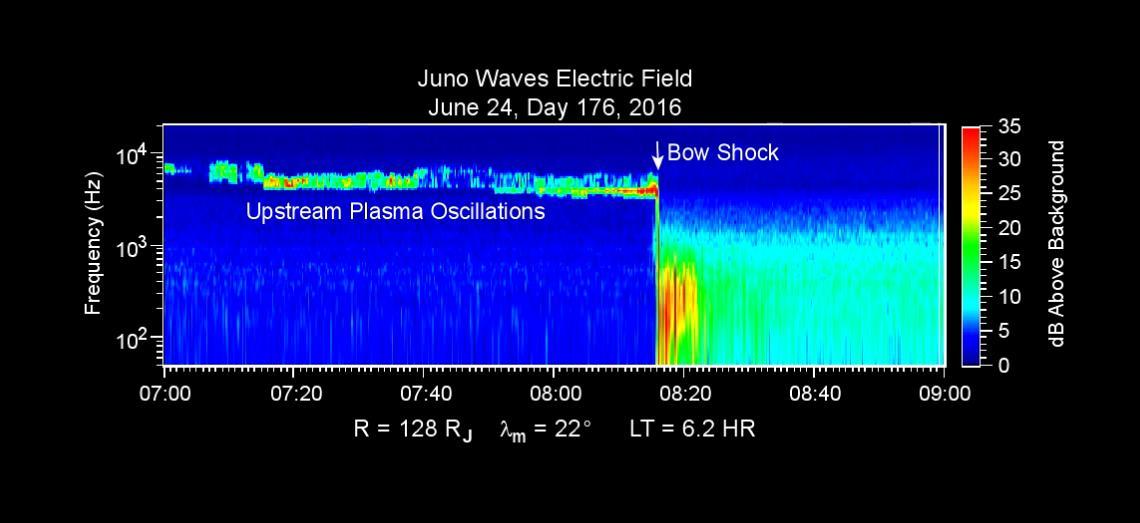
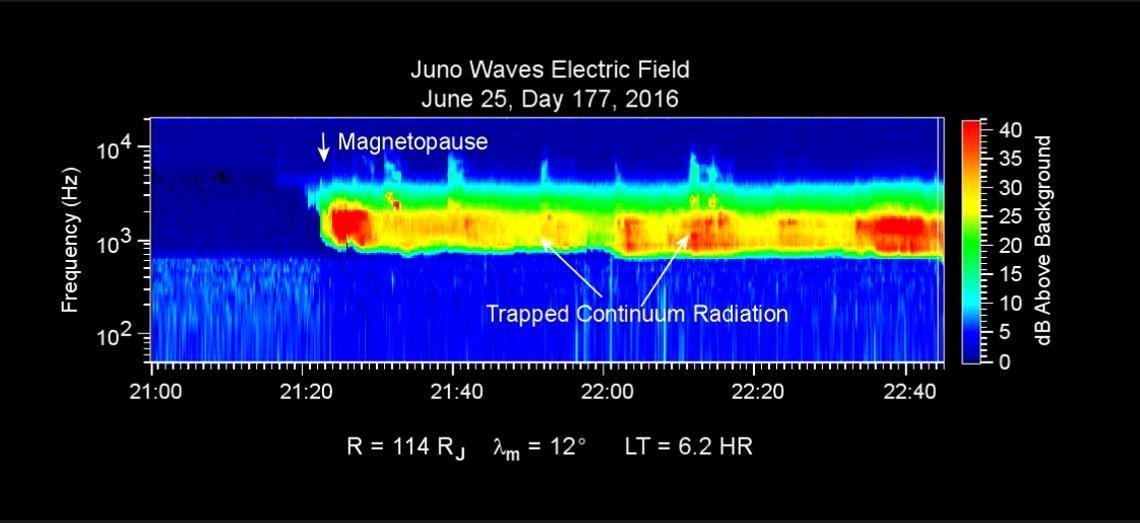
This chart presents data that the Waves investigation on NASA's Juno spacecraft recorded as the spacecraft crossed the bow shock just outside of Jupiter's magnetosphere on June 24, 2016, while approaching Jupiter. Audio accompanies the animation, with volume and pitch correlated to the amplitude and frequency of the recorded waves. The graph is a frequency-time spectrogram with color coding to indicate wave amplitudes as a function of wave frequency (vertical axis, in hertz) and time (horizontal axis, with a total elapsed time of two hours). During the hour before Juno reached the bow shock, the Waves instrument was detecting mainly plasma oscillations just below 10,000 hertz (10 kilohertz). The frequency of these oscillations is related to the local density of electrons; the data yield an estimate of approximately one electron per cubic centimeter (about 16 per cubic inch) in this region just outside Jupiter's bow shock. The broadband burst of noise marked "Bow Shock" is the region of turbulence where the supersonic solar wind is heated and slowed by encountering the Jovian magnetosphere. The shock is analogous to a sonic boom generated in Earth's atmosphere by a supersonic aircraft. The region after the shock is called the magnetosheath. The vertical bar to the right of the chart indicates the color coding of wave amplitude, in decibels (dB) above the background level detected by the Waves instrument. Each step of 10 decibels marks a tenfold increase in wave power. When Juno collected these data, the distance from the spacecraft to Jupiter was about 5.56 million miles (8.95 million kilometers), indicated on the chart as 128 times the radius of Jupiter. Jupiter's magnetic field is tilted about 10 degrees from the planet's axis of rotation. The note of 22 degrees on the chart indicates that at the time these data were recorded, the spacecraft was 22 degrees north of the magnetic-field equator. The "LT" notation is local time on Jupiter at the longitude of the planet directly below the spacecraft, with a value of 6.2 indicating approximately dawn. http://photojournal.jpl.nasa.gov/catalog/PIA20753
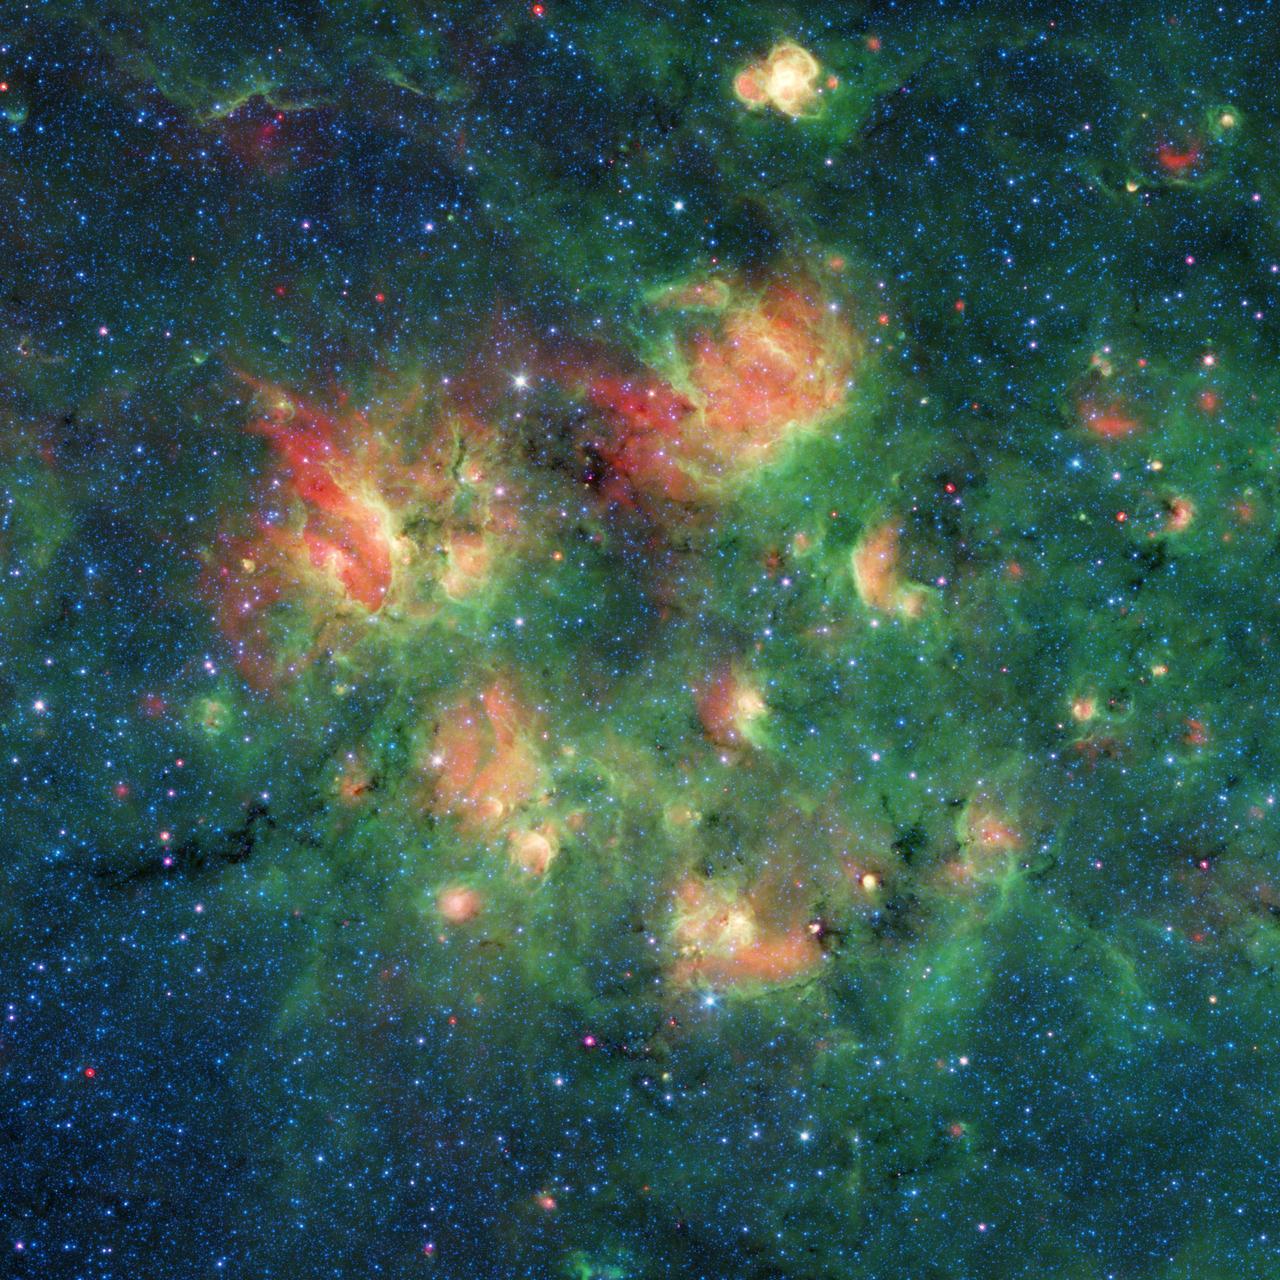
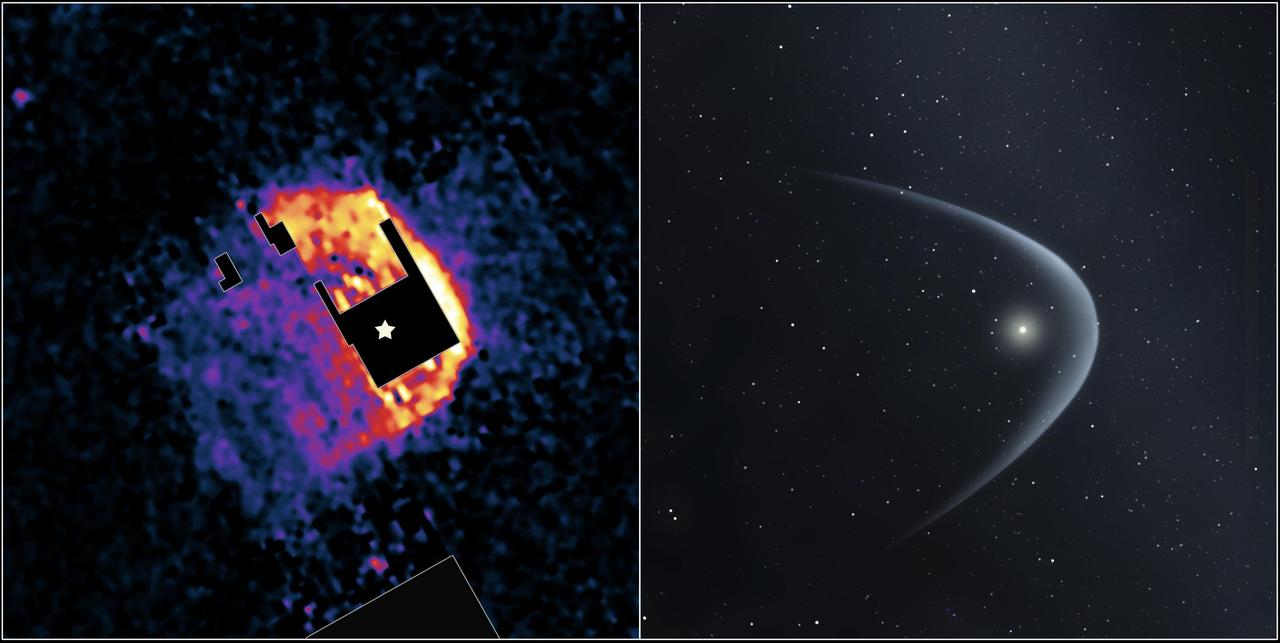
This infrared image from NASA's Spitzer Space Telescope shows a cloud of gas and dust full of bubbles, which are inflated by wind and radiation from massive young stars. Each bubble is filled with hundreds to thousands of stars, which form from dense clouds of gas and dust. The bubbles are estimated to be 10 to 30 light-years across, based on what astronomers know about them and other cosmic bubbles. However, determining the exact sizes of individual bubbles can be difficult, because their distance from Earth is challenging to measure and objects appear smaller the farther away they are. Flows of particles called stellar winds emitted by the stars, as well as the pressure of the light those winds produce, can push the surrounding material outward, sometimes creating a distinct perimeter. In Figure 1, the yellow circles and ovals outline more than 30 bubbles. This active region of star formation is located inside the Milky Way galaxy, in the constellation Aquila (also known as the Eagle). Black veins running throughout the cloud are regions of especially dense cold dust and gas where even more new stars are likely to form. The colors in this image represent different wavelengths of infrared light. Blue represents a wavelength of light primarily emitted by stars; dust and organic molecules called hydrocarbons appear green, and warm dust that's been heated by stars appears red. Also visible are four bow shocks — red arcs of warm dust formed as winds from fast-moving stars push aside dust grains scattered sparsely through most of the nebula. The locations of the bow shocks are indicated by squares in Figure 1. Figure 2 shows zoomed-in views of the four bow shocks. The bubbles and bow shocks in this image were identified as part of The Milky Way Project, a citizen science initiative on Zooniverse.org that seeks to map star formation throughout the galaxy. Participating citizen scientists looked through images from Spitzer's public data archive and identified as many bubbles as they could. More than 78,000 unique user accounts contributed. Astronomers running this program recently published a catalog of the bubble candidates that multiple citizen scientists had identified. The full Milky Way Project catalogs, which list a total of 2,600 bubbles and 599 bow shocks, are described in a paper published recently in Monthly Notices of the Royal Astronomical Society. Animation available at https://photojournal.jpl.nasa.gov/catalog/PIA23402
This image from NASA Spitzer Space Telescope left panel shows the bow shock of a dying star named R Hydrae, or R Hya, in the constellation Hydra.
This chart presents data that the Waves investigation on NASA's Juno spacecraft recorded as the spacecraft crossed the bow shock just outside of Jupiter's magnetosphere on June 24, 2016, while approaching Jupiter. Audio accompanies the animation, with volume and pitch correlated to the amplitude and frequency of the recorded waves. The graph is a frequency-time spectrogram with color coding to indicate wave amplitudes as a function of wave frequency (vertical axis, in hertz) and time (horizontal axis, with a total elapsed time of two hours). During the hour before Juno reached the bow shock, the Waves instrument was detecting mainly plasma oscillations just below 10,000 hertz (10 kilohertz). The frequency of these oscillations is related to the local density of electrons; the data yield an estimate of approximately one electron per cubic centimeter (about 16 per cubic inch) in this region just outside Jupiter's bow shock. The broadband burst of noise marked "Bow Shock" is the region of turbulence where the supersonic solar wind is heated and slowed by encountering the Jovian magnetosphere. The shock is analogous to a sonic boom generated in Earth's atmosphere by a supersonic aircraft. The region after the shock is called the magnetosheath. The vertical bar to the right of the chart indicates the color coding of wave amplitude, in decibels (dB) above the background level detected by the Waves instrument. Each step of 10 decibels marks a tenfold increase in wave power. When Juno collected these data, the distance from the spacecraft to Jupiter was about 5.56 million miles (8.95 million kilometers), indicated on the chart as 128 times the radius of Jupiter. Jupiter's magnetic field is tilted about 10 degrees from the planet's axis of rotation. The note of 22 degrees on the chart indicates that at the time these data were recorded, the spacecraft was 22 degrees north of the magnetic-field equator. The "LT" notation is local time on Jupiter at the longitude of the planet directly below the spacecraft, with a value of 6.2 indicating approximately dawn. http://photojournal.jpl.nasa.gov/catalog/PIA20753
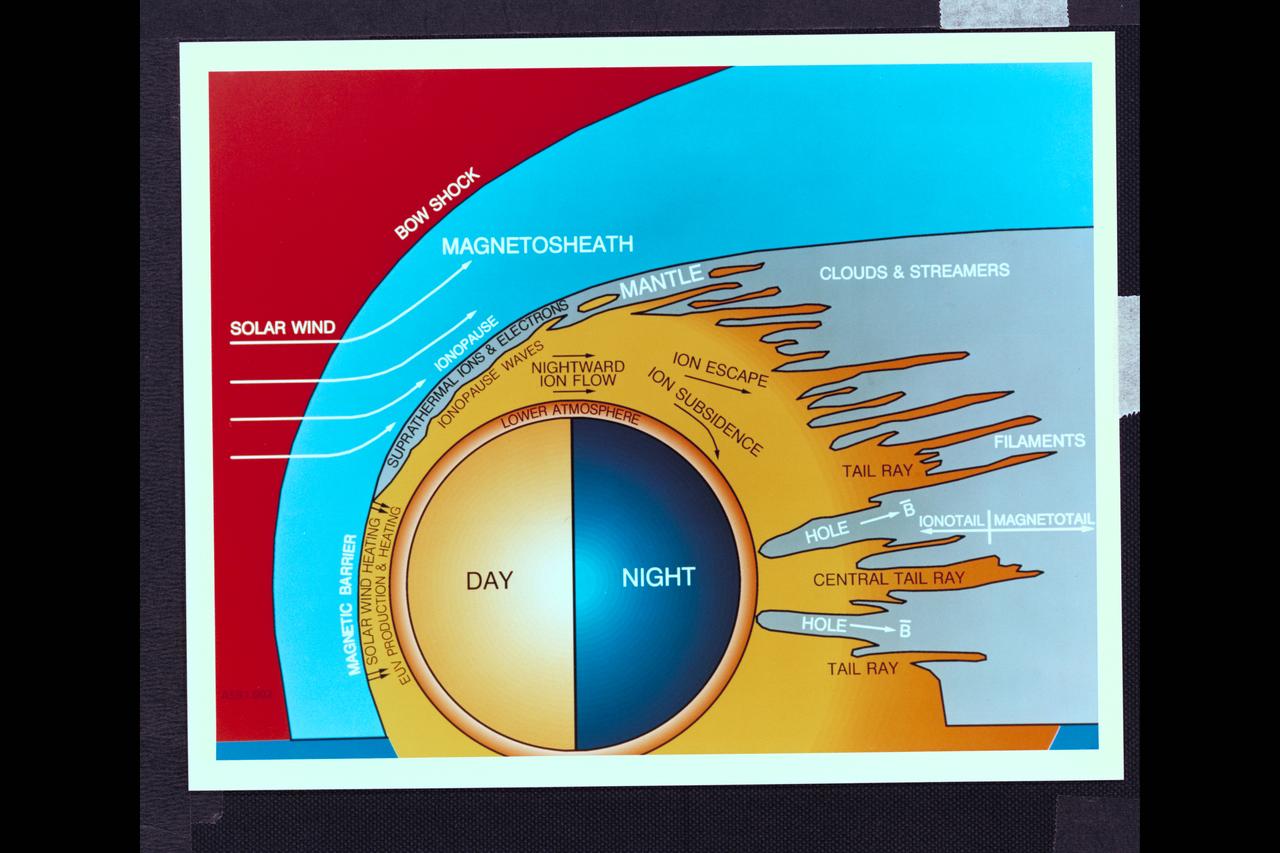
Graphic Art Venus - Day - Night drawing showing solar wind, bow shock, magnetosheath, clouds and streamers Pioneer Venus SP-461 fig 6-28 Interaction of the solar wind with the atmosphere of Venus as termined from Pioner Venus experiments and observations
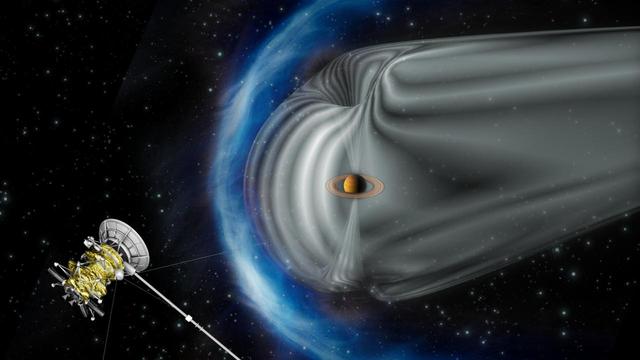
This artist impression by the European Space Agency shows NASA Cassini spacecraft exploring the magnetic environment of Saturn. The image is not to scale.
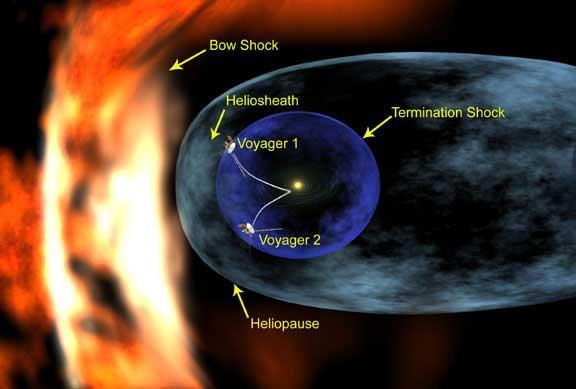
An artist's concept illustrates the positions of the Voyager spacecraft in relation to structures formed around our Sun by the solar wind. Also illustrated is the termination shock, a violent region the spacecraft must pass through before reaching the outer limits of the solar system. At the termination shock, the supersonic solar wind abruptly slows from an average speed of 400 kilometers per second to less than 100 kilometer per second (900,000 to less than 225,000 miles per hour). Beyond the termination shock is the solar system's final frontier, the heliosheath, a vast region where the turbulent and hot solar wind is compressed as it presses outward against the interstellar wind that is beyond the heliopause. A bow shock likely forms as the interstellar wind approaches and is deflected around the heliosphere, forcing it into a teardrop-shaped structure with a long, comet-like tail. The exact location of the termination shock is unknown, and it originally was thought to be closer to the Sun than Voyager 1 currently is. As Voyager 1 cruised ever farther from the Sun, it confirmed that all the planets are inside an immense bubble blown by the solar wind and the termination shock was much more distant. http://photojournal.jpl.nasa.gov/catalog/PIA04927
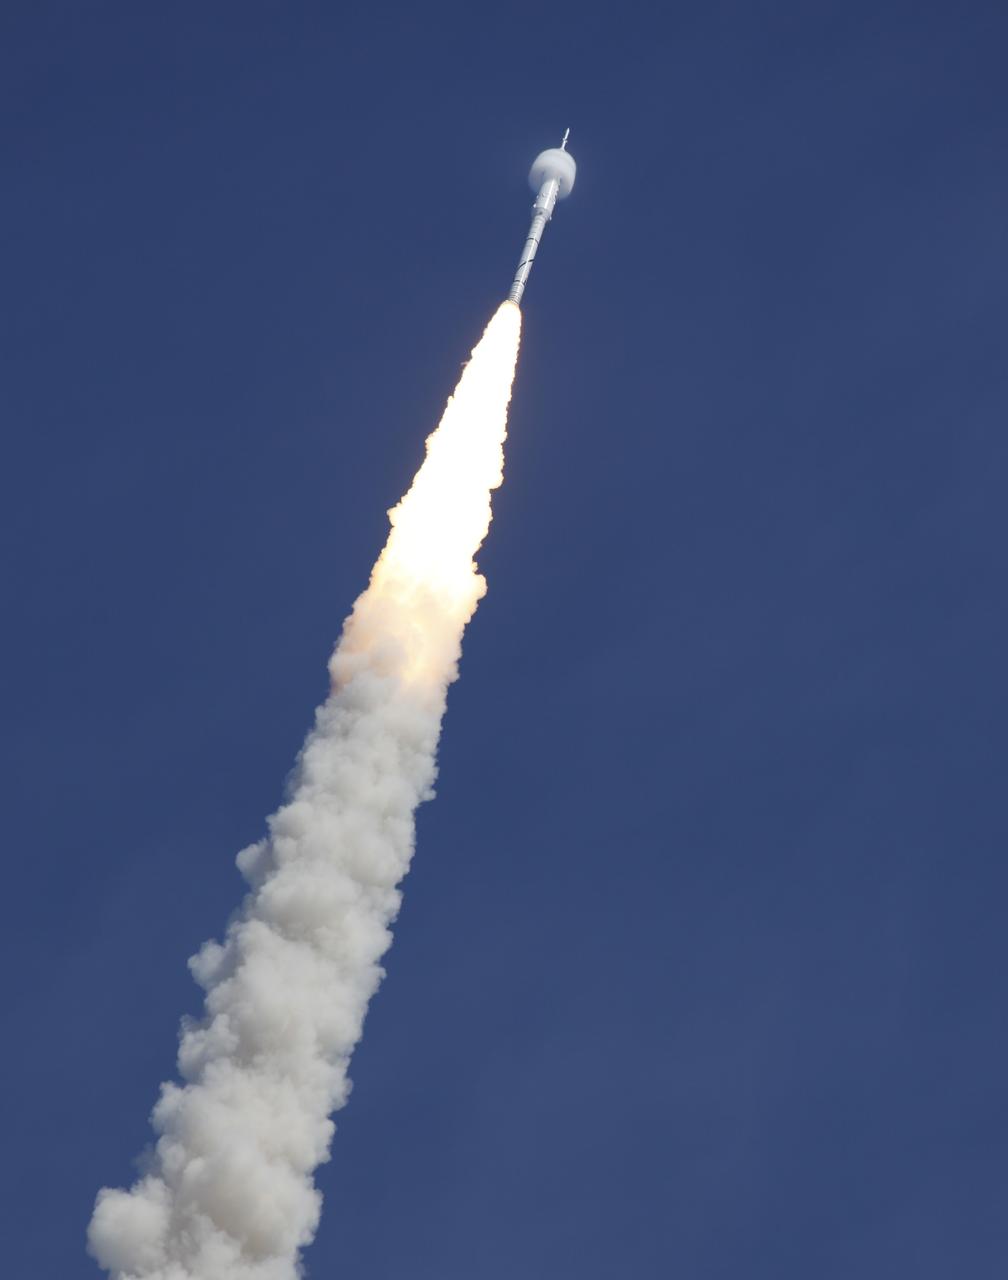
CAPE CANAVERAL, Fla. - A bow shock forms around the Constellation Program's 327-foot-tall Ares I-X test rocket traveling at supersonic speed. The rocket produces 2.96 million pounds of thrust at liftoff and goes supersonic in 39 seconds. Liftoff of the 6-minute flight test from Launch Pad 39B at NASA's Kennedy Space Center in Florida was at 11:30 a.m. EDT Oct. 28. This was the first launch from Kennedy's pads of a vehicle other than the space shuttle since the Apollo Program's Saturn rockets were retired. The parts used to make the Ares I-X booster flew on 30 different shuttle missions ranging from STS-29 in 1989 to STS-106 in 2000. The data returned from more than 700 sensors throughout the rocket will be used to refine the design of future launch vehicles and bring NASA one step closer to reaching its exploration goals. For information on the Ares I-X vehicle and flight test, visit http://www.nasa.gov/aresIX. Photo courtesy of Scott Andrews

This image was compiled using data from NASA's Spitzer Space Telescope using the Infrared Array Camera (IRAC) and the Multiband Imaging Photometer (MIPS) during Spitzer's "cold" mission, before the spacecraft's liquid helium coolant ran out in 2009. The colors correspond with IRAC wavelengths of 3.6 microns (blue), 4.5 microns (cyan) and 8 microns (green), and 24 microns (red) from the MIPS instrument. The green-and-orange delta filling most of this image is a nebula, or a cloud of gas and dust. This region formed from a much larger cloud of gas and dust that has been carved away by radiation from stars. The bright region at the tip of the nebula is dust that has been heated by the stars' radiation, which creates the surrounding red glow. The white color is the combination of four colors (blue, green, orange and red), each representing a different wavelength of infrared light, which is invisible to human eyes. The massive stars illuminating this region belong to a star cluster that extends above the white spot. On the left side of this image, a dark filament runs horizontally through the green cloud. A smattering of baby stars (the red and yellow dots) appear inside it. Known as Cepheus C, the area is a particularly dense concentration of gas and dust where infant stars form. This region is called Cepheus C because it lies in the constellation Cepheus, which can be found near the constellation Cassiopeia. Cepheus-C is about 6 light-years long, and lies about 40 light-years from the bright spot at the tip of the nebula. The small, red hourglass shape just below Cepheus C is V374 Ceph. Astronomers studying this massive star have speculated that it might be surrounded by a nearly edge-on disk of dark, dusty material. The dark cones extending to the right and left of the star are a shadow of that disk. The smaller nebula on the right side of the image includes a blue star crowned by a small, red arc of light. This "runaway star" is plowing through the gas and dust at a rapid clip, creating a shock wave or "bow shock" in front of itself. https://photojournal.jpl.nasa.gov/catalog/PIA23126

NASA image release July 3, 2012 Caption: Resembling a Fourth of July skyrocket, Herbig-Haro 110 is a geyser of hot gas from a newborn star that splashes up against and ricochets off the dense core of a cloud of molecular hydrogen. Although the plumes of gas look like whiffs of smoke, they are actually billions of times less dense than the smoke from a July 4 firework. This Hubble Space Telescope photo shows the integrated light from plumes, which are light-years across. -- Herbig-Haro (HH) objects come in a wide array of shapes, but the basic configuration stays the same. Twin jets of heated gas, ejected in opposite directions away from a forming star, stream through interstellar space. Astronomers suspect that these outflows are fueled by gas accreting onto a young star surrounded by a disk of dust and gas. The disk is the "fuel tank," the star is the gravitational engine, and the jets are the exhaust. When these energetic jets slam into colder gas, the collision plays out like a traffic jam on the interstate. Gas within the shock front slows to a crawl, but more gas continues to pile up as the jet keeps slamming into the shock from behind. Temperatures climb sharply, and this curving, flared region starts to glow. These "bow shocks" are so named because they resemble the waves that form at the front of a boat. In the case of the single HH 110 jet, astronomers observe a spectacular and unusual permutation on this basic model. Careful study has repeatedly failed to find the source star driving HH 110, and there may be good reason for this: perhaps the HH 110 outflow is itself generated by another jet. Astronomers now believe that the nearby HH 270 jet grazes an immovable obstacle - a much denser, colder cloud core - and gets diverted off at about a 60-degree angle. The jet goes dark and then reemerges, having reinvented itself as HH 110. The jet shows that these energetic flows are like the erratic outbursts from a Roman candle. As fast-moving blobs of gas catch up and collide with slower blobs, new shocks arise along the jet's interior. The light emitted from excited gas in these hot blue ridges marks the boundaries of these interior collisions. By measuring the current velocity and positions of different blobs and hot ridges along the chain within the jet, astronomers can effectively "rewind" the outflow, extrapolating the blobs back to the moment when they were emitted. This technique can be used to gain insight into the source star's history of mass accretion. This image is a composite of data taken with Hubble's Advanced Camera for Surveys in 2004 and 2005 and the Wide Field Camera 3 in April 2011. Credit: NASA, ESA, and the Hubble Heritage Team (STScI/AURA) <b><a href="http://www.nasa.gov/audience/formedia/features/MP_Photo_Guidelines.html" rel="nofollow">NASA image use policy.</a></b> <b><a href="http://www.nasa.gov/centers/goddard/home/index.html" rel="nofollow">NASA Goddard Space Flight Center</a></b> enables NASA’s mission through four scientific endeavors: Earth Science, Heliophysics, Solar System Exploration, and Astrophysics. Goddard plays a leading role in NASA’s accomplishments by contributing compelling scientific knowledge to advance the Agency’s mission. <b>Follow us on <a href="http://twitter.com/NASA_GoddardPix" rel="nofollow">Twitter</a></b> <b>Like us on <a href="http://www.facebook.com/pages/Greenbelt-MD/NASA-Goddard/395013845897?ref=tsd" rel="nofollow">Facebook</a></b> <b>Find us on <a href="http://instagrid.me/nasagoddard/?vm=grid" rel="nofollow">Instagram</a></b>
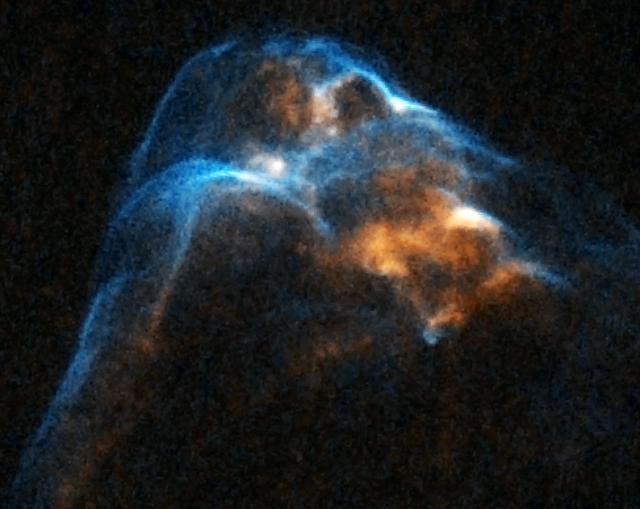
AUGUST 31, 2011: A team of scientists has collected enough high-resolution Hubble Space Telescope images over a 14-year period to stitch together time-lapse movies of powerful jets ejected from three young stars. The jets, a byproduct of gas accretion around newly forming stars, shoot off at supersonic speeds in opposite directions through space. These phenomena are providing clues about the final stages of a star’s birth, offering a peek at how our Sun came into existence 4.5 billion years ago. Hubble’s unprecedented sharpness allows astronomers to see changes in the jets over just a few years’ time. Most astronomical processes change over timescales that are much longer than a human lifetime. To read more go to: <a href="http://www.nasa.gov/mission_pages/hubble/science/supersonic-jets.html" rel="nofollow">www.nasa.gov/mission_pages/hubble/science/supersonic-jets...</a> Object Name: HH 34 Bow Shock Image Type: Astronomical Credit: NASA, ESA, and P. Hartigan (Rice University)..<b><a href="http://www.nasa.gov/centers/goddard/home/index.html" rel="nofollow">NASA Goddard Space Flight Center</a></b> enables NASA’s mission through four scientific endeavors: Earth Science, Heliophysics, Solar System Exploration, and Astrophysics. Goddard plays a leading role in NASA’s accomplishments by contributing compelling scientific knowledge to advance the Agency’s mission. <b>Follow us on <a href="http://twitter.com/NASA_GoddardPix" rel="nofollow">Twitter</a></b> <b>Like us on <a href="http://www.facebook.com/pages/Greenbelt-MD/NASA-Goddard/395013845897?ref=tsd" rel="nofollow">Facebook</a></b> <b>Find us on <a href="http://instagrid.me/nasagoddard/?vm=grid" rel="nofollow">Instagram</a></b>