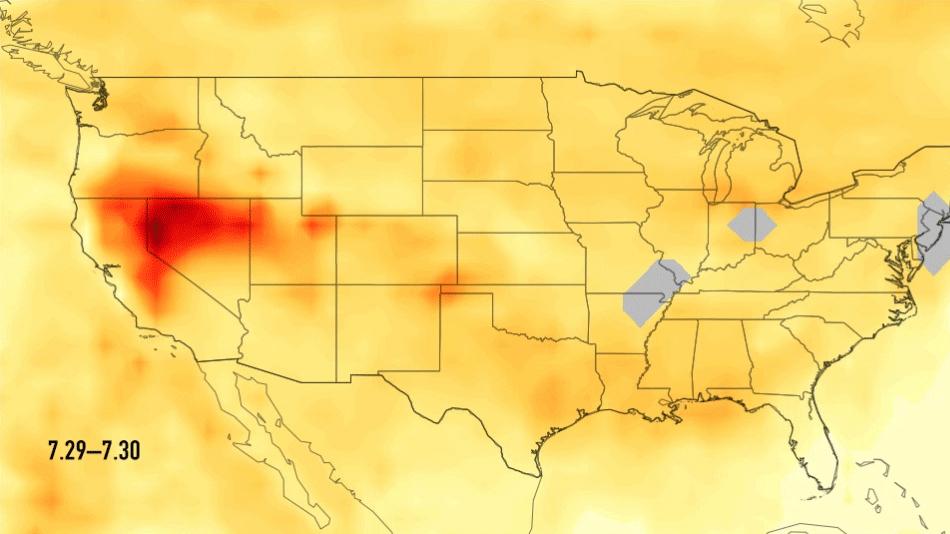
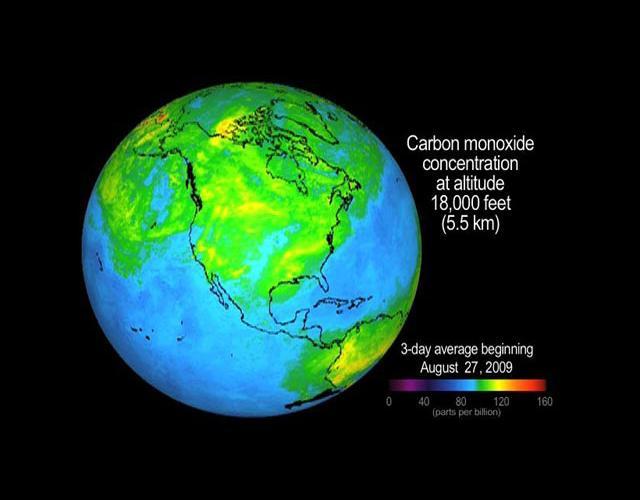
This single frame from a series of images shows carbon monoxide (in orange/red) from California's massive wildfires drifting east across the U.S. between July 30 and August 7, 2018. It was produced using data from the Atmospheric Infrared Sounder (AIRS) on NASA's Aqua satellite. AIRS measures concentrations of carbon monoxide that have been lofted high into the atmosphere. These images show the carbon monoxide at a 500 hPa pressure level, or an altitude of approximately 18,000 feet (5,500 meters). As the time series progresses, we see that this carbon monoxide is drifting east with one branch moving toward Texas and the other forking to the northeast. The high end of the scale is set to 200 parts per billion by volume (ppbv); however, local values can be significantly higher. Carbon monoxide is a pollutant that can persist in the atmosphere for about one month and can be transported large distances. It plays a role in both air pollution and climate change. An animation and single frames are available at https://photojournal.jpl.nasa.gov/catalog/PIA22492
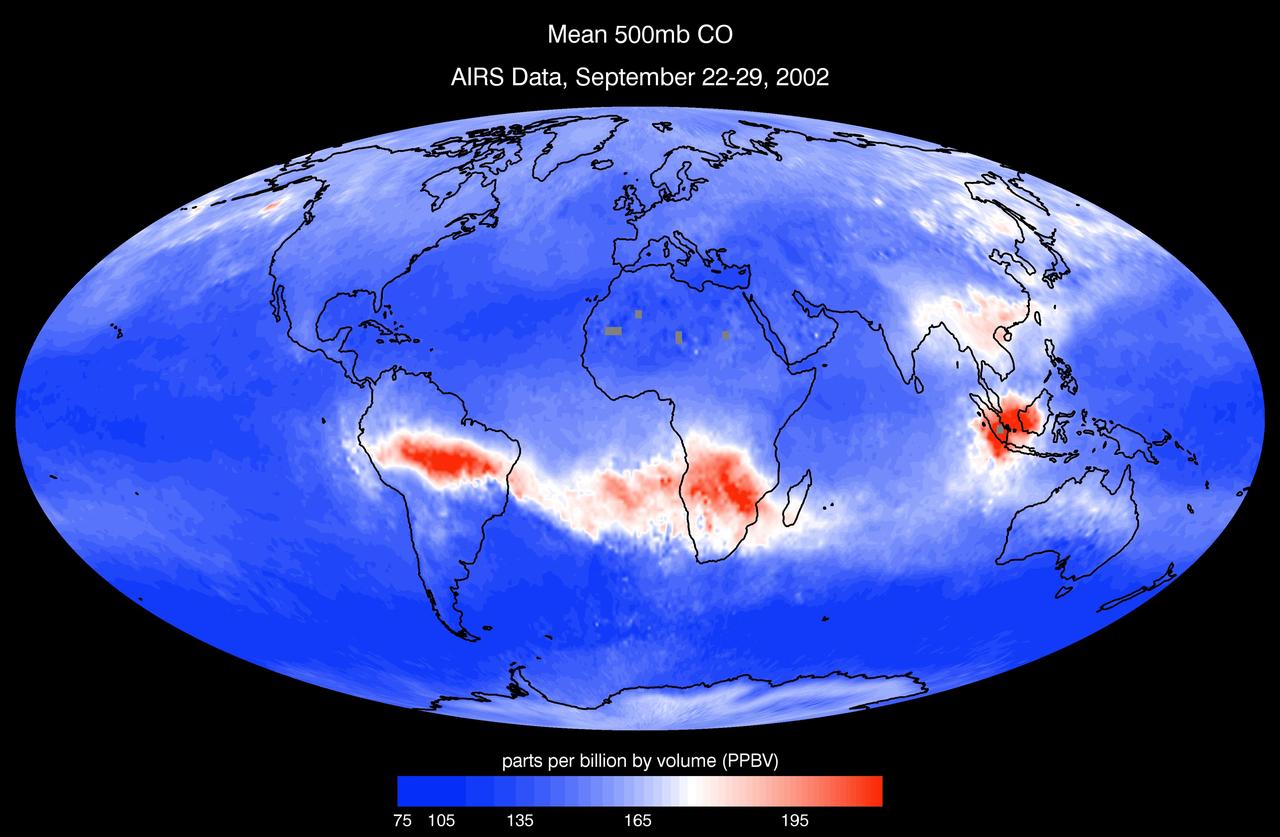
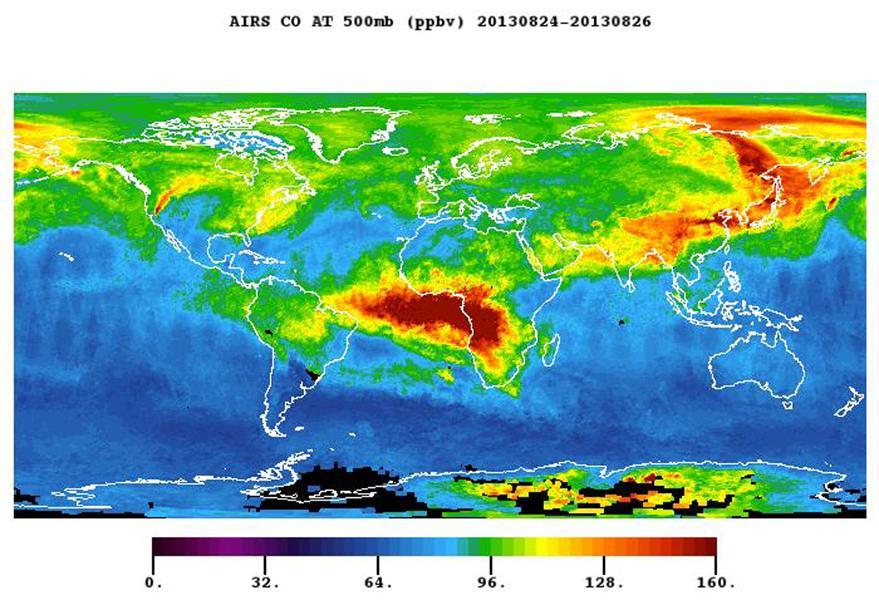
AIRS mean carbon monoxide at 500 millibar, September 22-29, 2002 AIRS Mean Carbon Monoxide at 500 Millibar, September 22-29, 2002.
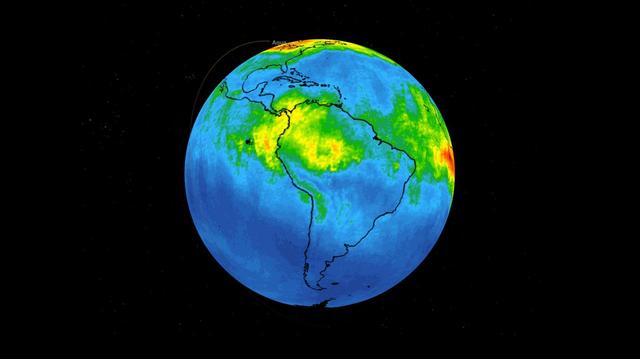
This time series shows carbon monoxide associated with fires from the Amazon region in Brazil from Aug. 8-22, 2019. The images show carbon monoxide at an hPA — a common unit of measurement for atmospheric pressure — of 500, or approximately 18,000 feet (5,500 meters) altitude, made with data collected from the Atmospheric Infrared Sounder (AIRS) on NASA's Aqua satellite. Each "day" in the series is made by averaging three day's-worth of measurements, a technique used to eliminate data gaps. As the series progresses, the carbon monoxide plume blooms in the northwest Amazon region then drifts south and east in a more concentrated plume toward Sao Paulo. Green indicates concentrations of carbon monoxide at approximately 100 parts per billion by volume (ppbv), yellow at approximately 120 ppbv, and dark red at approximately 160 ppbv. It must be noted that local values can be significantly higher. Carbon monoxide is a pollutant that can be transported large distances and persist in the atmosphere for about one month. It plays a role in both air pollution and climate change. Movie available at https://photojournal.jpl.nasa.gov/catalog/PIA23356
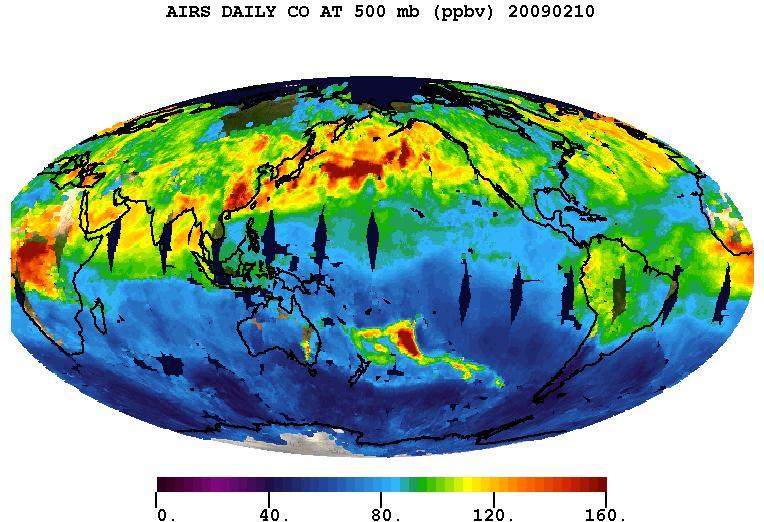
Carbon monoxide from the Australian fires of February, 2009, as seen by the Atmospheric Infrared Sounder AIRS on NASA Aqua satellite.
Carbon monoxide in the smoke from the Station fire was lofted high into the atmosphere, where it was observed by JPL Atmospheric Infrared Sounder instrument onboard NASA Aqua satellite. Animation available at the Photojournal.
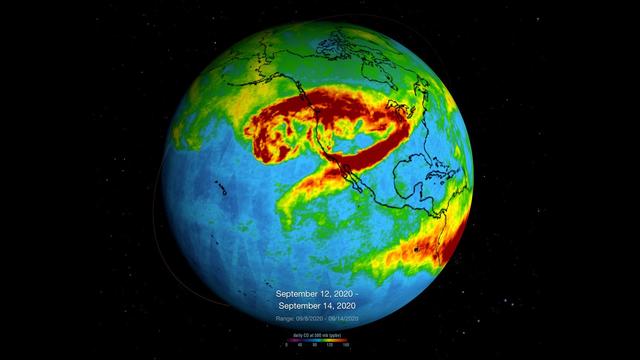
NASA's Atmospheric Infrared Sounder (AIRS), which is aboard the Aqua satellite, captured carbon monoxide plumes coming from California wildfires last week. There were 28 major wildfires burning across the state as of Sept. 14. This includes the August Complex Fire, which started on Aug. 17 and has since burned over 471,000 acres, making it the largest fire on record in California. The animation shows three-day averages of carbon monoxide concentrations around 3 miles (5 kilometers) up in the atmosphere between Sept. 6 and 14. The red and orange areas indicate regions with extremely high carbon monoxide concentrations of greater than 350 parts per billion by volume (ppbv). The more normal, background concentrations of carbon monoxide show up as yellow and green, with amounts between 30 and 50 ppbv. A pollutant that can travel large distances, carbon monoxide can persist in the atmosphere for about a month. At the high altitude mapped in these images, the gas has little effect on the air we breathe; however, strong winds can carry it downward to where it can significantly impact air quality. Carbon monoxide plays a role in both air pollution and climate change. The intense heat from the wildfires lofted the carbon monoxide high into the atmosphere, enabling detection by the AIRS instrument. The jet stream then blew the carbon monoxide plume eastward across the U.S. and over the Atlantic Ocean. Movie available at https://photojournal.jpl.nasa.gov/catalog/PIA23789
A series of maps of the transport of carbon monoxide generated by Alaska Fires, July 2004, created by data from the Atmospheric Infrared Sounder AIRS on NASA Aqua satellite.

Carbon monoxide from California wildfire, a visualization created using data from the Atmospheric Infrared Sounder AIRS on NASA Aqua satellite, June-July, 2008.
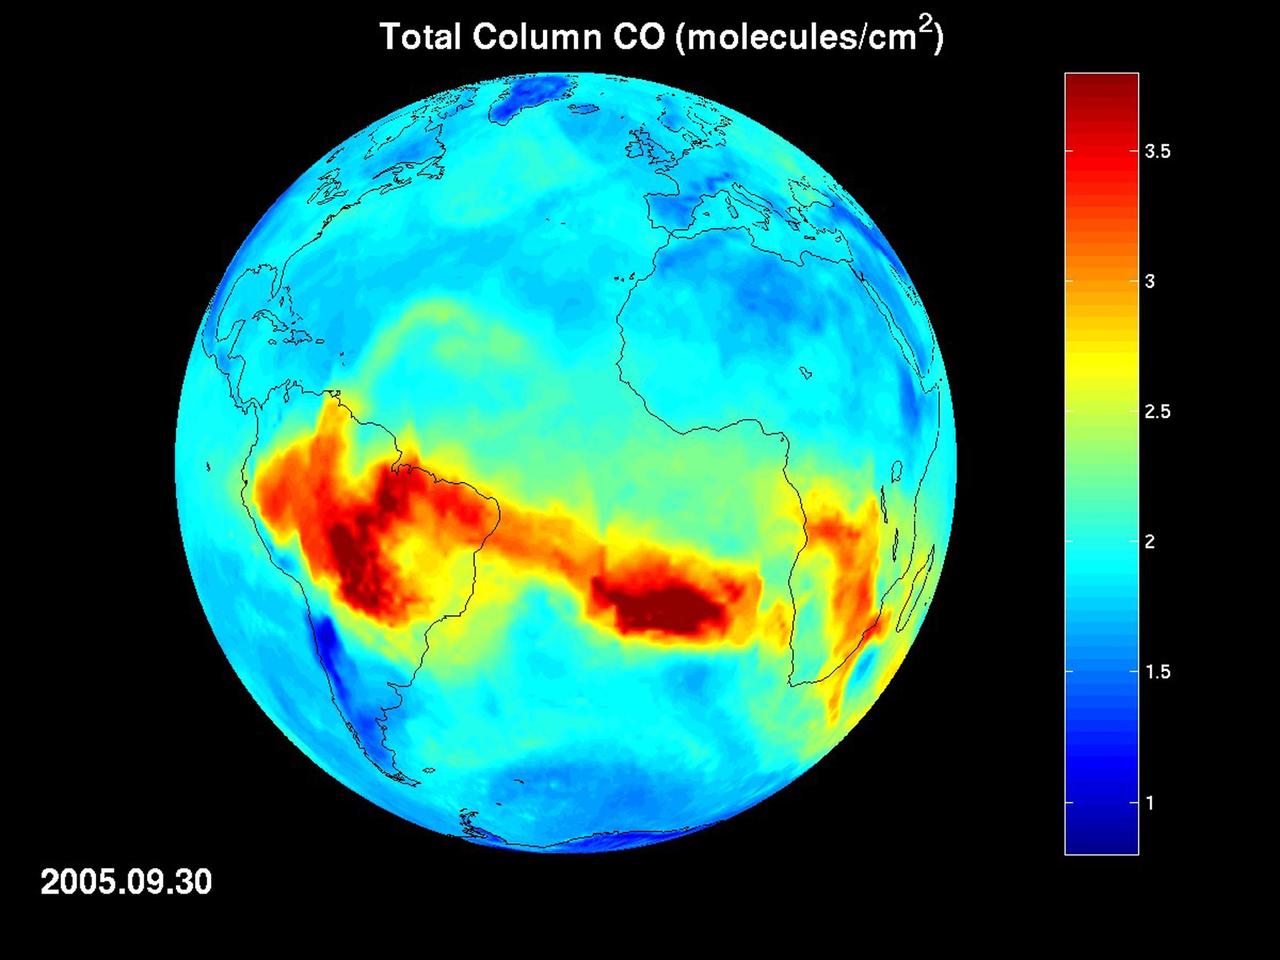
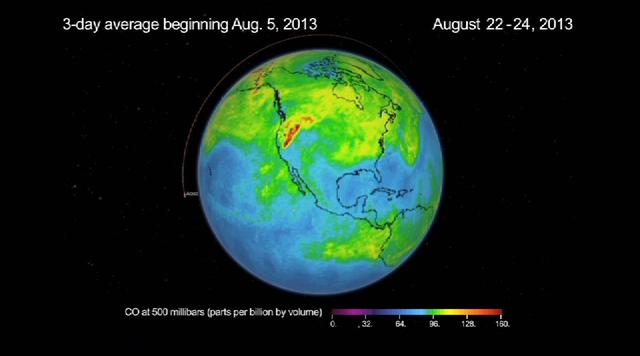
Map of carbon monoxide draped on globe: time Series from 8/1/2005 to 9/30/2005 from the Atmospheric Infrared Sounder AIRS on NASA Aqua satellite.
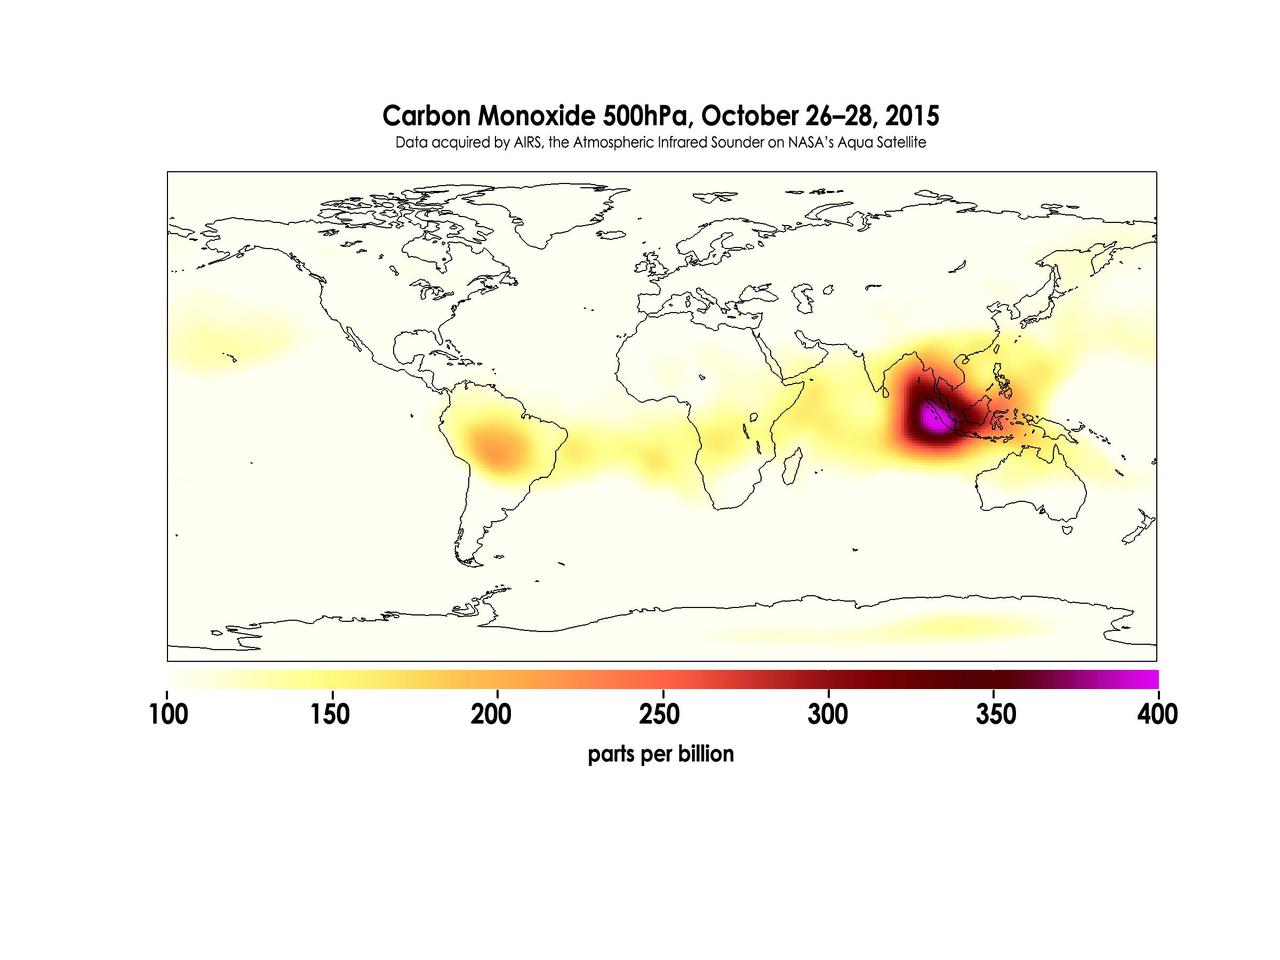
Widespread forest fires across Indonesia have burned tens of thousands of acres over three months, causing high levels of pollution, loss of life, and billions of dollars to the Indonesian government. It is estimated that more than 43 million people have been inhaling toxic fumes, and large parts of Indonesia have been placed in a state of emergency. Most of the fires are believed to have been set to clear farmland during the dry season, but a long term drought enhanced by El Niño conditions have contributed to the fires remaining unchecked due to lack of rain. These images made with data acquired by AIRS, the Atmospheric Infrared Sounder on NASA's Aqua Satellite, show the global concentration of carbon monoxide at the 500hPa pressure level, or approximately 18,000 feet (5,500 meters) altitude. The data are an average of measurements taken over three days, from October 14 through 16, and October 26 through 28, and the high concentration and large extent of the fires over Indonesia are quite apparent. While the scale for this image extends to 400 parts per billion, local values of carbon monoxide can be significantly higher. http://photojournal.jpl.nasa.gov/catalog/PIA20042
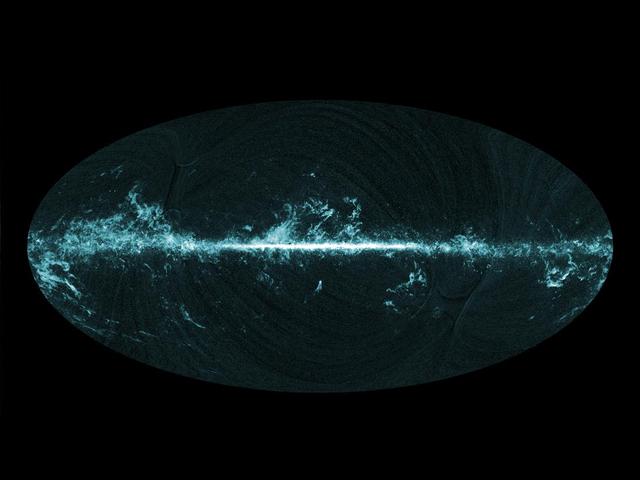
This all-sky image shows the distribution of carbon monoxide CO, a molecule used by astronomers to trace molecular clouds across the sky, as seen by Planck.
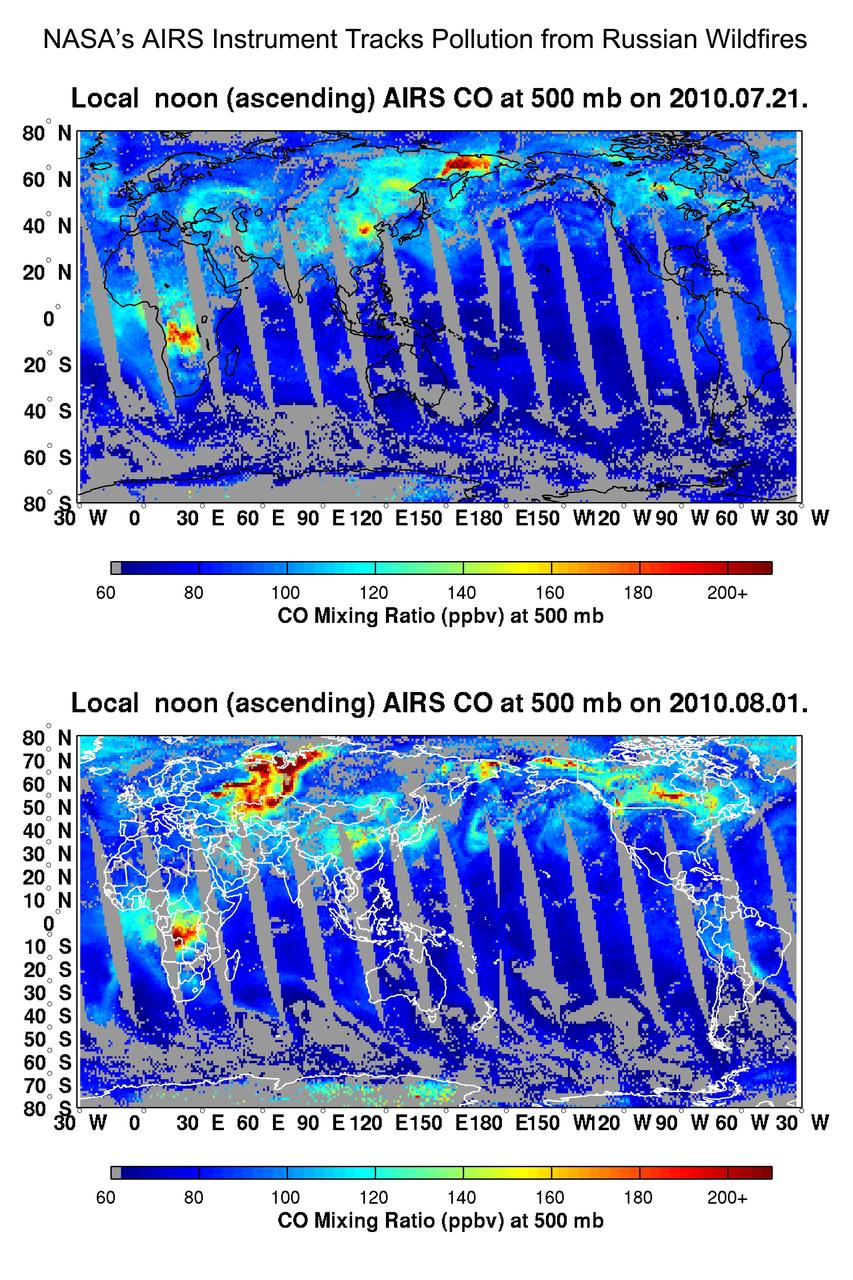
NASA Aqua spacecraft tracked the concentration and transport of carbon monoxide from Russian fires in 2010, during which time some 558 fires were burning.
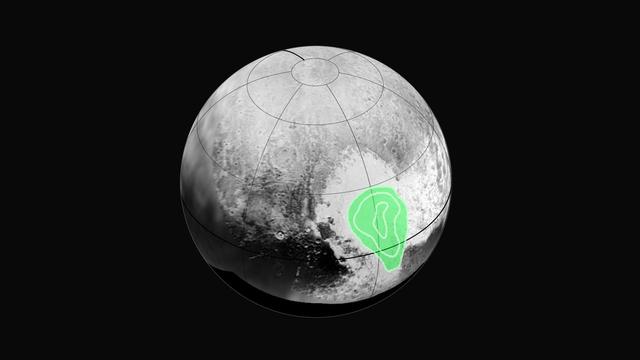
Peering closely at the "heart of Pluto," in the western half of what mission scientists have informally named Tombaugh Regio (Tombaugh Region), NASA's New Horizons' Ralph instrument revealed evidence of carbon monoxide ice. The contours indicate that the concentration of frozen carbon monoxide increases towards the center of the "bull's eye." These data were acquired by the spacecraft on July 14 and transmitted to Earth on July 16. http://photojournal.jpl.nasa.gov/catalog/PIA19718
The plume of carbon monoxide pollution from the Rim Fire burning in and near Yosemite National Park, Calif., shows a three-day running average of daily measurements from NASA Aqua spacecraft.
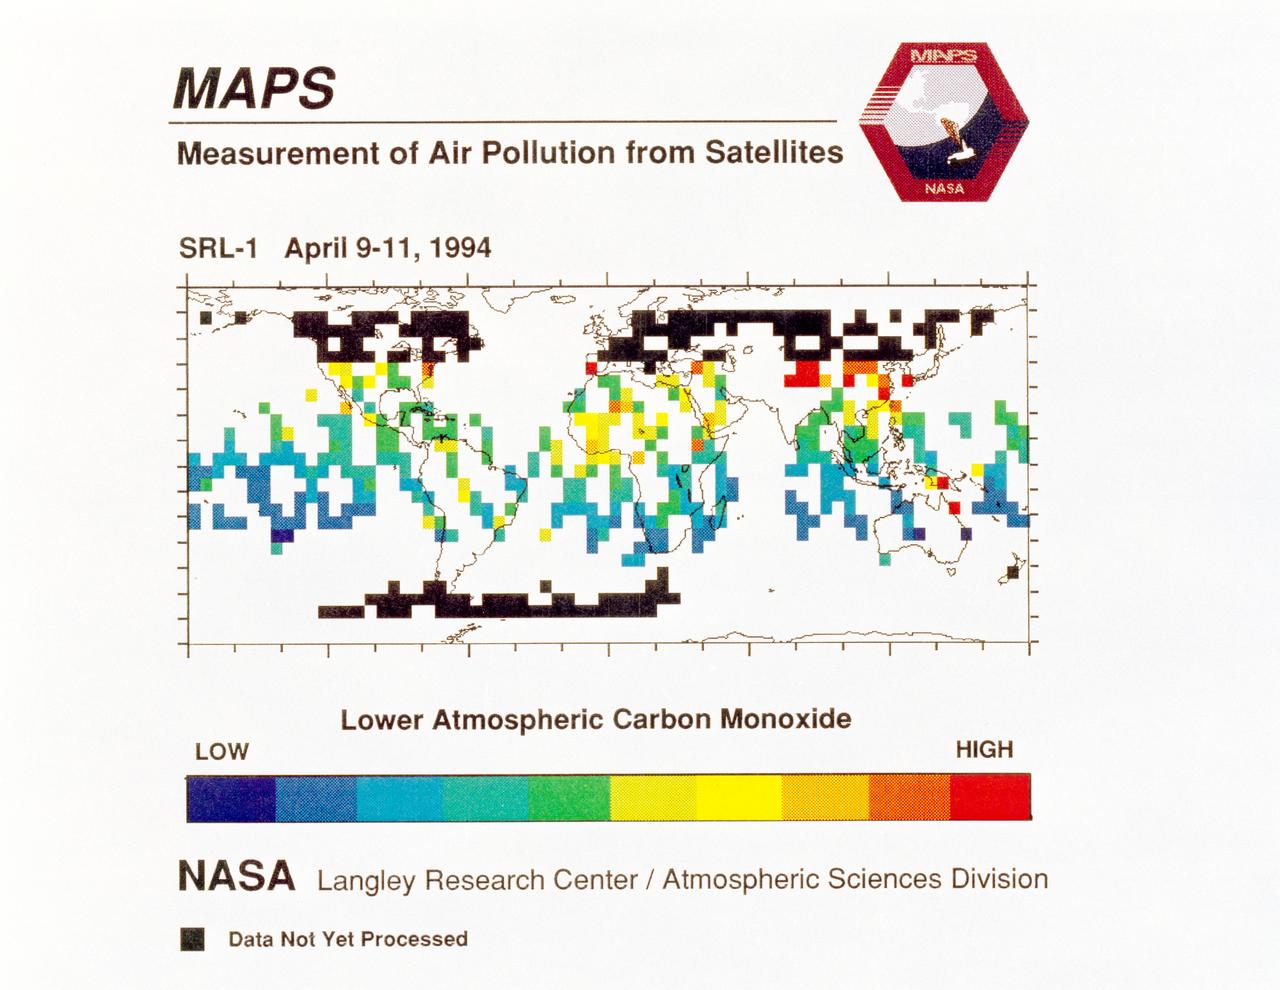
STS059-S-040 (12 April 1994) --- STS-59's MAPS (Measurement of Air Pollution from Satellites) experiment is sending real-time data that provides the most comprehensive view of carbon monoxide concentrations on Earth ever recorded. This computer image shows a summary of "quick look" data obtained by the MAPS instrument during its first days of operations as part of the Space Shuttle Endeavour's SRL-1 payload. This data will be processed using more sophisticated techniques following the flight. The color red indicates areas with the highest levels of carbon monoxide. These Northern Hemisphere springtime carbon monoxide values are generally significantly higher than the values found in the Southern Hemisphere. This is in direct contrast to the data obtained by the MAPS experiment during November 1981 and October 1984, i.e. during Northern Hemisphere fall. The astronauts aboard Endeavour have seen fires in most of the areas showing higher carbon monoxide values (China, Eastern Australia, and equatorial Africa). The relationship between the observed fires and the higher carbon monoxide values will be investigated following SRL-1 by combining the MAPS data with meteorological data, surface imagery, and Space Shuttle hand-held photographs. By the end of SRL-1, MAPS will have acquired data over most of the globe between 57 degrees north and 57 degrees south latitudes. The entire data set will be carefully analyzed using sophisticated post-flight data processing techniques. The data will then be applied in a variety of scientific studies concerning chemistry and transport processes in the atmosphere. The MAPS experiment measures the carbon monoxide in the lower atmosphere. This gas is produced both as a result of natural processes and as a result of human activities. The primary human resources of carbon monoxide are automobiles and industry and the burning of plant materials. The primary natural source is the interaction of sunlight with naturally occurring ozone and water vapor. The strength of all of these sources changes seasonally.
This frame from a movie was produced with data from NASA Aqua spacecraft showing the spread of carbon monoxide pollution across North America from fires in the Western U.S., including the Beaver Creek Fire in Idaho and the Rim Fire in California.
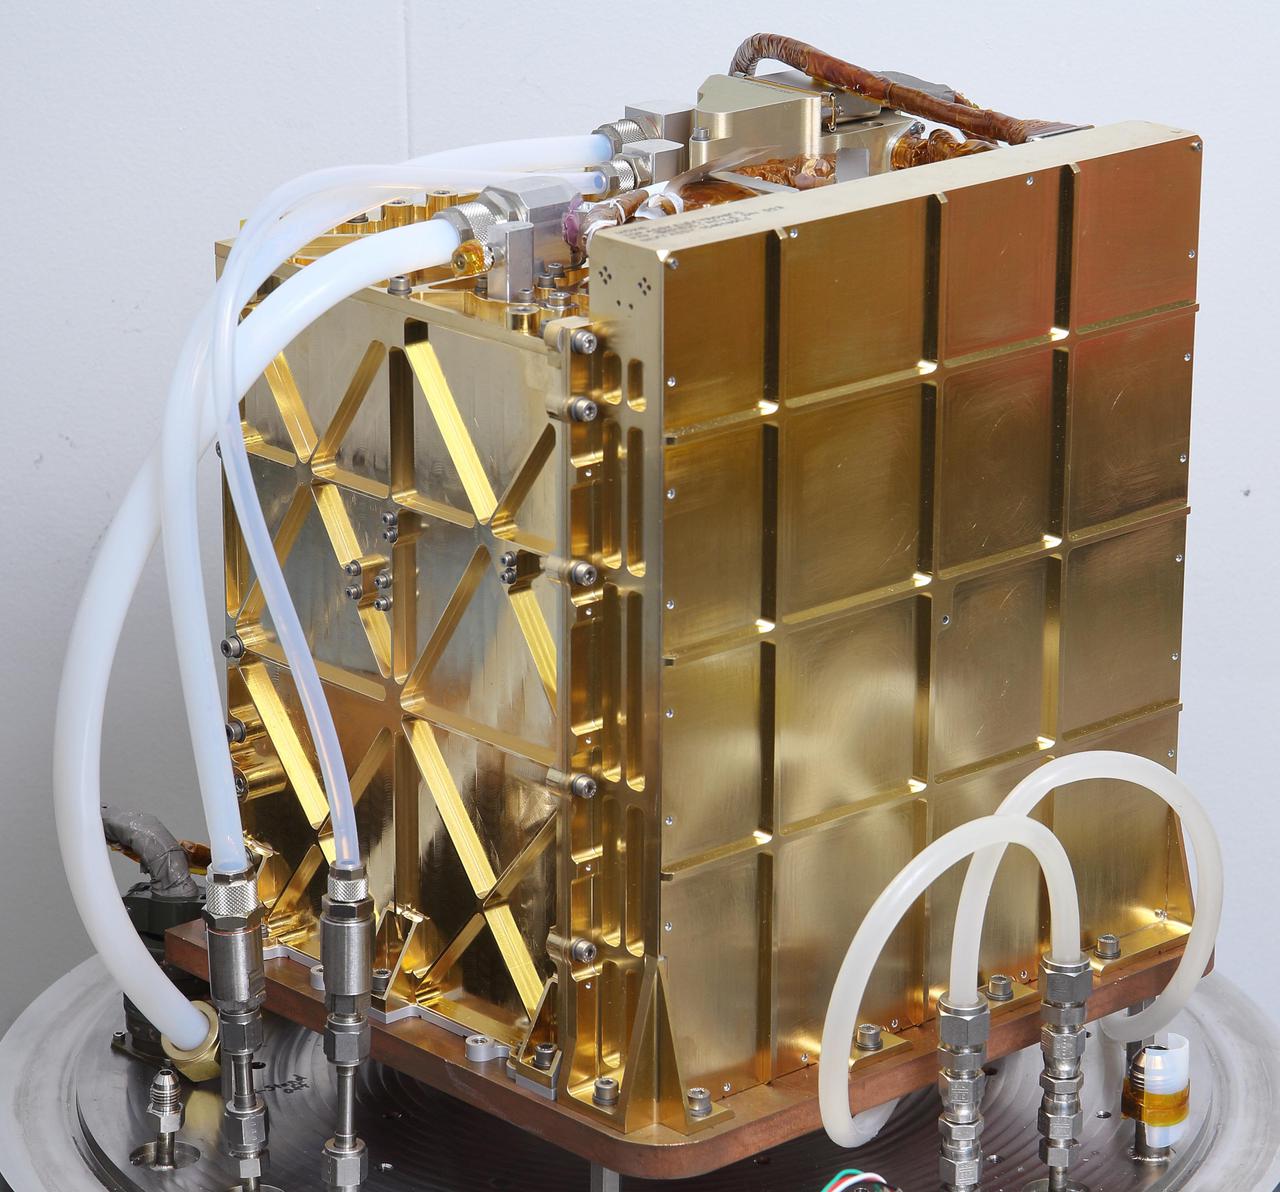
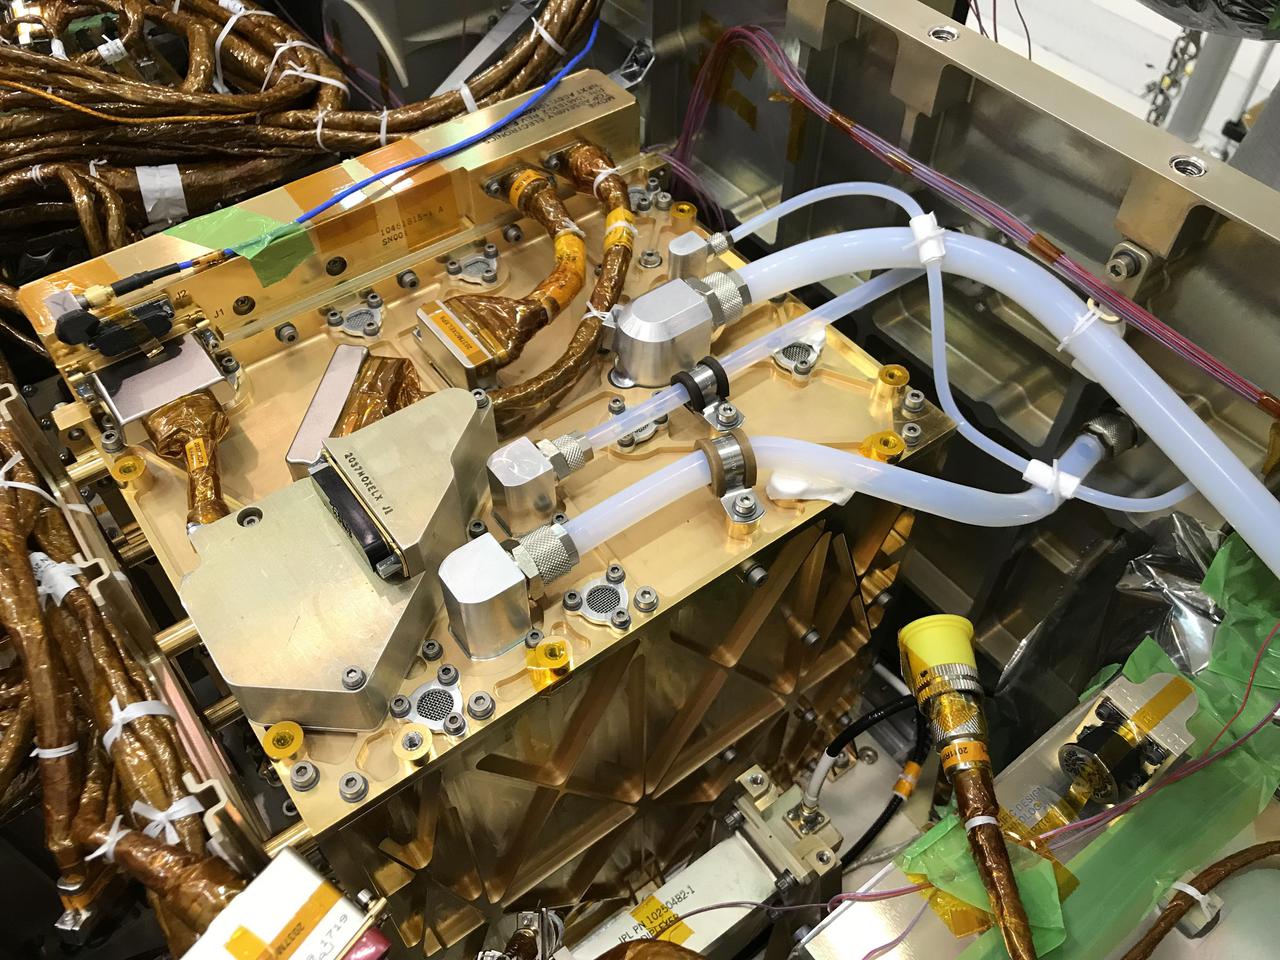
The engineering model (EM), an almost identical twin of MOXIE, is used for testing in the lab at NASA's Jet Propulsion Laboratory in Pasadena, California. Inside this gold-plated aluminum box is the Solid Oxide Electrolysis unit, or SOXE, the heart of MOXIE. Using an electrochemical process called electrolysis, SOXE takes in the carbon dioxide gas and splits it into carbon monoxide and oxygen, which is measured for purity, filtered, and then released back into the Mars atmosphere. Tubes to take in the Mars atmosphere and vent oxygen and carbon monoxide produced by the EM are connected at the top of the EM. The electronics needed to run this complex machine are housed inside the larger sidewall seen on the right. https://photojournal.jpl.nasa.gov/catalog/PIA24201

SCI2016_0006: Map of Cepheus E emphasizing the jets of material flowing to the upper left and lower right from the protostar. The protostar itself is the central yellow-red 'blob" in the colored background map of hydrogen emission made at a wavelength of 4.5 microns by the Spitzer infrared space telescope. The contour curves show the strength of emission from cool carbon monoxide gas measured by the Plateau de Bure radio telescope located in the French Alps. Lefloch et al. used GREAT on SOFIA to measure the amount and velocity of hot carbon monoxide gas at multiple positions along both "wings" of the outflow jet. Credit: Lefloch et al. 2015 Figure 1
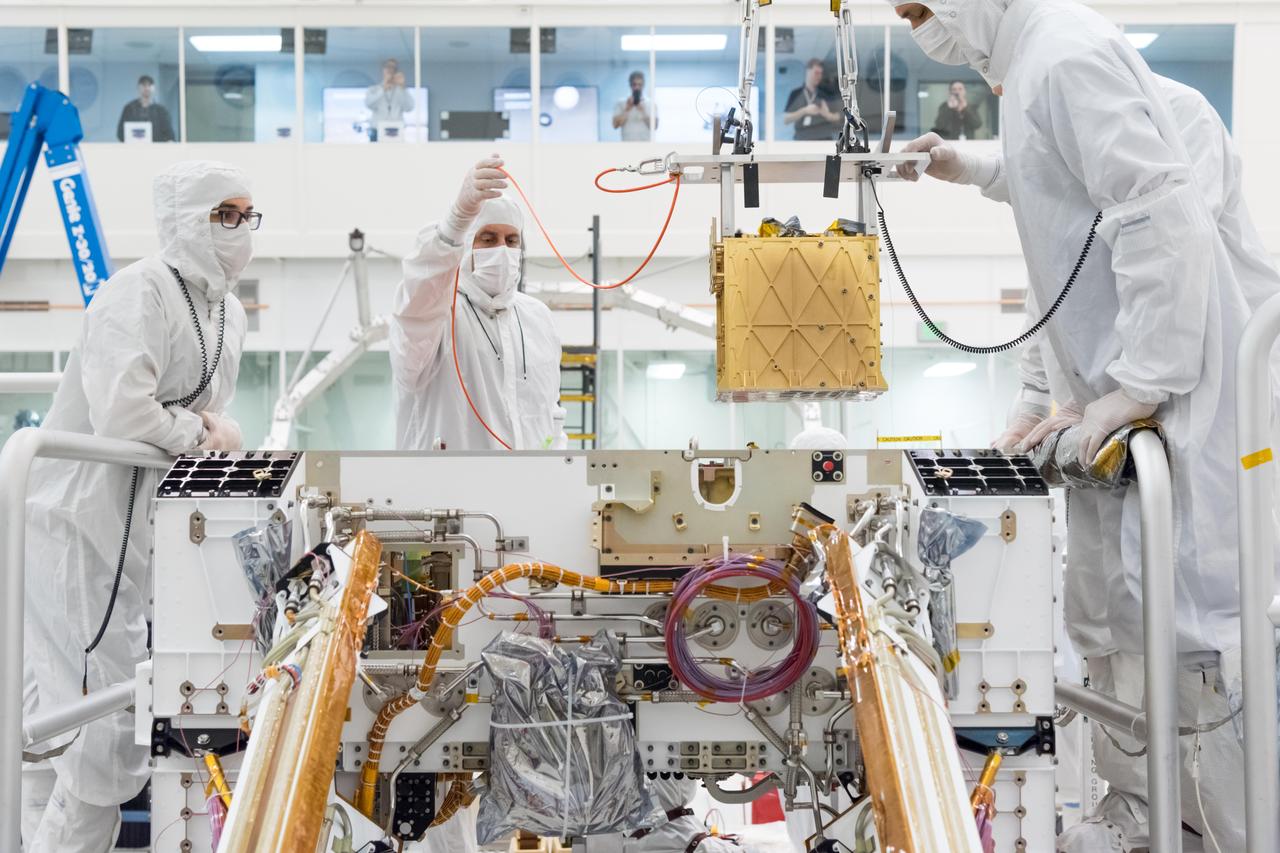
Members of NASA's Mars 2020 project install the Mars Oxygen In-Situ Resource Utilization Experiment (MOXIE) into the chassis of NASA's next Mars rover. MOXIE will demonstrate a way that future explorers might produce oxygen from the Martian atmosphere for propellant and for breathing. The car-battery-sized instrument does this by collecting carbon dioxide (CO2) from the Martian atmosphere and electrochemically splitting the carbon dioxide molecules into oxygen and carbon monoxide molecules. The oxygen is then analyzed for purity before being vented back out to the Martian atmosphere along with the carbon monoxide and other exhaust products. The image was taken on March 20, 2019, in the Spacecraft Assembly Facility's High Bay 1 Cleanroom at NASA's Jet Propulsion Laboratory, in Pasadena, California. https://photojournal.jpl.nasa.gov/catalog/PIA23154
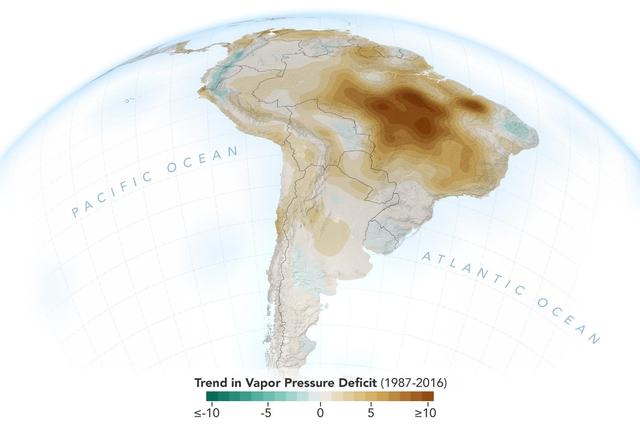
The image shows the trend of vapor pressure deficit over the Amazon rainforest during the dry season months — August through October — from 1987 to 2016. The measurements are shown in millibars — a standard unit of measure for atmospheric pressure. Vapor pressure deficit is the ratio of how much moisture is present in the atmosphere compared to how much moisture the atmosphere can hold. The trend shows the decline of moisture in the air, particularly across the south and southeastern Amazon, which is caused by a combination of human activities, including changes in land use, forest burning and its byproduct, black carbon, along with activities that have increased carbon monoxide and carbon dioxide levels in the region. https://photojournal.jpl.nasa.gov/catalog/PIA23425

This diagram illustrates how hypothetical helium atmospheres might form. These would be on planets about the mass of Neptune, or smaller, which orbit tightly to their stars, whipping around in just days. They are thought to have cores of water or rock, surrounded by thick atmospheres of gas. Radiation from their nearby stars would boil off hydrogen and helium, but because hydrogen is lighter, more hydrogen would escape. It's also possible that planetary bodies, such as asteroids, could impact the planet, sending hydrogen out into space. Over time, the atmospheres would become enriched in helium. With less hydrogen in the planets' atmospheres, the concentration of methane and water would go down. Both water and methane consist in part of hydrogen. Eventually, billions of years later (a "Gyr" equals one billion years), the abundances of the water and methane would be greatly reduced. Since hydrogen would not be abundant, the carbon would be forced to pair with oxygen, forming carbon monoxide. NASA's Spitzer Space Telescope observed a proposed helium planet, GJ 436b, with these traits: it lacks methane, and appears to contain carbon monoxide. Future observations are needed to detect helium itself in the atmospheres of these planets, and confirm this theory. http://photojournal.jpl.nasa.gov/catalog/PIA19345
In this image, the gold-plated Mars Oxygen In-Situ Resource Utilization Experiment (MOXIE) Instrument shines after being installed inside the Perseverance rover. The largest white tube on the top surface of MOXIE takes in filtered carbon dioxide-rich Martian atmosphere. That CO2 is pressurized and passed through the Solid Oxide Electrolysis unit, where it is split into carbon monoxide and oxygen. The smallest tube snaking across the top of the unit sends the oxygen produced by MOXIE through a composition sensor to measure purity, then vents the oxygen out to the Martian atmosphere. This technology demonstration may guide the design of future, larger devices that could enable human exploration of Mars. https://photojournal.jpl.nasa.gov/catalog/PIA24203
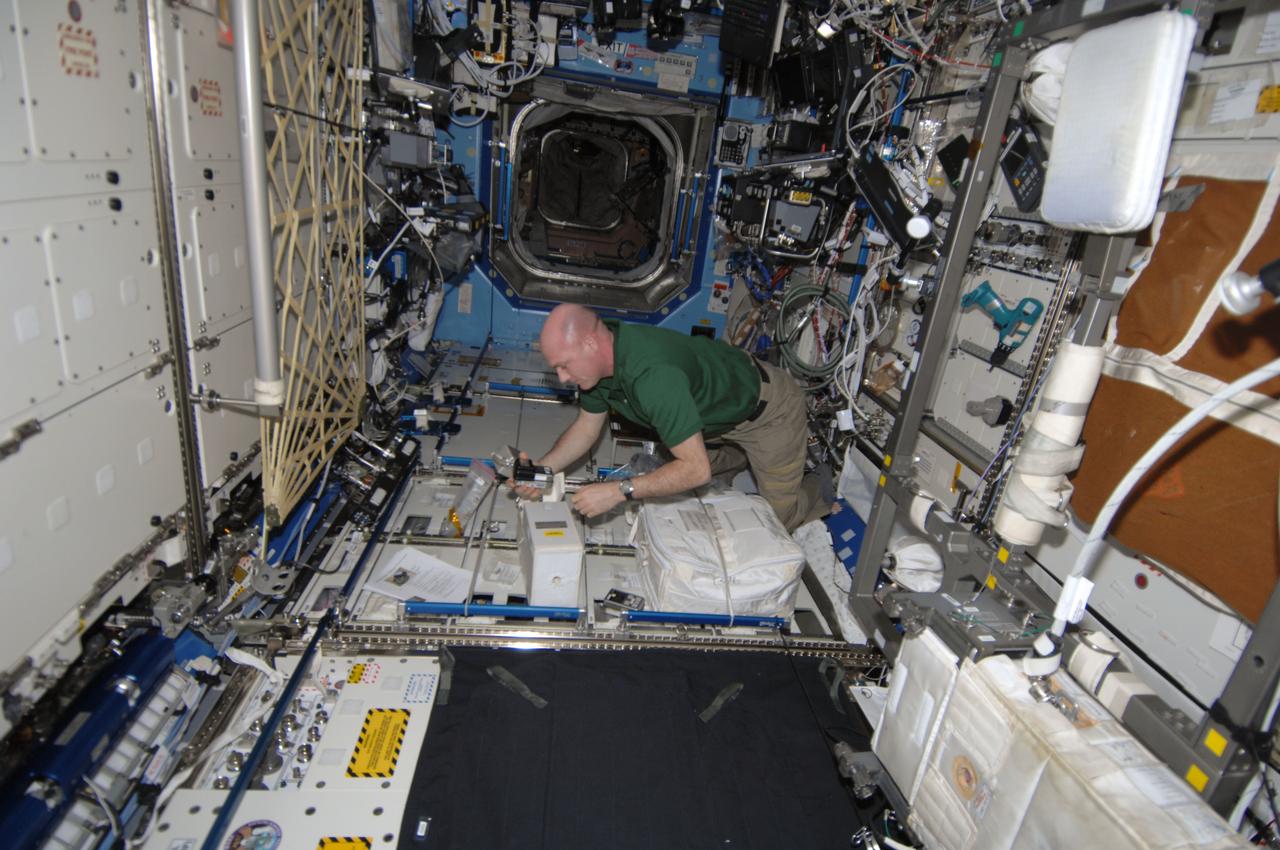
ISS030-E-156455 (26 Jan. 2012) --- European Space Agency astronaut Andre Kuipers, Expedition 30 flight engineer, sets up the Compound Specific Analyzer - Combustion Products (CSA-CP) in the Destiny laboratory of the International Space Station. The purpose of the analyzer is to measure the concentrations of carbon monoxide, hydrogen cyanide, hydrogen chloride and oxygen.
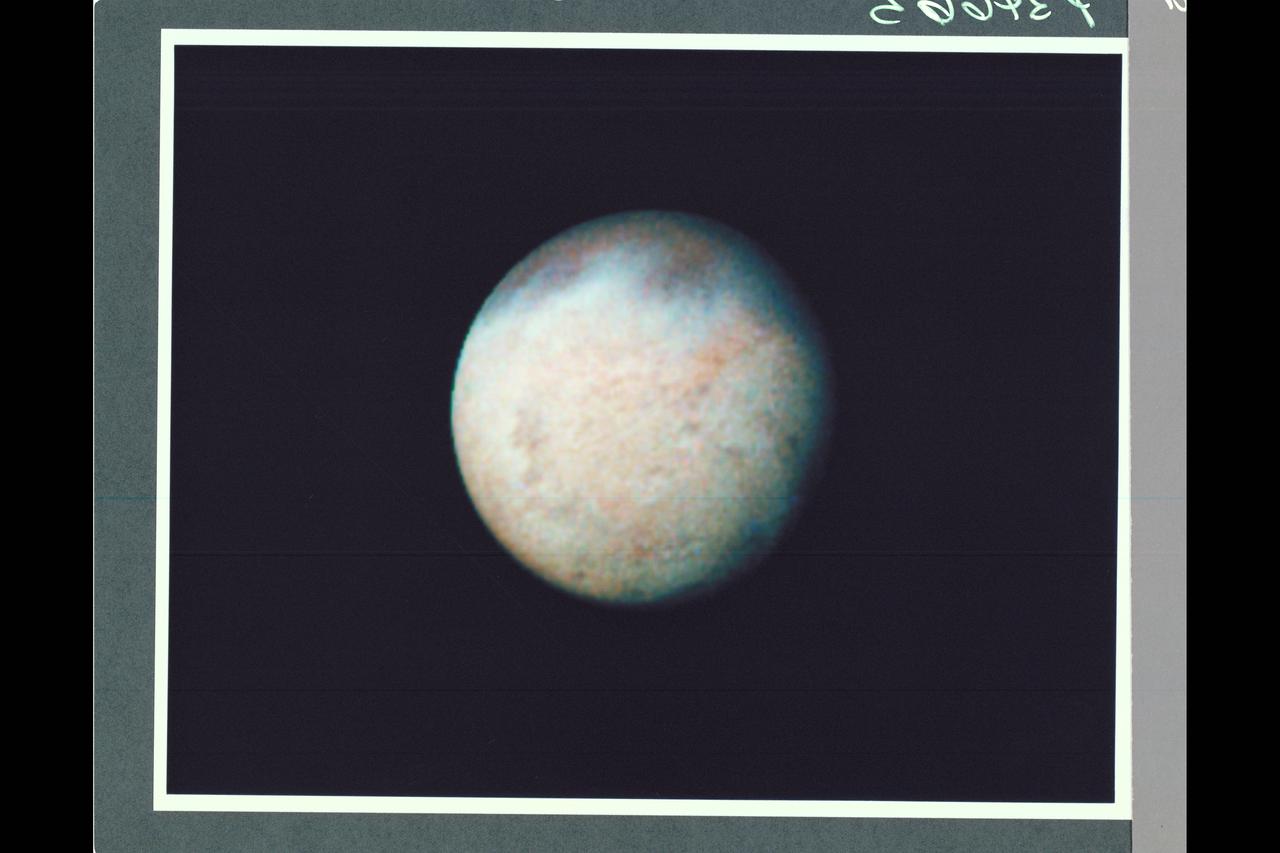
P-34665 This false color Voyager 2 image of Neptune's satellite Triton, is a composite of three images taken through ultraviolet, green, and viloet filters. The smallest resolvable features are about 47 km., or 29 miles accross. Mottling in the bright southern hemisphere may be the result of topography, if Triton's crust is predominently water ice, which is rigid at Triton's surface temperature. Alternatively, the mottling could be due to markings on a smooth surface, if the crust is composed of nitrogen, carbon monoxide, or methane ice, since they are soft at the same temperature.
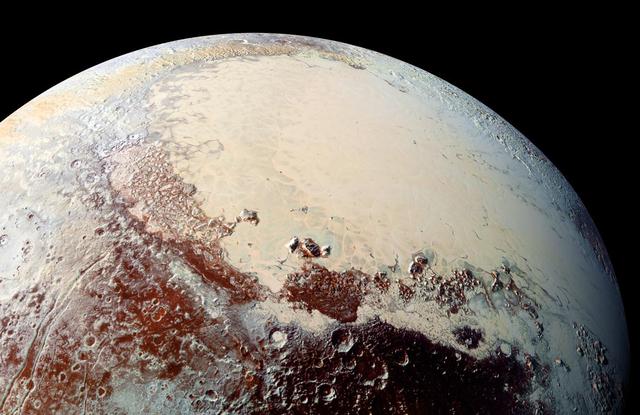
This high-resolution image captured by NASA's New Horizons spacecraft combines blue, red and infrared images taken by the Ralph/Multispectral Visual Imaging Camera (MVIC). The bright expanse is the western lobe of the "heart," informally called Sputnik Planum, which has been found to be rich in nitrogen, carbon monoxide and methane ices. http://photojournal.jpl.nasa.gov/catalog/PIA20007
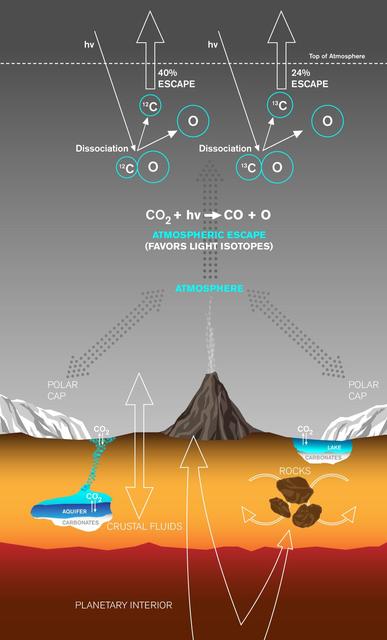
This graphic depicts paths by which carbon has been exchanged between Martian interior, surface rocks, polar caps, waters and atmosphere, and also depicts a mechanism by which carbon is lost from the atmosphere with a strong effect on isotope ratio. Carbon dioxide (CO2) to generate the Martian atmosphere originated in the planet's mantle and has been released directly through volcanoes or trapped in rocks crystallized from magmas and released later. Once in the atmosphere, the CO2 can exchange with the polar caps, passing from gas to ice and back to gas again. The CO2 can also dissolve into waters, which can then precipitate out solid carbonates, either in lakes at the surface or in shallow aquifers. Carbon dioxide gas in the atmosphere is continually lost to space at a rate controlled in part by the sun's activity. One loss mechanism is called ultraviolet photodissociation. It occurs when ultraviolet radiation (indicated on the graphic as "hv") encounters a CO2 molecule, breaking the bonds to first form carbon monoxide (CO) molecules and then carbon (C) atoms. The ratio of carbon isotopes remaining in the atmosphere is affected as these carbon atoms are lost to space, because the lighter carbon-12 (12C) isotope is more easily removed than the heavier carbon-13 (13C) isotope. This fractionation, the preferential loss of carbon-12 to space, leaves a fingerprint: enrichment of the heavy carbon-13 isotope, measured in the atmosphere of Mars today. http://photojournal.jpl.nasa.gov/catalog/PIA20163
One of the two pictures of Tempel 1 (see also PIA02101) taken by Deep Impact's medium-resolution camera is shown next to data of the comet taken by the spacecraft's infrared spectrometer. This instrument breaks apart light like a prism to reveal the "fingerprints," or signatures, of chemicals. Even though the spacecraft was over 10 days away from the comet when these data were acquired, it detected some of the molecules making up the comet's gas and dust envelope, or coma. The signatures of these molecules -- including water, hydrocarbons, carbon dioxide and carbon monoxide -- can be seen in the graph, or spectrum. Deep Impact's impactor spacecraft is scheduled to collide with Tempel 1 at 10:52 p.m. Pacific time on July 3 (1:52 a.m. Eastern time, July 4). The mission's flyby spacecraft will use its infrared spectrometer to sample the ejected material, providing the first look at the chemical composition of a comet's nucleus. These data were acquired from June 20 to 21, 2005. The picture of Tempel 1 was taken by the flyby spacecraft's medium-resolution instrument camera. The infrared spectrometer uses the same telescope as the high-resolution instrument camera. http://photojournal.jpl.nasa.gov/catalog/PIA02100

An expanded view of comet C/2006 W3 (Christensen) is shown here. The WISE spacecraft observed this comet on April 20th, 2010 as it traveled through the constellation Sagittarius. Comet Christensen was nearly 370 million miles (600 million kilometers) from Earth at the time. The extent of the dust, about a tenth of a degree across in this image, is about 2/3rds the diameter of the sun. The red contours show the signal from the gas emission observed by the WISE spacecraft in the 4.6 micron wavelength channel, which contains carbon monoxide (CO) and carbon dioxide (CO2) emission lines. The strength of the 4.6 micron signal indicates over half a metric ton per second of CO or CO2 was emitted from this comet at the time of the observations. The WISE spacecraft was put into hibernation in 2011 upon completing its goal of surveying the entire sky in infrared light. WISE cataloged three quarters of a billion objects, including asteroids, stars and galaxies. In August 2013, NASA decided to reinstate the spacecraft on a mission to find and characterize more asteroids. http://photojournal.jpl.nasa.gov/catalog/PIA20119

Canada has already had its share of wildfires this season, and the smoke from these wildfires is slowly drifting south over the United States' Midwest. The drifting smoke can be seen in this Terra satellite image over Lake Michigan, as well as parts of Minnesota, Wisconsin, Indiana and Ohio. The smoke released by any type of fire (forest, brush, crop, structure, tires, waste or wood burning) is a mixture of particles and chemicals produced by incomplete burning of carbon-containing materials. All smoke contains carbon monoxide, carbon dioxide and particulate matter (PM or soot). Smoke can contain many different chemicals, including aldehydes, acid gases, sulfur dioxide, nitrogen oxides, polycyclic aromatic hydrocarbons (PAHs), benzene, toluene, styrene, metals and dioxins. The type and amount of particles and chemicals in smoke varies depending on what is burning, how much oxygen is available, and the burn temperature. Exposure to any type of smoke should be avoided if possible, but especially by those with respiratory issues, the elderly, and children. This natural-color satellite image was collected by the Moderate Resolution Imaging Spectroradiometer (MODIS) aboard the Terra satellite on June 09, 2015. Credit: NASA image courtesy Jeff Schmaltz, MODIS Rapid Response Team <b><a href="http://www.nasa.gov/audience/formedia/features/MP_Photo_Guidelines.html" rel="nofollow">NASA image use policy.</a></b> <b><a href="http://www.nasa.gov/centers/goddard/home/index.html" rel="nofollow">NASA Goddard Space Flight Center</a></b> enables NASA’s mission through four scientific endeavors: Earth Science, Heliophysics, Solar System Exploration, and Astrophysics. Goddard plays a leading role in NASA’s accomplishments by contributing compelling scientific knowledge to advance the Agency’s mission. <b>Follow us on <a href="http://twitter.com/NASAGoddardPix" rel="nofollow">Twitter</a></b> <b>Like us on <a href="http://www.facebook.com/pages/Greenbelt-MD/NASA-Goddard/395013845897?ref=tsd" rel="nofollow">Facebook</a></b> <b>Find us on <a href="http://instagrid.me/nasagoddard/?vm=grid" rel="nofollow">Instagram</a></b>
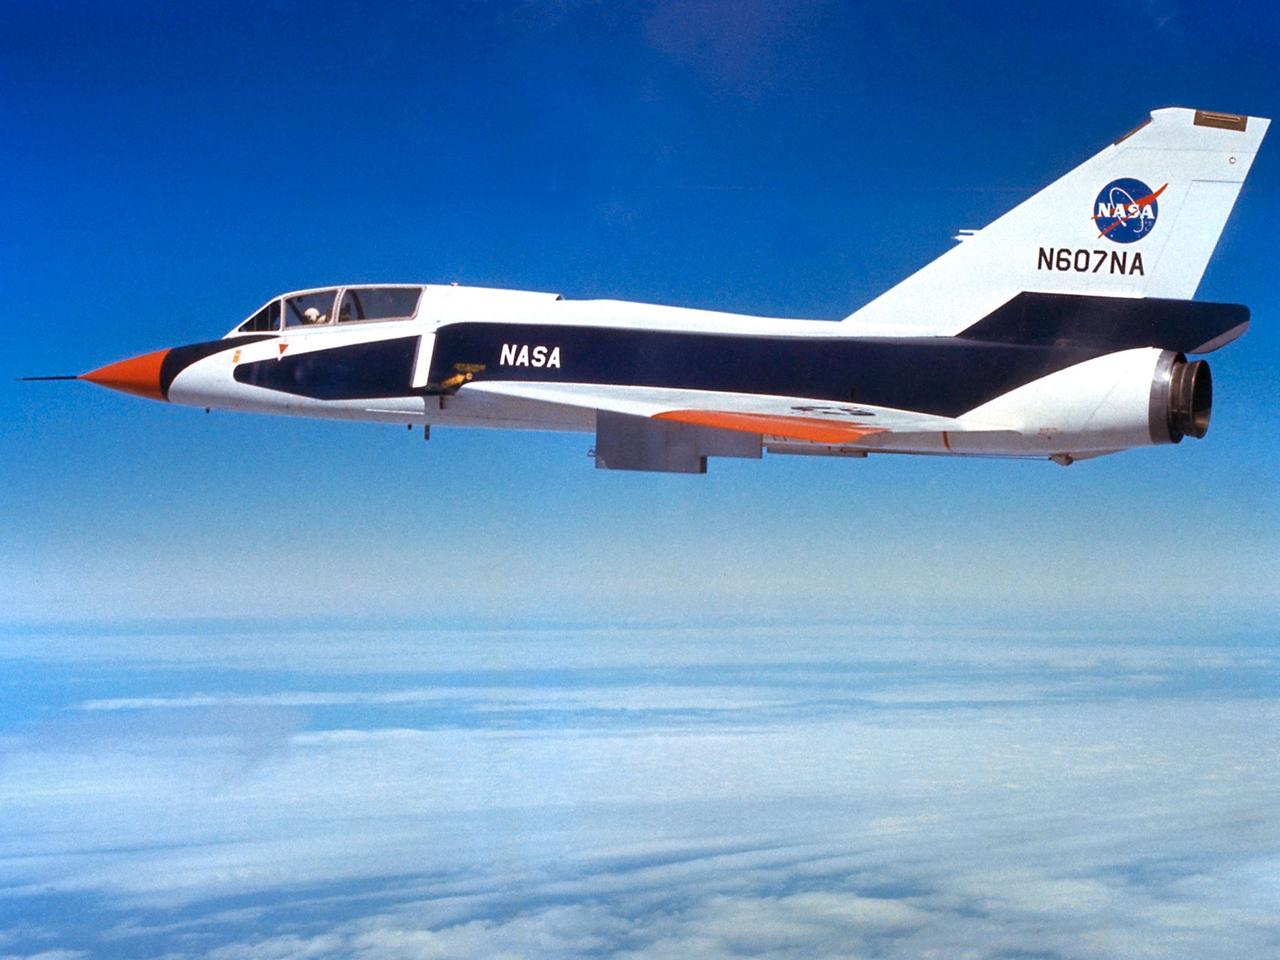
The National Aeronautics and Space Administration (NASA) Lewis Research Center’s Convair F-106B Delta Dart equipped with air sampling equipment in the mid-1970s. NASA Lewis created and managed the Global Air Sampling Program (GASP) in 1972 in partnership with several airline companies. NASA researchers used the airliners’ Boeing 747 aircraft to gather air samples to determine the amount of pollution present in the stratosphere. Private companies developed the air sampling equipment for the GASP program, and Lewis created a particle collector. The collector was flight tested on NASA Lewis’ F-106B in the summer of 1973. The sampling equipment was automatically operated once the proper altitude was achieved. The sampling instruments collected dust particles in the air so their chemical composition could be analyzed. The equipment analyzed one second’s worth of data at a time. The researchers also monitored carbon monoxide, monozide, ozone, and water vapor. The 747 flights began in December 1974 and soon included four airlines flying routes all over the globe. The F-106B augmented the airline data with sampling of its own, seen here. It gathered samples throughout this period from locations such as New Mexico, Texas, Michigan, and Ohio. In July 1977 the F-106B flew eight GASP flights in nine days over Alaska to supplement the earlier data gathered by the airlines.
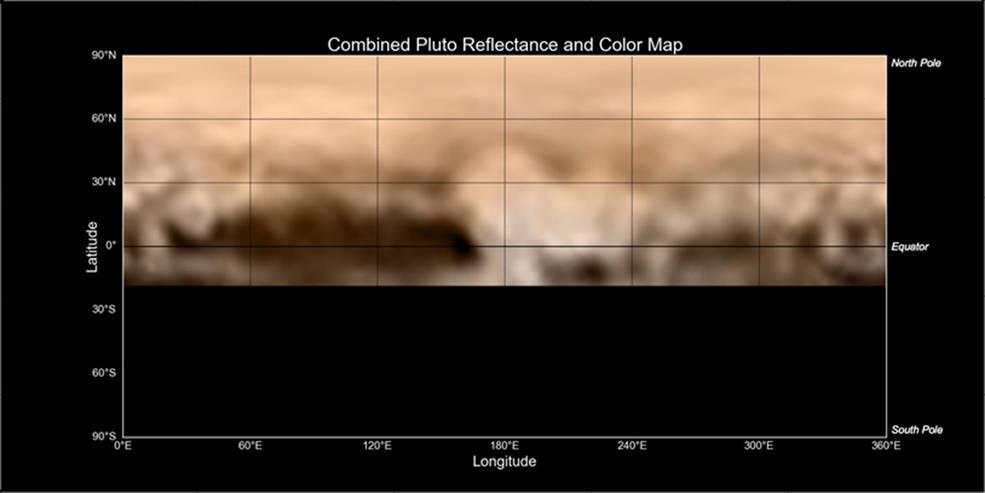
This map of Pluto, created from images taken from June 27-July 3, 2015, by the Long Range Reconnaissance Imager (LORRI) on New Horizons, was combined with lower-resolution color data from the spacecraft's Ralph instrument. The center of the map corresponds to the side of Pluto that will be seen close-up during New Horizons' July 14 flyby. This map gives mission scientists an important tool to decipher the complex and intriguing pattern of bright and dark markings on Pluto's surface. Features from all sides of Pluto can now be seen at a glance and from a consistent perspective, making it much easier to compare their shapes and sizes. The elongated dark area informally known as "the whale," along the equator on the left side of the map, is one of the darkest regions visible to New Horizons. It measures some 1,860 miles (3,000 kilometers) in length. Directly to the right of the whale's "snout" is the brightest region visible on the planet, which is roughly 990 miles (1,600 kilometers) across. This may be a region where relatively fresh deposits of frost -- perhaps including frozen methane, nitrogen and/or carbon monoxide -- form a bright coating. http://photojournal.jpl.nasa.gov/catalog/PIA19700
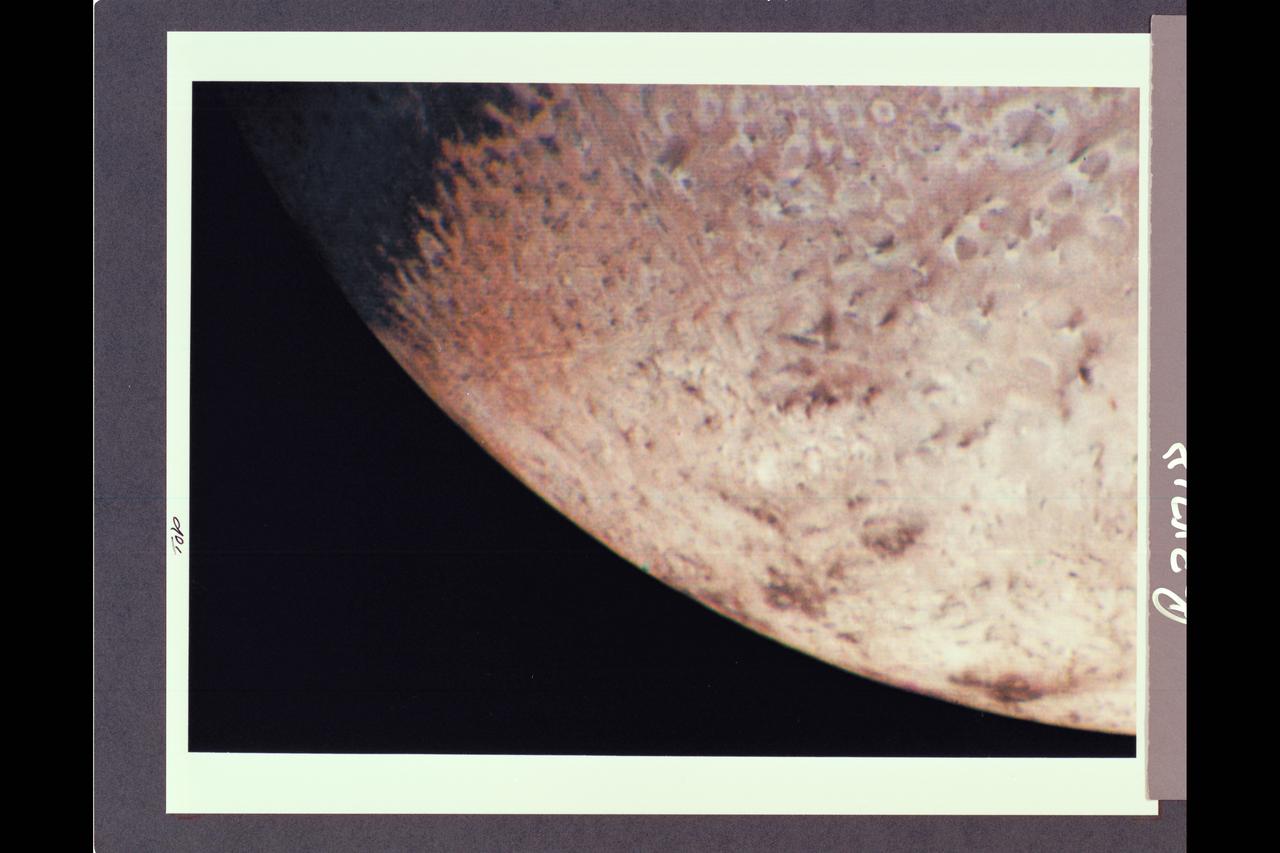
P-34718 Range: 210,000 kilometers (128,000 miles) This natural color image of the limb of Triton shows the largest surface features at about 3 miles across. The picture is a composite of images taken through the violet, green and clear filters and shows a geologic boundary between a rough, pitted surface to the right and a smoother surface to the left. The change between surface types is gradual. The image also shows a color boundary between pinkish material in the upper part of the image and whiter material in the lower part. The geologic and color boundaries are not the same. That implies that whatever supplies the color is a very thin coating over a different underlying material in which the geologic boundary occurs. The colored coating may be a seasonal frost composed of compounds volatile enough to be sublimated at the very low temperatures (40 K to 50 K or -387.4 F to -369.4 F) prevailing near Triton's surface. Possible compositions of the frost layer include methane (which turns red when irradiated), carbon monoxide or nitrogen. The color in this image is somewhat exaggerated: Triton is primarily a white object with a pinkish cast in some areas.
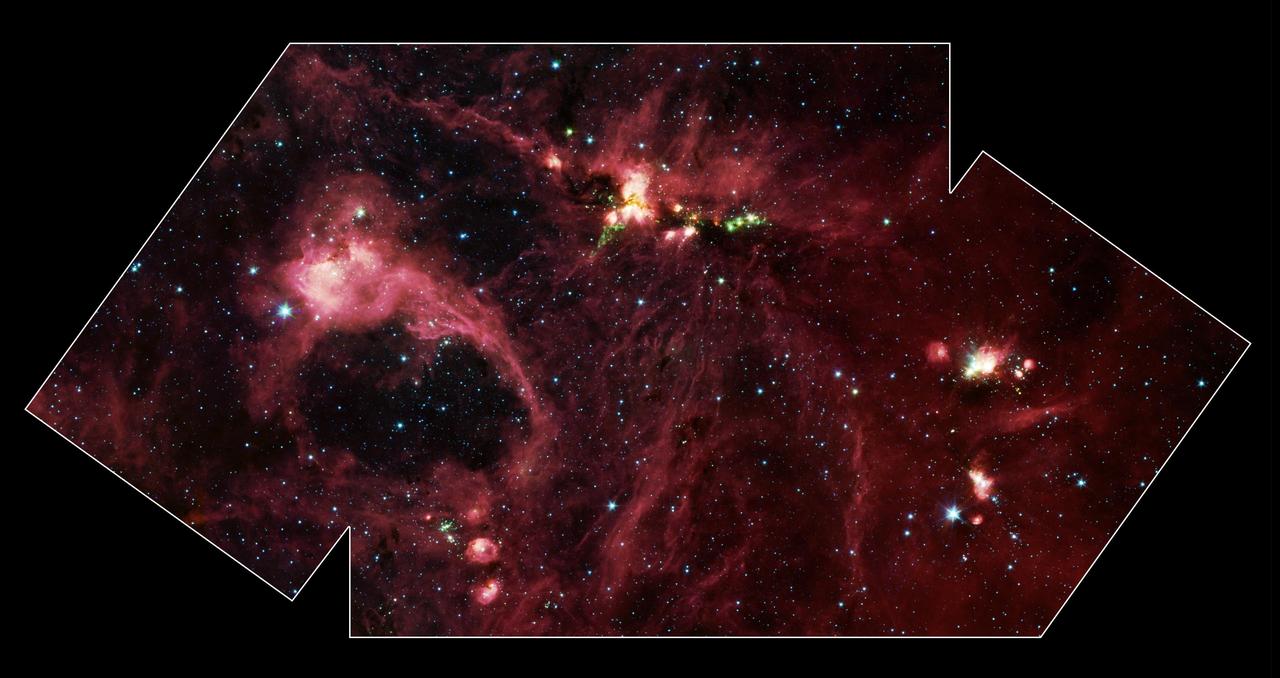
Hidden behind a shroud of dust in the constellation Cygnus is a stellar nursery called DR21, which is giving birth to some of the most massive stars in our galaxy. Visible light images reveal no trace of this interstellar cauldron because of heavy dust obscuration. In fact, visible light is attenuated in DR21 by a factor of more than 10,000,000,000,000,000,000,000,000,000,000,000,000,000 (ten thousand trillion heptillion). New images from NASA's Spitzer Space Telescope allow us to peek behind the cosmic veil and pinpoint one of the most massive natal stars yet seen in our Milky Way galaxy. The never-before-seen star is 100,000 times as bright as the Sun. Also revealed for the first time is a powerful outflow of hot gas emanating from this star and bursting through a giant molecular cloud. This image is a large-scale mosaic assembled from individual photographs obtained with the InfraRed Array Camera (IRAC) aboard Spitzer. The image covers an area about two times that of a full moon. The mosaic is a composite of images obtained at mid-infrared wavelengths of 3.6 microns (blue), 4.5 microns (green), 5.8 microns (orange) and 8 microns (red). The brightest infrared cloud near the top center corresponds to DR21, which presumably contains a cluster of newly forming stars at a distance of 10,000 light-years. Protruding out from DR21 toward the bottom left of the image is a gaseous outflow (green), containing both carbon monoxide and molecular hydrogen. Data from the Spitzer spectrograph, which breaks light into its constituent individual wavelengths, indicate the presence of hot steam formed as the outflow heats the surrounding molecular gas. Outflows are physical signatures of processes that create supersonic beams, or jets, of gas. They are usually accompanied by discs of material around the new star, which likely contain the materials from which future planetary systems are formed. Additional newborn stars, depicted in green, can be seen surrounding the DR21 region. The red filaments stretching across this image denote the presence of polycyclic aromatic hydrocarbons. These organic molecules, comprised of carbon and hydrogen, are excited by surrounding interstellar radiation and become luminescent at wavelengths near 8.0 microns. The complex pattern of filaments is caused by an intricate combination of radiation pressure, gravity and magnetic fields. The result is a tapestry in which winds, outflows and turbulence move and shape the interstellar medium. To the lower left of the mosaic is a large bubble of gas and dust, which may represent the remnants of a past generation of stars. http://photojournal.jpl.nasa.gov/catalog/PIA05732
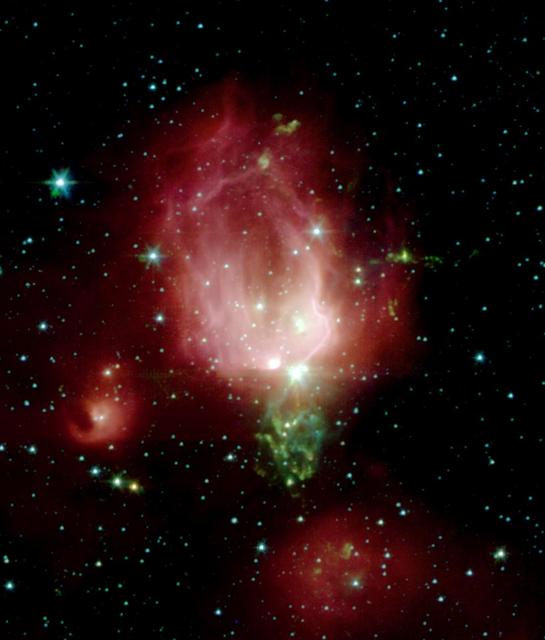
A cluster of newborn stars herald their birth in this interstellar Valentine Day commemorative picture obtained with NASA Spitzer Space Telescope. These bright young stars are found in a rosebud-shaped and rose-colored nebulosity known as NGC 7129. The star cluster and its associated nebula are located at a distance of 3300 light-years in the constellation Cepheus. A recent census of the cluster reveals the presence of 130 young stars. The stars formed from a massive cloud of gas and dust that contains enough raw materials to create a thousand Sun-like stars. In a process that astronomers still poorly understand, fragments of this molecular cloud became so cold and dense that they collapsed into stars. Most stars in our Milky Way galaxy are thought to form in such clusters. The Spitzer Space Telescope image was obtained with an infrared array camera that is sensitive to invisible infrared light at wavelengths that are about ten times longer than visible light. In this four-color composite, emission at 3.6 microns is depicted in blue, 4.5 microns in green, 5.8 microns in orange, and 8.0 microns in red. The image covers a region that is about one quarter the size of the full moon. As in any nursery, mayhem reigns. Within the astronomically brief period of a million years, the stars have managed to blow a large, irregular bubble in the molecular cloud that once enveloped them like a cocoon. The rosy pink hue is produced by glowing dust grains on the surface of the bubble being heated by the intense light from the embedded young stars. Upon absorbing ultraviolet and visible-light photons produced by the stars, the surrounding dust grains are heated and re-emit the energy at the longer infrared wavelengths observed by Spitzer. The reddish colors trace the distribution of molecular material thought to be rich in hydrocarbons. The cold molecular cloud outside the bubble is mostly invisible in these images. However, three very young stars near the center of the image are sending jets of supersonic gas into the cloud. The impact of these jets heats molecules of carbon monoxide in the cloud, producing the intricate green nebulosity that forms the stem of the rosebud. Not all stars are formed in clusters. Away from the main nebula and its young cluster are two smaller nebulae, to the left and bottom of the central 'rosebud,'each containing a stellar nursery with only a few young stars. Astronomers believe that our own Sun may have formed billions of years ago in a cluster similar to NGC 7129. Once the radiation from new cluster stars destroys the surrounding placental material, the stars begin to slowly drift apart. http://photojournal.jpl.nasa.gov/catalog/PIA05266
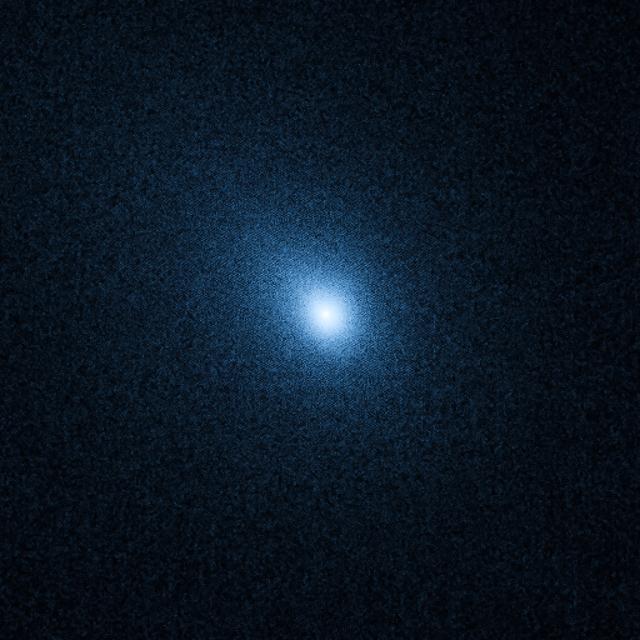
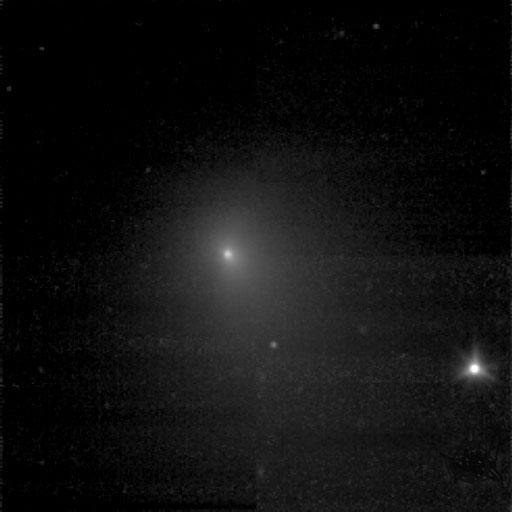
NASA image release October 5, 2010 Hubble Space Telescope observations of comet 103P/Hartley 2, taken on September 25, are helping in the planning for a November 4 flyby of the comet by NASA's Deep Impact eXtended Investigation (DIXI) spacecraft. Analysis of the new Hubble data shows that the nucleus has a diameter of approximately 0.93 miles (1.5 km), which is consistent with previous estimates. The comet is in a highly active state, as it approaches the Sun. The Hubble data show that the coma is remarkably uniform, with no evidence for the types of outgassing jets seen from most "Jupiter Family" comets, of which Hartley 2 is a member. Jets can be produced when the dust emanates from a few specific icy regions, while most of the surface is covered with relatively inert, meteoritic-like material. In stark contrast, the activity from Hartley 2's nucleus appears to be more uniformly distributed over its entire surface, perhaps indicating a relatively "young" surface that hasn't yet been crusted over. Hubble's spectrographs - the Cosmic Origins Spectrograph (COS) and the Space Telescope Imaging Spectrograph (STIS) -- are expected to provide unique information about the comet's chemical composition that might not be obtainable any other way, including measurements by DIXI. The Hubble team is specifically searching for emissions from carbon monoxide (CO) and diatomic sulfur (S2). These molecules have been seen in other comets but have not yet been detected in 103P/Hartley 2. 103P/Hartley has an orbital period of 6.46 years. It was discovered by Malcolm Hartley in 1986 at the Schmidt Telescope Unit in Siding Spring, Australia. The comet will pass within 11 million miles of Earth (about 45 times the distance to the Moon) on October 20. During that time the comet may be visible to the naked eye as a 5th magnitude "fuzzy star" in the constellation Auriga. Credit: NASA, ESA, and H. Weaver (The Johns Hopkins University/Applied Physics Lab) The Hubble Space Telescope is a project of international cooperation between NASA and the European Space Agency. NASA's Goddard Space Flight Center manages the telescope. The Space Telescope Science Institute (STScI) conducts Hubble science operations. STScI is operated for NASA by the Association of Universities for Research in Astronomy, Inc., in Washington, D.C. <b><a href="http://www.nasa.gov/centers/goddard/home/index.html" rel="nofollow">NASA Goddard Space Flight Center</a></b> enables NASA’s mission through four scientific endeavors: Earth Science, Heliophysics, Solar System Exploration, and Astrophysics. Goddard plays a leading role in NASA’s accomplishments by contributing compelling scientific knowledge to advance the Agency’s mission. <b>Follow us on <a href="http://twitter.com/NASA_GoddardPix" rel="nofollow">Twitter</a></b> <b>Join us on <a href="http://www.facebook.com/pages/Greenbelt-MD/NASA-Goddard/395013845897?ref=tsd" rel="nofollow">Facebook</a></b>

WASP-18b is an exoplanet located 325 light-years from Earth. The planet's mass is 10 times that of Jupiter, and it orbits its star once every 23 hours. A 2017 study found that this planet has a stratosphere that's loaded with carbon dioxide, but has no signs of water. A stratosphere is a layer of atmosphere in which temperature increases with higher altitudes. The study used NASA's Spitzer and Hubble space telescopes. https://photojournal.jpl.nasa.gov/catalog/PIA22087