
General Atomics' uninhabited Altair flew a NOAA/NASA coastal mapping, mammal observation and marine monitoring mission off the California coast in late 2005.

General Atomics' uninhabited Altair flew a NOAA/NASA coastal mapping, mammal observation and marine monitoring mission off the California coast in late 2005.

General Atomics' uninhabited Altair flew a NOAA/NASA coastal mapping, mammal observation and marine monitoring mission off the California coast in late 2005.
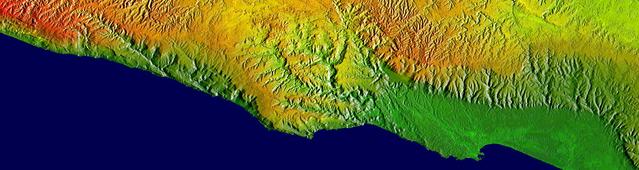
This elevation map shows a part of the southern coast of the Arabian Peninsula including parts of the countries of Oman and Yemen. The narrow coastal plain on the right side of the image includes the city of Salahlah, the second largest city in Oman.

General Atomics' remotely-operated Altair soars over Rogers Dry Lake at Edwards Air Force Base during a NOAA/NASA earth science mission in November 2005.
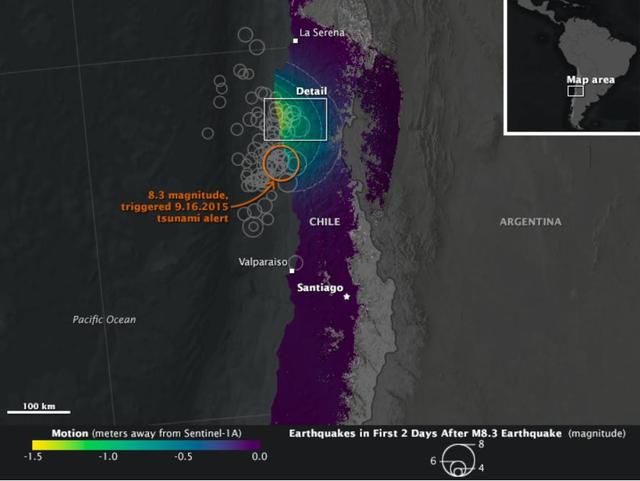
On Sept. 16, 2015, a magnitude 8.3 earthquake struck near the coast of central Chile along the boundary of the Nazca and South American tectonic plates. Dubbed the Illapel earthquake, the shaking lasted at least three minutes and propelled a 15-foot (4.5-meter) tsunami that washed into Coquimbo and other coastal areas. Smaller tsunami waves raced across the Pacific and showed up on the shores of Hawaii and other islands. The earthquake and tsunami caused substantial damage in several Chilean coastal towns, and at least 13 deaths have been reported. Demanding building codes and extensive disaster preparedness helped to limit the loss of life and property. The maps above, known as interferograms, show how the quake moved the ground, as observed by the Copernicus Sentinel-1A satellite (operated by the European Space Agency) and reported by ground stations to the U.S. Geological Survey. Sentinel-1A carries a synthetic aperture radar (SAR) instrument, which beams radio signals toward the ground and measures the reflections to determine the distance between the ground and the satellite. By comparing measurements made on Aug. 24 and Sept. 17, Cunren Liang, Eric Fielding, and other researchers from NASA's Jet Propulsion Laboratory were able to determine how the land surface shifted during and after the earthquake. Interferograms can be used to estimate where the fault moved deep in Earth and which areas have increased stress and higher likelihood of future earthquakes. The details can also provide important information to better understand the earthquake process. On both the close-up and the broad-view maps, the amount of land motion is represented in shades from yellow to purple. Areas where the ground shifted the most (vertically, horizontally, or both) are represented in yellow, while areas with little change are represented in purple. Circles show the location of earthquakes and aftershocks in the two days after the initial 8.3 earthquake, as reported by the USGS National Earthquake Information Center. Larger quakes are represented by larger circles. The base map layer uses a digital elevation model and a bathymetry map to show the contours of the land surface and seafloor. The interferograms above show that land moved as much as 1.4 meters toward to satellite (generally in the vertical direction) near the coast, and early estimates of the horizontal motion suggest it was as much as 2 meters. While SAR can see through clouds and the dark of night, it cannot see much through water. It is likely that much of the ground deformation from the earthquake occurred underwater, which explains the formation of the tsunami and the location of many aftershocks. http://photojournal.jpl.nasa.gov/catalog/PIA20002
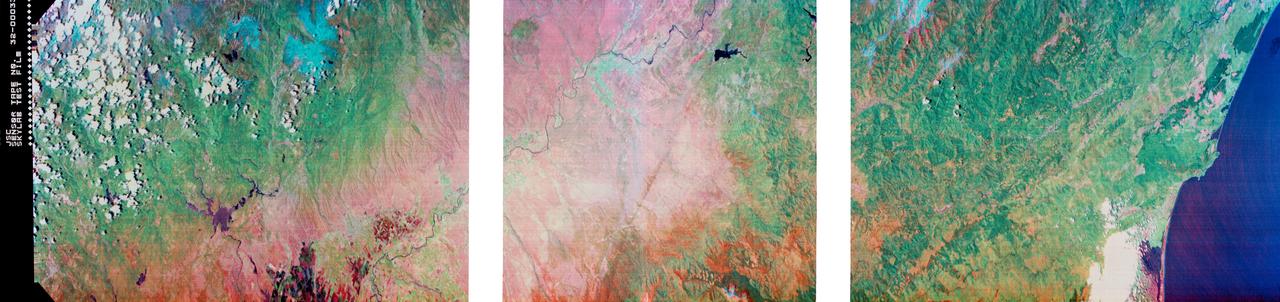
S73-34295 (June 1973) --- A vertical view of a portion of northern California reproduced from data taken from the Skylab Multispectral Scanner, experiment S192, in the Skylab space station in Earth orbit. This view is the most westerly one-third of Frame No. 001, Roll No. 518, S192, Skylab 2. Frame No. 001 extends from the Pacific coast at the Eureka area southeasterly 175 nautical miles to the Feather River drainage basin. Included in this view are Eureka, Trinidad, Klamath & Trinity Rivers and the Coastal Range mountains. This non-photographic image is a color composite of channels 2 (visible), 7, and 12 (infrared) from the Earth Resources Experiments Package (EREP) S192 scanner. The scanner techniques assist with spectral signature identification and mapping of ground truth targets in agriculture, forestry, geology, hydrology and oceanography. Photo credit: NASA
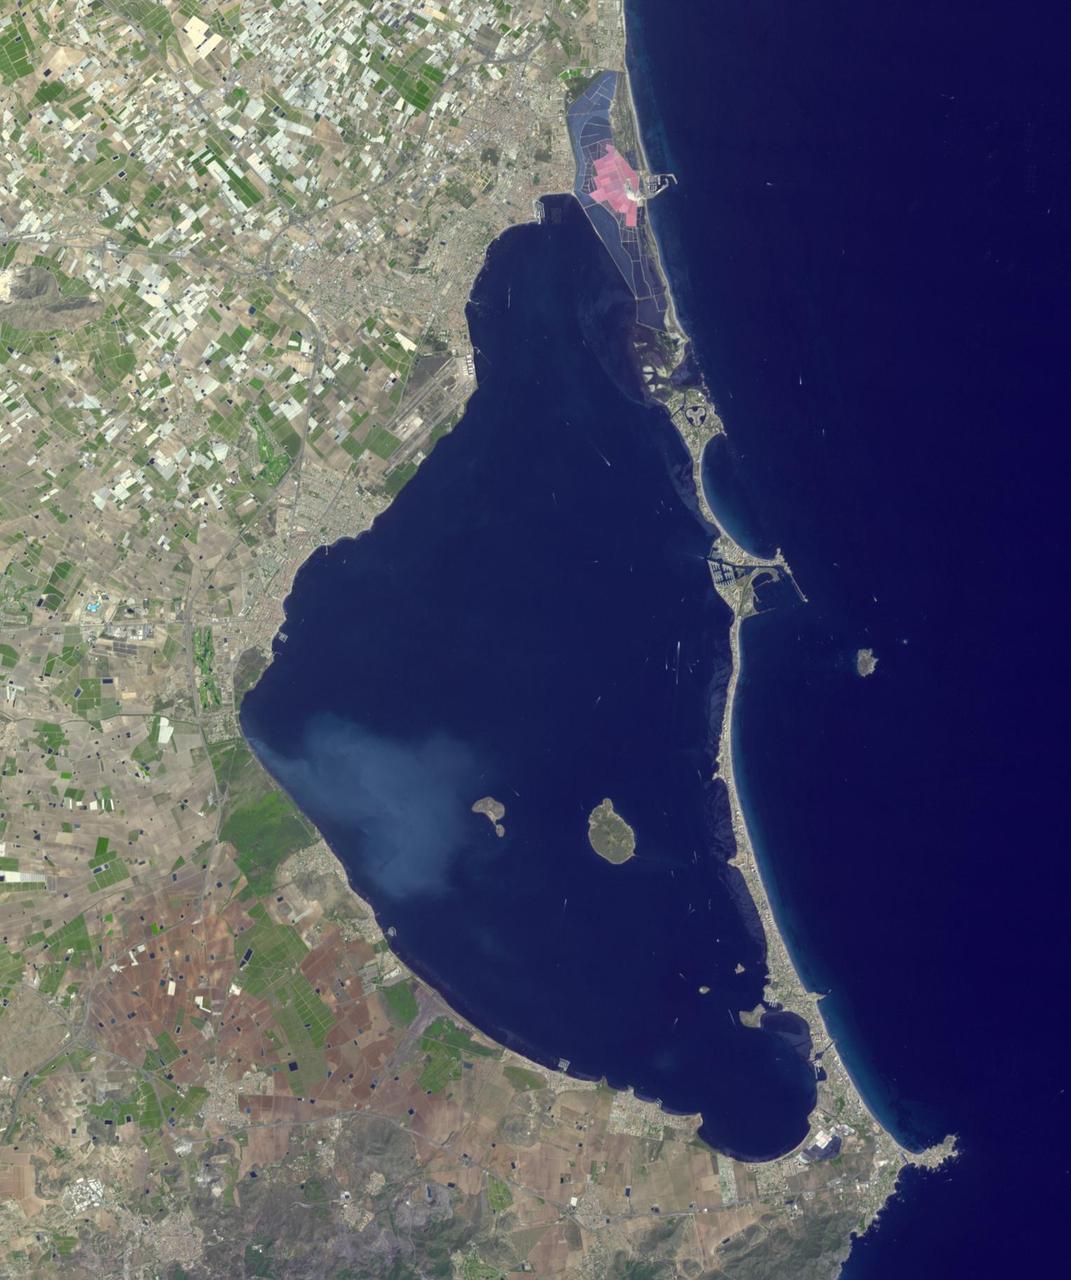
Mar Menor, in southeast Spain, is Europe's largest coastal saltwater lagoon. For the past 40 years, Mar Menor has faced severe contamination from agricultural runoff, leading to large algal blooms, and ecological degradation. Now, major restoration and prevention programs are in place to restore the lagoon, and try to reverse the damage. The image was acquired August 24, 2023, covers an area of 22.6 by 27.4 km, and is located at 37.7 degrees north, 0.8 degrees west. With its 14 spectral bands from the visible to the thermal infrared wavelength region and its high spatial resolution of about 50 to 300 feet (15 to 90 meters), ASTER images Earth to map and monitor the changing surface of our planet. ASTER is one of five Earth-observing instruments launched Dec. 18, 1999, on Terra. The instrument was built by Japan's Ministry of Economy, Trade and Industry. A joint U.S./Japan science team is responsible for validation and calibration of the instrument and data products. The broad spectral coverage and high spectral resolution of ASTER provides scientists in numerous disciplines with critical information for surface mapping and monitoring of dynamic conditions and temporal change. Example applications are monitoring glacial advances and retreats; monitoring potentially active volcanoes; identifying crop stress; determining cloud morphology and physical properties; wetlands evaluation; thermal pollution monitoring; coral reef degradation; surface temperature mapping of soils and geology; and measuring surface heat balance. https://photojournal.jpl.nasa.gov/catalog/PIA26009
![More than 70% of the world's hazelnuts come from Turkey, and about 60% come from the Eastern Black Sea region on the slopes of the Pontic mountain range, around the ancient coastal city of Giresun. The tradition of hazelnut farming goes back thousands of years. Presently, most of the hazelnut products are processed by women [BBC Travel]. The image was acquired August 15, 2024, covers an area of 35.7 by 36.2 km, and is located at 40.9 degrees north, 38.4 degrees east. With its 14 spectral bands from the visible to the thermal infrared wavelength region and its high spatial resolution of about 50 to 300 feet (15 to 90 meters), ASTER images Earth to map and monitor the changing surface of our planet. ASTER is one of five Earth-observing instruments launched Dec. 18, 1999, on Terra. The instrument was built by Japan's Ministry of Economy, Trade and Industry. A joint U.S./Japan science team is responsible for validation and calibration of the instrument and data products. The broad spectral coverage and high spectral resolution of ASTER provides scientists in numerous disciplines with critical information for surface mapping and monitoring of dynamic conditions and temporal change. Example applications are monitoring glacial advances and retreats; monitoring potentially active volcanoes; identifying crop stress; determining cloud morphology and physical properties; wetlands evaluation; thermal pollution monitoring; coral reef degradation; surface temperature mapping of soils and geology; and measuring surface heat balance. https://photojournal.jpl.nasa.gov/catalog/PIA26450](https://images-assets.nasa.gov/image/PIA26450/PIA26450~medium.jpg)
More than 70% of the world's hazelnuts come from Turkey, and about 60% come from the Eastern Black Sea region on the slopes of the Pontic mountain range, around the ancient coastal city of Giresun. The tradition of hazelnut farming goes back thousands of years. Presently, most of the hazelnut products are processed by women [BBC Travel]. The image was acquired August 15, 2024, covers an area of 35.7 by 36.2 km, and is located at 40.9 degrees north, 38.4 degrees east. With its 14 spectral bands from the visible to the thermal infrared wavelength region and its high spatial resolution of about 50 to 300 feet (15 to 90 meters), ASTER images Earth to map and monitor the changing surface of our planet. ASTER is one of five Earth-observing instruments launched Dec. 18, 1999, on Terra. The instrument was built by Japan's Ministry of Economy, Trade and Industry. A joint U.S./Japan science team is responsible for validation and calibration of the instrument and data products. The broad spectral coverage and high spectral resolution of ASTER provides scientists in numerous disciplines with critical information for surface mapping and monitoring of dynamic conditions and temporal change. Example applications are monitoring glacial advances and retreats; monitoring potentially active volcanoes; identifying crop stress; determining cloud morphology and physical properties; wetlands evaluation; thermal pollution monitoring; coral reef degradation; surface temperature mapping of soils and geology; and measuring surface heat balance. https://photojournal.jpl.nasa.gov/catalog/PIA26450
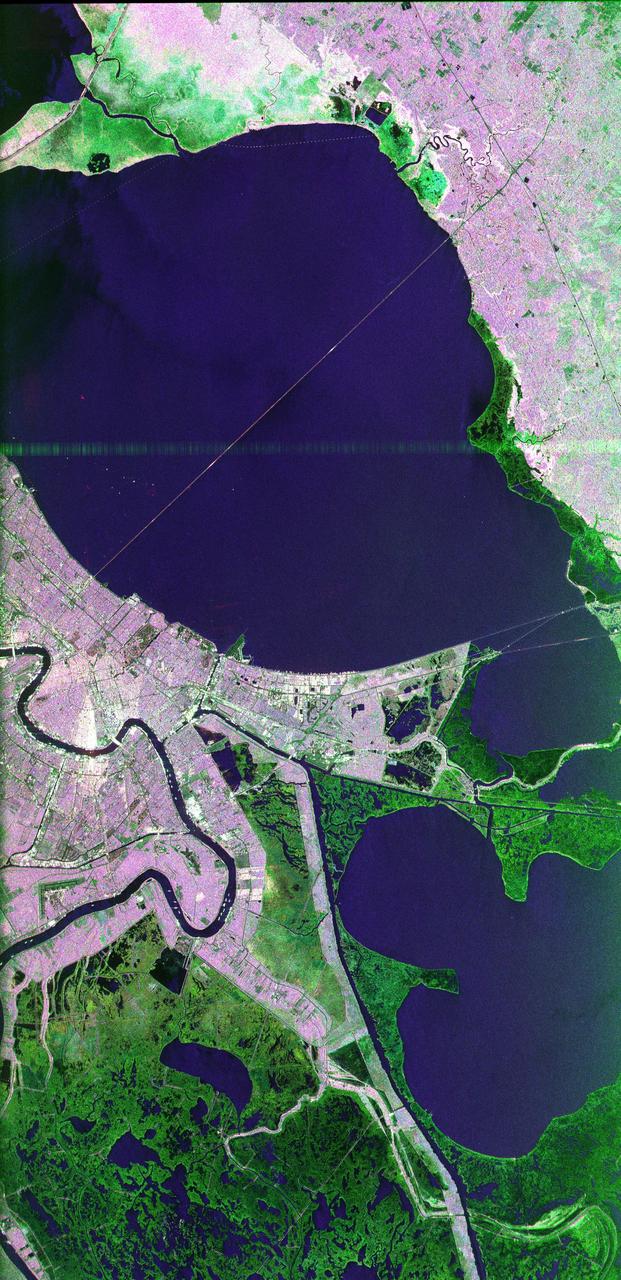
This image of the area surrounding the city of New Orleans, Louisiana in the southeastern United States demonstrates the ability of multi-frequency imaging radar to distinguish different types of land cover. The dark area in the center is Lake Pontchartrain. The thin line running across the lake is a causeway connecting New Orleans to the city of Mandeville. Lake Borgne is the dark area in the lower right of the image. The Mississippi River appears as a dark, wavy line in the lower left. The white dots on the Mississippi are ships. The French Quarter is the brownish square near the left center of the image. Lakefront Airport, a field used mostly for general aviation, is the bright spot near the center, jutting out into Lake Pontchartrain. The image was acquired by the Spaceborne Imaging Radar C/X-Band Synthetic Aperture Radar (SIR-C/X-SAR) during orbit 39 of space shuttle Endeavour on October 2, 1994. The area is located at 30.10 degrees north latitude and 89.1 degrees west longitude. The area shown is approximately 100 kilometers (60 miles) by 50 kilometers (30 miles). The colors in this image were obtained using the following radar channels: red represents the L-band (horizontally transmitted and received); green represents the C-band (horizontally transmitted and received); blue represents the L-band (vertically transmitted and received). The green areas are primarily vegetation consisting of swamp land and swamp forest (bayou) growing on sandy soil, while the pink areas are associated with reflections from buildings in urban and suburban areas. Different tones and colors in the vegetation areas will be studied by scientists to see how effective imaging radar data is in discriminating between different types of wetlands. Accurate maps of coastal wetland areas are important to ecologists studying wild fowl and the coastal environment. http://photojournal.jpl.nasa.gov/catalog/PIA01300
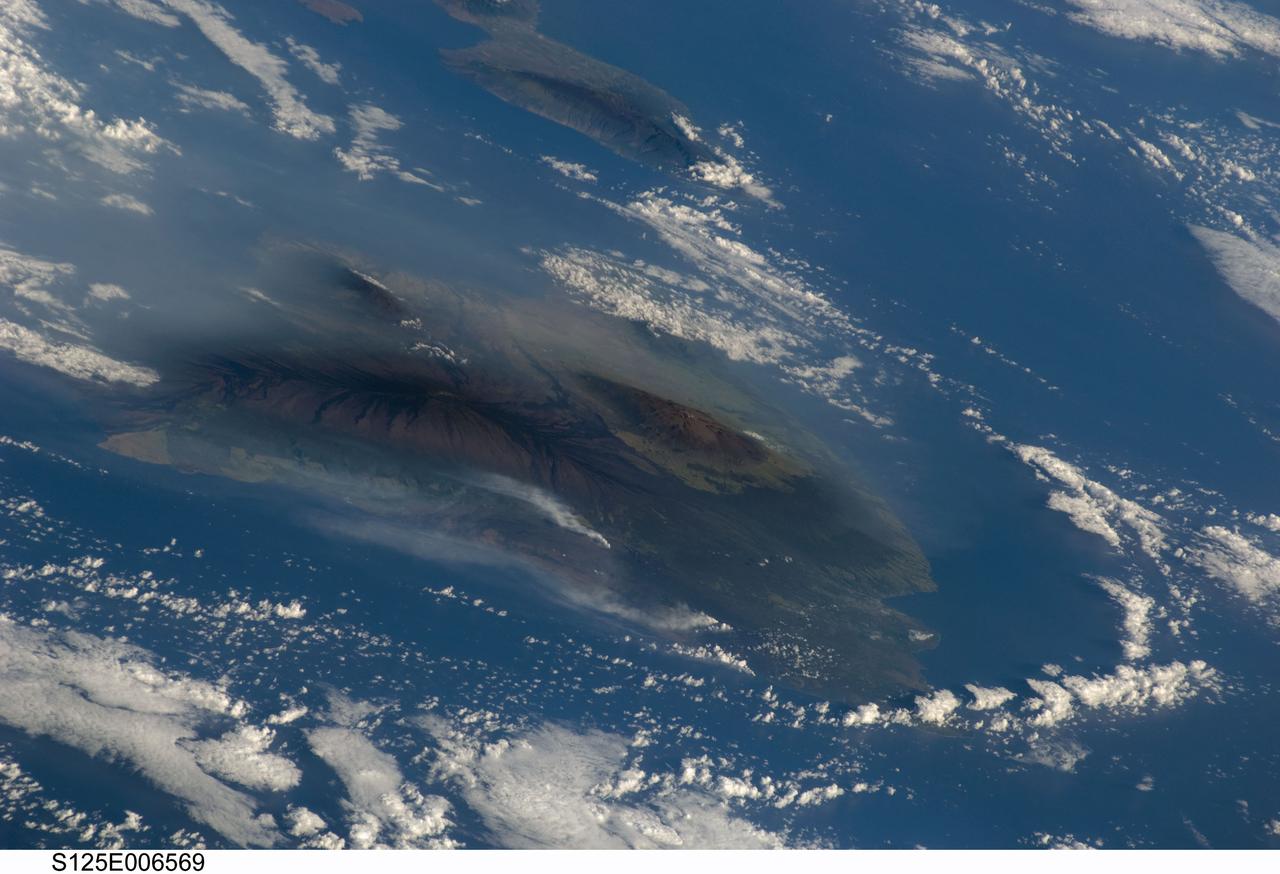
S125-E-006569 (13 May 2009) --- Hawaiian vog from Kilauea volcano, on the island of Hawaii, has been erupting continuously since 1983. This image, taken by the crew of Space Shuttle Atlantis (after completing the capture of the Hubble Space Telescope), shows the volcanic plumes from Kilauea rising up from Halema`uma`u Crater and along the coastline from lava flows entering the ocean from the East rift zone. The volcanic activity has created a blanket of volcanic fog, called vog that envelops the island. The Hawaii Volcano Observatory (HVO) maintains a website (including webcams) that continuously monitors and updates reports on the volcanic activity. Recent maps indicate expanded lava coverage along the coastal plain. In addition, Hawaii?s Department of Health maintains daily vog alerts, and publishes advisories for vog conditions around the ?big island? of Hawaii and the state. When this image was acquired, the region west of Hawaii Volcanoes National Park (downwind from the coastal plumes) had a vog advisory for people with respiratory sensitivities. The Volcano Observatory also reported that ?Lava from east rift zone vents continues to flow through tubes to the coast and is entering the ocean at two locations west of Kalapana. Sulfur dioxide emission rates from the Halema`uma`u and Pu`u `O`o vents remain elevated. Sulfur dioxide emission rates remain elevated and variable; the most recent rate measurement was 1,200 tonnes/day on May 12, compared to the 2003-2007 average rate of 140 tonnes/day. Small amounts of mostly ash-sized tephra continue to be produced consisting mostly of Pele's hair -- irregular pieces of vesicular glass -- and a few hollow spherules.?
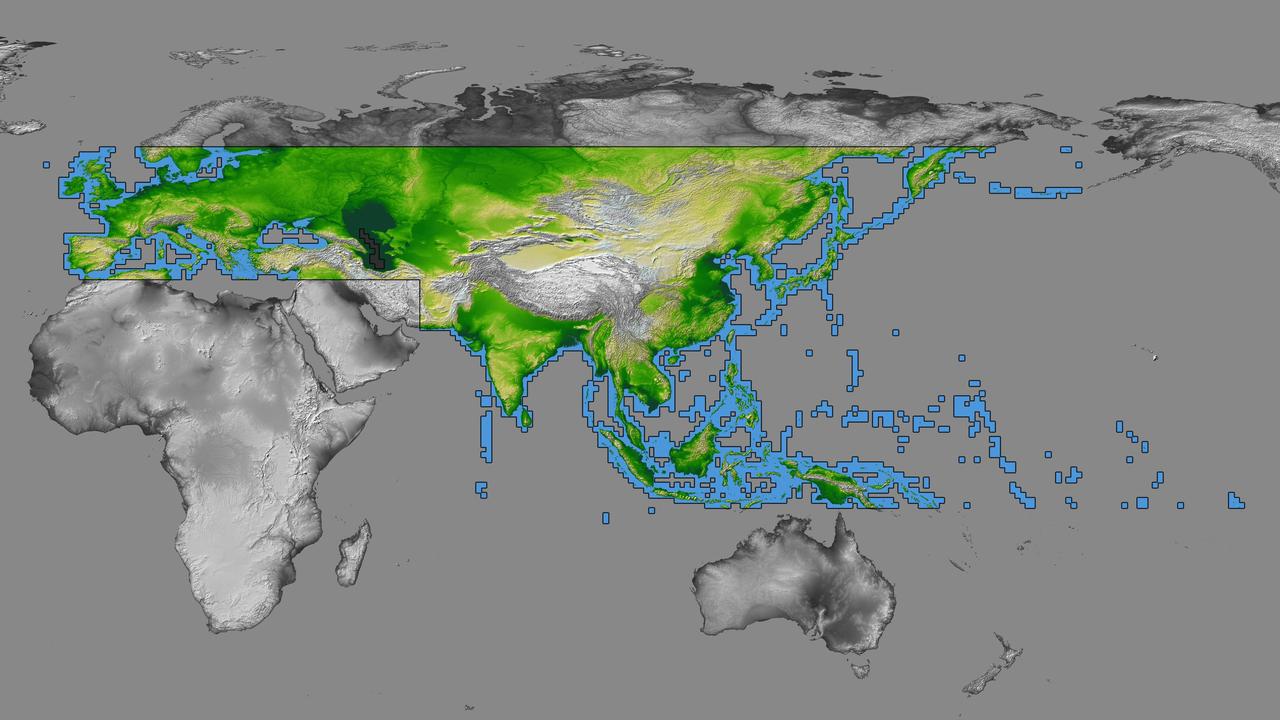
inal Caption Released with Image: The colored regions of this map show the extent of digital elevation data recently released by the Shuttle Radar Topography Mission (SRTM). This release includes data for most of Europe and Asia plus numerous islands in the Indian and Pacific Oceans. SRTM flew on board the Space Shuttle Endeavour in February 2000 and used an interferometric radar system to map the topography of Earth's landmass between latitudes 56 degrees south and 60 degrees north. The data were processed into geographic "tiles," each of which represents one by one degree of latitude and longitude. A degree of latitude measures 111 kilometers (69 miles) north-south, and a degree of longitude measures 111 kilometers or less east-west, decreasing away from the equator. The data are being released to the public on a continent-by-continent basis. This Eurasia segment includes 5,940 tiles, more than a third of the total data set. Previous releases covered North America and South America. Forthcoming releases will include Africa-Arabia and Australia plus an "Islands" release for those islands not included in the continental releases. Together these data releases constitute the world's first high-resolution, near-global elevation model. The resolution of the publicly released data is three arcseconds (1/1,200 of a degree of latitude and longitude), which is about 90 meters (295 feet). European coverage in the current data release stretches eastward from the British Isles and the Iberian Peninsula in the west, across the Alps and Carpathian Mountains, as well as the Northern European Plain, to the Ural and Caucasus Mountains bordering Asia. The Asian coverage includes a great diversity of landforms, including the Tibetan Plateau, Tarin Basin, Mongolian Plateau, and the mountains surrounding Lake Baikal, the world's deepest lake. Mt. Everest in the Himalayas, at 8,848 meters (29,029 feet) is the world's highest mountain. From India's Deccan Plateau, to Southeast Asia, coastal China, and Korea, various landforms place constraints upon land use planning for a great population. Volcanoes in the East Indies, the Philippines, Japan, and the Kamchatka Peninsula form the western part of the "Ring of Fire" around the Pacific Ocean. Many of these regions were previously very poorly mapped due to persistent cloud cover or the inaccessibility of the terrain. Digital elevation data, such as provided by SRTM, are particularly in high demand by scientists studying earthquakes, volcanism, and erosion patterns for use in mapping and modeling hazards to human habitation. But the shape of Earth's surface affects nearly every natural process and human endeavor that occurs there, so elevation data are used in a wide range of applications. In this index map color-coding is directly related to topographic height, with green at the lower elevations, rising through yellow and tan, to white at the highest elevations. The large, very dark green feature in western Asia is the Caspian Sea, which is below sea level. Blue areas on the map represent water within the mapped tiles, each of which includes shorelines or islands. http://photojournal.jpl.nasa.gov/catalog/PIA03398
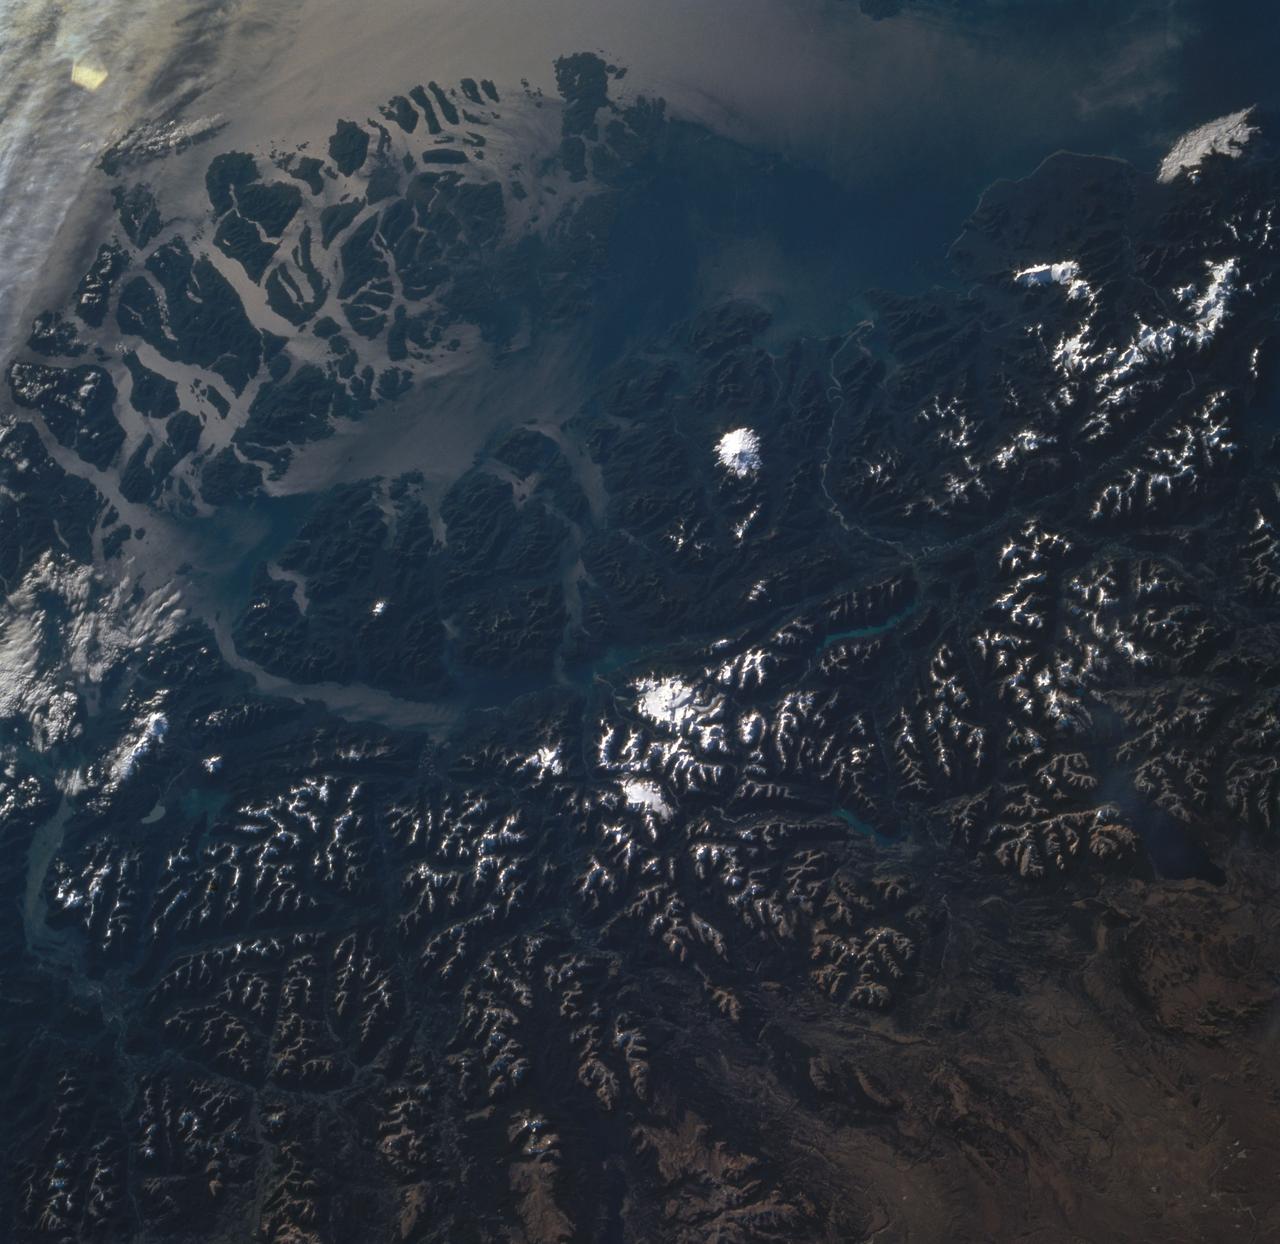
STS060-85-000AH (3-11 Feb 1994) --- This view is centered at about 44 degrees south along the Chilean continental margin of South America. The dark-colored coastal region is heavily forested by dense old-growth forests that are now being cut, but east of the mountains in Argentina the dry climate supports very little vegetation. This desert region known as Patagonia appears as light brown colors. The coastline is especially dramatic because it is shaped by the tortuous channels carved by glaciers which have left fjords. These fjords have effectively cut across the continental divide, and are bordered by active volcanoes which reach elevations between 2, 000 - 3,000 meters. The prominent volcanic peak in the center of the frame is Mt. Melimoya. To the north is a long, snow-covered volcanic ridge called Cerro Yantales. Cerro Yantales recently reported greatly increased fumarolic activity, including the emission of yellow gases near the summit. Russian and American scientists will use this photography to look for further evidence of increased activity like snow melt around the peak. Other Russian and American scientists are particularly interested in mapping the summertime snowline and firm (permanent snow field) elevations as early indications of any potential climatic variation in the making.
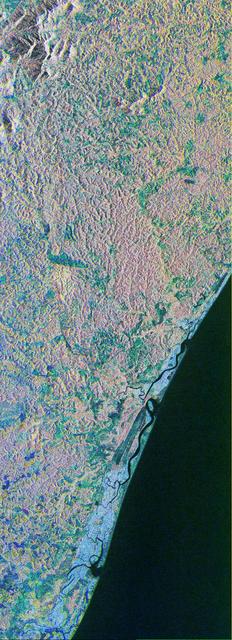
This is a color composite image of southern Bahia, Brazil, centered at 15.22 degree south latitude and 39.07 degrees west longitude. The image was acquired by the Spaceborne Imaging Radar-C/X-band Synthetic Aperture Radar aboard the space shuttle Endeavour on its 38th orbit of Earth on October 2, 1994. The image covers an area centered over the Una Biological Reserve, one the largest protected areas in northeastern Brazil. The 7,000-hectare reserve is administered by the Brazilian Institute for the Environment and is part of the larger Atlantic coastal forest, a narrow band of rain forest extending along the eastern coast of Brazil. The Atlantic coastal forest of southern Bahia is one of the world's most threatened and diverse ecosystems. Due to widespread settlement, only 2 to 5 percent of the original forest cover remains. Yet the region still contains an astounding variety of plants and animals, including a large number of endemic species. More than half of the region's tree species and 80 percent of its animal species are indigenous and found nowhere else on Earth. The Una Reserve is also the only federally protected habitat for the golden-headed lion tamarin, the yellow-breasted capuchin monkey and many other endangered species. In the past few years, scientists from Brazilian and international conservation organizations have coordinated efforts to study the biological diversity of this region and to develop practical and economically viable options for preserving the remaining primary forests in southern Bahia. The shuttle imaging radar is used in this study to identify various land uses and vegetation types, including remaining patches of primary forest, cabruca forest (cacao planted in the understory of the native forest), secondary forest, pasture and coastal mangrove. Standard remote-sensing technology that relies on light reflected from the forest canopy cannot accurately distinguish between cabruca and undisturbed forest. Optical remote sensing is also limited by the nearly continuous cloud cover in the region and heavy rainfall, which occurs more than 150 days each year. The ability of the shuttle radars to "see" through the forest canopy to the cultivated cacao below -- independent of weather or sunlight conditions --will allow researchers to distinguish forest from cabruca in unprecedented detail. This SIR-C/X-SAR image was produced by assigning red to the L-band, green to the C-band and blue to the X-band. The Una Reserve is located in the middle of the image west of the coastline and slightly northwest of Comandatuba River. The reserve's primary forests are easily detected by the pink areas in the image. The intensity of red in these areas is due to the high density of forest vegetation (biomass) detected by the radar's L-band (horizontally transmitted and vertically received) channel. Secondary forest is visible along the reserve's eastern border. The Serrado Mar mountain range is located in the top left portion of the image. Cabruca forest to the west of Una Reserve has a different texture and a yellow color. The removal of understory in cabruca forest reduces its biomass relative to primary forest, which changes the L-band and C-band penetration depth and returns, and produces a different texture and color in the image. The region along the Atlantic is mainly mangrove swamp, agricultural fields and urban areas. The high intensity of blue in this region is a result of increasing X-band return in areas covered with swamp and low vegetation. The image clearly separates the mangrove region (east of coastal Highway 001, shown in blue) from the taller and dryer forest west of the highway. The high resolution capability of SIR-C/X-SAR imaging and the sensitivity of its frequency and polarization channels to various land covers will be used for monitoring and mapping areas of importance for conservation. http://photojournal.jpl.nasa.gov/catalog/PIA01764
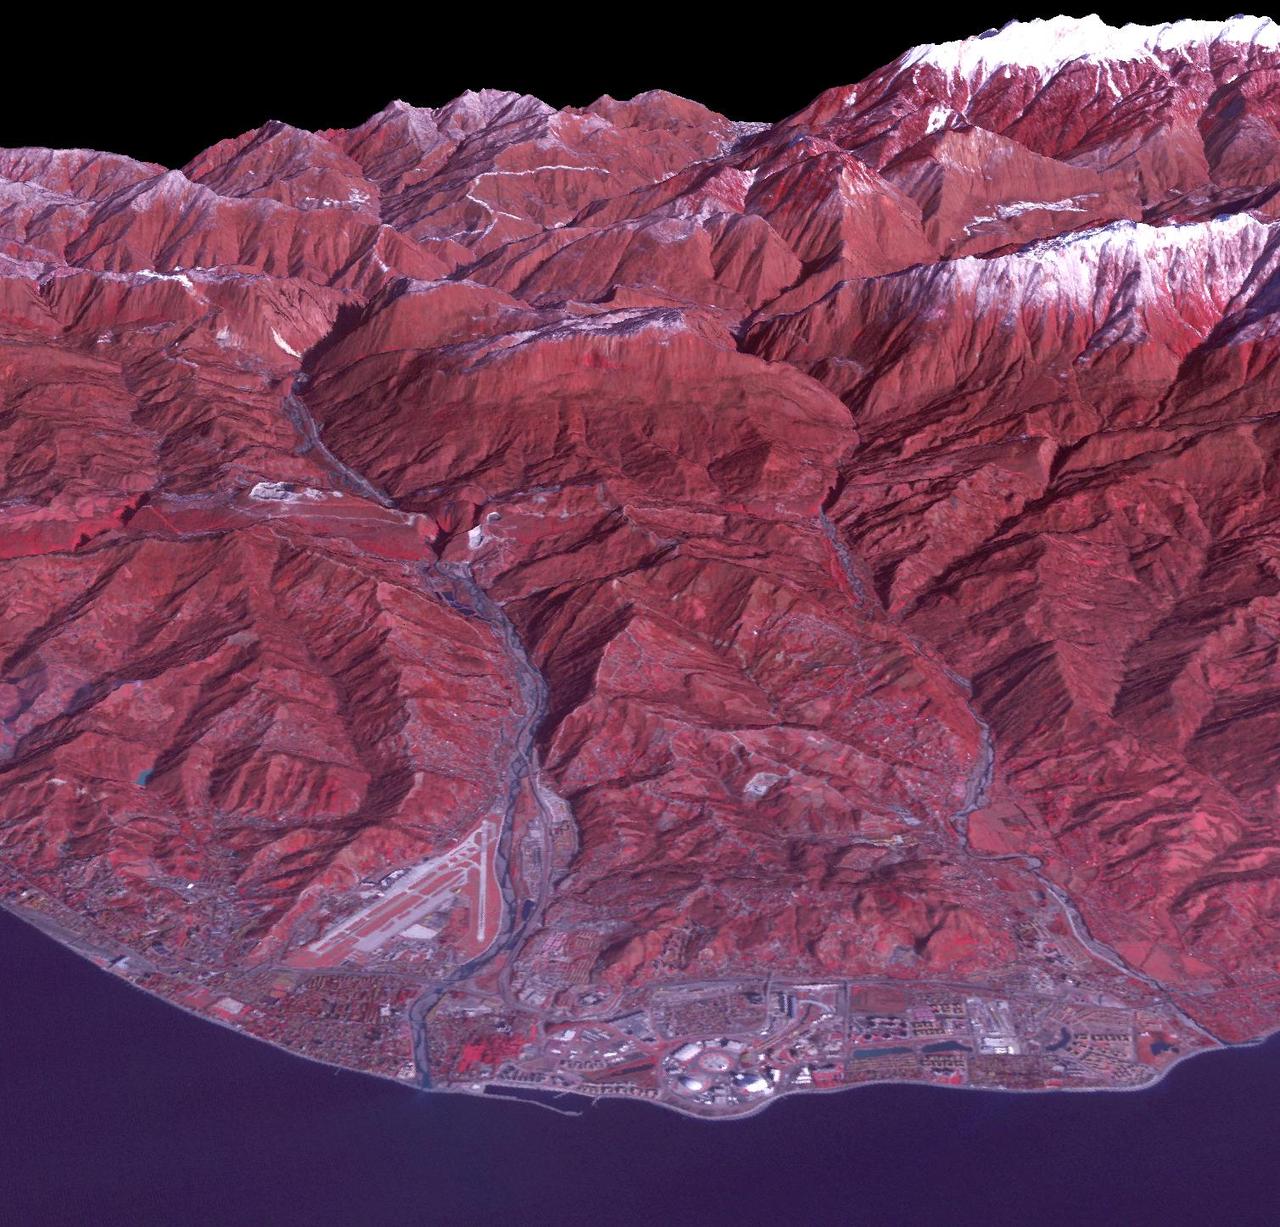
Sochi, Russia Winter Olympic Sites (Coastal Cluster) The Black Sea resort of Sochi, Russia, is the warmest city ever to host the Winter Olympic Games, which open on Feb. 7, 2014, and run through Feb. 23. This north-looking image, acquired on Jan. 4, 2014, by the Advanced Spaceborne Thermal Emission and Reflection Radiometer (ASTER) instrument on NASA's Terra spacecraft, shows the Sochi Olympic Park Coastal Cluster -- the circular area on the shoreline in the bottom center of the image -- which was built for Olympic indoor sports. Even curling has its own arena alongside multiple arenas for hockey and skating. The Olympic alpine events will take place at the Mountain Cluster, located in a snow-capped valley at the top right of the image. Sochi itself, a city of about 400,000, is not visible in the picture. It's farther west (left) along the coast, past the airport at bottom left. In the image, red indicates vegetation, white is snow, buildings are gray and the ocean is dark blue. The area imaged is about 15 miles (24 kilometers) from west to east (left to right) at the coastline and 25 miles (41 kilometers) from front to back. Height is exaggerated 1.5 times. The image was created from the ASTER visible and near-infrared bands, draped over ASTER-derived digital elevation data. With its 14 spectral bands from the visible to the thermal infrared wavelength region and its high spatial resolution of 15 to 90 meters (about 50 to 300 feet), ASTER images Earth to map and monitor the changing surface of our planet. ASTER is one of five Earth-observing instruments launched Dec. 18, 1999, on Terra. The instrument was built by Japan's Ministry of Economy, Trade and Industry. A joint U.S./Japan science team is responsible for validation and calibration of the instrument and data products. The broad spectral coverage and high spectral resolution of ASTER provides scientists in numerous disciplines with critical information for surface mapping and monitoring of dynamic conditions and temporal change. Example applications are: monitoring glacial advances and retreats; monitoring potentially active volcanoes; identifying crop stress; determining cloud morphology and physical properties; wetlands evaluation; thermal pollution monitoring; coral reef degradation; surface temperature mapping of soils and geology; and measuring surface heat balance. The U.S. science team is located at NASA's Jet Propulsion Laboratory, Pasadena, Calif. The Terra mission is part of NASA's Science Mission Directorate, Washington, D.C. More information about ASTER is available at <a href="http://asterweb.jpl.nasa.gov/" rel="nofollow">asterweb.jpl.nasa.gov/</a>. Image credit: NASA/GSFC/METI/ERSDAC/JAROS, and U.S./Japan ASTER Science Team <b><a href="http://www.nasa.gov/audience/formedia/features/MP_Photo_Guidelines.html" rel="nofollow">NASA image use policy.</a></b> <b><a href="http://www.nasa.gov/centers/goddard/home/index.html" rel="nofollow">NASA Goddard Space Flight Center</a></b> enables NASA’s mission through four scientific endeavors: Earth Science, Heliophysics, Solar System Exploration, and Astrophysics. Goddard plays a leading role in NASA’s accomplishments by contributing compelling scientific knowledge to advance the Agency’s mission. <b>Follow us on <a href="http://twitter.com/NASAGoddardPix" rel="nofollow">Twitter</a></b> <b>Like us on <a href="http://www.facebook.com/pages/Greenbelt-MD/NASA-Goddard/395013845897?ref=tsd" rel="nofollow">Facebook</a></b> <b>Find us on <a href="http://instagram.com/nasagoddard?vm=grid" rel="nofollow">Instagram</a></b>
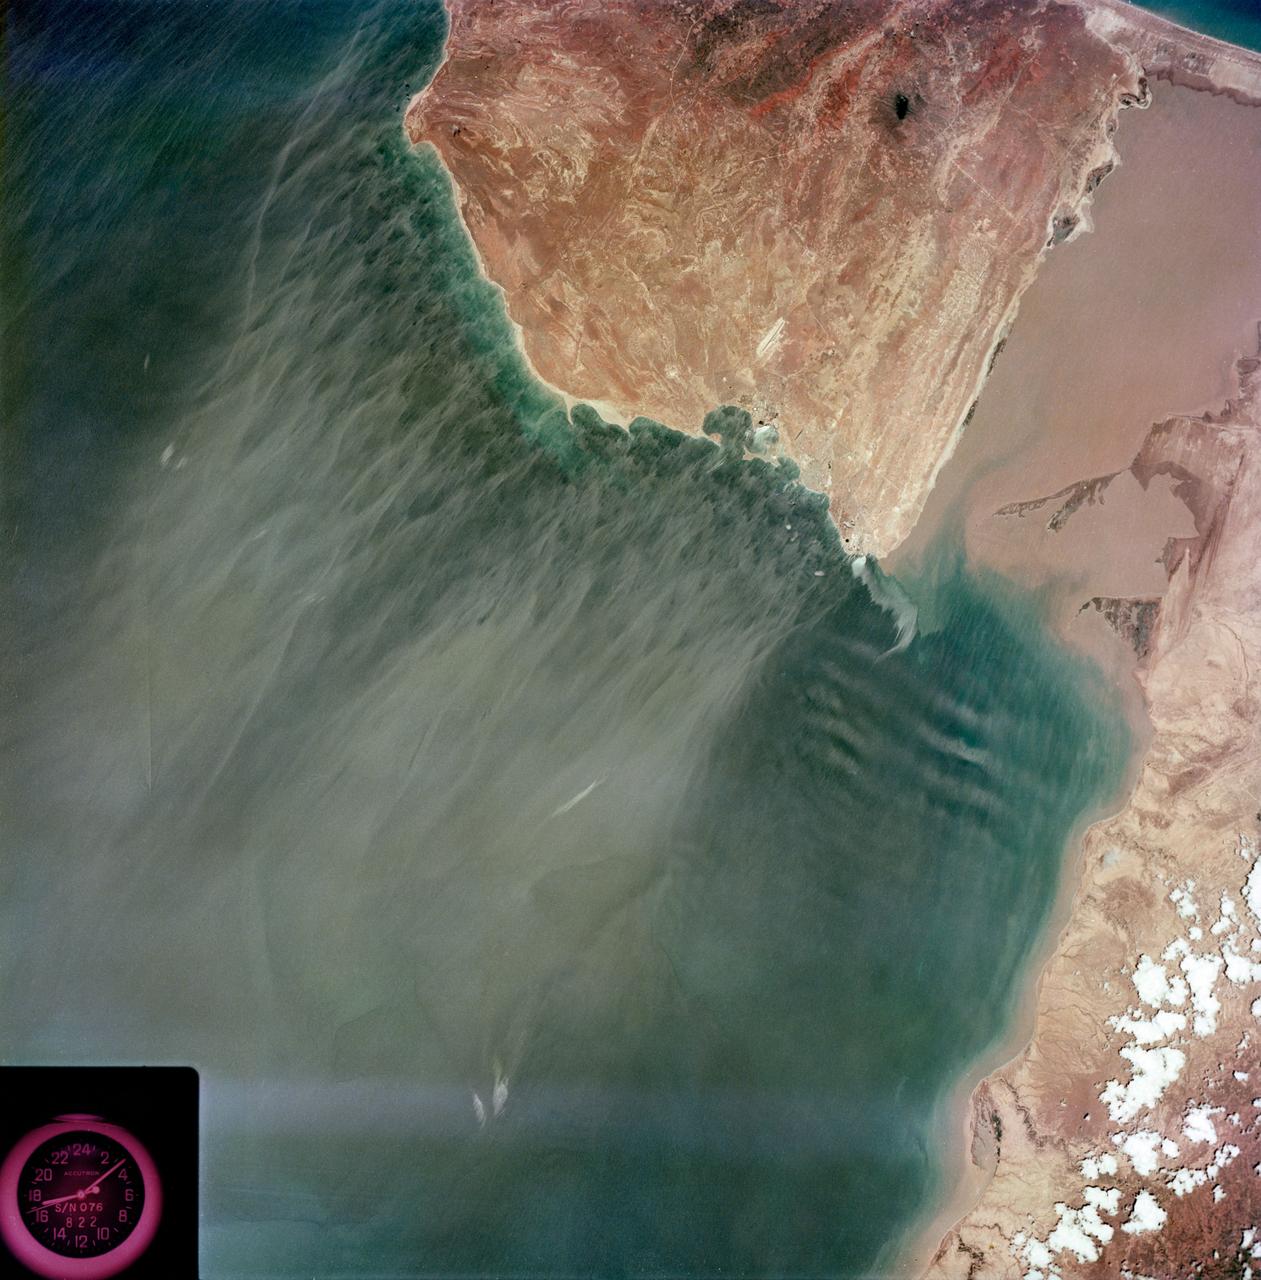
S73-35079 (July-September 1973) --- A near vertical view of the Caribbean coast of Venezuela is seen in this Skylab 3 Earth Resources Experiment Package S190-B (five-inch Earth terrain camera) photograph taken from the Skylab space station in Earth orbit. The large body of water is the Golfo de Venezuela; and the major land mass is the Peninsula de Paraguana. The view is looking northward from the mouth of the Golfete de Coro and Punta Cardon to Punta Macolla. The peninsula is connected to the Venezuelan mainland by the narrow strip of land in the most easterly corner of the picture. The dry, arid climate on the peninsula is indicated by sparse vegetation and the abundance of sand dunes. The highest point is about 2,700 feet above the sea and is the conspicuous black spot. Old raised shoreline features appear as streaks parallel to the Golfete de Coro. Sand dunes and stream erosion have modified these features. Water of the Golfete de Coro is red from the high sediment content. The streaks in the water off the peninsula is apparently an effect of wind which is blowing sand and water offshore. The EREP investigator Dr. Jose Antonio Galavis, of the Ministerio de Mines e Hidrocarburos, will use this information to map geology and coastal sedimentation in the Peninsula de Paraguana. Federal agencies participating with NASA on the EREP projects are the Departments of Agriculture, Commerce, Interior, the Environmental Protection Agency and the Corps of Engineers. All EREP photography is available to the public through the Department of Interior?s Earth Resources Observations Systems Data Center, Sioux Falls, South Dakota, 57198. (Alternate number SL3-83-237) Photo credit: NASA
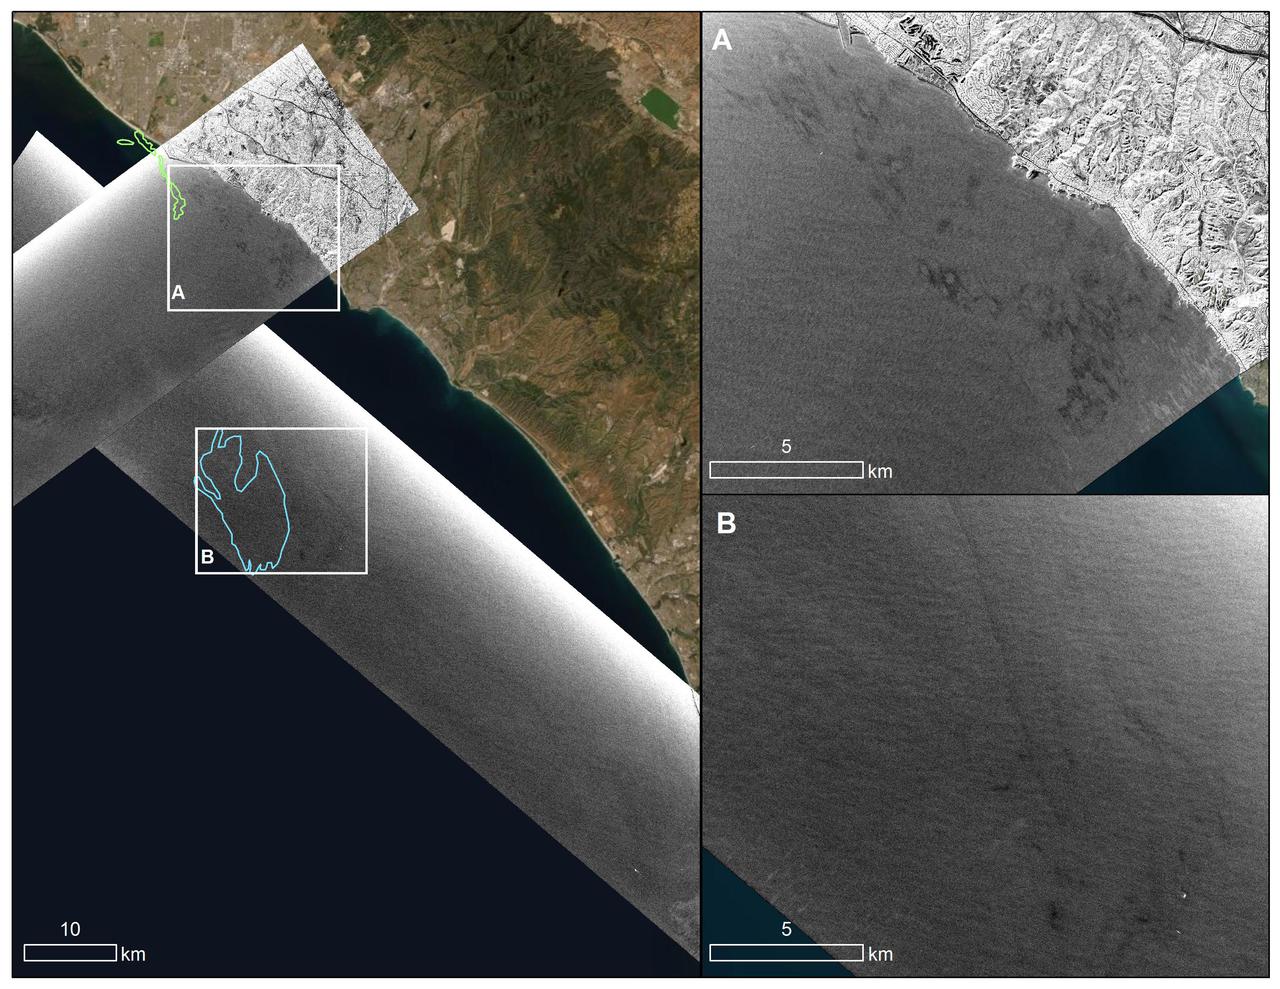
An oil spill off the Southern California coast – first reported to the U.S. Coast Guard on Oct. 2, 2021 – prompted an effort by NASA's Applied Sciences Disasters Program to determine what NASA resources and capabilities could be available to support response efforts for the spill. As part of those efforts, a team from NASA's Jet Propulsion Laboratory in Southern California flew an airplane equipped with an instrument known as the Uninhabited Aerial Vehicle Synthetic Aperture Radar (UAVSAR) over the spill area on Oct. 6 to corroborate the presence and location of oil slicks. Mapping the location of oil slicks and determining how thick the oil is can also help with clean-up activities. The JPL researchers collected the UAVSAR data in support of the National Oceanic and Atmospheric Administration (NOAA), which regularly monitors U.S. coastal waters for potential spills. This image shows a composite of two images taken during passes (grayscale regions) made by the UAVSAR instrument off the coast of Huntington Beach. Dark smudges off the coast in the close-up images to the right (labeled A and B) are potential oil slicks – NOAA researchers will analyze the data to look for the presence of oil. The area outlined in light green (image on the left) was identified by NOAA using satellite data as a region possibly containing oil on Oct.3, while the blue outline shows an area on Oct. 6 that could also contain oil. Attached to the bottom of a Gulfstream-III based at NASA's Armstrong Flight Research Center near Palmdale, California, UAVSAR is an all-weather tool that bounces radar signals off of Earth's surface. Repeated images of the same areas, taken at different times, enable scientists to detect changes in those regions. The radar signals will reflect differently off of different surfaces, including oil and seawater. These signal variations can tell researchers about the presence of an oil slick in the ocean, and in some cases provide information about its thickness. https://photojournal.jpl.nasa.gov/catalog/PIA23782
![The monster winter storm that brought icing to the U.S. southeast moved northward along the Eastern Seaboard and brought snow, sleet and rain from the Mid-Atlantic to New England on February 13. A new image from NOAA's GOES satellite showed clouds associated with the massive winter storm stretch from the U.S. southeast to the northeast. Data from NOAA's GOES-East satellite taken on Feb. 13 at 1455 UTC/9:45 a.m. EST were made into an image by NASA/NOAA's GOES Project at NASA's Goddard Space Flight Center in Greenbelt, Md. The clouds and fallen snow data from NOAA's GOES-East satellite were overlaid on a true-color image of land and ocean created by data from the Moderate Resolution Imaging Spectroradiometer or MODIS instrument that flies aboard NASA's Aqua and Terra satellites.The image showed that the clouds associated with the storm were blanketing much of the U.S. East Coast. At 3:11 a.m. EST, a surface map issued by the National Weather Service or NWS showed the storm's low pressure area was centered over eastern North Carolina. Since then, the low has continued to track north along the eastern seaboard. By 11 a.m. EST, precipitation from the storm was falling from South Carolina to Maine, according to National Weather Service radar. By 11 a.m. EST, the Washington, D.C. region snow and sleet totals ranged from 3" in far eastern Maryland to over 18" in the northern and western suburbs in Maryland and Virginia. NWS reported that snow, sleet and rain were still falling and more snow is expected as the back side of the low moves into the region. The New York City region remained under an NWS Winter Storm Warning until 6 a.m. on Friday, February 14 and the National Weather Service expects minor coastal impacts Thursday into Friday afternoon. New England was also being battered by the storm. At 10:56 a.m. EST, Barnstable, Mass. on Cape Cod was experiencing rain and winds gusting to 28 mph. An NWS wind advisory is in effect for Cape Cod until 7 p.m. EST. Further north, Portland, Maine was experiencing heavy snow with winds from the northeast at 6 mph. The National Weather Service in Gray, Maine noted "Significant snowfall is likely for much of western Maine and New Hampshire as this storm passes by. There will be a mix or changeover to sleet and freezing rain over southern and coastal sections tonight...before all areas end as a period of snow Friday (Feb. 14) morning." On February 13 at 10 a.m. EST, NOAA's National Weather Service noted "An abundance of Atlantic moisture getting wrapped into the storm will continue to fuel widespread precipitation...which should lift through the Mid-Atlantic States and Northeast Thursday into Friday. A wide swath of heavy snow accumulations are expected with this storm...but air [moving] off the warmer ocean water should change snow over to rain along the coastal areas. Also...a narrow axis of sleet and freezing rain will be possible within the transition zone...which is expected to set up near the I-95 corridor." For updates on local forecasts, watches and warnings, visit NOAA's <a href="http://www.weather.gov" rel="nofollow">www.weather.gov</a> webpage. GOES satellites provide the kind of continuous monitoring necessary for intensive data analysis. Geostationary describes an orbit in which a satellite is always in the same position with respect to the rotating Earth. This allows GOES to hover continuously over one position on Earth's surface, appearing stationary. As a result, GOES provide a constant vigil for the atmospheric "triggers" for severe weather conditions such as tornadoes, flash floods, hail storms and hurricanes. For updated information about the storm system, visit NOAA's WPC website: <a href="http://www.hpc.ncep.noaa.gov/" rel="nofollow">www.hpc.ncep.noaa.gov/</a> For more information about GOES satellites, visit: <a href="http://www.goes.noaa.gov/" rel="nofollow">www.goes.noaa.gov/</a> or <a href="http://goes.gsfc.nasa.gov/" rel="nofollow">goes.gsfc.nasa.gov/</a> Credit: NASA/GSFC/Jeff Schmaltz/MODIS Land Rapid Response Team <b><a href="http://www.nasa.gov/audience/formedia/features/MP_Photo_Guidelines.html" rel="nofollow">NASA image use policy.</a></b> <b><a href="http://www.nasa.gov/centers/goddard/home/index.html" rel="nofollow">NASA Goddard Space Flight Center</a></b> enables NASA’s mission through four scientific endeavors: Earth Science, Heliophysics, Solar System Exploration, and Astrophysics. Goddard plays a leading role in NASA’s accomplishments by contributing compelling scientific knowledge to advance the Agency’s mission. <b>Follow us on <a href="http://twitter.com/NASAGoddardPix" rel="nofollow">Twitter</a></b> <b>Like us on <a href="http://www.facebook.com/pages/Greenbelt-MD/NASA-Goddard/395013845897?ref=tsd" rel="nofollow">Facebook</a></b> <b>Find us on <a href="http://instagram.com/nasagoddard?vm=grid" rel="nofollow">Instagram</a></b>](https://images-assets.nasa.gov/image/GSFC_20171208_Archive_e001229/GSFC_20171208_Archive_e001229~medium.jpg)
The monster winter storm that brought icing to the U.S. southeast moved northward along the Eastern Seaboard and brought snow, sleet and rain from the Mid-Atlantic to New England on February 13. A new image from NOAA's GOES satellite showed clouds associated with the massive winter storm stretch from the U.S. southeast to the northeast. Data from NOAA's GOES-East satellite taken on Feb. 13 at 1455 UTC/9:45 a.m. EST were made into an image by NASA/NOAA's GOES Project at NASA's Goddard Space Flight Center in Greenbelt, Md. The clouds and fallen snow data from NOAA's GOES-East satellite were overlaid on a true-color image of land and ocean created by data from the Moderate Resolution Imaging Spectroradiometer or MODIS instrument that flies aboard NASA's Aqua and Terra satellites.The image showed that the clouds associated with the storm were blanketing much of the U.S. East Coast. At 3:11 a.m. EST, a surface map issued by the National Weather Service or NWS showed the storm's low pressure area was centered over eastern North Carolina. Since then, the low has continued to track north along the eastern seaboard. By 11 a.m. EST, precipitation from the storm was falling from South Carolina to Maine, according to National Weather Service radar. By 11 a.m. EST, the Washington, D.C. region snow and sleet totals ranged from 3" in far eastern Maryland to over 18" in the northern and western suburbs in Maryland and Virginia. NWS reported that snow, sleet and rain were still falling and more snow is expected as the back side of the low moves into the region. The New York City region remained under an NWS Winter Storm Warning until 6 a.m. on Friday, February 14 and the National Weather Service expects minor coastal impacts Thursday into Friday afternoon. New England was also being battered by the storm. At 10:56 a.m. EST, Barnstable, Mass. on Cape Cod was experiencing rain and winds gusting to 28 mph. An NWS wind advisory is in effect for Cape Cod until 7 p.m. EST. Further north, Portland, Maine was experiencing heavy snow with winds from the northeast at 6 mph. The National Weather Service in Gray, Maine noted "Significant snowfall is likely for much of western Maine and New Hampshire as this storm passes by. There will be a mix or changeover to sleet and freezing rain over southern and coastal sections tonight...before all areas end as a period of snow Friday (Feb. 14) morning." On February 13 at 10 a.m. EST, NOAA's National Weather Service noted "An abundance of Atlantic moisture getting wrapped into the storm will continue to fuel widespread precipitation...which should lift through the Mid-Atlantic States and Northeast Thursday into Friday. A wide swath of heavy snow accumulations are expected with this storm...but air [moving] off the warmer ocean water should change snow over to rain along the coastal areas. Also...a narrow axis of sleet and freezing rain will be possible within the transition zone...which is expected to set up near the I-95 corridor." For updates on local forecasts, watches and warnings, visit NOAA's <a href="http://www.weather.gov" rel="nofollow">www.weather.gov</a> webpage. GOES satellites provide the kind of continuous monitoring necessary for intensive data analysis. Geostationary describes an orbit in which a satellite is always in the same position with respect to the rotating Earth. This allows GOES to hover continuously over one position on Earth's surface, appearing stationary. As a result, GOES provide a constant vigil for the atmospheric "triggers" for severe weather conditions such as tornadoes, flash floods, hail storms and hurricanes. For updated information about the storm system, visit NOAA's WPC website: <a href="http://www.hpc.ncep.noaa.gov/" rel="nofollow">www.hpc.ncep.noaa.gov/</a> For more information about GOES satellites, visit: <a href="http://www.goes.noaa.gov/" rel="nofollow">www.goes.noaa.gov/</a> or <a href="http://goes.gsfc.nasa.gov/" rel="nofollow">goes.gsfc.nasa.gov/</a> Credit: NASA/GSFC/Jeff Schmaltz/MODIS Land Rapid Response Team <b><a href="http://www.nasa.gov/audience/formedia/features/MP_Photo_Guidelines.html" rel="nofollow">NASA image use policy.</a></b> <b><a href="http://www.nasa.gov/centers/goddard/home/index.html" rel="nofollow">NASA Goddard Space Flight Center</a></b> enables NASA’s mission through four scientific endeavors: Earth Science, Heliophysics, Solar System Exploration, and Astrophysics. Goddard plays a leading role in NASA’s accomplishments by contributing compelling scientific knowledge to advance the Agency’s mission. <b>Follow us on <a href="http://twitter.com/NASAGoddardPix" rel="nofollow">Twitter</a></b> <b>Like us on <a href="http://www.facebook.com/pages/Greenbelt-MD/NASA-Goddard/395013845897?ref=tsd" rel="nofollow">Facebook</a></b> <b>Find us on <a href="http://instagram.com/nasagoddard?vm=grid" rel="nofollow">Instagram</a></b>
![The monster winter storm that brought icing to the U.S. southeast moved northward along the Eastern Seaboard and brought snow, sleet and rain from the Mid-Atlantic to New England on February 13. A new image from NOAA's GOES satellite showed clouds associated with the massive winter storm stretch from the U.S. southeast to the northeast. Data from NOAA's GOES-East satellite taken on Feb. 13 at 1455 UTC/9:45 a.m. EST were made into an image by NASA/NOAA's GOES Project at NASA's Goddard Space Flight Center in Greenbelt, Md. The clouds and fallen snow data from NOAA's GOES-East satellite were overlaid on a true-color image of land and ocean created by data from the Moderate Resolution Imaging Spectroradiometer or MODIS instrument that flies aboard NASA's Aqua and Terra satellites.The image showed that the clouds associated with the storm were blanketing much of the U.S. East Coast. At 3:11 a.m. EST, a surface map issued by the National Weather Service or NWS showed the storm's low pressure area was centered over eastern North Carolina. Since then, the low has continued to track north along the eastern seaboard. By 11 a.m. EST, precipitation from the storm was falling from South Carolina to Maine, according to National Weather Service radar. By 11 a.m. EST, the Washington, D.C. region snow and sleet totals ranged from 3" in far eastern Maryland to over 18" in the northern and western suburbs in Maryland and Virginia. NWS reported that snow, sleet and rain were still falling and more snow is expected as the back side of the low moves into the region. The New York City region remained under an NWS Winter Storm Warning until 6 a.m. on Friday, February 14 and the National Weather Service expects minor coastal impacts Thursday into Friday afternoon. New England was also being battered by the storm. At 10:56 a.m. EST, Barnstable, Mass. on Cape Cod was experiencing rain and winds gusting to 28 mph. An NWS wind advisory is in effect for Cape Cod until 7 p.m. EST. Further north, Portland, Maine was experiencing heavy snow with winds from the northeast at 6 mph. The National Weather Service in Gray, Maine noted "Significant snowfall is likely for much of western Maine and New Hampshire as this storm passes by. There will be a mix or changeover to sleet and freezing rain over southern and coastal sections tonight...before all areas end as a period of snow Friday (Feb. 14) morning." On February 13 at 10 a.m. EST, NOAA's National Weather Service noted "An abundance of Atlantic moisture getting wrapped into the storm will continue to fuel widespread precipitation...which should lift through the Mid-Atlantic States and Northeast Thursday into Friday. A wide swath of heavy snow accumulations are expected with this storm...but air [moving] off the warmer ocean water should change snow over to rain along the coastal areas. Also...a narrow axis of sleet and freezing rain will be possible within the transition zone...which is expected to set up near the I-95 corridor." For updates on local forecasts, watches and warnings, visit NOAA's <a href="http://www.weather.gov" rel="nofollow">www.weather.gov</a> webpage. GOES satellites provide the kind of continuous monitoring necessary for intensive data analysis. Geostationary describes an orbit in which a satellite is always in the same position with respect to the rotating Earth. This allows GOES to hover continuously over one position on Earth's surface, appearing stationary. As a result, GOES provide a constant vigil for the atmospheric "triggers" for severe weather conditions such as tornadoes, flash floods, hail storms and hurricanes. For updated information about the storm system, visit NOAA's WPC website: <a href="http://www.hpc.ncep.noaa.gov/" rel="nofollow">www.hpc.ncep.noaa.gov/</a> For more information about GOES satellites, visit: <a href="http://www.goes.noaa.gov/" rel="nofollow">www.goes.noaa.gov/</a> or <a href="http://goes.gsfc.nasa.gov/" rel="nofollow">goes.gsfc.nasa.gov/</a> Credit: NASA/GSFC/Jeff Schmaltz/MODIS Land Rapid Response Team <b><a href="http://www.nasa.gov/audience/formedia/features/MP_Photo_Guidelines.html" rel="nofollow">NASA image use policy.</a></b> <b><a href="http://www.nasa.gov/centers/goddard/home/index.html" rel="nofollow">NASA Goddard Space Flight Center</a></b> enables NASA’s mission through four scientific endeavors: Earth Science, Heliophysics, Solar System Exploration, and Astrophysics. Goddard plays a leading role in NASA’s accomplishments by contributing compelling scientific knowledge to advance the Agency’s mission. <b>Follow us on <a href="http://twitter.com/NASAGoddardPix" rel="nofollow">Twitter</a></b> <b>Like us on <a href="http://www.facebook.com/pages/Greenbelt-MD/NASA-Goddard/395013845897?ref=tsd" rel="nofollow">Facebook</a></b> <b>Find us on <a href="http://instagram.com/nasagoddard?vm=grid" rel="nofollow">Instagram</a></b>](https://images-assets.nasa.gov/image/GSFC_20171208_Archive_e001228/GSFC_20171208_Archive_e001228~medium.jpg)
The monster winter storm that brought icing to the U.S. southeast moved northward along the Eastern Seaboard and brought snow, sleet and rain from the Mid-Atlantic to New England on February 13. A new image from NOAA's GOES satellite showed clouds associated with the massive winter storm stretch from the U.S. southeast to the northeast. Data from NOAA's GOES-East satellite taken on Feb. 13 at 1455 UTC/9:45 a.m. EST were made into an image by NASA/NOAA's GOES Project at NASA's Goddard Space Flight Center in Greenbelt, Md. The clouds and fallen snow data from NOAA's GOES-East satellite were overlaid on a true-color image of land and ocean created by data from the Moderate Resolution Imaging Spectroradiometer or MODIS instrument that flies aboard NASA's Aqua and Terra satellites.The image showed that the clouds associated with the storm were blanketing much of the U.S. East Coast. At 3:11 a.m. EST, a surface map issued by the National Weather Service or NWS showed the storm's low pressure area was centered over eastern North Carolina. Since then, the low has continued to track north along the eastern seaboard. By 11 a.m. EST, precipitation from the storm was falling from South Carolina to Maine, according to National Weather Service radar. By 11 a.m. EST, the Washington, D.C. region snow and sleet totals ranged from 3" in far eastern Maryland to over 18" in the northern and western suburbs in Maryland and Virginia. NWS reported that snow, sleet and rain were still falling and more snow is expected as the back side of the low moves into the region. The New York City region remained under an NWS Winter Storm Warning until 6 a.m. on Friday, February 14 and the National Weather Service expects minor coastal impacts Thursday into Friday afternoon. New England was also being battered by the storm. At 10:56 a.m. EST, Barnstable, Mass. on Cape Cod was experiencing rain and winds gusting to 28 mph. An NWS wind advisory is in effect for Cape Cod until 7 p.m. EST. Further north, Portland, Maine was experiencing heavy snow with winds from the northeast at 6 mph. The National Weather Service in Gray, Maine noted "Significant snowfall is likely for much of western Maine and New Hampshire as this storm passes by. There will be a mix or changeover to sleet and freezing rain over southern and coastal sections tonight...before all areas end as a period of snow Friday (Feb. 14) morning." On February 13 at 10 a.m. EST, NOAA's National Weather Service noted "An abundance of Atlantic moisture getting wrapped into the storm will continue to fuel widespread precipitation...which should lift through the Mid-Atlantic States and Northeast Thursday into Friday. A wide swath of heavy snow accumulations are expected with this storm...but air [moving] off the warmer ocean water should change snow over to rain along the coastal areas. Also...a narrow axis of sleet and freezing rain will be possible within the transition zone...which is expected to set up near the I-95 corridor." For updates on local forecasts, watches and warnings, visit NOAA's <a href="http://www.weather.gov" rel="nofollow">www.weather.gov</a> webpage. GOES satellites provide the kind of continuous monitoring necessary for intensive data analysis. Geostationary describes an orbit in which a satellite is always in the same position with respect to the rotating Earth. This allows GOES to hover continuously over one position on Earth's surface, appearing stationary. As a result, GOES provide a constant vigil for the atmospheric "triggers" for severe weather conditions such as tornadoes, flash floods, hail storms and hurricanes. For updated information about the storm system, visit NOAA's WPC website: <a href="http://www.hpc.ncep.noaa.gov/" rel="nofollow">www.hpc.ncep.noaa.gov/</a> For more information about GOES satellites, visit: <a href="http://www.goes.noaa.gov/" rel="nofollow">www.goes.noaa.gov/</a> or <a href="http://goes.gsfc.nasa.gov/" rel="nofollow">goes.gsfc.nasa.gov/</a> Credit: NASA/GSFC/Jeff Schmaltz/MODIS Land Rapid Response Team <b><a href="http://www.nasa.gov/audience/formedia/features/MP_Photo_Guidelines.html" rel="nofollow">NASA image use policy.</a></b> <b><a href="http://www.nasa.gov/centers/goddard/home/index.html" rel="nofollow">NASA Goddard Space Flight Center</a></b> enables NASA’s mission through four scientific endeavors: Earth Science, Heliophysics, Solar System Exploration, and Astrophysics. Goddard plays a leading role in NASA’s accomplishments by contributing compelling scientific knowledge to advance the Agency’s mission. <b>Follow us on <a href="http://twitter.com/NASAGoddardPix" rel="nofollow">Twitter</a></b> <b>Like us on <a href="http://www.facebook.com/pages/Greenbelt-MD/NASA-Goddard/395013845897?ref=tsd" rel="nofollow">Facebook</a></b> <b>Find us on <a href="http://instagram.com/nasagoddard?vm=grid" rel="nofollow">Instagram</a></b>
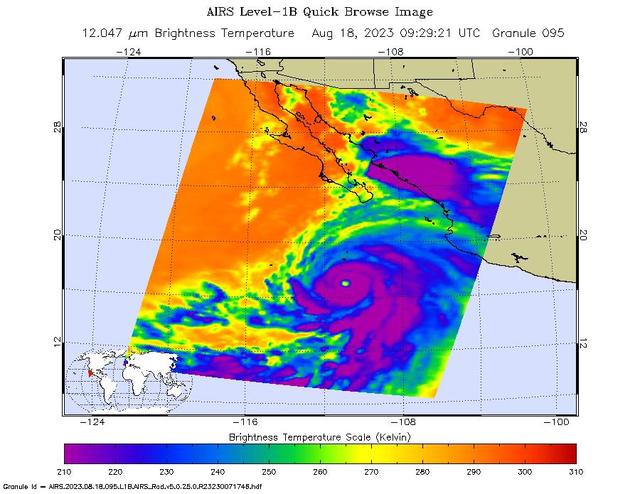
NASA's Atmospheric Infrared Sounder (AIRS) captured Hurricane Hilary on the morning of Aug. 18, 2023, when it was a Category 4 storm roughly 470 miles (760 kilometers) south of Baja California. Hilary could be the first tropical storm to make landfall in California since 1939, according to the National Weather Service. Hilary grew from a tropical storm into a Category 2 hurricane within 24 hours on Aug. 17. Another period of rapid intensification – an increase in maximum sustained wind speed of at least 30 knots (35 mph) within 24 hours – occurred Aug. 17-18. The animation shows some of this rapid growth, with images taken by AIRS Aug. 15-18. This intensification was driven by very warm ocean surface waters and weak wind shear, a term for vertical changes in wind speed. Strong wind shear can keep hurricanes from forming, or can tear them apart. AIRS measures cloud temperatures in infrared wavelengths, which can reveal information about the atmosphere not visible to the human eye. Hilary shows several indicators of a powerful hurricane: a well-defined eye surrounded by a ring of very cold clouds in purple, with warmer outer regions seen in yellows and oranges. Purple and violet areas are colder, between about minus 82 degrees Fahrenheit and minus 46 F (minus 63 degrees Celsius to minus 44 C). Blue and green regions are roughly minus 28 F to 26 F (minus 33 C to minus 3 C). The cooler parts of the clouds are associated with very heavy rainfall. Most hurricanes in the Pacific Ocean off Mexico travel westward, following tropical trade winds. Occasionally, one of these storms will head northward. Hurricane Hilary is being steered by a weak low-pressure system off the coast of California, an area normally dominated by high pressure and an atmospheric circulation pattern that would deflect storms from the region. The current forecast from the National Hurricane Center has Hilary closely following the western coastline of the Baja California peninsula, weakening as it moves north. Rainfall projections for Southern California range from 2 inches (5 centimeters) in coastal areas to 8 or more inches (20 or more centimeters) in local mountains. For comparison, San Diego and Los Angeles receive no rain in August most years, and the wettest parts of the local mountains receive about 1 inch (3 centimeters) of rain over a normal summer. In conjunction with the Advanced Microwave Sounding Unit (AMSU), AIRS senses emitted infrared and microwave radiation from Earth to provide a 3D look at the planet's weather and climate. Working in tandem, the two instruments make simultaneous observations down to Earth's surface. With more than 2,000 channels sensing different regions of the atmosphere, the system creates a global, 3D map of atmospheric temperature and humidity, cloud amounts and heights, greenhouse gas concentrations, and many other atmospheric phenomena. Launched into Earth orbit in 2002 aboard NASA's Aqua spacecraft, the AIRS and AMSU instruments are managed by NASA's Jet Propulsion Laboratory in Southern California, under contract to NASA. JPL is a division of Caltech. Animation available at https://photojournal.jpl.nasa.gov/catalog/PIA25779