
Martha Williams, who leads the team inventing the Flexible Damage Detection System, stands in a laboratory with a prototype at NASA's Kennedy Space Center in Florida. The system uses circuits printed on thin thermal film and specialized software. The system is designed to show where damage to a surface occurs and how severe it may be. It could offer astronauts a real-time update on their spacecraft's condition during a mission without requiring a spacewalk.

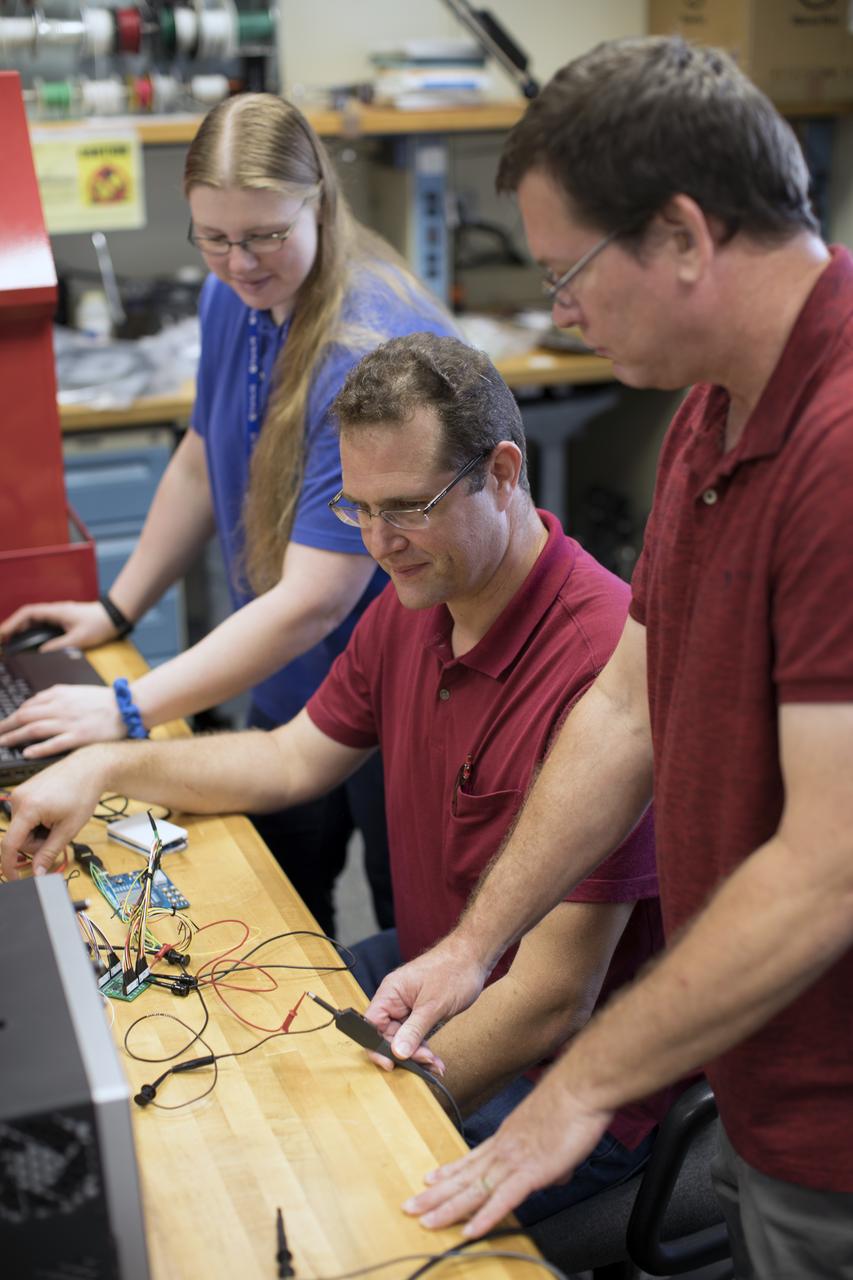
Jamie Szafran, from left, Mark Lewis and Curtis Ihlefeld work with the prototype of the Flexible Damage Detection System in a laboratory with a prototype at NASA's Kennedy Space Center in Florida. The system uses circuits printed on thin thermal film and specialized software. The system is designed to show where damage to a surface occurs and how severe it may be. It could offer astronauts a real-time update on their spacecraft's condition during a mission without requiring a spacewalk.
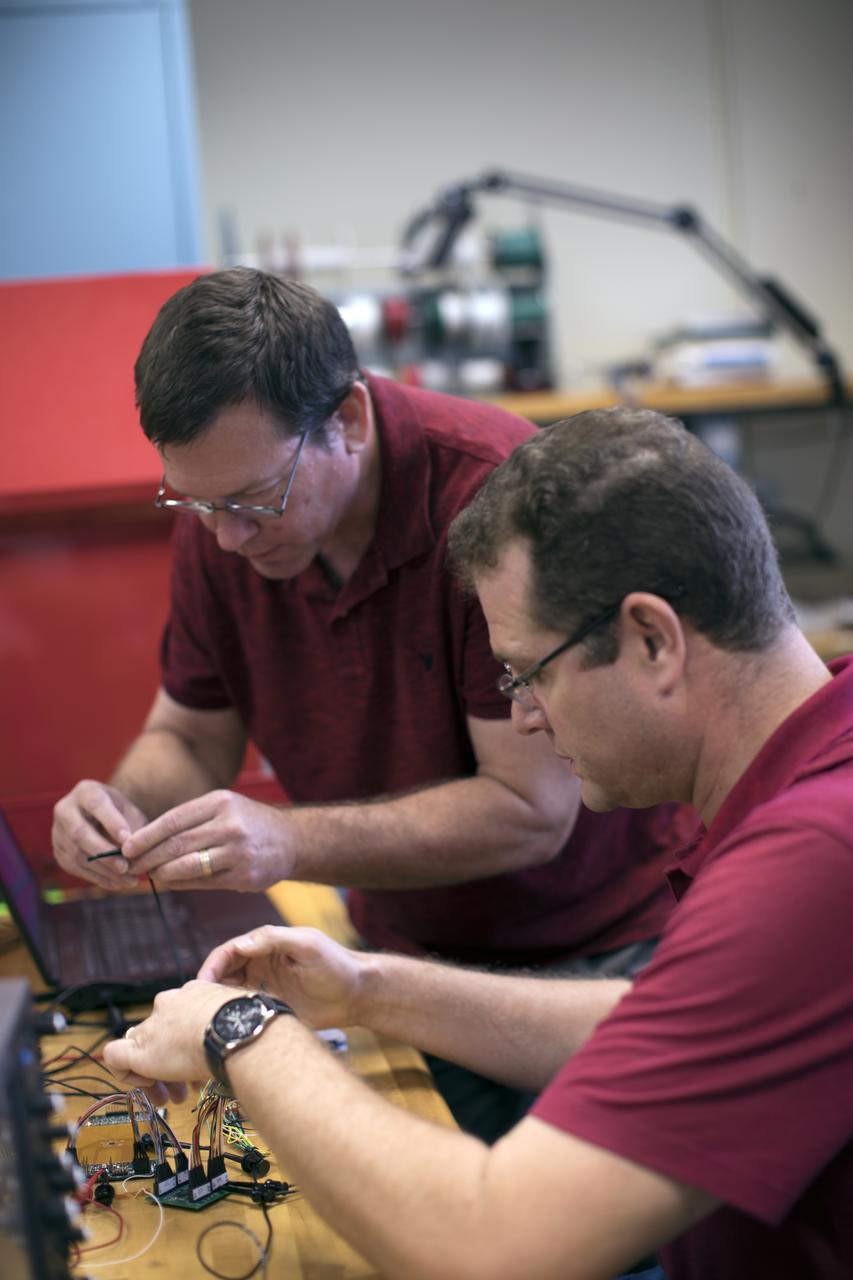
Curtis Ihlefeld, left, and Mark Lewis work with the prototype of the Flexible Damage Detection System in a laboratory with a prototype at NASA's Kennedy Space Center in Florida. The system uses circuits printed on thin thermal film and specialized software. The system is designed to show where damage to a surface occurs and how severe it may be. It could offer astronauts a real-time update on their spacecraft's condition during a mission without requiring a spacewalk.
Jamie Szafran, from left, Mark Lewis and Curtis Ihlefeld work with the prototype of the Flexible Damage Detection System in a laboratory with a prototype at NASA's Kennedy Space Center in Florida. The system uses circuits printed on thin thermal film and specialized software. The system is designed to show where damage to a surface occurs and how severe it may be. It could offer astronauts a real-time update on their spacecraft's condition during a mission without requiring a spacewalk.
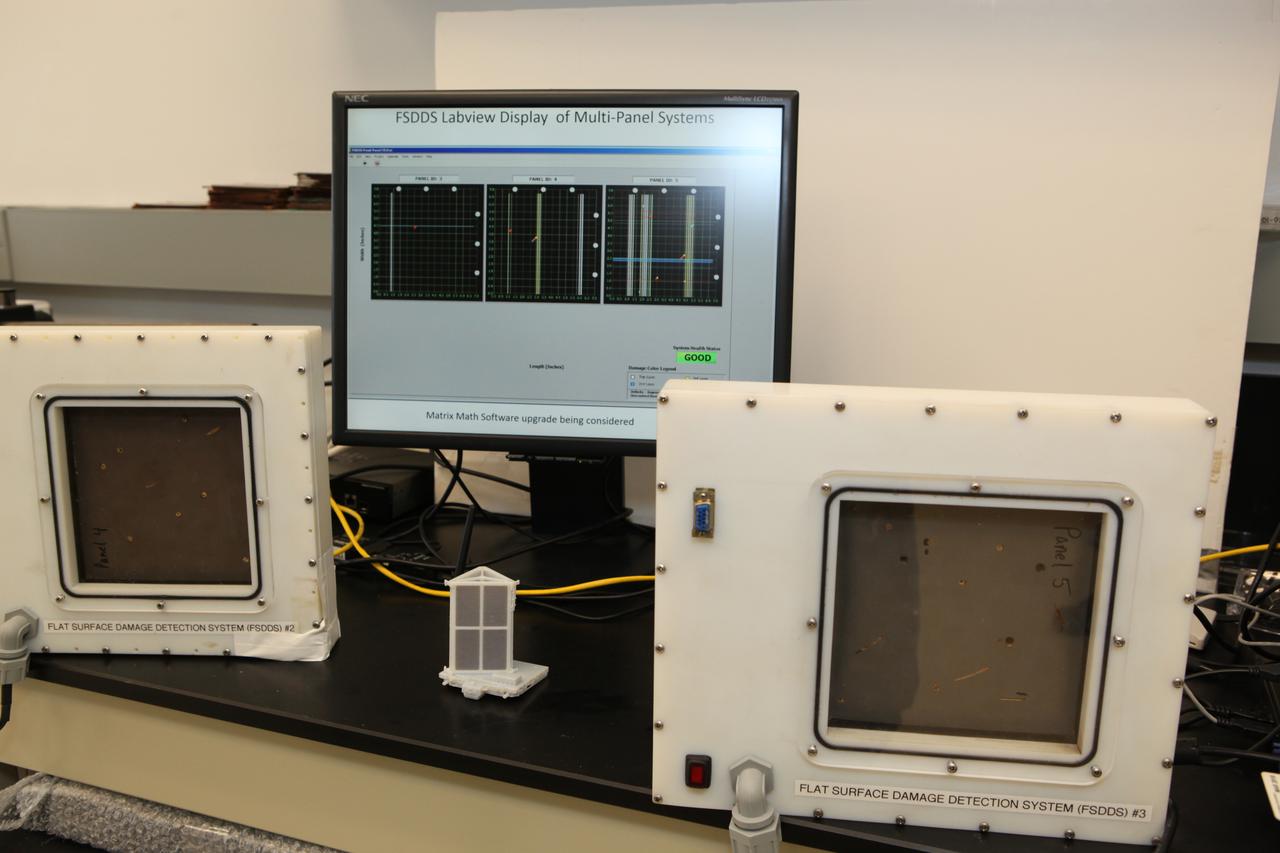
The complete prototype Flexible Damage Detection System stands in a laboratory at NASA's Kennedy Space Center in Florida. The system uses circuits printed on thin thermal film and specialized software. The system is designed to show where damage to a surface occurs and how severe it may be. It could offer astronauts a real-time update on their spacecraft's condition during a mission without requiring a spacewalk. Photo credit: NASA/Dimitri Gerondidakis
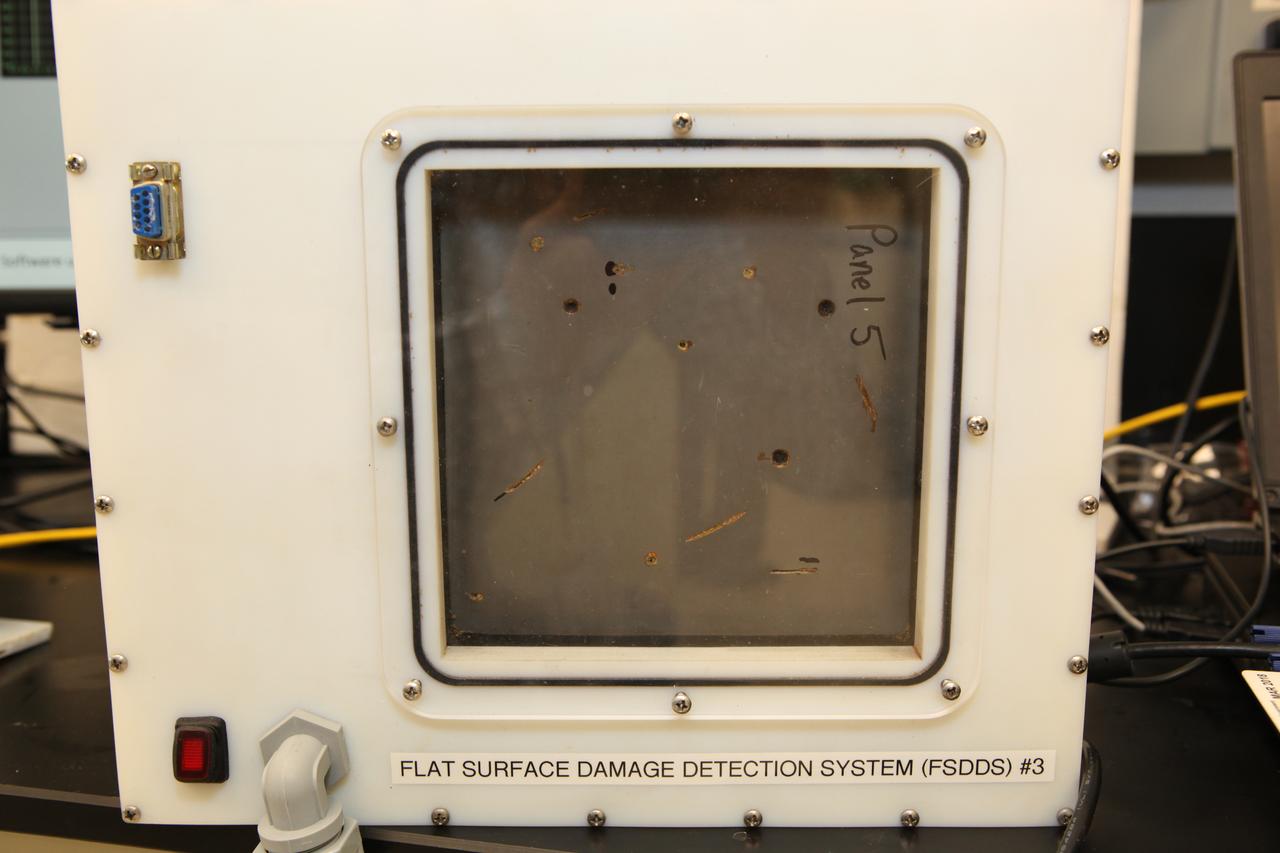
The prototype Flexible Damage Detection System stands in a laboratory at NASA's Kennedy Space Center in Florida. The system uses circuits printed on thin thermal film and specialized software. The system is designed to show where damage to a surface occurs and how severe it may be. It could offer astronauts a real-time update on their spacecraft's condition during a mission without requiring a spacewalk.

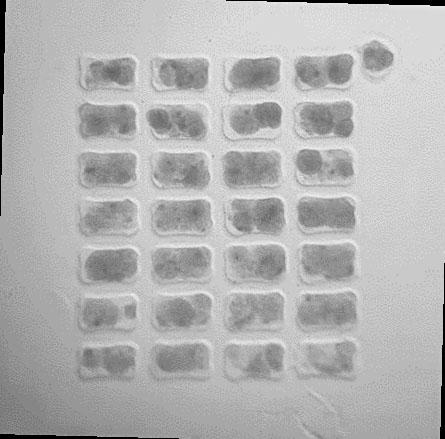
ISS013-E-63453 (3 August 2006) --- Astronaut Thomas Reiter, who represents the European Space Agency on the Expedition 13 crew, handles the infrared camera used to photograph a set of reinforced carbon carbon (RCC) samples for possible detection of damage caused by variations in temperature between sound and damaged RCC test sections.
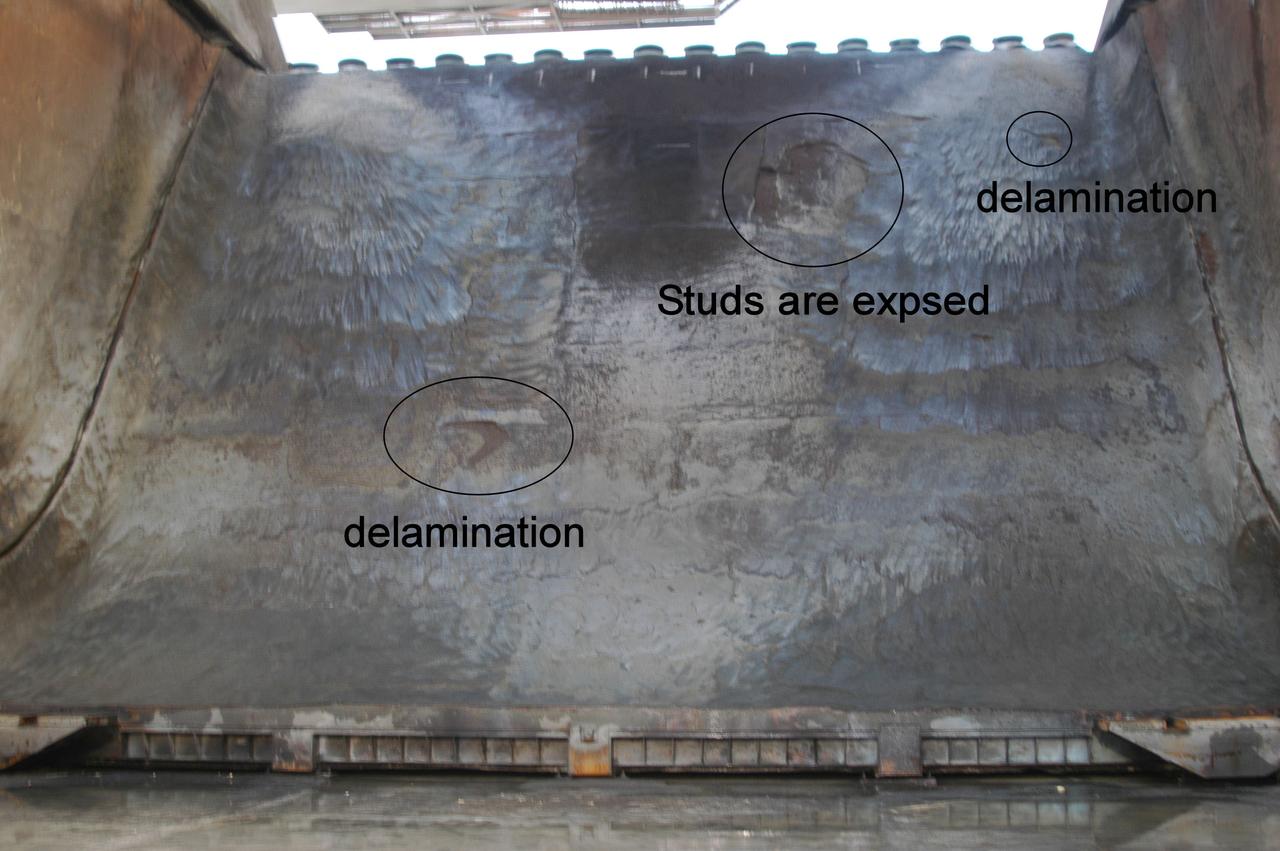
JSC2009-E-119287 (11 May 2009) --- A medium close still shot of the flame trench area at Launch Pad 39A at the Kennedy Space Center has been marked to indicate three different areas where minor damage was detected during STS-125 post-launch inspections. Two areas of delaminating flank a area where studs are partially exposed. While speaking during a press briefing, LeRoy Cain, deputy program manager for STS, showed this visual but expressed that NASA has no major concern over the damage at this time.
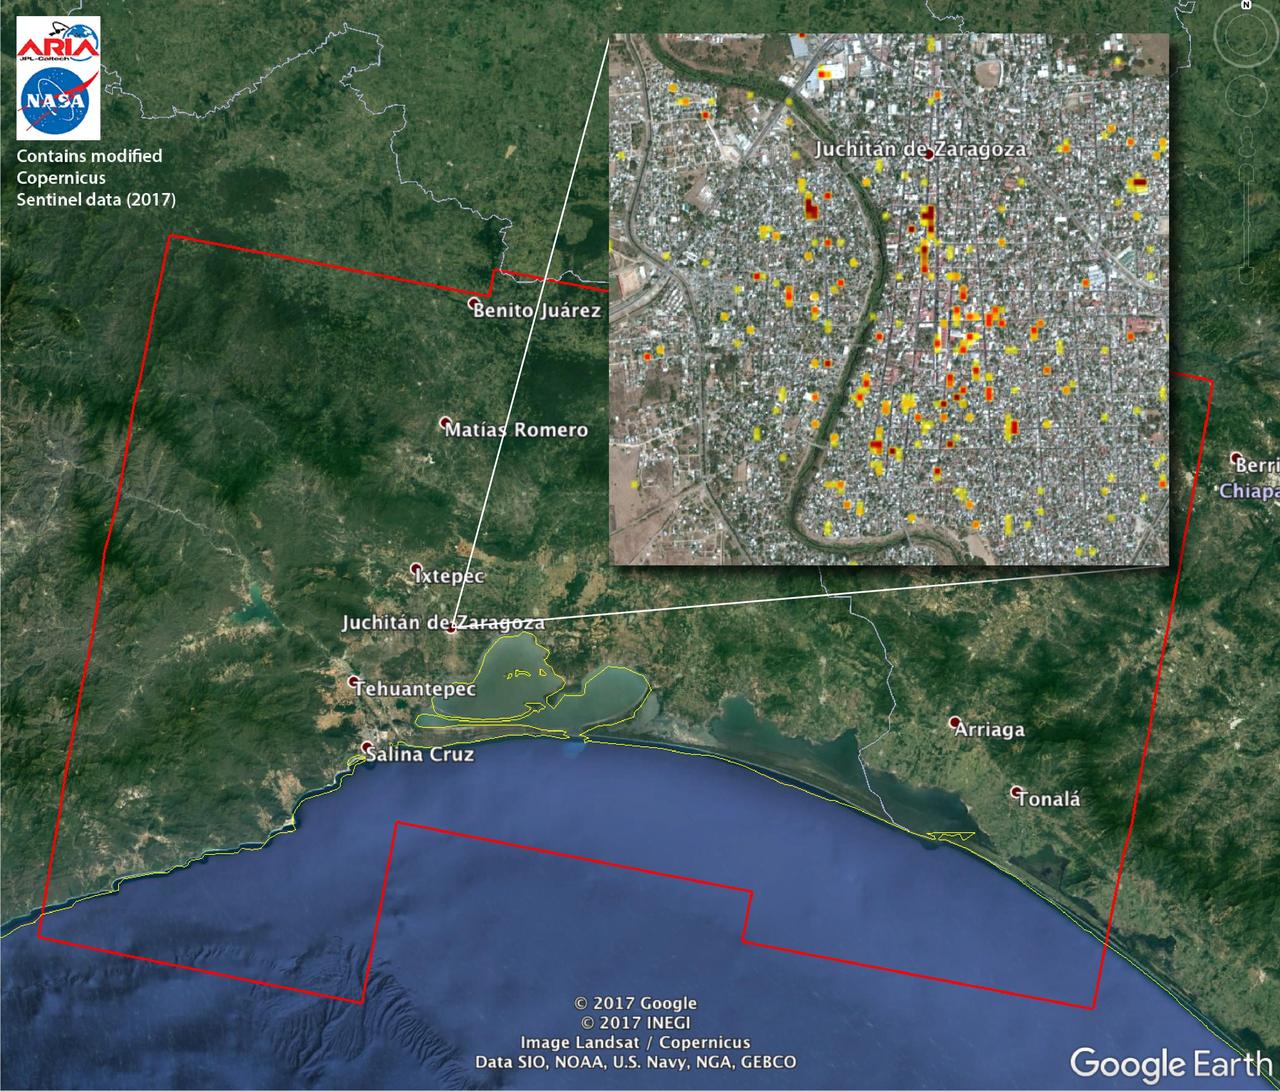
The Advanced Rapid Imaging and Analysis (ARIA) team at NASA's Jet Propulsion Laboratory in Pasadena, California, and Caltech, also in Pasadena, created this Damage Proxy Map (DPM) depicting areas of Southern Mexico that are likely damaged (shown by red and yellow pixels) from the magnitude 8.1 Chiapas earthquake of Sept. 7, 2017 (near midnight local time, early morning on Sept. 8 UTC). The map is derived from synthetic aperture radar (SAR) images from the Copernicus Sentinel-1A and Sentinel-1B satellites, operated by the European Space Agency (ESA). The images were taken before (Sept. 7, 2017 UTC) and after (Sept. 13, 2017 UTC) the earthquake. The map covers an area of 155 by 106 miles (250 by 170 kilometers). Each pixel measures about 33 yards (30 meters) across. The color variation from yellow to red indicates increasingly more significant ground surface change. Preliminary validation was done by comparing the SAR images to optical satellite imagery from DigitalGlobe. This damage proxy map should be used as guidance to identify damaged areas, and may be less reliable over vegetated areas. Sentinel-1 data were accessed through the Copernicus Open Access Hub. The image contains modified Copernicus Sentinel data (2017), processed by ESA and analyzed by the NASA-JPL/Caltech ARIA team. This research was carried out at JPL under a contract with NASA. https://photojournal.jpl.nasa.gov/catalog/PIA21956
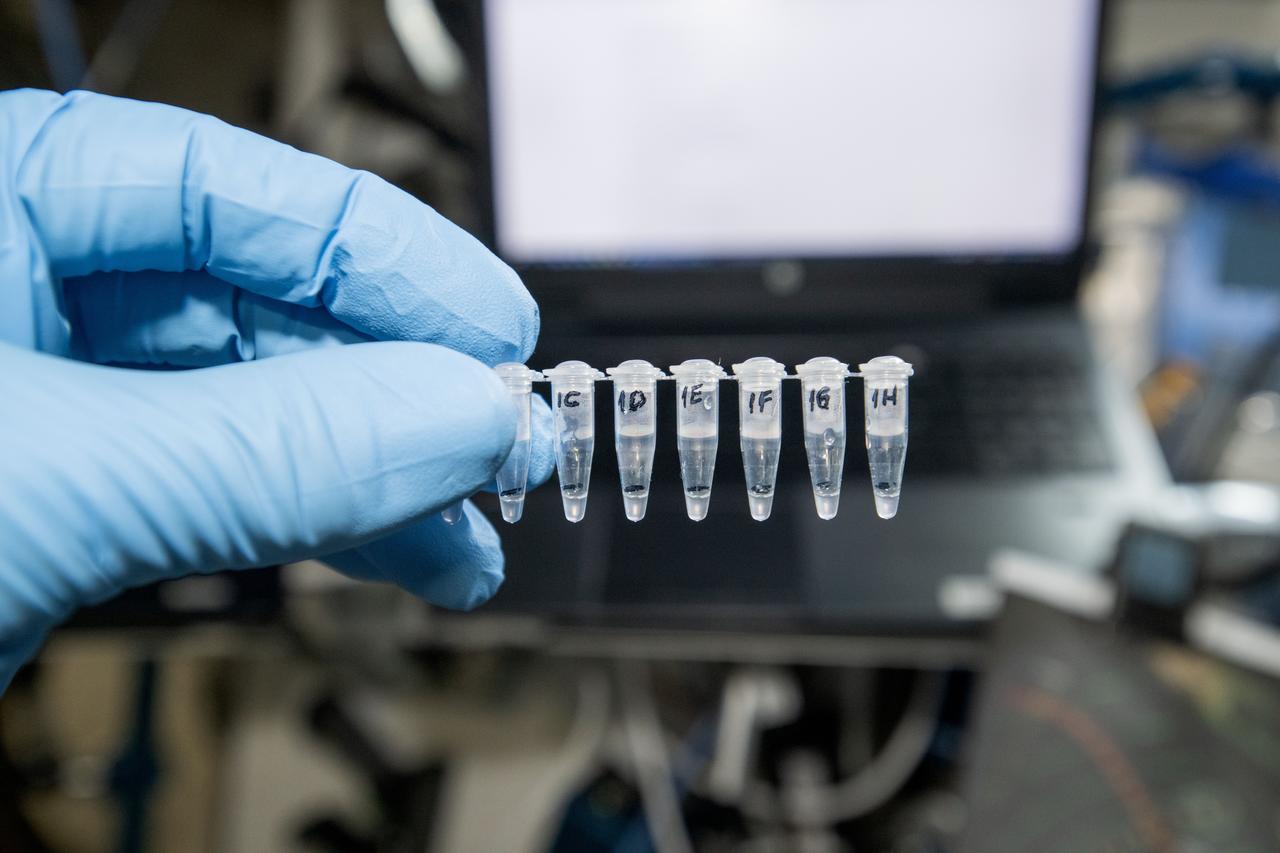
iss072e010035 (Oct. 12, 2024) --- NASA astronaut and Expedition 72 Flight Engineer Don Pettit displays Genes In Space-11 samples validating on-orbit Nucleic Acid Sequenced Based Amplification (NASBA), a novel technique to detect specific RNA sequences that can be applied to studying crucial biological processes, such as viral infection, genomic damage, or gene expression during spaceflight. Genes in Space-11 studies how spaceflight may activate retrotransposons, which are DNA fragments that copy and paste themselves throughout a genome, leading to cancer and other diseases. This investigation tests methods for detecting and measuring retrotransposons that may be adapted to detect other RNAs, including those of viruses that cause illness. Understanding the behavior of retrotransposons in microgravity may shed light on the genetic risks, including cancer, from space travel and support development of ways to protect astronauts during missions.
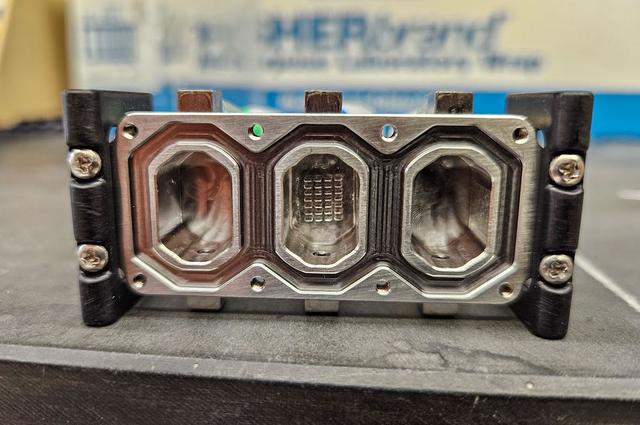
An image of a cardiac tissue chip positioned inside the MVP’s cell culture chamber as part of MVP Cell-09. This investigation aims to understand the cellular and molecular mechanisms by which Streptococcus pneumoniae, the leading cause of community-acquired pneumonia damages heart tissue. Bacteria are generally more active and virulent in the unique conditions of space. Investigators hypothesize microgravity may amplify the effects of Streptococcus pneumoniae on heart cells, exaggerating important cell responses that would not be detected on Earth. Credit. University of Alabama at Birmingham.
An image of the cardiac tissue chip with an array of cardiac tissues as part of MVP Cell-09. This investigation aims to understand the cellular and molecular mechanisms by which Streptococcus pneumoniae, the leading cause of community-acquired pneumonia damages heart tissue. Bacteria are generally more active and virulent in the unique conditions of space. Investigators hypothesize microgravity may amplify the effects of Streptococcus pneumoniae on heart cells, exaggerating important cell responses that would not be detected on Earth. Credit. University of Alabama at Birmingham.

An image shows the culture medium bags during preflight testing as part of the MVP Cell-09. This investigation aims to understand the cellular and molecular mechanisms by which Streptococcus pneumoniae, the leading cause of community-acquired pneumonia damages heart tissue. Bacteria are generally more active and virulent in the unique conditions of space. Investigators hypothesize microgravity may amplify the effects of Streptococcus pneumoniae on heart cells, exaggerating important cell responses that would not be detected on Earth. Credit. University of Alabama at Birmingham.
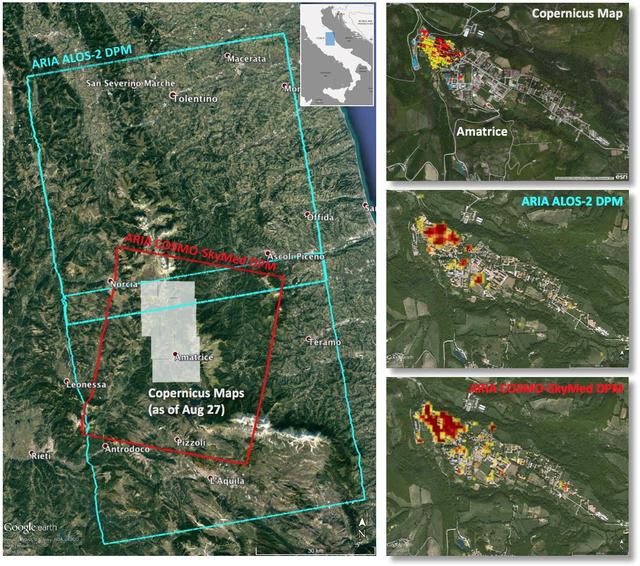
Italy earthquake. The quake has caused significant damage in the historic town of Amatrice. To assist in the disaster response efforts, scientists at NASA's Jet Propulsion Laboratory, Pasadena, California, and the California Institute of Technology in Pasadena, in collaboration with the Italian Space Agency (ASI), generated this image of the earthquake's hardest-hit region. The 40-by-75 mile (65-by-120 kilometer) Damage Proxy Map (DPM) was derived from two consecutive frames of the Japan Aerospace Exploration Agency's (JAXA's) L-band interferometric synthetic aperture radar (InSAR) data from the ALOS-2 satellite (cyan rectangles), and the 25-by-31 mile (40-by-50 kilometer) DPM was derived from InSAR data from the Agenzia Spaciale Italiana's (ASI's) X-band COSMO-SkyMed satellite (red rectangle). Both DPMs cover the historic town of Amatrice, revealing severe damage in the western side of the town (right panels). The time span of the data for the change is Jan. 27, 2016 to Aug. 24, 2016 for ALOS-2 and Aug. 20, 2016 to Aug. 28, 2016 for COSMO-SkyMed. Each pixel in the damage proxy map is about 100 feet (30 meters) across. The SAR data were processed by the Advanced Rapid Imaging and Analysis (ARIA) team at JPL and Caltech. The technique uses a prototype algorithm to rapidly detect surface changes caused by natural or human-produced damage. The assessment technique is most sensitive to destruction of the built environment. When the radar images areas with little to no destruction, its image pixels are transparent. Increased opacity of the radar image pixels reflects damage, with areas in red reflecting the heaviest damage to cities and towns. The color variations from yellow to red indicate increasingly more significant ground surface change. Preliminary validation was done by comparing the DPMs to a damage assessment map produced by the Copernicus Emergency Management Service, which is based on visual inspection of before and after high-resolution aerial imagery -- the extent indicated with gray boxes in the left panel. http://photojournal.jpl.nasa.gov/catalog/PIA20897
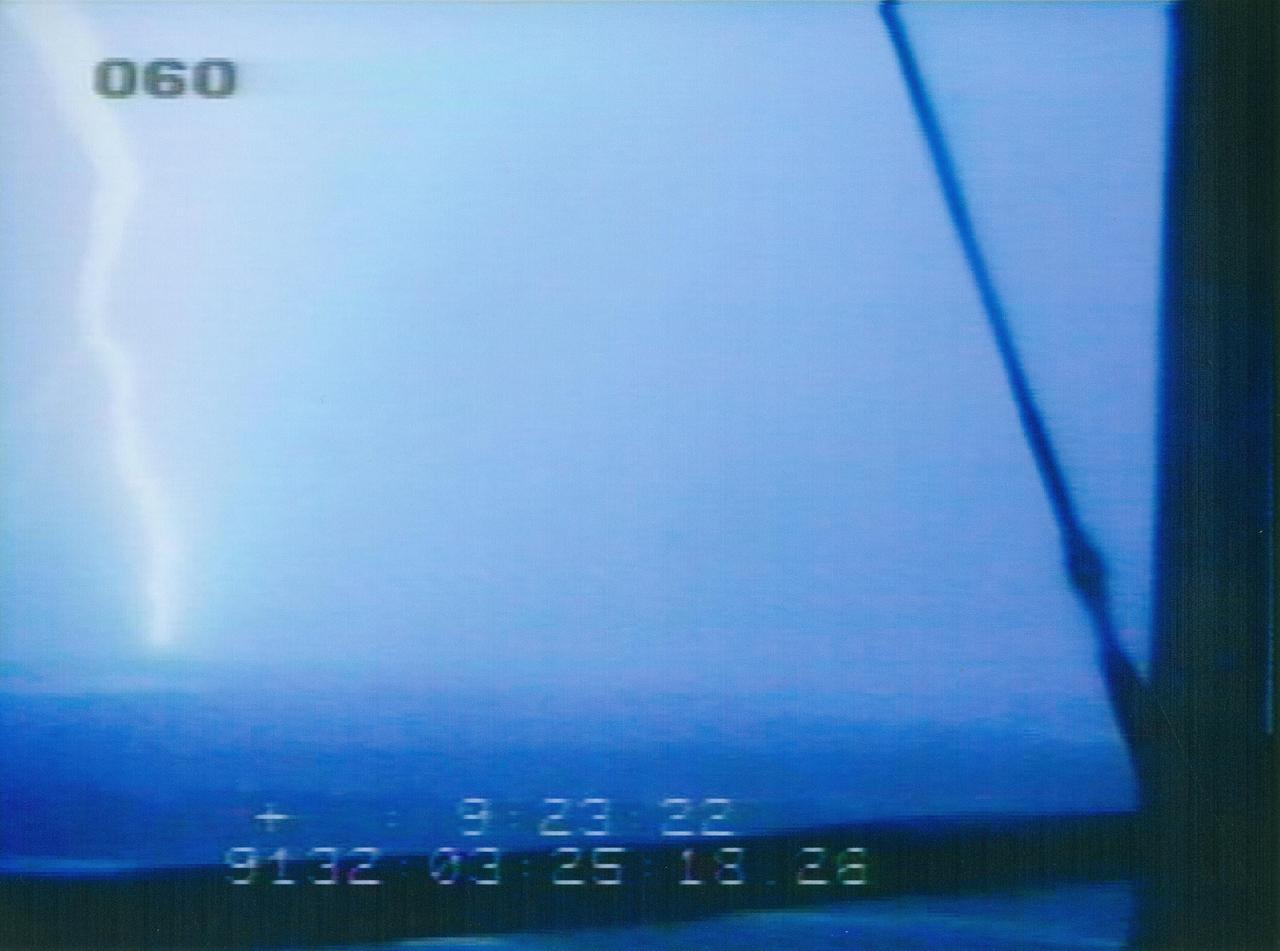
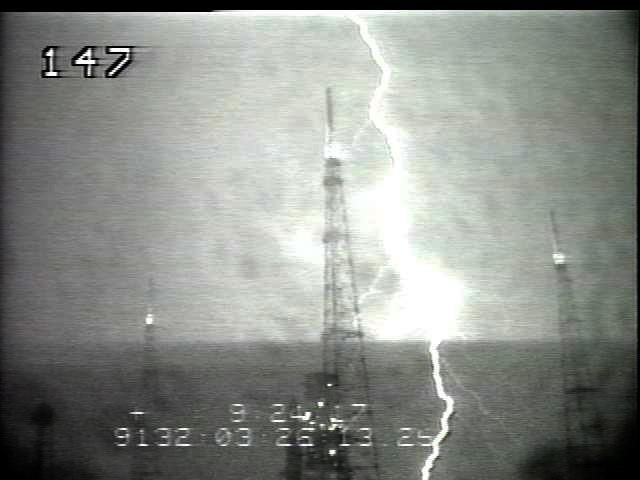
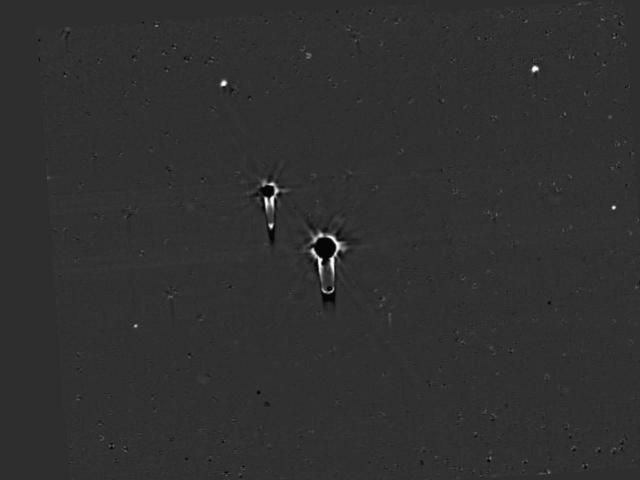
CAPE CANAVERAL, Fla. – This photo taken from Launch Pad 39A at NASA's Kennedy Space Center in Florida shows one of two lightning strikes that occurred on May 11 around 11 p.m. within a third of a mile of space shuttle Endeavour on Launch Pad 39B. Engineers and safety personnel evaluated data and performed a walkdown of the pad and determined there is no damage to the vehicle or the pad. The images are from Kennedy's Operational Television cameras which can be used to triangulate the location of lightning strikes. Other detection systems include the Cloud-To-Ground Lightning Surveillance System, Strikenet/National Lightning Detection Network, Lightning Induced Voltage Instrumentation System and the Catenary Wire Lightning Instrumentation System. Endeavour is standing by on the pad, prepared for liftoff in the unlikely event that a rescue mission is necessary during space shuttle Atlantis' STS-125 mission to service NASA's Hubble Space Telescope. Photo credit: NASA
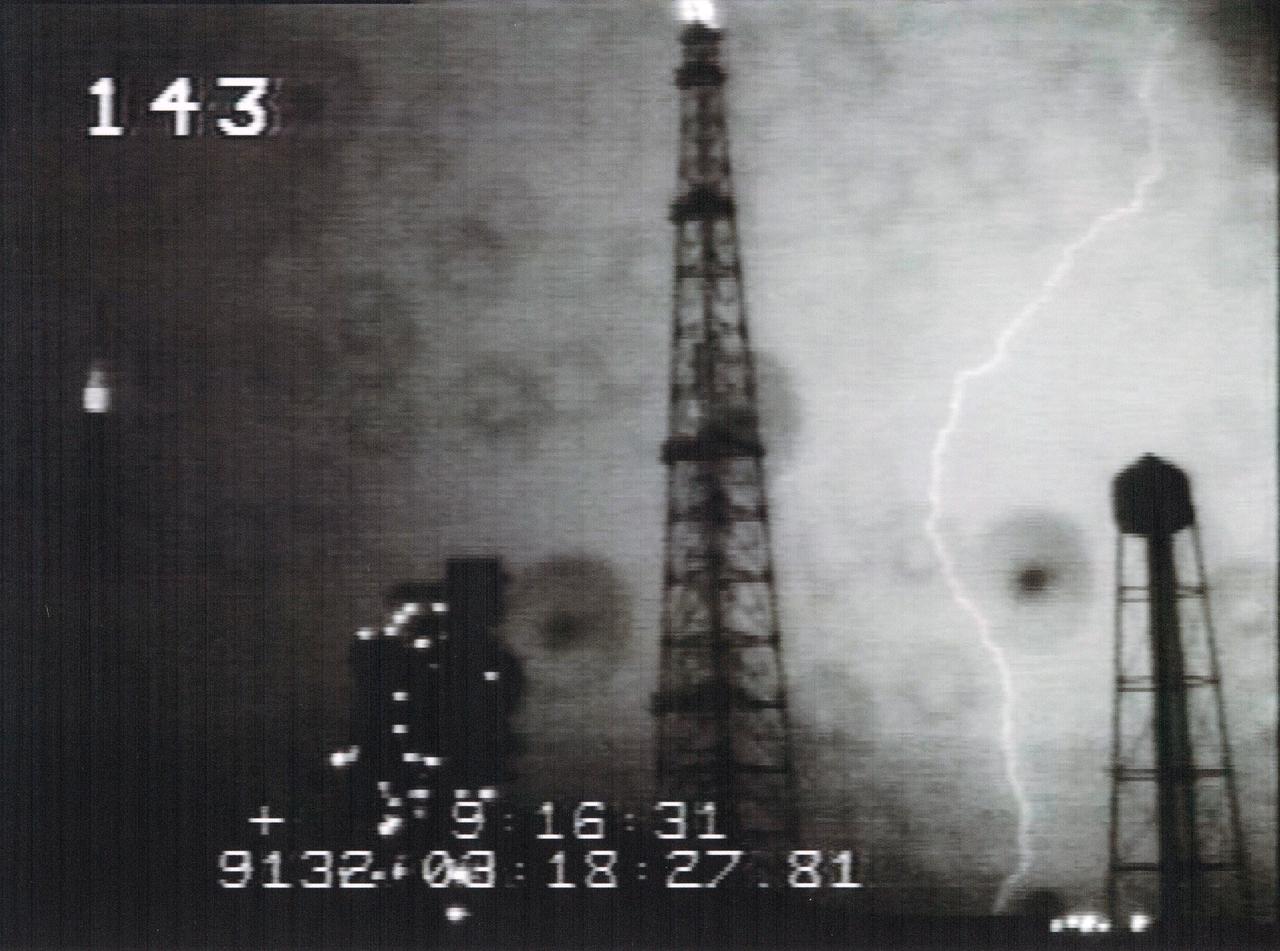
CAPE CANAVERAL, Fla. – This photo shows one of two lightning strikes that occurred on May 11 around 11 p.m. within a third of a mile of space shuttle Endeavour on Launch Pad 39B at NASA's Kennedy Space Center in Florida. Engineers and safety personnel evaluated data and performed a walkdown of the pad and determined there is no damage to the vehicle or the pad. The images are from Kennedy's Operational Television cameras which can be used to triangulate the location of lightning strikes. Other detection systems include the Cloud-To-Ground Lightning Surveillance System, Strikenet/National Lightning Detection Network, Lightning Induced Voltage Instrumentation System and the Catenary Wire Lightning Instrumentation System. Endeavour is standing by on the pad, prepared for liftoff in the unlikely event that a rescue mission is necessary during space shuttle Atlantis' STS-125 mission to service NASA's Hubble Space Telescope. Photo credit: NASA
CAPE CANAVERAL, Fla. – This photo shows one of two lightning strikes that occurred on May 11 around 11 p.m. within a third of a mile of space shuttle Endeavour on Launch Pad 39B at NASA's Kennedy Space Center in Florida. Engineers and safety personnel evaluated data and performed a walkdown of the pad and determined there is no damage to the vehicle or the pad. The images are from Kennedy's Operational Television cameras which can be used to triangulate the location of lightning strikes. Other detection systems include the Cloud-To-Ground Lightning Surveillance System, Strikenet/National Lightning Detection Network, Lightning Induced Voltage Instrumentation System and the Catenary Wire Lightning Instrumentation System. Endeavour is standing by on the pad, prepared for liftoff in the unlikely event that a rescue mission is necessary during space shuttle Atlantis' STS-125 mission to service NASA's Hubble Space Telescope. Photo credit: NASA

NASA's highly modified F-15A (Serial #71-0287) used for digital electronic flight and engine control systems research, at sunrise on the ramp at the Dryden Flight Research Facility, Edwards, California. The F-15 was called the HIDEC (Highly Integrated Digital Electronic Control) flight facility. Research programs flown on the testbed vehicle have demonstrated improved rates of climb, fuel savings, and engine thrust by optimizing systems performance. The aircraft also tested and evaluated a computerized self-repairing flight control system for the Air Force that detects damaged or failed flight control surfaces. The system then reconfigures undamaged control surfaces so the mission can continue or the aircraft is landed safely.
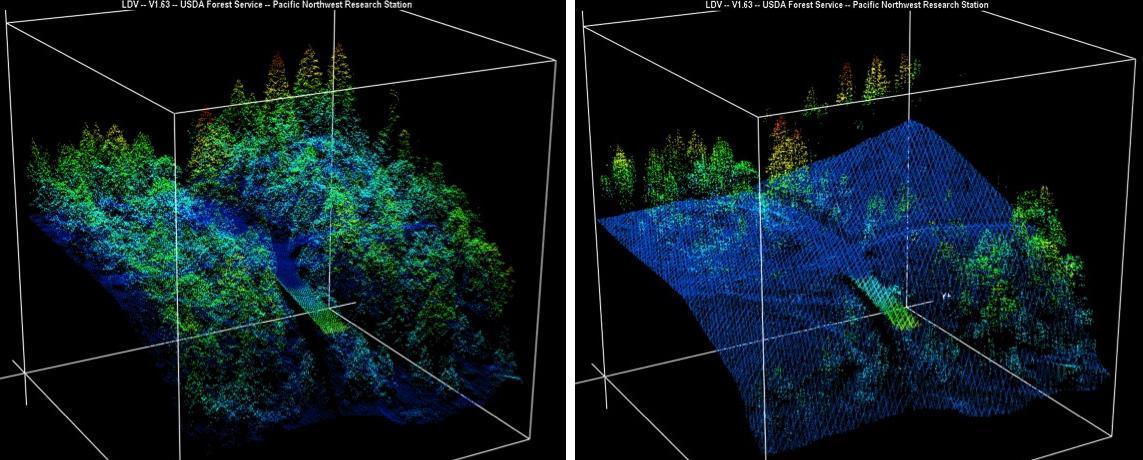
New maps of two recent California megafires that combine unique data sets from the U.S. Forest Service and NASA's Jet Propulsion Laboratory in Pasadena, California, are answering some of the urgent questions that follow a huge wildfire. These before-and-after USFS LIght Detection And Ranging (LIDAR) images from the 2014 King fire region in El Dorado National Forest, California are among new maps. They show a small section of the Rubicon River drainage basin, where fire damage was severe. Blue indicates ground level; lighter colors are higher. A road -- bordered by dense trees in the before image at left -- and part of a bridge are in the center, with the bridge appearing green. http://photojournal.jpl.nasa.gov/catalog/PIA19360
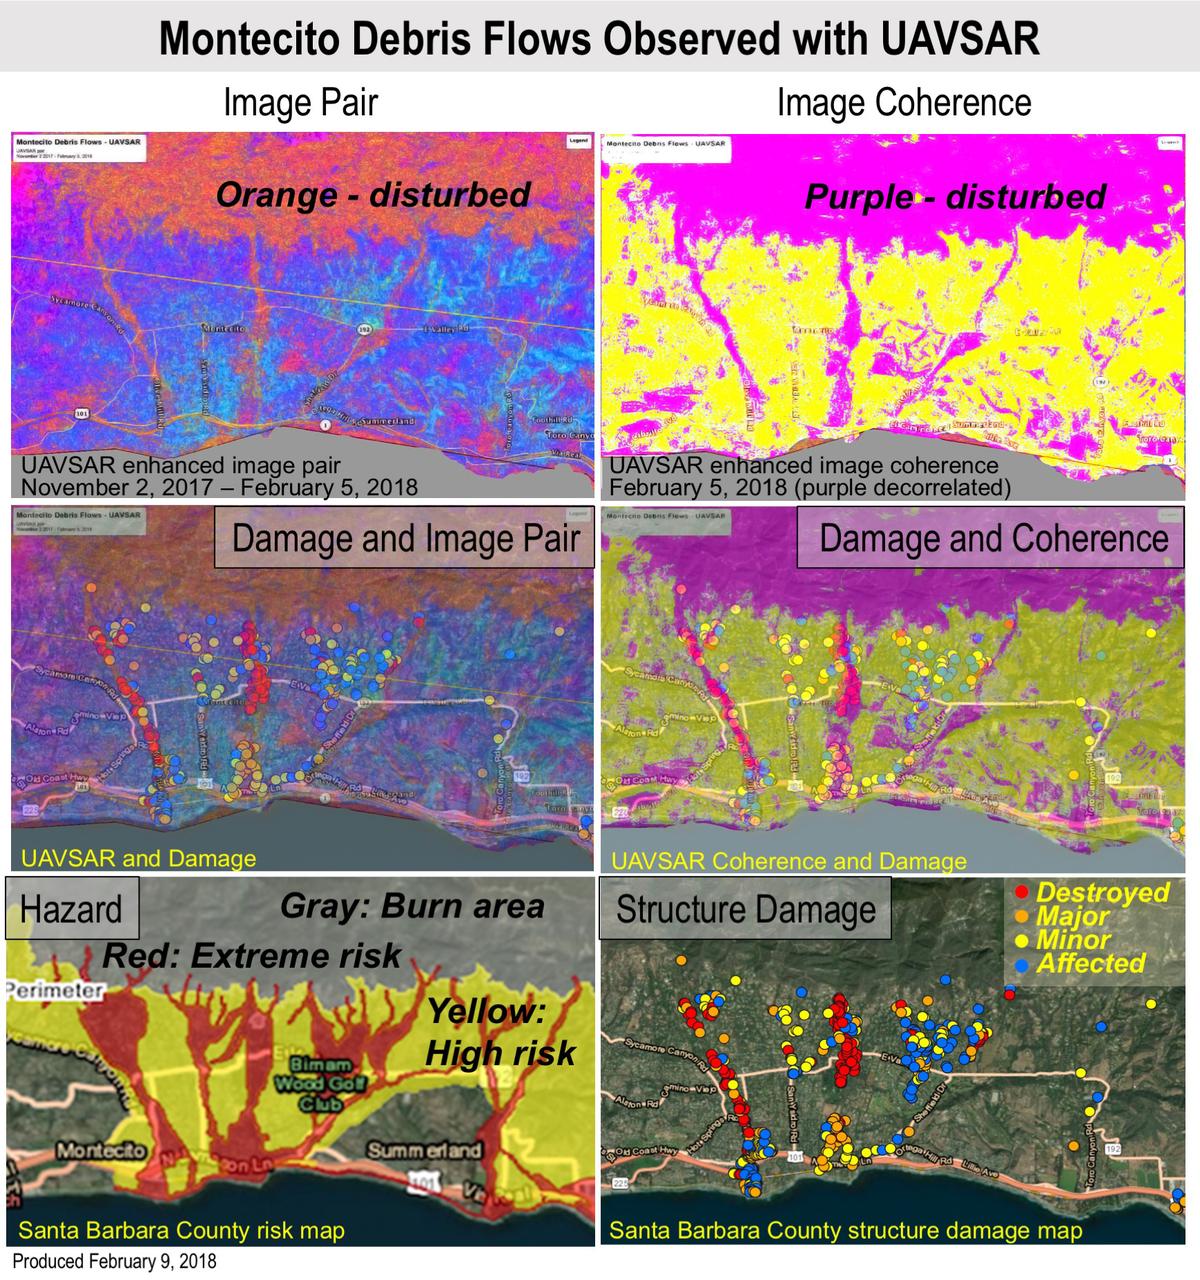
Extreme winter rains in January 2018 following the Thomas Fire in Ventura and Santa Barbara Counties caused severe debris flows, resulting in significant loss of life and considerable property damage in the town on Montecito, just east of Santa Barbara. NASA's Uninhabited Aerial Vehicle Synthetic Aperture Radar (UAVSAR) airborne radar platform detected changes caused by the debris flows between two images acquired on Nov. 2, 2017, and Feb. 5, 2018. An enhanced image pair (top left) shows disturbed areas in orange. In areas of severe surface disruption from the fire scar and debris flows the two image pairs can't be matched and decorrelate (top right). In the middle panels, the radar images are overlaid on the structure damage map produced by the County of Santa Barbara. The fire scars and damage correspond well with the risk map (lower left) and damage map (lower right). With an operational system, products such as these have the potential to augment information available for search and rescue, and for damage assessment for government agencies or the insurance industry. Radar has the advantage of being available in all weather conditions, as it can image through clouds. NASA's Uninhabited Aerial Vehicle Synthetic Aperture Radar (UAVSAR), developed and managed by the Jet Propulsion Laboratory, Pasadena, California, can record changes on the ground beneath the aircraft that occur between multiple flights, which take exactly the same flight path. The instrument is used to monitor how volcanoes, earthquakes, and other natural hazards are changing Earth. The JPL UAVSAR team collected and processed the imagery for Principal Investigator Andrea Donnellan who performed the analysis. She has been conducting ground change research using UAVSAR in this and other regions of California since 2009. https://photojournal.jpl.nasa.gov/catalog/PIA22243
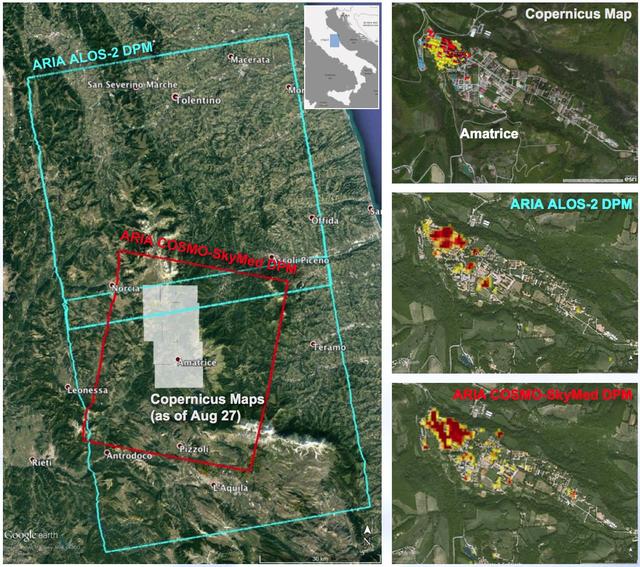
A NASA-funded program provided valuable information for responders and groups supporting the recovery efforts for the Aug. 24, 2016, magnitude 6.2 earthquake that struck central Italy. The earthquake caused significant loss of life and property damage in the town of Amatrice. To assist in the disaster response efforts, scientists at NASA's Jet Propulsion Laboratory and Caltech, both in Pasadena, California, obtained and used radar imagery of the earthquake's hardest-hit region to discriminate areas of damage from that event. The views indicate the extent of damage caused by the earthquake and subsequent aftershocks in and around Amatrice, based on changes to the ground surface detected by radar. The color variations from yellow to red indicate increasingly more significant ground surface change. The damage maps were created from data obtained before and after the earthquake by satellites belonging to the Italian Space Agency (ASI) and the Japan Aerospace Exploration Agency (JAXA). The radar-derived damage maps compare well with a damage map produced by the European Commission Copernicus Emergency Management Service based upon visual inspection of high-resolution pre-earthquake aerial photographs and post-earthquake satellite optical imagery, and provide broader geographic coverage of the earthquake's impact in the region. The X-band COSMO-SkyMed (CSK) data were provided through a research collaboration with ASI and were acquired on July 3, August 20, and August 28, 2016. The L-band ALOS/PALSAR-2 data were provided by JAXA through its science research program and were acquired on September 9, 2015, January 27, 2016, and August 24, 2016. The radar data were processed by the Advanced Rapid Imaging and Analysis (ARIA) team at JPL and Caltech. ARIA is a NASA-funded project that is building an automated system for demonstrating the ability to rapidly and reliably provide GPS and satellite data to support the local, national and international hazard monitoring and response communities. Using space-based imagery of disasters, ARIA data products can provide rapid assessments of the geographic region impacted by a disaster, as well as detailed imaging of the locations where damage occurred. Radar can "see" through clouds day and night and measure centimeter-level ground movements. NASA is partnering with the Indian Space Research Organization (ISRO) to develop the NASA ISRO Synthetic Aperture Radar (NISAR) mission that will routinely provide systematic SAR observations of Earth's land and ice-covered surfaces at least twice every 12 days, enabling greater scientific understanding of the dynamic processes that drive the Earth system and natural hazards, as well as providing actionable support for disaster response and recovery. http://photojournal.jpl.nasa.gov/catalog/PIA21091
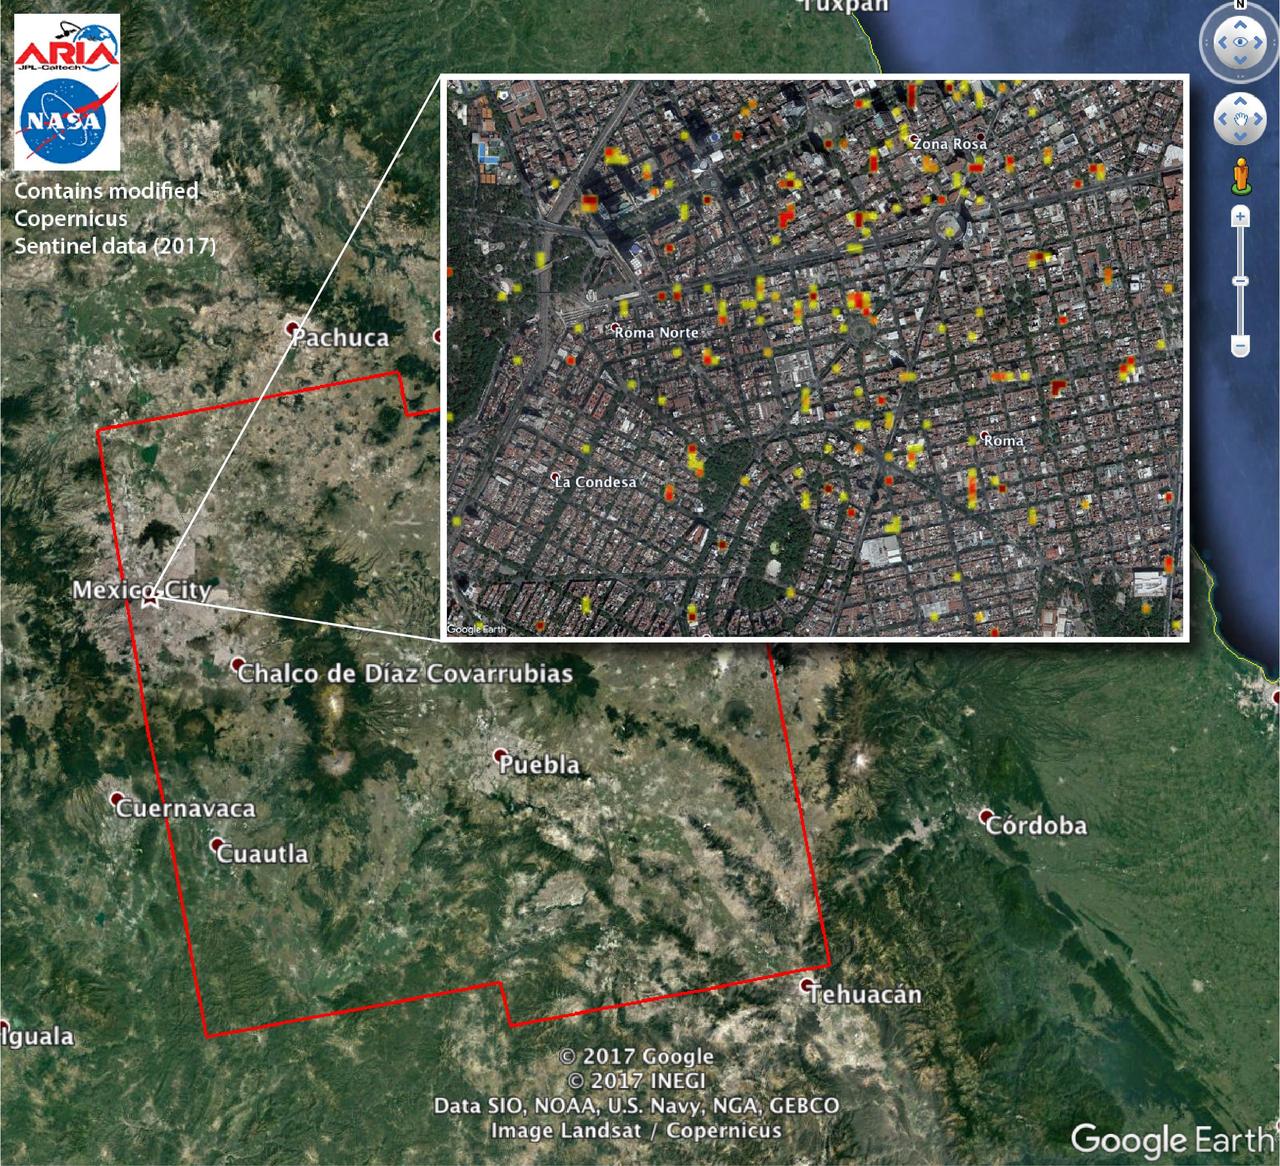
The Advanced Rapid Imaging and Analysis (ARIA) team at NASA's Jet Propulsion Laboratory in Pasadena, California, and Caltech, also in Pasadena, created this Damage Proxy Map (DPM) depicting areas of Central Mexico, including Mexico City, that are likely damaged (shown by red and yellow pixels) from the magnitude 7.1 Raboso earthquake of Sept. 19, 2017 (local time). The map is derived from synthetic aperture radar (SAR) images from the Copernicus Sentinel-1A and Sentinel-1B satellites, operated by the European Space Agency (ESA). The images were taken before (Sept. 8, 2017) and after (Sept. 20, 2017) the earthquake. The map covers an area of 109 by 106 miles (175 by 170 kilometers). Each pixel measures about 33 yards (30 meters) across. The color variation from yellow to red indicates increasingly more significant ground and building surface change. Preliminary validation was done by comparing the DPM to a crowd-sourced Google Map (https://www.google.com/maps/d/u/0/viewer?mid=1_-V97lbdgLFHpx-CtqhLWlJAnYY&ll=19.41452166501326%2C-99.16498240436704&z=16). This damage proxy map should be used as guidance to identify damaged areas, and may be less reliable over vegetated areas. Sentinel-1 data were accessed through the Copernicus Open Access Hub. The image contains modified Copernicus Sentinel data (2017), processed by ESA and analyzed by the NASA-JPL/Caltech ARIA team. This research was carried out at JPL under contract with NASA. https://photojournal.jpl.nasa.gov/catalog/PIA21963
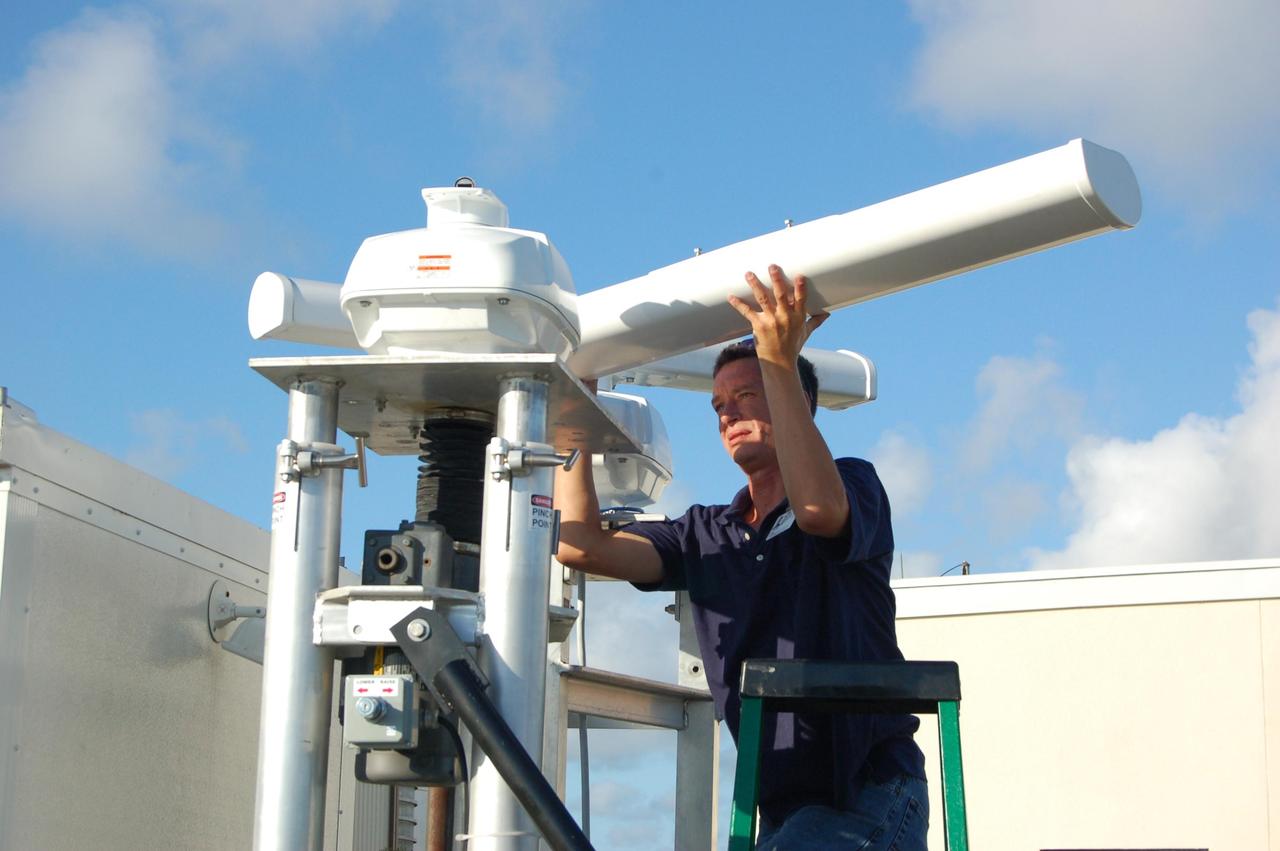
KENNEDY SPACE CENTER, FLA. - Bird detection radar is set up near Launch Pad 39B before the July 1 launch of Space Shuttle Discovery on mission STS-121. When birds, especially vultures, are near the shuttle during a launch, impact on a critical area is possible and could cause catastrophic damage to the vehicle. Already proven affective for aviation where threats posed by bird strikes have been a problem, the avian radar, known as Aircraft Birdstrike Avoidance Radar, provides horizontal and vertical scanning and can monitor either launch pad for movement of vultures around them. If data relayed from the avian radar indicates large birds are dangerously close to the vehicle, controllers could hold the countdown. Photo credit: NASA/Gianni Woods
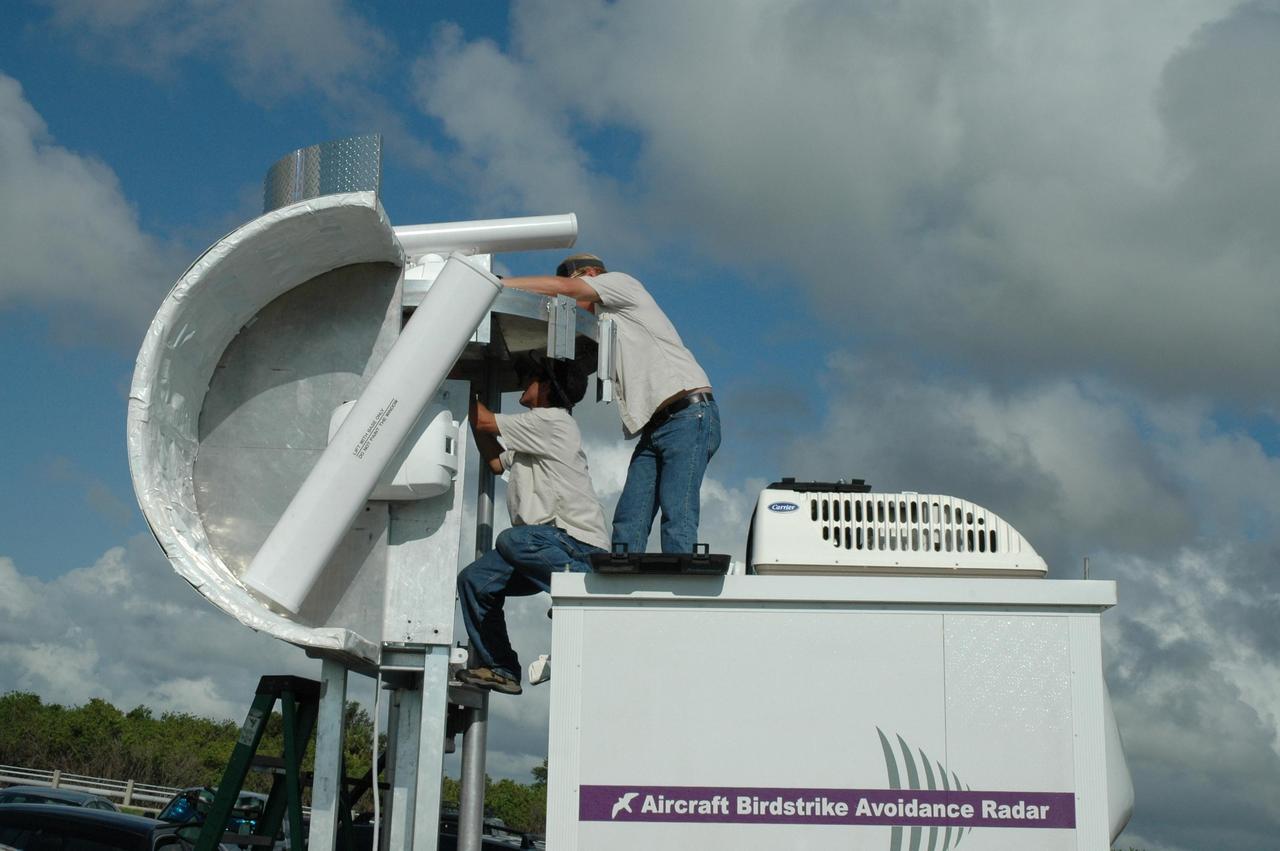
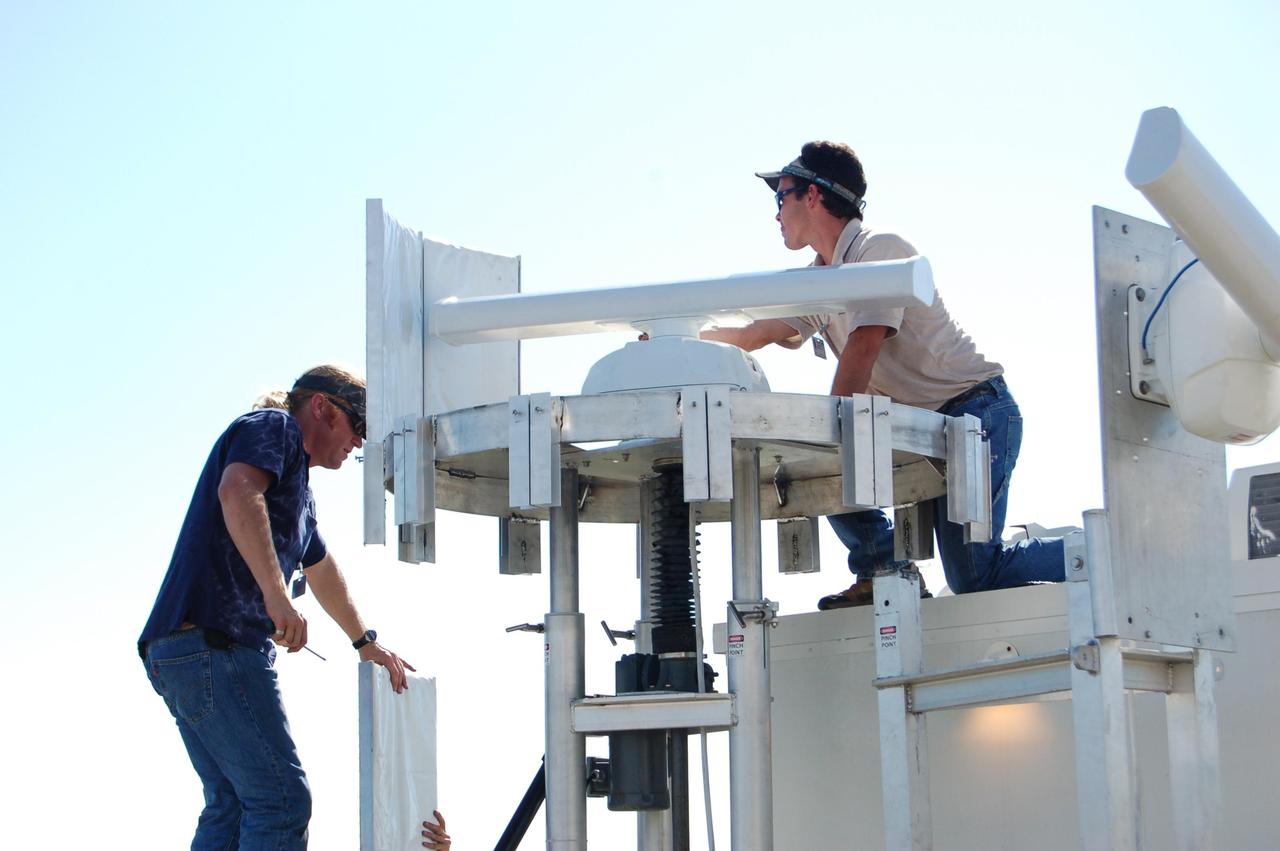
KENNEDY SPACE CENTER, FLA. - Radar technicians adjust two bird detection radars near Launch Pad 39B before the July 1 launch of Space Shuttle Discovery on mission STS-121. When birds, especially vultures, are near the shuttle during a launch, impact on a critical area is possible and could cause catastrophic damage to the vehicle. Already proven affective for aviation where threats posed by bird strikes have been a problem, the avian radar, known as Aircraft Birdstrike Avoidance Radar, provides horizontal and vertical scanning and can monitor either launch pad for movement of vultures around them. If data relayed from the avian radar indicates large birds are dangerously close to the vehicle, controllers could hold the countdown. Photo credit: NASA/Dimitri Gerondidakis
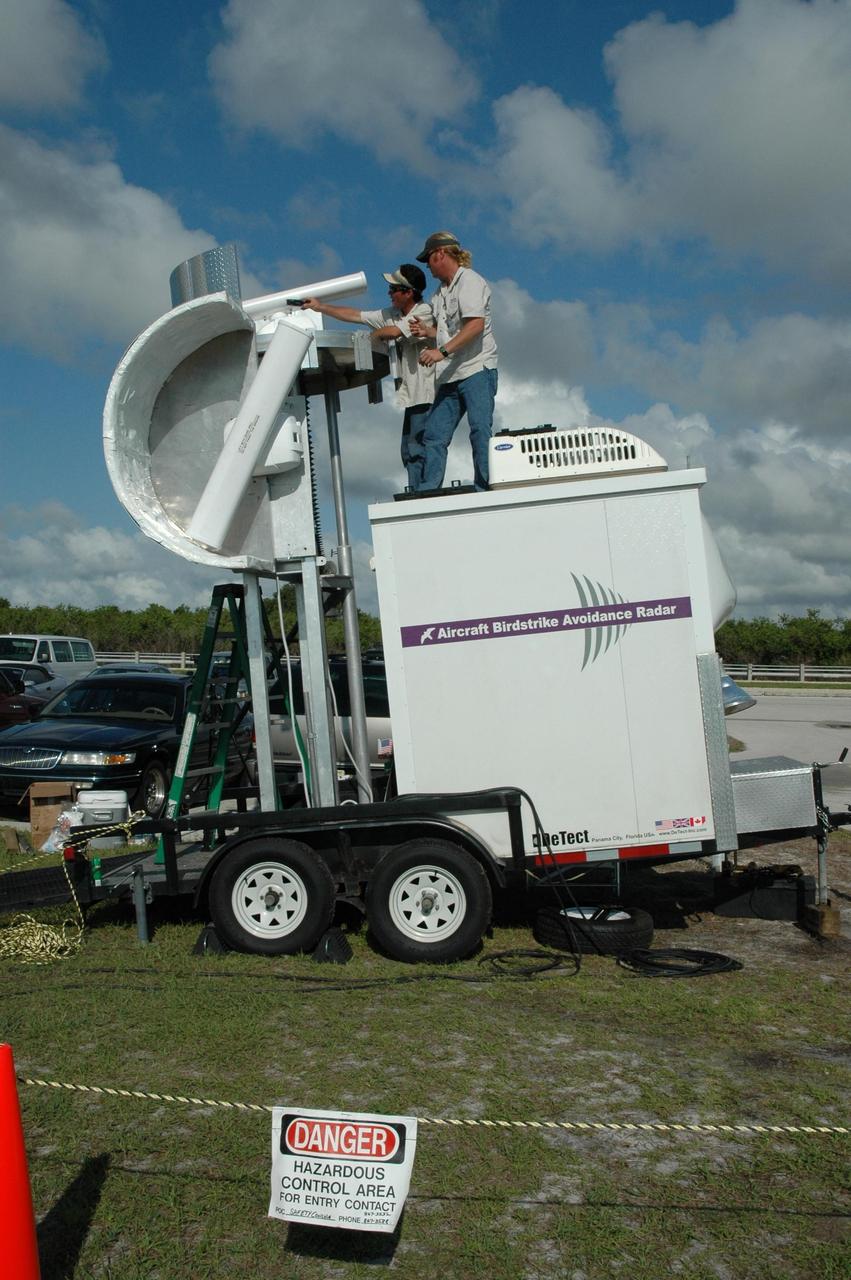
KENNEDY SPACE CENTER, FLA. - Radar technicians adjust two bird detection radars near Launch Pad 39B before the July 1 launch of Space Shuttle Discovery on mission STS-121. When birds, especially vultures, are near the shuttle during a launch, impact on a critical area is possible and could cause catastrophic damage to the vehicle. Already proven affective for aviation where threats posed by bird strikes have been a problem, the avian radar, known as Aircraft Birdstrike Avoidance Radar, provides horizontal and vertical scanning and can monitor either launch pad for movement of vultures around them. If data relayed from the avian radar indicates large birds are dangerously close to the vehicle, controllers could hold the countdown. Photo credit: NASA/Dimitri Gerondidakis
KENNEDY SPACE CENTER, FLA. - Radar technicians set up bird detection radar near Launch Pad 39B before the July 1 launch of Space Shuttle Discovery on mission STS-121. When birds, especially vultures, are near the shuttle during a launch, impact on a critical area is possible and could cause catastrophic damage to the vehicle. Already proven affective for aviation where threats posed by bird strikes have been a problem, the avian radar, known as Aircraft Birdstrike Avoidance Radar, provides horizontal and vertical scanning and can monitor either launch pad for movement of vultures around them. If data relayed from the avian radar indicates large birds are dangerously close to the vehicle, controllers could hold the countdown. Photo credit: NASA/Gianni Woods
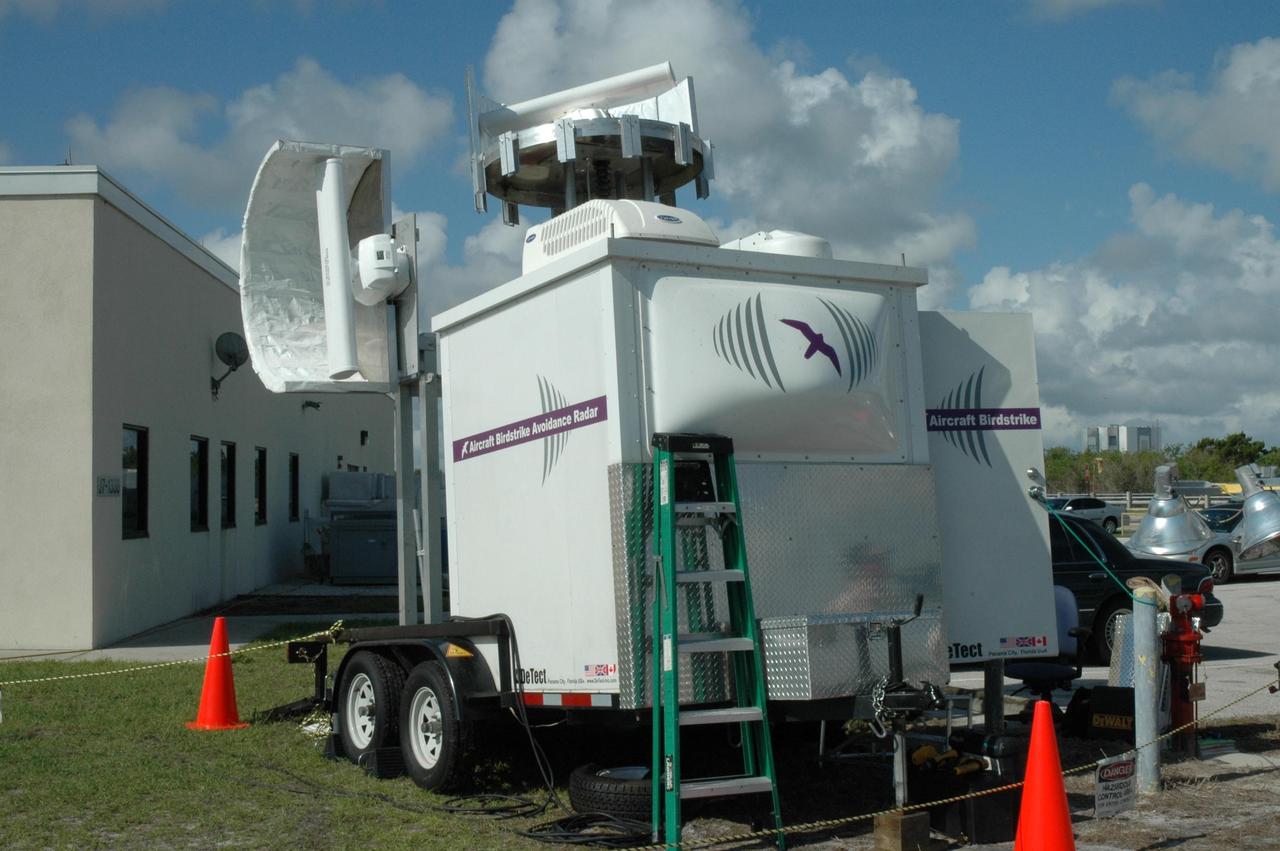
KENNEDY SPACE CENTER, FLA. - Two bird detection radars have been set up near Launch Pad 39B to get ready for the July 1 launch of Space Shuttle Discovery on mission STS-121. When birds, especially vultures, are near the shuttle during a launch, impact on a critical area is possible and could cause catastrophic damage to the vehicle. Already proven affective for aviation where threats posed by bird strikes have been a problem, the avian radar, known as Aircraft Birdstrike Avoidance Radar, provides horizontal and vertical scanning and can monitor either launch pad for movement of vultures around them. If data relayed from the avian radar indicates large birds are dangerously close to the vehicle, controllers could hold the countdown. Photo credit: NASA/Dimitri Gerondidakis
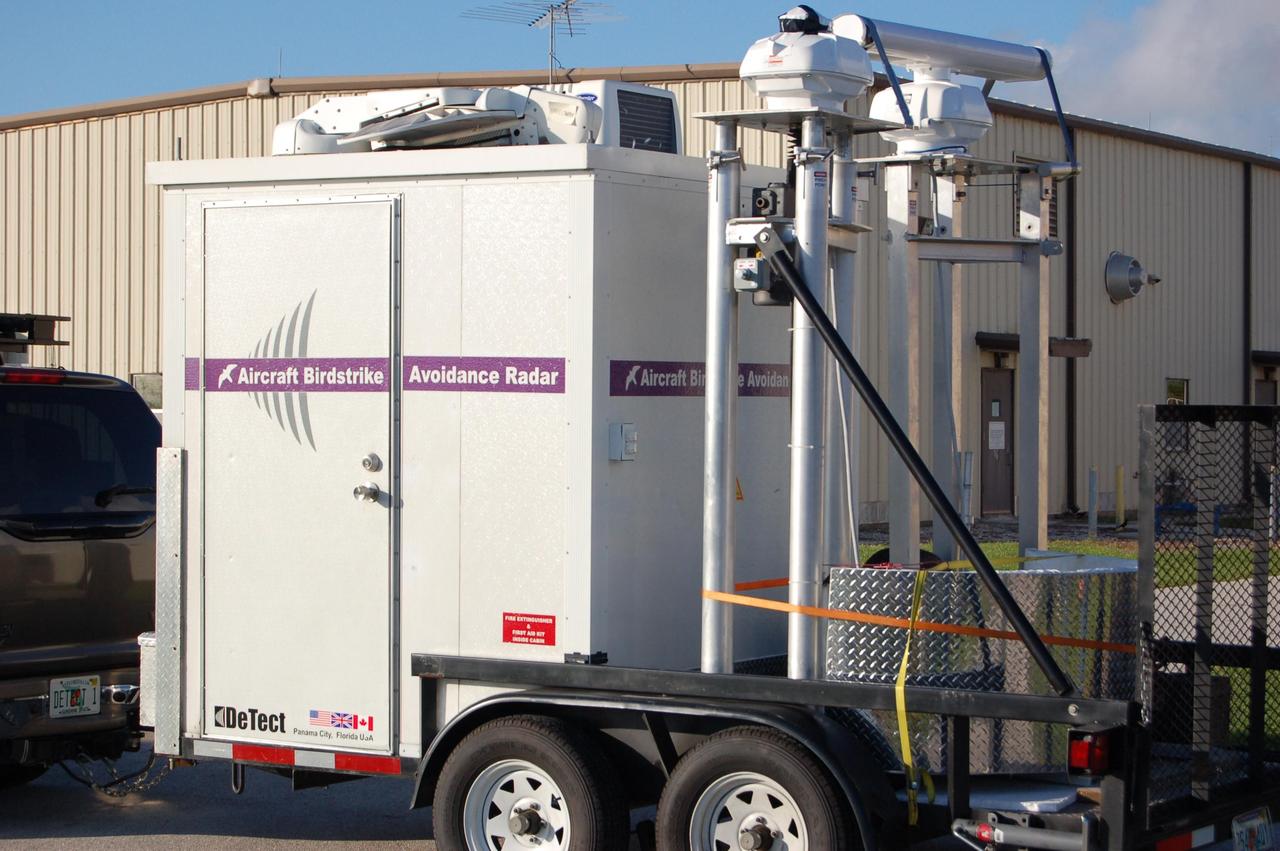
KENNEDY SPACE CENTER, FLA. - Bird detection radar is delivered near Launch Pad 39B before the July 1 launch of Space Shuttle Discovery on mission STS-121. When birds, especially vultures, are near the shuttle during a launch, impact on a critical area is possible and could cause catastrophic damage to the vehicle. Already proven affective for aviation where threats posed by bird strikes have been a problem, the avian radar, known as Aircraft Birdstrike Avoidance Radar, provides horizontal and vertical scanning and can monitor either launch pad for movement of vultures around them. If data relayed from the avian radar indicates large birds are dangerously close to the vehicle, controllers could hold the countdown. Photo credit: NASA/Gianni Woods
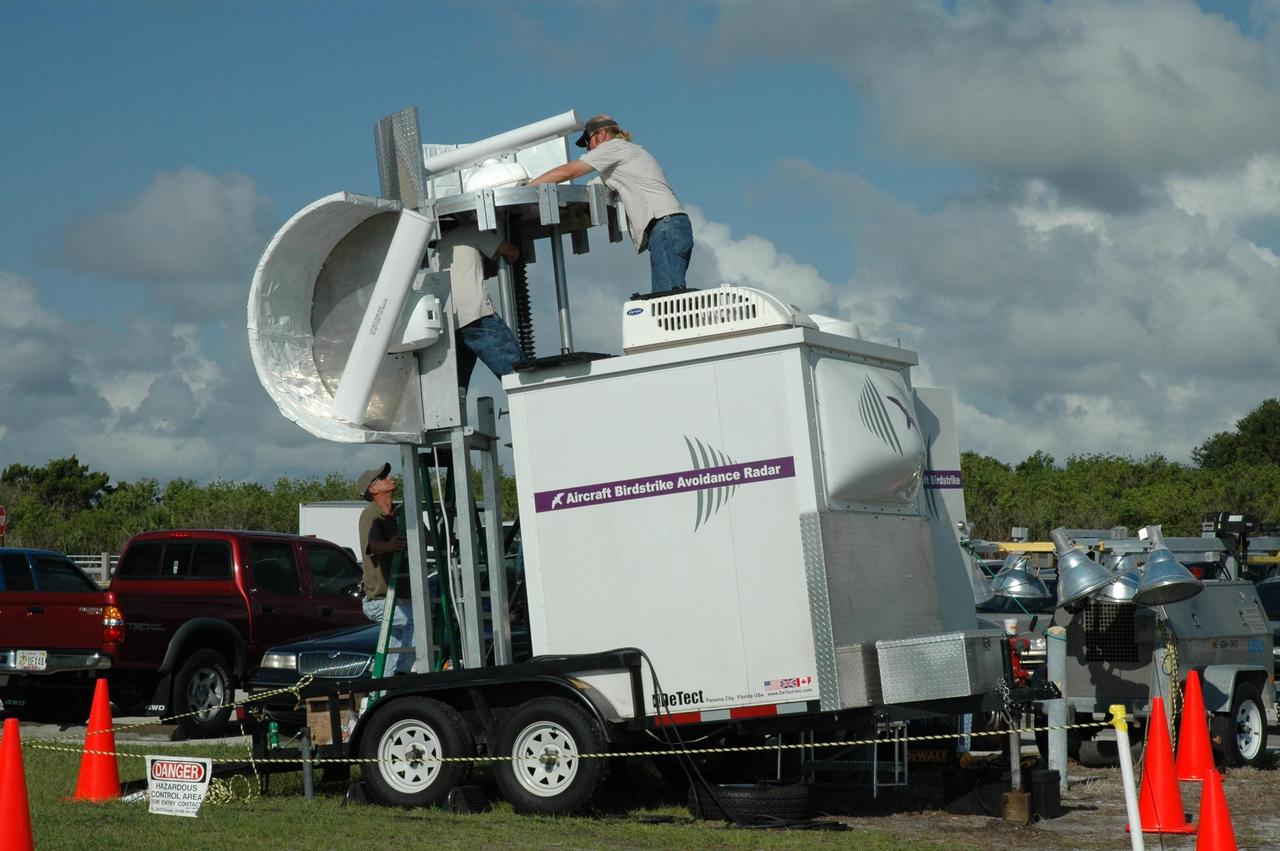
KENNEDY SPACE CENTER, FLA. - Radar technicians adjust two bird detection radars near Launch Pad 39B before the July 1 launch of Space Shuttle Discovery on mission STS-121. When birds, especially vultures, are near the shuttle during a launch, impact on a critical area is possible and could cause catastrophic damage to the vehicle. Already proven affective for aviation where threats posed by bird strikes have been a problem, the avian radar, known as Aircraft Birdstrike Avoidance Radar, provides horizontal and vertical scanning and can monitor either launch pad for movement of vultures around them. If data relayed from the avian radar indicates large birds are dangerously close to the vehicle, controllers could hold the countdown. Photo credit: NASA/Dimitri Gerondidakis
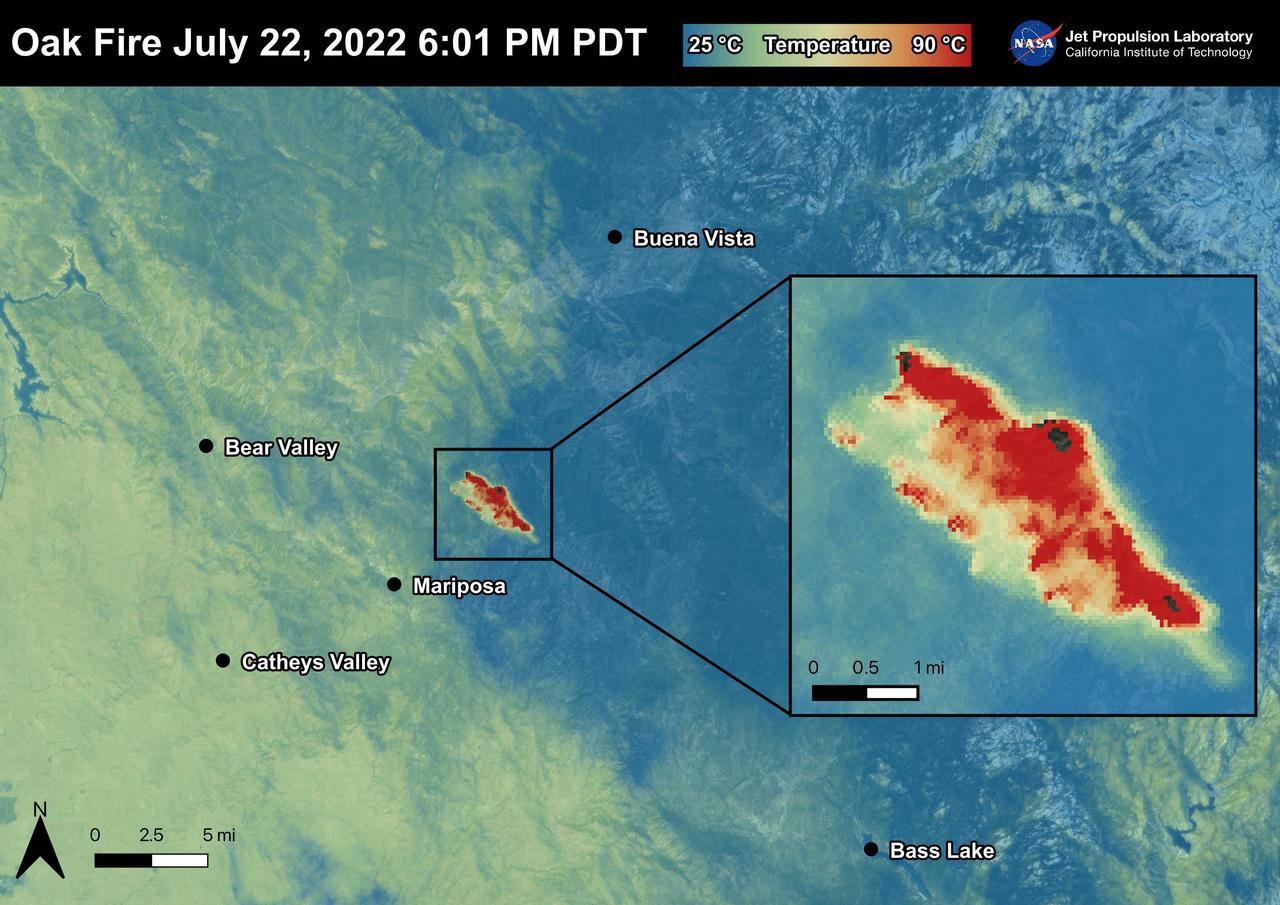
The Oak Fire started on July 22nd, 2022 at 2:10 PM PDT near Carstens Road and Highway 140 in Mariposa County, west of Yosemite. The fire has burned over 19,000 acres. In the first few days of the Oak Fire, over 1,400 structures were threatened, 3 were damaged, and 41 destroyed. Evacuation orders and road closures were issued throughout the region. The Oak Fire was captured in an ECOSTRESS Land Surface Temperature image on July 22nd with temperatures exceeding 90 degrees Celsius. ECOSTRESS is a thermal instrument on the International Space Station that measures the temperature of the ground, which is hotter than the air temperature during the day. It was launched to the space station in 2018. Its primary mission is to identify critical thresholds of water use and water stress in plants and to detect the timing, location, and predictive factors leading to plant water uptake decline and/or cessation. The nature of the high-resolution data provided by ECOSTRESS allows it to record heat related phenomena such as heat waves and wildfires. https://photojournal.jpl.nasa.gov/catalog/PIA25481

Shown here at Utah State University's Space Dynamics Laboratory in Logan, Utah, in November, 2023, the six satellites that make up NASA's Sun Radio Interferometer Space Experiment (SunRISE) mission are each only about the size of a cereal box, flanked by small solar panels. Once in space, the six SmallSats fly about 6 miles (10 kilometers) apart and each deploy four radio antennas that extend 10 feet (2.5 meters). Using a technique called interferometry, the six satellites will effectively act like one big radio receiver and detect solar radio bursts, or eruptions of radio waves in the outer atmosphere of the Sun. In the places where these radio bursts arise, scientists also see eruptions of accelerated particles, which can damage spacecraft electronics, including on communications satellites in Earth orbit, and pose a health threat to astronauts. Keeping track of solar radio bursts and pinpointing their location could help warn humans of approaching accelerated particles. https://photojournal.jpl.nasa.gov/catalog/PIA25789
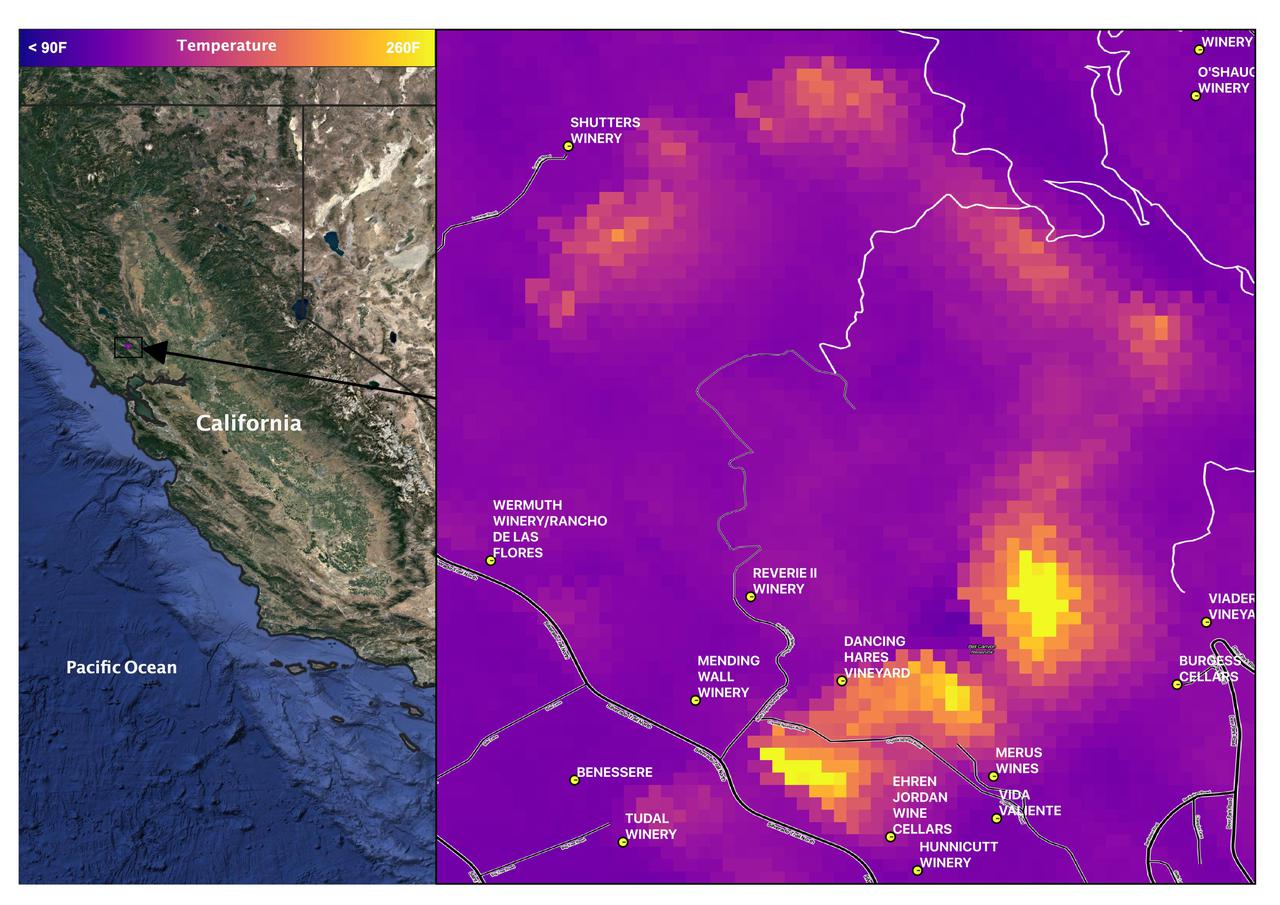
Late in the evening on September 27, 2020 the Glass Fire ignited in the foothills of Napa Valley, California. The cause of the fire is still unknown. Within 24 hours it exploded to over 11,000 acres fueled by dehydrated soil and the drought-stricken landscape. Within hours of the start of the fire, ECOSTRESS captured several hotspots near the fire's origin (represented by the brightest yellow spots on the map). Not only is it important to monitor the progress of the fire as it to help protect people and property, dense wildfire smoke can also damage crops. For this reason, it is important to track both the movement of the fire and local weather patterns to predict crop damage from smoke exposure. Wildfires are common in this region of California, however this unseasonable fire ripped through the region with unusual speed and intensity. As wildfire behavior continues to adapt with Climate Change, images like this help scientists and farmers understand the impacts that the new fire season has on crops. This information is helpful in developing plans to increase agricultural resilience to climate change. Tasked with detecting plant water use and stress, ECOSTRESS's primary mission is to measure the temperature of plants heating up as they run out of water. But it can also measure and track heat-related phenomena like wildfires, heat waves, and volcanoes. ECOSTRESS observations have a spatial resolution of about 77 by 77 yards (70 by 70 meters), which enables researchers to study surface-temperature conditions down to the size of a football field. Due to the space station's unique orbit, the mission can acquire images of the same regions at different times of the day, as opposed to crossing over each area at the same time of day like satellites in other orbits do. This is advantageous when monitoring plant stress in the same area throughout the day, for example. https://photojournal.jpl.nasa.gov/catalog/PIA24209
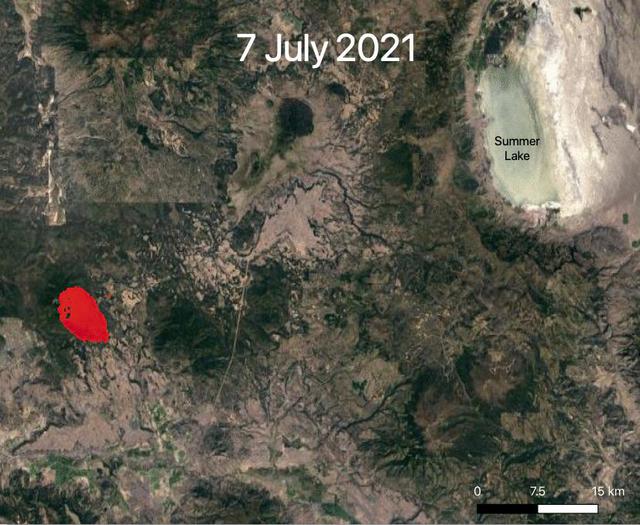
NASA's ECOsystem Spaceborne Thermal Radiometer Experiment on Space Station (ECOSTRESS) is aiding in the fight against fires in the Western U.S. As of July 27, 2021, the Bootleg Fire in southern Oregon had ballooned to more than 410,000 acres, damaging hundreds of buildings and vehicles in its path. ECOSTRESS measures surface temperature from the vantage point of the International Space Station. Researchers of the RADR-Fire team at Pacific Northwest National Laboratory have been experimenting with ECOSTRESS data as part of a new tool now being implemented for first responders like the U.S. Forest Service. In the visualization, ECOSTRESS is tracking the movement of the Bootleg Fire between July 7 and July and identifying its proximity to critical infrastructure — areas in red represent the hottest pixels ECOSTRESS detected. The extreme heat in those areas indicates the fire front, or where resources are most needed. Tasked with detecting plant water use and stress, ECOSTRESS's primary mission is to measure the temperature of plants heating up as they run out of water. But it can also measure and track heat-related phenomena like wildfires, heat waves, and volcanoes. ECOSTRESS observations have a spatial resolution of about 77 by 77 yards (70 by 70 meters), which enables researchers to study surface-temperature conditions down to the size of a football field. Due to the space station's unique orbit, the mission can acquire images of the same regions at different times of the day, as opposed to crossing over each area at the same time of day like satellites in other orbits do. This is advantageous when monitoring plant stress in the same area throughout the day, for example. Movie available at https://photojournal.jpl.nasa.gov/catalog/PIA23695
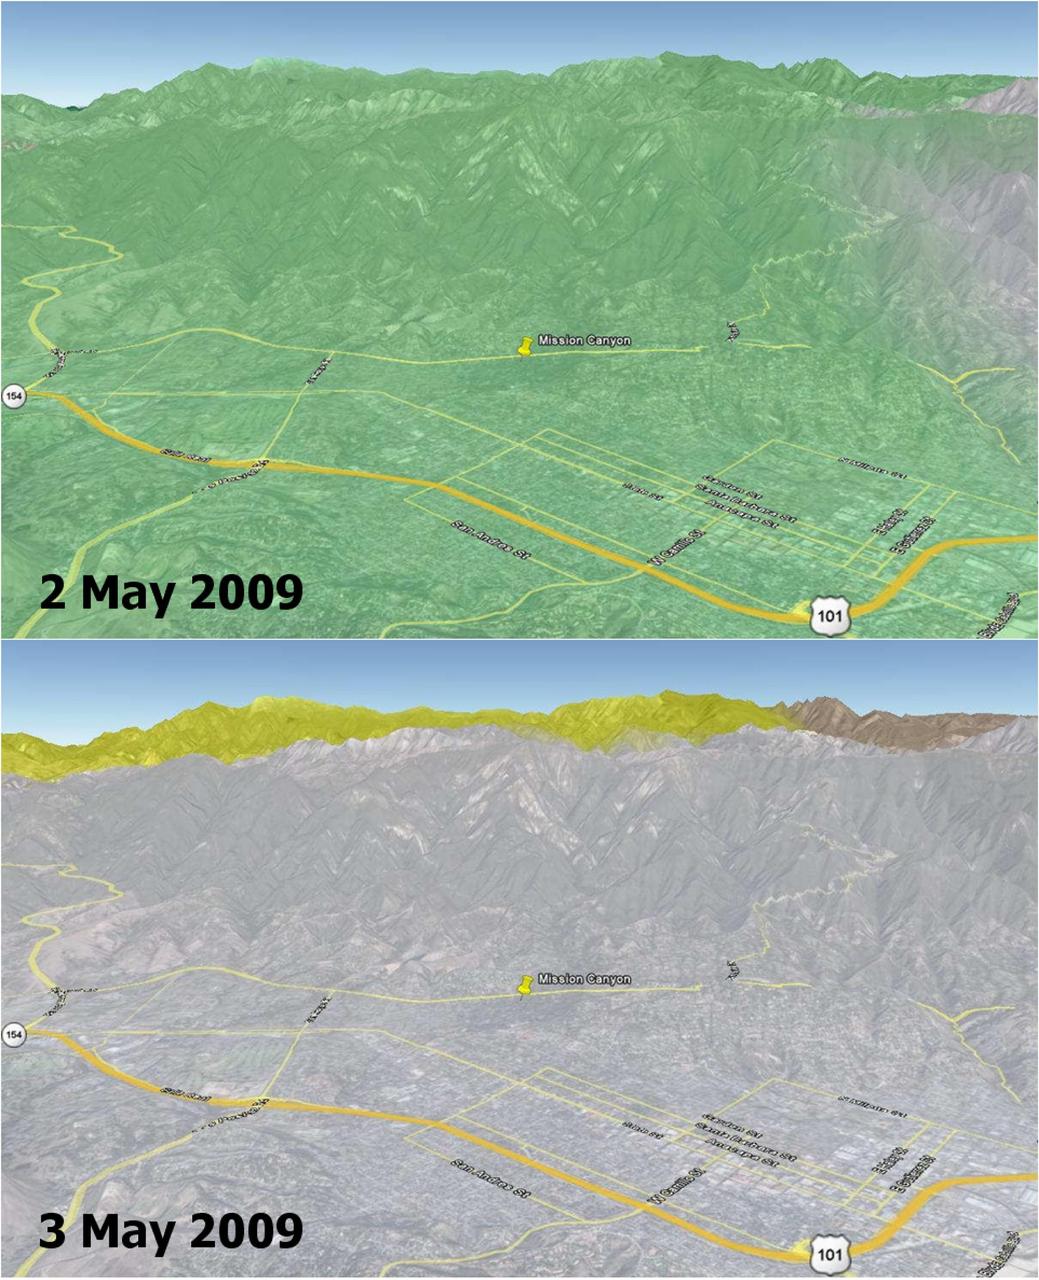
Wildfires are a recurring natural hazard faced by Californians. In Santa Barbara County, a wildfire, called the Jesusita fire, ignited on May 5, 2009 in the Cathedral Peak area northwest of Mission Canyon. As of midday May 8, the fire, which was 10-percent contained, had scorched 3,500 acres, damaged or destroyed 75 structures, and had forced the evacuation of tens of thousands of residents. This image shows soil moisture change in the top soil layer (2-inches deep) on 2 and 3 May 2009, as measured by the NASA QuikSCAT satellite scatterometer (radar). Rainwater increased the amount of moisture in the soil by a moderate 4 percent (represented by the green color) on May 2, which rapidly dried up on the next day (0 percent, as depicted by the grey color on May 3). Son Nghiem of JPL is leading a science team to develop wildfire applications using QuikScat data. “Information critical to assessing the conditions leading to wildfires can be obtained from NASA’s SeaWinds scatterometer, a stable and accurate radar aboard the QuikScat satellite,” says Dr. Son Nghiem, a JPL scientist in remote sensing. This is accomplished by using QuikScat data to map moisture changes in the topsoil. As such, QuikScat can detect rainwater that actually reaches the land surface and accumulates on it, rather than raindrops in the air. While rain radars may detect a significant rain rate, rainwater may evaporate in part before reaching the surface. For example, in the case of dry thunderstorm (known as virga), raindrops disappear on the way down, leaving the land dry, while the associated lightning ignites fires. For the case of the current fire in Santa Barbara, QuikScat detected a moderate increase of 4 percent in soil moisture on May 2, while rain radar data seemed to indicate a significant and extensive rain. The next day, QuikScat revealed that whatever rainwater that had accumulated earlier quickly dried up over the whole area. The maximum temperature in Santa Barbara approached 90 degrees Fahrenheit and broke the record set in 1984. An important characteristic of QuikScat measurements is that they represent the average conditions over the whole area, rather than some disparate data collected at a few localized points. The rapid dry-up in Santa Barbara together with high temperatures and high winds led to the devastating Jesusita fire. http://photojournal.jpl.nasa.gov/catalog/PIA12006
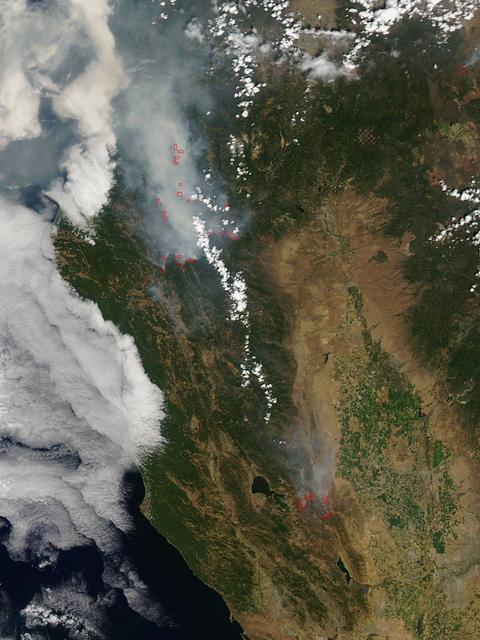
California has been hit hard the past few weeks with storms. Storms bring lightning and lightning strikes cause wildfires. Currently there are at least five fire complexes in the area including River, Fork, South, Route and Mad River. The Mad River complex is a series of seven lightning fires that started on July 30th, 2015 after a lightning storm moved through Northern California. After initial firefighters responded, 25 fires were reported and most of the fires were contained. Some additional fires might be detected from the original lightning storms in the upcoming days and will be attacked once they are found. Damage assessment is ongoing and crews will determine the extent of structures and equipment damaged or destroyed. The River Complex is managing a total of 5 fires due to fires merging together on the Shasta-Trinity and the Six Rivers National Forests. Winds from the west are expected to lift the inversion today resulting in active fire behavior. The Fork Complex consists of over 40 fires, all of which were ignited by lightning between July 29 and 31, 2015. These fires are still being identified, assessed, and prioritized. Updated acreage and information about specific fires will be published as it is known. Fire activity moderated throughout last night (8/4) with the smoke inversion layer remaining in place today. Hopefully this will create favorable conditions for fire crews to take direct fire attack on the fires edge, construct dozer line and scout for best firefighting locations on all fires in the complex. The South Complex consists of approximately nine known fires, five of which are currently over 100 acres. The fires are active and defense of structures and point protection are in progress. The weather is trapping smoke in the valley causing very poor air quality. As the smoke lifts the fire activity increases. Firefighters will continue to provide point protection on structures and to look for opportunities to build direct and indirect containment lines. The Route Complex currently stands at 12,164 acres from seven separate fires and is at 2% containment. The overall acreage has been reduced because the South Fire on the nearby South Complex is merging with the Johnson Fire in the Route Complex resulting in decreased and revised fire perimeter acreage. This natural-color satellite image collected by the Moderate Resolution Imaging Spectroradiometer (MODIS) aboard the Terra satellite shows smoke rising and drifting northwest from the various fire complexes. It was captured on August 04, 2015. Actively burning areas, detected by MODIS’s thermal bands, are outlined in red. NASA image courtesy Jeff Schmaltz, MODIS Rapid Response Team. <b><a href="http://www.nasa.gov/audience/formedia/features/MP_Photo_Guidelines.html" rel="nofollow">NASA image use policy.</a></b> <b><a href="http://www.nasa.gov/centers/goddard/home/index.html" rel="nofollow">NASA Goddard Space Flight Center</a></b> enables NASA’s mission through four scientific endeavors: Earth Science, Heliophysics, Solar System Exploration, and Astrophysics. Goddard plays a leading role in NASA’s accomplishments by contributing compelling scientific knowledge to advance the Agency’s mission. <b>Follow us on <a href="http://twitter.com/NASAGoddardPix" rel="nofollow">Twitter</a></b> <b>Like us on <a href="http://www.facebook.com/pages/Greenbelt-MD/NASA-Goddard/395013845897?ref=tsd" rel="nofollow">Facebook</a></b> <b>Find us on <a href="http://instagrid.me/nasagoddard/?vm=grid" rel="nofollow">Instagram</a></b>
This single frame from a four-frame movie shows New Horizons' final deep search for hazardous material around Pluto, obtained on July 1, 2015. These data allow a highly sensitive search for any new moons. The images were taken with the spacecraft's Long Range Reconnaissance Imager (LORRI) over a 100-minute period, and were the final observations in the series of dedicated searches for hazards in the Pluto system which began on May 11. The images show all five known satellites of Pluto moving in their orbits around the dwarf planet, but analysis of these data has so far not revealed the existence of any additional moons. This means that any undiscovered Plutonian moons further than a few thousand miles from Pluto must be smaller than about 1 mile (1.6 kilometers) in diameter, if their surfaces have similar brightness to Pluto's big moon Charon. For comparison, Pluto's faintest known moon, Styx, which is conspicuous in the lower left quadrant of these images, is about 4 miles (7 kilometers) across, assuming the same surface brightness. The absence of additional moons, and also the absence of detectable rings in the hazard search data, imply that the spacecraft is very unlikely to be damaged by collisions with rings, or dust particles ejected from moons, during its high-speed passage through the Pluto system. The four movie frames were taken at 16:28, 16:38, 17:52, and 18:04 UTC on July 1, from a range of 9.4 million miles (15.2 million kilometers). Each frame is a mosaic of four sets of overlapping images, with a total exposure time of 120 seconds. The images have been heavily processed to remove the glare of Pluto and Charon, and the dense background of stars, though blemishes remain at the locations of many of the brighter stars. The "tails" extending to the right or downward from Pluto and Charon are camera artifacts caused by the extreme overexposure of both objects. Pluto and its five moons Charon, Styx, Nix, Kerberos and Hydra are identified by their initials, and their orbits around the center of gravity of the system (which is located just outside Pluto itself) are also shown. http://photojournal.jpl.nasa.gov/catalog/PIA19701

A truck arrives at NASA's Jet Propulsion Laboratory in Southern California on June 3, 2024, to deliver the Medium Articulating Transportation System (MATS), which will be used during the construction and transportation of components for NASA's Near-Earth Object Surveyor mission. Originating at the aerospace company Beyond Gravity in Vienna, Austria, the MATS traveled via ship through the Panama Canal to Port Hueneme, California, before arriving by road at JPL. Construction has begun on NEO Surveyor's instrument enclosure in the High Bay 1 clean room at JPL's Spacecraft Assembly Facility. When the enclosure is complete later this year, it will be moved inside the MATS to NASA's Johnson Space Center in Houston for environmental testing. The MATS is a transportable clean room with its own filtration and climate control systems that keep the spacecraft and components clean, stable, and safe while being moved between facilities. NEO Surveyor's instrument enclosure contains the spacecraft's telescope, mirrors, and infrared sensors that will be used to detect, track, and characterize the most hazardous near-Earth objects. BAE Systems, Space Dynamics Laboratory, and Teledyne are among the aerospace and engineering companies contracted to build the spacecraft and its instrumentation. The Laboratory for Atmospheric and Space Physics at the University of Colorado, Boulder will support operations, and IPAC at Caltech in Pasadena, California, is responsible for processing survey data and producing the mission's data products. JPL manages the project; Caltech manages JPL for NASA. Launching no earlier than 2027, NEO Surveyor supports the objectives of NASA's Planetary Defense Coordination Office (PDCO) at NASA Headquarters in Washington. The NASA Authorization Act of 2005 directed NASA to discover and characterize at least 90% of the near-Earth objects more than 140 meters (460 feet) across that come within 30 million miles (48 million kilometers) of our planet's orbit. Objects of this size can cause significant regional damage, or worse, should they impact the Earth. https://photojournal.jpl.nasa.gov/catalog/PIA26381

At NASA's Jet Propulsion Laboratory in Southern California, on June 7, 2024, clean room technicians use a crane to lift the lid of the Medium Articulating Transportation System (MATS) that will be used during the construction and transportation of components for NASA's Near-Earth Object Surveyor mission. Inside the MATS is the Medium Articulating Assembly Dolly (MAAD), a platform that will support the spacecraft's instrument enclosure, which is being constructed inside the High Bay 1 clean room at JPL's Spacecraft Assembly Facility. The MAAD is an articulating platform on which a spacecraft (or spacecraft components) can be mounted securely and positioned as required during assembly. It can tilt a spacecraft vertically and horizontally, rotating it 360 degrees. JPL plans to use the MAAD for future missions to reduce the number of crane lifts during assembly, test, and launch operations, known as ATLO. NEO Surveyor is the first mission to use the platform. NEO Surveyor's instrument enclosure contains the spacecraft's telescope, mirrors, and infrared sensors that will be used to detect, track, and characterize the most hazardous near-Earth objects. BAE Systems, Space Dynamics Laboratory, and Teledyne are among the aerospace and engineering companies contracted to build the spacecraft and its instrumentation. The Laboratory for Atmospheric and Space Physics at the University of Colorado, Boulder will support operations, and IPAC at Caltech in Pasadena, California, is responsible for processing survey data and producing the mission's data products. JPL manages the project; Caltech manages JPL for NASA. Launching no earlier than 2027, NEO Surveyor supports the objectives of NASA's Planetary Defense Coordination Office (PDCO) at NASA Headquarters in Washington. The NASA Authorization Act of 2005 directed NASA to discover and characterize at least 90% of the near-Earth objects more than 140 meters (460 feet) across that come within 30 million miles (48 million kilometers) of our planet's orbit. Objects of this size can cause significant regional damage, or worse, should they impact the Earth. https://photojournal.jpl.nasa.gov/catalog/PIA26382
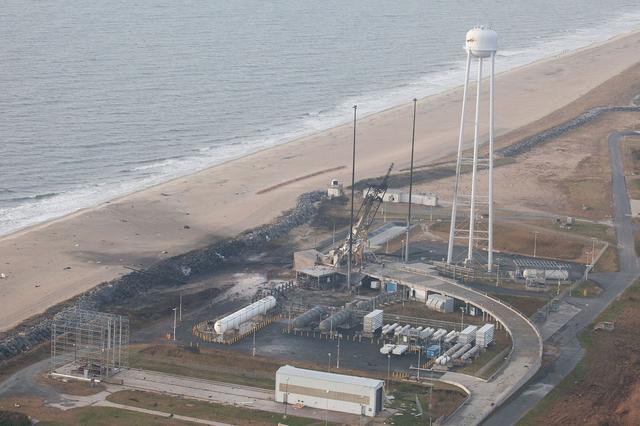
An aerial view of the Wallops Island launch facilities taken by the Wallops Incident Response Team Oct. 29 following the failed launch attempt of Orbital Science Corp.'s Antares rocket Oct. 28. Credit: NASA/Terry Zaperach --- The Wallops Incident Response Team completed today an initial assessment of Wallops Island, Virginia, following the catastrophic failure of Orbital Science Corp.’s Antares rocket shortly after liftoff at 6:22 p.m. EDT Tuesday, Oct. 28, from Pad 0A of the Mid-Atlantic Regional Spaceport at NASA’s Wallops Flight Facility in Virginia. “I want to praise the launch team, range safety, all of our emergency responders and those who provided mutual aid and support on a highly-professional response that ensured the safety of our most important resource -- our people,” said Bill Wrobel, Wallops director. “In the coming days and weeks ahead, we'll continue to assess the damage on the island and begin the process of moving forward to restore our space launch capabilities. There's no doubt in my mind that we will rebound stronger than ever.” The initial assessment is a cursory look; it will take many more weeks to further understand and analyze the full extent of the effects of the event. A number of support buildings in the immediate area have broken windows and imploded doors. A sounding rocket launcher adjacent to the pad, and buildings nearest the pad, suffered the most severe damage. At Pad 0A the initial assessment showed damage to the transporter erector launcher and lightning suppression rods, as well as debris around the pad. The Wallops team also met with a group of state and local officials, including the Virginia Department of Environmental Quality, the Virginia Department of Emergency Management, the Virginia Marine Police, and the U.S. Coast Guard. The Wallops environmental team also is conducting assessments at the site. Preliminary observations are that the environmental effects of the launch failure were largely contained within the southern third of Wallops Island, in the area immediately adjacent to the pad. Immediately after the incident, the Wallops’ industrial hygienist collected air samples at the Wallops mainland area, the Highway 175 causeway, and on Chincoteague Island. No hazardous substances were detected at the sampled locations. Additional air, soil and water samples will be collected from the incident area as well as at control sites for comparative analysis. The Coast Guard and Virginia Marine Resources Commission reported today they have not observed any obvious signs of water pollution, such as oil sheens. Furthermore, initial assessments have not revealed any obvious impacts to fish or wildlife resources. The Incident Response Team continues to monitor and assess. Following the initial assessment, the response team will open the area of Wallops Island, north of the island flagpole opposite of the launch pad location, to allow the U.S. Navy to return back to work. Anyone who finds debris or damage to their property in the vicinity of the launch mishap is cautioned to stay away from it and call the Incident Response Team at 757-824-1295. Further updates on the situation and the progress of the ongoing investigation will be available at: <a href="http://www.orbital.com" rel="nofollow">www.orbital.com</a> and <a href="http://www.nasa.gov/orbital" rel="nofollow">www.nasa.gov/orbital</a> <b><a href="http://www.nasa.gov/audience/formedia/features/MP_Photo_Guidelines.html" rel="nofollow">NASA image use policy.</a></b> <b><a href="http://www.nasa.gov/centers/goddard/home/index.html" rel="nofollow">NASA Goddard Space Flight Center</a></b> enables NASA’s mission through four scientific endeavors: Earth Science, Heliophysics, Solar System Exploration, and Astrophysics. Goddard plays a leading role in NASA’s accomplishments by contributing compelling scientific knowledge to advance the Agency’s mission. <b>Follow us on <a href="http://twitter.com/NASAGoddardPix" rel="nofollow">Twitter</a></b> <b>Like us on <a href="http://www.facebook.com/pages/Greenbelt-MD/NASA-Goddard/395013845897?ref=tsd" rel="nofollow">Facebook</a></b> <b>Find us on <a href="http://instagram.com/nasagoddard?vm=grid" rel="nofollow">Instagram</a></b>
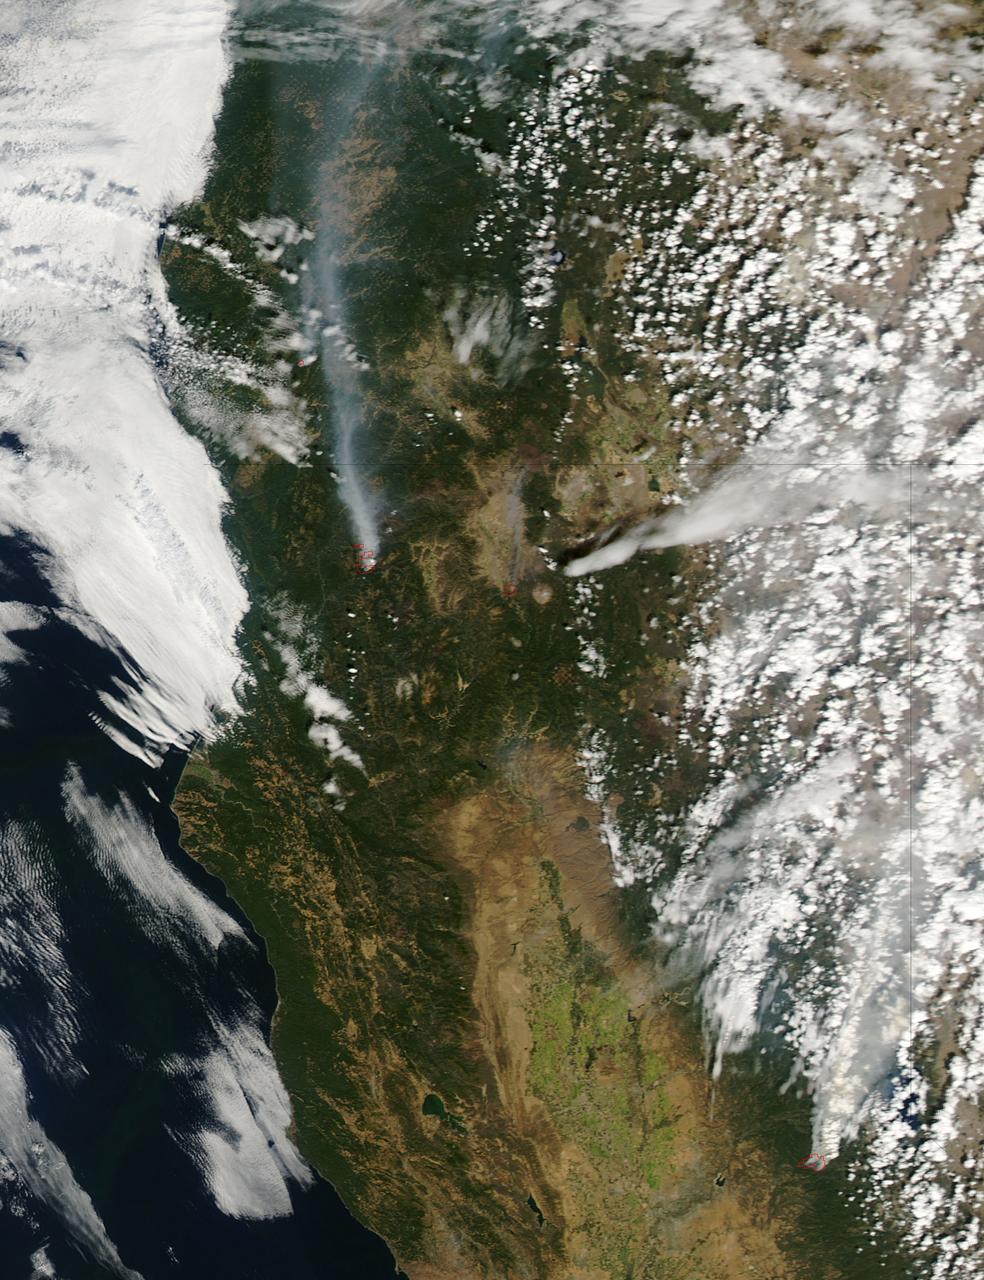
The fire season in California has been anything but cooperative this year. Hot conditions combined with a state-wide drought and dry lightning makes for unpleasant conditions and leads to an abundance of forest fires. On August 12, lightning struck and started the fire that grew into the Happy Camp Complex. Currently over 113,000 acres have been affected and the fire is only 55% contained as of today. Strong winds tested fire lines yesterday (8/15), and are expected to do so again today. Despite the high winds, existing fire lines held with no spotting or expansion outside current containment lines. The south end of the fire continued backing slowly toward Elk Creek in the Marble Mountain Wilderness. The Man Fire joined with the Happy Camp Complex yesterday and will be managed by California Interagency Incident Management Team 4 as of 6:00am on Wednesday, September 17, 2014. Nearby the Happy Camp Complex, near Mt. Shasta and the town of Weed, another fire erupted that fire officials said quickly damaged or destroyed 100 structures Monday (8/15). Hundreds of firefighters were trying to contain that fire. A California Fire spokesman said more than 300 acres were scorched and more than 100 structures damaged or destroyed in just a few hours. The blaze, dubbed the Boles Fire, also led to the closure of Interstate 5 and U.S. 97. Weed is in Siskiyou County, about 50 miles south of the California-Oregon border. With strong winds, the fire was able to rage into the community before firefighters could get equipment to the blaze. About 1,500 to 2,000 residents were being evacuated to the Siskiyou County fairgrounds. An evacuation center was set up at the county fairgrounds in Yreka. NASA's Aqua satellite collected this natural-color image with the Moderate Resolution Imaging Spectroradiometer, MODIS, instrument on September 15, 2014. Actively burning areas, detected by MODIS’s thermal bands, are outlined in red. NASA image courtesy Jeff Schmaltz LANCE/EOSDIS MODIS Rapid Response Team, GSFC. Caption by Lynn Jenner with information from Inciweb and California Department of Forestry and Fire Protection. <b><a href="http://www.nasa.gov/audience/formedia/features/MP_Photo_Guidelines.html" rel="nofollow">NASA image use policy.</a></b> <b><a href="http://www.nasa.gov/centers/goddard/home/index.html" rel="nofollow">NASA Goddard Space Flight Center</a></b> enables NASA’s mission through four scientific endeavors: Earth Science, Heliophysics, Solar System Exploration, and Astrophysics. Goddard plays a leading role in NASA’s accomplishments by contributing compelling scientific knowledge to advance the Agency’s mission. <b>Follow us on <a href="http://twitter.com/NASAGoddardPix" rel="nofollow">Twitter</a></b> <b>Like us on <a href="http://www.facebook.com/pages/Greenbelt-MD/NASA-Goddard/395013845897?ref=tsd" rel="nofollow">Facebook</a></b> <b>Find us on <a href="http://instagram.com/nasagoddard?vm=grid" rel="nofollow">Instagram</a></b>

An oil slick in the Gulf of Mexico following Hurricane Ida – a high-end Category 4 when it made landfall near Port Fourchon, Louisiana, on Aug. 29, 2021 – appears as a green trail in the inset false-color graphic provided by NASA's Delta-X project, while the surrounding seawater appears orange. The National Oceanic and Atmospheric Administration (NOAA) regularly monitors U.S. coastal waters for potential spills and noticed slicks that appeared just off the coast after the hurricane. They were able to use this information from Delta-X to corroborate other data they had about oil slicks in the area (satellite image in the second inset picture). The blue-green swath crossing from the Gulf of Mexico over the Louisiana coast denotes the flight path of the Delta-X radar instrument on Sept. 1, just before 11:30 a.m. CDT. Charged with studying the Mississippi River Delta, Delta-X was gearing up to collect data on Louisiana's coastal wetlands when Hurricane Ida barreled ashore in late August. The storm damaged buildings and infrastructure alike, resulting in power outages, flooding, and oil slicks in the Gulf of Mexico. Oil tends to smooth out the bumps on the ocean's surface, which results in a distinct radar signal that the Delta-X mission was able to pick out of their data. Delta-X added flight paths to their planned schedule – with the support of NASA's Applied Science Disaster Program – in order to collect information over the gulf in areas of interest to NOAA. Delta-X is studying two wetlands – the Atchafalaya and Terrebonne Basins – by land, boat, and air to quantify water and sediment flow as well as vegetation growth. While the Atchafalaya Basin has been gaining land through sediment accumulation, Terrebonne Basin, which is right next to the Atchafalaya, has been rapidly losing land. The data collected by the project will be applied to models used to forecast which areas of the delta are likely to gain or lose land under various sea level rise, river flow, and watershed management scenarios. The mission uses several instruments to collect its data. Affixed to the bottom of a Gulfstream-III airplane, one of those instruments, the all-weather Uninhabited Aerial Vehicle Synthetic Aperture Radar (UAVSAR), bounces radar signals off of Earth's surface, forming a kind of image of a particular area. Repeated images of the same regions, captured at different times, enable researchers to detect changes in those areas, such as fluctuating water levels beneath the vegetation as the tides move in and out of these wetlands. In addition to radar measurements, teams from Caltech, Louisiana State University, Florida International University, and other collaborating institutions gather water and vegetation samples – among other data – by boat, other airborne sensors, and from instruments on the ground. Funded by NASA's Earth Venture Suborbital (EVS-3) program, Delta-X is managed by the agency's Jet Propulsion Laboratory. Caltech in Pasadena, California, manages JPL for NASA. Fall 2021 was Delta-X's last scheduled field campaign, although the five-year mission will run through the end of 2023. https://photojournal.jpl.nasa.gov/catalog/PIA24540
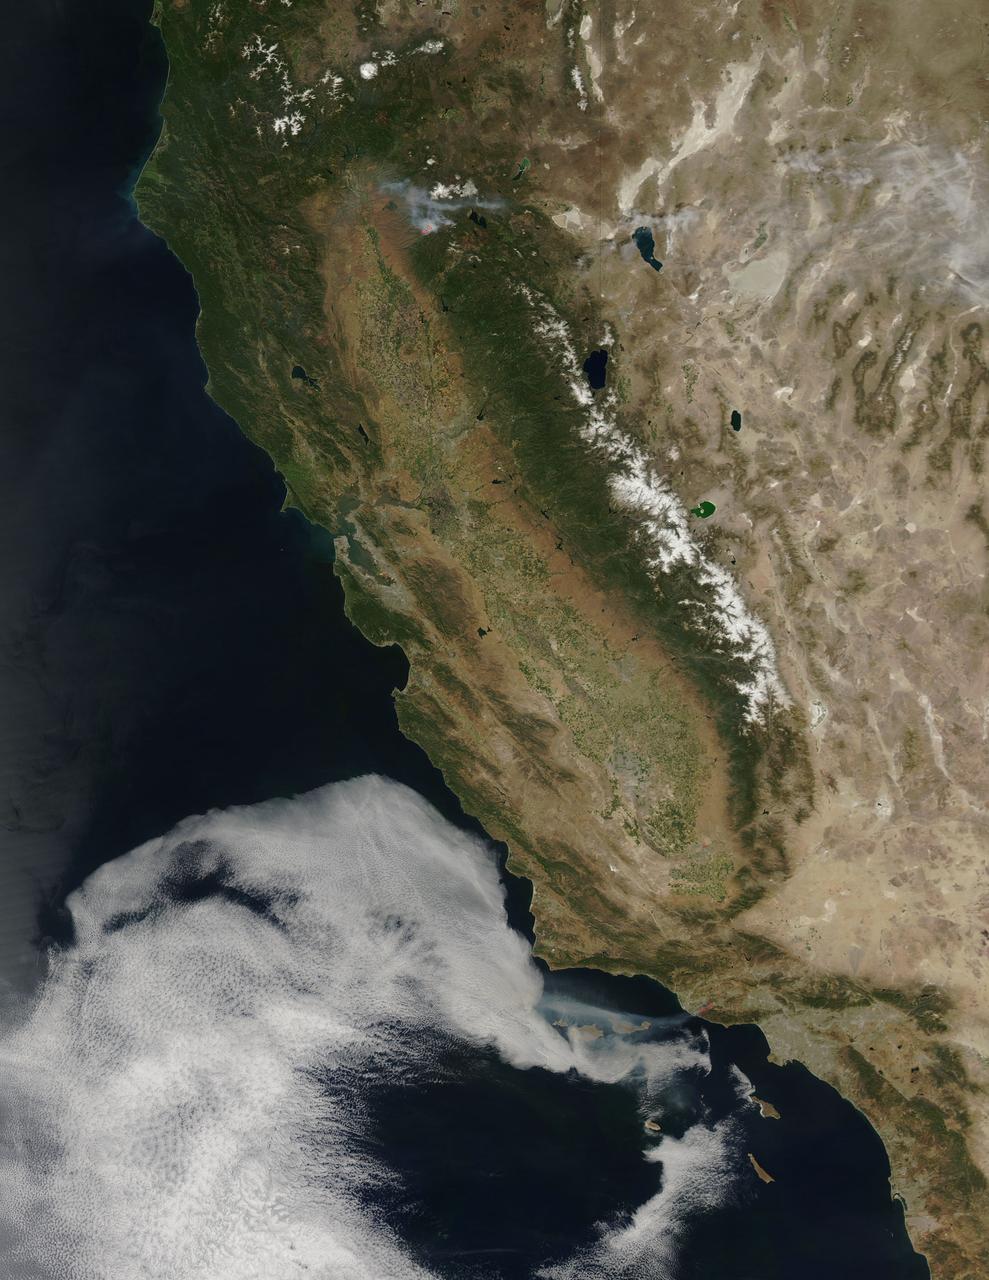
According to the NBCnews.com, Southern California firefighters were battling a growing, brush-fueled wildfire early Friday that had reached the beach in Ventura County and was pushing toward the upscale city of Malibu, officials said. Dubbed the Springs Fire, this "monster" of a wildfire has been made worse by howling Santa Ana winds and unusually dry vegetation. As of 2 am local time in California on Friday the 3rd, it was within "seven or eight miles" of Malibu, Ventura County Fire Department spokesman Bill Nash said. Weather conditions are not cooperating in the containment of this fire. The Weather Channel has predicted dry winds from offshore that will bring gusts of 40 to 50 miles per hour to the Southern California region on Friday the 3rd which could easily spread the fire. A complication to the winds is the extremely dry plant life left from a season in which only about five inches of rain fell in the area. The Springs Fire grew to 10,000 acres and was ten percent contained as of early Friday morning, according to the California Department of Forestry and Fire Prevention. Evacuations took place Thursday, and as of Friday morning 15 homes had been damaged. More than 2,000 homes and 100 commercial properties were under threat from the fire and those numbers could grow with weather conditions today (May 3). Currently the fire is burning in a rural area outside of Malibu, but it doesn't have to go very far to get to some expensive homes and more populated areas. It's current direction has it burning down the mountainside toward Malibu. Firefighters expect to receive help from tankers and helicopters in the air Friday morning, according to a release from the Ventura County Fire Department. The cause of the fire remained under investigation Friday. There had been no lightning or other natural fire-starting phenomenon in the area when the blaze began, Nash said. This natural-color satellite image was collected by the Moderate Resolution Imaging Spectroradiometer (MODIS) aboard the Aqua satellite on May 02, 2013. Actively burning areas, detected by MODIS’s thermal bands, are outlined in red. NASA image courtesy Jeff Schmaltz LANCE/EOSDIS MODIS Rapid Response Team, GSFC. Caption by Lynn Jenner with information from NBCnews.com <b><a href="http://www.nasa.gov/audience/formedia/features/MP_Photo_Guidelines.html" rel="nofollow">NASA image use policy.</a></b> <b><a href="http://www.nasa.gov/centers/goddard/home/index.html" rel="nofollow">NASA Goddard Space Flight Center</a></b> enables NASA’s mission through four scientific endeavors: Earth Science, Heliophysics, Solar System Exploration, and Astrophysics. Goddard plays a leading role in NASA’s accomplishments by contributing compelling scientific knowledge to advance the Agency’s mission. <b>Follow us on <a href="http://twitter.com/NASA_GoddardPix" rel="nofollow">Twitter</a></b> <b>Like us on <a href="http://www.facebook.com/pages/Greenbelt-MD/NASA-Goddard/395013845897?ref=tsd" rel="nofollow">Facebook</a></b> <b>Find us on <a href="http://instagram.com/nasagoddard?vm=grid" rel="nofollow">Instagram</a></b>