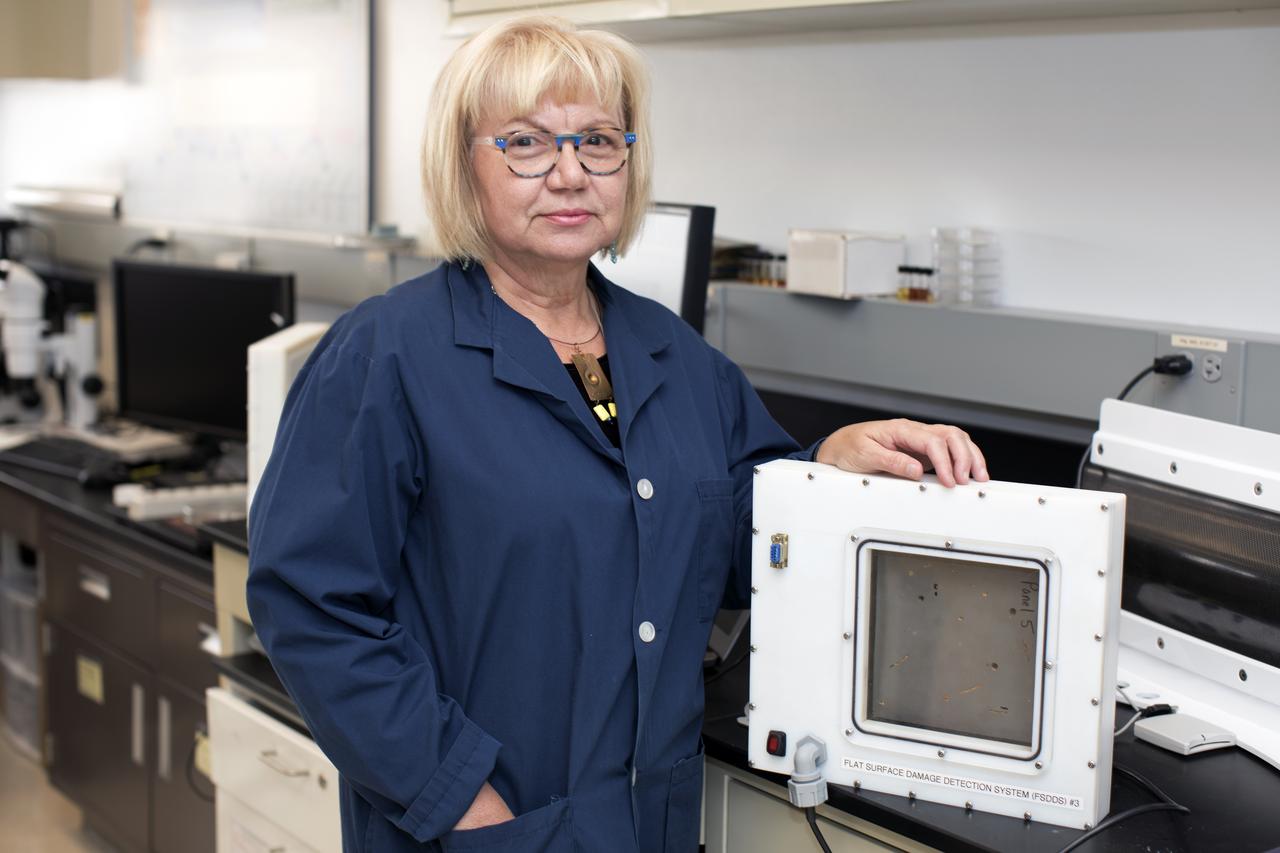
Martha Williams, who leads the team inventing the Flexible Damage Detection System, stands in a laboratory with a prototype at NASA's Kennedy Space Center in Florida. The system uses circuits printed on thin thermal film and specialized software. The system is designed to show where damage to a surface occurs and how severe it may be. It could offer astronauts a real-time update on their spacecraft's condition during a mission without requiring a spacewalk.

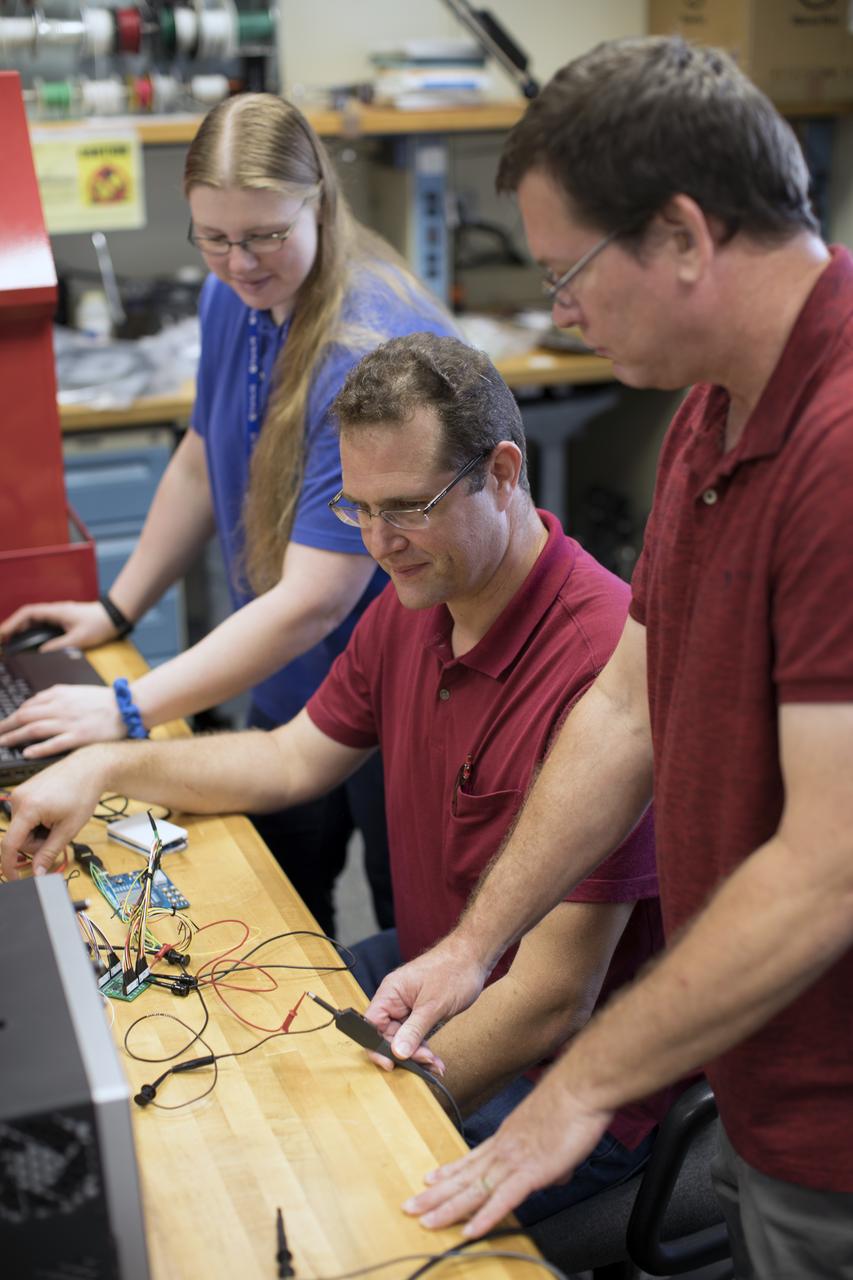
Jamie Szafran, from left, Mark Lewis and Curtis Ihlefeld work with the prototype of the Flexible Damage Detection System in a laboratory with a prototype at NASA's Kennedy Space Center in Florida. The system uses circuits printed on thin thermal film and specialized software. The system is designed to show where damage to a surface occurs and how severe it may be. It could offer astronauts a real-time update on their spacecraft's condition during a mission without requiring a spacewalk.
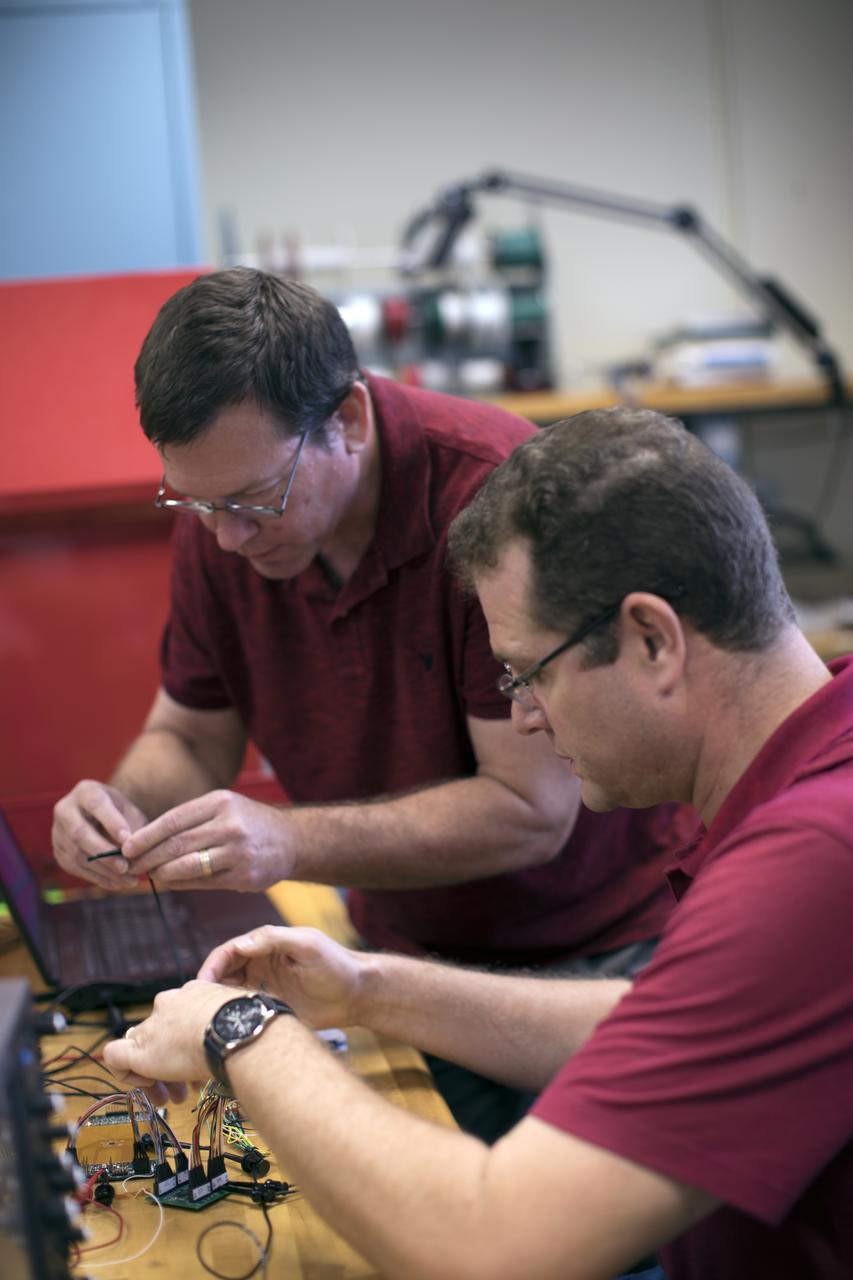
Curtis Ihlefeld, left, and Mark Lewis work with the prototype of the Flexible Damage Detection System in a laboratory with a prototype at NASA's Kennedy Space Center in Florida. The system uses circuits printed on thin thermal film and specialized software. The system is designed to show where damage to a surface occurs and how severe it may be. It could offer astronauts a real-time update on their spacecraft's condition during a mission without requiring a spacewalk.
Jamie Szafran, from left, Mark Lewis and Curtis Ihlefeld work with the prototype of the Flexible Damage Detection System in a laboratory with a prototype at NASA's Kennedy Space Center in Florida. The system uses circuits printed on thin thermal film and specialized software. The system is designed to show where damage to a surface occurs and how severe it may be. It could offer astronauts a real-time update on their spacecraft's condition during a mission without requiring a spacewalk.
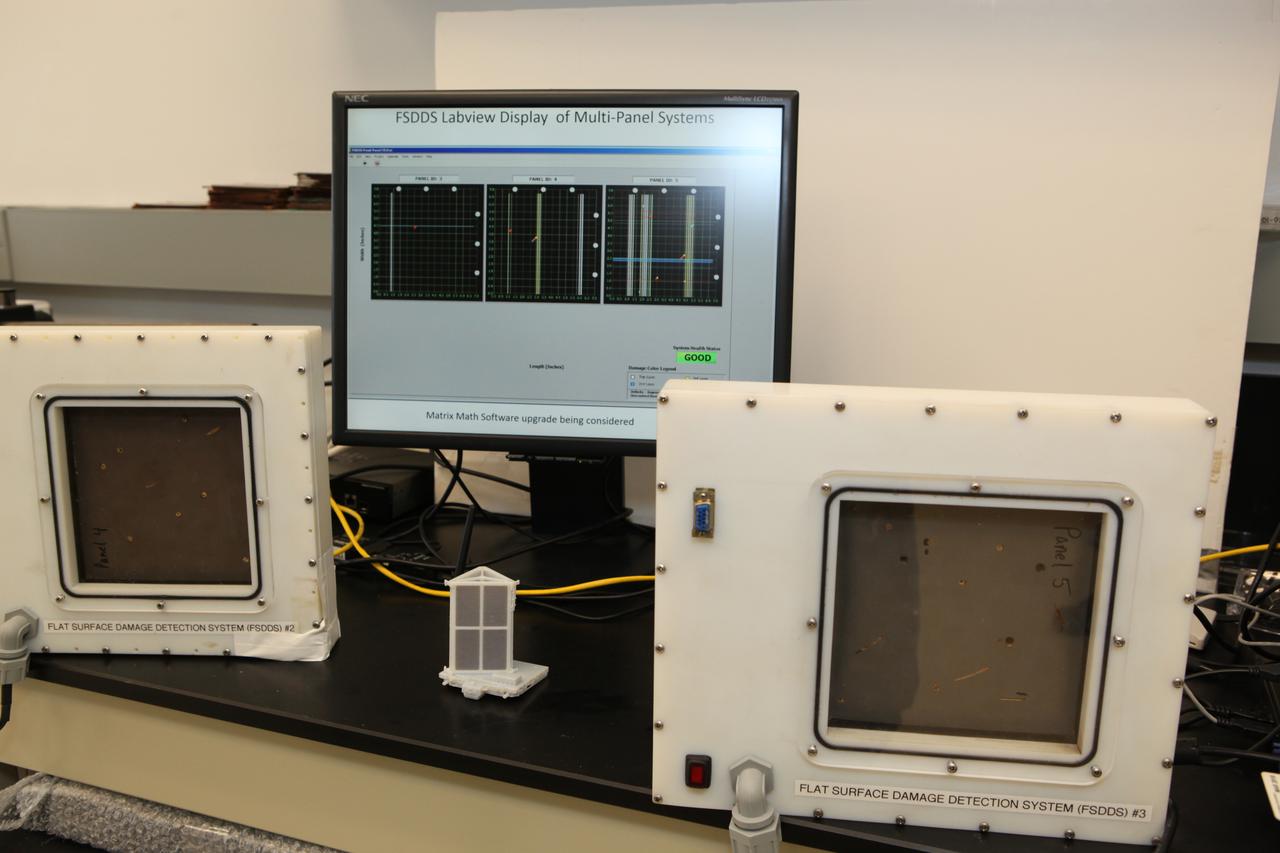
The complete prototype Flexible Damage Detection System stands in a laboratory at NASA's Kennedy Space Center in Florida. The system uses circuits printed on thin thermal film and specialized software. The system is designed to show where damage to a surface occurs and how severe it may be. It could offer astronauts a real-time update on their spacecraft's condition during a mission without requiring a spacewalk. Photo credit: NASA/Dimitri Gerondidakis
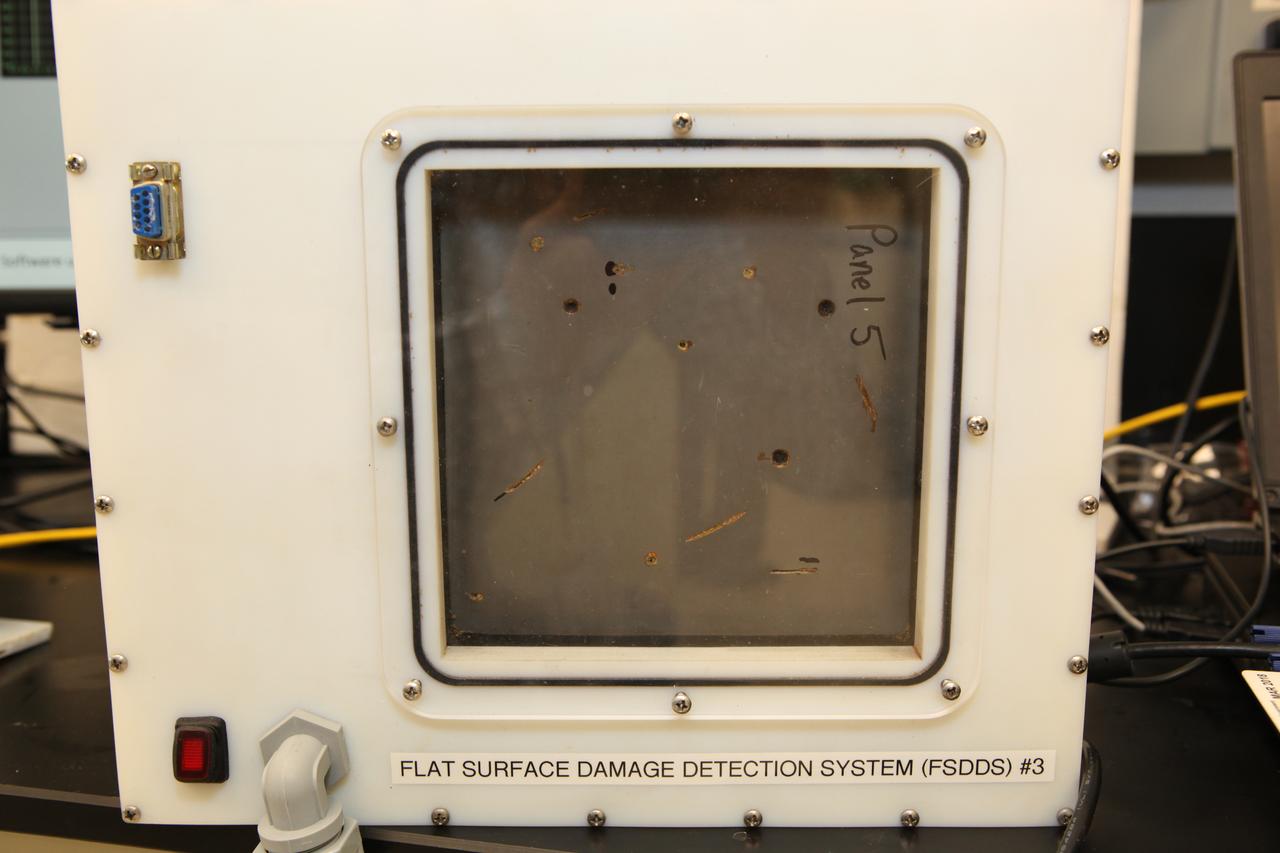
The prototype Flexible Damage Detection System stands in a laboratory at NASA's Kennedy Space Center in Florida. The system uses circuits printed on thin thermal film and specialized software. The system is designed to show where damage to a surface occurs and how severe it may be. It could offer astronauts a real-time update on their spacecraft's condition during a mission without requiring a spacewalk.
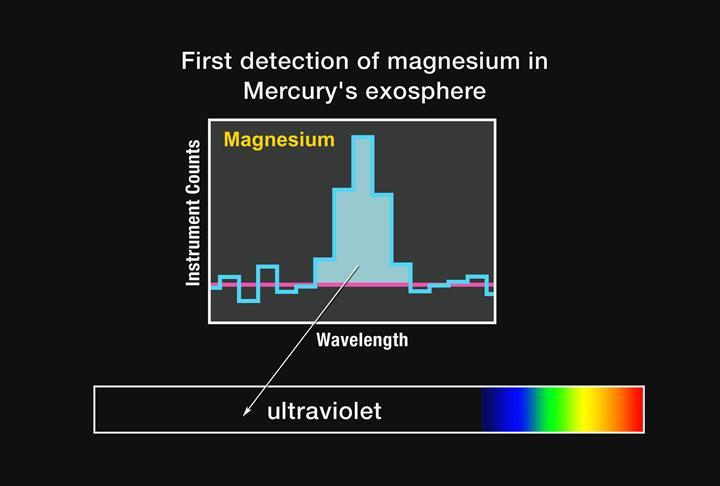
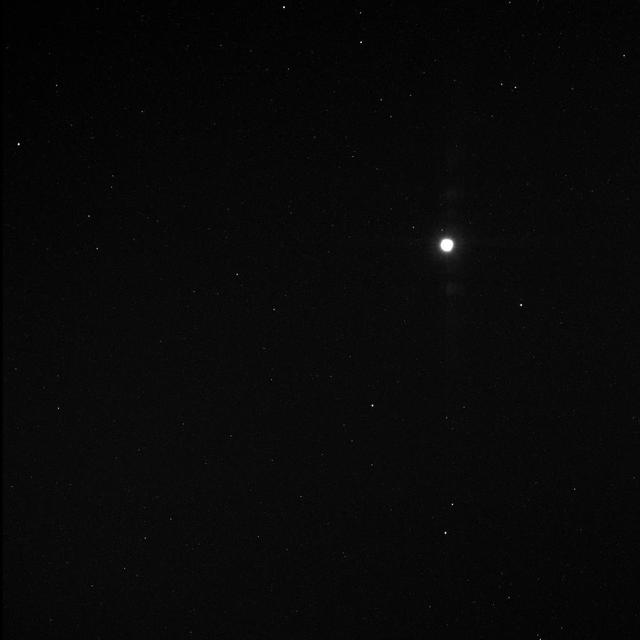
First Detection of Magnesium in Mercury Exosphere

Tukufu Zuberi of the History Detectives waits on the analysis of the film. Tthe History Detectives believed a piece of film was from the Echo II Project. PHOTO CREDIT: NASA/Debbie Mccallum
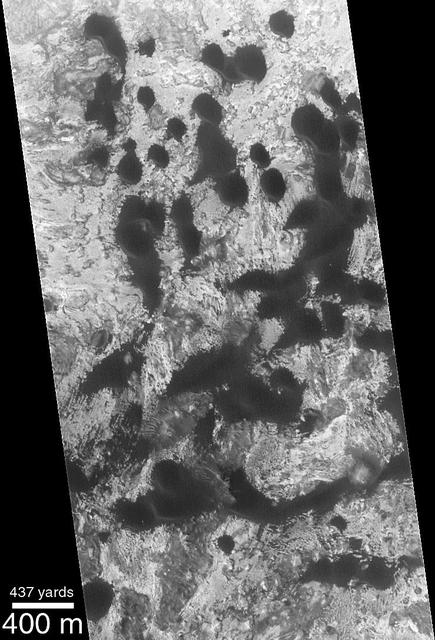
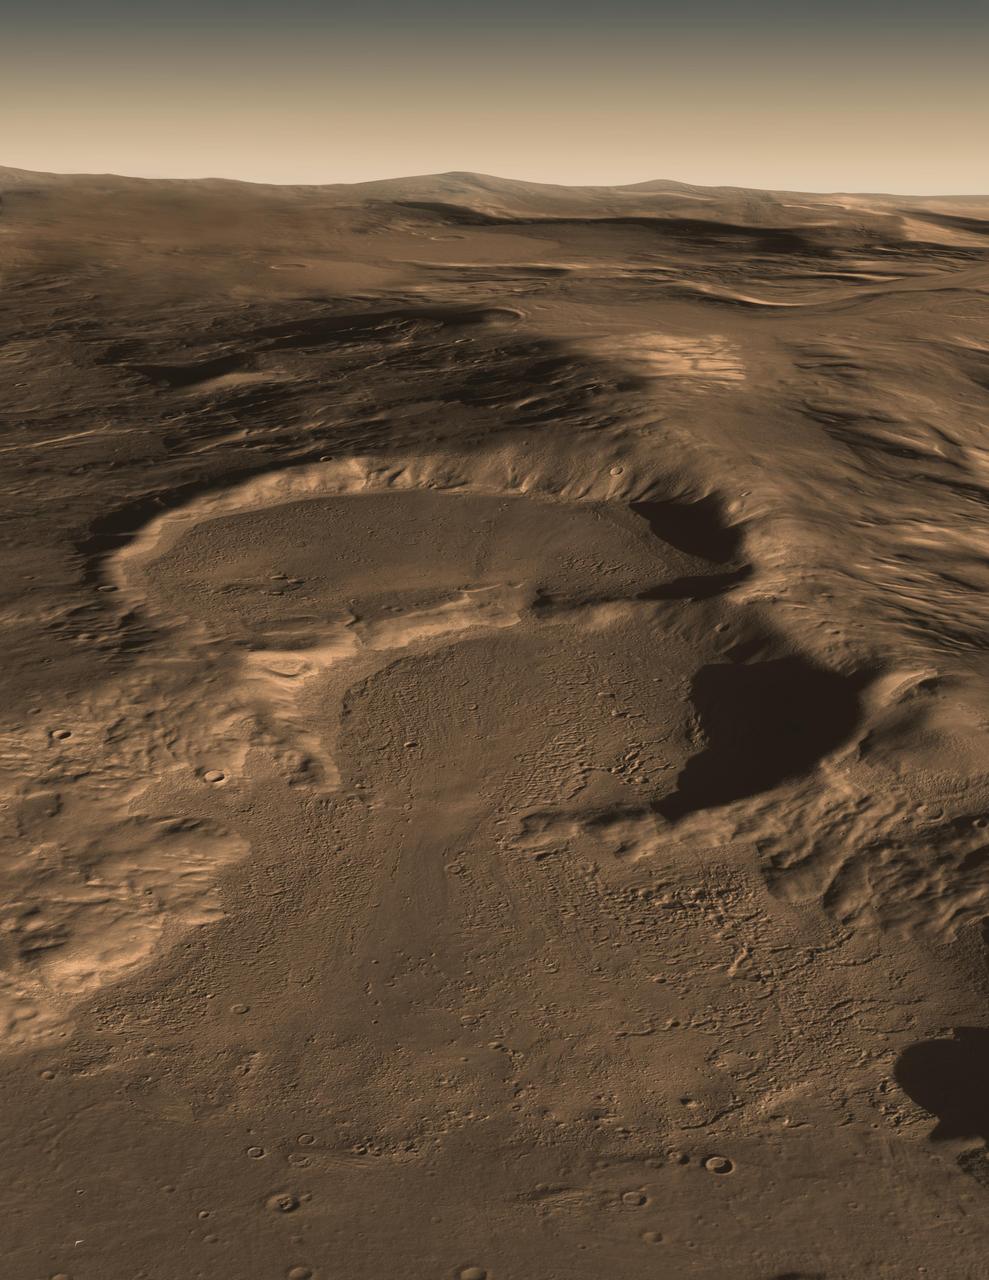
Movement of Whole Martian Dunes Difficult to Detect or Confirm
Analyzing a piece of the film that the History Detectives believed was from the Echo II Project. PHOTO CREDIT: NASA/Debbie Mccallum
Analyzing a piece of the film that the History Detectives believed was from the Echo II Project. PHOTO CREDIT: NASA/Debbie Mccallum
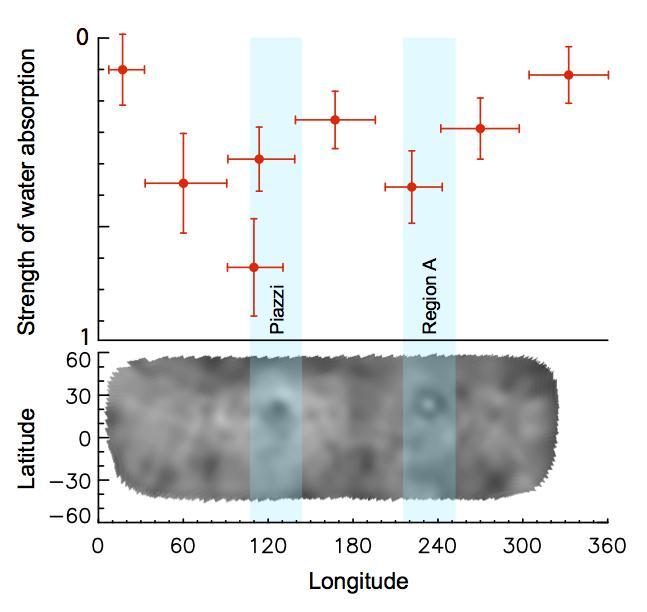
This graph shows variability in the intensity of the water absorption signal detected at Ceres by the Herschel space observatory on March 6, 2013.

Debbie Thomas (left) and Tukufu Zuberi of the PBS's series History Detectives during filming at a NASA Goddard Space Flight Center lab. PHOTO CREDIT: NASA/Debbie Mccallum

Marjorie Sovinski (left) and Tukufu Zuberi of the PBS's serieres History Detectives during filming at NASA Goddard Space Flight Center. PHOTO CREDIT: NASA/Debbie Mccallum
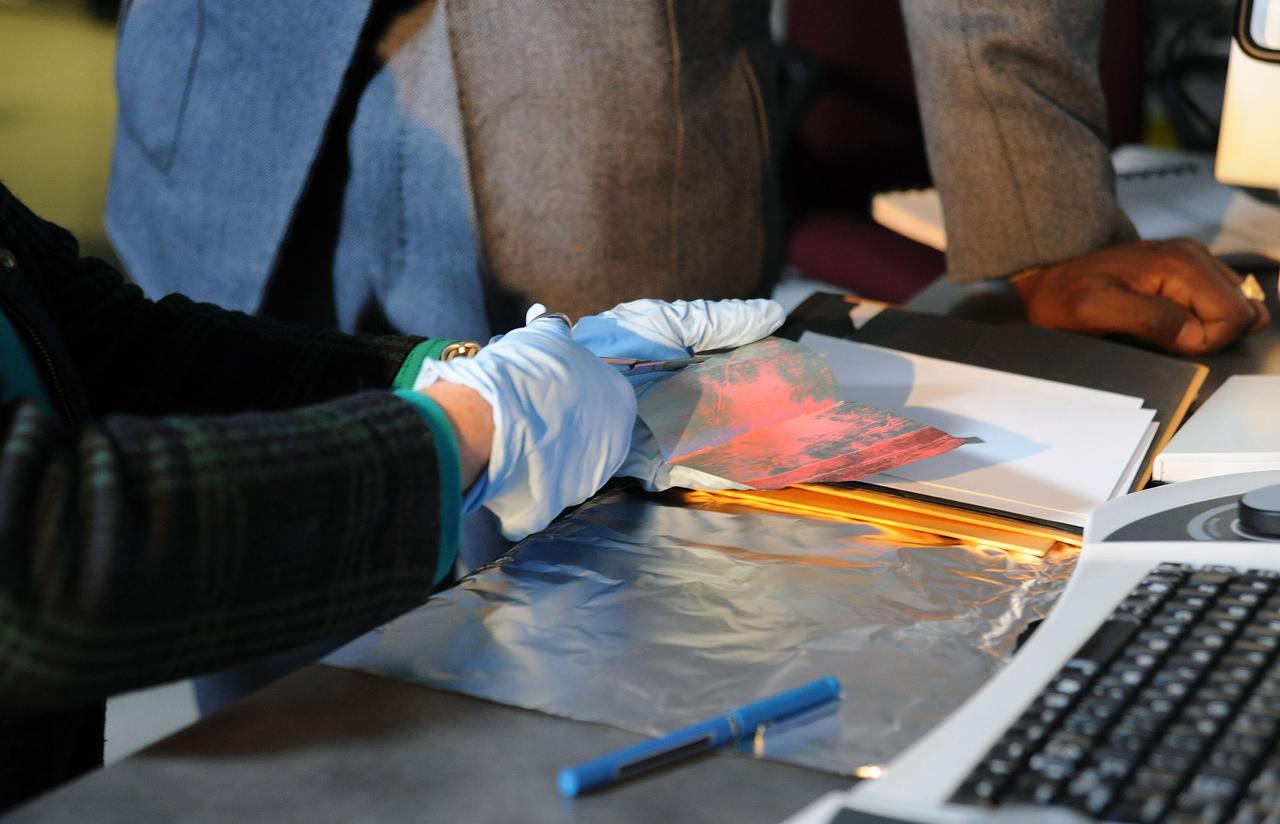
Debbie Thomas cutting the sample to be tested during a visit from the PBS's series History Detectives in NASA Goddard Space Flight Center lab. PHOTO CREDIT: NASA/Debbie Mccallum
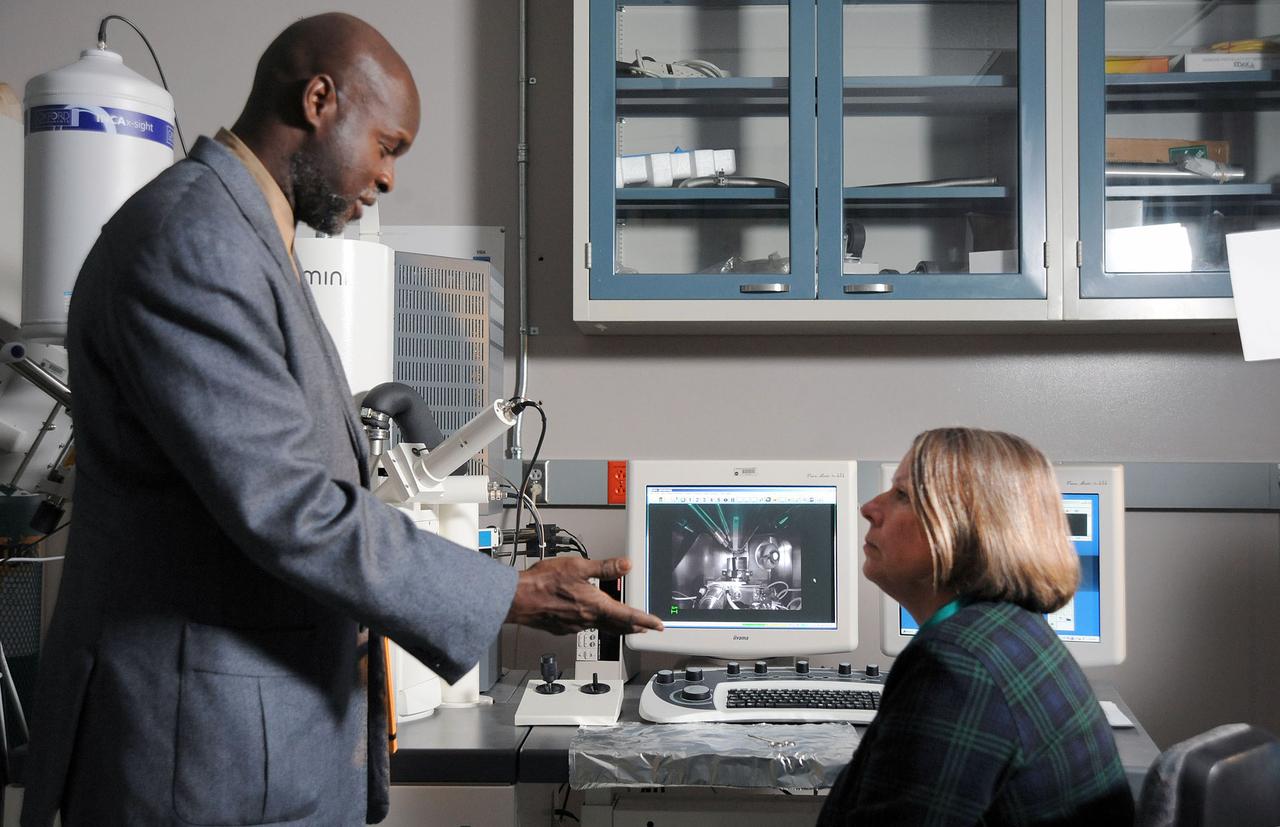
Debbie Thomas (right) and Tukufu Zuberi of the PBS's series History Detectives during filming at a NASA Goddard Space Flight Center lab. PHOTO CREDIT: NASA/Debbie Mccallum
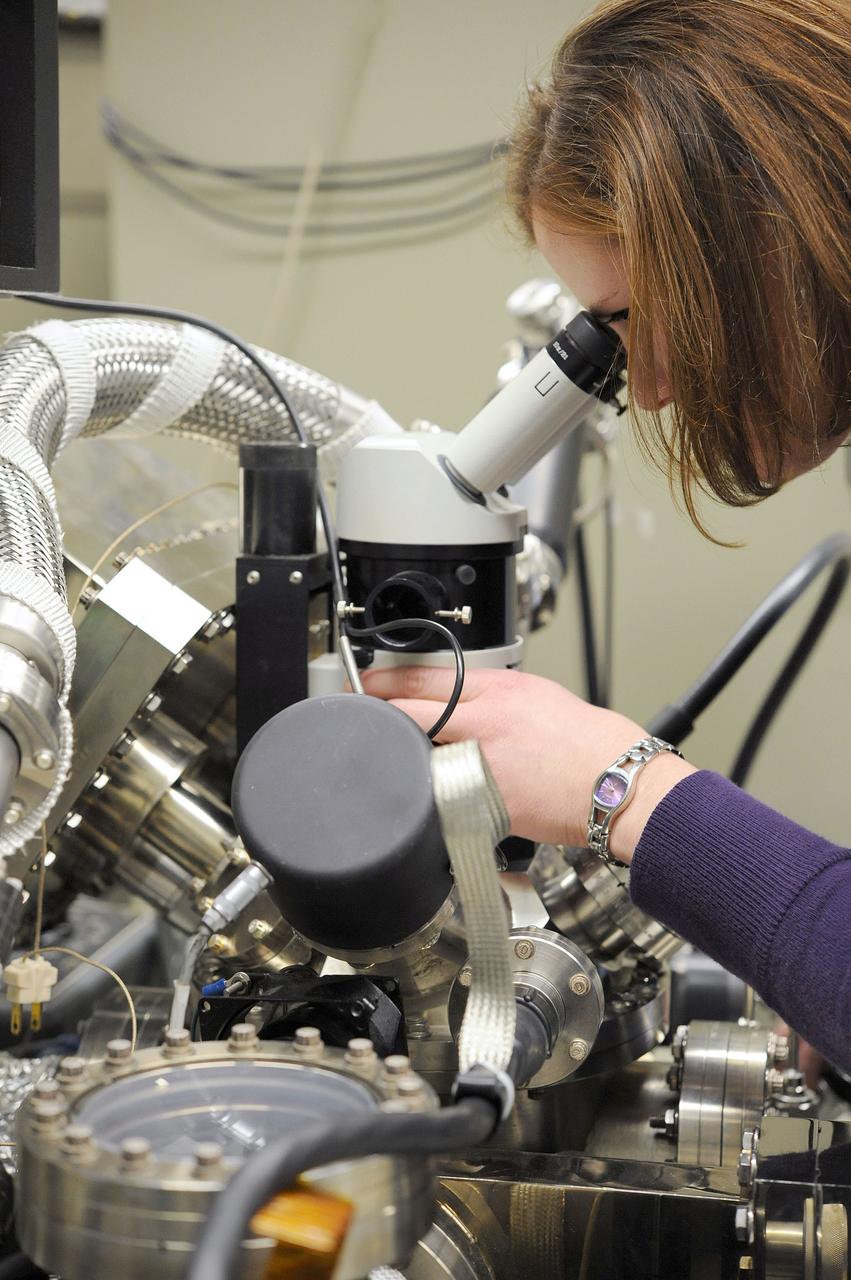
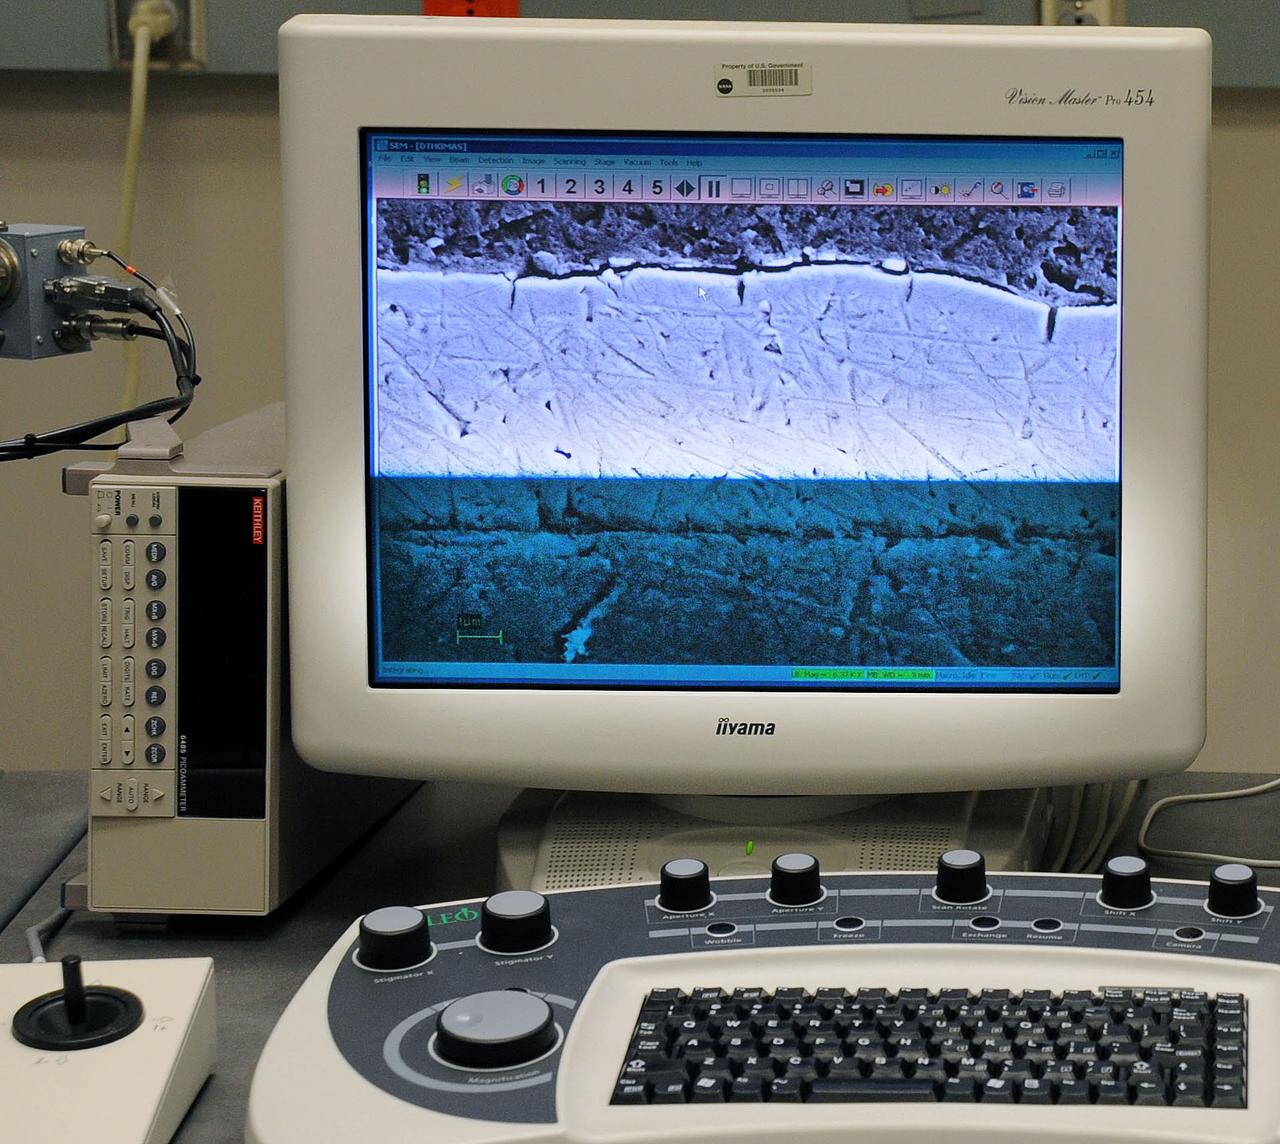
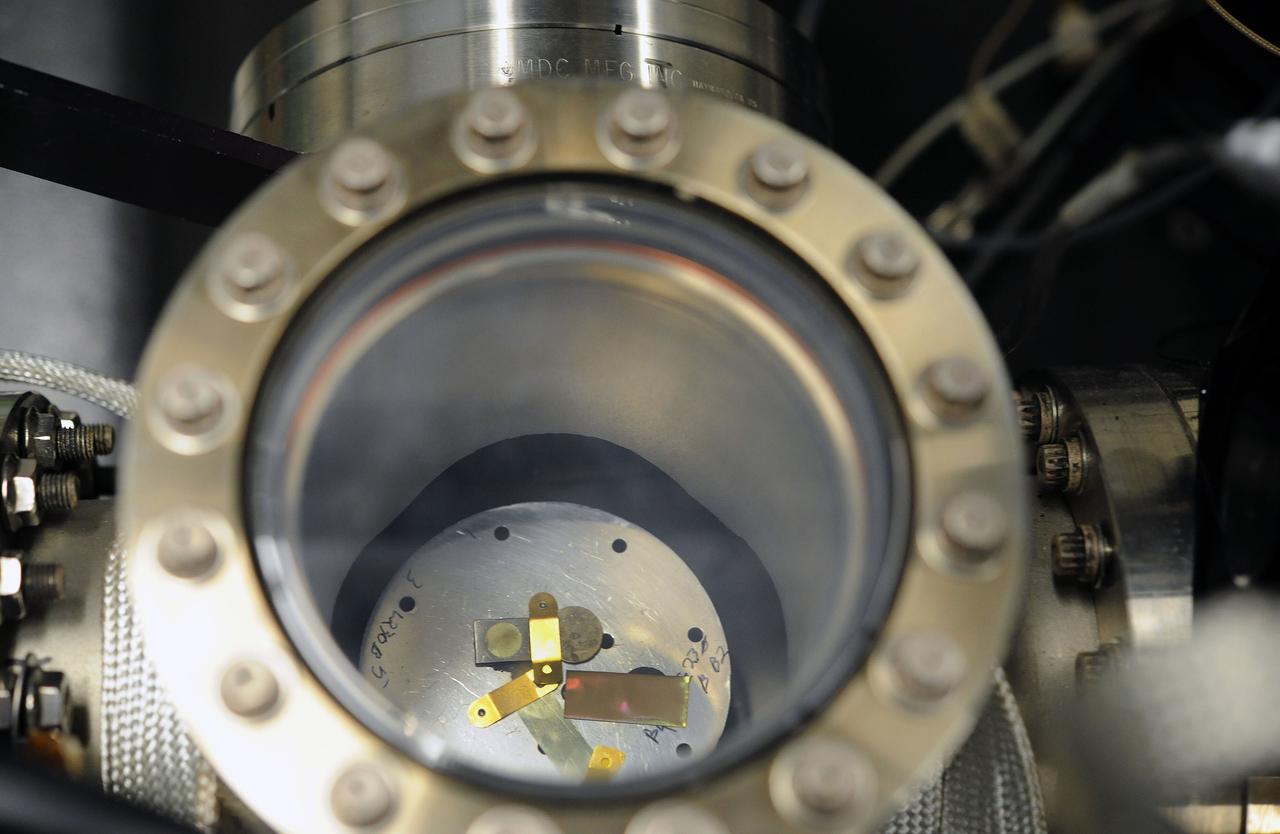
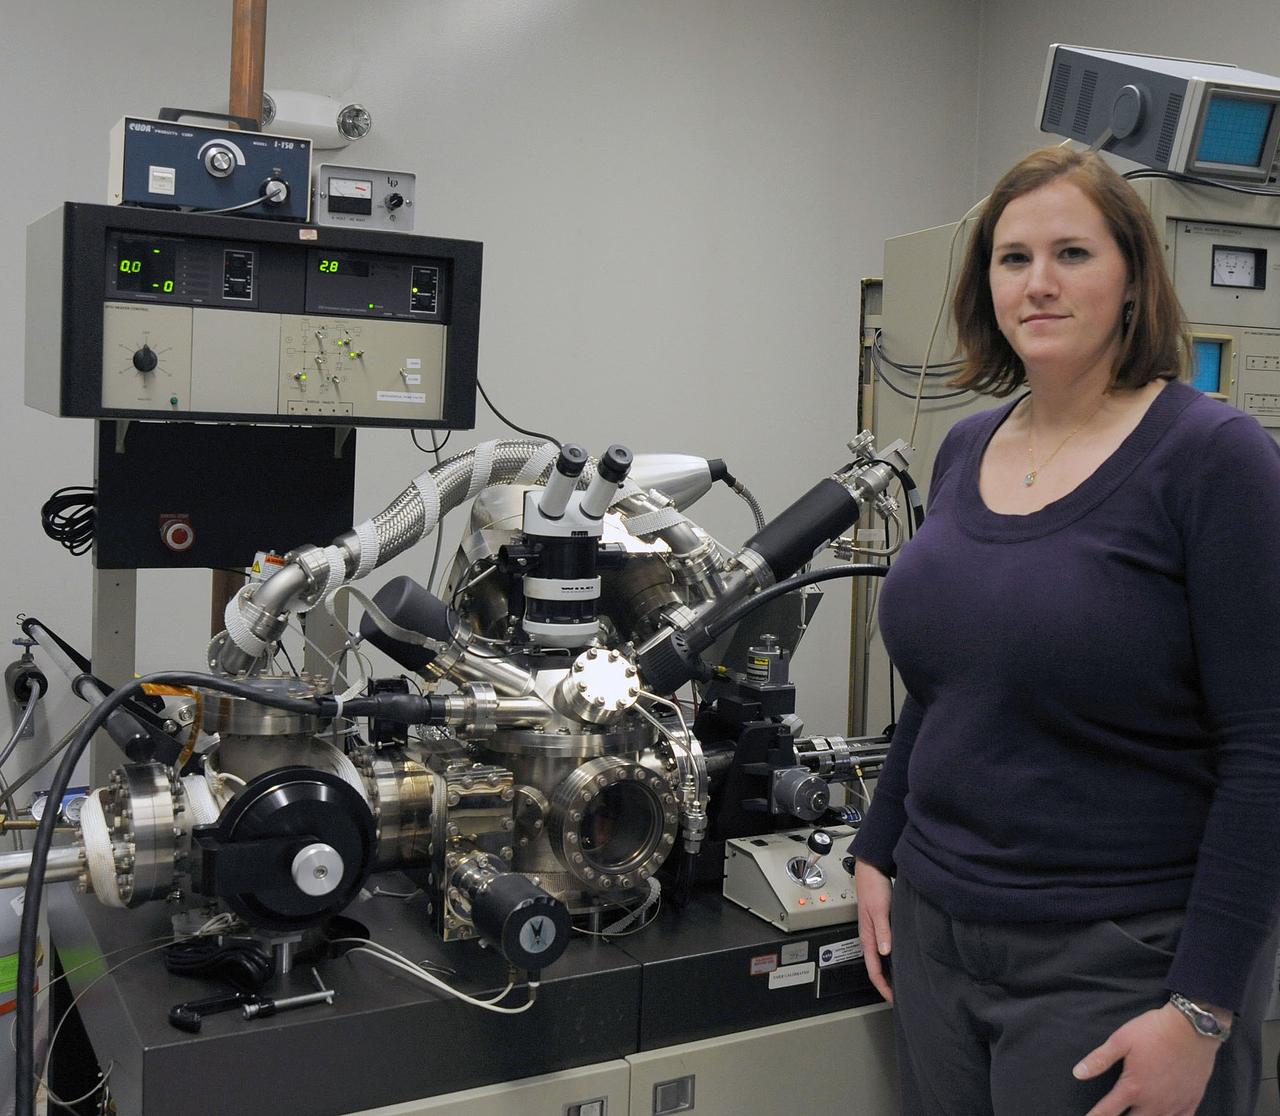
The name of the instrument is X-Ray Photoelecton Spectrometer (acronymed XPS); the lab is in the Materials Engineering Branch and aptly titled the X-Ray Photoelectron Spectrometry Lab. XPS is a non-destructive surface analysis technique that provides an elemental composition of the surface. It is capable of detecting any element with the exception of hydrogen and helium. In the picture, I am analyzing a piece of the film that the History Detectives believed was from the Echo II Project. I was looking for the presence of chromium, which would help confirm that the exterior of the film had a chromium conversion coating. PHOTO CREDIT: NASA/Debbie Mccallum

This map shows the route driven by NASA's Curiosity Mars rover (blue line) and locations where the rover's Chemistry and Camera (ChemCam) instrument detected the element boron (dots, colored by abundance of boron according to the key at right). The main map shows the traverse from landing day (Sol 0) in August 2012 to the rover's location in September 2016, with boron detections through September 2015. The inset at upper left shows a magnified version of the most recent portion of that traverse, with boron detections during that portion. Overlapping dots represent cases when boron was detected in multiple ChemCam observation points in the same target and non-overlapping dots represent cases where two different targets in the same location have boron. Most of the mission's detections of boron have been made in the most recent seven months (about 200 sols) of the rover's uphill traverse. The base image for the map is from the High Resolution Imaging Science Experiment (HiRISE) camera on NASA's Mars Reconnaissance Orbiter. North is up. The scale bar at lower right represents one kilometer (0.62 mile). http://photojournal.jpl.nasa.gov/catalog/PIA21150
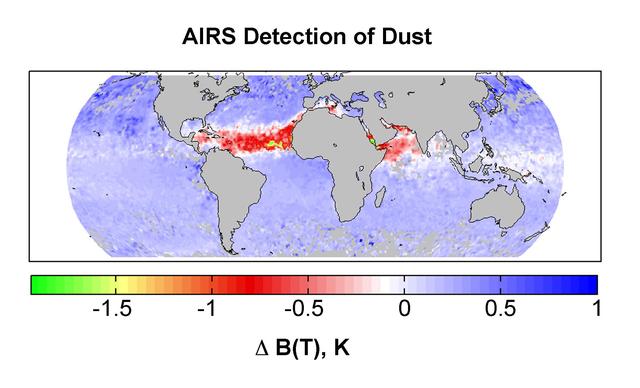
Detection of dust: global map for July 2003 from the Atmospheric Infrared Sounder AIRS on NASA Aqua satellite.
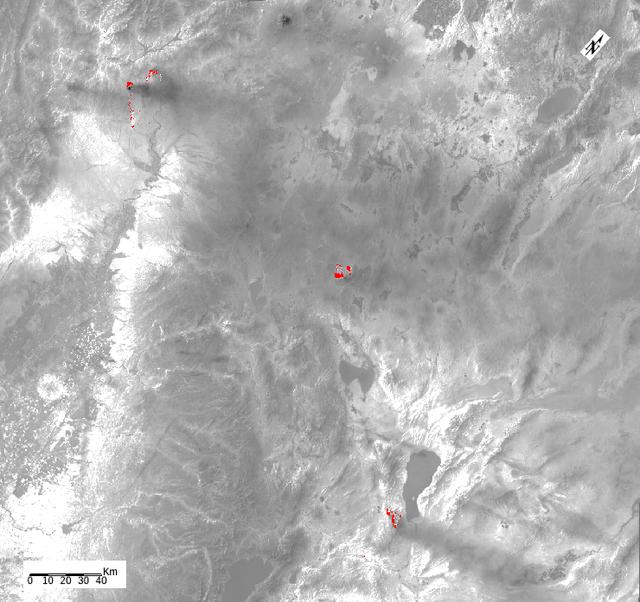
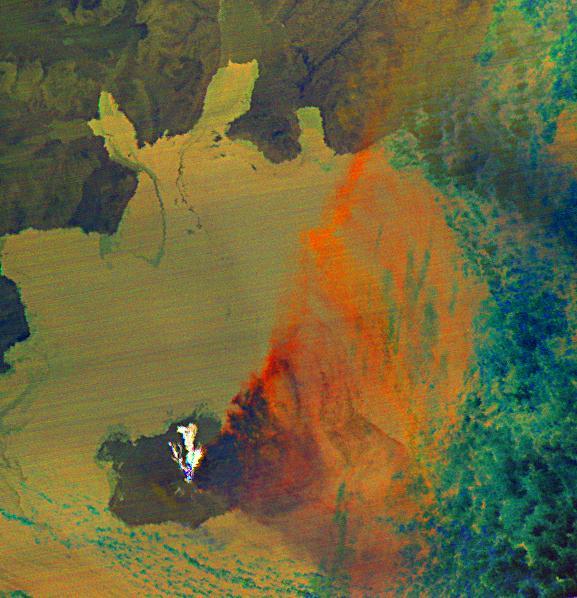
ECOSTRESS, NASA's new Earth-observing mission aboard the International Space Station, detected three wildfires burning in the western US on July 28, 2018 -- the Carr and Whaleback fires in California, and the Perry Fire in Nevada. The fires can be seen in red in Figures 1 and 2. Zooming in on the two larger fires shows the heat data in more detail and also reveals the fires' thick smoke plumes. ECOSTRESS launched on June 29 as part of a SpaceX commercial resupply mission to the space station. Its primary mission is to measure surface temperatures to detect plant health; however, it can also detect other heat-related phenomenon like heat waves, volcanoes and wildfires. This is the first image of wildfires acquired from ECOSTRESS. https://photojournal.jpl.nasa.gov/catalog/PIA22490
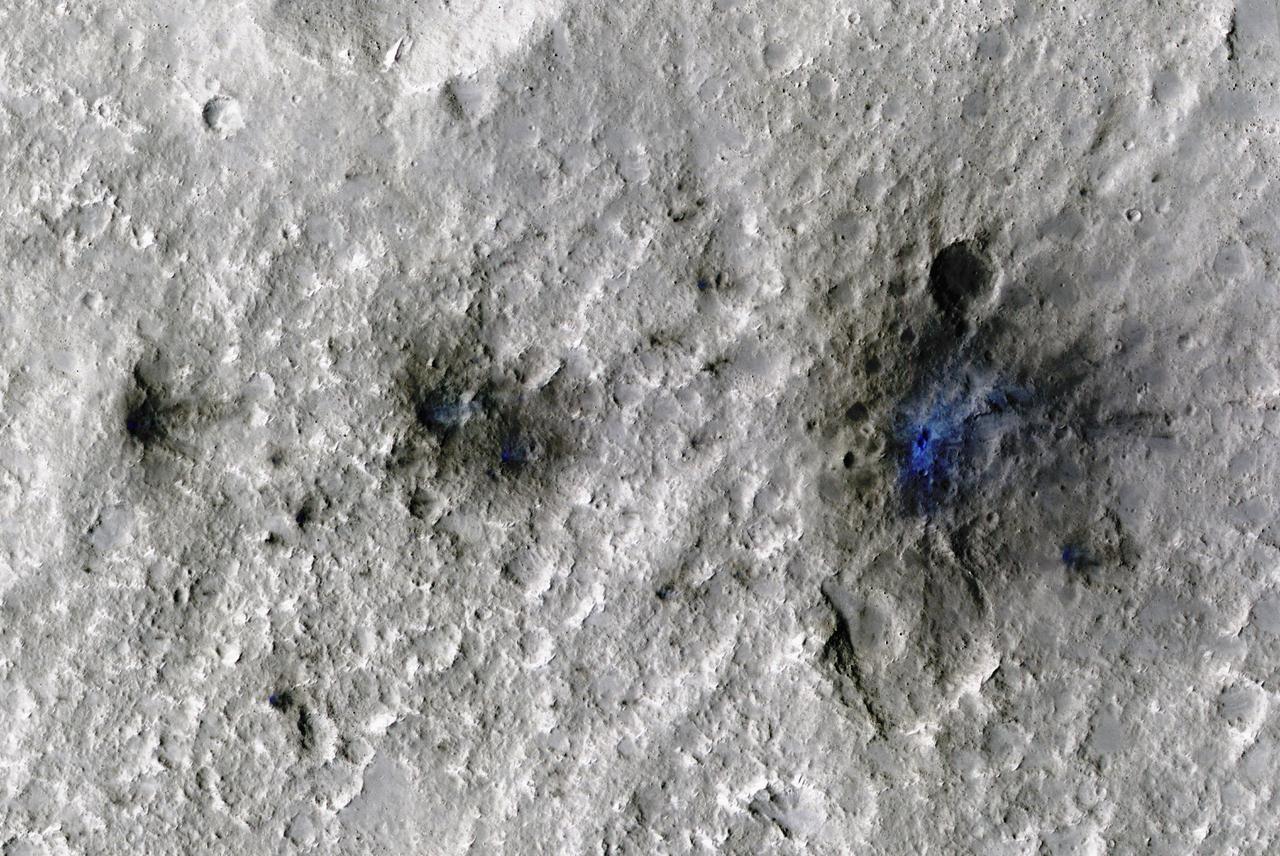
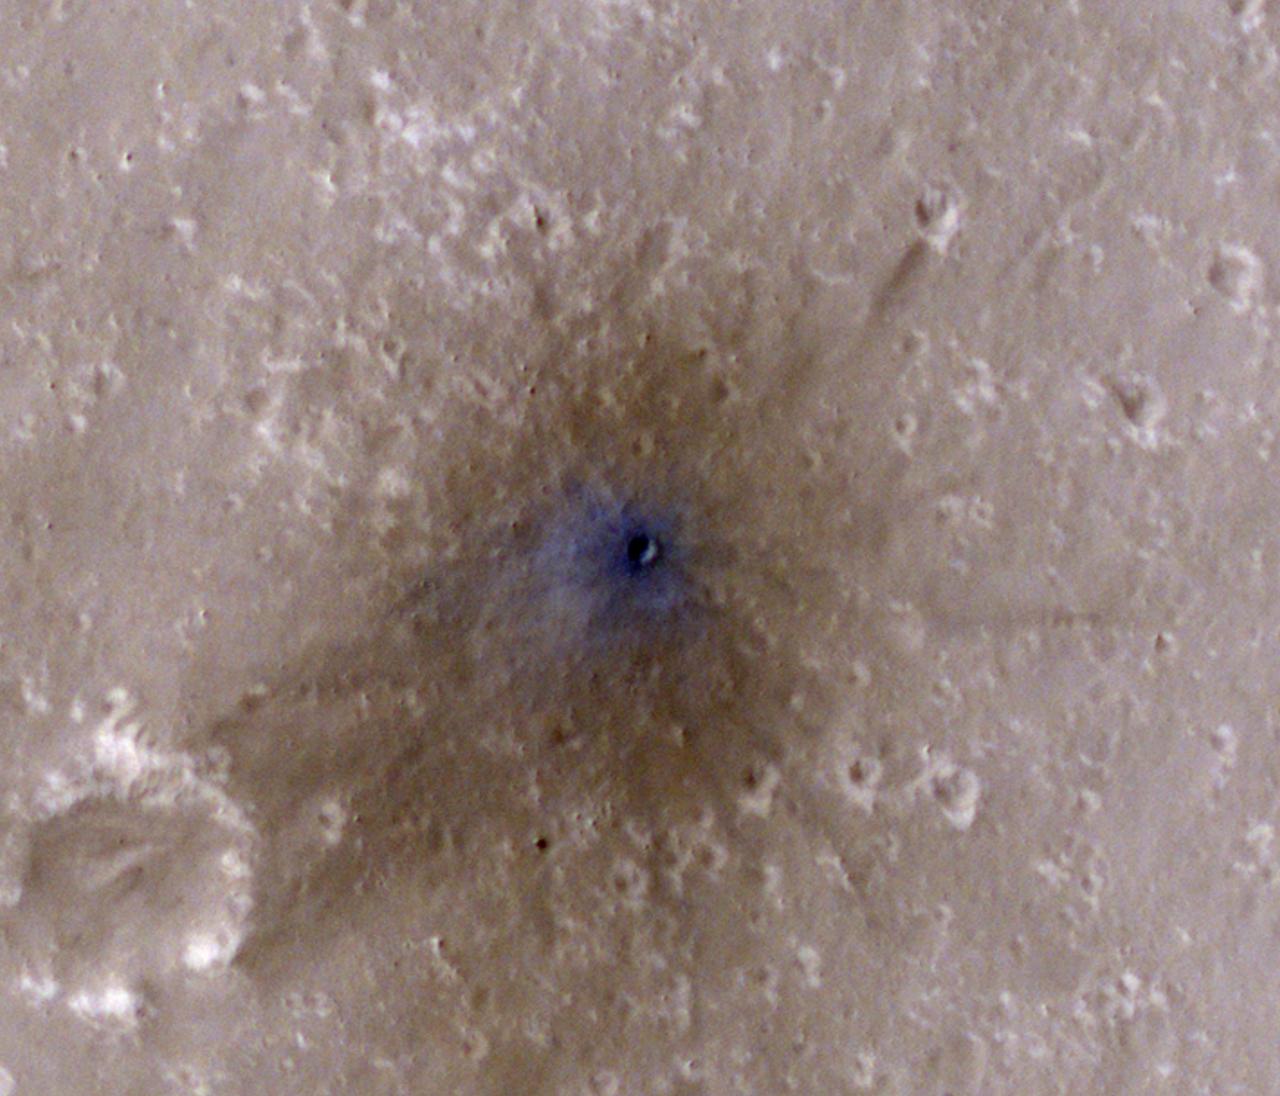
The craters seen here in blue were formed by a meteoroid impact on Mars on Sept. 5, 2021. The impact was the first to be detected by NASA's InSight mission; the image was taken later by NASA's Mars Reconnaissance Orbiter using its High Resolution Imaging Science Experiment (HiRISE) camera. The initial impact itself created a small marsquake that was detected by InSight's seismometer. The instrument recorded seismological data that showed the moment the meteoroid entered Mars' atmosphere, its explosion into pieces in the atmosphere, and finally, the impact that created a series of at least three craters in the surface. MRO then flew over the approximate site where the impact was "felt" to look for darkened patches of ground using its Context Camera. After finding this location, HiRISE captured the scene in color. The ground is not actually blue; this enhanced-color image highlights certain hues in the scene to make details more visible to the human eye – in this case, dust and soil disturbed by the impact. https://photojournal.jpl.nasa.gov/catalog/PIA25408
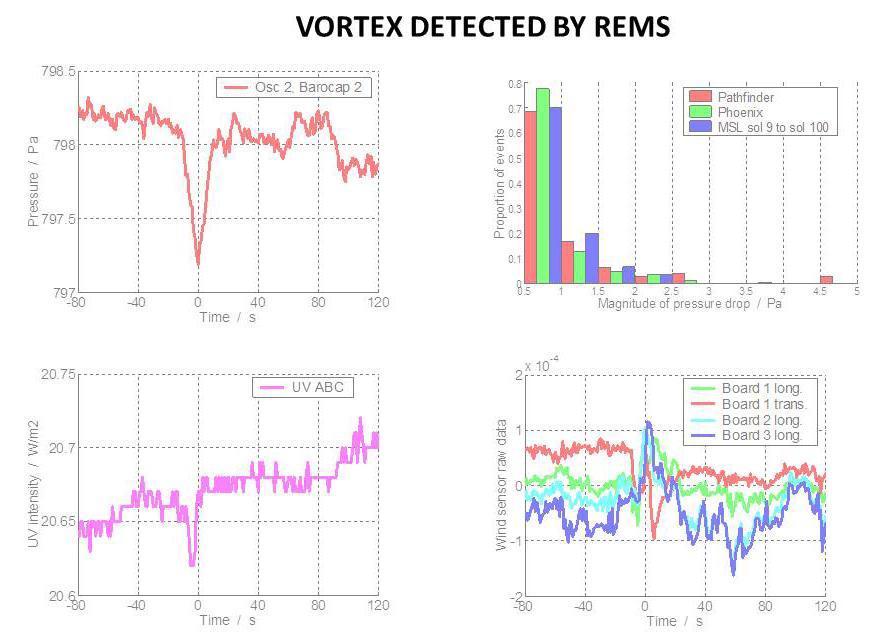
The Rover Environmental Monitoring Station REMS on NASA Curiosity Mars rover has detected dozens of whirlwinds, or vortex events, causing brief dips in atmospheric pressure, and sometimes other measurable effects.
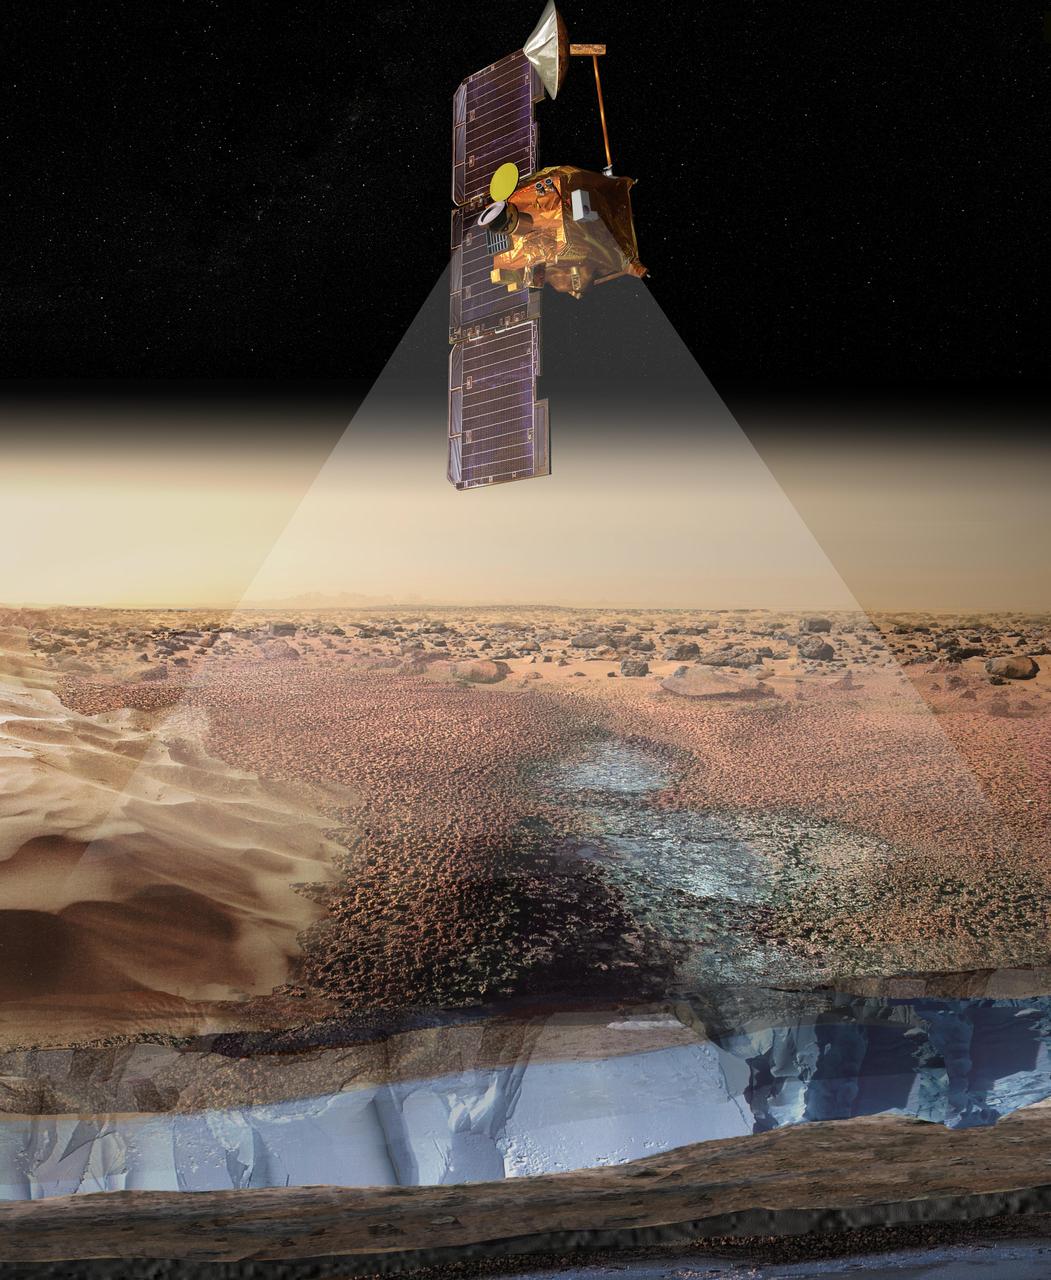
This artist rendering portrays ice-rich layers in the soils of Mars being detected by instruments aboard NASA 2001 Mars Odyssey spacecraft.
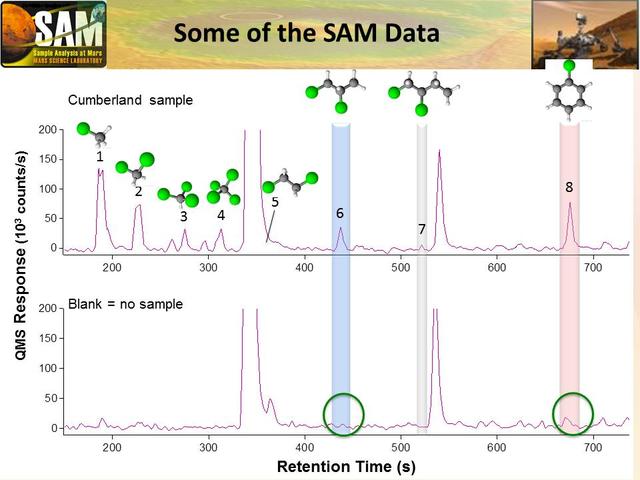
Data graphed here are examples from the Sample Analysis at Mars SAM laboratory detection of Martian organics in a sample of powder that the drill on NASA Curiosity Mars rover collected from a rock target called Cumberland.
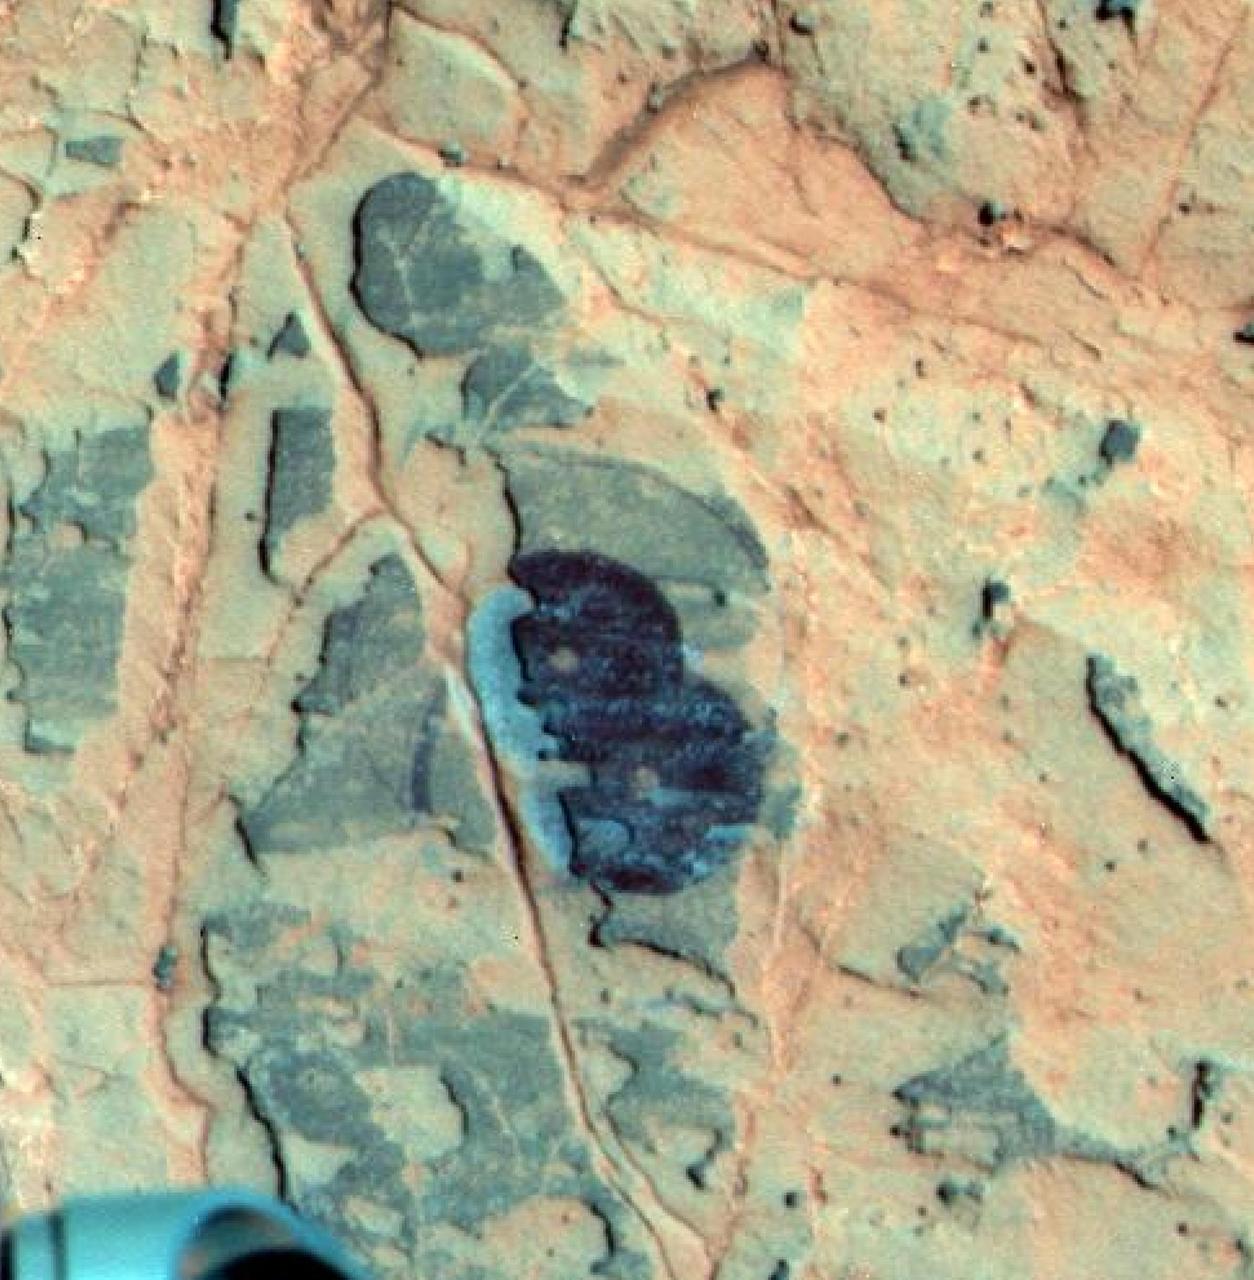
Researchers used NASA Mars Exploration Rover Opportunity to find a water-related mineral on the ground that had been detected from orbit, and found it in the dark veneer of rocks on the rim of Endeavour Crater.
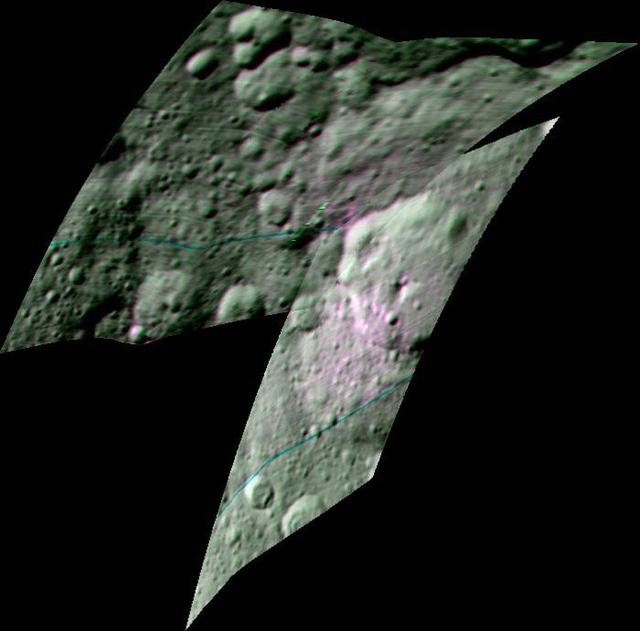
This enhanced color composite image from Dawn's visible and infrared mapping spectrometer shows the area around Ernutet Crater on Ceres. The instrument detected the evidence of organic materials in this area, as reported in a 2017 study in the journal Science. In this view, areas that appear pink with respect to the background appear to be rich in organics, and green areas are where organic material appears to be less abundant. Light with a wavelength of 2000 nanometers is shown in blue, 3400 nanometers is shown in green and 1700 nanometers is shown in red. http://photojournal.jpl.nasa.gov/catalog/PIA21420
NASA's Mars Reconnaissance Orbiter captured this image of a meteoroid impact that was first detected by the agency's InSight lander using its seismometer. This crater was formed on Feb. 18, 2021. MRO's High Resolution Imaging Science Experiment (HiRISE) camera captured this scene in color. The ground is not actually blue; this enhanced-color image highlights certain hues in the scene to make details more visible to the human eye – in this case, dust and soil disturbed by the impact. https://photojournal.jpl.nasa.gov/catalog/PIA25409
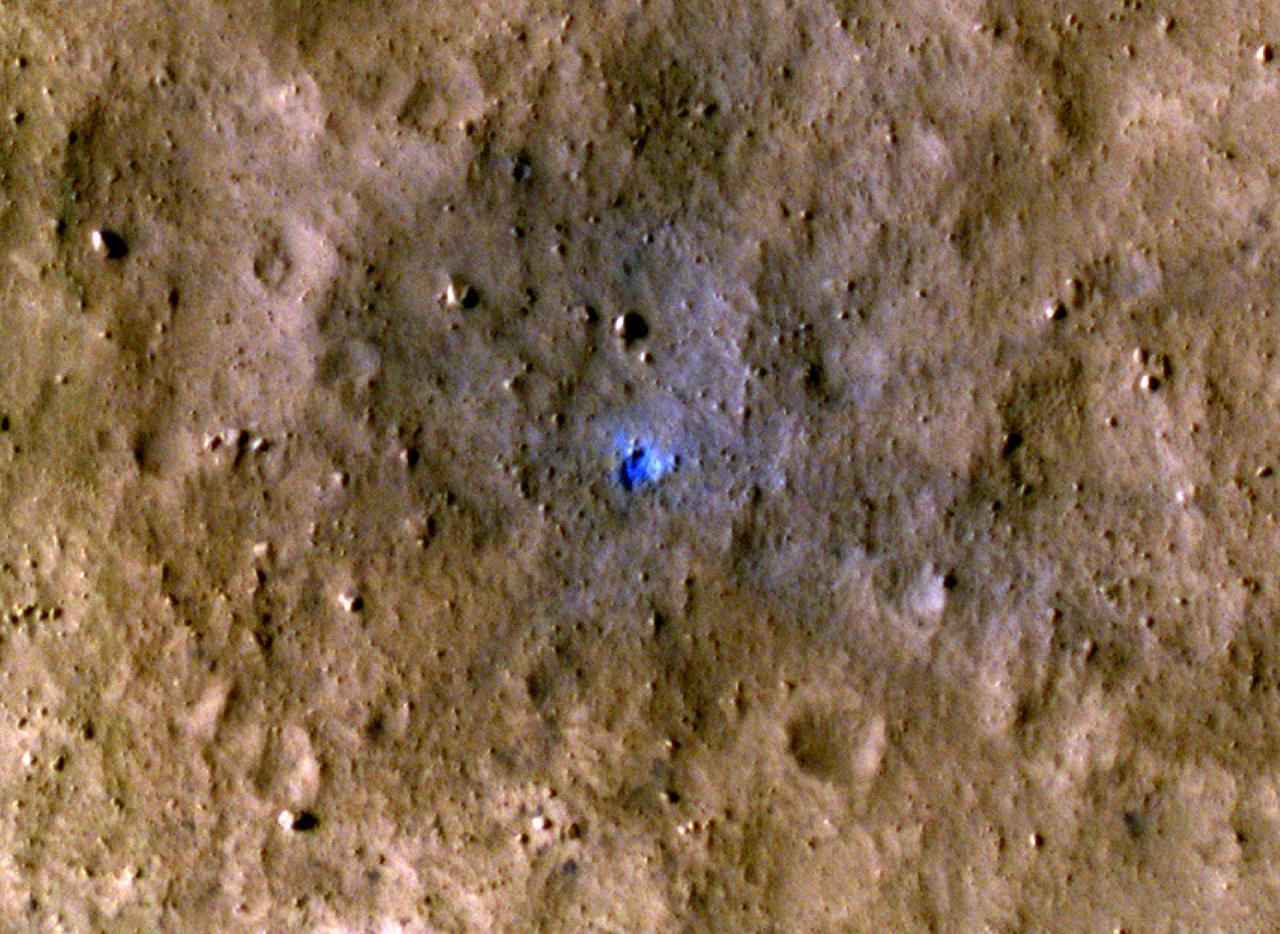
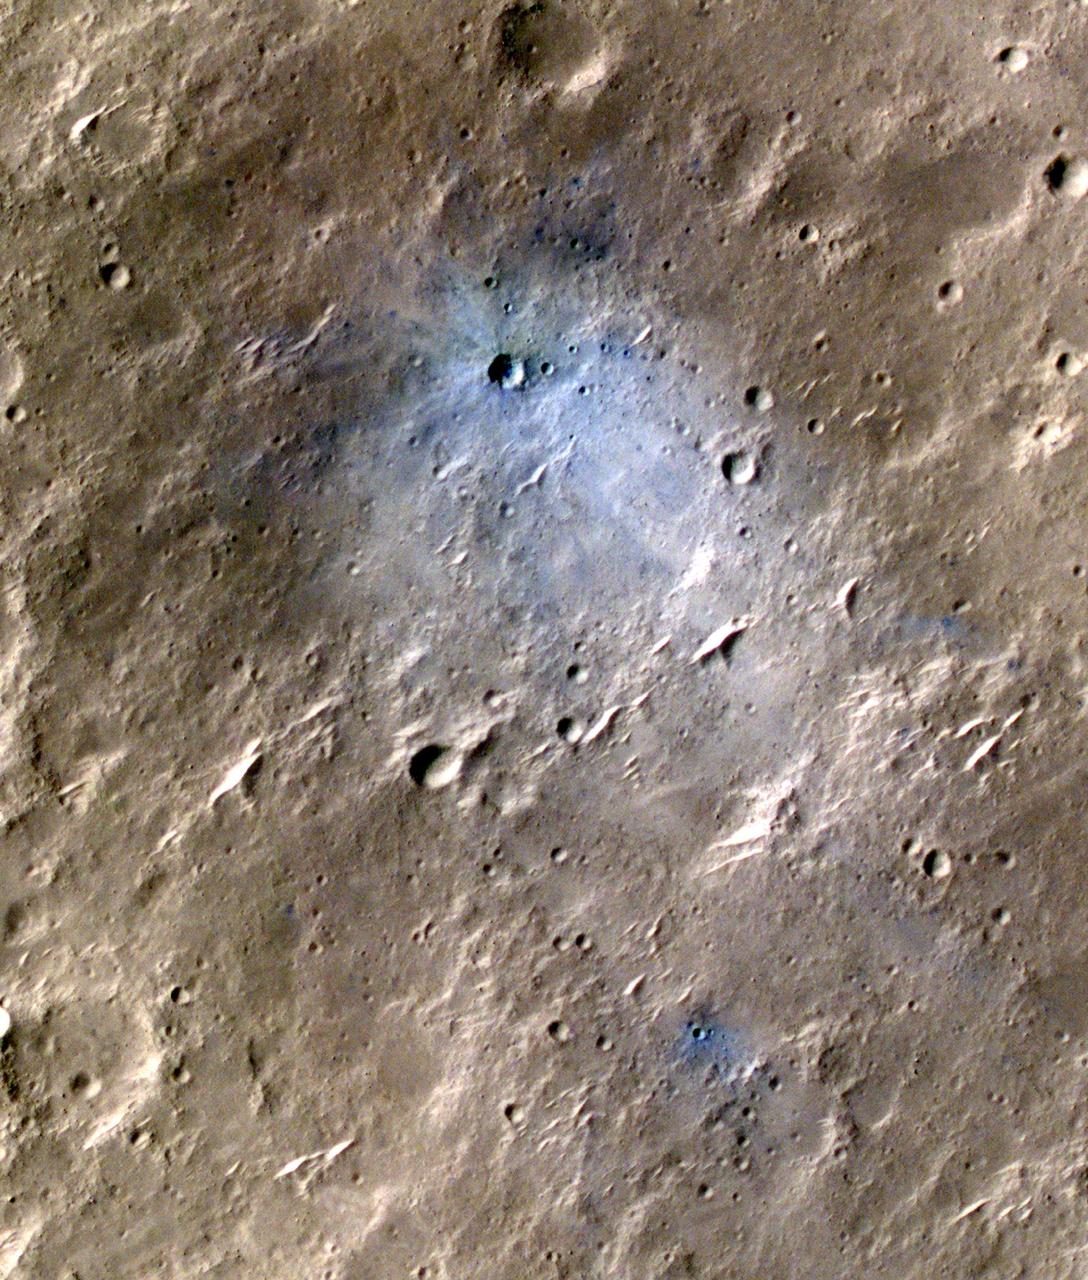
NASA's Mars Reconnaissance Orbiter captured this image of a meteoroid impact that was first detected by the agency's InSight lander using its seismometer. This crater was formed on Aug. 30, 2021. MRO's High Resolution Imaging Science Experiment (HiRISE) camera captured this scene in color. The ground is not actually blue; this enhanced-color image highlights certain hues in the scene to make details more visible to the human eye – in this case, dust and soil disturbed by the impact. https://photojournal.jpl.nasa.gov/catalog/PIA25411
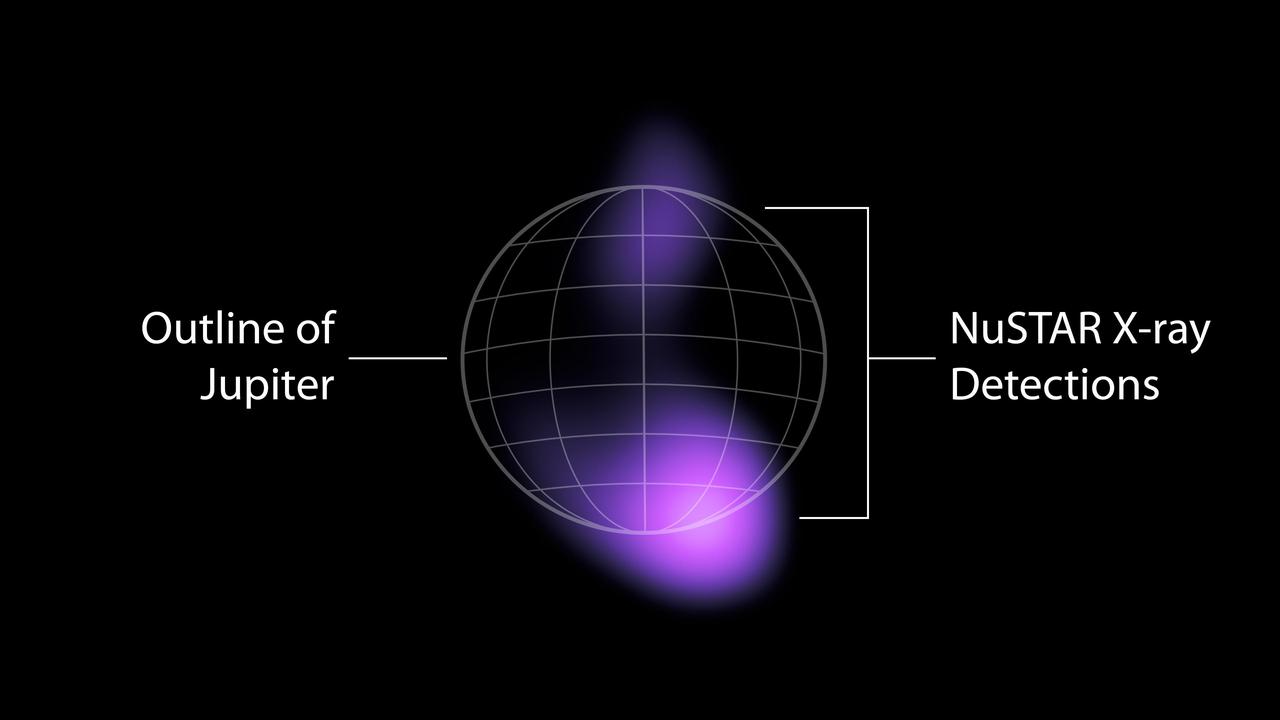
The areas where high-energy X-rays were detected by NASA's NuSTAR (Nuclear Spectroscopic Telescope Array) from the auroras near Jupiter's north and south poles are shown in purple in this graphic. The emissions are the highest-energy light ever seen at Jupiter and the highest-energy light ever detected from a planet in our solar system other than Earth. The light comes from accelerated electrons colliding with the atmosphere. NuSTAR cannot pinpoint the source of the light with high precision, but can only find that it is coming from somewhere in the purple-colored regions. X-rays are a form of light, but with much higher energies and shorter wavelengths than the visible light human eyes can see. NASA's Chandra X-ray Observatory and the ESA (European Space Agency) XMM-Newton observatory have both studied X-rays from Jupiter's auroras – produced when volcanos on Jupiter's moon Io shower the planet with ions (atoms stripped of their electrons). Jupiter's powerful magnetic field accelerates the particles and funnels them toward the planet's poles, where they collide with its atmosphere and release energy in the form of light, including X-rays. Electrons from Io are also accelerated by the planet's magnetic field, according to observations by the Jovian Auroral Distributions Experiment (JADE) and Jupiter Energetic-particle Detector Instrument (JEDI) on NASA's Juno spacecraft, which arrived at Jupiter in 2016. Researchers suspected that those electrons should produce even higher-energy X-rays than those observed by Chandra and XMM-Newton, and the NuSTAR detections confirm that hypothesis. The high-energy X-rays are relatively faint, and required a week of NuSTAR observations to detect. Scientists have detected X-rays in Earth's auroras with even higher energies than what NuSTAR saw at Jupiter, but those emissions can only be spotted by small satellites or high-altitude balloons that get extremely close to the locations in the atmosphere that generate those X-rays. https://photojournal.jpl.nasa.gov/catalog/PIA25131
NASA's Mars Reconnaissance Orbiter captured this image of a meteoroid impact that was later associated with a seismic event detected by the agency's InSight lander using its seismometer. This crater was formed on May 27, 2020. MRO's Context Camera originally located the impact. Then, the spacecraft's High Resolution Imaging Science Experiment (HiRISE) camera captured this scene in color. The ground is not actually blue; this enhanced-color image highlights certain hues in the scene to make details more visible to the human eye – in this case, dust and soil disturbed by the impact. https://photojournal.jpl.nasa.gov/catalog/PIA25410
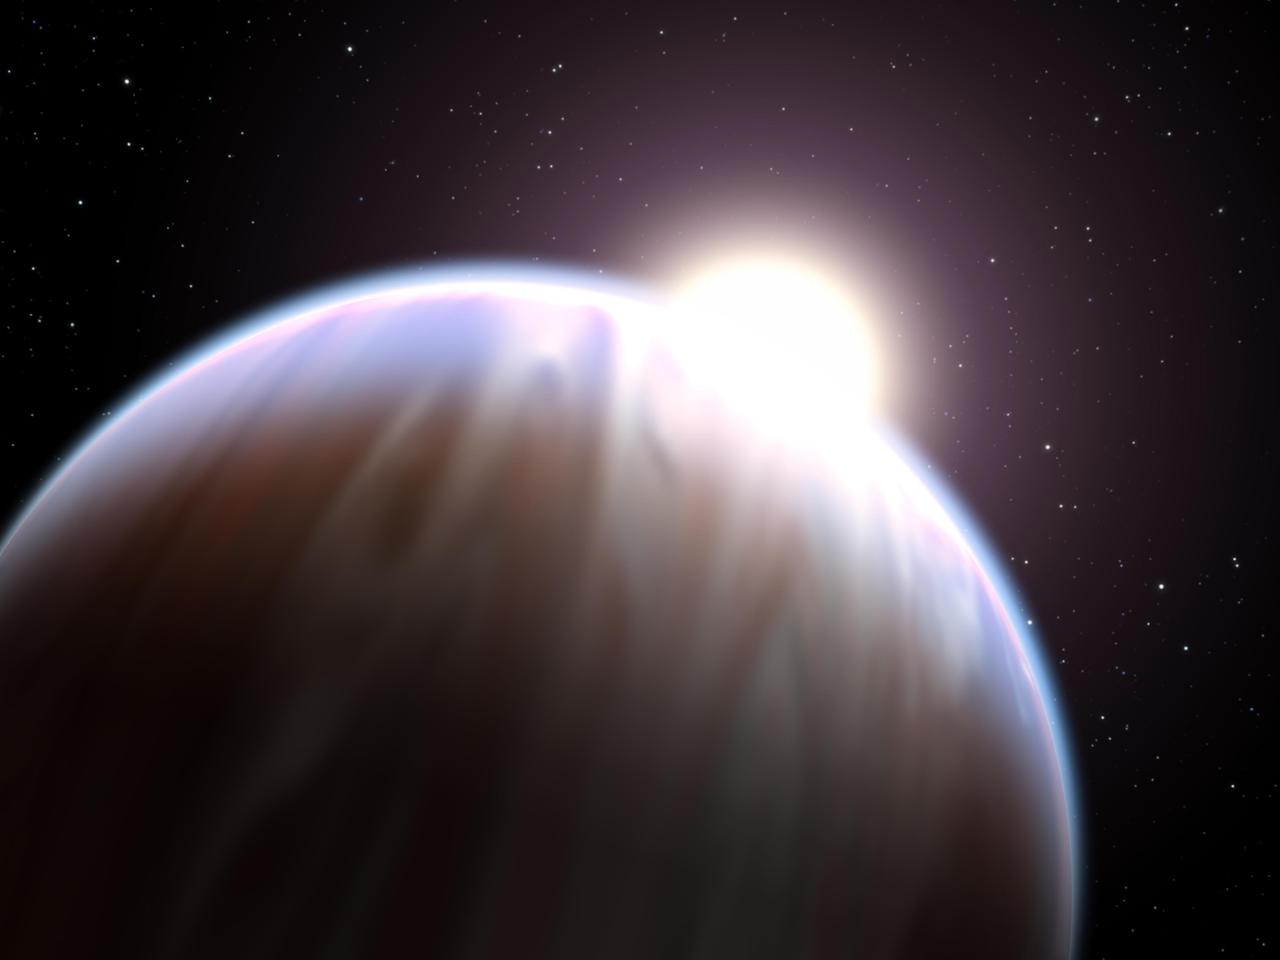
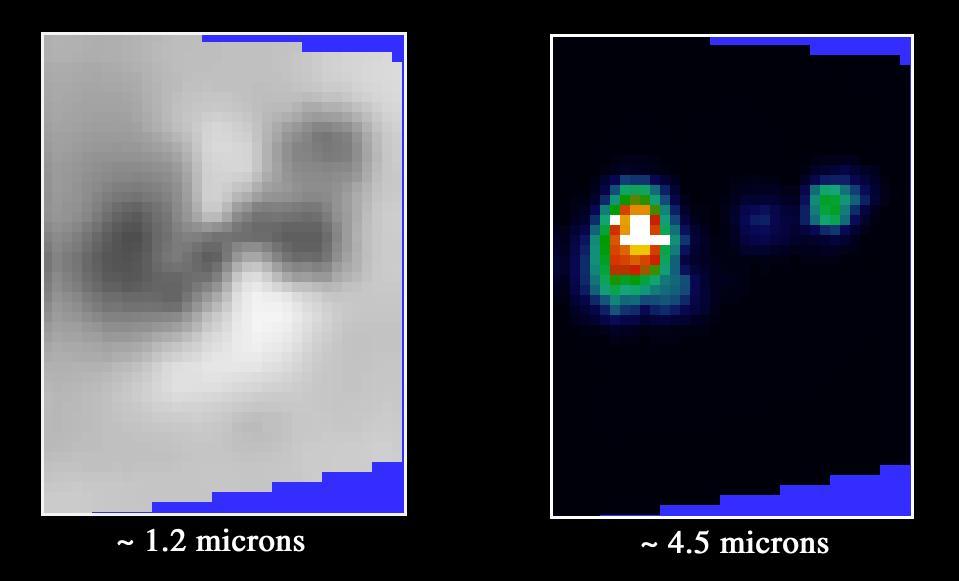
A team of astronomers has made the first detection ever of an organic molecule in the atmosphere of a Jupiter-sized planet orbiting another star. The breakthrough was made with NASA Hubble Space Telescope.
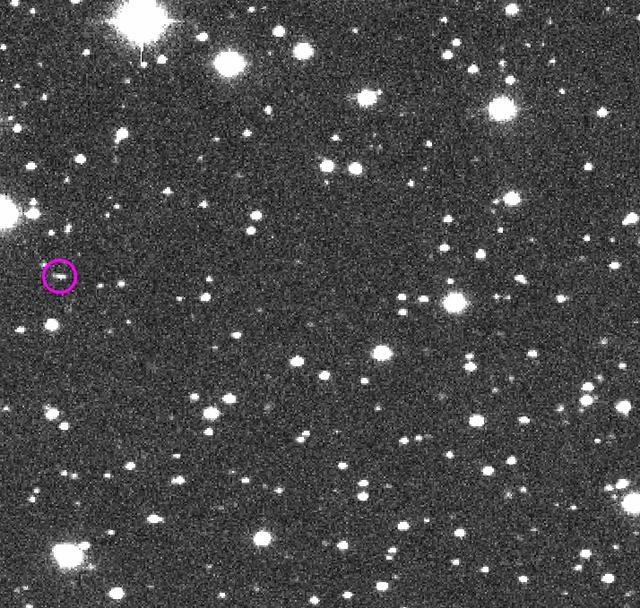
This frame from a sequence of four images taken during one night of observation by NASA's Catalina Sky Survey near Tucson, Arizona, shows the speck of light that moves relative to the background stars is a small asteroid that was, at the time, about as far away as the moon. This asteroid, named 2014 AA, was the second one ever detected on course to impact Earth. It was estimated to be about 6 to 10 feet (2 to 3 meters) in diameter, and it harmlessly hit Earth's atmosphere over the Atlantic Ocean about 20 hours after its discovery in these images. The images were taken Jan. 1, 2014. They provide an example of how asteroids are typically discovered by detection of their motion relative to background stars. An animation is available at https://photojournal.jpl.nasa.gov/catalog/PIA21712
Pegasus-1, meteoroid detection satellite, installed on Saturn I (SA-9 mission) S-IV stage, January 13, 1965. The satellite was used to obtain data on frequency and penetration of the potentially hazardous micrometeoroids in low Earth orbits and to relay the information back to Earth. SA-9 was launched on February 16, 1965 and the Pegasus-1 satellite was the first operational payload for Saturn I.
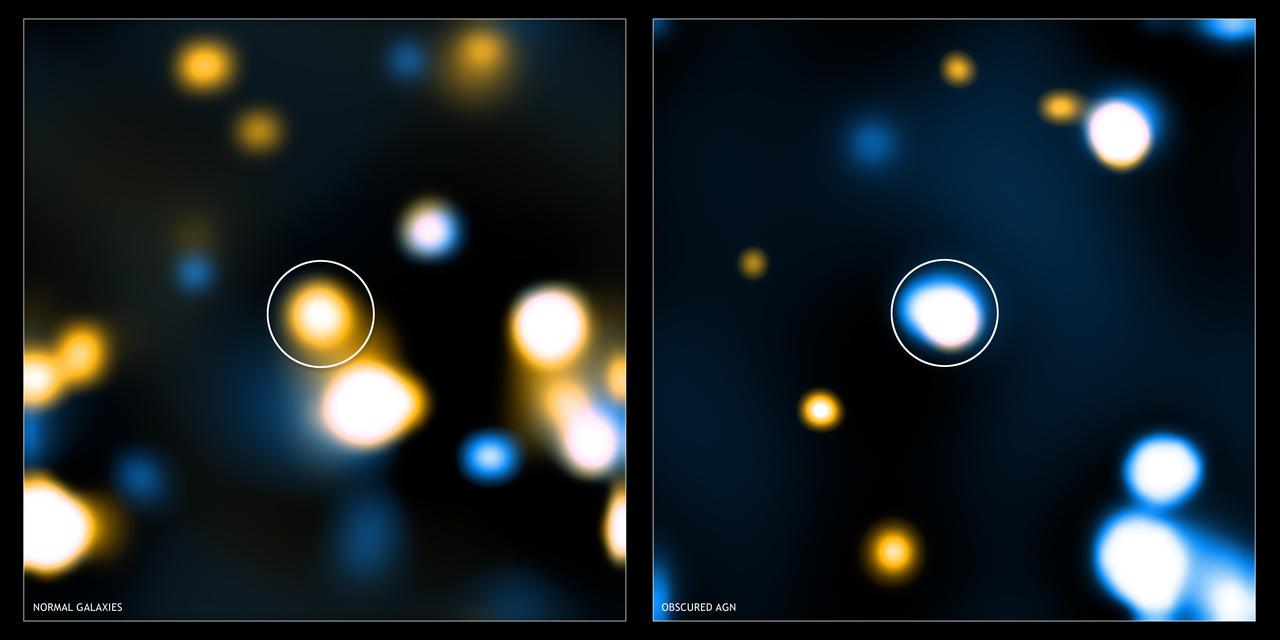
These two images show tacked Chandra images for two different classes of distant, massive galaxy detected with NASA Spitzer. Image stacking is a procedure used to detect emission from objects that is too faint to be detected in single images.
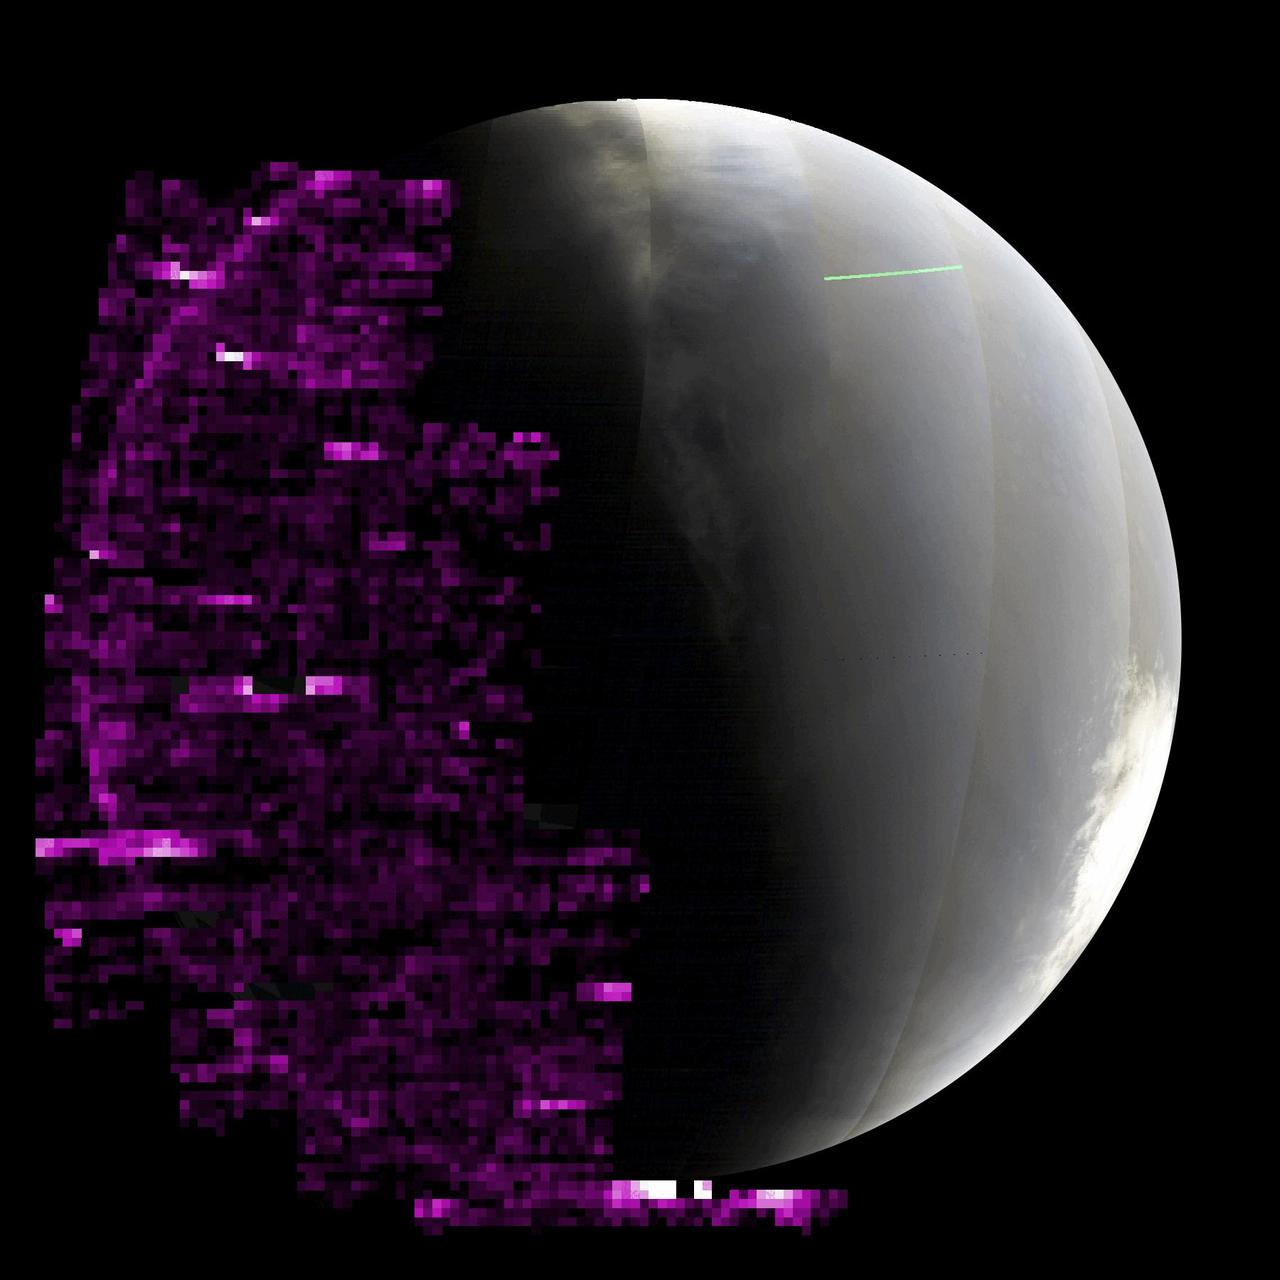
The purple color in this animated GIF shows auroras across Mars' nightside as detected by the Imaging Ultraviolet Spectrograph instrument aboard NASA's MAVEN (Mars Atmosphere and Volatile EvolutioN) orbiter. The brighter the purple, the more auroras were present. Taken as waves of energetic particles from a solar storm were arriving at Mars, the sequence pauses at the end, when the wave of the most energetic particles arrived and overwhelmed the instrument with noise. MAVEN took these images between May 14 and 20, 2024, as the spacecraft orbited below Mars, looking up at the nightside of the planet (Mars' south pole can be seen on the right, in full sunlight). Animation available at https://photojournal.jpl.nasa.gov/catalog/PIA26304
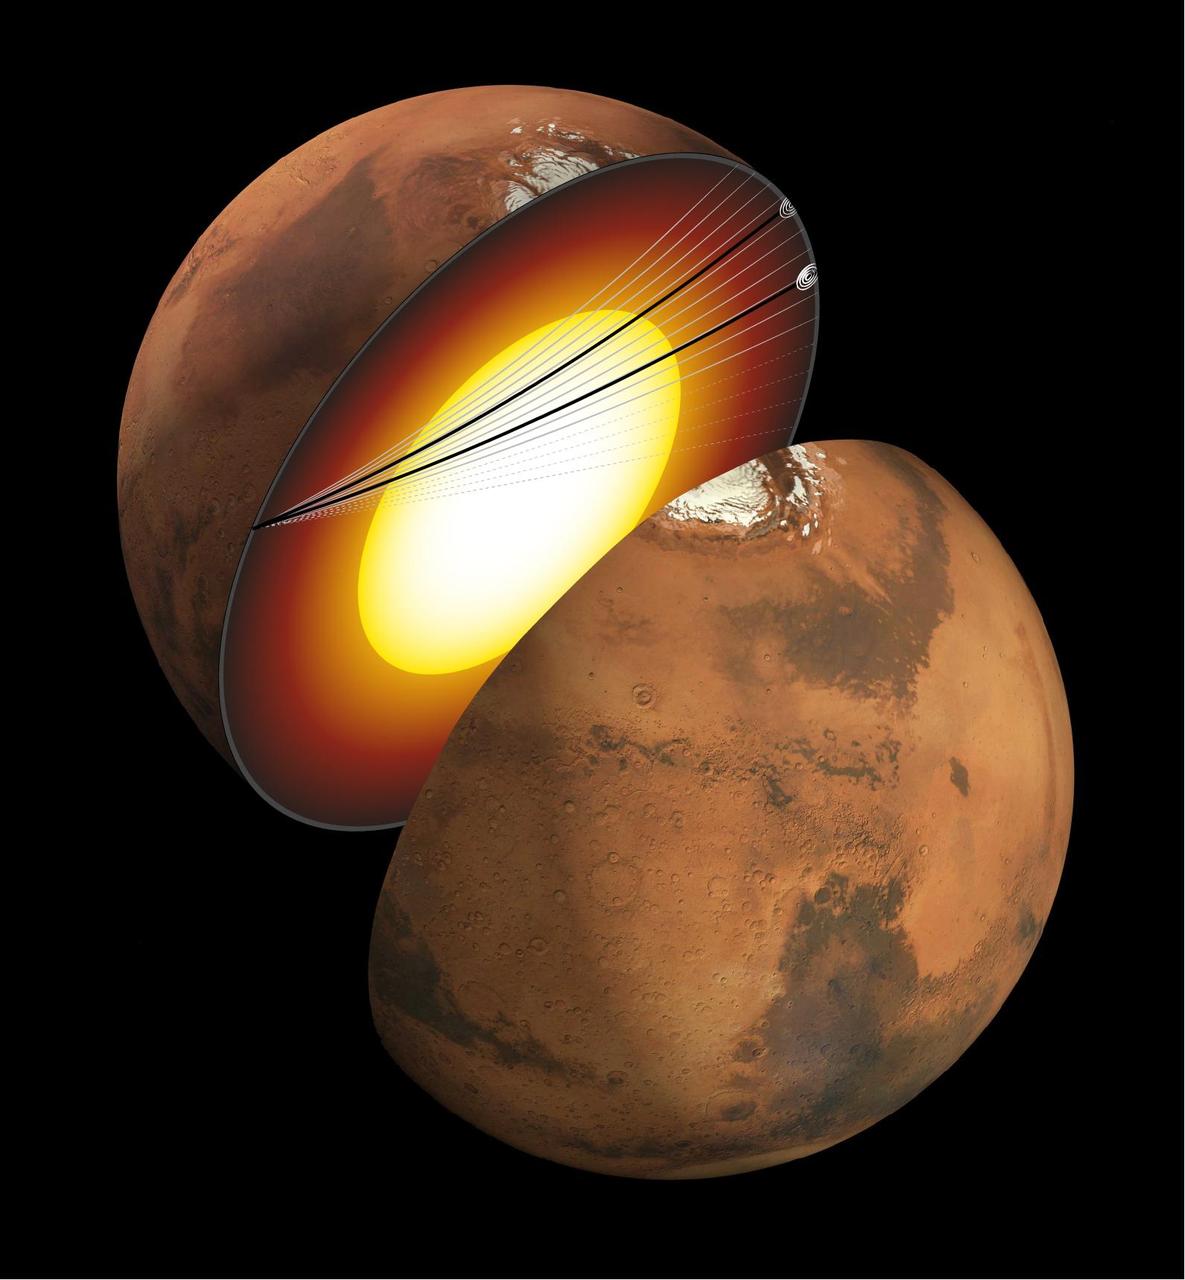
This artist's concept shows a cutaway of Mars along with the paths of seismic waves from two separate quakes in 2021. These seismic waves, detected by NASA's InSight mission, were the first ever identified to enter another planet's core. InSight's seismometer allowed scientists to study these waves and gain an unprecedented look at the Martian core. The quakes were detailed in a paper published April 24, 2023, in the Proceedings of the National Academies of Sciences. Occurring on Aug. 25 and Sept. 18, 2021, the two temblors were the first identified by the InSight team to have originated on the opposite side of the planet from the lander – so-called farside quakes. The distance proved crucial: The farther a quake happens from InSight, the deeper into the planet its seismic waves can travel before being detected. https://photojournal.jpl.nasa.gov/catalog/PIA25827
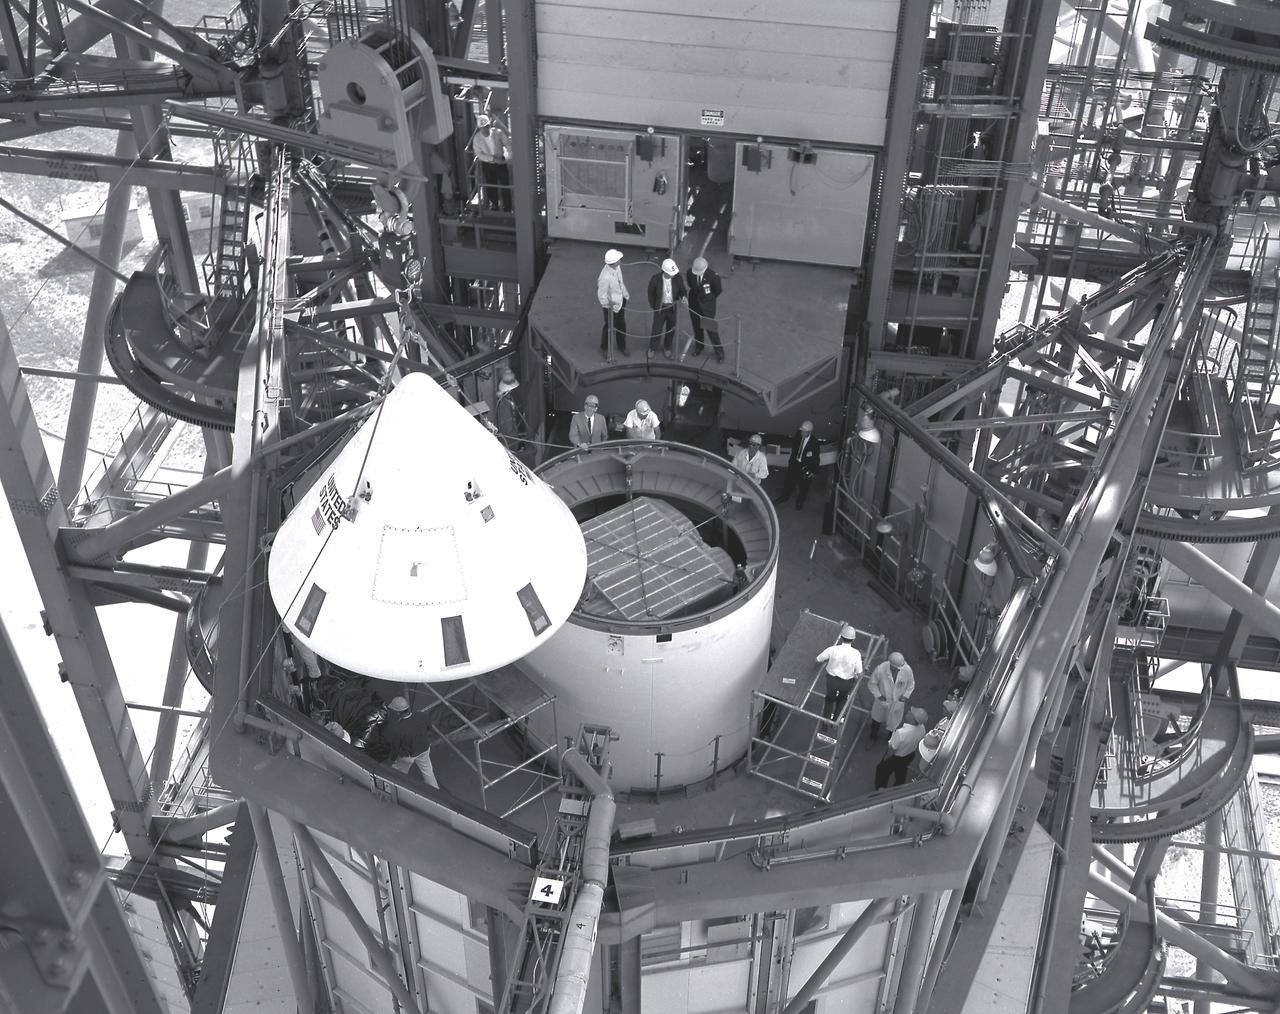
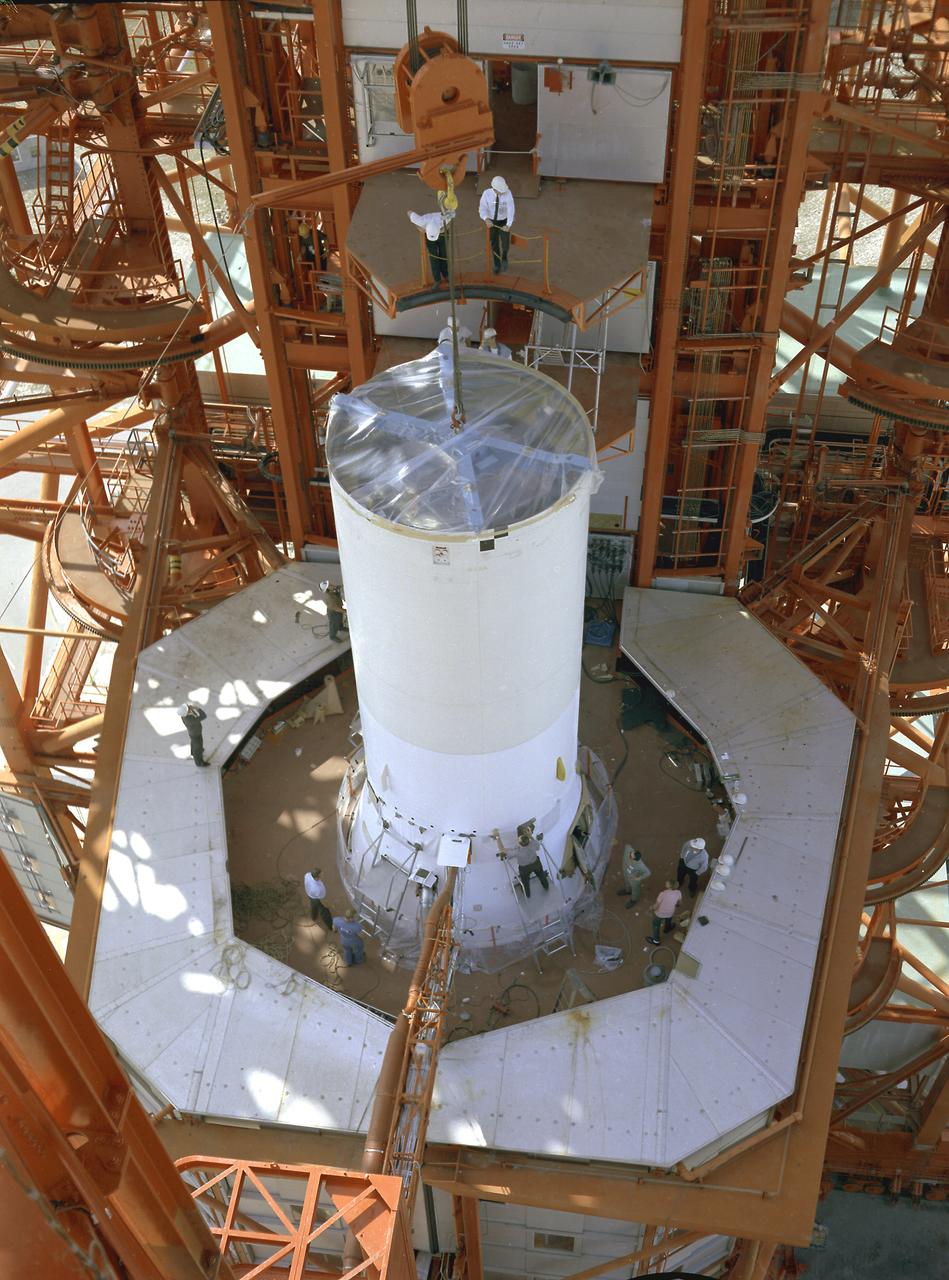
In this photograph, the Pegasus, meteoroid detection satellite is installed in its specially modified Apollo service module atop the S-IV stage (second stage) of a Saturn I vehicle for the SA-9 mission at Cape Kennedy. Personnel in the service structure moved the boilerplate Apollo command module into place to cap the vehicle. The command and service modules, visible here, were jettisoned into orbit to free the Pegasus for wing deployment. The satellite was used to obtain data on frequency and penetration of the potentially hazardous micrometeoroids in low Earth orbits and to relay the information back to Earth. The SA-9 was launched on February 16, 1965.
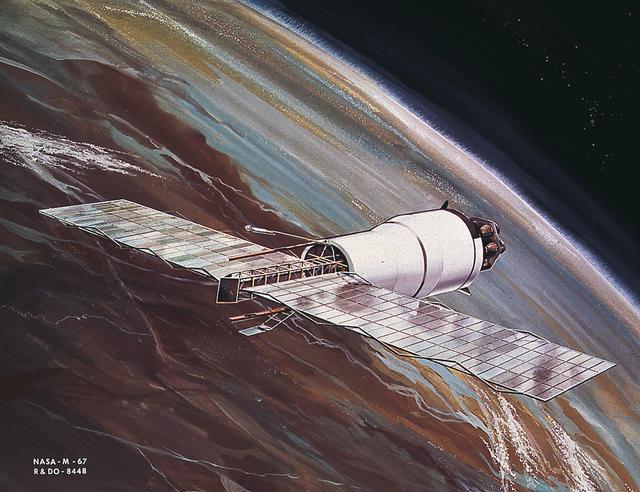
This image is an artist's conception of the Pegasus, meteoroid detection satellite, in orbit with meteoroid detector extended. The satellite, a payload for Saturn I SA-8, SA-9, and SA-10 missions, was used to obtain data on frequency and penetration of the potentially hazardous micrometeoroids in low Earth orbits and to relay the information back to Earth.
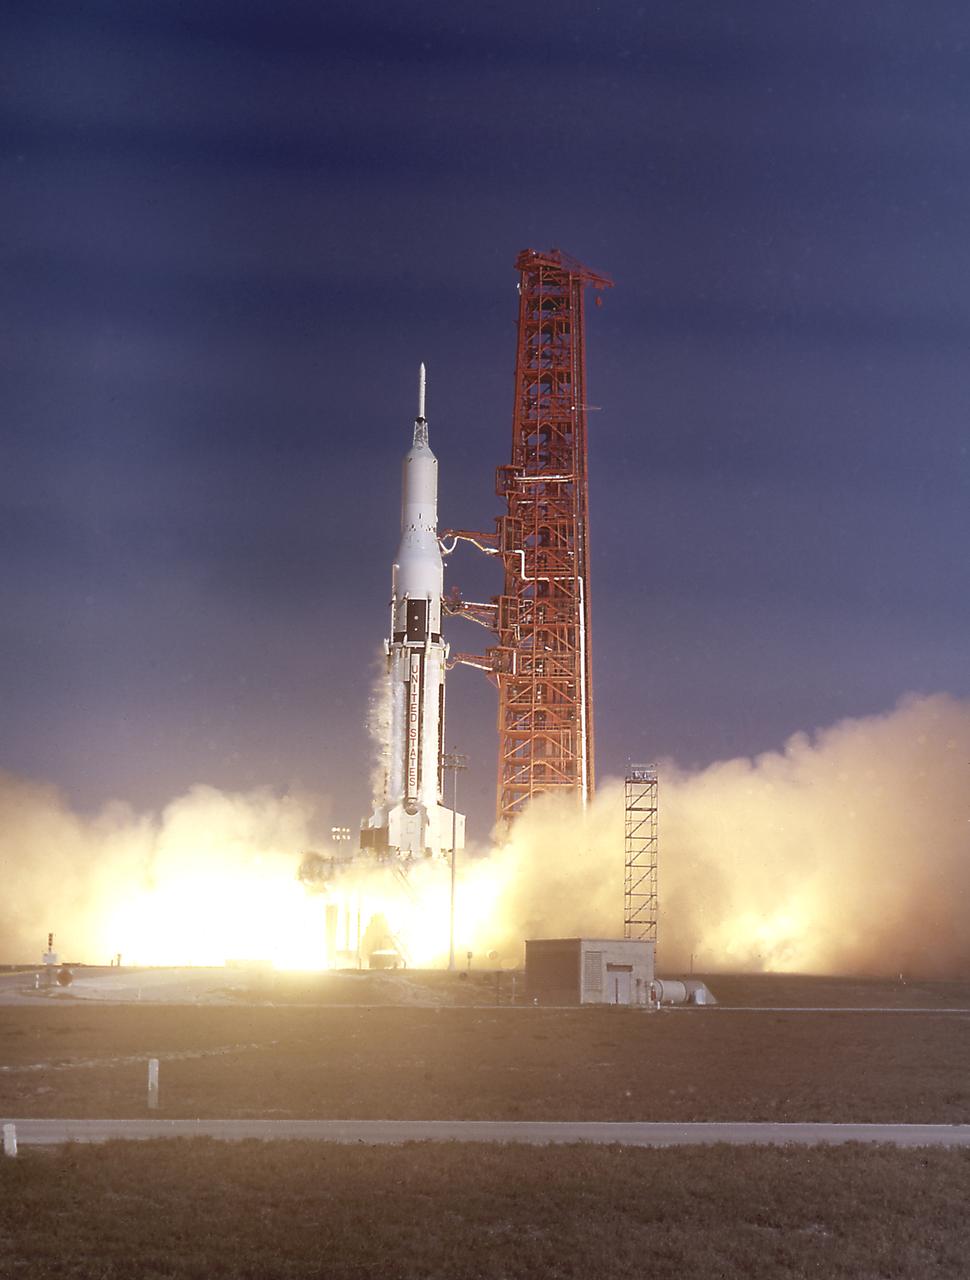
The SA-9 (Saturn I Block II), the eighth Saturn I flight, lifted off on February 16, 1965. This was the first Saturn with an operational payload, the Pegasus I meteoroid detection satellite. SA-9 successfully deployed the Pegasus I, NASA's largest unmarned instrumented satellite, into near Earth orbit.
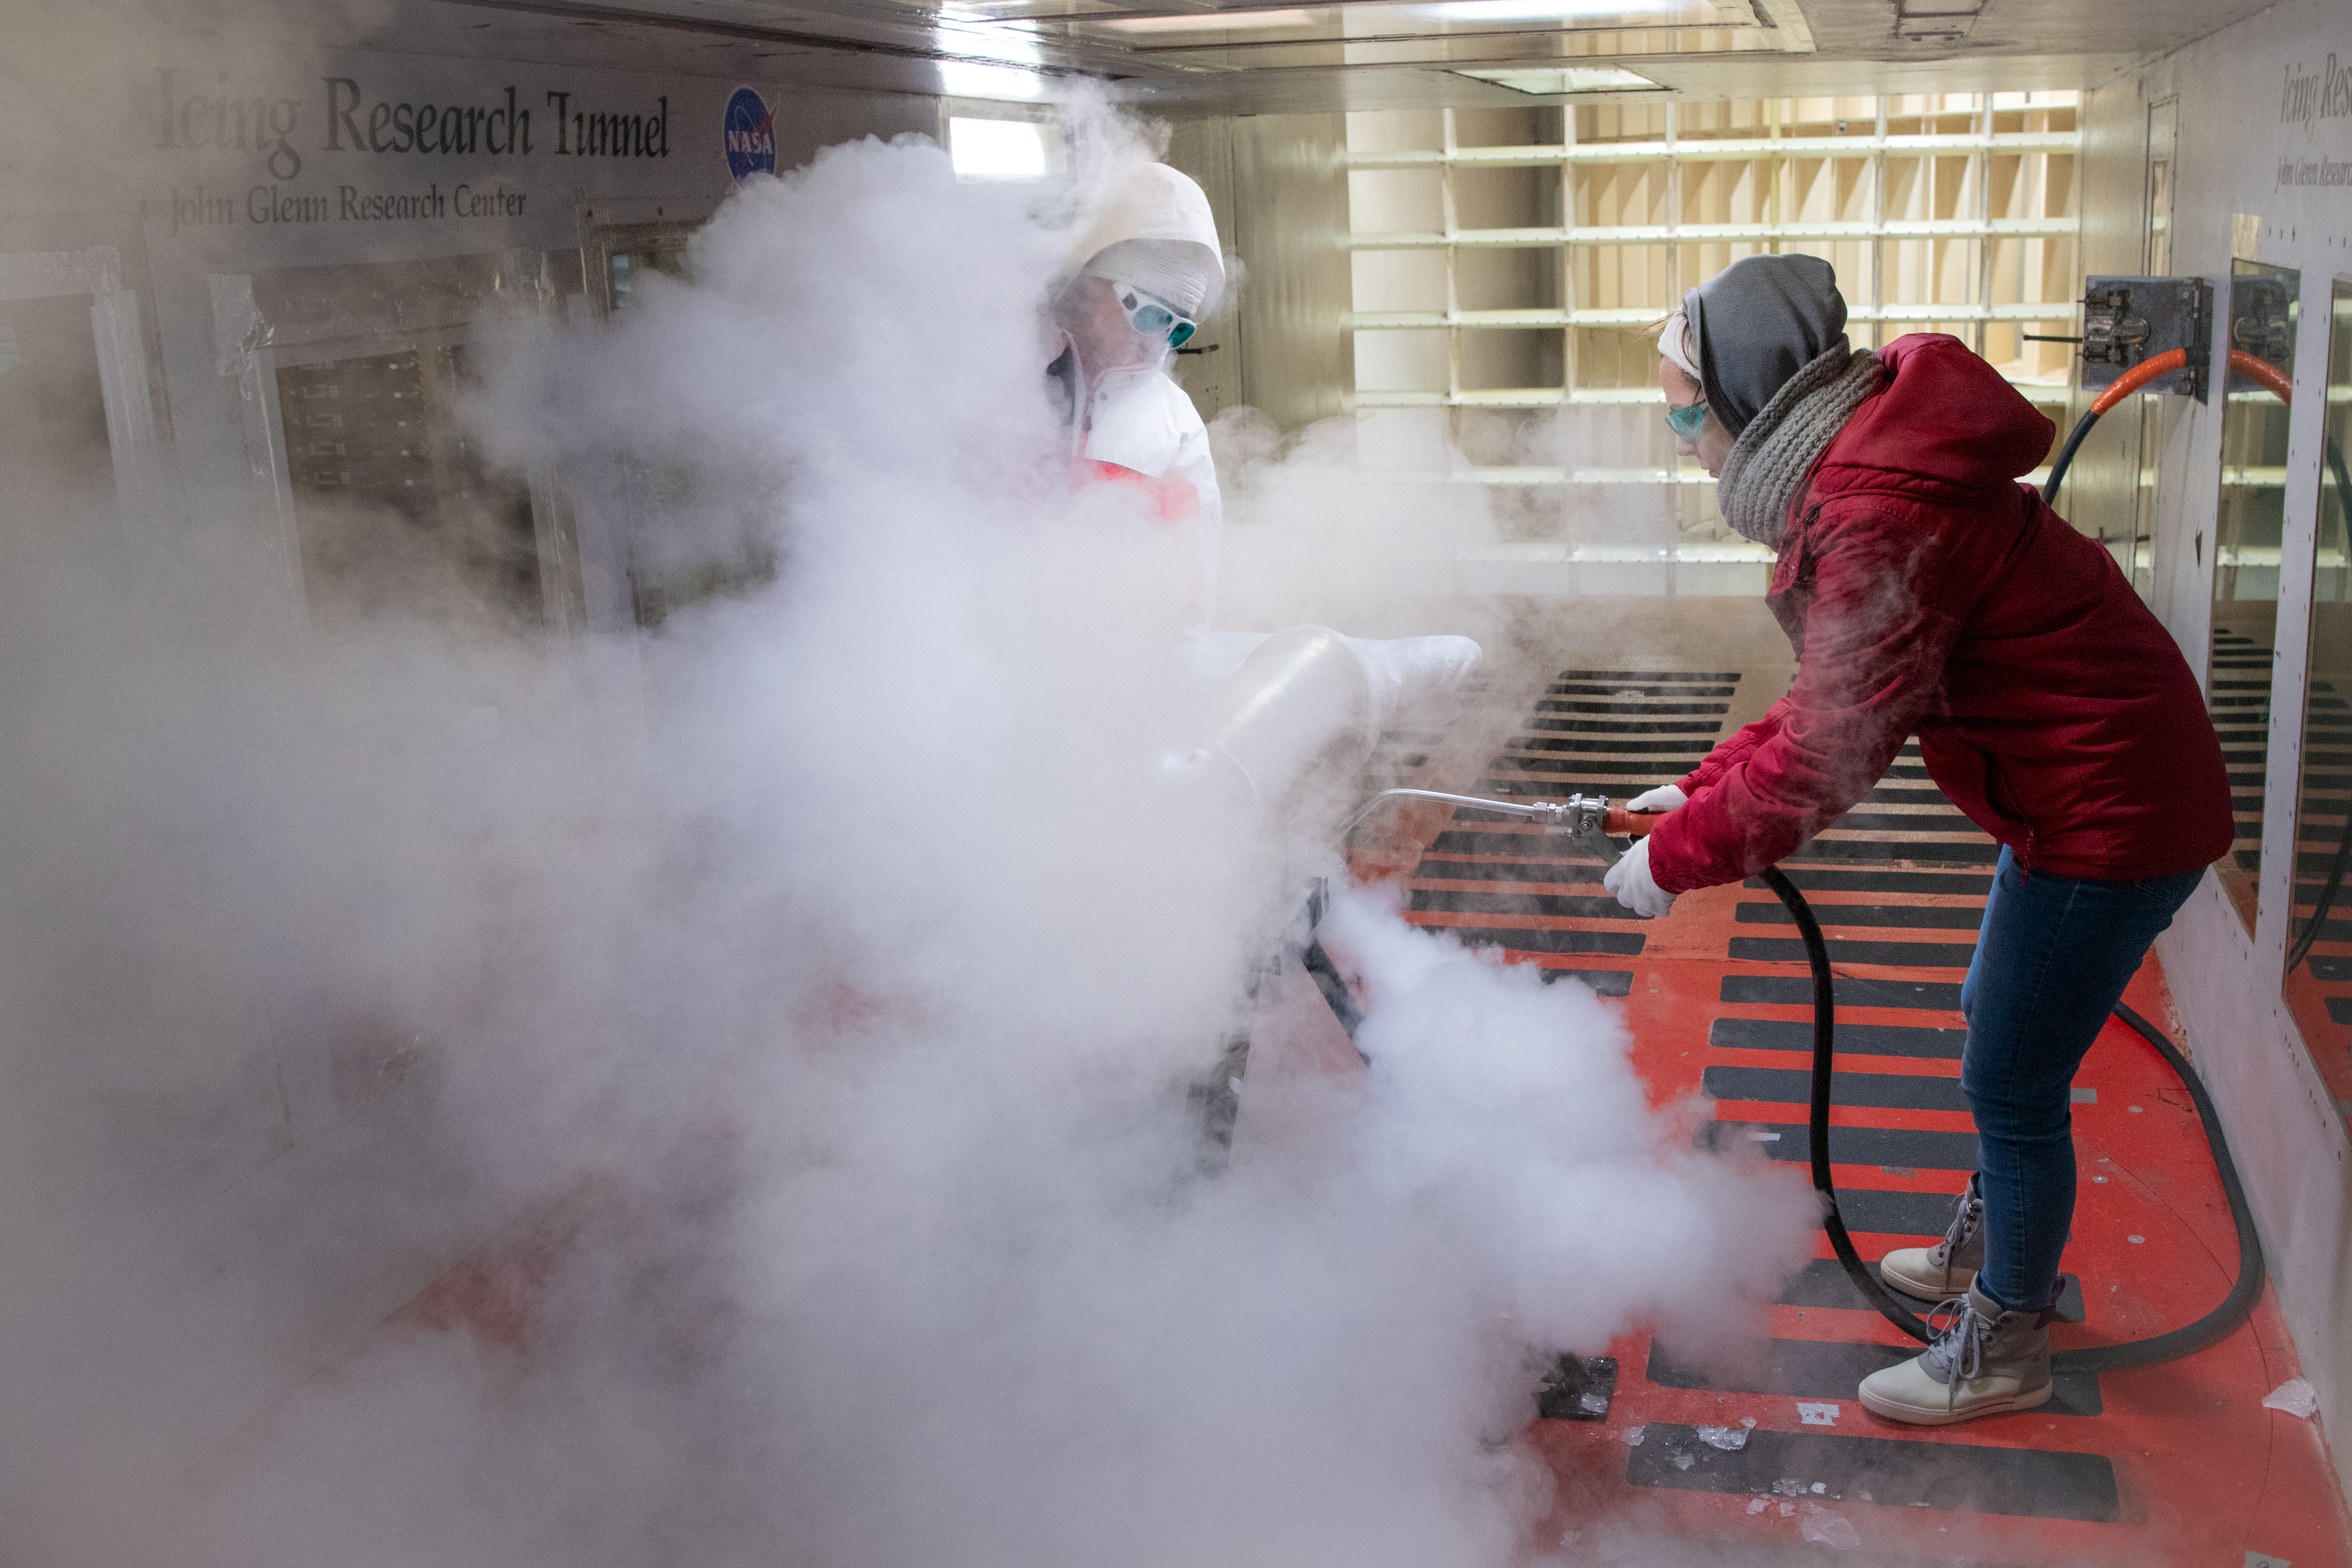
Test engineers clean the ice cloud detection probe in the Icing Research Tunnel in between test runs. Steam is used to melt the accumulated ice on the detection probe. The test engineers need to wear goggles to protect them from the laser light that the probe emits. The laser detects water content and ice particles in the cloud that the wind tunnel produces. This process is done to calibrate the tunnel for research by characterizing the cloud flow.
The active volcano Prometheus on Jupiter moon Io was imaged by NASA Galileo spacecraft during the close flyby of Io on Oct.10, 1999. The spectrometer can detect active volcanoes on Io by measuring their heat in the near-infrared wavelengths.
Marjorie Sovinski looking for the presence of chromium, which would help confirm that the exterior of the film had a chromium conversion coating. PHOTO CREDIT: NASA/Debbie Mccallum
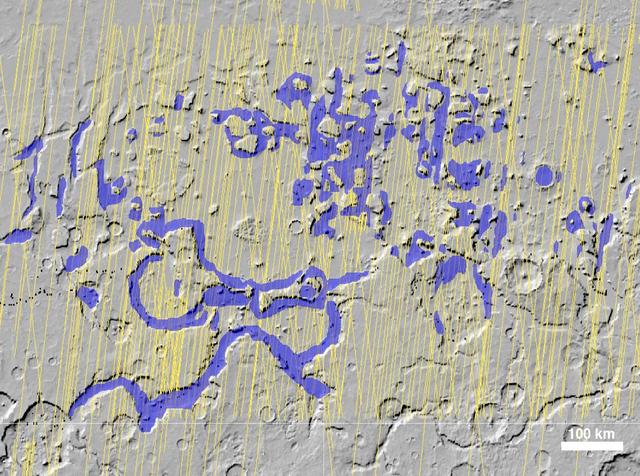
NASA Mars Reconnaissance Orbiter has detected widespread deposits of glacial ice in the mid-latitudes of Mars. This map of a region known as Deuteronilus Mensae, in the northern hemisphere, shows locations of the detected ice deposits in blue.
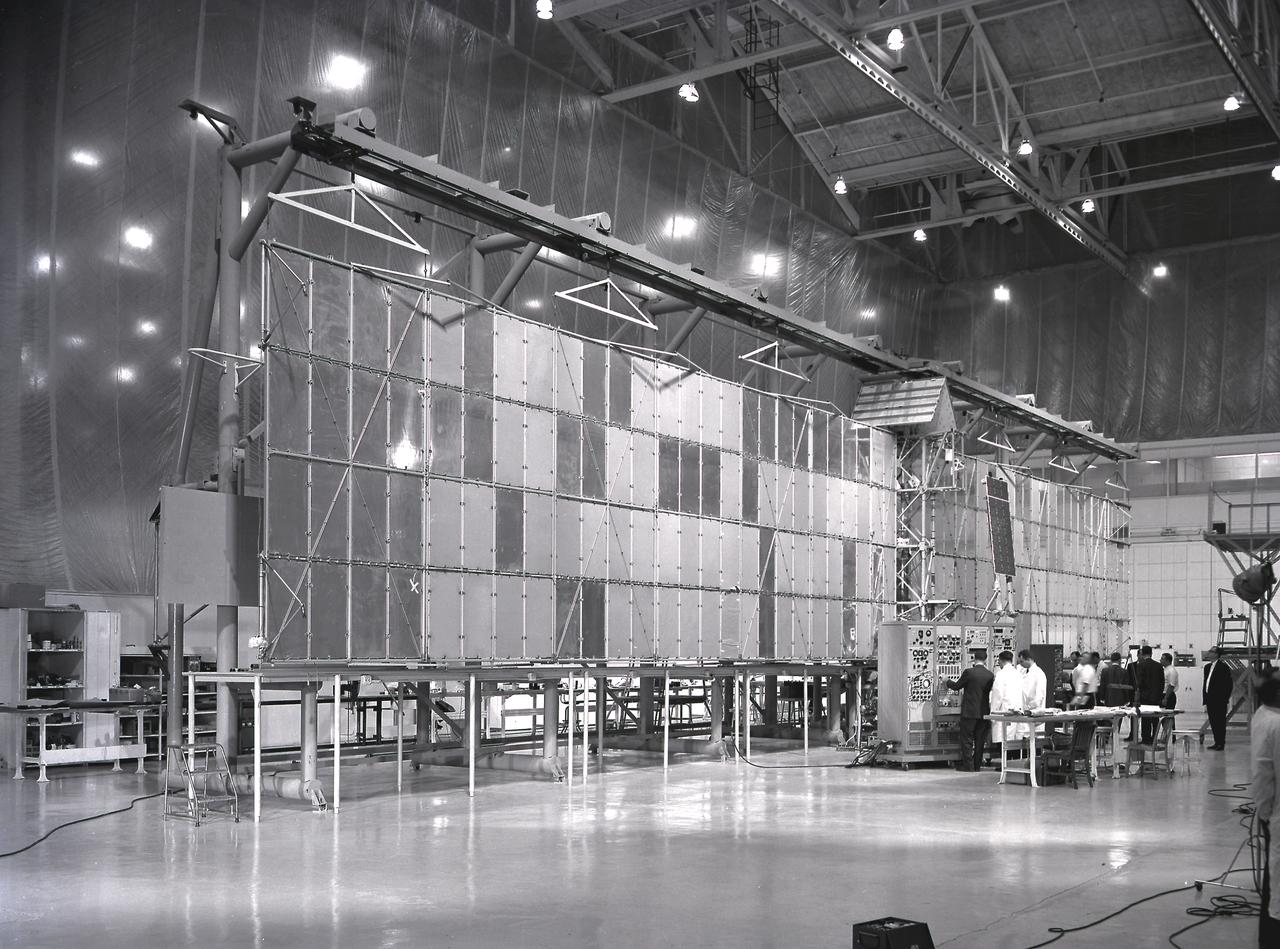
Fairchild technicians check out the extended Pegasus meteoroid detection surface. The Pegasus was developed by Fairchild Stratos Corporation, Hagerstown, Maryland, for NASA through the Marshall Space Flight Center. Three Pegasus satellites were flown aboard Saturn I SA-8, SA-9, and SA-10 missions. After being placed into orbit around the Earth, the satellite unfolded a series of giant panels to form a pair of wings measuring 96 feet across. The purpose of the satellite was to electronically record the size and frequency of particles in space, and compare the performance of protected and unprotected solar cells as important new preliminaries to a marned flight to the Moon.

Taken in 1997, NASA Hubble Space Telescope, using visible light, detected clouds in the northern hemisphere of Uranus.
Calcium was detected in the near-Mercury exosphere by NASA MESSENGER spacecraft and has also been observed telescopically from Earth.
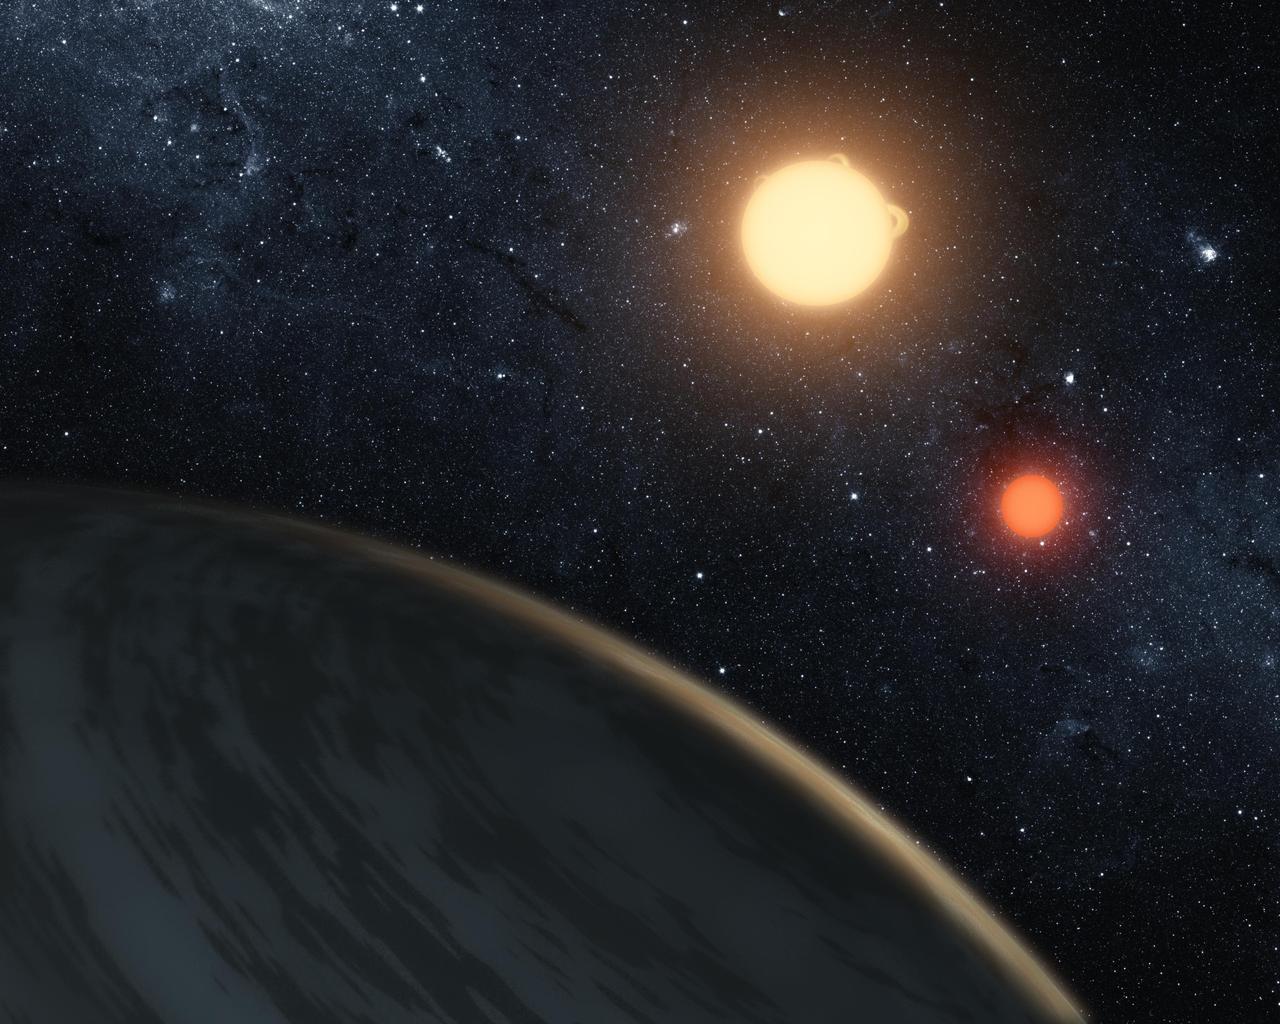
This artist image illustrates Kepler-16b, the first directly detected circumbinary planet, which is a planet that orbits two stars.
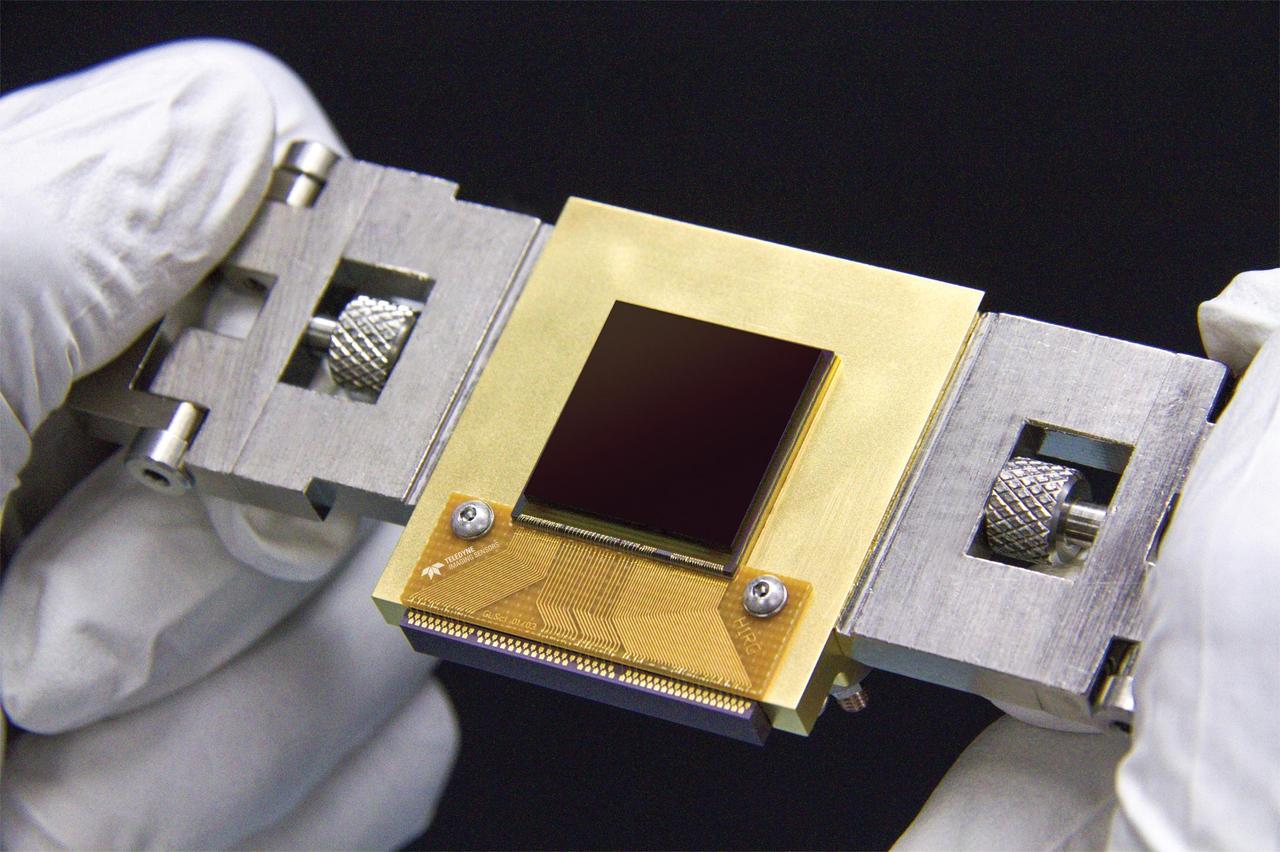
The NEOCam chip is the first megapixel sensor capable of detecting infrared wavelengths at temperatures achievable in deep space without refrigerators or cryogens.
The Thermal and Electrical Conductivity Probe on NASA Phoenix Mars Lander detected small and variable amounts of water in the Martian soil.
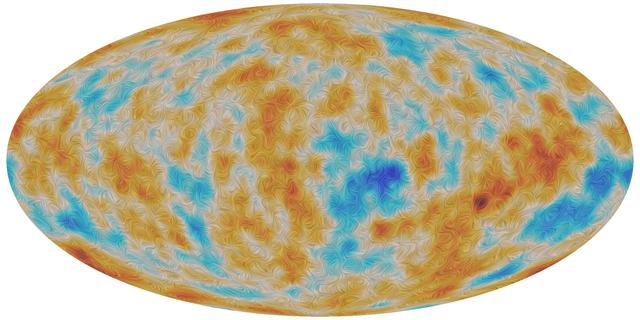
A visualization of the polarization of the Cosmic Microwave Background, or CMB, as detected by ESA Planck satellite over the entire sky.
NASA Spitzer Space Telescope has detected the building blocks of life in the distant universe, albeit in a violent milieu.
This computer graphic image shows three craters in the eastern Hellas region of Mars containing concealed glaciers detected by radar.
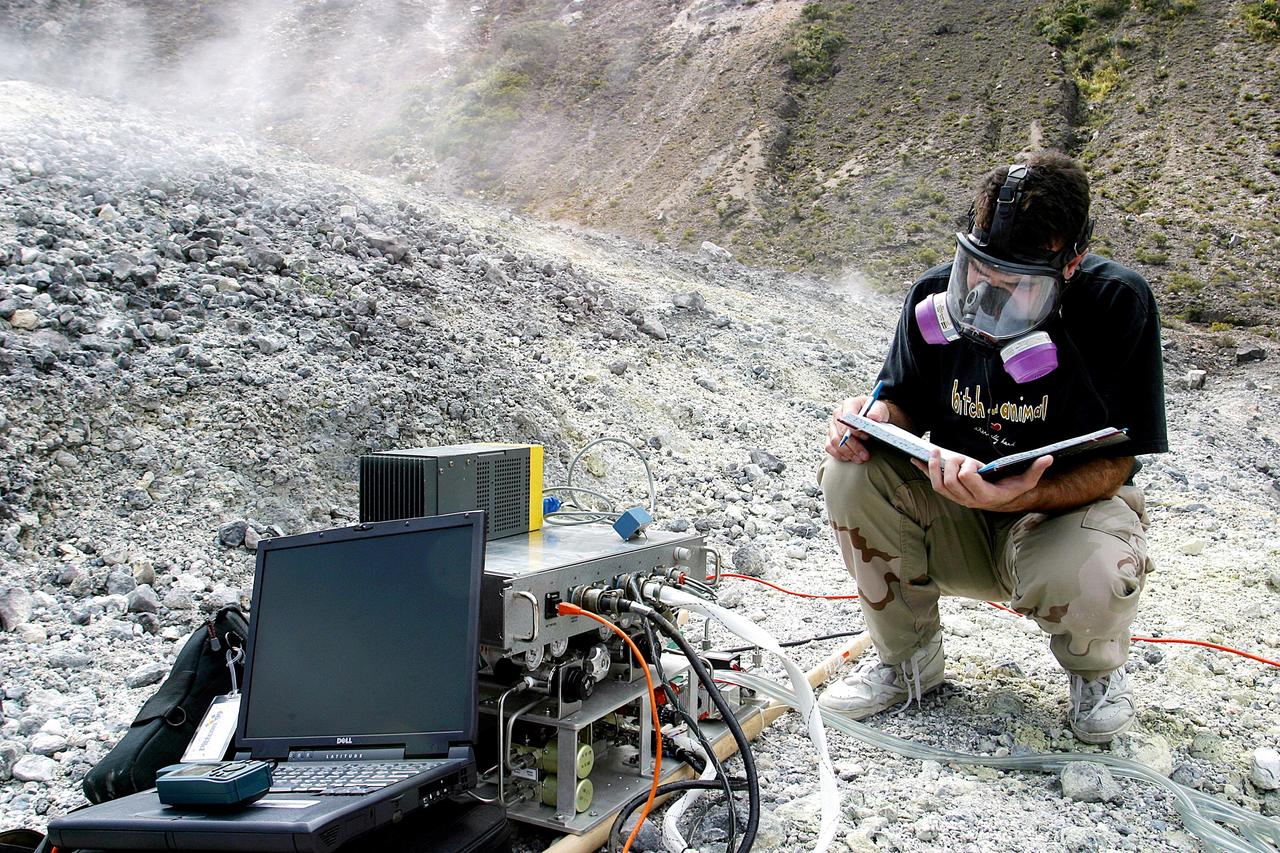
KENNEDY SPACE CENTER, FLA. - Dr. Richard Arkin records data as the hazardous gas detection system AVEMS is used to analyze the toxic gases produced by active vents, called fumaroles, in the Turrialba volcano in Costa Rica. He is using the Aircraft-based Volcanic Emission Mass Spectrometer (AVEMS) that determines the presence and concentration of various chemicals. The AVEMS system has been developed for use in the Space Shuttle program, to detect toxic gas leaks and emissions in the Shuttle’s aft compartment and the crew compartment.
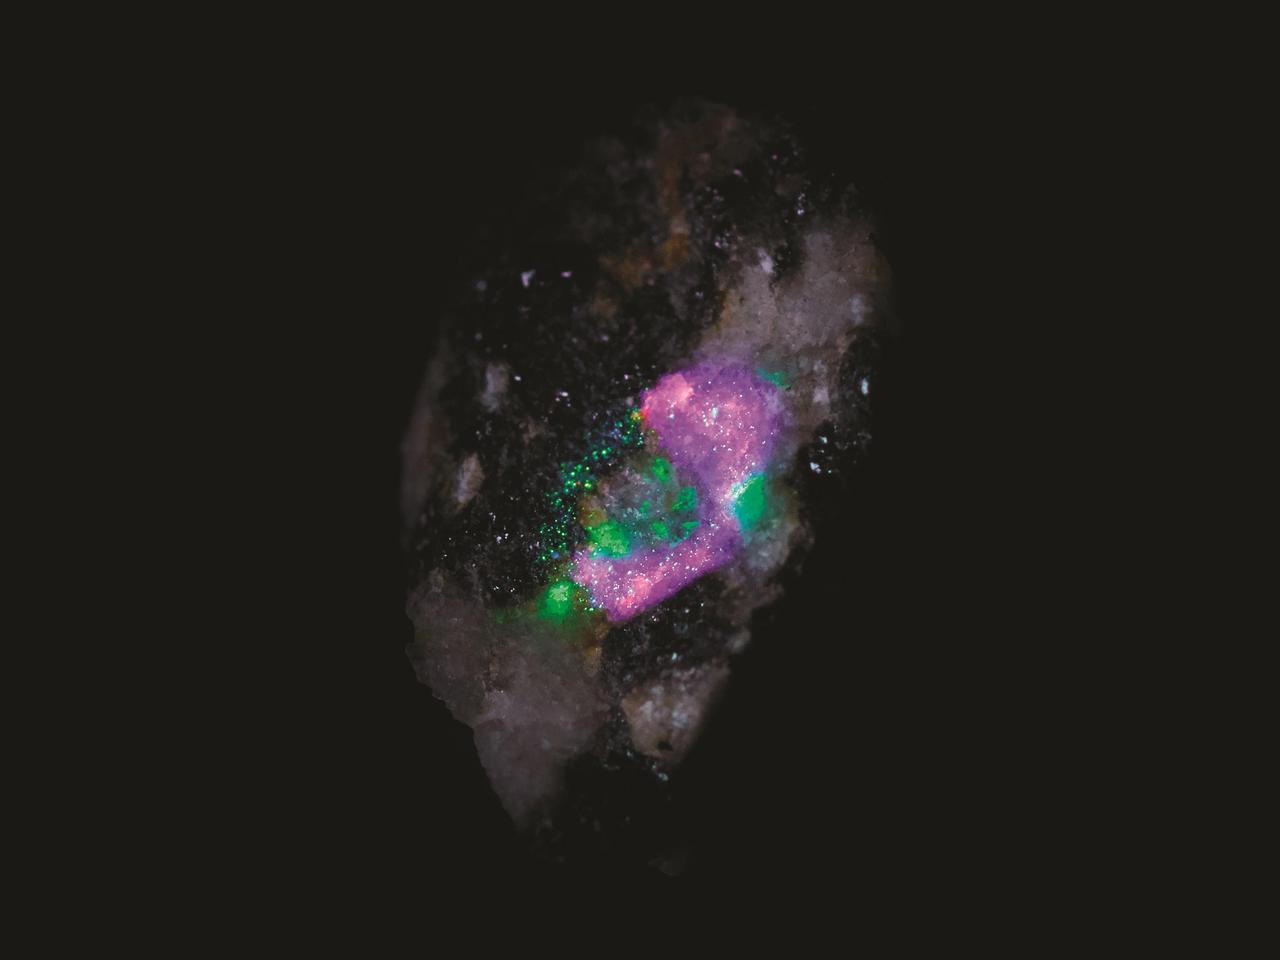
In this test image by SHERLOC (Scanning Habitable Environments with Raman & Luminescence for Organics & Chemicals), an instrument aboard NASA's Perseverance rover, each color represents a different mineral detected on a rock's surface. https://photojournal.jpl.nasa.gov/catalog/PIA23895
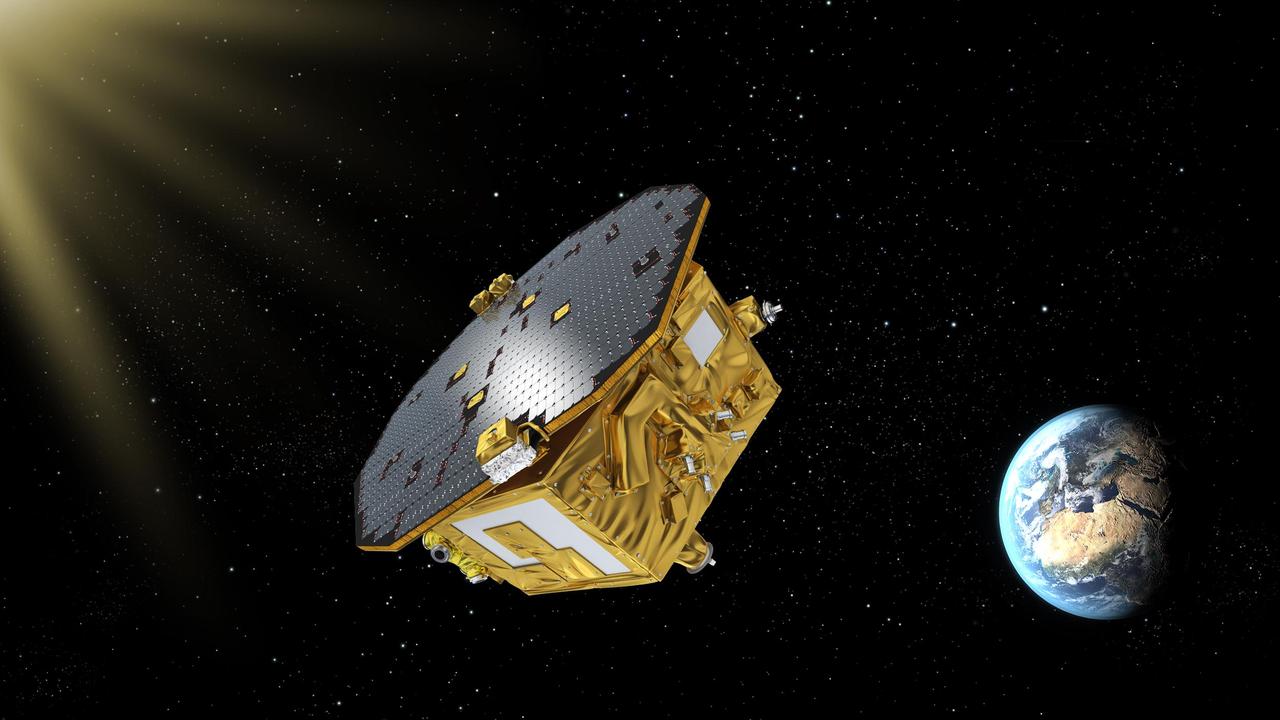
This artist's concept shows ESA's LISA Pathfinder spacecraft, which launched on Dec. 3, 2015, from Kourou, French Guiana, will help pave the way for a mission to detect gravitational waves. LISA Pathfinder, led by the European Space Agency (ESA), is designed to test technologies that could one day detect gravitational waves. Gravitational waves, predicted by Einstein's theory of general relativity, are ripples in spacetime produced by any accelerating body. But the waves are so weak that Earth- or space-based observatories would likely only be able to directly detect such signals coming from massive astronomical systems, such as binary black holes or exploding stars. Detecting gravitational waves would be an important piece in the puzzle of how our universe began. http://photojournal.jpl.nasa.gov/catalog/PIA20196
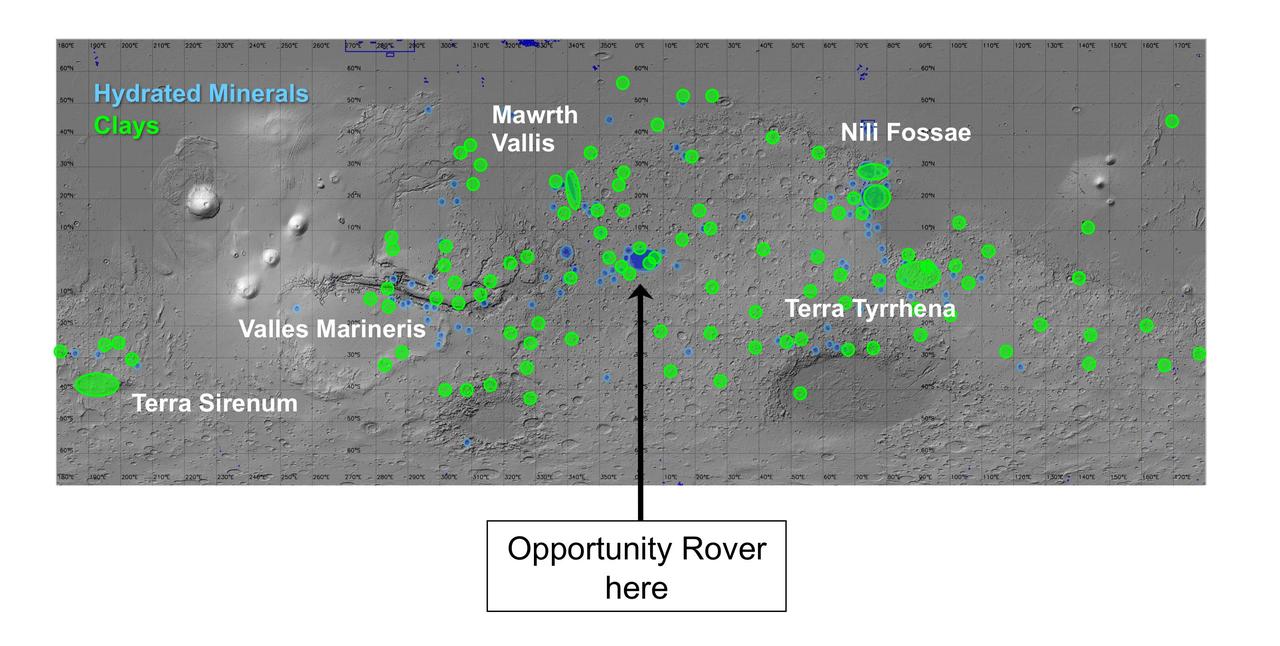
On this map of Mars, spectrometers on spacecraft orbiting Mars have detected clay minerals green and hydrated minerals-- clays, sulfates and others blue.
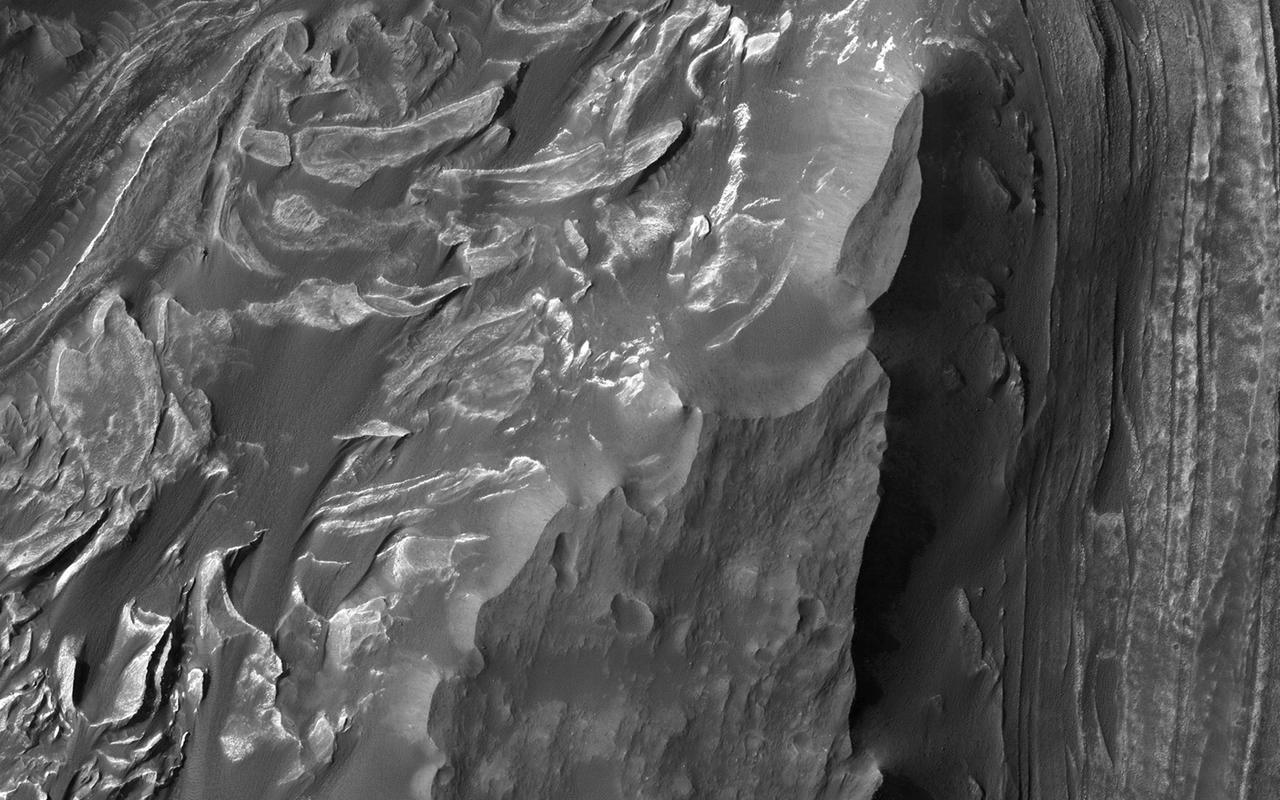
Melas Chasma is the widest segment of the Valles Marineris canyon, and is an area where NASA Mars Reconnaissance Orbiter has detected the presence of sulfates.
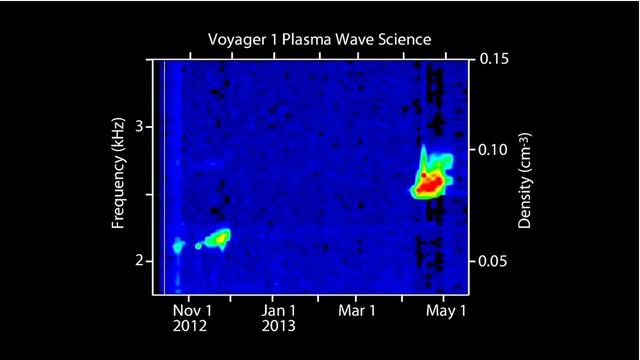
This visual represents sounds captured of interstellar space by NASA Voyager 1 spacecraft. Voyager 1 plasma wave instrument detected the vibrations of dense interstellar plasma.
Observations by NASA Mars Reconnaissance Orbiter have detected carbon-dioxide snow clouds on Mars and evidence of carbon-dioxide snow falling to the surface.

This image, using data from NASA Galileo mission, shows the first detection of clay-like minerals on the surface of Jupiter moon Europa.
Astronomers using NASA Spitzer Space Telescope have detected what they believe is an alien world just two-thirds the size of Earth -- one of the smallest on record.

This graph shows the temperature differences in the oldest light in the universe, called the cosmic microwave background, detected by ESA Planck at different distances apart on the sky.
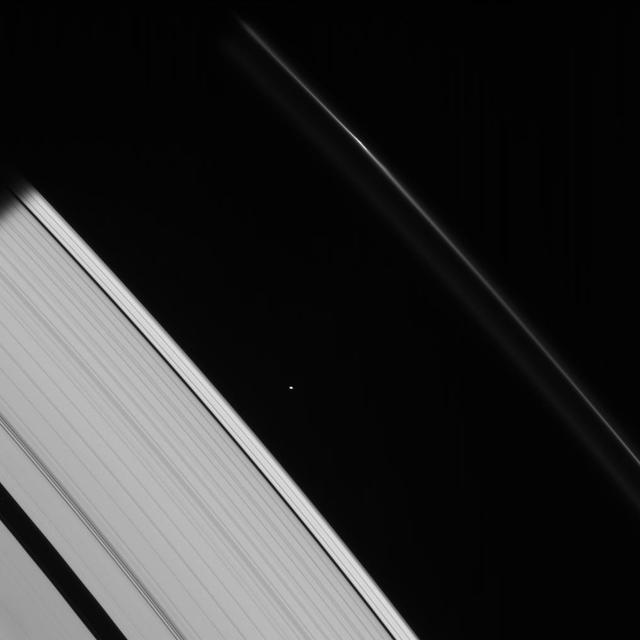
This strikingly crisp view shows Atlas heading into Saturn shadow at upper left. The moon basic, elongated shape is easy to detect here
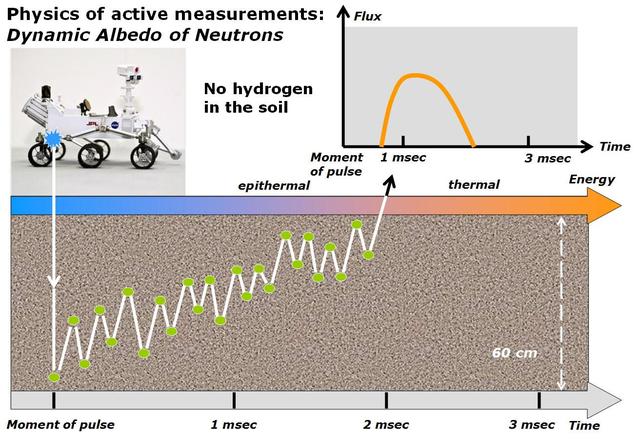
This diagram illustrates how the Dynamic Albedo of Neutrons DAN instrument on NASA Curiosity Mars rover detects hydrogen in the ground beneath the rover.
The first examinations of Martian soil by the Sample Analysis at Mars, or SAM, instrument on NASA Mars Curiosity rover show no definitive detection of Martian organic molecules at this point.
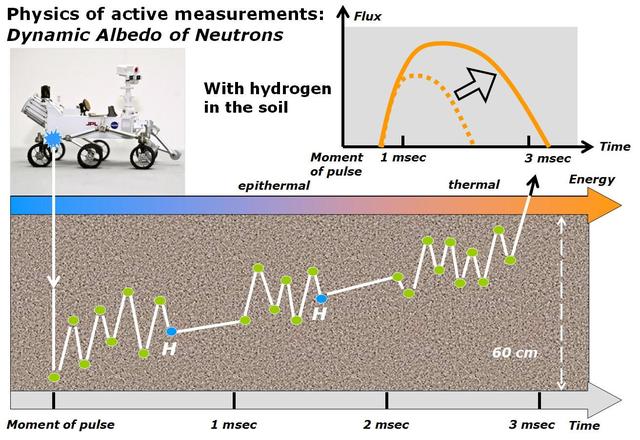
This diagram illustrates how the Dynamic Albedo of Neutrons DAN instrument on NASA Curiosity Mars rover detects hydrogen in the ground beneath the rover.

This graphic illuminates the process by which astronomers using NASA Spitzer Space Telescope have, for the first time, detected the light from a super Earth planet.
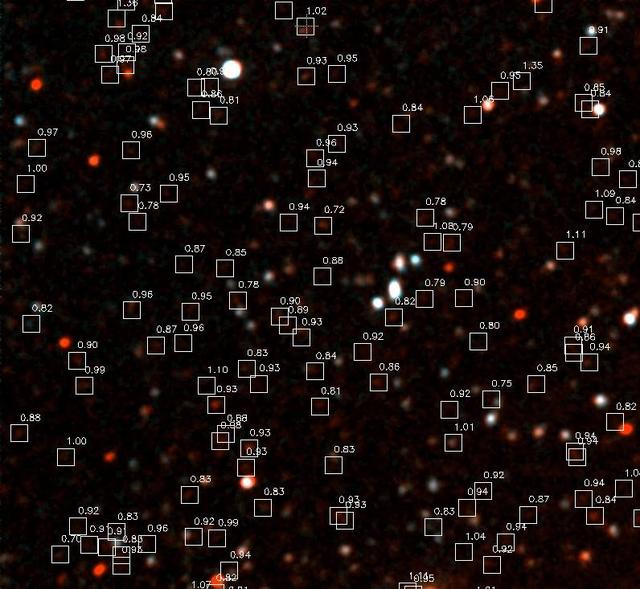
NASA's Galaxy Evolution Explorer photographed this ultraviolet color blowup of the Groth Deep Image on June 22 and June 23, 2003. Hundreds of galaxies are detected in this portion of the image, and the faint red galaxies are believed to be 6 billion light years away. The white boxes show the location of these distant galaxies, of which more than a 100 can be detected in this image. NASA astronomers expect to detect 10,000 such galaxies after extrapolating to the full image at a deeper exposure level. http://photojournal.jpl.nasa.gov/catalog/PIA04626

The ChemCam instrument on NASA Curiosity Mars rover fired its laser 50 times at its onboard graphite target showing spectral measurements from the first shot, which hit dust on the target, compared to spectral measurements of from the 50th shot.
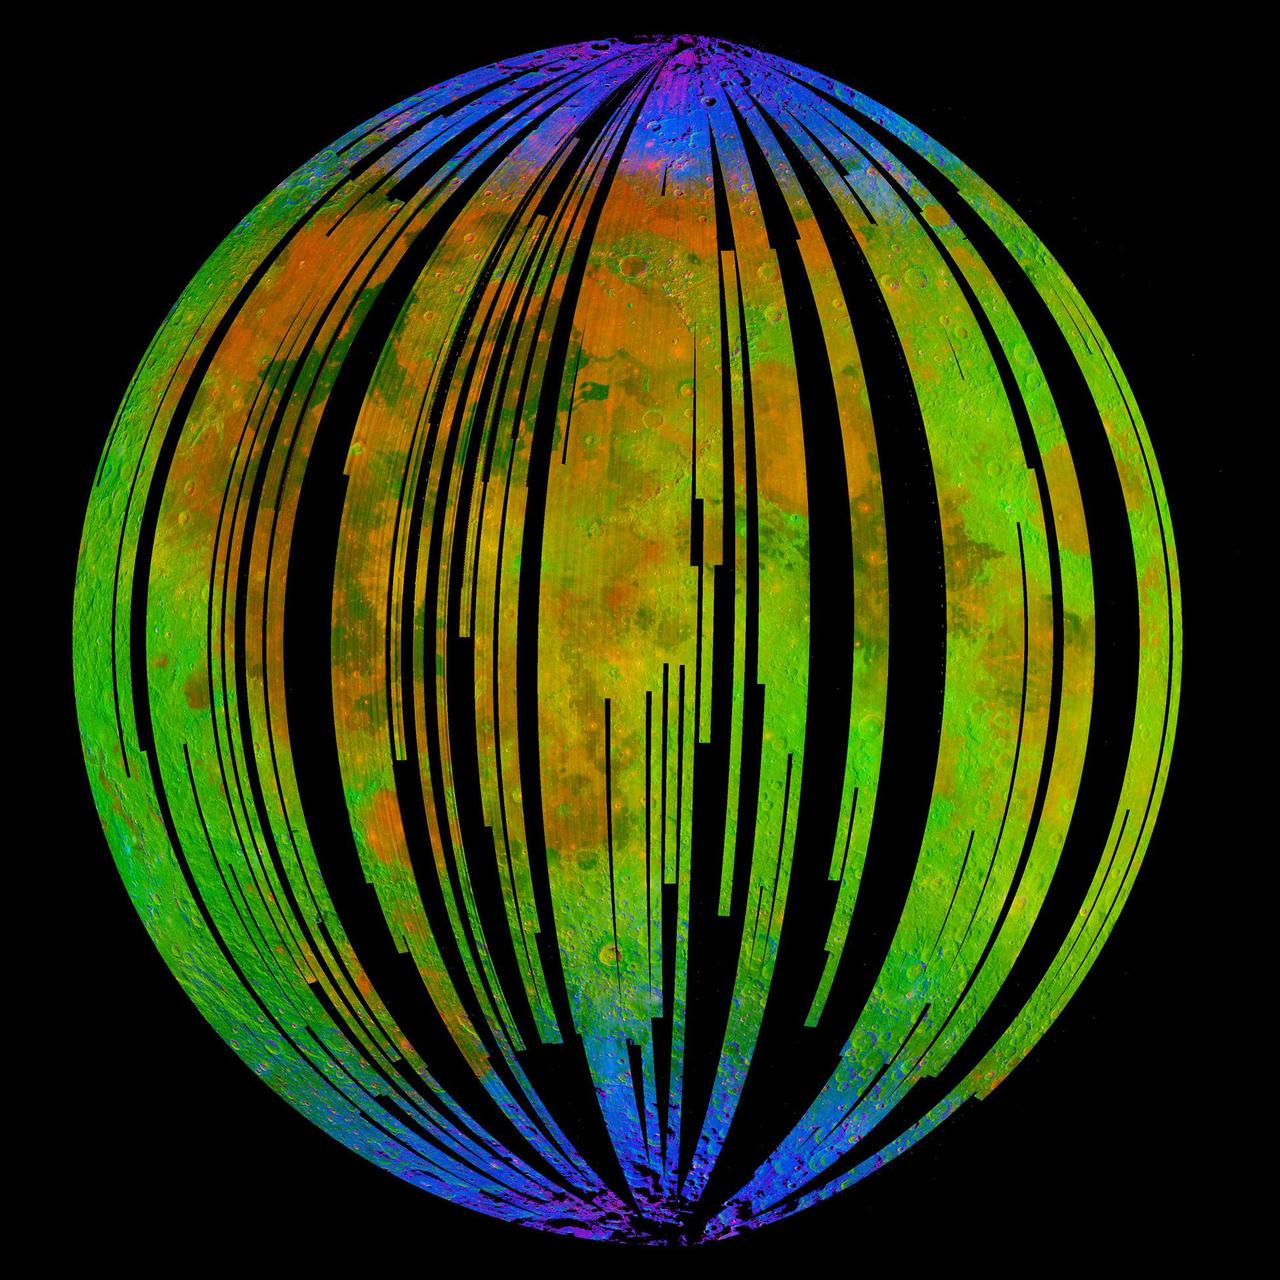
This image of the moon is from NASA Moon Mineralogy Mapper on the Indian Space Research Organization Chandrayaan-1 mission. It is a three-color composite of reflected near-infrared radiation from the sun.
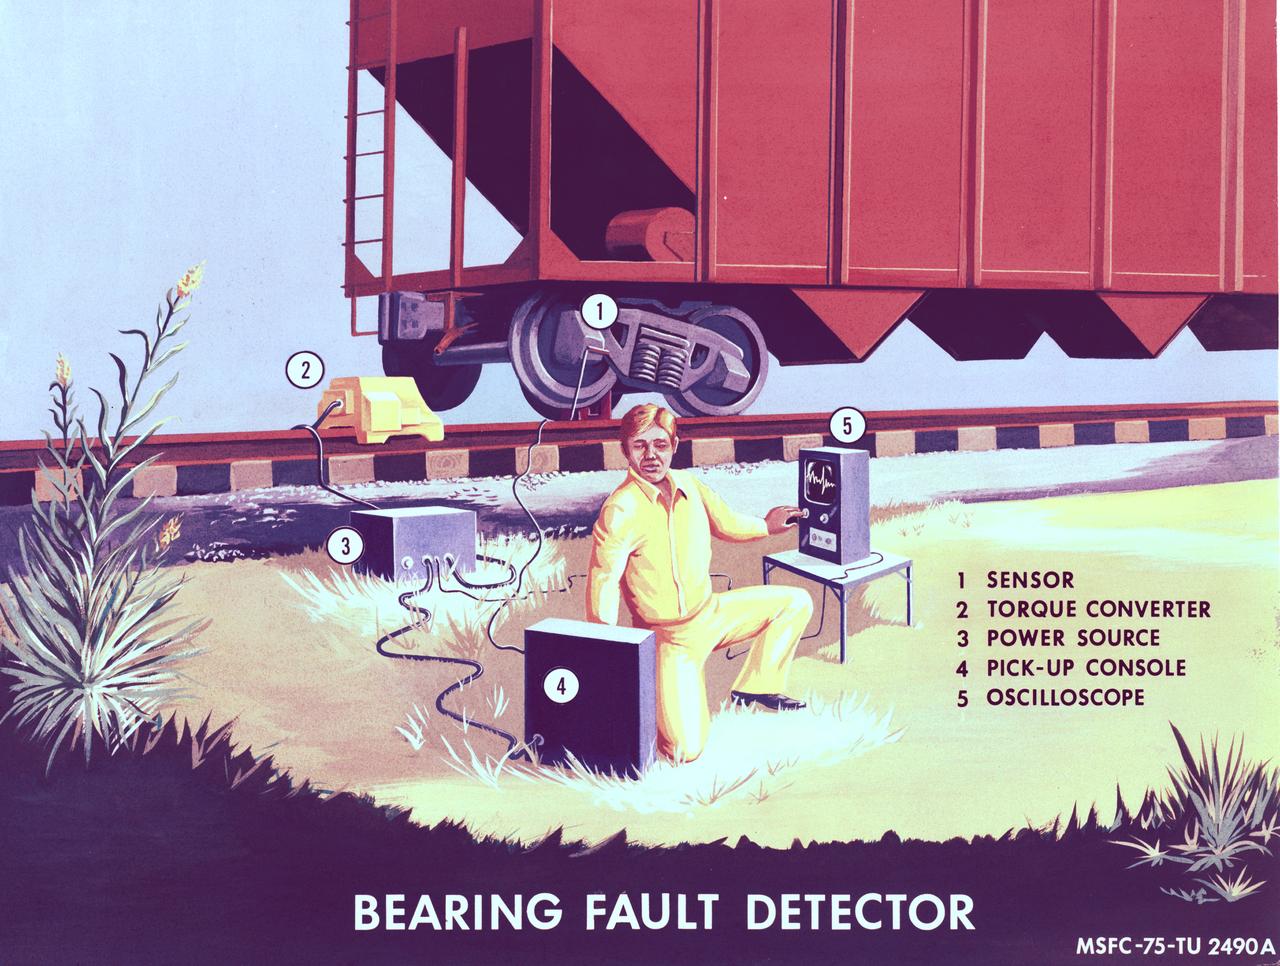
Technology derived by NASA for monitoring control gyros in the Skylab program is directly applicable to the problems of fault detection of railroad wheel bearings. Marhsall Space Flight Center's scientists have developed a detection concept based on the fact that bearing defects excite resonant frequency of rolling elements of the bearing as they impact the defect. By detecting resonant frequency and subsequently analyzing the character of this signal, bearing defects may be detected and identified as to source.
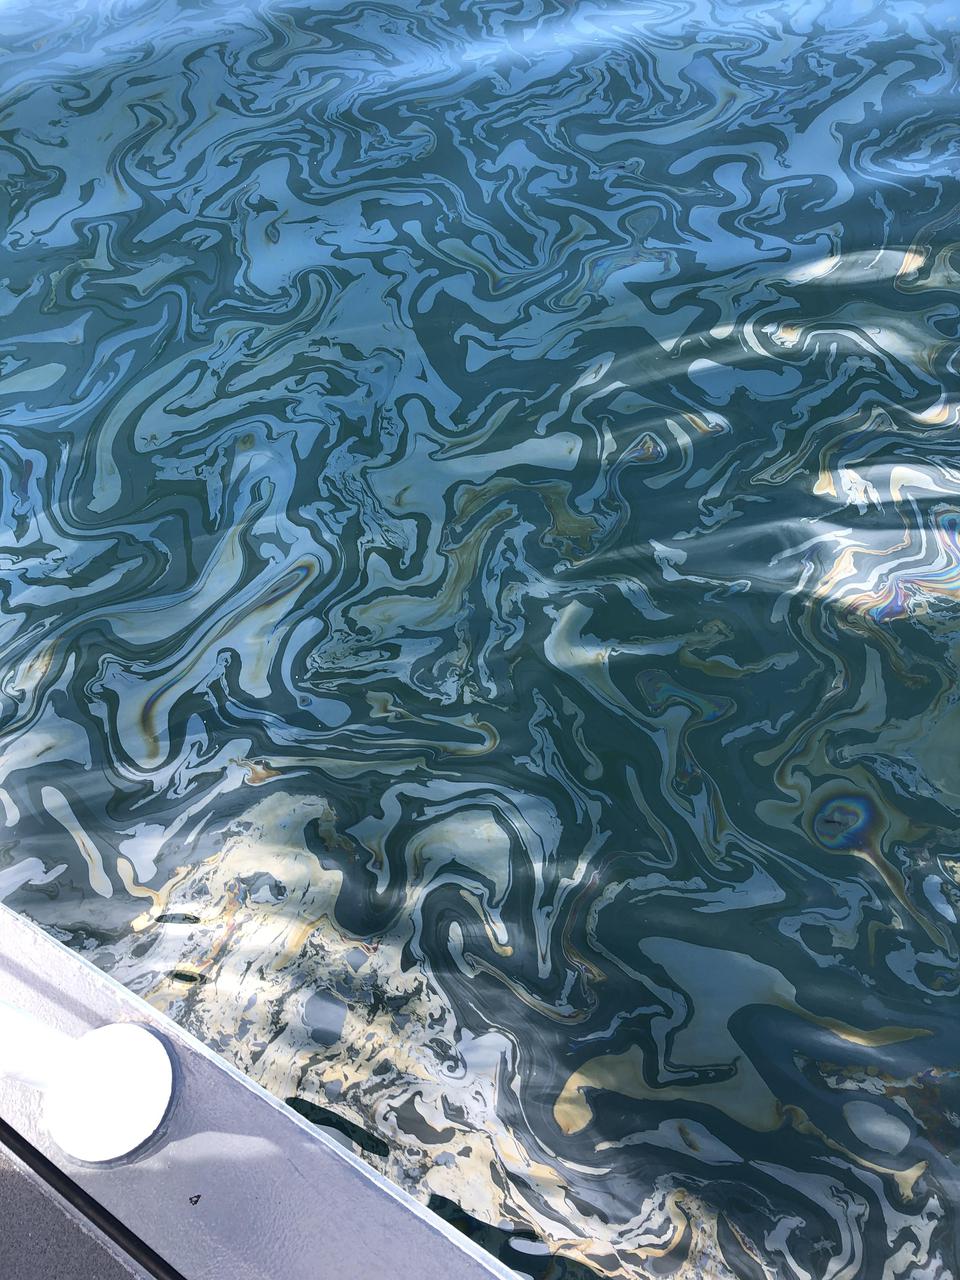
An oil slick from naturally occurring oil seeps off the coast of Santa Barbara, California. The NASA-NOAA Marine Oil Spill Thickness (MOST) project is using the area to test the ability of a radar instrument called UAVSAR to detect the thickness of oil in oil slicks – important information for first responders to oil spills. Having concluded their second field campaign in Santa Barbara at the end of October, 2021, the MOST team is working to develop a way for NOAA – the lead federal agency for detecting and tracking coastal oil spills – to use remote sensing data to determine not just where oil is, but where the thickest parts of it are. NASA's UAVSAR, or Uninhabited Aerial Vehicle Synthetic Aperture Radar, attaches to the fuselage of an airplane that collects a roughly 12-mile-wide (19-kilometer-wide) image of the area. The instrument sends radar pulses down to the surface of the ocean, and the signals that bounce back are used to detect roughness, caused by waves, at the ocean's surface. Oil dampens the waves, creating areas of smoother water that appear darker than the surrounding clean water in the SAR imagery – the thicker the oil, the darker the area appears. When the project concludes, likely in 2023, scientists hope to have a prototype system for detecting oil spill thickness that can be deployed in emergencies. https://photojournal.jpl.nasa.gov/catalog/PIA23699
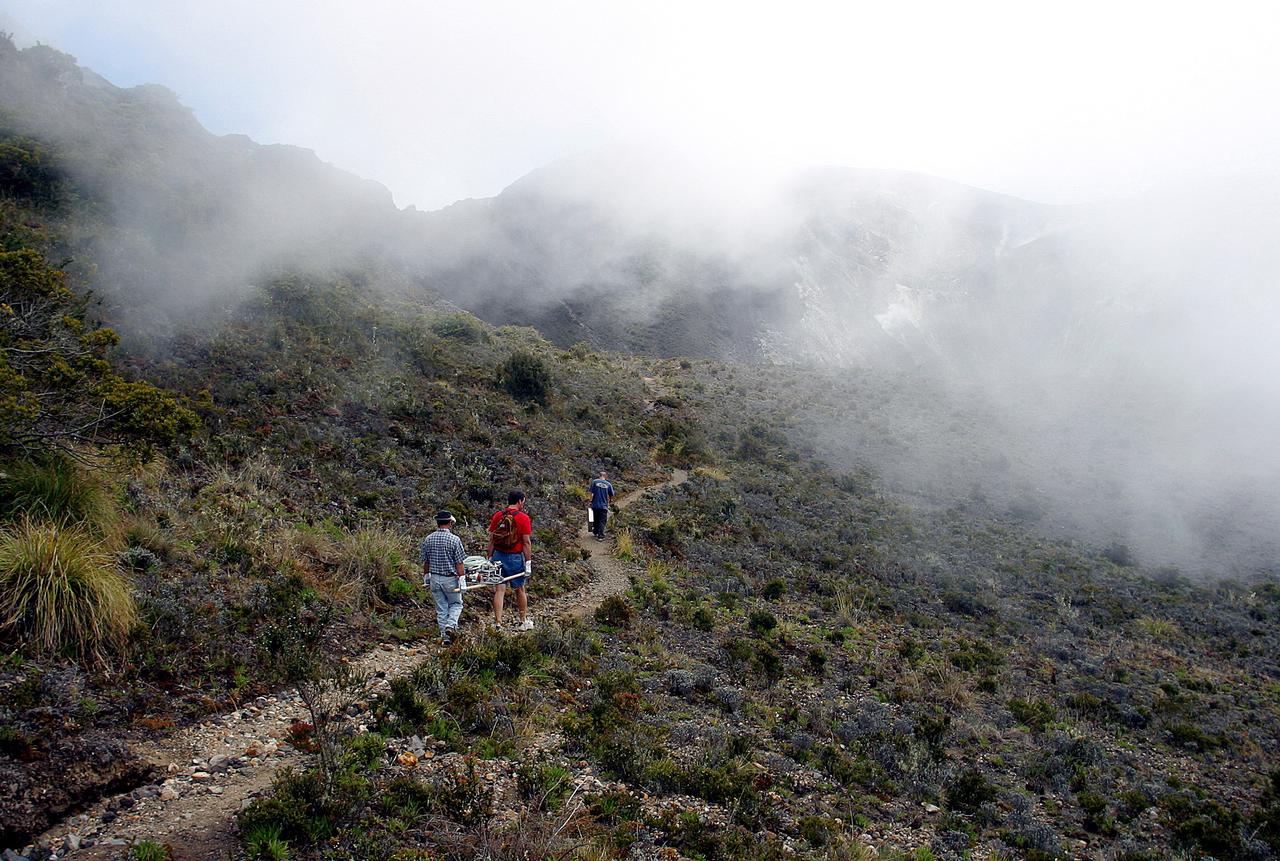
KENNEDY SPACE CENTER, FLA. - Arturo Ramierez, Charles Curley and Duke Follistein, KSC and Costa Rican researchers, carry the hazardous gas detection system AVEMS to the central of the Turrialba volcano. The Aircraft-based Volcanic Emission Mass Spectrometer determines the presence and concentration of various chemicals. It is being tested in flights over the Turrialba volcano and in the crater, sampling and analyzing fresh volcanic gases in their natural chemical state. The AVEMS system has been developed for use in the Space Shuttle program, to detect toxic gas leaks and emissions in the Shuttle’s aft compartment and the crew compartment.

This artist concept illustrates a young, red dwarf star surrounded by three planets. NASA Galaxy Evolution Explorer is helping to identify young, red dwarf stars that are close to us by detecting their ultraviolet light.

This graphic shows the flux of radiation detected by NASA Mars Science Laboratory on the trip from Earth to Mars; the spikes in radiation levels occurred because of large solar energetic particle events caused by giant flares on the sun.
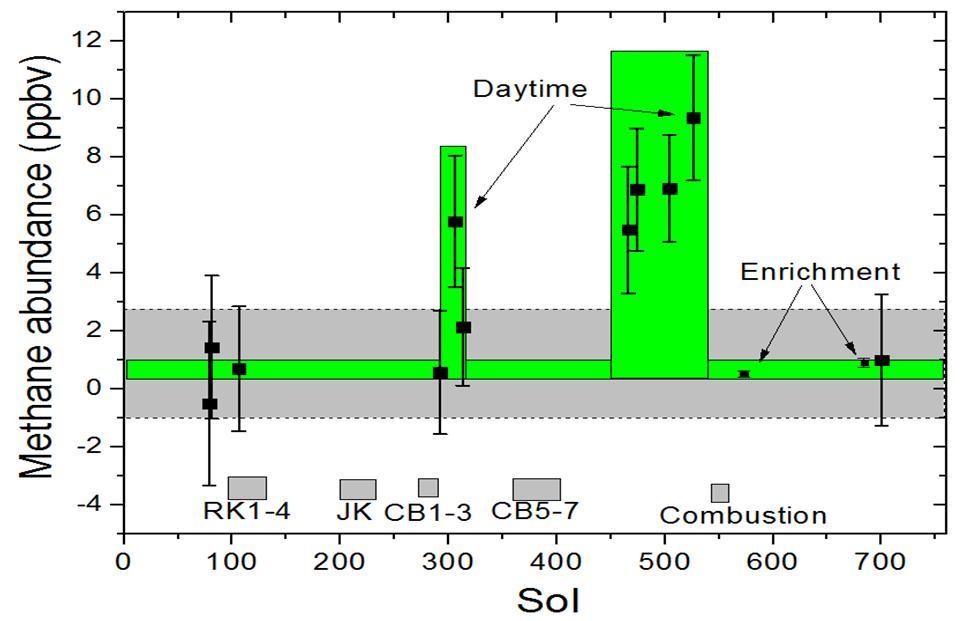
This graphic shows tenfold spiking in the abundance of methane in the Martian atmosphere surrounding NASA Curiosity Mars rover, as detected by a series of measurements made with the Tunable Laser Spectrometer instrument in the rover laboratory suite.
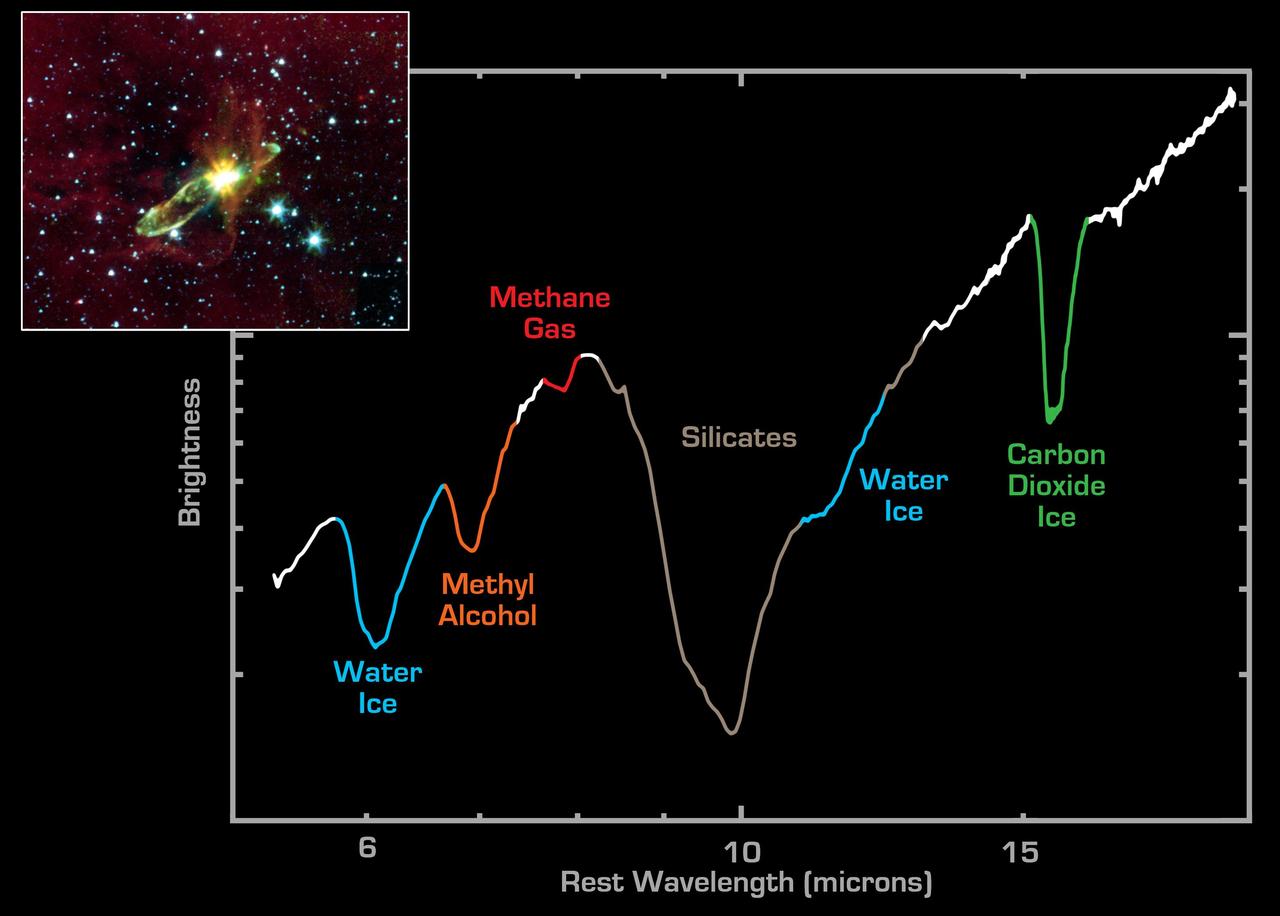
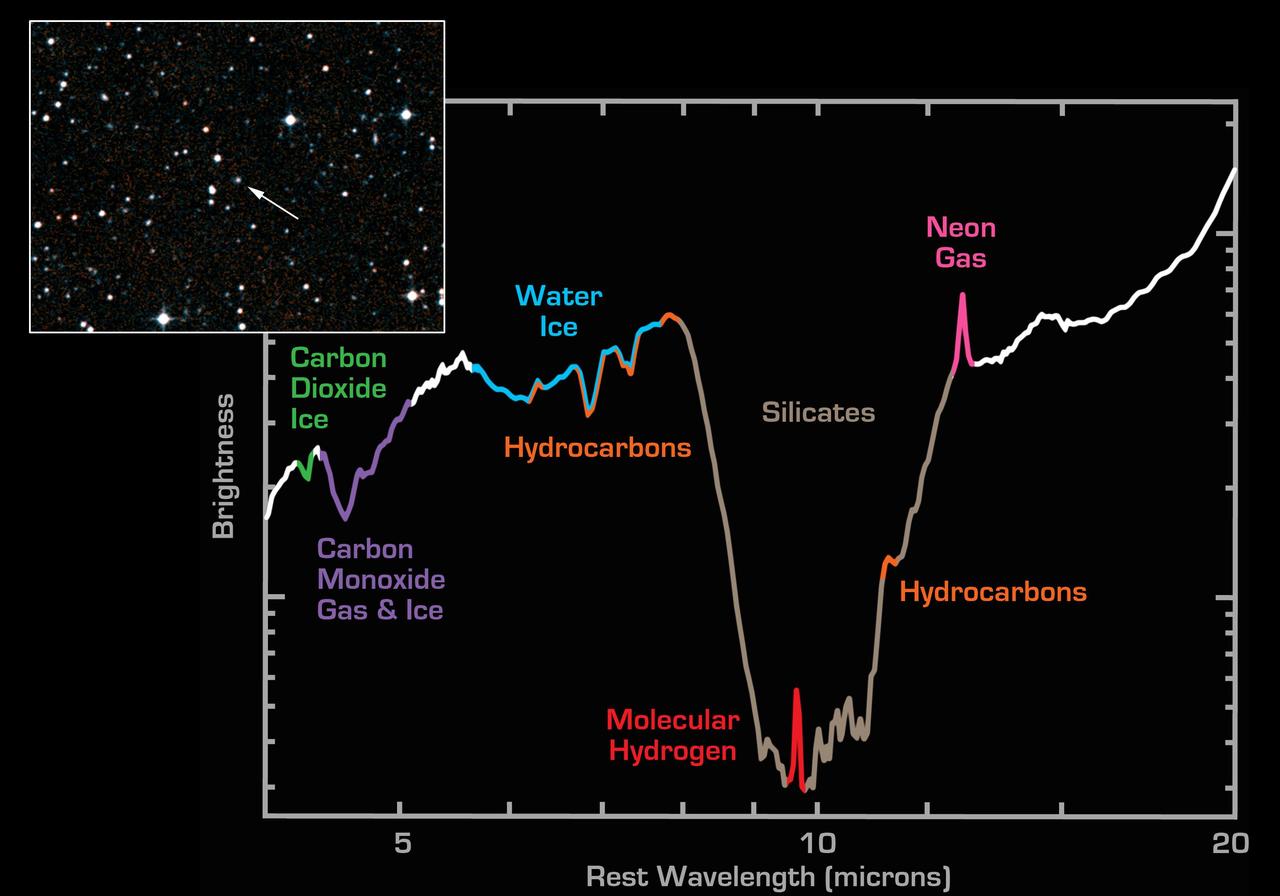
NASA Spitzer Space Telescope has lifted the cosmic veil to see an otherwise hidden newborn star, while detecting the presence of water and carbon dioxide ices, as well as organic molecules.
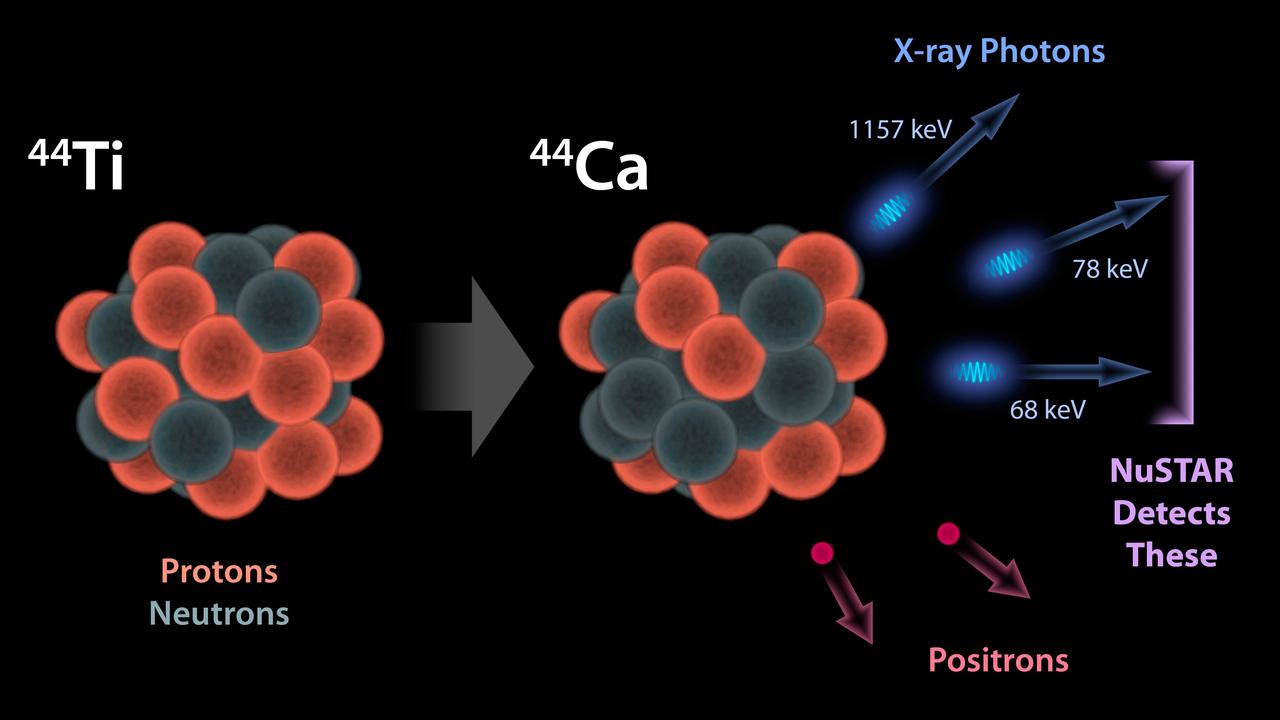
This diagram illustrates why NASA NuSTAR can see radioactivity in the remains of exploded stars for the first time. The observatory detects high-energy X-ray photons that are released by a radioactive substance called titanium-44.
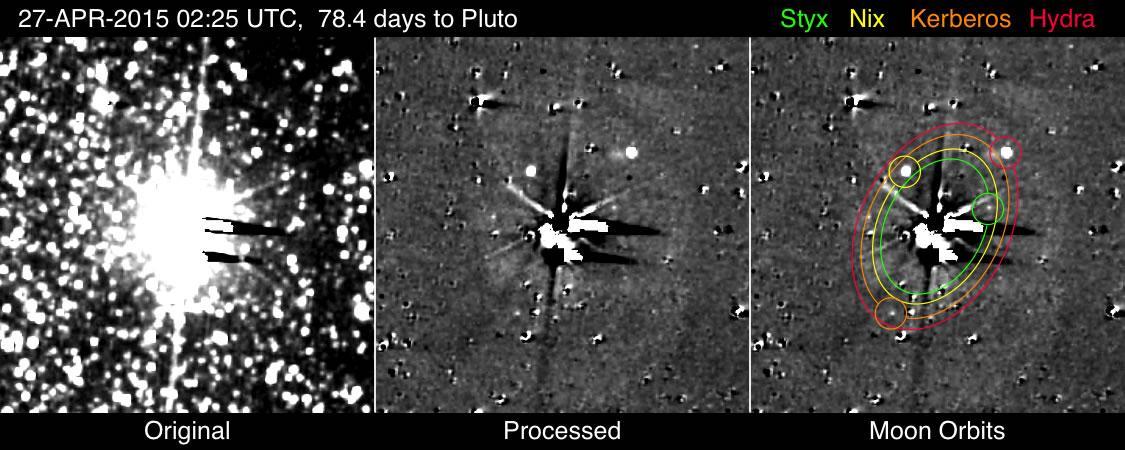
The images detecting Kerberos and Styx shown here were taken with NASA New Horizons most sensitive camera, the Long Range Reconnaissance Imager LORRI, from April 25-May 1, 2015.
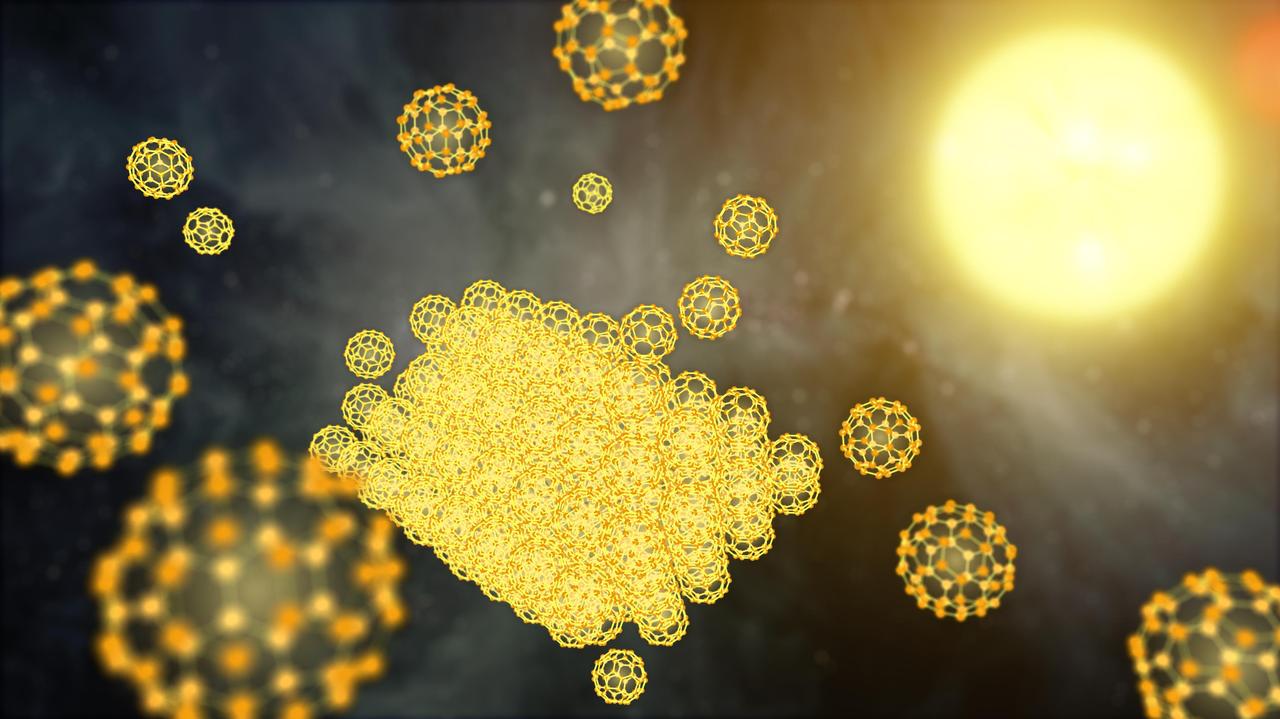
NASA Spitzer Space Telescope has detected the solid form of buckyballs in space for the first time. To form a solid particle, the buckyballs must stack together, as illustrated in this artist concept showing the very beginnings of the process.

This view of Lyot Crater is a combined mapping by NASA Project Viking with elevation information from Mars Global Surveyor showing at least one of the nine craters in the northern lowlands of Mars with exposures of hydrated minerals detected from orbit.
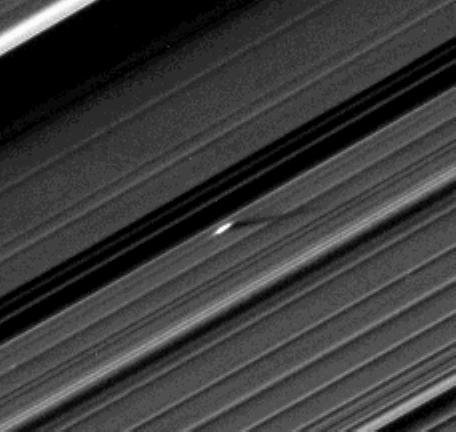
An unusually large propeller feature is detected just beyond the Encke Gap in this Cassini image of Saturn’s outer A ring taken a couple days after the planet’s August 2009 equinox.
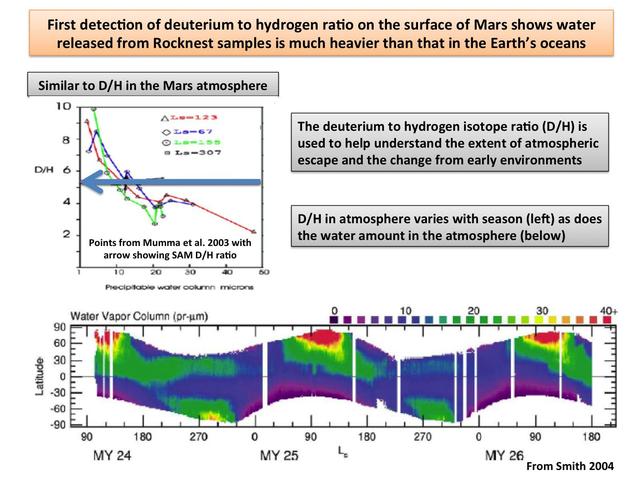
This plot shows the first-ever look at the deuterium to hydrogen ratio measured from the surface of Mars, as detected by the Sample Analysis at Mars instrument, or SAM, on NASA Curiosity rover.
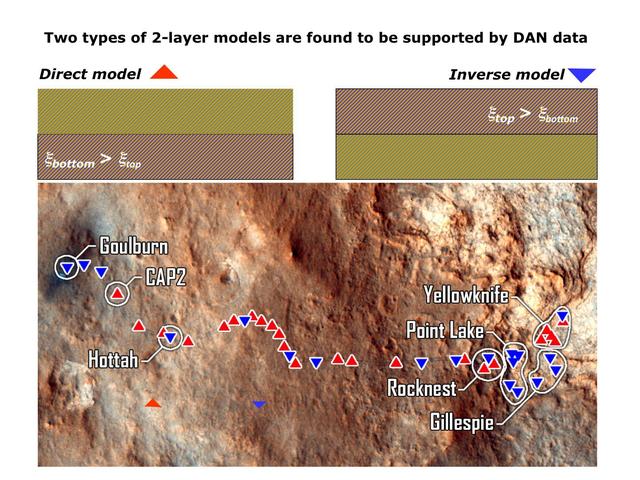
The Dynamic Albedo of Neutrons DAN instrument on NASA Mars rover Curiosity detects even very small amounts of water in the ground beneath the rover, primarily water bound into the crystal structure of hydrated minerals.
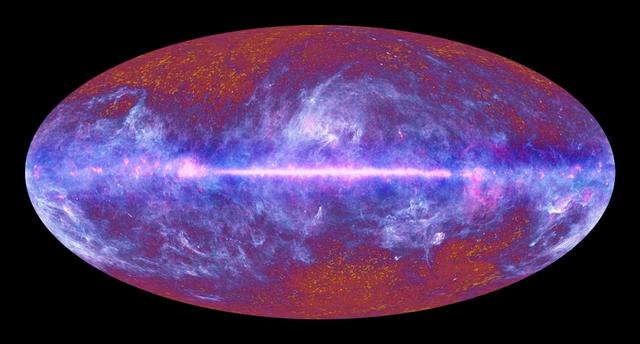
This image of the microwave sky was synthesized using data spanning the range of light frequencies detected by ESA Planck. A vast portion of the sky is dominated by the diffuse emission from gas and dust in our Milky Way galaxy.
This picture highlights a slice of Saturn largest ring. The ring red band was discovered by NASA Spitzer Space Telescope, which detected infrared light, or heat, from the dusty ring material.
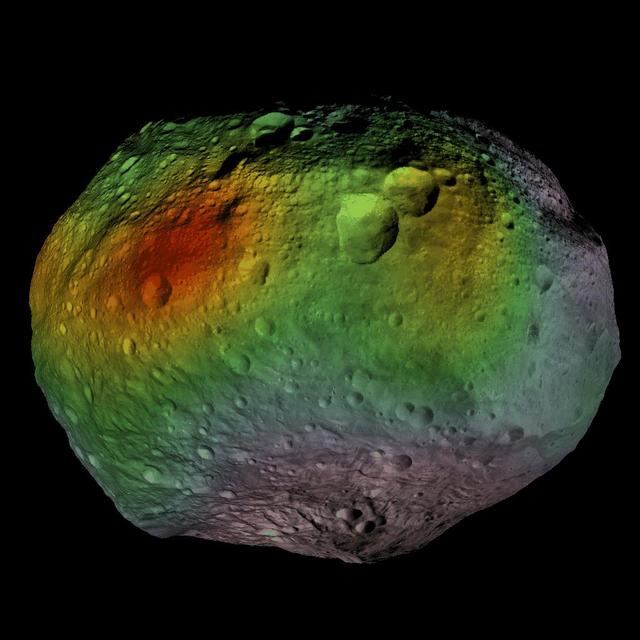
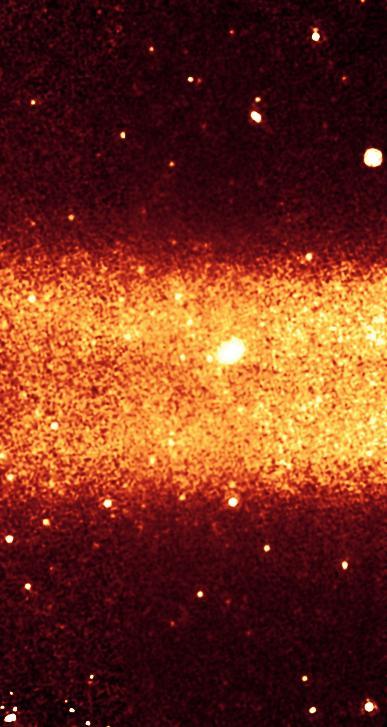
This image shows that NASA Dawn mission detected abundances of hydrogen in a wide swath around the equator of the giant asteroid Vesta. The hydrogen probably exists in the form of hydroxyl or water bound to minerals in Vesta surface.
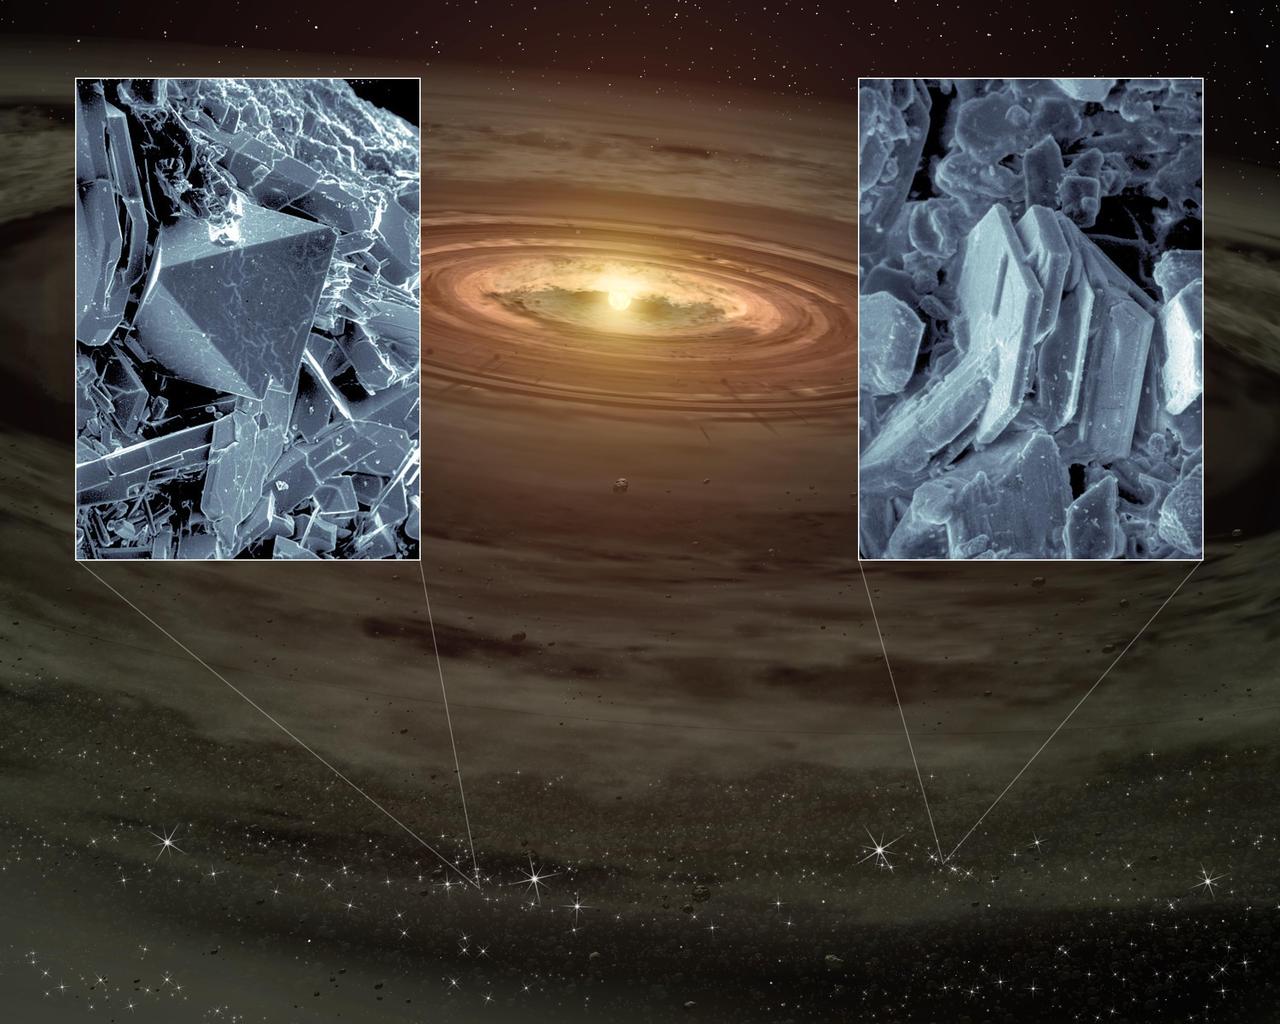
NASA Spitzer Space Telescope has, for the first time, detected tiny quartz-like crystals sprinkled in young planetary systems. The crystals, which are types of silica minerals called cristobalite and tridymite.
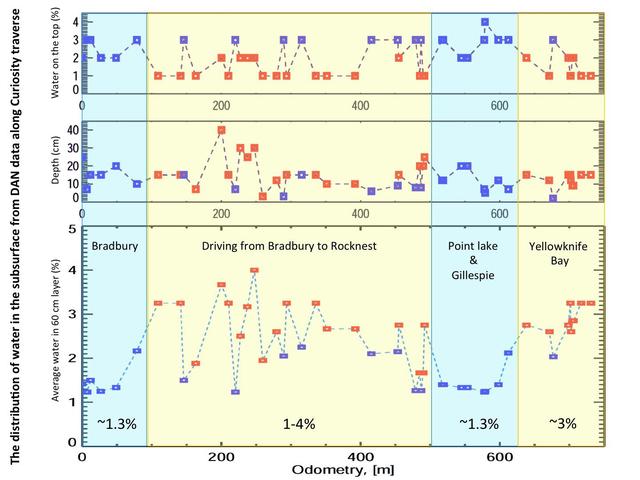
This set of graphs shows variation in the amount and the depth of water detected beneath NASA Mars rover Curiosity by use of the rover Dynamic Albedo of Neutrons DAN instrument at different points the rover has driven.
This image from NASA MESSENGER is one of many from the latest vulcanoid search are currently being transmitted to Earth. Vulcanoids are small rocky bodies that have been postulated to exist but not yet been detected.
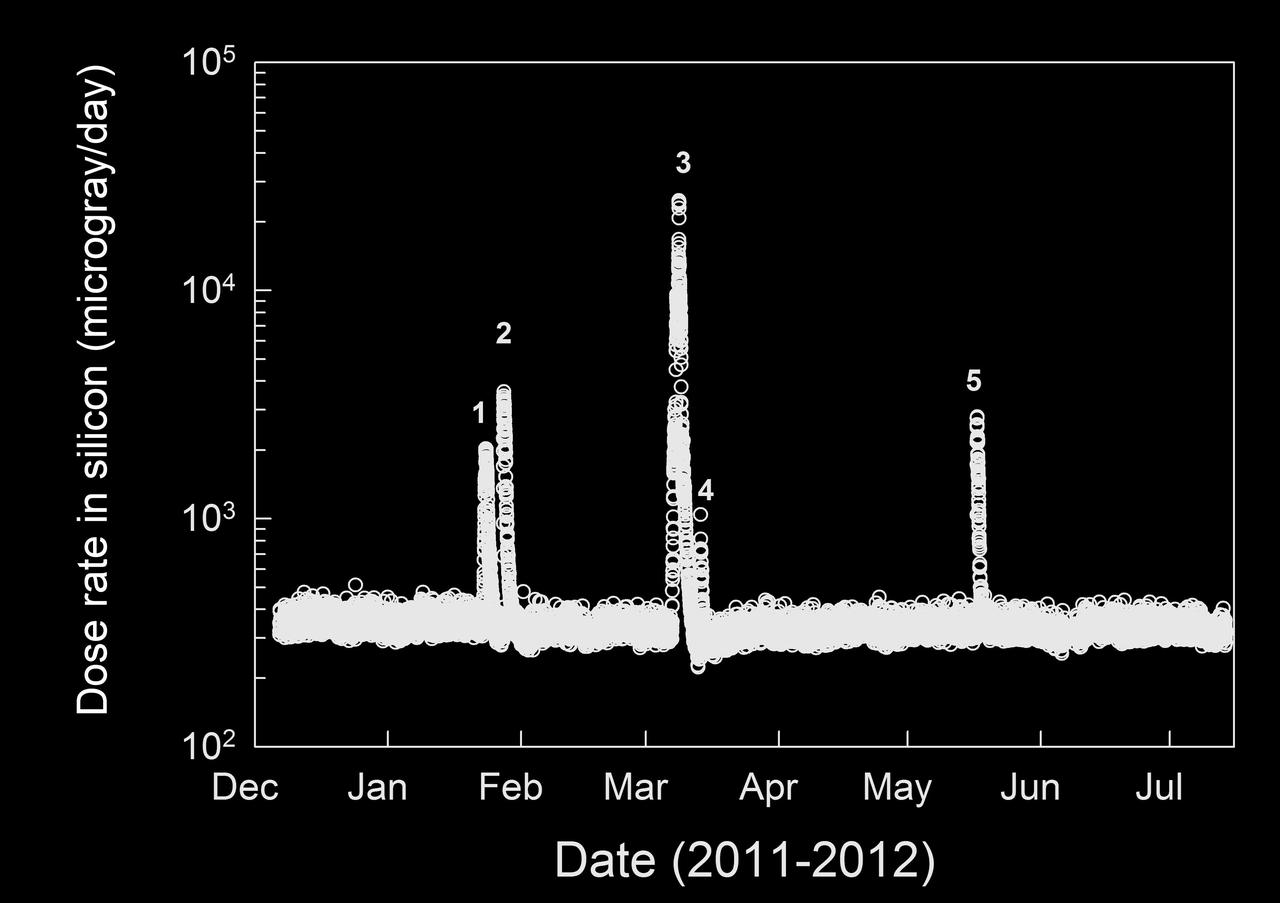
This graphic shows the level of natural radiation detected by the Radiation Assessment Detector shielded inside NASA Mars Science Laboratory on the trip from Earth to Mars from December 2011 to July 2012.

This image shows an array of the 512 superconducting detectors used on the BICEP2 telescope at the South Pole. The technology was key to detecting the effects of gravitational waves associated with the early epoch of our universe known as inflation.
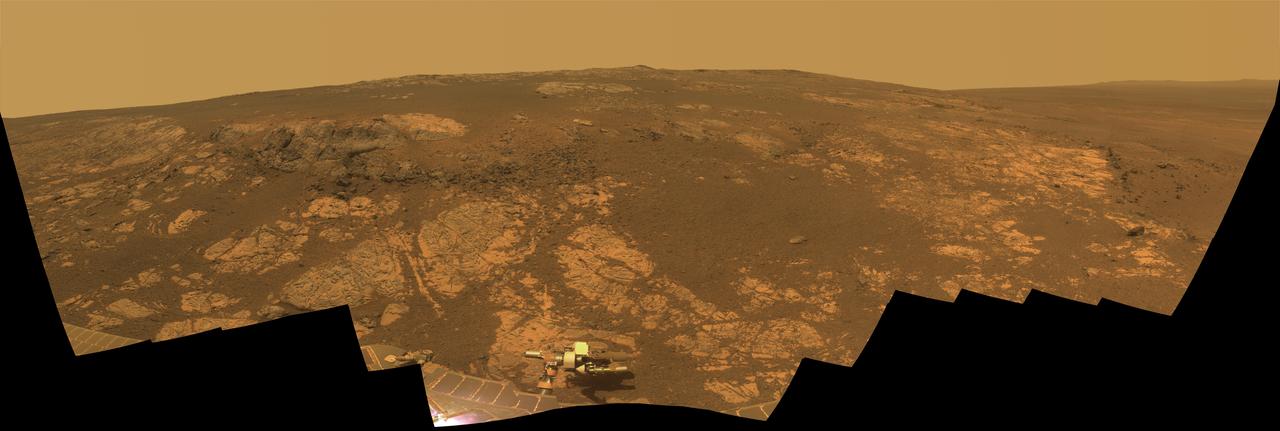
NASA rover Opportunity takes a look at Matijevic Hill, an area within the Cape York segment of Endeavour rim where clay minerals have been detected from orbit.

This graphic illustrates where astronomers at last found oxygen molecules in space -- near the star-forming core of the Orion nebula. The squiggly lines, or spectra, reveal the signatures of oxygen molecules, detected by ESA Hershel Space Observatory.
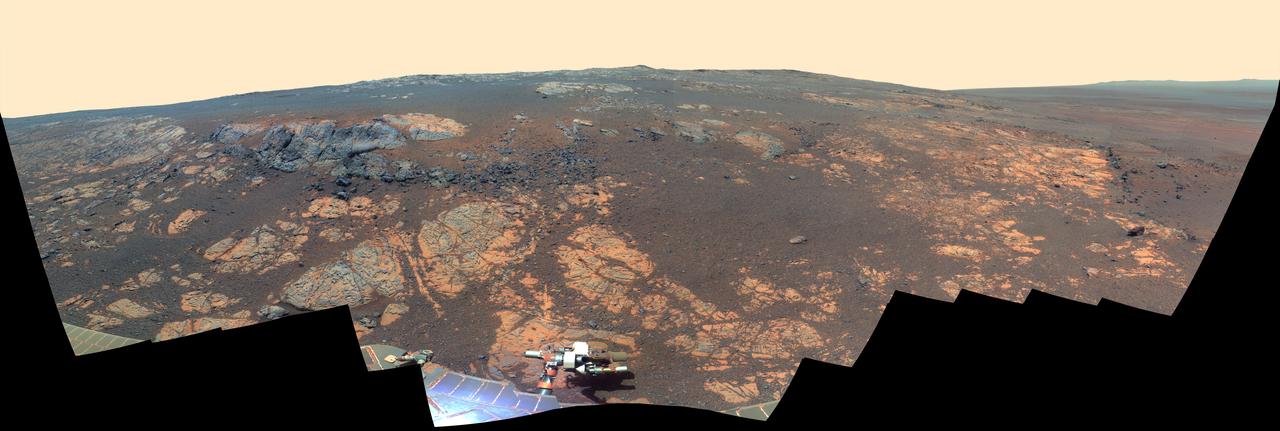
This false color image from NASA rover Opportunity takes a look at Matijevic Hill, an area within the Cape York segment of Endeavour rim where clay minerals have been detected from orbit.
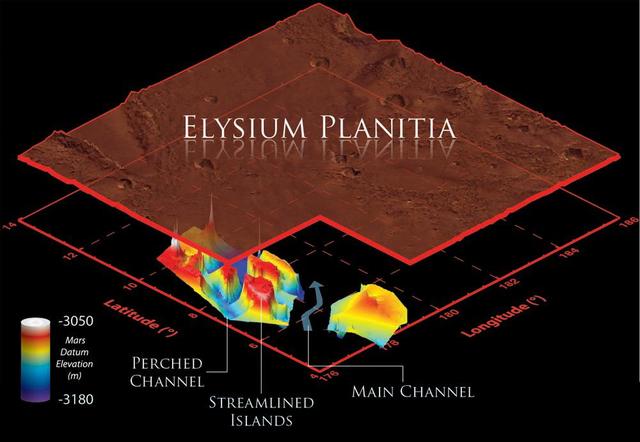
This illustration schematically shows where the Shallow Radar instrument on NASA Mars Reconnaissance Orbiter detected flood channels that had been buried by lava flows in the Elysium Planitia region of Mars.
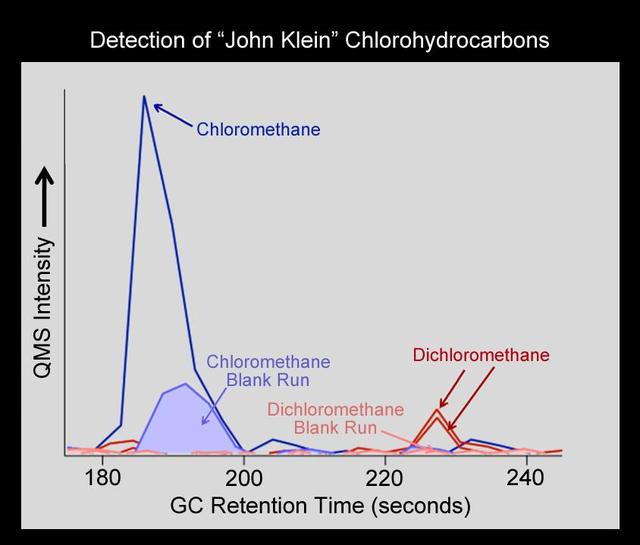
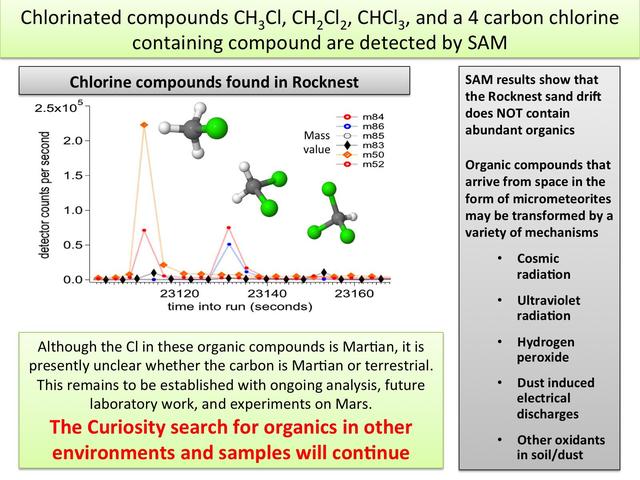
NASA Curiosity rover has detected the simple carbon-containing compounds chloro- and dichloromethane from the powdered rock sample extracted from the John Klein rock on Mars.
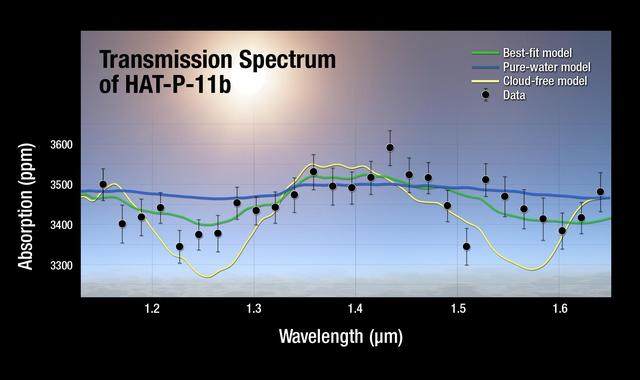
A plot of the transmission spectrum for exoplanet HAT-P-11b, with data from NASA Kepler, Hubble and Spitzer observatories combined. The results show a robust detection of water absorption in the Hubble data.
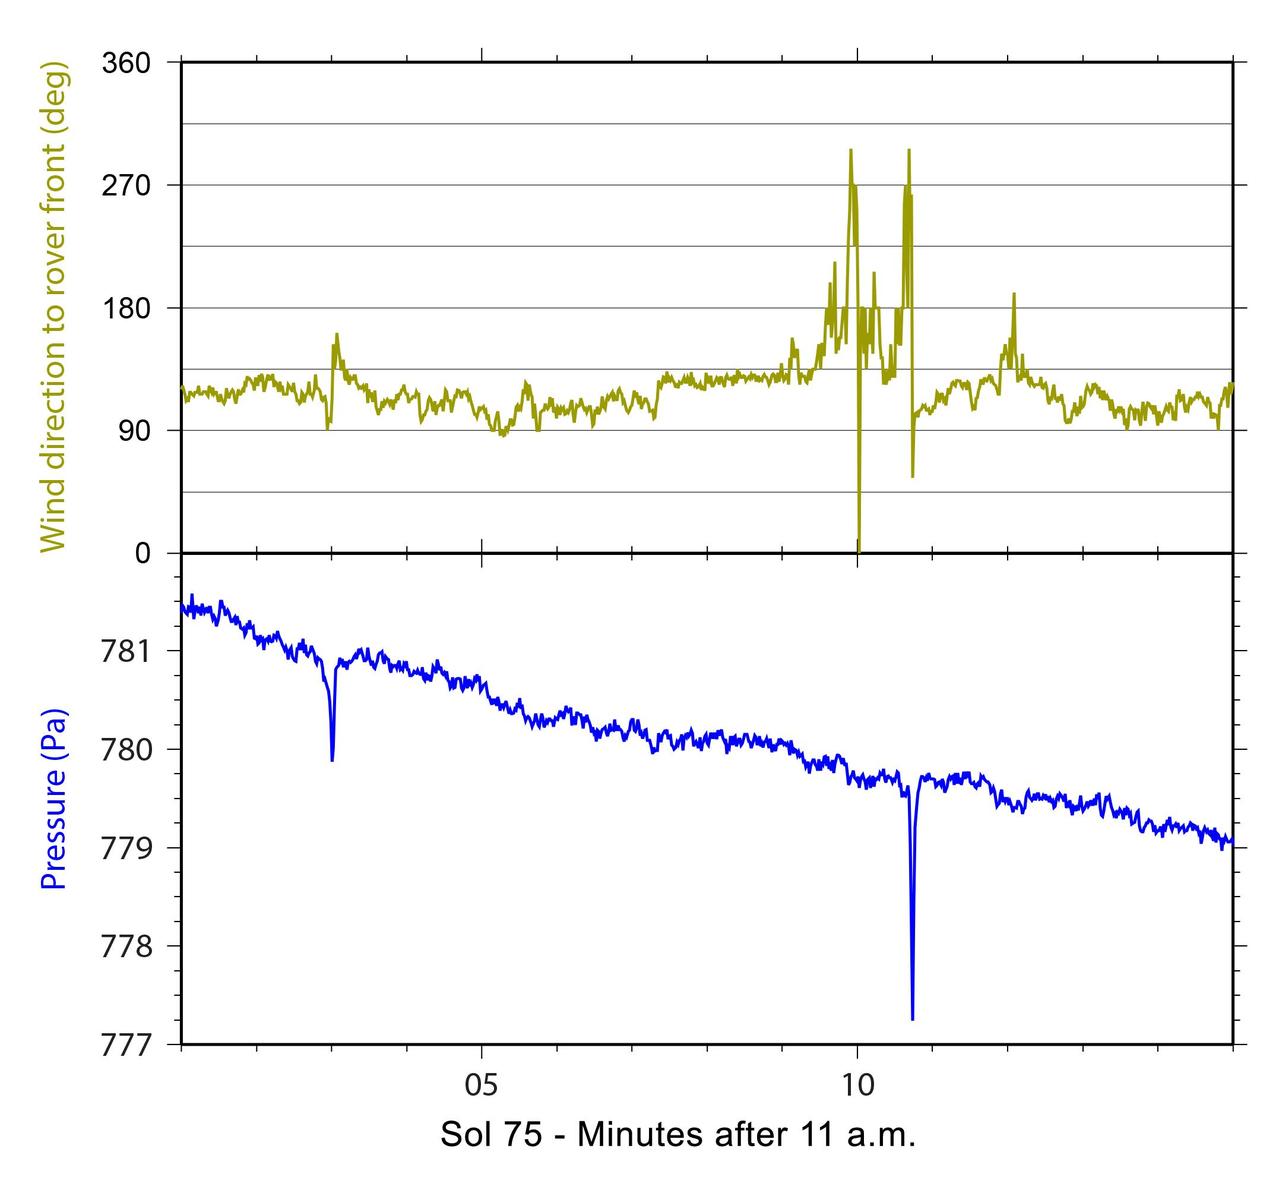
Twenty-one times during the first 12 weeks that NASA Mars rover Curiosity worked on Mars, the rover Rover Environmental Monitoring Station REMS detected brief dips in air pressure that could be caused by a passing whirlwind.
Since last spring, the U.S. Geological Survey Alaska Volcano Observatory AVO has detected increasing volcanic unrest at Augustine Volcano in Cook Inlet, Alaska near Anchorage. This image is from NASA Terra spacecraft.