
Jupiter Torus Diagram
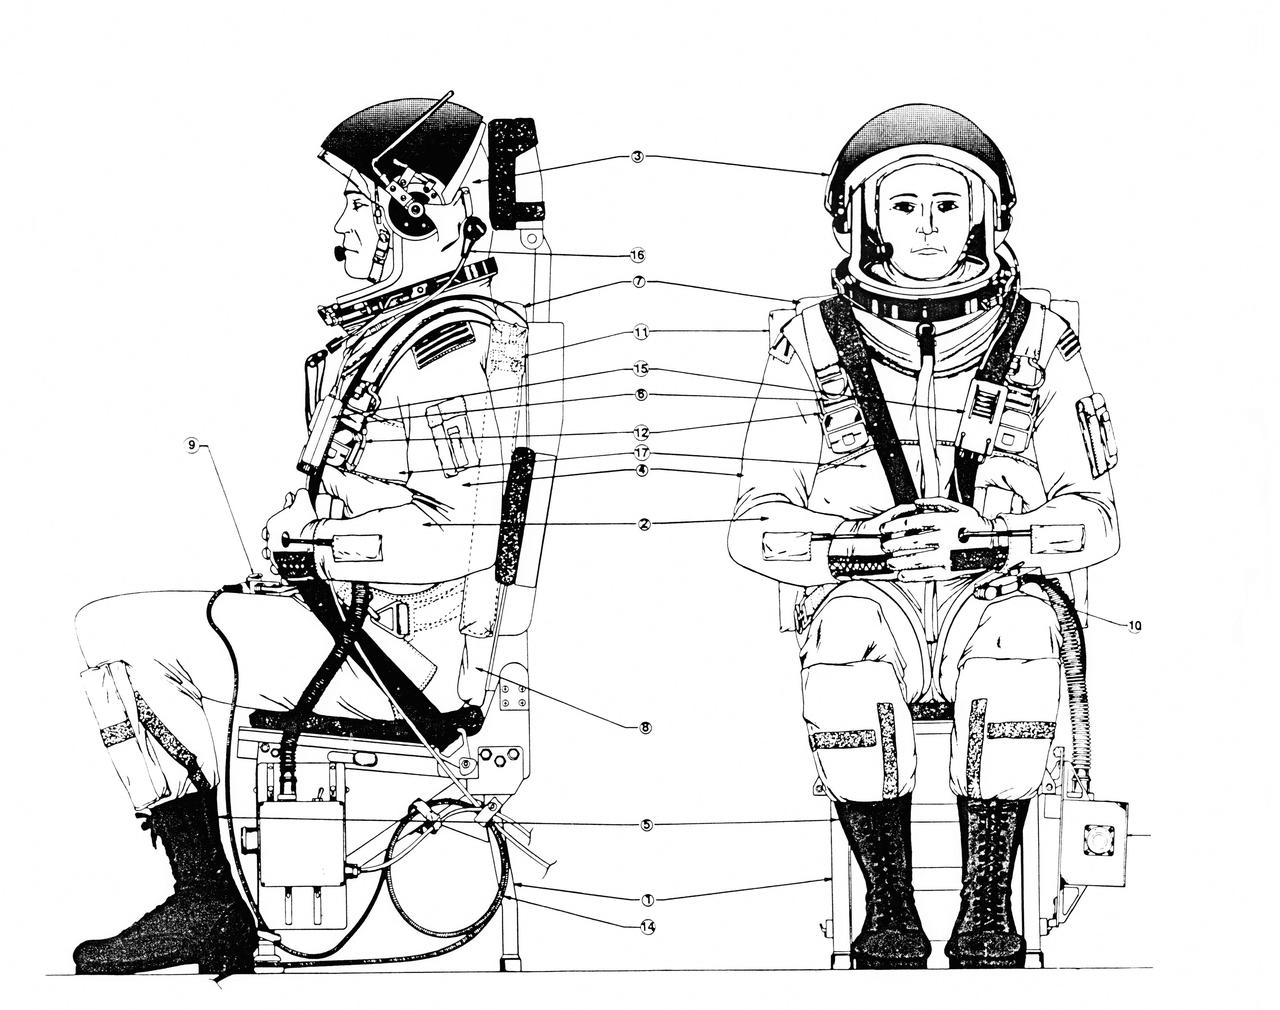
Diagrams of Crew Escape System Partial Pressure Suits, dated July, 1988.

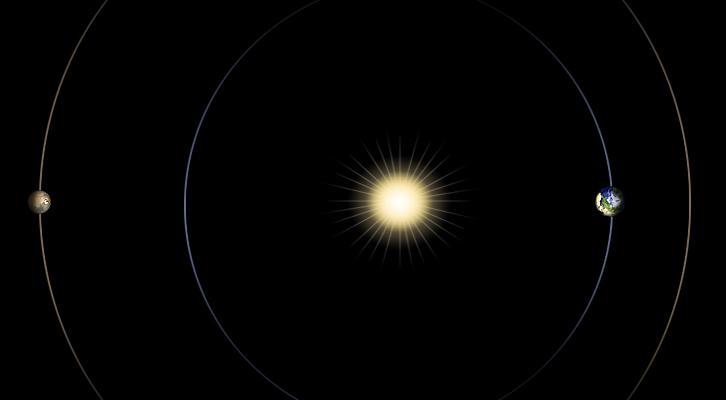
This diagram shows the approximate distances of the terrestrial planets from the Sun; they include Mercury, Venus, Earth, and Mars.
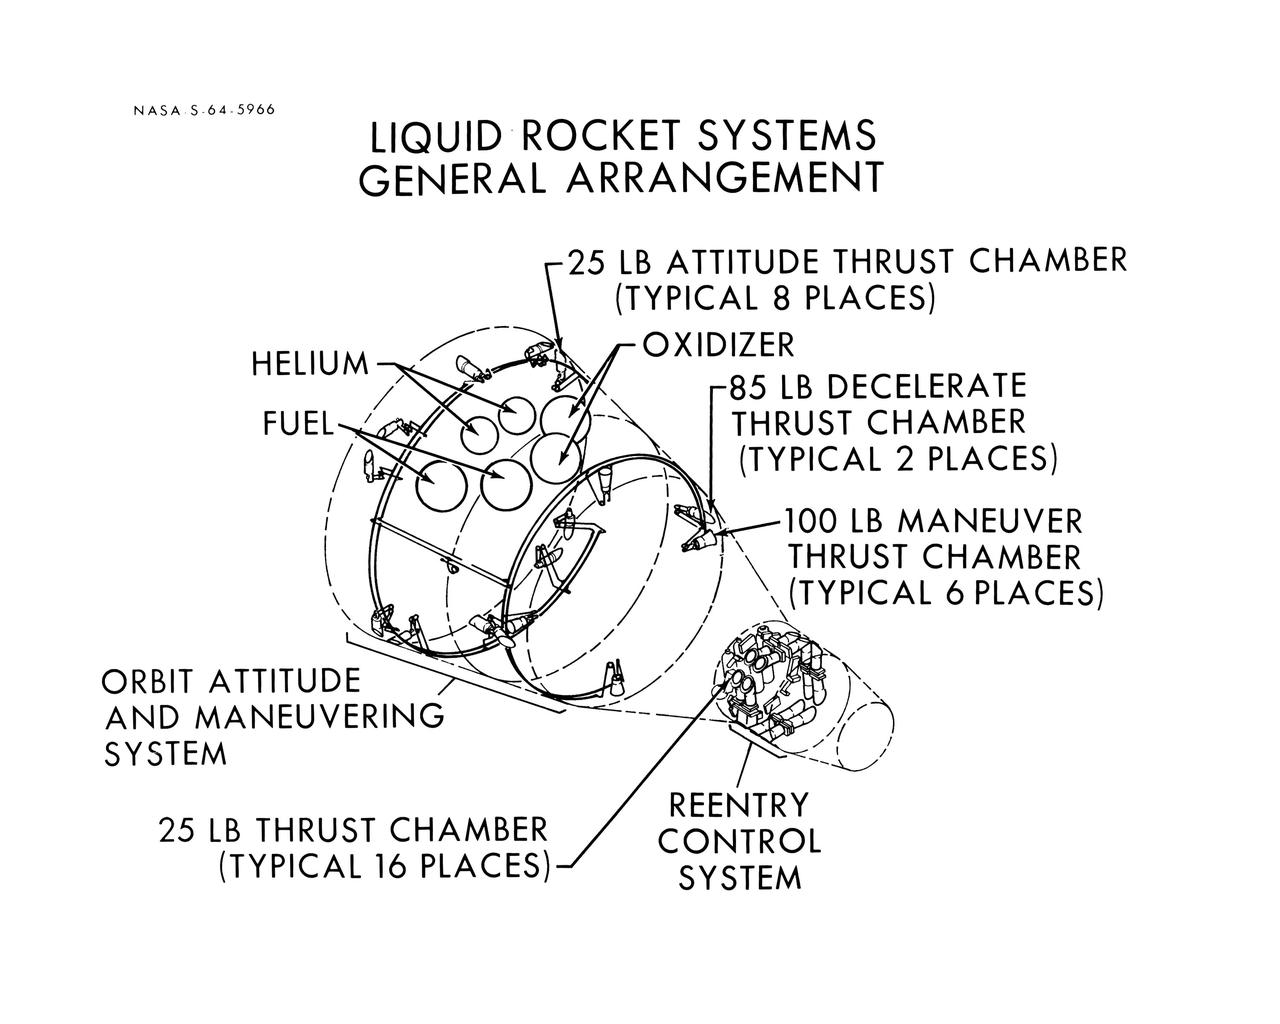
S64-05966 (1964) --- Diagram shows the general arrangement of the liquid rocket systems on the Gemini spacecraft are shown. The locations of the 25-pound, 85-pound and 100-pound thrusters of the orbital attitude and maneuver system and the 25-pound thrusters of the re-entry control system are shown.
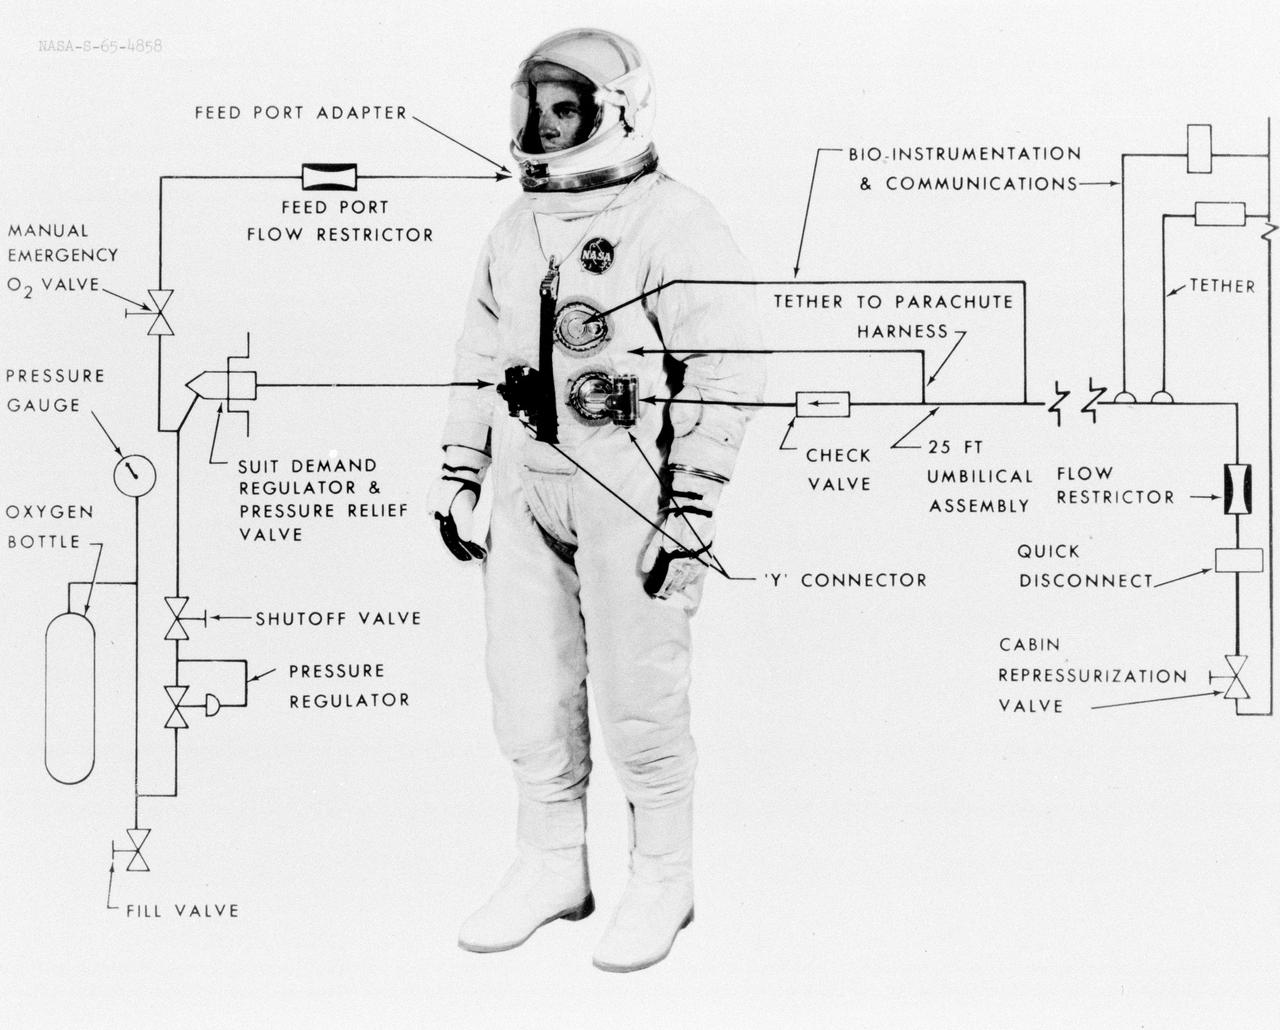
S65-04858 (May 1965) --- Illustrative diagram showing the various features of the G-4C extravehicular spacesuit.
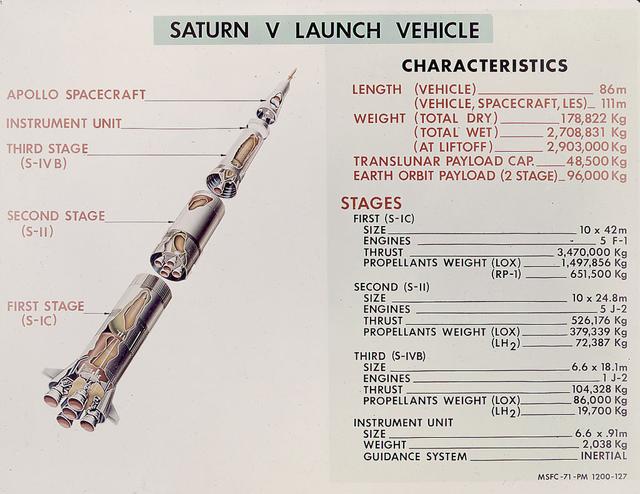
This is a good cutaway diagram of the Saturn V launch vehicle showing the three stages, the instrument unit, and the Apollo spacecraft. The chart on the right presents the basic technical data in clear metric detail. The Saturn V is the largest and most powerful launch vehicle in the United States. The towering, 111 meter, Saturn V was a multistage, multiengine launch vehicle standing taller than the Statue of Liberty. Altogether, the Saturn V engines produced as much power as 85 Hoover Dams. Development of the Saturn V was the responsibility of the Marshall Space Flight Center at Huntsville, Alabama, directed by Dr. Wernher von Braun.
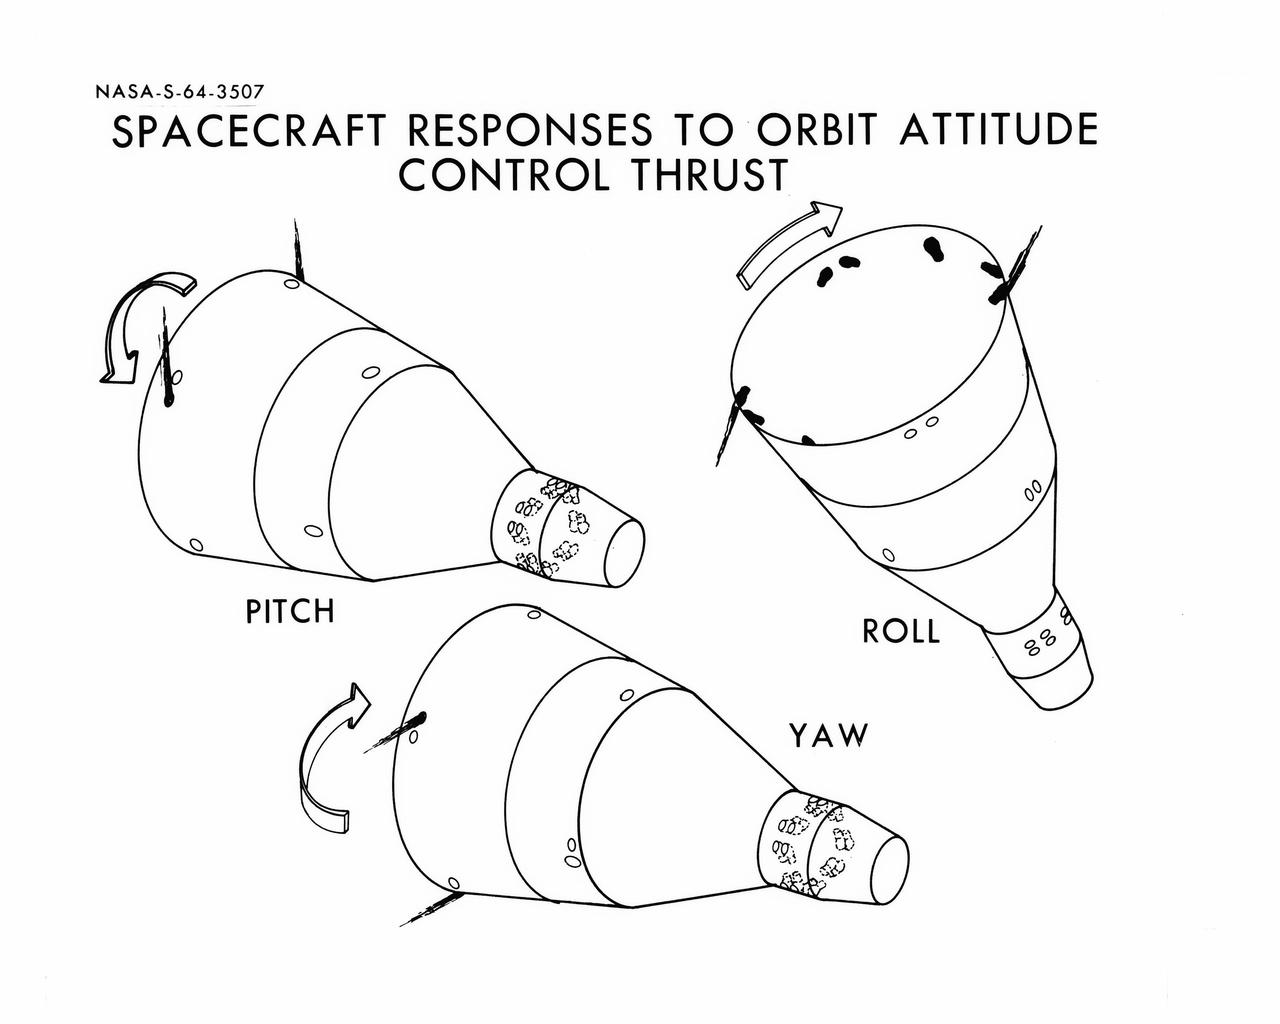
S64-03507 (1964) --- Diagrams shows Gemini spacecraft responses to orbital attitude systems's thrusters. Firing of appropriate combination of the thrusters cause pitch, roll and yaw.

This diagram illustrates research from NASA Galaxy Evolution Explorer showing that black holes once they reach a critical size can put the brakes on new star formation in elliptical galaxies.
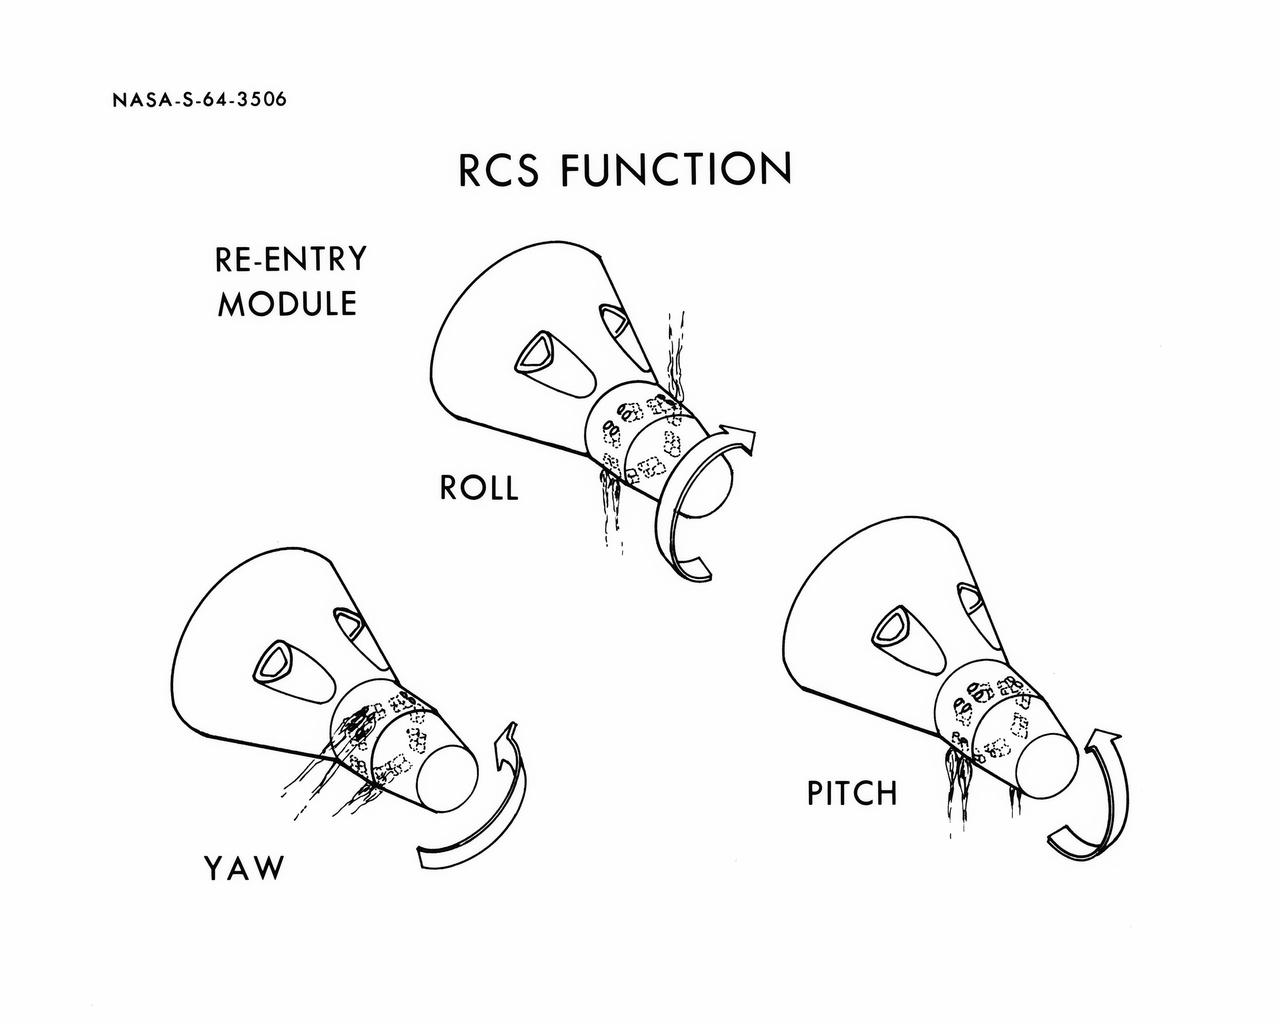
S64-03506 (1964) --- Diagrams shows Gemini spacecraft functions of the thrusters in the Gemini spacecraft's re-entry control system. Thrusters may be fired in various combinations to cause yaw, roll and pitch.
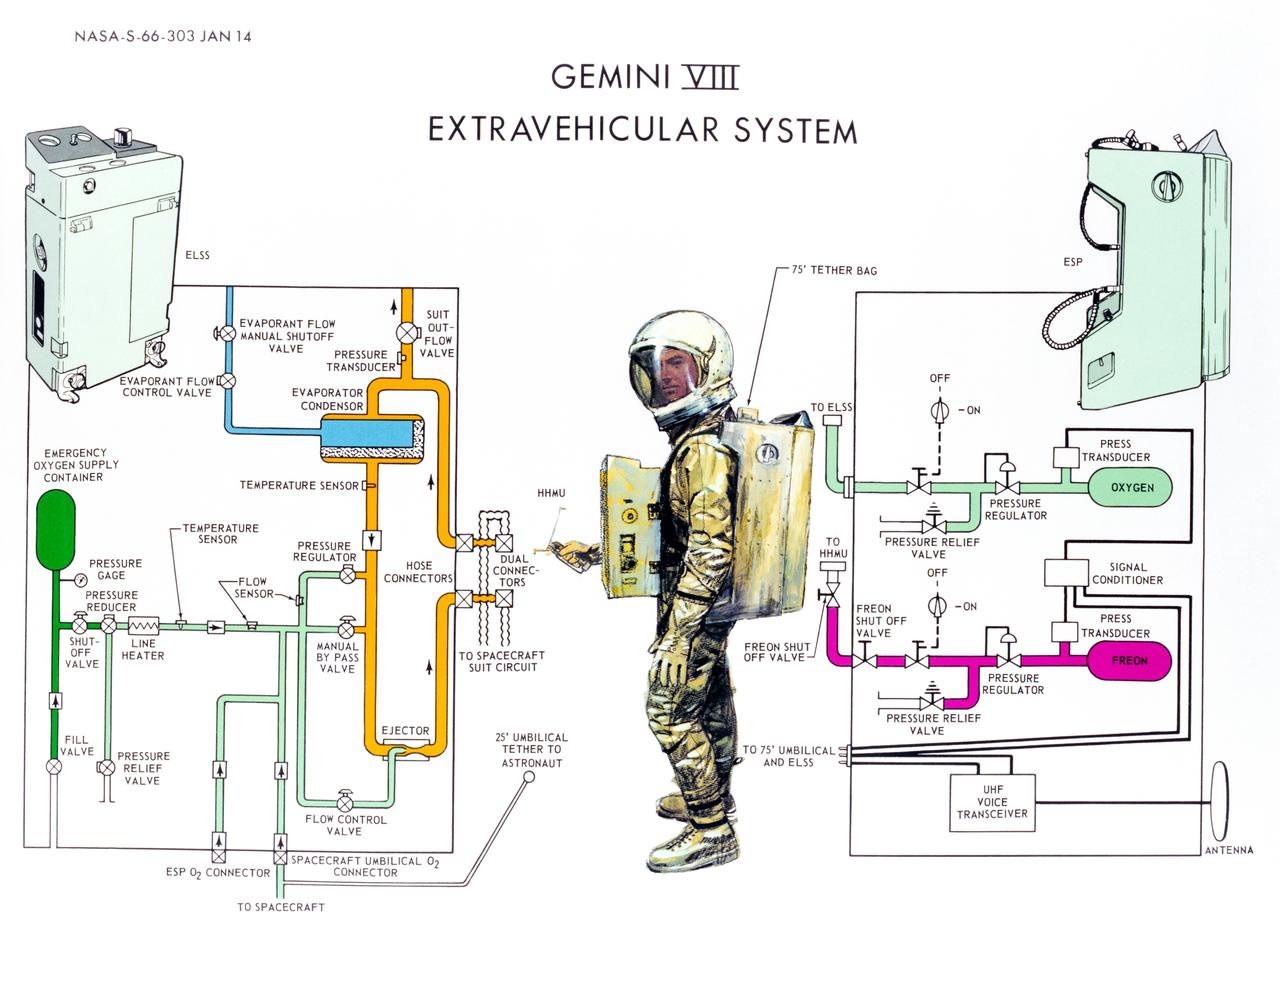
S66-00303 (14 Jan. 1966) --- Illustrative diagram showing the operation of the chest and backpacks of the Gemini-8 extravehicular system. Photo credit: NASA

On July 18, 2011, Melinda Webster of University of Washington, calculated distances between sampling locations during the 2011 ICESCAPE mission's eighth sea ice station in the Arctic Ocean. The ICESCAPE mission, or "Impacts of Climate on Ecosystems and Chemistry of the Arctic Pacific Environment," is a NASA shipborne investigation to study how changing conditions in the Arctic affect the ocean's chemistry and ecosystems. The bulk of the research took place in the Beaufort and Chukchi seas in summer 2010 and 2011. Credit: NASA/Kathryn Hansen <b><a href="http://www.nasa.gov/audience/formedia/features/MP_Photo_Guidelines.html" rel="nofollow">NASA image use policy.</a></b> <b><a href="http://www.nasa.gov/centers/goddard/home/index.html" rel="nofollow">NASA Goddard Space Flight Center</a></b> enables NASA’s mission through four scientific endeavors: Earth Science, Heliophysics, Solar System Exploration, and Astrophysics. Goddard plays a leading role in NASA’s accomplishments by contributing compelling scientific knowledge to advance the Agency’s mission. <b>Follow us on <a href="http://twitter.com/NASA_GoddardPix" rel="nofollow">Twitter</a></b> <b>Like us on <a href="http://www.facebook.com/pages/Greenbelt-MD/NASA-Goddard/395013845897?ref=tsd" rel="nofollow">Facebook</a></b> <b>Find us on <a href="http://instagrid.me/nasagoddard/?vm=grid" rel="nofollow">Instagram</a></b>
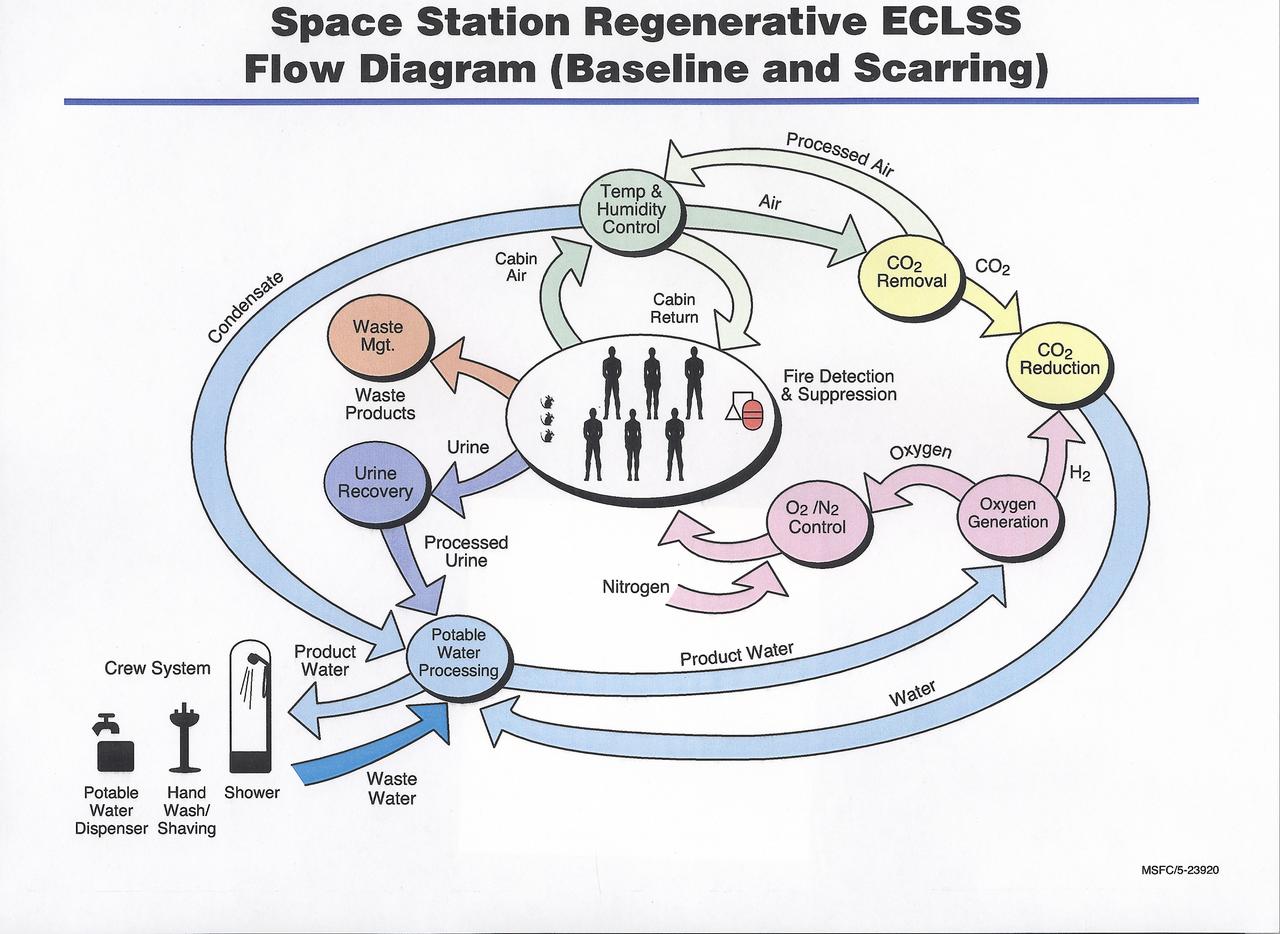
This diagram shows the flow of recyclable resources in the International Space Station (ISS). The Environmental Control and Life Support System (ECLSS) Group of the Flight Projects Directorate at the Marshall Space Flight Center is responsible for the regenerative ECLSS hardware, as well as providing technical support for the rest of the system. The regenerative ECLSS, whose main components are the Water Recovery System (WRS), and the Oxygen Generation System (OGS), reclaims and recycles water and oxygen. The ECLSS maintains a pressurized habitation environment, provides water recovery and storage, maintains and provides fire detection / suppression, and provides breathable air and a comfortable atmosphere in which to live and work within the ISS. The ECLSS hardware will be located in the Node 3 module of the ISS.
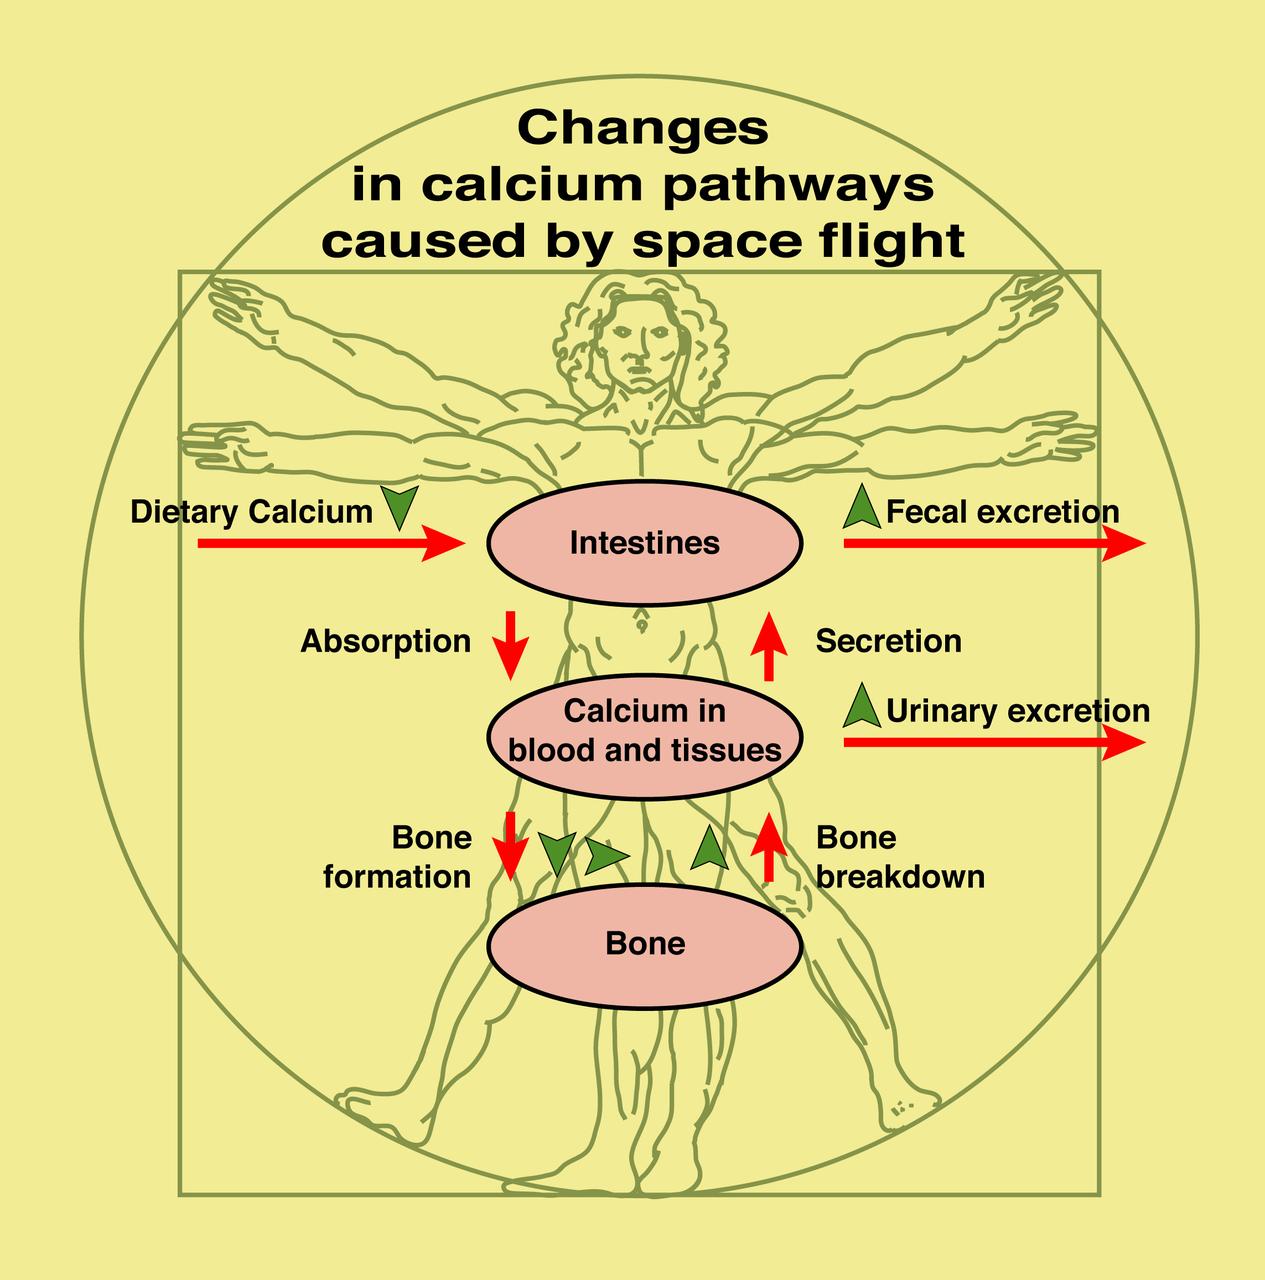
This diagram shows the normal pathways of calcium movement in the body and indicates changes (green arrows) seen during preliminary space flight experiments. Calcium plays a central role because 1) it gives strength and structure to bone and 2) all types of cells require it to function normally. To better understand how and why weightlessness induces bone loss, astronauts have participated in a study of calcium kinetics -- that is, the movement of calcium through the body, including absorption from food, and its role in the formation and breakdown of bone.

This diagram shows the planned locations of the Space Experiment Research and Processing Laboratory (SERPL) and the Space Station Commerce Park at Kennedy Space Center. The SERPL is a planned 100,000-square-foot laboratory that will provide expanded and upgraded facilities for hosting International Space Station experiment processing. In addition, it will provide better support for other biological and life sciences payload processing at KSC. It will serve as a magnet facility for the planned 400-acre Commerce Park.
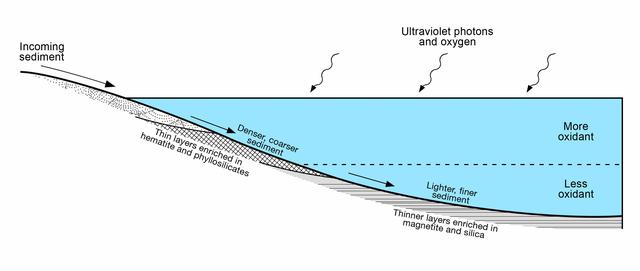
This diagram presents some of the processes and clues related to a long-ago lake on Mars that became stratified, with the shallow water richer in oxidants than deeper water was. The sedimentary rocks deposited within a lake in Mars' Gale Crater more than three billion years ago differ from each other in a pattern that matches what is seen in lakes on Earth. As sediment-bearing water flows into a lake, bedding thickness and particle size progressively decrease as sediment is deposited in deeper and deeper water as seen in examples of thick beds (PIA19074) from shallowest water, thin beds (PIA19075) from deeper water and even thinner beds (PIA19828) from deepest water. At sites on lower Mount Sharp, inside the crater, measurements of chemical and mineral composition by NASA's Curiosity Mars rover reveal a clear correspondence between the physical characteristics of sedimentary rock from different parts of the lake and how strongly oxidized the sediments were. Rocks with textures indicating that the sediments were deposited near the edge of a lake have more strongly oxidized composition than rocks with textures indicating sedimentation in deep water. For example, the iron mineral hematite is more oxidized than the iron mineral magnetite. An explanation for why such chemical stratification occurs in a lake is that the water closer to the surface is more exposed to oxidizing effects of oxygen in the atmosphere and ultraviolet light. On Earth, a stratified lake with a distinct boundary between oxidant-rich shallows and oxidant-poor depths provides a diversity of environments suited to different types of microbes. If Mars has ever hosted microbial live, the stratified lake at Gale Crater may have similarly provided a range of different habitats for life. https://photojournal.jpl.nasa.gov/catalog/PIA21500
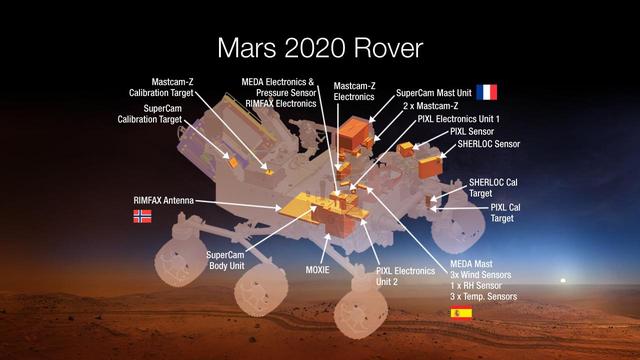
This diagram shows components of the investigations payload for NASA Mars 2020 rover mission.
S64-04925 (September 1964) --- Diagram of Gemini spacecraft location of re-entry communications experiment planned for the Gemini-Titan 3 orbital flight.
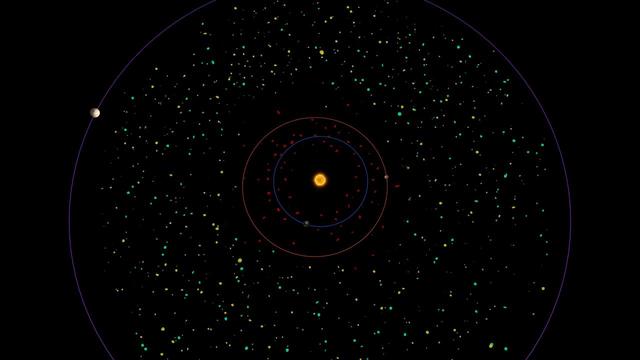
This diagram shows a bird eye view of our asteroid belt, which lies between the orbits of Mars red and Jupiter purple.
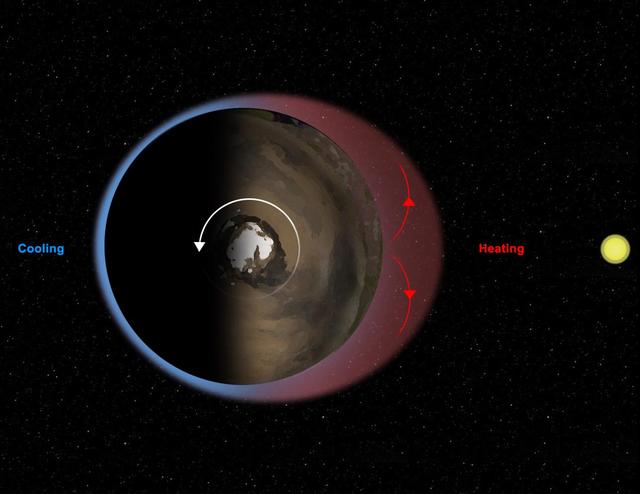
This diagram illustrates Mars thermal tides, a weather phenomenon responsible for large, daily variations in pressure at the Martian surface.

For the first time, two space-based telescopes have teamed up with ground-based observatories to observe a microlensing event, a magnification of the light of a distant star due to the gravitational effects of an unseen object in the foreground. In this case, the cause of the microlensing event was a brown dwarf, dubbed OGLE-2015-BLG-1319, orbiting a star. In terms of mass, brown dwarfs fall somewhere between the size of the largest planets and the smallest stars. Curiously, scientists have found that, for stars roughly the mass of our sun, less than 1 percent have a brown dwarf orbiting within 3 AU (1 AU is the distance between Earth and the sun). This newly discovered brown dwarf may fall in that distance range. This microlensing event was observed by ground-based telescopes looking for these uncommon events, and subsequently seen by NASA's Spitzer and Swift space telescopes. As the diagram shows, Spitzer and Swift offer additional vantage points for viewing this chance alignment. While Swift orbits close to Earth, and saw (blue diamonds) essentially the same change in light that the ground-based telescopes measured (grey markers), Spitzer's location much farther away from Earth gave it a very different perspective on the event (red circles). In particular, Spitzer's vantage point resulted in a time lag in the microlensing event it observed, compared to what was seen by Swift and the ground-based telescope. This offset allowed astronomers to determine the distance to OGLE-2015-BLG-1319 as well as its mass: around 30-65 times that of Jupiter. http://photojournal.jpl.nasa.gov/catalog/PIA21077

This diagram shows the flow of water recovery and management in the International Space Station (ISS). The Environmental Control and Life Support System (ECLSS) Group of the Flight Projects Directorate at the Marshall Space Flight Center is responsible for the regenerative ECLSS hardware, as well as providing technical support for the rest of the system. The regenerative ECLSS, whose main components are the Water Recovery System (WRS), and the Oxygen Generation System (OGS), reclaims and recycles water oxygen. The ECLSS maintains a pressurized habitation environment, provides water recovery and storage, maintains and provides fire detection/ suppression, and provides breathable air and a comfortable atmosphere in which to live and work within the ISS. The ECLSS hardware will be located in the Node 3 module of the ISS.
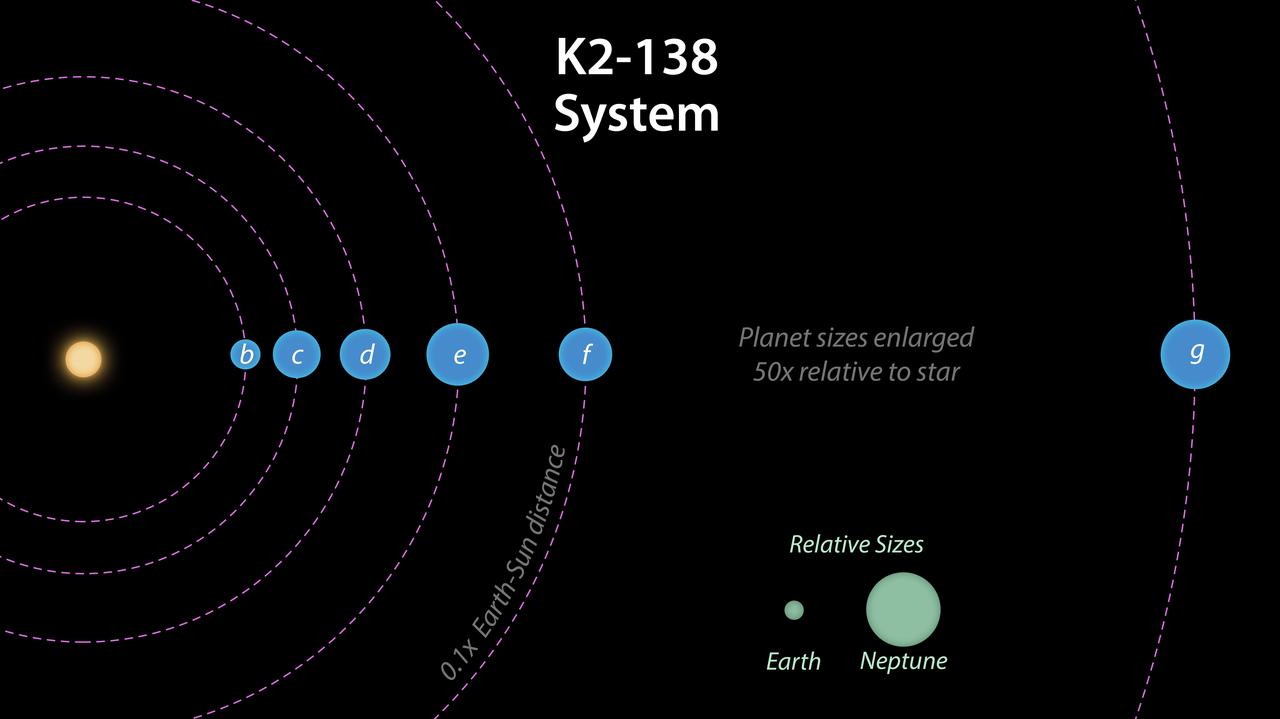
This image shows the estimated radii of the six planets in the planetary system K2-128, as well as their distance from the parent star. The radii of the Earth and Neptune are shown for scale. https://photojournal.jpl.nasa.gov/catalog/PIA23003
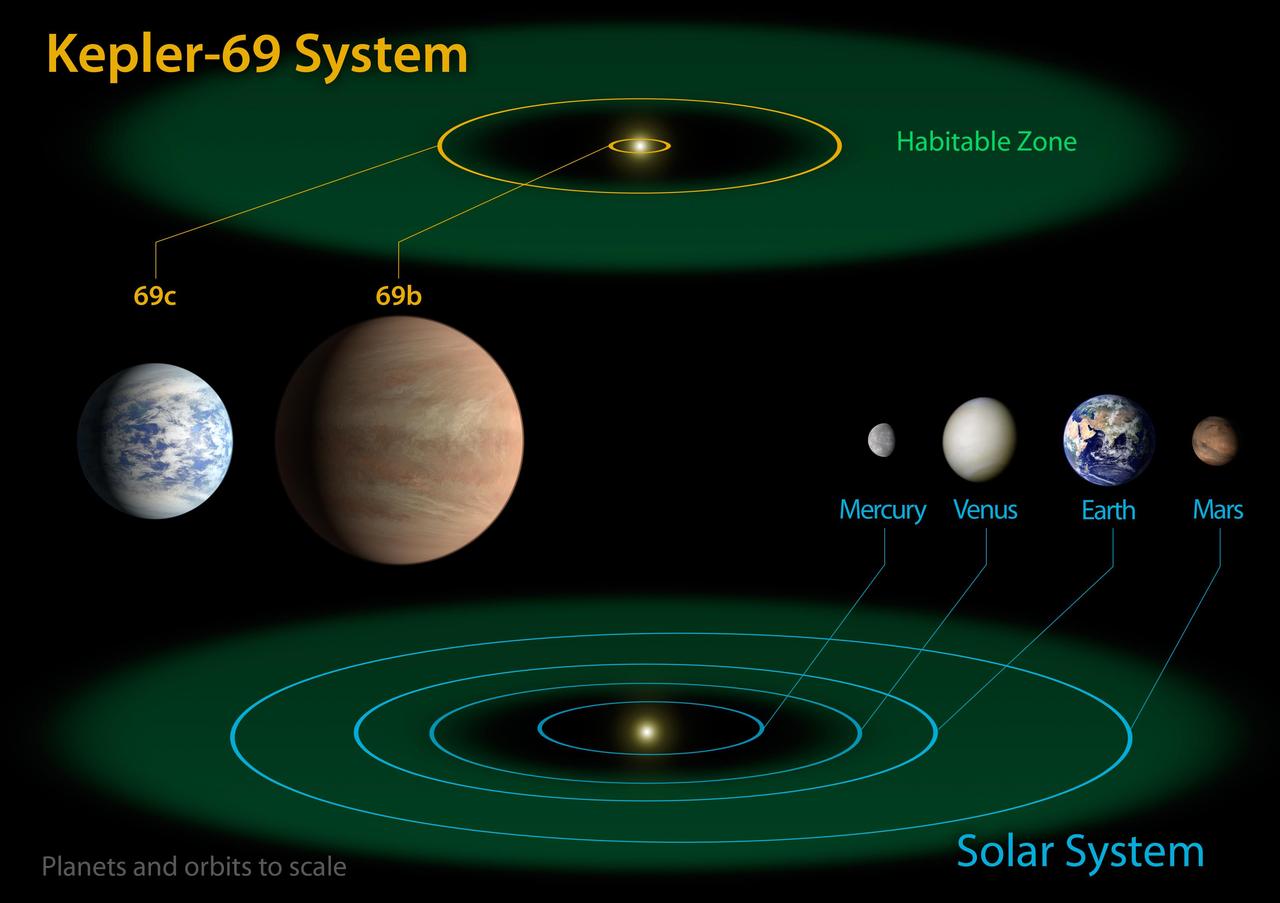
This diagram compares the planets of the inner solar system to Kepler-69, a two-planet system about 2,700 light-years from Earth in the constellation Cygnus.

The locations of brown dwarfs discovered by NASA Wide-field Infrared Survey Explorer, or WISE, and mapped by NASA Spitzer Space Telescope, are shown in this diagram as red circles.

This diagram based on results from NASA Galaxy Evolution Explorer and the Anglo-Australian Telescope illustrates two ways to measure how fast the universe is expanding.

This diagram illustrates the earliest journeys of water in a young, forming star system. NASA Spitzer Space Telescope was able to probe a crucial phase of this stellar evolution.

Our solar system features eight planets, seen in this artist’s diagram. This representation is intentionally fanciful, as the planets are depicted far closer together than they really are.
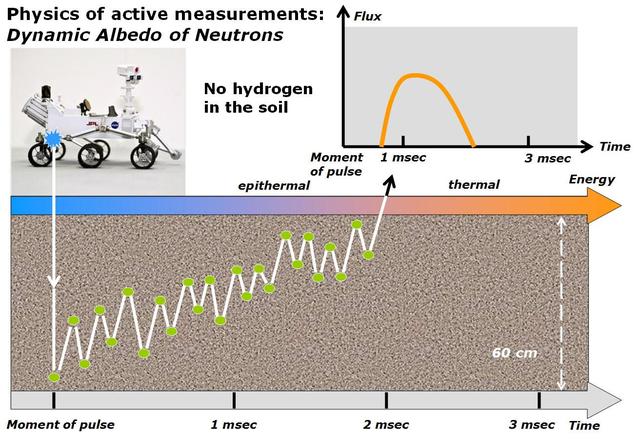
This diagram illustrates how the Dynamic Albedo of Neutrons DAN instrument on NASA Curiosity Mars rover detects hydrogen in the ground beneath the rover.
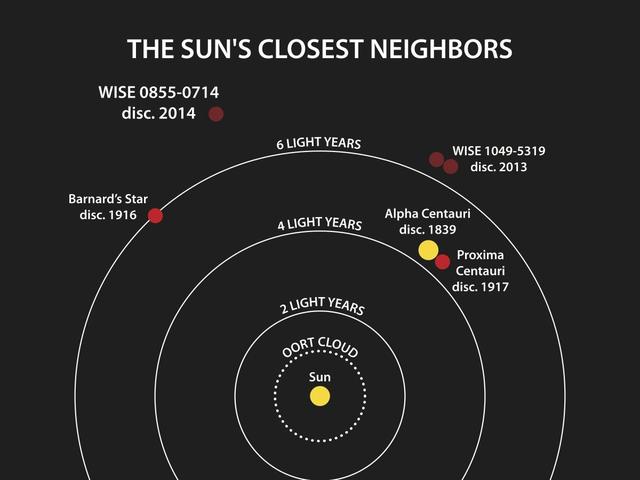
This diagram illustrates the locations of the star systems closest to the sun. The year when the distance to each system was determined is listed after the system name.
This artist diagram based on observations from NASA Spitzer Space Telescope compares the Epsilon Eridani system to our own solar system. The two systems are structure
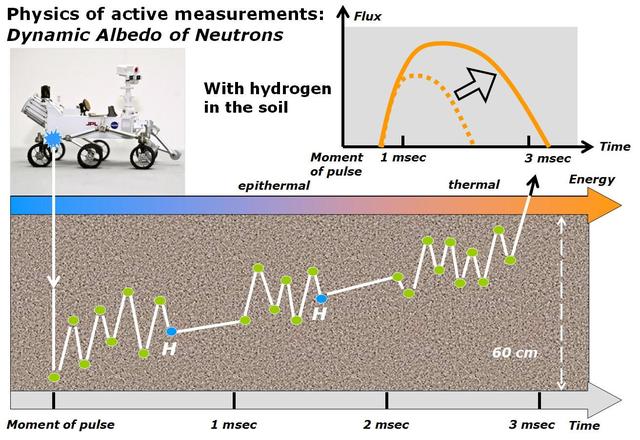
This diagram illustrates how the Dynamic Albedo of Neutrons DAN instrument on NASA Curiosity Mars rover detects hydrogen in the ground beneath the rover.
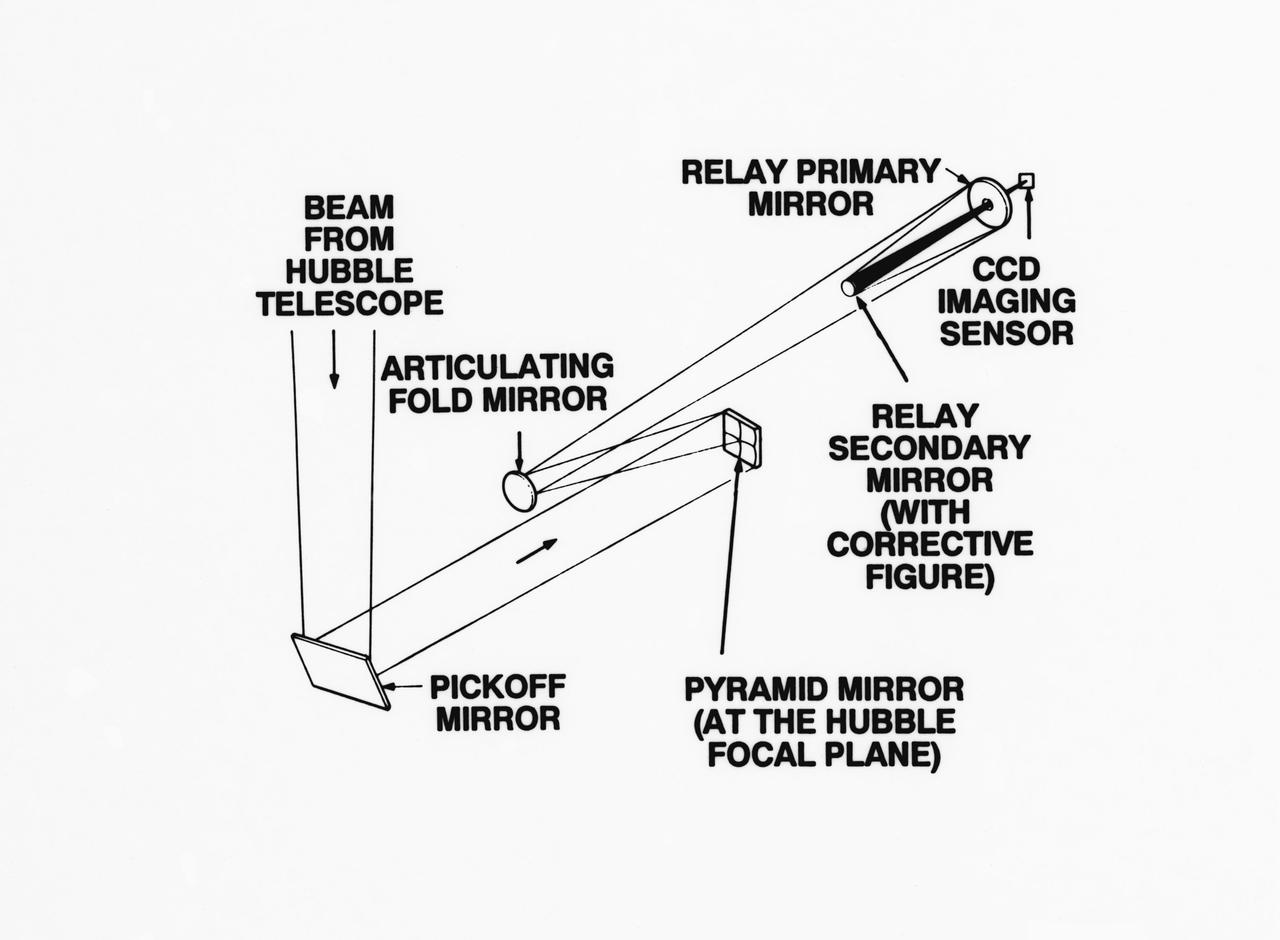
S93-33258 (15 Mar 1993) --- An optical schematic diagram of one of the four channels of the Wide Field\Planetary Camera-2 (WF\PC-2) shows the path taken by beams from the Hubble Space Telescope (HST) before an image is formed at the camera's charge-coupled devices. A team of NASA astronauts will pay a visit to the HST later this year, carrying with them the new WF/PC-2 to replace the one currently on the HST. The Jet Propulsion Laboratory in Pasadena, California has been working on the replacement system for several months. See NASA photo S93-33257 for a close-up view of tiny articulating mirrors designed to realign incoming light in order to make certain the beams fall precisely in the middle of the secondary mirrors.
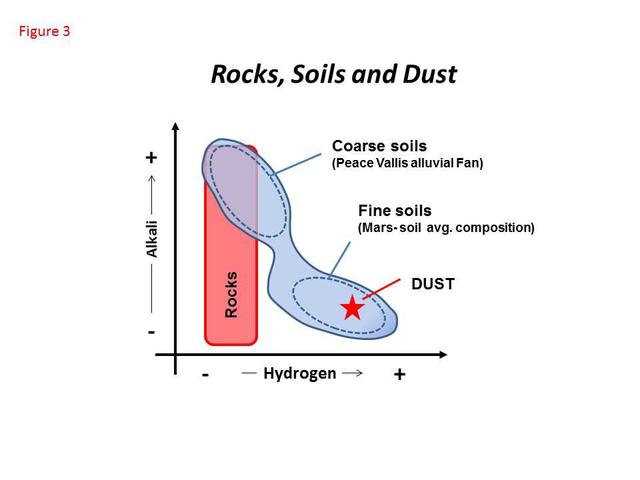
This diagram shows how materials analyzed by the ChemCam instrument on NASA Curiosity Mars rover during the first 100 Martian days of the mission differed with regard to hydrogen content horizontal axis and alkali vertical axis.
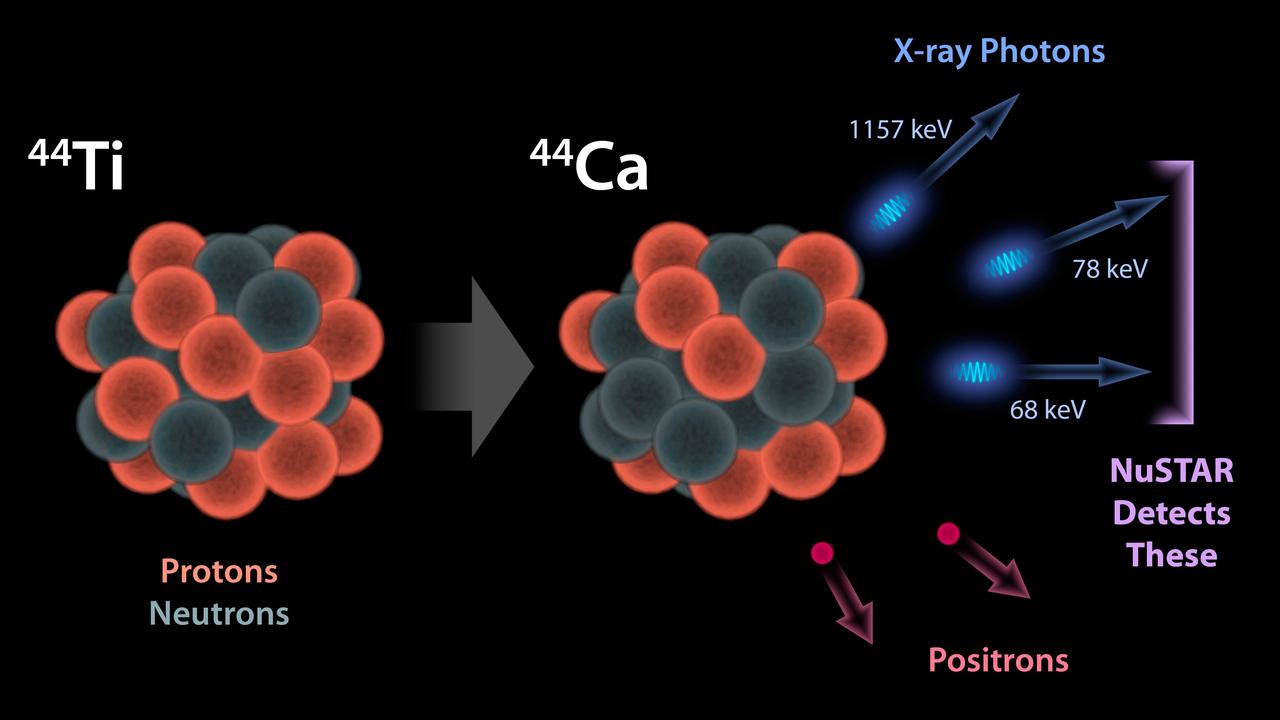
This diagram illustrates why NASA NuSTAR can see radioactivity in the remains of exploded stars for the first time. The observatory detects high-energy X-ray photons that are released by a radioactive substance called titanium-44.

This diagram illustrates that mature planetary systems like our own might be more common around twin, or binary, stars that are either really close together, or really far apart.
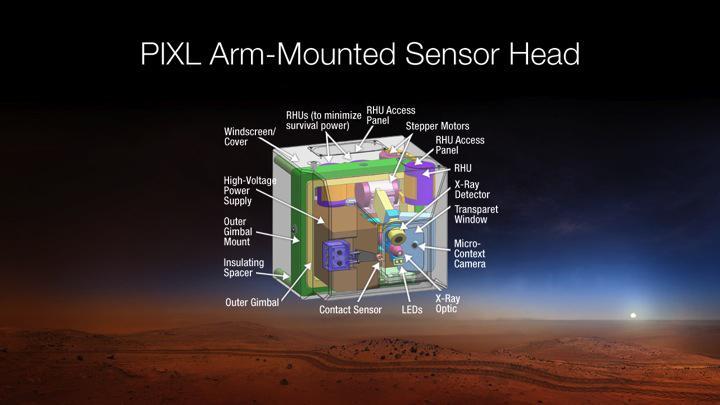
This diagram depicts the sensor head of the Planetary Instrument for X-RAY Lithochemistry, or PIXL, which has been selected as one of seven investigations for the payload of NASA Mars 2020 rover mission.

This diagram illustrates how astronomers using NASA Spitzer Space Telescope can capture the elusive spectra of hot-Jupiter planets. Spectra are an object light spread apart into its basic components, or wavelengths.
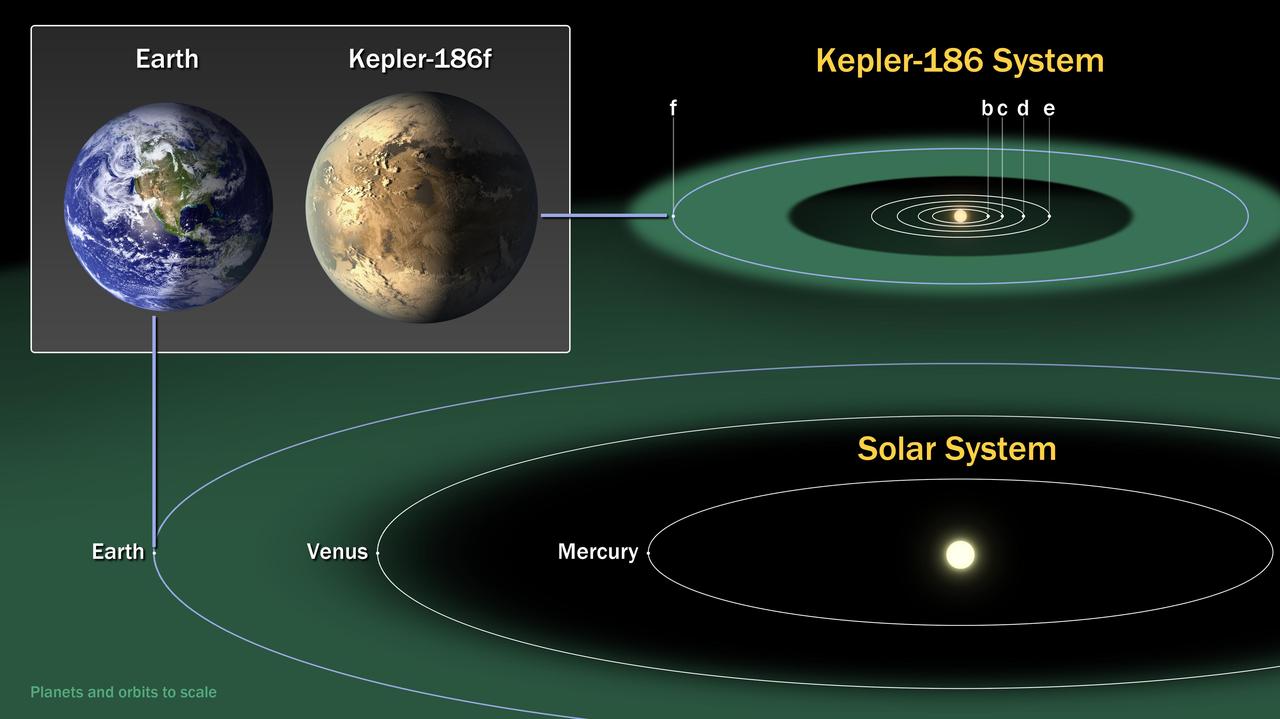
This diagram compares the planets of our inner solar system to Kepler-186, a five-planet star system about 500 light-years from Earth in the constellation Cygnus.
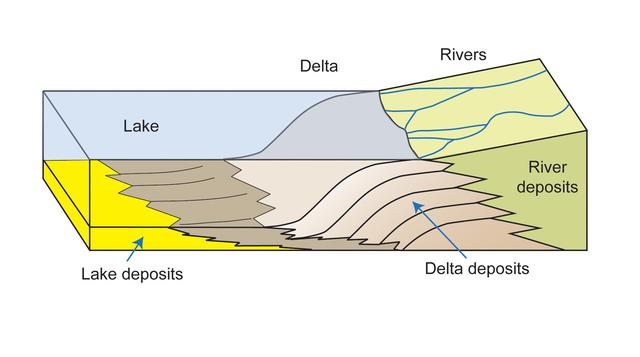
This diagram depicts rivers entering a lake. Where the water flow decelerates, sediments drop out, and a delta forms, depositing a prism of sediment that tapers out toward the lake interior.

Jupiter, Saturn, Uranus, and Neptune are known as the jovian Jupiter-like planets because they are all gigantic compared with Earth, and they have a gaseous nature. This diagram shows the approximate distance of the jovian planets from the Sun.
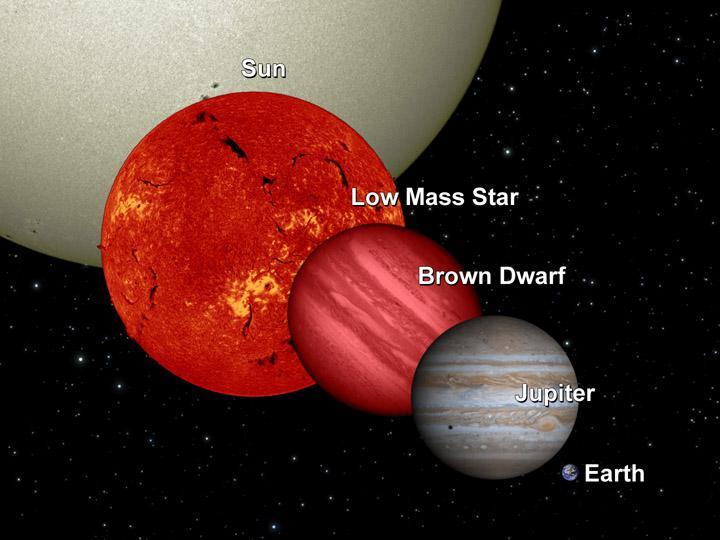
NASA Wide-field Infrared Survey Explorer will uncover many failed stars, or brown dwarfs, in infrared light. This diagram shows a brown dwarf in relation to Earth, Jupiter, a low-mass star and the sun.
This diagram shows findings of results of observations made primarily by NASA Spitzer Telescopes and the Very Large Array radio telescope and illuminates new details about a celestial andbar connecting two massive islands of galaxies.
This diagram illustrates the positions of Mars, Earth and the sun during a period that occurs approximately every 26 months, when Mars passes almost directly behind the sun from Earth perspective.
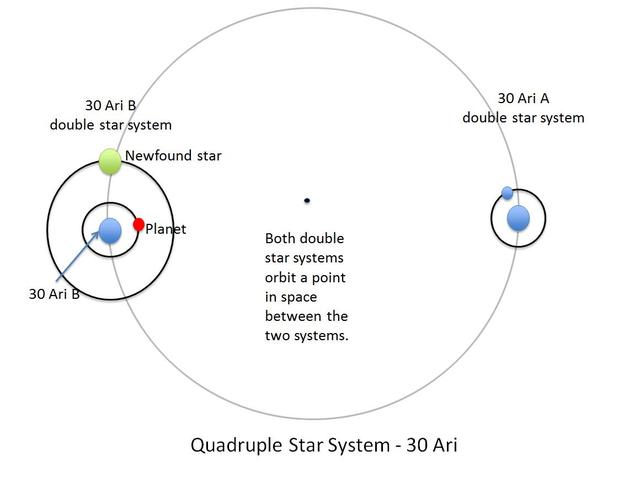
The four stars and one planet of the 30 Ari system are illustrated in this diagram. This quadruple star system consists of two pairs of stars: 30 Ari B and 30 Ari A.
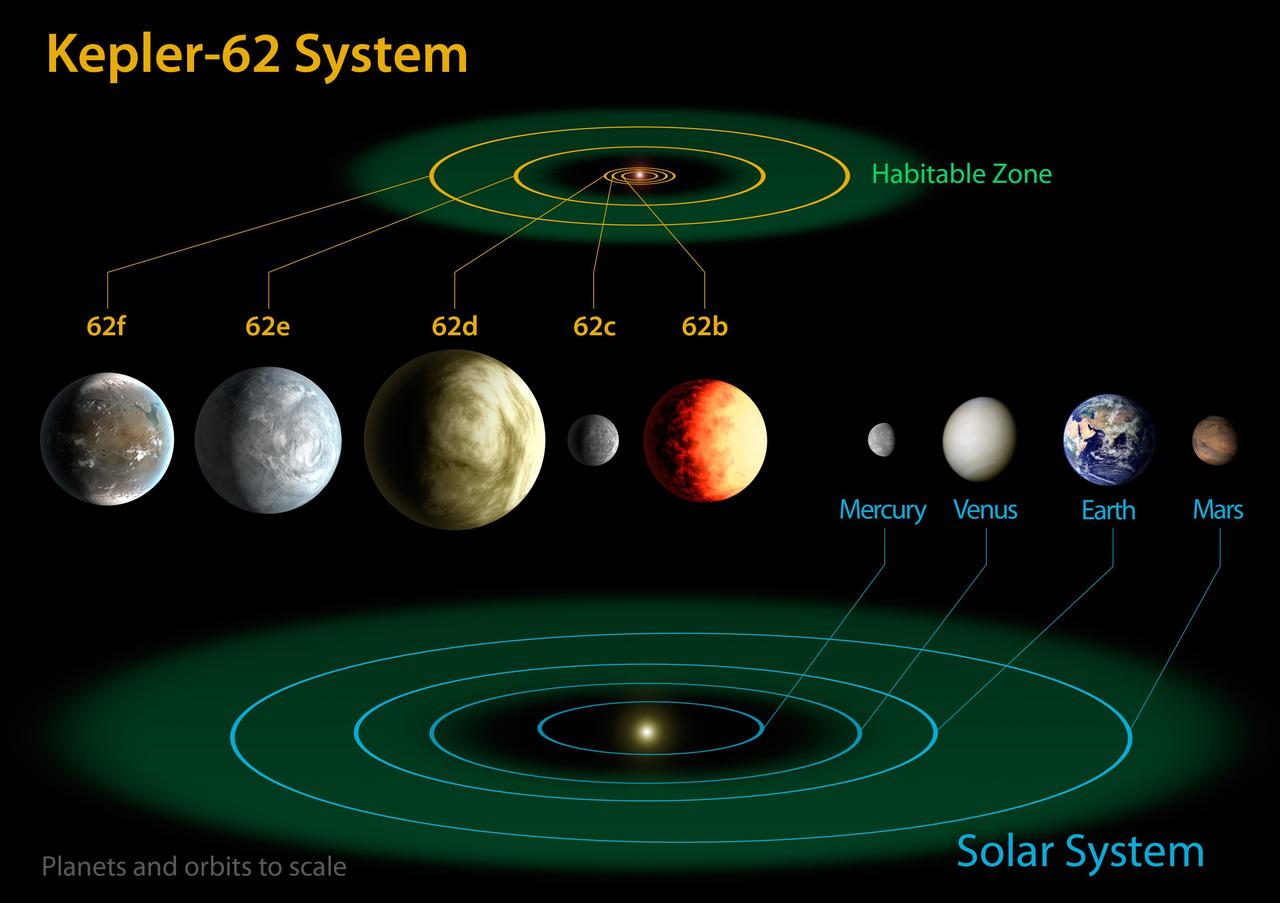
This diagram compares the planets of the inner solar system to Kepler-62, a five-planet system about 1,200 light-years from Earth in the constellation Lyra. At seven billion years old, the star is somewhat older than the sun.
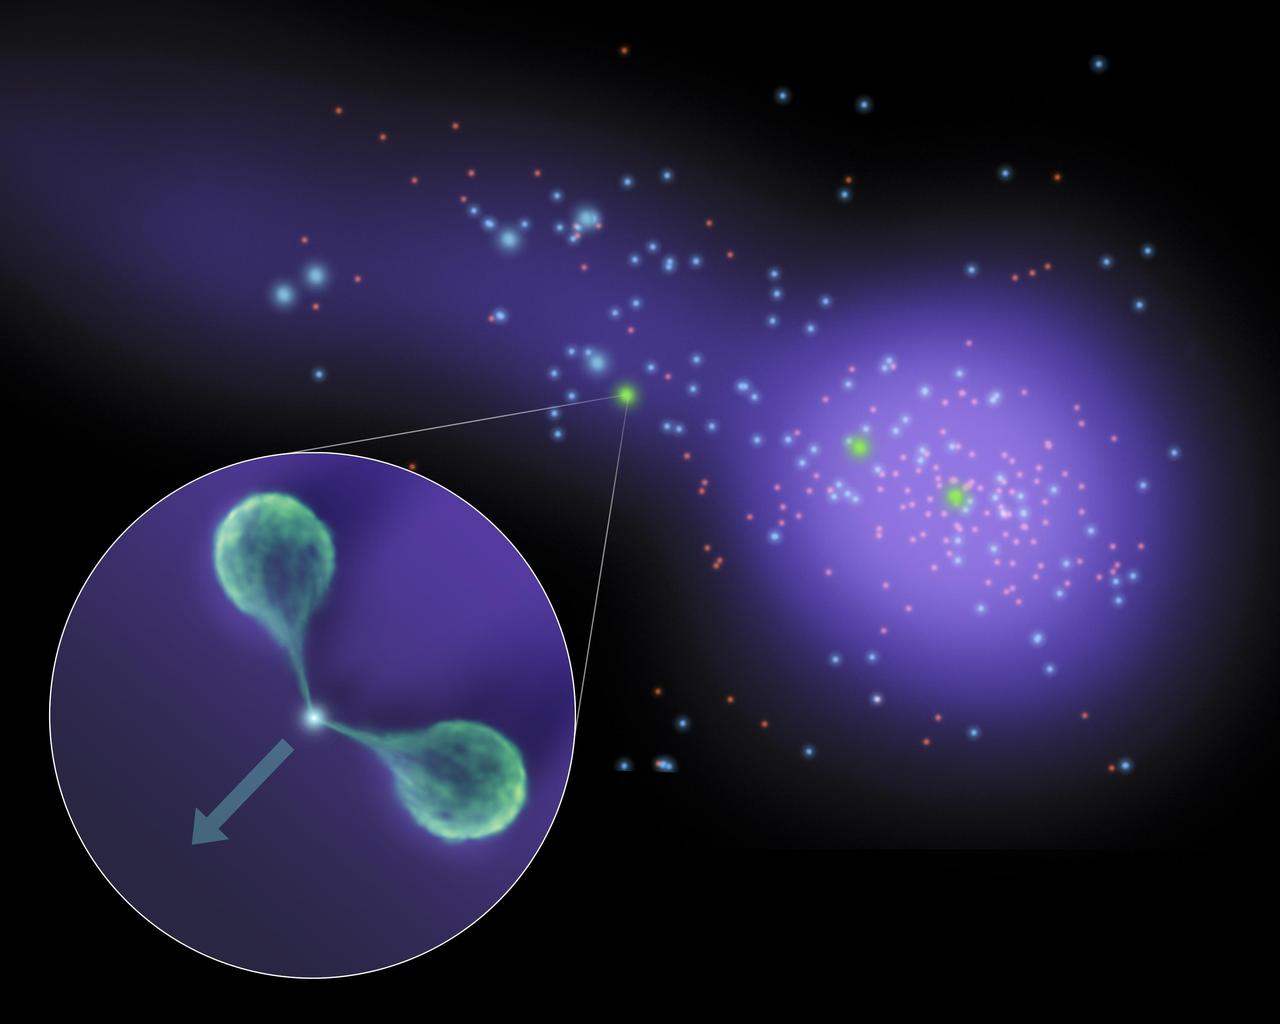
NASA Galaxy Evolution Explorer spacecraft and Cerro Tololo Inter-American Observatory combined data making this diagram illustratrating the extent to which astronomers have been underestimating the proportion of small to big stars in certain galaxies.
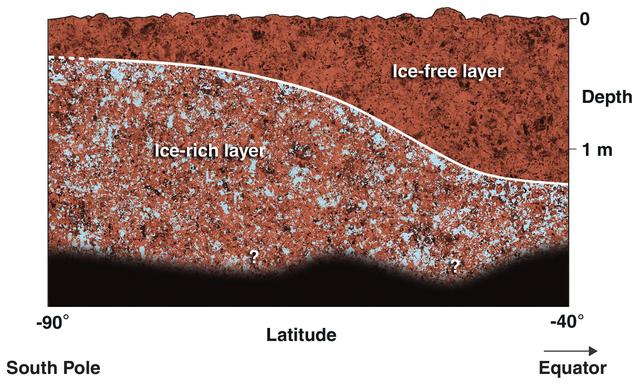
This diagram shows a possible configuration of ice-rich and dry soil in the upper meter 3 feet of Mars. The ice-rich soil was detected by the gamma ray spectrometer suite of instruments aboard NASA Mars Odyssey spacecraft.
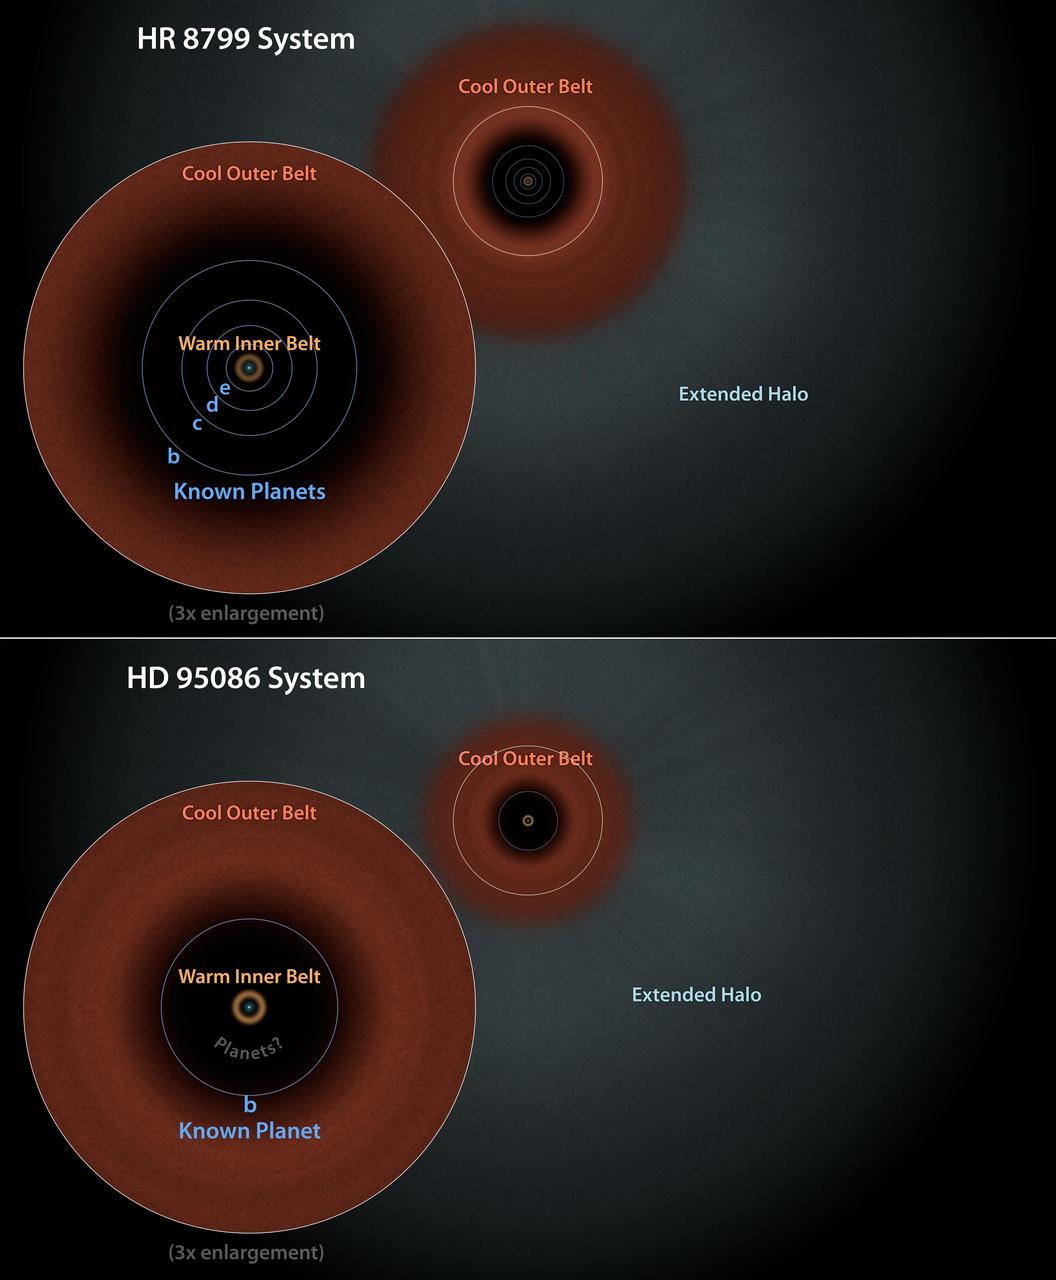
This diagram illustrates two similar star systems, HD 95086 and HR 8799. Evidence from NASA Spitzer Space Telescope has pointed to the presence of two dust belts in each system.

jsc2020e016851 (3/26/2020) --- A Preflight diagram of the interactive live streaming system for the Space Studio Kibo experiment. Image Courtesy of: © Bascule Inc
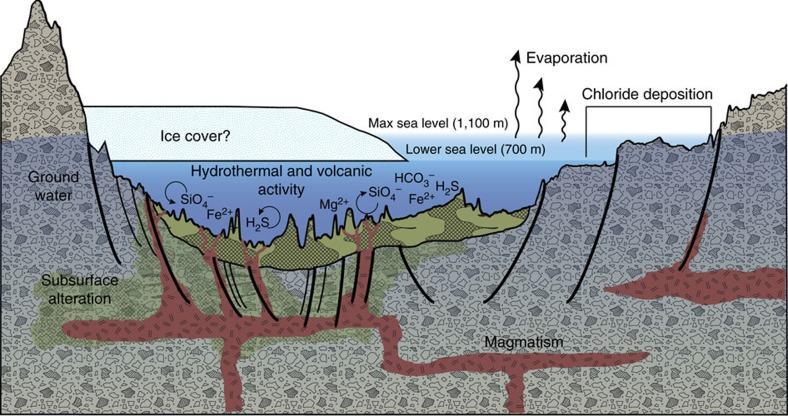
This diagram illustrates an interpretation for the origin of some deposits in the Eridania basin of southern Mars as resulting from seafloor hydrothermal activity more than 3 billion years ago. The ground level depicted is an exaggerated topography of a transect about 280 miles (450 kilometers) long. Blue portions of the diagram depict water-depth estimates and the possibility of ice covering the ancient sea. Thick, clay-rich deposits (green) formed through hydrothermal alteration of volcanic materials in deep water, by this model. Notations indicate deep-water reactions of iron and magnesium ions with silicates, sulfides and carbonates. Deep-seated structural discontinuities could have facilitated the ascent of magma from a mantle source. Chloride deposits formed from evaporation of seawater at higher elevations in the basin. https://photojournal.jpl.nasa.gov/catalog/PIA22060
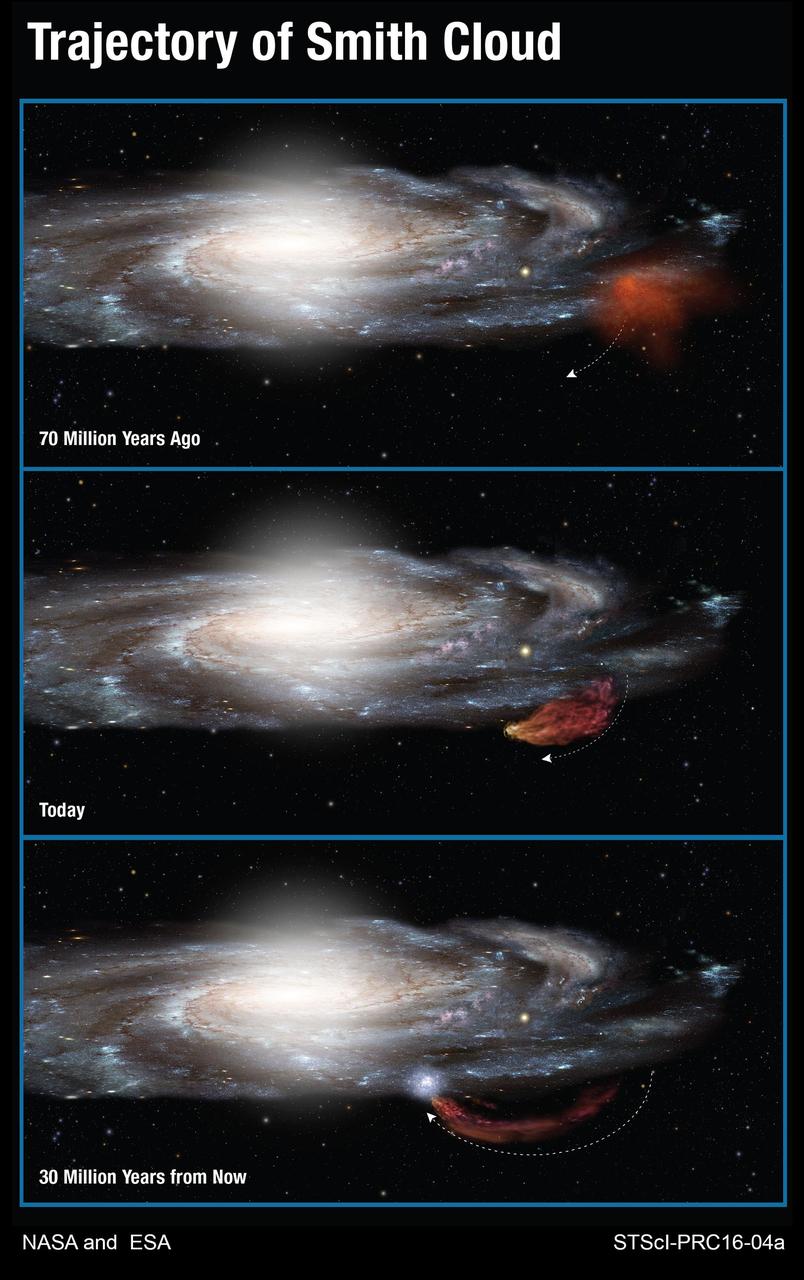
This artist diagram shows the Smith Cloud as it arcs out of the plane of our Milky Way galaxy, then returning like a boomerang. Hubble Telescope measurements that it came out of a region near the edge of the galaxy disk of stars 70 million years ago

This diagram compares our own solar system to Kepler-22, a star system containing the first habitable zone planet -- the sweet spot around a star where temperatures are right for water to exist in its liquid form, discovered by NASA Kepler mission.
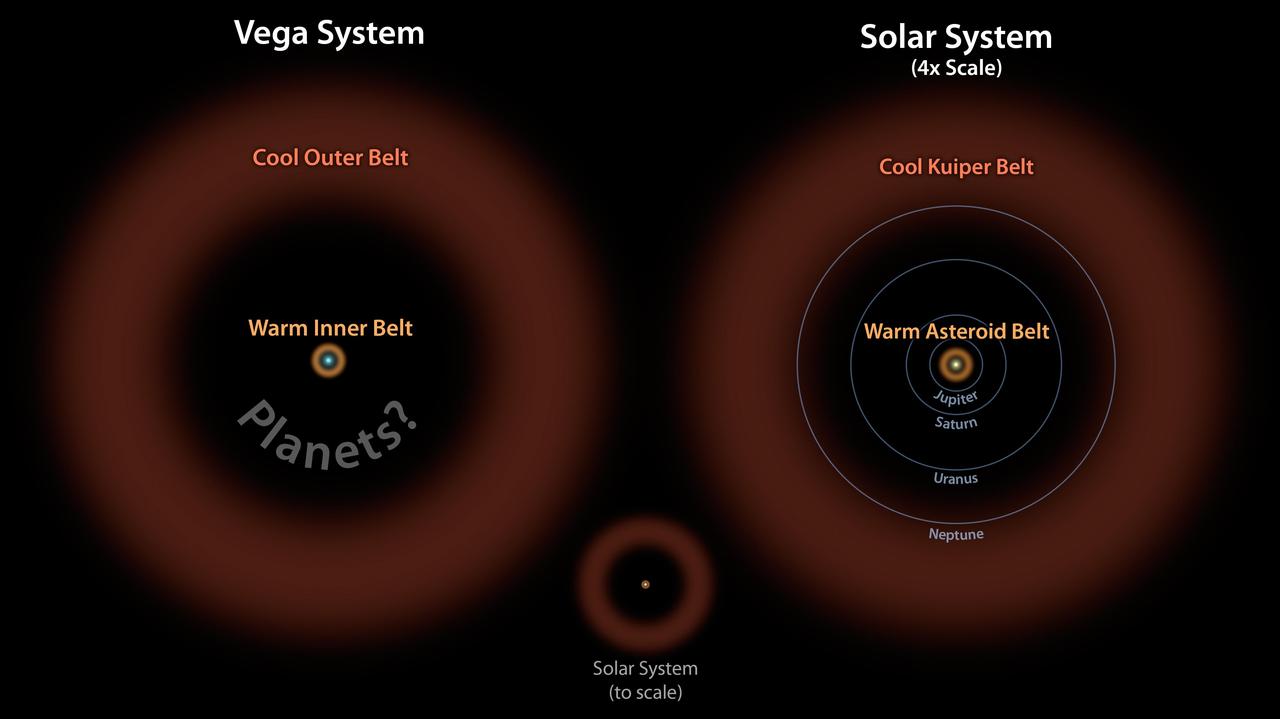
In this diagram, the Vega system, which was already known to have a cooler outer belt of comets orange, is compared to our solar system with its asteroid and Kuiper belts. The ring of warm, rocky debris was detected using NASA Spitzer Space Telescope,

This artist diagram compares our solar system below to the VB 10 star system. Astronomers successfully used the astrometry planet-hunting method for the first time to discover a gas planet, called VB 10b, around a very tiny star, VB 10.
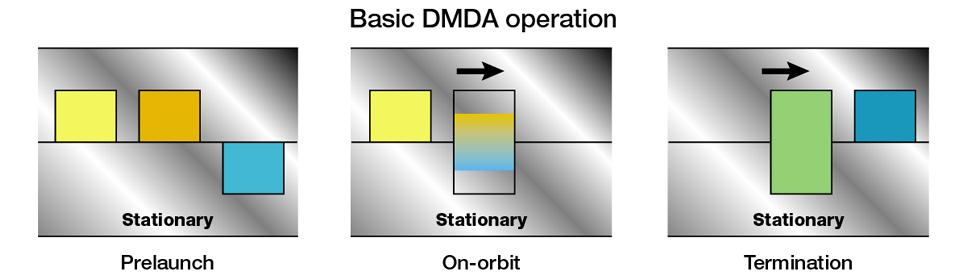
Experiments to seek solutions for a range of biomedical issues are at the heart of several investigations that will be hosted by the Commercial Instrumentation Technology Associates (ITA), Inc. Biomedical Experiments (CIBX-2) payload. CIBX-2 is unique, encompassing more than 20 separate experiments including cancer research, commercial experiments, and student hands-on experiments from 10 schools as part of ITA's ongoing University Among the Stars program. This drawing depicts a cross-section of a set of Dual-Materials Dispersion Apparatus (DMDA) specimen wells, one of which can include a reverse osmosis membrane to dewater a protein solution and thus cause crystallization. Depending on individual needs, two or three wells may be used, the membrane may be absent, or other proprietary enhancements may be present. The experiments are sponsored by NASA's Space Product Development Program (SPD).
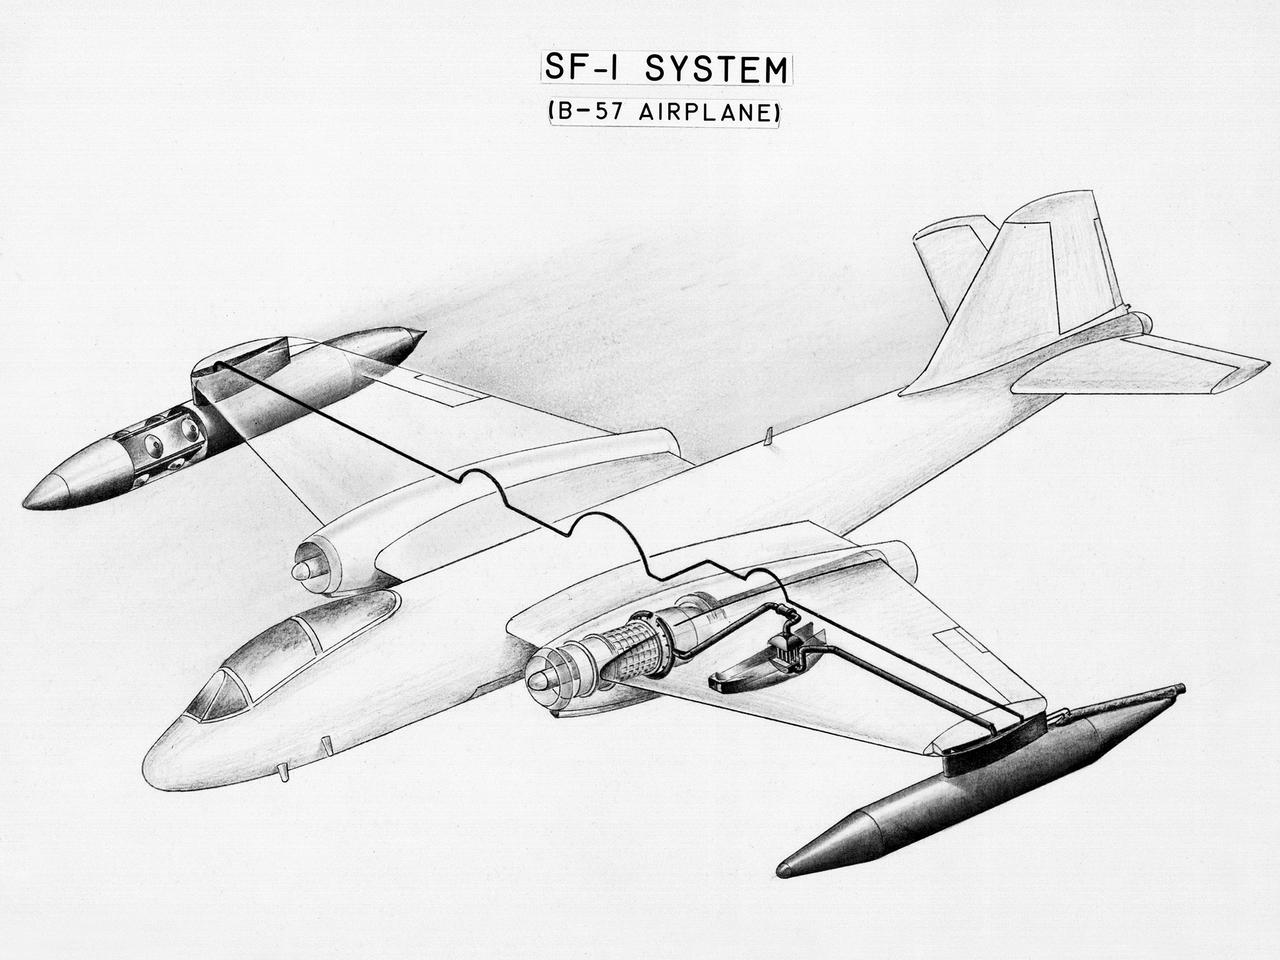
This diagram shows a hydrogen fuel system designed by researchers at the National Advisory Committee for Aeronautics (NACA) Lewis Flight Propulsion Laboratory and installed on a Martin B-57B Canberra aircraft. Lewis researchers accelerated their studies of high energy propellants in the early 1950s. In late 1954, Lewis researchers studied the combustion characteristics of gaseous hydrogen in a turbojet combustor. It was found that the hydrogen provided a very high efficiency. Almost immediately thereafter, Associate Director Abe Silverstein became focused on the possibilities of hydrogen for aircraft propulsion. That fall, Silverstein secured a contract to work with the air force to examine the practicality of liquid hydrogen aircraft. A B-57B Canberra was obtained by the air force especially for this project, referred to as Project Bee. The aircraft was powered by two Wright J65 engines, one of which was modified so that it could be operated using either traditional or liquid hydrogen propellants. The engine and its liquid hydrogen fuel system were tested extensively in the Altitude Wind Tunnel and the Four Burner Area test cells in 1955 and 1956. A B-57B flight program was planned to test the system on an actual aircraft. The aircraft would take off using jet fuel, switch to liquid hydrogen while over Lake Erie, then after burning the hydrogen supply switch back to jet fuel for the landing. The third test flight, in February 1957, was a success, and the ensuing B-57B flights remain the only demonstration of hydrogen-powered aircraft.

Guidance and Navaigation: CV-990 Shuttle simulation - descent at Edwards Airforce Base, Dryden Flight Research Center, CA (Shuttle un-powered descent and landing diagram)
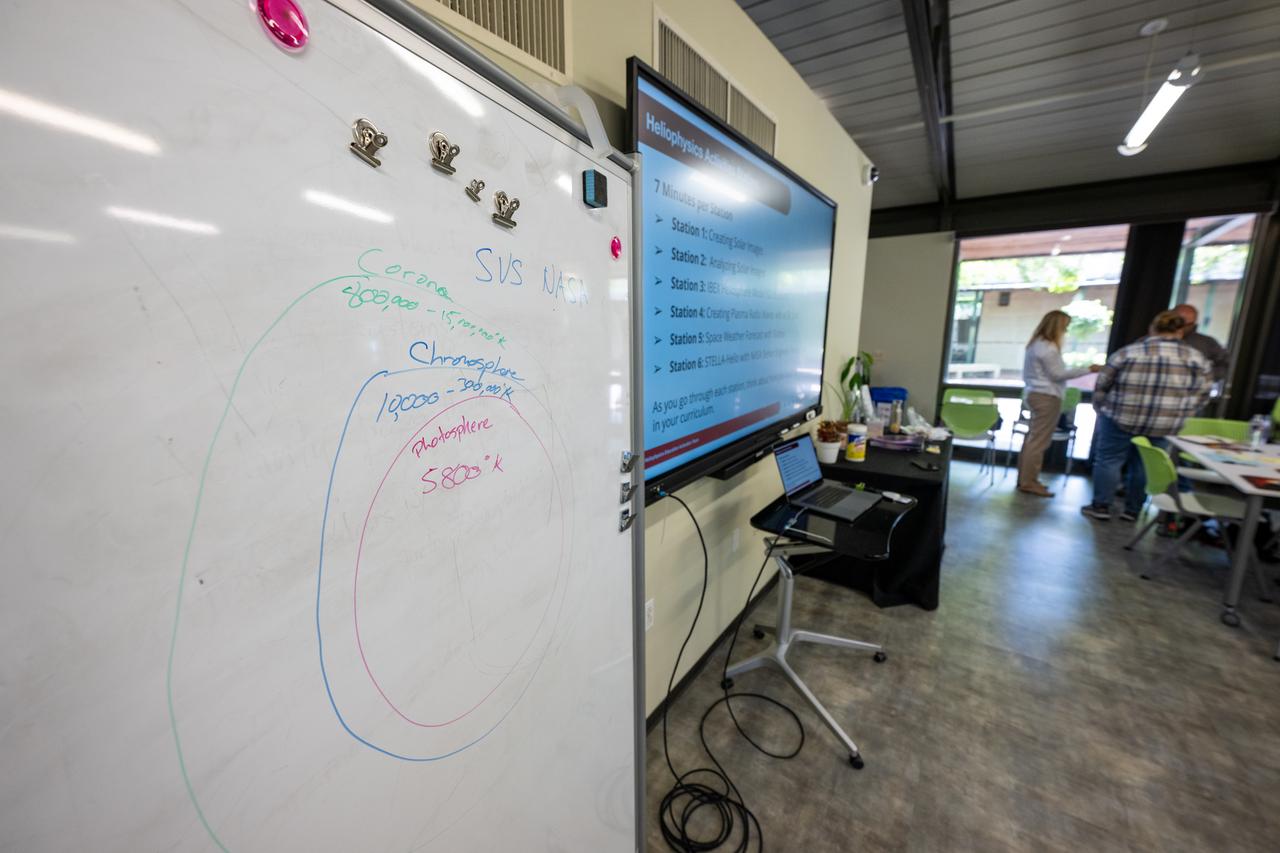
A diagram is seen during a teacher professional development event hosted by the NASA Heliophysics Education Activation Team (HEAT) at the Dallas Arboretum, Saturday, April 6, 2024, in Dallas, Texas. Photo Credit: (NASA/Keegan Barber)
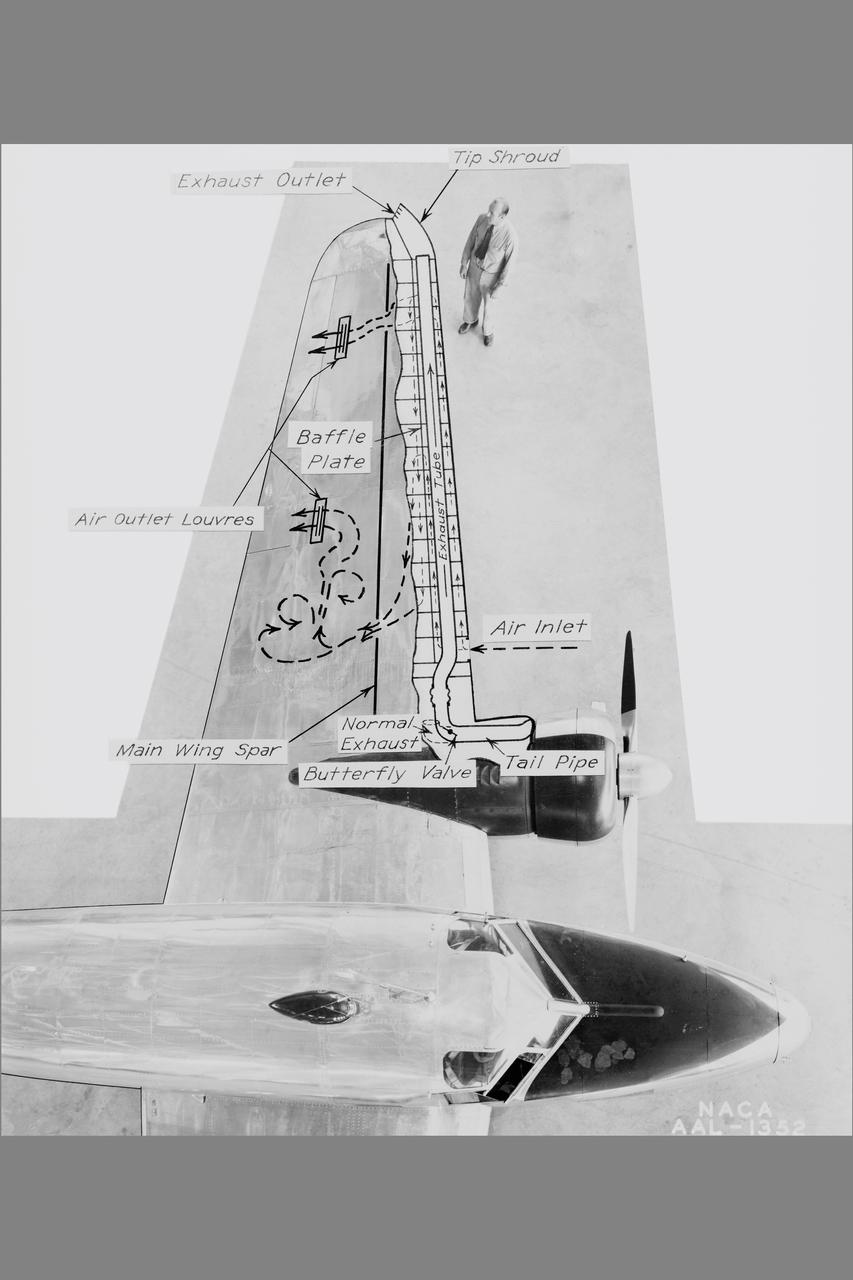
NACA Photographer NASA Ames De-icing project: diagram of the systems using exhaust-heated air to prevent icing on the Lockheed 12A wings Published: Adventures in Research SP-4302
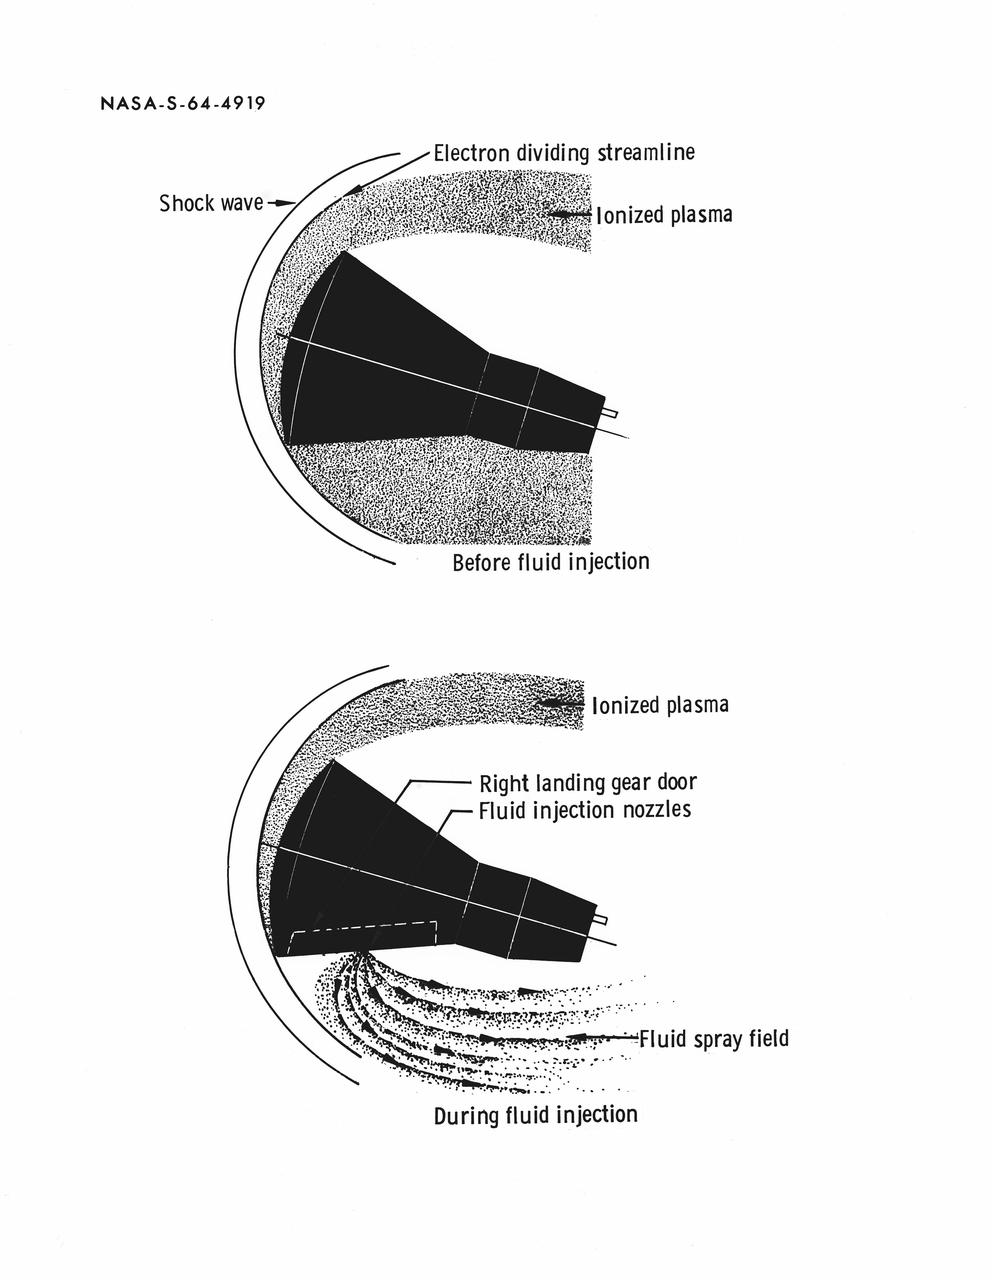
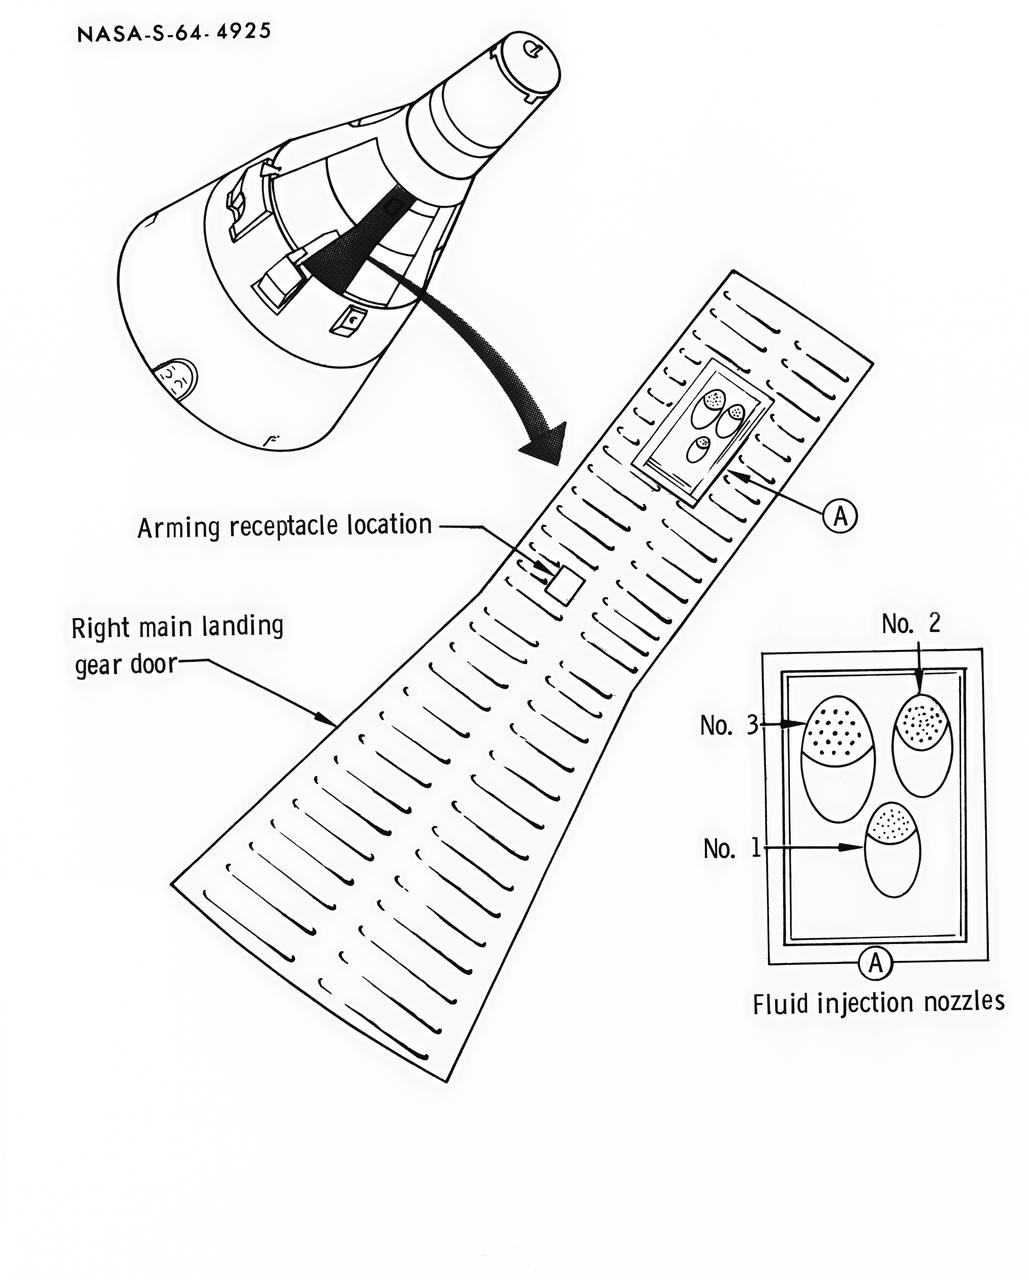
S64-04919 (September 1964) --- Diagram of reduction of the re-entry ionized plasma about a Gemini spacecraft by fluid injection, an experiment planned for the Gemini-Titan 3 orbital flight.
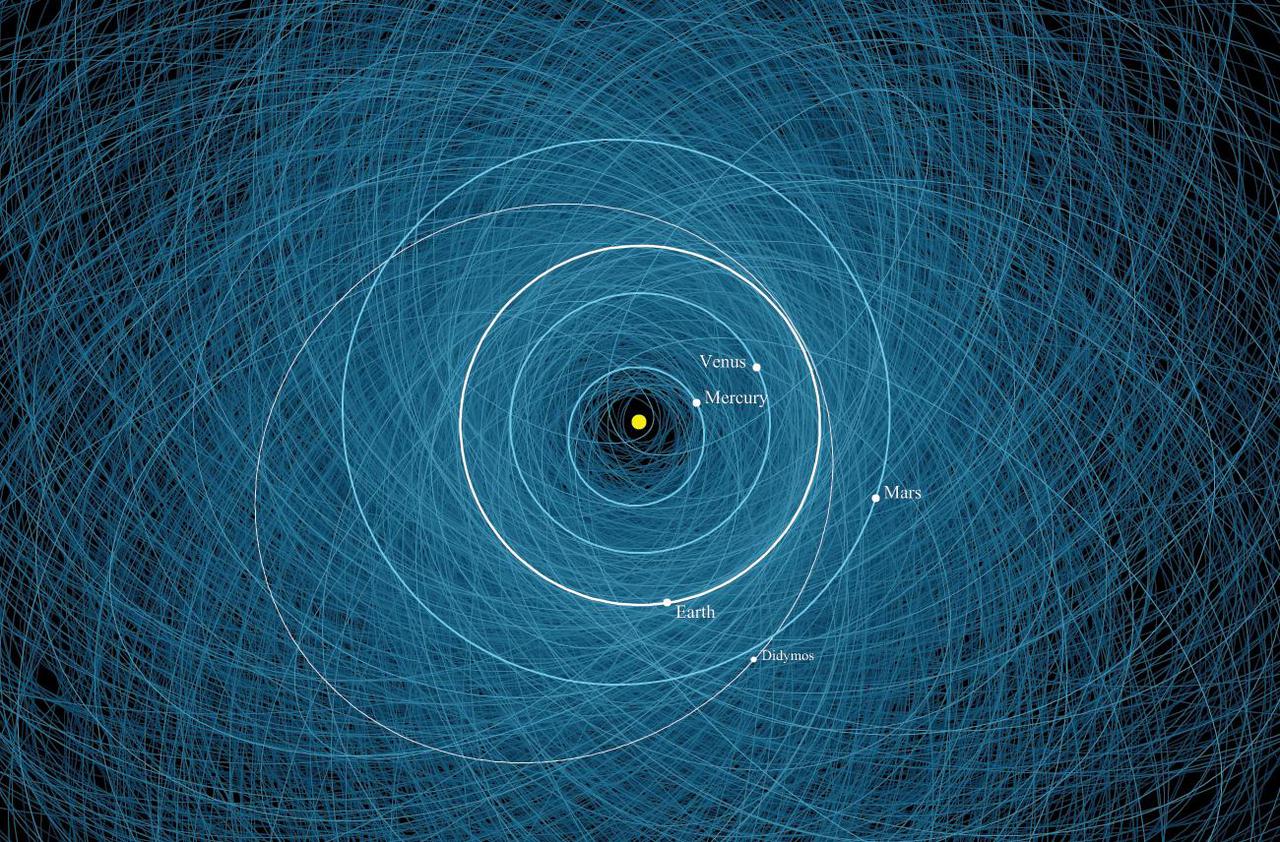
This diagram shows the orbit of binary asteroid Didymos around the Sun. Didymos consists of a large, nearly half-mile-wide (780-meter-wide) asteroid orbited by a smaller, 525-foot-wide (160-meter-wide) asteroid, or moonlet. Didymos' orbital path around the Sun is shown as the thin white ellipse and Earth's orbit is the thick white line. In the background are the orbits for 2,200 other known potentially hazardous asteroids. A potentially hazardous asteroid is classified as an asteroid wider than about 460 feet (140 meters) with an orbit that brings it within 5 million miles (8 million kilometers) of Earth's orbit. Didymos' smaller asteroid is the target of NASA's Double Asteroid Redirect Test (DART) mission. The DART spacecraft is a kinetic impactor designed to collide with the moonlet to see how its orbit around the larger asteroid will be changed by the impact. The outcome of this mission will help NASA determine whether the method could be used to modify the trajectory of an asteroid should one threaten Earth in the future. Didymos is not a danger to our planet. This orbital diagram was produced by the Center for Near Earth Object Studies (CNEOS), which is managed by NASA's Jet Propulsion Laboratory in Southern California. CNEOS characterizes every known near-Earth asteroid (NEA) orbit to improve long-term impact hazard assessments in support of NASA's Planetary Defense Coordination Office (PDCO). https://photojournal.jpl.nasa.gov/catalog/PIA24565

Of the 1,030 confirmed planets from Kepler, a dozen are less than twice the size of Earth and reside in the habitable zone of their host stars. In this diagram, the sizes of the exoplanets are represented by the size of each sphere. These are arranged by size from left to right, and by the type of star they orbit, from the M stars that are significantly cooler and smaller than the sun, to the K stars that are somewhat cooler and smaller than the sun, to the G stars that include the sun. The sizes of the planets are enlarged by 25 times compared to the stars. The Earth is shown for reference. http://photojournal.jpl.nasa.gov/catalog/PIA19827
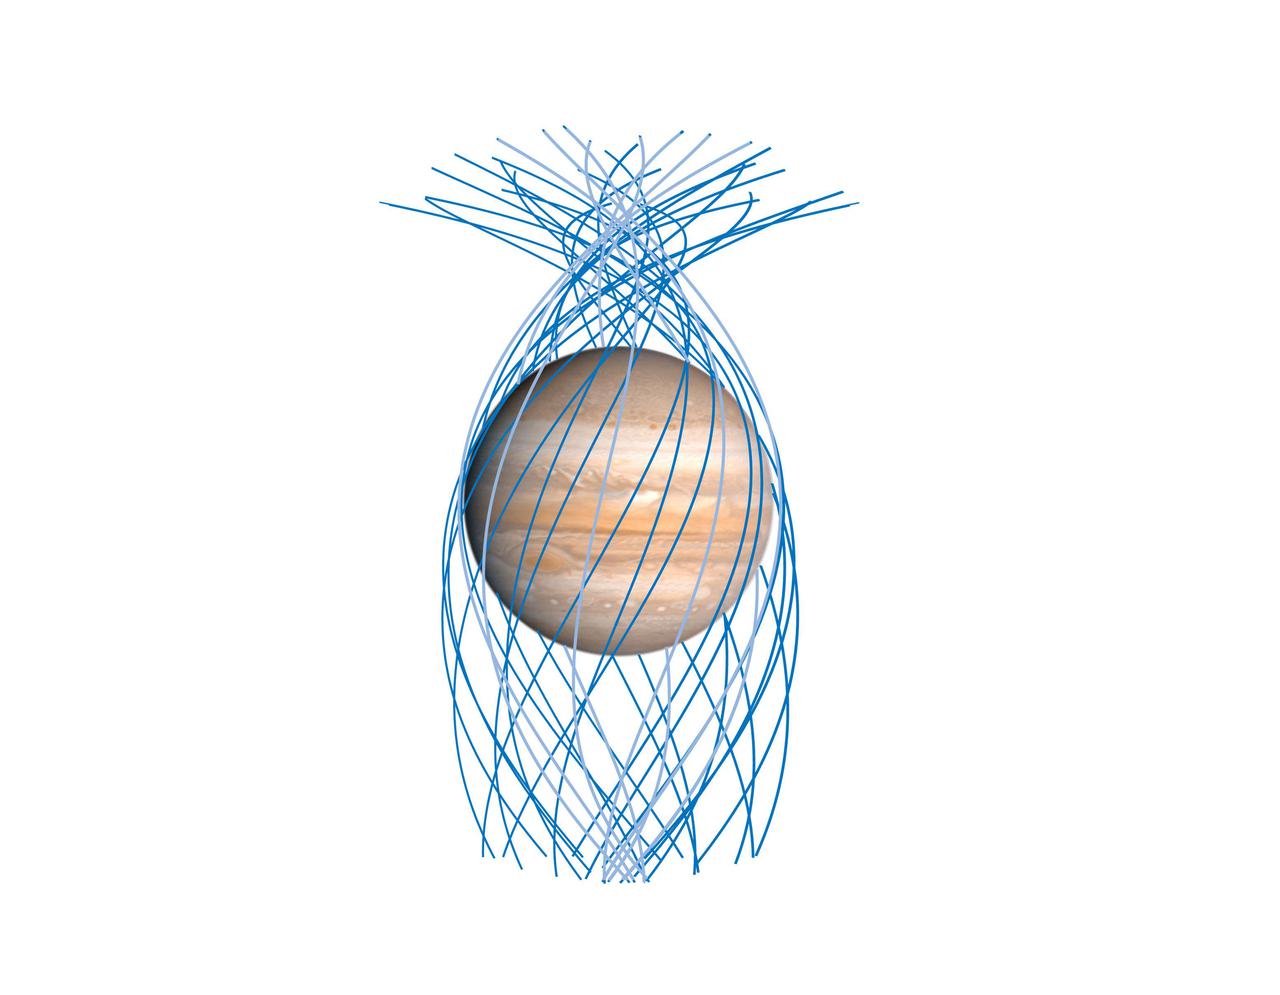
This diagram indicates the paths that NASA's Juno spacecraft took relative to Jupiter as the spacecraft repeatedly passed close by the giant planet over the course of five years, beginning in 2016, wrapping it in a dense net of observations ideally suited to mapping its magnetic field. Shown here are segments of the mission's first 32 high-inclination orbits, drawn from that part of each orbit passing very close to Jupiter, equally spaced in longitude. Juno has completed its first global mapping of the magnetic field, sampling it from pole to pole at about 11 degrees of separation in longitude between each orbit. https://photojournal.jpl.nasa.gov/catalog/PIA25061
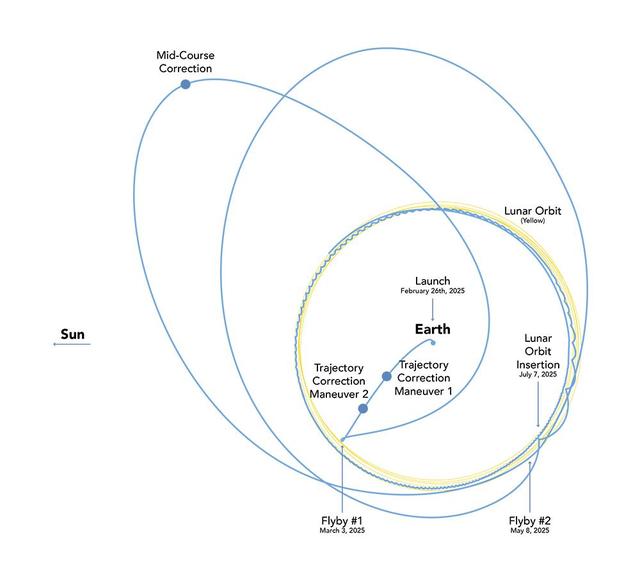
Lunar Trailblazer's voyage to the Moon will take between four and seven months, depending on the day it launches. This orbital diagram shows the low-energy transfer trajectory of the NASA mission should it launch on Feb. 26, the earliest date in a four-day launch period. If it launches that date, the spacecraft is expected to arrive in lunar orbit about four months later. Shown in this diagram are key dates of trajectory correction maneuvers, when the spacecraft will use its thrusters to shape its orbit, and lunar flybys. Lunar Trailblazer was a selection of NASA's SIMPLEx (Small Innovative Missions for Planetary Exploration), which provides opportunities for low-cost science spacecraft to ride-share with selected primary missions. To maintain the lower overall cost, SIMPLEx missions have a higher risk posture and lighter requirements for oversight and management. This higher risk acceptance allows NASA to test pioneering technologies, and the definition of success for these missions includes the lessons learned from more experimental endeavors. https://photojournal.jpl.nasa.gov/catalog/PIA26459

This illustration of TOI 700 d is based on several simulated environments for an ocean-covered version of the planet. https://photojournal.jpl.nasa.gov/catalog/PIA23407
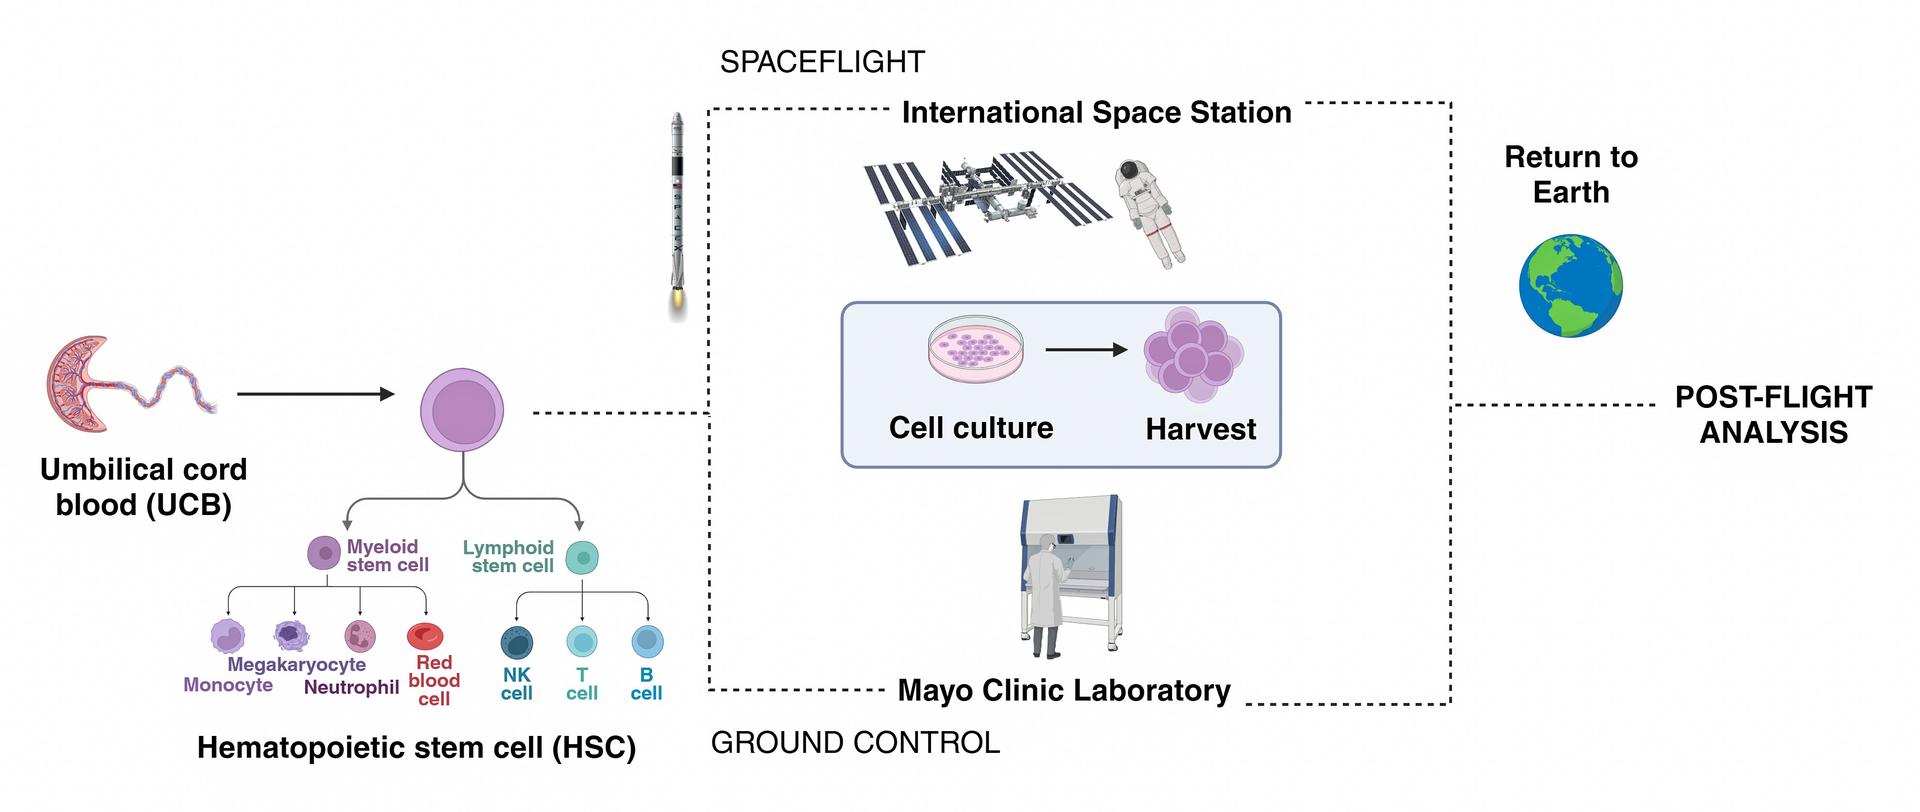
jsc2026e014321 (March 23, 2026) --- Simple schematic diagram of the InSPA-StemCellEX-H2 investigation design, which works upon prior research to produce stem cells in greater numbers in space with BioServe’s newly developed microgravity bioreactor. Credit: Mayo Clinic.

KENNEDY SPACE CENTER, FLA. - This storyboard shows a diagram of the telescope design and photos for a new five-meter focal length scope. The tracking telescope is part of the Distant Object Attitude Measurement System (DOAMS) in Cocoa Beach, Fla., that provides optical support for launches from KSC and Cape Canaveral.
KENNEDY SPACE CENTER, FLA. -- Members of the Columbia reconstruction team look at a diagram on the floor of the RLV Hangar. In the background are pieces of the Columbia debris being examined and recorded. As part of the ongoing investigation into the tragic accident, workers will attempt to reconstruct the orbiter inside the RLV.
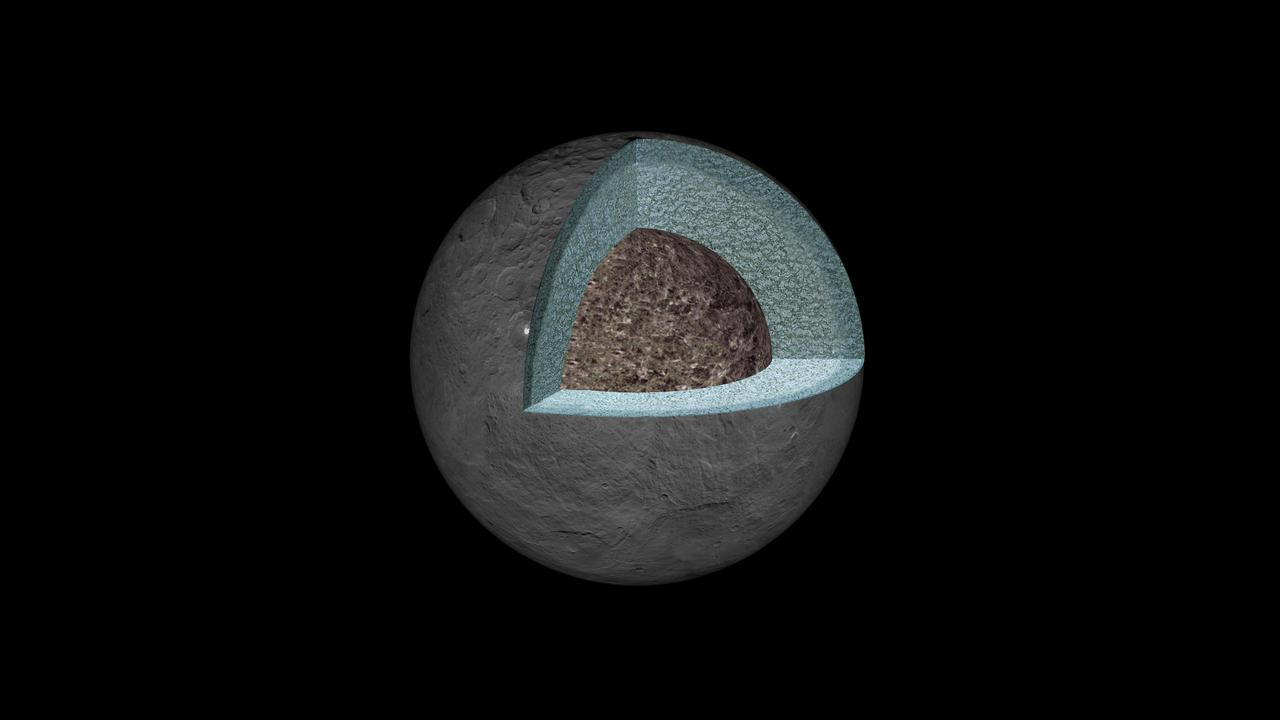
This artist's concept shows a diagram of how the inside of Ceres could be structured, based on data about the dwarf planet's gravity field from NASA's Dawn mission. Using information about Ceres' gravity and topography, scientists found that Ceres is "differentiated," which means that it has compositionally distinct layers at different depths. The densest layer is at the core, which scientists suspect is made of hydrated silicates. Above that is a volatile-rich shell, topped with a crust of mixed materials. This research teaches scientists about what internal processes could have occurred during the early history of Ceres. It appears that, during a heating phase early in the history of Ceres, water and other light materials partially separated from rock. These light materials and water then rose to the outer layer of Ceres. http://photojournal.jpl.nasa.gov/catalog/PIA20867
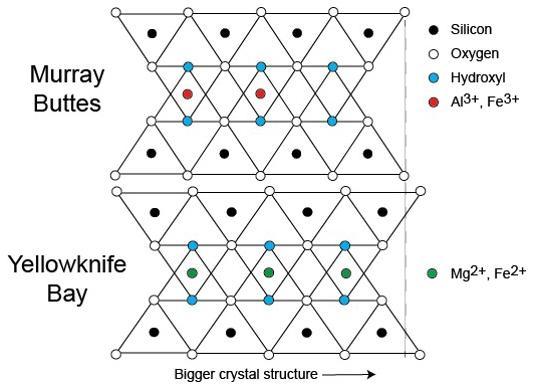
This diagram illustrates how the dimensions of clay minerals' crystal structure are affected by which ions are present in the composition of the mineral. Different clay minerals were identified this way at two sites in Mars' Gale Crater: "Murray Buttes" and "Yellowknife Bay." In otherwise identical clay minerals, a composition that includes aluminum and ferric iron ions (red dots) results in slightly smaller crystalline unit cells than one that instead includes magnesium and ferrous iron ions (green dots). Ferric iron is more highly oxidized than ferrous iron. Crystalline cell units are the basic repeating building blocks that define minerals. X-ray diffraction analysis, a capability of the Chemistry and Mineralogy (CheMin) instrument on NASA's Curiosity Mars rover, identifies minerals from their crystalline structure. http://photojournal.jpl.nasa.gov/catalog/PIA21148
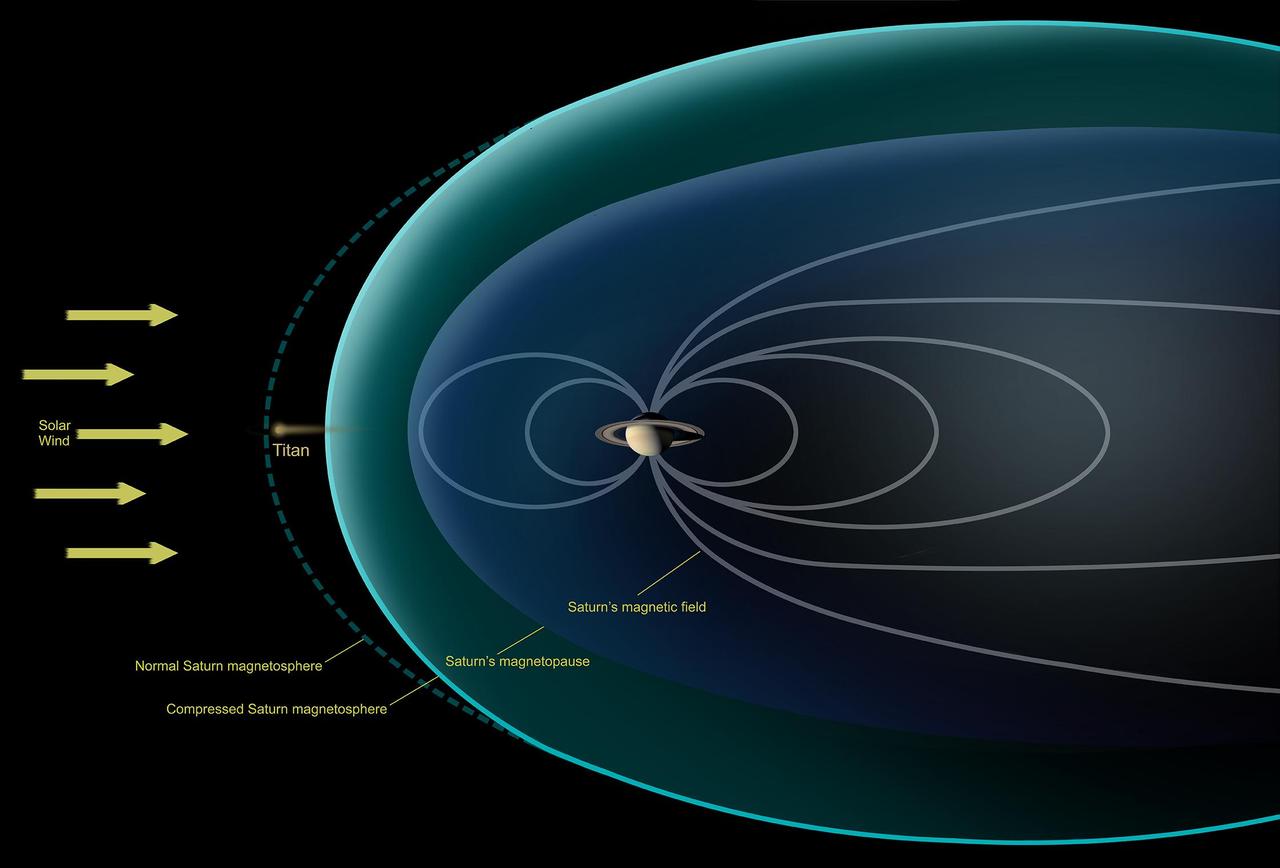
This diagram depicts conditions observed by NASA's Cassini spacecraft during a flyby in Dec. 2013, when Saturn's magnetosphere was highly compressed, exposing Titan to the full force of the solar wind. In analyzing data from the encounter, scientists with Cassini's magnetometer team observed that the giant moon interacted with the solar wind much like the planets Mars and Venus, or a comet -- none of which possess their own internal magnetic field. Specifically, they saw that the solar wind draped itself around Titan, creating a shockwave that formed around Titan where the full-force solar wind rammed into the moon's atmosphere. Previously, researchers had thought Titan would have a different sort of interaction with the solar wind because of the moon's complex atmospheric chemistry. http://photojournal.jpl.nasa.gov/catalog/PIA19055

jsc2025e065388 (7/24/2025) --- Diagram of the Microgravity Associated Bone Loss-B (MABL-B) investigation of bone loss on the International Space Station. Shown left to right are the BioCell chambers and type of samples each holds, how the samples are transported to the station, and the process of activating the study once on board. The top right shows samples of cells with a signaling protein that promotes bone formation and the bottom right the samples with a protein that increases bone loss. Credit: Mayo Clinic
KENNEDY SPACE CENTER, FLA. - Retired Navy Admiral Harold W. Gehman Jr. (second from right), chairman of the Columbia Accident Investigation Board, and other members of the board study a diagram of a Space Shuttle orbiter. Gehman and other members of the board are visiting sites at KSC to become familiar with the Shuttle launch process. The independent board is charged with determining what caused the destruction of the Space Shuttle Columbia and the loss of its seven-member crew on Feb. 1 during reentry.

Columbia Reconstruction Project Team members study diagrams to aid in the placement of debris from the Space Shuttle Columbia in the RLV Hangar. The debris is being shipped to KSC from the collection point at Barksdale Air Force Base, Shreveport, La. As part of the ongoing investigation into the tragic accident that claimed Columbia and her crew of seven, workers will attempt to reconstruct the orbiter inside the hangar.
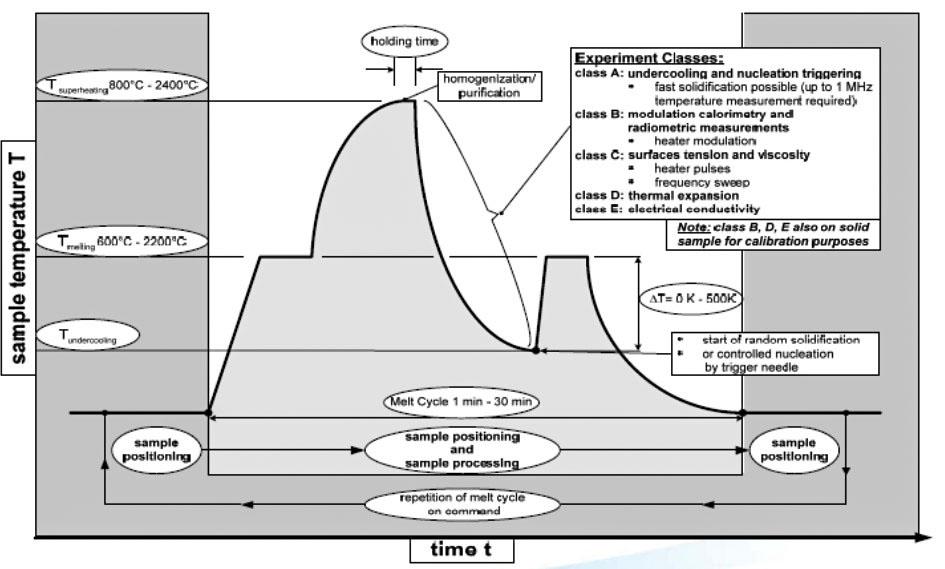
jsc2021e029751 (7/15/2021) --- A diagram showing the the Process cycle of the Electromagnetic Levitator (EML) - Batch 3 of samples. EML is a multi-user facility that provides containerless melting and solidification of electrically conductive, spherical samples, under ultra-high vacuum and/or high gas-purity conditions. Heating and positioning of the sample is achieved by electromagnetic fields generated by a coil system. Batch 3 is a new Sample Chamber to be mounted to the EML process chamber, bringing 18 new samples

CAPE CANAVERAL, Fla. -- This diagram of a space shuttle orbiter shows the location of avionics bay 5. Space shuttle Endeavour was scheduled to launch on the STS-134 mission to the International Space Station on April 29, but that attempt was scrubbed to allow engineers to assess an issue associated with failed heaters on a fuel line for Endeavour's auxiliary power unit-1 (APU-1). STS-134 will be the final spaceflight for Endeavour. For more information, visit www.nasa.gov/mission_pages/shuttle/shuttlemissions/sts134/index.html. Image credit: NASA
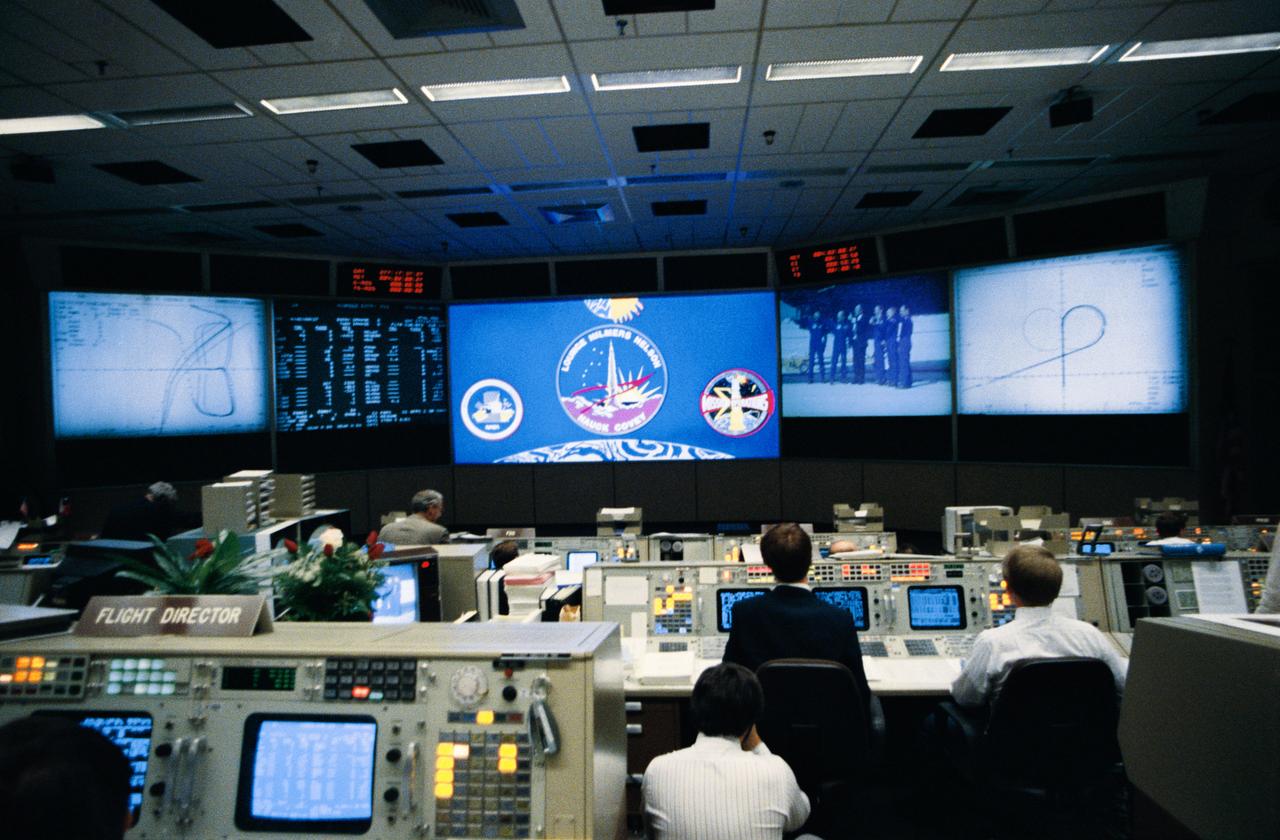
JSC Mission Control Center (MCC) Bldg 30 flight control room (FCR) personnel monitor STS-26 post landing activities and ceremonies at Edwards Air Force Base (EAFB) via their monitors. Displayed on front screens are approach and landing diagrams, data, the space shuttle program insignia, the STS-26 mission insignia, the Mission Operations Directorate insignia, and the STS-26 crew standing in front of Discovery, Orbiter Vehicle (OV) 103.
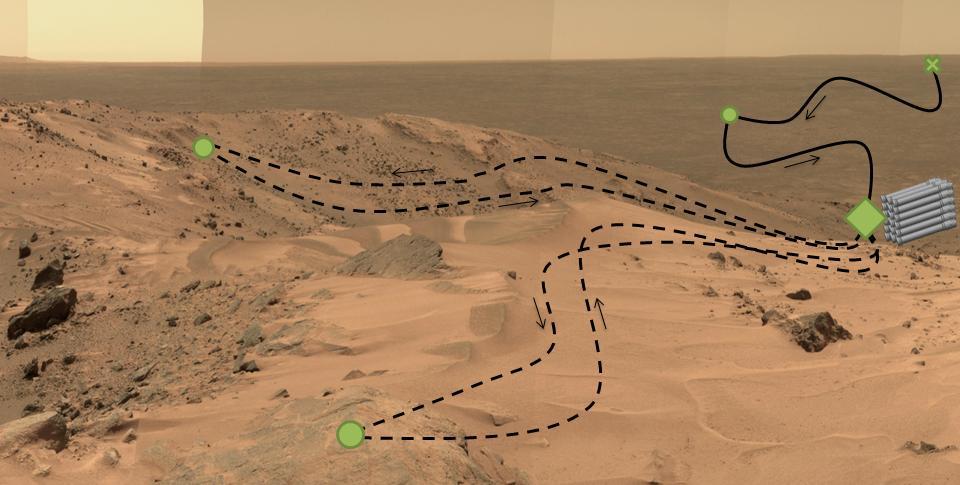
This diagram, superimposed on a photo of Martian landscape, illustrates a concept called "adaptive caching," which is in development for NASA's 2020 Mars rover mission. In addition to the investigations that the Mars 2020 rover will conduct on Mars, the rover will collect carefully selected samples of Mars rock and soil and cache them to be available for possible return to Earth if a Mars sample-return mission is scheduled and flown. Each sample will be stored in a sealed tube. Adaptive caching would result in a set of samples, up to the maximum number of tubes carried on the rover, being placed on the surface at the discretion of the mission operators. The tubes holding the collected samples would not go into a surrounding container. In this illustration, green dots indicate "regions of interest," where samples might be collected. The green diamond indicates one region of interest serving as the depot for the cache. The green X at upper right represents the landing site. The solid black line indicates the rover's route during its prime mission, and the dashed black line indicates its route during an extension of the mission. The base image is a portion of the "Everest Panorama" taken by the panoramic camera on NASA's Mars Exploration Rover Spirit at the top of Husband Hill in 2005. http://photojournal.jpl.nasa.gov/catalog/PIA19150

This diagram shows the general arrangement of the payloads to be carried by the multidisciplinary STS-107 Research-1 Space Shuttle mission in 2002. The Spacehab module will host experiments that require direct operation by the flight crew. Others with special requirements will be on the GAS Bridge Assembly sparning the payload bay. The Extended Duration Orbiter kit carries additional oxygen and hydrogen for the electricity-producing fuel cells. Research-1 experiments will cover space biology, life science, microgravity research, and commercial space product development, research sponsored by NASA's Office of Biological and Physical Research. An alternative view without callouts is available at 0101765.

CAPE CANAVERAL, Fla. -- This diagram of a space shuttle orbiter's avionics bay 5 shows the location of aft load control assembly-2 (ALCA-2) inside the bay. Space shuttle Endeavour was scheduled to launch on the STS-134 mission to the International Space Station on April 29, but that attempt was scrubbed to allow engineers to assess an issue associated with failed heaters on a fuel line for Endeavour's auxiliary power unit-1 (APU-1). STS-134 will be the final spaceflight for Endeavour. For more information, visit www.nasa.gov/mission_pages/shuttle/shuttlemissions/sts134/index.html. Image credit: NASA
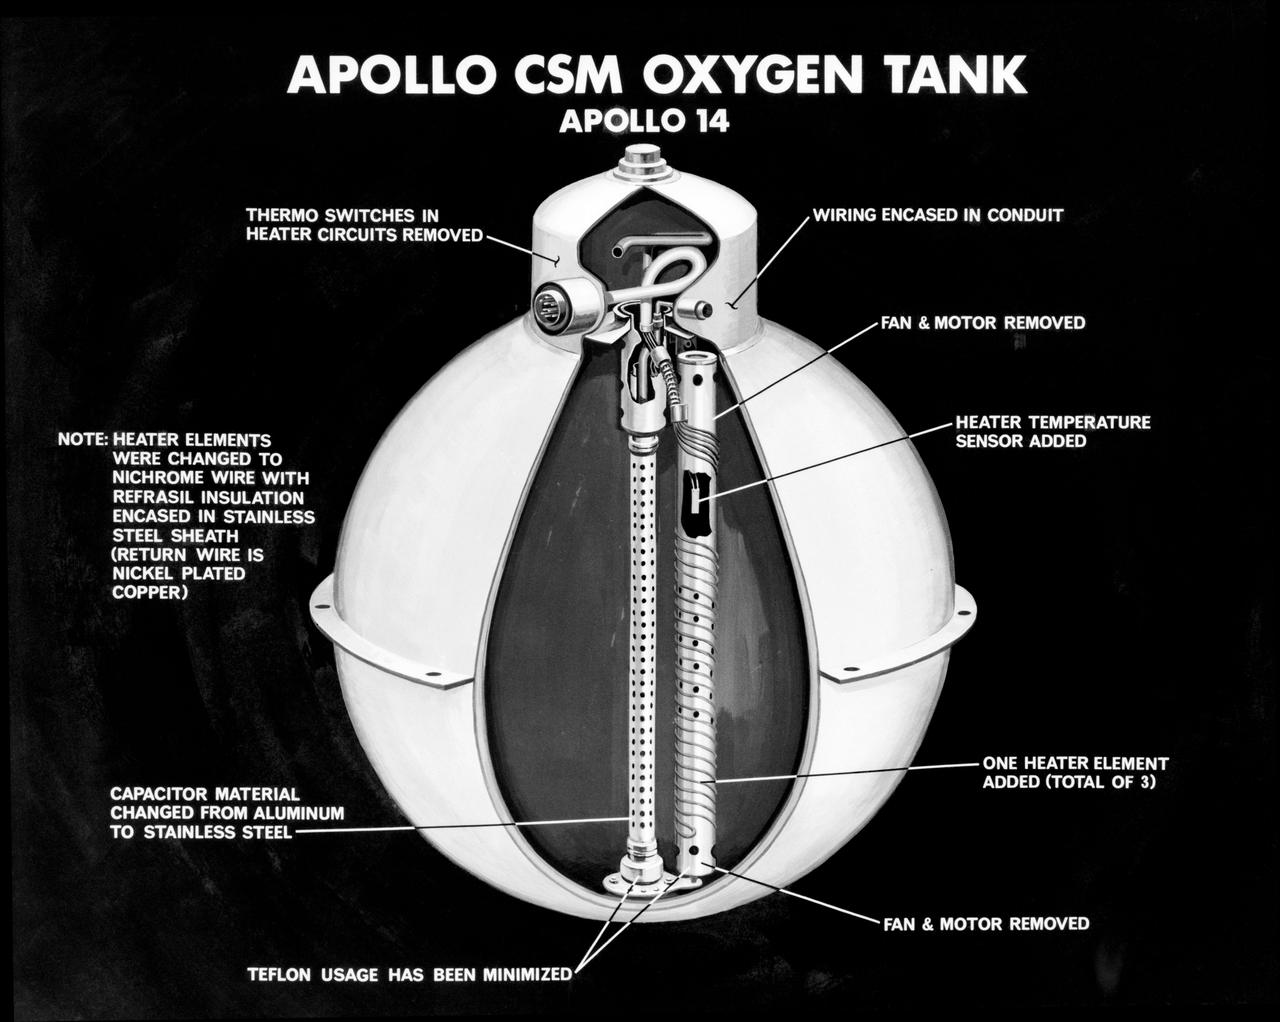
S71-16745 (January 1971) --- An artist's concept illustrating a cutaway view of one of the three oxygen tanks of the Apollo 14 spacecraft. This is the new Apollo oxygen tank design, developed since the Apollo 13 oxygen tank explosion. Apollo 14 has three oxygen tanks redesigned to eliminate ignition sources, minimize the use of combustible materials, and simplify the fabrication process. The third tank has been added to the Apollo 14 Service Module, located in the SM's sector one, apart from the pair of oxygen tanks in sector four. Arrows point out various features of the oxygen tank.
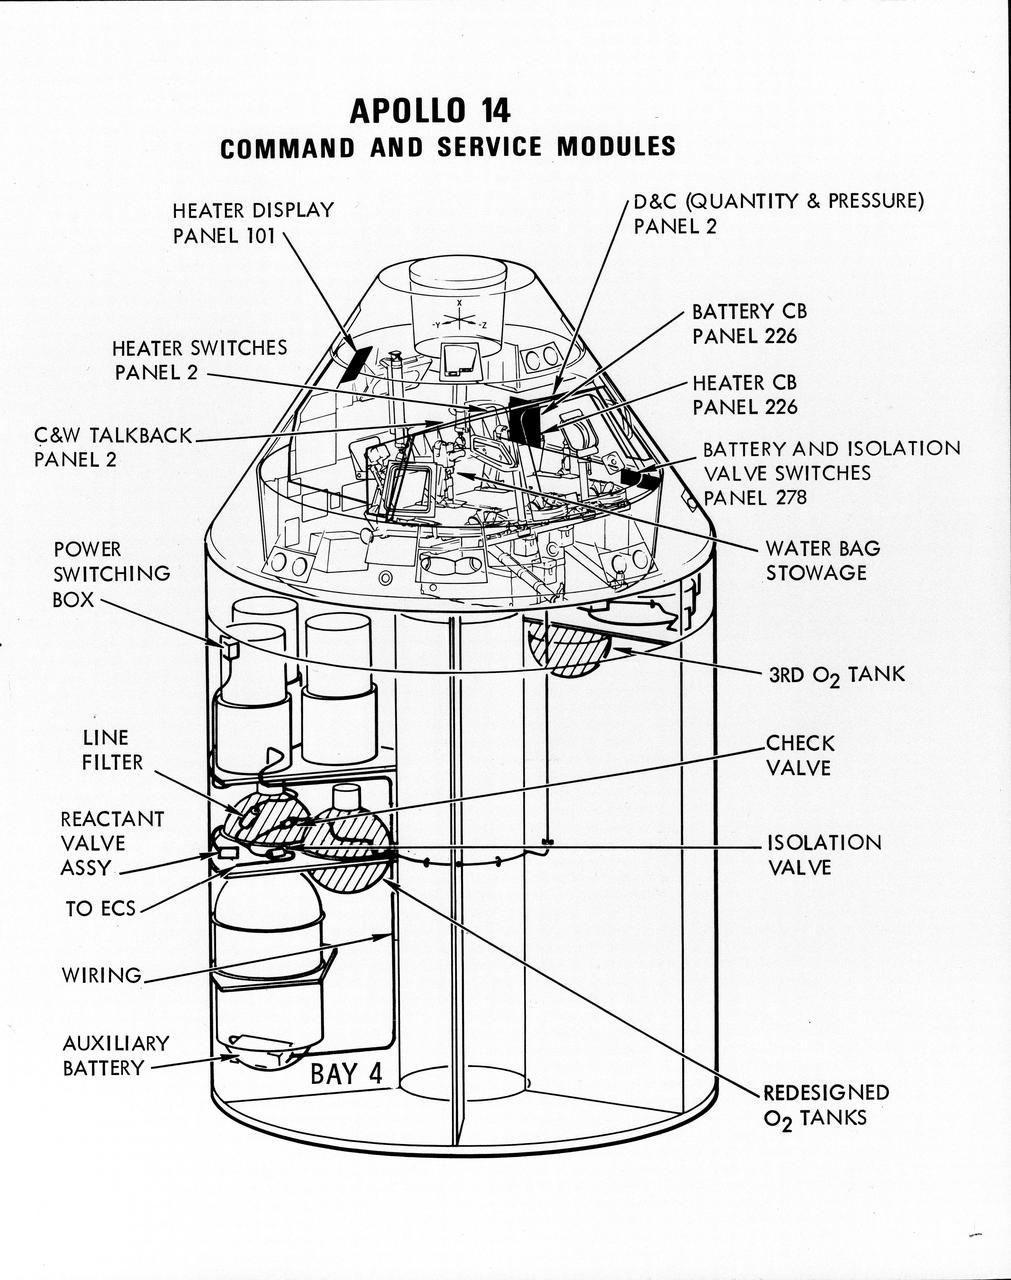
S71-16823 (January 1971) --- A line drawing illustrating a cutaway view of the Apollo 14 Command and Service Modules, showing the engineering changes in the CSM which were recommended by the Apollo 13 Review Board. (The Apollo 13 abort was caused by a short circuit and wiring overheating in one of the SM cryogenic oxygen tanks.) The major changes to the Apollo 14 CSM include adding a third cryogenic oxygen tank installed in a heretofore empty bay (in sector one) of the SM, addition of an auxiliary battery in the SM as a backup in case of fuel cell failure, and removal of destratification fans in the cryogenic oxygen tanks and removal of thermostat switches from the oxygen tank heater circuits. Provision for stowage of an emergency five-gallon supply of drinking water has been added to the CM.

S65-05112 (30 May 1965) --- Cutaway engineering drawing showing some of the features of the zero-gravity integral propulsion unit.

This diagram illustrates how hypothetical helium atmospheres might form. These would be on planets about the mass of Neptune, or smaller, which orbit tightly to their stars, whipping around in just days. They are thought to have cores of water or rock, surrounded by thick atmospheres of gas. Radiation from their nearby stars would boil off hydrogen and helium, but because hydrogen is lighter, more hydrogen would escape. It's also possible that planetary bodies, such as asteroids, could impact the planet, sending hydrogen out into space. Over time, the atmospheres would become enriched in helium. With less hydrogen in the planets' atmospheres, the concentration of methane and water would go down. Both water and methane consist in part of hydrogen. Eventually, billions of years later (a "Gyr" equals one billion years), the abundances of the water and methane would be greatly reduced. Since hydrogen would not be abundant, the carbon would be forced to pair with oxygen, forming carbon monoxide. NASA's Spitzer Space Telescope observed a proposed helium planet, GJ 436b, with these traits: it lacks methane, and appears to contain carbon monoxide. Future observations are needed to detect helium itself in the atmospheres of these planets, and confirm this theory. http://photojournal.jpl.nasa.gov/catalog/PIA19345
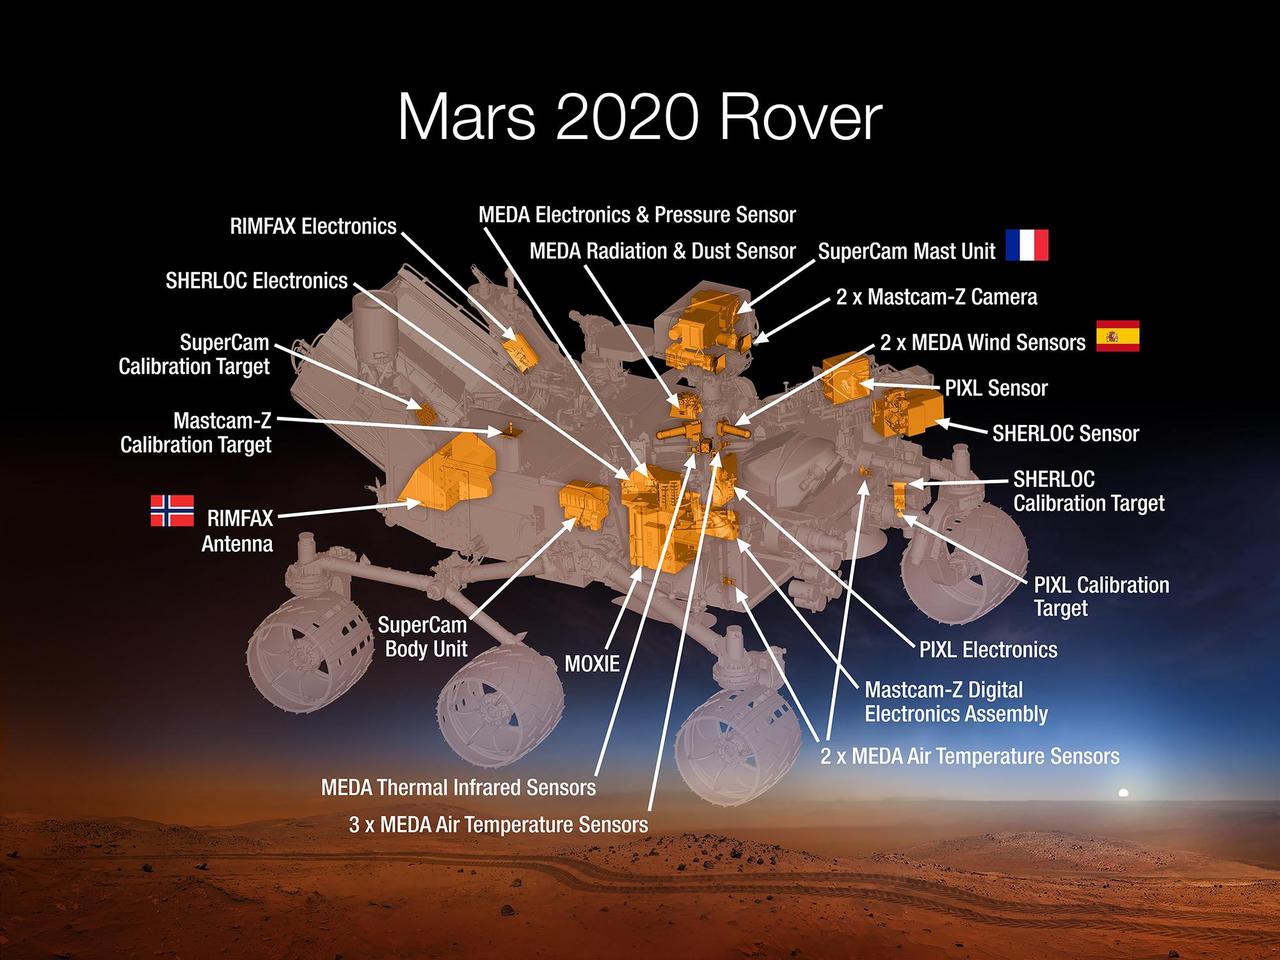
This 2015 diagram shows components of the investigations payload for NASA's Mars 2020 rover mission. Mars 2020 will re-use the basic engineering of NASA's Mars Science Laboratory to send a different rover to Mars, with new objectives and instruments, launching in 2020. The rover will carry seven instruments to conduct its science and exploration technology investigations. They are: Mastcam-Z, an advanced camera system with panoramic and stereoscopic imaging capability and the ability to zoom. The instrument also will determine mineralogy of the Martian surface and assist with rover operations. The principal investigator is James Bell, Arizona State University in Tempe. SuperCam, an instrument that can provide imaging, chemical composition analysis, and mineralogy. The instrument will also be able to detect the presence of organic compounds in rocks and regolith from a distance. The principal investigator is Roger Wiens, Los Alamos National Laboratory, Los Alamos, New Mexico. This instrument also has a significant contribution from the Centre National d'Etudes Spatiales, Institut de Recherche en Astrophysique et Planétologie (CNES/IRAP) France. Planetary Instrument for X-ray Lithochemistry (PIXL), an X-ray fluorescence spectrometer that will also contain an imager with high resolution to determine the fine-scale elemental composition of Martian surface materials. PIXL will provide capabilities that permit more detailed detection and analysis of chemical elements than ever before. The principal investigator is Abigail Allwood, NASA's Jet Propulsion Laboratory, Pasadena, California. Scanning Habitable Environments with Raman & Luminescence for Organics and Chemicals (SHERLOC), a spectrometer that will provide fine-scale imaging and uses an ultraviolet (UV) laser to determine fine-scale mineralogy and detect organic compounds. SHERLOC will be the first UV Raman spectrometer to fly to the surface of Mars and will provide complementary measurements with other instruments in the payload. SHERLOC includes a high-resolution color camera for microscopic imaging of Mars' surface. The principal investigator is Luther Beegle, JPL. The Mars Oxygen ISRU Experiment (MOXIE), an exploration technology investigation that will produce oxygen from Martian atmospheric carbon dioxide. The principal investigator is Michael Hecht, Massachusetts Institute of Technology, Cambridge, Massachusetts. Mars Environmental Dynamics Analyzer (MEDA), a set of sensors that will provide measurements of temperature, wind speed and direction, pressure, relative humidity and dust size and shape. The principal investigator is Jose Rodriguez-Manfredi, Centro de Astrobiologia, Instituto Nacional de Tecnica Aeroespacial, Spain. The Radar Imager for Mars' Subsurface Experiment (RIMFAX), a ground-penetrating radar that will provide centimeter-scale resolution of the geologic structure of the subsurface. The principal investigator is Svein-Erik Hamran, the Norwegian Defence Research Establishment, Norway. http://photojournal.jpl.nasa.gov/catalog/PIA19672

NASA's Europa Clipper is tasked with up-close study of Jupiter's enigmatic moon Europa, which orbits the gas giant within a band of powerful radiation generated by the planet's strong magnetic field. The relative intensity of Jupiter's radiation bands is illustrated in this diagram, along with the orbits of Jupiter's three other largest moons: Io, Ganymede, and Callisto. To limit the damaging effects of radiation on the spacecraft, Europa Clipper will orbit Jupiter elliptically, dipping in for dozens of close flybys of Europa. Between each pass, the spacecraft will retreat to a safer distance from which it can safely transmit the science data it collects back to Earth. Europa Clipper's three main science objectives are to determine the thickness of the moon's icy shell and its interactions with the ocean below, to investigate its composition, and to characterize its geology. The mission's detailed exploration of Europa will help scientists better understand the astrobiological potential for habitable worlds beyond our planet. https://photojournal.jpl.nasa.gov/catalog/PIA26436
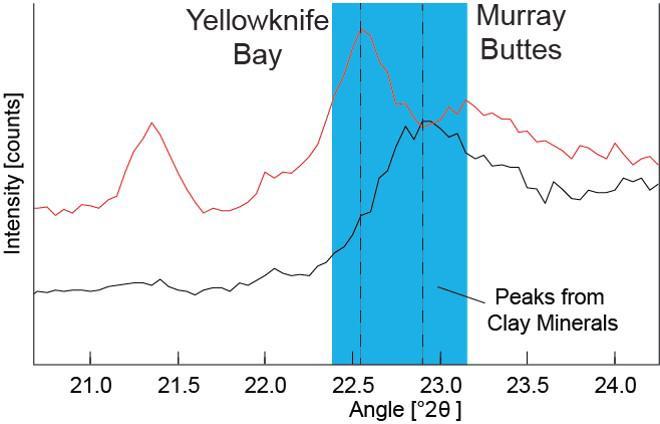
Data graphed here from the Chemistry and Camera (CheMin) instrument on NASA's Mars Curiosity rover show a difference between clay minerals in powder drilled from mudstone outcrops at two locations in Mars' Gale Crater: "Yellowknife Bay" and "Murray Buttes." CheMin's X-ray diffraction analysis reveals information about the crystalline structure of minerals in the rock. The intensity peaks marked with dotted vertical lines in this chart indicate that the crystalline structure of the two sites' clay minerals differs. The difference can be tied to a compositional difference in the clay minerals, as depicted in a diagram at PIA21148. The Yellowknife Bay site is on the floor of Gale Crater. The Murray Buttes site is on lower Mount Sharp, the layered mound in the center of the crater. http://photojournal.jpl.nasa.gov/catalog/PIA21147
S93-33257 (15 Mar 1993) --- This close-up view features tiny articulating fold mirrors that will go into a replacement camera for the Wide Field\Planetary Camera (WF\PC-1) currently on the Hubble Space Telescope (HST). A team of NASA astronauts will pay a visit to the HST later this year, carrying with them the new WF/PC-2 to replace the one currently on the HST. The Jet Propulsion Laboratory (JPL) in Pasadena, California has been working on the replacement system for several months. See NASA photo S93-33258 for an optical schematic diagram of one of the four channels of the WF\PC-2 showing the path taken by beams from the HST before an image is formed at the camera's charge-coupled devices.
Diagram depicts the importance of cell-cell communication as central to the understanding of cancer growth and progression, the focus of the NASA bioreactor demonstration system (BDS-05) investigation. Microgravity studies will allow us to unravel the signaling and communication between these cells with the host and potential development of therapies for the treatment of cancer metastasis. The NASA Bioreactor provides a low turbulence culture environment which promotes the formation of large, three-dimensional cell clusters. Due to their high level of cellular organization and specialization, samples constructed in the bioreactor more closely resemble the original tumor or tissue found in the body. The Bioreactor is rotated to provide gentle mixing of fresh and spent nutrient without inducing shear forces that would damage the cells. The work is sponsored by NASA's Office of Biological and Physical Research. The bioreactor is managed by the Biotechnology Cell Science Program at NASA's Johnson Space Center (JSC). NASA-sponsored bioreactor research has been instrumental in helping scientists to better understand normal and cancerous tissue development. In cooperation with the medical community, the bioreactor design is being used to prepare better models of human colon, prostate, breast and ovarian tumors. Cartilage, bone marrow, heart muscle, skeletal muscle, pancreatic islet cells, liver and kidney are just a few of the normal tissues being cultured in rotating bioreactors by investigators. Credit: Emory University.

Images here show the sunlit side of Saturn's rings. A strip along the bottom of each image has been filtered so that the textures are more visible. The filter consists of averaging and then subtracting out the major brightness variations across the scene. The images illustrate how textures in Saturn's rings differ, even in close proximity. Cassini had previously discovered that straw-like clumpy textures are visible in the troughs of the strongest density waves, such as the Janus 6:5 wave in the outer A ring (at top of Figure 1A). Images from Cassini's Ring Grazing Orbits show that similar clumpy textures are also visible in the troughs of medium-size density waves, such as the (left to right) Prometheus 26:25, 27:26 and 28:27 waves, also in the outer A ring (Figure 1B). Strawlike texture is apparent in one band of the inner A ring but not surrounding regions (Figure 1C). Feathery texture is seen in some bands of the outer B ring, but not surrounding regions (Figure 1D). Figure 1E, which is an update of an image previously released as PIA21618, shows Plateau P1, where three textures are visible in close proximity to each other. (See PIA03550 for a labeled diagram of the rings.) The images in this montage were taken in visible light, using the Cassini spacecraft narrow-angle camera. https://photojournal.jpl.nasa.gov/catalog/PIA23168
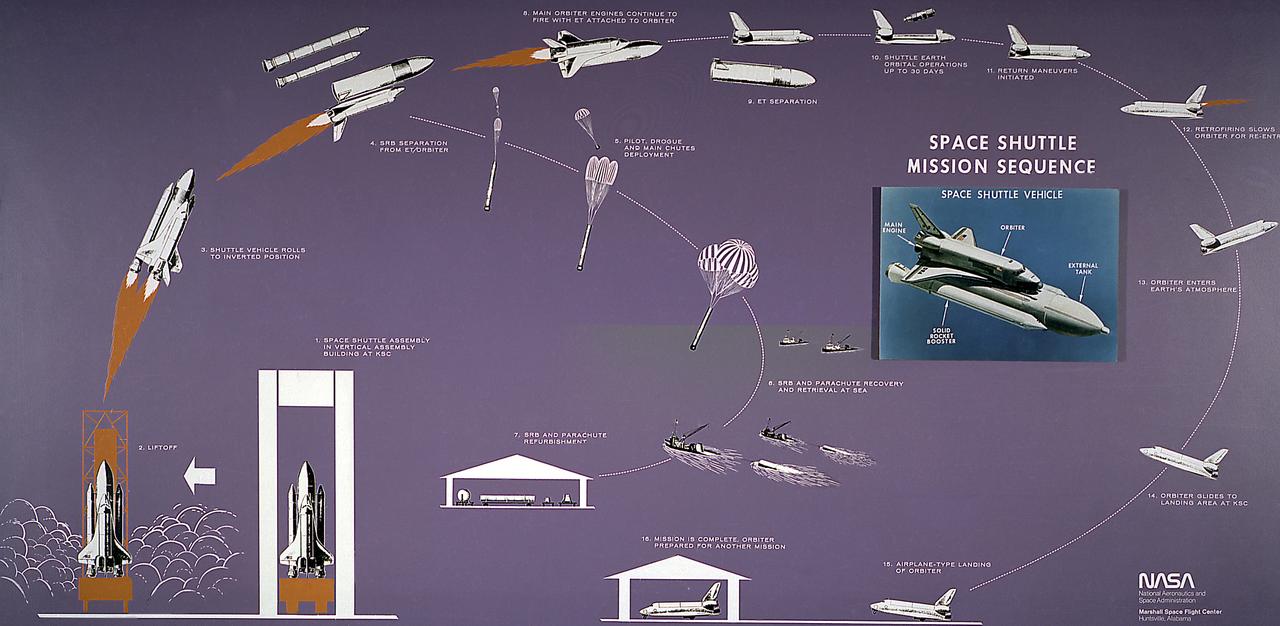
This diagram illustrates the Space Shuttle mission sequence. The Space Shuttle was approved as a national program in 1972 and developed through the 1970s. Part spacecraft and part aircraft, the Space Shuttle orbiter, the brain and the heart of the Space Transportation System (STS), required several technological advances, including thousands of insulating tiles able to stand the heat of reentry over the course of many missions, as well as sophisticated engines that could be used again and again without being thrown away. The airplane-like orbiter has three main engines, that burn liquid hydrogen and oxygen stored in the large external tank, the single largest structure in the Shuttle. Attached to the tank are two solid rocket boosters that provide the vehecile with most of the thrust needed for liftoff. Two minutes into the flight, the spent solids drop into the ocean to be recovered and refurbished for reuse, while the orbiter engines continue burning until approximately 8 minutes into the flight. After the mission is completed, the orbiter lands on a runway like an airplane.
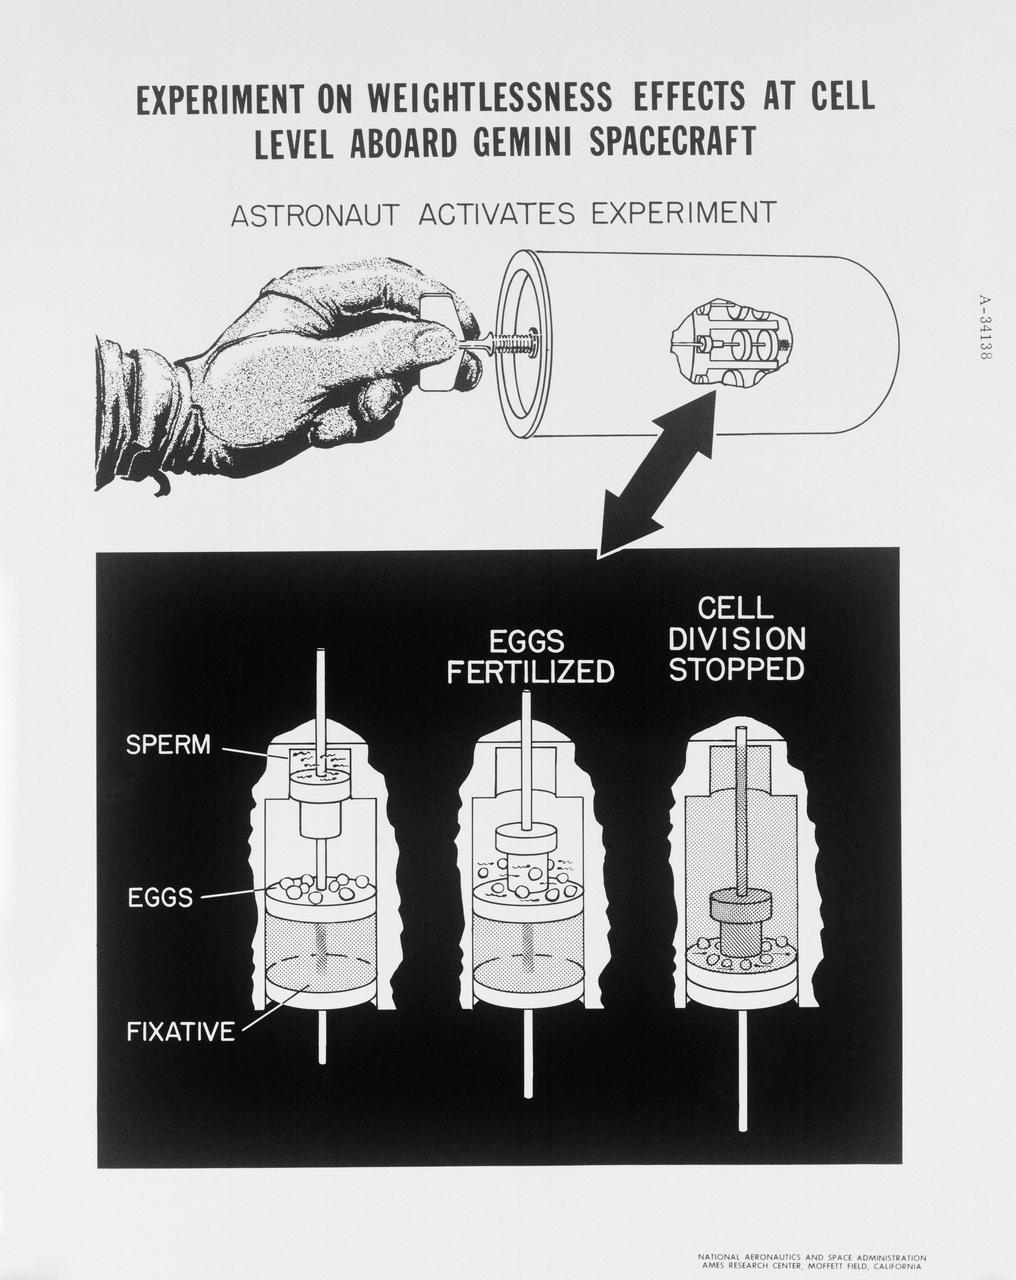
S65-18766 (March 1965) --- Diagram of experiment planned for the Gemini-Titan 3 mission scheduled on March 23, 1965, to find out if there are effects of weightlessness on individual living cells. The round canister (top) shows the experiment package. It will contain eight identical chambers, each with sections of sperm, eggs and fixative. Cells are eggs of the spiny, black sea animal, the sea urchin. Bottom panel shows the three stages of each chamber. From left in the first stage, sperm, eggs and fixative are separated. By turning the handle, astronauts will fertilize a certain portion of the eggs, which will begin to divide. At 20 minutes after launch, further turns of the handle will force fixative into two chambers and stop cell division. At 70 minutes after launch, cell division in four more chambers will be stopped, and just prior to re-entry, growth of the remaining two chambers will be terminated by a turn of the handle. This system will allow study after the flight of how cells divided after various time periods in weightlessness. Abnormalities would suggest weightlessness effects on living tissue and possible hazard to prolonged manned spaceflight.
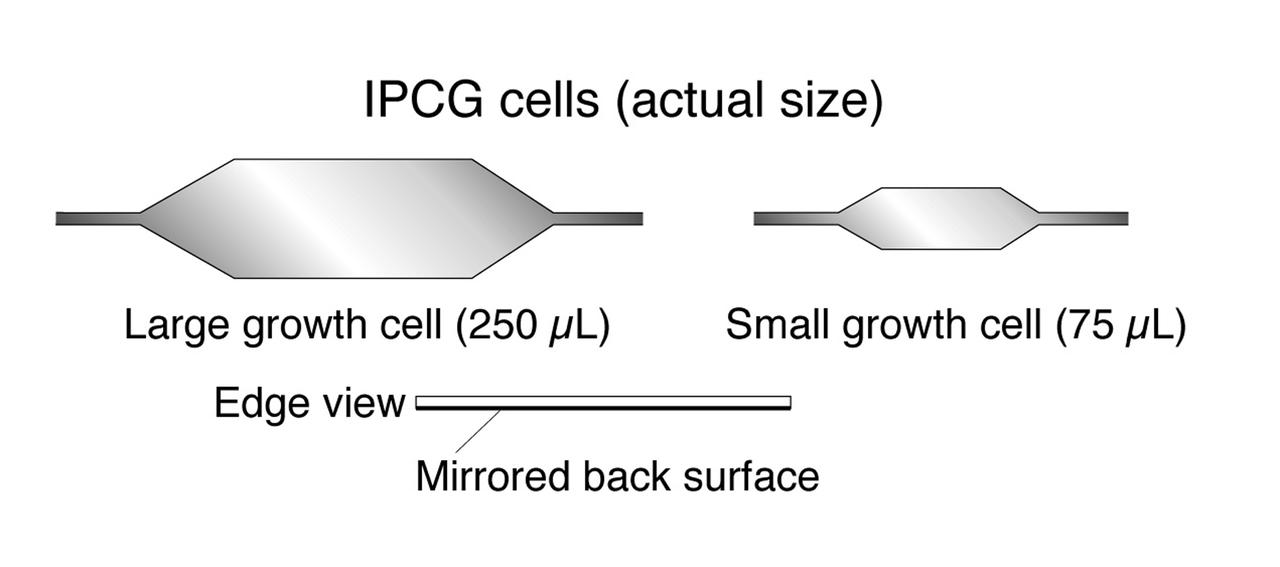
The Interferometer Protein Crystal Growth (IPCG) experiment was designed to measure details of how protein molecules move through a fluid. It was flown on the STS-86 mission for use aboard Russian Space Station Mir in 1998. It studied aspects of how crystals grow - and what conditions lead to the best crystals, details that remain a mystery. IPCG produces interference patterns by spilitting then recombining laser light. This let scientists see how fluid densities - and molecular diffusion - change around a crystal as it grows in microgravity. The heart of the IPCG apparatus is the interferometer cell comprising the optical bench, microscope, other optics, and video camera. IPCG experiment cells are made of optical glass and silvered on one side to serve as a mirror in the interferometer system that visuzlizes crystals and conditions around them as they grow inside the cell. This diagram shows the growth cells. The principal investigator was Dr. Alexander McPherson of University of California, Irvine. Co-investigators are William Witherow and Dr. Marc Pusey of NASA's Marshall Space Flight Center (MSFC).
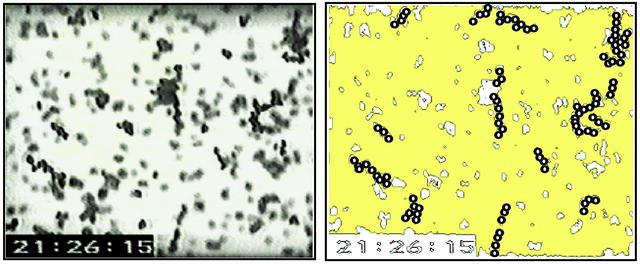
John Marshall, an investigator at Ames Research Center and a principal investigator in the microgravity fluid physics program, is studying the adhesion and cohesion of particles in order to shed light on how granular systems behave. These systems include everything from giant dust clouds that form planets to tiny compressed pellets, such as the ones you swallow as tablets. This knowledge should help us control the grains, dust, and powders that we encounter or use on a daily basis. Marshall investigated electrostatic charge in microgravity on the first and second U.S. Microgravity Laboratory shuttle missions to see how grains aggregate, or stick together. With gravity's effects eliminated on orbit, Marshall found that the grains of sand that behaved ever so freely on Earth now behaved like flour. They would just glom together in clumps and were quite difficult to disperse. That led to an understanding of the prevalence of the electrostatic forces. The granules wanted to aggregate as little chains, like little hairs, and stack end to end. Some of the chains had 20 or 30 grains. This phenomenon indicated that another force, what Marshall believes to be an electrostatic dipole, was at work.(The diagram on the right emphasizes the aggregating particles in the photo on the left, taken during the USML-2 mission in 1995.)
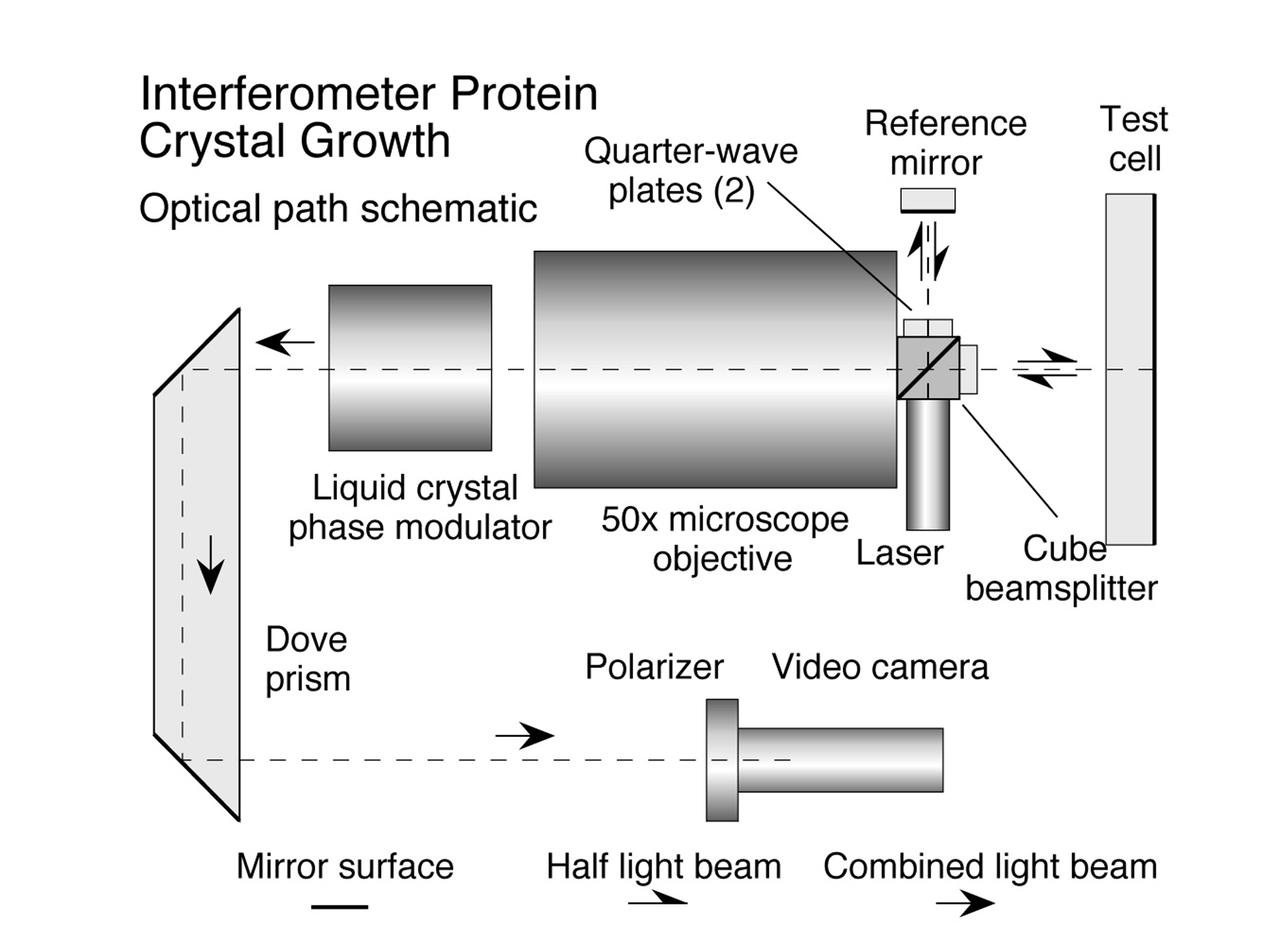
The Interferometer Protein Crystal Growth (IPCG) experiment was designed to measure details of how protein molecules move through a fluid. It was flown on the STS-86 mission for use aboard Russian Space Station Mir in 1998. It studied aspects of how crystals grow - and what conditions lead to the best crystals, details that remain a mystery. IPCG produces interference patterns by spilitting then recombining laser light. This let scientists see how fluid densities - and molecular diffusion - change around a crystal as it grows in microgravity. The heart of the IPCG apparatus is the interferometer cell comprising the optical bench, microscope, other optics, and video camera. IPCG experiment cells are made of optical glass and silvered on one side to serve as a mirror in the interferometer system that visuzlizes crystals and conditions around them as they grow inside the cell. This diagram shows the optical layout. The principal investigator was Dr. Alexander McPherson of University of California, Irvine. Co-investigators are William Witherow and Dr. Marc Pusey of NASA's Marshall Space Flight Center (MSFC).
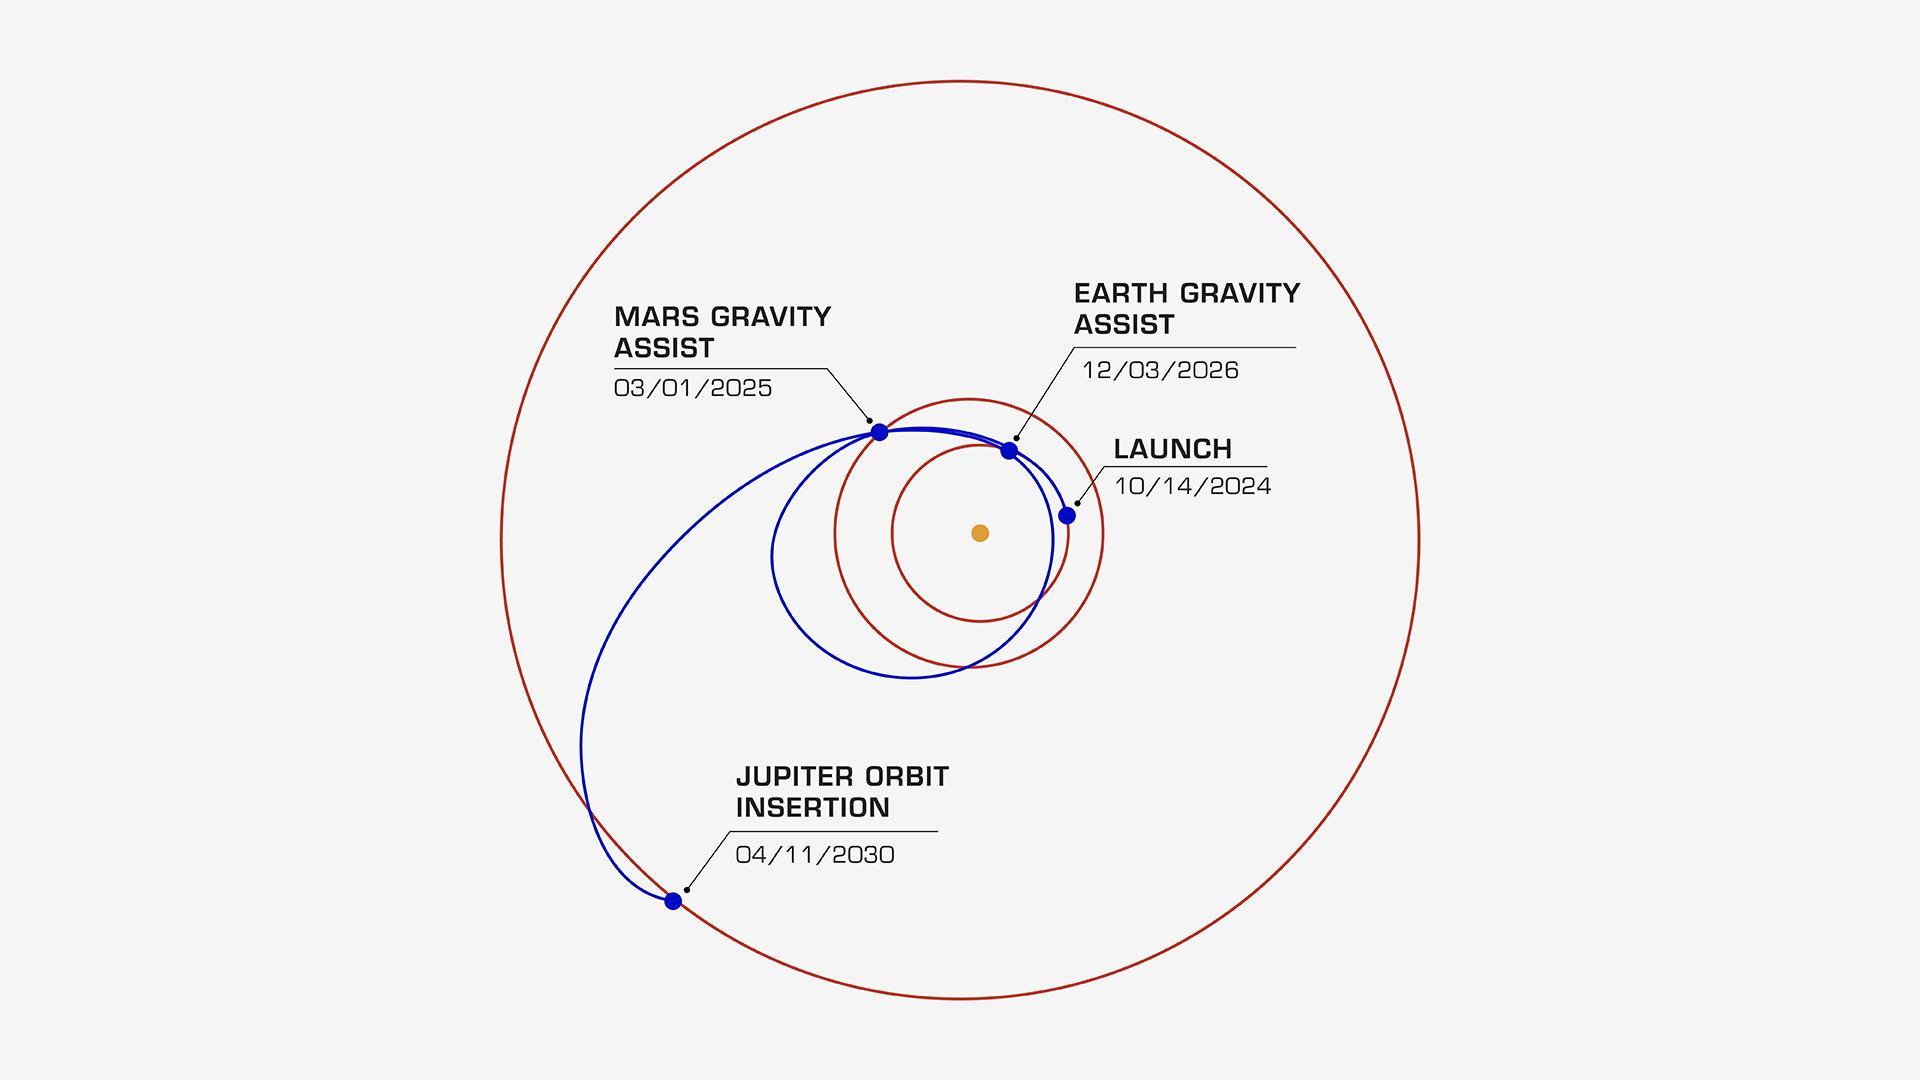
On its journey to the Jupiter system, NASA's Europa Clipper will take a path that swings past Mars, then Earth, using the gravity of each planet as a slingshot to boost the spacecraft's speed. All told, the journey will take about 5½ years, covering a distance of about 1.8 billion miles (2.9 billion kilometers). In this diagram, the orbits of Jupiter, Mars, and Earth are shown as concentric rings. Europa Clipper's launch period begins on Oct. 10, 2024. If the spacecraft launches on a later date, the timing of its Mars and Earth gravity assist maneuvers will shift. For all liftoff dates within the launch period, however, the spacecraft is scheduled to begin orbiting Jupiter on April 11, 2030. Then it will begin its investigation of the gas giant's icy moon Europa. Europa Clipper's three main science objectives are to determine the thickness of the moon's icy shell and its interactions with the ocean below, to investigate its composition, and to characterize its geology. The mission's detailed exploration of Europa will help scientists better understand the astrobiological potential for habitable worlds beyond our planet. Managed by Caltech in Pasadena, California, NASA's Jet Propulsion Laboratory leads the development of the Europa Clipper mission in partnership with APL for NASA's Science Mission Directorate in Washington. APL designed the main spacecraft body in collaboration with JPL and NASA's Goddard Space Flight Center in Greenbelt, Maryland, NASA's Marshall Space Flight Center in Huntsville, Alabama, and Langley Research Center in Hampton, Virginia. The Planetary Missions Program Office at Marshall executes program management of the Europa Clipper mission. NASA's Launch Services Program, based at Kennedy, manages the launch service for the Europa Clipper spacecraft, which will launch on a SpaceX Falcon Heavy rocket from Launch Complex 39A at Kennedy. https://photojournal.jpl.nasa.gov/catalog/PIA26435
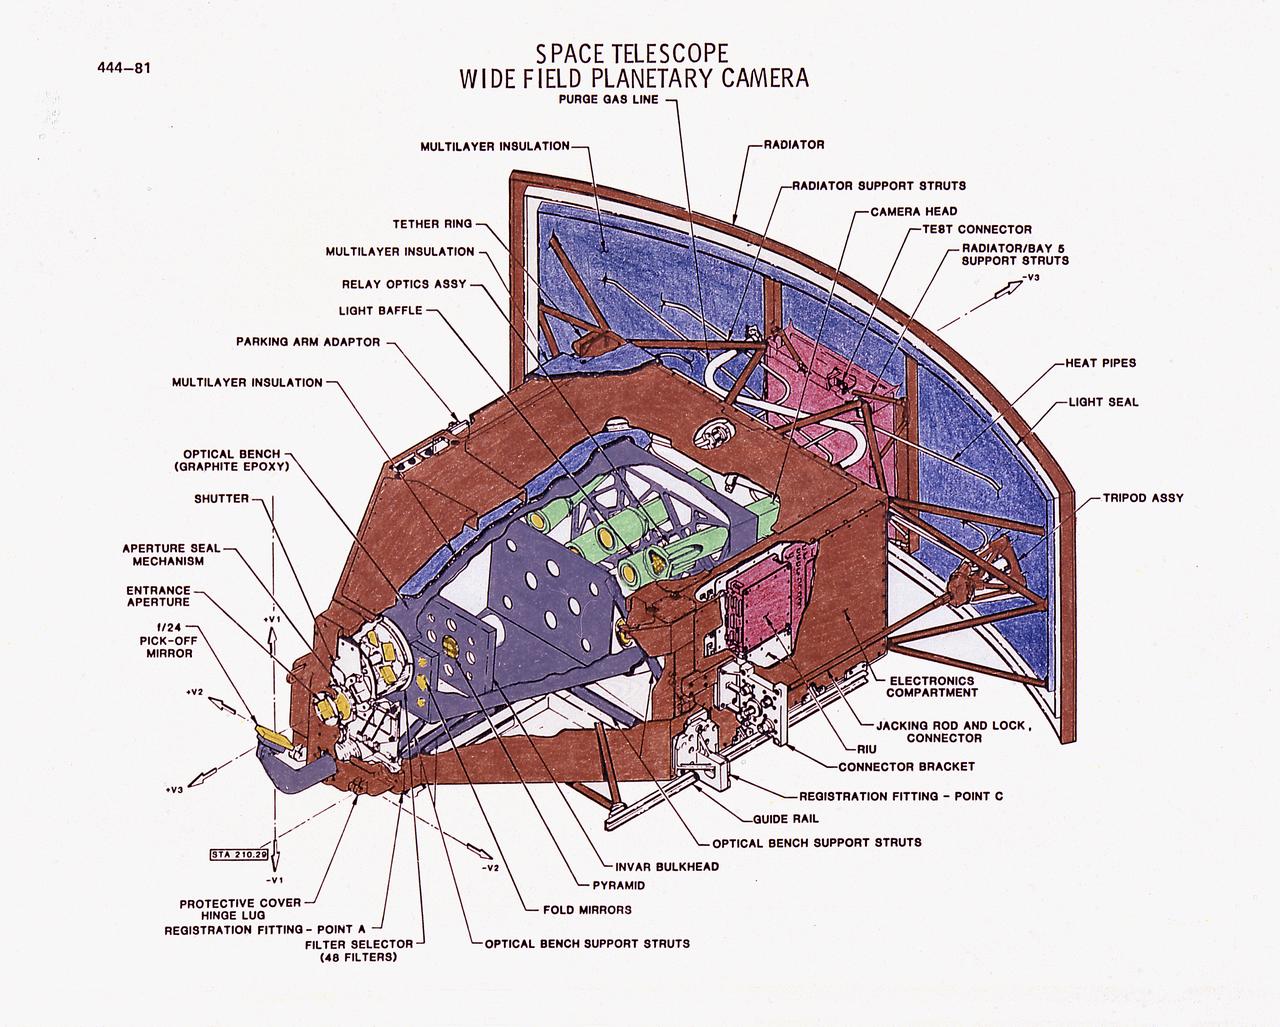
This illustration is a diagram of the Hubble Space Telescope's (HST's), Wide Field Planetary Camera (WF/PC), one of the five Scientific Instruments. The WF/PC uses a four-sided pyramid mirror to split a light image into quarters. It then focuses each quadrant onto one of two sets of four sensors. The sensors are charge-coupled detectors and function as the electronic equivalent of extremely sensitive photographic plates. The WF/PC operates in two modes. The Wide-Field mode that will view 7.2-arcmin sections of the sky, and the Planetary mode that will look at narrower fields of view, such as planets or areas within other galaxies. The purpose of the HST, the most complex and sensitive optical telescope ever made, is to study the cosmos from a low-Earth orbit. By placing the telescope in space, astronomers are able to collect data that is free of the Earth's atmosphere. The HST detects objects 25 times fainter than the dimmest objects seen from Earth and provides astronomers with an observable universe 250 times larger than visible from ground-based telescopes, perhaps as far away as 14 billion light-years. The HST views galaxies, stars, planets, comets, possibly other solar systems, and even unusual phenomena such as quasars, with 10 times the clarity of ground-based telescopes. The HST was deployed from the Space Shuttle Discovery (STS-31 mission) into Earth orbit in April 1990. The Marshall Space Flight Center had responsibility for design, development, and construction of the HST. The Perkin-Elmer Corporation, in Danbury, Cornecticut, developed the optical system and guidance sensors.
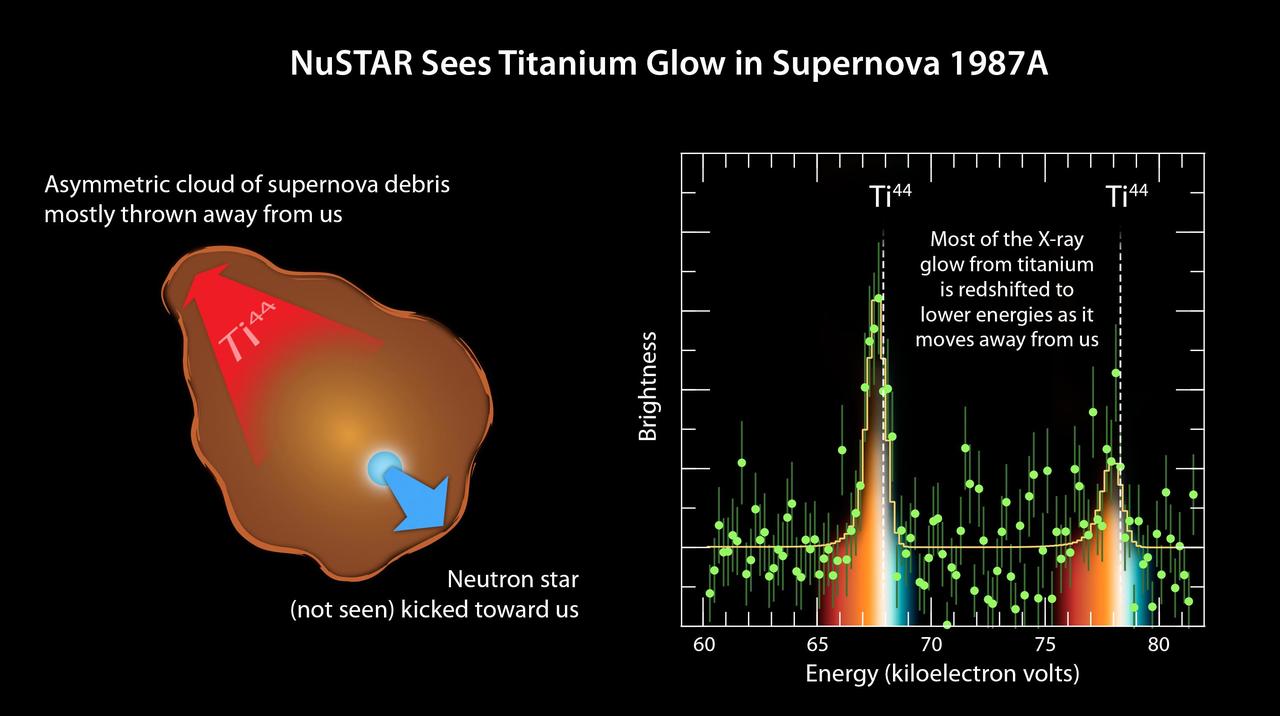
The plot of data from NASA's Nuclear Spectroscopic Telescope Array, or NuSTAR (right), amounts to a "smoking gun" of evidence in the mystery of how massive stars explode. The observations indicate that supernovae belonging to a class called Type II or core-collapse blast apart in a lopsided fashion, with the core of the star hurtling in one direction, and the ejected material mostly expanding the other way (see diagram in Figure 1). NuSTAR made the most precise measurements yet of a radioactive element, called titanium-44, in the supernova remnant called 1987A. NuSTAR sees high-energy X-rays, as shown here in the plot ranging from 60 to more than 80 kiloelectron volts. The spectral signature of titanium-44 is apparent as the two tall peaks. The white line shows where one would expect to see these spectral signatures if the titanium were not moving. The fact that the spectral peaks have shifted to lower energies indicates that the titanium has "redshifted," and is moving way from us. This is similar to what happens to a train's whistle as the train leaves the station. The whistle's sound shifts to lower frequencies. NuSTAR's detection of redshifted titanium reveals that the bulk of material ejected in the 1987A supernova is flying way from us at a velocity of 1.6 million miles per hour (2.6 million kilometers per hour). Had the explosion been spherical in nature, the titanium would have been seen flying uniformly in all directions. This is proof that this explosion occurred in an asymmetrical fashion. http://photojournal.jpl.nasa.gov/catalog/PIA19335

The diagram – based on data used in a July 2024 NASA-funded study – shows polar motion, a phenomenon that results from the combined action of several physical processes that broadly shift the distribution of mass around the globe or create forces in its mantle and core that cause the planet to wobble as it rotates. These changes cause the spin axis to meander over time. The blue line starts at the position of the spin axis near the North Pole in 1900, the first year polar motion data was collected, and tracks it until 2023. The spin axis now sits about 30 feet (10 meters) from where it was in 1900, in the direction of Canada's Baffin Bay. Around 2000, the axis took a sudden eastward turn, which researchers at NASA's Jet Propulsion Laboratory in Southern California in a 2016 study attributed to faster melting of the Greenland and Antarctic ice sheets and groundwater depletion in Eurasia. Surendra Adhikari, a JPL geophysicist who co-authored that study, used measurements from the International Earth Rotation and Reference Systems Service to create the animation. Adhikari and collaborators from Switzerland, Canada, and Germany found in a July 2024 paper in Nature Geoscience that about 90% of repeated oscillations in polar motion between 1900 and 2018 could be explained by large-scale mass redistribution at Earth's surface due to the melting of ice sheets and glaciers and the depletion of aquifers. It also found that nearly all of the long-term, non-repeating drift of the axis was due to dynamics in the mantle. Animation available at https://photojournal.jpl.nasa.gov/catalog/PIA26120
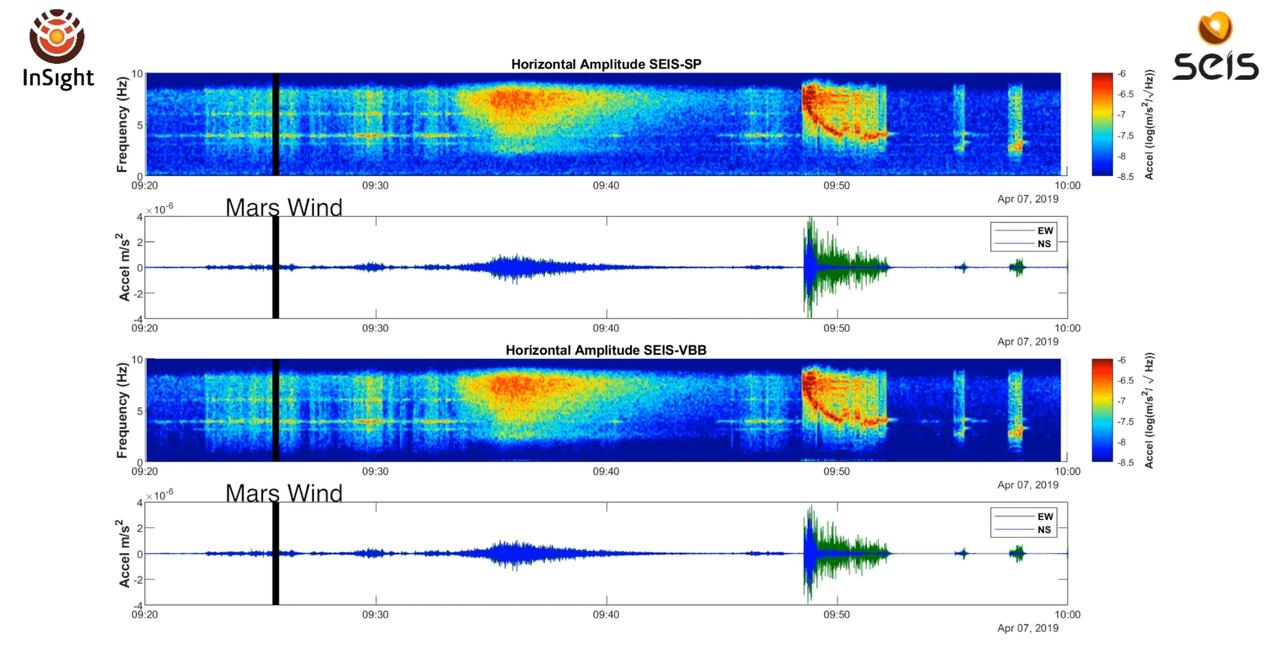
This video and audio illustrates a seismic event detected by NASA's InSight on April 6, 2019, the 128th Martian day, or sol, of the mission. Three distinct kinds of sounds can be heard, all of them detected as ground vibrations by the spacecraft's seismometer, called the Seismic Experiment for Interior Structure (SEIS): There's noise from Martian wind; the seismic event itself; and the spacecraft's robotic arm as it moves to take pictures. This event is the first likely marsquake recorded by the InSight team. Several other seismic events have been recorded but are much more ambiguous than this signal. The audio underscores just how seismically noisy the Martian surface can be and was produced from two sets of sensors included with SEIS. You can hear sounds from the Very Broad Band sensors from your left speakers and sounds from the Short Period sensors from your right speakers. Audio from both sets of sensors have been sped up by a factor of 60; the actual vibrations on Mars would not have been audible to the human ear. https://photojournal.jpl.nasa.gov/catalog/PIA23176