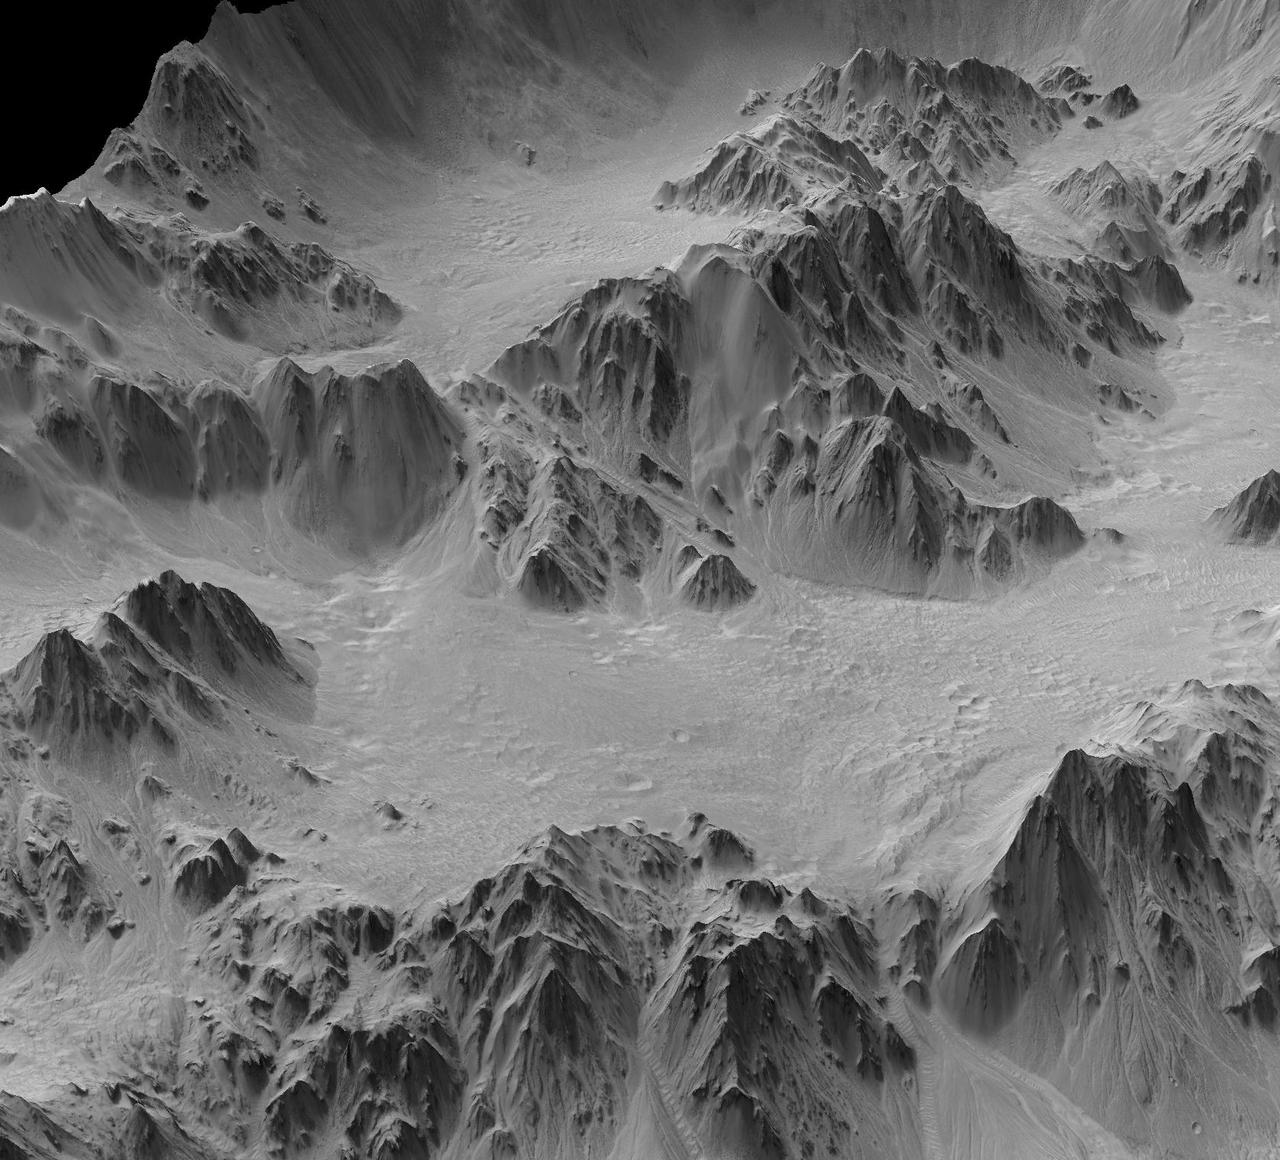
This is a synthesized, oblique view of a portion of the wall terraces of Mojave Crater in the Xanthe Terra region of Mars. It is a digital terrain model generated from a stereo pair of images from NASA Mars Reconnaissance Orbiter.
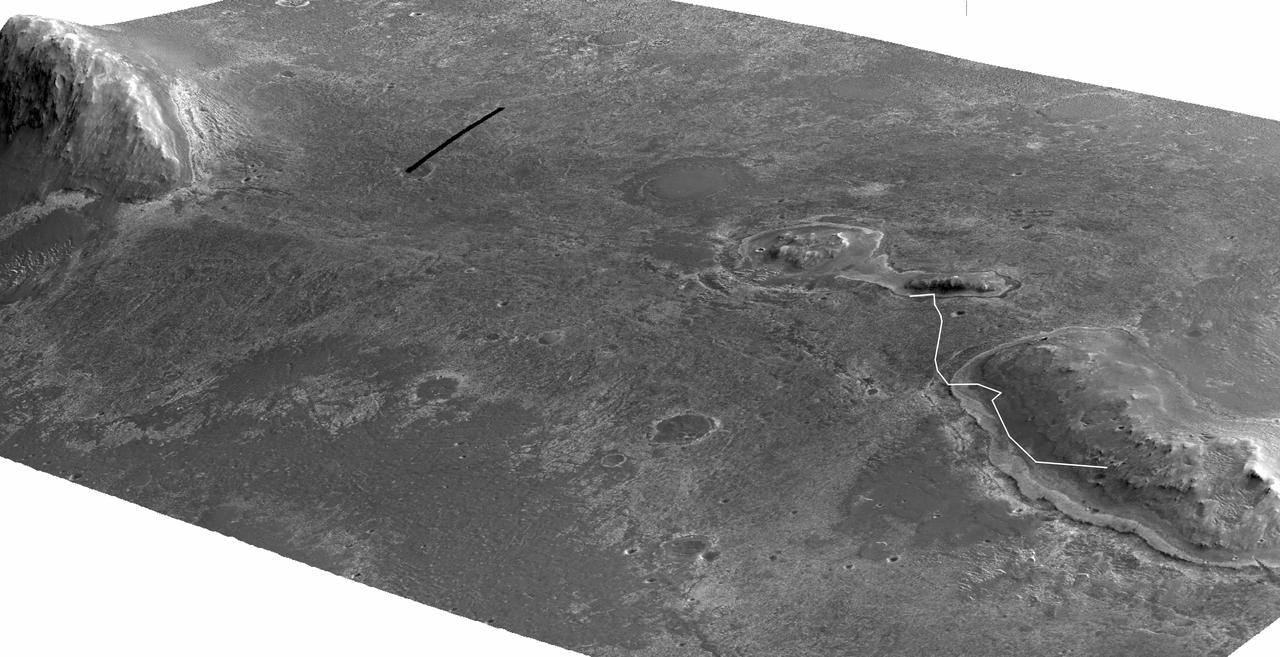
A stereo pair of images from taken from Mars orbit were used to generate a digital elevation model that is the basis for this simulated perspective view of Cape

STS109-E-5291 (1-12 March 2002) --- Astronaut Nancy J. Currie, STS-109 mission specialist, works with Payload and General Support Computers (PGSC) on the mid deck of the Space Shuttle Columbia. The image was taken with digital still camera.
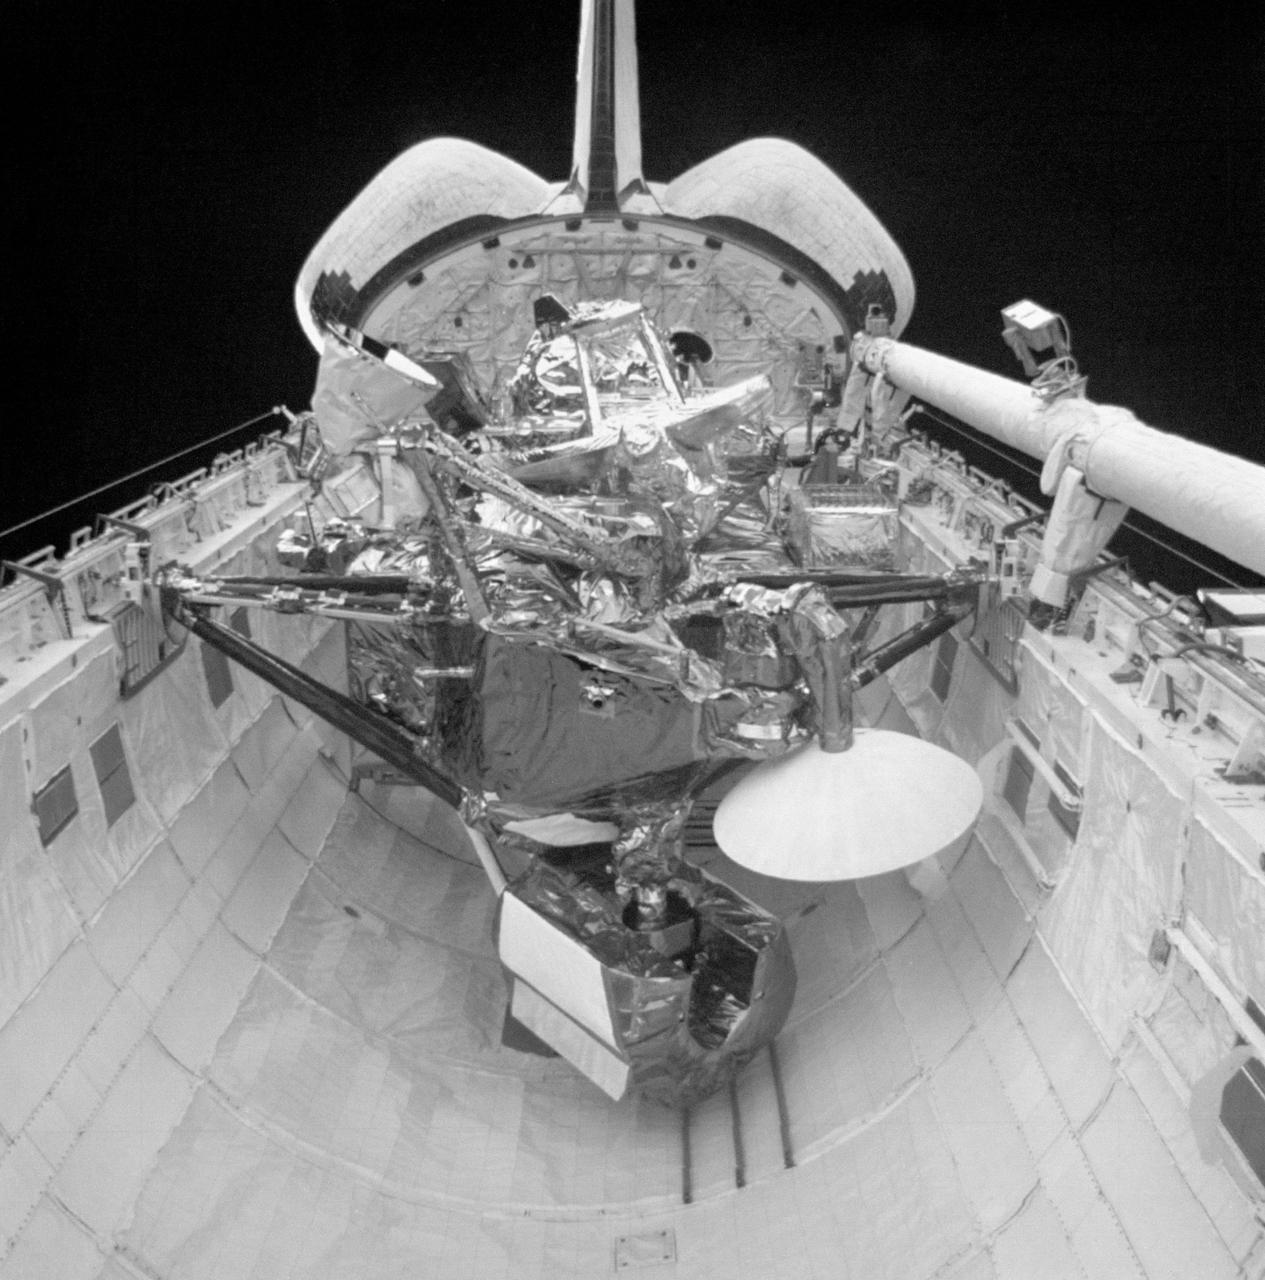
S48-E-013 (15 Sept 1991) --- The Upper Atmosphere Research Satellite (UARS) in the payload bay of the earth- orbiting Discovery. UARS is scheduled for deploy on flight day three of the STS-48 mission. Data from UARS will enable scientists to study ozone depletion in the stratosphere, or upper atmosphere. This image was transmitted by the Electronic Still Camera (ESC), Development Test Objective (DTO) 648. The ESC is making its initial appearance on a Space Shuttle flight. Electronic still photography is a new technology that enables a camera to electronically capture and digitize an image with resolution approaching film quality. The digital image is stored on removable hard disks or small optical disks, and can be converted to a format suitable for downlink transmission or enhanced using image processing software. The Electronic Still Camera (ESC) was developed by the Man- Systems Division at the Johnson Space Center and is the first model in a planned evolutionary development leading to a family of high-resolution digital imaging devices. H. Don Yeates, JSC's Man-Systems Division, is program manager for the ESC. THIS IS A SECOND GENERATION PRINT MADE FROM AN ELECTRONICALLY PRODUCED NEGATIVE.

S48-E-007 (12 Sept 1991) --- Astronaut James F. Buchli, mission specialist, catches snack crackers as they float in the weightless environment of the earth-orbiting Discovery. This image was transmitted by the Electronic Still Camera, Development Test Objective (DTO) 648. The ESC is making its initial appearance on a Space Shuttle flight. Electronic still photography is a new technology that enables a camera to electronically capture and digitize an image with resolution approaching film quality. The digital image is stored on removable hard disks or small optical disks, and can be converted to a format suitable for downlink transmission or enhanced using image processing software. The Electronic Still Camera (ESC) was developed by the Man- Systems Division at the Johnson Space Center and is the first model in a planned evolutionary development leading to a family of high-resolution digital imaging devices. H. Don Yeates, JSC's Man-Systems Division, is program manager for the ESC. THIS IS A SECOND GENERATION PRINT MADE FROM AN ELECTRONICALLY PRODUCED NEGATIVE
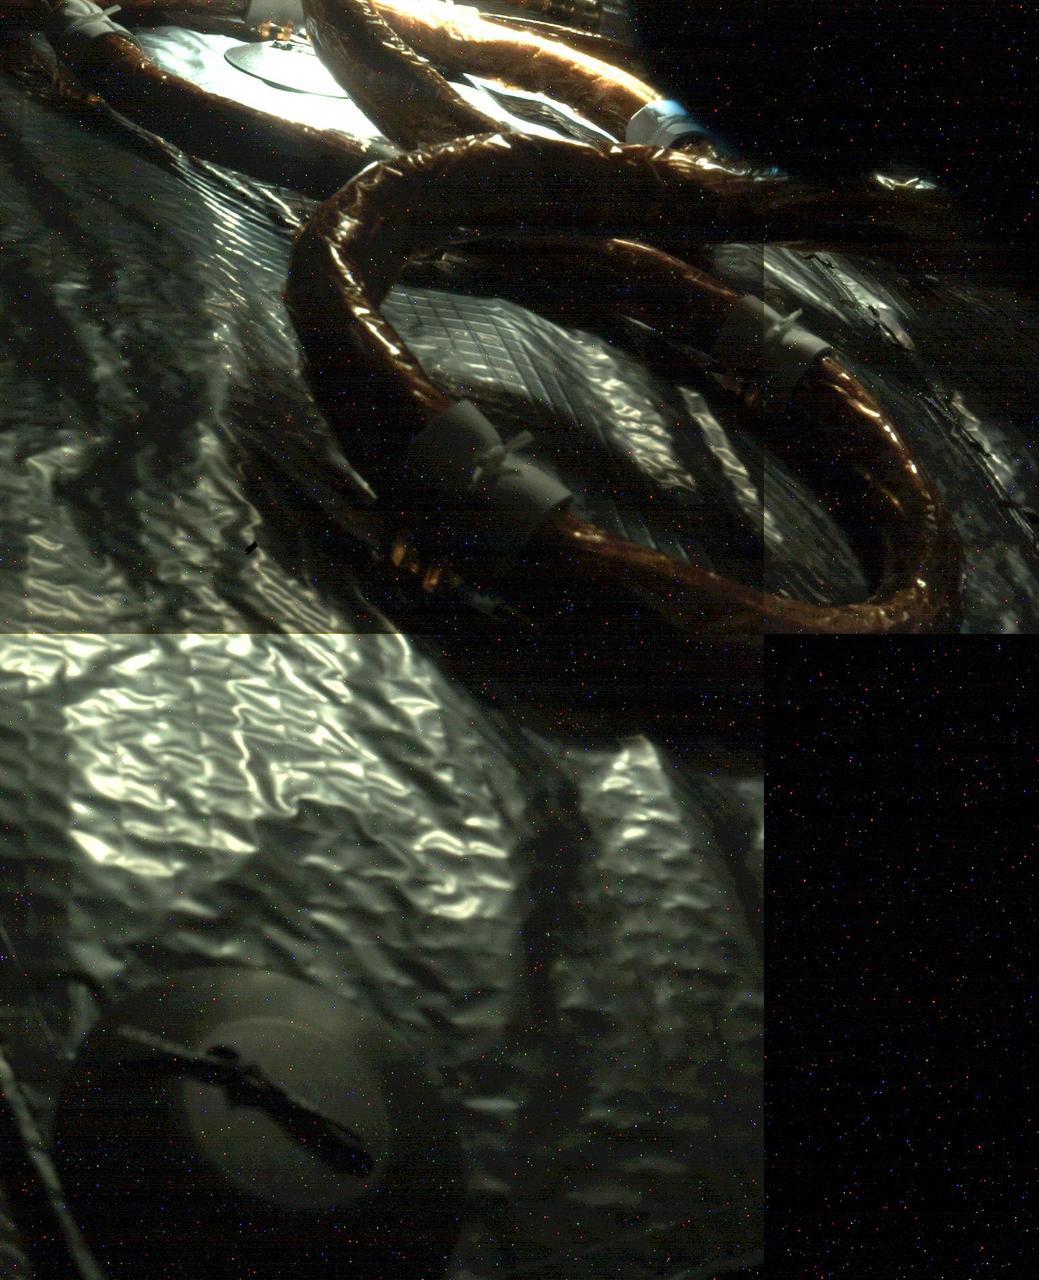
An electrical cable can be seen snaking its way along insulation material in this image of the interior of the Mars 2020 spacecraft at it cruises through interplanetary space to the Red Planet. The cable and insulation are tied to the inside of the spacecraft's heat shield, which will protect the spacecraft from the extreme temperatures generated by friction as it enters the Martian atmosphere on Feb 18, 2021. The light source is the Sun, which likely entered through a vent hole in the Multi-Mission Radioisotope Thermoelectric Generator (MMRTG) door. The picture was assembled from three images taken at different times by the Perseverance rover's rear left Hazcam during a systems check on Oct. 19, 2020. The colored pixels seen in the image are due to digital noise from the camera. https://photojournal.jpl.nasa.gov/catalog/PIA24233

STS109-E-5005 (3 March 2002) --- Astronauts John M. Grunsfeld (foreground), payload commander; and James H. Newman, mission specialist, perform tasks on the mid deck of the Space Shuttle Columbia. Although other tasks are being accomplished, the STS-109 crew is in a general posture of preparation for several days' space walk duty to perform work on the Hubble Space Telescope (HST). The image was recorded with a digital still camera.
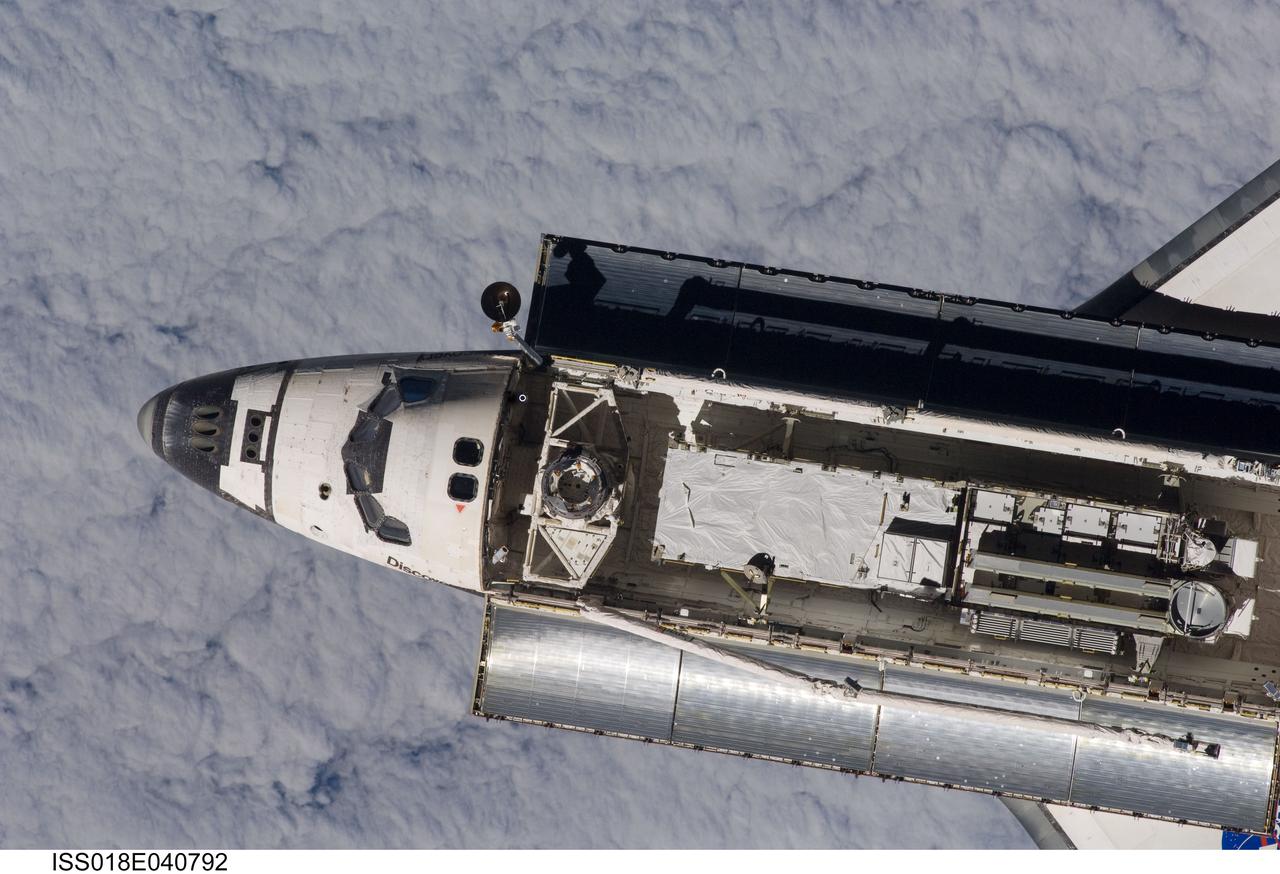
ISS018-E-040792 (17 March 2009) --- Backdropped by a blanket of clouds, Space Shuttle Discovery is featured in this image photographed by an Expedition 18 crewmember on the International Space Station during rendezvous and docking operations. Before docking with the station, astronaut Lee Archambault, STS-119 commander, flew the shuttle through a Rendezvous Pitch Maneuver or basically a backflip to allow the space station crew a good view of Discovery's heat shield. Using digital still cameras equipped with both 400 and 800 millimeter lenses, the ISS crewmembers took a number of photos of the shuttle's thermal protection system and sent them down to teams on the ground for analysis. A 400 millimeter lens was used for this image. Docking occurred at 4:20 p.m. (CDT) on March 17, 2009. The final pair of power-generating solar array wings and the S6 truss segment are visible in Discovery?s cargo bay.
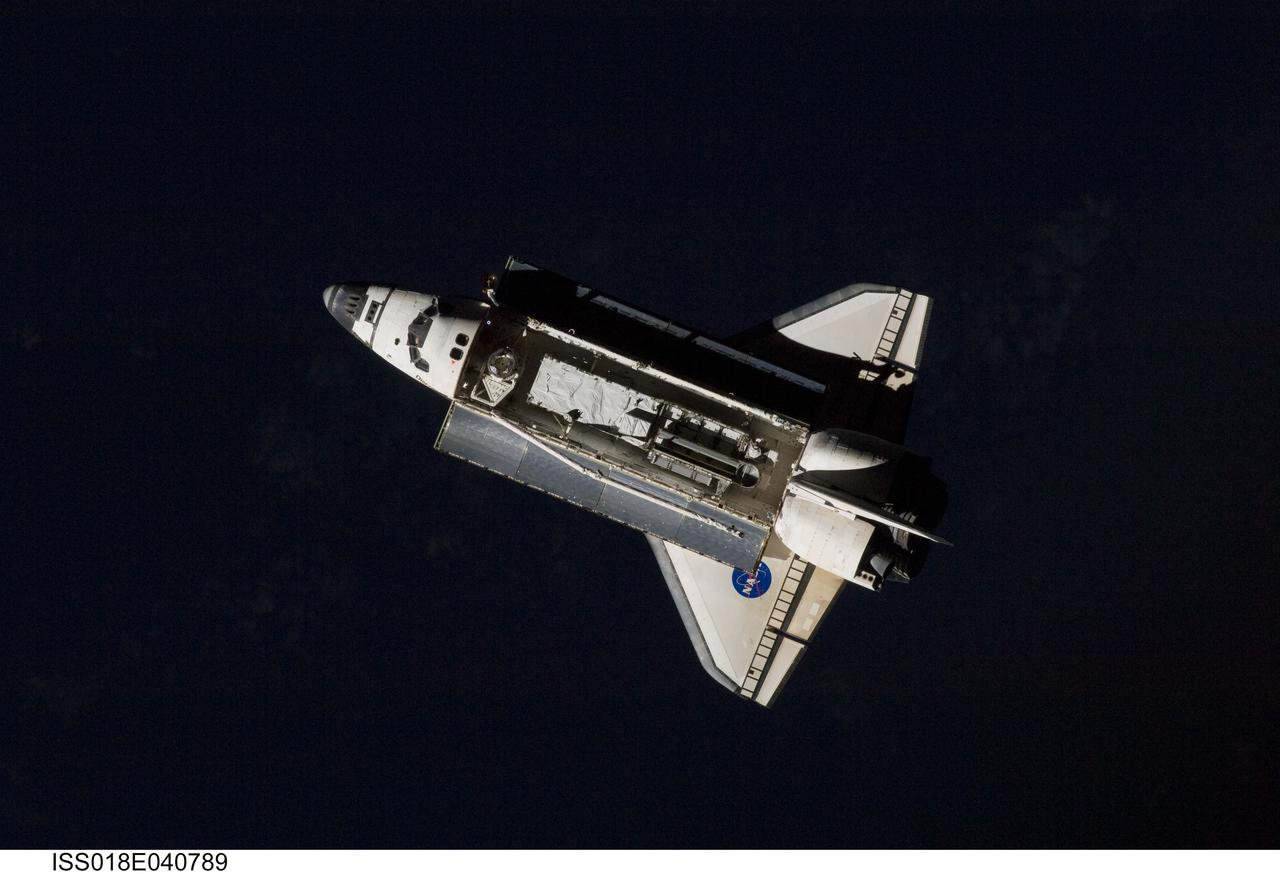
ISS018-E-040789 (17 March 2009) --- Backdropped by the blackness of space, Space Shuttle Discovery is featured in this image photographed by an Expedition 18 crewmember on the International Space Station during rendezvous and docking operations. Before docking with the station, astronaut Lee Archambault, STS-119 commander, flew the shuttle through a Rendezvous Pitch Maneuver or basically a backflip to allow the space station crew a good view of Discovery's heat shield. Using digital still cameras equipped with both 400 and 800 millimeter lenses, the ISS crewmembers took a number of photos of the shuttle's thermal protection system and sent them down to teams on the ground for analysis. A 400 millimeter lens was used for this image. Docking occurred at 4:20 p.m. (CDT) on March 17, 2009. The final pair of power-generating solar array wings and the S6 truss segment are visible in Discovery’s cargo bay.
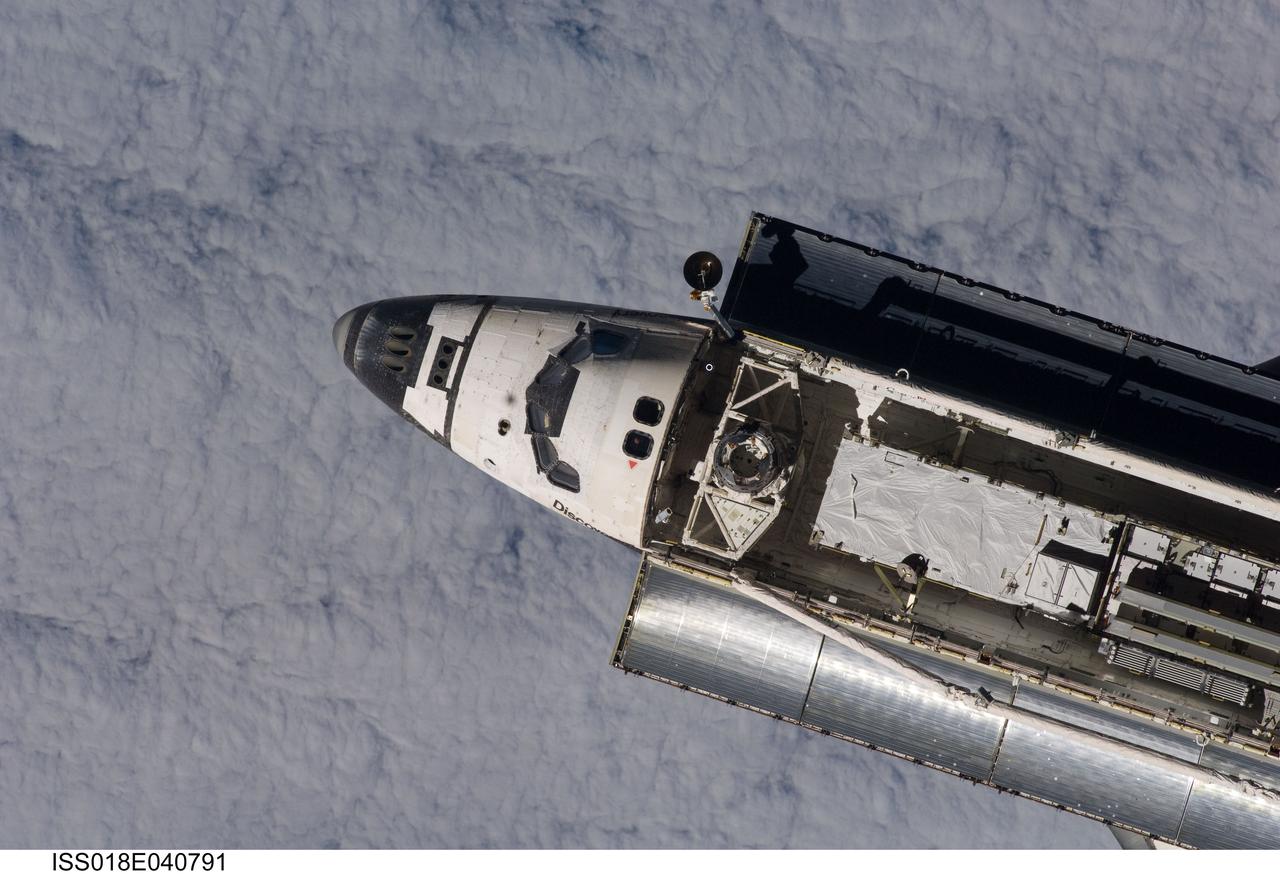
ISS018-E-040791 (17 March 2009) --- Backdropped by a blanket of clouds, Space Shuttle Discovery is featured in this image photographed by an Expedition 18 crewmember on the International Space Station during rendezvous and docking operations. Before docking with the station, astronaut Lee Archambault, STS-119 commander, flew the shuttle through a Rendezvous Pitch Maneuver or basically a backflip to allow the space station crew a good view of Discovery's heat shield. Using digital still cameras equipped with both 400 and 800 millimeter lenses, the ISS crewmembers took a number of photos of the shuttle's thermal protection system and sent them down to teams on the ground for analysis. A 400 millimeter lens was used for this image. Docking occurred at 4:20 p.m. (CDT) on March 17, 2009. The final pair of power-generating solar array wings and the S6 truss segment are visible in Discovery?s cargo bay.

ISS018-E-040790 (17 March 2009) --- Backdropped by the blackness of space, Space Shuttle Discovery is featured in this image photographed by an Expedition 18 crewmember on the International Space Station during rendezvous and docking operations. Before docking with the station, astronaut Lee Archambault, STS-119 commander, flew the shuttle through a Rendezvous Pitch Maneuver or basically a backflip to allow the space station crew a good view of Discovery's heat shield. Using digital still cameras equipped with both 400 and 800 millimeter lenses, the ISS crewmembers took a number of photos of the shuttle's thermal protection system and sent them down to teams on the ground for analysis. A 400 millimeter lens was used for this image. Docking occurred at 4:20 p.m. (CDT) on March 17, 2009. The final pair of power-generating solar array wings and the S6 truss segment are visible in Discovery?s cargo bay.
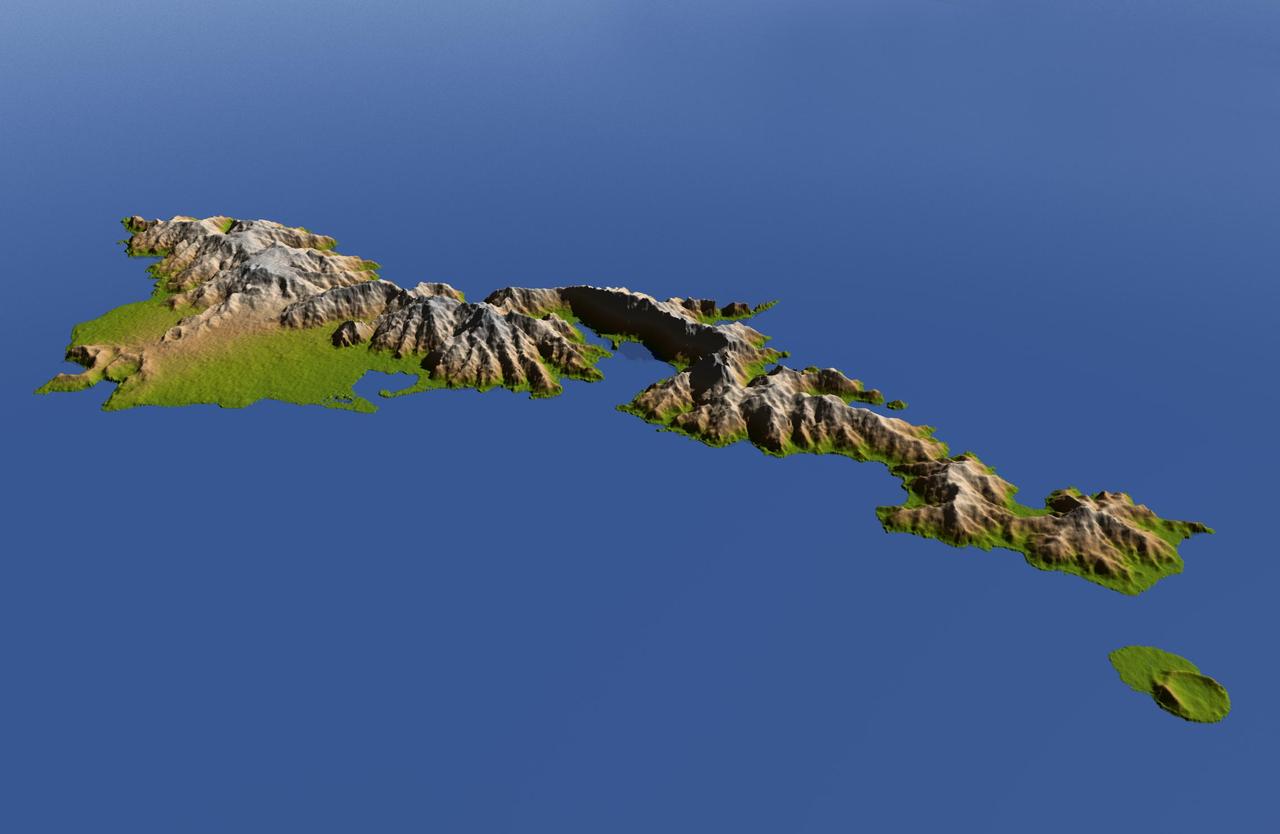
The topography of Tutuila, largest of the islands of American Samoa, is well shown in this color-coded perspective view generated with digital elevation data from the Shuttle Radar Topography Mission (SRTM.) The total area of Tutuila is about 141.8 square kilometers (54.8 square miles), slightly larger than San Francisco. The large bay near the center in this view is Pago Pago Harbor, actually a submerged volcanic crater whose south wall collapsed millions of years ago. Adjacent to the harbor is Pago Pago, the capital of American Samoa, and to the left (west) of the harbor in this view is Matafao Peak, Tutuila’s highest point at 653 meters (2,142 feet). On September 29, 2009, a tsunami generated by a major undersea earthquake located about 200 kilometers (120 miles) southwest of Tutuila inundated the more heavily populated southern coast of the island with an ocean surge more than 3 meters (10 feet) deep, causing scores of casualties. Digital topographic data such as those produced by SRTM aid researchers and planners in predicting which coastal regions are at the most risk from such waves, as well as from the more common storm surges caused by tropical storms and even sea level rise. Two visualization methods were combined to produce the image: shading and color coding of topographic height. The shaded image was derived by computing topographic slope in the northeast-southwest direction, so that northeast slopes appear bright and southwest slopes appear dark. Color coding is directly related to topographic height, with green at the lower elevations, rising through yellow and tan, to white at the highest elevations. The image was then projected using the elevation data to produce this perspective view, with the topography exaggerated by a factor of two. http://photojournal.jpl.nasa.gov/catalog/PIA11965
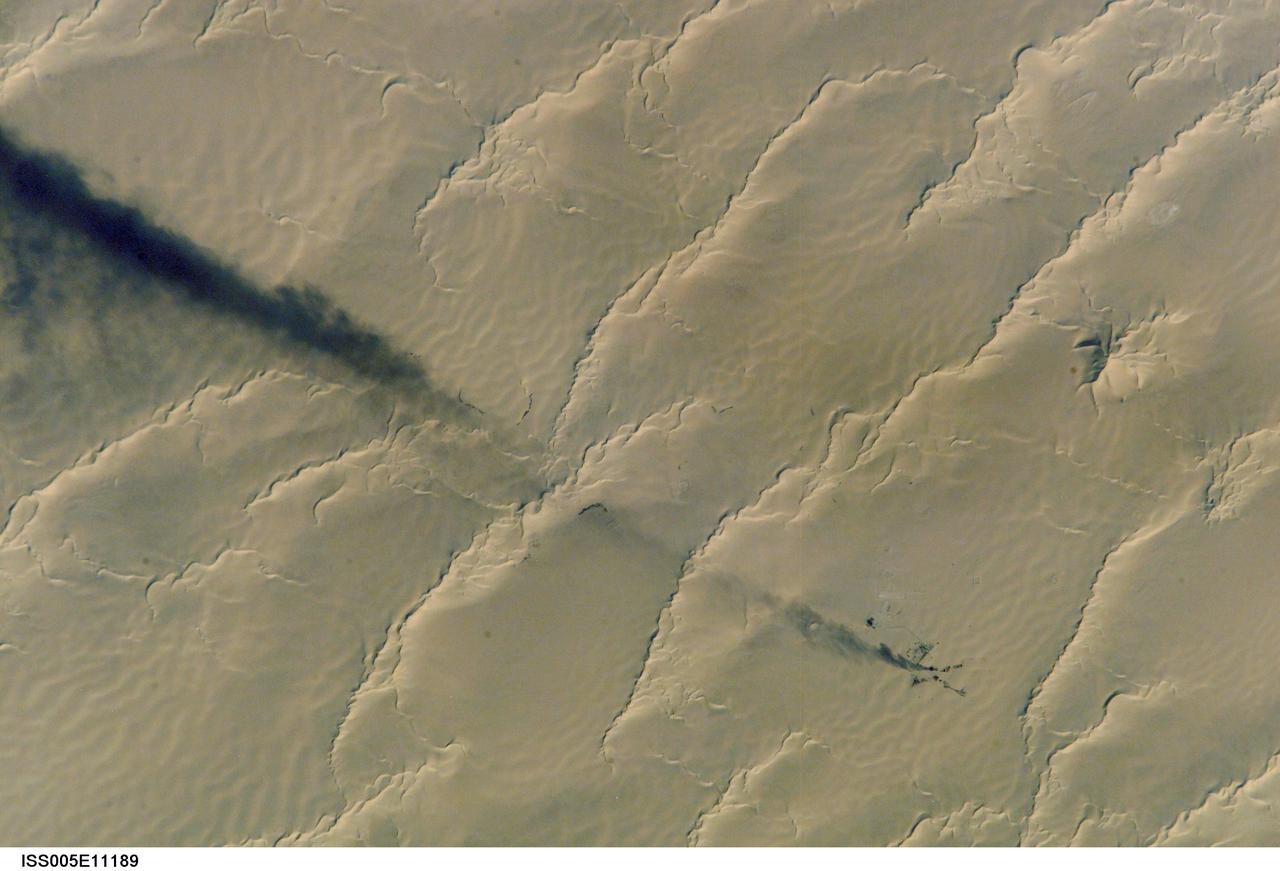
ISS005-E-11189 (25 August 2002) --- Calanscio Sand Sea, Libya is featured in this digital image photographed by an Expedition 5 crewmember on the International Space Station (ISS). A plume of black smoke blowing westward is silhouetted against yellow linear dunes in the great sand sea of northeast Libya. Smoke from flares at remote well heads is commonly seen by astronauts flying over the Sahara Desert. NASA scientists studying the Station imagery had the following observations about the image. The plume dispersal pattern visible at the left edge of the image may be due to upper-level winds or gravitational settling of heavier particulates. The regular pattern of linear dunes is generated by two major winds: the dominant north wind (north is towards the top right) determines the orientation of the sand dunes. Gentler easterly winds, as were blowing when this view was taken, make the dunes asymmetric, with a gentle windward (west) slope and an over steeped downwind slope. Some over steepened slopes even cast shadows in the early morning light. One mound of sand (top right), due north of the well head, does not fit the pattern of linear dunes. This type is known as a star dune.
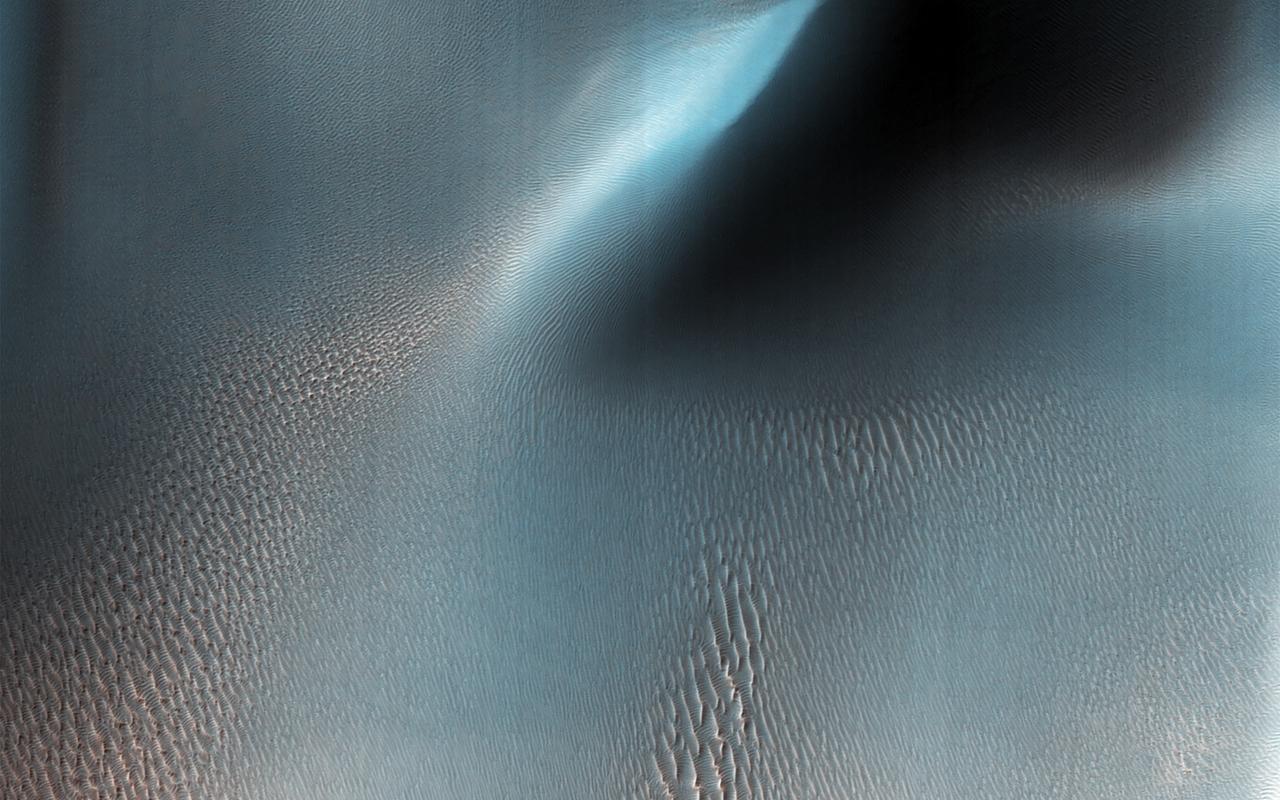
NASA's Mars Reconnaissance Rover (MRO) has observed two types of wind (aeolian) features in Proctor Crater: large, dark features that are sand dunes, made up of basaltic particles, and smaller, light-toned ripples that we call "TAR," or "transverse aeolian ridges." The origin of the TARs is a mystery. They might be dust deposits, or perhaps coarse grained ripples that are coated in bright dust. These TARs are less than 10 meters tall, and are much smaller than the sand dunes that reach impressive heights of over 130 meters. In other places on Mars, TARs are generally older than sand dunes, but here in Proctor Crater, it is not so obvious. How can we tell which came first, the TARs or the dunes? The dunes are situated on top of the TARs, and with this information, we can say the dunes are clearly the younger formations here in Proctor Crater. Fortunately, HiRISE has a tool that can solve this riddle. By taking stereo images of the same region from two different locations, we can estimate the topography of the region by measuring the displacement of surface features from one picture to the other. The result is a quantitative estimate of the local surface topography, called a digital terrain model. The dunes are situated on top of the TARs, and with this information, we can say the dunes are clearly the younger formations here in Proctor Crater. https://photojournal.jpl.nasa.gov/catalog/PIA22040
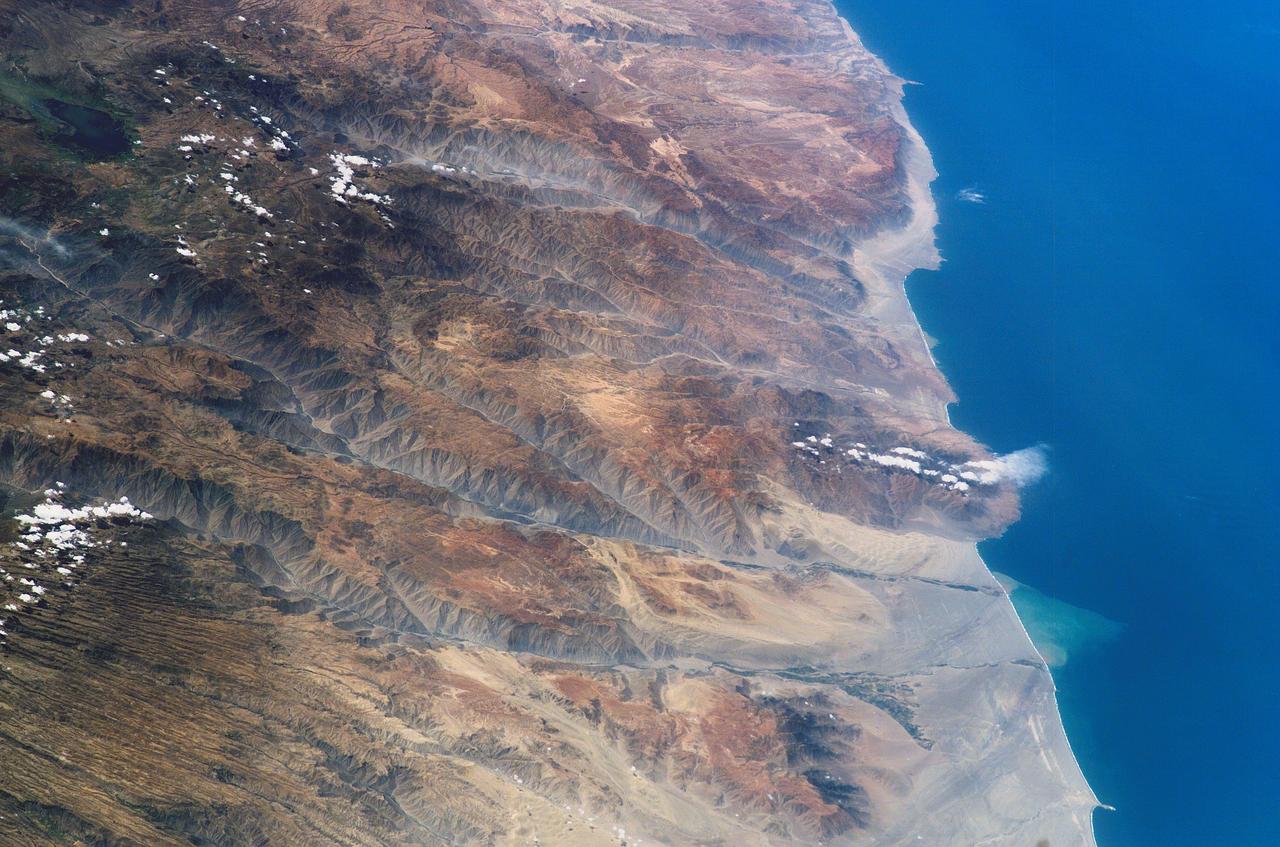
ISS006-E-38306 (14 March 2003) --- The Arid Coast of Peru is featured in this digital image photographed by an Expedition 6 crewmember on the International Space Station (ISS). This oblique, south-looking view shows the dramatic canyons of Peru’s southern coast (15.5 – 17 degrees S). According to NASA scientists studying ISS imagery, these are relatively young features carved by rivers mainly over the past 8 million years following the last major upheaval of the Andes Mountains. The canyons are some of the steepest and deepest on Earth—lake Laguna Parincocha (top left corner) lies on the Andean plateau about 3,250 meters above sea level, only 80 kilometers from the coast. A sheet of volcanic rock (known as an ignimbrite deposit) emplaced during an explosive eruptive event is scored with a dense pattern of parallel dry streams in the lower left corner of the image. Volcanic source regions for the ignimbrite lie outside the left margin of the view. The Yauca and Acarí rivers feed small tan-colored sediment plumes into the sea (lower right). Dark green agricultural fields cluster along the lower courses of the rivers. Strong southerly winds have generated sand dunes and dark wind streaks along the coast, whose alignments re-curve inland into the lower river valleys (lower right). The coast and canyons are commonly hazy due to oceanic air and blowing dust. Yellow lines parallel with the coast and near the small peninsula, according to scientists, are raised shorelines probably caused by tectonic uplift of the coastline.
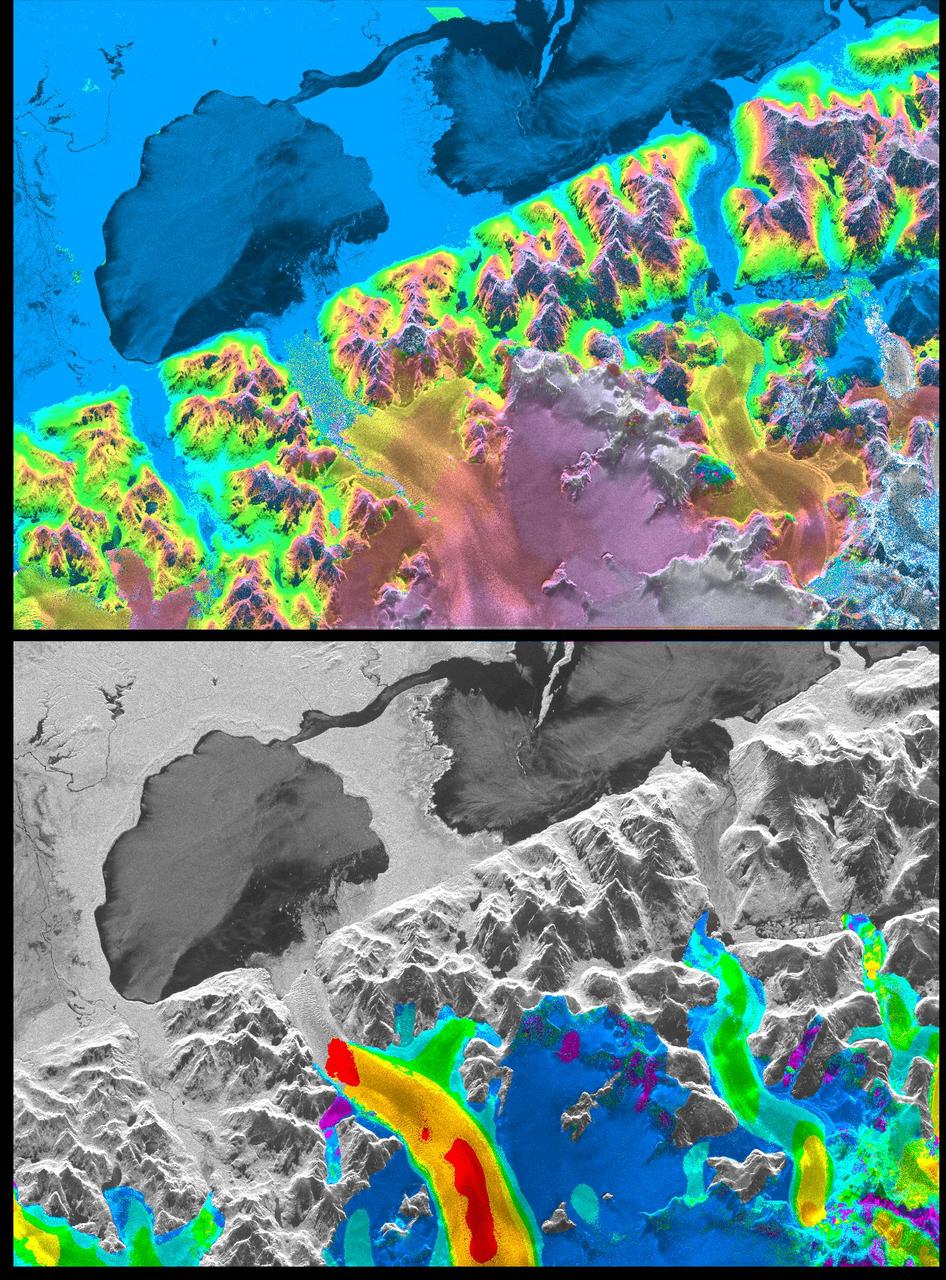
A NASA radar instrument has been successfully used to measure some of the fastest moving and most inaccessible glaciers in the world -- in Chile's huge, remote Patagonia ice fields -- demonstrating a technique that could produce more accurate predictions of glacial response to climate change and corresponding sea level changes. This image, produced with interferometric measurements made by the Spaceborne Imaging Radar-C and X-band Synthetic Aperture Radar (SIR-C/X-SAR) flown on the Space Shuttle last fall, has provided the first detailed measurements of the mass and motion of the San Rafael Glacier. Very few measurements have been made of the Patagonian ice fields, which are the world's largest mid-latitude ice masses and account for more than 60 percent of the Southern Hemisphere's glacial area outside of Antarctica. These features make the area essential for climatologists attempting to understand the response of glaciers on a global scale to changes in climate, but the region's inaccessibility and inhospitable climate have made it nearly impossible for scientists to study its glacial topography, meteorology and changes over time. Currently, topographic data exist for only a few glaciers while no data exist for the vast interior of the ice fields. Velocity has been measured on only five of the more than 100 glaciers, and the data consist of only a few single-point measurements. The interferometry performed by the SIR-C/X-SAR was used to generate both a digital elevation model of the glaciers and a map of their ice motion on a pixel-per-pixel basis at very high resolution for the first time. The data were acquired from nearly the same position in space on October 9, 10 and 11, 1994, at L-band frequency (24-cm wavelength), vertically transmitted and received polarization, as the Space Shuttle Endeavor flew over several Patagonian outlet glaciers of the San Rafael Laguna. The area shown in these two images is 50 kilometers by 30 kilometers (30 miles by 18 miles) in size and is centered at 46.6 degrees south latitude, 73.8 degrees west longitude. North is toward the upper right. The top image is a digital elevation model of the scene, where color and saturation represent terrain height (between 0 meters and 2,000 meters or up to 6,500 feet) and brightness represents radar backscatter. Low elevations are shown in blue and high elevations are shown in pink. The digital elevation map of the glacier surface has a horizontal resolution of 15 meters (50 feet) and a vertical resolution of 10 meters (30 feet). High-resolution maps like these acquired over several years would allow scientists to calculate directly long-term changes in the mass of the glacier. The bottom image is a map of ice motion parallel to the radar look direction only, which is from the top of the image. Purple indicates ice motion away from the radar at more than 6 centimeters per day; dark blue is ice motion toward or away at less than 6 cm per day; light blue is motion toward the radar of 6 cm to 20 cm (about 2 to 8 inches) per day; green is motion toward the radar of 20 cm to 45 cm (about 8 to 18 inches) per day; yellow is 45 cm to 85 cm (about 18 to 33 inches) per day; orange is 85 cm to 180 cm (about 33 to 71 inches) per day; red is greater than 180 cm (71 inches) per day. The velocity estimates are accurate to within 5 millimeters per day. The largest velocities are recorded on the San Rafael Glacier in agreement with previous work. Other outlet glaciers exhibit ice velocities of less than 1 meter per day. Several kilometers before its terminus, (left of center) the velocity of the San Rafael Glacier exceeds 10 meters (32 feet) per day, and ice motion cannot be estimated from the data. There, a revisit time interval of less than 12 hours would have been necessary to estimate ice motion from interferometry data. The results however demonstrate that the radar interferometry technique permits the monitoring of glacier characteristics unattainable by any other means. http://photojournal.jpl.nasa.gov/catalog/PIA01781

jsc2022e062020 (6/30/2022) --- Space Health will create a digital twin of the astronaut from the data collected by the Bio-Monitor and demonstrate how this could be used for autonomous health monitoring on future space missions. (Image courtesy of CSA)
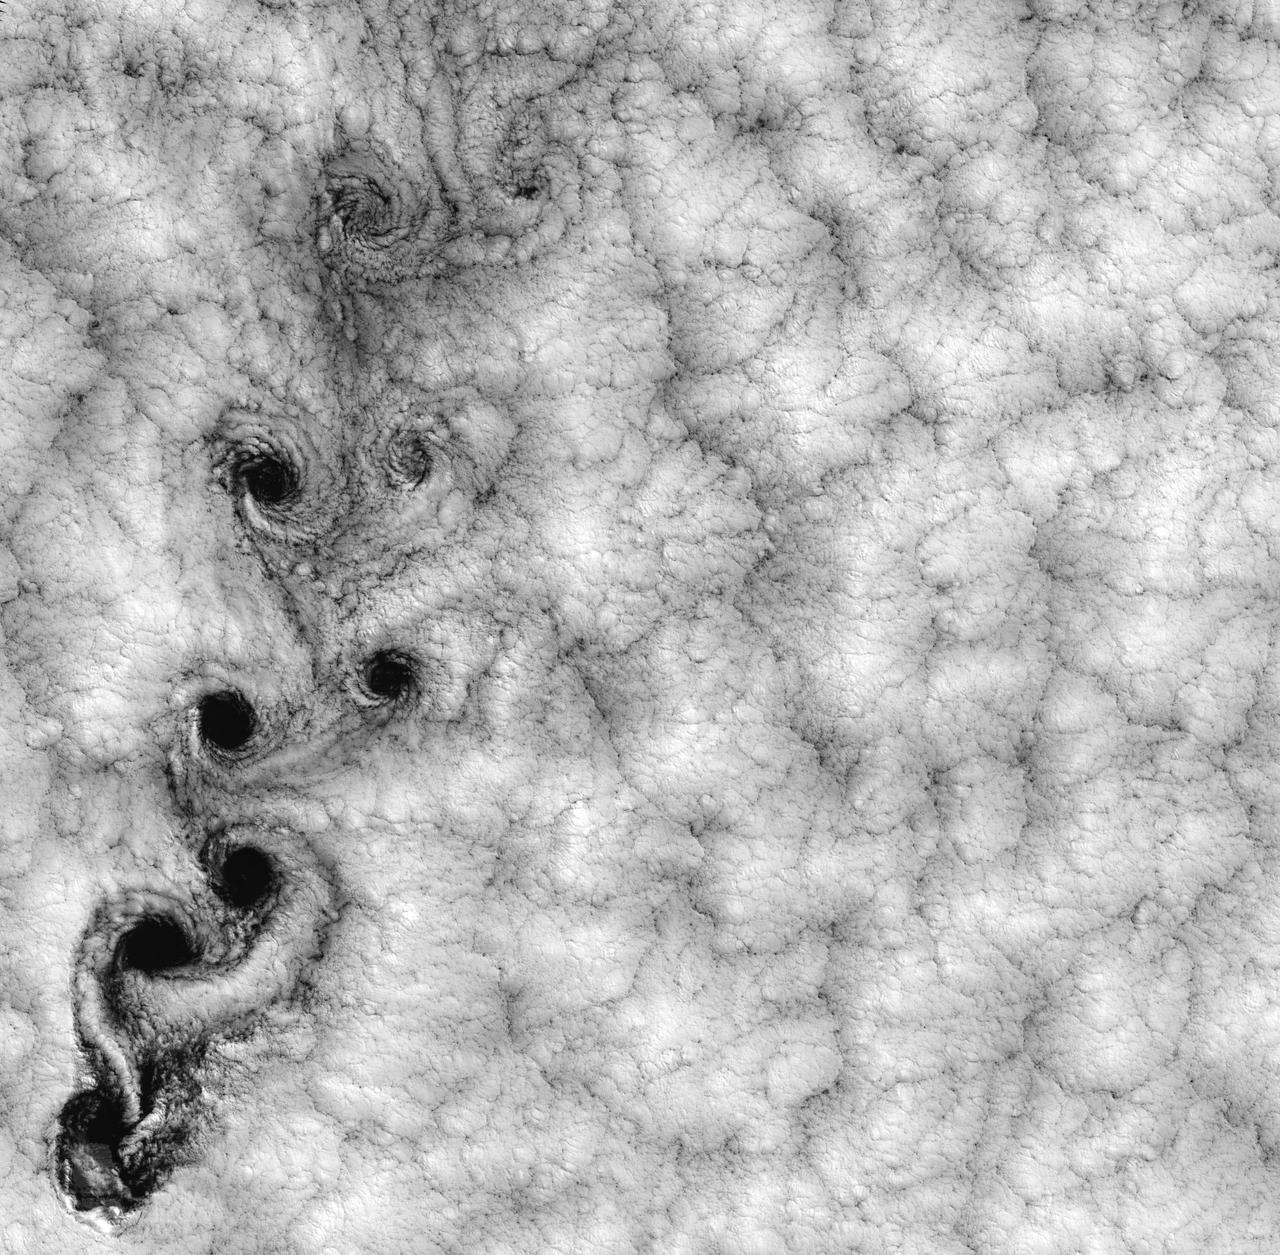
NASA image acquired September 15, 1999 This Landsat 7 image of clouds off the Chilean coast near the Juan Fernandez Islands (also known as the Robinson Crusoe Islands) on September 15, 1999, shows a unique pattern called a “von Karman vortex street.” This pattern has long been studied in the laboratory, where the vortices are created by oil flowing past a cylindrical obstacle, making a string of vortices only several tens of centimeters long. Study of this classic “flow past a circular cylinder” has been very important in the understanding of laminar and turbulent fluid flow that controls a wide variety of phenomena, from the lift under an aircraft wing to Earth’s weather. Here, the cylinder is replaced by Alejandro Selkirk Island (named after the true “Robinson Crusoe,” who was stranded here for many months in the early 1700s). The island is about 1.5 km in diameter, and rises 1.6 km into a layer of marine stratocumulus clouds. This type of cloud is important for its strong cooling of the Earth’s surface, partially counteracting the Greenhouse warming. An extended, steady equatorward wind creates vortices with clockwise flow off the eastern edge and counterclockwise flow off the western edge of the island. The vortices grow as they advect hundreds of kilometers downwind, making a street 10,000 times longer than those made in the laboratory. Observing the same phenomenon extended over such a wide range of sizes dramatizes the “fractal” nature of atmospheric convection and clouds. Fractals are characteristic of fluid flow and other dynamic systems that exhibit “chaotic” motions. Both clockwise and counter-clockwise vortices are generated by flow around the island. As the flow separates from the island’s leeward (away from the source of the wind) side, the vortices “swallow” some of the clear air over the island. (Much of the island air is cloudless due to a local “land breeze” circulation set up by the larger heat capacity of the waters surrounding the island.) The “swallowed” gulps of clear island air get carried along within the vortices, but these are soon mixed into the surrounding clouds. Landsat is unique in its ability to image both the small-scale eddies that mix clear and cloudy air, down to the 30 meter pixel size of Landsat, but also having a wide enough field-of-view, 180 km, to reveal the connection of the turbulence to large-scale flows such as the subtropical oceanic gyres. Landsat 7, with its new onboard digital recorder, has extended this capability away from the few Landsat ground stations to remote areas such as Alejandro Island, and thus is gradually providing a global dynamic picture of evolving human-scale phenomena. For more details on von Karman vortices, refer to <a href="http://climate.gsfc.nasa.gov/~cahalan" rel="nofollow">climate.gsfc.nasa.gov/~cahalan</a>. Image and caption courtesy Bob Cahalan, NASA GSFC Instrument: Landsat 7 - ETM+ Credit: NASA/GSFC/Landsat <b><a href="http://www.nasa.gov/centers/goddard/home/index.html" rel="nofollow">NASA Goddard Space Flight Center</a></b> enables NASA’s mission through four scientific endeavors: Earth Science, Heliophysics, Solar System Exploration, and Astrophysics. Goddard plays a leading role in NASA’s accomplishments by contributing compelling scientific knowledge to advance the Agency’s mission. <b>Follow us on <a href="http://twitter.com/NASA_GoddardPix" rel="nofollow">Twitter</a></b> <b>Join us on <a href="http://www.facebook.com/pages/Greenbelt-MD/NASA-Goddard/395013845897?ref=tsd" rel="nofollow">Facebook</a></b>
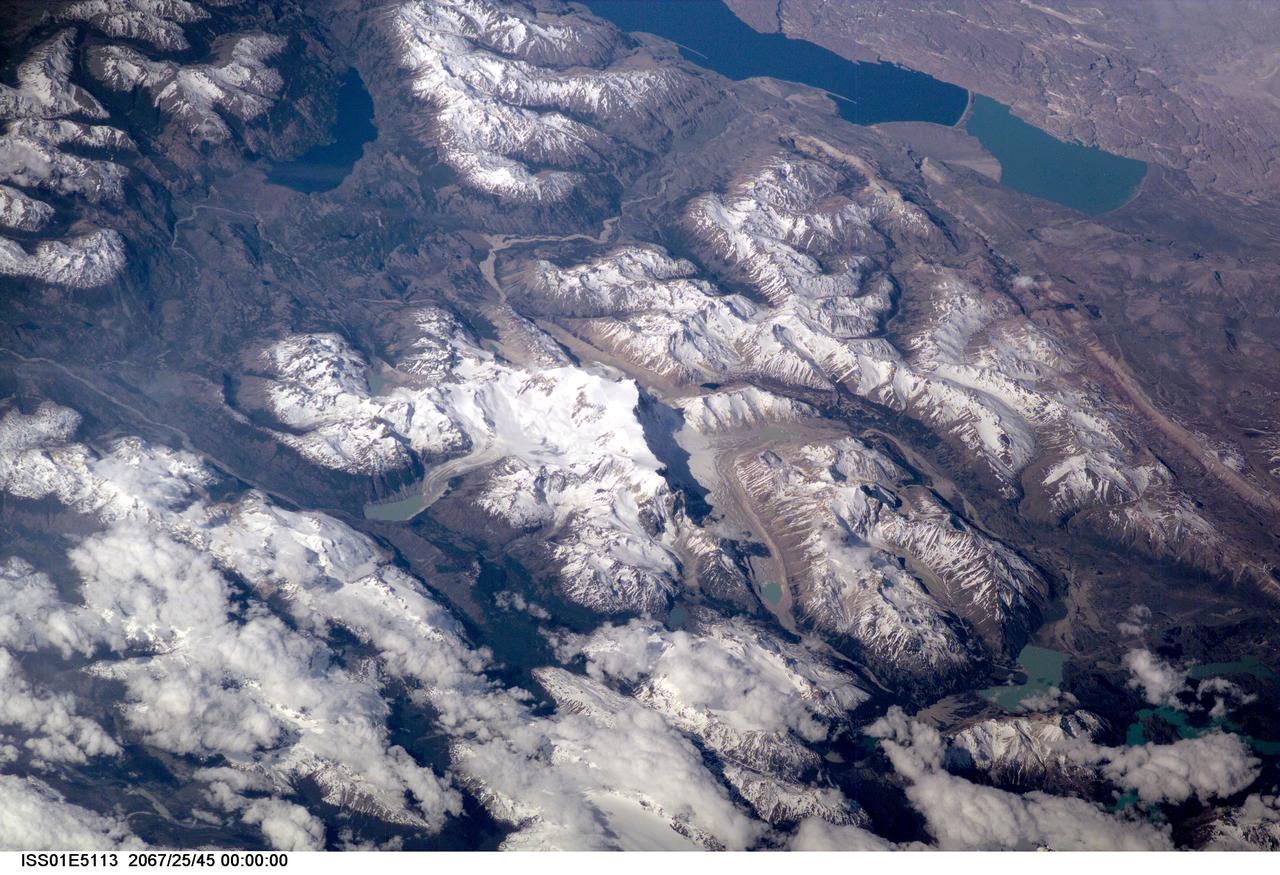
ISS01-E-5113 (December 2000) --- This scene on the remote, rugged Argentine/Chilean border in the far southern Andes Mountains offers numerous, dramatic examples of both erosional processes and features of ice and water. The sharp, glaciated crest of the Cerro San Lorenzo (center) exceeds 12,000 feet and casts a long shadow southeastward. Glaciers on its western flank flow into the valley. Lago Pueyrredon, and the other lakes visible here, have been excavated by geologically "recent" episodes of glacier erosion, when glaciers extended all the way onto the lowland plains (top right). Since the last melting of the glaciers, scientists estimate about 15,000 years ago, three distinct "fan-deltas" have formed where rivers flow into the lake. Counterclockwise currents in the lake, driven by strong winds from the west, have generated thin sand spits from each fan-delta. The largest spit (attached to the largest fan-delta, see right arrow) has isolated an approximately 10-kilometer long segment of the south end of the lake. This river, which has constructed the large fan, presently discharges turbid water to this isolated basin, giving it a lighter color than the rest of the lake. This Digital Still Camera photo was taken from the International Space Station, in December 2000 (late spring for this part of the world) when most of the previous winter's snow had melted below an altitude of 6,000 feet. Little evidence of man's presence can be found in this rough, desolate region. Glacial data collected over the past 50 years indicate that small ice bodies are disappearing at accelerated rates. (EOS, vol 81, no. 24, June 13, 2000) Predictions are that large fluctuations in land ice, with significant implications to society, are possible in the coming decades and centuries due to natural and anthropogenic climate change. Before glacial data can be used to address critical problems pertaining to the world's economic and environmental health, more detailed information about such glaciers is needed. Images like this from the International Space Station can be added to those taken from satellites (Landsat-7, instruments on the Terra satellite launched in 1999) to build data sets of glaciers in remote areas around the world.