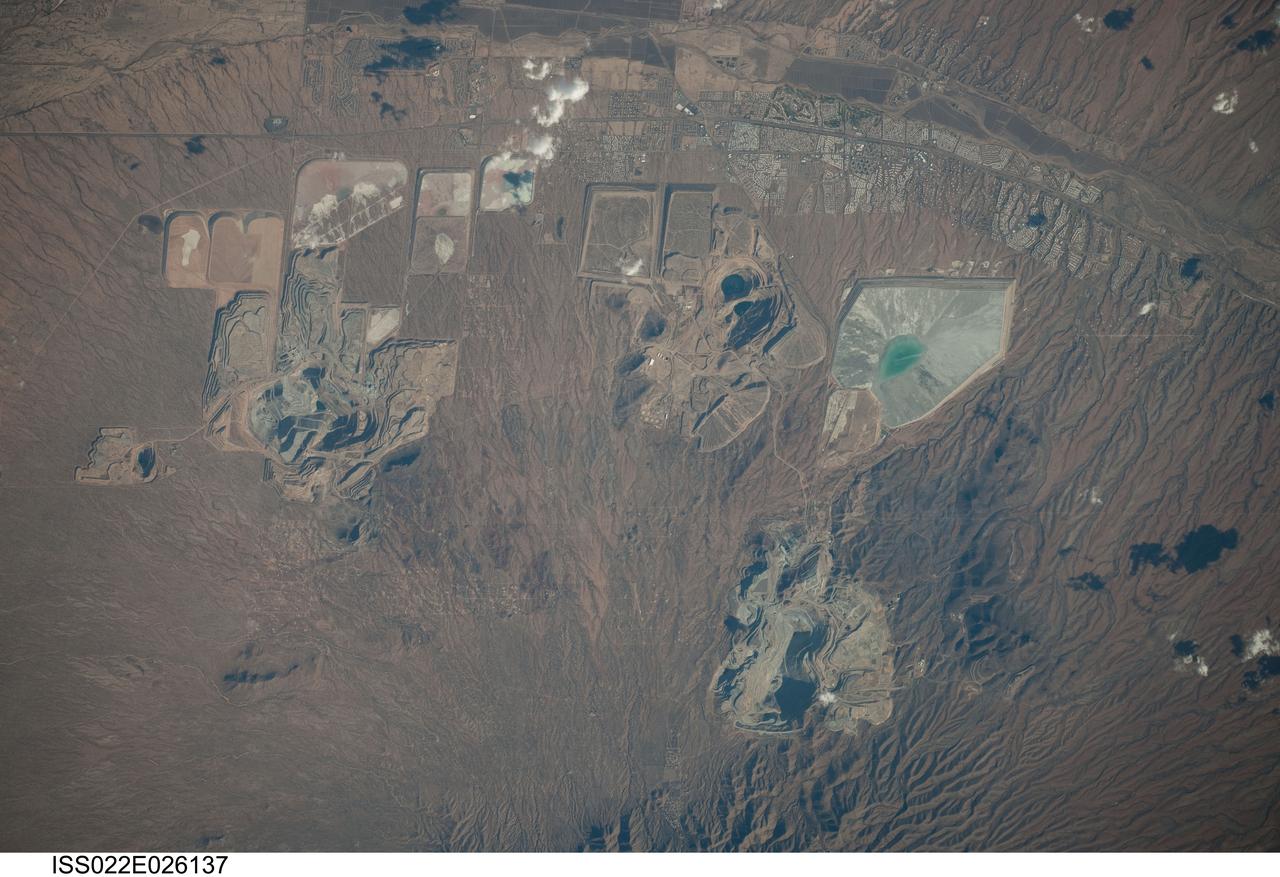
ISS022-E-026137 (14 Jan. 2010) --- Open Pit Mines in southern Arizona are featured in this image photographed by an Expedition 22 crew member on the International Space Station. The State of Arizona is the United States? largest producer of the metal copper, primarily mined from ore bodies known as porphyry copper deposits. Copper is a good conductor of electricity and heat, and is a vital element of virtually all of our electronic devices and components. A porphyry copper deposit is a geological structure formed by crystal-rich magma moving upwards through pre-existing rock layers. As the magma cools and crystallizes, it forms an igneous rock with large crystals embedded in a fine-grained matrix, known as porphyry. Hot fluids circulate through the magma and surrounding rocks via fractures, depositing copper-bearing and other minerals in characteristic spatial patterns that signal the nature of the ore body to a geologist. The most common approach to extracting metal-bearing ore from a porphyry copper deposit is by open-pit mining. For more details, please refer to http://earth.jsc.nasa.gov/EarthObservatory/OpenPitMinesSouthernArizona.htm.

The Visible Infrared Imaging Radiometer Suite (VIIRS) on the Suomi NPP satellite captured this view of extensive sea-ice fracturing off the northern coast of Alaska. The event began in late-January and spread west toward Banks Island throughout February and March 2013. Visualizations of the Arctic often give the impression that the ice cap is a continuous sheet of stationary, floating ice. In fact, it is a collection of smaller pieces that constantly shift, crack, and grind against one another as they are jostled by winds and ocean currents. Especially during the summer—but even during the height of winter—cracks—or leads—open up between pieces of ice. That was what was happening on the left side of the animation (seen here: <a href="http://bit.ly/10kE7sh" rel="nofollow">bit.ly/10kE7sh</a>) in late January. A high-pressure weather system was parked over the region, producing warmer temperatures and winds that flowed in a southwesterly direction. That fueled the Beaufort Gyre, a wind-driven ocean current that flows clockwise. The gyre was the key force pulling pieces of ice west past Point Barrow, the northern nub of Alaska that protrudes into the Beaufort Sea. “A fracturing event in this area is not unusual because the Beaufort Gyre tends to push ice away from Banks Island and the Canadian Archipelago,” explained Walt Meier of the National Snow & Ice Data Center (NSIDC). “Point Barrow can act like a ‘pin point’ where the ice catches and fractures to the north and east.” In February, however, a series of storms passing over central Alaska exacerbated the fracturing. Strong westerly winds prompted several large pieces of ice to break away in an arc-shaped wave that moved progressively east. By the end of February, large pieces of ice had fractured all the way to the western coast of Banks Island, a distance of about 1,000 kilometers (600 miles). The data used to create the animation came from the longwave infrared (thermal) portion of the electromagnetic spectrum, so the animation illustrates how much heat the surface was emitting as VIIRS surveyed the area. Cooler areas (sea ice) appear white, while warmer areas (open water) are dark. The light gray plume near the cracks is warmer, moister air escaping from the ocean and blowing downwind. Clouds do not show up well in the VIIRS thermal band, so the storms that fueled the fracturing are not readily visible. While fracturing events are common, few events sprawl across such a large area or produce cracks as long and wide as those seen here. The age of the sea ice in this area was one of the key reasons this event became so widespread. “The region is covered almost completely by seasonal or first-year ice—ice that has formed since last September,” said Meier. “This ice is thinner and weaker than the older, multi-year ice, so it responds more readily to winds and is more easily broken up.” NASA Earth Observatory images by Jesse Allen using VIIRS day-night band data from the Suomi National Polar-orbiting Partnership. Suomi NPP is the result of a partnership between NASA, the National Oceanic and Atmospheric Administration, and the Department of Defense. Caption by Adam Voiland. Instrument: Suomi NPP - VIIRS For more info go to: <a href="http://earthobservatory.nasa.gov/IOTD/view.php?id=80752" rel="nofollow">earthobservatory.nasa.gov/IOTD/view.php?id=80752</a> Credit: <b><a href="http://www.earthobservatory.nasa.gov/" rel="nofollow"> NASA Earth Observatory</a></b> <b><a href="http://www.nasa.gov/audience/formedia/features/MP_Photo_Guidelines.html" rel="nofollow">NASA image use policy.</a></b> <b><a href="http://www.nasa.gov/centers/goddard/home/index.html" rel="nofollow">NASA Goddard Space Flight Center</a></b> enables NASA’s mission through four scientific endeavors: Earth Science, Heliophysics, Solar System Exploration, and Astrophysics. Goddard plays a leading role in NASA’s accomplishments by contributing compelling scientific knowledge to advance the Agency’s mission. <b>Follow us on <a href="http://twitter.com/NASA_GoddardPix" rel="nofollow">Twitter</a></b> <b>Like us on <a href="http://www.facebook.com/pages/Greenbelt-MD/NASA-Goddard/395013845897?ref=tsd" rel="nofollow">Facebook</a></b> <b>Find us on <a href="http://instagram.com/nasagoddard?vm=grid" rel="nofollow">Instagram</a></b>

Image acquired February 19, 2010: Tropical Cyclone Gelane had sustained winds of 125 knots (230 kilometers per hour) and gusts up to 150 knots (275 kilometers per hour), according to a report from the U.S. Navy’s Joint Typhoon Warning Center (JTWC) on February 19, 2010. The JTWC reported that Gelane was roughly 315 nautical miles (585 kilometers) east-northeast of Port Louis, Mauritius, and was forecast to travel toward the southwest, weakening slightly as it moved. The Moderate Resolution Imaging Spectroradiometer (MODIS) on NASA’s Aqua satellite captured this true-color image on February 19, 2010. Gelane’s spiral arms span hundreds of kilometers over the open ocean. Credit: NASA image by Jeff Schmaltz, MODIS Rapid Response Team, Goddard Space Flight Center. Caption by Michon Scott. Instrument: Aqua - MODIS..For more details and a higher res file of this image go to: <a href="http://earthobservatory.nasa.gov/NaturalHazards/view.php?id=42767" rel="nofollow">earthobservatory.nasa.gov/NaturalHazards/view.php?id=42767</a>

NASA image acquired August 4, 2010 Though many areas in northwest Pakistan were bracing for heavy rain and additional flash flooding on August 4, 2010, the city of Kheshgi, in northwest Pakistan, had clear skies. This image, taken by the Advanced Spaceborne Thermal Emission and Reflection Radiometer (ASTER) on NASA’s Terra satellite reveals a city awash in flood water. Thick with mud, the Kabul River is pale green in this false color image. Clearer water is dark blue. The river flows through its usual channel, but in places, water seeps over the channel and across the landscape. The buildings and roads of Kheshgi are silver. Spots of turquoise blue—shallow, muddy water or water-logged ground—covers several sections of the city. On the south side of the Kabul River, water flows down the hills, washing over neighborhoods. The bare ground in the hills is brown and tan. Plant-covered land, red in this image, is divided into long, narrow rectangles, pointing to agriculture. Geometric shapes under the water near the river are probably submerged fields of crops. Thousands of acres of crops had been lost in floods throughout Pakistan, said the United Nations. Kheshgi is in the Nowshera district in the Khyber Pakhutnkhwa province. As of August 2, Khyber Pakhutnkhwa was the hardest hit province in Pakistan, said the United Nations, and Nowshera was the most impacted district in the province. Nowshera reported 500,000 people displaced with 161 dead, said the Government of Khuber Pakhtunkhwa. The floods affected communities throughout Pakistan. More than 1,100 people had died, 15,000 homes were damaged or destroyed, and at least one million people were in need of emergency assistance throughout Pakistan, said the United Nations on August 2. The floods occurred as unusually heavy monsoon rains fell over Pakistan. NASA image courtesy NASA/GSFC/MITI/ERSDAC/JAROS, and U.S./Japan ASTER Science Team. Caption by Holli Riebeek. Instrument: Terra - ASTER Credit: <b><a href="#//earthobservatory.nasa.gov/" rel="nofollow"> NASA’s Earth Observatory</a></b> To learn more about this image go here: <a href="http://earthobservatory.nasa.gov/NaturalHazards/view.php?id=45050" rel="nofollow">earthobservatory.nasa.gov/NaturalHazards/view.php?id=45050</a> Or here: <a href="http://earthobservatory.nasa.gov/NaturalHazards/view.php?id=45343" rel="nofollow">earthobservatory.nasa.gov/NaturalHazards/view.php?id=45343</a> <b><a href="http://www.nasa.gov/centers/goddard/home/index.html" rel="nofollow">NASA Goddard Space Flight Center</a></b> is home to the nation's largest organization of combined scientists, engineers and technologists that build spacecraft, instruments and new technology to study the Earth, the sun, our solar system, and the universe. <b>Follow us on <a href="http://twitter.com/NASA_GoddardPix" rel="nofollow">Twitter</a></b> <b>Join us on <a href="http://www.facebook.com/pages/Greenbelt-MD/NASA-Goddard/395013845897?ref=tsd" rel="nofollow">Facebook</a></b>

The Visible Infrared Imaging Radiometer Suite (VIIRS) on the Suomi NPP satellite captured this view of extensive sea-ice fracturing off the northern coast of Alaska. The event began in late-January and spread west toward Banks Island throughout February and March 2013. Visualizations of the Arctic often give the impression that the ice cap is a continuous sheet of stationary, floating ice. In fact, it is a collection of smaller pieces that constantly shift, crack, and grind against one another as they are jostled by winds and ocean currents. Especially during the summer—but even during the height of winter—cracks—or leads—open up between pieces of ice. That was what was happening on the left side of the animation (seen here: <a href="http://bit.ly/10kE7sh" rel="nofollow">bit.ly/10kE7sh</a>) in late January. A high-pressure weather system was parked over the region, producing warmer temperatures and winds that flowed in a southwesterly direction. That fueled the Beaufort Gyre, a wind-driven ocean current that flows clockwise. The gyre was the key force pulling pieces of ice west past Point Barrow, the northern nub of Alaska that protrudes into the Beaufort Sea. “A fracturing event in this area is not unusual because the Beaufort Gyre tends to push ice away from Banks Island and the Canadian Archipelago,” explained Walt Meier of the National Snow & Ice Data Center (NSIDC). “Point Barrow can act like a ‘pin point’ where the ice catches and fractures to the north and east.” In February, however, a series of storms passing over central Alaska exacerbated the fracturing. Strong westerly winds prompted several large pieces of ice to break away in an arc-shaped wave that moved progressively east. By the end of February, large pieces of ice had fractured all the way to the western coast of Banks Island, a distance of about 1,000 kilometers (600 miles). The data used to create the animation came from the longwave infrared (thermal) portion of the electromagnetic spectrum, so the animation illustrates how much heat the surface was emitting as VIIRS surveyed the area. Cooler areas (sea ice) appear white, while warmer areas (open water) are dark. The light gray plume near the cracks is warmer, moister air escaping from the ocean and blowing downwind. Clouds do not show up well in the VIIRS thermal band, so the storms that fueled the fracturing are not readily visible. While fracturing events are common, few events sprawl across such a large area or produce cracks as long and wide as those seen here. The age of the sea ice in this area was one of the key reasons this event became so widespread. “The region is covered almost completely by seasonal or first-year ice—ice that has formed since last September,” said Meier. “This ice is thinner and weaker than the older, multi-year ice, so it responds more readily to winds and is more easily broken up.” NASA Earth Observatory images by Jesse Allen using VIIRS day-night band data from the Suomi National Polar-orbiting Partnership. Suomi NPP is the result of a partnership between NASA, the National Oceanic and Atmospheric Administration, and the Department of Defense. Caption by Adam Voiland. Instrument: Suomi NPP - VIIRS For more info go to: <a href="http://earthobservatory.nasa.gov/IOTD/view.php?id=80752" rel="nofollow">earthobservatory.nasa.gov/IOTD/view.php?id=80752</a> Credit: <b><a href="http://www.earthobservatory.nasa.gov/" rel="nofollow"> NASA Earth Observatory</a></b> <b><a href="http://www.nasa.gov/audience/formedia/features/MP_Photo_Guidelines.html" rel="nofollow">NASA image use policy.</a></b> <b><a href="http://www.nasa.gov/centers/goddard/home/index.html" rel="nofollow">NASA Goddard Space Flight Center</a></b> enables NASA’s mission through four scientific endeavors: Earth Science, Heliophysics, Solar System Exploration, and Astrophysics. Goddard plays a leading role in NASA’s accomplishments by contributing compelling scientific knowledge to advance the Agency’s mission. <b>Follow us on <a href="http://twitter.com/NASA_GoddardPix" rel="nofollow">Twitter</a></b> <b>Like us on <a href="http://www.facebook.com/pages/Greenbelt-MD/NASA-Goddard/395013845897?ref=tsd" rel="nofollow">Facebook</a></b> <b>Find us on <a href="http://instagram.com/nasagoddard?vm=grid" rel="nofollow">Instagram</a></b>

The Visible Infrared Imaging Radiometer Suite (VIIRS) on the Suomi NPP satellite captured this view of extensive sea-ice fracturing off the northern coast of Alaska. The event began in late-January and spread west toward Banks Island throughout February and March 2013. Visualizations of the Arctic often give the impression that the ice cap is a continuous sheet of stationary, floating ice. In fact, it is a collection of smaller pieces that constantly shift, crack, and grind against one another as they are jostled by winds and ocean currents. Especially during the summer—but even during the height of winter—cracks—or leads—open up between pieces of ice. That was what was happening on the left side of the animation (seen here: <a href="http://bit.ly/10kE7sh" rel="nofollow">bit.ly/10kE7sh</a>) in late January. A high-pressure weather system was parked over the region, producing warmer temperatures and winds that flowed in a southwesterly direction. That fueled the Beaufort Gyre, a wind-driven ocean current that flows clockwise. The gyre was the key force pulling pieces of ice west past Point Barrow, the northern nub of Alaska that protrudes into the Beaufort Sea. “A fracturing event in this area is not unusual because the Beaufort Gyre tends to push ice away from Banks Island and the Canadian Archipelago,” explained Walt Meier of the National Snow & Ice Data Center (NSIDC). “Point Barrow can act like a ‘pin point’ where the ice catches and fractures to the north and east.” In February, however, a series of storms passing over central Alaska exacerbated the fracturing. Strong westerly winds prompted several large pieces of ice to break away in an arc-shaped wave that moved progressively east. By the end of February, large pieces of ice had fractured all the way to the western coast of Banks Island, a distance of about 1,000 kilometers (600 miles). The data used to create the animation came from the longwave infrared (thermal) portion of the electromagnetic spectrum, so the animation illustrates how much heat the surface was emitting as VIIRS surveyed the area. Cooler areas (sea ice) appear white, while warmer areas (open water) are dark. The light gray plume near the cracks is warmer, moister air escaping from the ocean and blowing downwind. Clouds do not show up well in the VIIRS thermal band, so the storms that fueled the fracturing are not readily visible. While fracturing events are common, few events sprawl across such a large area or produce cracks as long and wide as those seen here. The age of the sea ice in this area was one of the key reasons this event became so widespread. “The region is covered almost completely by seasonal or first-year ice—ice that has formed since last September,” said Meier. “This ice is thinner and weaker than the older, multi-year ice, so it responds more readily to winds and is more easily broken up.” NASA Earth Observatory images by Jesse Allen using VIIRS day-night band data from the Suomi National Polar-orbiting Partnership. Suomi NPP is the result of a partnership between NASA, the National Oceanic and Atmospheric Administration, and the Department of Defense. Caption by Adam Voiland. Instrument: Suomi NPP - VIIRS For more info go to: <a href="http://earthobservatory.nasa.gov/IOTD/view.php?id=80752" rel="nofollow">earthobservatory.nasa.gov/IOTD/view.php?id=80752</a> Credit: <b><a href="http://www.earthobservatory.nasa.gov/" rel="nofollow"> NASA Earth Observatory</a></b> <b><a href="http://www.nasa.gov/audience/formedia/features/MP_Photo_Guidelines.html" rel="nofollow">NASA image use policy.</a></b> <b><a href="http://www.nasa.gov/centers/goddard/home/index.html" rel="nofollow">NASA Goddard Space Flight Center</a></b> enables NASA’s mission through four scientific endeavors: Earth Science, Heliophysics, Solar System Exploration, and Astrophysics. Goddard plays a leading role in NASA’s accomplishments by contributing compelling scientific knowledge to advance the Agency’s mission. <b>Follow us on <a href="http://twitter.com/NASA_GoddardPix" rel="nofollow">Twitter</a></b> <b>Like us on <a href="http://www.facebook.com/pages/Greenbelt-MD/NASA-Goddard/395013845897?ref=tsd" rel="nofollow">Facebook</a></b> <b>Find us on <a href="http://instagram.com/nasagoddard?vm=grid" rel="nofollow">Instagram</a></b>
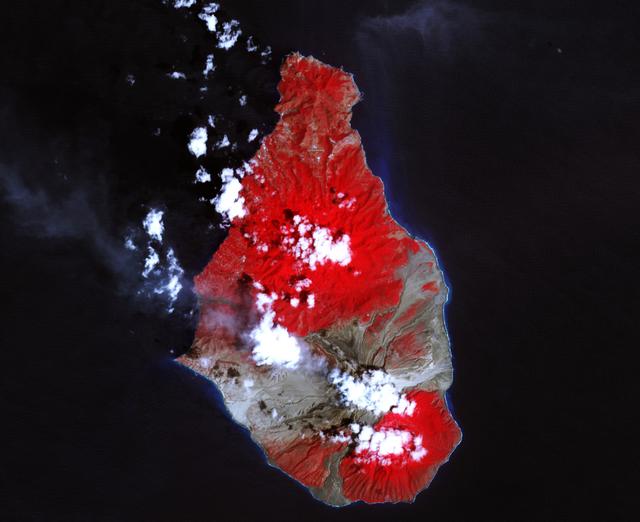
A massive eruption of Montserrat’s Soufrière Hills Volcano covered large portions of the island in debris. The eruption was triggered by a collapse of Soufrière Hills’ summit lava dome on February 11, 2010. Pyroclastic flows raced down the northern flank of the volcano, leveling trees and destroying buildings in the village of Harris, which was abandoned after Soufrière Hills became active in 1995. The Montserrat Volcano Observatory reported that some flows, about 15 meters (49 feet) thick, reached the sea at Trant’s Bay. These flows extended the island’s coastline up to 650 meters (2,100 feet). These false-color satellite images show the southern half of Montserrat before and after the dome collapse. The top image shows Montserrat on February 21, 2010, just 10 days after the event. For comparison, the bottom image shows the same area on March 17, 2007. Red areas are vegetated, clouds are white, blue/black areas are ocean water, and gray areas are covered by flow deposits. Fresh deposits tend to be lighter than older deposits. On February 21, the drainages leading down from Soufrière Hills, including the White River Valley, the Tar River Valley, and the Belham River Valley, were filled with fresh debris. According to the Montserrat Volcano Observatory, pyroclastic flows reached the sea through Aymers Ghaut on January 18, 2010, and flows entered the sea near Plymouth on February 5, 2010. NASA Earth Observatory image by Robert Simmon, using data from the NASA/GSFC/METI/ERSDAC/JAROS, and U.S./Japan ASTER Science Team. Caption by Robert Simmon. To read more go to: <a href="http://earthobservatory.nasa.gov/IOTD/view.php?id=42792" rel="nofollow">earthobservatory.nasa.gov/IOTD/view.php?id=42792</a> <b><a href="http://www.nasa.gov/centers/goddard/home/index.html" rel="nofollow">NASA Goddard Space Flight Center</a></b> is home to the nation's largest organization of combined scientists, engineers and technologists that build spacecraft, instruments and new technology to study the Earth, the sun, our solar system, and the universe. <b>Follow us on <a href="http://twitter.com/NASA_GoddardPix" rel="nofollow">Twitter</a></b> <b>Join us on <a href="http://www.facebook.com/pages/Greenbelt-MD/NASA-Goddard/395013845897?ref=tsd" rel="nofollow">Facebook</a><b> </b></b>
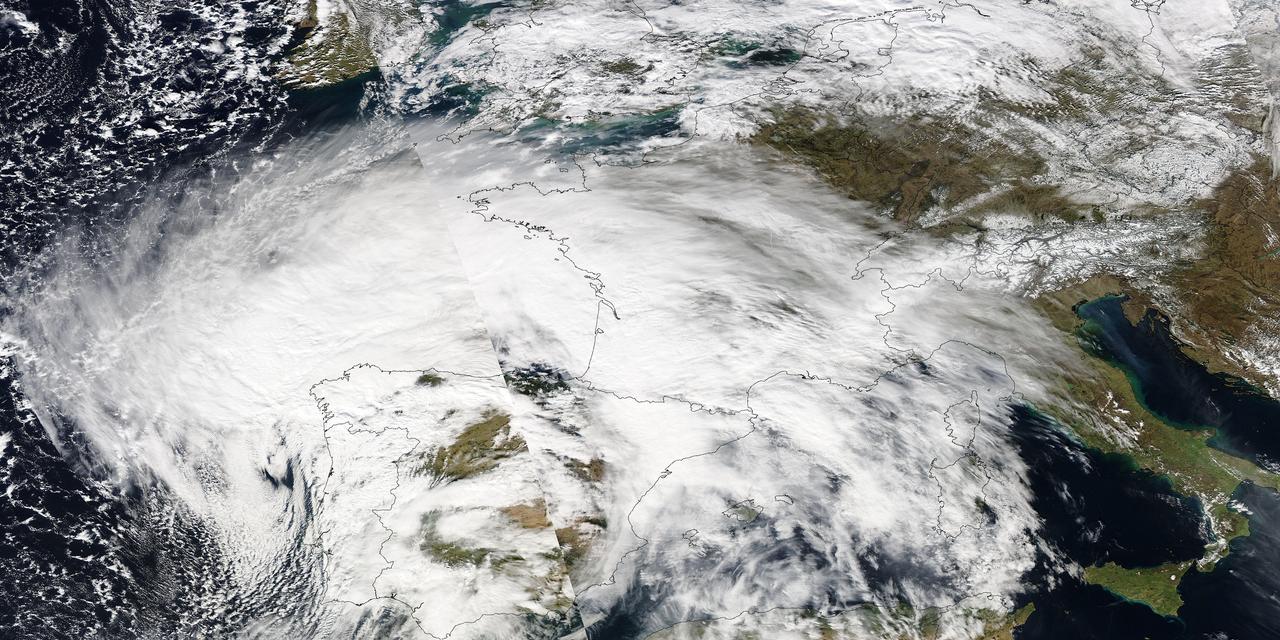
Image acquired February 27, 2010: An extratropical cyclone named Xynthia brought hurricane-force winds and high waves to Western Europe at the end of February 2010, CNN reported. Winds as fast as 200 kilometers (125 miles) per hour reached as far inland as Paris, and at the storm’s peak, hurricane-force winds extended from Portugal to the Netherlands. Hundreds of people had to take refuge from rising waters on their rooftops. By March 1, at least 58 people had died, some of them struck by falling trees. Most of the deaths occurred in France, but the storm also caused casualties in England, Germany, Belgium, Spain, and Portugal. The Moderate Resolution Imaging Spectroradiometer (MODIS) on NASA’s Aqua satellite captured this image of Western Europe, acquired in two separate overpasses on February 27, 2010. MODIS captured the eastern half of the image around 10:50 UTC, and the western half about 12:30 UTC. Forming a giant comma shape, clouds stretch from the Atlantic Ocean to northern Italy. NASA image courtesy MODIS Rapid Response Team at NASA Goddard Space Flight Center. Caption by Michon Scott. Instrument: Aqua - MODIS For more information related to this image go to: <a href="http://earthobservatory.nasa.gov/NaturalHazards/view.php?id=42881" rel="nofollow">earthobservatory.nasa.gov/NaturalHazards/view.php?id=42881</a>