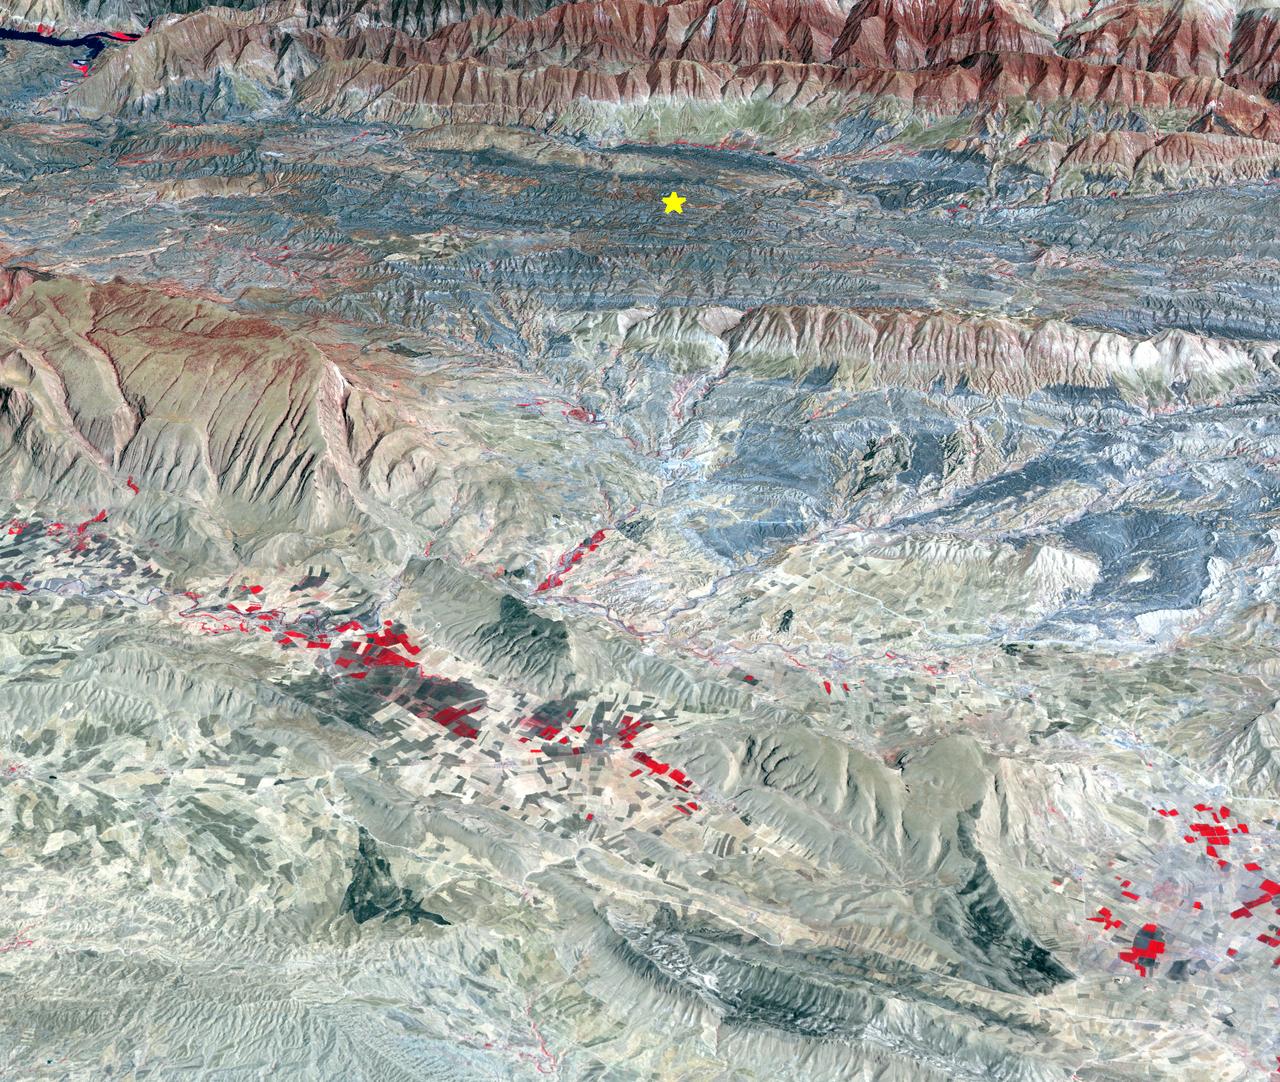
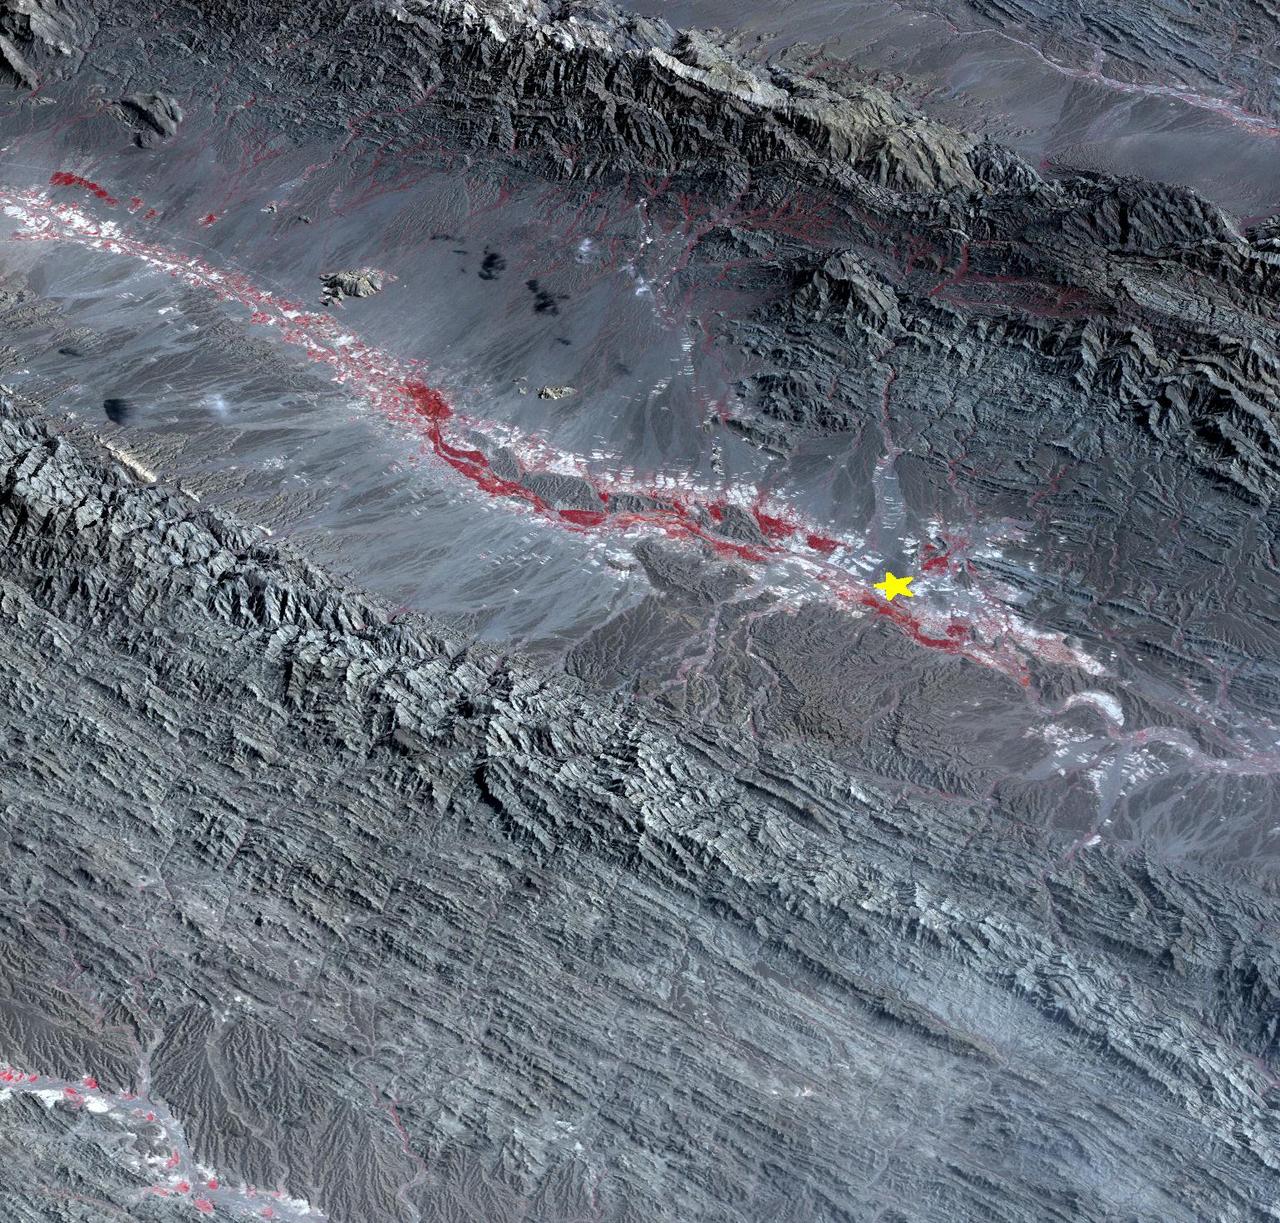
On Oct. 26, 2015, NASA Terra spacecraft acquired this image of northeastern Afghanistan where a magnitude 7.5 earthquake struck the Hindu Kush region. The earthquake's epicenter was at a depth of 130 miles (210 kilometers), on a probable shallowly dipping thrust fault. At this location, the Indian subcontinent moves northward and collides with Eurasia, subducting under the Asian continent, and raising the highest mountains in the world. This type of earthquake is common in the area: a similar earthquake occurred 13 years ago about 12 miles (20 kilometers) away. This perspective image from the Advanced Spaceborne Thermal Emission and Reflection Radiometer (ASTER) instrument on NASA's Terra spacecraft, looking southwest, shows the hypocenter with a star. The image was acquired July 8, 2015, and is located near 36.4 degrees north, 70.7 degrees east. http://photojournal.jpl.nasa.gov/catalog/PIA20035
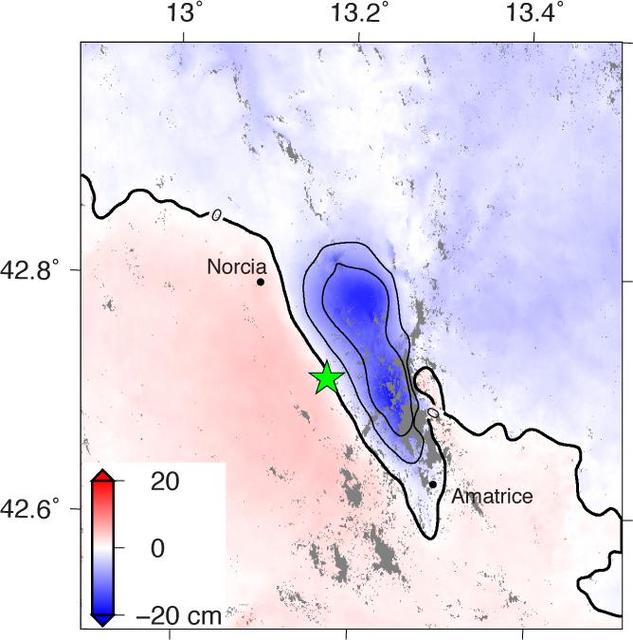
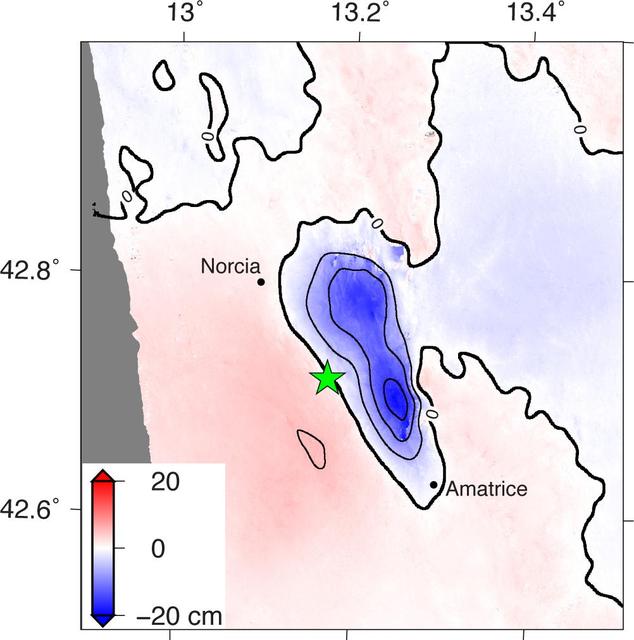
Amatrice earthquake in central Italy, which caused widespread building damage to several towns throughout the region. This earthquake was the strongest in that area since the 2009 earthquake that destroyed the city of L'Aquila. The Advanced Rapid Imaging and Analysis (ARIA) data system, a collaborative project between NASA's Jet Propulsion Laboratory, Pasadena, California, and the California Institute of Technology in Pasadena, automatically generated interferometric synthetic aperture radar images from the Copernicus Sentinel 1A satellite operated by the European Space Agency (ESA) for the European Commission to calculate a map of the deformation of Earth's surface caused by the quake. This false-color map shows the amount of permanent surface movement, as viewed by the satellite, during a 12-day interval between two Sentinel 1 images acquired on Aug. 15, 2016, and Aug. 27, 2016. The movement was caused almost entirely by the earthquake. In this map, the colors of the surface displacements are proportional to the surface motion. The red and pink tones show the areas where the land moved toward the satellite by up to 2 inches (5 centimeters). The area with various shades of blue moved away from the satellite, mostly downward, by as much as 8 inches (20 centimeters). Contours on the surface motion are 2 inches (5 centimeters) The green star shows the epicenter where the earthquake started as located by the U.S. Geological Survey National Earthquake Information Center. Black dots show town locations. Scientists use these maps to build detailed models of the fault slip at depth and associated land movements to better understand the impact on future earthquake activity. The map shows the fault or faults that moved in the earthquake is about 14 miles (22 kilometers) long between Amatrice and Norcia and slopes to the west beneath the area that moved downward. http://photojournal.jpl.nasa.gov/catalog/PIA20896
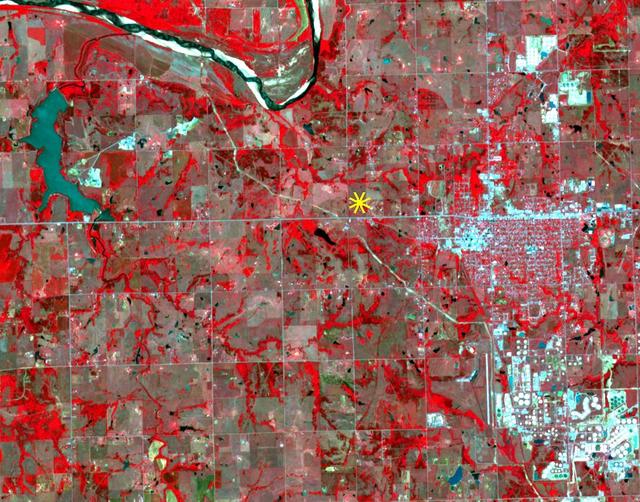
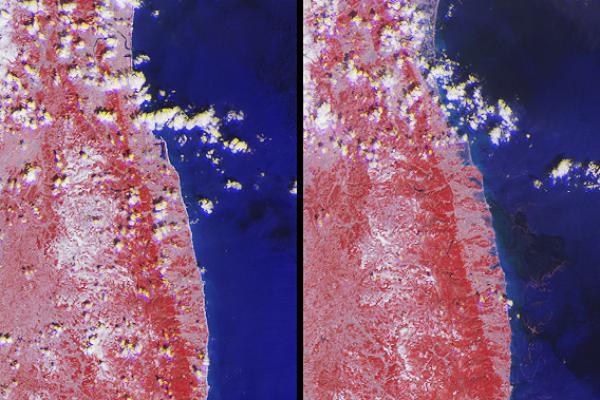
On Sunday, Nov. 6, 2016, at 7:44 p.m. local time, a magnitude 5.0 earthquake struck near the town of Cushing, Oklahoma. Numerous buildings were damaged by the temblor, but only a few minor injuries were reported. Cushing is home to one of the world's largest oil storage terminals; no damage was reported to the petroleum facilities. A star marks the epicenter of the earthquake,which occurred at a depth of 3.1 miles (5 kilometers). The image was acquired April 28, 2011, covers an area of 7 by 9 miles (11.4 by 14.5 kilometers), and is located at 36 degrees north, 96.8 degrees west. http://photojournal.jpl.nasa.gov/catalog/PIA21099
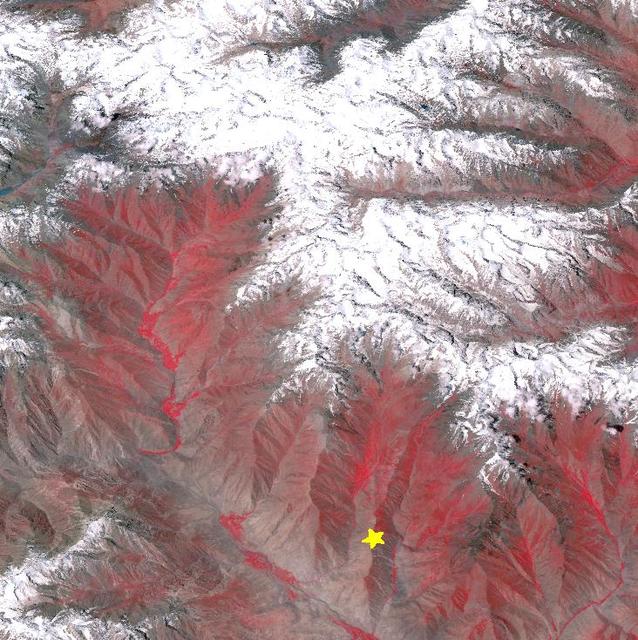
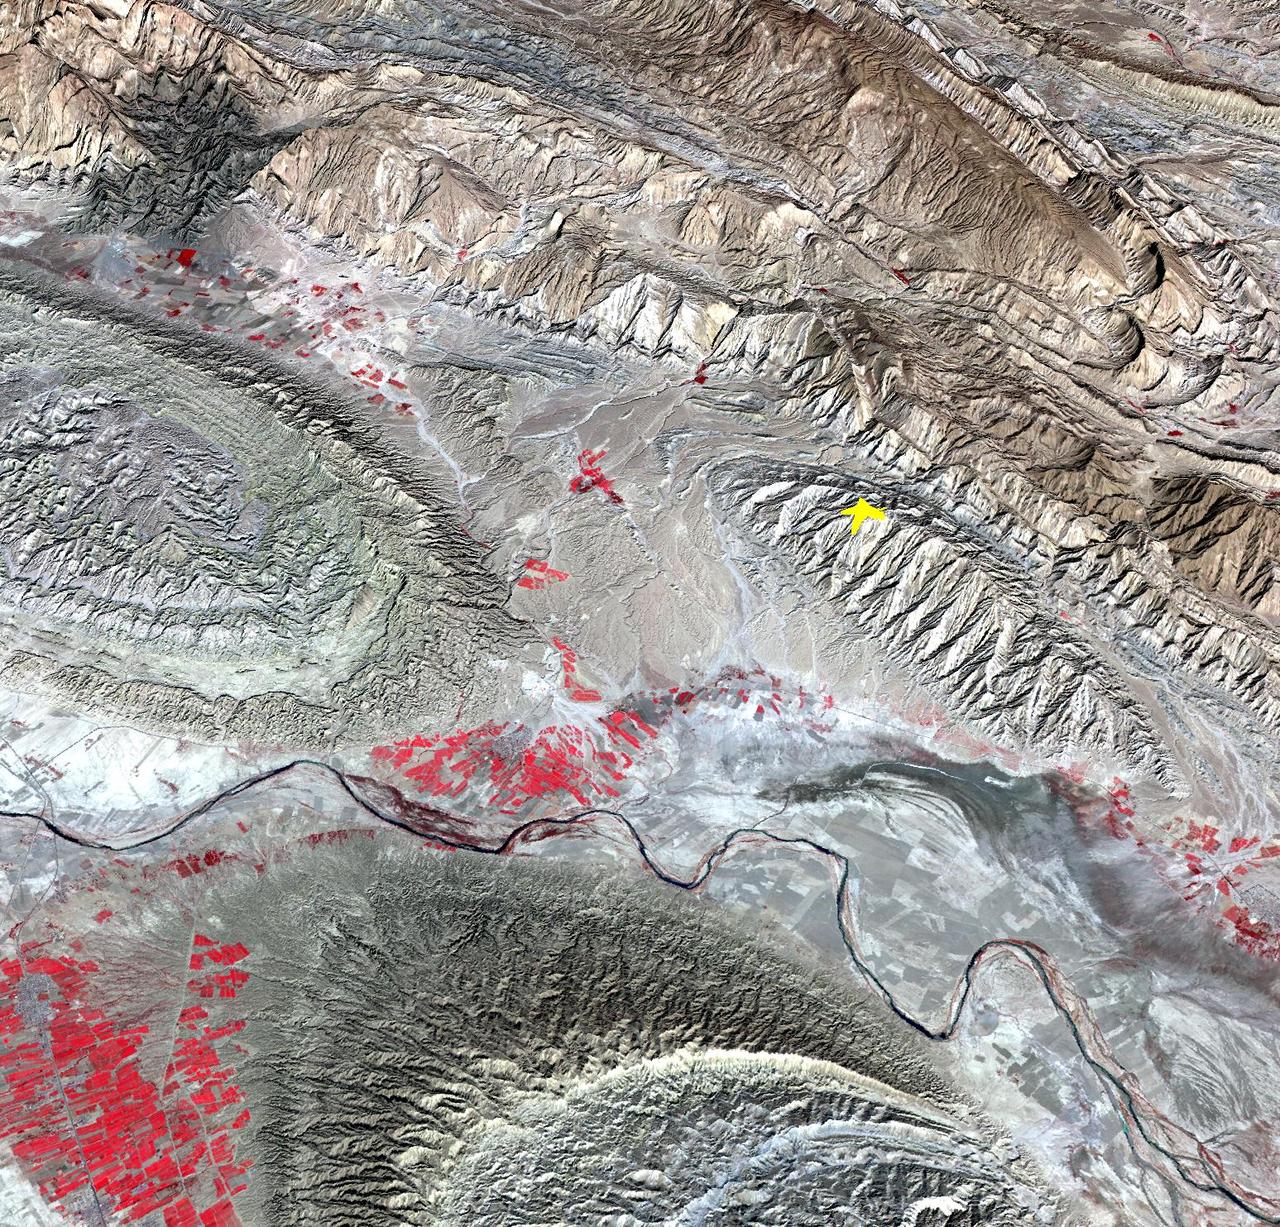
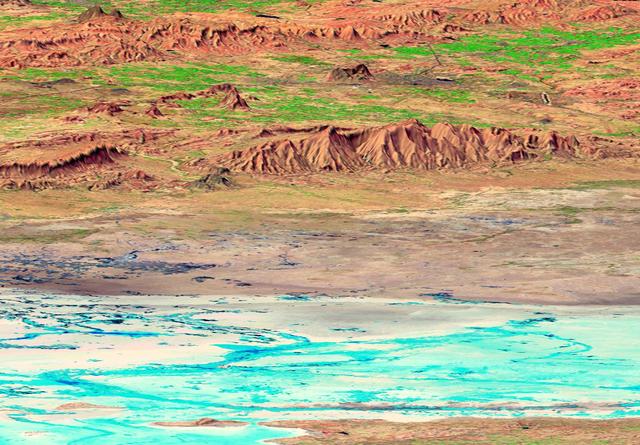
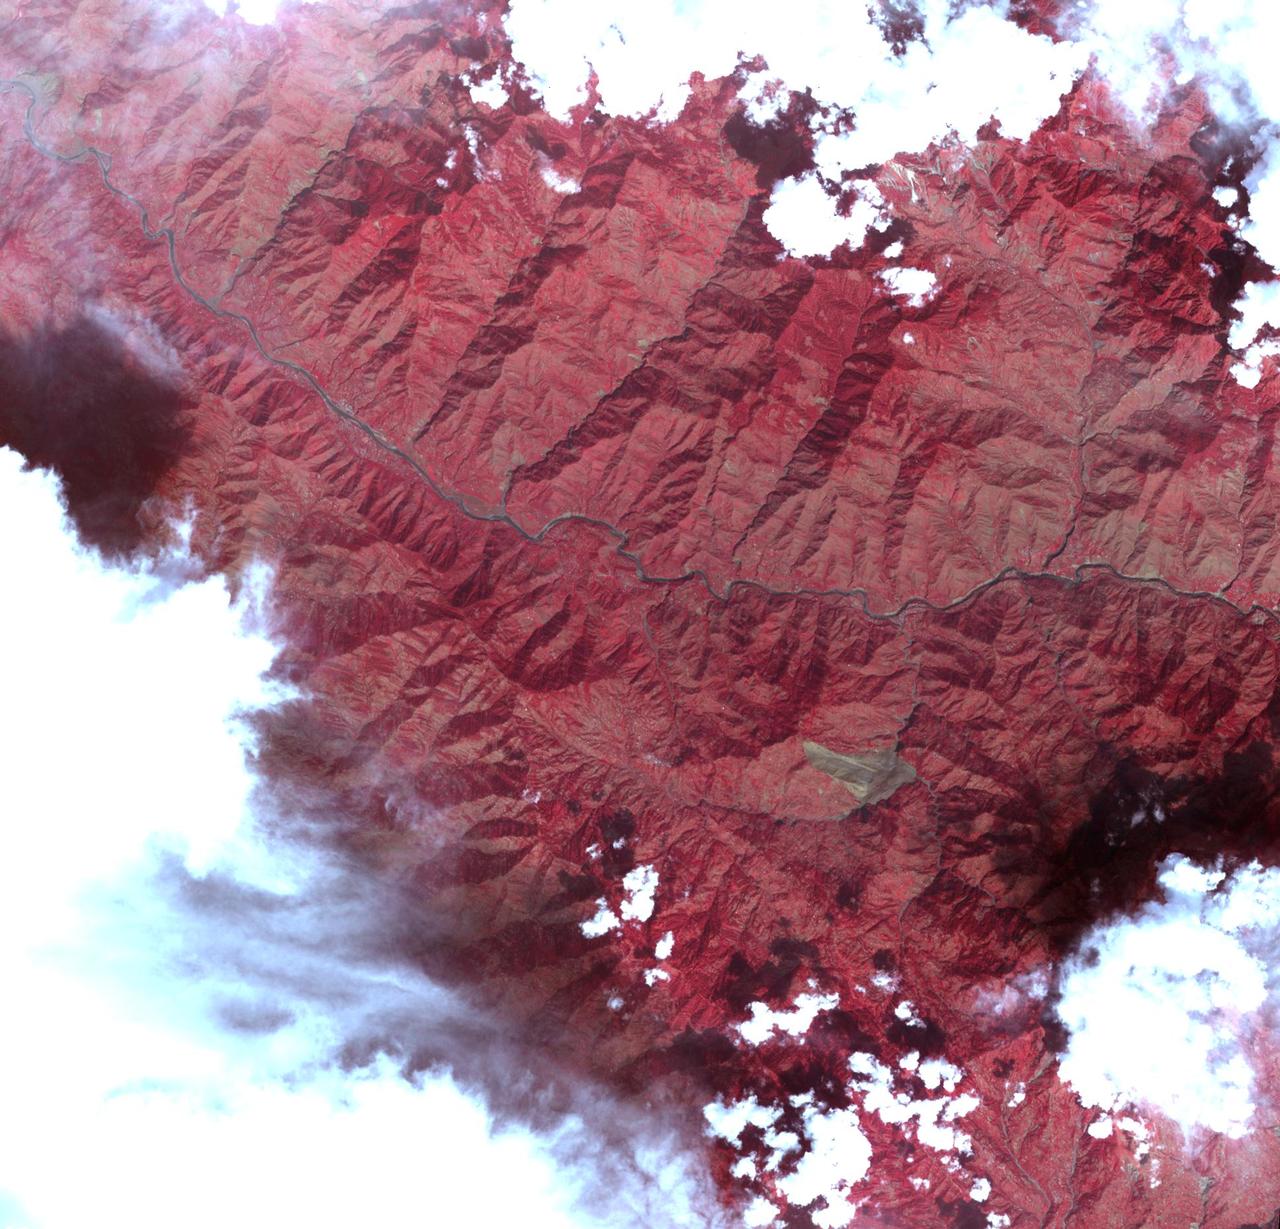
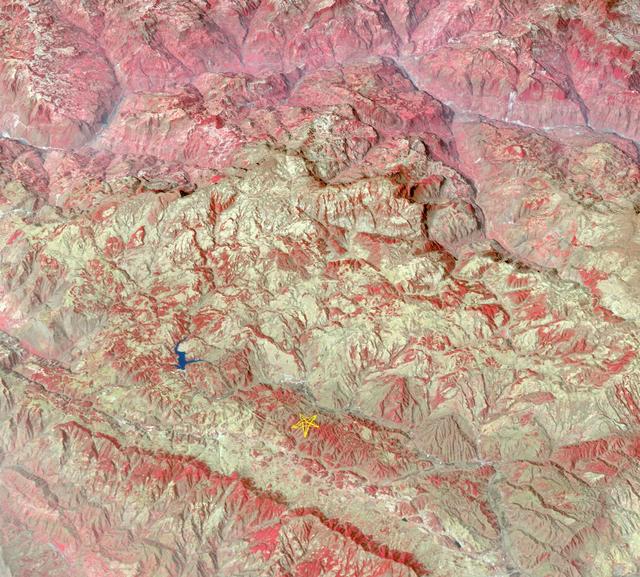
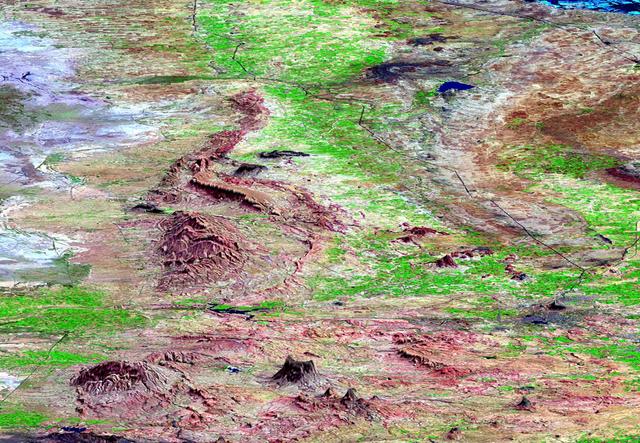
On Sunday, Nov. 12, 2017, a magnitude 7.3 earthquake struck along the Iran-Iraq border near Halabjah, Iraq. The earthquake was felt as far away as Kuwait, Qatar, Turkey, Lebanon and Israel. Extensive damage and numerous casualties were reported in the area near the epicenter (yellow star on image). The earthquake occurred along the boundary between the Arabian and Eurasian tectonic plates. This is an earthquake-prone area, and has experienced many deadly earthquakes in the past. In this perspective-view image, bright red areas are crops in fields, pale red on mountain ridges are shrubs and trees, dark gray areas are traces of earlier brush fires, and gray and tan colors are different rock types. The image was acquired Sept. 8, 2017, and the star marks the earthquake epicenter at 34.9 degrees north, 45.9 degrees east. https://photojournal.jpl.nasa.gov/catalog/PIA22112
NASA and its partners are contributing observations and expertise to the ongoing response to the Aug. 23, 2016, magnitude 6.2 Amatrice earthquake in central Italy caused widespread building damage to several towns throughout the region. This earthquake was the strongest in that area since the 2009 earthquake that destroyed the city of L'Aquila. Scientists with the Advanced Rapid Imaging and Analysis project (ARIA), a collaboration between NASA's Jet Propulsion Laboratory, Pasadena, California, and the California Institute of Technology in Pasadena, analyzed interferometric synthetic aperture radar images from the PALSAR-2 instrument on the ALOS-2 satellite operated by the Japan Aerospace Exploration Agency (JAXA) to calculate a map of the deformation of Earth's surface caused by the quake. This false-color map shows the amount of permanent surface movement, as viewed by the satellite, during a seven-month interval between two ALOS-2 images acquired on Sept. 9, 2015 and Aug. 24, 2016. The movement was caused almost entirely by the earthquake. In this map, the colors of the surface displacements are proportional to the surface motion. The red and pink tones show the areas where the land moved toward the satellite by up to 2 inches (5 centimeters). The area with various shades of blue moved away from the satellite, mostly downward, by as much as 8 inches (20 centimeters). Contours on the surface motion are 2 inches (5 centimeters) The green star shows the epicenter where the earthquake started as located by the U.S. Geological Survey National Earthquake Information Center. Black dots show town locations. Scientists use these maps to build detailed models of the fault slip at depth and associated land movements to better understand the impact on future earthquake activity. The map shows the fault or faults that moved in the earthquake is about 14 miles (22 kilometers) long between Amatrice and Norcia and slopes to the west beneath the area that moved downward. The PALSAR-2 data were provided by JAXA through a science project. http://photojournal.jpl.nasa.gov/catalog/PIA20893

The Advanced Rapid Imaging and Analysis (ARIA) team at NASA's Jet Propulsion Laboratory in Pasadena, California, and Caltech, also in Pasadena, created this Damage Proxy Map (DPM) depicting areas in the northeastern part of Lombok Island, Indonesia, that are likely damaged (shown by red and yellow pixels) as a result of the major earthquake sequence (including the M6.4 July 29, the M6.9 August 5, the M5.9 August 9, and the M6.4 August 18 earthquakes) in 2018. The map is derived from synthetic aperture radar (SAR) images from the ALOS-2 satellites, operated by Japan Aerospace Exploration Agency (JAXA). The images were taken before the (May 13, 2018 00:30) and after the (August 19, 2018 00:30, both local time) earthquakes. The map covers an area of 73 by 70 kilometers, shown by the large red polygon. Each pixel measures about 30 meters across. The color variation from yellow to red indicates increasingly more significant ground surface change. Preliminary validation was done by comparing with the DigitalGlobe's high-resolution optical satellite imagery. This damage proxy map should be used as guidance to identify damaged areas, and may be less reliable over vegetated areas. For example, the scattered single colored pixels over vegetated areas may be false positives, and the lack of colored pixels over vegetated areas does not necessarily mean no damage. The DPM was created by the NASA-JPL/Caltech ARIA team, and the ALOS-2 data were provided by JAXA. The Earth Observatory of Singapore coordinated with the Sentinel Asia to timely task the ALOS-2 satellite. The algorithm development was carried out at JPL under a contract with NASA. https://photojournal.jpl.nasa.gov/catalog/PIA22495
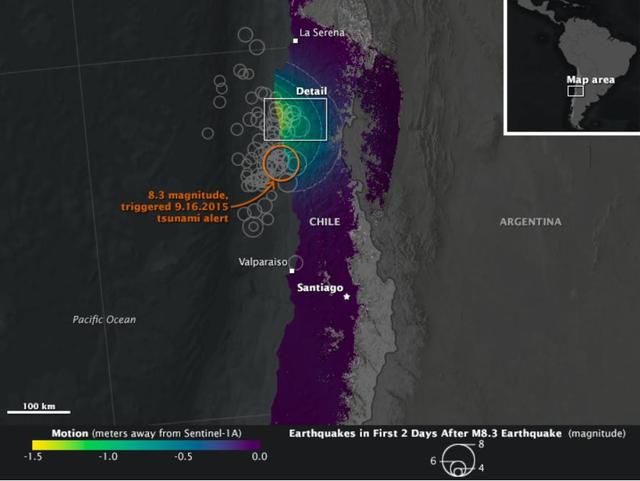
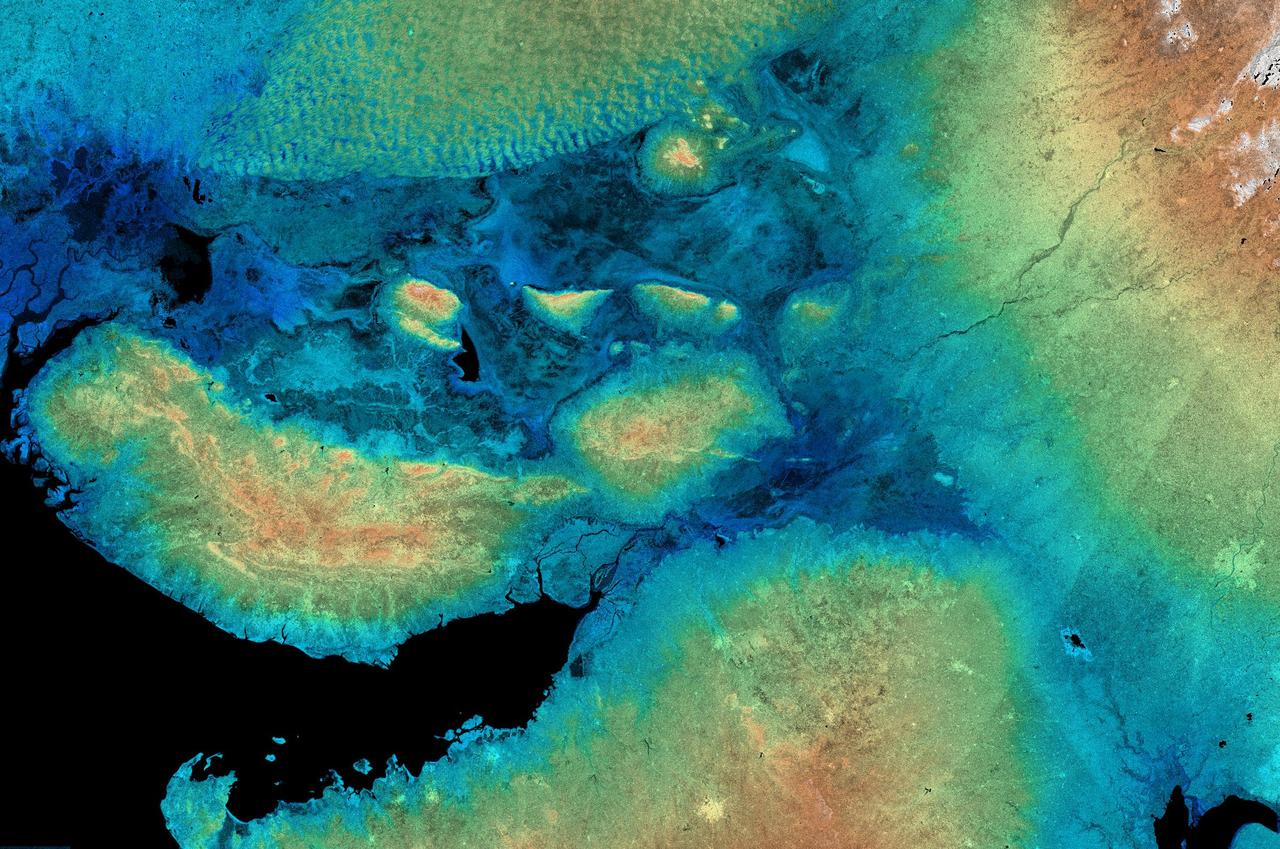
On Sept. 16, 2015, a magnitude 8.3 earthquake struck near the coast of central Chile along the boundary of the Nazca and South American tectonic plates. Dubbed the Illapel earthquake, the shaking lasted at least three minutes and propelled a 15-foot (4.5-meter) tsunami that washed into Coquimbo and other coastal areas. Smaller tsunami waves raced across the Pacific and showed up on the shores of Hawaii and other islands. The earthquake and tsunami caused substantial damage in several Chilean coastal towns, and at least 13 deaths have been reported. Demanding building codes and extensive disaster preparedness helped to limit the loss of life and property. The maps above, known as interferograms, show how the quake moved the ground, as observed by the Copernicus Sentinel-1A satellite (operated by the European Space Agency) and reported by ground stations to the U.S. Geological Survey. Sentinel-1A carries a synthetic aperture radar (SAR) instrument, which beams radio signals toward the ground and measures the reflections to determine the distance between the ground and the satellite. By comparing measurements made on Aug. 24 and Sept. 17, Cunren Liang, Eric Fielding, and other researchers from NASA's Jet Propulsion Laboratory were able to determine how the land surface shifted during and after the earthquake. Interferograms can be used to estimate where the fault moved deep in Earth and which areas have increased stress and higher likelihood of future earthquakes. The details can also provide important information to better understand the earthquake process. On both the close-up and the broad-view maps, the amount of land motion is represented in shades from yellow to purple. Areas where the ground shifted the most (vertically, horizontally, or both) are represented in yellow, while areas with little change are represented in purple. Circles show the location of earthquakes and aftershocks in the two days after the initial 8.3 earthquake, as reported by the USGS National Earthquake Information Center. Larger quakes are represented by larger circles. The base map layer uses a digital elevation model and a bathymetry map to show the contours of the land surface and seafloor. The interferograms above show that land moved as much as 1.4 meters toward to satellite (generally in the vertical direction) near the coast, and early estimates of the horizontal motion suggest it was as much as 2 meters. While SAR can see through clouds and the dark of night, it cannot see much through water. It is likely that much of the ground deformation from the earthquake occurred underwater, which explains the formation of the tsunami and the location of many aftershocks. http://photojournal.jpl.nasa.gov/catalog/PIA20002
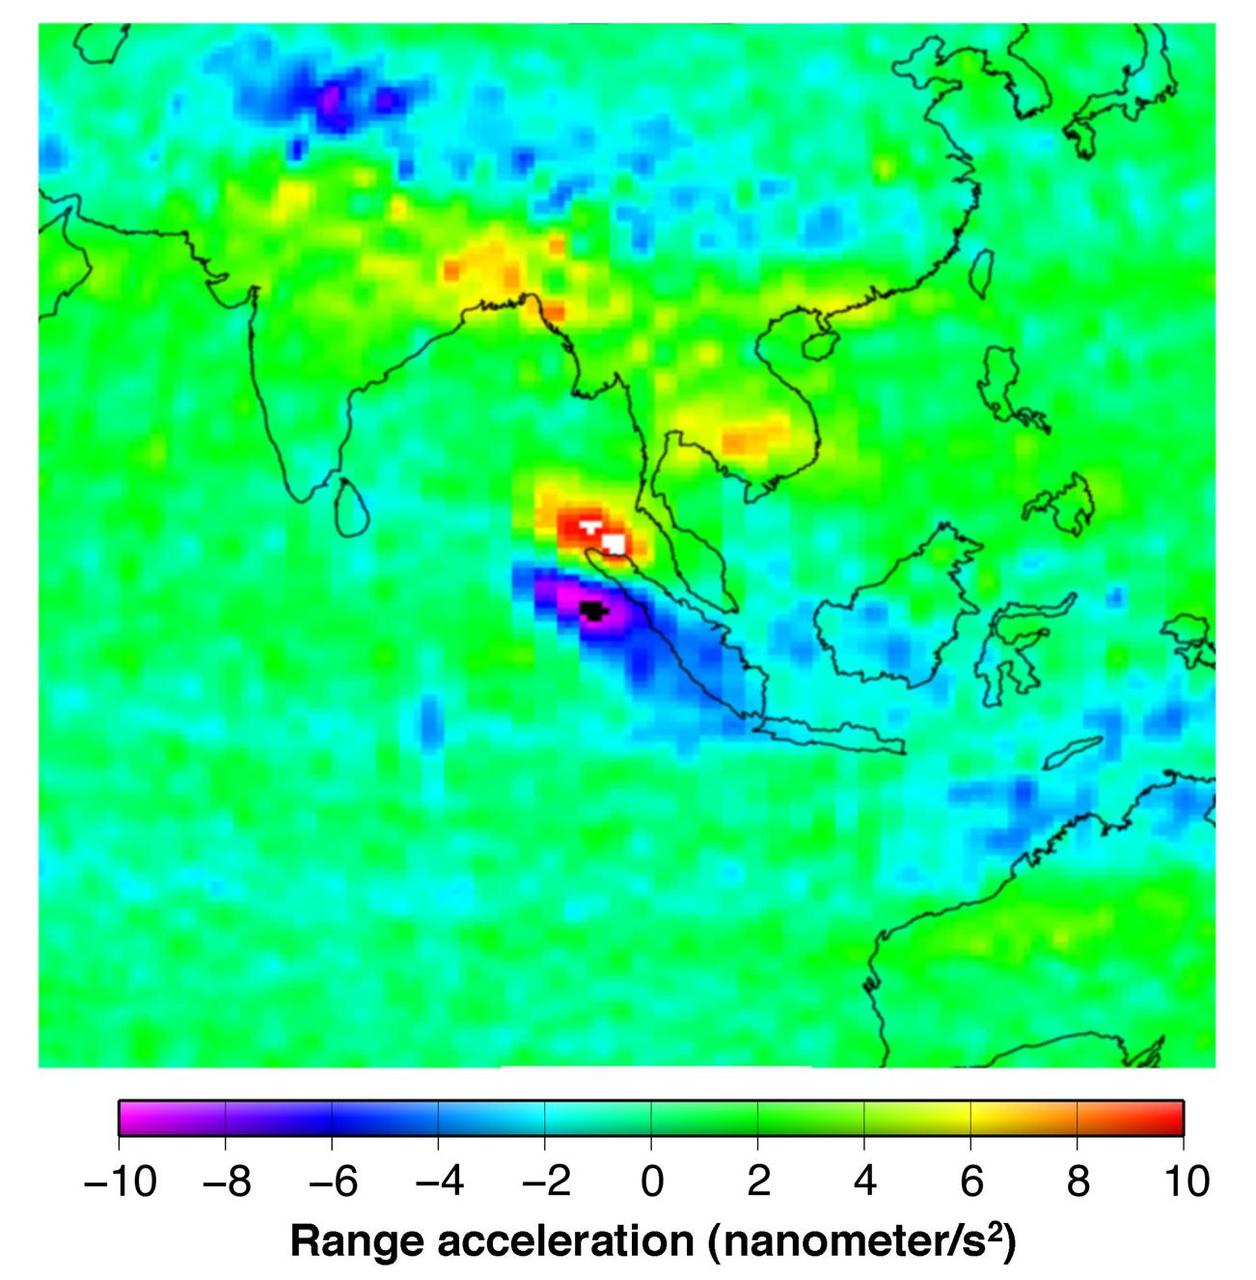
This figure shows the effect of the December 2004 great Sumatra earthquake on the Earth’s gravity field as observed by NASA GRACE.

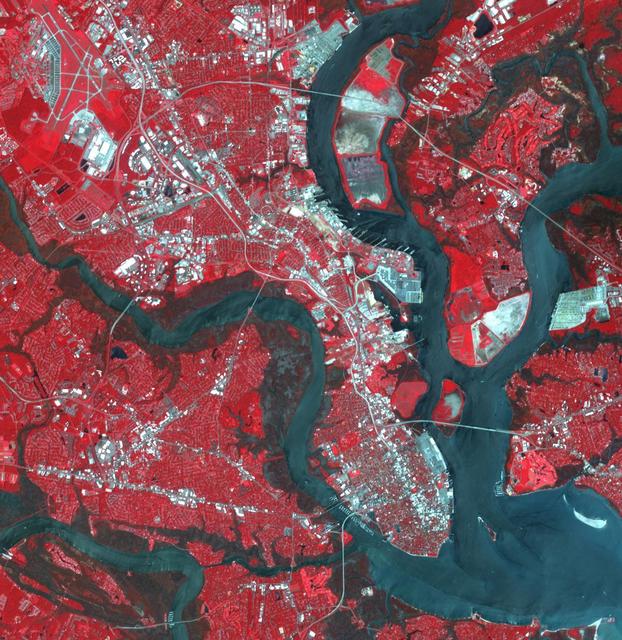
An instrument on NASA Terra spacecraft captured a simulated natural color image of the Port-au-Prince, Haiti, area, two days after a devastating earthquake.

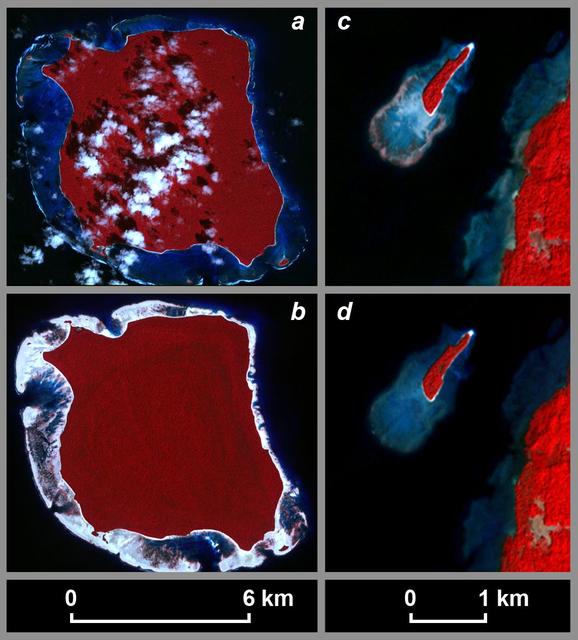
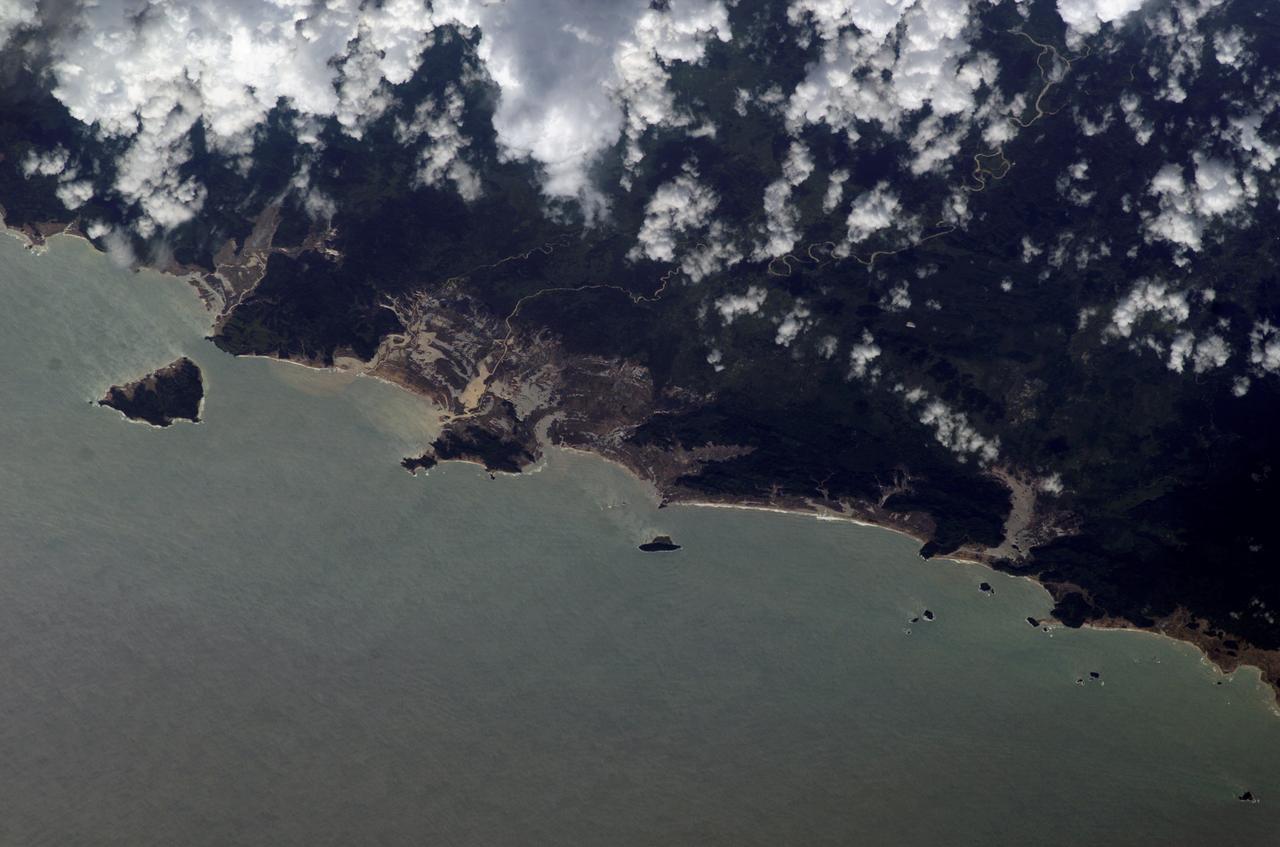
On September 24, 2013, a major strike-slip earthquake rattled western Pakistan, killing at least 350 people and leaving more than 100,000 homeless. The 7.7 magnitude quake struck the Baluchistan province of northwestern Pakistan. Amidst the destruction, a new island was created offshore in the Paddi Zirr (West Bay) near Gwadar, Pakistan. On September 26, 2013, the Advanced Land Imager (ALI) on NASA’s Earth Observing-1 (EO-1) satellite captured the top image of that new island, which sits roughly one kilometer (0.6 miles) offshore. Likely a “mud volcano,” the island rose from the seafloor near Gwadar on September 24, shortly after the earthquake struck about 380 kilometers (230 miles) inland. The lower image, acquired by the Operational Land Imager on the Landsat 8 satellite, shows the same area on April 17, 2013. In the satellite images, lighter shades of green and tan in the water reveal shallow seafloor or suspended sediment. The water depth around the new island is roughly 15 to 20 meters (50 to 65 feet), according to marine geologist Asif Inam of Pakistan’s National Institute of Oceanography. “The floor in that area is generally flat, but the gradient in this area changes quite abruptly,” Inam said. The top image from ALI is also clear enough to show the parallel ripples of waves marching toward the shore. Read more: <a href="https://earthobservatory.nasa.gov/IOTD/view.php?id=82146" rel="nofollow">earthobservatory.nasa.gov/IOTD/view.php?id=82146</a> NASA Earth Observatory image by Jesse Allen and Robert Simmon, using EO-1 ALI data from the NASA EO-1 team. <b><a href="http://www.nasa.gov/audience/formedia/features/MP_Photo_Guidelines.html" rel="nofollow">NASA image use policy.</a></b> <b><a href="http://www.nasa.gov/centers/goddard/home/index.html" rel="nofollow">NASA Goddard Space Flight Center</a></b> enables NASA’s mission through four scientific endeavors: Earth Science, Heliophysics, Solar System Exploration, and Astrophysics. Goddard plays a leading role in NASA’s accomplishments by contributing compelling scientific knowledge to advance the Agency’s mission. <b>Follow us on <a href="http://twitter.com/NASAGoddardPix" rel="nofollow">Twitter</a></b> <b>Like us on <a href="http://www.facebook.com/pages/Greenbelt-MD/NASA-Goddard/395013845897?ref=tsd" rel="nofollow">Facebook</a></b> <b>Find us on <a href="http://instagrid.me/nasagoddard/?vm=grid" rel="nofollow">Instagram</a></b>
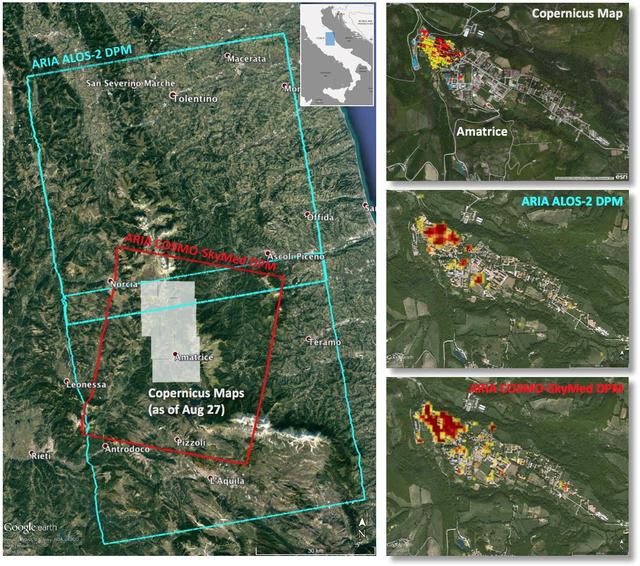
Italy earthquake. The quake has caused significant damage in the historic town of Amatrice. To assist in the disaster response efforts, scientists at NASA's Jet Propulsion Laboratory, Pasadena, California, and the California Institute of Technology in Pasadena, in collaboration with the Italian Space Agency (ASI), generated this image of the earthquake's hardest-hit region. The 40-by-75 mile (65-by-120 kilometer) Damage Proxy Map (DPM) was derived from two consecutive frames of the Japan Aerospace Exploration Agency's (JAXA's) L-band interferometric synthetic aperture radar (InSAR) data from the ALOS-2 satellite (cyan rectangles), and the 25-by-31 mile (40-by-50 kilometer) DPM was derived from InSAR data from the Agenzia Spaciale Italiana's (ASI's) X-band COSMO-SkyMed satellite (red rectangle). Both DPMs cover the historic town of Amatrice, revealing severe damage in the western side of the town (right panels). The time span of the data for the change is Jan. 27, 2016 to Aug. 24, 2016 for ALOS-2 and Aug. 20, 2016 to Aug. 28, 2016 for COSMO-SkyMed. Each pixel in the damage proxy map is about 100 feet (30 meters) across. The SAR data were processed by the Advanced Rapid Imaging and Analysis (ARIA) team at JPL and Caltech. The technique uses a prototype algorithm to rapidly detect surface changes caused by natural or human-produced damage. The assessment technique is most sensitive to destruction of the built environment. When the radar images areas with little to no destruction, its image pixels are transparent. Increased opacity of the radar image pixels reflects damage, with areas in red reflecting the heaviest damage to cities and towns. The color variations from yellow to red indicate increasingly more significant ground surface change. Preliminary validation was done by comparing the DPMs to a damage assessment map produced by the Copernicus Emergency Management Service, which is based on visual inspection of before and after high-resolution aerial imagery -- the extent indicated with gray boxes in the left panel. http://photojournal.jpl.nasa.gov/catalog/PIA20897
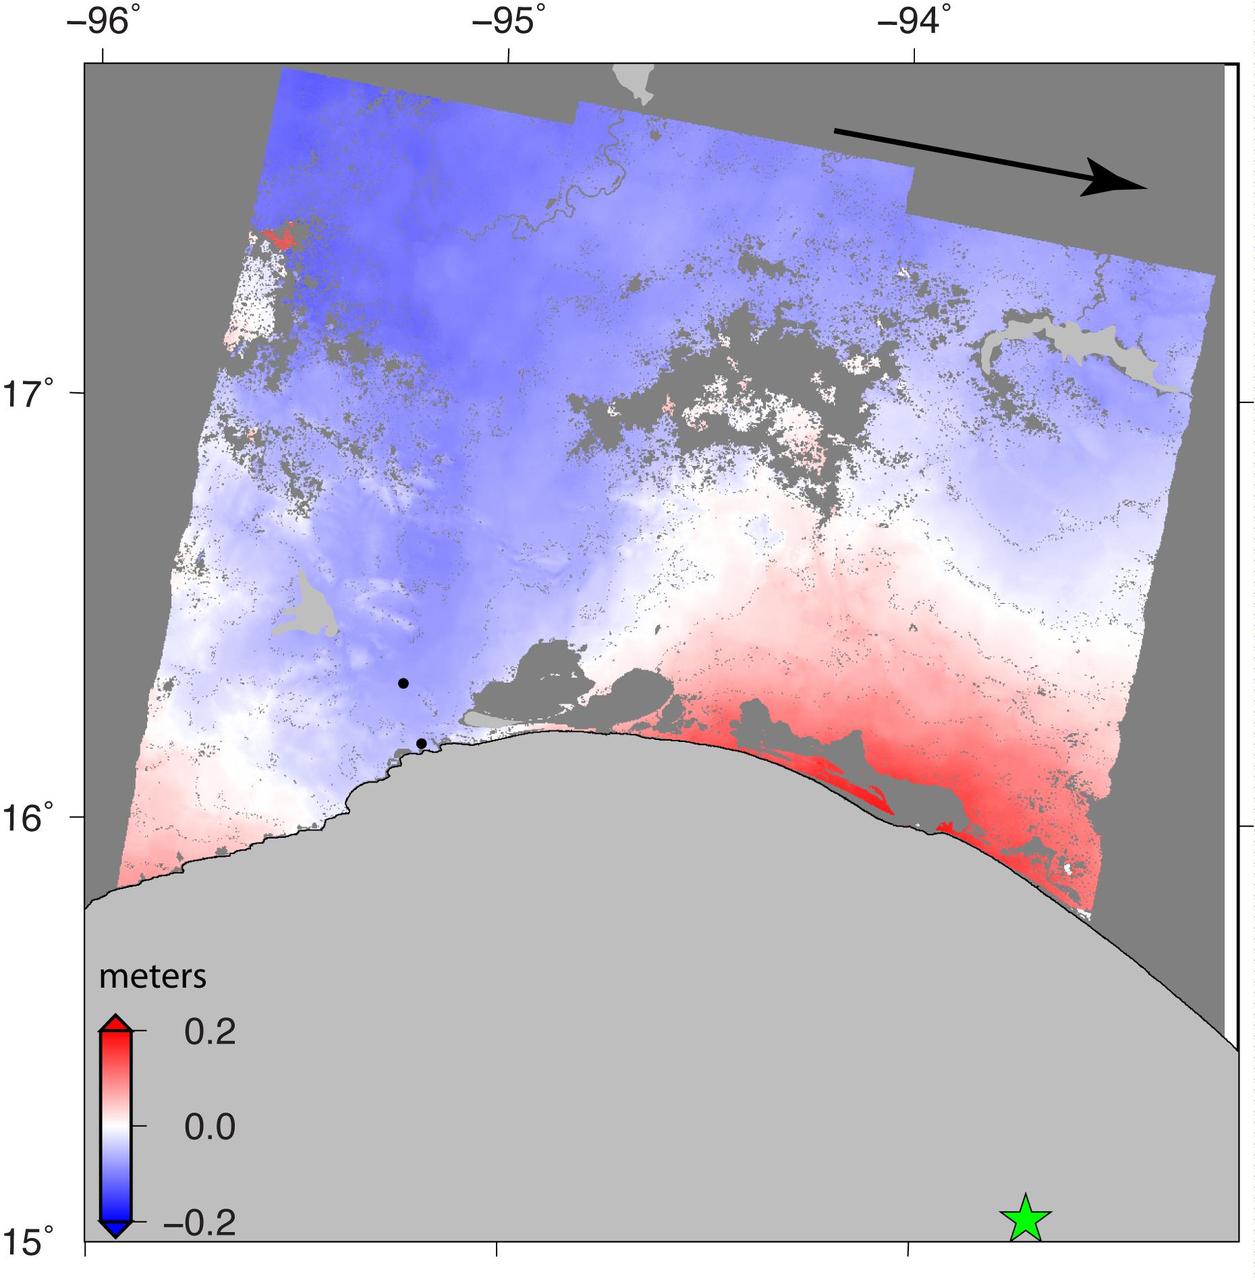
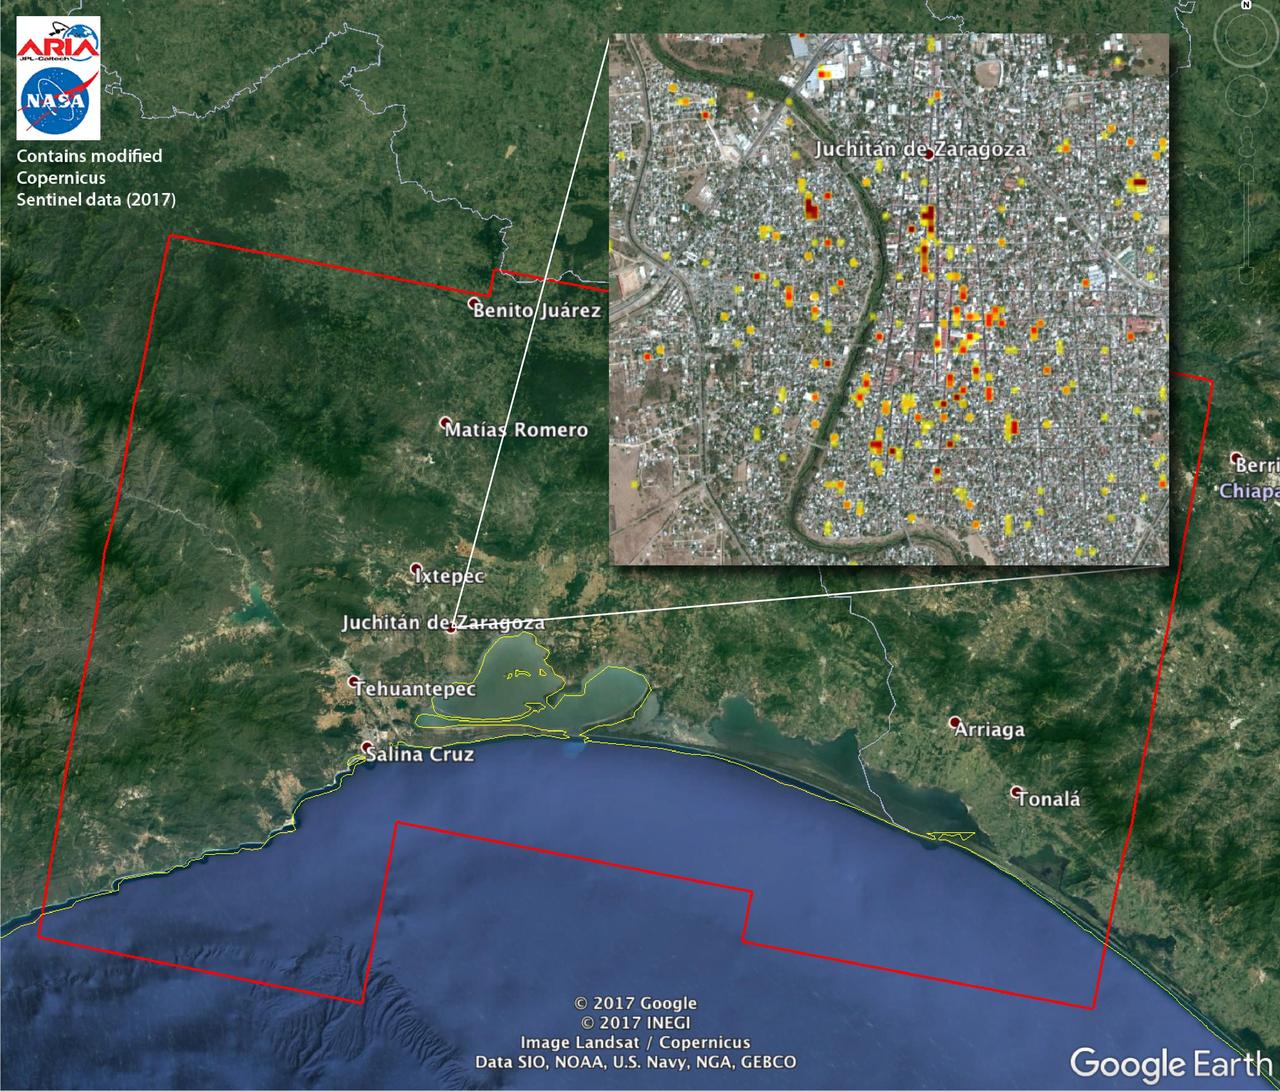
NASA and its partners are contributing important observations and expertise to the ongoing response to the Sept. 7, 2017 (local time), magnitude 8.1 Oaxaca-Chiapas earthquake in Mexico. This earthquake was the strongest in more than a century in Mexico. It has caused a significant humanitarian crisis, with widespread building damage and triggered landslides throughout the region. Scientists with the Advanced Rapid Imaging and Analysis project (ARIA), a collaboration between NASA's Jet Propulsion Laboratory in Pasadena, California; and Caltech, also in Pasadena, analyzed interferometric synthetic aperture radar images from the radar instrument on the Copernicus Sentinel-1A and Sentinel-1B satellites operated by the European Space Agency (ESA) to calculate a map of the deformation of Earth's surface caused by the quake. This false-color map shows the amount of permanent surface movement caused almost entirely by the earthquake, as viewed by the satellite, during a six-day interval between radar images acquired by the two Sentinel-1 satellites on Sept. 7 and Sept. 13, 2017. In this map, the colors of the surface displacements are proportional to the surface motion. The red tones show the areas along the coast of Chiapas and Oaxaca have moved toward the satellite by as much as 9 inches (22 centimeters) in a combination of up and eastward motion. The area in between and farther north with various shades of blue moved away from the satellite, mostly downward or westward, by as much as 6 inches (15 centimeters). Areas without color are open water or heavy vegetation, which prevent the radar from measuring change between the satellite images. Scientists use these maps to build detailed models of the fault slip at depth and associated land movements to better understand the impact on future earthquake activity. The green star shows the location of the earthquake epicenter estimated by the United States Geological Survey (USGS) National Earthquake Information Center. Map contains modified Copernicus Sentinel data 2017, processed by ESA and analyzed by the NASA-JPL/Caltech ARIA team. This research was carried out at JPL under a contract with NASA. Sentinel-1 data were accessed through the Copernicus Open Access Hub. An annotated figures is available at https://photojournal.jpl.nasa.gov/catalog/PIA21962
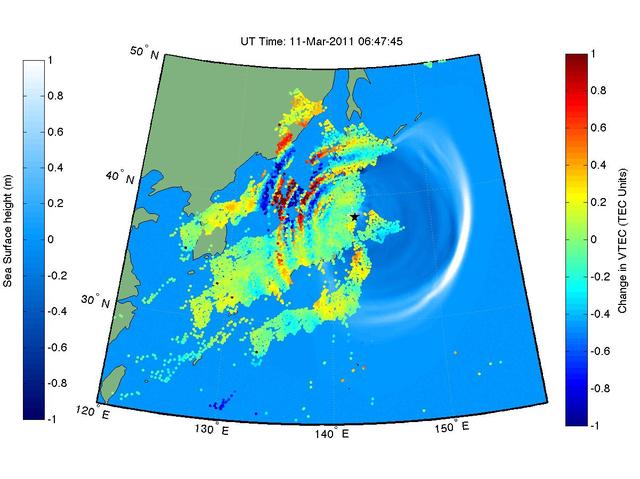
NASA Sees Tohoku-Oki Earthquake and Tsunami in Earth Upper Atmosphere
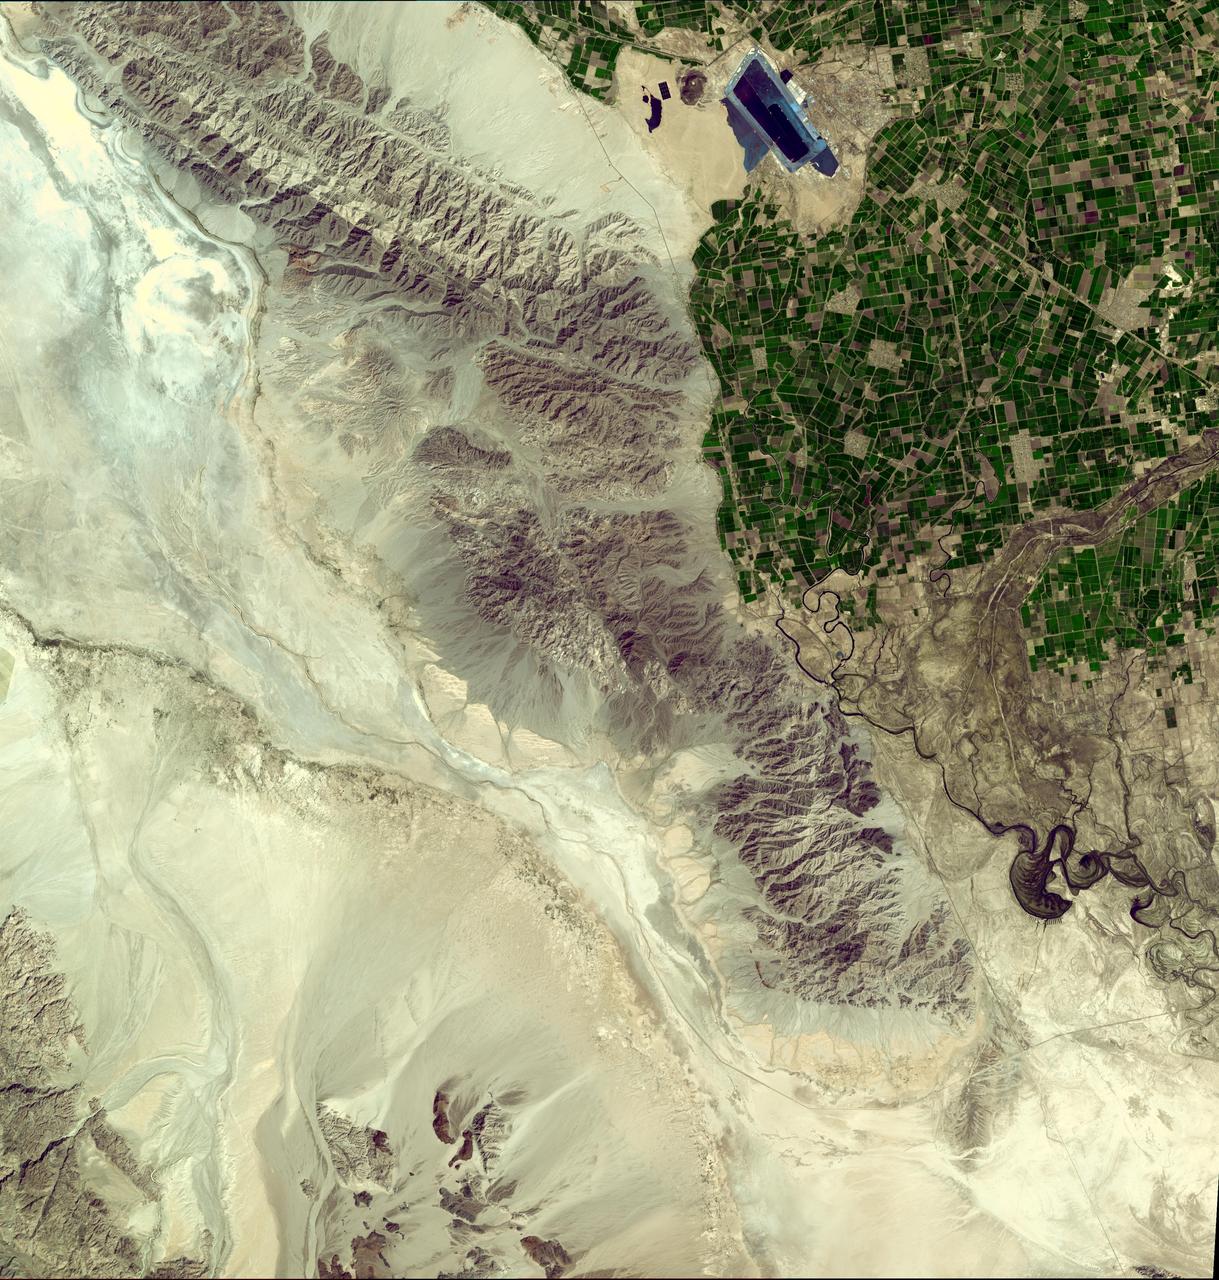
On April 9, 2013 at 11:52 GMT, a magnitude 6.3 earthquake hit southwestern Iran's Bushehr province near the town of Kaki. Preliminary information is that several villages have been destroyed and many people have died, as reported by BBC News. This perspective view of the region was acquired Nov. 17, 2012, by the Advanced Spaceborne Thermal Emission and Reflection Radiometer (ASTER) instrument on NASA's Terra spacecraft. The location of the earthquake's epicenter is marked with a yellow star. Vegetation is displayed in red; the vertical exaggeration of the topography is 2X. The image is centered near 28.5 degrees north latitude, 51.6 degrees east longitude. With its 14 spectral bands from the visible to the thermal infrared wavelength region and its high spatial resolution of 15 to 90 meters (about 50 to 300 feet), ASTER images Earth to map and monitor the changing surface of our planet. ASTER is one of five Earth-observing instruments launched Dec. 18, 1999, on Terra. The instrument was built by Japan's Ministry of Economy, Trade and Industry. A joint U.S./Japan science team is responsible for validation and calibration of the instrument and data products. The broad spectral coverage and high spectral resolution of ASTER provides scientists in numerous disciplines with critical information for surface mapping and monitoring of dynamic conditions and temporal change. Example applications are: monitoring glacial advances and retreats; monitoring potentially active volcanoes; identifying crop stress; determining cloud morphology and physical properties; wetlands evaluation; thermal pollution monitoring; coral reef degradation; surface temperature mapping of soils and geology; and measuring surface heat balance. The U.S. science team is located at NASA's Jet Propulsion Laboratory, Pasadena, Calif. The Terra mission is part of NASA's Science Mission Directorate, Washington, D.C. More information about ASTER is available at <a href="http://asterweb.jpl.nasa.gov/" rel="nofollow">asterweb.jpl.nasa.gov/</a>. Image Credit: NASA/GSFC/METI/ERSDAC/JAROS, and U.S./Japan ASTER Science Team Image Addition Date: 2013-04-10 <b><a href="http://www.nasa.gov/audience/formedia/features/MP_Photo_Guidelines.html" rel="nofollow">NASA image use policy.</a></b> <b><a href="http://www.nasa.gov/centers/goddard/home/index.html" rel="nofollow">NASA Goddard Space Flight Center</a></b> enables NASA’s mission through four scientific endeavors: Earth Science, Heliophysics, Solar System Exploration, and Astrophysics. Goddard plays a leading role in NASA’s accomplishments by contributing compelling scientific knowledge to advance the Agency’s mission. <b>Follow us on <a href="http://twitter.com/NASA_GoddardPix" rel="nofollow">Twitter</a></b> <b>Like us on <a href="http://www.facebook.com/pages/Greenbelt-MD/NASA-Goddard/395013845897?ref=tsd" rel="nofollow">Facebook</a></b> <b>Find us on <a href="http://instagram.com/nasagoddard?vm=grid" rel="nofollow">Instagram</a></b>
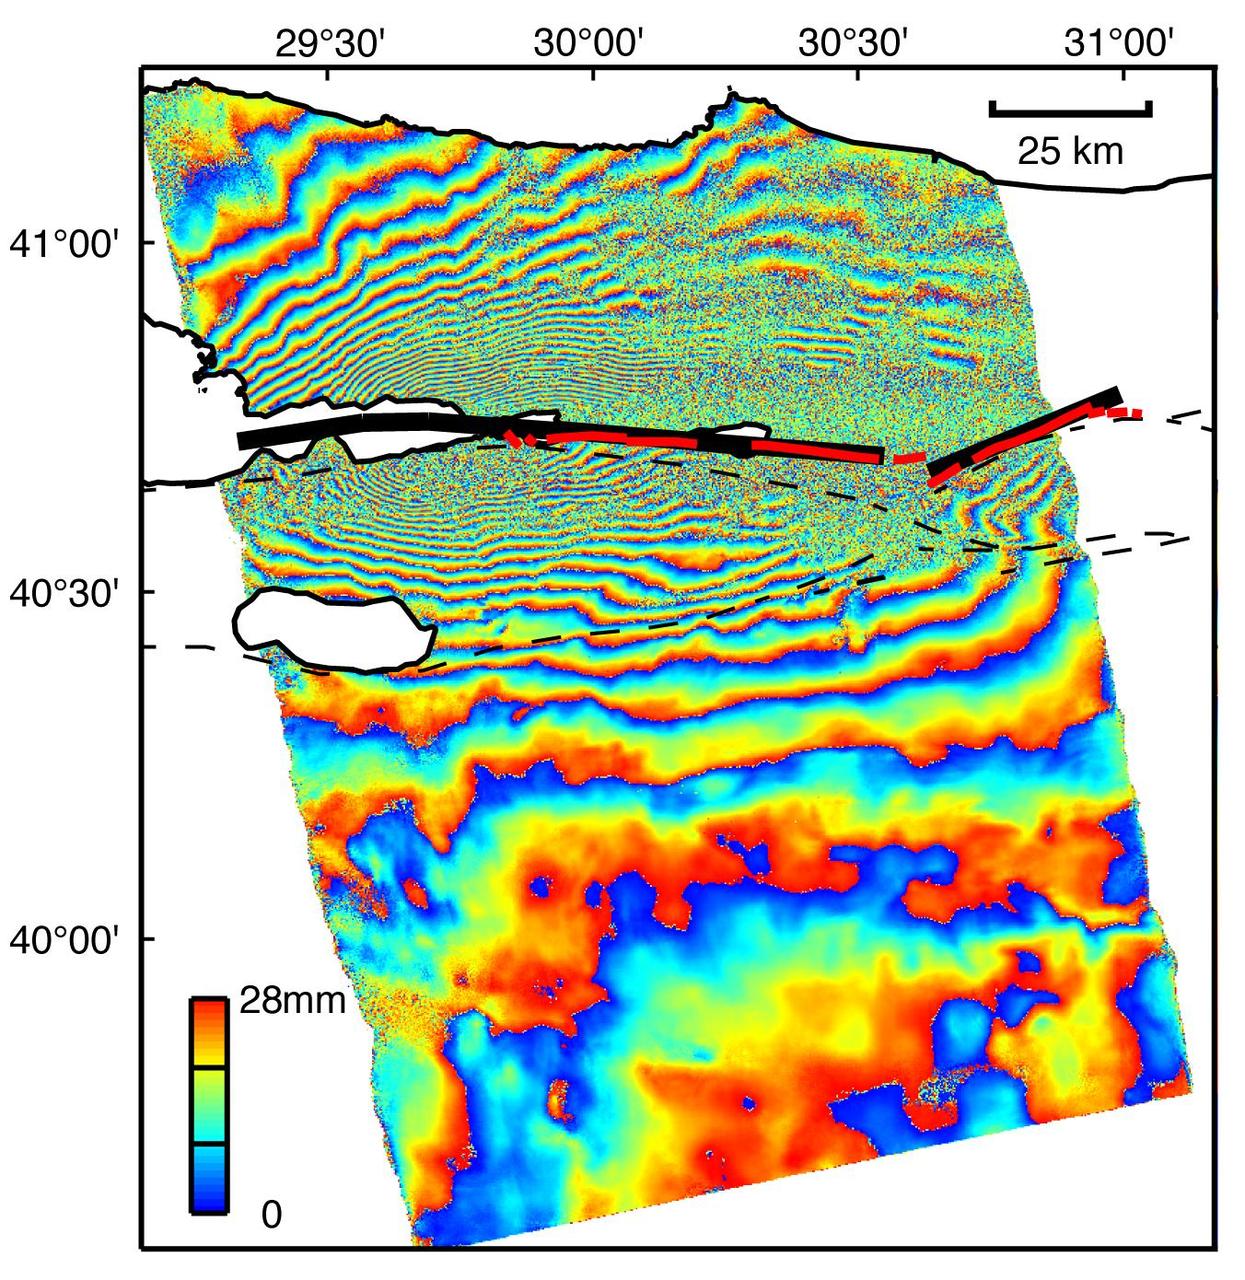
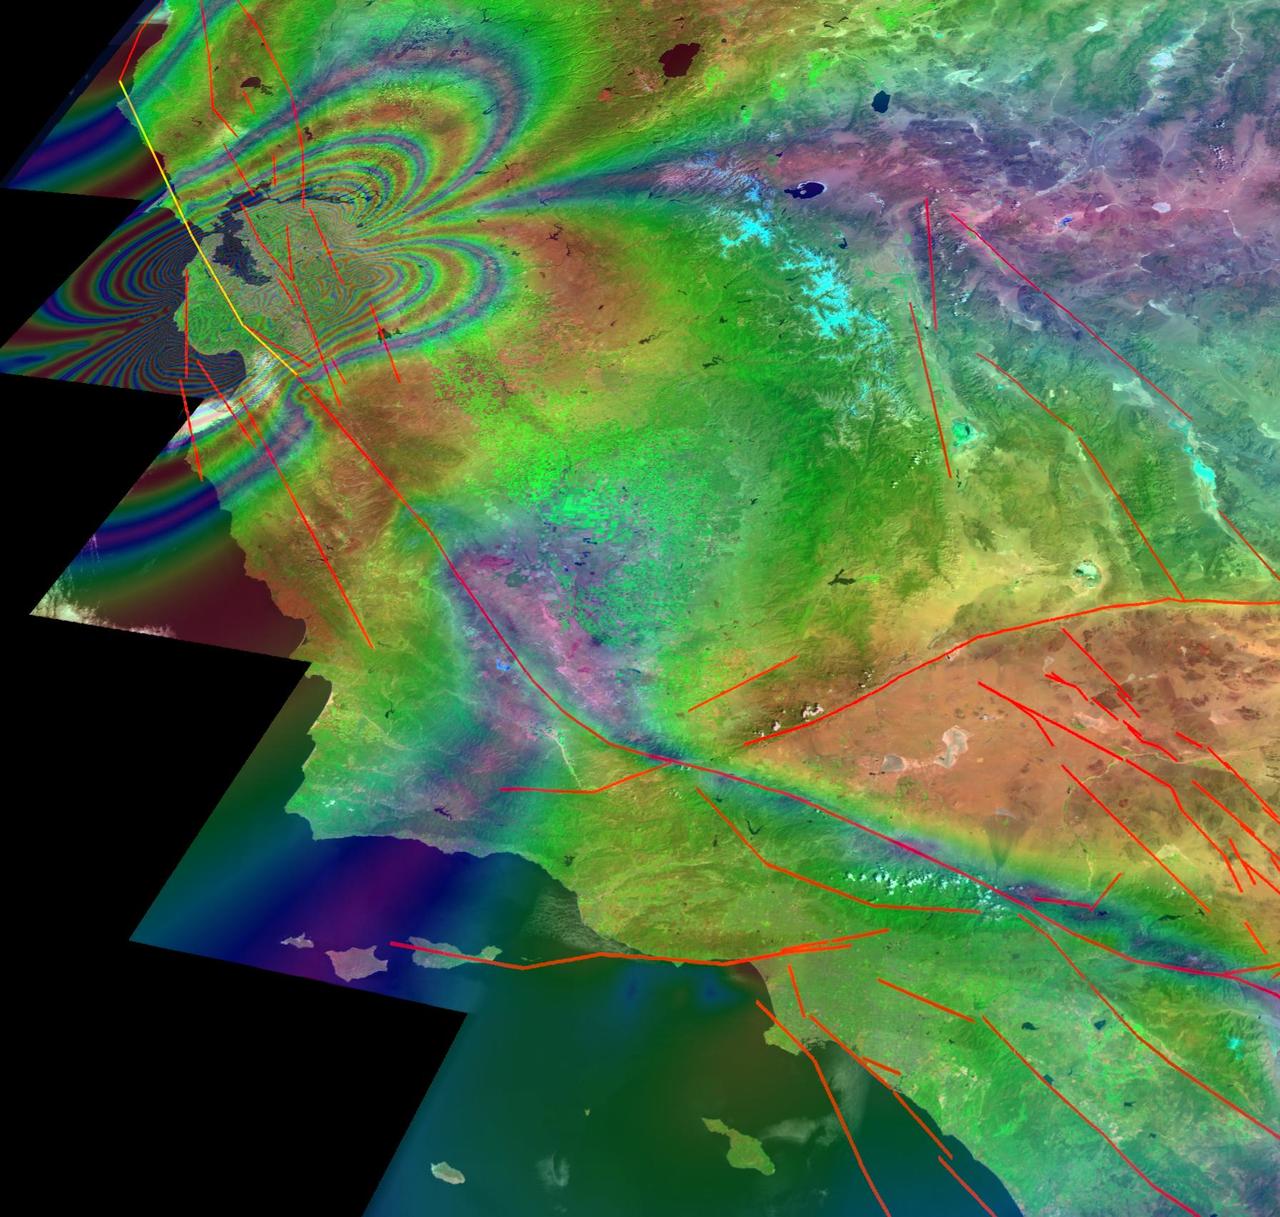
This image is an interferogram that was created using pairs of images taken by Synthetic Aperture Radar (SAR). The images, acquired at two different times, have been combined to measure surface deformation or changes that may have occurred during the time between data acquisition. The images were collected by the European Space Agency's Remote Sensing satellite (ERS-2) on 13 August 1999 and 17 September 1999 and were combined to produce these image maps of the apparent surface deformation, or changes, during and after the 17 August 1999 Izmit, Turkey earthquake. This magnitude 7.6 earthquake was the largest in 60 years in Turkey and caused extensive damage and loss of life. Each of the color contours of the interferogram represents 28 mm (1.1 inches) of motion towards the satellite, or about 70 mm (2.8 inches) of horizontal motion. White areas are outside the SAR image or water of seas and lakes. The North Anatolian Fault that broke during the Izmit earthquake moved more than 2.5 meters (8.1 feet) to produce the pattern measured by the interferogram. Thin red lines show the locations of fault breaks mapped on the surface. The SAR interferogram shows that the deformation and fault slip extended west of the surface faults, underneath the Gulf of Izmit. Thick black lines mark the fault rupture inferred from the SAR data. Scientists are using the SAR interferometry along with other data collected on the ground to estimate the pattern of slip that occurred during the Izmit earthquake. This then used to improve computer models that predict how this deformation transferred stress to other faults and to the continuation of the North Anatolian Fault, which extends to the west past the large city of Istanbul. These models show that the Izmit earthquake further increased the already high probability of a major earthquake near Istanbul. http://photojournal.jpl.nasa.gov/catalog/PIA00557

Ground shaking triggered liquefaction in a subsurface layer of water-saturated sand, producing differential lateral and vertical movement in a overlying carapace of unliquified sand and slit, which moved from right to left towards the Pajaro River. This mode of ground failure, termed lateral spreading, is a principal cause of liquefaction-related earthquake damage caused by the Oct. 17, 1989, Loma Prieta earthquake. Sand and soil grains have faces that can cause friction as they roll and slide against each other, or even cause sticking and form small voids between grains. This complex behavior can cause soil to behave like a liquid under certain conditions such as earthquakes or when powders are handled in industrial processes. Mechanics of Granular Materials (MGM) experiments aboard the Space Shuttle use the microgravity of space to simulate this behavior under conditons that carnot be achieved in laboratory tests on Earth. MGM is shedding light on the behavior of fine-grain materials under low effective stresses. Applications include earthquake engineering, granular flow technologies (such as powder feed systems for pharmaceuticals and fertilizers), and terrestrial and planetary geology. Nine MGM specimens have flown on two Space Shuttle flights. Another three are scheduled to fly on STS-107. The principal investigator is Stein Sture of the University of Colorado at Boulder. Credit: S.D. Ellen, U.S. Geological Survey
This illustration depicts synthetic aperature radar patterns of seismic deformations associated with a model earthquake on the San Francisco section of the San Andreas Fault depicted in yellow.
This image from NASA Terra satellite shows the Kachchh region in the Gujarat province of western India. On January 26, 2001, a magnitude 7.7 earthquake devastated this area, killing 20,000 people and destroying buildings, dams, and port facilities.
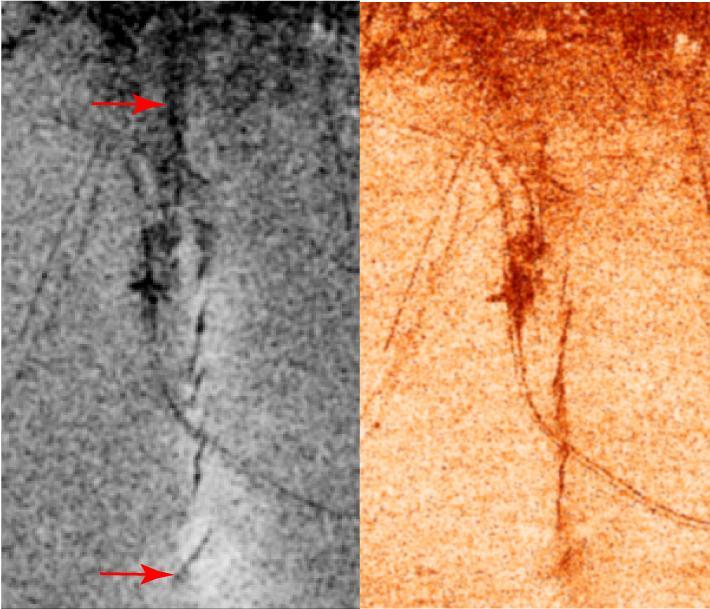
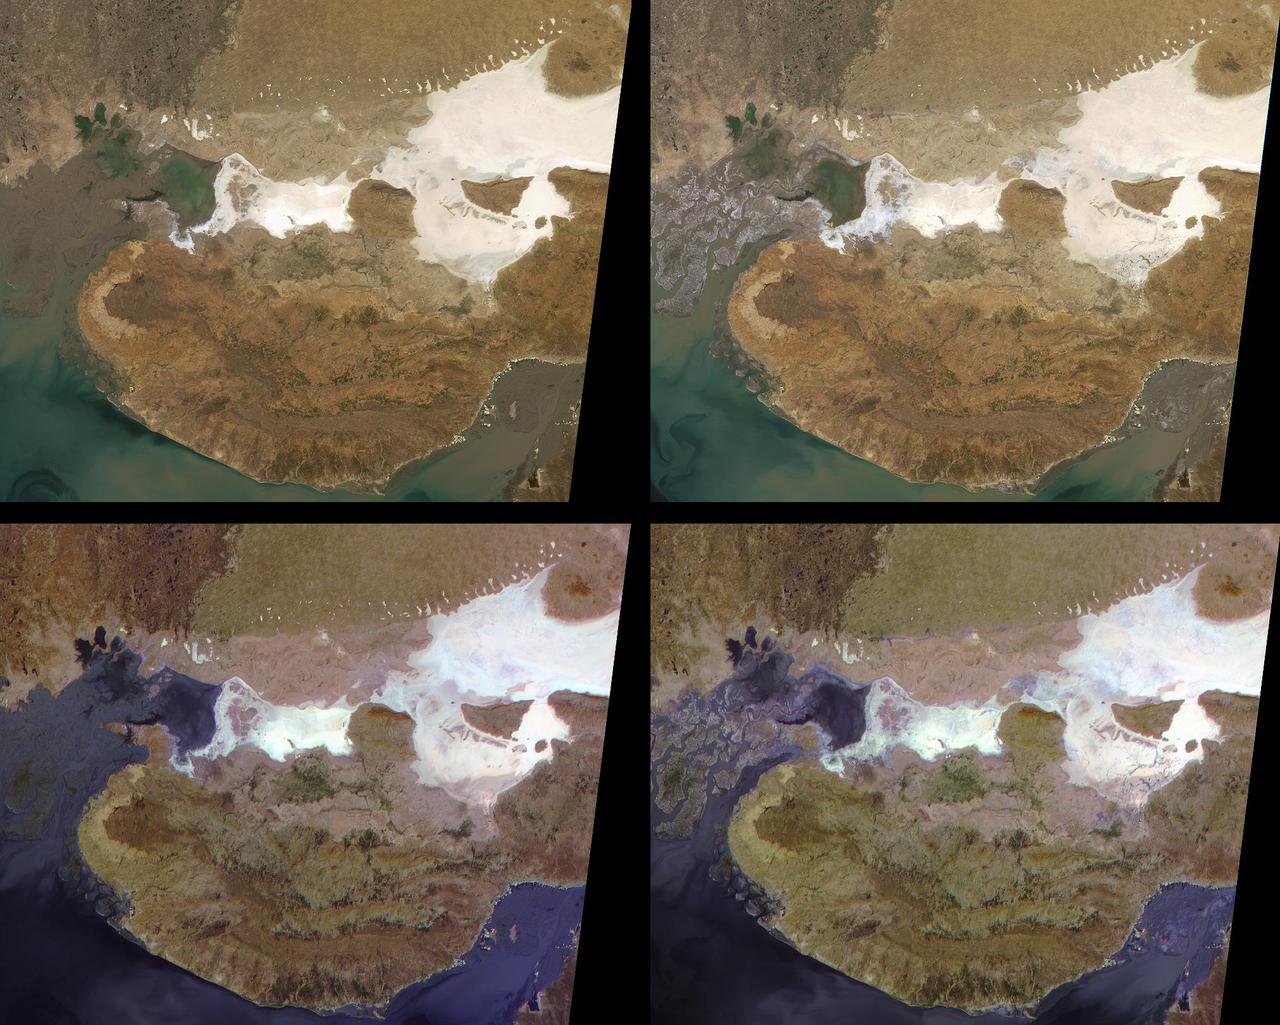
A magnitude 6.5 earthquake devastated the small city of Bam in southeast Iran on December 26, 2003. The two images from ESA Envisat show similar measures of the radar interferometric correlation in grayscale on the left and in false colors on the right.

NASA Terra spacecraft captures a clear sky image of the region of the recent Haiti earthquake.
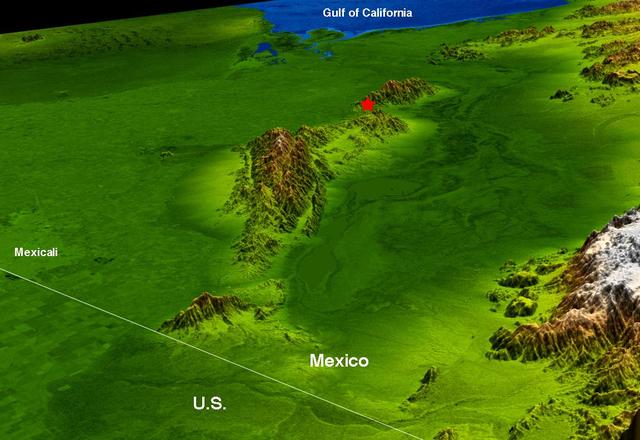
The topography surrounding the Laguna Salada Fault in the Mexican state of Baja, California, is shown in this combined radar image and topographic view with data from NASA Shuttle Radar Topography Mission where a 7.2 earthquake struck on April 4, 2010.
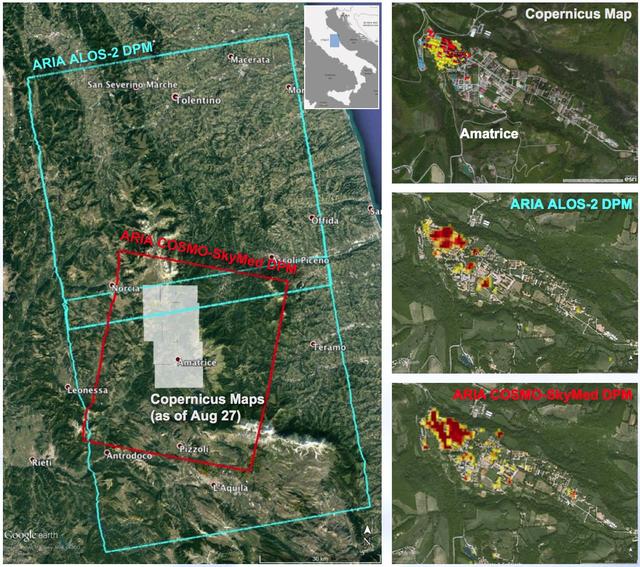
A NASA-funded program provided valuable information for responders and groups supporting the recovery efforts for the Aug. 24, 2016, magnitude 6.2 earthquake that struck central Italy. The earthquake caused significant loss of life and property damage in the town of Amatrice. To assist in the disaster response efforts, scientists at NASA's Jet Propulsion Laboratory and Caltech, both in Pasadena, California, obtained and used radar imagery of the earthquake's hardest-hit region to discriminate areas of damage from that event. The views indicate the extent of damage caused by the earthquake and subsequent aftershocks in and around Amatrice, based on changes to the ground surface detected by radar. The color variations from yellow to red indicate increasingly more significant ground surface change. The damage maps were created from data obtained before and after the earthquake by satellites belonging to the Italian Space Agency (ASI) and the Japan Aerospace Exploration Agency (JAXA). The radar-derived damage maps compare well with a damage map produced by the European Commission Copernicus Emergency Management Service based upon visual inspection of high-resolution pre-earthquake aerial photographs and post-earthquake satellite optical imagery, and provide broader geographic coverage of the earthquake's impact in the region. The X-band COSMO-SkyMed (CSK) data were provided through a research collaboration with ASI and were acquired on July 3, August 20, and August 28, 2016. The L-band ALOS/PALSAR-2 data were provided by JAXA through its science research program and were acquired on September 9, 2015, January 27, 2016, and August 24, 2016. The radar data were processed by the Advanced Rapid Imaging and Analysis (ARIA) team at JPL and Caltech. ARIA is a NASA-funded project that is building an automated system for demonstrating the ability to rapidly and reliably provide GPS and satellite data to support the local, national and international hazard monitoring and response communities. Using space-based imagery of disasters, ARIA data products can provide rapid assessments of the geographic region impacted by a disaster, as well as detailed imaging of the locations where damage occurred. Radar can "see" through clouds day and night and measure centimeter-level ground movements. NASA is partnering with the Indian Space Research Organization (ISRO) to develop the NASA ISRO Synthetic Aperture Radar (NISAR) mission that will routinely provide systematic SAR observations of Earth's land and ice-covered surfaces at least twice every 12 days, enabling greater scientific understanding of the dynamic processes that drive the Earth system and natural hazards, as well as providing actionable support for disaster response and recovery. http://photojournal.jpl.nasa.gov/catalog/PIA21091
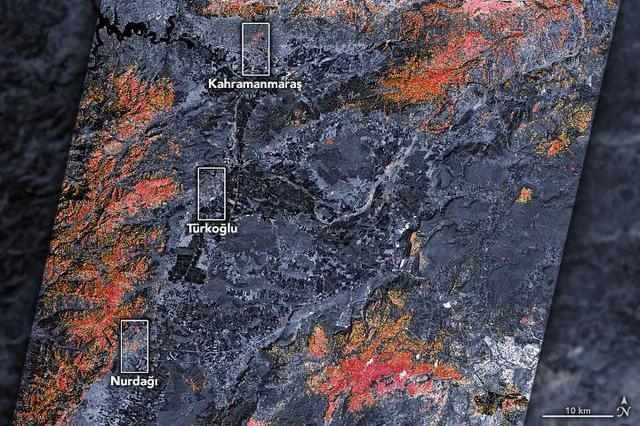
The magnitude 7.8 and 7.5 earthquakes that struck southern Turkey and western Syria on February 6, 2023, caused widespread destruction in both countries. The initial, stronger earthquake emanated from a fault 11 miles (18 kilometers) below the surface. The shallow depth meant the earthquake produced violent shaking that affected areas hundreds of miles from the epicenter, 16 miles (26 kilometers) east of the city of Nurdağı, Turkey. The second quake followed nine hours later, striking 6 miles (10 kilometers) deep, roughly 2.5 miles (4 kilometers) south-southeast of the Turkish town of Ekinözü. Hundreds of smaller aftershocks occurred in subsequent days. The preliminary damage proxy map above shows parts of the Turkish cities of Islahiye, Kahramanmaras, and Nurdağı. Dark red pixels represent areas likely to have severe damage to buildings, homes, and infrastructure or changes to landscape, while orange and yellow areas are moderately or partially damaged. Each pixel measures about 100 feet (30 meters) across (about the size of a baseball infield). The damage estimates are most accurate for urban areas and may be less accurate in the mountain and vegetated areas. The Earth Observatory of Singapore – Remote Sensing Lab and the Advanced Rapid Imaging and Analysis (ARIA) team at NASA's Jet Propulsion Laboratory and Caltech collaborated to derive the map from data collected by Japan's Advanced Land Observing Satellite-2 satellite (ALOS-2) on February 8, 2023. The satellite carries a synthetic aperture radar, a sensor that sends pulses of microwaves toward Earth's surface and records for the reflections of those waves to map the landscape, including buildings. By comparing the February 8 data to observations made by the same satellite before the earthquake (on April 7, 2021 and April 6, 2022), scientists tracked the changes and began to identify areas that were likely damaged. https://photojournal.jpl.nasa.gov/catalog/PIA25564
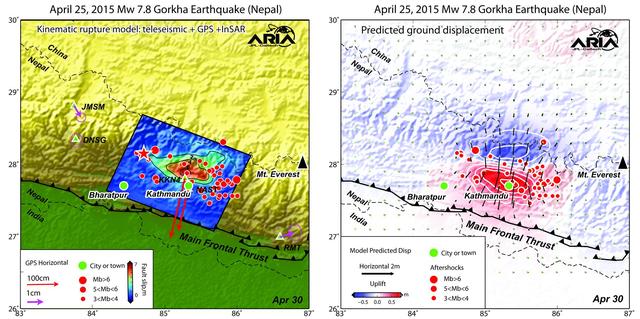
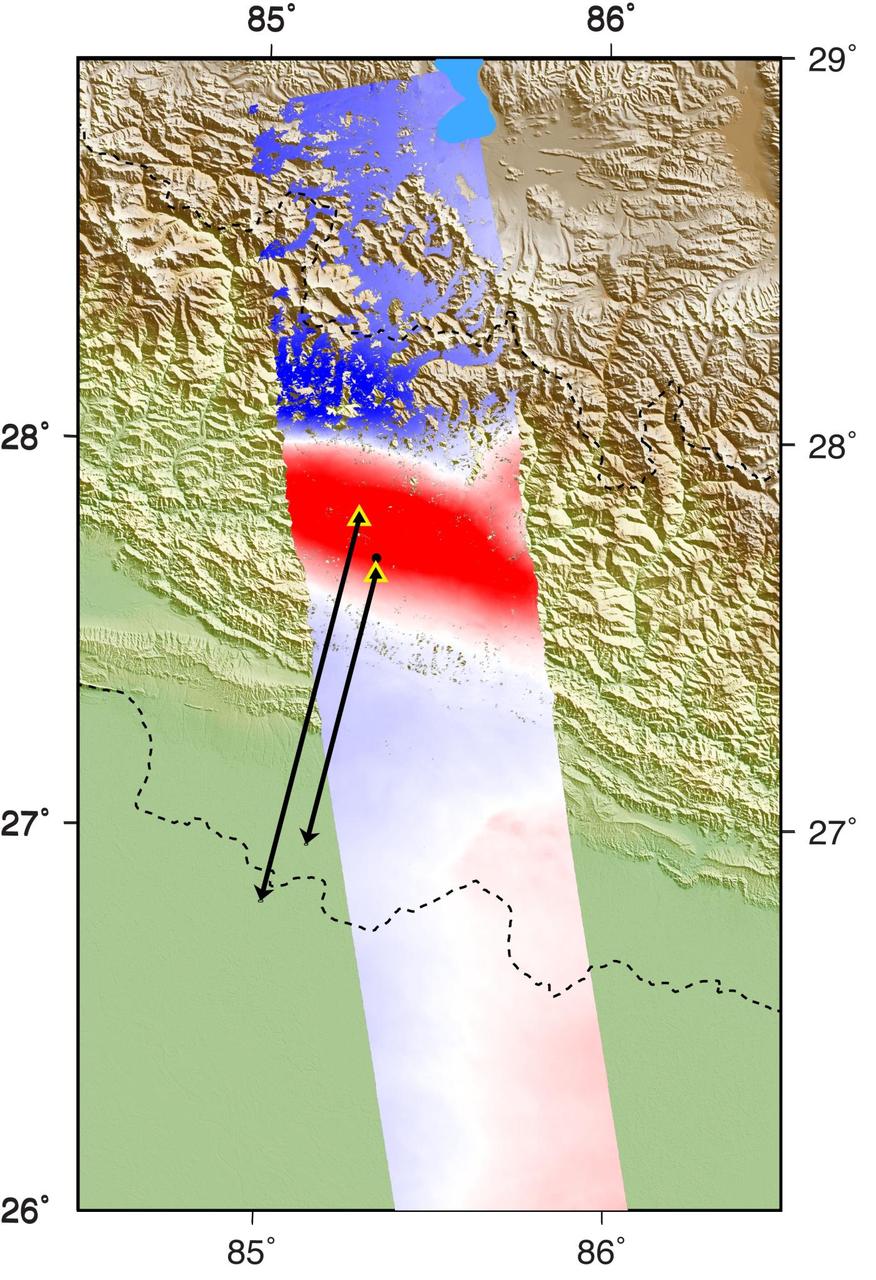
Using a combination of GPS-measured ground motion data, satellite radar data, and seismic observations from instruments distributed around the world, scientists have constructed preliminary estimates of how much the fault responsible for the April 25, 2015, magnitude 7.8 Gorkha earthquake in Nepal moved below Earth's surface (Figure 1). This information is useful for understanding not only what happened in the earthquake but also the potential for future events. It can also be used to infer a map of how Earth's surface moved due to the earthquake over a broader region (Figure 2). The maps created from these data can be viewed at PIA19384. In the first figure, the modeled slip on the fault is shown as viewed from above and indicated by the colors and contours within the rectangle. The peak slip in the fault exceeds 19.7 feet (6 meters). The ground motion measured with GPS is shown by the red and purple arrows and was used to develop the fault slip model. In the second figure, color represents vertical movement and the scaled arrows indicate direction and magnitude of horizontal movement. In both figures, aftershocks are indicated by red dots. Background color and shaded relief reflect regional variations in topography. The barbed lines show where the main fault reaches Earth's surface. The main fault dives northward into the Earth below the Himalaya. http://photojournal.jpl.nasa.gov/catalog/PIA19384

Sand boil or sand volcano measuring 2 m (6.6 ft.) in length erupted in median of Interstate Highway 80 west of the Bay Bridge toll plaza when ground shaking transformed loose water-saturated deposit of subsurface sand into a sand-water slurry (liquefaction) in the October 17, 1989, Loma Prieta earthquake. Vented sand contains marine-shell fragments. Sand and soil grains have faces that can cause friction as they roll and slide against each other, or even cause sticking and form small voids between grains. This complex behavior can cause soil to behave like a liquid under certain conditions such as earthquakes or when powders are handled in industrial processes. Mechanics of Granular Materials (MGM) experiments aboard the Space Shuttle use the microgravity of space to simulate this behavior under conditions that carnot be achieved in laboratory tests on Earth. MGM is shedding light on the behavior of fine-grain materials under low effective stresses. Applications include earthquake engineering, granular flow technologies (such as powder feed systems for pharmaceuticals and fertilizers), and terrestrial and planetary geology. Nine MGM specimens have flown on two Space Shuttle flights. Another three are scheduled to fly on STS-107. The principal investigator is Stein Sture of the University of Colorado at Boulder. (Credit: J.C. Tinsley, U.S. Geological Survey)

An automobile lies crushed under the third story of this apartment building in the Marina District after the Oct. 17, 1989, Loma Prieta earthquake. The ground levels are no longer visible because of structural failure and sinking due to liquefaction. Sand and soil grains have faces that can cause friction as they roll and slide against each other, or even cause sticking and form small voids between grains. This complex behavior can cause soil to behave like a liquid under certain conditions such as earthquakes or when powders are handled in industrial processes. Mechanics of Granular Materials (MGM) experiments aboard the Space Shuttle use the microgravity of space to simulate this behavior under conditons that carnot be achieved in laboratory tests on Earth. MGM is shedding light on the behavior of fine-grain materials under low effective stresses. Applications include earthquake engineering, granular flow technologies (such as powder feed systems for pharmaceuticals and fertilizers), and terrestrial and planetary geology. Nine MGM specimens have flown on two Space Shuttle flights. Another three are scheduled to fly on STS-107. The principal investigator is Stein Sture of the University of Colorado at Boulder. Credit: J.K. Nakata, U.S. Geological Survey.

This radar image, called a coseismic interferogram, using satellite data from the European Space Agency Envisat depicts ground displacements resulting from the March 11, 2011, magnitude 9.0 Tohoku earthquake in Japan.

On April 9, 2013 at 11:52 GMT, this image acquired by NASA Terra spacecraft, shows the location of a magnitude 6.3 earthquake hit southwestern Iran Bushehr province near the town of Kaki.

The topography surrounding the Laguna Salada Fault in the Mexican state of Baja, California, is shown in this perspective view with data from NASA Shuttle Radar Topography Mission where a 7.2 earthquake struck on April 4, 2010.
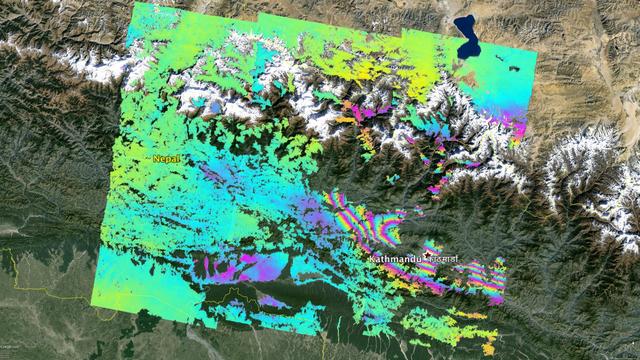
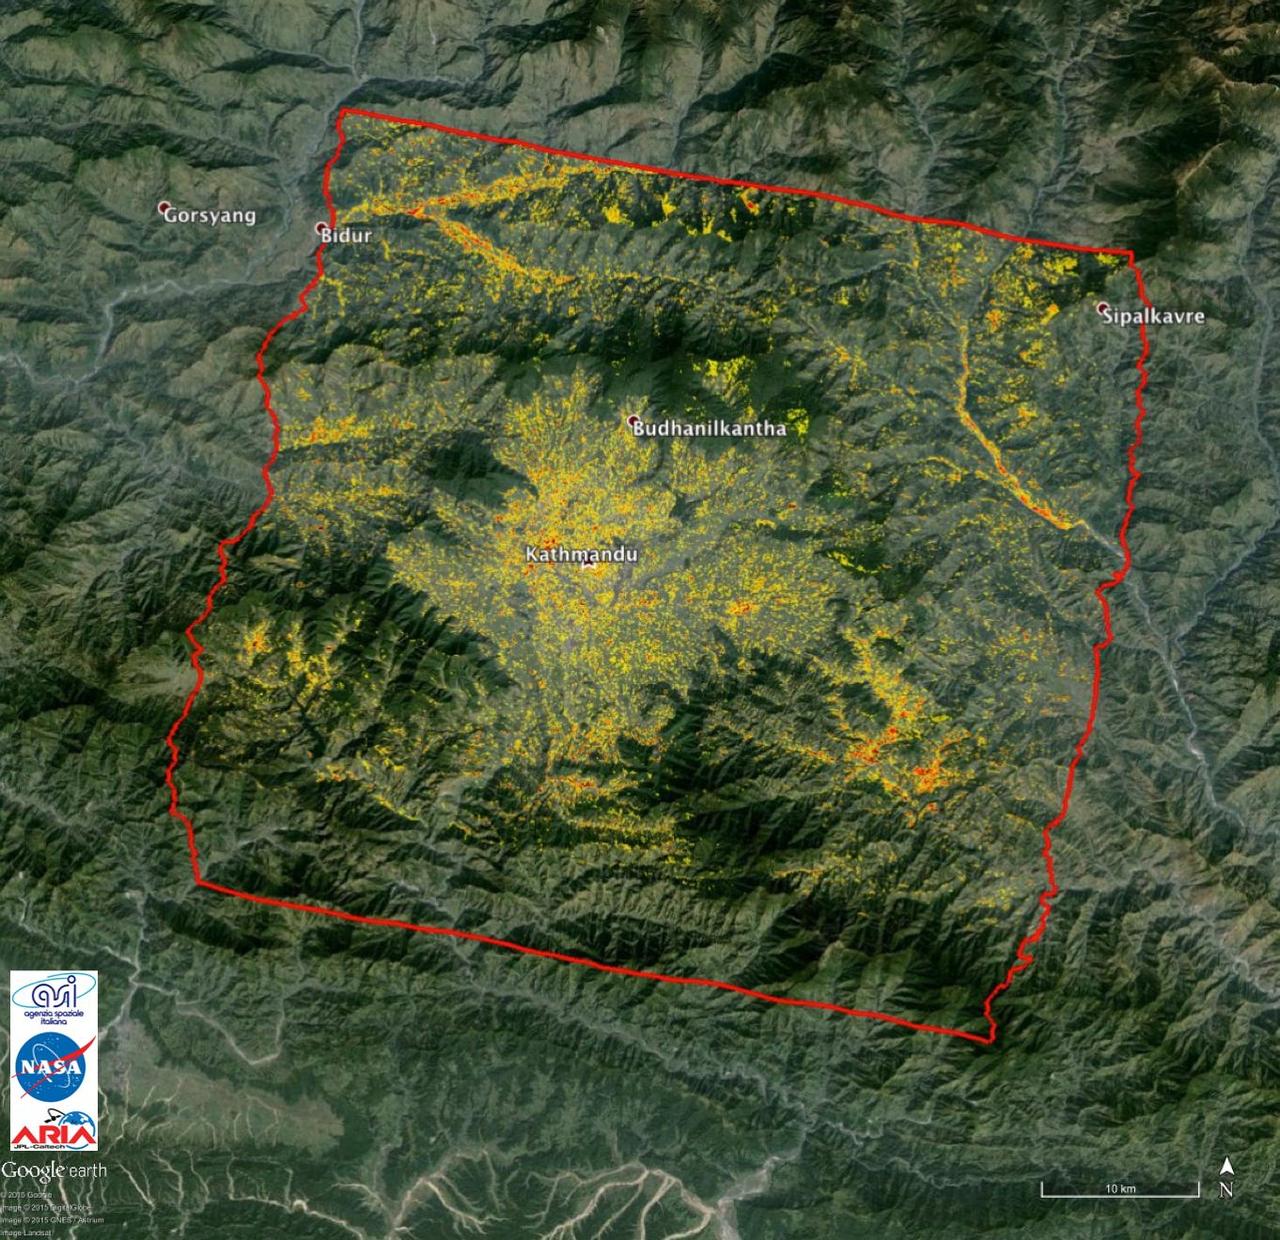
NASA and its partners are contributing important observations and expertise to the ongoing response to the April 25, 2015, magnitude 7.8 Gorkha earthquake in Nepal. The quake was the strongest to occur in that area since the 1934 Nepal-Bihar magnitude 8.0 event and caused significant regional damage and a humanitarian crisis. Scientists with the Advanced Rapid Imaging and Analysis project (ARIA), a collaboration between NASA's Jet Propulsion Laboratory, Pasadena, California, and the California Institute of Technology in Pasadena, analyzed interferometric synthetic aperture radar images from the European Union's Copernicus Sentinel-1A satellite, operated by the European Space Agency and also available from the Alaska Satellite Facility (https://www.asf.alaska.edu), to calculate a map of the deformation of Earth's surface caused by the quake. This false-color map shows the amount of permanent surface movement caused almost entirely by the earthquake, as viewed by the satellite, during a 12-day interval between two Sentinel-1 images acquired on April 17 and April 29, 2015. In the map, surface displacements are seen as color contours (or "fringes"), where each color cycle represents 8 inches (20 centimeters) of surface motion. The contours show the land around Kathmandu has moved upward by more than 40 inches (1 meter). Areas without the color contours have snow or heavy vegetation that affects the radar measurements. Scientists use these maps to build detailed models of the fault and associated land movements to better understand the impact on future earthquake activity. The background image is from Google Earth. The map contains Copernicus data (2015). http://photojournal.jpl.nasa.gov/catalog/PIA19535
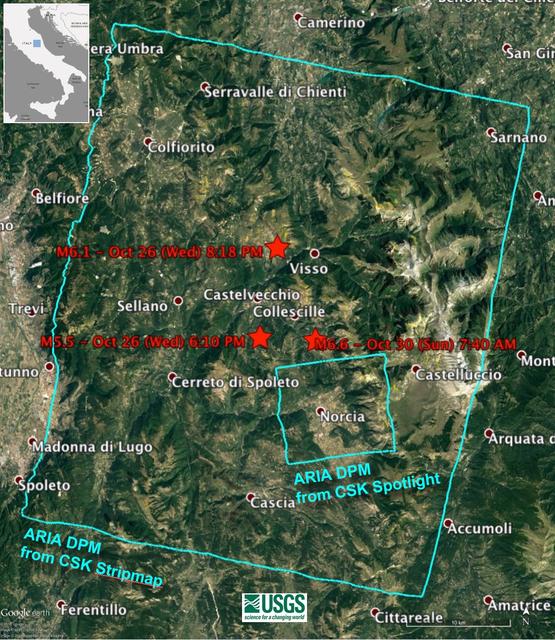
Damage Proxy Map (DPM) v0.5, derived from the Italian Space Agency's COSMO-SkyMed Spotlight synthetic aperture radar (SAR) data acquired from an ascending orbit, covering an area of 6.2-by-6.2 miles (10-by-10 kilometers), centered at Norcia, Italy. Red pixels (pixel size about 16 feet, or 5 meters)represent areas of potential damage due to the Magnitude 6.6 Oct 30, 2016, Central Italy earthquakes, as well as ground surface change during the time period Oct. 30, 2016 -- Oct. 31, 2016. The color variation from yellow to red indicate increasingly more significant ground surface change. Preliminary validation was carried out by comparing with high-resolution pre- and post-event optical imagery acquired by DigitalGlobe's WorldView satellites, and a damage map produced by the European Commission Copernicus Emergency Management Service based upon visual inspection of high-resolution pre- (Orthophoto) and post-event (Pleiades-1) optical imagery. This DPM provides broad geographic coverage of the earthquake's impact in the region. Areas that fall in radar shadow and layover were masked out. The DPM should be used as guidance to identify damaged areas, and may be less reliable over vegetated areas. http://photojournal.jpl.nasa.gov/catalog/PIA15374
This false-color map from NASA ARIA project shows the amount of permanent surface movement caused almost entirely by the magnitude 7.8 Gorkha earthquake in Nepal.
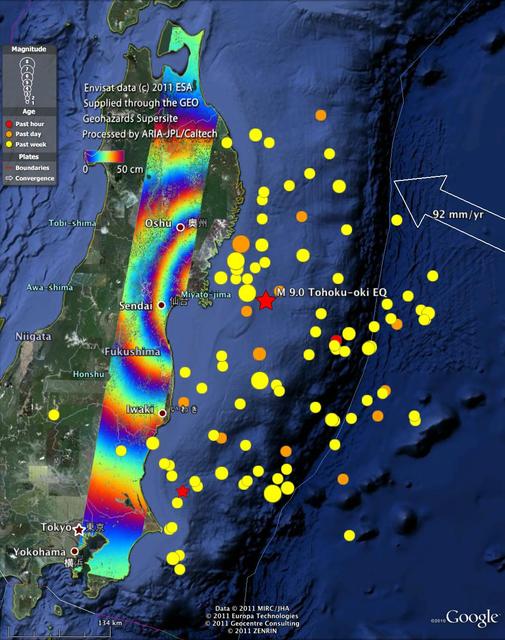
This radar image from ESA Envisat depicts ground displacements resulting from the March 11, 2011, magnitude 9.0 Tohoku earthquake in Japan.
A magnitude 6.6 earthquake struck a sparsely inhabited area of southeast Iran on March 14, 1998, at 11:10 p.m. local time.

On January 26, 2001, when India Republic Day is normally celebrated, a devastating earthquake hit the state of Gujarat. These two false-color images were acquired by NASA Terra spacecraft before and after the event, on January 15 and 31.
NASA data and expertise are providing valuable information for the ongoing response to the April 25, 2015, magnitude 7.8 Gorkha earthquake in Nepal.
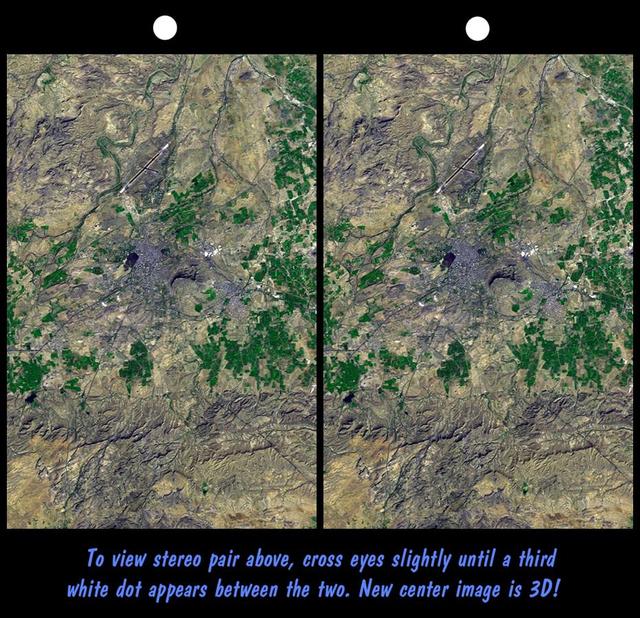
On January 26, 2001, the city of Bhuj suffered the most deadly earthquake in India history. This stereoscopic image was generated from NASA Landsat satellite and data from Shuttle Radar Topography Mission SRTM.
The magnitude 9.2 Indian Ocean earthquake of December 26, 2004, produced broad regions of uplift and subsidence. In order to define the lateral extent and the downdip limit of rupture. This image is from NASA Terra spacecraft.
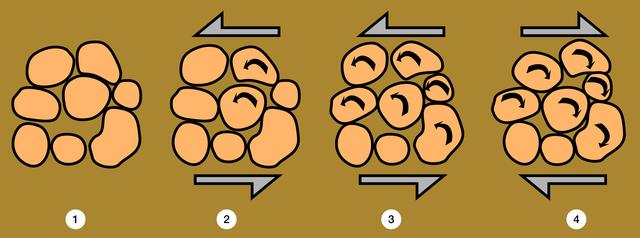
The packing of particles can change radically during cyclic loading such as in an earthquake or when shaking a container to compact a powder. A large hole (1) is maintained by the particles sticking to each other. A small, counterclockwise strain (2) collapses the hole, and another large strain (3) forms more new holes which collapse when the strain reverses (4). Sand and soil grains have faces that can cause friction as they roll and slide against each other, or even cause sticking and form small voids between grains. This complex behavior can cause soil to behave like a liquid under certain conditions such as earthquakes or when powders are handled in industrial processes. MGM experiments aboard the Space Shuttle use the microgravity of space to simulate this behavior under conditions that carnot be achieved in laboratory tests on Earth. MGM is shedding light on the behavior of fine-grain materials under low effective stresses. Applications include earthquake engineering, granular flow technologies (such as powder feed systems for pharmaceuticals and fertilizers), and terrestrial and planetary geology. Nine MGM specimens have flown on two Space Shuttle flights. Another three are scheduled to fly on STS-107. The principal investigator is Stein Sture of the University of Colorado at Boulder. (after T.L. Youd, Packing Changes and Liquefaction Susceptibility, Journal of the Geotechnical Engieering Division, 103: GT8,918-922, 1977)(Credit: NASA/Marshall Space Flight Center.)(Credit: University of Colorado at Boulder).

Key persornel in the Mechanics of Granular Materials (MGM) experiment at the University of Colorado at Boulder include Tawnya Ferbiak (software engineer), Susan Batiste (research assistant), and Christina Winkler (graduate research assistant). Sand and soil grains have faces that can cause friction as they roll and slide against each other, or even cause sticking and form small voids between grains. This complex behavior can cause soil to behave like a liquid under certain conditions such as earthquakes or when powders are handled in industrial processes. MGM experiments aboard the Space Shuttle use the microgravity of space to simulate this behavior under conditions that cannot be achieved in laboratory tests on Earth. MGM is shedding light on the behavior of fine-grain materials under low effective stresses. Applications include earthquake engineering, granular flow technologies (such as powder feed systems for pharmaceuticals and fertilizers), and terrestrial and planetary geology. Nine MGM specimens have flown on two Space Shuttle flights. Another three are scheduled to fly on STS-107. The principal investigator is Stein Sture of the University of Colorado at Boulder. (Credit: University of Colorado at Boulder).

Key persornel in the Mechanics of Granular Materials (MGM) experiment include Khalid Alshibli, project scientist at NASA's Marshall Space Flight Center (MSFC). Sand and soil grains have faces that can cause friction as they roll and slide against each other, or even cause sticking and form small voids between grains. This complex behavior can cause soil to behave like a liquid under certain conditions such as earthquakes or when powders are handled in industrial processes. MGM experiments aboard the Space Shuttle use the microgravity of space to simulate this behavior under conditions that cannot be achieved in laboratory tests on Earth. MGM is shedding light on the behavior of fine-grain materials under low effective stresses. Applications include earthquake engineering, granular flow technologies (such as powder feed systems for pharmaceuticals and fertilizers), and terrestrial and planetary geology. Nine MGM specimens have flown on two Space Shuttle flights. Another three are scheduled to fly on STS-107. The principal investigator is Stein Sture of the University of Colorado at Boulder. (Credit: MSFC).
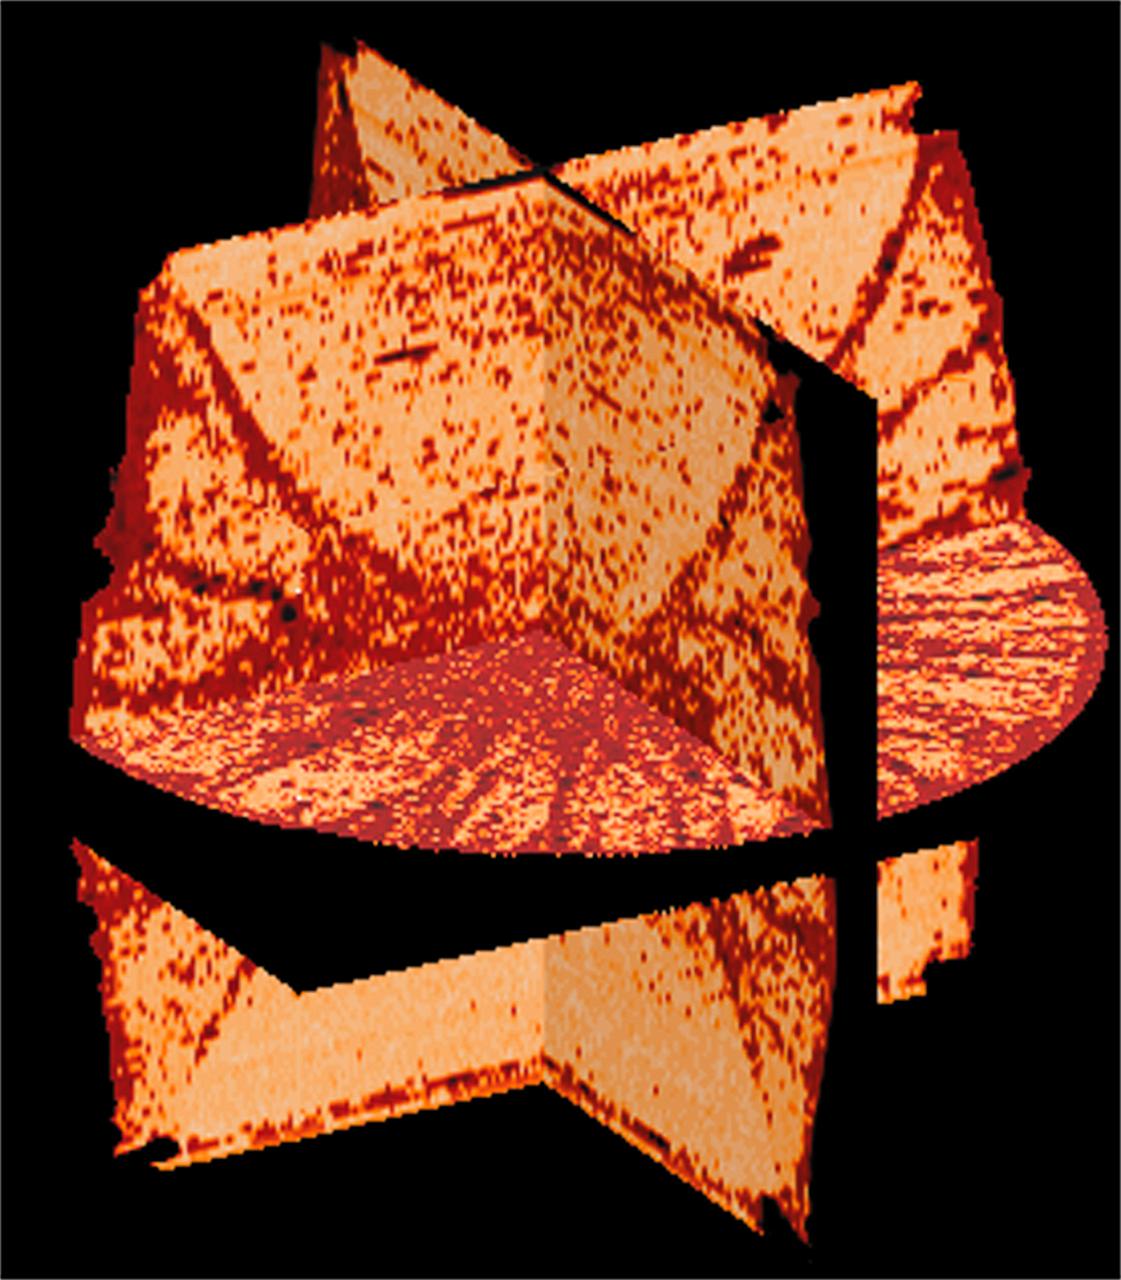
CT scans of the specimens on STS-79 reveal internal cone-shaped features and radial patterns not seen in specimens processed on the ground. The lighter areas are the densest in these images. CT scans produced richly detailed images allowing scientists to build 3D models of the interior of the specimens that can be compared with microscopic examination of thin slices. This view is made from three orthogonal slices. Sand and soil grains have faces that can cause friction as they roll and slide against each other, or even cause sticking and form small voids between grains. This complex behavior can cause soil to behave like a liquid under certain conditions such as earthquakes or when powders are handled in industrial processes. Mechanics of Granular Materials (MGM) experiments aboard the Space Shuttle use the microgravity of space to simulate this behavior under conditions that carnot be achieved in laboratory tests on Earth. MGM is shedding light on the behavior of fine-grain materials under low effective stresses. Applications include earthquake engineering, granular flow technologies (such as powder feed systems for pharmaceuticals and fertilizers), and terrestrial and planetary geology. Nine MGM specimens have flown on two Space Shuttle flights. Another three are scheduled to fly on STS-107. The principal investigator is Stein Sture of the University of Colorado at Boulder. (Credit: Los Alamos National Laboratory and the University of Colorado at Boulder).

Key persornel in the Mechanics of Granular Materials (MGM) experiment are Mark Lankton (Program Manager at University Colorado at Boulder), Susan Batiste (research assistance, UCB), and Stein Sture (principal investigator). Sand and soil grains have faces that can cause friction as they roll and slide against each other, or even cause sticking and form small voids between grains. This complex behavior can cause soil to behave like a liquid under certain conditions such as earthquakes or when powders are handled in industrial processes. MGM experiments aboard the Space Shuttle use the microgravity of space to simulate this behavior under conditions that cannot be achieved in laboratory tests on Earth. MGM is shedding light on the behavior of fine-grain materials under low effective stresses. Applications include earthquake engineering, granular flow technologies (such as powder feed systems for pharmaceuticals and fertilizers), and terrestrial and planetary geology. Nine MGM specimens have flown on two Space Shuttle flights. Another three are scheduled to fly on STS-107. The principal investigator is Stein Sture of the University of Colorado at Boulder. (Credit: University of Colorado at Boulder).
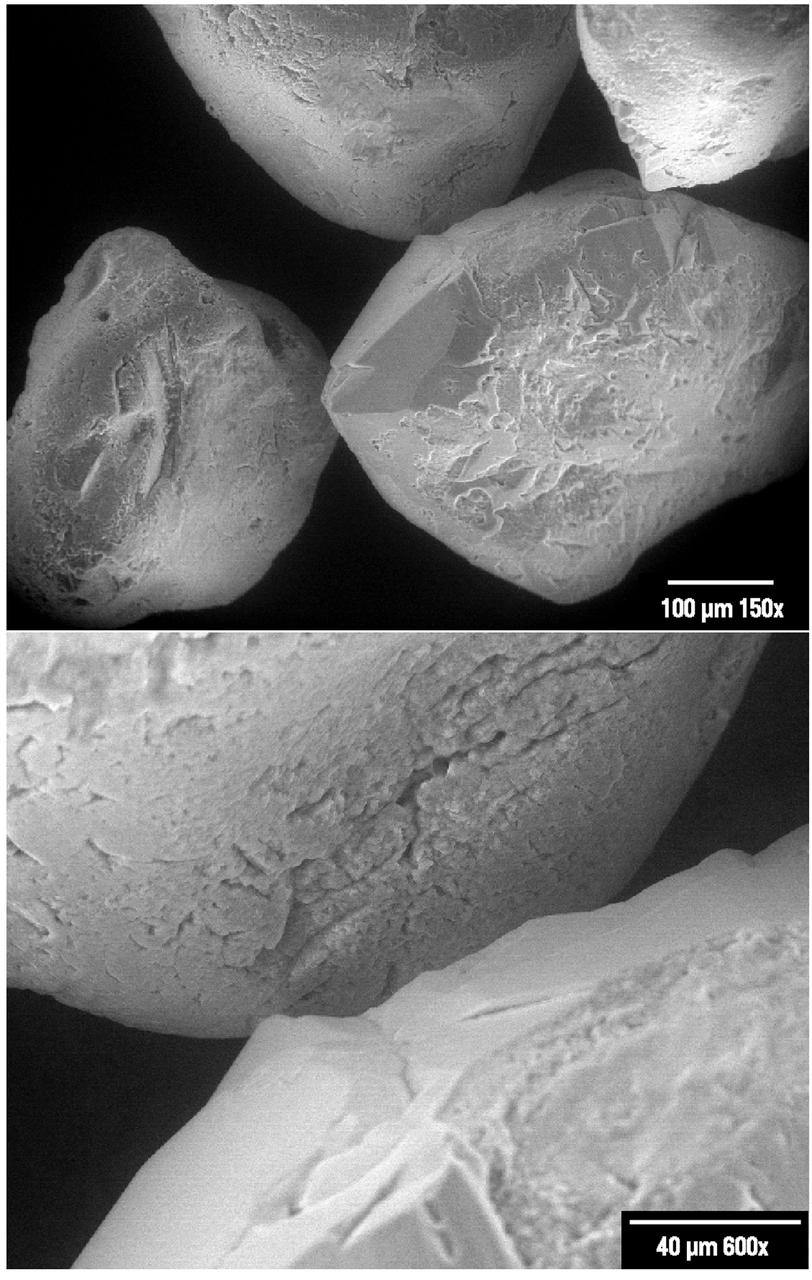
What appear to be boulders fresh from a tumble down a mountain are really grains of Ottawa sand, a standard material used in civil engineering tests and also used in the Mechanics of Granular Materials (MGM) experiment. The craggy surface shows how sand grans have faces that can cause friction as they roll and slide against each other, or even causing sticking and form small voids between grains. This complex behavior can cause soil to behave like a liquid under certain conditions such as earthquakes or when powders are handled in industrial processes. MGM uses the microgravity of space to simulate this behavior under conditions that carnot be achieved in laboratory tests on Earth. MGM is shedding light on the behavior of fine-grain materials under low effective stresses. Applications include earthquake engineering, granular flow technologies (such as powder feed systems for pharmaceuticals and fertilizers), and terrestrial and planetary geology. Nine MGM specimens have flown on two Space Shuttle flights. Another three are scheduled to fly on STS-107. The principal investigator is Stein Sture of the University of Colorado at Boulder. These images are from an Electron Spectroscopy for Chemical Analysis (ESCA) study conducted by Dr. Binayak Panda of IITRI for Marshall Space Flight Center (MSFC). (Credit: NASA/MSFC)
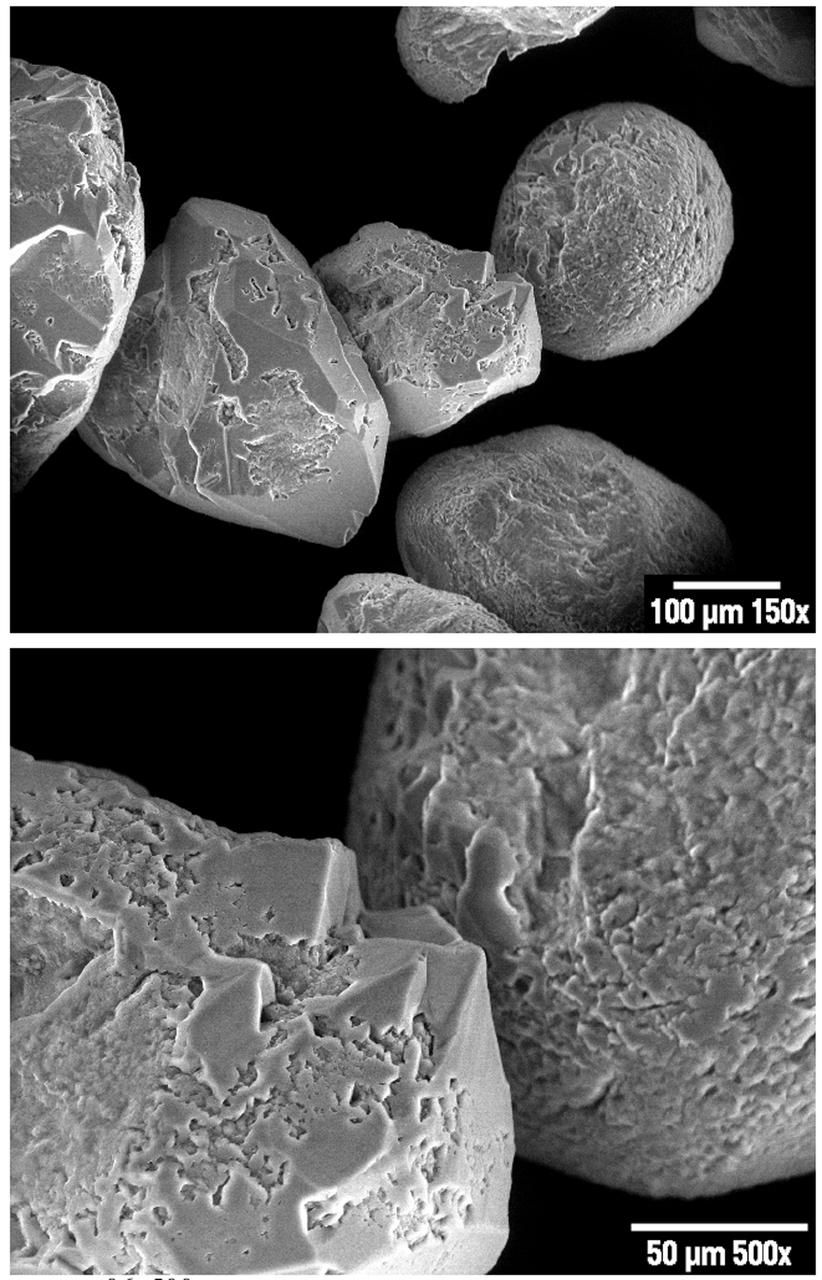
What appear to be boulders fresh from a tumble down a mountain are really grains of Ottawa sand, a standard material used in civil engineering tests and also used in the Mechanics of Granular Materials (MGM) experiment. The craggy surface shows how sand grans have faces that can cause friction as they roll and slide against each other, or even causing sticking and form small voids between grains. This complex behavior can cause soil to behave like a liquid under certain conditions such as earthquakes or when powders are handled in industrial processes. MGM uses the microgravity of space to simulate this behavior under conditions that carnot be achieved in laboratory tests on Earth. MGM is shedding light on the behavior of fine-grain materials under low effective stresses. Applications include earthquake engineering, granular flow technologies (such as powder feed systems for pharmaceuticals and fertilizers), and terrestrial and planetary geology. Nine MGM specimens have flown on two Space Shuttle flights. Another three are scheduled to fly on STS-107. The principal investigator is Stein Sture of the University of Colorado at Boulder. These images are from an Electron Spectroscopy for Chemical Analysis (ESCA) study conducted by Dr. Binayak Panda of IITRI for Marshall Space Flight Center (MSFC). (Credit: NASA/MSFC)
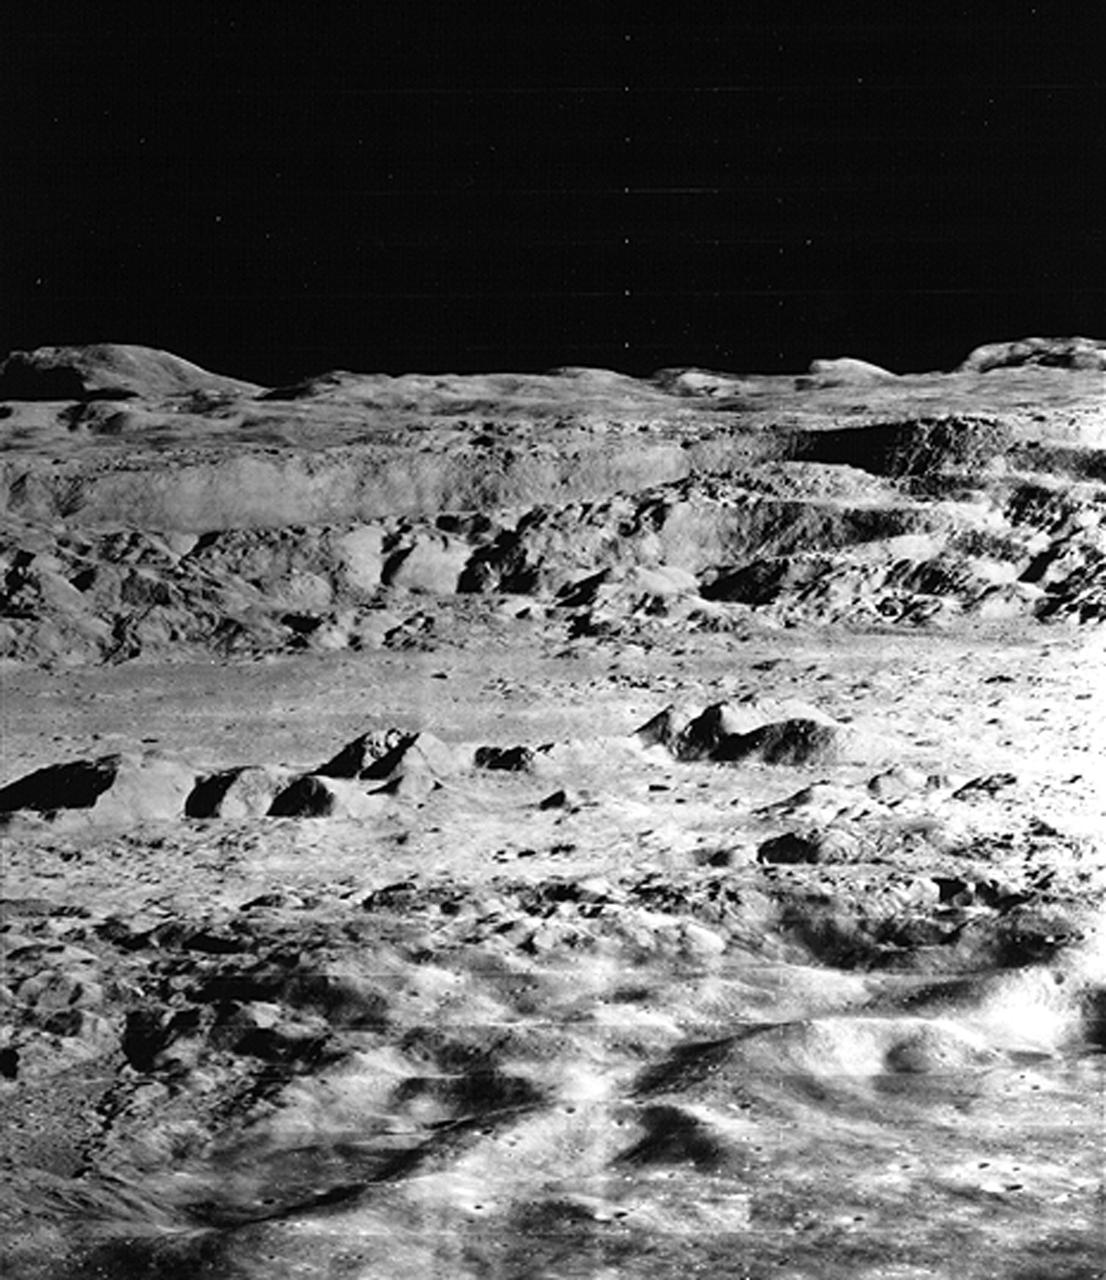
Lunar Orbiter 2 oblique northward view towards Copernicus crater on the Moon shows crater wall slumping caused by soil liquefaction following the impact that formed the crater. The crater is about 100 km in diameter. The central peaks are visible towards the top of the image, rising about 400 m above the crater floor, and stretching for about 15 km. The northern wall of the crater is in the background. Sand and soil grains have faces that can cause friction as they roll and slide against each other, or even cause sticking and form small voids between grains. This complex behavior can cause soil to behave like a liquid under certain conditions such as earthquakes or when powders are handled in industrial processes. MGM experiments aboard the Space Shuttle use the microgravity of space to simulate this behavior under conditions that carnot be achieved in laboratory tests on Earth. MGM is shedding light on the behavior of fine-grain materials under low effective stresses. Applications include earthquake engineering, granular flow technologies (such as powder feed systems for pharmaceuticals and fertilizers), and terrestrial and planetary geology. Nine MGM specimens have flown on two Space Shuttle flights. Another three are scheduled to fly on STS-107. The principal investigator is Stein Sture of the University of Colorado at Boulder. (Credit: University of Colorado at Boulder).
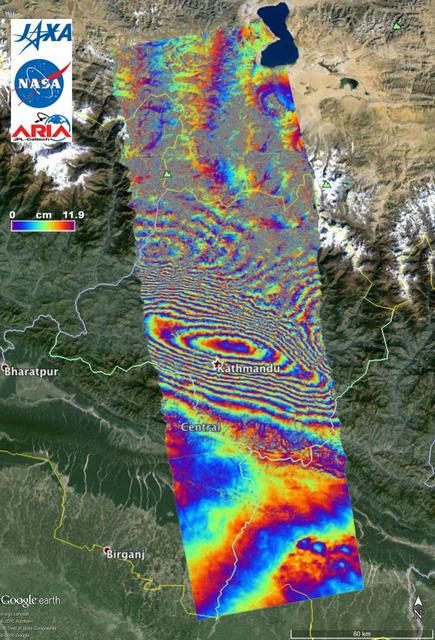
NASA and its partners are contributing important observations and expertise to the ongoing response to the April 25, 2015, magnitude 7.8 Gorkha earthquake in Nepal. The quake was the strongest to occur in that area since the 1934 Nepal-Bihar magnitude 8.0 event and caused significant regional damage and a humanitarian crisis. Scientists with the Advanced Rapid Imaging and Analysis project (ARIA), a collaboration between NASA's Jet Propulsion Laboratory, Pasadena, California, and the California Institute of Technology in Pasadena, analyzed interferometric synthetic aperture radar images from the PALSAR-2 instrument on the ALOS-2 satellite operated by the Japan Aerospace Exploration Agency (JAXA) to calculate a map of the deformation of Earth's surface caused by the quake. This false-color map shows the amount of permanent surface movement caused almost entirely by the earthquake, as viewed by the satellite, during a 70-day interval between two ALOS-2 images, acquired February 21 and May 2, 2015. In the map, surface displacements are seen as color contours (or "fringes"), where each color cycle represents 4.7 inches (11.9 centimeters) of surface motion. The contours show the land around Kathmandu has moved toward the satellite by up to 4.6 feet (1.4 meter), or 5.2 feet (1.6 meters) if we assume purely vertical motion. Areas without the color contours have snow or heavy vegetation that affects the radar measurements. Scientists use these maps to build detailed models of the fault and associated land movements to better understand the impact on future earthquake activity. The PALSAR-2 data were provided by JAXA through the Committee on Earth Observation Satellite (CEOS) in support of the response effort. The background image is from Google Earth. http://photojournal.jpl.nasa.gov/catalog/PIA19383
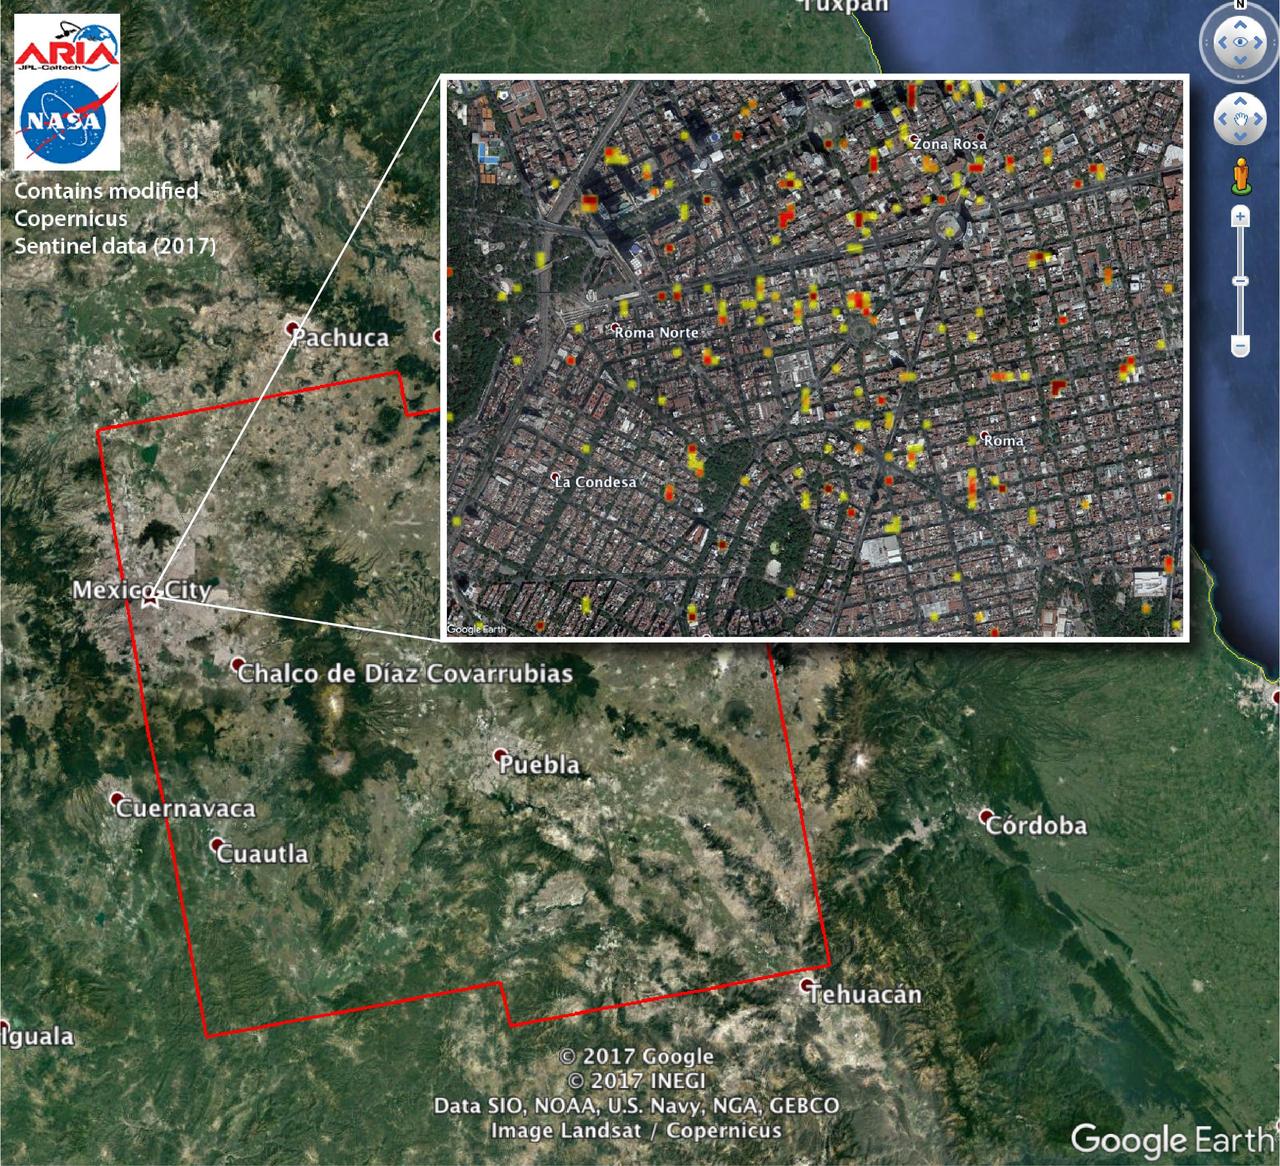
The Advanced Rapid Imaging and Analysis (ARIA) team at NASA's Jet Propulsion Laboratory in Pasadena, California, and Caltech, also in Pasadena, created this Damage Proxy Map (DPM) depicting areas of Central Mexico, including Mexico City, that are likely damaged (shown by red and yellow pixels) from the magnitude 7.1 Raboso earthquake of Sept. 19, 2017 (local time). The map is derived from synthetic aperture radar (SAR) images from the Copernicus Sentinel-1A and Sentinel-1B satellites, operated by the European Space Agency (ESA). The images were taken before (Sept. 8, 2017) and after (Sept. 20, 2017) the earthquake. The map covers an area of 109 by 106 miles (175 by 170 kilometers). Each pixel measures about 33 yards (30 meters) across. The color variation from yellow to red indicates increasingly more significant ground and building surface change. Preliminary validation was done by comparing the DPM to a crowd-sourced Google Map (https://www.google.com/maps/d/u/0/viewer?mid=1_-V97lbdgLFHpx-CtqhLWlJAnYY&ll=19.41452166501326%2C-99.16498240436704&z=16). This damage proxy map should be used as guidance to identify damaged areas, and may be less reliable over vegetated areas. Sentinel-1 data were accessed through the Copernicus Open Access Hub. The image contains modified Copernicus Sentinel data (2017), processed by ESA and analyzed by the NASA-JPL/Caltech ARIA team. This research was carried out at JPL under contract with NASA. https://photojournal.jpl.nasa.gov/catalog/PIA21963
This image from NASA Terra spacecraft shows where a magnitude 7.2 earthquake struck in Mexico Baja, California at shallow depth along the principal plate boundary between the North American and Pacific plates on April 4, 2010.
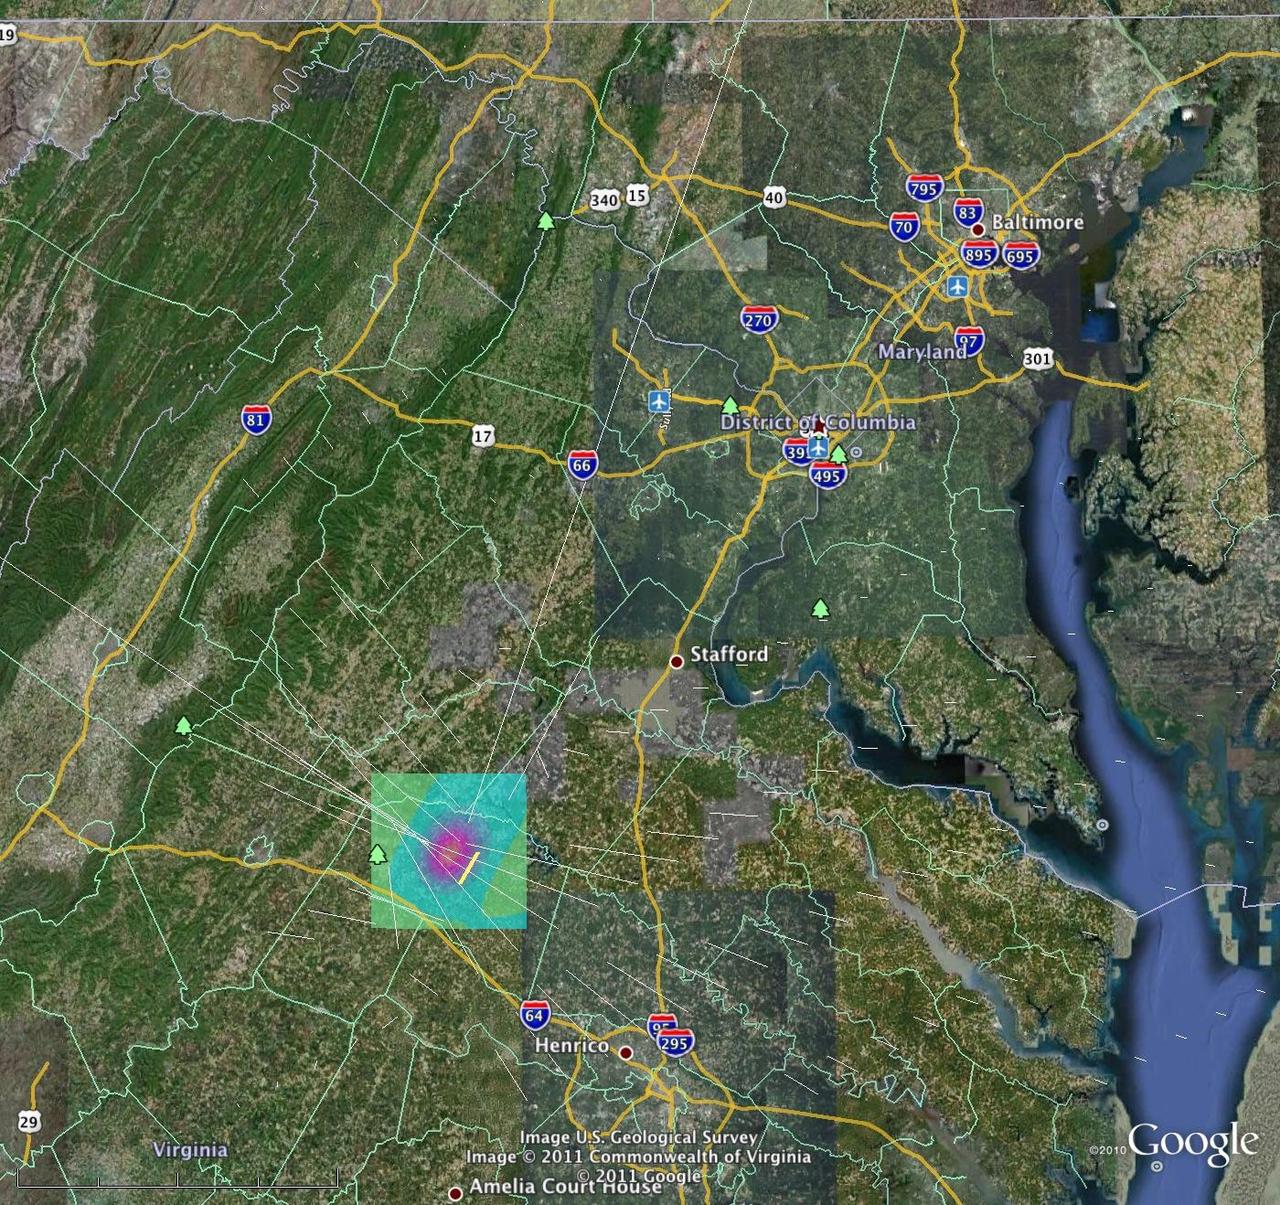
A magnitude 5.8 earthquake in Mineral, Va. was widely felt up and down the East Coast of the United States. This computer model is a QuakeSim model image overlaid on a Google Earth image.
The Advanced Rapid Imaging and Analysis (ARIA) team at NASA's Jet Propulsion Laboratory in Pasadena, California, and Caltech, also in Pasadena, created this Damage Proxy Map (DPM) depicting areas of Southern Mexico that are likely damaged (shown by red and yellow pixels) from the magnitude 8.1 Chiapas earthquake of Sept. 7, 2017 (near midnight local time, early morning on Sept. 8 UTC). The map is derived from synthetic aperture radar (SAR) images from the Copernicus Sentinel-1A and Sentinel-1B satellites, operated by the European Space Agency (ESA). The images were taken before (Sept. 7, 2017 UTC) and after (Sept. 13, 2017 UTC) the earthquake. The map covers an area of 155 by 106 miles (250 by 170 kilometers). Each pixel measures about 33 yards (30 meters) across. The color variation from yellow to red indicates increasingly more significant ground surface change. Preliminary validation was done by comparing the SAR images to optical satellite imagery from DigitalGlobe. This damage proxy map should be used as guidance to identify damaged areas, and may be less reliable over vegetated areas. Sentinel-1 data were accessed through the Copernicus Open Access Hub. The image contains modified Copernicus Sentinel data (2017), processed by ESA and analyzed by the NASA-JPL/Caltech ARIA team. This research was carried out at JPL under a contract with NASA. https://photojournal.jpl.nasa.gov/catalog/PIA21956
The earthquake that struck western India on January 26, 2001, was the country strongest in the past 50 years. This perspective view shows the area of the earthquake epicenter in the lower left corner.
This image shows the area around the January 26, 2001, earthquake in western India, the deadliest in the country history with some 20,000 fatalities. The epicenter of the magnitude 7.6 earthquake was just to the left of the center of the image.
On Oct. 23, 2011, a magnitude 7.2 earthquake struck eastern Turkey, near the city of Van, the result of the collision between the Arabian and Eurasian tectonic plates. Turkey is a tectonically active country, experiencing frequent devastating earthquakes.
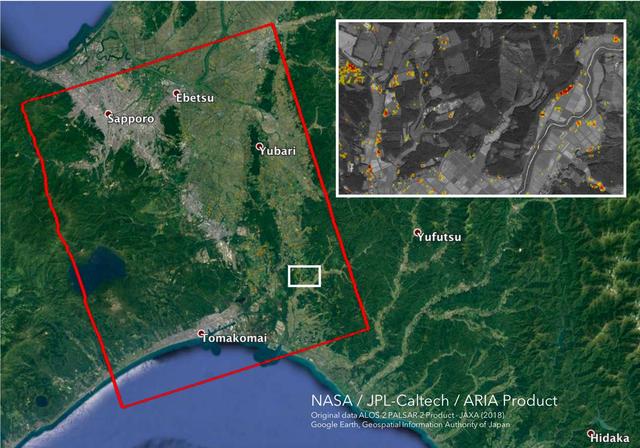
The Advanced Rapid Imaging and Analysis (ARIA) team at NASA's Jet Propulsion Laboratory in Pasadena, California, and Caltech, also in Pasadena, created this Damage Proxy Map (DPM) depicting areas in the southwestern part of Hokkaido, Japan, that are likely damaged as a result of the M6.6 September 5 earthquake in 2018 (shown by red and yellow pixels). The map is derived from synthetic aperture radar (SAR) images from the ALOS-2 satellites, operated by Japan Aerospace Exploration Agency (JAXA). The images were taken before and after the earthquake -- August 23 and September 6, respectively. The map covers an area of 70 by 57 kilometers, shown by the large red polygon. Each pixel measures about 30 meters across. The color variation from yellow to red indicates increasingly more significant ground surface change. Preliminary validation was done by comparing with the high-resolution airborne optical imagery provided by the Geospatial Information Authority of Japan. This damage proxy map should be used as guidance to identify damaged areas, and may be less reliable over vegetated areas. For example, pixels over vegetated areas and farmlands may be false positives, and the lack of colored pixels over vegetated areas does not necessarily mean no damage. The DPM was created by the NASA-JPL/Caltech ARIA team, and the ALOS-2 data were provided by JAXA. The algorithm development was carried out at JPL under a contract with NASA. https://photojournal.jpl.nasa.gov/catalog/PIA22696
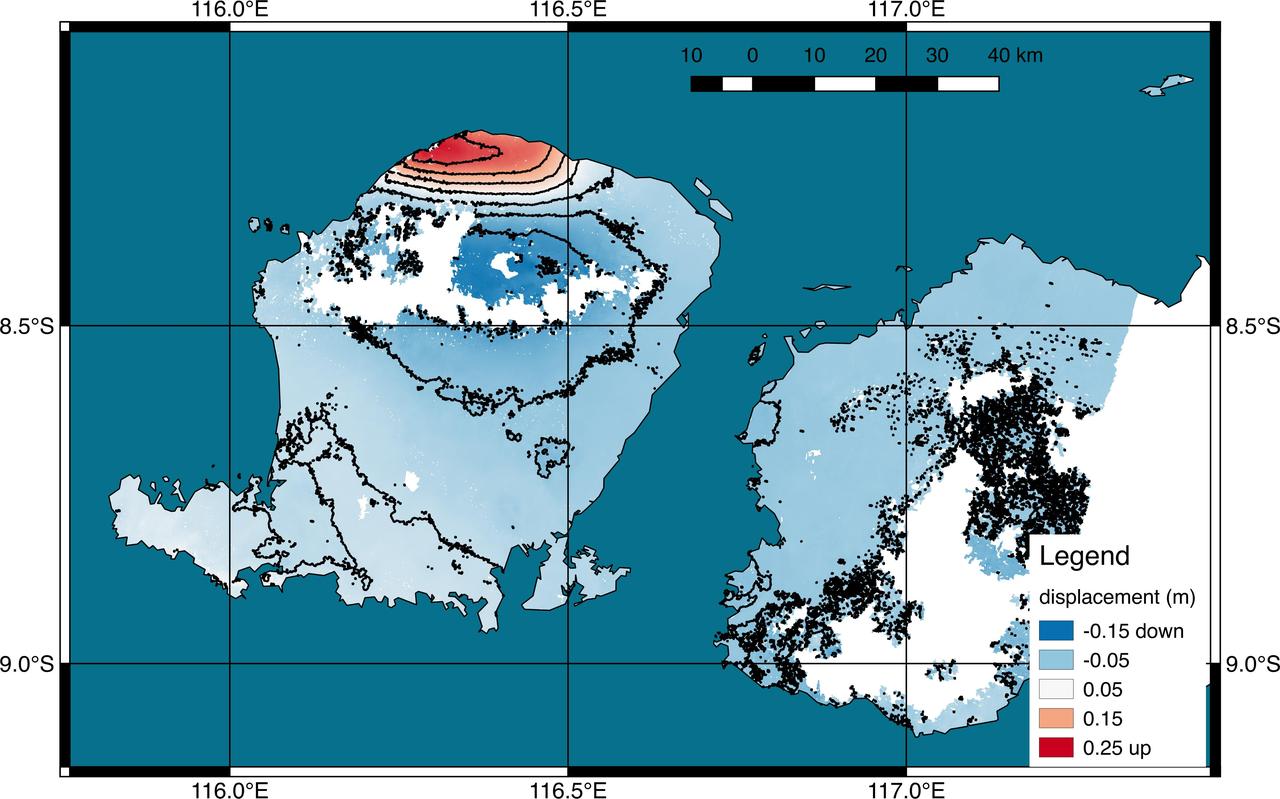
Scientists with the Advanced Rapid Imaging and Analysis project (ARIA), a collaboration between NASA's Jet Propulsion Laboratory in Pasadena, California, and Caltech, also in Pasadena, used synthetic aperture radar (SAR) data from the European Union's Copernicus Sentinel-1A and -1B satellites, operated by the European Space Agency. They generated a map of the deformation of Earth's surface caused by the Aug. 5, 2018 magnitude 6.9 earthquake under Lombok island, Indonesia. The deformation map is produced from automated interferometric processing of the SAR data using the JPL-Caltech ARIA data system in response to a signal received from the U.S. Geological Survey. The false-color map shows the amount of permanent surface movement that occurred almost entirely due to the quake, as viewed by the satellite, during a 6-day interval between two Sentinel-1 images acquired on July 30 and Aug. 5, 2018. The map shows that the earthquake fault was under the northwest corner of Lombok island, probably extending offshore to the west. Through these maps, NASA and its partners are contributing observations and expertise that can assist with response to earthquakes and other natural or human-produced hazards. From the pattern of deformation in the map, scientists have determined that the earthquake fault slip was on a fault beneath the northwestern part of Lombok Island and caused as much as 10 inches (25 centimeters) of uplift of the ground surface. The map depicts motion towards the satellite (up and west) in the direction of the radar's line-of-sight, with contours every 2 inches (5 centimeters). White areas are places where the radar measurement was not possible, largely due to dense forests in the middle of the islands. https://photojournal.jpl.nasa.gov/catalog/PIA22491
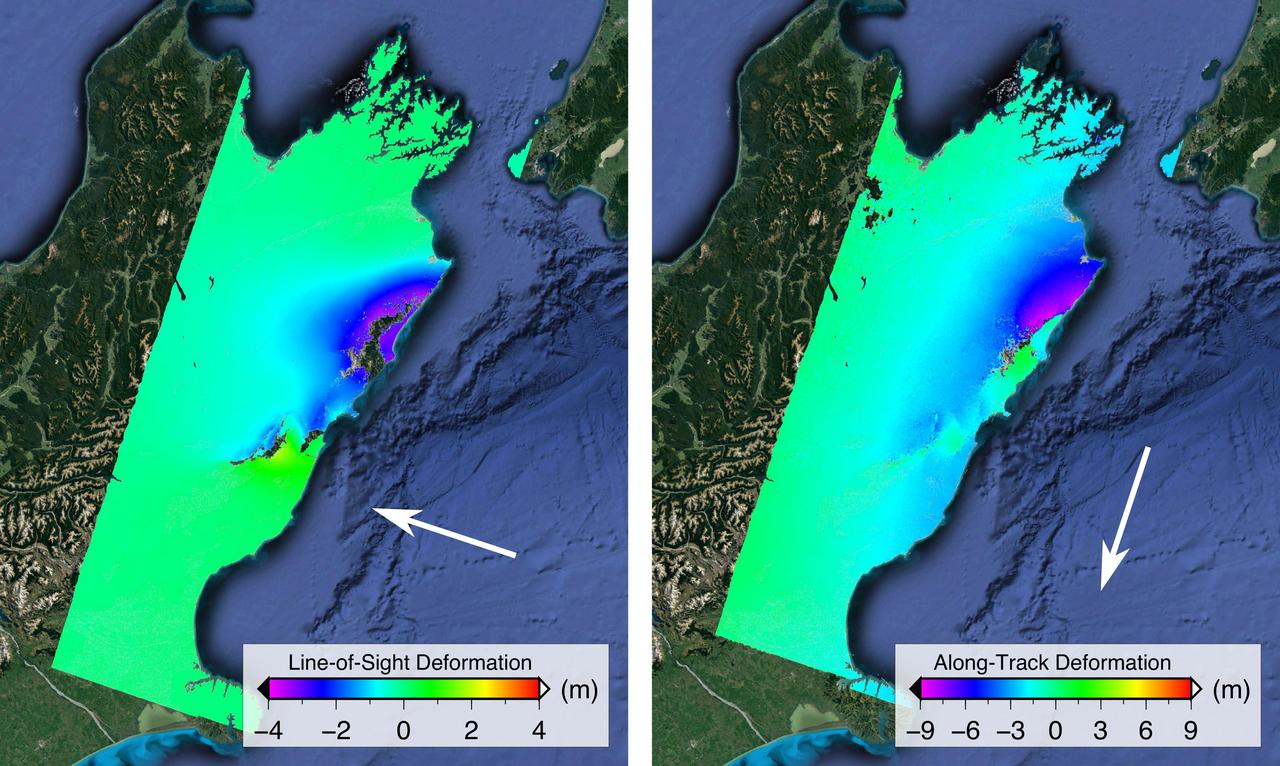
NASA and its partners are contributing important observations and expertise to the ongoing response to the Nov. 14, 2016, magnitude 7.8 Kaikoura earthquake in New Zealand. This shallow earthquake was so complex and unusual, it is likely to change how scientists think about earthquake hazards in plate boundary zones around the world. Scientists with the Advanced Rapid Imaging and Analysis project (ARIA), a collaboration between NASA's Jet Propulsion Laboratory, Pasadena, California, and Caltech in Pasadena, analyzed interferometric synthetic aperture radar images from the PALSAR-2 instrument on the ALOS-2 satellite operated by the Japan Aerospace Exploration Agency (JAXA) to calculate maps of the deformation of Earth's surface caused by the quake. Two maps show motion of the surface in two different directions. Each false-color map shows the amount of permanent surface movement caused almost entirely by the earthquake, as viewed by the satellite, during a 28-day interval between two ALOS-2 wide-swath images acquired on Oct. 18 and Nov. 15, 2016. In these two new maps made from the wide-swath images, the colors of the surface displacements are proportional to the surface motion. The wide-swath images cover the entire 106-mile (170-kilometer) length of the complex set of earthquake ruptures. The arrows show the direction of the radar motion measurement. In the left image, the blue and purple tones show the areas where the land around the Kaikoura peninsula in the Marlborough region of New Zealand's South Island has moved toward the satellite by up to 13.2 feet (4 meters), both eastward and upward. In the right image, the blue and purple tones show the areas that moved to the north by up to 30 feet (9 meters) and green tones show the area that moved to the south. The sharp line of color change is across the Kekerengu Fault, which had the largest amount of motion in the earthquake. Field studies found maximum rupture at the surface was measured at 39 feet (12 meters) of horizontal displacement. Several other faults have sharp color changes due to smaller amounts of motion, with a total of at least 12 faults rupturing in this single large earthquake. Areas without color have snow, heavy vegetation or open water that prevents the radar measurements from being coherent between satellite images – a required condition to measure ground displacement. Scientists use these maps to build detailed models of the fault slip at depth and associated land movements to better understand the impact on future earthquake activity. The PALSAR-2 data were provided by JAXA through the Committee on Earth Observation Satellites (CEOS) and through scientific research projects. The background image is from Google Earth. http://photojournal.jpl.nasa.gov/catalog/PIA21210
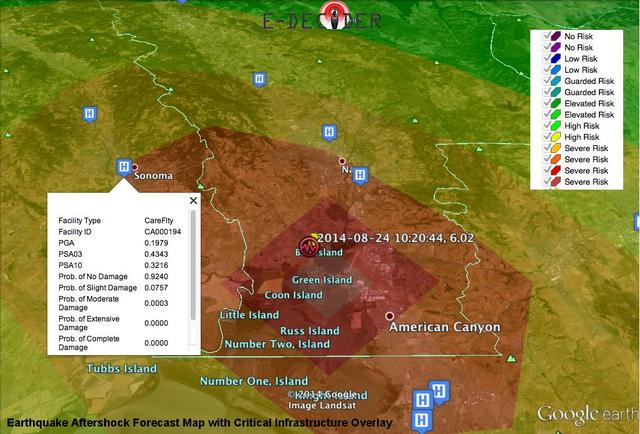
A NASA-funded disaster decision support system, provided a number of rapid response map data products to decision makers at the California Earthquake Clearinghouse following its activation for the Aug. 24, 2014 magnitude 6.0 earthquake in Napa, California
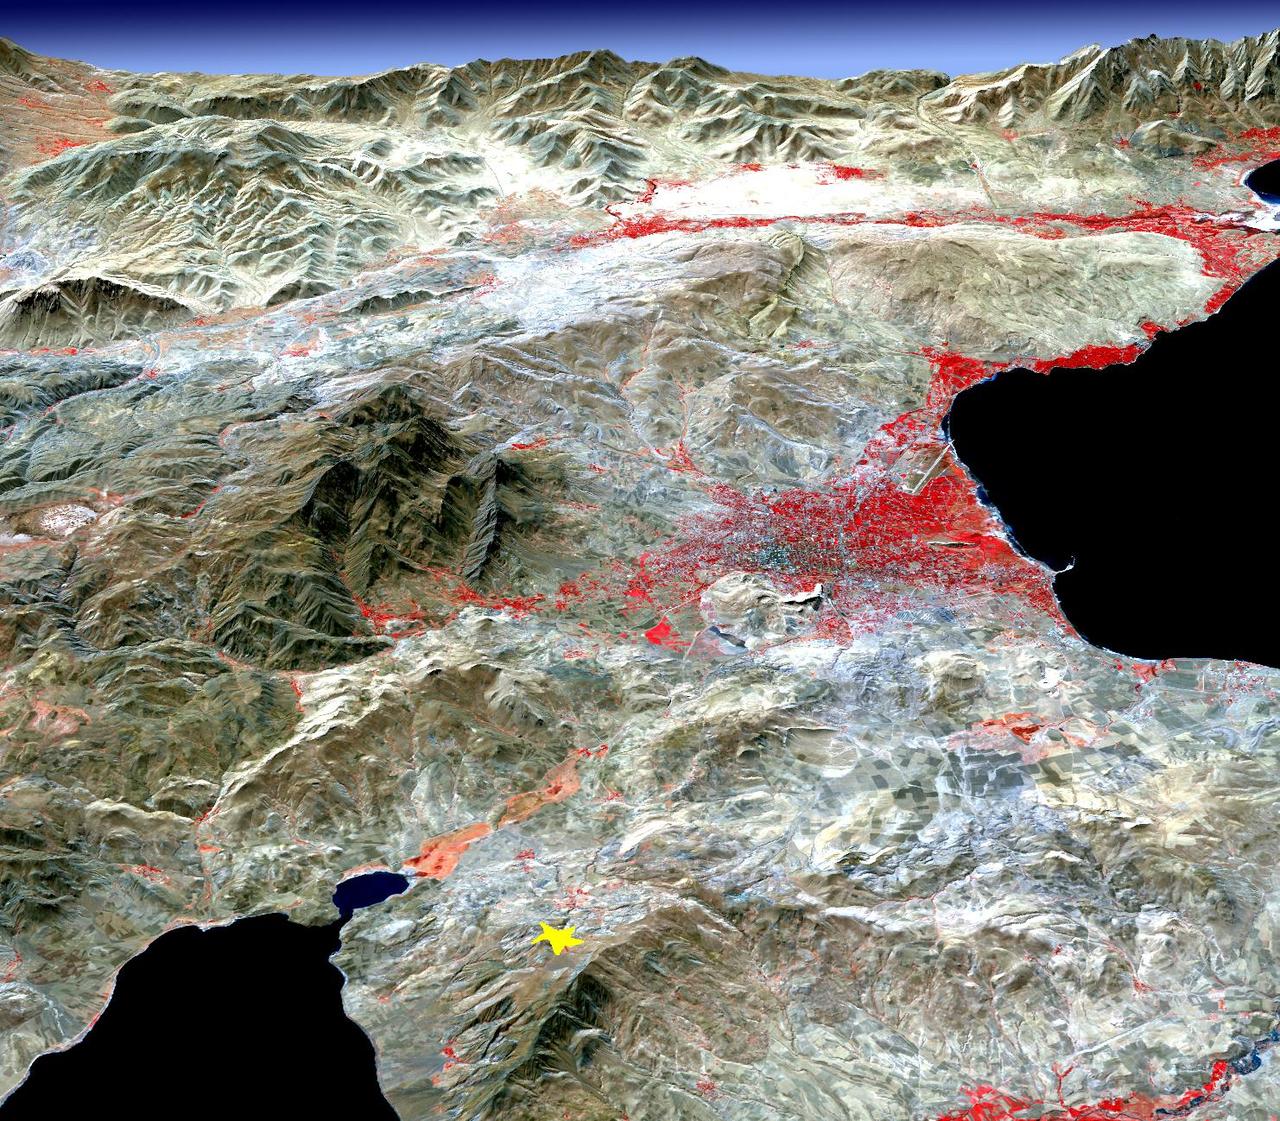
The San Fernando Valley lower right of center is part of Los Angeles and includes well over one million people. Two major disasters have occurred here in the last few decades: the 1971 Sylmar earthquake and the 1994 Northridge earthquake.
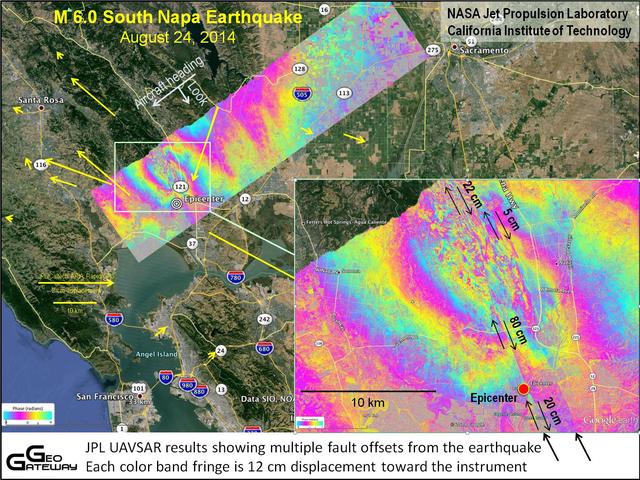
NASA UAVSAR studies ground deformation after a magnitude 6.0 South Napa earthquake on August 24, 2014.

This poster highlights NASA JPL missions that provide important inputs to research on volcanoes, fires, earthquakes, droughts, tsunamis, floods and hurricanes.

NASA data and expertise are providing valuable information for the ongoing response to the April 25, 2015, magnitude 7.8 Gorkha earthquake in Nepal.
On January 26, 2001 the Kachchh region in western India suffered the most deadly earthquake in India history.
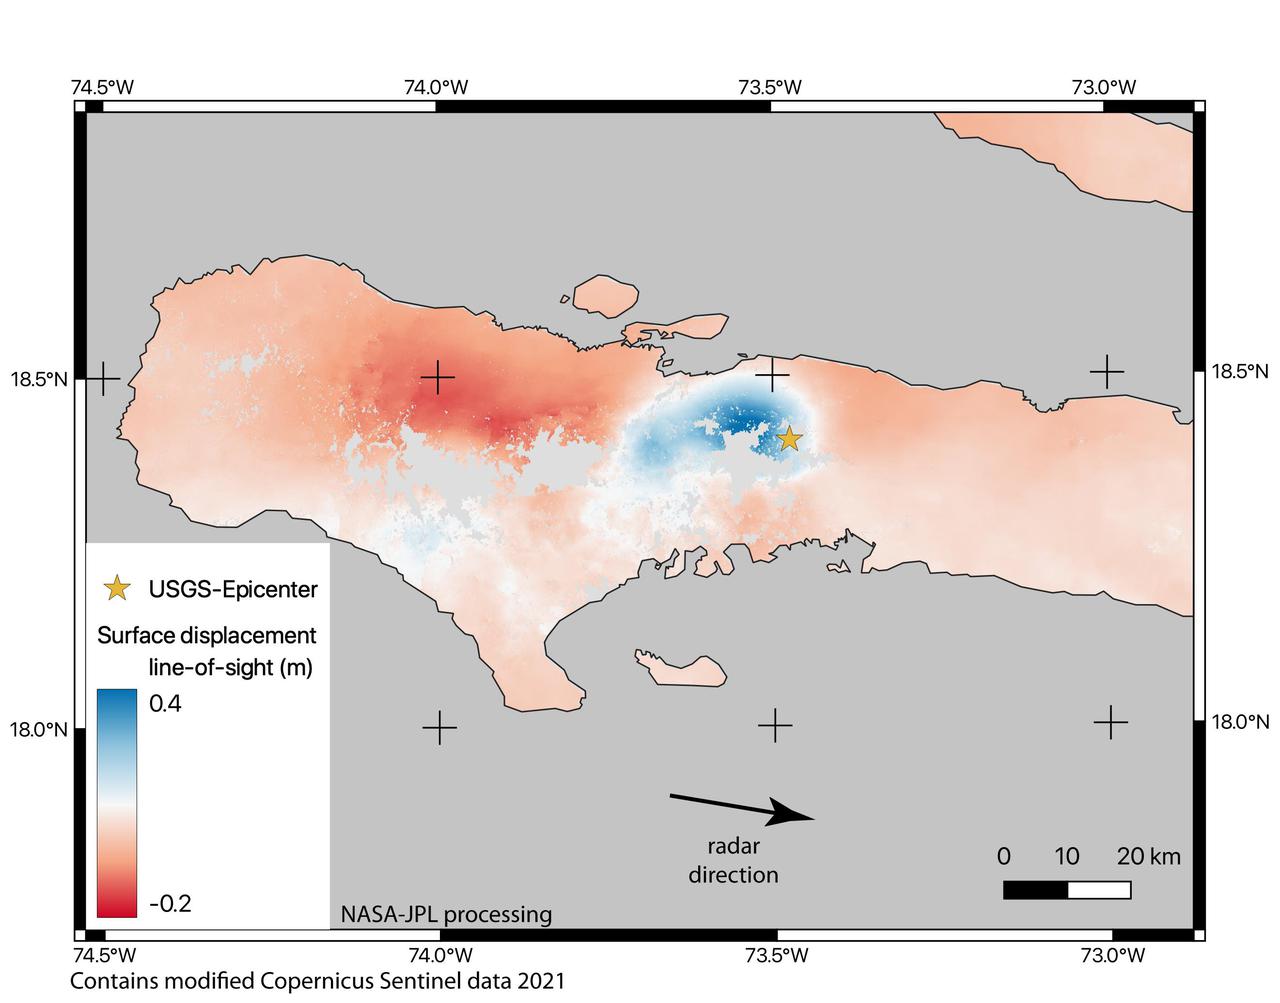
On August 14, 2021, a magnitude 7.2 earthquake struck western Haiti causing widespread damage and loss of life, and triggering landslides throughout the region. Scientists with the Advanced Rapid Imaging and Analysis project (ARIA), a collaboration between NASA's Jet Propulsion Laboratory and the California Institute of Technology analyzed interferometric synthetic aperture radar images from the Copernicus Sentinel-1A satellite operated by the European Space Agency (ESA) to calculate a map of the deformation of Earth's surface caused by the quake. Using images acquired before and after the earthquake – August 3 and 15, 2021, respectively – scientists produced this false-color map showing the amount of permanent surface movement the quake caused. Areas in blue moved toward the satellite by as much as 16 inches (50 centimeters) in a combination of up and eastward motion. These blue areas are close to the epicenter – marked with the orange star – indicating that there was likely a large slip on the fault beneath them. The areas to the west – shown with various shades of red – moved away from the satellite, mostly downward or westward, by as much as 8 inches (20 cm). The two areas of significant ground movement (darker red and blue) are both west of the epicenter and indicate the fault rupture proceeded westward from its starting point. Areas with gray are open water or heavy vegetation that prevents the instrument from measuring change between satellite images. Scientists use these maps to build detailed models of the fault slip at depth and associated land movements to better understand the impact on future earthquake activity. https://photojournal.jpl.nasa.gov/catalog/PIA23697
NASA Shuttle Radar Topography Mission imaged Sendai, the capital city of Japan Miyagi Prefecture a magnitude 8.9 earthquake struck offshore on Mar. 11. 2011.
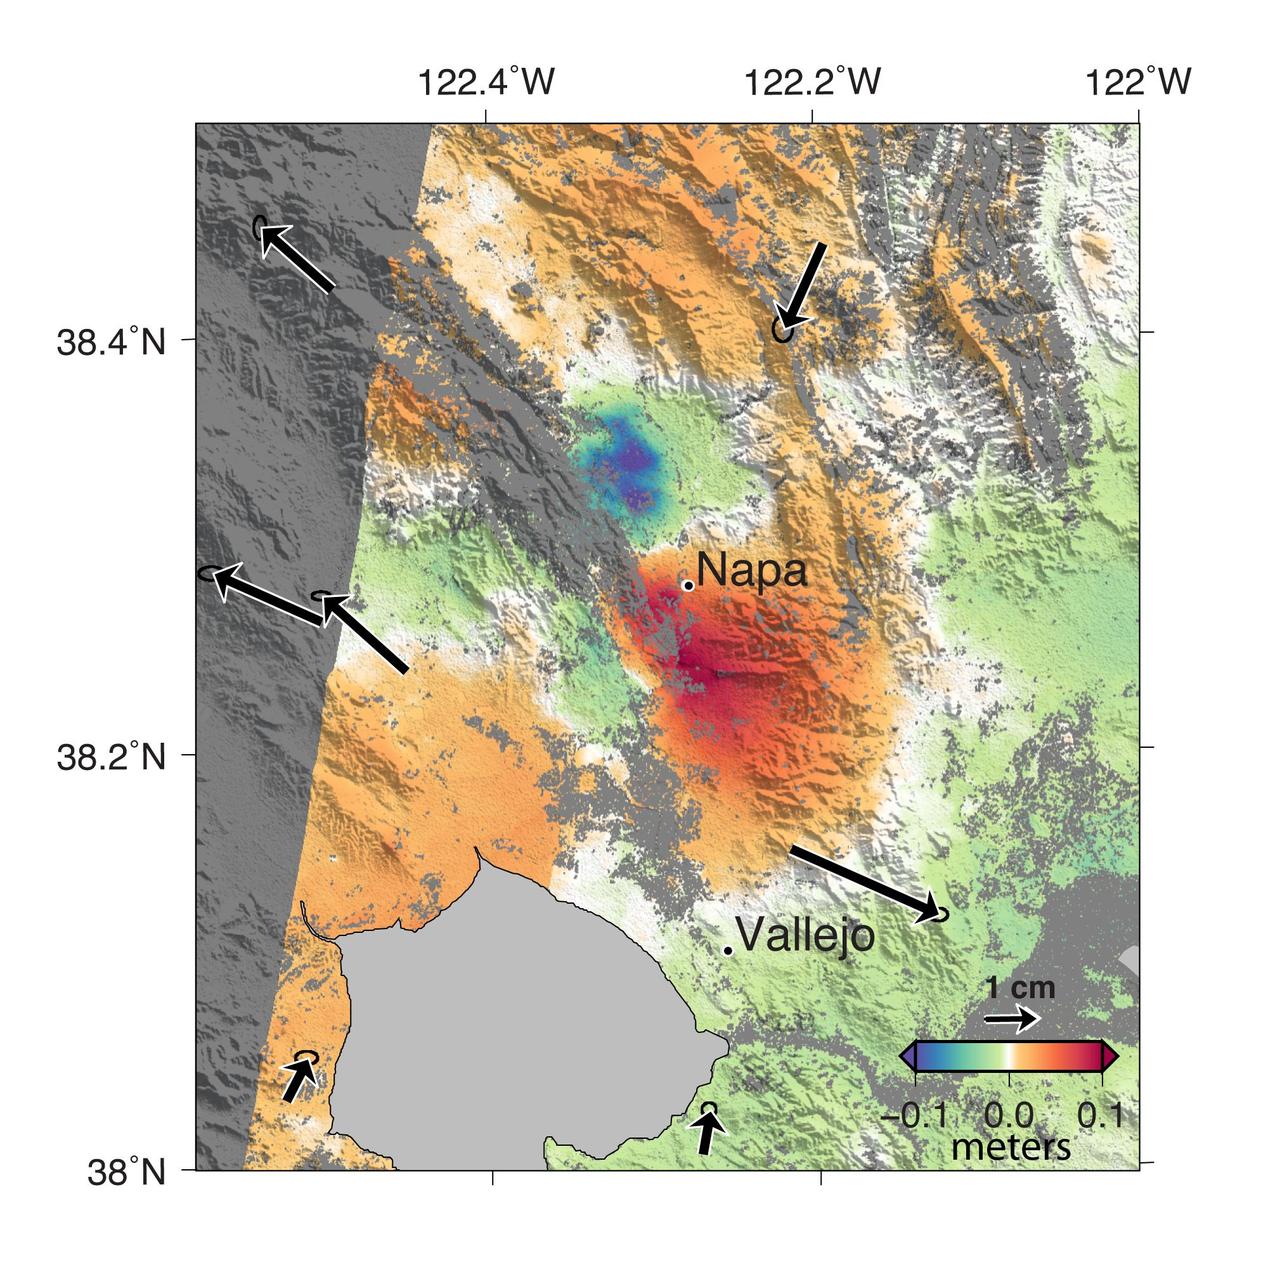
A magnitude 6.0 earthquake struck southern Napa county northeast of San Francisco, California, on Aug. 24, 2014. NASA satellite data reveal ground defomation.
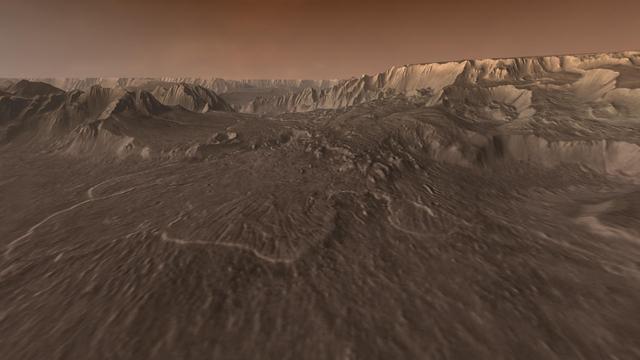
Ages ago, a giant earthquake shook the walls of Valles Marineris, the Grand Canyon of Mars, and triggered a catastrophic landslide that crashed down 15,000 feet.
On 26 December 2004, a magnitude 9.0 earthquake occurred off the west coast of Sumatra, Indonesia. These views were acquired by NASA Terra spacecraft.
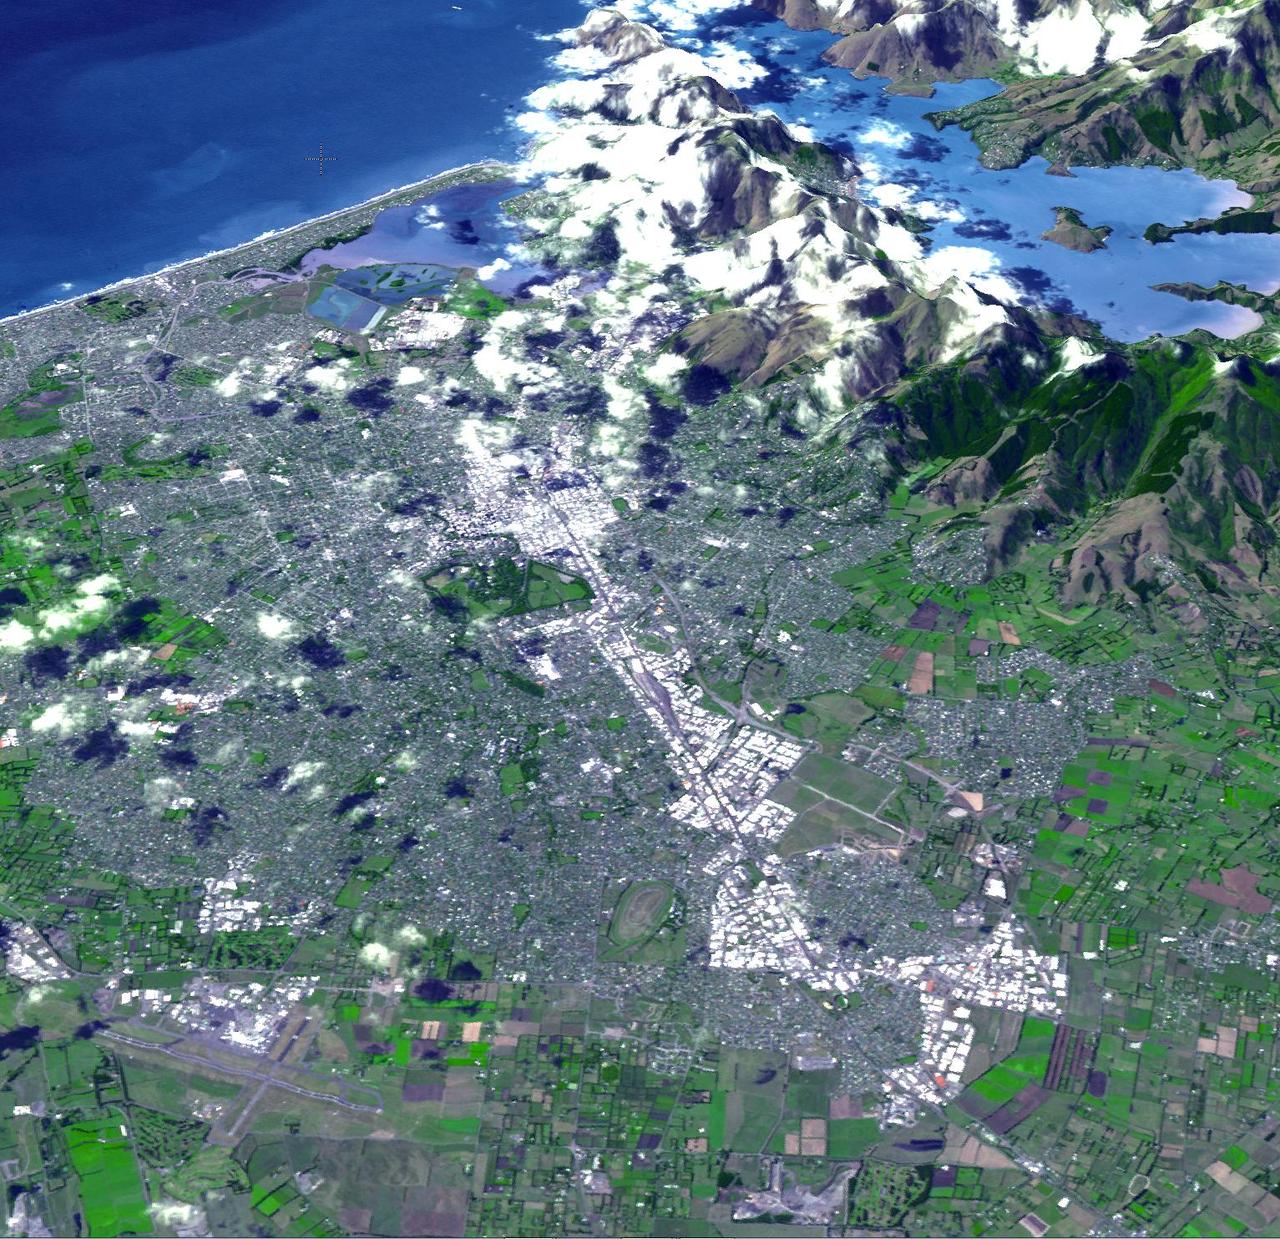
On Feb. 23, 2011, NASA Terra spacecraft imaged the Christchurch region on New Zealand South Island; this region was rocked by a powerful magnitude 6.3 earthquake.

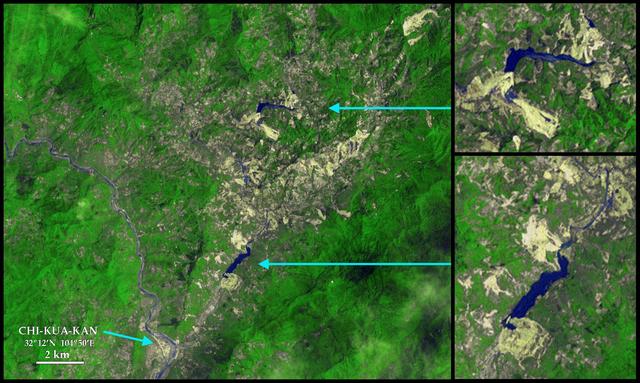
This image from NASA Terra spacecraft highlights the epicenter of a powerful magnitude 6.6 earthquake which struck Sichuan Province in southwest China on April 20, 2013. Vegetation is displayed in red; clouds and snow are in white.

This radar image from NASA Uninhabited Aerial Vehicle Synthetic Aperture Radar UAVSAR shows the deformed Earth caused by a 7.2 earthquake in Mexico state of Baja California in 2010.
On January 26, 2001, the Kachchh region in western India suffered the most deadly earthquake in India history. Geologists traversed the region looking for ground surface disruptions, that could provide clues to the tectonic processes here.

This image, acquired by NASA Terra spacecraft, shows the epicenter of a magnitude 7.7 earthquake which struck south-central Pakistan on Sept. 24, 2013, in Pakistan Makran fold belt.
The extent of inundation from the destructive and deadly tsunami triggered by the March 11, 2011, magnitude 8.9 earthquake centered off Japan northeastern coast east of the city of Sendai is revealed in this image pair from NASA Terra spacecraft.
This image acquired by NASA Terra spacecraft on Oct. 11, 2005, depicts a 30-kilometer 19-mile wide region southeast of the epicenter of the magnitude 7.6 Pakistan earthquake, between Muzaffarabad and Uri in the Pir Punjal range of Kashmir.
The star on this image from the NASA Terra spacecraft indicates the eipcenter of a magnitude 6.1 earthquake which truck in southern China Yunnan province, toppling thousands of homes and causing numerous casualties.

This radar image from NASA Uninhabited Aerial Vehicle Synthetic Aperture Radar UAVSAR shows the deformed Earth caused by a 7.2 earthquake in Mexico state of Baja California and parts of the American Southwest on April 4, 2010.
This image, produced from instrument data aboard NASA Space Shuttle Endeavour, is a perspective view of the topography of Port-au-Prince, Haiti where a magnitude 7.0 earthquake occurred on January 12, 2010.
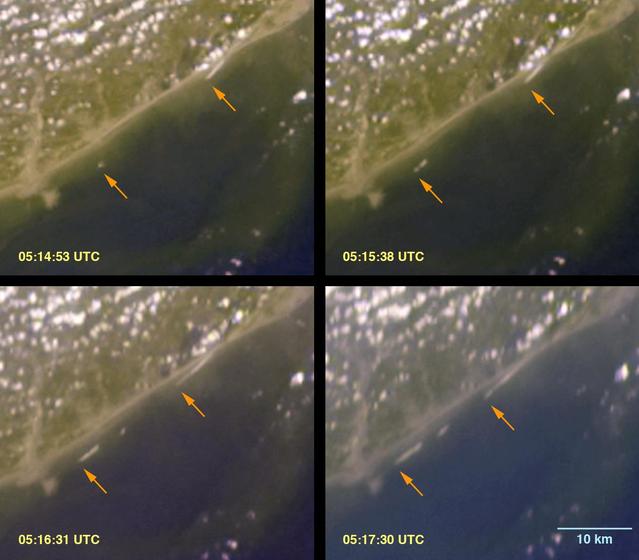
The initial tsunami waves resulting from the undersea earthquake that occurred at 00:58:53 UTC Coordinated Universal Time on 26 December 2004 off the island of Sumatra, Indonesia, as seen by NASA Terra spacecraft.
This image, produced from instrument data aboard NASA Space Shuttle Endeavour, is a perspective view of the topography of Port-au-Prince, Haiti and Hispianola. A magnitude 7.0 earthquake occurred on Haiti on January 12, 2010.
This perspective view from NASA Shuttle Radar Topography Mission of coastal Chile indicates the epicenter red marker of the 8.8 earthquake on Feb. 27, 2010, just offshore of the Maule region in the Bahia de Chanco.
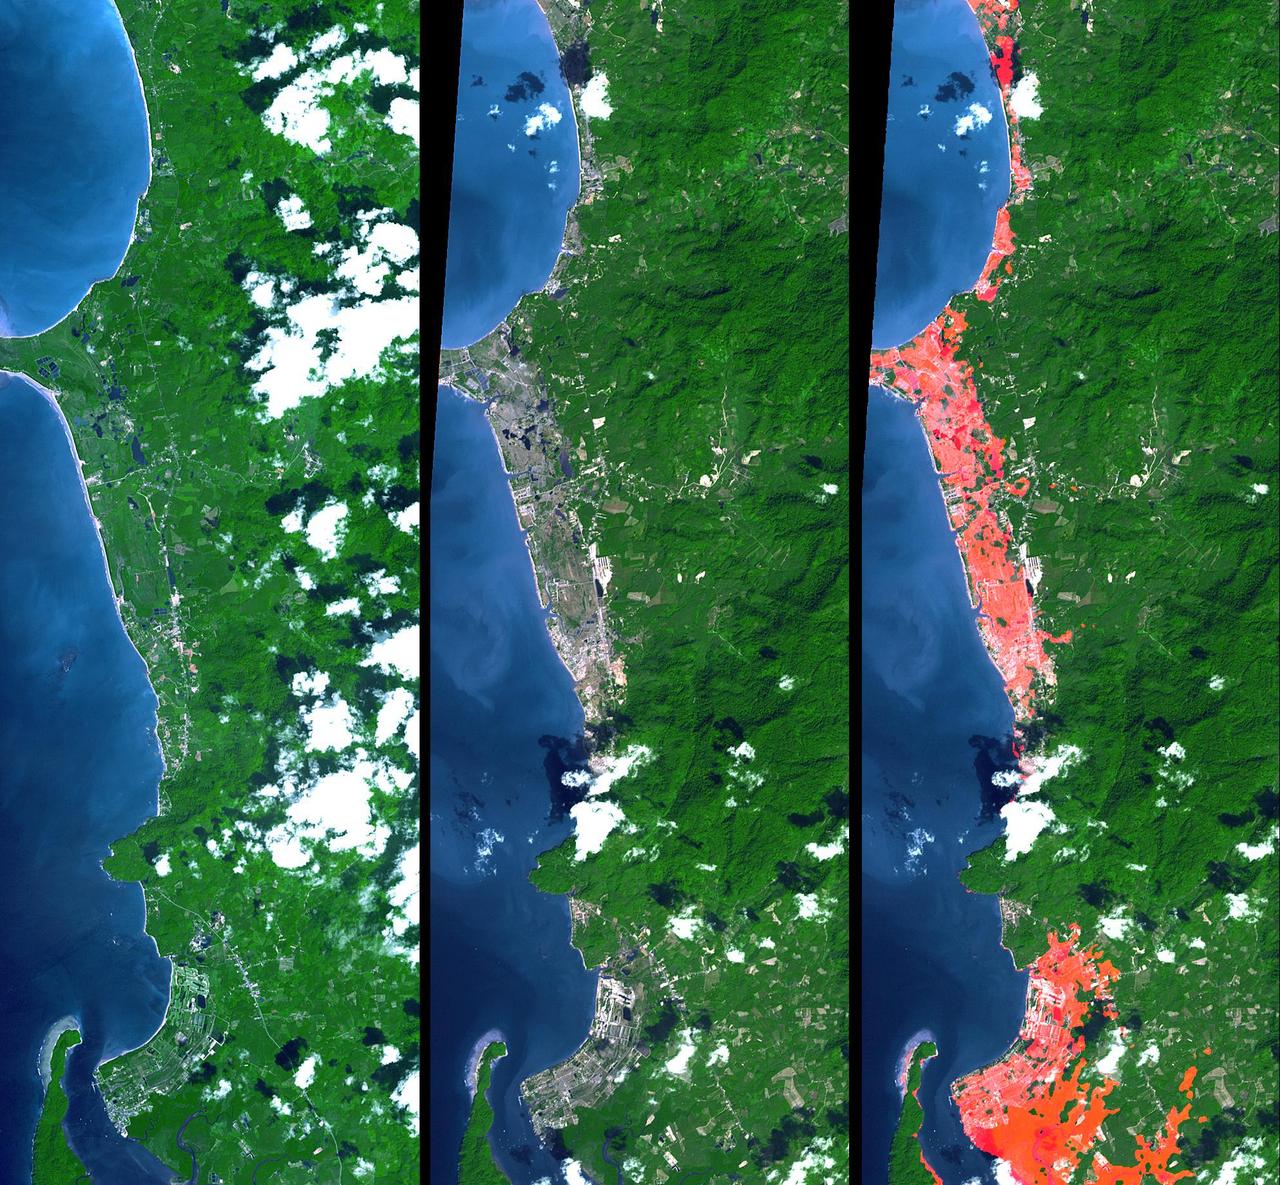
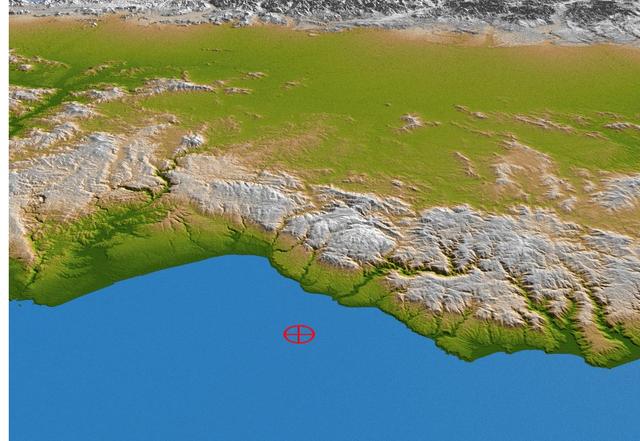
This image from NASA Terra spacecraft shows the Indian Ocean coastline north of Phuket, Thailand is a major tourist destination that was in the path of the tsunami produced by a giant offshore earthquake on December 26, 2004.
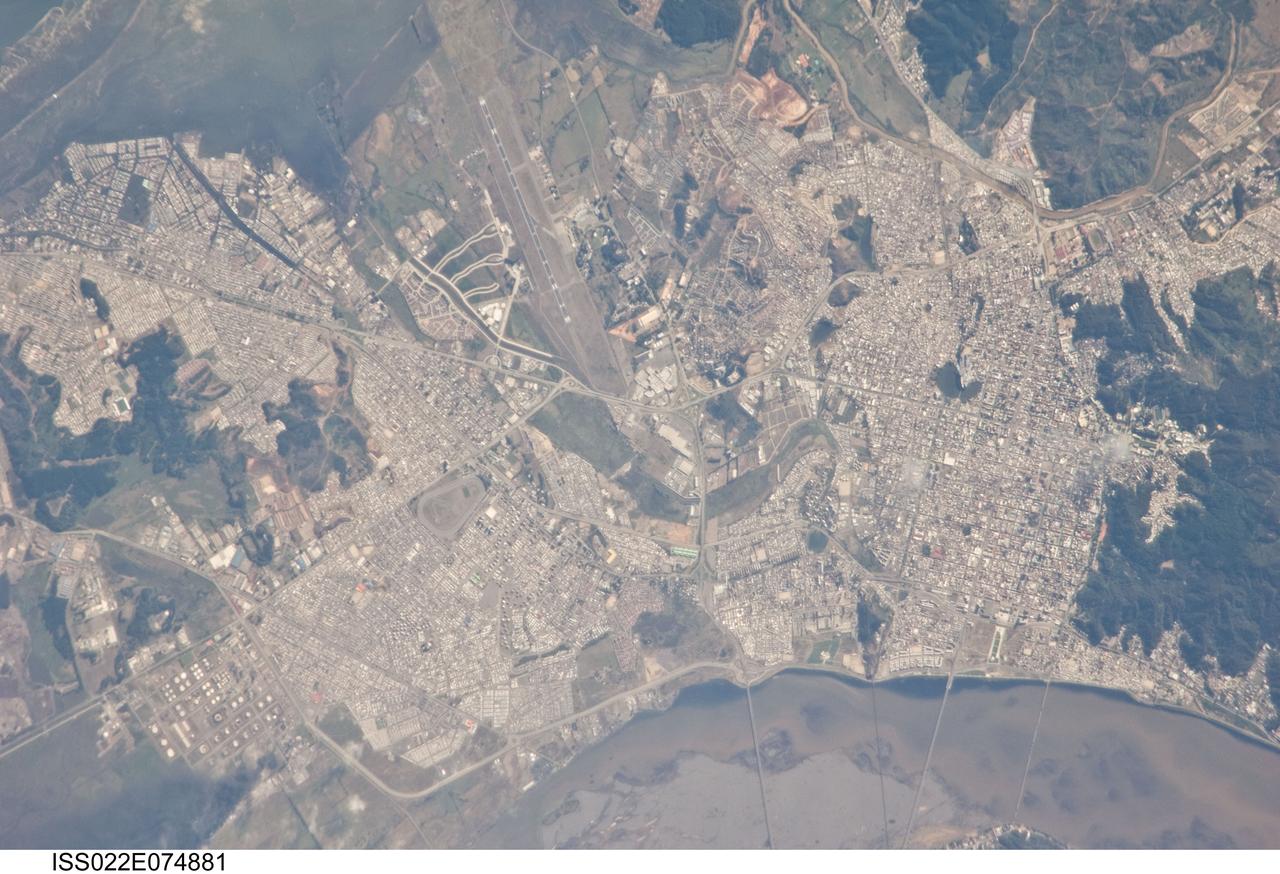
ISS022-E-074881 (27 Feb. 2010) --- Earthquake damage in Concepcion, Chile is featured in this image photographed by an Expedition 22 crew member on the International Space Station. This detailed view of the Chilean cities of Concepcion and Hualpen was acquired from the space station approximately seven hours after a magnitude 8.8 earthquake occurred offshore 115 kilometers to the north-northeast. Much of the Chilean coastline is located above the boundary between the converging Nazca and South American tectonic plates. This type of plate boundary is known as a subduction zone; such zones frequently experience moderate to strong earthquakes as one tectonic plate overrides the other. The largest earthquake worldwide during the past 200 years (magnitude 9.5 in May 1960) had a source region approximately 230 kilometers north of the Feb. 27 quake. While the image is not detailed enough to see damage to individual buildings or roadways some indicators of earthquake damage are visible. A dark smoke plume is visible at lower left near an oil refinery in Hualpen. At lower right, parts of the road bed of a single-lane bridge over the Bio-Bio River appear to have collapsed. A smaller, white smoke plume is visible at right near the Universidad de Concepcion. Smoke and haze possibly related to the earthquake was noted over Santiago, Chile in data acquired by the MODIS sensor less than one hour after this photograph was taken.
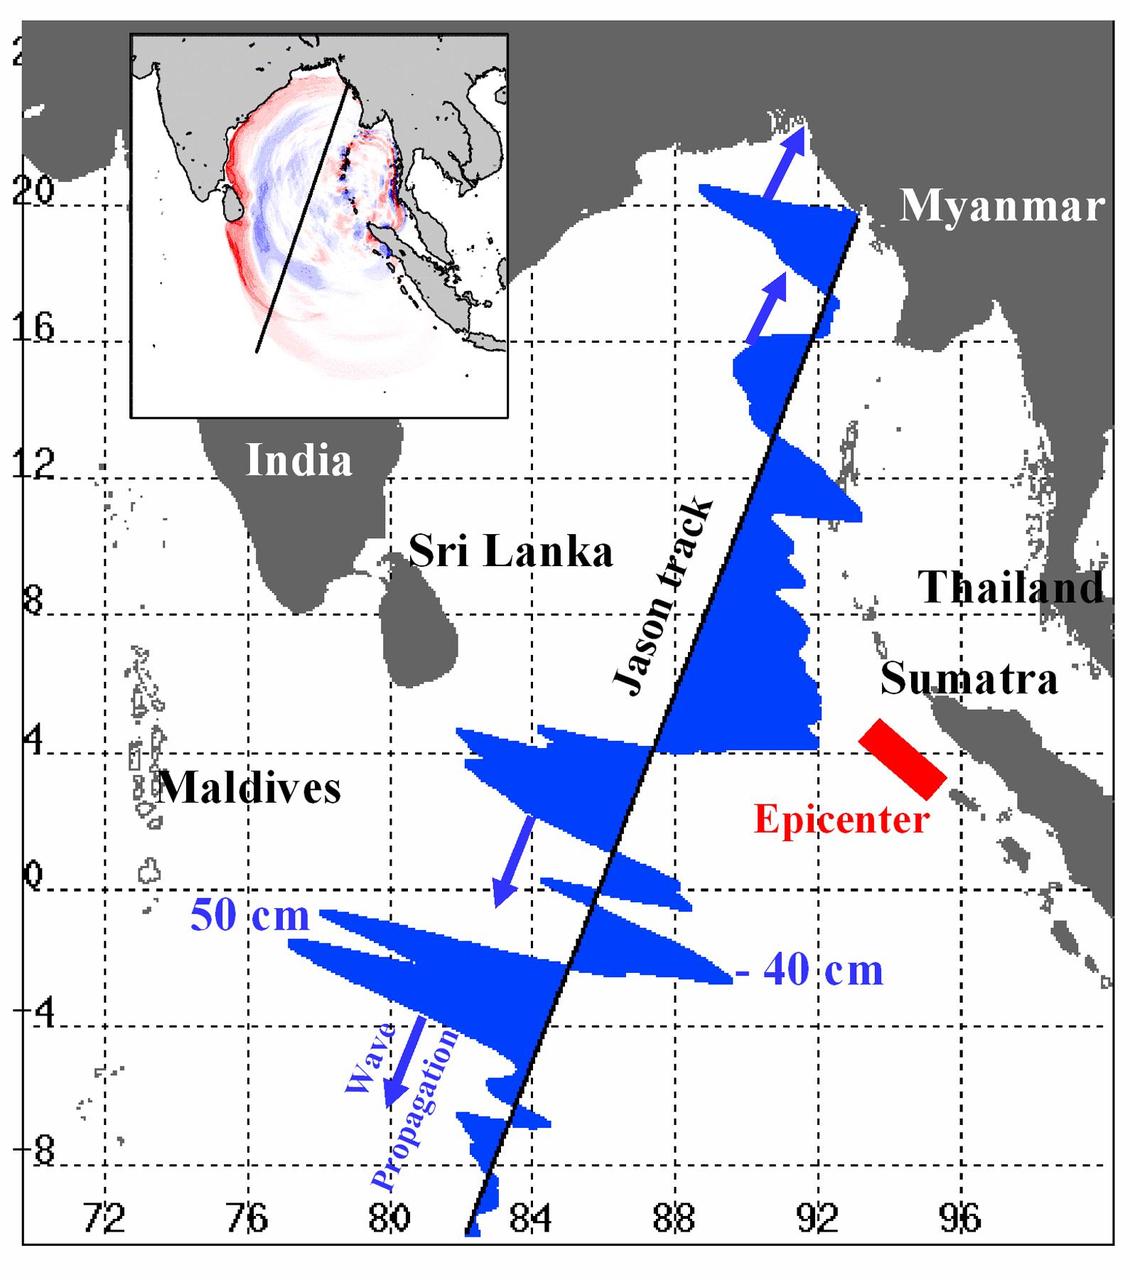
Displayed in blue color is the height of sea surface (shown in blue) measured by the Jason satellite two hours after the initial magnitude 9 earthquake hit the region (shown in red) southwest of Sumatra on December 26, 2004. The data were taken by a radar altimeter onboard the satellite along a track traversing the Indian Ocean when the tsunami waves had just filled the entire Bay of Bengal (see the model simulation inset image). The data shown are the changes of sea surface height from previous observations made along the same track 20-30 days before the earthquake, reflecting the signals of the tsunami waves. The maximum height of the leading wave crest was about 50 cm (or 1.6 ft), followed by a trough of sea surface depression of 40 cm. The directions of wave propagation along the satellite track are shown by the blue arrows. http://photojournal.jpl.nasa.gov/catalog/PIA07219
On September 24 at 11:29 GMT, a magnitude 7.7 earthquake struck in south-central Pakistan at a relatively shallow depth of 20 kilometers. The earthquake occurred as the result of oblique strike-slip motion, consistent with rupture within the Eurasian tectonic plate. Tremors were felt as far away as New Delhi as well as Karachi in Pakistan. Even though the immediate area to the epicenter is sparsely populated, the majority of houses are of mud brick construction and damage is expected to be extensive. The perspective view, looking to the east, shows the location of the epicenter in Pakistan's Makran fold belt. The image is centered near 27 degrees north latitude, 65.5 degrees east longitude, and was acquired December 13, 2012. With its 14 spectral bands from the visible to the thermal infrared wavelength region and its high spatial resolution of 15 to 90 meters (about 50 to 300 feet), ASTER images Earth to map and monitor the changing surface of our planet. ASTER is one of five Earth-observing instruments launched Dec. 18, 1999, on Terra. The instrument was built by Japan's Ministry of Economy, Trade and Industry. A joint U.S./Japan science team is responsible for validation and calibration of the instrument and data products. The broad spectral coverage and high spectral resolution of ASTER provides scientists in numerous disciplines with critical information for surface mapping and monitoring of dynamic conditions and temporal change. Example applications are: monitoring glacial advances and retreats; monitoring potentially active volcanoes; identifying crop stress; determining cloud morphology and physical properties; wetlands evaluation; thermal pollution monitoring; coral reef degradation; surface temperature mapping of soils and geology; and measuring surface heat balance. The U.S. science team is located at NASA's Jet Propulsion Laboratory, Pasadena, Calif. The Terra mission is part of NASA's Science Mission Directorate, Washington, D.C. More information about ASTER is available at <a href="http://asterweb.jpl.nasa.gov/" rel="nofollow">asterweb.jpl.nasa.gov/</a>. Image Credit: NASA/GSFC/METI/ERSDAC/JAROS, and U.S./Japan ASTER Science Team Image Addition Date: 2013-09-24 <b><a href="http://www.nasa.gov/audience/formedia/features/MP_Photo_Guidelines.html" rel="nofollow">NASA image use policy.</a></b> <b><a href="http://www.nasa.gov/centers/goddard/home/index.html" rel="nofollow">NASA Goddard Space Flight Center</a></b> enables NASA’s mission through four scientific endeavors: Earth Science, Heliophysics, Solar System Exploration, and Astrophysics. Goddard plays a leading role in NASA’s accomplishments by contributing compelling scientific knowledge to advance the Agency’s mission. <b>Follow us on <a href="http://twitter.com/NASA_GoddardPix" rel="nofollow">Twitter</a></b> <b>Like us on <a href="http://www.facebook.com/pages/Greenbelt-MD/NASA-Goddard/395013845897?ref=tsd" rel="nofollow">Facebook</a></b> <b>Find us on <a href="http://instagram.com/nasagoddard?vm=grid" rel="nofollow">Instagram</a></b>
This image acquired by NASA Terra satellite May 12, 2008, shows faults within the mountains, but near and almost parallel the mountain front, northwest of the city of Chengdu.
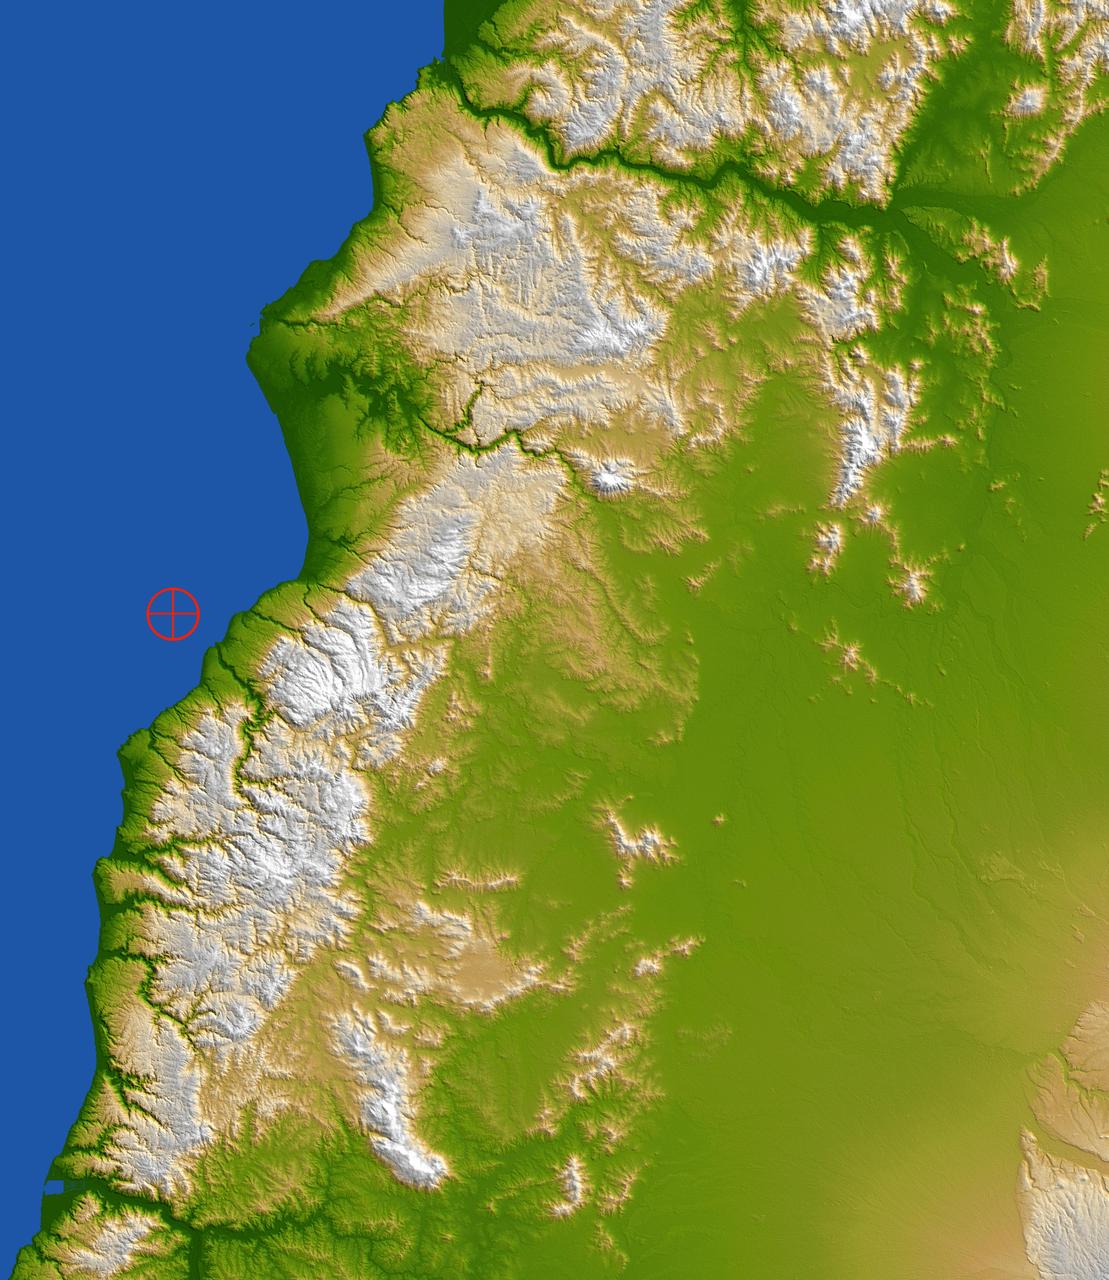
This color-coded shaded relief view from NASA Shuttle Radar Topography Mission of coastal Chile indicates the epicenter red marker of the 8.8 earthquake on Feb. 27, 2010, just offshore of the Maule region in the Bahia de Chanco.

This image, produced from instrument data aboard NASA Space Shuttle Endeavour, is a stereoscopic view of the topography of Port-au-Prince, Haiti where a magnitude 7.0 earthquake occurred on January 12, 2010. You need 3-D glasses to view this image.
This perspective view shows the city of Bhuj, India, in the foreground gray area after an earthquake in western India on January 26, 2001. This image was generated from NASA Landsat satellite and data from Shuttle Radar Topography Mission SRTM.

The Mar. 11, 2011, Tohoku, Japan earthquake and tsunami devastated a large extent of the northeastern Japan coast, and virtually erased many villages and cities from the map. NASA Terra spacecraft acquired this image of Sendai on Mar. 14, 2011.
This perspective view shows the city of Bhuj, India, in the foreground near the right side dark gray area. Bhuj and many other towns and cities nearby were almost completely destroyed by the January 26, 2001, earthquake in western India.
ISS010-E-13088 (15 January 2005) --- Tsunami damage, northwestern Sumatra (Indonesia) is featured in this image photographed by an Expedition 10 crewmember on the International Space Station. On December 26, 2004 a large (magnitude 9.0) earthquake occurred off the western coast of Sumatra in the Indian Ocean. Scientists believe the earthquake was caused by the release of stresses accumulated as the India tectonic plate is overridden by the Burma tectonic plate. Movement of the seafloor due to the earthquake generated a tsunami, or seismic sea wave, that affected coastal regions around the Indian Ocean. The northwestern Sumatra coastline in particular suffered extensive damage and loss of life. This photo, along with image ISS010-E-13079, illustrates damage along the southwestern coast of Aceh Province in the vicinity of the city of Lho’ Kruet, Indonesia. The image captures the sunglint illuminating the Indian Ocean and standing water inland (light gray). Distortion and scale differences are caused by increased obliquity of the view from the Station.
Charleston is the largest city in South Carolina, with almost 1 million people. It was founded in 1670 by the English. By 1690, it was the 5th largest city in North America. The 1699 earthquake and fire destroyed 1/3 of town. Malaria and yellow fever were endemic. The location attracted pirates. In 1860, South Carolina became the first state to declare secession from US. In 1886 a major earthquake damaged 2000 bldgs. More recently, in 1989 Hurricane Hugo devastated ¾ of homes in the historic district. The image was acquired August 15, 2023, covers an area of 18.1 by 18.6 km, and is located at 32.8 degrees north, 79.9 degrees west. https://photojournal.jpl.nasa.gov/catalog/PIA26507
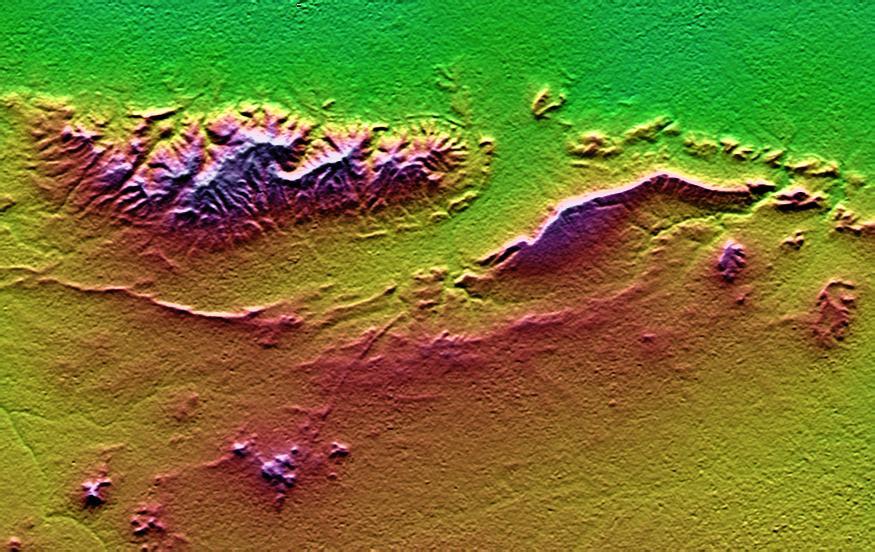
On January 26, 2001, the Kachchh region in western India suffered the most deadly earthquake in India's history. This shaded topography view of landforms northeast of the city of Bhuj depicts geologic structures that are of interest in the study the tectonic processes that may have led to that earthquake. However, preliminary field studies indicate that these structures are composed of Mesozoic rocks that are overlain by younger rocks showing little deformation. Thus these structures may be old, not actively growing, and not directly related to the recent earthquake. The Haro Hills are on the left and the Kas Hills are on the right. The Haro Hills are an "anticline," which is an upwardly convex elongated fold of layered rocks. In this view, the anticline is distinctly ringed by an erosion resistant layer of sandstone. The east-west orientation of the anticline may relate to the crustal compression that has occurred during India's northward movement toward, and collision with, Asia. In contrast, the largest of the Kas Hills appears to be a tilted (to the south) and faulted (on the north) block of layered rocks. Also seen here, the linear feature trending toward the southwest from the image center is an erosion-resistant "dike," which is an igneous intrusion into older "host" rocks along a fault plane or other crack. These features are simple examples of how shaded topography can provide a direct input to geologic studies. In this image, colors show the elevation as measured by the Shuttle Radar Topography Mission (SRTM). Colors range from green at the lowest elevations, through yellow and red, to purple at the highest elevations. Elevations here range from near sea level to about 300 meters (about 1000 feet). Shading has been added, with illumination from the north (image top). http://photojournal.jpl.nasa.gov/catalog/PIA03300
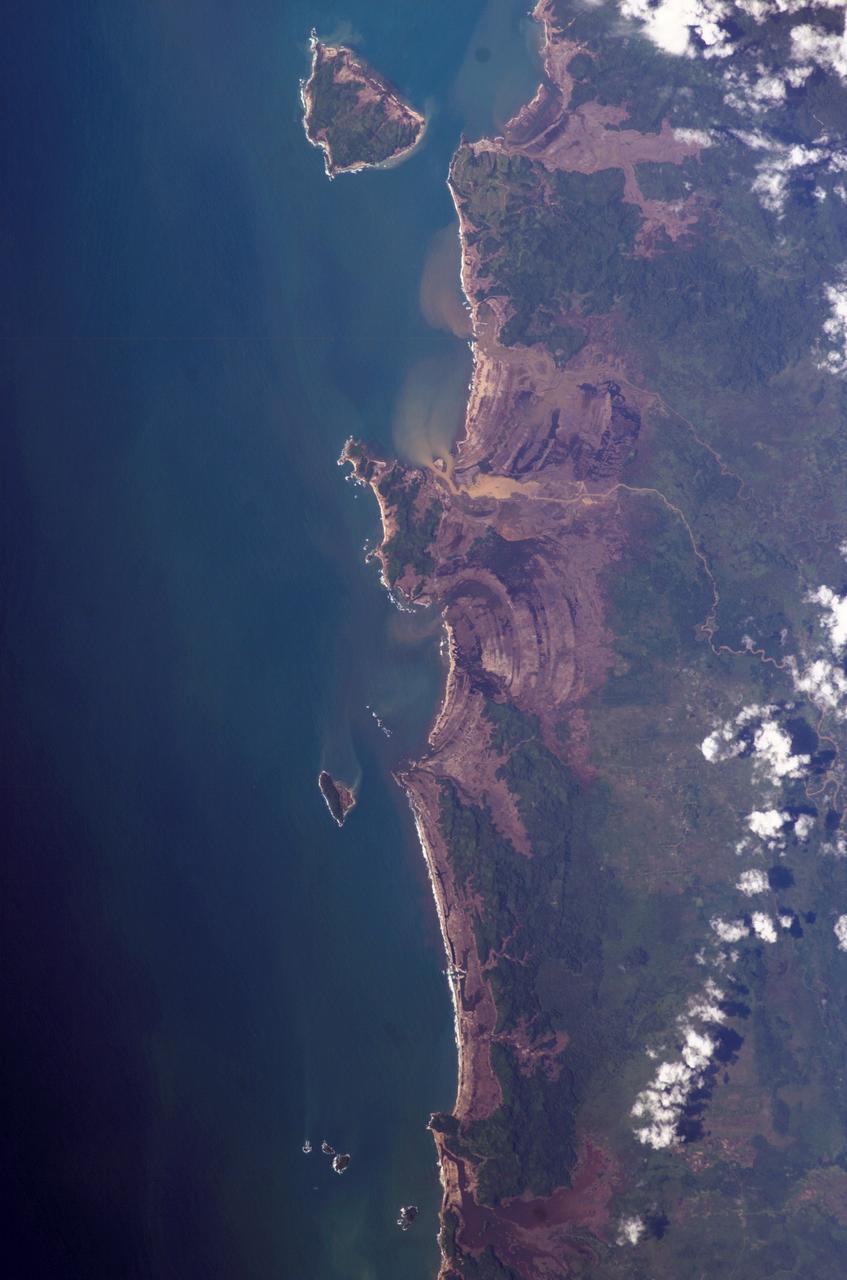
ISS010-E-13079 (15 January 2005) --- Tsunami damage, northwestern Sumatra (Indonesia) is featured in this image photographed by an Expedition 10 crewmember on the International Space Station (ISS). On December 26, 2004 a large (magnitude 9.0) earthquake occurred off the western coast of Sumatra in the Indian Ocean. Scientists believe the earthquake was caused by the release of stresses accumulated as the India tectonic plate is overridden by the Burma tectonic plate. Movement of the seafloor due to the earthquake generated a tsunami, or seismic sea wave, that affected coastal regions around the Indian Ocean. The northwestern Sumatra coastline in particular suffered extensive damage and loss of life. This photo, along with image ISS010-E-13088, illustrates damage along the southwestern coast of Aceh Province in the vicinity of the city of Lho’ Kruet, Indonesia. Large areas of bare and disturbed soil (brownish gray) previously covered with vegetation are visible along the coastline. Embayments in the coastline were particularly hard hit, while adjacent headlands were less affected.
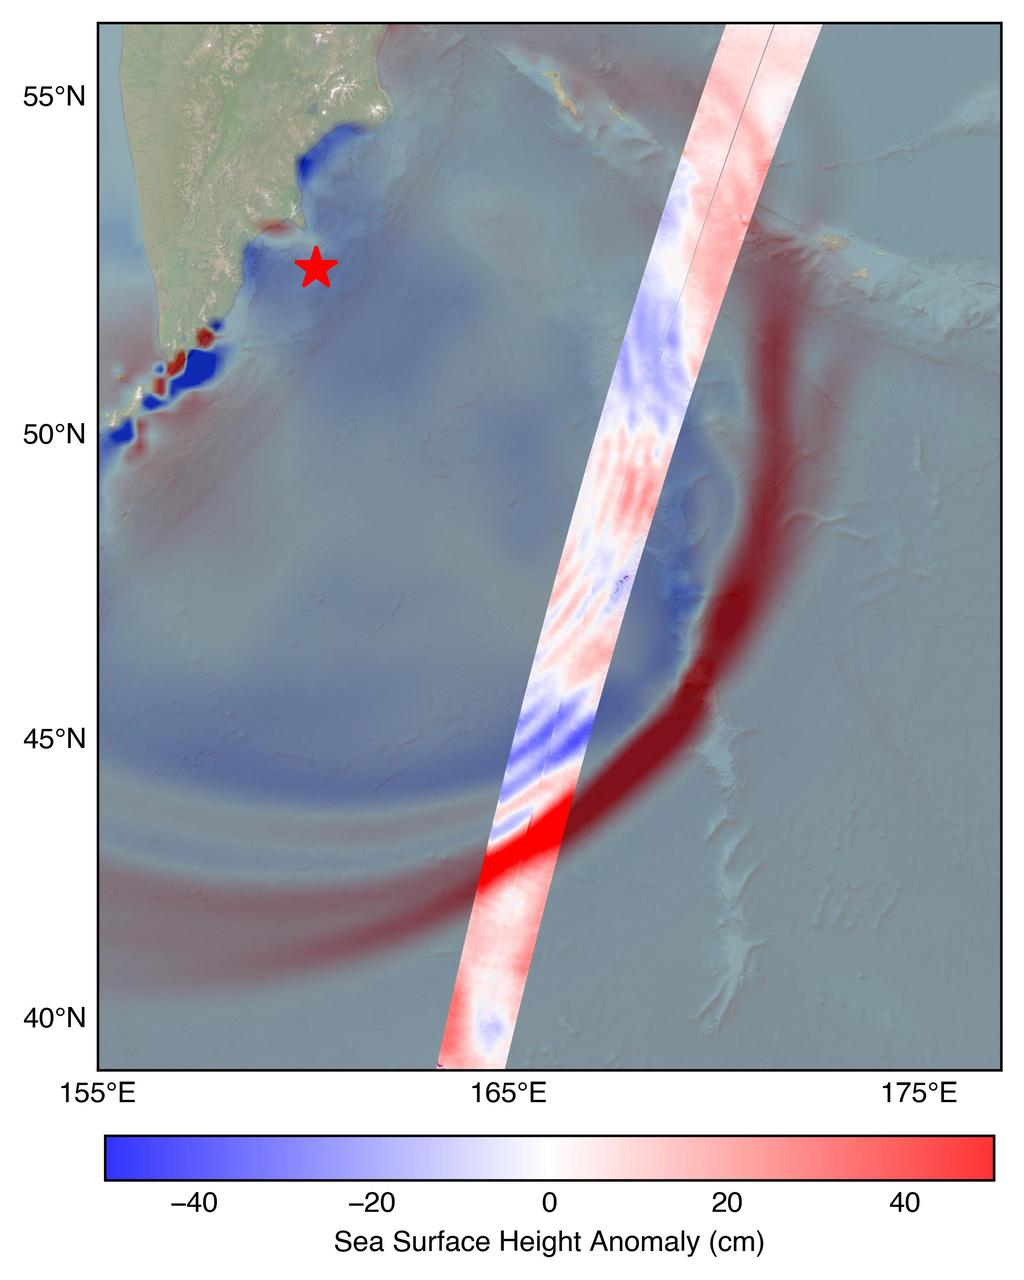
The U.S.-French SWOT (Surface Water and Ocean Topography) satellite captured the leading edge of a tsunami wave that rolled through the Pacific Ocean on July 30, 2025 (11:25 a.m. local time), in the wake of a magnitude 8.8 earthquake that struck Russia's Kamchatka Peninsula. The satellite captured the data about 70 minutes after the earthquake struck. The SWOT sea level measurements, shown in the highlighted swath from the satellite's ground track, is plotted against a tsunami forecast model from the National Oceanic and Atmospheric Administration (NOAA) Center for Tsunami Research in the background. A red star marks the location of the earthquake. The measurements show a wave height exceeding 1.5 feet (45 centimeters) as well as a look at the shape and direction of travel of the leading edge of the wave (indicated in red). Researchers noted that while the wave height might seem small, tsunamis extend from the seafloor to the ocean surface. A seemingly small wave in the open ocean can become much larger in shallower coastal waters. https://photojournal.jpl.nasa.gov/catalog/PIA26652
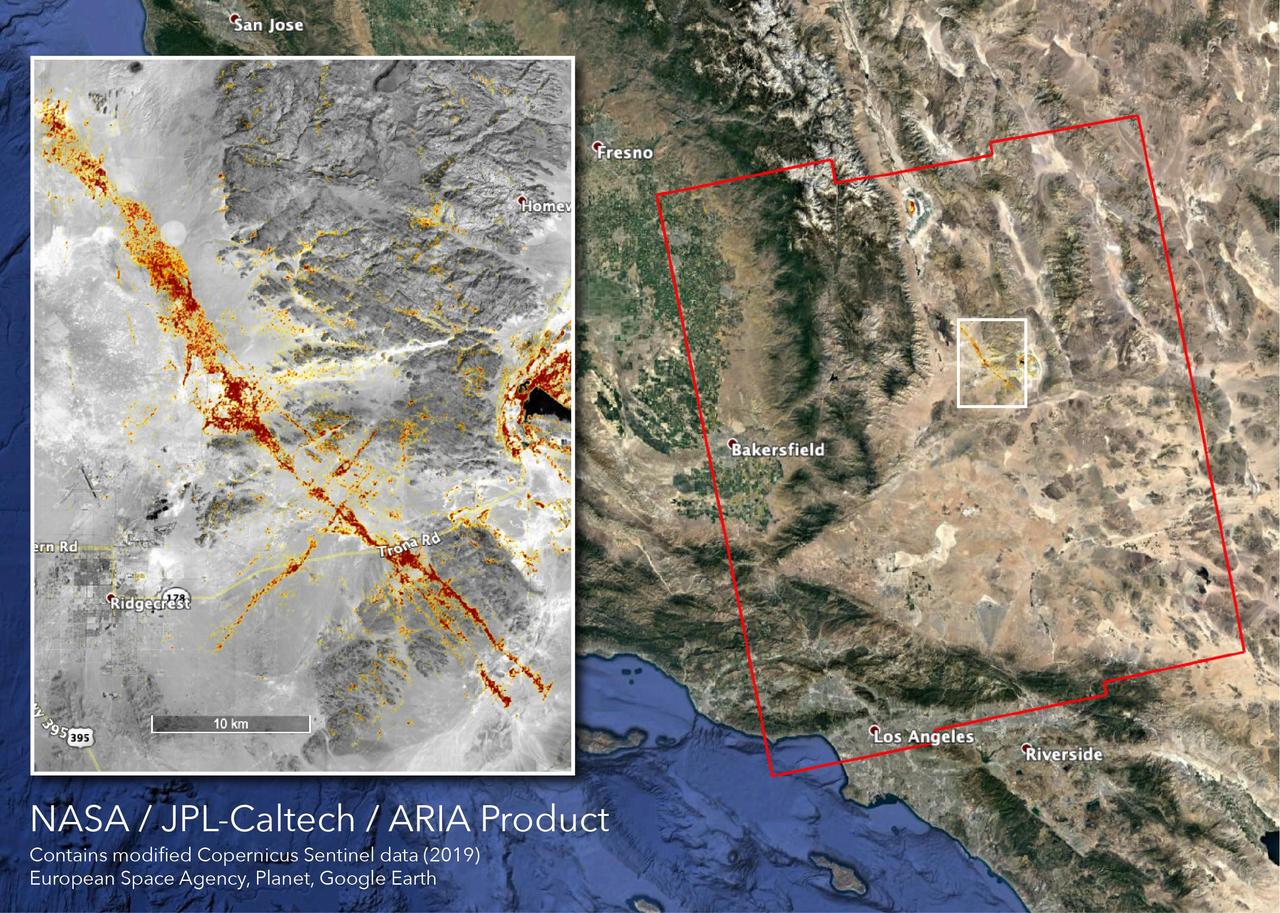
The Advanced Rapid Imaging and Analysis (ARIA) team at NASA's Jet Propulsion Laboratory in Pasadena, California, created this map depicting areas that are likely damaged as a result of the recent major earthquakes in Southern California. The color variation from yellow to red indicates increasingly more significant surface change, or damage. The map covers an area of 155 by 186 miles (250 by 300 kilometers), shown by the large red polygon. Each pixel measures about 33 yards (30 meters) across. To make the map, the team used synthetic aperture radar (SAR) images from the European Space Agency's Copernicus Sentinel-1 satellites from before and after the sequence of quakes — July 4, 2019 and July 10, 2019 respectively. The map may be less reliable over vegetated areas but can provide useful guidance in identifying damaged areas. https://photojournal.jpl.nasa.gov/catalog/PIA23354
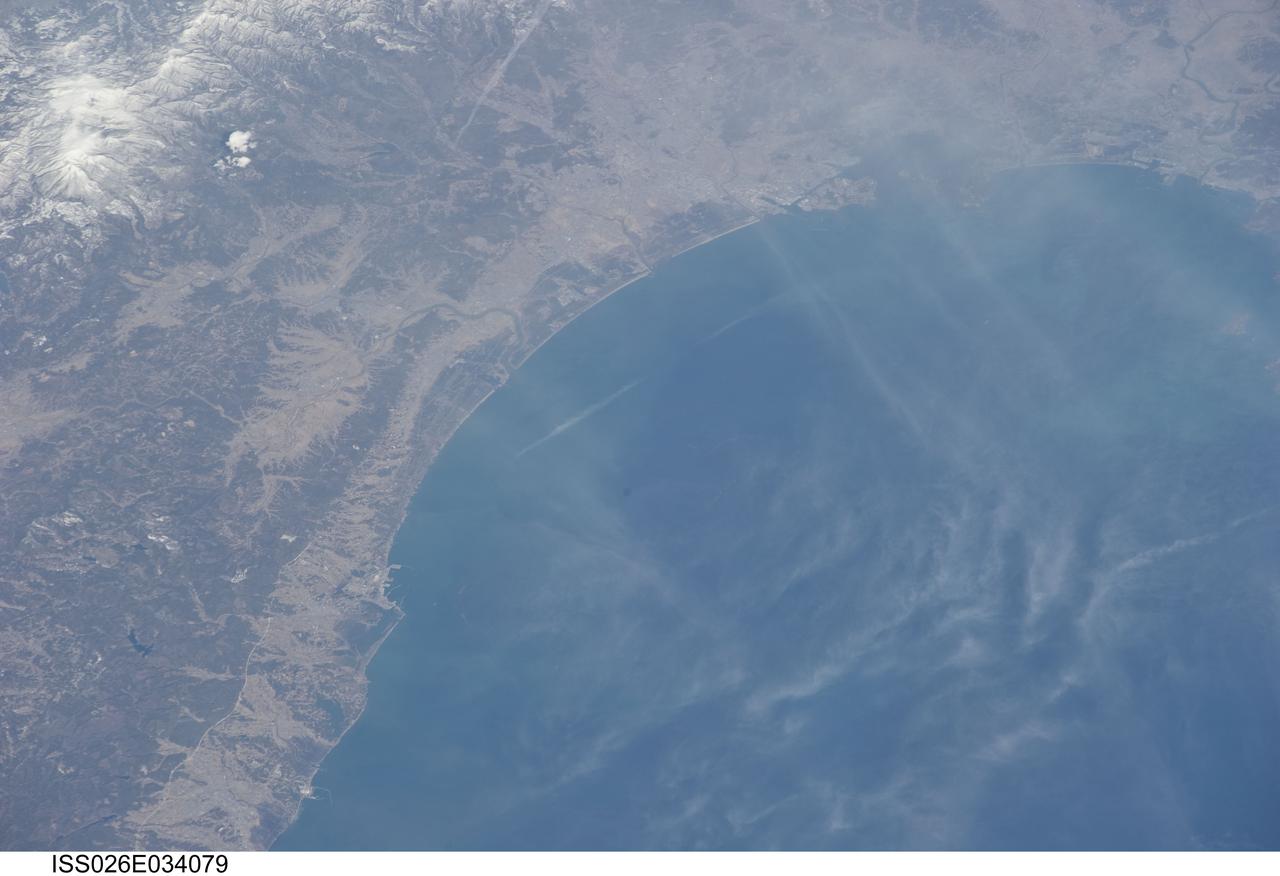
ISS026-E-034079 (14 March 2011) --- From 220 miles above Japan, an Expedition 26 crew member onboard the International Space Station took this 200mm view of the Sendai coast and southward, on March 14, three days after the one-two-punch of earthquake and tsunami.
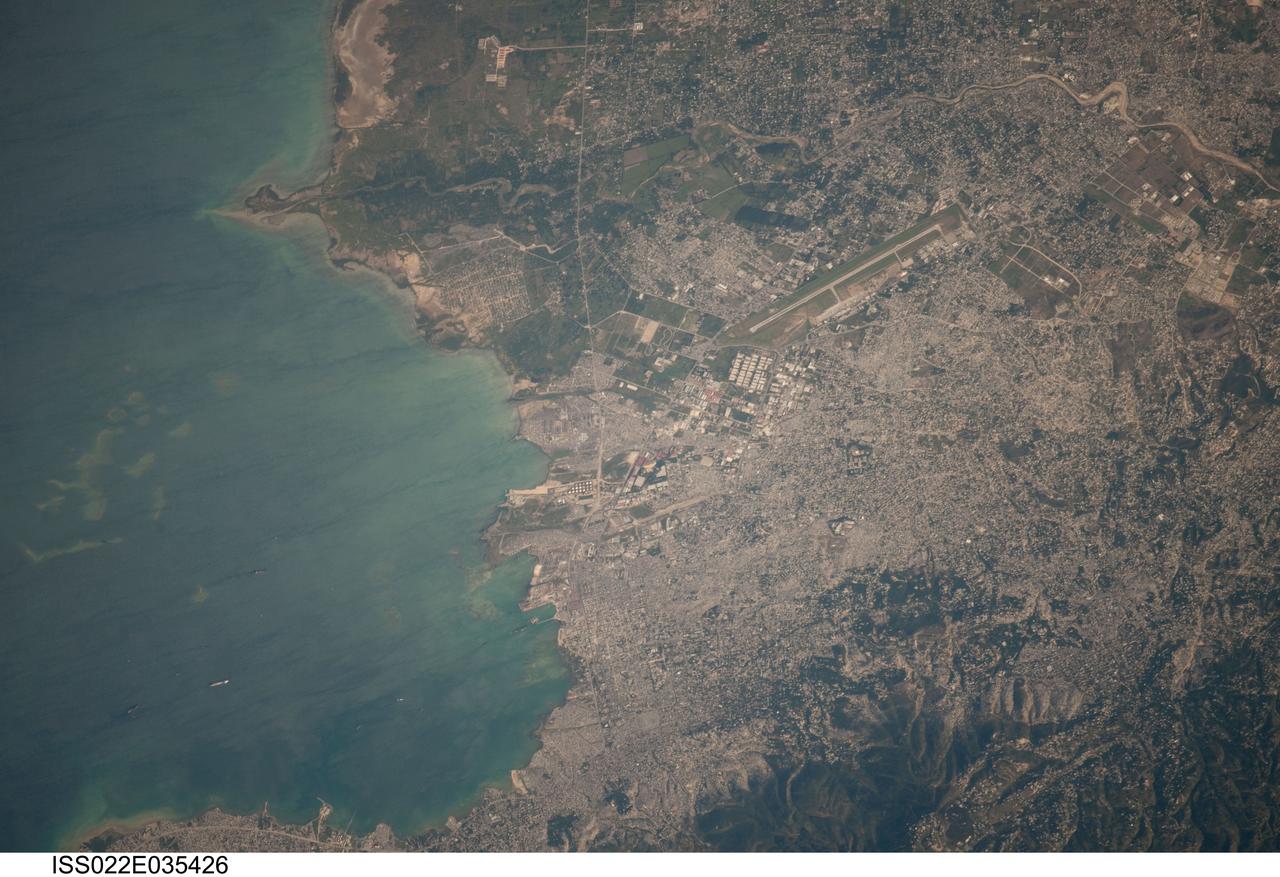
ISS022-E-035426 (22 Jan. 2010) --- Photographed from the International Space Station orbiting Earth at an altitude of 211 statute miles, this image of the Port au Prince area of Haiti from Jan. 22 is centered on the area that was heavily damaged by a magnitude 7.0 earthquake on Jan. 12. According to the United States Geological Survey (USGS) Earthquake Center, a number of tremors of varying magnitudes up to 6.0 were recorded in ensuing days. Ships can be easily delineated in the harbor. The single runway of the airport, heavily damaged by the quake, is seen near center of the frame. The airport?s control tower was destroyed and has since been rebuilt and is now in service, thanks to part of the huge world-wide aid offered to the nation
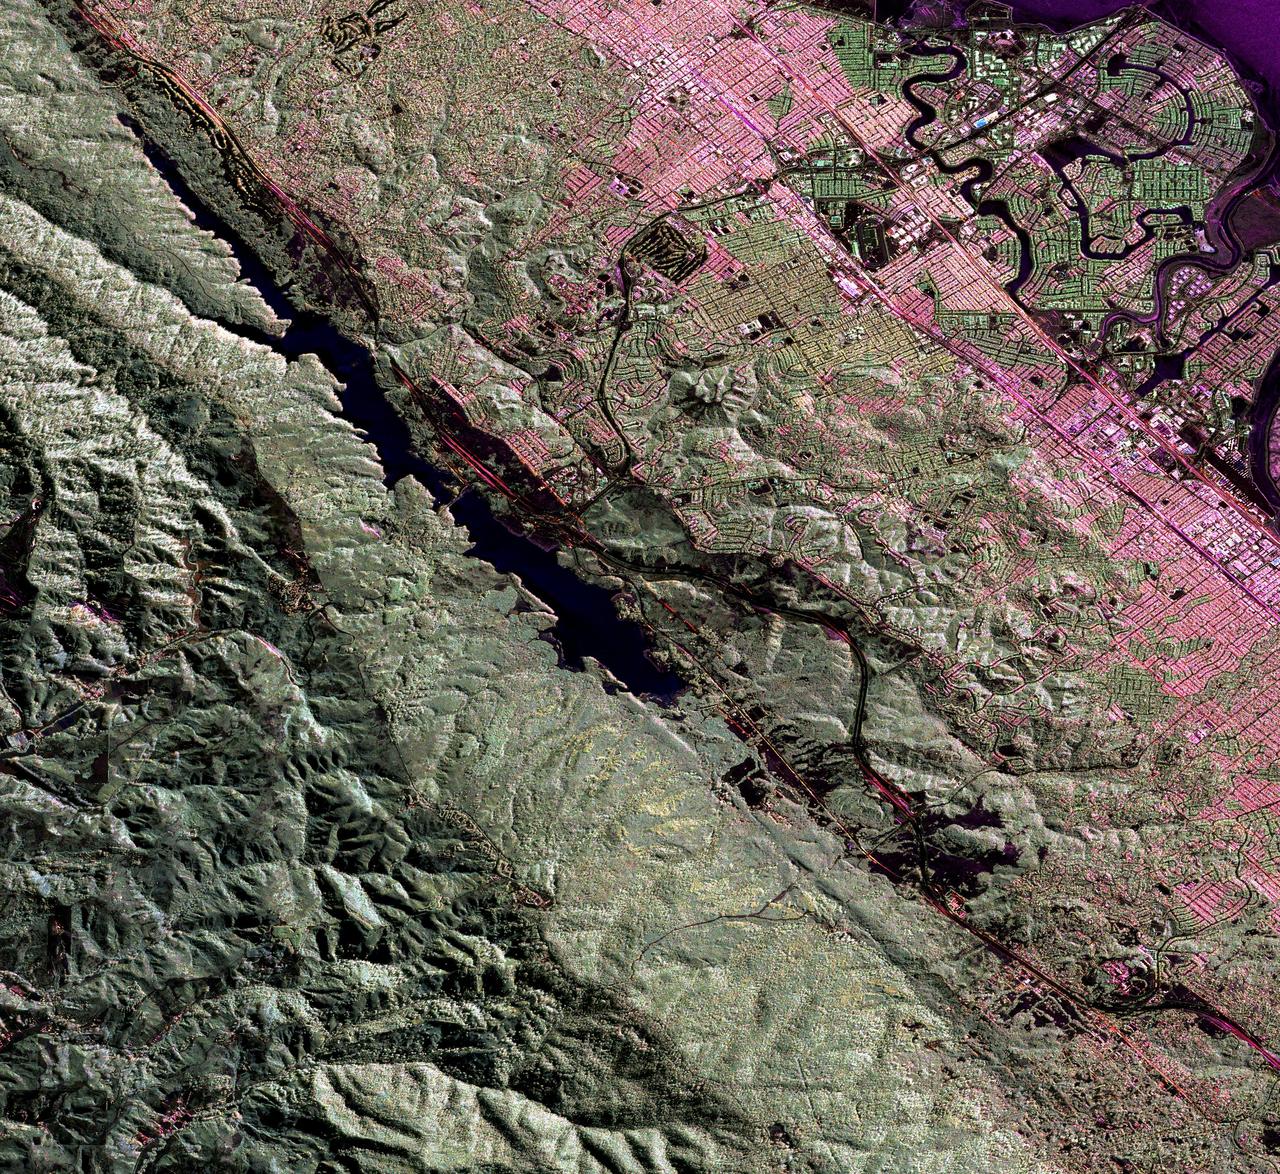
This image is a false-color composite of three channels of the UAVSAR polarimetric data acquired over the San Andreas Fault west of San Mateo, California.