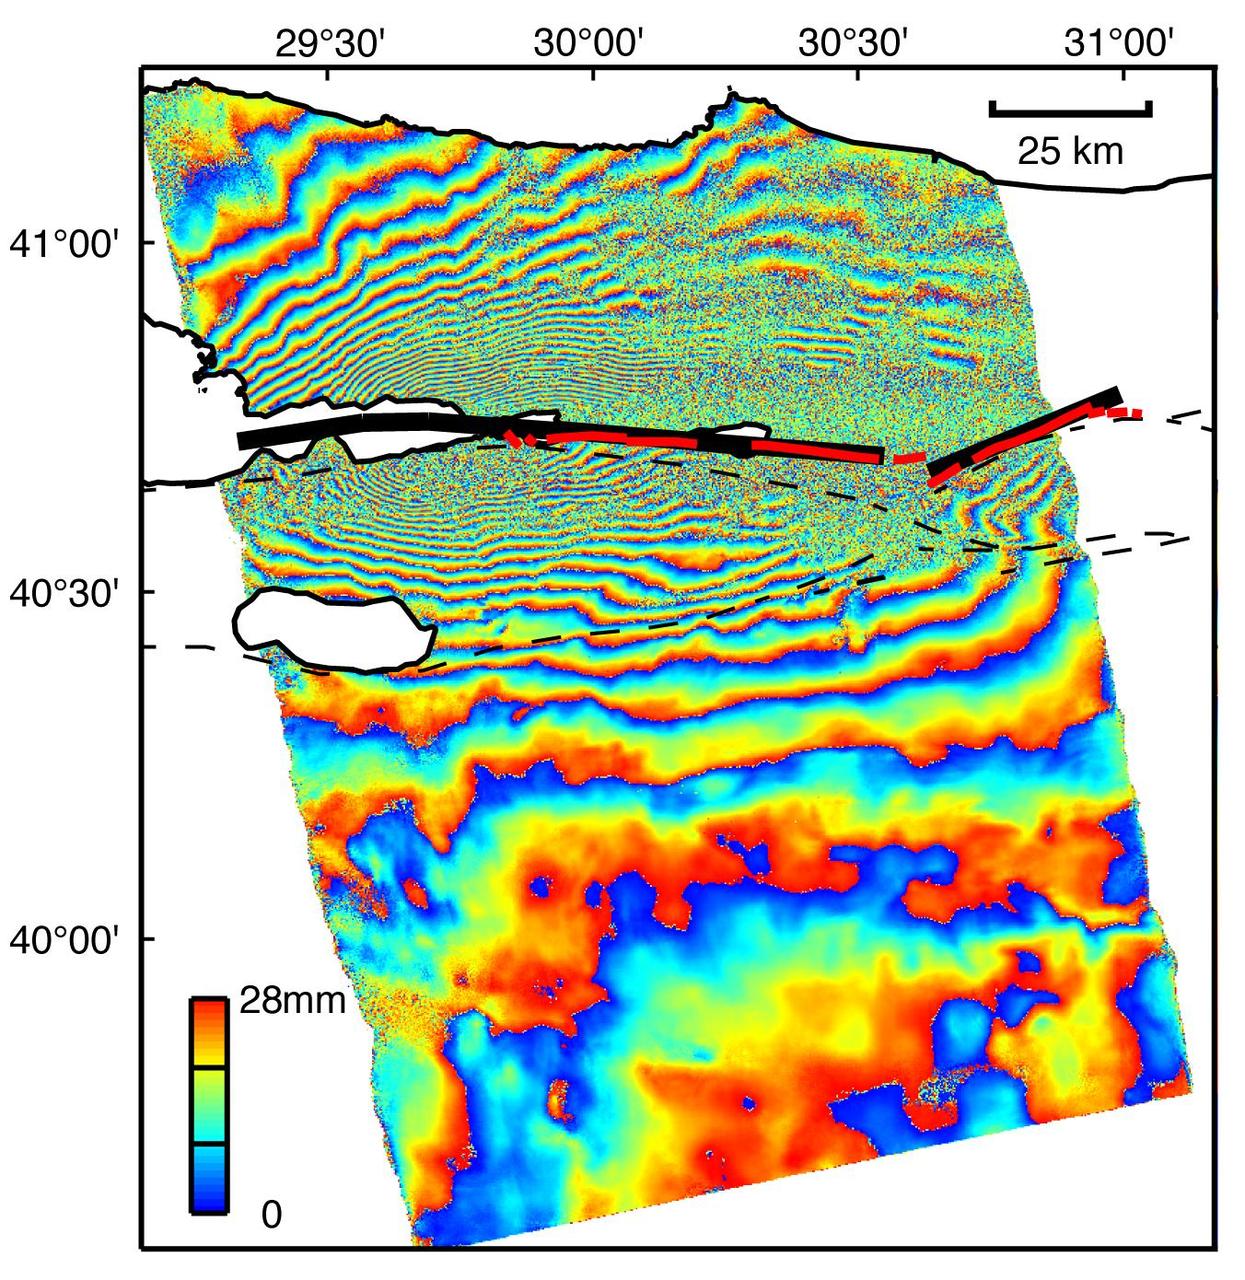
This image is an interferogram that was created using pairs of images taken by Synthetic Aperture Radar (SAR). The images, acquired at two different times, have been combined to measure surface deformation or changes that may have occurred during the time between data acquisition. The images were collected by the European Space Agency's Remote Sensing satellite (ERS-2) on 13 August 1999 and 17 September 1999 and were combined to produce these image maps of the apparent surface deformation, or changes, during and after the 17 August 1999 Izmit, Turkey earthquake. This magnitude 7.6 earthquake was the largest in 60 years in Turkey and caused extensive damage and loss of life. Each of the color contours of the interferogram represents 28 mm (1.1 inches) of motion towards the satellite, or about 70 mm (2.8 inches) of horizontal motion. White areas are outside the SAR image or water of seas and lakes. The North Anatolian Fault that broke during the Izmit earthquake moved more than 2.5 meters (8.1 feet) to produce the pattern measured by the interferogram. Thin red lines show the locations of fault breaks mapped on the surface. The SAR interferogram shows that the deformation and fault slip extended west of the surface faults, underneath the Gulf of Izmit. Thick black lines mark the fault rupture inferred from the SAR data. Scientists are using the SAR interferometry along with other data collected on the ground to estimate the pattern of slip that occurred during the Izmit earthquake. This then used to improve computer models that predict how this deformation transferred stress to other faults and to the continuation of the North Anatolian Fault, which extends to the west past the large city of Istanbul. These models show that the Izmit earthquake further increased the already high probability of a major earthquake near Istanbul. http://photojournal.jpl.nasa.gov/catalog/PIA00557

Alvin Mitchell, a NASA C-20A aircraft quality assurance inspector, completes preflight checks at NASA’s Armstrong Flight Research Center in Edwards, California, on Wednesday, April 29, 2026. The aircraft conducted science flights over Central California carrying NASA’s UAVSAR (Uninhabited Aerial Vehicle Synthetic Aperture Radar), which collects detailed ground‑movement data to improve earthquake‑hazard models and support a new Earth‑observing satellite.

NASA’s C-20A takes off from NASA’s Armstrong Flight Research Center in Edwards, California, on Wednesday, April 29, 2026. The aircraft conducted science flights over Central California carrying NASA’s UAVSAR (Uninhabited Aerial Vehicle Synthetic Aperture Radar), which collects detailed ground‑movement data to improve earthquake‑hazard models and support a new Earth‑observing satellite.

NASA’s C-20A takes off from NASA’s Armstrong Flight Research Center in Edwards, California, on Wednesday, April 29, 2026. The aircraft conducted science flights over Central California carrying NASA’s UAVSAR (Uninhabited Aerial Vehicle Synthetic Aperture Radar), which collects detailed ground‑movement data to improve earthquake‑hazard models and support a new Earth‑observing satellite.

NASA’s C-20A takes off from NASA’s Armstrong Flight Research Center in Edwards, California, on Wednesday, April 29, 2026. The aircraft conducted science flights over Central California carrying NASA’s UAVSAR (Uninhabited Aerial Vehicle Synthetic Aperture Radar), which collects detailed ground‑movement data to improve earthquake‑hazard models and support a new Earth‑observing satellite.

C-20A crew chief Isac Mata stows metal pins used to secure the landing gear, while Ian Elkin, operations engineer, boards the aircraft to prepare for takeoff from NASA’s Armstrong Flight Research Center in Edwards, California, on Wednesday, April 29, 2026. The aircraft conducted science flights over Central California carrying NASA’s UAVSAR (Uninhabited Aerial Vehicle Synthetic Aperture Radar), which collects detailed ground‑movement data to improve earthquake‑hazard models and support a new Earth‑observing satellite.
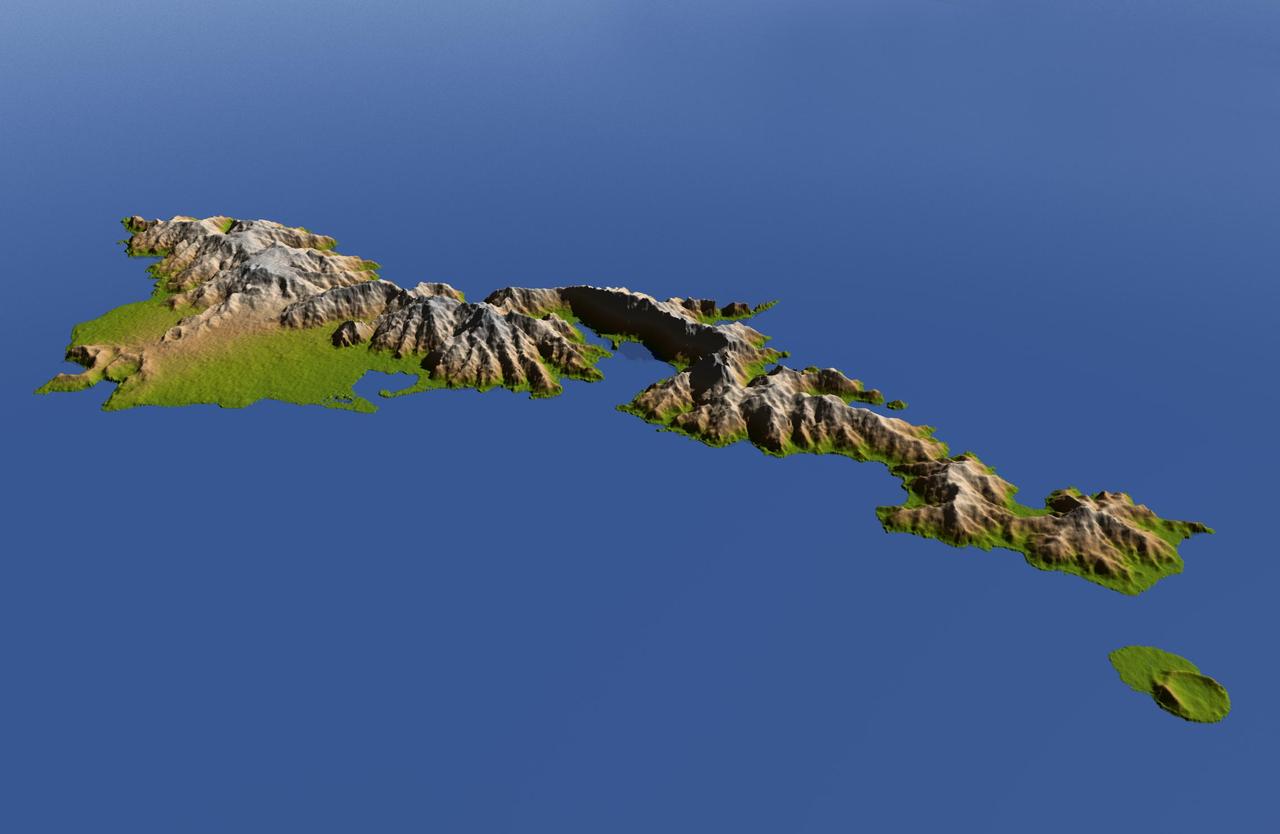
The topography of Tutuila, largest of the islands of American Samoa, is well shown in this color-coded perspective view generated with digital elevation data from the Shuttle Radar Topography Mission (SRTM.) The total area of Tutuila is about 141.8 square kilometers (54.8 square miles), slightly larger than San Francisco. The large bay near the center in this view is Pago Pago Harbor, actually a submerged volcanic crater whose south wall collapsed millions of years ago. Adjacent to the harbor is Pago Pago, the capital of American Samoa, and to the left (west) of the harbor in this view is Matafao Peak, Tutuila’s highest point at 653 meters (2,142 feet). On September 29, 2009, a tsunami generated by a major undersea earthquake located about 200 kilometers (120 miles) southwest of Tutuila inundated the more heavily populated southern coast of the island with an ocean surge more than 3 meters (10 feet) deep, causing scores of casualties. Digital topographic data such as those produced by SRTM aid researchers and planners in predicting which coastal regions are at the most risk from such waves, as well as from the more common storm surges caused by tropical storms and even sea level rise. Two visualization methods were combined to produce the image: shading and color coding of topographic height. The shaded image was derived by computing topographic slope in the northeast-southwest direction, so that northeast slopes appear bright and southwest slopes appear dark. Color coding is directly related to topographic height, with green at the lower elevations, rising through yellow and tan, to white at the highest elevations. The image was then projected using the elevation data to produce this perspective view, with the topography exaggerated by a factor of two. http://photojournal.jpl.nasa.gov/catalog/PIA11965
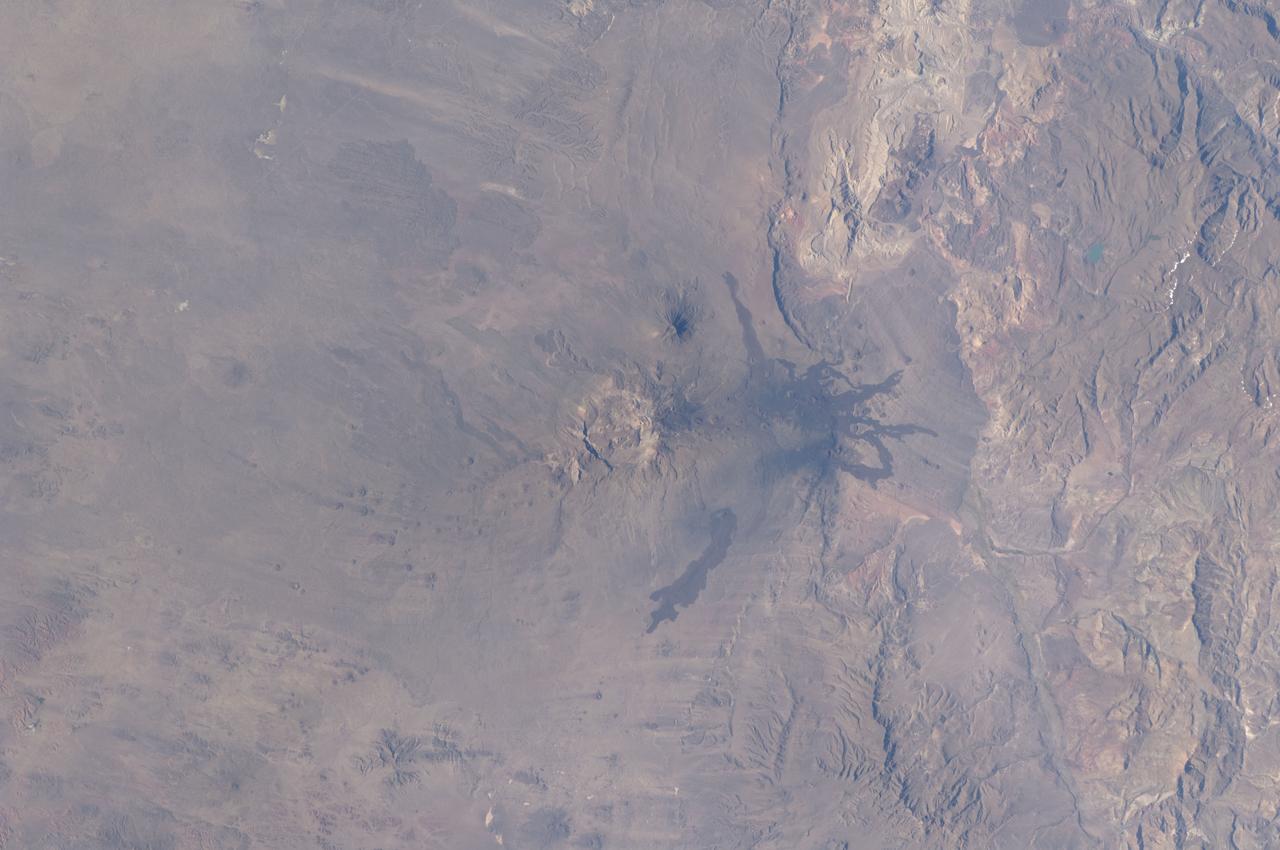
ISS030-E-030265 (31 Dec. 2011) --- The Payun Matru Volcanic Field in Argentina is featured in this image photographed by an Expedition 30 crew member on the International Space Station. The Payun Matru (3,680 meters above sea level) and Payun Liso (3,715 meters above sea level) stratovolcanoes are the highest points of the Payun Matru Volcanic Field located in west-central Argentina, approximately 140 kilometers to the east of the Andes mountain chain. This photograph illustrates some of the striking geological features of the field visible from space. The summit of Payun Matru is dominated by a roughly 15 kilometer-in-diameter caldera (center), formed by an explosive eruption sometime after approximately 168,000 years ago. Several dark lava flows, erupted from smaller vents and fissures, are visible in the northwestern part of the volcanic field. One distinct flow, erupted from Volcan Santa Maria located to the northwest of Payun Matru, is approximately 15 kilometers long. A number of small cinder cones, appearing as brown dots due to the short lens used, are built on older lava flows (grey) to the northeast of Payun Matru. While there is no recorded historical observation of the most recent volcanic activity in the field, oral histories suggest that activity was witnessed by indigenous peoples. Most Andean volcanoes—and earthquakes—follow the trend of the greater Andes chain of mountains, and are aligned roughly N-S above the tectonic boundary between the subducting (descending) Nazca Plate and the overriding South American Plate as is predicted from plate tectonic theory. Other major volcanic centers located some distance away from the major trend typically result from more complex geological processes associated with the subduction zone, and can provide additional insight into the subduction process.
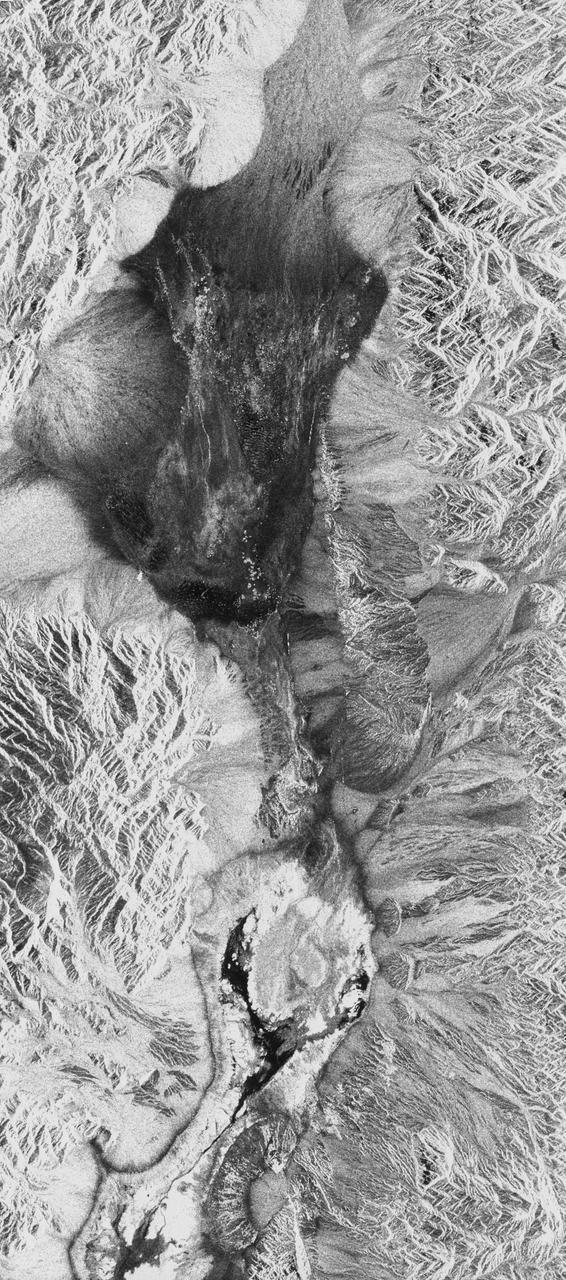
STS059-S-026 (11 April 1994) --- This is an image of Death Valley, California, centered at 36.629 degrees north latitude, 117.069 degrees west longitude. The image shows Furnace Creek alluvial fan and Furnace Creek Ranch at the far right, and the sand dunes near Stove Pipe Wells at the center. The dark fork-shaped feature between Furnace Creek fan and the dunes is a smooth flood-plain which encloses Cottonball Basin. The SIR-C/X-SAR supersite is an area of extensive field investigations and has been visited by both Space Radar Lab astronaut crews. Elevations in the Valley range from 70 meters below sea level, the lowest in the United States, to more than 3300 meters above sea level. Scientists are using SIR-C/X-SAR data from Death Valley to help answer a number of different questions about the Earth's geology. One question concerns how alluvial fans are formed and change through time under the influence of climatic changes and earthquakes. Alluvial fans are gravel deposits that wash down from the mountains over time. They are visible in the image as circular, fan-shaped bright areas extending into the darker valley floor from the mountains. Information about the alluvial fans help scientists study Earth's ancient climate. Scientists know the fans are bulit up through climatic and tectonic processes and they will use the SIR-C/X-SAR data to understand the nature and rates of weathering processes on the fans, soil formation, and the transport of sand and dust by the wind. SIR-C/X-SAR's sensitivity to centimeter-scale (or inch-scale) roughness provides detailed maps of surface texture. Such information can be used to study the occurrence and movement of dust storms and sand dunes. the goal of these studies is to gain a better understanding of the record of past climatic changes and the effects of those changes on a sensitive environment. This may lead to a better ability to predict future response of the land to different potential global cimate-change scenarios. Death Valley is also one of the primary calibration sites for SIR-C/X-SAR. The bright dots near the center of the image are corner reflectors that have been set-up to calibrate the radar as the Shuttle passes overhead. Thirty triangular-shaped reflectors (they look like aluminum pyramids) have been deployed by the calibration team from JPL over a 40 kilometer by 40 kilometer area in and around Death Valley. The calibration team will also deploy transponders (electronic reflectors) and recievers to measure the radar signals from SIR-C/X-SAR on the ground. Spaceborne Imaging Radar-C and X-Synthetic Aperture Radar (SIR-C/X-SAR) is part of NASA's Mission to Planet Earth (MTPE). The radars illuminate Earth with microwaves allowing detailed observations at any time, regardless of weather or sunlight conditions. SIR-C/X-SAR uses three microwave wavelengths: L-Band (24 cm), C-Band (6 cm), and X-Band (3 cm). The multi-frequency data will be used by the international scientific community to better understand the global environment and how it is changing. The SIR-C/X-SAR data, complemented by aircraft and ground studies, will give scientists clearer insights into those environmental changes which are caused by nature and those changes which are induced by human activity. SIR-C was develpoed by NASA's Jet Propulsion Laboratory (JPL). X-SAR was developed by the Dornire and Alenia Spazio Companies for the German Space Agency, Deutsche Agentur fuer Raumfahrtangelegenheiten (DARA), and the Italian Space Agency, Agenzia Spaziale Italiana (ASI). JPL Photo ID: P-43883