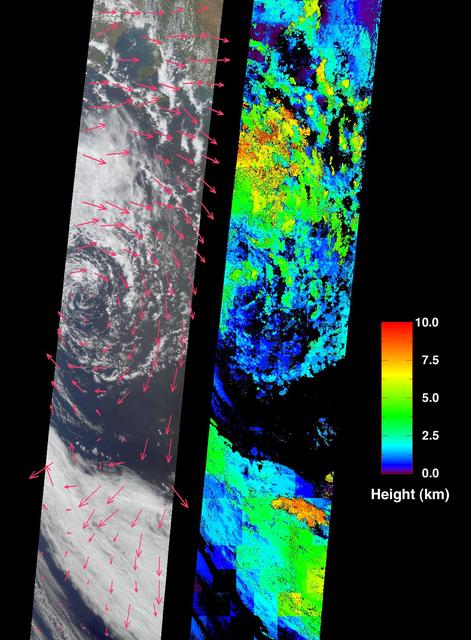
These images acquired on October 11, 2001 by NASA Terra satellite portray an occluded extratropical cyclone situated in the Southern Ocean, about 650 kilometers south of the Eyre Peninsula, South Australia.
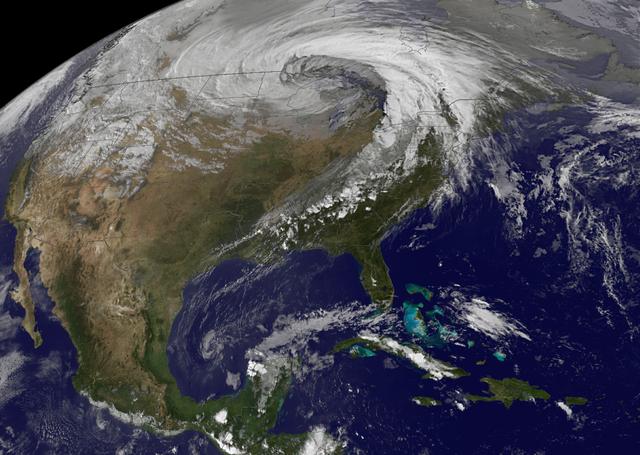
NASA image acquired October 26, 2010 The storm that swept across the center of the United States on October 26 and October 27, 2010, was memorable to those who experienced it because of its strong winds, rain, hail, and widespread tornadoes. Meteorologists get excited about the storm because it set a record for the lowest pressure (not associated with a hurricane) measured over land in the continental United States. At 5:13 p.m. CDT, the weather station in Bigfork, Minnesota recorded 955.2 millibars (28.21 inches of pressure). Pressure is one indicator of a storm’s strength, and this measurement corresponds to the pressure seen in a Category 3 hurricane. This image, taken by the GOES satellite on October 26, shows the storm system circling around the area of extreme low pressure. Such extratropical cyclones form over the United States in the spring and fall, when the temperature difference from north to south is large. Warm, high-pressure air rushes toward the cooler, low-pressure air in the north. Because the Earth is rotating, the air moving in ends up circling the area of low pressure, creating the cyclone shown in the image. The intensity of the storm is determined by the pressure difference between the center and the outer edges. Extreme low pressure in the center of the storm, therefore, is an indicator that the storm was very intense. The animation shows the storm developing starting late on October 25 and running through October 27. The cyclone formed very quickly on October 26, taking a distinctive comma shape as the day went on. The storm developed so quickly, in fact, that it is classified as a bomb, an extremely fast developing storm (dropping at least one millibar of pressure per hour for 24 hours), more common over water than land. The storm was also huge. Though the area of low pressure is centered over the Upper Midwest, the storm reached from the Gulf of Mexico into Canada, and from the Rocky Mountains to the Atlantic Ocean. Extratropical cyclones bring an array of unsettled weather, including strong wind, rain, hail, and tornadoes, and this cyclone brought all of that. On October 26–27, winds gusted up to 78 miles per hour in Michigan, with high winds throughout the Midwest. The National Weather Service reported 61 tornadoes over the two days. Heavy snow also fell in the north. NASA Earth Observatory imagery created by Jesse Allen, using imagery provided courtesy of the NASA GOES Project Science Office. Caption by Holli RIebeek. Instrument: GOES Credit: <b><a href="http://www.earthobservatory.nasa.gov/" rel="nofollow"> NASA Earth Observatory</a></b> <b><a href="http://www.nasa.gov/centers/goddard/home/index.html" rel="nofollow">NASA Goddard Space Flight Center</a></b> enables NASA’s mission through four scientific endeavors: Earth Science, Heliophysics, Solar System Exploration, and Astrophysics. Goddard plays a leading role in NASA’s accomplishments by contributing compelling scientific knowledge to advance the Agency’s mission. <b>Follow us on <a href="http://twitter.com/NASA_GoddardPix" rel="nofollow">Twitter</a></b> <b>Join us on <a href="http://www.facebook.com/pages/Greenbelt-MD/NASA-Goddard/395013845897?ref=tsd" rel="nofollow">Facebook</a></b>
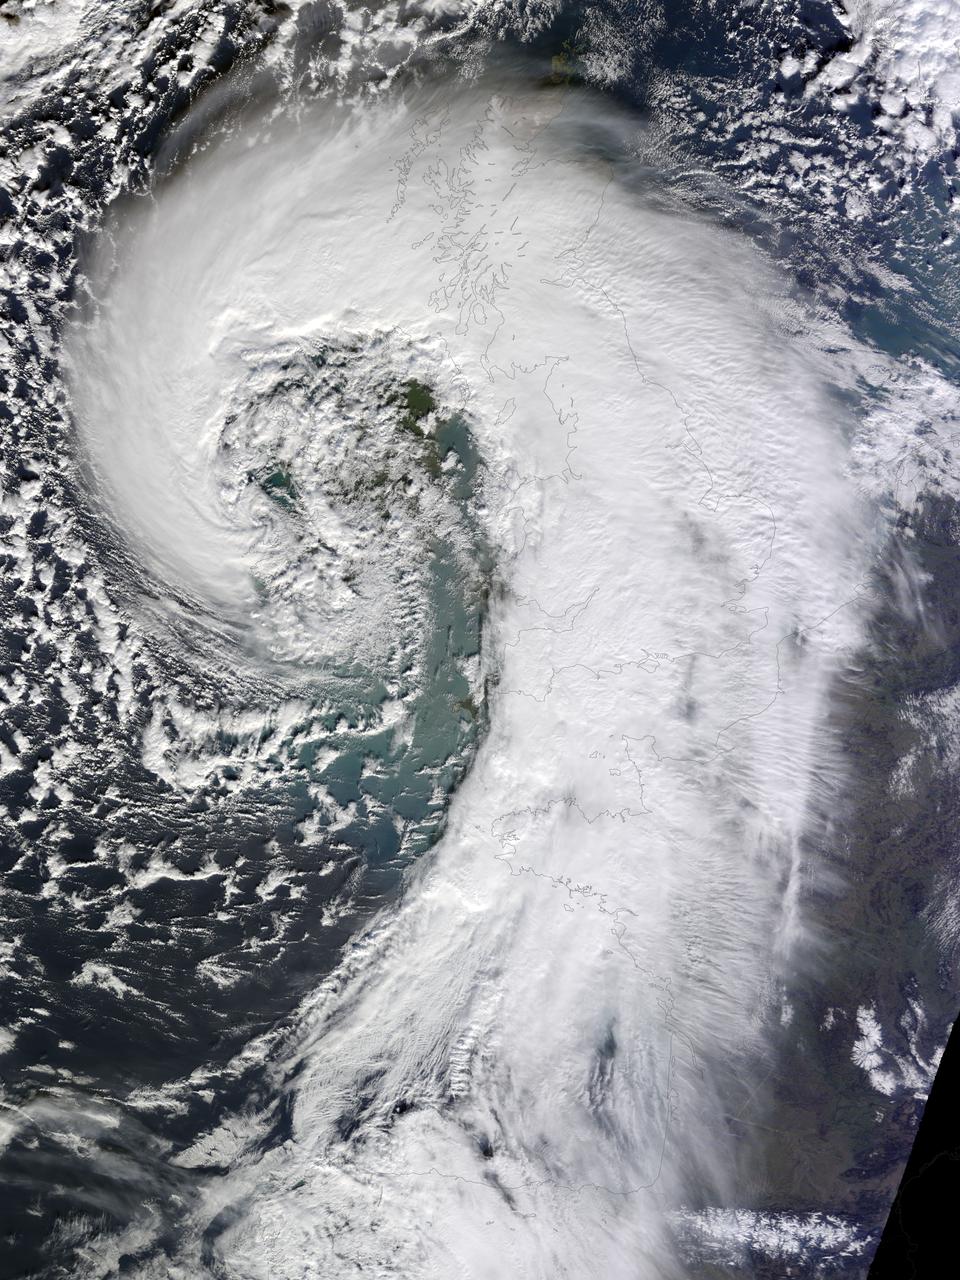
Soggy winters are not unusual in the United Kingdom, but this winter has been in a category of its own. UK Met Office meteorologists had just declared January 2014 the wettest month on record for parts of southern Britain when another series of storms swept across the area in early February. The Moderate Resolution Imaging Spectroradiometer (MODIS) on NASA’s Terra satellite captured this image of an extratropical cyclone bearing down on the United Kingdom on February 12, 2014. Mature extratropical cyclones often feature comma-shaped cloud patterns that are the product of “conveyor belt” circulation. While heavy precipitation is often present near the low-pressure head of the comma, a slot of dry air usually trails the west side of the tail. The storm brought the United Kingdom yet another round of heavy rain, as well as winds that exceeded 160 kilometers (100 miles) per hour. It snarled traffic, disrupted train service, and caused power outages for more than 700,000 people. The also exacerbated severe flooding in southern England. More than 5,800 homes have flooded since early December, according to media reports. Authorities have deployed thousands of soldiers to towns and cities in southern England to help with flood recovery. Meanwhile, the Met Office was forecasting more of the same. They warned that another system bearing heavy rain and winds was lining up to push into the United Kingdom from the southeast on Friday morning. NASA Earth Observatory image by Jesse Allen, using data from the Land Atmosphere Near real-time Capability for EOS (LANCE). Caption by Adam Voiland. More info: <a href="http://earthobservatory.nasa.gov/NaturalHazards/view.php?id=83127" rel="nofollow">earthobservatory.nasa.gov/NaturalHazards/view.php?id=83127</a> Instrument: Terra - MODIS Credit: <b><a href="http://www.earthobservatory.nasa.gov/" rel="nofollow"> NASA Earth Observatory</a></b> <b><a href="http://www.nasa.gov/audience/formedia/features/MP_Photo_Guidelines.html" rel="nofollow">NASA image use policy.</a></b> <b><a href="http://www.nasa.gov/centers/goddard/home/index.html" rel="nofollow">NASA Goddard Space Flight Center</a></b> enables NASA’s mission through four scientific endeavors: Earth Science, Heliophysics, Solar System Exploration, and Astrophysics. Goddard plays a leading role in NASA’s accomplishments by contributing compelling scientific knowledge to advance the Agency’s mission. <b>Follow us on <a href="http://twitter.com/NASAGoddardPix" rel="nofollow">Twitter</a></b> <b>Like us on <a href="http://www.facebook.com/pages/Greenbelt-MD/NASA-Goddard/395013845897?ref=tsd" rel="nofollow">Facebook</a></b> <b>Find us on <a href="http://instagrid.me/nasagoddard/?vm=grid" rel="nofollow">Instagram</a></b>
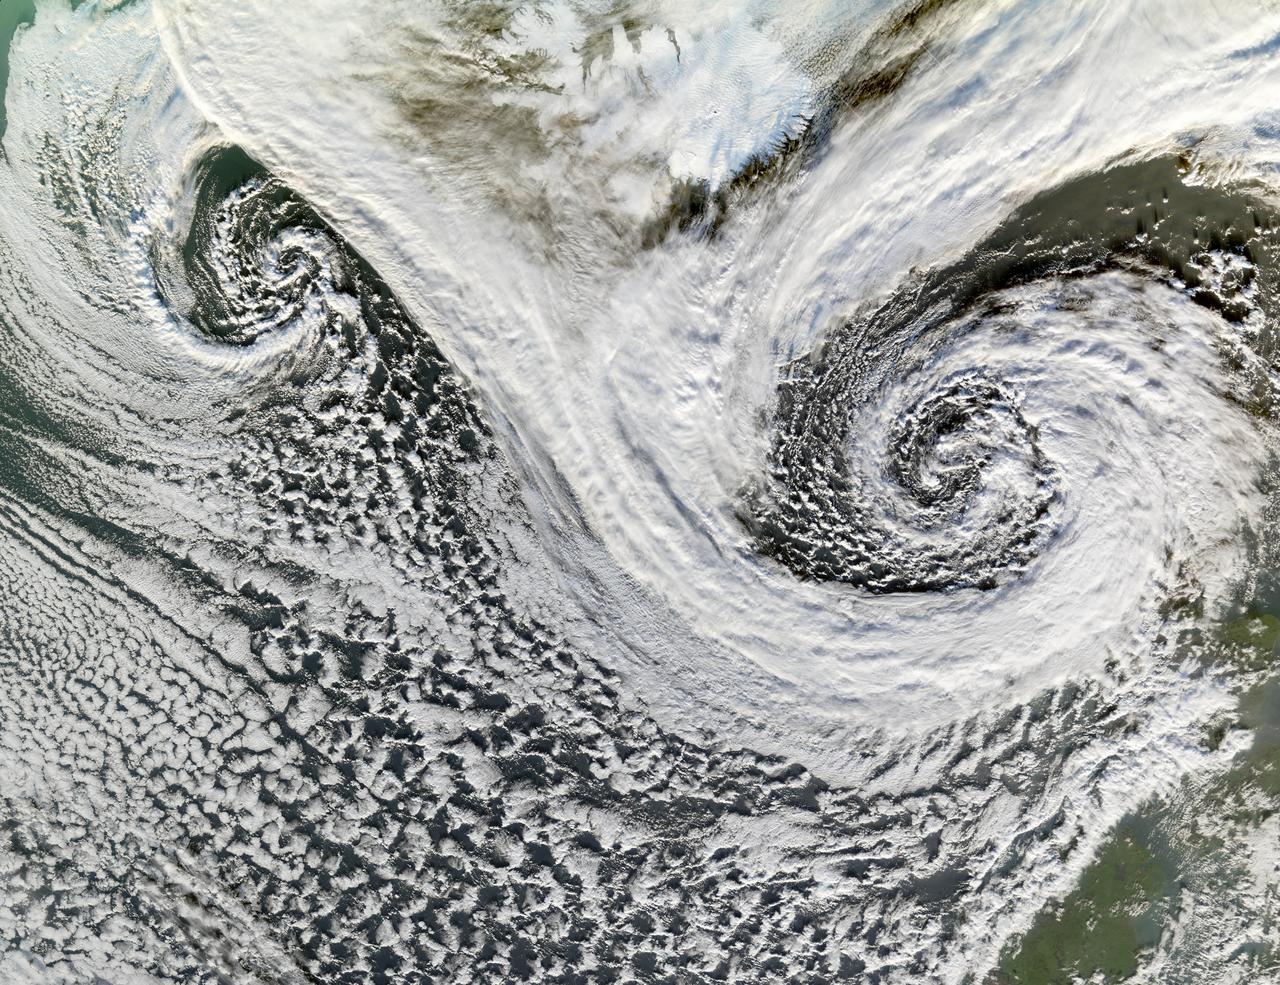
A cyclone is a low-pressure area of winds that spiral inwards. Although tropical storms most often come to mind, these spiraling storms can also form at mid- and high latitudes. Two such cyclones formed in tandem in November 2006. The Moderate Resolution Imaging Spectroradiometer (MODIS) flying onboard NASA’s Terra satellite took this picture on November 20. This image shows the cyclones south of Iceland. Scotland appears in the lower right. The larger and perhaps stronger cyclone appears in the east, close to Scotland. Cyclones at high and mid-latitudes are actually fairly common, and they drive much of the Earth’s weather. In the Northern Hemisphere, cyclones move in a counter-clockwise direction, and both of the spiraling storms in this image curl upwards toward the northeast then the west. The eastern storm is fed by thick clouds from the north that swoop down toward the storm in a giant “V” shape on either side of Iceland. Skies over Iceland are relatively clear, allowing some of the island to show through. South of the storms, more diffuse cloud cover swirls toward the southeast. Credit: NASA <b><a href="http://www.nasa.gov/centers/goddard/home/index.html" rel="nofollow">NASA Goddard Space Flight Center</a></b> is home to the nation's largest organization of combined scientists, engineers and technologists that build spacecraft, instruments and new technology to study the Earth, the sun, our solar system, and the universe. <b>Follow us on <a href="http://twitter.com/NASA_GoddardPix" rel="nofollow">Twitter</a></b> <b>Join us on <a href="http://www.facebook.com/pages/Greenbelt-MD/NASA-Goddard/395013845897?ref=tsd" rel="nofollow">Facebook</a></b>
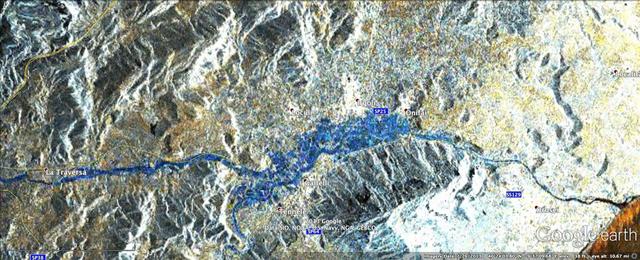
In mid-November 2013, extratropical cyclone Cleopatra brought devastating flooding to the Italian island of Sardinia as shown by the COSMO-SkyMed satellite.
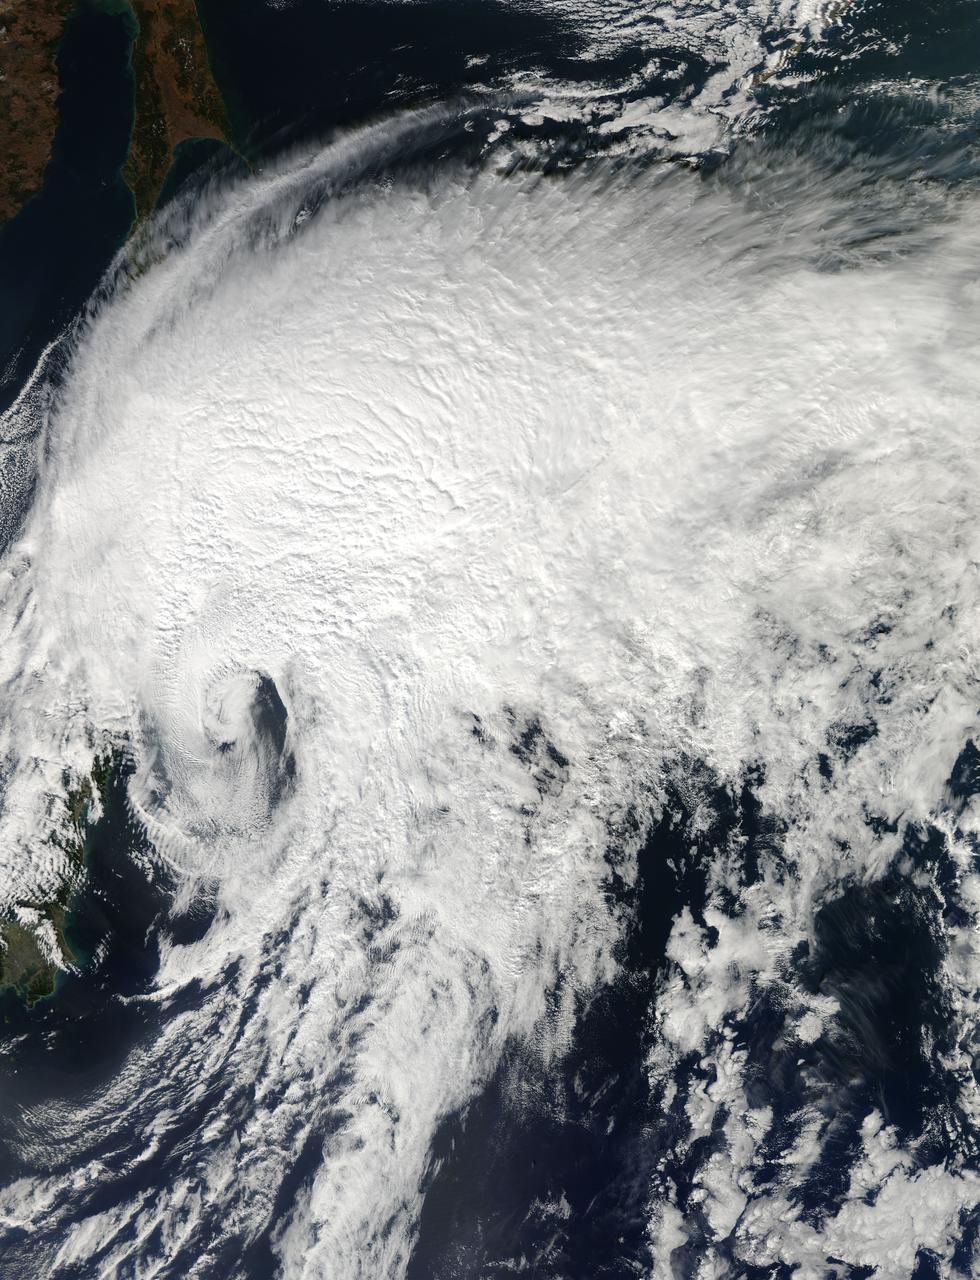
NASA's Aqua satellite passed over Extra-Tropical Storm Vongfong on Oct. 4 as it was moving away from Hokkaido, Japan, the northernmost of the big islands. Vongfong transitioned into an extra-tropical storm early on Oct. 4 as its core changed from warm to cold. The MODIS or Moderate Resolution Imaging Spectroradiometer instrument aboard NASA's Aqua satellite captured a visible image of Tropical Storm Vongfong over Japan on Oct. 14 at 03:15 UTC as it was southeast of the island of Hokkaido, Japan. The image showed that south of the center of circulation was almost devoid of clouds and showers, which were all pushed to the north and east of the center as a result of southwesterly wind shear. At 0300 UTC on Oct. 14, the Joint Typhoon Warning Center issued its final advisory on Tropical storm Vongfong. At that time Vongfong's center was located near 29.1 north latitude and 142.9 east longitude, about 111 nautical miles (127.7 miles/205.6 km) southeast of Misawa, Japan. Vongfong was moving to the northeast at a speedy 36 knots (41.4 mph/66.67 kph). Vongfong's maximum sustained winds were near 35 knots (40.2 mph/64.8 kph). Vongfong had transitioned into an extra-tropical system and will continue to move away from northern Japan and over the northwestern Pacific Ocean. Credit: NASA/GSFC/Jeff Schmaltz/MODIS Land Rapid Response Team <b><a href="http://www.nasa.gov/audience/formedia/features/MP_Photo_Guidelines.html" rel="nofollow">NASA image use policy.</a></b> <b><a href="http://www.nasa.gov/centers/goddard/home/index.html" rel="nofollow">NASA Goddard Space Flight Center</a></b> enables NASA’s mission through four scientific endeavors: Earth Science, Heliophysics, Solar System Exploration, and Astrophysics. Goddard plays a leading role in NASA’s accomplishments by contributing compelling scientific knowledge to advance the Agency’s mission. <b>Follow us on <a href="http://twitter.com/NASAGoddardPix" rel="nofollow">Twitter</a></b> <b>Like us on <a href="http://www.facebook.com/pages/Greenbelt-MD/NASA-Goddard/395013845897?ref=tsd" rel="nofollow">Facebook</a></b> <b>Find us on <a href="http://instagram.com/nasagoddard?vm=grid" rel="nofollow">Instagram</a></b>
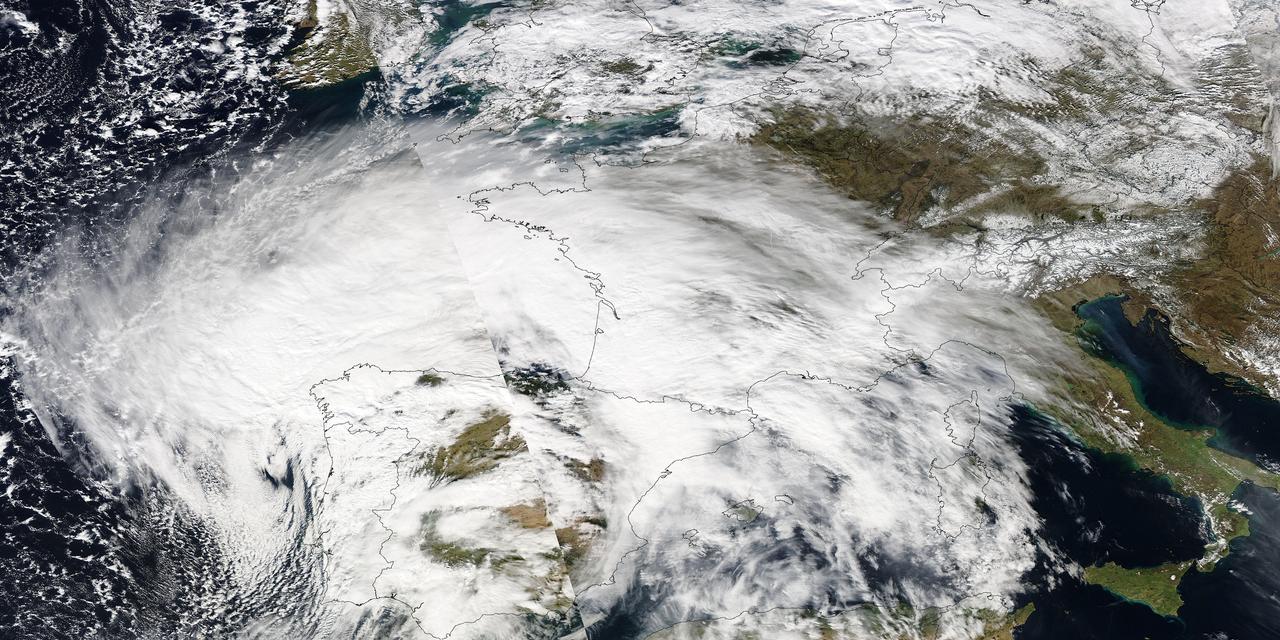
Image acquired February 27, 2010: An extratropical cyclone named Xynthia brought hurricane-force winds and high waves to Western Europe at the end of February 2010, CNN reported. Winds as fast as 200 kilometers (125 miles) per hour reached as far inland as Paris, and at the storm’s peak, hurricane-force winds extended from Portugal to the Netherlands. Hundreds of people had to take refuge from rising waters on their rooftops. By March 1, at least 58 people had died, some of them struck by falling trees. Most of the deaths occurred in France, but the storm also caused casualties in England, Germany, Belgium, Spain, and Portugal. The Moderate Resolution Imaging Spectroradiometer (MODIS) on NASA’s Aqua satellite captured this image of Western Europe, acquired in two separate overpasses on February 27, 2010. MODIS captured the eastern half of the image around 10:50 UTC, and the western half about 12:30 UTC. Forming a giant comma shape, clouds stretch from the Atlantic Ocean to northern Italy. NASA image courtesy MODIS Rapid Response Team at NASA Goddard Space Flight Center. Caption by Michon Scott. Instrument: Aqua - MODIS For more information related to this image go to: <a href="http://earthobservatory.nasa.gov/NaturalHazards/view.php?id=42881" rel="nofollow">earthobservatory.nasa.gov/NaturalHazards/view.php?id=42881</a>
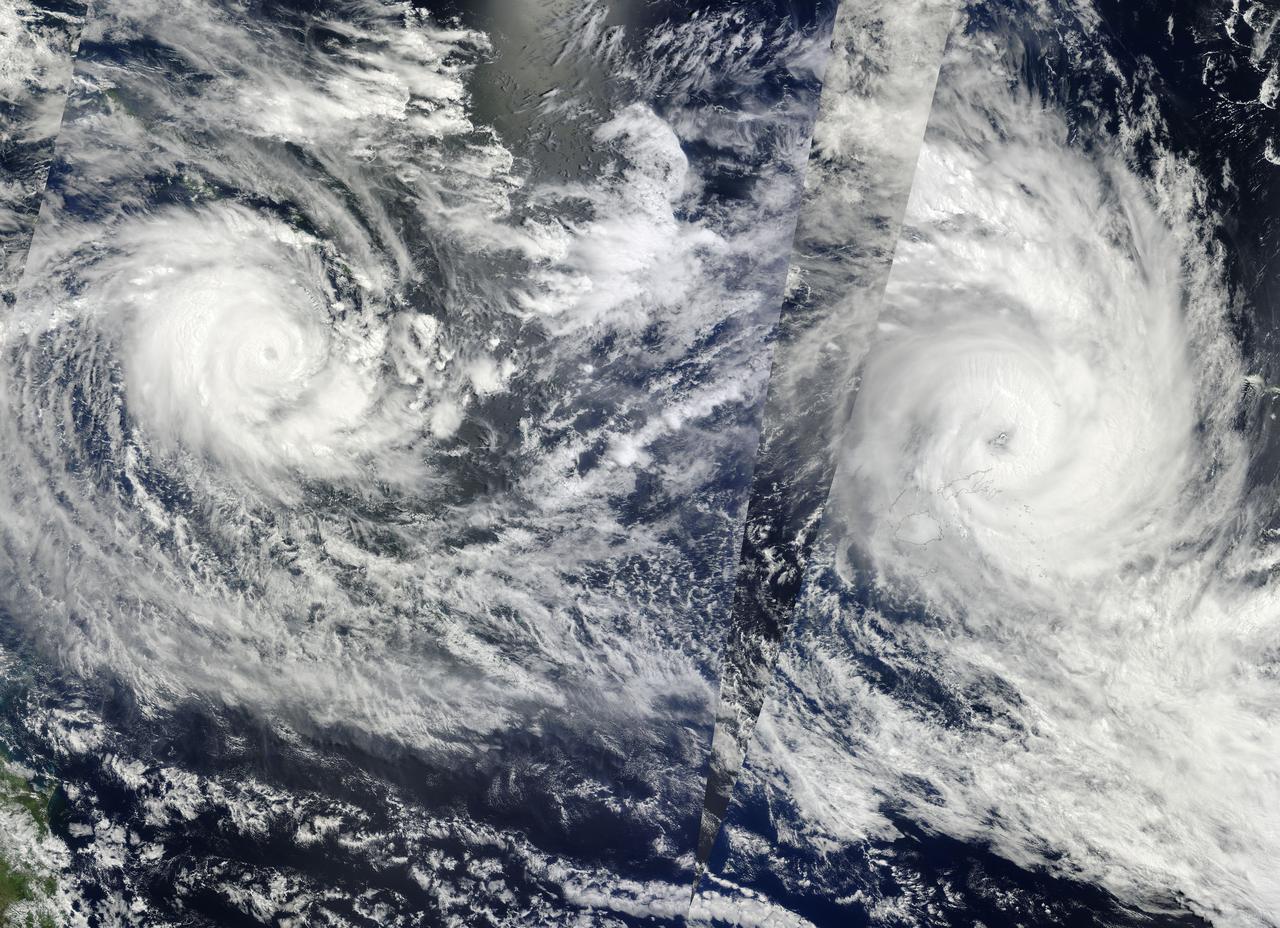
NASA Image acquired March 14 - 15, 2010 Two fierce tropical cyclones raged over the South Pacific Ocean in mid-March 2010, the U.S. Navy’s Joint Typhoon Warning Center (JTWC) reported. Over the Solomon Islands, Tropical Cyclone Ului had maximum sustained winds of 130 knots (240 kilometers per hour, 150 miles per hour) and gusts up to 160 knots (300 km/hr, 180 mph). Over Fiji, Tropical Cyclone Tomas had maximum sustained winds of 115 knots (215 km/hr, 132 mph) and gusts up to 140 knots (260 km/hr, 160 mph). The Moderate Resolution Imaging Spectroradiometer (MODIS) on NASA’s Terra and Aqua satellites captured both storms in multiple passes over the South Pacific on March 15, 2010, local time. The majority of the image is from the morning of March 15 (late March 14, UTC time) as seen by MODIS on the Terra satellite, with the right portion of the image having been acquired earliest. The wedge-shaped area right of center is from Aqua MODIS, and it was taken in the early afternoon of March 15 (local time). Although it packs less powerful winds, according to the JTWC, Tomas stretches across a larger area. It was moving over the northern Fiji islands when Terra MODIS captured the right portion of the image. According to early reports, Tomas forced more than 5,000 people from their homes while the islands sustained damage to crops and buildings. The JTWC reported that Tomas had traveled slowly toward the south and was passing over an area of high sea surface temperatures. (Warm seas provide energy for cyclones.) This storm was expected to intensify before transitioning to an extratropical storm. Ului is more compact and more powerful. A few hours before this image was taken, the storm had been an extremely dangerous Category 5 cyclone with sustained winds of 140 knots (260 km/hr, 160 mph). Ului degraded slightly before dealing the southern Solomon Islands a glancing blow. Initial news reports say that homes were damaged on the islands, but no one was injured. Like Tomas, Ului had been moving westward over an area of high sea surface temperatures. This storm was expected to continue moving westward before turning south and eventually weakening. The high-resolution image provided above is at 500 meters per pixel. The MODIS Rapid Response System provides this image at additional resolutions. NASA image by Jeff Schmaltz, MODIS Rapid Response Team, Goddard Space Flight Center. Caption by Michon Scott and Holli Riebeek. Instrument: Terra - MODIS To learn more about this image go here: <a href="http://earthobservatory.nasa.gov/IOTD/view.php?id=43154." rel="nofollow">earthobservatory.nasa.gov/IOTD/view.php?id=43154.</a>.