
The Sovereign Democratic Republic of the Fiji Islands, commonly known as Fiji, is shown in this image acquired by NASA Shuttle Radar Topography Mission SRTM on February 19, 2000.
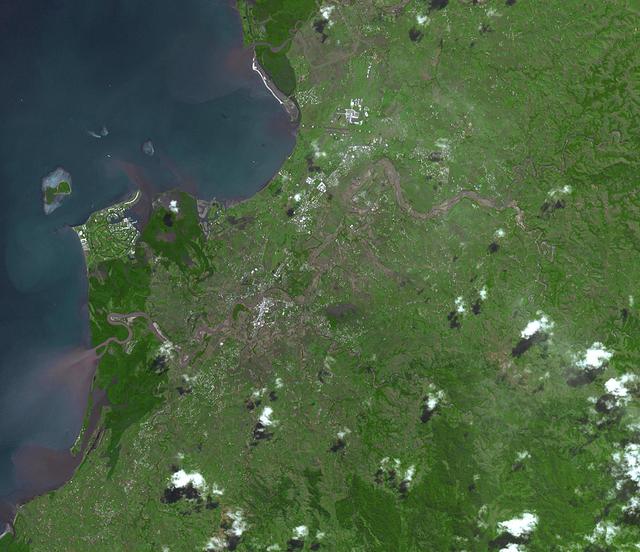
This image, acquired by NASA Terra spacecraft, shows Fiji, hard hit by heavy rains in early 2012, causing flooding and landslides. Hardest hit was the western part of the main Island of Viti Levu, Fiji, and the principal city of Nadi.
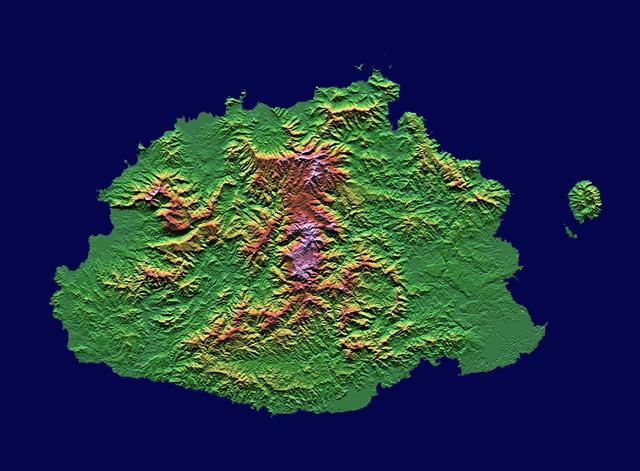
The Sovereign Democratic Republic of the Fiji Islands, commonly known as Fiji, is an independent nation consisting of some 332 islands surrounding the Koro Sea in the South Pacific Ocean. This image shows Viti Levu, the largest island in the group.
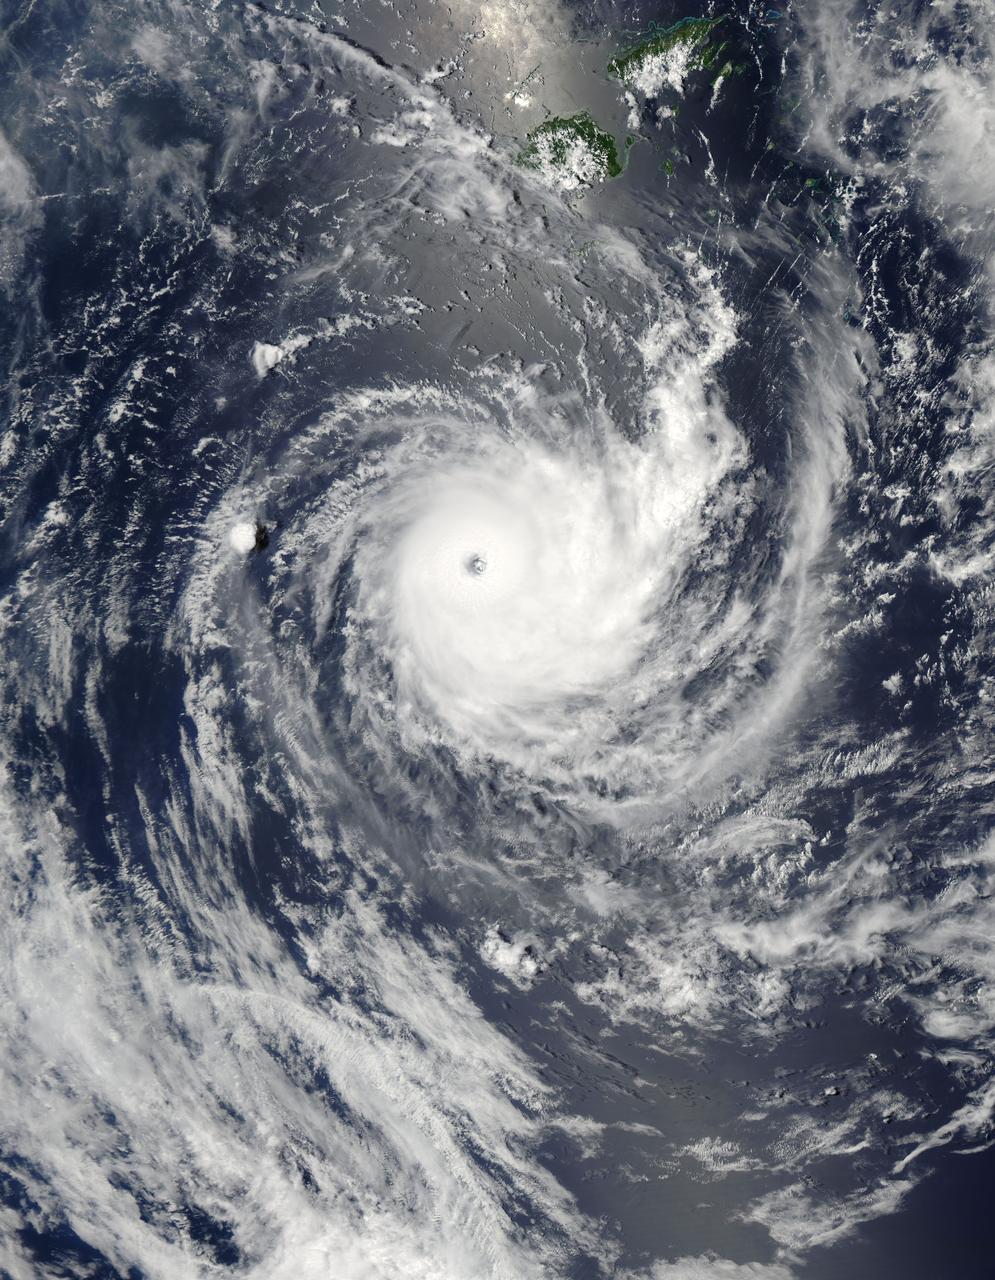
NASA image acquired January 26,02011 Tropical Cyclone Wilma raged over the Pacific Ocean in late January 2011. At 8:00 p.m. New Caledonia time (9:00 UTC) on January 26, the U.S. Navy’s Joint Typhoon Warning Center (JTWC) reported that Wilma was located some 555 nautical miles (1,030 kilometers) east of Noumea, New Caledonia. Wilma packed maximum sustained winds of 115 knots (215 kilometers per hour) with gusts up to 140 knots (260 kilometers per hour). The Moderate Resolution Imaging Spectroradiometer (MODIS) on NASA’s Aqua satellite captured this natural-color image at 12:45 p.m. New Caledonia time (1:45 UTC) on January 26, 2011. Wilma has a tightly coiled configuration and a well-defined eye. The storm hovers over the Pacific Ocean just south of Fiji. According to the JTWC, Wilma would remain strong for a day or so, then would being to gradually weaken, thanks to greater vertical wind shear and lower sea surface temperatures. NASA/GSFC/Jeff Schmaltz/MODIS Land Rapid Response Team <b><a href="http://www.nasa.gov/centers/goddard/home/index.html" rel="nofollow">NASA Goddard Space Flight Center</a></b> enables NASA’s mission through four scientific endeavors: Earth Science, Heliophysics, Solar System Exploration, and Astrophysics. Goddard plays a leading role in NASA’s accomplishments by contributing compelling scientific knowledge to advance the Agency’s mission. <b>Follow us on <a href="http://twitter.com/NASA_GoddardPix" rel="nofollow">Twitter</a></b> <b>Join us on <a href="http://www.facebook.com/pages/Greenbelt-MD/NASA-Goddard/395013845897?ref=tsd" rel="nofollow">Facebook</a></b>
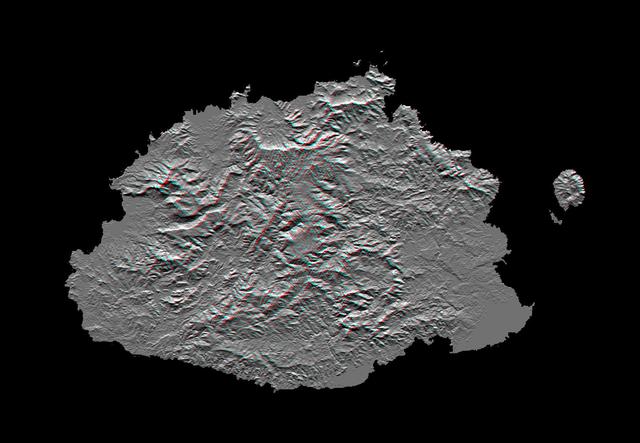
This anaglyph, from NASA Shuttle Radar Topography Mission, shows Viti Levu, the largest island in the group some 332 islands commonly known as Fiji. 3D glasses are necessary to view this image.

The pictured archipelago is the Republic of Fiji. This image from NASA Terra satellite is MISR Mystery Image Quiz #1.
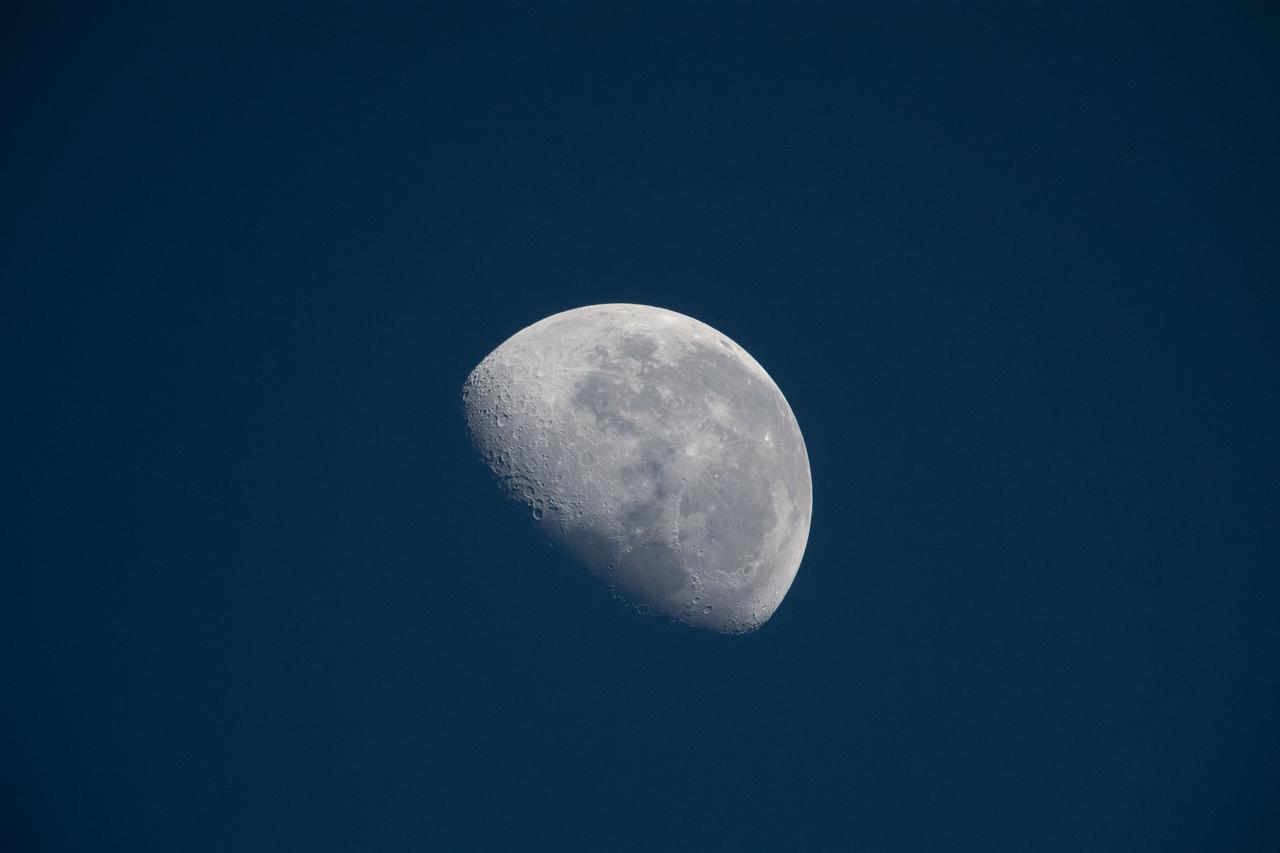
iss065e018847 (May 1, 2021) --- The waning gibbous Moon was pictured from the International Space Station while orbiting 264 miles above the Pacific Ocean in between Fiji and American Samoa.
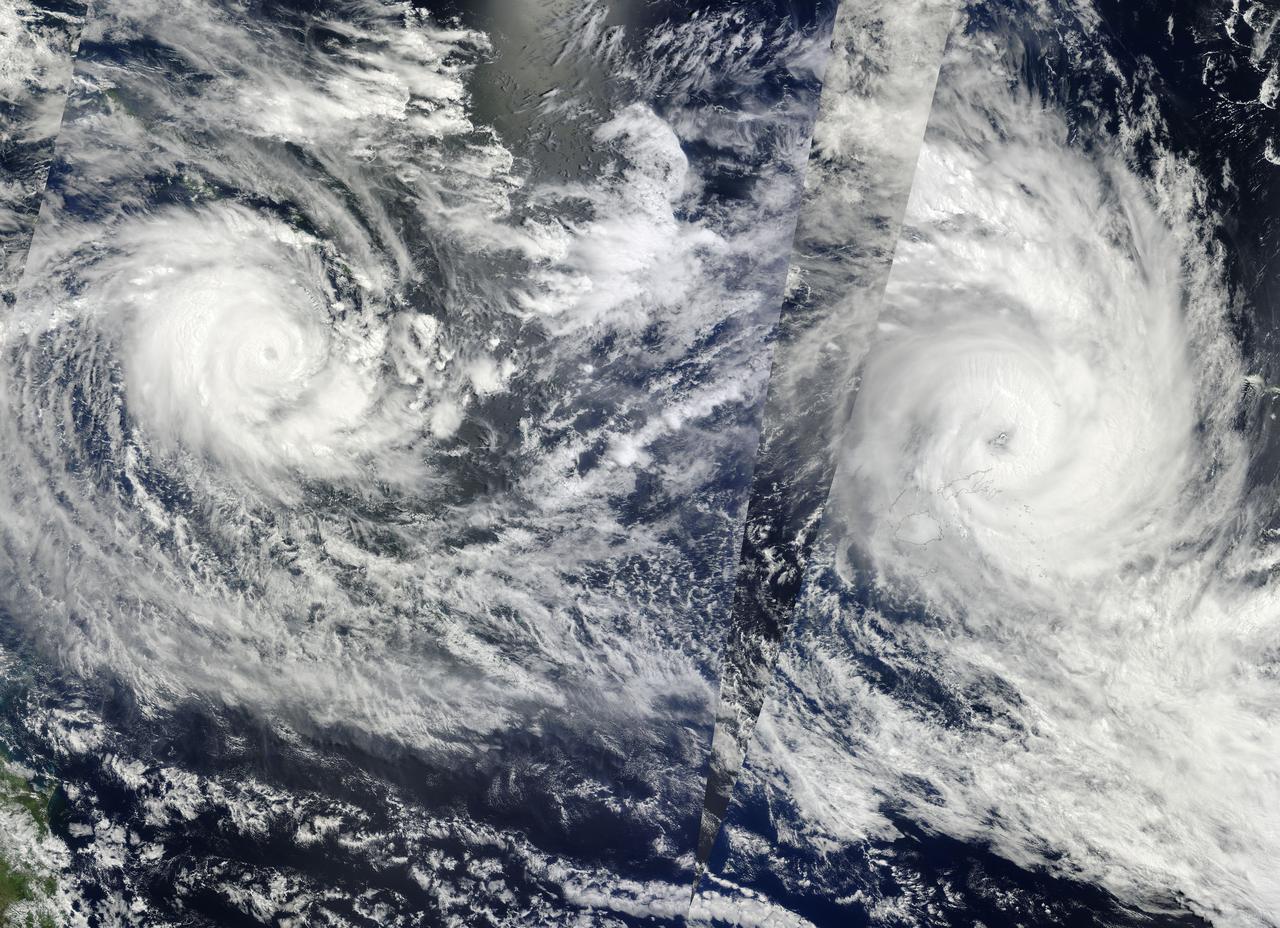
NASA Image acquired March 14 - 15, 2010 Two fierce tropical cyclones raged over the South Pacific Ocean in mid-March 2010, the U.S. Navy’s Joint Typhoon Warning Center (JTWC) reported. Over the Solomon Islands, Tropical Cyclone Ului had maximum sustained winds of 130 knots (240 kilometers per hour, 150 miles per hour) and gusts up to 160 knots (300 km/hr, 180 mph). Over Fiji, Tropical Cyclone Tomas had maximum sustained winds of 115 knots (215 km/hr, 132 mph) and gusts up to 140 knots (260 km/hr, 160 mph). The Moderate Resolution Imaging Spectroradiometer (MODIS) on NASA’s Terra and Aqua satellites captured both storms in multiple passes over the South Pacific on March 15, 2010, local time. The majority of the image is from the morning of March 15 (late March 14, UTC time) as seen by MODIS on the Terra satellite, with the right portion of the image having been acquired earliest. The wedge-shaped area right of center is from Aqua MODIS, and it was taken in the early afternoon of March 15 (local time). Although it packs less powerful winds, according to the JTWC, Tomas stretches across a larger area. It was moving over the northern Fiji islands when Terra MODIS captured the right portion of the image. According to early reports, Tomas forced more than 5,000 people from their homes while the islands sustained damage to crops and buildings. The JTWC reported that Tomas had traveled slowly toward the south and was passing over an area of high sea surface temperatures. (Warm seas provide energy for cyclones.) This storm was expected to intensify before transitioning to an extratropical storm. Ului is more compact and more powerful. A few hours before this image was taken, the storm had been an extremely dangerous Category 5 cyclone with sustained winds of 140 knots (260 km/hr, 160 mph). Ului degraded slightly before dealing the southern Solomon Islands a glancing blow. Initial news reports say that homes were damaged on the islands, but no one was injured. Like Tomas, Ului had been moving westward over an area of high sea surface temperatures. This storm was expected to continue moving westward before turning south and eventually weakening. The high-resolution image provided above is at 500 meters per pixel. The MODIS Rapid Response System provides this image at additional resolutions. NASA image by Jeff Schmaltz, MODIS Rapid Response Team, Goddard Space Flight Center. Caption by Michon Scott and Holli Riebeek. Instrument: Terra - MODIS To learn more about this image go here: <a href="http://earthobservatory.nasa.gov/IOTD/view.php?id=43154." rel="nofollow">earthobservatory.nasa.gov/IOTD/view.php?id=43154.</a>.
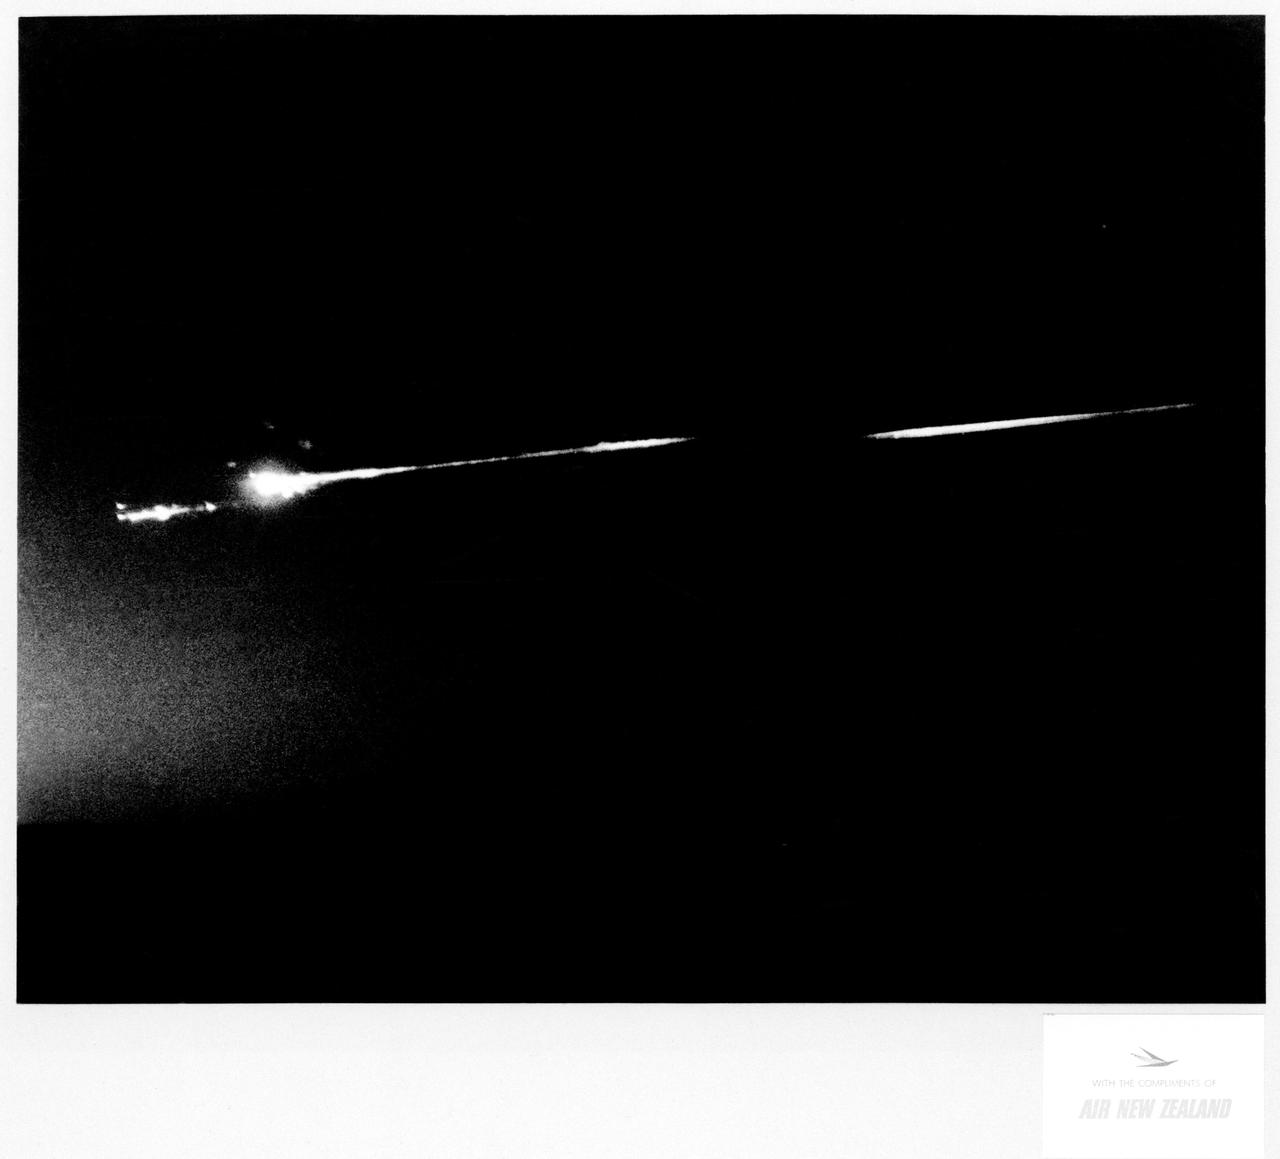
S70-17646 (18 April 1970) --- An unidentified airline passenger snapped these bright objects, believed to be the Apollo 13 Service Module (SM) and Lunar Module (LM) as they entered Earth's atmosphere over the Pacific Ocean on April 18, 1970. The aircraft, an Air New Zealand DC-8 was midway between the Fiji Islands (Nandi Island to be specific) and Auckland, New Zealand, when the photograph was taken. The crew men of the problem plagued Apollo 13 mission jettisoned the LM and SM prior to entering Earth's atmosphere in the Apollo 13 Command Module (CM).
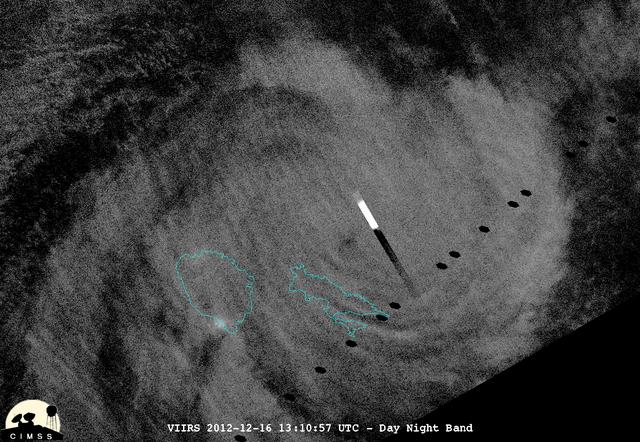
This night-time view of Cyclone Evan was taken from the Visible Infrared Imaging Radiometer Suite (VIIRS) on NASA/NOAA's Suomi National Polar-orbiting Partnership on Dec. 16, 2012. The rectangular bright object in the image is a lightning flash. "Because of the scan time as compared to how quickly lightning flashes, you get a nice streak in the data," said William Straka, of the University of Wisconsin-Madison, who provided this image. On Dec. 17 at 0900 UTC (4 a.m. EST), Cyclone Evan had maximum sustained winds near 115 knots (132 mph/213 kph). Evan was a Category 4 cyclone on the Saffir-Simpson Scale and was battering Fiji. Image Credit: NASA/NOAA/UWM/William Straka Text Credit: NASA Goddard/Rob Gutro <b><a href="http://www.nasa.gov/audience/formedia/features/MP_Photo_Guidelines.html" rel="nofollow">NASA image use policy.</a></b> <b><a href="http://www.nasa.gov/centers/goddard/home/index.html" rel="nofollow">NASA Goddard Space Flight Center</a></b> enables NASA’s mission through four scientific endeavors: Earth Science, Heliophysics, Solar System Exploration, and Astrophysics. Goddard plays a leading role in NASA’s accomplishments by contributing compelling scientific knowledge to advance the Agency’s mission. <b>Follow us on <a href="http://twitter.com/NASA_GoddardPix" rel="nofollow">Twitter</a></b> <b>Like us on <a href="http://www.facebook.com/pages/Greenbelt-MD/NASA-Goddard/395013845897?ref=tsd" rel="nofollow">Facebook</a></b> <b>Find us on <a href="http://instagrid.me/nasagoddard/?vm=grid" rel="nofollow">Instagram</a></b>
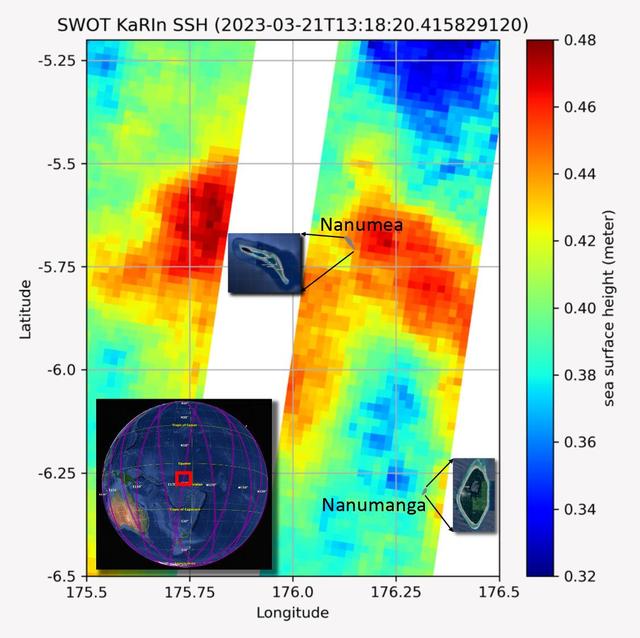
The recently launched Surface Water and Ocean Topography (SWOT) mission collected data on sea levels around two of the inhabited islands of Tuvalu, a nation in the South Pacific Ocean that has been threatened with sea level rise that substantially exceeds the global average. The image shows two areas of red that indicate higher than normal sea levels around two of Tuvalu's inhabited islands, Nanumanga and Nanumea. The higher sea levels were likely caused by internal tides or circular currents called eddies. The SWOT data illuminates for the first time these small ocean features that, when they occur on top of rising sea levels, can lead to episodic flooding along coastlines. The Tuvalu data was collected March 21, 2023. Rising seas are a direct consequence of climate change. On a global scale, the combination of warming ocean waters and ice melt from glaciers and ice sheets is leading to sea level rise that is occurring at an ever-increasing rate. The current rate of rise is more than 0.15 inches (4 millimeters) per year, an increase from 0.08 inches (2 millimeters) per year in 1993. This seemingly small increase holds great significance for coastal communities that have seen more than a century of persistent sea level rise. The gap between the average high tide and flooding conditions has narrowed, and coastal impacts driven by sea level rise have increased in frequency and severity in recent years. This is particularly true for low-lying island nations like Tuvalu, located about 620 miles (1,000 kilometers) north of Fiji. Sea level rise does not occur at the same rate everywhere across the globe, and can be exacerbated by natural ocean fluctuations that occur over time periods from years to decades. For Tuvalu, the amount of sea level rise has been substantially higher than the global average over the past three decades. The amount of rise, when coupled with Tuvalu's low land elevations, places the country increasingly under threat. In the near term, sea level rise will combine with naturally occurring ocean variability and storms to exacerbate events like coastal flooding. Monitoring and understanding sea level change is critical for Tuvalu and other low-lying island nations. Launched on Dec. 16, 2022, from Vandenberg Space Force Base in central California, SWOT collected the Tuvalu sea level data during a period of commissioning, calibration, and validation. Engineers are checking out the performance of the satellite's systems and science instruments before the planned start of science operations in summer 2023. https://photojournal.jpl.nasa.gov/catalog/PIA25777