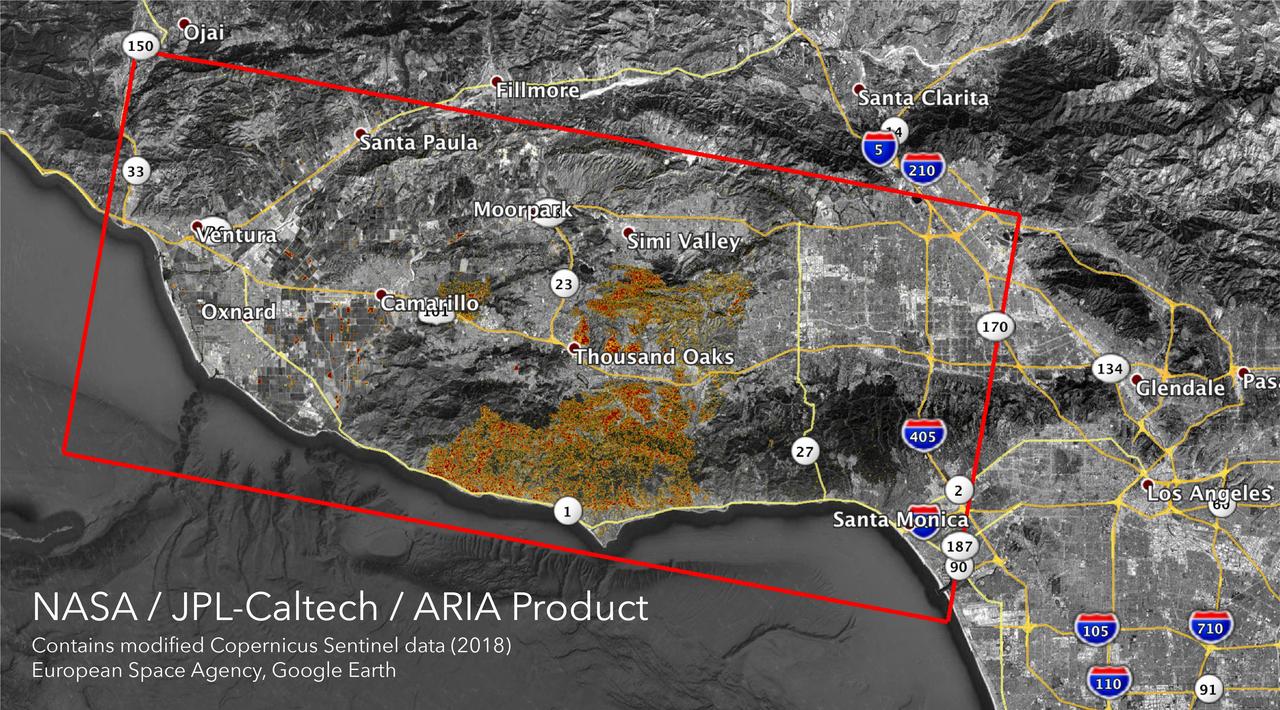
The Advanced Rapid Imaging and Analysis (ARIA) team at NASA's Jet Propulsion Laboratory in Pasadena, California, created these Damage Proxy Maps (DPMs) depicting areas in California likely damaged by the Woolsey and Camp Fires. They are derived from synthetic aperture radar (SAR) images from the Copernicus Sentinel-1 satellites, operated by the European Space Agency (ESA). The pre-event images for the Woolsey Fire in Southern California were taken before the fire on Oct. 30, 2018 and the post-event image was acquired during the fire on Nov. 11, 2018. The map covers an area of 50 miles x 25 miles (80 km x 40 km), indicated with the big red polygon. Each pixel measures about 33 yards x 33 yards (30 m x 30 m). The color variation from yellow to red indicates increasingly more significant ground surface change. The pre-event images for the Camp Fire in Northern California were taken on Nov. 4, 2018 and the post-event images were acquired during the fire on Nov. 10, 2018. The map covers an area of 55 miles x 48 miles (88 km x 77 km). As in the previous image, each pixel measures about 33 yards x 33 yards (30 m x 30 m). The color variation from yellow to red indicates increasingly more significant ground surface change. Preliminary validation for both maps was done by comparing approximate location data to Google's Crisismap. These damage proxy maps can be used as guidance to identify damaged areas with the understanding that they may be less reliable over vegetated areas including farmlands. For example, the scattered single colored pixels over vegetated areas may be false positives, and the lack of colored pixels over vegetated areas does not necessarily mean no damage. https://photojournal.jpl.nasa.gov/catalog/PIA22816
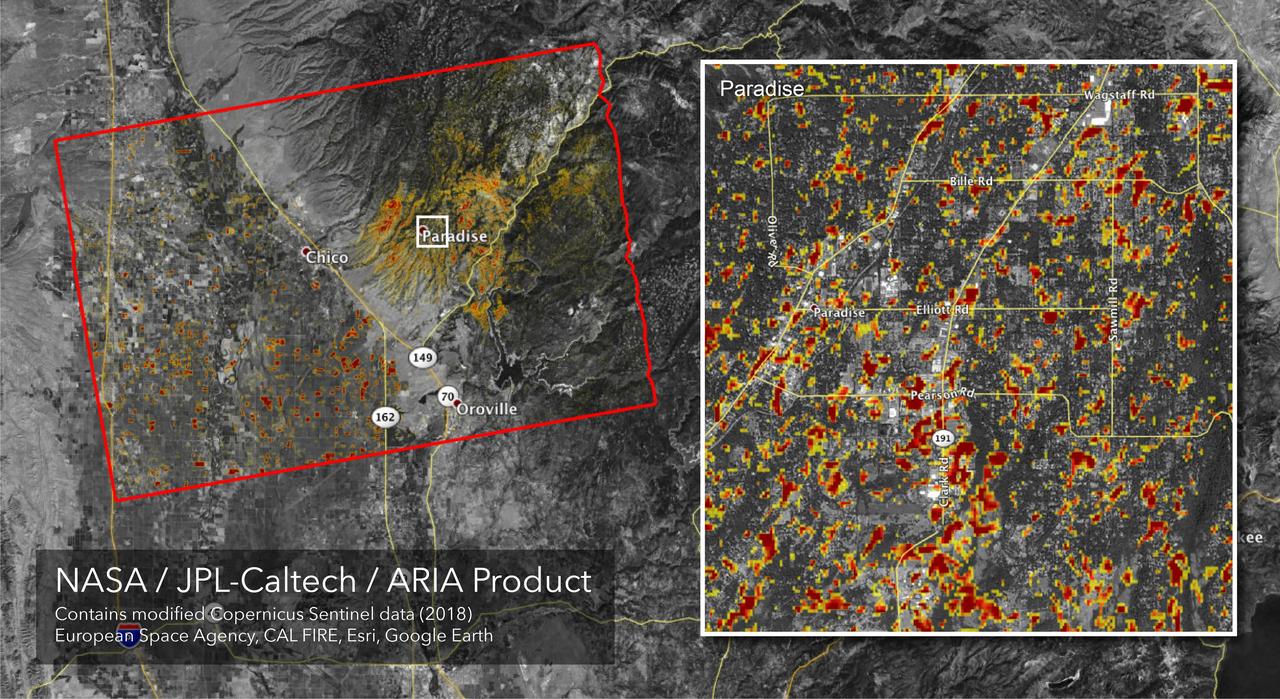
The Advanced Rapid Imaging and Analysis (ARIA) team at NASA's Jet Propulsion Laboratory in Pasadena, California, created this Damage Proxy Map (DPM) depicting areas of Northern California that are likely damaged (shown by red and yellow pixels) as a result of the Camp Fire. The map is derived from synthetic aperture radar (SAR) images from the Copernicus Sentinel-1 satellites, operated by the European Space Agency (ESA). The pre-event images were taken before (November 4, 2018) and the post-event image was acquired during the fire (6pm November 16, 2018, both local time). https://photojournal.jpl.nasa.gov/catalog/PIA22819
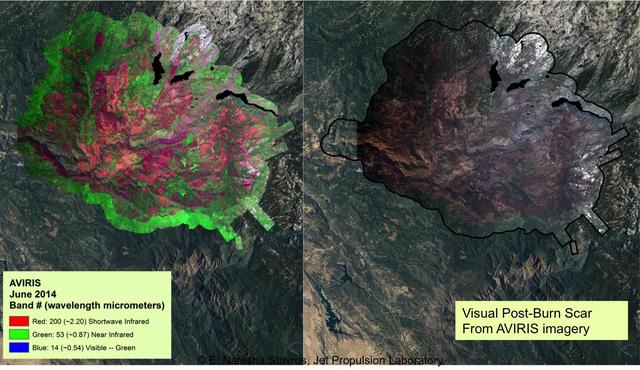
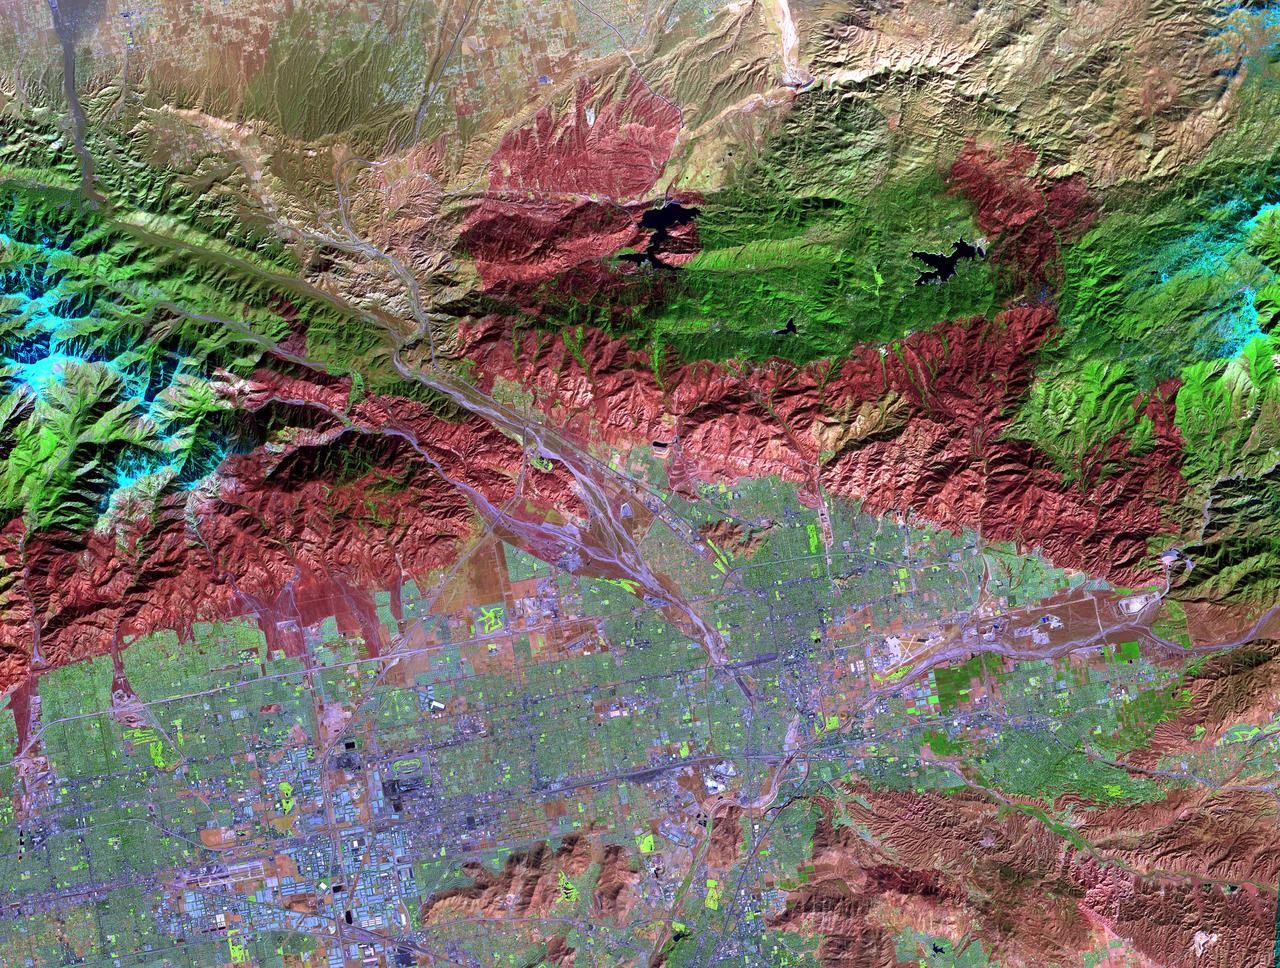
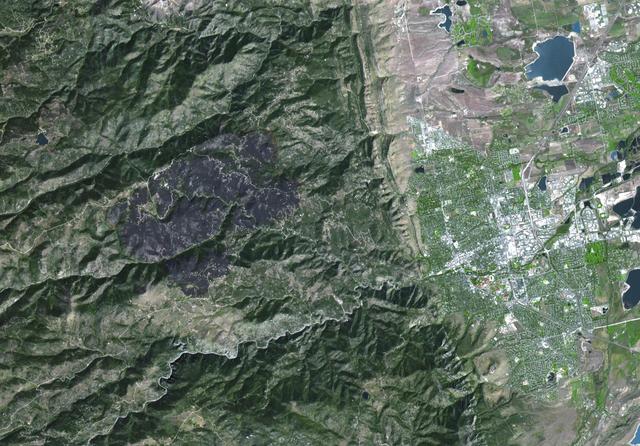
At left, a NASA AVIRIS map shows the spectral signature of the 2013 Rim fire in and near Yosemite National Park, California, the third largest in the state's history, burning more than 250,000 acres. Almost two years later, forest restoration efforts are still ongoing. Charred wood has a strong signal in the wavelengths shown here in red, so areas that are predominantly red in the image were heavily burned. The wavelengths of green, visible light (the color of vegetation) appear on this map as blue. There are no solid blue patches on the map because no large areas of green, living foliage survived the fire. Purple, a mixture of red and blue, indicates an area where charred wood and living plants are mingled. This image provides far more information about the state of the post-fire vegetation than the view on the right, which is what an observer flying overhead would see. AVIRIS is a unique NASA science instrument that measures the complete solar reflected portion of the electromagnetic spectrum with unmatched spectral range, calibration accuracy and signal-to-noise ratio. AVIRIS spectra are measured from 370 to 2,500 nanometers at 9.8-nanometer intervals. Images are acquired with 20-, 6- or 4-meter (66-, 20, or 13-feet) spatial resolution with a 34 degree swath. Up to 100 million spectra are measured in image format on each flight. The spectral image measurements are provided in orthorectified (geometrically corrected) format for direct use by scientists. http://photojournal.jpl.nasa.gov/catalog/PIA19361

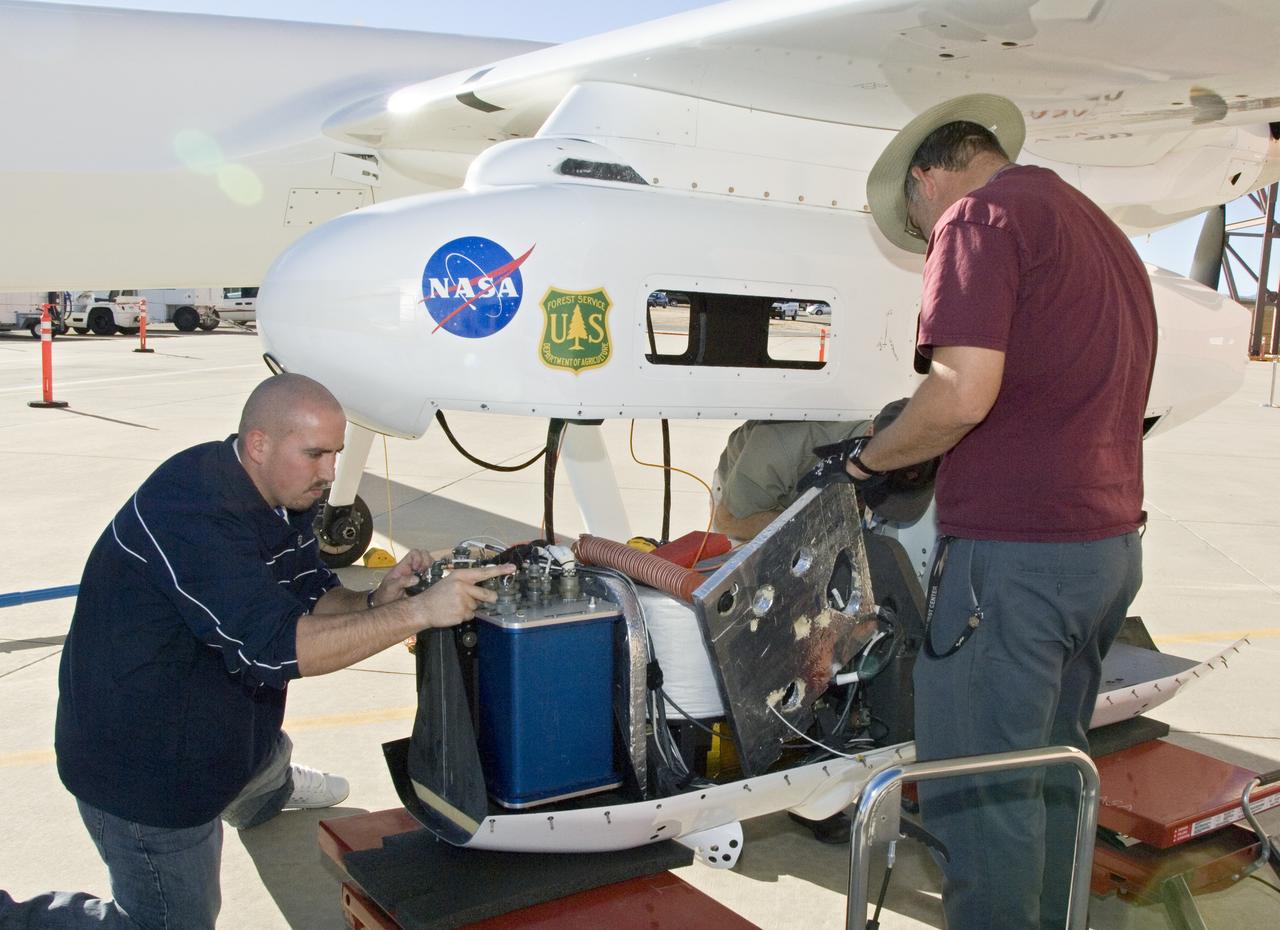
Equipped with a pod-mounted infrared imaging sensor, the Altair UAS aided fire mapping efforts over wildfires in central and southern California in late 2006.
A series of maps of the transport of carbon monoxide generated by Alaska Fires, July 2004, created by data from the Atmospheric Infrared Sounder AIRS on NASA Aqua satellite.
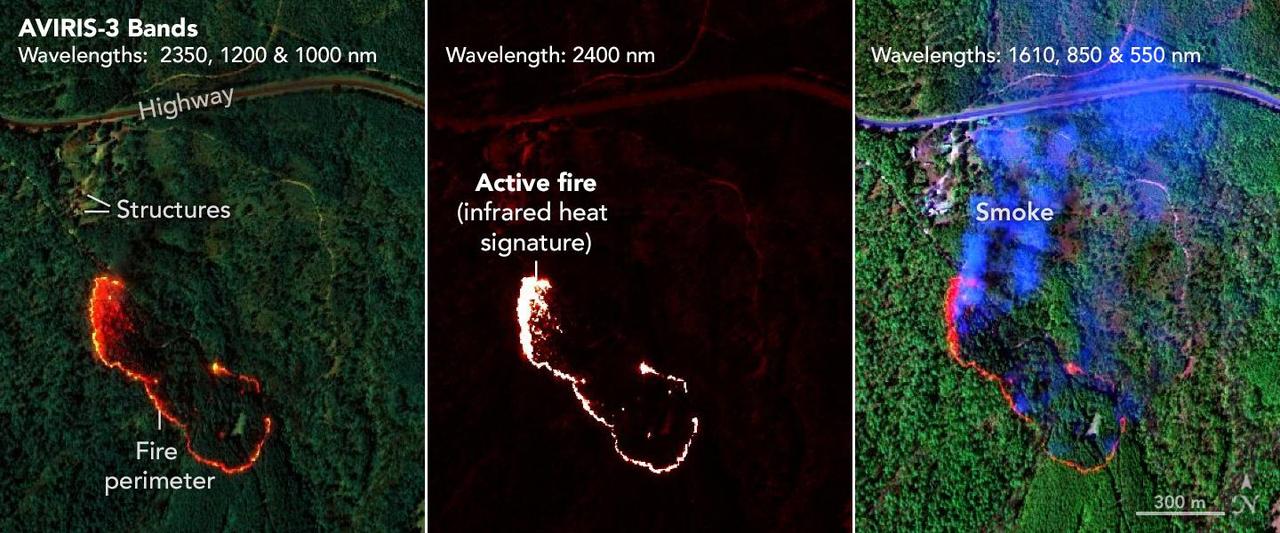
NASA's AVIRIS-3 sensor, an airborne imaging spectrometer built and operated by the agency's Jet Propulsion Laboratory in Southern California, captured infrared data on a wildfire about 3 miles (5 kilometers) west of the town of Mount Vernon, Alabama, on March 21, 2025. Within minutes of flying over, real-time maps of the fire were sent via satellite internet to firefighters with the Alabama Forestry Commission, who used it to contain the fire, preventing it from reaching four buildings. The first image in the series combines reflection data from AVIRIS-3 (Airborne Visible Infrared Imaging Spectrometer 3) at three infrared wavelengths that are invisible to the human eye – 2,350 nanometers, 1,200 nanometers, and 1,000 nanometers. In the resulting composite image, the colors indicate where the fire was burning most intensely. Orange and red areas show cooler-burning areas, while yellow indicates the most intense flames. Burned areas show up as dark red or brown. The second image in the series looks solely at the 2,400 nanometers wavelength. This wavelength is particularly useful for seeing hot spots and the perimeters of fires, which show brightly against a red background. The third image in the series combines light at 1,610 nanometers, 850 nanometers, and 550 nanometers. This view shows burn areas and smoke. The AVIRIS-3 sensor belongs to a line of imaging spectrometers built at JPL since 1986. The instruments have been used to study a wide range of phenomena – including fire – by measuring sunlight reflecting from the planet's surface. Data from imaging spectrometers like AVIRIS-3 typically takes days or weeks to be processed into highly detailed, multilayer image products used for research. By simplifying the calibration algorithms, researchers were able to process data on a computer aboard the plane in a sliver of the time it otherwise would have taken, and airborne satellite internet connectivity enabled the images to be distributed almost immediately, while the plane was still in flight, rather than after it landed. Flying about 9,000 feet (3,000 meters) in altitude aboard a NASA King Air B200 research plane, AVIRIS-3 collected data on the Castleberry Fire while preparing for prescribed burn experiments that took place in the Geneva State Forest in Alabama on March 28 and at Fort Stewart-Hunter Army Airfield in Georgia from April 14 to 20. The burns were part of a NASA 2025 FireSense Airborne Campaign. https://photojournal.jpl.nasa.gov/catalog/PIA26499
KRISHNA VADREVU ANALYZING LANDSAT AND DIGITAL ELEVATION DATA FOR FIRE HAZARD MAPPING STUDIES
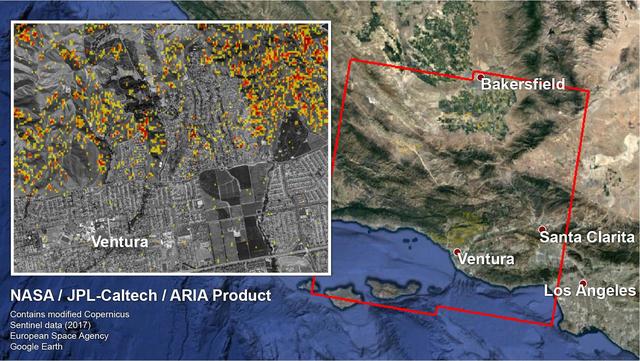
The Advanced Rapid Imaging and Analysis (ARIA) team at NASA's Jet Propulsion Laboratory in Pasadena, California, and Caltech, also in Pasadena, created a Damage Proxy Map (DPM) depicting areas in Southern California that are likely damaged (shown by red and yellow pixels) as a result of recent wildfires, including the Thomas Fire in Ventura and Santa Barbara Counties, highlighted in the attached image taken from the DPM. The map is derived from synthetic aperture radar (SAR) images from the Copernicus Sentinel-1 satellites, operated by the European Space Agency (ESA). The images were taken before (Nov. 28, 2017, 6 a.m. PST) and after (Dec. 10, 2017, 6 a.m. PST) the onset of the fires. The map covers an area of 107 by 107 miles (172 by 172 kilometers), shown by the large red polygon. Each pixel measures about 33 yards (30 meters) across. The color variation from yellow to red indicates increasingly more significant ground surface change. Preliminary validation was done by comparing the map to optical satellite imagery from DigitalGlobe. This damage proxy map should be used as guidance to identify damaged areas, and may be less reliable over vegetated areas. For example, the colored pixels seen over mountainous areas may seem a little scattered even though the reality could be that the contiguous areas were burned. Patches of farmland can also appear as signals due to plowing or irrigation. The full map is available to download from https://aria-share.jpl.nasa.gov/events/20171210-SoCal_Fire/. https://photojournal.jpl.nasa.gov/catalog/PIA22191
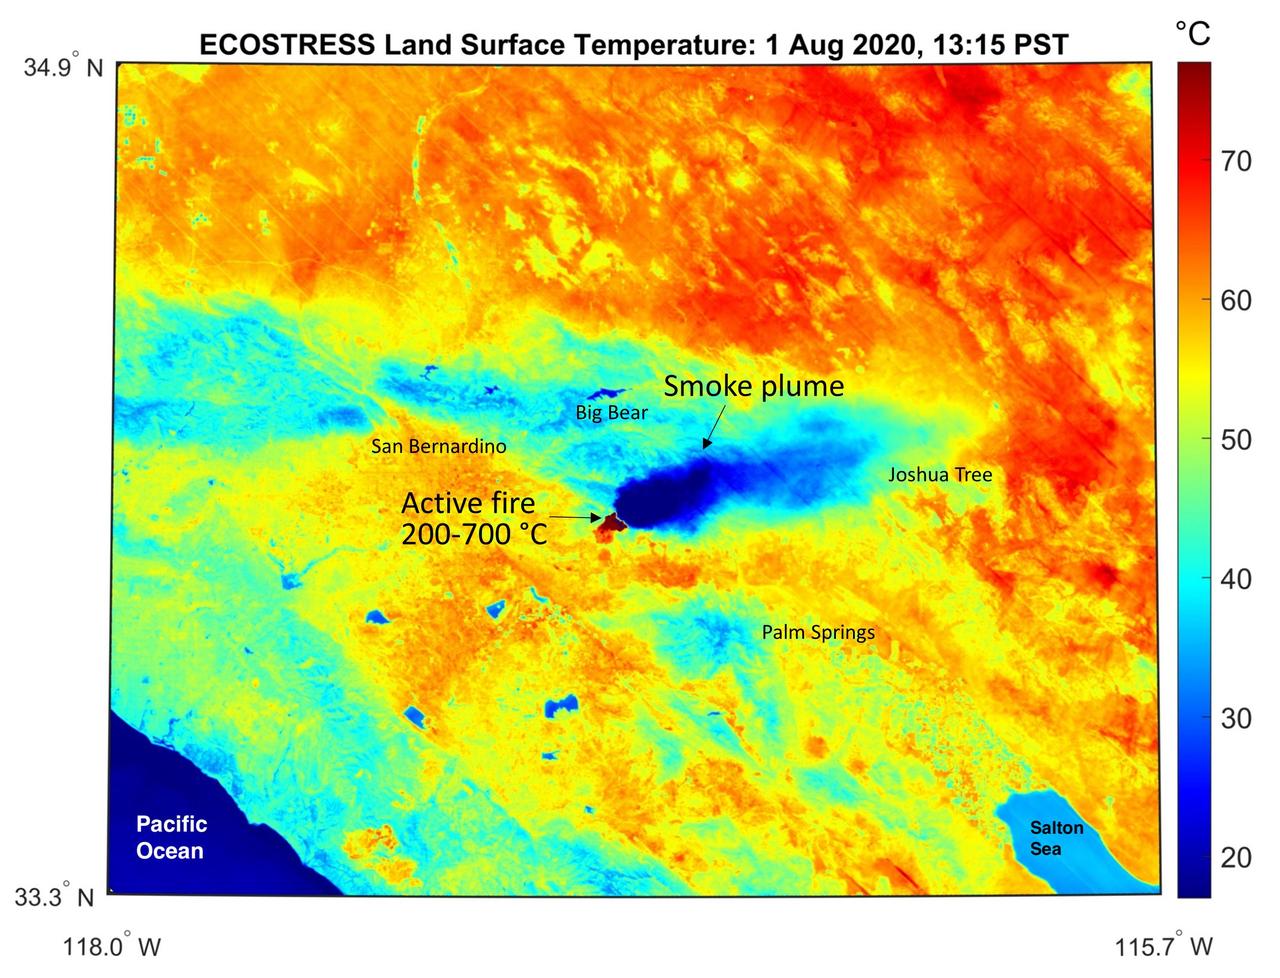
This temperature map shows the stressed and dry vegetation surrounding the Apple fire in Southern California on Aug. 1, 2020. The observation was made possible by NASA's Ecosystem Spaceborne Thermal Radiometer Experiment on Space Station (ECOSTRESS) that measured the temperature of the burn area and tracked the dark smoke plume drifting east from California to Arizona. ECOSTRESS collected this data when the space station passed over the region at about 1:15 p.m. PST on Saturday, Aug. 1, 2020, when the burn area was approximately 4,000 acres in size. Black smoke can be seen drifting east and over Joshua Tree National Park in the Mojave Desert. With a resolution of about 77 by 77 yards (70 by 70 meters), the image enables surface-temperature conditions down to the size of a football field to be studied. In the active burn area, temperatures of between 390-1290 F (200-700 C) were recorded, and in one pixel in the ECOSTRESS image of the burn zone, a peak temperature of 1387 F (753 C) was detected. Tasked with detecting plant water use and stress, ECOSTRESS measures the temperature of plants as they heat up when they run out of water. But it can also measure and track heat-related phenomena like fires, heat waves, and volcanoes. https://photojournal.jpl.nasa.gov/catalog/PIA23798
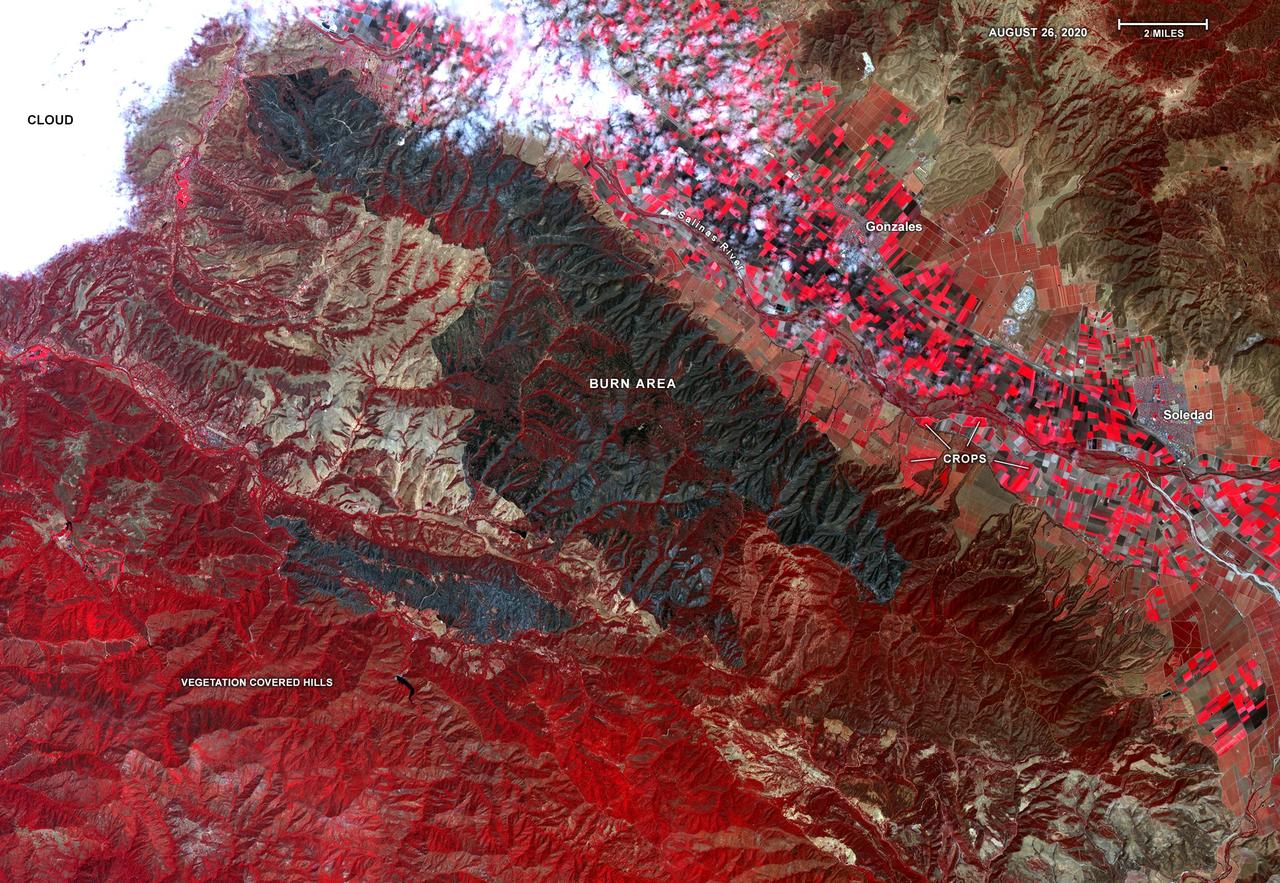
On Aug. 26, 2020, Advanced Spaceborne Thermal Emission and Reflection Radiometer (ASTER) instrument aboard NASA's Terra satellite passed over the River and Carmel fires in Monterey County, California, got a bird's eye view of the vast fire burn area. This false-color map shows the burn area as dark blue and gray, in the center of the image. Vegetation is in red, including agricultural crops along the Salinas River (bright red rectangles) surrounding the towns of Soledad and Gonzales; bare areas with no vegetation and rock are shown in tan and brown. The city of Salinas is in the upper left of the image, obscured by thick clouds. ASTER obtains high-resolution (15-90 square meters, or 161-969 square feet, per pixel) images of the Earth in 14 wavelengths of the electromagnetic spectrum, ranging from visible to thermal infrared light. Data from ASTER — which is managed by Japan Space Systems and NASA's Jet Propulsion Laboratory in Southern California — are used by scientists to create detailed maps of land surface temperature, how much infrared energy the land emits, how much light the land reflects and its elevation. On this occasion, ASTER was able to support NASA's Disaster Program response to the state's wildfires, providing data products that can be used by resources on the ground to fight the fires and for scientists to better understand their long-term effects. The area covered here is 21.4 by 31 miles (34.4 by 49.9 kilometers). https://photojournal.jpl.nasa.gov/catalog/PIA23800
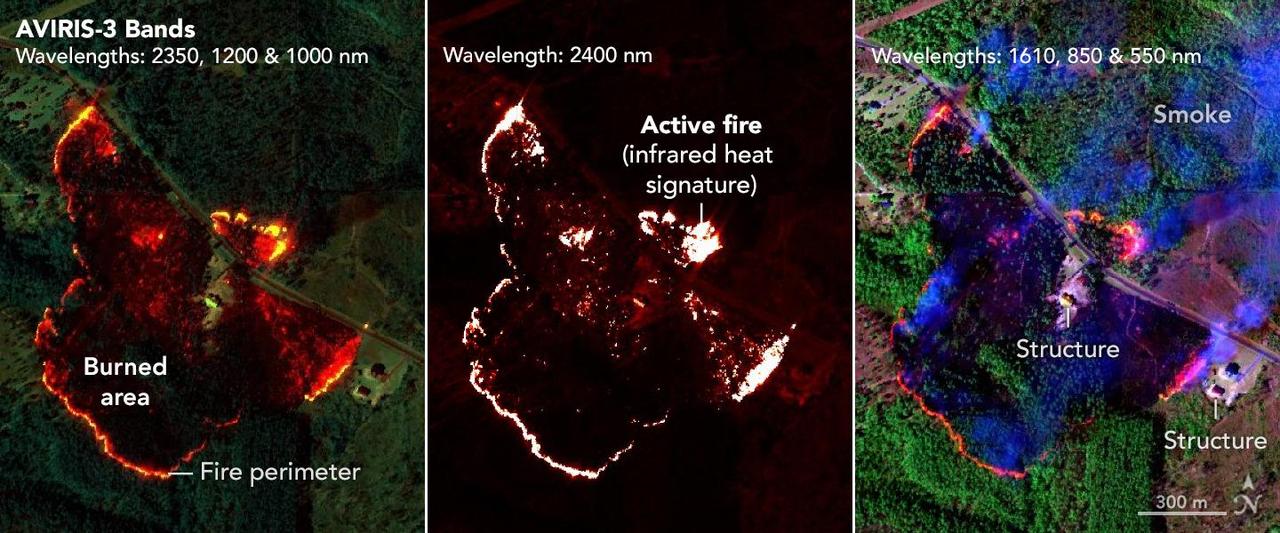
NASA's AVIRIS-3 sensor, an airborne imaging spectrometer built and operated by the agency's Jet Propulsion Laboratory in Southern California, captured infrared data of a wildfire 4 miles (2.5 kilometers) southwest of the unincorporated community of Perdido, Alabama, on March 21, 2025. Within minutes of flying over, real-time maps of the fire were sent via satellite internet to firefighters with the Alabama Forestry Commission, who used it to contain the fire, preventing it from reaching six buildings. The first image in the series combines reflection data from AVIRIS-3 (Airborne Visible Infrared Imaging Spectrometer 3) at three infrared wavelengths that are invisible to the human eye – 2,350 nanometers, 1,200 nanometers, and 1,000 nanometers. In the resulting composite image, the colors indicate where the fire was burning most intensely. Orange and red areas show cooler-burning areas, while yellow indicates the most intense flames. Burned areas show up as dark red or brown. The second image in the series looks solely at the 2,400 nanometers wavelength. The images are particularly useful for seeing hot spots and the perimeters of fires, which show brightly against a red background. The third image in the series combines light at 1,610 nanometers, 850 nanometers, and 550 nanometers. This view shows burn areas and smoke. The AVIRIS-3 sensor belongs to a line of imaging spectrometers built at JPL since 1986. The instruments have been used to study a wide range of phenomena – including fire – by measuring sunlight reflecting from the planet's surface. Data from imaging spectrometers like AVIRIS-3 typically takes days or weeks to be processed into highly detailed, multilayer image products used for research. By simplifying the calibration algorithms, researchers were able to process data on a computer aboard the plane in a sliver of the time it otherwise would have taken, and airborne satellite internet connectivity enabled the images to be distributed almost immediately, while the plane was still in flight, rather than after it landed. Flying about 9,000 feet (3,000 meters) in altitude aboard a NASA King Air B200 research plane, AVIRIS-3 collected data on the Castleberry Fire while preparing for prescribed burn experiments that took place in the Geneva State Forest in Alabama on March 28 and at Fort Stewart-Hunter Army Airfield in Georgia from April 14 to 20. The burns were part of a NASA 2025 FireSense Airborne Campaign. https://photojournal.jpl.nasa.gov/catalog/PIA26498
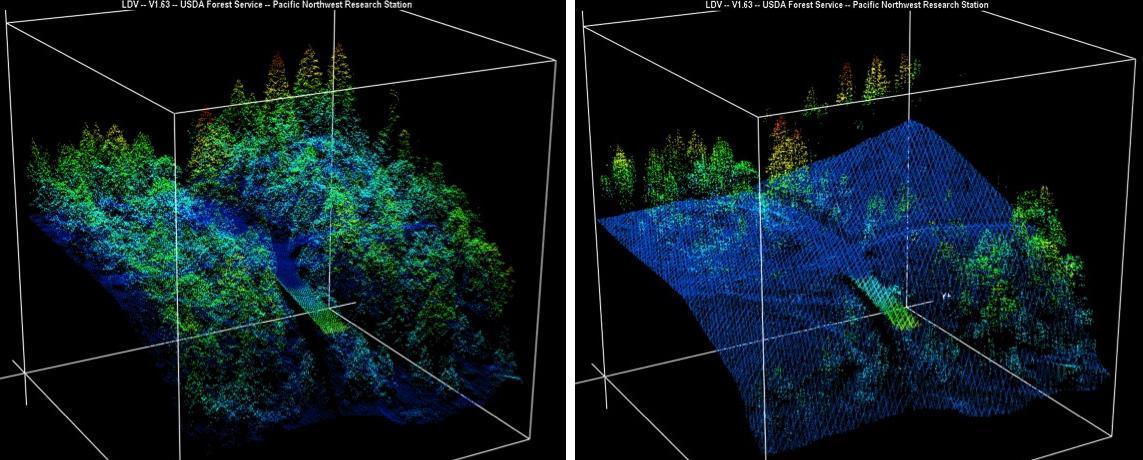
New maps of two recent California megafires that combine unique data sets from the U.S. Forest Service and NASA's Jet Propulsion Laboratory in Pasadena, California, are answering some of the urgent questions that follow a huge wildfire. These before-and-after USFS LIght Detection And Ranging (LIDAR) images from the 2014 King fire region in El Dorado National Forest, California are among new maps. They show a small section of the Rubicon River drainage basin, where fire damage was severe. Blue indicates ground level; lighter colors are higher. A road -- bordered by dense trees in the before image at left -- and part of a bridge are in the center, with the bridge appearing green. http://photojournal.jpl.nasa.gov/catalog/PIA19360
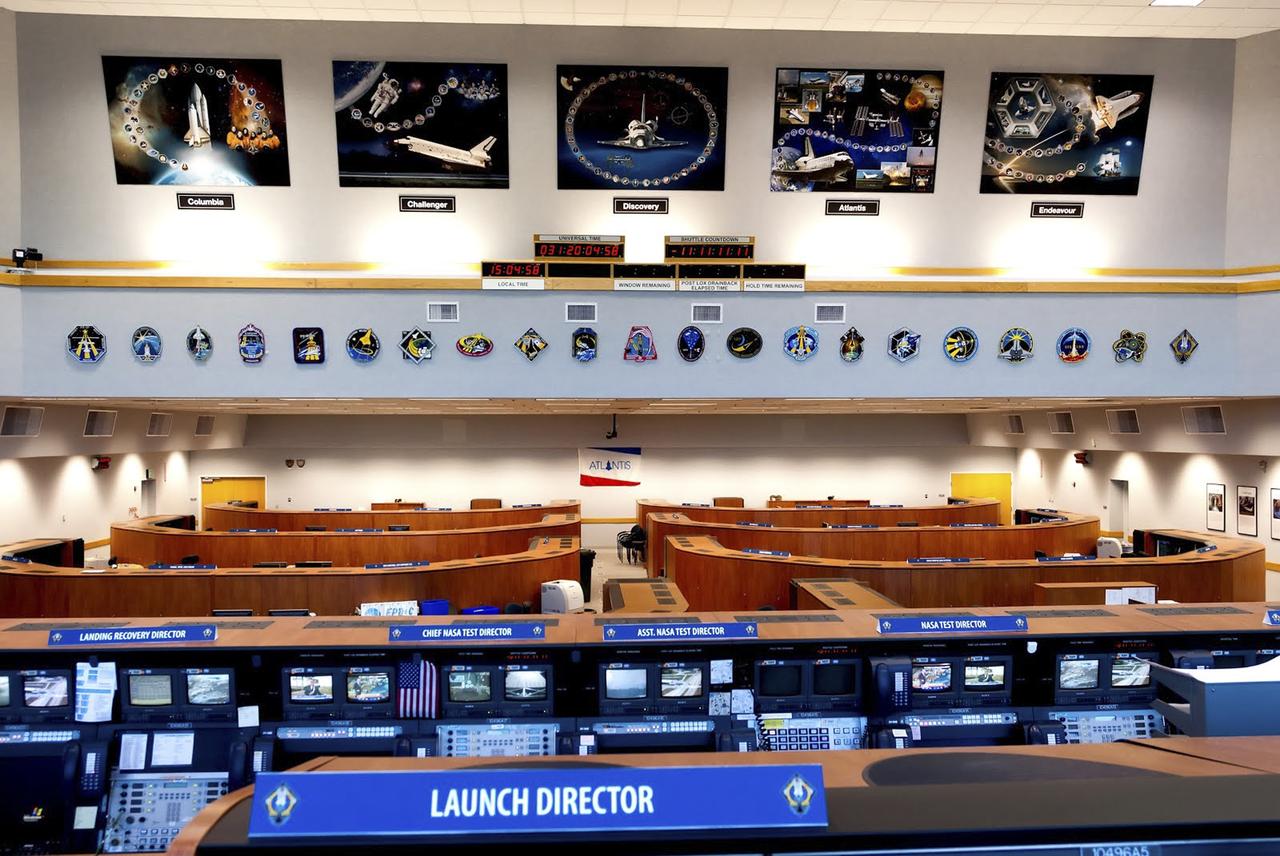
CAPE CANAVERAL, Fla. – As seen on Google Maps, Firing Room 4 inside the Launch Control Center at NASA's Kennedy Space Center was one of the four control rooms used by NASA and contractor launch teams to oversee a space shuttle countdown. This firing room was the most advanced of the control rooms used for shuttle missions and was the primary firing room for the shuttle's final series of launches before retirement. It is furnished in a more contemporary style with wood cabinets and other features, although it retains many of the computer systems the shuttle counted on to operate safely. Specialized operators worked at consoles tailored to keep track of the status of shuttle systems while the spacecraft was processed in the Orbiter Processing Facility, being stacked inside the Vehicle Assembly Building and standing at the launch pad before liftoff. The firing rooms, including 3, were also used during NASA's Apollo Program. Google precisely mapped the space center and some of its historical facilities for the company's map page. The work allows Internet users to see inside buildings at Kennedy as they were used during the space shuttle era. Photo credit: Google/Wendy Wang
NASA flew an aircraft equipped with Uninhabited Aerial Vehicle Synthetic Aperture Radar (UAVSAR) flew above California fires on Sept. 3 and 10. The smoke-penetrating UAVSAR enables scientists to get a close-up view of how these fires have altered the landscape. Attached to the bottom of the aircraft, the radar is flown repeatedly over an area to measure tiny changes in surface height with extreme accuracy. The flight is part of the ongoing effort by NASA's Applied Sciences Disaster Program in the Earth Sciences Division, which generates maps and other data products that can be used by partner agencies on the ground to track fire hotspots, map the extent of the burn areas, and even measure the height of the smoke plumes that have drifted over California and neighboring states. Movie available at https://photojournal.jpl.nasa.gov/catalog/PIA24102
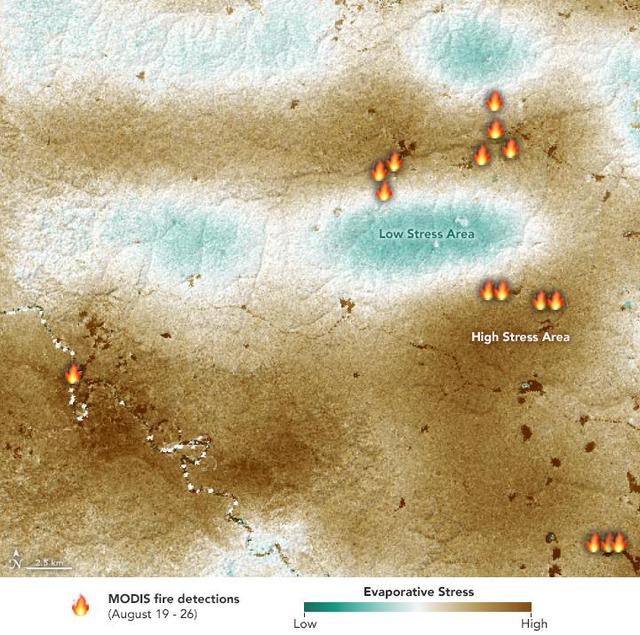
NASA's ECOsystem Spaceborne Thermal Radiometer Experiment on Space Station (ECOSTRESS) sensor measured the water-stress levels of plants when it passed over the Peruvian Amazon rainforest on Aug. 7, 2019, before the fires there began. The map shows areas of plants in distress (brown) and areas of less stress (blue). Water-stressed plants released measurably less water vapor into the air at the time of the summer fires. The fire icons represent fires imaged by NASA's Terra satellite between Aug. 19 and 26. The burn pattern reveals that the fires were concentrated in areas of highly water-stressed plants, pointing to how water-stressed plants can impact the spread of fires. The data may one day help NASA's Earth-observing missions predict the path of future forest or brush fires. https://photojournal.jpl.nasa.gov/catalog/PIA23432
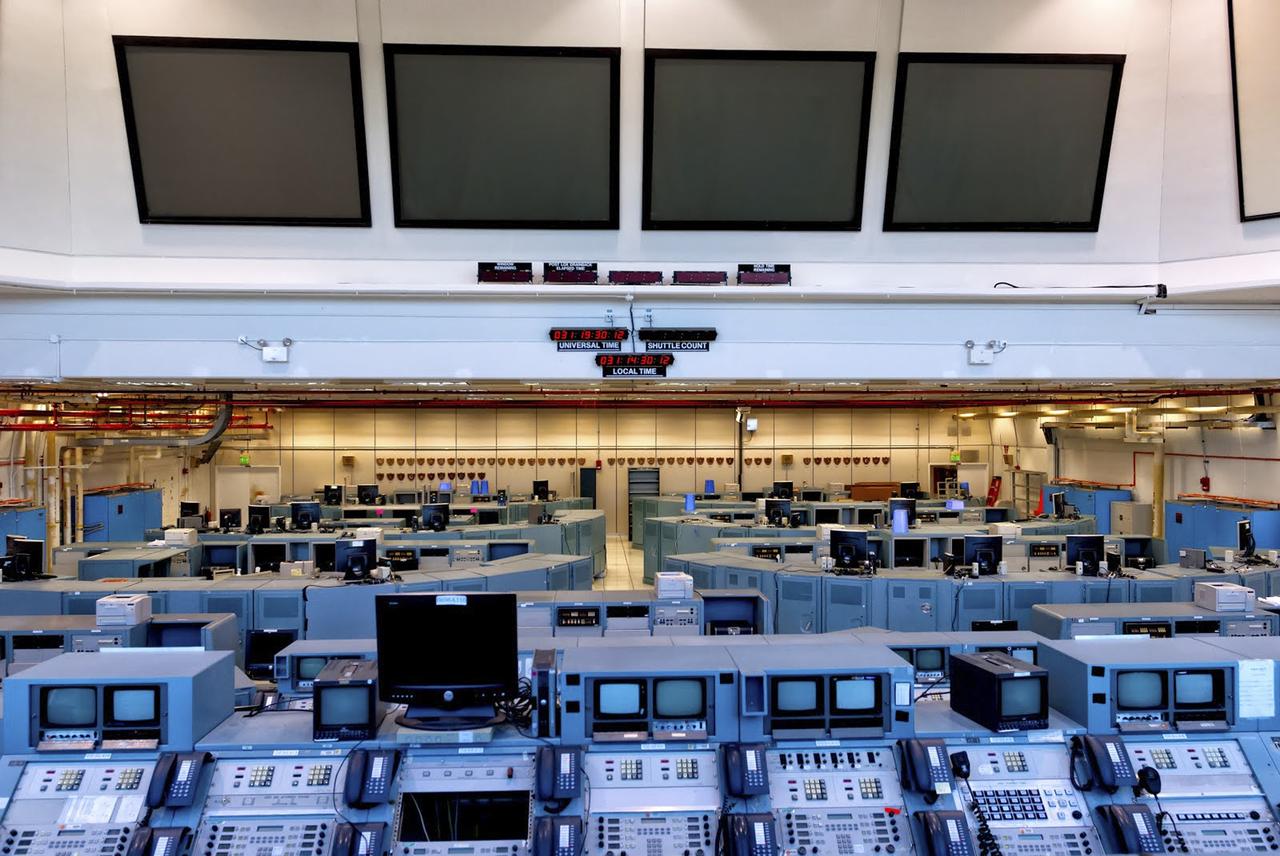
CAPE CANAVERAL, Fla. – As seen on Google Maps, Firing Room 3 inside the Launch Control Center at NASA's Kennedy Space Center was one of the four control rooms used by NASA and contractor launch teams to oversee a space shuttle countdown. This firing room is furnished in the classic style with the same metal computer cabinets and some of the same monitors in place when the first shuttle mission launched April 12, 1981. Specialized operators worked at consoles tailored to keep track of the status of shuttle systems while the spacecraft was processed in the Orbiter Processing Facility, being stacked inside the Vehicle Assembly Building and standing at the launch pad before liftoff. The firing rooms, including 3, were also used during NASA's Apollo Program. Google precisely mapped the space center and some of its historical facilities for the company's map page. The work allows Internet users to see inside buildings at Kennedy as they were used during the space shuttle era. Photo credit: Google/Wendy Wang
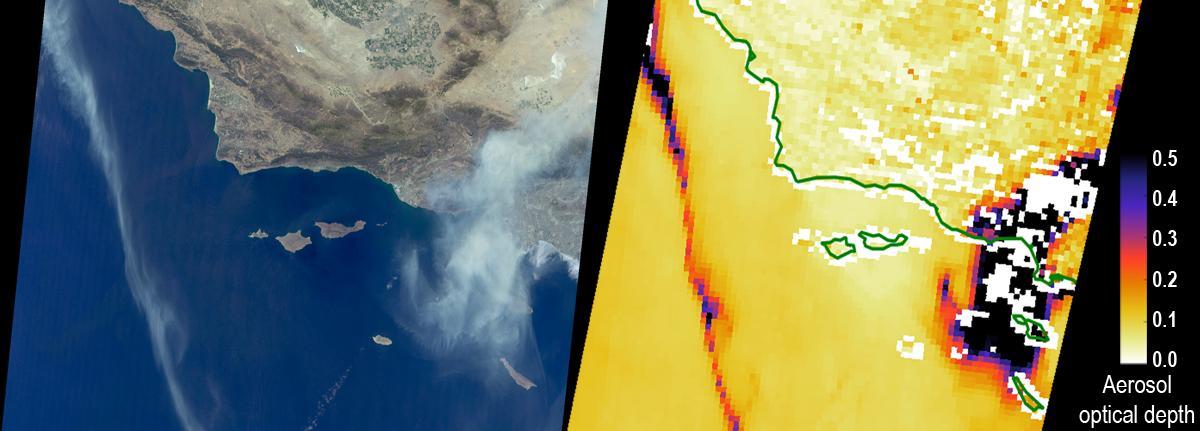
The Sand Fire in the Santa Clarita Valley area of Southern California erupted on Friday, July 22, 2016, and rapidly grew to more than 37,000 acres (58 square miles, or 150 square kilometers) over the weekend. As of Tuesday, July 26, hundreds of residents still remain under evacuation orders, and the fire claimed the life of a local resident. The fire is currently 25 percent contained. The Multi-angle Imaging SpectroRadiometer (MISR) instrument aboard NASA's Terra satellite passed over the region on July 23 around 11:50 a.m. PDT. At left is an image acquired by MISR's 60-degree forward-viewing camera. The oblique view angle makes the smoke more apparent than it would be in a more conventional vertical view. Smoke from the Sand Fire is visible on the right-hand side of the image, and a long streamer of smoke from the Soberanes Fire near Big Sur in Central California is visible over the ocean near the left-hand side of the image. Like the Sand Fire, the Soberanes Fire also broke out on July 22, and quickly grew to more than 19,000 acres (30 square miles, or 77 square kilometers), causing the evacuation of hundreds of people and closure of several state parks. The Soberanes Fire is currently only 10 percent contained. The swath width of the MISR image is 257 miles (414 kilometers). At right is a map of aerosol optical depth, a quantitative measure of the smoke abundance in the atmosphere, derived from the images acquired by MISR's nine differently angled cameras. The thick smoke from both fires is apparent. Individual squares making up this map measure 2.7 miles (4.4 kilometers) on a side. The product shown here is a prototype of a new version of the MISR aerosol product to be publicly released in the near future, and increases the spatial resolution of the aerosol information by a factor of 16 compared to the currently available product, making it possible to discern finer details in the distribution of the smoke. These data were captured during Terra orbit 88284. http://photojournal.jpl.nasa.gov/catalog/PIA20720

NASA's Airborne Visible Infrared Imaging Spectrometer instrument (AVIRIS), flying aboard a NASA Armstrong Flight Research Center high-altitude ER-2 aircraft, observed wildfires burning in Southern California on Dec. 5-7, 2017. AVIRIS is an imaging spectrometer that observes light in visible and infrared wavelengths, measuring the full spectrum of radiated energy. Unlike regular cameras with three colors, AVIRIS has 224 spectral channels, measuring contiguously from the visible through the shortwave infrared. Data from these flights, compared against measurements acquired earlier in the year, show many ways this one instrument can improve both our understanding of fire risk and the response to fires in progress. The top row in this image compilation shows pre-fire data acquired from June 2017. At top left is a visible-wavelength image similar to what our own eyes would see. The top middle image is a map of surface composition based on analyzing the full electromagnetic spectrum, revealing green vegetated areas and non-photosynthetic vegetation that is potential fuel as well as non-vegetated surfaces that may slow an advancing fire. The image at top right is a remote measurement of the water in tree canopies, a proxy for how much moisture is in the vegetation. The bottom row in the compilation shows data acquired from the Thomas fire in progress in December 2017. At bottom left is a visible wavelength image. The bottom middle image is an infrared image, with red at 2,250 nanometers showing fire energy, green at 1,650 nanometers showing the surface through the smoke, and blue at 1,000 nanometers showing the smoke itself. The image at bottom right is a fire temperature map using spectroscopic analysis to measure fire thermal emission recorded in the AVIRIS spectra. https://photojournal.jpl.nasa.gov/catalog/PIA22194
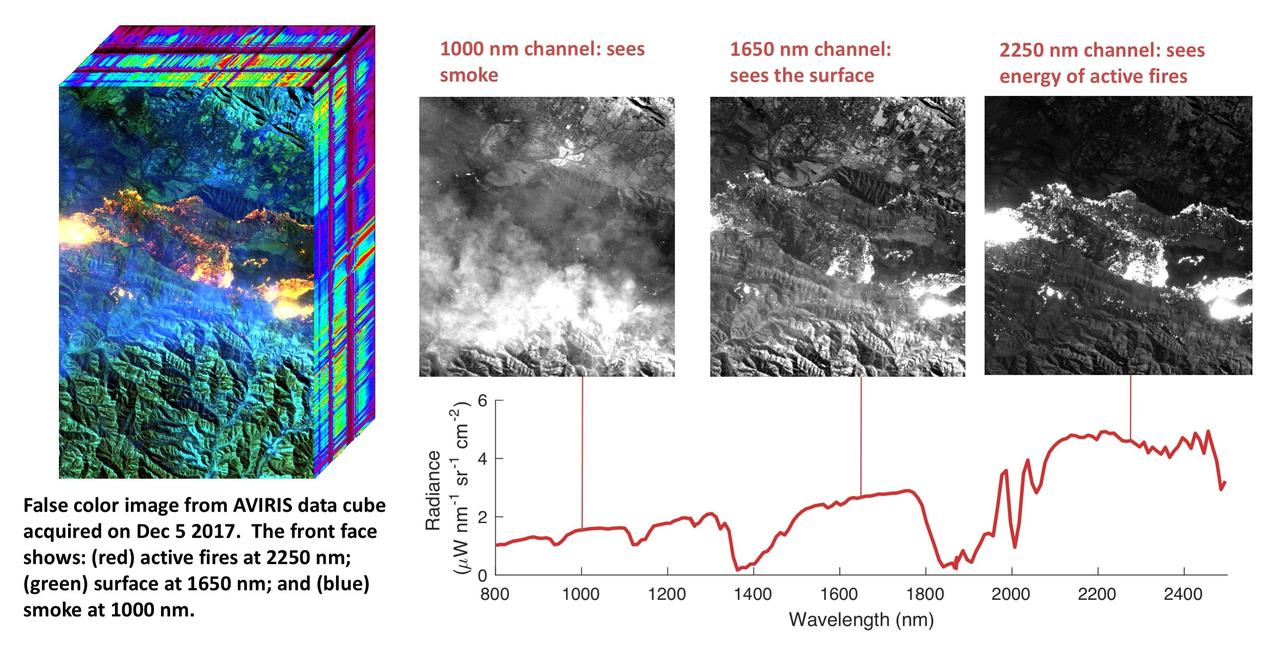
NASA's Airborne Visible Infrared Imaging Spectrometer instrument (AVIRIS), flying aboard a NASA Armstrong Flight Research Center high-altitude ER-2 aircraft, flew over the wildfires burning in Southern California on Dec. 5, 2017 and acquired this false-color image. Active fires are visible in red, ground surfaces are in green and smoke is in blue. AVIRIS is an imaging spectrometer that observes light in visible and infrared wavelengths, measuring the full spectrum of radiated energy. Unlike regular cameras with three colors, AVIRIS has 224 spectral channels from the visible through the shortwave infrared. This permits mapping of fire temperatures, fractional coverage, and surface properties, including how much fuel is available for a fire. Spectroscopy is also valuable for characterizing forest drought conditions and health to assess fire risk. AVIRIS has been observing fire-prone areas in Southern California for many years, forming a growing time series of before/after data cubes. These data are helping improve scientific understanding of fire risk and how ecosystems respond to drought and fire. https://photojournal.jpl.nasa.gov/catalog/PIA11243
On November 18, 2003, the Advanced Spaceborne Thermal Emission and Reflection Radiometer (ASTER) on NASA's Terra satellite acquired this image of the Old Fire/Grand Prix fire east of Los Angeles. The image is being processed by NASA's Wildfire Response Team and will be sent to the United States Department of Agriculture's Forest Service Remote Sensing Applications Center (RSAC) which provides interpretation services to Burned Area Emergency Response (BAER) teams to assist in mapping the severity of the burned areas. The image combines data from the visible and infrared wavelength regions to highlight the burned areas. http://photojournal.jpl.nasa.gov/catalog/PIA04879
The Advanced Spaceborne Thermal Emission and Reflection Radiometer ASTER instrument aboard NASA Terra spacecraft captured this image of the Fourmile Canyon fire west of Boulder Colo., on Sept. 17, 2010; it was 100 percent contained.
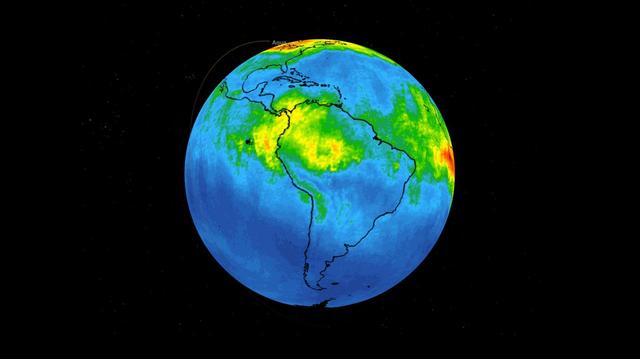
This time series shows carbon monoxide associated with fires from the Amazon region in Brazil from Aug. 8-22, 2019. The images show carbon monoxide at an hPA — a common unit of measurement for atmospheric pressure — of 500, or approximately 18,000 feet (5,500 meters) altitude, made with data collected from the Atmospheric Infrared Sounder (AIRS) on NASA's Aqua satellite. Each "day" in the series is made by averaging three day's-worth of measurements, a technique used to eliminate data gaps. As the series progresses, the carbon monoxide plume blooms in the northwest Amazon region then drifts south and east in a more concentrated plume toward Sao Paulo. Green indicates concentrations of carbon monoxide at approximately 100 parts per billion by volume (ppbv), yellow at approximately 120 ppbv, and dark red at approximately 160 ppbv. It must be noted that local values can be significantly higher. Carbon monoxide is a pollutant that can be transported large distances and persist in the atmosphere for about one month. It plays a role in both air pollution and climate change. Movie available at https://photojournal.jpl.nasa.gov/catalog/PIA23356
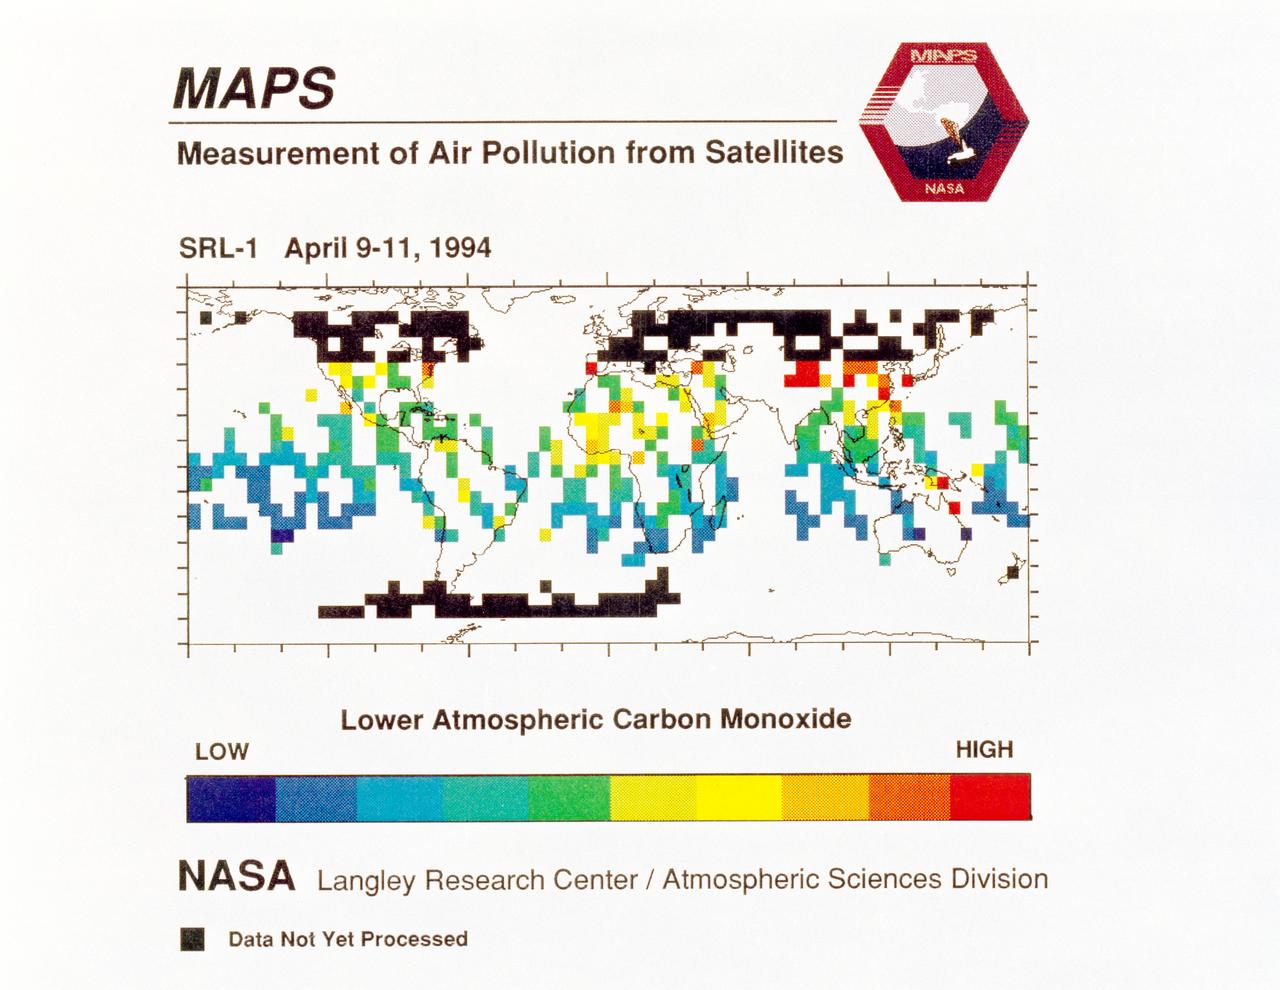
STS059-S-040 (12 April 1994) --- STS-59's MAPS (Measurement of Air Pollution from Satellites) experiment is sending real-time data that provides the most comprehensive view of carbon monoxide concentrations on Earth ever recorded. This computer image shows a summary of "quick look" data obtained by the MAPS instrument during its first days of operations as part of the Space Shuttle Endeavour's SRL-1 payload. This data will be processed using more sophisticated techniques following the flight. The color red indicates areas with the highest levels of carbon monoxide. These Northern Hemisphere springtime carbon monoxide values are generally significantly higher than the values found in the Southern Hemisphere. This is in direct contrast to the data obtained by the MAPS experiment during November 1981 and October 1984, i.e. during Northern Hemisphere fall. The astronauts aboard Endeavour have seen fires in most of the areas showing higher carbon monoxide values (China, Eastern Australia, and equatorial Africa). The relationship between the observed fires and the higher carbon monoxide values will be investigated following SRL-1 by combining the MAPS data with meteorological data, surface imagery, and Space Shuttle hand-held photographs. By the end of SRL-1, MAPS will have acquired data over most of the globe between 57 degrees north and 57 degrees south latitudes. The entire data set will be carefully analyzed using sophisticated post-flight data processing techniques. The data will then be applied in a variety of scientific studies concerning chemistry and transport processes in the atmosphere. The MAPS experiment measures the carbon monoxide in the lower atmosphere. This gas is produced both as a result of natural processes and as a result of human activities. The primary human resources of carbon monoxide are automobiles and industry and the burning of plant materials. The primary natural source is the interaction of sunlight with naturally occurring ozone and water vapor. The strength of all of these sources changes seasonally.

NASA's ECOsystem Spaceborne Thermal Radiometer Experiment on Space Station (ECOSTRESS) has imaged a temperature profile of an area surrounding a fire-induced tornado in Loyalton, California. A 20,000-acre wildfire early on Saturday, Aug. 15, 2020, had been the source of the tornado. Fire tornados are rare occurrences and happen due to the most unfavorable weather conditions: harsh winds and a surge in heat from a fire. They have the potential to be highly dangerous, leading to many areas to issue a weather alert to their residents to stay cautious and find places of shelter. In this map, there is a concentrated area of high temperature, which is likely where the fire-induced tornado had taken place. Also present in the image are very cold clouds, possibly representing the pyrocumulonimbus cloud that usually forms above a fire tornado. The National Weather Service (NWS) also suggested outflow winds in excess of 60 mph, which points to the event to be an EF1 or EF2 tornado. https://photojournal.jpl.nasa.gov/catalog/PIA23215
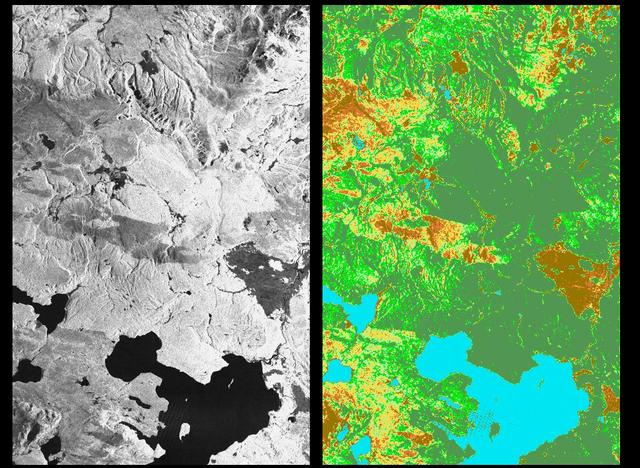
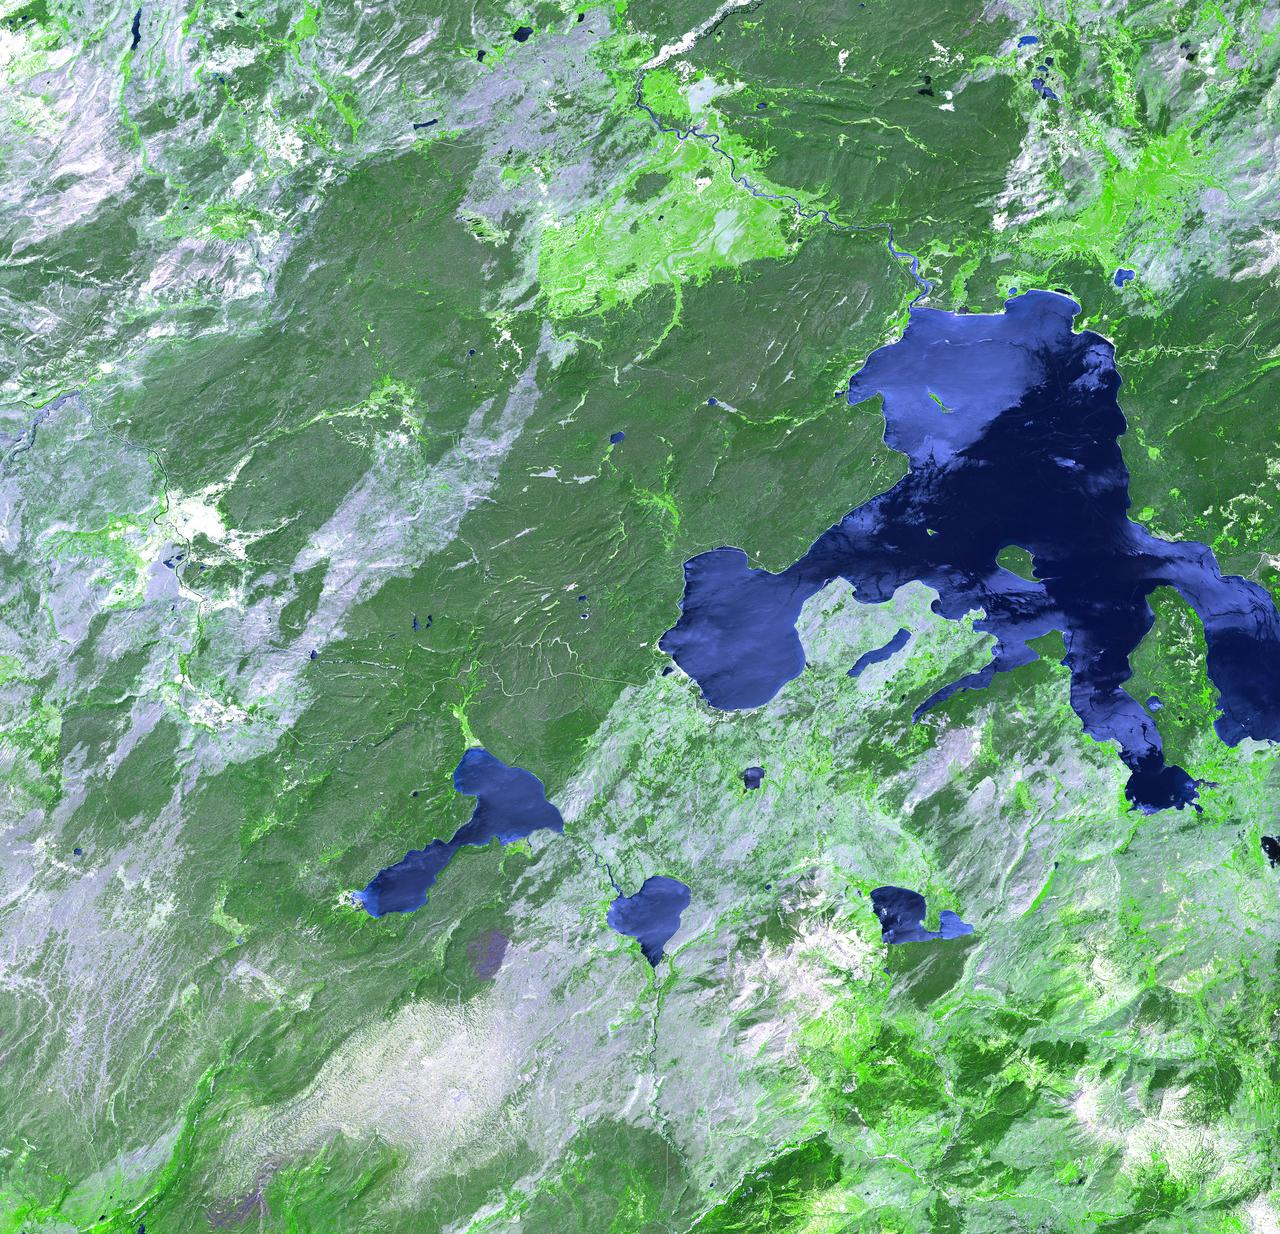
These two radar images show the majestic Yellowstone National Park, Wyoming, the oldest national park in the United States and home to the world's most spectacular geysers and hot springs. The region supports large populations of grizzly bears, elk and bison. In 1988, the park was burned by one of the most widespread fires to occur in the northern Rocky Mountains in the last 50 years. Surveys indicated that 793,880 acres of land burned. Of that, 41 percent was burned forest, with tree canopies totally consumed by the fire; 35 percent was a combination of unburned, scorched and blackened trees; 13 percent was surface burn under an unburned canopy; 6 percent was non-forest burn; and 5 percent was undifferentiated burn. Six years later, the burned areas are still clearly visible in these false-color radar images obtained by the Spaceborne Imaging Radar-C/X-band Synthetic Aperture Radar on board the space shuttle Endeavour. The image at the left was obtained using the L-band radar channel, horizontally received and vertically transmitted, on the shuttle's 39th orbit on October 2, 1994. The area shown is 45 kilometers by 71 kilometers (28 miles by 44 miles) in size and centered at 44.6 degrees north latitude, 110.7 degrees west longitude. North is toward the top of the image (to the right). Most trees in this area are lodge pole pines at different stages of fire succession. Yellowstone Lake appears as a large dark feature at the bottom of the scene. At right is a map of the forest crown, showing its biomass, or amount of vegetation, which includes foliage and branches. The map was created by inverting SIR-C data and using in situ estimates of crown biomass gathered by the Yellowstone National Biological Survey. The map is displayed on a color scale from blue (rivers and lakes with no biomass) to brown (non-forest areas with crown biomass of less than 4 tons per hectare) to light brown (areas of canopy burn with biomass of between 4 and 12 tons per hectare). Yellow indicates areas of canopy burn and mixed burn with a biomass of between 12 to 20 tons per hectare; light green is mixed burn and on-burn forest with a biomass of 20 to 35 tons per hectare; and green is non-burned forest with a biomass of greater than 35 tons per hectare. Forest recovery from the fire seems to depend on fire intensity and soil conditions. In areas of severe canopy burn and poor soil conditions, crown biomass was still low in 1994 (indicated by the brown areas at the center left), whereas in areas of mixed burn with nutrient-rich soils, seen west of Yellowstone Lake, crown biomass has increased significantly in six years (indicated by the yellow and light green areas). Imaging fire-affected regions with spaceborne radar illustrates SIR-C/X-SAR's keen abilities to monitor regrowth after a fire. Knowing the amount of carbon accumulated in the atmosphere by regenerating forest in the 20 to 50 years following a fire disturbance is also a significant factor in understanding the global carbon cycle. Measuring crown biomass is necessary to evaluate the effects of past and future fires in specific regions. http://photojournal.jpl.nasa.gov/catalog/PIA01741
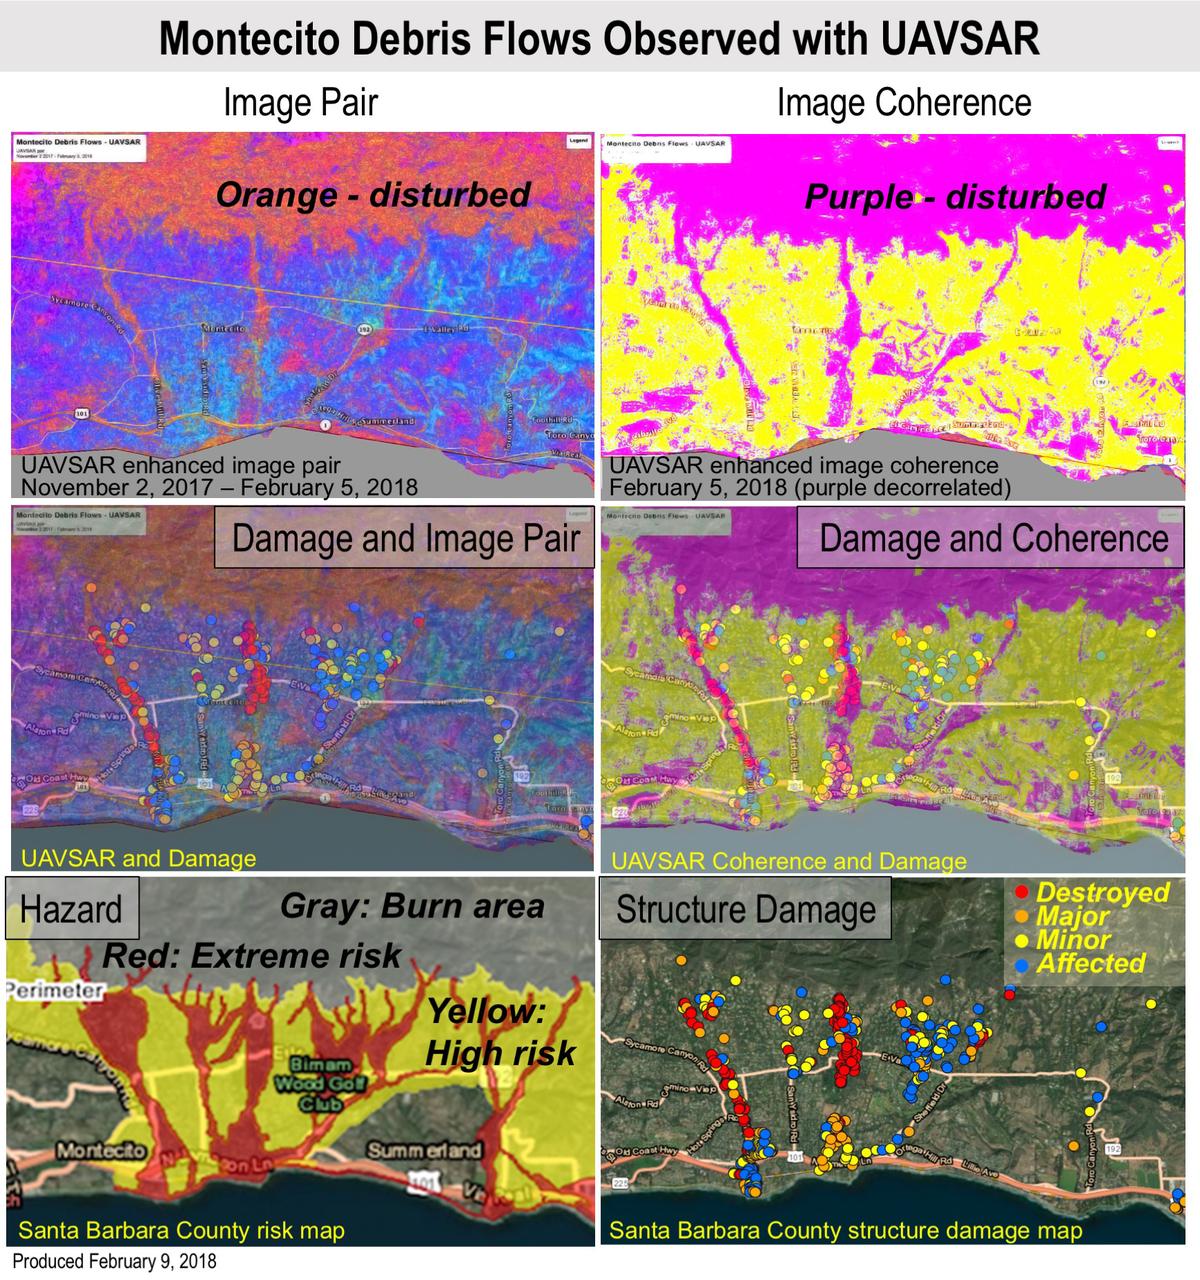
Extreme winter rains in January 2018 following the Thomas Fire in Ventura and Santa Barbara Counties caused severe debris flows, resulting in significant loss of life and considerable property damage in the town on Montecito, just east of Santa Barbara. NASA's Uninhabited Aerial Vehicle Synthetic Aperture Radar (UAVSAR) airborne radar platform detected changes caused by the debris flows between two images acquired on Nov. 2, 2017, and Feb. 5, 2018. An enhanced image pair (top left) shows disturbed areas in orange. In areas of severe surface disruption from the fire scar and debris flows the two image pairs can't be matched and decorrelate (top right). In the middle panels, the radar images are overlaid on the structure damage map produced by the County of Santa Barbara. The fire scars and damage correspond well with the risk map (lower left) and damage map (lower right). With an operational system, products such as these have the potential to augment information available for search and rescue, and for damage assessment for government agencies or the insurance industry. Radar has the advantage of being available in all weather conditions, as it can image through clouds. NASA's Uninhabited Aerial Vehicle Synthetic Aperture Radar (UAVSAR), developed and managed by the Jet Propulsion Laboratory, Pasadena, California, can record changes on the ground beneath the aircraft that occur between multiple flights, which take exactly the same flight path. The instrument is used to monitor how volcanoes, earthquakes, and other natural hazards are changing Earth. The JPL UAVSAR team collected and processed the imagery for Principal Investigator Andrea Donnellan who performed the analysis. She has been conducting ground change research using UAVSAR in this and other regions of California since 2009. https://photojournal.jpl.nasa.gov/catalog/PIA22243
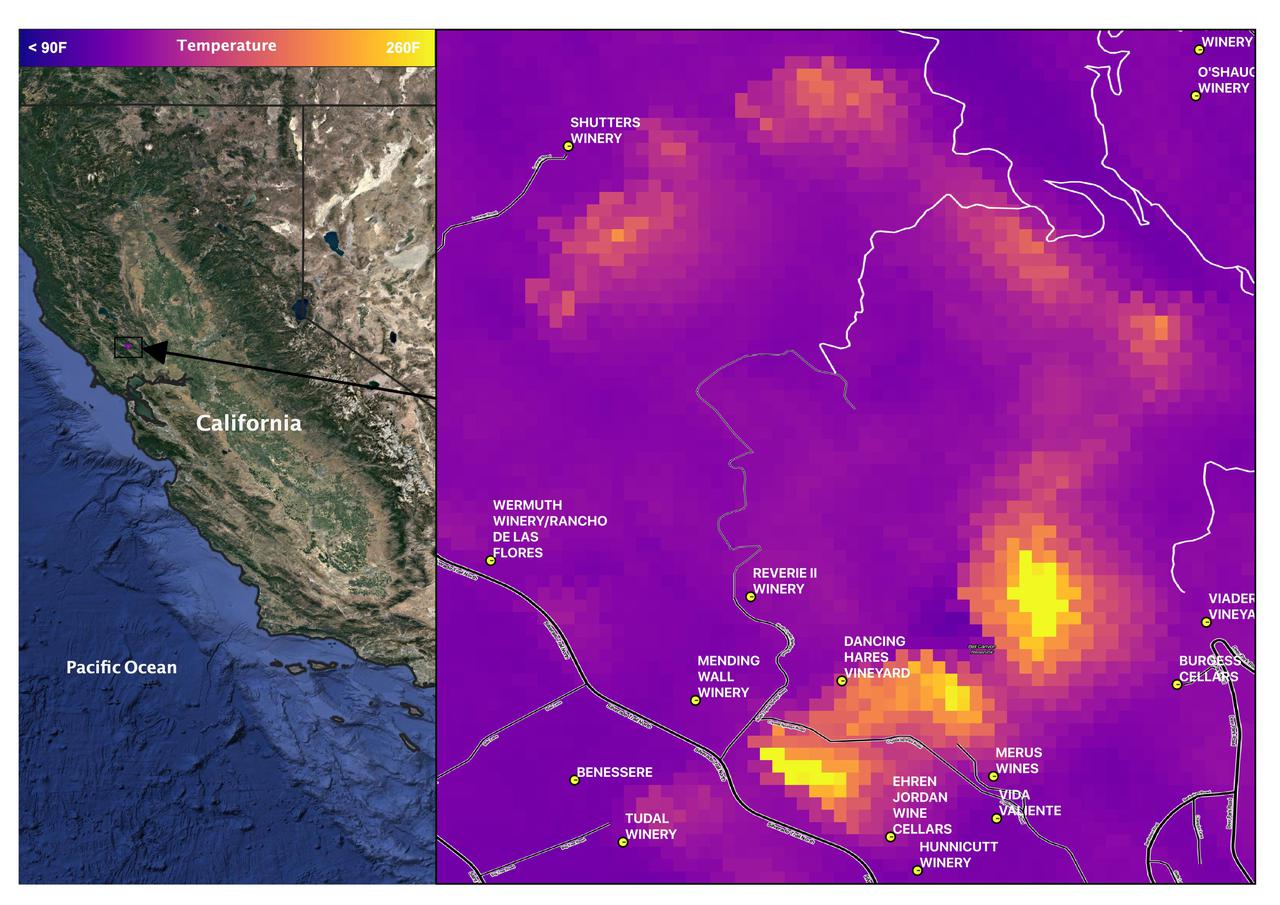
Late in the evening on September 27, 2020 the Glass Fire ignited in the foothills of Napa Valley, California. The cause of the fire is still unknown. Within 24 hours it exploded to over 11,000 acres fueled by dehydrated soil and the drought-stricken landscape. Within hours of the start of the fire, ECOSTRESS captured several hotspots near the fire's origin (represented by the brightest yellow spots on the map). Not only is it important to monitor the progress of the fire as it to help protect people and property, dense wildfire smoke can also damage crops. For this reason, it is important to track both the movement of the fire and local weather patterns to predict crop damage from smoke exposure. Wildfires are common in this region of California, however this unseasonable fire ripped through the region with unusual speed and intensity. As wildfire behavior continues to adapt with Climate Change, images like this help scientists and farmers understand the impacts that the new fire season has on crops. This information is helpful in developing plans to increase agricultural resilience to climate change. Tasked with detecting plant water use and stress, ECOSTRESS's primary mission is to measure the temperature of plants heating up as they run out of water. But it can also measure and track heat-related phenomena like wildfires, heat waves, and volcanoes. ECOSTRESS observations have a spatial resolution of about 77 by 77 yards (70 by 70 meters), which enables researchers to study surface-temperature conditions down to the size of a football field. Due to the space station's unique orbit, the mission can acquire images of the same regions at different times of the day, as opposed to crossing over each area at the same time of day like satellites in other orbits do. This is advantageous when monitoring plant stress in the same area throughout the day, for example. https://photojournal.jpl.nasa.gov/catalog/PIA24209
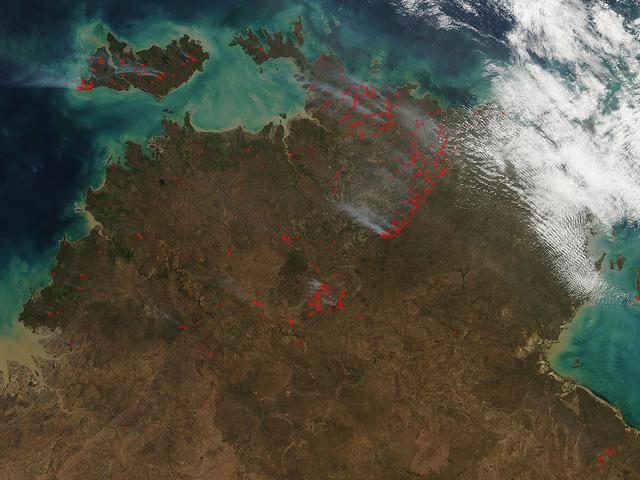
The Aqua satellite collected this natural-color image of fires in Australia with the Moderate Resolution Imaging Spectroradiometer (MODIS) instrument on June 30, 2017. The image looks at multiple fires and smoke from those fires burning in northern Australia and the island of Bathurst on June 30, 2017. The Northern Territory fire incident map does show some incidents of grass and shrub fires, in the past 24 hours, but it also shows areas of what are called "strategic fires" which are those set by fire experts to rid an area of overgrowth, brush, dead grass and shrubs to prevent fires from spreading in the event of a lightning strike. NASA image courtesy Jeff Schmaltz, MODIS Rapid Response Team <b><a href="http://www.nasa.gov/audience/formedia/features/MP_Photo_Guidelines.html" rel="nofollow">NASA image use policy.</a></b> <b><a href="http://www.nasa.gov/centers/goddard/home/index.html" rel="nofollow">NASA Goddard Space Flight Center</a></b> enables NASA’s mission through four scientific endeavors: Earth Science, Heliophysics, Solar System Exploration, and Astrophysics. Goddard plays a leading role in NASA’s accomplishments by contributing compelling scientific knowledge to advance the Agency’s mission. <b>Follow us on <a href="http://twitter.com/NASAGoddardPix" rel="nofollow">Twitter</a></b> <b>Like us on <a href="http://www.facebook.com/pages/Greenbelt-MD/NASA-Goddard/395013845897?ref=tsd" rel="nofollow">Facebook</a></b> <b>Find us on <a href="http://instagrid.me/nasagoddard/?vm=grid" rel="nofollow">Instagram</a></b>
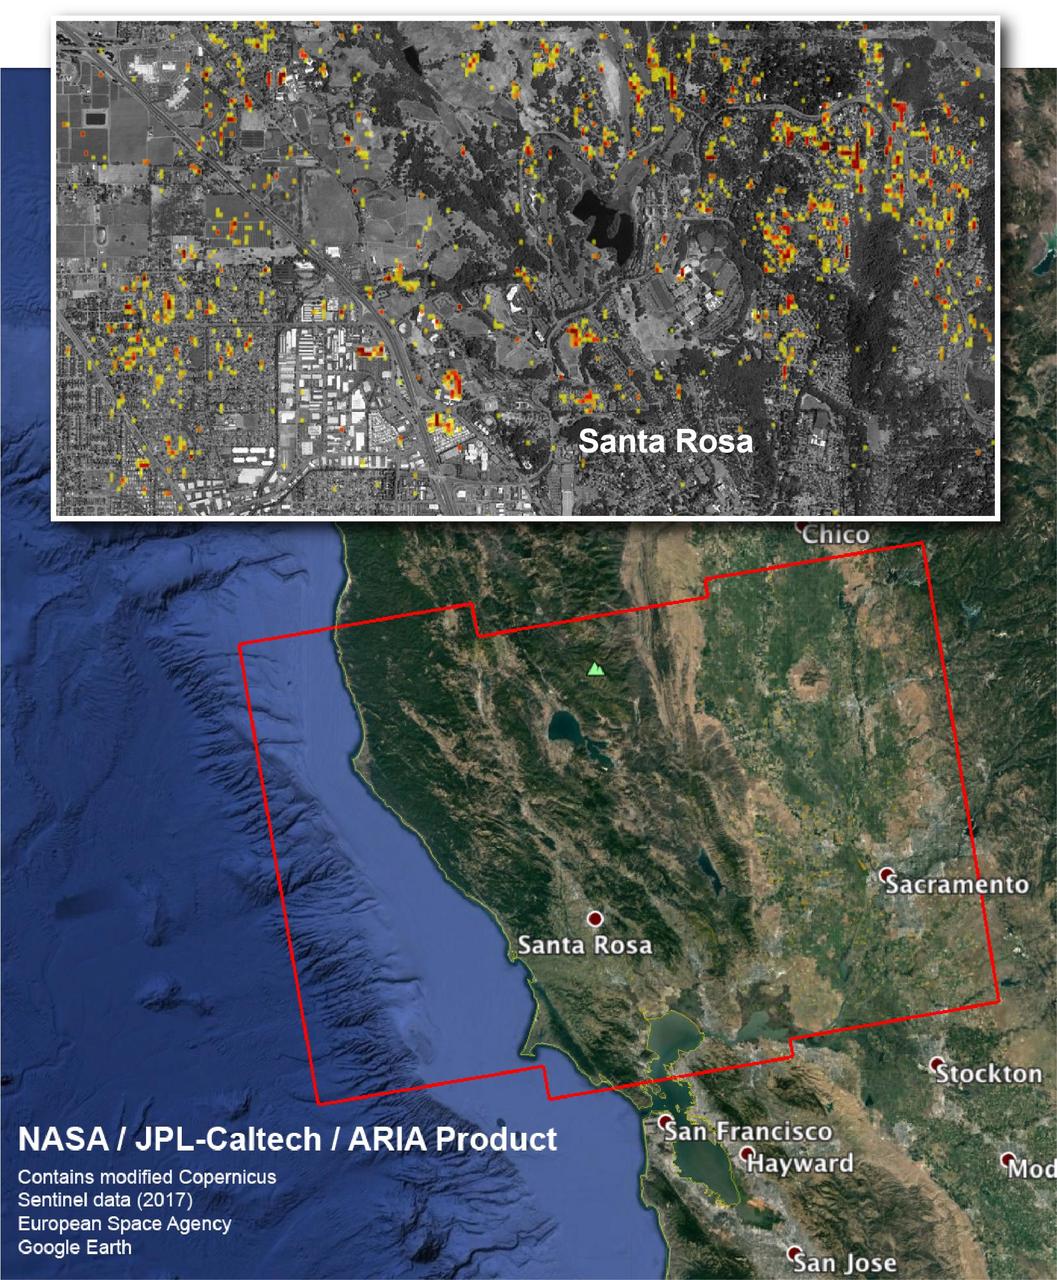
The Advanced Rapid Imaging and Analysis (ARIA) team at NASA's Jet Propulsion Laboratory in Pasadena, California, and Caltech, also in Pasadena, created this Damage Proxy Map depicting areas in Northern California that are likely damaged (shown by red and yellow pixels) as a result of the region's current outbreak of wildfires. The map is derived from synthetic aperture radar (SAR) images from the Copernicus Sentinel-1 satellites, operated by the European Space Agency (ESA). The images were taken before (Sep. 27, 2017, 7 p.m. PDT) and after (Oct. 9, 2017, 7 p.m. PDT) the onset of the fires. The map has been provided to various agencies to aid in the wildfire response. The map covers the area within the large red polygon, and measures 155 by 106 miles (250 by 170 kilometers). The illustrative figure from the map depicted in the inset shows damage in the city of Santa Rosa. Each pixel in the Damage Proxy Map measures about 98 feet (30 meters) across. The color variation from yellow to red indicates increasingly more significant ground surface change. Preliminary validation was done by comparing to optical satellite imagery from DigitalGlobe. This Damage Proxy Map should be used as guidance to identify damaged areas, and may be less reliable over vegetated areas. Sentinel-1 data were accessed through the Copernicus Open Access Hub. The image contains modified Copernicus Sentinel data (2017), processed by ESA and analyzed by the NASA-JPL/Caltech ARIA team. This research was carried out at JPL under a contract with NASA. https://photojournal.jpl.nasa.gov/catalog/PIA22048
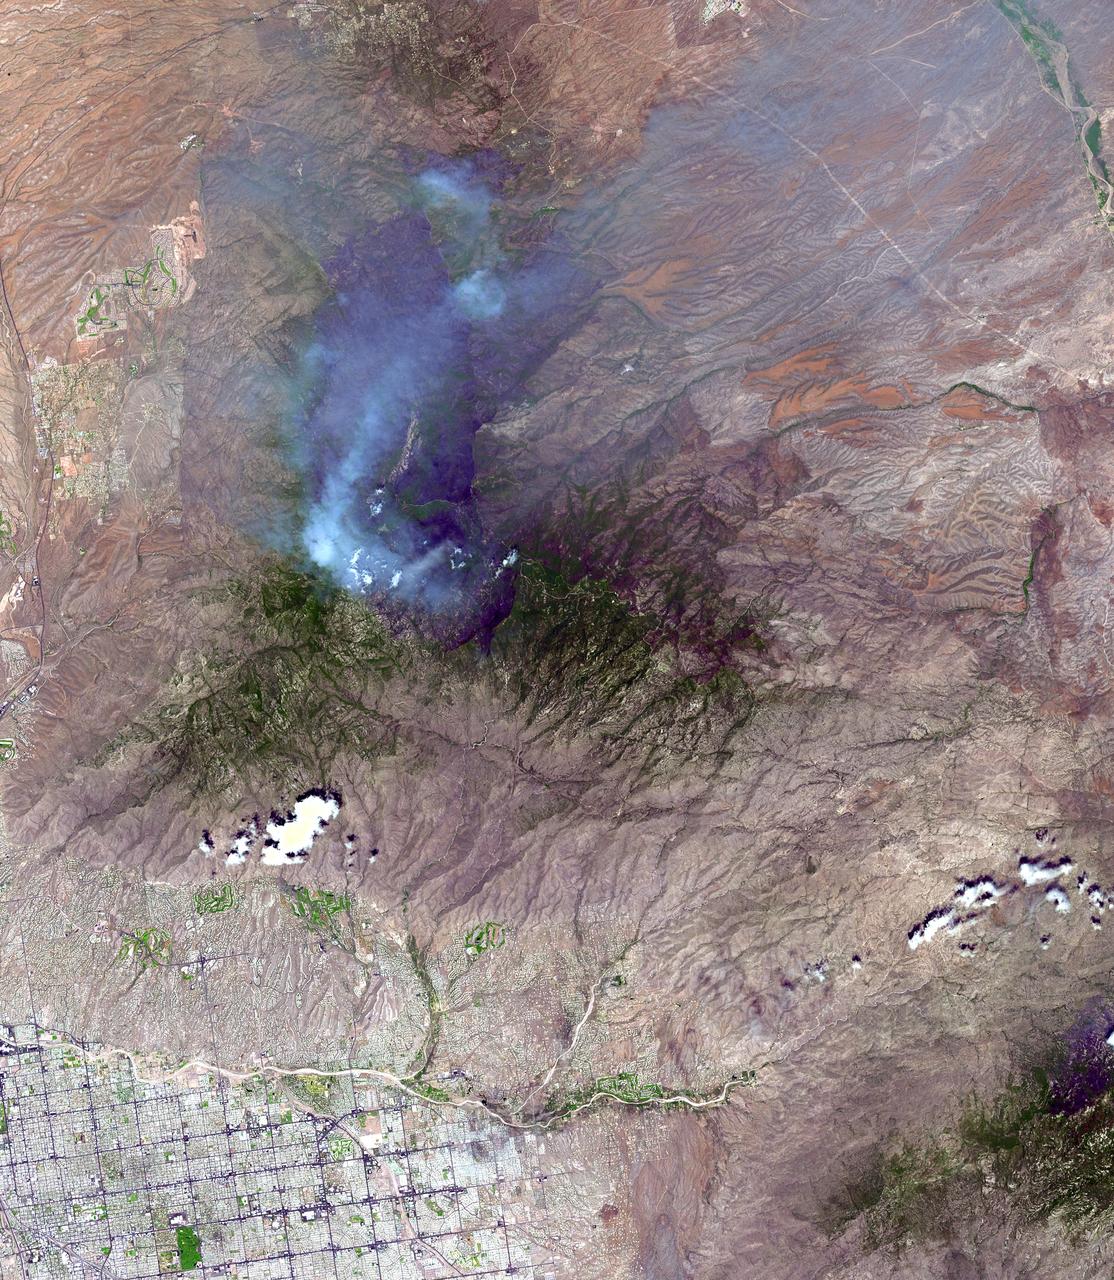
On June 26, NASA's Terra satellite acquired this image of the Aspen fire burning out of control north of Tucson, AZ. As of that date, the fire had consumed more than 27,000 acres and destroyed more than 300 homes, mostly in the resort community of Summerhaven, according to news reports. These data are being used by NASA's Wildfire Response Team and the US Forest Service to assess the intensity of the burn for future remediation efforts. This image was acquired on June 26, 2003 by the Advanced Spaceborne Thermal Emission and Reflection Radiometer (ASTER) on Terra. With its 14 spectral bands from the visible to the thermal infrared wavelength region, and its high spatial resolution of 15 to 90 meters (about 50 to 300 feet), ASTER images Earth to map and monitor the changing surface of our planet. http://photojournal.jpl.nasa.gov/catalog/PIA04602
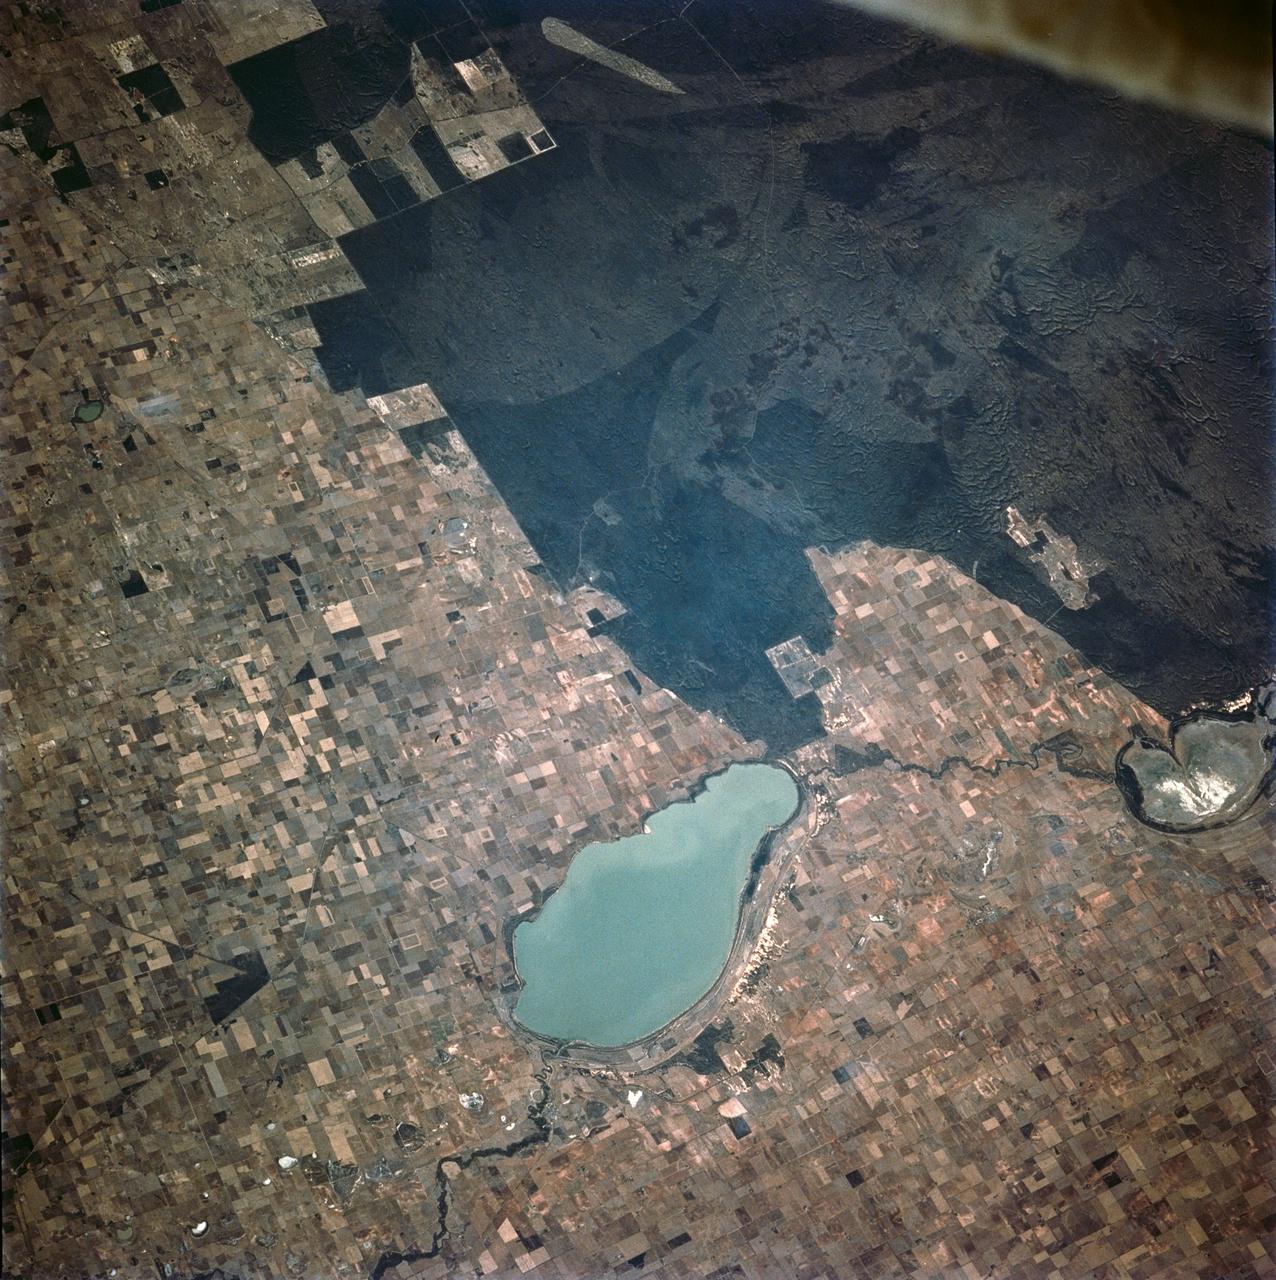
STS062-106-042 (4-18 March 1994) --- This view of southern Australia about 100 miles northwest of Melbourne shows areas of protected reserves of natural forests in the midst of agricultural crop lands. The green patch seen here has been recently burned as indicated by the irregular large scar. The impact of winds on the scar is clearly visible. This nature preserve is reported to be the home to a large number of animals including the koala bears. Similar views were shot by the STS-60 crewmembers last month. These photographs will assist earth scientists in mapping the impact of forest fires and in moniotring the recovery of burned areas.
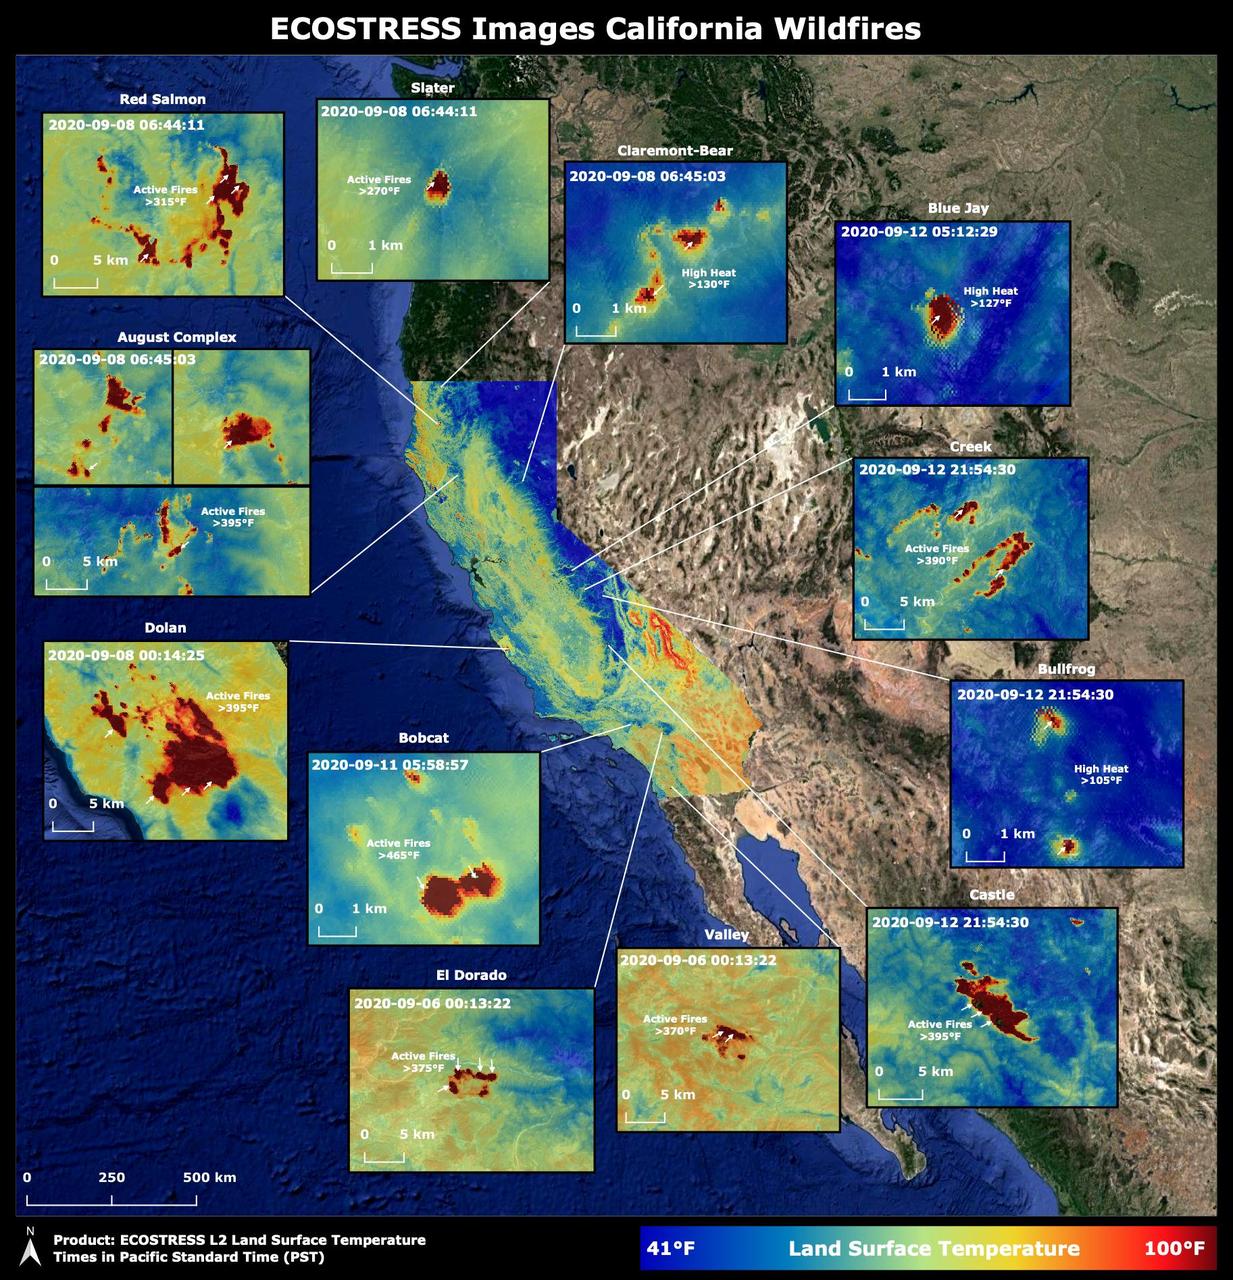
Throughout the month of September 2020, NASA's ECOsystem Spaceborne Thermal Radiometer Experiment on Space Station (ECOSTRESS) imaged multiple wildfires across the state of California. The image above shows the ECOSTRESS land surface temperature of California. Multiple insets highlight a fraction of the multiple fires that have impacted California, with effects seen throughout the U.S. and beyond. The dark red spots show areas of high heat, with arrows pointing out the active fires. The contiguous California image was stitched together from multiple evening (10 p.m.-6 a.m. PDT) ECOSTRESS images from Sept 6 to 12, 2020, to generate a cloud-free statewide map. NASA's Jet Propulsion Laboratory in Southern California built and manages the ECOSTRESS mission for the Earth Science Division in the Science Mission Directorate at NASA Headquarters in Washington. ECOSTRESS is an Earth Venture Instrument mission; the program is managed by NASA's Earth System Science Pathfinder program at NASA's Langley Research Center in Hampton, Virginia. Future studies could use ECOSTRESS data products in a similar fashion as LST was used to assess the fires pictured above. https://photojournal.jpl.nasa.gov/catalog/PIA23721
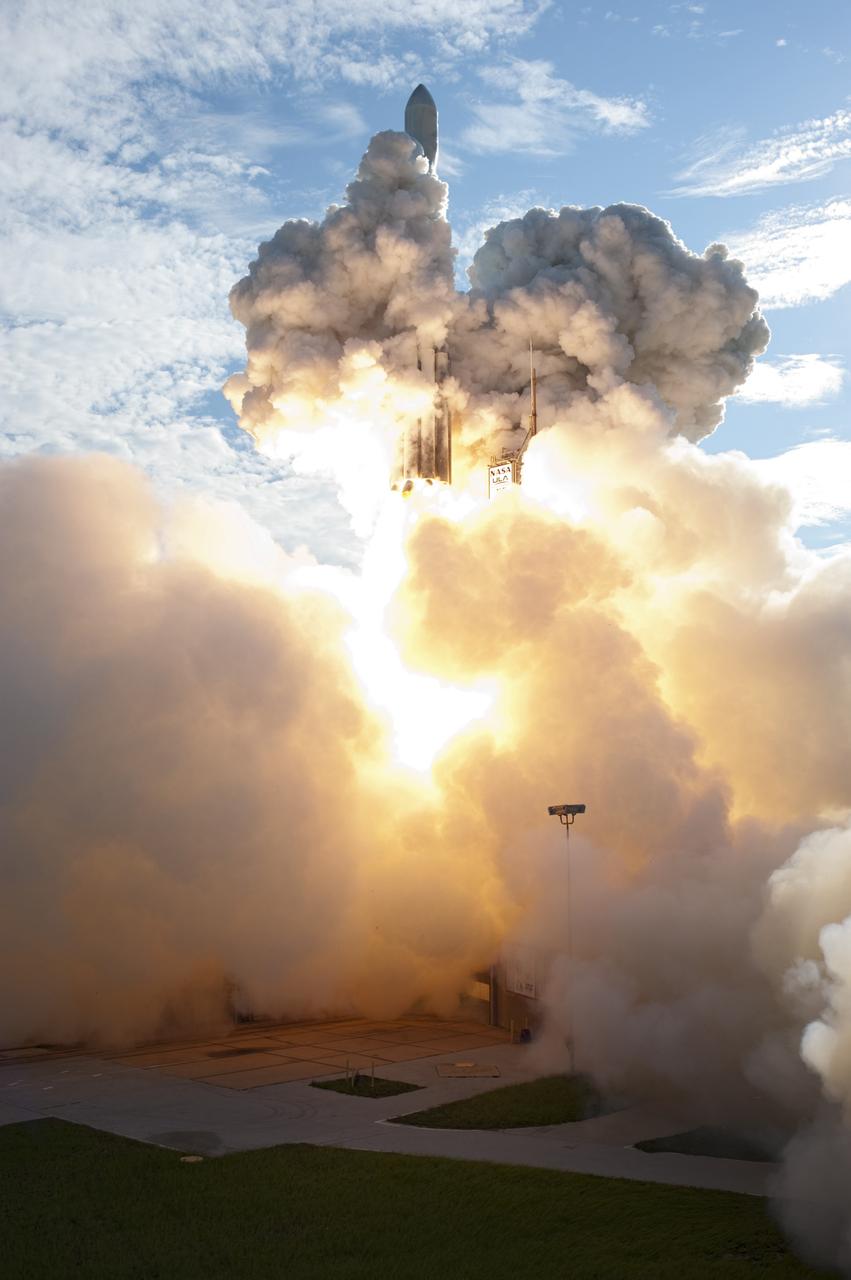
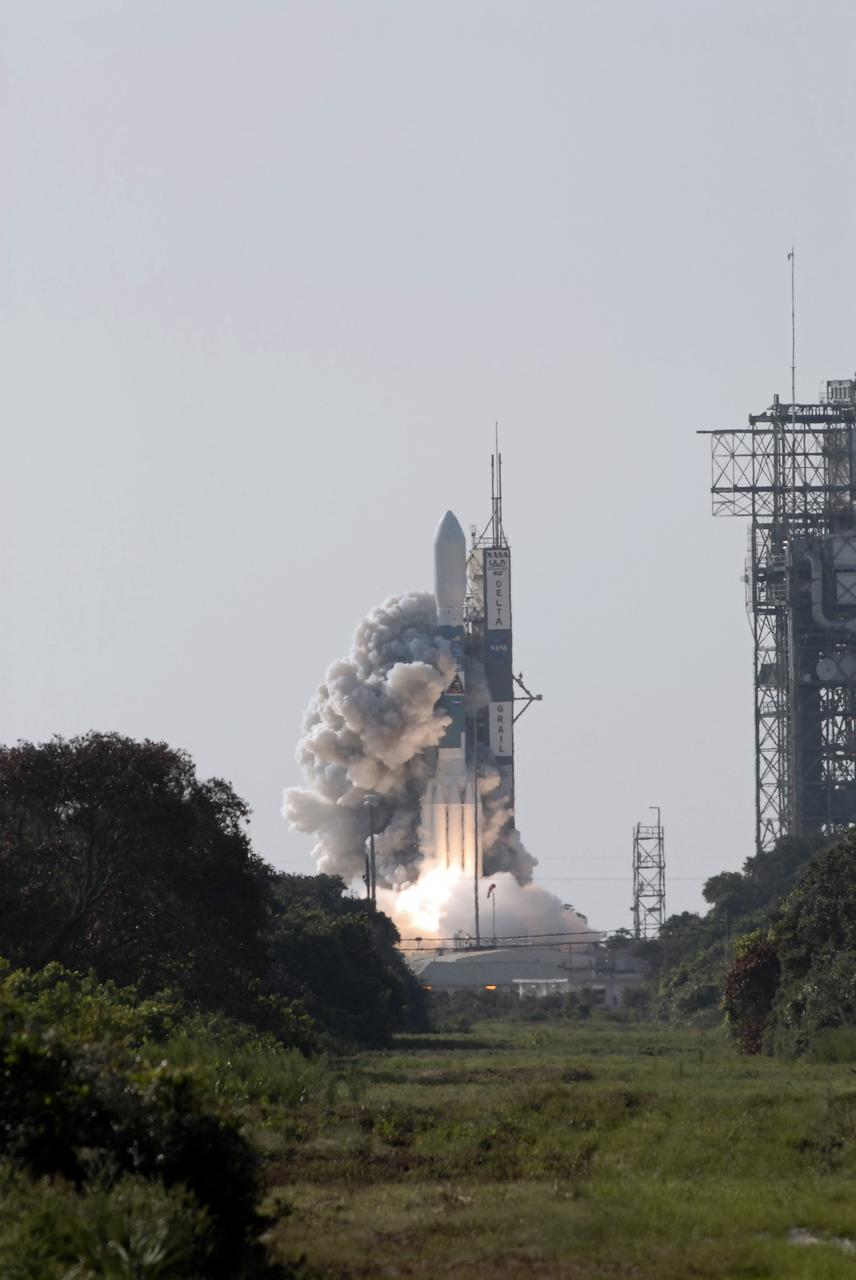
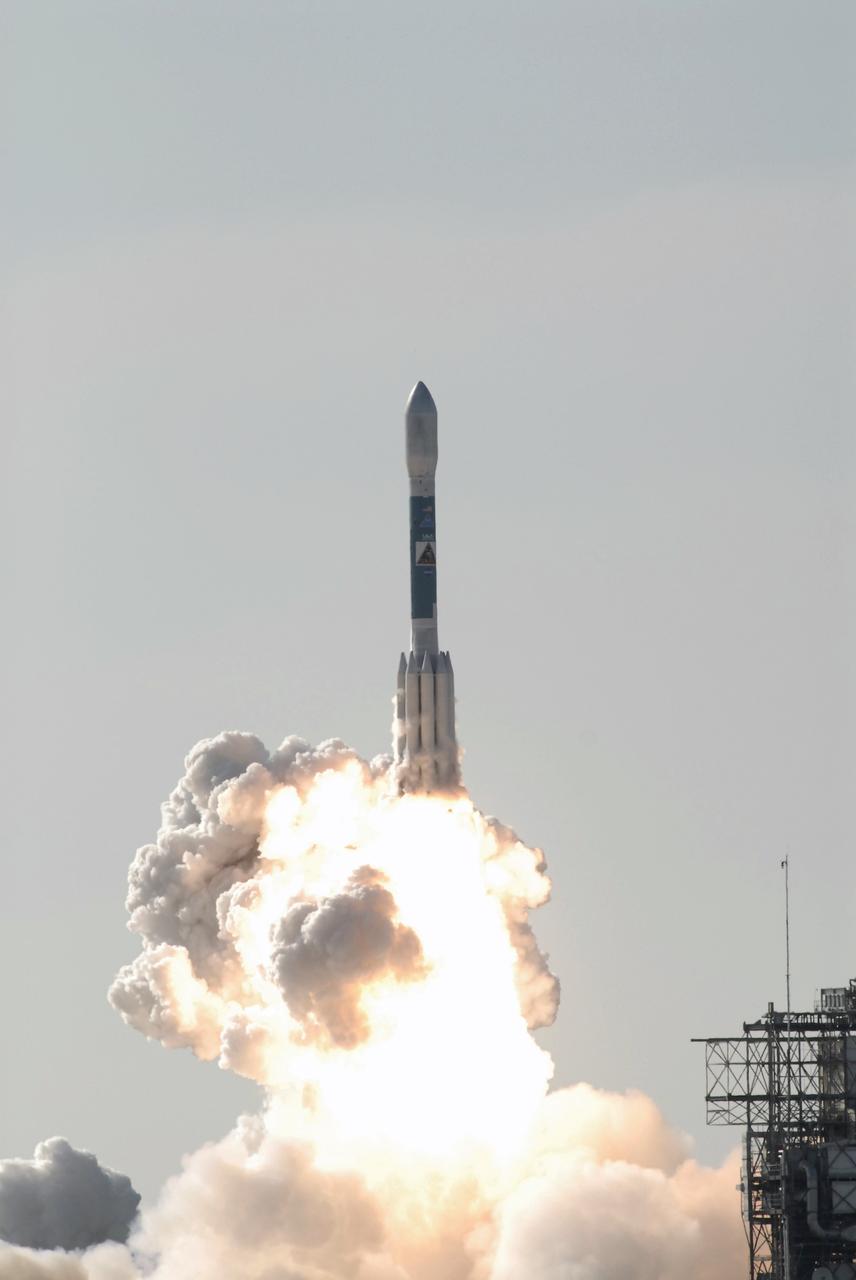
CAPE CANAVERAL, Fla. – Rising from fire and smoke after liftoff, NASA’s twin Gravity Recovery and Interior Laboratory (GRAIL) mission launches atop a United Launch Alliance Delta II Heavy rocket leaving from Space Launch Complex 17B on Cape Canaveral Air Force Station in Florida. Liftoff was at 9:08:52 a.m. EDT Sept. 10. GRAIL-A will separate from the second stage of the rocket at about one hour, 21 minutes after liftoff, followed by GRAIL-B at 90 minutes after launch. The spacecraft are embarking on a three-month journey to reach the moon. GRAIL will fly twin spacecraft in tandem around the moon to precisely measure and map variations in the moon's gravitational field. The mission will provide the most accurate global gravity field to date for any planet, including Earth. This detailed information will reveal differences in the density of the moon's crust and mantle and will help answer fundamental questions about the moon's internal structure, thermal evolution, and history of collisions with asteroids. The aim is to map the moon's gravity field so completely that future moon vehicles can safely navigate anywhere on the moon’s surface. For more information, visit http://www.nasa.gov/grail. Photo credit: NASA/ Tony Gray and Tim Powers
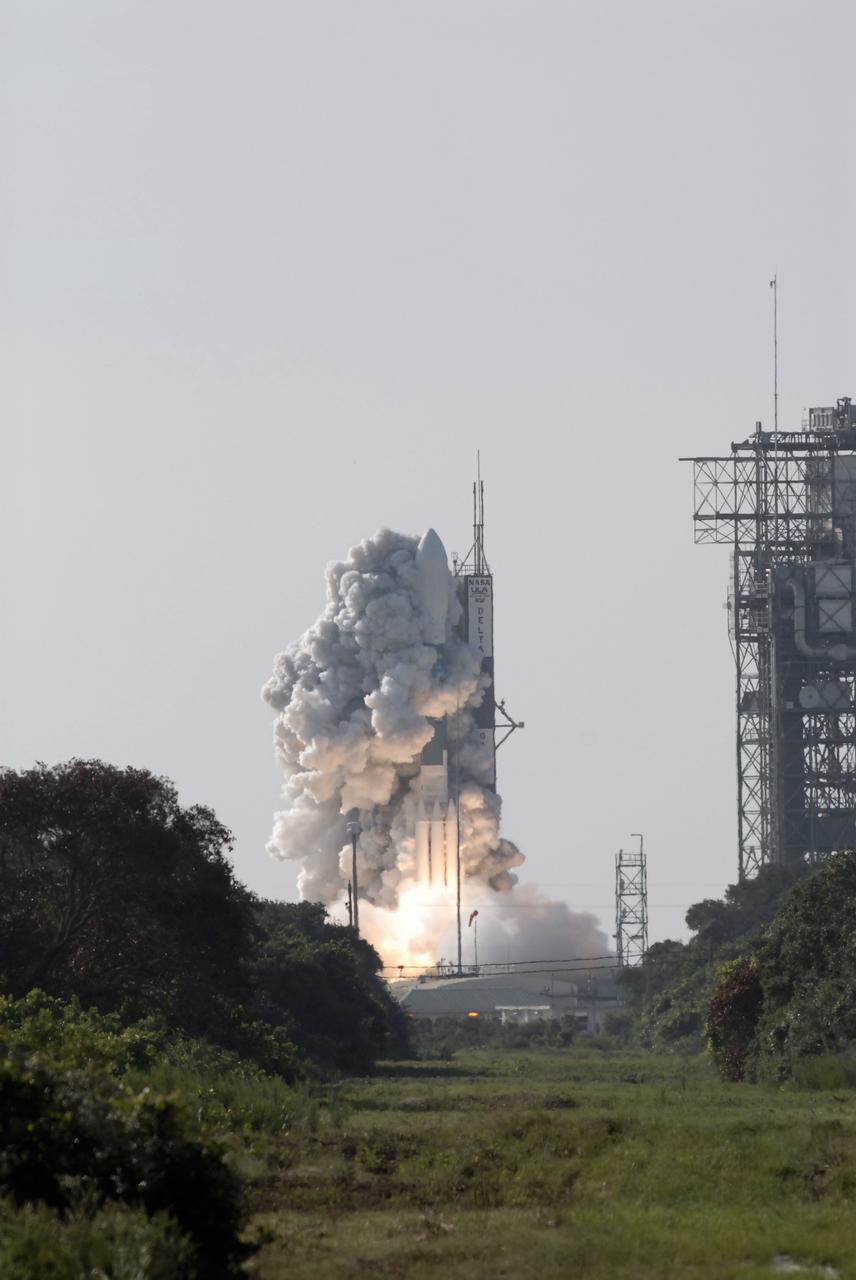
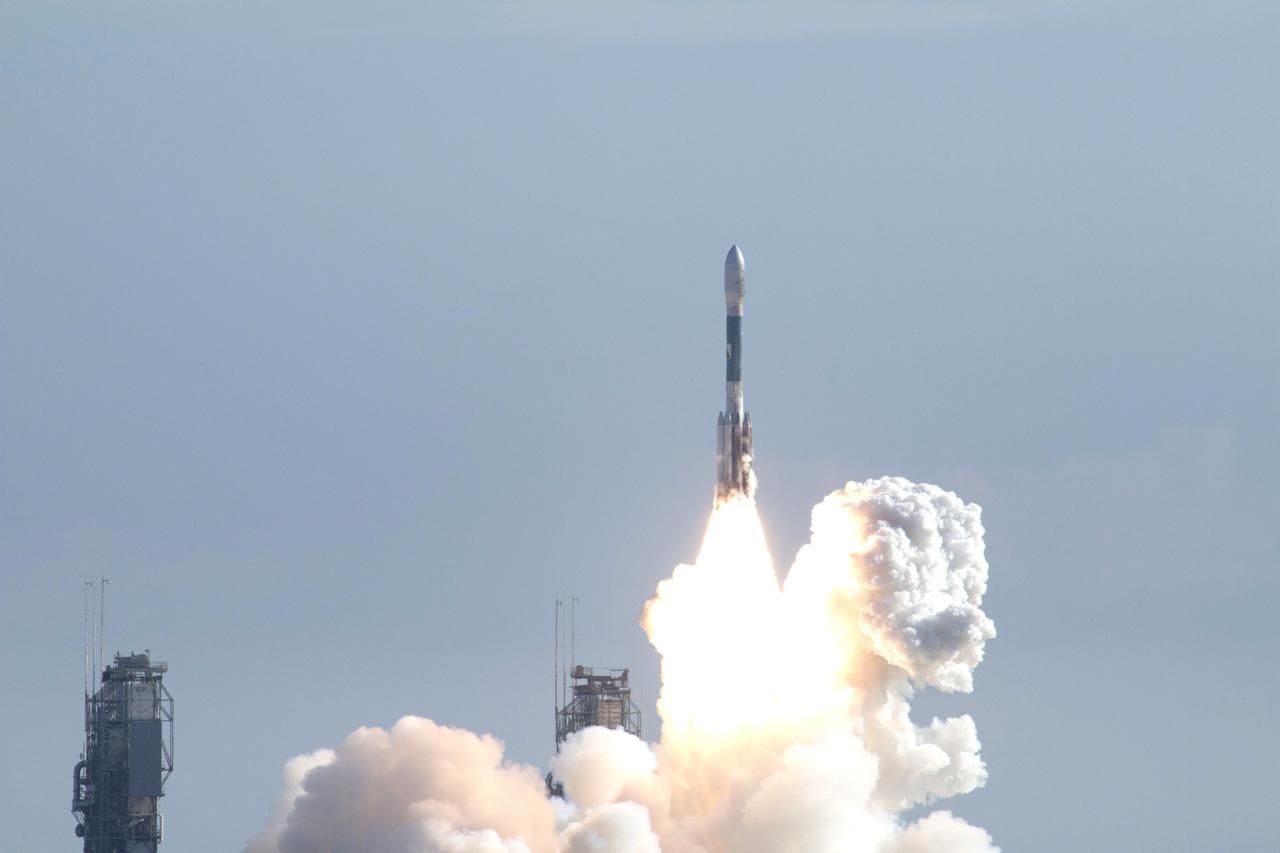
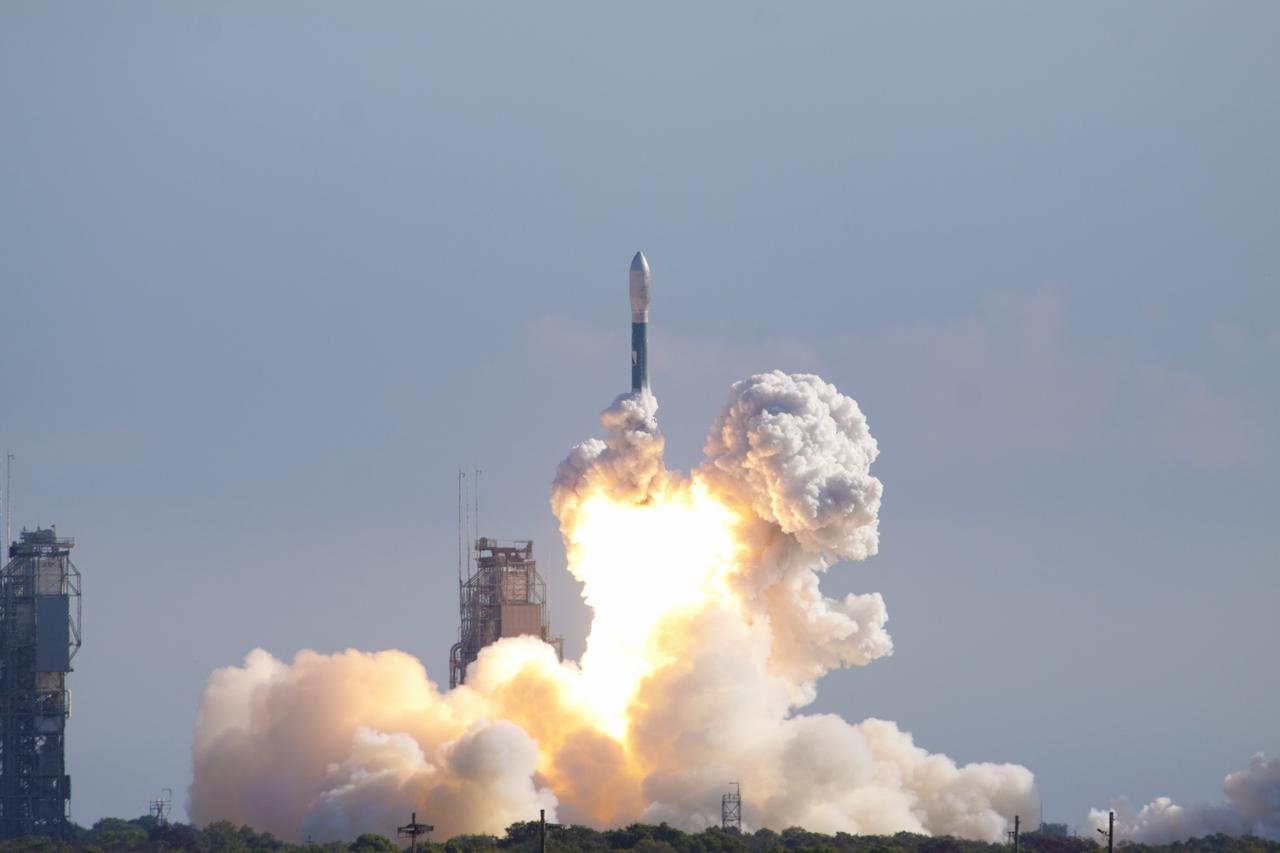
CAPE CANAVERAL, Fla. – Rising from fire and smoke, the United Launch Alliance Delta II Heavy rocket lifted off at 9:08 a.m. EDT Sept. 10 from Space Launch Complex 17B on Cape Canaveral Air Force Station in Florida carrying NASA’s twin Gravity Recovery and Interior Laboratory (GRAIL) mission to the moon. GRAIL will fly twin spacecraft in tandem around the moon to precisely measure and map variations in the moon's gravitational field. The mission will provide the most accurate global gravity field to date for any planet, including Earth. This detailed information will reveal differences in the density of the moon's crust and mantle and will help answer fundamental questions about the moon's internal structure, thermal evolution, and history of collisions with asteroids. The aim is to map the moon's gravity field so completely that future moon vehicles can safely navigate anywhere on the moon’s surface. For more information, visit http://www.nasa.gov/grail. Photo credit: NASA/Kim Shiflett
CAPE CANAVERAL, Fla. – Fire and smoke light up a blue sky as a United Launch Alliance Delta II Heavy rocket propels NASA’s Gravity Recovery and Interior Laboratory (GRAIL) mission into space. Liftoff from Space Launch Complex 17B on Cape Canaveral Air Force Station in Florida was at 9:08:52 a.m. EDT Sept.10. GRAIL-A will separate from the second stage of the rocket at about one hour, 21 minutes after liftoff, followed by GRAIL-B at 90 minutes after launch. The spacecraft are embarking on a three-month journey to reach the moon. GRAIL will fly twin spacecraft in tandem around the moon to precisely measure and map variations in the moon's gravitational field. The mission will provide the most accurate global gravity field to date for any planet, including Earth. This detailed information will reveal differences in the density of the moon's crust and mantle and will help answer fundamental questions about the moon's internal structure, thermal evolution, and history of collisions with asteroids. The aim is to map the moon's gravity field so completely that future moon vehicles can safely navigate anywhere on the moon’s surface. For more information, visit http://www.nasa.gov/grail. Photo credit: NASA/Darrell McCall
CAPE CANAVERAL, Fla. – Rising from fire and smoke, the United Launch Alliance Delta II Heavy rocket lifted off at 9:08 a.m. EDT Sept. 10 from Space Launch Complex 17B on Cape Canaveral Air Force Station in Florida carrying NASA’s twin Gravity Recovery and Interior Laboratory (GRAIL) mission to the moon. GRAIL will fly twin spacecraft in tandem around the moon to precisely measure and map variations in the moon's gravitational field. The mission will provide the most accurate global gravity field to date for any planet, including Earth. This detailed information will reveal differences in the density of the moon's crust and mantle and will help answer fundamental questions about the moon's internal structure, thermal evolution, and history of collisions with asteroids. The aim is to map the moon's gravity field so completely that future moon vehicles can safely navigate anywhere on the moon’s surface. For more information, visit http://www.nasa.gov/grail. Photo credit: NASA/Kim Shiflett
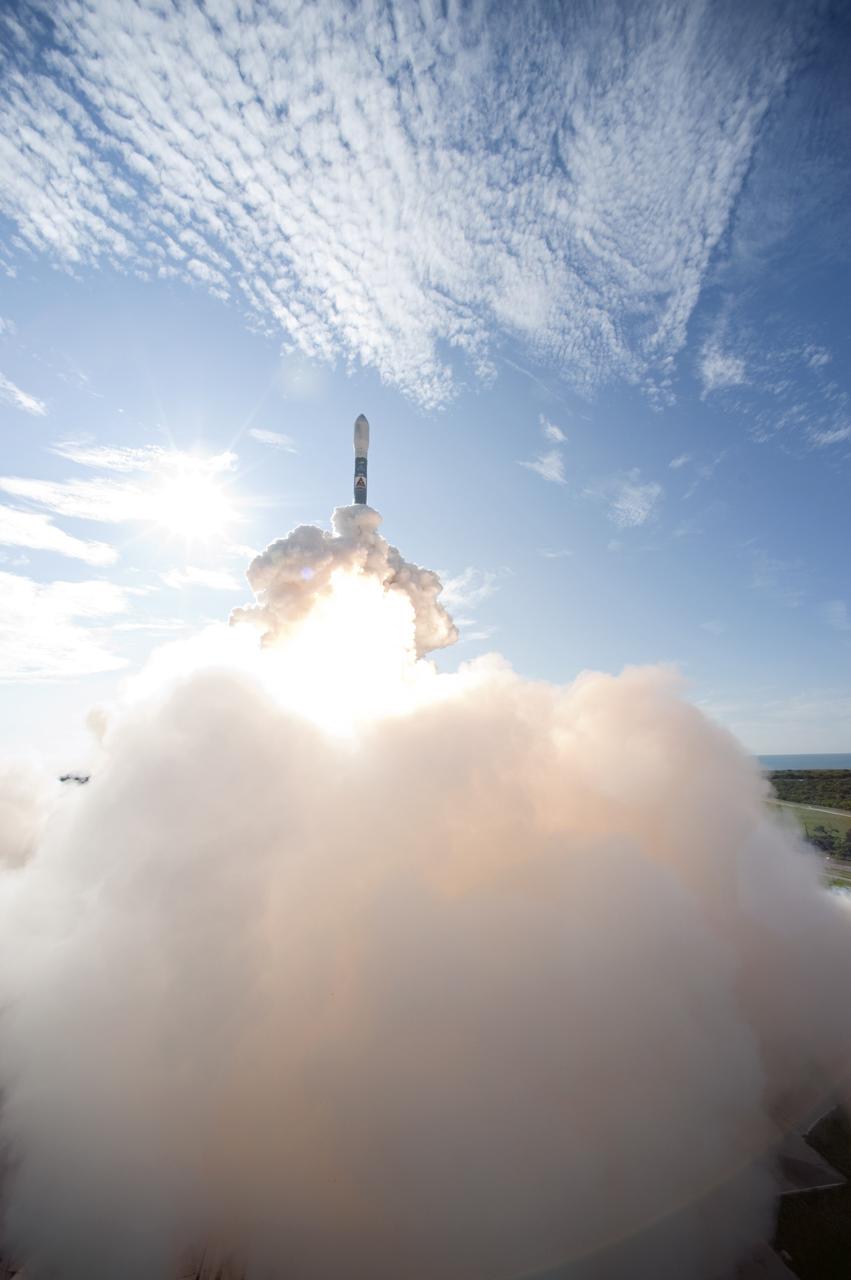
CAPE CANAVERAL, Fla. – Rising from fire and smoke under a blue sky, NASA’s twin Gravity Recovery and Interior Laboratory (GRAIL) mission launches atop a United Launch Alliance Delta II Heavy rocket leaving from Space Launch Complex 17B on Cape Canaveral Air Force Station in Florida. Liftoff was at 9:08:52 a.m. EDT Sept. 10. GRAIL-A will separate from the second stage of the rocket at about one hour, 21 minutes after liftoff, followed by GRAIL-B at 90 minutes after launch. The spacecraft are embarking on a three-month journey to reach the moon. GRAIL will fly twin spacecraft in tandem around the moon to precisely measure and map variations in the moon's gravitational field. The mission will provide the most accurate global gravity field to date for any planet, including Earth. This detailed information will reveal differences in the density of the moon's crust and mantle and will help answer fundamental questions about the moon's internal structure, thermal evolution, and history of collisions with asteroids. The aim is to map the moon's gravity field so completely that future moon vehicles can safely navigate anywhere on the moon’s surface. For more information, visit http://www.nasa.gov/grail. Photo credit: NASA/Sandra Joseph and Don Kight
CAPE CANAVERAL, Fla. – Rising from fire and smoke after liftoff, NASA’s twin Gravity Recovery and Interior Laboratory (GRAIL) mission launches atop a United Launch Alliance Delta II Heavy rocket leaving from Space Launch Complex 17B on Cape Canaveral Air Force Station in Florida. At left is the pad’s mobile service tower. The spacecraft launched at 9:08:52 a.m. EDT Sept. 10. GRAIL-A will separate from the second stage of the rocket at about one hour, 21 minutes after liftoff, followed by GRAIL-B at 90 minutes after launch. The spacecraft are embarking on a three-month journey to reach the moon. GRAIL will fly twin spacecraft in tandem around the moon to precisely measure and map variations in the moon's gravitational field. The mission will provide the most accurate global gravity field to date for any planet, including Earth. This detailed information will reveal differences in the density of the moon's crust and mantle and will help answer fundamental questions about the moon's internal structure, thermal evolution, and history of collisions with asteroids. The aim is to map the moon's gravity field so completely that future moon vehicles can safely navigate anywhere on the moon’s surface. For more information, visit http://www.nasa.gov/grail. Photo credit: NASA/Kenny Allen

CAPE CANAVERAL, Fla. – Fire lights up the sky as a United Launch Alliance Delta II Heavy rocket lofts NASA’s Gravity Recovery and Interior Laboratory (GRAIL) mission into space. Liftoff from Space Launch Complex 17B on Cape Canaveral Air Force Station in Florida was at 9:08:52 a.m. EDT Sept.10. GRAIL-A will separate from the second stage of the rocket at about one hour, 21 minutes after liftoff, followed by GRAIL-B at 90 minutes after launch. The spacecraft are embarking on a three-month journey to reach the moon. GRAIL will fly twin spacecraft in tandem around the moon to precisely measure and map variations in the moon's gravitational field. The mission will provide the most accurate global gravity field to date for any planet, including Earth. This detailed information will reveal differences in the density of the moon's crust and mantle and will help answer fundamental questions about the moon's internal structure, thermal evolution, and history of collisions with asteroids. The aim is to map the moon's gravity field so completely that future moon vehicles can safely navigate anywhere on the moon’s surface. For more information, visit http://www.nasa.gov/grail. Photo credit: NASA/Darrell McCall
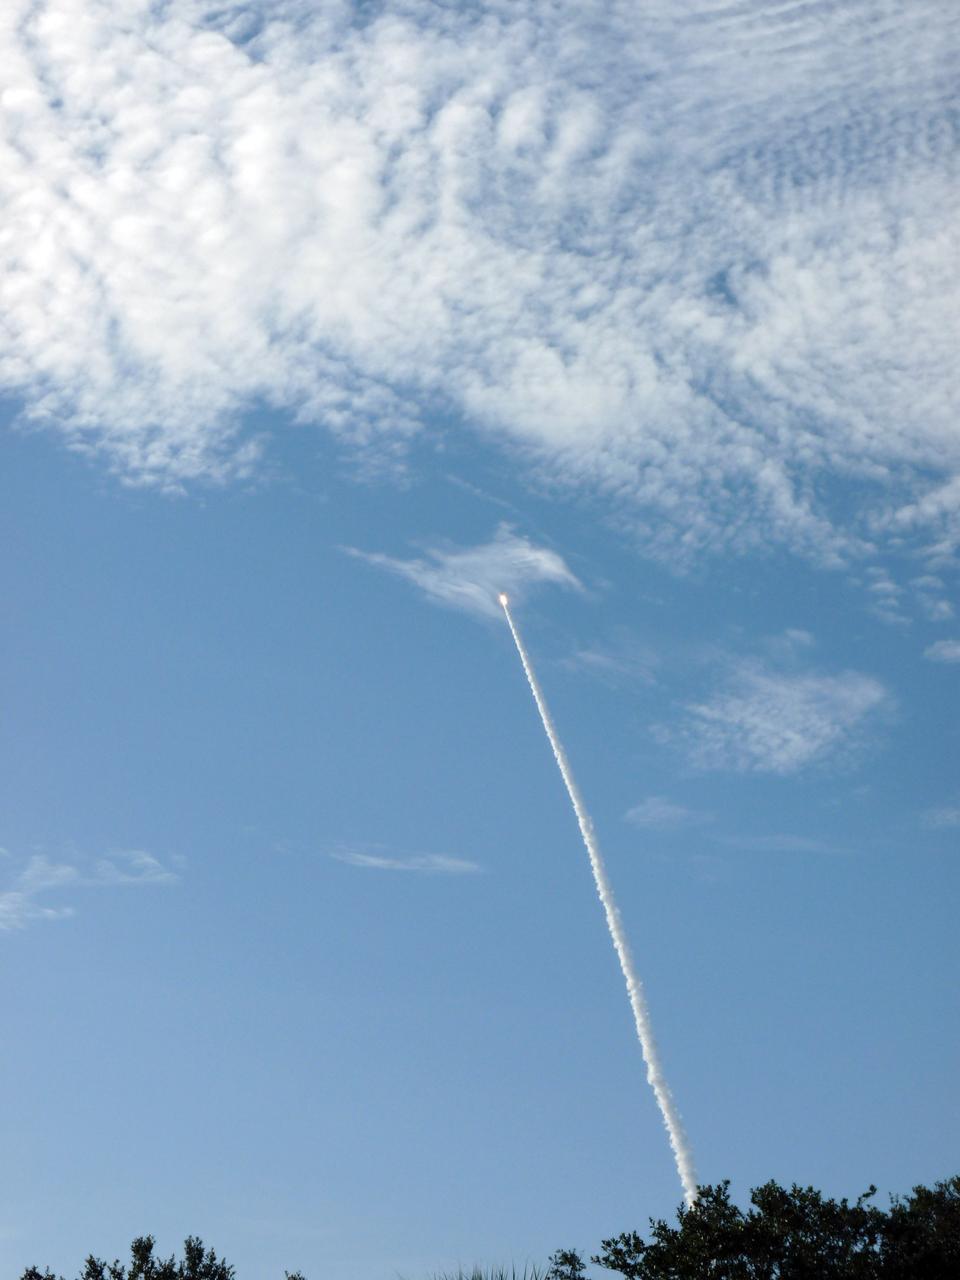
CAPE CANAVERAL, Fla. – Fire lights up a blue sky on Space Launch Complex 17B on Cape Canaveral Air Force Station in Florida as a United Launch Alliance Delta II Heavy rocket lofts the Gravity Recovery and Interior Laboratory (GRAIL) mission into space. Liftoff was at 9:08:52 a.m. EDT Sept.10. GRAIL-A will separate from the second stage of the rocket at about one hour, 21 minutes after liftoff, followed by GRAIL-B at 90 minutes after launch. The spacecraft are embarking on a three-month journey to reach the moon. GRAIL will fly twin spacecraft in tandem around the moon to precisely measure and map variations in the moon's gravitational field. The mission will provide the most accurate global gravity field to date for any planet, including Earth. This detailed information will reveal differences in the density of the moon's crust and mantle and will help answer fundamental questions about the moon's internal structure, thermal evolution, and history of collisions with asteroids. The aim is to map the moon's gravity field so completely that future moon vehicles can safely navigate anywhere on the moon’s surface. For more information, visit http://www.nasa.gov/grail. Photo credit: NASA/Fletcher Hildreth
CAPE CANAVERAL, Fla. – Rising from fire and smoke, the United Launch Alliance Delta II Heavy rocket lifted off at 9:08 a.m. EDT Sept. 10 from Space Launch Complex 17B on Cape Canaveral Air Force Station in Florida carrying NASA’s twin Gravity Recovery and Interior Laboratory (GRAIL) mission to the moon. GRAIL will fly twin spacecraft in tandem around the moon to precisely measure and map variations in the moon's gravitational field. The mission will provide the most accurate global gravity field to date for any planet, including Earth. This detailed information will reveal differences in the density of the moon's crust and mantle and will help answer fundamental questions about the moon's internal structure, thermal evolution, and history of collisions with asteroids. The aim is to map the moon's gravity field so completely that future moon vehicles can safely navigate anywhere on the moon’s surface. For more information, visit http://www.nasa.gov/grail. Photo credit: NASA/Kim Shiflett
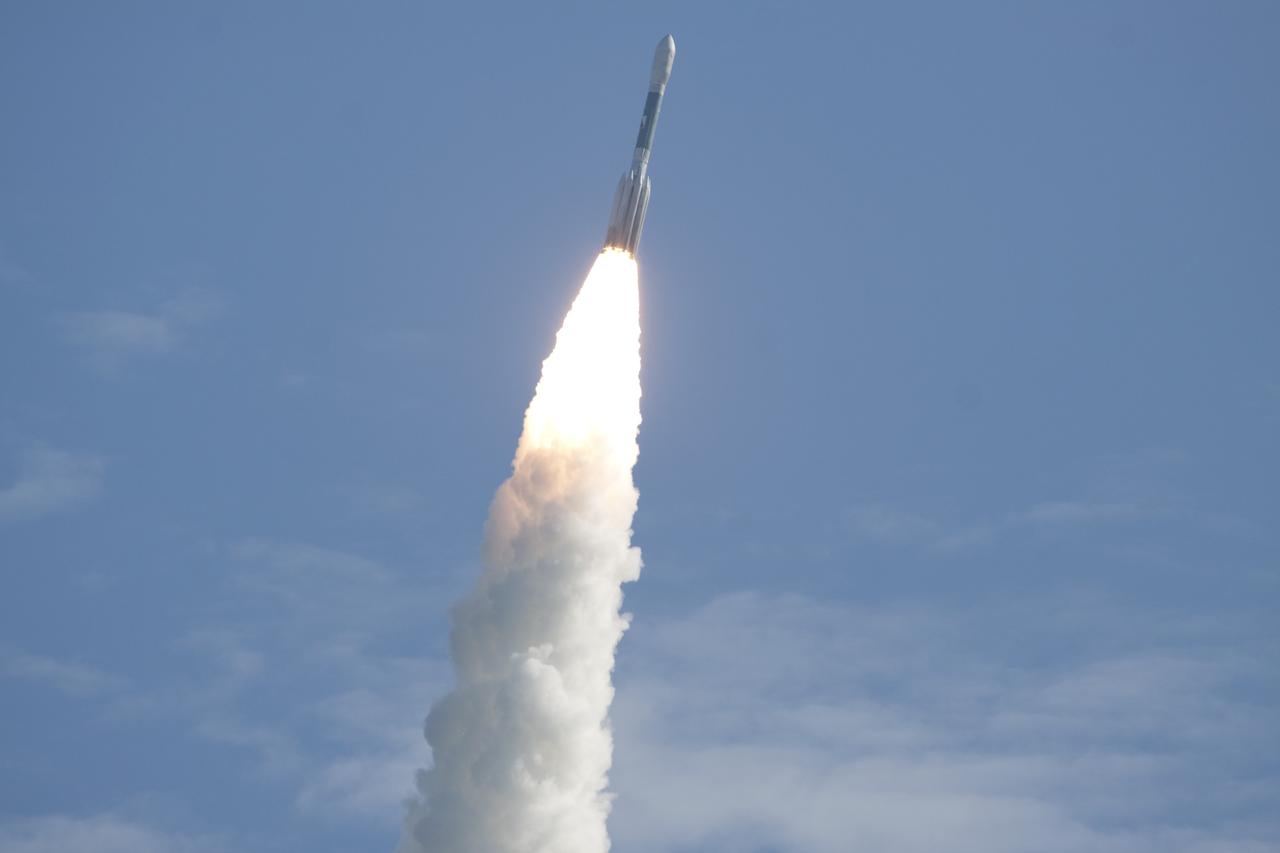
CAPE CANAVERAL, Fla. – Rising from fire and smoke, NASA’s twin Gravity Recovery and Interior Laboratory (GRAIL) mission launches atop a United Launch Alliance Delta II Heavy rocket. Leaving from Space Launch Complex 17B on Cape Canaveral Air Force Station in Florida, the spacecraft launched at 9:08:52 a.m. EDT Sept.10. GRAIL-A will separate from the second stage of the rocket at about one hour, 21 minutes after liftoff, followed by GRAIL-B at 90 minutes after launch. The spacecraft are embarking on a three-month journey to reach the moon. GRAIL will fly twin spacecraft in tandem around the moon to precisely measure and map variations in the moon's gravitational field. The mission will provide the most accurate global gravity field to date for any planet, including Earth. This detailed information will reveal differences in the density of the moon's crust and mantle and will help answer fundamental questions about the moon's internal structure, thermal evolution, and history of collisions with asteroids. The aim is to map the moon's gravity field so completely that future moon vehicles can safely navigate anywhere on the moon’s surface. For more information, visit http://www.nasa.gov/grail. Photo credit: NASA/Darrell McCall
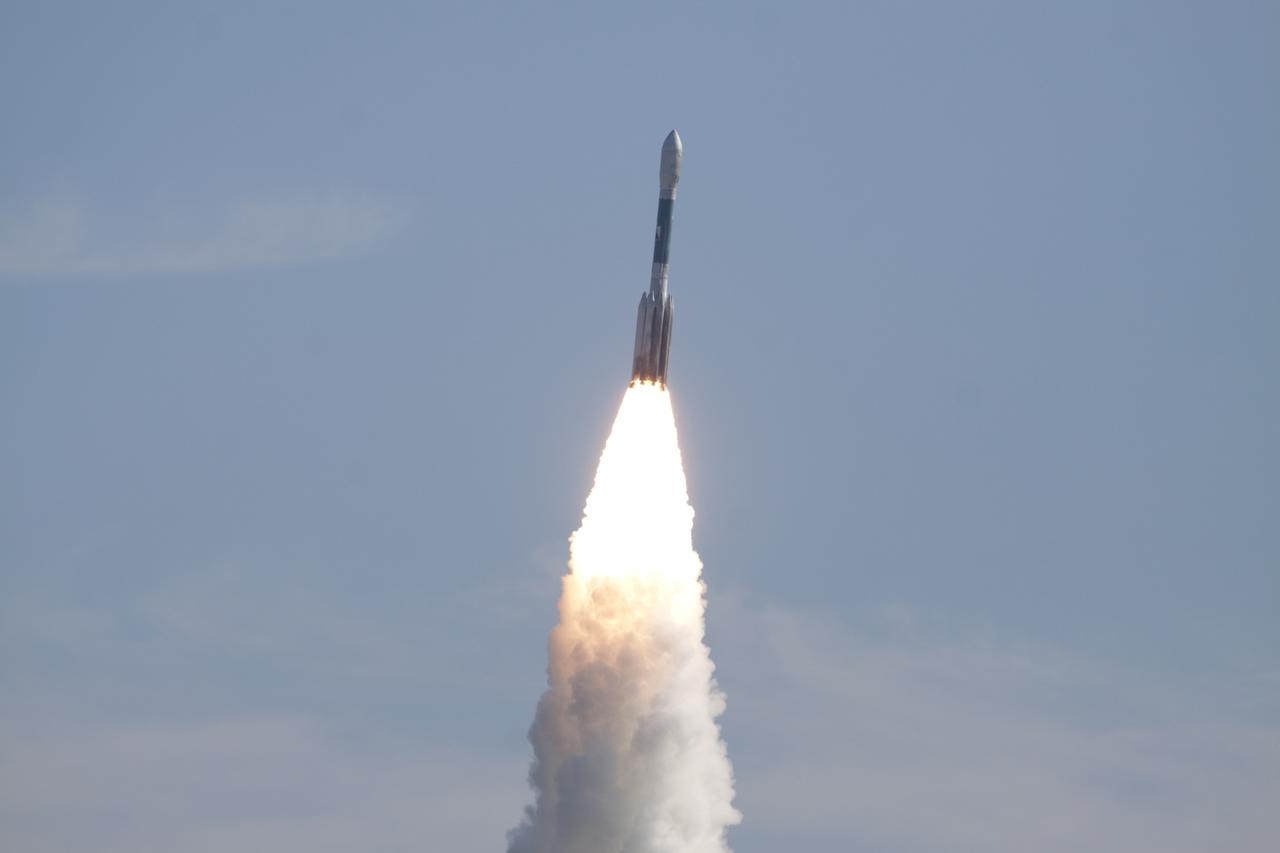
CAPE CANAVERAL, Fla. – Fire and smoke light up the sky as a United Launch Alliance Delta II Heavy rocket propels NASA’s Gravity Recovery and Interior Laboratory (GRAIL) mission into space. Liftoff from Space Launch Complex 17B on Cape Canaveral Air Force Station in Florida was at 9:08:52 a.m. EDT Sept.10. GRAIL-A will separate from the second stage of the rocket at about one hour, 21 minutes after liftoff, followed by GRAIL-B at 90 minutes after launch. The spacecraft are embarking on a three-month journey to reach the moon. GRAIL will fly twin spacecraft in tandem around the moon to precisely measure and map variations in the moon's gravitational field. The mission will provide the most accurate global gravity field to date for any planet, including Earth. This detailed information will reveal differences in the density of the moon's crust and mantle and will help answer fundamental questions about the moon's internal structure, thermal evolution, and history of collisions with asteroids. The aim is to map the moon's gravity field so completely that future moon vehicles can safely navigate anywhere on the moon’s surface. For more information, visit http://www.nasa.gov/grail. Photo credit: NASA/Darrell McCall
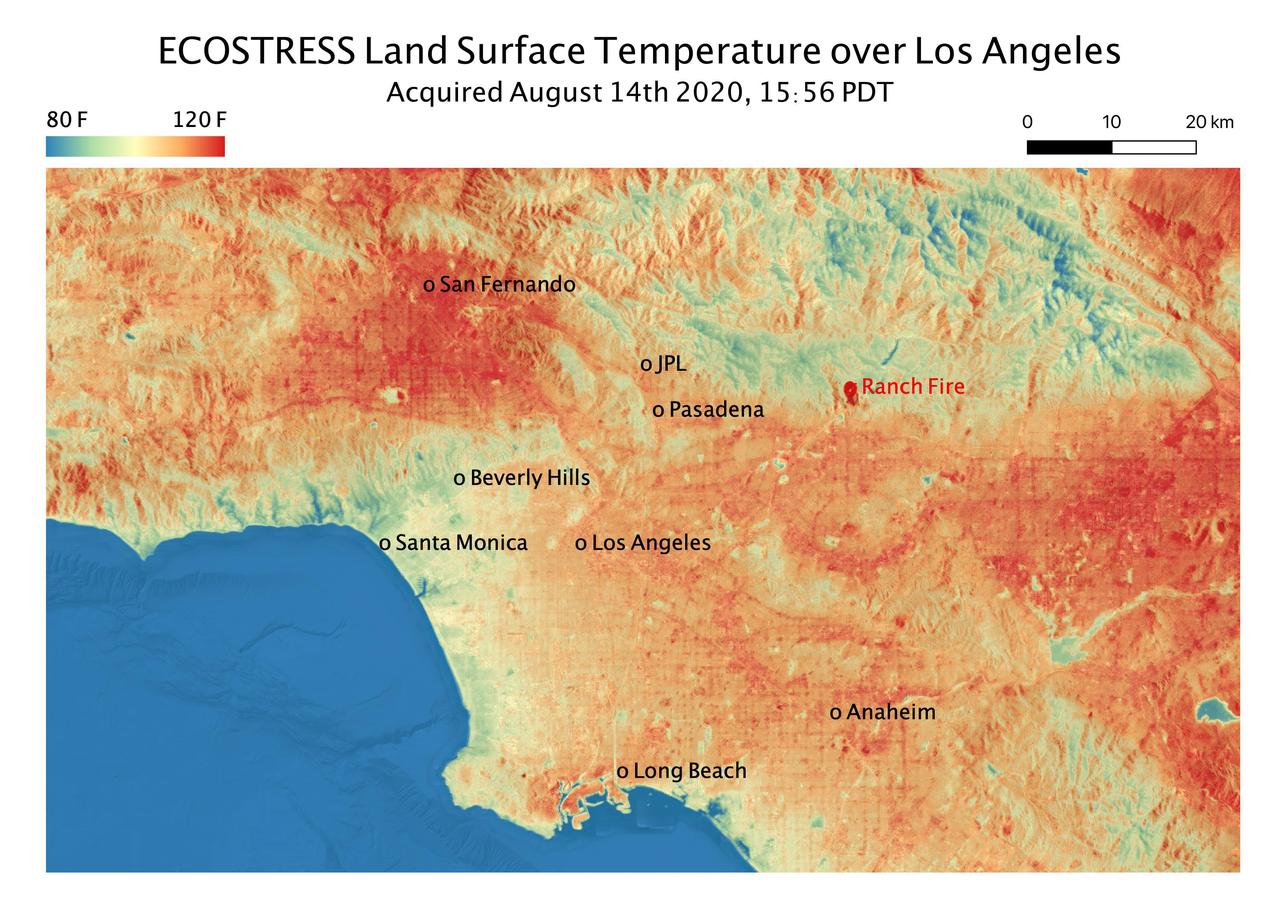
This temperature map shows the land surface temperatures throughout Los Angeles County on Aug. 14, 2020. The observation was made possible by NASA's Ecosystem Spaceborne Thermal Radiometer Experiment on Space Station (ECOSTRESS), which measured a peak land surface temperature in the San Fernando Valley, northwest of downtown Los Angeles, of 128.3 degrees Fahrenheit (53.5 degrees Celsius). ECOSTRESS collected this data as the space station passed over California at about 3:56 p.m. PDT (6:56 p.m. EDT) during a record-breaking heat wave that gripped the region. The Ranch fire, that burned near the city of Azuza was also detected by ECOSTRESS. With a resolution of about 77 by 77 yards (70 by 70 meters), the image enables the study of surface-temperature conditions down to the size of a football field. The hottest temperatures are shown in dark red, with the coolest temperatures in blue. ECOSTRESS measures the temperature of plants as they heat up when they run out of water. But it can also measure and track heat-related phenomena like heat waves, fires, and volcanoes. https://photojournal.jpl.nasa.gov/catalog/PIA23786
Thirteen years after devastating forest fires burned over 1.6 million acres in Yellowstone National Park, the scars are still evident. In this simulated natural color ASTER image, burned areas appear gray, in contrast to the dark green of unburned forests. The image covers an area of 60 x 63 km. This image was acquired on July 2, 2001 by the Advanced Spaceborne Thermal Emission and Reflection Radiometer (ASTER) on NASA's Terra satellite. With its 14 spectral bands from the visible to the thermal infrared wavelength region, and its high spatial resolution of 15 to 90 meters (about 50 to 300 feet), ASTER images Earth to map and monitor the changing surface of our planet. http://photojournal.jpl.nasa.gov/catalog/PIA03875
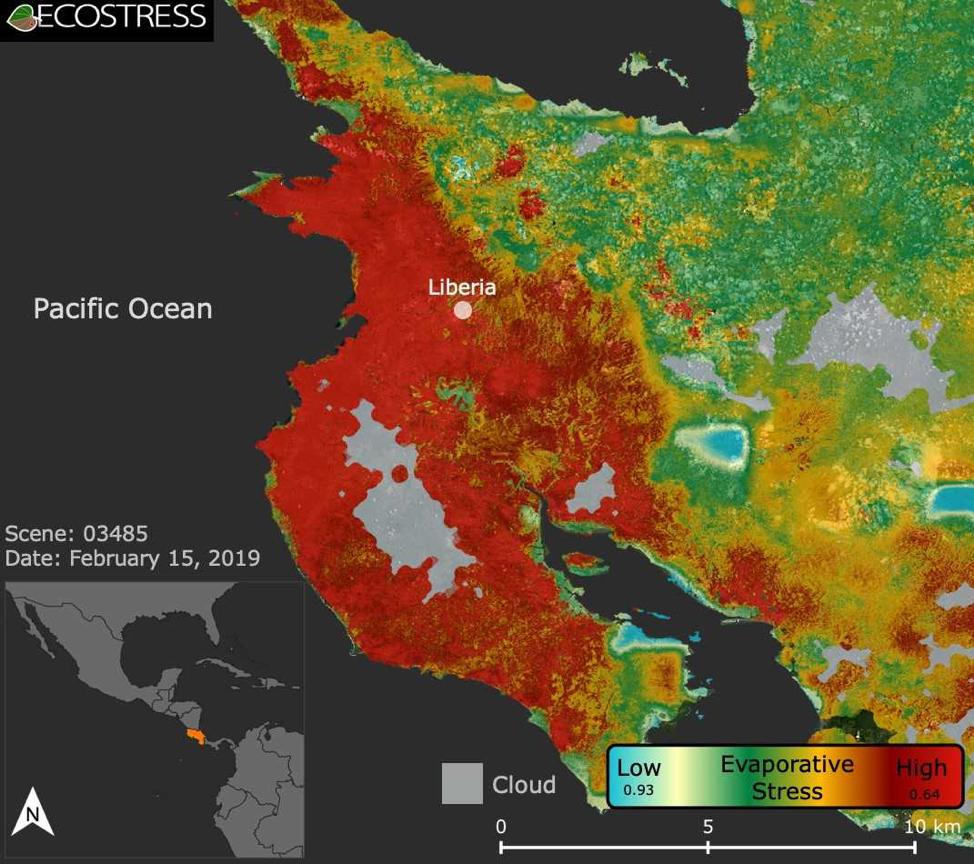
This image shows the ECOSTRESS evaporative stress index for the Guanacaste region of Costa Rica (in red on inset map, left) a few months after the onset of a major Central American drought. Red indicates high plant water stress, yellow is moderate stress and greens/blues are low stress. Light gray is cloud cover. The index measures how much water plants are using relative to how much they would use under optimal conditions; low numbers correlate with high stress. ECOSTRESS launched on June 29, 2018, as part of a SpaceX commercial resupply mission to the International Space Station. Its primary mission is to detect plant health by monitoring Earth's surface temperature. However, surface temperature data are also useful in detecting other heat-related phenomena — like heat waves, volcanoes and fires. https://photojournal.jpl.nasa.gov/catalog/PIA22839
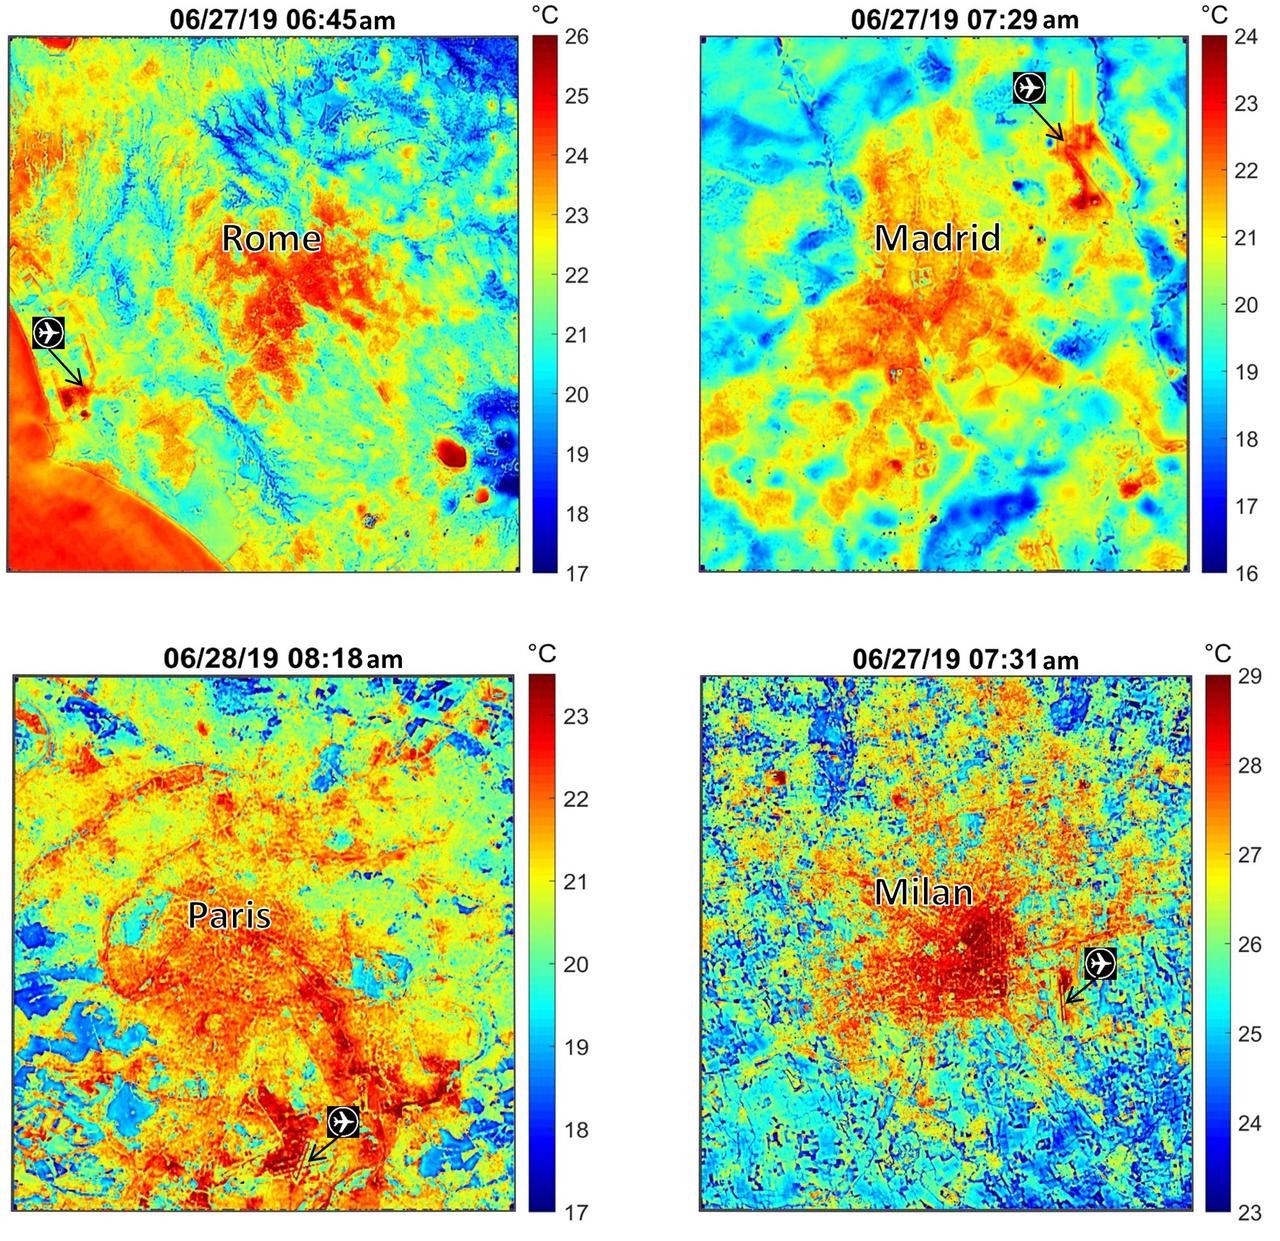
These maps of four European cities show ECOSTRESS surface temperature images acquired in the early mornings of June 27 and 28, 2019, during a heatwave. The images have been sharpened to delineate key features such as airports. Airports and city centers are hotter than surrounding regions because they have more surfaces that retain heat (asphalt, concrete, etc.). ECOSTRESS launched on June 29, 2018, as part of a SpaceX commercial resupply mission to the International Space Station. Its primary mission is to detect plant health by monitoring Earth's surface temperature. However, surface temperature data are also useful in detecting other heat-related phenomena — like heat waves, volcanoes and fires. https://photojournal.jpl.nasa.gov/catalog/PIA23148
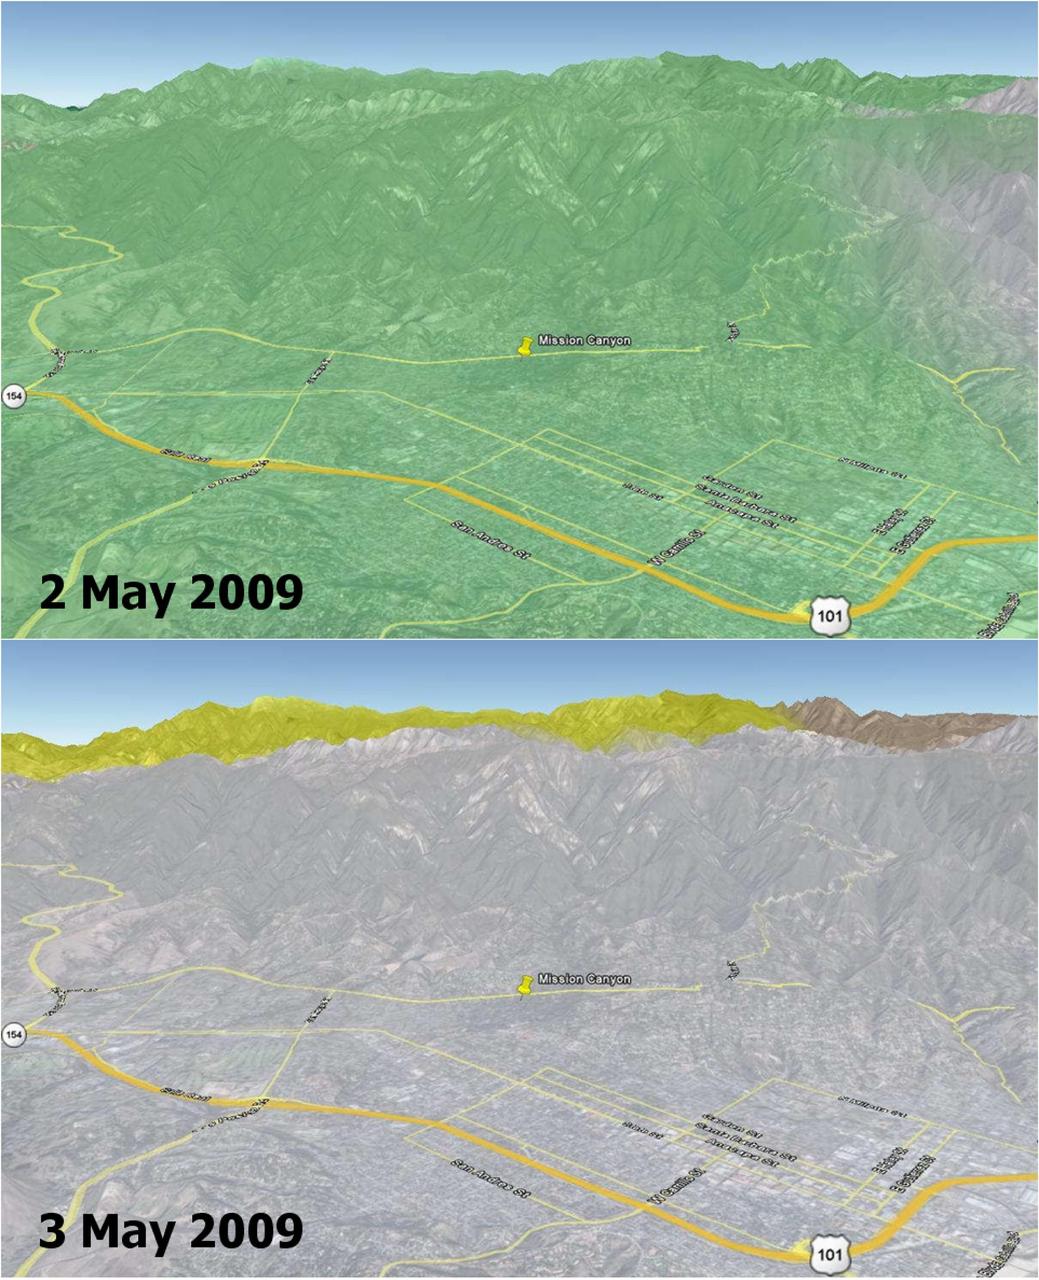
Wildfires are a recurring natural hazard faced by Californians. In Santa Barbara County, a wildfire, called the Jesusita fire, ignited on May 5, 2009 in the Cathedral Peak area northwest of Mission Canyon. As of midday May 8, the fire, which was 10-percent contained, had scorched 3,500 acres, damaged or destroyed 75 structures, and had forced the evacuation of tens of thousands of residents. This image shows soil moisture change in the top soil layer (2-inches deep) on 2 and 3 May 2009, as measured by the NASA QuikSCAT satellite scatterometer (radar). Rainwater increased the amount of moisture in the soil by a moderate 4 percent (represented by the green color) on May 2, which rapidly dried up on the next day (0 percent, as depicted by the grey color on May 3). Son Nghiem of JPL is leading a science team to develop wildfire applications using QuikScat data. “Information critical to assessing the conditions leading to wildfires can be obtained from NASA’s SeaWinds scatterometer, a stable and accurate radar aboard the QuikScat satellite,” says Dr. Son Nghiem, a JPL scientist in remote sensing. This is accomplished by using QuikScat data to map moisture changes in the topsoil. As such, QuikScat can detect rainwater that actually reaches the land surface and accumulates on it, rather than raindrops in the air. While rain radars may detect a significant rain rate, rainwater may evaporate in part before reaching the surface. For example, in the case of dry thunderstorm (known as virga), raindrops disappear on the way down, leaving the land dry, while the associated lightning ignites fires. For the case of the current fire in Santa Barbara, QuikScat detected a moderate increase of 4 percent in soil moisture on May 2, while rain radar data seemed to indicate a significant and extensive rain. The next day, QuikScat revealed that whatever rainwater that had accumulated earlier quickly dried up over the whole area. The maximum temperature in Santa Barbara approached 90 degrees Fahrenheit and broke the record set in 1984. An important characteristic of QuikScat measurements is that they represent the average conditions over the whole area, rather than some disparate data collected at a few localized points. The rapid dry-up in Santa Barbara together with high temperatures and high winds led to the devastating Jesusita fire. http://photojournal.jpl.nasa.gov/catalog/PIA12006
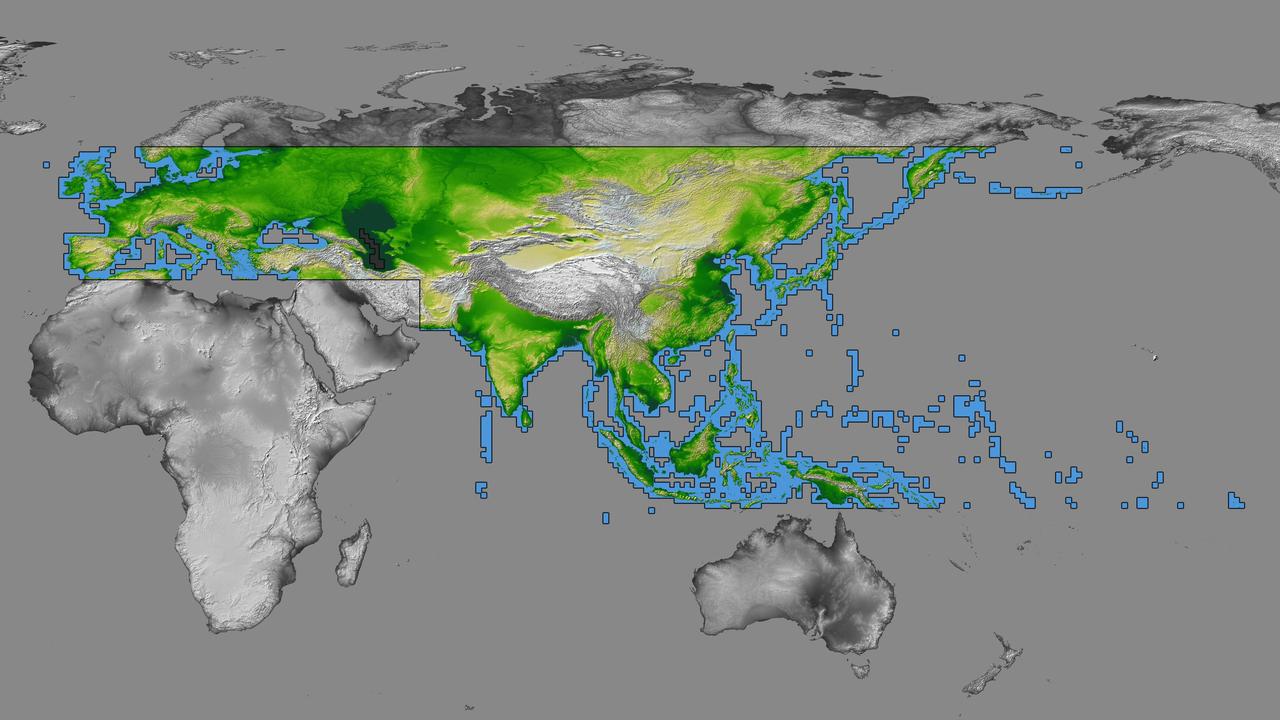
inal Caption Released with Image: The colored regions of this map show the extent of digital elevation data recently released by the Shuttle Radar Topography Mission (SRTM). This release includes data for most of Europe and Asia plus numerous islands in the Indian and Pacific Oceans. SRTM flew on board the Space Shuttle Endeavour in February 2000 and used an interferometric radar system to map the topography of Earth's landmass between latitudes 56 degrees south and 60 degrees north. The data were processed into geographic "tiles," each of which represents one by one degree of latitude and longitude. A degree of latitude measures 111 kilometers (69 miles) north-south, and a degree of longitude measures 111 kilometers or less east-west, decreasing away from the equator. The data are being released to the public on a continent-by-continent basis. This Eurasia segment includes 5,940 tiles, more than a third of the total data set. Previous releases covered North America and South America. Forthcoming releases will include Africa-Arabia and Australia plus an "Islands" release for those islands not included in the continental releases. Together these data releases constitute the world's first high-resolution, near-global elevation model. The resolution of the publicly released data is three arcseconds (1/1,200 of a degree of latitude and longitude), which is about 90 meters (295 feet). European coverage in the current data release stretches eastward from the British Isles and the Iberian Peninsula in the west, across the Alps and Carpathian Mountains, as well as the Northern European Plain, to the Ural and Caucasus Mountains bordering Asia. The Asian coverage includes a great diversity of landforms, including the Tibetan Plateau, Tarin Basin, Mongolian Plateau, and the mountains surrounding Lake Baikal, the world's deepest lake. Mt. Everest in the Himalayas, at 8,848 meters (29,029 feet) is the world's highest mountain. From India's Deccan Plateau, to Southeast Asia, coastal China, and Korea, various landforms place constraints upon land use planning for a great population. Volcanoes in the East Indies, the Philippines, Japan, and the Kamchatka Peninsula form the western part of the "Ring of Fire" around the Pacific Ocean. Many of these regions were previously very poorly mapped due to persistent cloud cover or the inaccessibility of the terrain. Digital elevation data, such as provided by SRTM, are particularly in high demand by scientists studying earthquakes, volcanism, and erosion patterns for use in mapping and modeling hazards to human habitation. But the shape of Earth's surface affects nearly every natural process and human endeavor that occurs there, so elevation data are used in a wide range of applications. In this index map color-coding is directly related to topographic height, with green at the lower elevations, rising through yellow and tan, to white at the highest elevations. The large, very dark green feature in western Asia is the Caspian Sea, which is below sea level. Blue areas on the map represent water within the mapped tiles, each of which includes shorelines or islands. http://photojournal.jpl.nasa.gov/catalog/PIA03398
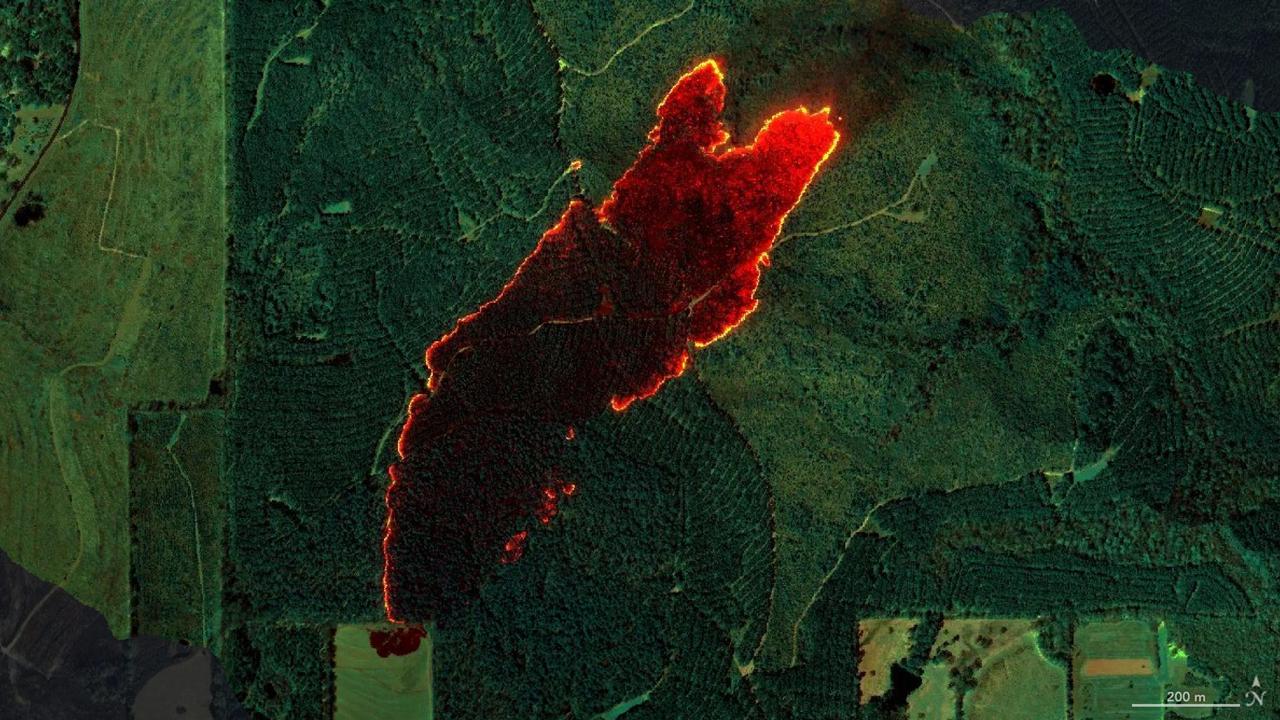
NASA's AVIRIS-3 sensor, an airborne imaging spectrometer built and operated by the agency's Jet Propulsion Laboratory in Southern California, captured infrared data of a roughly 120-acre wildfire about 3 miles (5 kilometers) east of the town of Castleberry, Alabama, on March 19, 2025. Within minutes of flying over the Castleberry Fire, which had not previously been reported to authorities, real-time maps of where burning was most intense were sent via satellite internet to firefighters with the Alabama Forestry Commission, who used it to decide how to deploy their personnel and firefighting equipment. The image combines reflection data from AVIRIS-3 (Airborne Visible Infrared Imaging Spectrometer 3) at three infrared wavelengths that are invisible to the human eye: 2,350 nanometers, 1,200 nanometers, and 1,000 nanometers. In the resulting composite image, the colors indicate where the fire was burning most intensely. Orange and red areas show cooler-burning areas, while yellow indicates the most intense flames. Burned areas show up as dark red or brown. The AVIRIS-3 sensor belongs to a line of imaging spectrometers built at JPL since 1986. The instruments have been used to study a wide range of phenomena – including fire – by measuring sunlight reflecting from the planet's surface. Data from imaging spectrometers like AVIRIS-3 typically takes days or weeks to be processed into highly detailed, multilayer image products used for research. By simplifying the calibration algorithms, researchers were able to process data on a computer aboard the plane in a sliver of the time it otherwise would have taken, and airborne satellite internet connectivity enabled the images to be distributed almost immediately, while the plane was still in flight, rather than after it landed. Flying about 9,000 feet (3,000 meters) in altitude aboard a NASA King Air B200 research plane, AVIRIS-3 collected data on the Castleberry Fire while preparing for prescribed burn experiments that took place in the Geneva State Forest in Alabama on March 28 and at Fort Stewart-Hunter Army Airfield in Georgia from April 14 to 20. The burns were part of a NASA 2025 FireSense Airborne Campaign. https://photojournal.jpl.nasa.gov/catalog/PIA26497
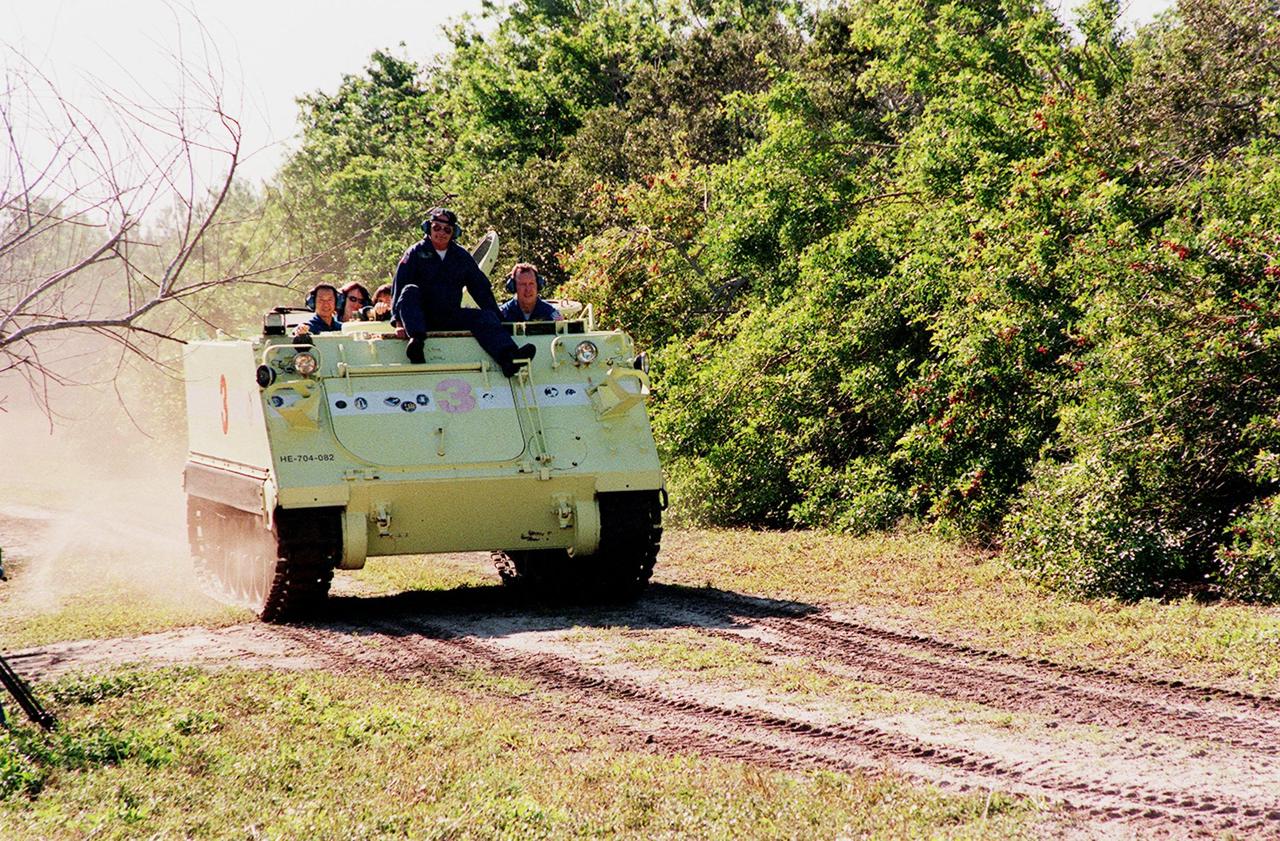
STS-99 Pilot Dominic Gorie, under the watchful eye of Capt. George Hoggard, a trainer with the KSC Fire Department, practices driving the M-113, an armored personnel carrier. Part of Terminal Countdown Demonstration Test (TCDT) activities, the M-113 could be used by the crew in the event of an emergency at the pad during which the crew must make a quick exit from the area. Riding in the rear are Mission Specialists Mamoru Mohri, who is with the National Space Development Agency (NASDA) of Japan, Janet Lynn Kavandi (Ph.D.) and Janice Voss (Ph.D.). TCDT provides the crew with simulated countdown exercises, emergency egress training, and opportunities to inspect the mission payloads in the orbiter's payload bay. STS-99 is the Shuttle Radar Topography Mission, which will chart a new course, using two antennae and a 200-foot-long section of space station-derived mast protruding from the payload bay to produce unrivaled 3-D images of the Earth's surface. The result of the Shuttle Radar Topography Mission could be close to 1 trillion measurements of the Earth's topography. Besides contributing to the production of better maps, these measurements could lead to improved water drainage modeling, more realistic flight simulators, better locations for cell phone towers, and enhanced navigation safety. Launch of Endeavour on the 11-day mission is scheduled for Jan. 31 at 12:47 p.m. EST

STS-99 Pilot Dominic Gorie, under the watchful eye of Capt. George Hoggard, a trainer with the KSC Fire Department, practices driving the M-113, an armored personnel carrier. Part of Terminal Countdown Demonstration Test (TCDT) activities, the M-113 could be used by the crew in the event of an emergency at the pad during which the crew must make a quick exit from the area. Riding in the rear are Mission Specialists Mamoru Mohri, who is with the National Space Development Agency (NASDA) of Japan, Janet Lynn Kavandi (Ph.D.) and Janice Voss (Ph.D.). TCDT provides the crew with simulated countdown exercises, emergency egress training, and opportunities to inspect the mission payloads in the orbiter's payload bay. STS-99 is the Shuttle Radar Topography Mission, which will chart a new course, using two antennae and a 200-foot-long section of space station-derived mast protruding from the payload bay to produce unrivaled 3-D images of the Earth's surface. The result of the Shuttle Radar Topography Mission could be close to 1 trillion measurements of the Earth's topography. Besides contributing to the production of better maps, these measurements could lead to improved water drainage modeling, more realistic flight simulators, better locations for cell phone towers, and enhanced navigation safety. Launch of Endeavour on the 11-day mission is scheduled for Jan. 31 at 12:47 p.m. EST
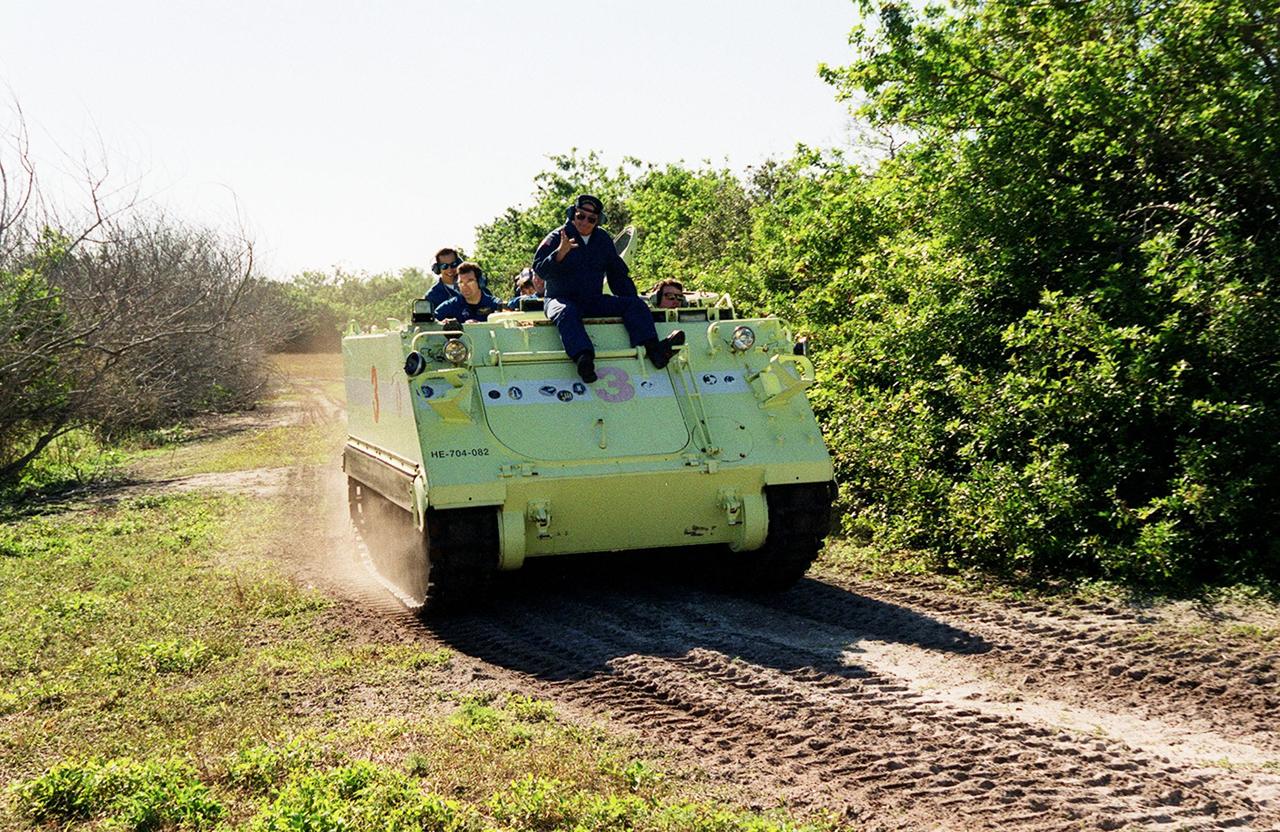
Under the watchful eye of Capt. George Hoggard, a trainer with the KSC Fire Department, STS-99 Commander Kevin Kregel practices driving the M-113, an armored personnel carrier. Part of Terminal Countdown Demonstration Test (TCDT) activities, the M-113 could be used by the crew in the event of an emergency at the pad during which the crew must make a quick exit from the area. TCDT provides the crew with simulated countdown exercises, emergency egress training, and opportunities to inspect the mission payloads in the orbiter's payload bay. STS-99 is the Shuttle Radar Topography Mission, which will chart a new course, using two antennae and a 200-foot-long section of space station-derived mast protruding from the payload bay to produce unrivaled 3-D images of the Earth's surface. The result of the Shuttle Radar Topography Mission could be close to 1 trillion measurements of the Earth's topography. Besides contributing to the production of better maps, these measurements could lead to improved water drainage modeling, more realistic flight simulators, better locations for cell phone towers, and enhanced navigation safety. Launch of Endeavour on the 11-day mission is scheduled for Jan. 31 at 12:47 p.m. EST

Under the watchful eye of Capt. George Hoggard, a trainer with the KSC Fire Department, STS-99 Commander Kevin Kregel practices driving the M-113, an armored personnel carrier. Part of Terminal Countdown Demonstration Test (TCDT) activities, the M-113 could be used by the crew in the event of an emergency at the pad during which the crew must make a quick exit from the area. TCDT provides the crew with simulated countdown exercises, emergency egress training, and opportunities to inspect the mission payloads in the orbiter's payload bay. STS-99 is the Shuttle Radar Topography Mission, which will chart a new course, using two antennae and a 200-foot-long section of space station-derived mast protruding from the payload bay to produce unrivaled 3-D images of the Earth's surface. The result of the Shuttle Radar Topography Mission could be close to 1 trillion measurements of the Earth's topography. Besides contributing to the production of better maps, these measurements could lead to improved water drainage modeling, more realistic flight simulators, better locations for cell phone towers, and enhanced navigation safety. Launch of Endeavour on the 11-day mission is scheduled for Jan. 31 at 12:47 p.m. EST
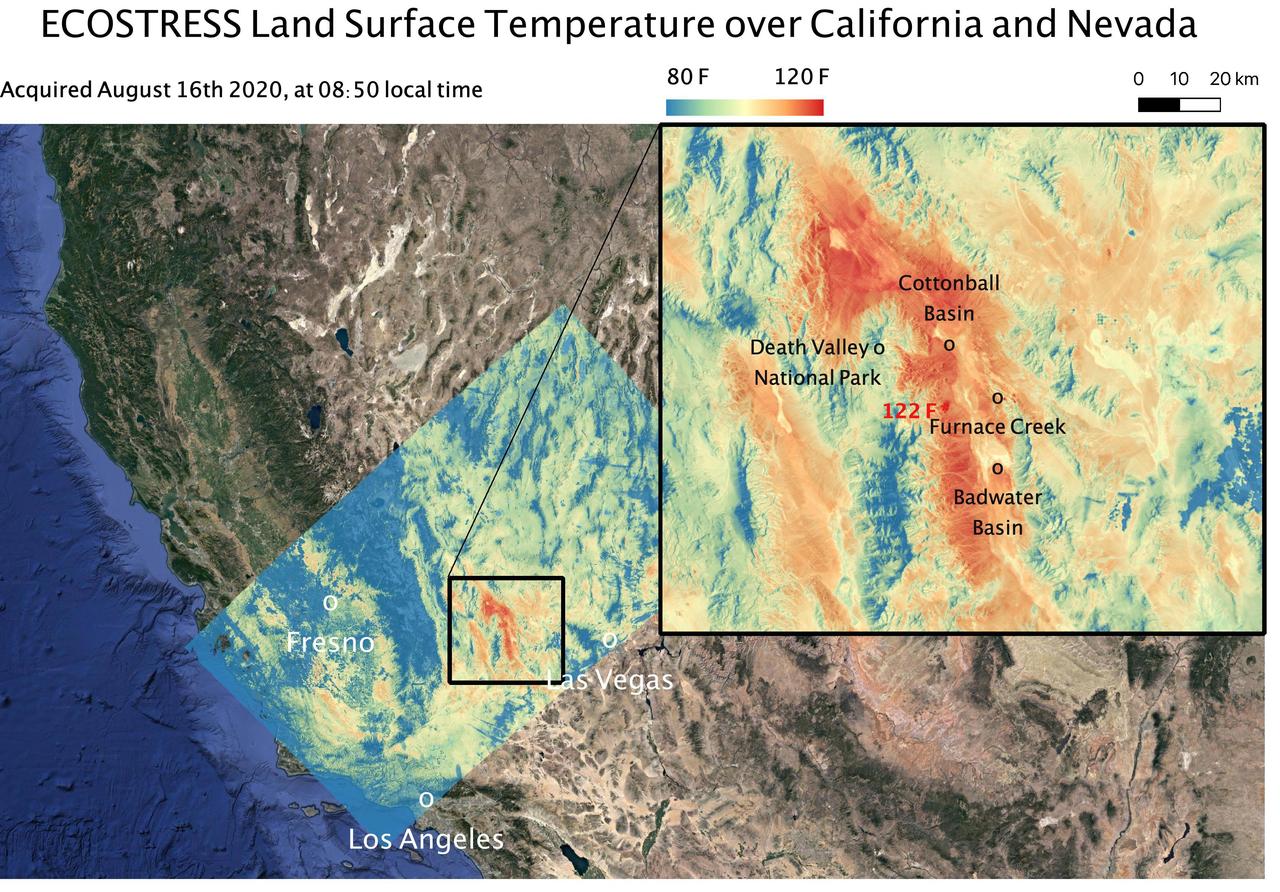
This temperature map shows the land surface temperatures around Death Valley in California's Mojave Desert on Aug. 16, 2020. The observation was made possible by NASA's Ecosystem Spaceborne Thermal Radiometer Experiment on Space Station (ECOSTRESS), which measured a peak land surface temperature of 122.52 degrees Fahrenheit (50.29 degrees Celsius) near Furnace Creek. ECOSTRESS collected this data when the space station passed over California at about 8:50 a.m. PDT (11:50 a.m. EDT) during a record-breaking heat wave that gripped the region. With a resolution of about 77 by 77 yards (70 by 70 meters), the image enables the study of surface-temperature conditions down to the size of a football field. The hottest temperatures are shown in dark red, with the coolest temperatures in blue. ECOSTRESS measures the temperature of plants as they heat up when they run out of water. But it can also measure and track heat-related phenomena like heat waves, fires, and volcanoes. https://photojournal.jpl.nasa.gov/catalog/PIA23787
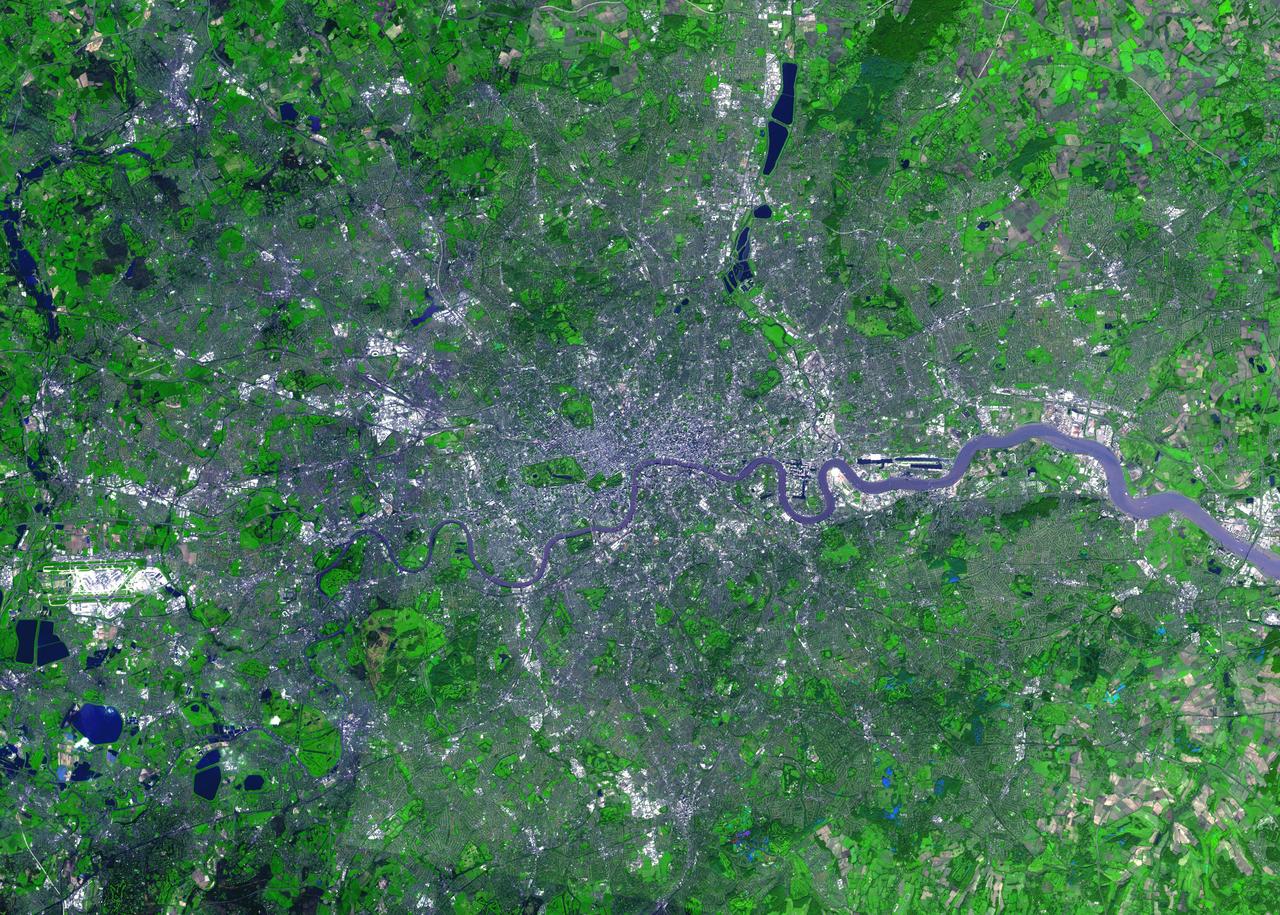
For almost 2,000 years, the River Thames has served as the life force of London, capital of the United Kingdom and one of the world's most famous cities. In AD 43 the Romans established the trading settlement of Londinium at a favorable crossing point on the river. The Romans remained until the 5th century, when the city came under Saxon control. The early 17th century saw enormous growth, but the deadly plague of 1664 and 1665 ravaged the population, and in the following year the Great Fire, which burned for four days, destroyed most of the city. A public transportation system and other city services in the early 19th century eased many of the increasing urban problems of the burgeoning capital of the wealthy British Empire. After coping with the devastating effects of bombing during World War II and the gradual dismantling of the empire, London today thrives as a vital modern metropolis. London is one of 100 cities being studied using ASTER data to map and monitor urban use patterns and growth. This image was acquired on October 12, 2001 by the Advanced Spaceborne Thermal Emission and Reflection Radiometer (ASTER) on NASA's Terra satellite. With its 14 spectral bands from the visible to the thermal infrared wavelength region, and its high spatial resolution of 15 to 90 meters (about 50 to 300 feet), ASTER images Earth to map and monitor the changing surface of our planet. http://photojournal.jpl.nasa.gov/catalog/PIA04301
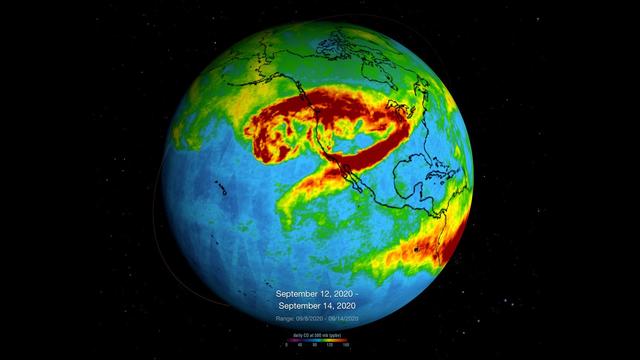
NASA's Atmospheric Infrared Sounder (AIRS), which is aboard the Aqua satellite, captured carbon monoxide plumes coming from California wildfires last week. There were 28 major wildfires burning across the state as of Sept. 14. This includes the August Complex Fire, which started on Aug. 17 and has since burned over 471,000 acres, making it the largest fire on record in California. The animation shows three-day averages of carbon monoxide concentrations around 3 miles (5 kilometers) up in the atmosphere between Sept. 6 and 14. The red and orange areas indicate regions with extremely high carbon monoxide concentrations of greater than 350 parts per billion by volume (ppbv). The more normal, background concentrations of carbon monoxide show up as yellow and green, with amounts between 30 and 50 ppbv. A pollutant that can travel large distances, carbon monoxide can persist in the atmosphere for about a month. At the high altitude mapped in these images, the gas has little effect on the air we breathe; however, strong winds can carry it downward to where it can significantly impact air quality. Carbon monoxide plays a role in both air pollution and climate change. The intense heat from the wildfires lofted the carbon monoxide high into the atmosphere, enabling detection by the AIRS instrument. The jet stream then blew the carbon monoxide plume eastward across the U.S. and over the Atlantic Ocean. Movie available at https://photojournal.jpl.nasa.gov/catalog/PIA23789
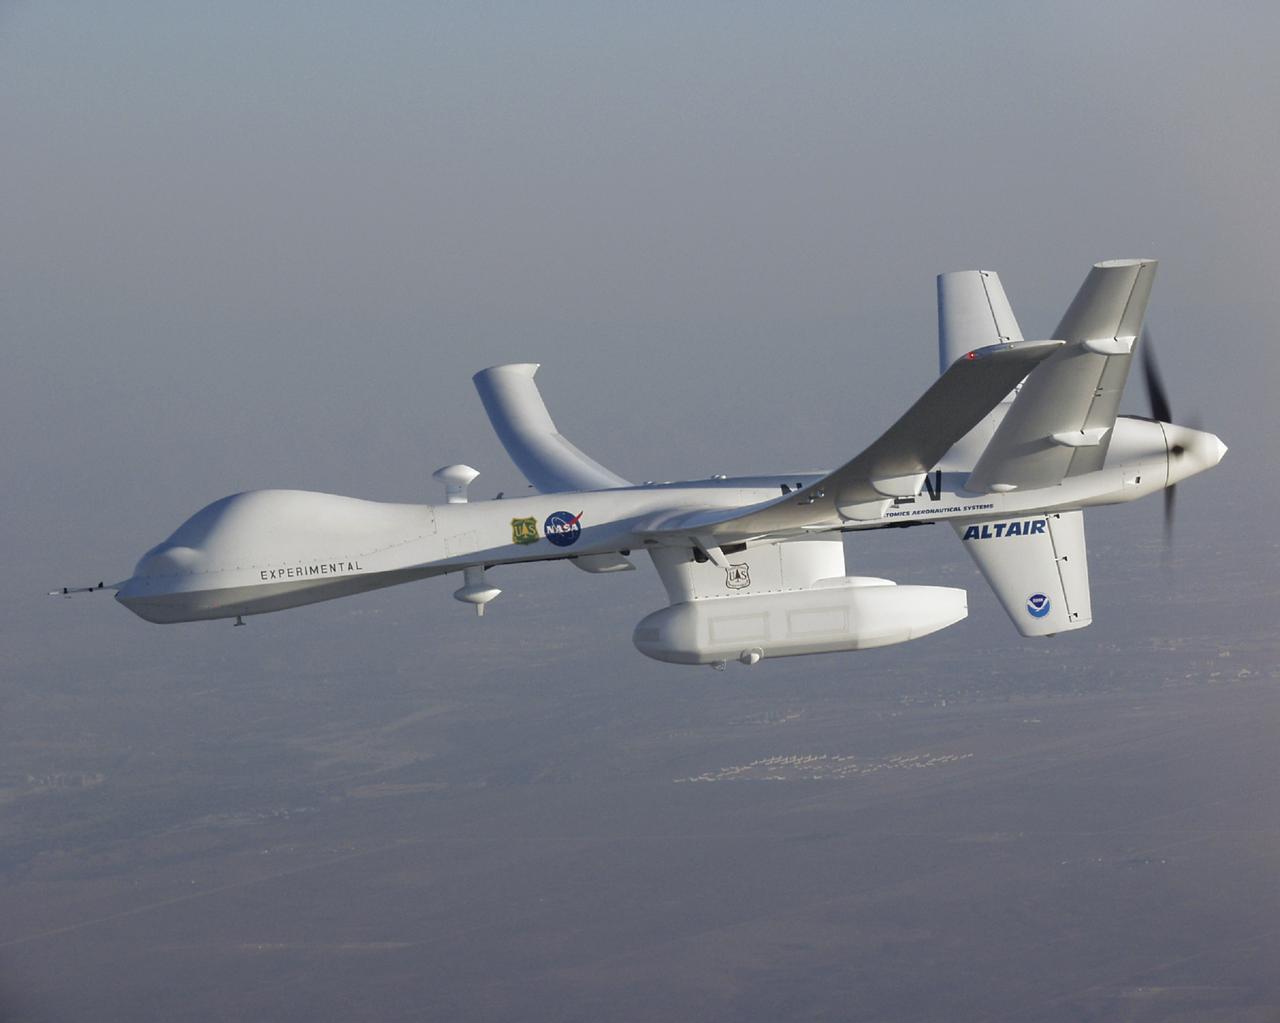
A high-tech infrared imaging sensor in its underbelly pod, the Altair UAS flew repeated passes over the Esperanza fire to aid firefighting efforts.
NASA Dryden's Ikhana ground crewmen Gus Carreno and James Smith load the thermal-infrared imaging scanner pallet into the Ikhana's underwing payload pod.

With smoke from the Lake Arrowhead area fires streaming in the background, NASA's Ikhana unmanned aircraft heads out on a Southern California wildfires imaging mission.

With smoke from the Lake Arrowhead area fires streaming in the background, NASA's Ikhana unmanned aircraft heads out on a Southern California wildfires imaging mission.
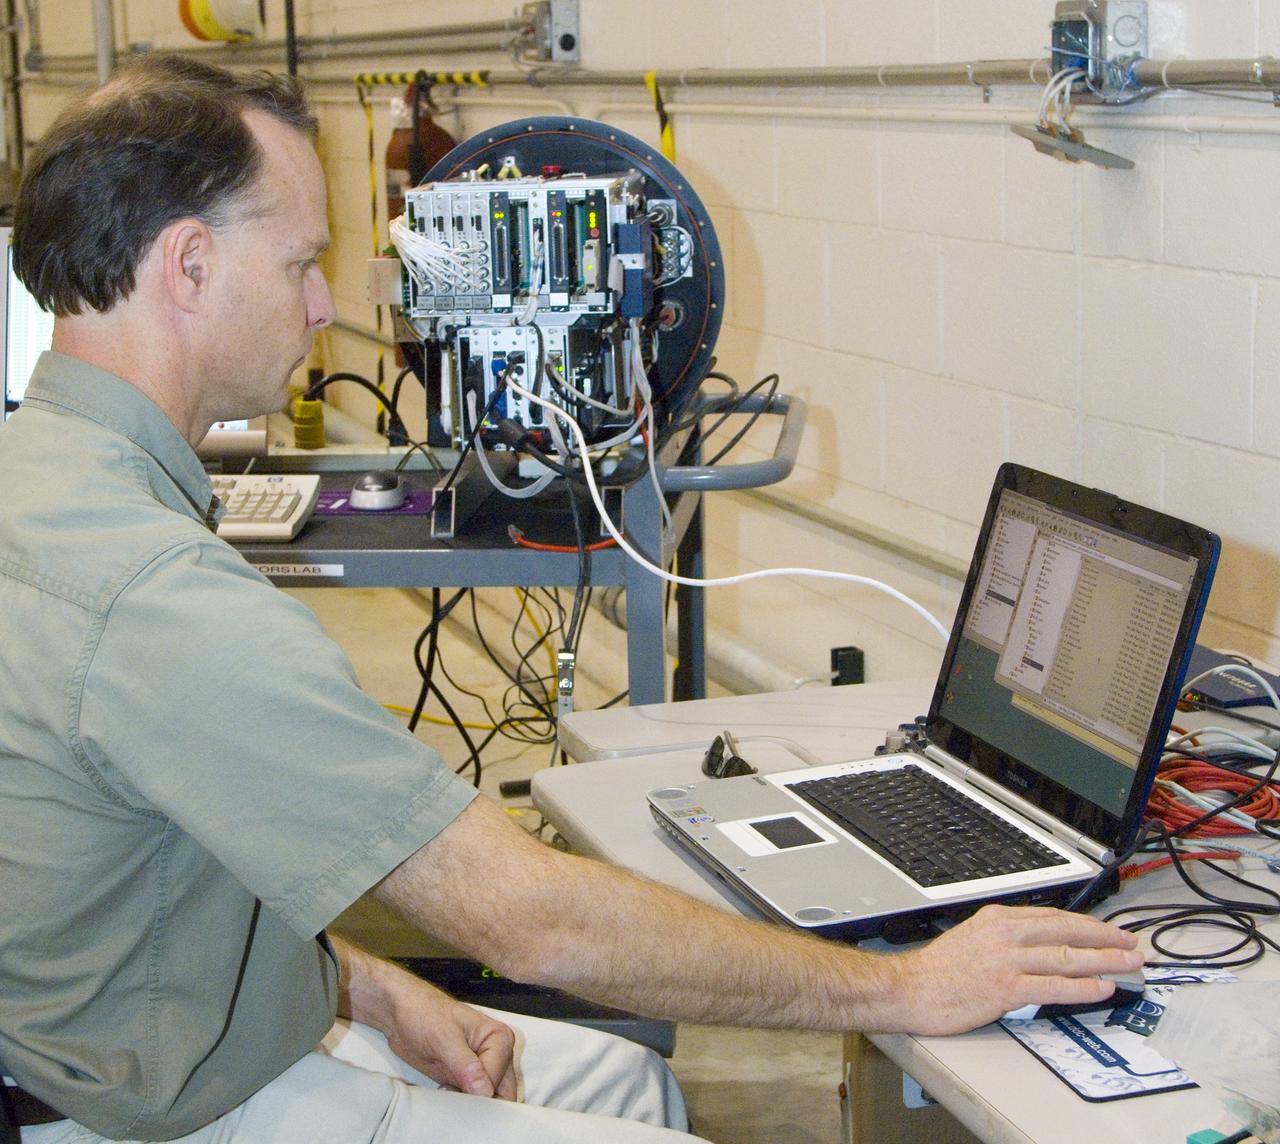
NASA Ames engineer Ted Hildum checks out the thermal-infrared scanner computer before it is loaded on NASA's Ikhana unmanned aircraft.

As it sped away from a relatively distant encounter with Titan on Feb. 17, 2017, NASA's Cassini spacecraft captured this mosaic view of the moon's northern lakes and seas. Cassini's viewing angle over Kraken Mare and Ligeia Mare was better during this flyby than previous encounters, providing increased contrast for viewing these seas. Because the spacecraft is peering through less of Titan's haze toward Kraken and Ligeia, more details on their shorelines are visible, compared to earlier maps. This was one of several "non-targeted" Cassini Titan flybys in 2017 that allow the mission to image the moon's north polar region and track clouds there. ("Non-targeted" means Cassini did not have to use any rocket-thruster firings to steer itself toward the flyby.) Several prominent cloud streaks are visible at mid-latitudes between 45 and 55 degrees north latitude, on the right side of the image. Smaller bright clouds are seen just above the sea called Punga Mare (roughly at center). Scientists are seeing increasing cloud activity in Titan's north polar region as the seasons continue to change from spring to summer there, though not as much as predicted by models of Titan's atmosphere. The images in this mosaic were taken with the Cassini spacecraft narrow-angle camera using a spectral filter sensitive to wavelengths of near-infrared light centered at 938 nanometers. The view was obtained at a distance of approximately 150,700 miles (242,500 kilometers) from Titan. Image scale is about 1.6 miles (2.6 kilometers) per pixel. The view is an orthographic projection centered on 68 degrees north latitude, 225 degrees west longitude. An orthographic view is most like the view seen by a distant observer looking through a telescope. http://photojournal.jpl.nasa.gov/catalog/PIA21434
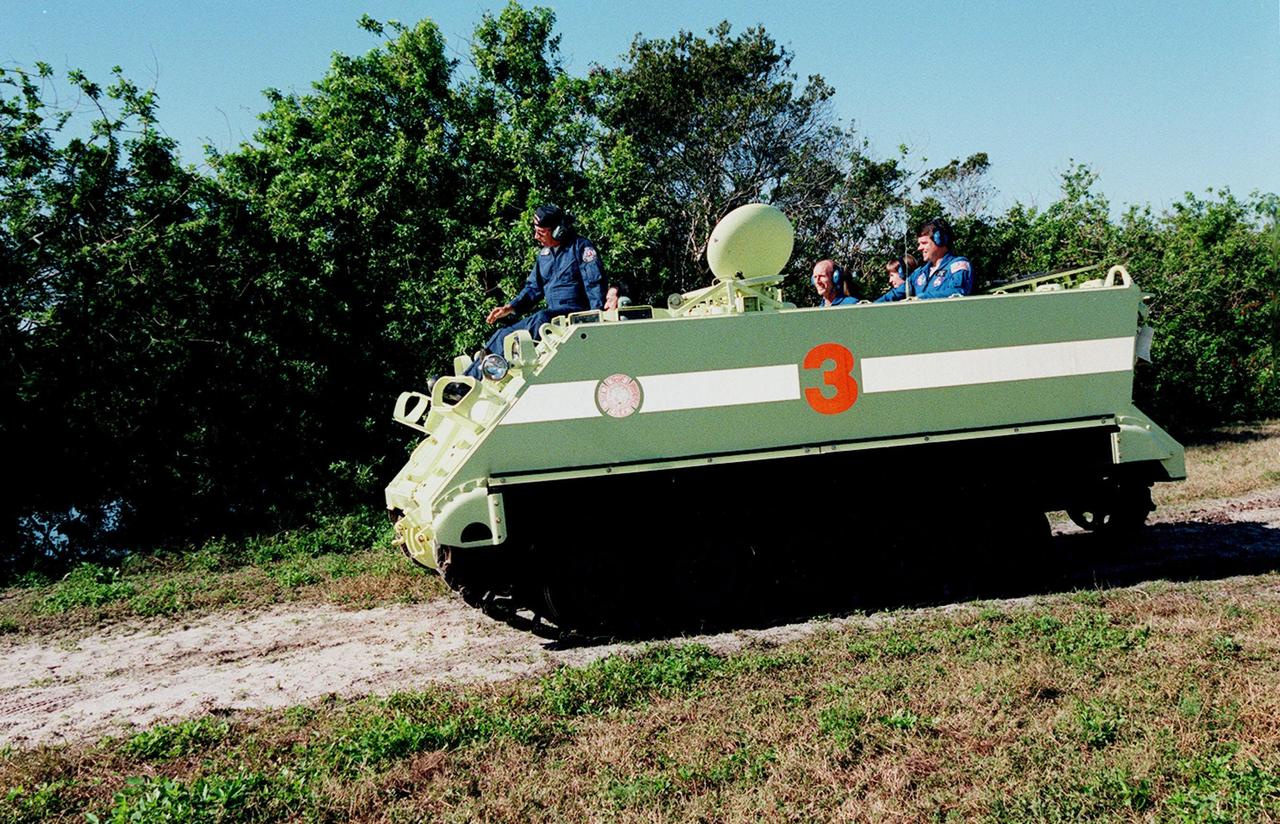
STS-99 Mission Specialist Mamoru Mohri, who is with the National Space Development Agency (NASDA) of Japan, practices driving an armored personnel carrier under the watchful eye of Capt. George Hoggard (riding on the front), trainer with the KSC Fire Department. The vehicle is part of emergency egress training during Terminal Countdown Demonstration Test (TCDT) activities and could be used by the crew in the event of an emergency at the pad during which the crew must make a quick exit from the area. Riding in the rear of the carrier are Mission Specialists Gerhard Thiele (center), Janice Voss (Ph.D.), and Commander Kevin Kregel. TCDT provides the crew with simulated countdown exercises, emergency egress training, and opportunities to inspect the mission payloads in the orbiter's payload bay. STS-99 is the Shuttle Radar Topography Mission, which will chart a new course, using two antennae and a 200-foot-long section of space station-derived mast protruding from the payload bay to produce unrivaled 3-D images of the Earth's surface. The result of the Shuttle Radar Topography Mission could be close to 1 trillion measurements of the Earth's topography. Besides contributing to the production of better maps, these measurements could lead to improved water drainage modeling, more realistic flight simulators, better locations for cell phone towers, and enhanced navigation safety. Launch of Endeavour on the 11-day mission is scheduled for Jan. 31 at 12:47 p.m. EST

STS-99 Mission Specialist Mamoru Mohri, who is with the National Space Development Agency (NASDA) of Japan, practices driving an armored personnel carrier under the watchful eye of Capt. George Hoggard (riding on the front), trainer with the KSC Fire Department. The vehicle is part of emergency egress training during Terminal Countdown Demonstration Test (TCDT) activities and could be used by the crew in the event of an emergency at the pad during which the crew must make a quick exit from the area. Riding in the rear of the carrier are Mission Specialists Gerhard Thiele (center), Janice Voss (Ph.D.), and Commander Kevin Kregel. TCDT provides the crew with simulated countdown exercises, emergency egress training, and opportunities to inspect the mission payloads in the orbiter's payload bay. STS-99 is the Shuttle Radar Topography Mission, which will chart a new course, using two antennae and a 200-foot-long section of space station-derived mast protruding from the payload bay to produce unrivaled 3-D images of the Earth's surface. The result of the Shuttle Radar Topography Mission could be close to 1 trillion measurements of the Earth's topography. Besides contributing to the production of better maps, these measurements could lead to improved water drainage modeling, more realistic flight simulators, better locations for cell phone towers, and enhanced navigation safety. Launch of Endeavour on the 11-day mission is scheduled for Jan. 31 at 12:47 p.m. EST

NASA image acquired April 18 - October 23, 2012 This image of North and South America at night is a composite assembled from data acquired by the Suomi NPP satellite in April and October 2012. The new data was mapped over existing Blue Marble imagery of Earth to provide a realistic view of the planet. The nighttime view was made possible by the new satellite’s “day-night band” of the Visible Infrared Imaging Radiometer Suite. VIIRS detects light in a range of wavelengths from green to near-infrared and uses filtering techniques to observe dim signals such as city lights, gas flares, auroras, wildfires, and reflected moonlight. In this case, auroras, fires, and other stray light have been removed to emphasize the city lights. “Artificial lighting is a excellent remote sensing observable and proxy for human activity,” says Chris Elvidge, who leads the Earth Observation Group at NOAA’s National Geophysical Data Center. Social scientists and demographers have used night lights to model the spatial distribution of economic activity, of constructed surfaces, and of populations. Planners and environmental groups have used maps of lights to select sites for astronomical observatories and to monitor human development around parks and wildlife refuges. Electric power companies, emergency managers, and news media turn to night lights to observe blackouts. Named for satellite meteorology pioneer Verner Suomi, NPP flies over any given point on Earth's surface twice each day at roughly 1:30 a.m. and p.m. The polar-orbiting satellite flies 824 kilometers (512 miles) above the surface, sending its data once per orbit to a ground station in Svalbard, Norway, and continuously to local direct broadcast users distributed around the world. The mission is managed by NASA with operational support from NOAA and its Joint Polar Satellite System, which manages the satellite's ground system. NASA Earth Observatory image by Robert Simmon, using Suomi NPP VIIRS data provided courtesy of Chris Elvidge (NOAA National Geophysical Data Center). Suomi NPP is the result of a partnership between NASA, NOAA, and the Department of Defense. Caption by Mike Carlowicz. Instrument: Suomi NPP - VIIRS Credit: <b><a href="http://www.earthobservatory.nasa.gov/" rel="nofollow"> NASA Earth Observatory</a></b> <b>Click here to view all of the <a href="http://earthobservatory.nasa.gov/Features/NightLights/" rel="nofollow"> Earth at Night 2012 images </a></b> <b>Click here to <a href="http://earthobservatory.nasa.gov/NaturalHazards/view.php?id=79787" rel="nofollow"> read more </a> about this image </b> <b><a href="http://www.nasa.gov/audience/formedia/features/MP_Photo_Guidelines.html" rel="nofollow">NASA image use policy.</a></b> <b><a href="http://www.nasa.gov/centers/goddard/home/index.html" rel="nofollow">NASA Goddard Space Flight Center</a></b> enables NASA’s mission through four scientific endeavors: Earth Science, Heliophysics, Solar System Exploration, and Astrophysics. Goddard plays a leading role in NASA’s accomplishments by contributing compelling scientific knowledge to advance the Agency’s mission. <b>Follow us on <a href="http://twitter.com/NASA_GoddardPix" rel="nofollow">Twitter</a></b> <b>Like us on <a href="http://www.facebook.com/pages/Greenbelt-MD/NASA-Goddard/395013845897?ref=tsd" rel="nofollow">Facebook</a></b> <b>Find us on <a href="http://instagram.com/nasagoddard?vm=grid" rel="nofollow">Instagram</a></b>

NASA image acquired April 18 - October 23, 2012 This new image of Europe, Africa, and the Middle East at night is a composite assembled from data acquired by the Suomi NPP satellite in April and October 2012. The new data was mapped over existing Blue Marble imagery of Earth to provide a realistic view of the planet. The nighttime view was made possible by the new satellite’s “day-night band” of the Visible Infrared Imaging Radiometer Suite. VIIRS detects light in a range of wavelengths from green to near-infrared and uses filtering techniques to observe dim signals such as gas flares, auroras, wildfires, city lights, and reflected moonlight. In this case, auroras, fires, and other stray light have been removed to emphasize the city lights. “Night time imagery provides an intuitively graspable view of our planet,” says William Stefanov, senior remote sensing scientist for the International Space Station program office. “They provide a fairly straightforward means to map urban versus rural areas, and to show where the major population centers are and where they are not.” Named for satellite meteorology pioneer Verner Suomi, NPP flies over any given point on Earth's surface twice each day at roughly 1:30 a.m. and p.m. The polar-orbiting satellite flies 824 kilometers (512 miles) above the surface, sending its data once per orbit to a ground station in Svalbard, Norway, and continuously to local direct broadcast users distributed around the world. The mission is managed by NASA with operational support from NOAA and its Joint Polar Satellite System, which manages the satellite's ground system. NASA Earth Observatory image by Robert Simmon, using Suomi NPP VIIRS data provided courtesy of Chris Elvidge (NOAA National Geophysical Data Center). Suomi NPP is the result of a partnership between NASA, NOAA, and the Department of Defense. Caption by Mike Carlowicz. Instrument: Suomi NPP - VIIRS Credit: <b><a href="http://www.earthobservatory.nasa.gov/" rel="nofollow"> NASA Earth Observatory</a></b> <b>Click here to view all of the <a href="http://earthobservatory.nasa.gov/Features/NightLights/" rel="nofollow"> Earth at Night 2012 images </a></b> <b>Click here to <a href="http://earthobservatory.nasa.gov/NaturalHazards/view.php?id=79793" rel="nofollow"> read more </a> about this image </b> <b><a href="http://www.nasa.gov/audience/formedia/features/MP_Photo_Guidelines.html" rel="nofollow">NASA image use policy.</a></b> <b><a href="http://www.nasa.gov/centers/goddard/home/index.html" rel="nofollow">NASA Goddard Space Flight Center</a></b> enables NASA’s mission through four scientific endeavors: Earth Science, Heliophysics, Solar System Exploration, and Astrophysics. Goddard plays a leading role in NASA’s accomplishments by contributing compelling scientific knowledge to advance the Agency’s mission. <b>Follow us on <a href="http://twitter.com/NASA_GoddardPix" rel="nofollow">Twitter</a></b> <b>Like us on <a href="http://www.facebook.com/pages/Greenbelt-MD/NASA-Goddard/395013845897?ref=tsd" rel="nofollow">Facebook</a></b> <b>Find us on <a href="http://instagram.com/nasagoddard?vm=grid" rel="nofollow">Instagram</a></b>
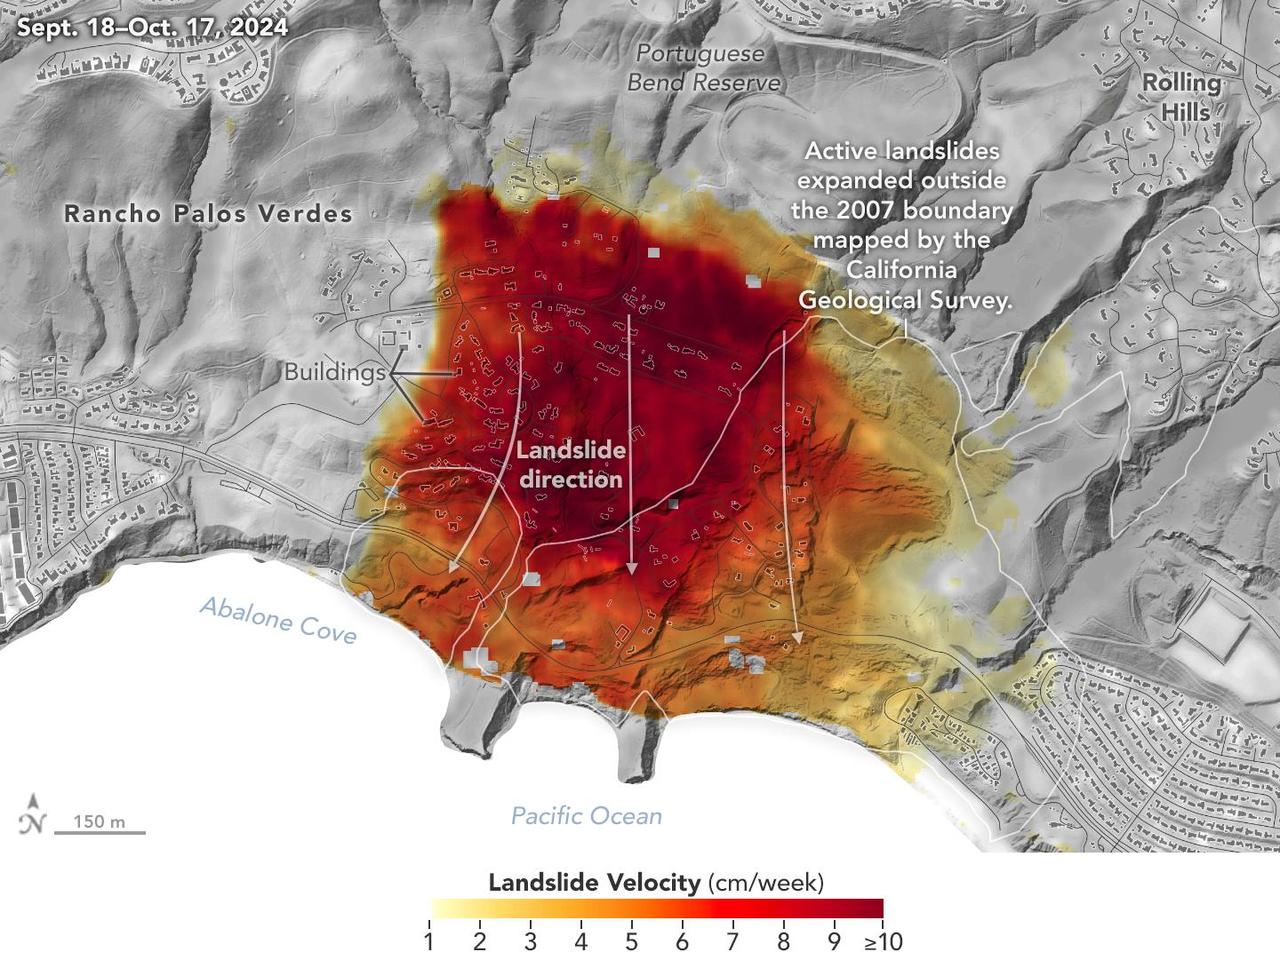
Researchers at NASA's Jet Propulsion Laboratory in Southern California used data from an airborne radar to measure the movement of the slow-moving landslides on the Palos Verdes Peninsula in Los Angeles County. The analysis determined that, during a period of four weeks in the fall of 2024, land in the residential area slid toward the ocean by as much as 4 inches (10 centimeters) per week. Portions of the peninsula, which juts into the Pacific Ocean just south of the city of Los Angeles, is part of an ancient complex of landslides and has been moving for at least the past six decades, affecting hundreds of buildings in local communities. The motion accelerated and the active area expanded following record-breaking rainfall in Southern California in 2023 and another heavy-precipitation winter in 2024. To create this visualization, the Advanced Rapid Imaging and Analysis (ARIA) team used data from four flights of NASA's Uninhabited Aerial Vehicle Synthetic Aperture Radar (UAVSAR) that took place between Sept. 18 and Oct. 17. The UAVSAR instrument was mounted to a Gulfstream III jet flown out of NASA's Armstrong Flight Research Center in Edwards, California, and the four flights were planned to estimate the speed and direction of the landslides in three dimensions. In the image, colors indicate how fast parts of the landslide complex were moving in late September and October, with the darkest reds indicating the highest speeds. The arrows represent the direction of horizontal motion. The white solid lines are the boundaries of active landslide areas as defined in 2007 by the California Geological Survey. The insights from the UAVSAR flights were part of a package of analyses by the ARIA team that also used data from ESA's (the European Space Agency's) Copernicus Sentinel-1A/B satellites. The analyses were provided to California officials to support the state's response to the landslides and made available to the public at NASA's Disaster Mapping Portal. The ARIA mission is a collaboration between JPL and Caltech, which manages JPL for NASA, to leverage radar and optical remote-sensing, GPS, and seismic observations for science as well as to aid in disaster response. The project investigates the processes and impacts of earthquakes, volcanoes, landslides, fires, subsurface fluid movement, and other natural hazards. UAVSAR has flown thousands of radar missions around the world since 2007 studying phenomena such as glaciers and ice sheets, vegetation in ecosystems, and natural hazards like earthquakes, volcanoes, and landslides. https://photojournal.jpl.nasa.gov/catalog/PIA26495
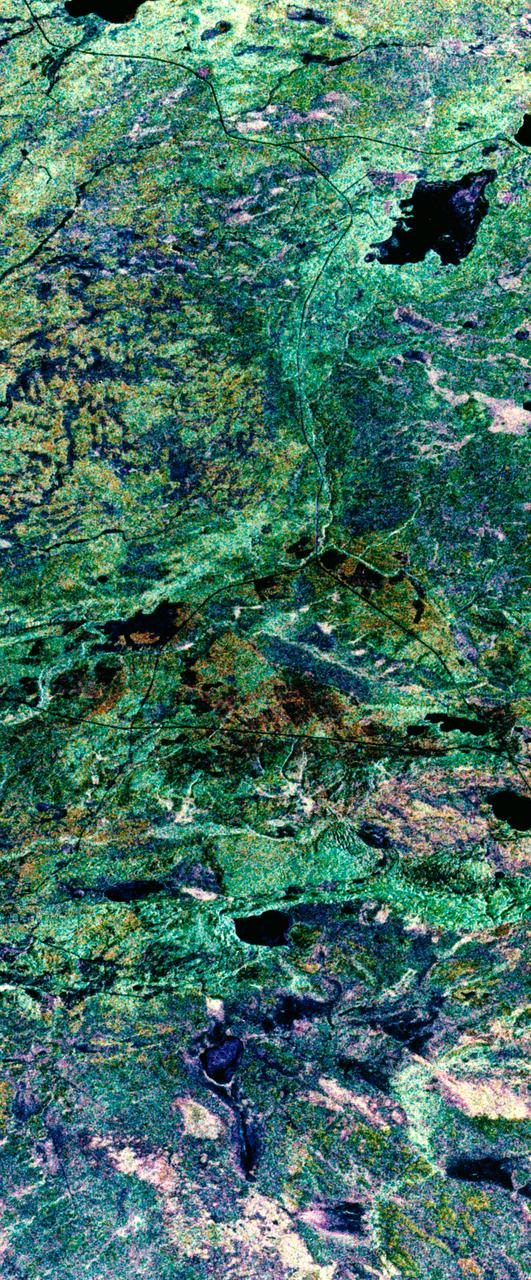
STS059-S-039 (11 April 1994) --- This is a false-color composite of Prince Albert, Canada, centered at 53.91 north latitude and 104.69 west longitude. This image was acquired by the Spaceborne Imaging Radar-C and X-Band Synthetic Aperture Radar (SIR-C/X-SAR) aboard the Space Shuttle Endeavour on its 20th orbit. The area is located 40 kilometers (25 miles) north and 30 kilometers (20 miles) east of the town of Prince Albert in the Saskatchewan province of Canada. The image covers the area east of the Candle Lake, between gravel surface Highways 120 and 106 and west of 106. The area in the middle of the image covers the entire Nipawin (Narrow Hills) provincial park. The look angle of the radar is 30 degrees and the size of the image is approximately 20 kilometers by 50 kilometers (12 by 30 miles). The image was produced by using only the L-Band. The three polarization channels HH, HV and VV are illustrated by red, green and blue respectively. The changes in the intensity of each color are related to various surface conditions such as variations in forest stands, frozen or thawed condition of the surface, disturbances (fire and deforestation), and areas of re-growth. Most of the dark areas in the image are the ice-covered lakes in the region. The dark area on the top right corner of the image is the White Gull Lake north of the intersection of Highway 120 and 913. The right middle part of the image shows Lake Ispuchaw and Lower Fishing Lake. The deforested areas are also shown by dark areas in the image. Since most of the logging practice at the Prince Albert area is around the major highways, the deforested areas can be easily detected as small geometrically shaped dark regions along the roads. At the time of the SIR-C/X-SAR overpass, a major part of the forest is either frozen or undergoing the spring thaw. The L-Band HH shows a high return in the jack pine forest. The reddish areas in the image are old jack pine forest, 12-17 meters (40-55 feet) in height and 60-75 years old. The orange-greenish areas are young jack pine trees, 3-5 meters (10-16 feet) in height and 11-16 years old. The green areas are due to the relative high intensity of the HV channel which is strongly correlated with the amount of biomass. L-Band HV channel shows the biomass variations over the entire region. Most of the green areas, when compared to the forest cover maps are identified as black spruce trees. The dark blue and dark purple colors show recently harvested or re-growth areas respectively. SIR-C/X-SAR is part of NASA's Mission to Planet Earth (MTPE). SIR-C/X-SAR radars illuminate Earth with microwaves allowing detailed observations at any time, regardless of weather or sunlight conditions. SIR-C/X-SAR uses three microwave wavelengths: L-Band (24 cm), C-Band (6 cm), and X-Band (3 cm). The multi-frequency data will be used by the international scientific community to better understand the global environment and how it is changing. The SIR-C/X-SAR data, complemented by aircraft and ground studies, will give scientists clearer insights into those environmental changes which are caused by nature and those changes which are induced by human activity. SIR-C was developed by NASA's Jet Propulsion Laboratory (JPL). X-SAR was developed by the Dornire and Alenia Spazio Companies for the German Space Agency, Deutsche Agentur fuer Raumfahrtangelegenheiten (DARA), and the Italian Space Agency, Agenzia Spaziale Italiana (ASI). JPL Photo ID: P-43886
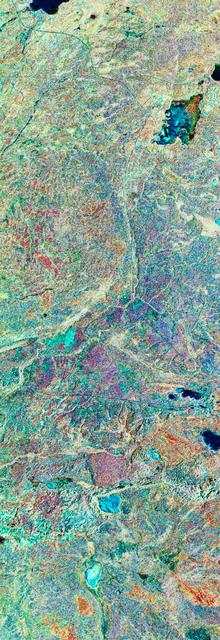
STS059-S-079 (18 April 1994) --- This is a false-color, three frequency image of Prince Albert, Canada, centered at 53.91 north latitude and 104.69 west longitude. It was produced using data from the X-Band, C-Band and L-Band radars that comprise the Spaceborne Imaging Radar-C and X-Band Synthetic Aperture Radar (SIR-C/X-SAR). SIR-C/X-SAR acquired this image on the 20th orbit of the Space Shuttle Endeavour. The area is located 40 kilometers north and 30 kilometers east of the town of Prince Albert in the Saskatchewan province of Canada. The image covers the area east of the Candle Lake, between gravel surface Highways 120 and 106 and west of 106. The area in the middle of the image covers the entire Nipawin (Narrow Hills) provincial park. The look angle of the radar is 30 degrees and the size of the image is approximately 20 by 50 kilometers. The red, green, and blue colors represent L-Band total power, C-Band total power, and XVV respectively. The changes in the intensity of each color are related to various surface conditions such as frozen or thawed forest, fire, deforestation and areas of regrowth. Most of the dark blue areas in the image are the ice covered lakes. The dark area on the top right corner of the image is the White Gull Lake north of the intersection of Highway 120 and 913. The right middle part of the image shows Lake Ispuchaw and Lower Fishing Lake. The deforested areas are shown by light blue in the image. Since most of the logging practice at the Prince Albert area is around the major highways, the deforested areas can be easily detected as small geometrically shaped dark regions along the roads. At the time these data were taken, a major part of the forest was either frozen or undergoing the spring thaw. In such conditions, due to low volume of water in the vegetation, a deeper layer of the canopy is imaged by the radar, revealing valuable information about the type of trees, the amount of vegetation biomass and the condition of the surface. As the frequency increases, the penetration depth in the canopy decreases. Over forest canopies, the X-Band radar contains information about the top of the canopy. Whereas, C-Band and L-Band radar returns show contributions from the crown and trunk areas respectively. The bright areas in the image are dense mixed aspen and old jackpine forests where the return from all three bands is high. The reddish area corresponds to more sparse old jack pine (12 to 17 meters in height and 60 to 75 years old) where the L-Band signal penetrates deeper in the canopy and dominates C-Band and X-Band returns. Comparison of the image with the forest cover map of the area indicates that the three band radar can be used to classify various stands. SIR-C/X-SAR is part of NASA's Mission to Planet Earth (MTPE). SIR-C/X-SAR radars illuminate Earth with microwaves allowing detailed observations at any time, regardless of weather or sunlight conditions. SIR-C/X-SAR uses three microwave wavelengths: L-Band (24 cm), C-Band (6 cm), and X-Band (3 cm). The multi-frequency data will be used by the international scientific community to better understand the global environment and how it is changing. The SIR-C/X-SAR data, complemented by aircraft and ground studies, will give scientists clearer insights into those environmental changes which are caused by nature and those changes which are induced by human activity. SIR-C was developed by NASA's Jet Propulsion Laboratory (JPL). X-SAR was developed by the Dornire and Alenia Spazio Companies for the German Space Agency, Deutsche Agentur fuer Raumfahrtangelegenheiten (DARA), and the Italian Space Agency, Agenzia Spaziale Italiana (ASI). JPL Photo ID: P-43929

NASA image acquired April 18 - October 23, 2012 This image of Asia and Australia at night is a composite assembled from data acquired by the Suomi NPP satellite in April and October 2012. The new data was mapped over existing Blue Marble imagery of Earth to provide a realistic view of the planet. The nighttime view was made possible by the new satellite’s “day-night band” of the Visible Infrared Imaging Radiometer Suite. VIIRS detects light in a range of wavelengths from green to near-infrared and uses filtering techniques to observe dim signals such as city lights, gas flares, auroras, wildfires, and reflected moonlight. In this case, auroras, fires, and other stray light have been removed to emphasize the city lights. “Night time imagery provides an intuitively graspable view of our planet,” says William Stefanov, a scientist in NASA’s International Space Station program office who has worked with similar images from astronauts. “City lights are an excellent means to track urban and suburban growth, which feeds into planning for energy use and urban hazards, for studying urban heat islands, and for initializing climate models.” Named for satellite meteorology pioneer Verner Suomi, NPP flies over any given point on Earth's surface twice each day at roughly 1:30 a.m. and p.m. The polar-orbiting satellite flies 824 kilometers (512 miles) above the surface, sending its data once per orbit to a ground station in Svalbard, Norway, and continuously to local direct broadcast users distributed around the world. The mission is managed by NASA with operational support from NOAA and its Joint Polar Satellite System, which manages the satellite's ground system. NASA Earth Observatory image by Robert Simmon, using Suomi NPP VIIRS data provided courtesy of Chris Elvidge (NOAA National Geophysical Data Center). Suomi NPP is the result of a partnership between NASA, NOAA, and the Department of Defense. Caption by Mike Carlowicz. Instrument: Suomi NPP - VIIRS Credit: <b><a href="http://www.earthobservatory.nasa.gov/" rel="nofollow"> NASA Earth Observatory</a></b> <b>Click here to view all of the <a href="http://earthobservatory.nasa.gov/Features/NightLights/" rel="nofollow"> Earth at Night 2012 images </a></b> <b>Click here to <a href="http://earthobservatory.nasa.gov/NaturalHazards/view.php?id=79790" rel="nofollow"> read more </a> about this image </b> <b><a href="http://www.nasa.gov/audience/formedia/features/MP_Photo_Guidelines.html" rel="nofollow">NASA image use policy.</a></b> <b><a href="http://www.nasa.gov/centers/goddard/home/index.html" rel="nofollow">NASA Goddard Space Flight Center</a></b> enables NASA’s mission through four scientific endeavors: Earth Science, Heliophysics, Solar System Exploration, and Astrophysics. Goddard plays a leading role in NASA’s accomplishments by contributing compelling scientific knowledge to advance the Agency’s mission. <b>Follow us on <a href="http://twitter.com/NASAGoddardPix" rel="nofollow">Twitter</a></b> <b>Like us on <a href="http://www.facebook.com/pages/Greenbelt-MD/NASA-Goddard/395013845897?ref=tsd" rel="nofollow">Facebook</a></b> <b>Find us on <a href="http://instagram.com/nasagoddard?vm=grid" rel="nofollow">Instagram</a></b>