The College Fjord with its glaciers was imaged by ASTER on June 24, 2000. This image covers an area 20 kilometers (13 miles) wide and 24 kilometers (15 miles) long in three bands of the reflected visible and infrared wavelength region. College Fjord is located in Prince Williams Sound, east of Seward, Alaska. Vegetation is in red, and snow and ice are white and blue. Ice bergs calved off of the glaciers can be seen as white dots in the water. At the head of the fjord, Harvard Glacier (left) is one of the few advancing glaciers in the area; dark streaks on the glacier are medial moraines: rock and dirt that indicate the incorporated margins of merging glaciers. Yale Glacier to the right is retreating, exposing (now vegetated) bedrock where once there was ice. On the west edge of the fjord, several small glaciers enter the water. This fjord is a favorite stop for cruise ships plying Alaska's inland passage. This image is located at 61.2 degrees north latitude and 147.7 degrees west longitude. http://photojournal.jpl.nasa.gov/catalog/PIA02664
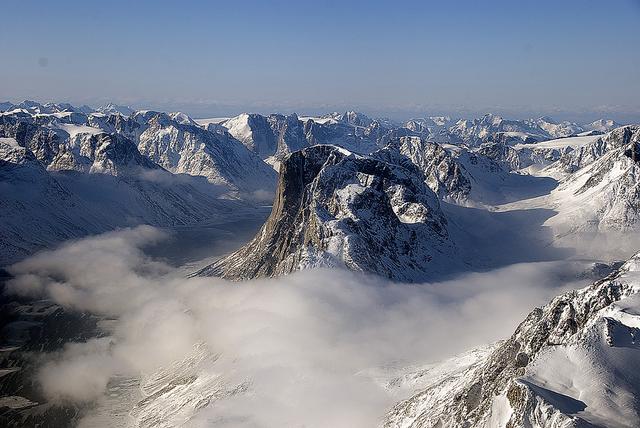
On April 8, 2011, IceBridge flew a mission to coastal areas in southwest Greenland. Mountains and an open-water fjord surround one of the mission's targets, a small ice cap called Sukkertoppen Isflade. Operation IceBridge, now in its third year, makes annual campaigns in the Arctic and Antarctic where science flights monitor glaciers, ice sheets and sea ice. Credit: NASA/GSFC/Michael Studinger To learn more about Ice Bridge go to: <a href="http://www.nasa.gov/mission_pages/icebridge/news/spr11/index.html" rel="nofollow">www.nasa.gov/mission_pages/icebridge/news/spr11/index.html</a> <b><a href="http://www.nasa.gov/centers/goddard/home/index.html" rel="nofollow">NASA Goddard Space Flight Center</a></b> enables NASA’s mission through four scientific endeavors: Earth Science, Heliophysics, Solar System Exploration, and Astrophysics. Goddard plays a leading role in NASA’s accomplishments by contributing compelling scientific knowledge to advance the Agency’s mission. <b>Follow us on <a href="http://twitter.com/NASA_GoddardPix" rel="nofollow">Twitter</a></b> <b>Join us on <a href="http://www.facebook.com/pages/Greenbelt-MD/NASA-Goddard/395013845897?ref=tsd" rel="nofollow">Facebook</a></b>
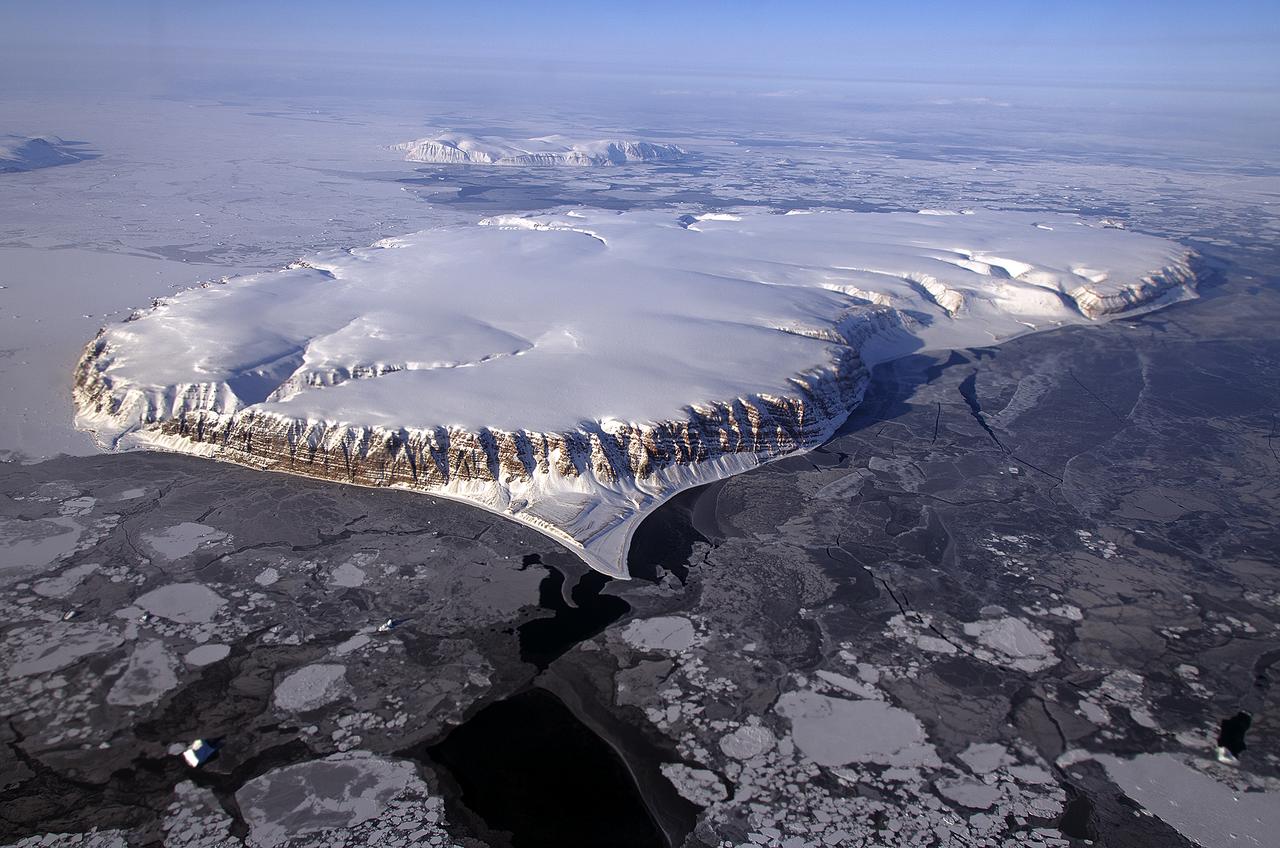
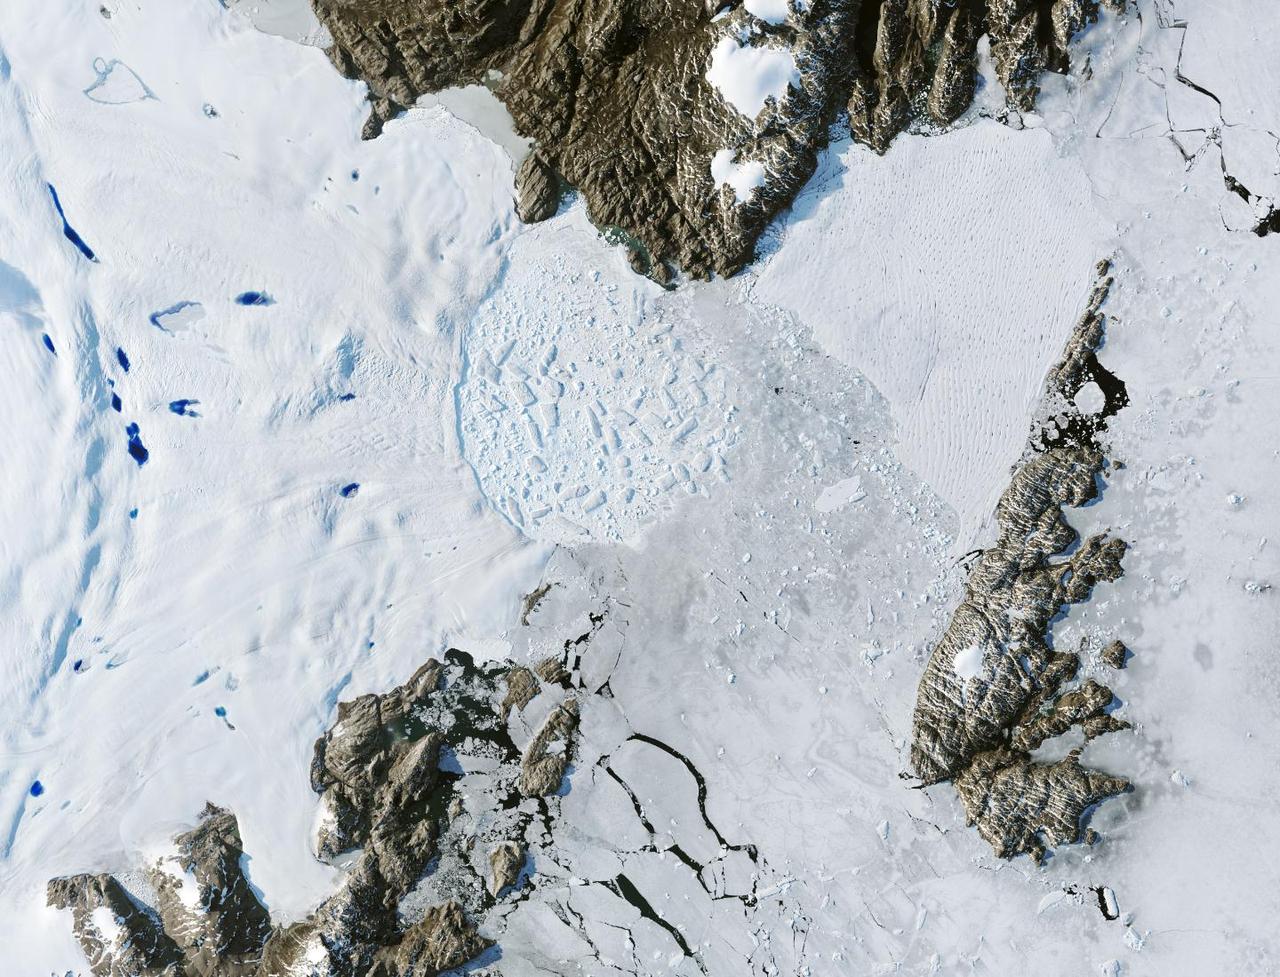
This image of Saunders Island and Wolstenholme Fjord with Kap Atholl in the background was taken during an Operation IceBridge survey flight in April, 2013. Sea ice coverage in the fjord ranges from thicker, white ice seen in the background, to thinner grease ice and leads showing open ocean water in the foreground. In March 2013, NASA's Operation IceBridge scientists began another season of research activity over Arctic ice sheets and sea ice. IceBridge, a six-year NASA mission, is the largest airborne survey of Earth's polar ice ever flown. It will yield an unprecedented three-dimensional view of Arctic and Antarctic ice sheets, ice shelves and sea ice. These flights will provide a yearly, multi-instrument look at the behavior of the rapidly changing features of the Greenland and Antarctic ice. Image Credit: NASA / Michael Studinger Read more about the mission here: <a href="http://www.nasa.gov/mission_pages/icebridge/index.html" rel="nofollow">www.nasa.gov/mission_pages/icebridge/index.html</a> <b><a href="http://www.nasa.gov/audience/formedia/features/MP_Photo_Guidelines.html" rel="nofollow">NASA image use policy.</a></b> <b><a href="http://www.nasa.gov/centers/goddard/home/index.html" rel="nofollow">NASA Goddard Space Flight Center</a></b> enables NASA’s mission through four scientific endeavors: Earth Science, Heliophysics, Solar System Exploration, and Astrophysics. Goddard plays a leading role in NASA’s accomplishments by contributing compelling scientific knowledge to advance the Agency’s mission. <b>Follow us on <a href="http://twitter.com/NASA_GoddardPix" rel="nofollow">Twitter</a></b> <b>Like us on <a href="http://www.facebook.com/pages/Greenbelt-MD/NASA-Goddard/395013845897?ref=tsd" rel="nofollow">Facebook</a></b> <b>Find us on <a href="http://instagram.com/nasagoddard?vm=grid" rel="nofollow">Instagram</a></b>
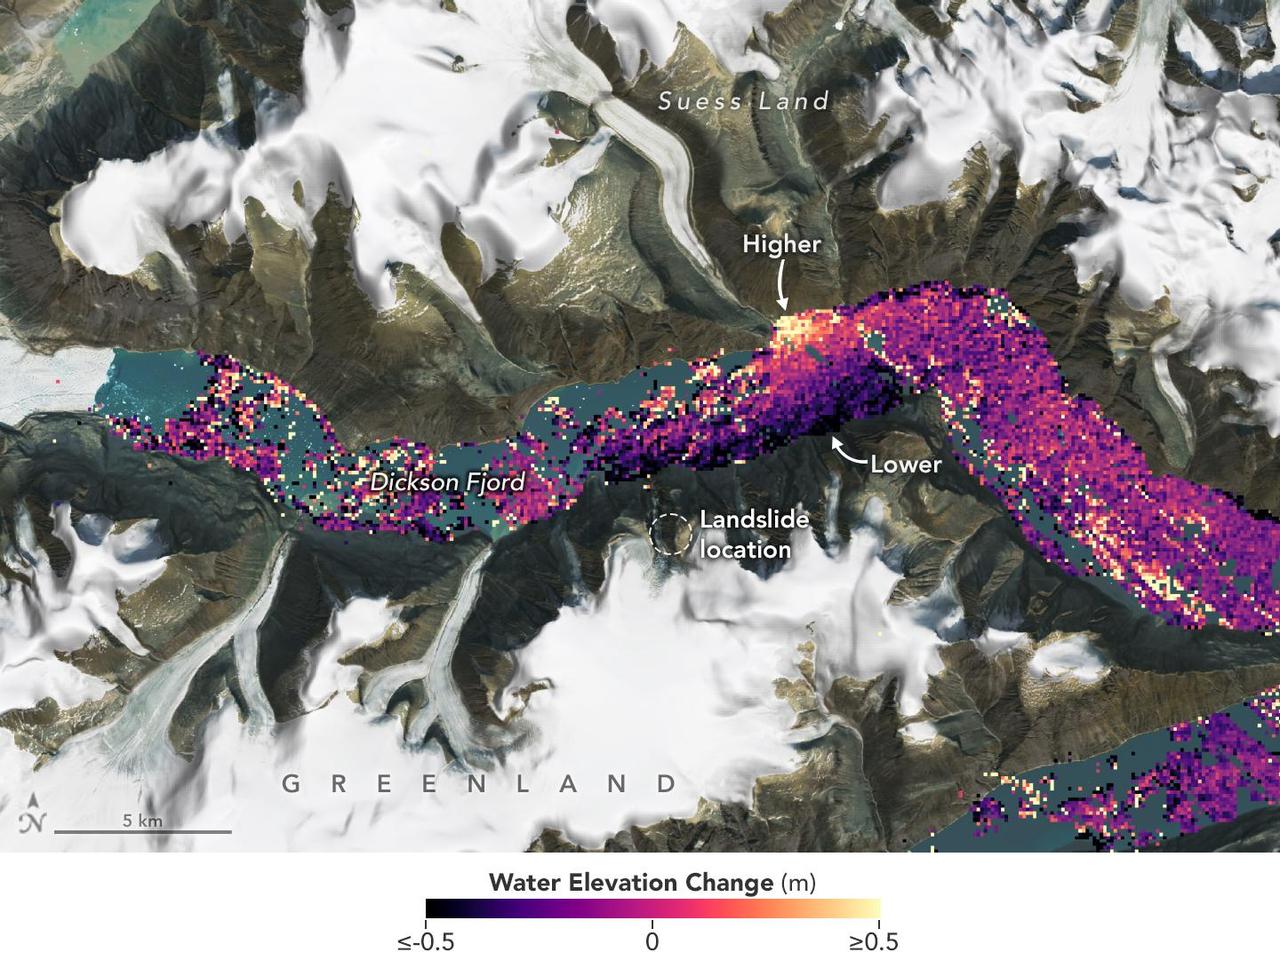
A visualization based on data from the international SWOT satellite mission shows the unique contours of a tsunami that sloshed within the steep walls of a fjord in Greenland in September 2023. Triggered by a massive landslide, the tsunami generated a seismic rumble that reverberated around the world for nine days. Short for Surface Water and Ocean Topography, SWOT collected water elevation measurements in the Dickson Fjord on Sept. 17, 2023, the day after the initial landslide and tsunami. The data was compared with measurements made under normal conditions a few weeks prior, on Aug. 6, 2023. Colors toward the lighter end of the scale indicate higher water levels, and darker colors indicate lower-than-normal levels. The data suggest that water levels at some points along the north side of the fjord were as much as 4 feet (1.2 meters) higher than on the south. In a September 2024 paper in Science, researchers traced a seismic signal back to the tsunami, which began when more than 880 million cubic feet of rock and ice (25 million cubic meters) fell into the Dickson Fjord. Part of a network of channels on Greenland's eastern coast, the fjord is about 1,772 feet (540 meters) deep and 1.7 miles (2.7 kilometers) wide, with walls taller than 6,000 feet (1,830 meters). Far from the open ocean, in a confined space, the energy of the tsunami's motion had limited opportunity to dissipate, so the wave moved back and forth about every 90 seconds for nine days. It caused tremors recorded on seismic instruments thousands of miles away. Launched in December 2022 from Vandenberg Space Force Base in central California, SWOT is now in its operations phase, collecting data that will be used for research and other purposes. https://photojournal.jpl.nasa.gov/catalog/PIA26420
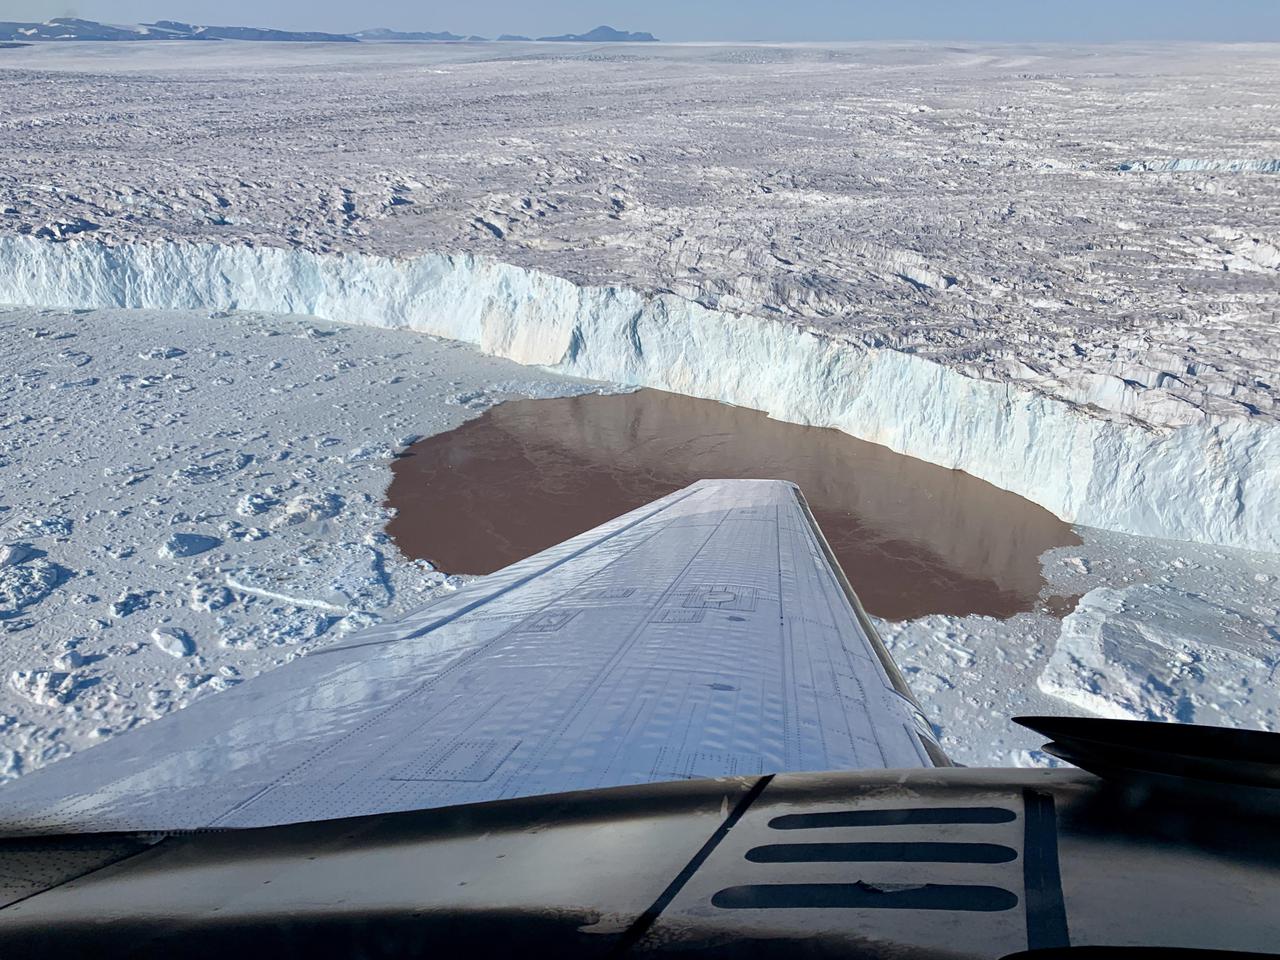
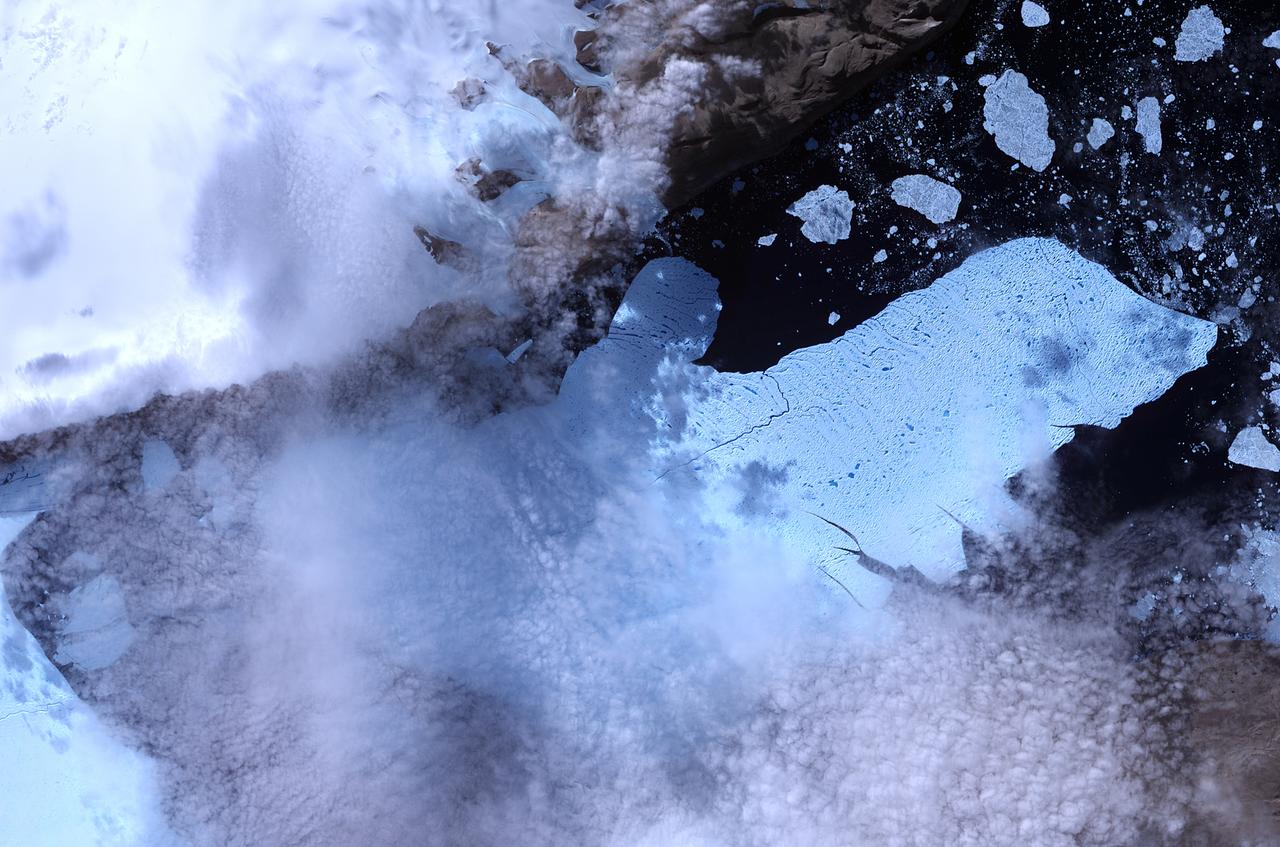
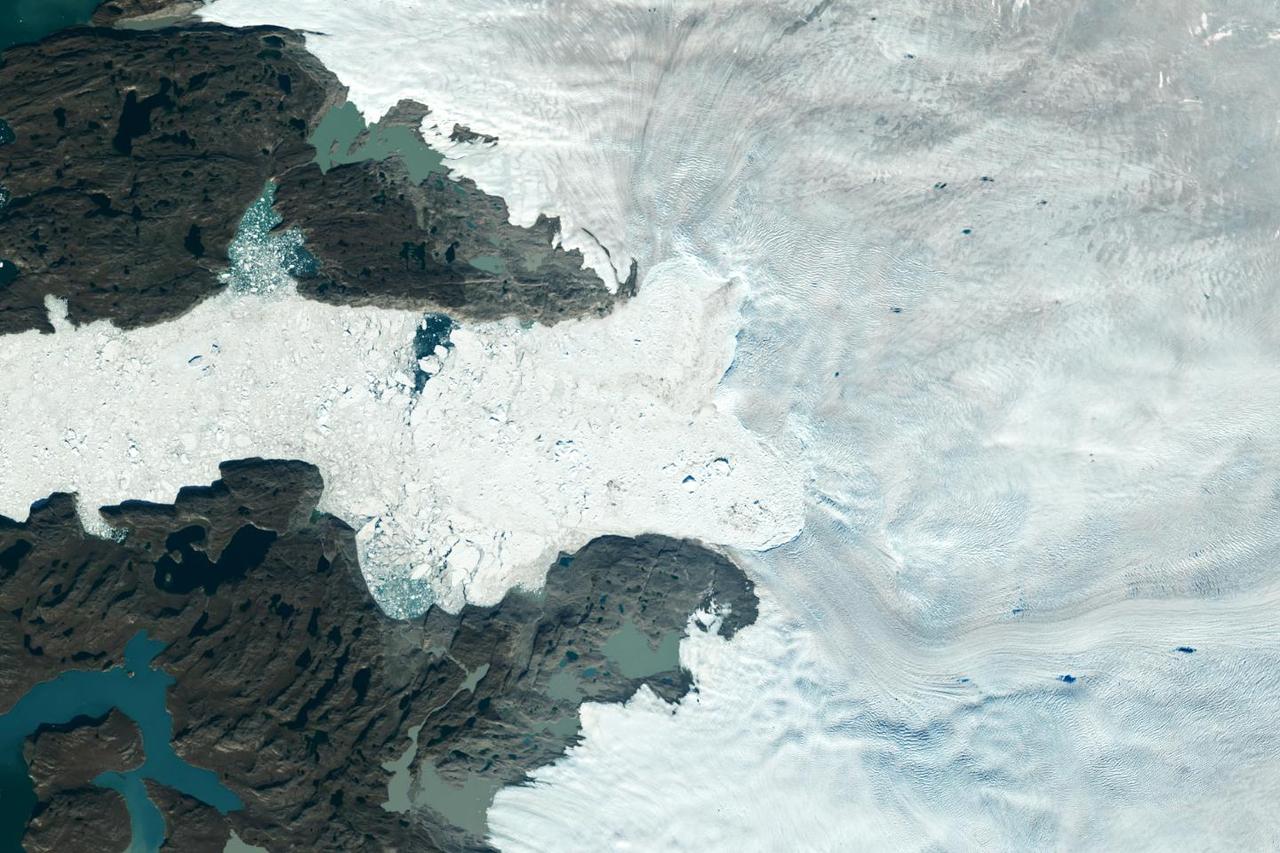
In this aerial view, a glacier along Greenland's craggy coastline is actively undergoing undercutting, a process in which meltwater flowing out from the bottom of the glacier enters the fjord. The brown water in front of the glacier is caused by sediment being dredged up from the base of the glacier by meltwater plumes reaching the surface of the fjord. Because the meltwater contains no salt, it is lighter and rises through the saltier ocean water, dragging the warm ocean water into contact with the ice at the glacier's base. The result is increased melting at the bottom of the glacier, which creates and overhanging layer of ice that breaks off (or calves) as icebergs. As the climate warms, the ocean water temperature and the amount of meltwater both increase, combining to hasten this undercutting process and speed up the ice loss from Greenland's Ice Sheet. The image was taken on Aug. 25, 2019 by a probe-dropping airplane as part of the Oceans Melting Greenland (OMG) mission. OMG has been studying glaciers that plunge into Greenland's steep-sided inlets, or fjords, for the past five years, gathering precise measurements of fjord depth and water salinity from probes dropped by plane, supplemented by measurements made by boat. The aim is to better understand how the warming ocean water around Greenland is hastening ice melt and calving of these marine-terminating glaciers. https://photojournal.jpl.nasa.gov/catalog/PIA24162
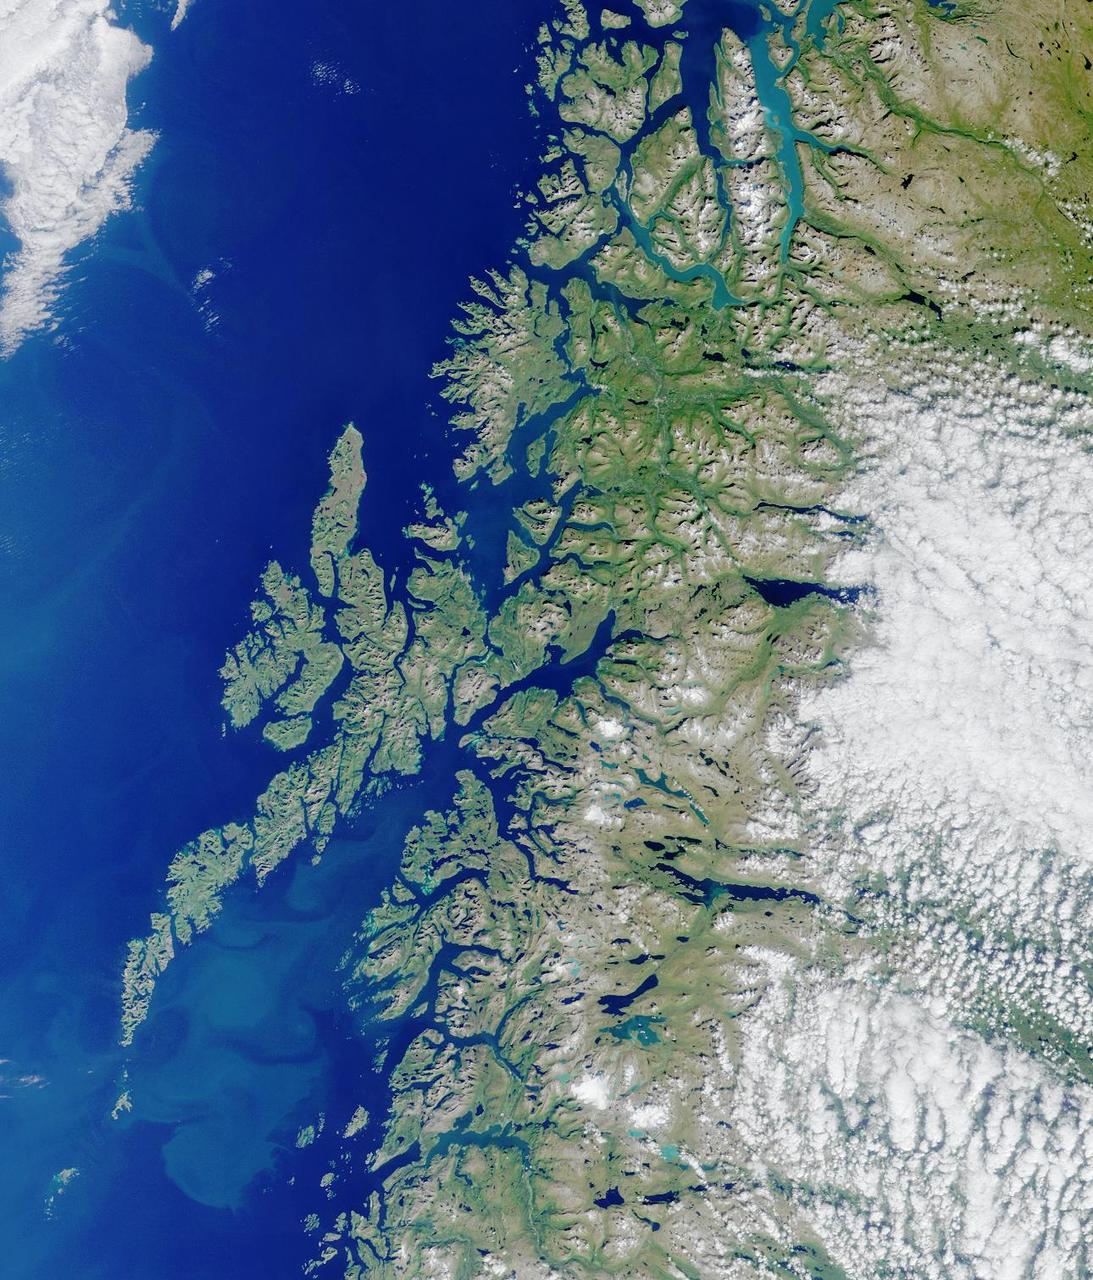
Lofoten Islands, Norway. Norway is deeply indented by fjords, rises precipitously to high plateaus, and is united with the ocean by numerous islands. This image from NASA Terra satellite is MISR Mystery Image Quiz #2.
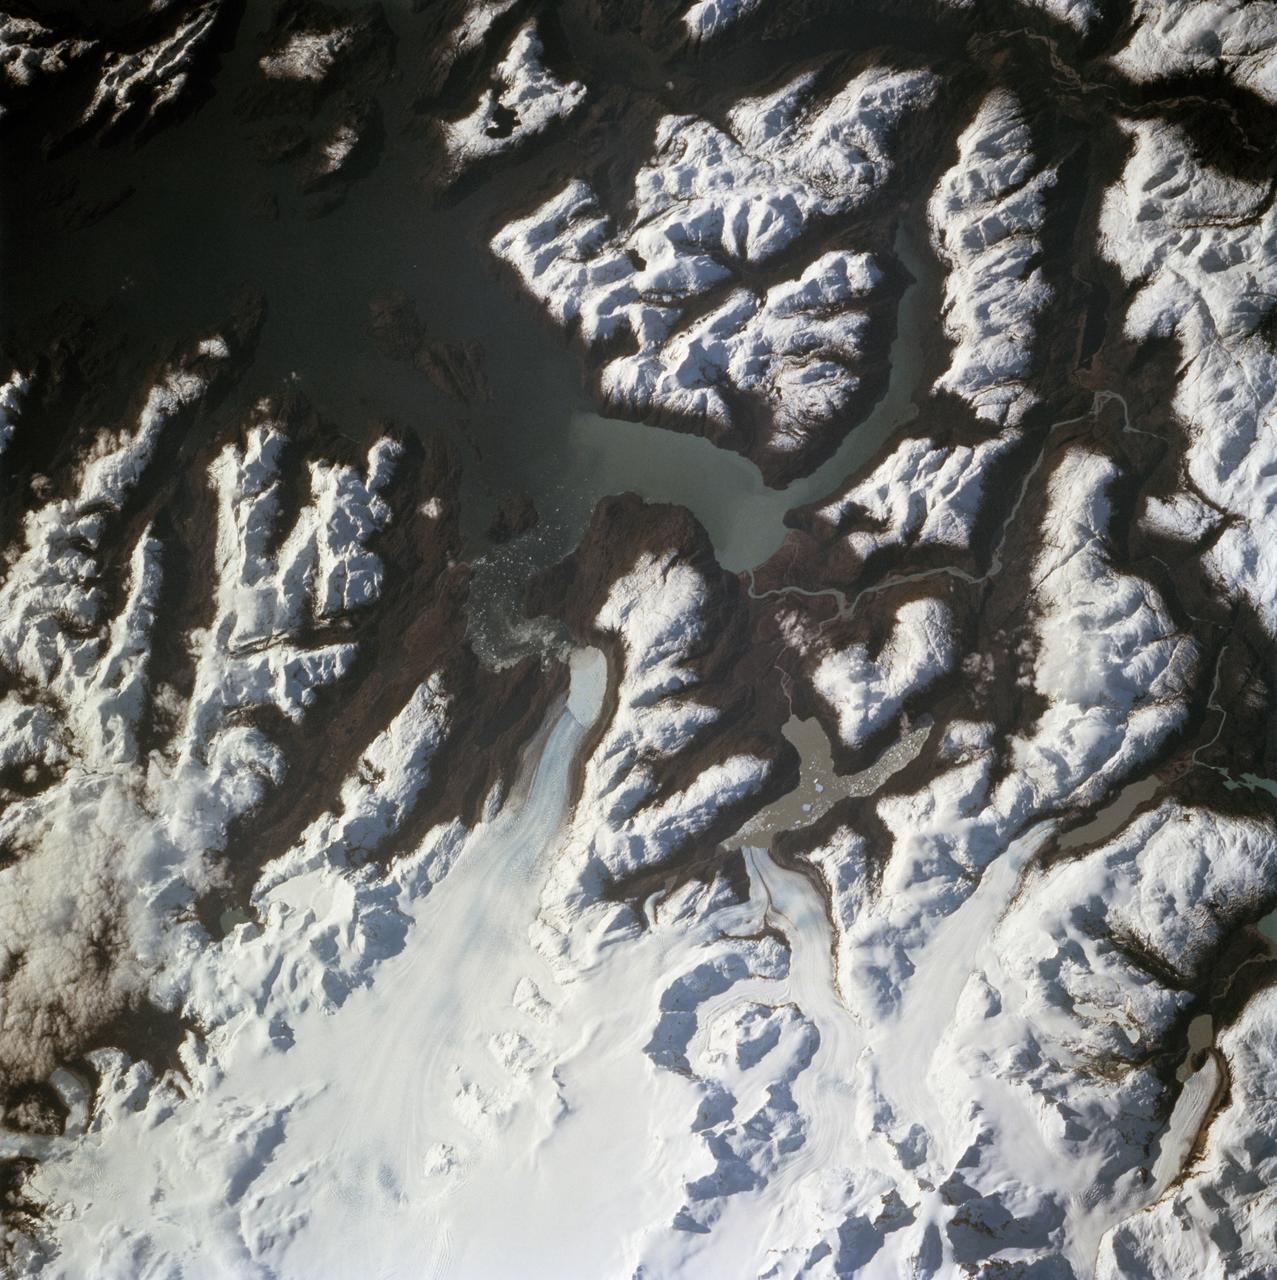
STS068-260-078 (30 September-11 October 1994) --- The ice visible along the bottom of this view is the north end of the larger (southern) of two great remaining ice field of the Andes Mountains in Chile. The longest glacier visible here flows down into the Calen Fjord (an arm of the Pacific Ocean known as Canal Baker) where numerous calved icebergs can be seen floating. The other three glaciers end in glacier-cut valleys with small lakes - the bigger lake has numerous icebergs as well. the river snaking through the mountains to the fjord drains water from the great Lake O'Higgins, which lies out of the picture to the right. Glacial mud can be seen emptying into the fjord and discoloring the water with its milky color.
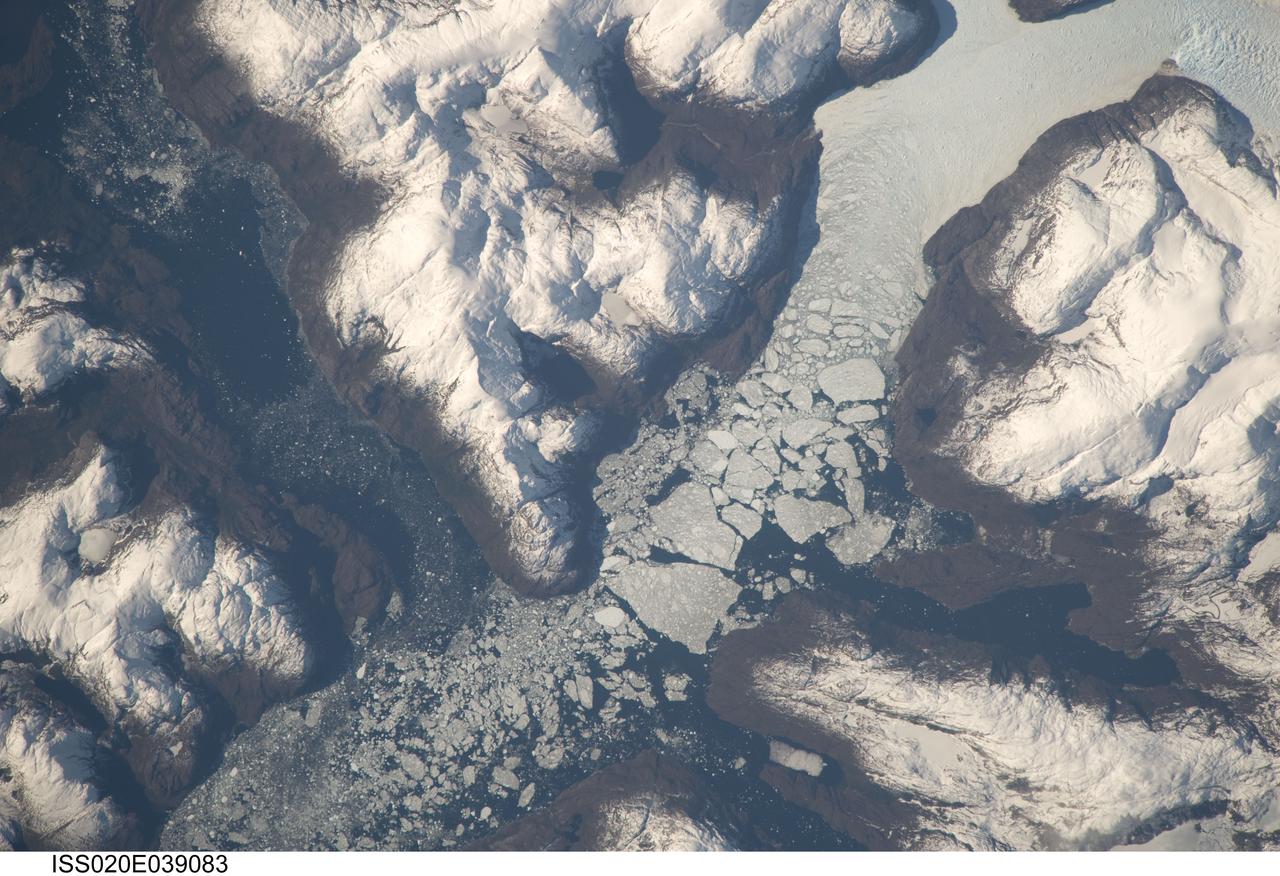
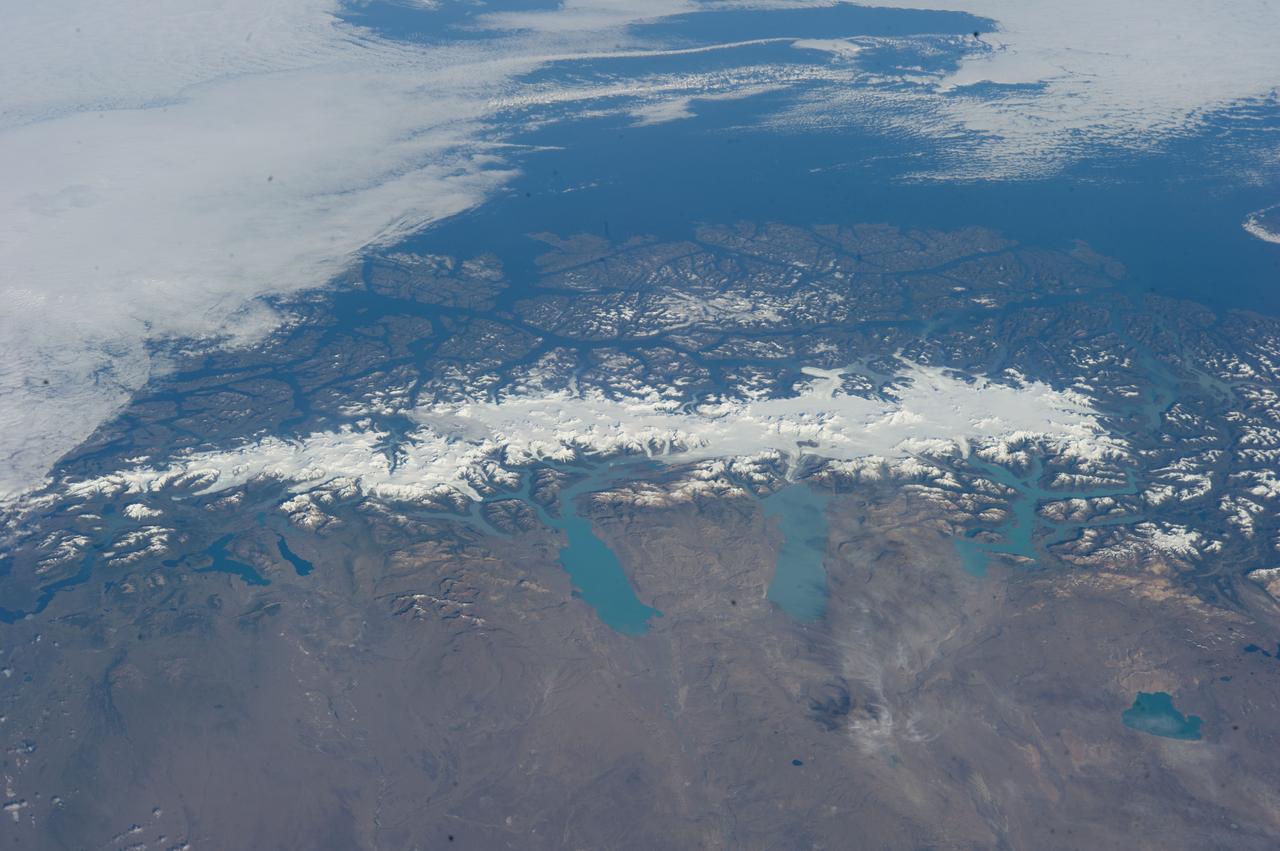
ISS020-E-039083 (6 Sept. 2009) --- Glacier outlet in the Southern Patagonian Ice Field of Chile is featured in this image photographed by an Expedition 20 crew member on the International Space Station. The Southern Patagonian Ice Field of Chile and Argentina hosts a spectacular array of glaciers and associated glacial features within the southern Andes Mountains. Glaciers flowing downhill on the eastern side of the mountains have outlets into several large freshwater lakes. On the western side of the mountains, glaciers release ice into the Pacific Ocean via an intricate network of fjords. Fjords are steep valleys originally cut by glaciers during periods of lower sea level that are now inundated. As glaciers flow into the fjord, ice at the front of the glacier begins to break off and form icebergs that can float out to sea ? a process known as calving. This detailed photograph shows the merged outlet of Penguin Glacier and HPS 19 into a fjord carved into the snow-covered mountains of the southern Andes. The designation HPS stands for Hielo Patagonico Sur (e.g. Southern Patagonian Ice field) and is used to identify glaciers that have no other geographic name. Ice flowing into the fjord begins to break up at center, forming numerous icebergs ? the largest visible in this image is approximately 2 kilometers in width. The large ice masses visible at center have a coarse granular appearance due to variable snow cover, and mixing and refreezing of ice fragments prior to floating free.
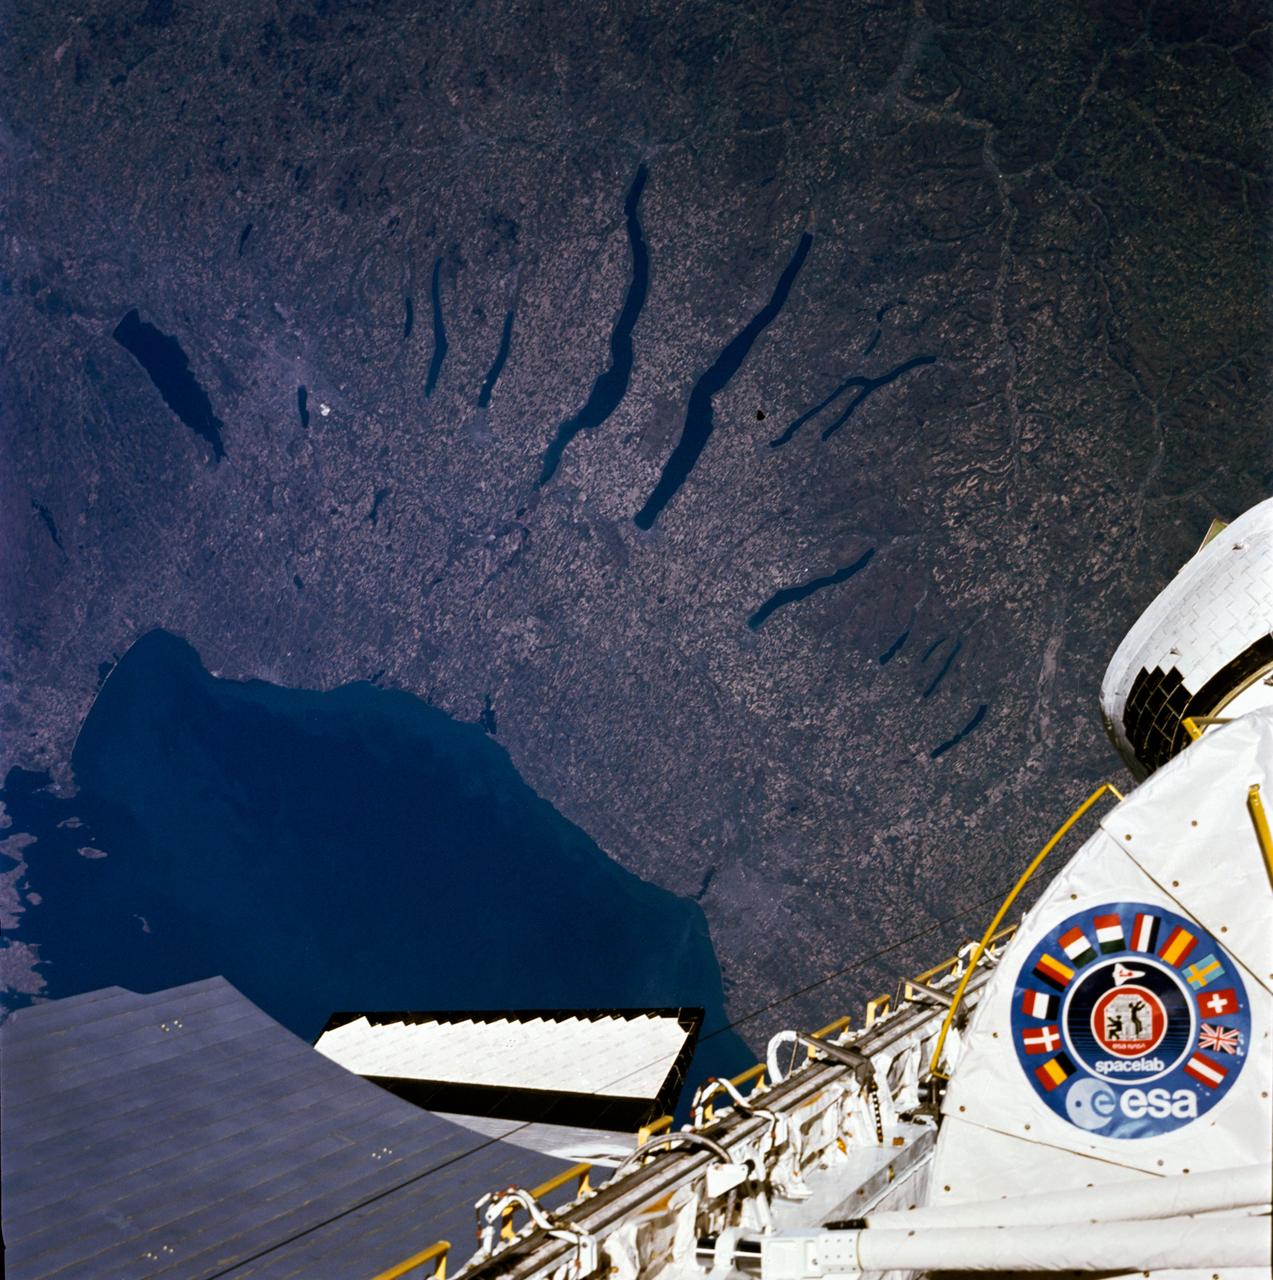
51B-33-028 (29 April-6 May 1985) --- An excellent view of the Finger Lakes area of New York, and including Lake Ontario and a small part of Ontario. The lakes are fjord-like remnants of the glacial era. The cities of Rochester, Syracuse, and Utica can be seen.
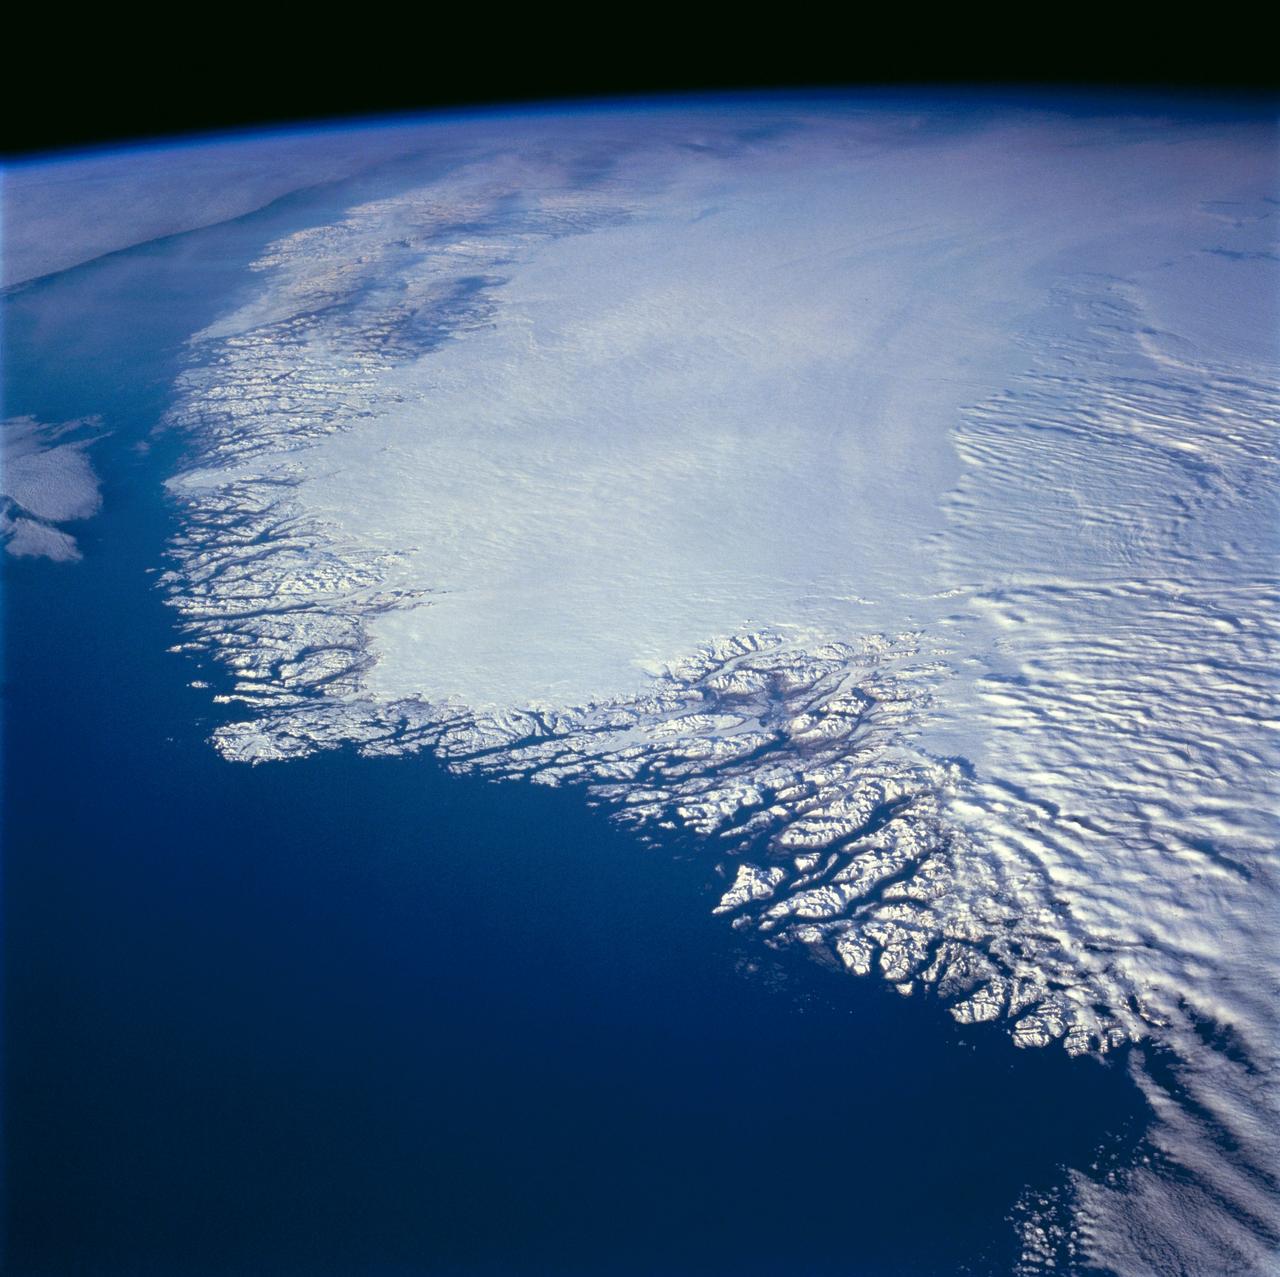
This north-looking view of southwestern Greenland was taken in November, 1994, and shows numerous indentations, many of which contain small settlements. These fjords were carved by the glaciers of the last ice age 10,000 years ago. Even today, the ice in the center of Greenland is nearly 3,500 meters (11,000 feet) thick and great rivers of ice continuously flow down toward the sea, where they melt or break off as icebergs. Some Icebergs exceed the size of small islands, weigh several million tons, and rise several hundred feet above the sea surface. Cape Farewell is visible toward the bottom right of the view. Julianehab Bay and the Bredev fjord can be seen toward the center of the photograph. Godthab, the main settlement on Greenland, is barely visible to the north of the Frederikeshabs Icefield near the left center of the view.
STS060-85-000AH (3-11 Feb 1994) --- This view is centered at about 44 degrees south along the Chilean continental margin of South America. The dark-colored coastal region is heavily forested by dense old-growth forests that are now being cut, but east of the mountains in Argentina the dry climate supports very little vegetation. This desert region known as Patagonia appears as light brown colors. The coastline is especially dramatic because it is shaped by the tortuous channels carved by glaciers which have left fjords. These fjords have effectively cut across the continental divide, and are bordered by active volcanoes which reach elevations between 2, 000 - 3,000 meters. The prominent volcanic peak in the center of the frame is Mt. Melimoya. To the north is a long, snow-covered volcanic ridge called Cerro Yantales. Cerro Yantales recently reported greatly increased fumarolic activity, including the emission of yellow gases near the summit. Russian and American scientists will use this photography to look for further evidence of increased activity like snow melt around the peak. Other Russian and American scientists are particularly interested in mapping the summertime snowline and firm (permanent snow field) elevations as early indications of any potential climatic variation in the making.
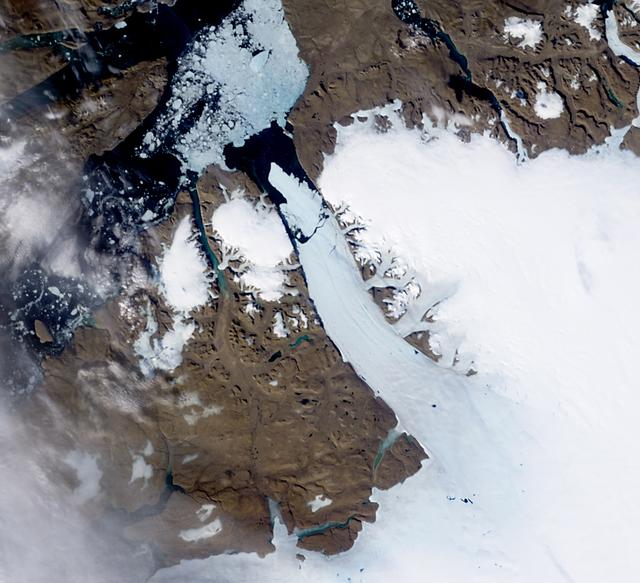
NASA image acquired August 11, 2010. After breaking off the Petermann Glacier on August 5, 2010, a massive ice island floated slowly down the fjord toward the Nares Strait. The Advanced Spaceborne Thermal Emission and Reflection Radiometer (ASTER) on NASA’s Terra satellite captured this false-color image of the ice island on August 11, 2010. In this image, ice is light blue, water is nearly black, and clouds are nearly white. Although a bank of thin clouds hovers over the fjord, the southernmost margin of the ice island is still visible. Toward the north, the leading edge of the ice island retains the same shape it had days earlier, at the time of the initial calving. NASA Earth Observatory image created by Jesse Allen, using data provided courtesy of NASA/GSFC/METI/ERSDAC/JAROS, and U.S./Japan ASTER Science Team. Caption by Michon Scott. Instrument: Terra - ASTER To see more images from of the glacier go to: <a href="http://earthobservatory.nasa.gov/NaturalHazards/event.php?id=45116" rel="nofollow">earthobservatory.nasa.gov/NaturalHazards/event.php?id=45116</a> <b><a href="http://www.nasa.gov/centers/goddard/home/index.html" rel="nofollow">NASA Goddard Space Flight Center</a></b> is home to the nation's largest organization of combined scientists, engineers and technologists that build spacecraft, instruments and new technology to study the Earth, the sun, our solar system, and the universe. <b>Follow us on <a href="http://twitter.com/NASA_GoddardPix" rel="nofollow">Twitter</a></b> <b>Join us on <a href="http://www.facebook.com/pages/Greenbelt-MD/NASA-Goddard/395013845897?ref=tsd" rel="nofollow">Facebook</a><b></b></b>

ISS017-E-012583 (4 Aug. 2008) --- Cape Farewell, Greenland is featured in this image photographed by an Expedition 17 crewmember on the International Space Station (ISS). This view illustrates the southernmost tip of Greenland, known as Kap Farvel in Danish and Nunap Isua in Inuit. The viewing direction is towards the northeast; the image was taken when the space station was located near its most northerly orbital latitude of 52 degrees, off the northern coast of the Island of Newfoundland approximately 1160 kilometers to the southwest. Greenland is the world's largest island with an area of over 2 million square kilometers; however much of the island is covered by an ice cap that can reach thicknesses of 3 kilometers. The image is highly oblique -- taken from an angle looking outwards from the ISS, rather than straight down towards the Earth -- and this provides a sense of topography along the southern edge of Greenland. The exposed dark grey bedrock along the southwestern coastline has been carved by glaciers into numerous fjords -- steep-sided valleys that drain directly into the ocean; the white cloud cover surrounding the island doubtless contains some sea ice and icebergs calved from glaciers. A band of high-altitude cirrus clouds (light grey) cast shadows on the lower stratus cloud deck in the lower third of the image. The thin blue layer of Earth's atmosphere is visible.
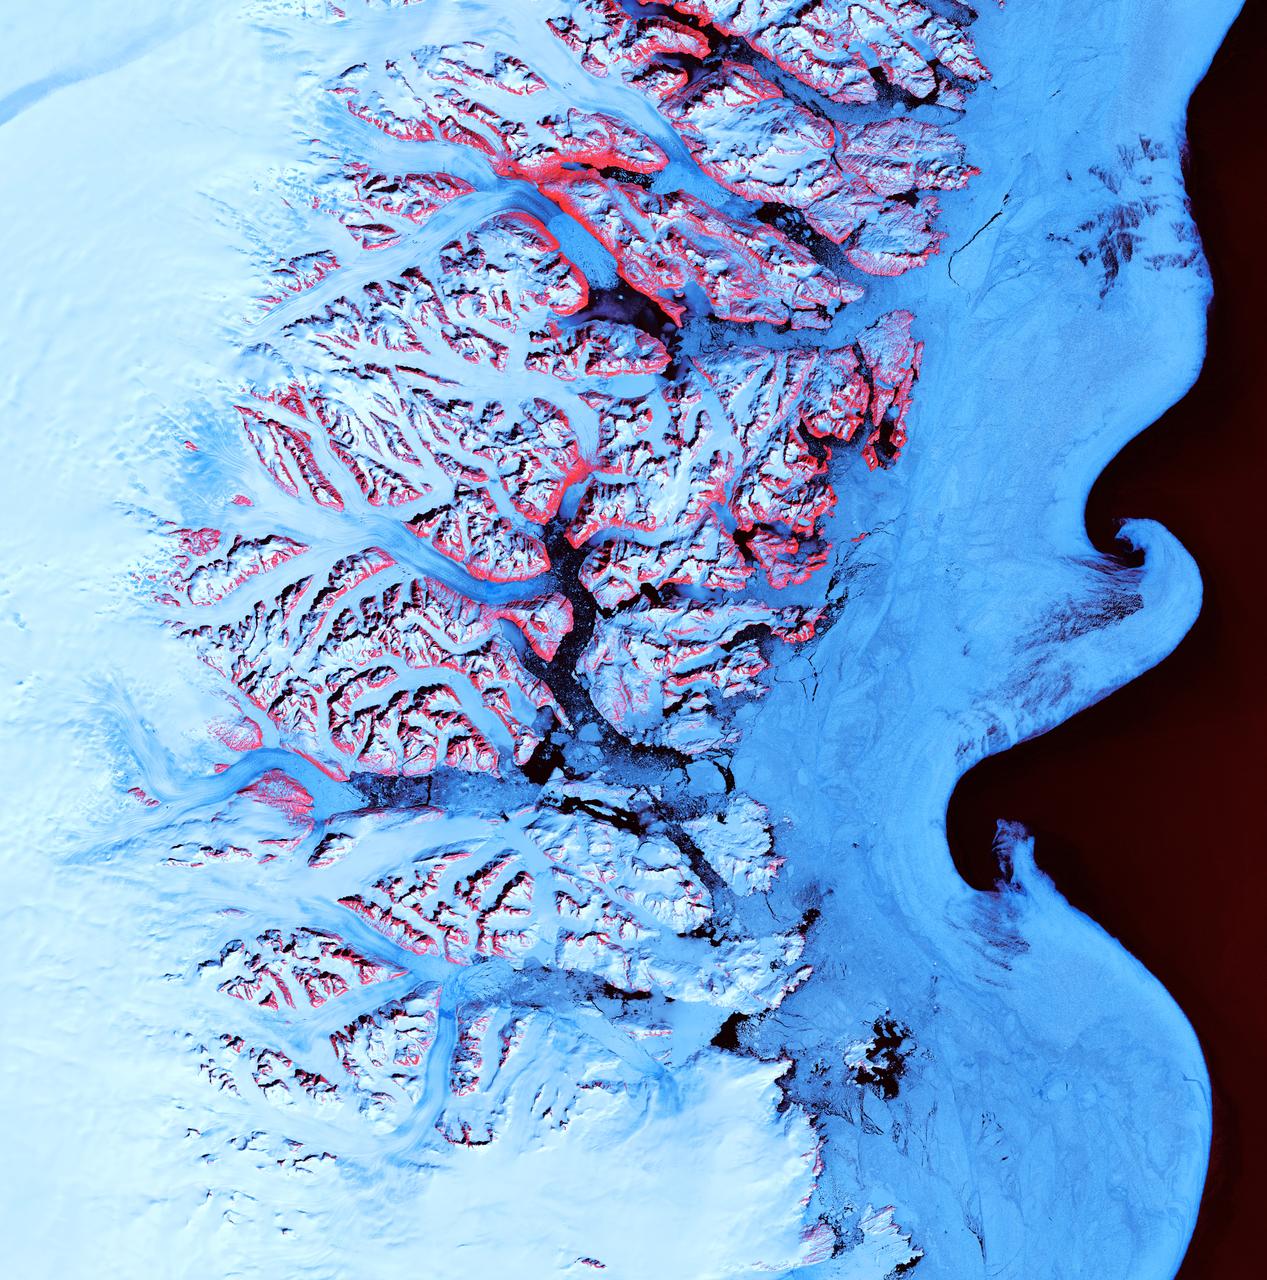
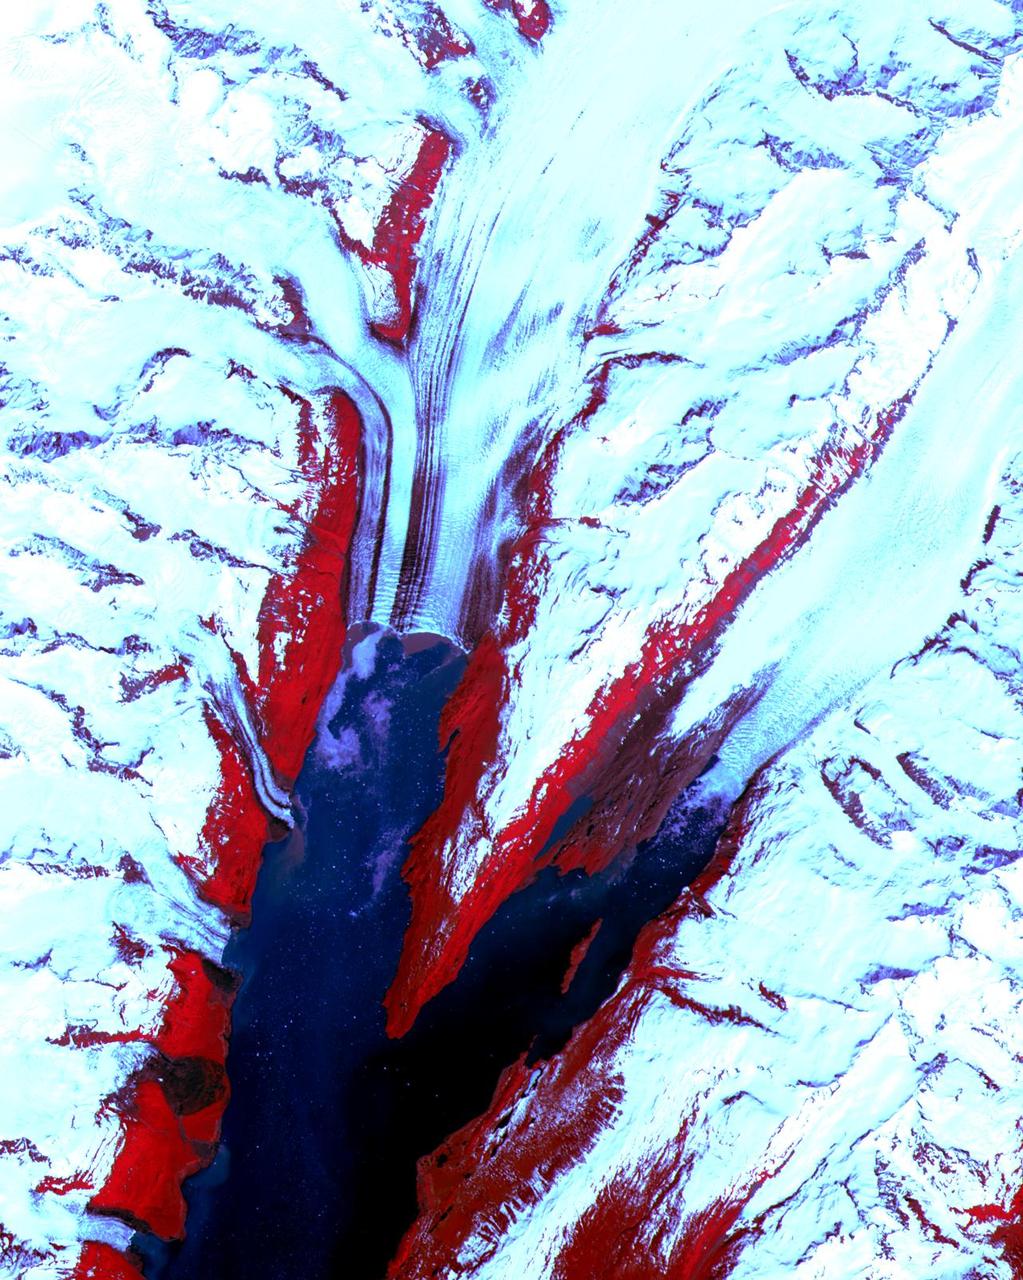
Ice Waves - May 21st, 2001 Description: Along the southeastern coast of Greenland, an intricate network of fjords funnels glacial ice to the Atlantic Ocean. During the summer melting season, newly calved icebergs join slabs of sea ice and older, weathered bergs in an offshore slurry that the southward-flowing East Greenland Current sometimes swirls into stunning shapes. Exposed rock of mountain peaks, tinted red in this image, hints at a hidden landscape. Credit: USGS/NASA/Landsat 7 To learn more about the Landsat satellite go to: <a href="http://landsat.gsfc.nasa.gov/" rel="nofollow">landsat.gsfc.nasa.gov/</a> <b><a href="http://www.nasa.gov/centers/goddard/home/index.html" rel="nofollow">NASA Goddard Space Flight Center</a></b> enables NASA’s mission through four scientific endeavors: Earth Science, Heliophysics, Solar System Exploration, and Astrophysics. Goddard plays a leading role in NASA’s accomplishments by contributing compelling scientific knowledge to advance the Agency’s mission. <b>Follow us on <a href="http://twitter.com/NASA_GoddardPix" rel="nofollow">Twitter</a></b> <b>Join us on <a href="http://www.facebook.com/pages/Greenbelt-MD/NASA-Goddard/395013845897?ref=tsd" rel="nofollow">Facebook</a></b>
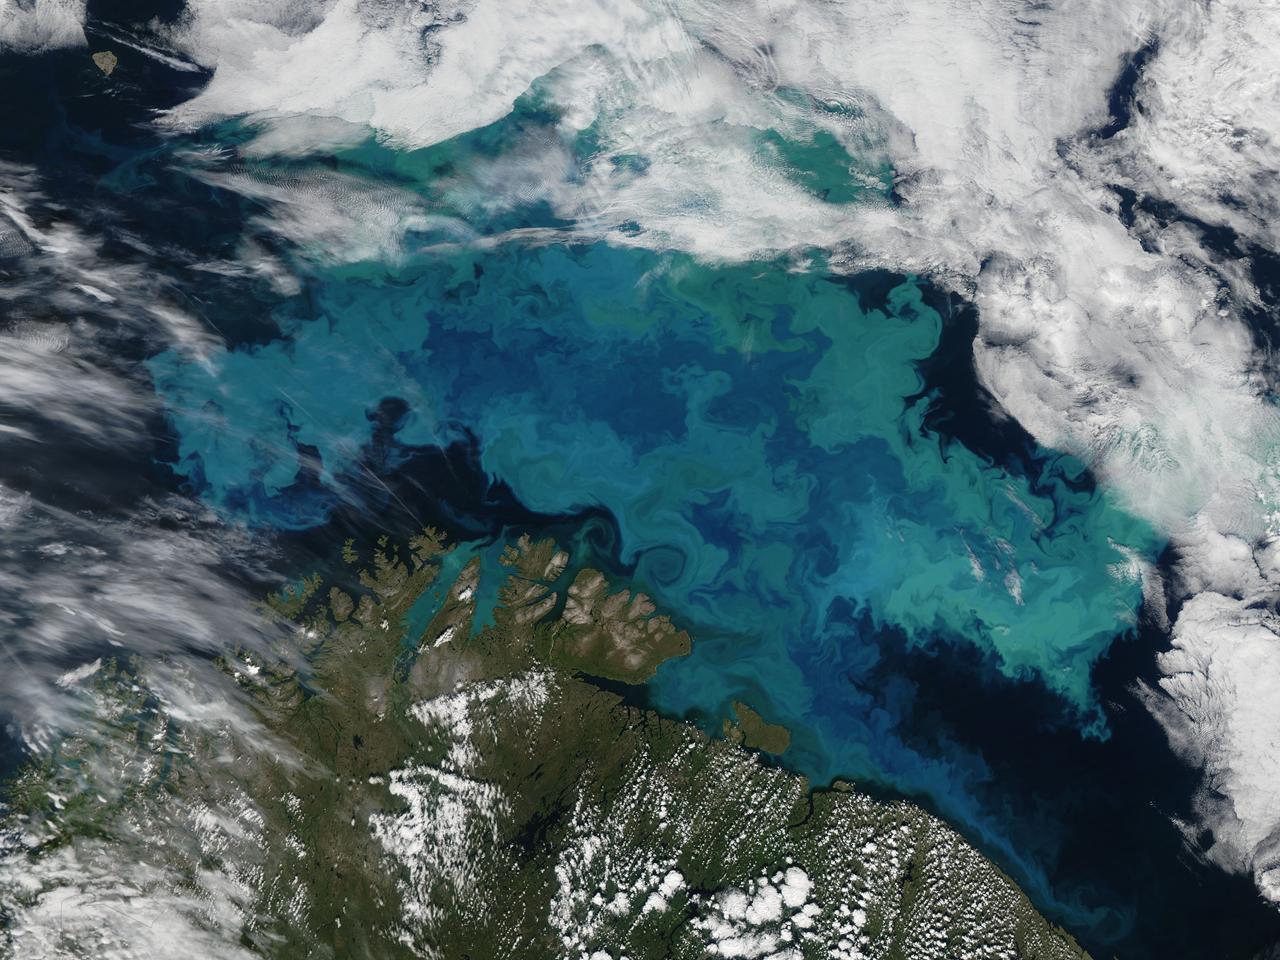
Phytoplankton bloom in the Barents Sea captured August 14, 2011. At times nature exceeds the ability of the artist’s brush to blend brilliant colors, interweave textures and combine patterns to create stunning panoramas, while using only the palette of land, water, cloud and vegetation. This stunning and artistic image of a phytoplankton bloom in the Barents Sea was by the Moderate Resolution Imaging Spectroradiometer (MODIS) aboard the Aqua satellite was captured on August 14, 2011. The peacock-hued swirls of blues and green that paint the navy-blue sea water are created by light reflecting off of millions of phytoplankton, microscopic plants that grow in the sunlit surface water of the world’s oceans. Different types of phytoplankton reflect different colored light, so a multi-color bloom such as this typically contains multiple species. The depth of the bloom also affects coloration – the deeper the organism, the less light is reflected and the duller the color. Coccolithophores, a type of phytoplankton which flourish in nutrient-poor, sub-polar waters, have unique limestone (calcite) scales. This white coating makes the plant highly reflective, and thus a bloom can appear to be a bright, almost iridescent blue. The chalky coating can also cause whitish swirls in the water, making the blues washed out with a milky hue. August is a highly active month for phytoplankton blooms in the Barents Sea, but the timing, development, abundance and species composition is variable in this area. The distribution of phytoplankton is largely controlled by the polar front, ice cover, freshwater runoff and ice melting. Each water source – the Artic, the Atlantic and the coastal water – all bring their own characteristic species into the Barents Sea, creating a multi-specie and multi-color spectacle. Because phytoplankton are the base of the marine food chain, places were blooms are large and frequent often support a thriving marine population. This is certainly the case in the Barents Sea where the fisheries, particularly the cod fisheries, are of great importance for both Norway and Russia. The coastlines of both of these countries can be seen in the bottom of the image. Russia forms the south-eastern most coast, while the remaining three-quarters of the coastline belongs to Norway. Two fjords in the west, Porsangerfjorden and Laksefjord are tinted bright blue with phytoplankton. Just to the east of these fjords, freshwater from the Tana River flows through Tanafjord, turning the waters here are a duller blue. As fresh water flows into the Barents Sea, phytoplankton bloom is affected by the flowing water, creating paisley-like patterns in the coastal eddies. Credit: NASA/GSFC/Jeff Schmaltz/MODIS Land Rapid Response Team <b><a href="http://www.nasa.gov/centers/goddard/home/index.html" rel="nofollow">NASA Goddard Space Flight Center</a></b> enables NASA’s mission through four scientific endeavors: Earth Science, Heliophysics, Solar System Exploration, and Astrophysics. Goddard plays a leading role in NASA’s accomplishments by contributing compelling scientific knowledge to advance the Agency’s mission. <b>Follow us on <a href="http://twitter.com/NASA_GoddardPix" rel="nofollow">Twitter</a></b> <b>Like us on <a href="http://www.facebook.com/pages/Greenbelt-MD/NASA-Goddard/395013845897?ref=tsd" rel="nofollow">Facebook</a></b> <b>Find us on <a href="http://web.stagram.com/n/nasagoddard/?vm=grid" rel="nofollow">Instagram</a></b>
Satellite images from 2022 (Main image) and 1985 (Figure A) capture the retreat of Jakobshavn Isbrae, a glacier on Greenland's western coast, as icebergs broke off its edge over nearly four decades. In a recent study in Nature, researchers from NASA's Jet Propulsion Laboratory in Southern California calculated that Jakobshavn lost an estimated 97 billion tons (88 billion metric tons) of ice in the period between the two images. The earlier image was taken by the Thematic Mapper instrument on the Landsat 5 satellite on Sept. 5, 1985, while the later image was captured by the Operational Land Imager on the Landsat 8 satellite on Sept. 4, 2022. Of the 207 glaciers analyzed in the study, Jakobshavn lost the second most ice mass, trailing only Zachariae Isstrom, a glacier in northeast Greenland. The study took a comprehensive look at glacial retreat around the edges of the entire Greenland Ice Sheet from 1985 to 2022 and found that 179 glaciers retreated significantly since 1985, 27 held steady, and just one advanced slightly. The study found that overall the ice sheet shed about 1,140 billion tons (1,034 billion metric tons) of ice from 1985 to 2022, one-fifth more mass than previously estimated, as icebergs fell into the ocean at an accelerating rate. Most of the ice loss came from below sea level, in fjords on Greenland's periphery. Once occupied by ancient glacial ice, many of these deep coastal valleys have filled with seawater – meaning the ice that broke off made little net contribution to sea level. But the loss likely accelerated the movement of ice flowing down from higher elevations, which in turn added to sea level rise. It also added previously unaccounted-for fresh water to the North Atlantic Ocean, which could have impacts on global ocean currents. https://photojournal.jpl.nasa.gov/catalog/PIA26117
Satellite images from 2022 (Main image) and 1999 (Figure A) capture the retreat of Zachariae Isstrom, a glacier in northeast Greenland, as icebergs broke off its edge over the course of 23 years. In a recent study in Nature, researchers from NASA's Jet Propulsion Laboratory in Southern California calculated that Zachariae lost an estimated 176 billion tons (160 billion metric tons) of ice in the period between 1985 and 2022. That was the greatest mass lost for the period of any of the 207 glaciers analyzed in the paper. The earlier image was taken by the Enhanced Thematic Mapper Plus on the Landsat 7 satellite on Aug. 5, 1999, while the later image was captured by the Operational Land Imager on the Landsat 8 satellite on Aug. 22, 2022. The study took a comprehensive look at glacial retreat around the edges of the entire Greenland Ice Sheet from 1985 to 2022 and found that 179 glaciers retreated significantly since 1985, 27 held steady, and just one advanced slightly. The study found that overall the ice sheet shed about 1,140 billion tons (1,034 billion metric tons) of ice from 1985 to 2022, one-fifth more mass than previously estimated, as icebergs fell into the ocean at an accelerating rate. Most of the ice loss came from below sea level, in fjords on Greenland's periphery. Once occupied by ancient glacial ice, many of these deep coastal valleys have filled with seawater – meaning the ice that broke off made little net contribution to sea level. But the loss likely accelerated the movement of ice flowing down from higher elevations, which in turn added to sea level rise. It also added previously unaccounted-for fresh water to the North Atlantic Ocean, which could have impacts on global ocean currents. https://photojournal.jpl.nasa.gov/catalog/PIA26118
NASA image acquired August 5, 2010 On August 5, 2010, an enormous chunk of ice, roughly 97 square miles (251 square kilometers) in size, broke off the Petermann Glacier, along the northwestern coast of Greenland. The Canadian Ice Service detected the remote event within hours in near real-time data from the Moderate Resolution Imaging Spectroradiometer (MODIS) on NASA’s Aqua satellite. The Peterman Glacier lost about one-quarter of its 70-kilometer (40-mile) long floating ice shelf, said researchers who analyzed the satellite data at the University of Delaware. The Moderate Resolution Imaging Spectroradiometer (MODIS) on NASA’s Terra satellite captured these natural-color images of Petermann Glacier 18:05 UTC on August 5, 2010 (top), and 17:15 UTC on July 28, 2010 (bottom). The Terra image of the Petermann Glacier on August 5 was acquired almost 10 hours after the Aqua observation that first recorded the event. By the time Terra took this image, skies were less cloudy than they had been earlier in the day, and the oblong iceberg had broken free of the glacier and moved a short distance down the fjord. Icebergs calving off the Petermann Glacier are not unusual. Petermann Glacier’s floating ice tongue is the Northern Hemisphere’s largest, and it has occasionally calved large icebergs. The recently calved iceberg is the largest to form in the Arctic since 1962, said the University of Delaware. To read more and or to download the high res go here: <a href="http://www.nasa.gov/topics/earth/features/petermann-calve.html" rel="nofollow">www.nasa.gov/topics/earth/features/petermann-calve.html</a> or Click here to see more images from <b><a href="#//earthobservatory.nasa.gov/" rel="nofollow"> NASA Goddard’s Earth Observatory</a></b> NASA Earth Observatory image created by Jesse Allen and Robert Simmon, using data obtained from the Goddard Level 1 and Atmospheric Archive and Distribution System (LAADS). Caption by Holli Riebeek and Michon Scott. Instrument: Terra - MODIS <b><a href="http://www.nasa.gov/centers/goddard/home/index.html" rel="nofollow">NASA Goddard Space Flight Center</a></b> is home to the nation's largest organization of combined scientists, engineers and technologists that build spacecraft, instruments and new technology to study the Earth, the sun, our solar system, and the universe. <b>Follow us on <a href="http://twitter.com/NASA_GoddardPix" rel="nofollow">Twitter</a></b> <b>Join us on <a href="http://www.facebook.com/pages/Greenbelt-MD/NASA-Goddard/395013845897?ref=tsd" rel="nofollow">Facebook</a><b></b></b>
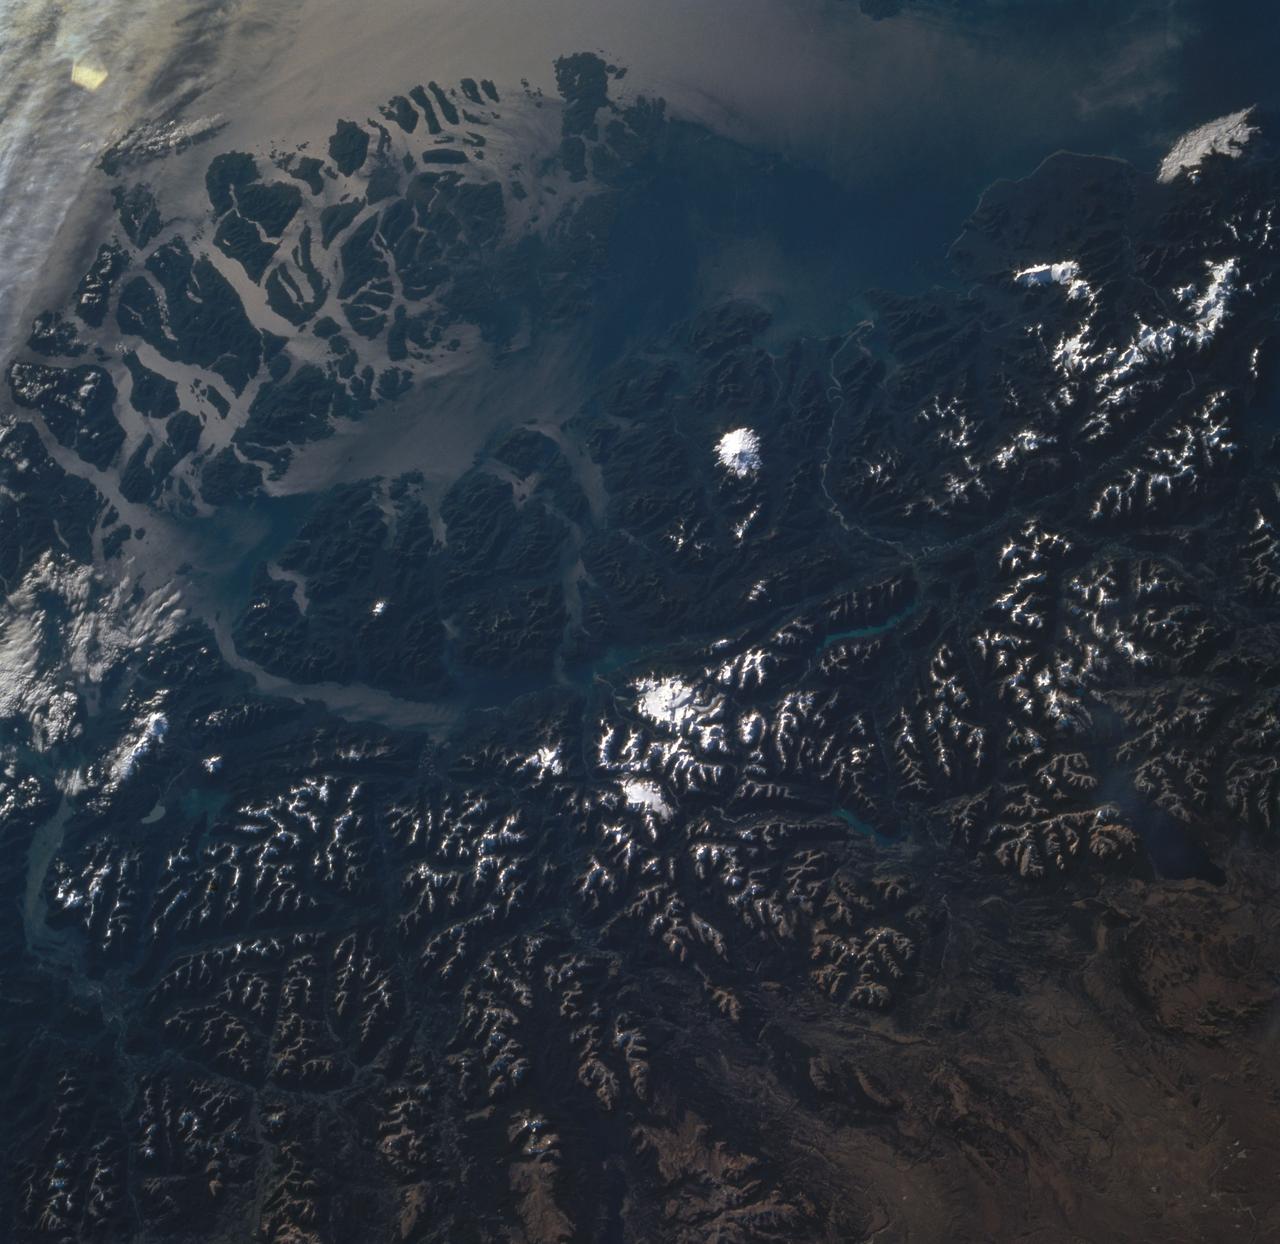
ISS038-E-047324 (13 Feb. 2014) --- This grand panorama of the Southern Patagonia Icefield (center) was imaged by an Expedition 38 crew member on the International Space Station on one of the rare clear days in the southern Andes Mountains. With an area of 13,000 square kilometers, the icefield is the largest temperate ice sheet in the Southern Hemisphere. Storms that swirl into the region from the southern Pacific Ocean (top) bring rain and snow (equivalent to a total of 2-11 meters of rainfall per year) resulting in the buildup of the ice sheet shown here (center). During the ice ages the glaciers were far larger. Geologists now know that ice tongues extended far onto the plains in the foreground, completely filling the great Patagonian lakes on repeated occasions. Similarly, ice tongues extended into the dense network of fjords (arms of the sea) on the Pacific side of the icefield. Ice tongues today appear tiny compared to the view that an "ice age" astronaut would have seen. A study of the surface topography of sixty-three glaciers, based on Shuttle Radar Topography Mission (SRTM) data, compared data from 2000 to data from studies going back about 30 years (1968-1975). Many glacier tongues showed significant annual "retreat" of their ice fronts, a familiar signal of climate change. The study also revealed that the almost invisible loss by glacier thinning is far more significant in explaining ice loss. The researchers concluded that volume loss by frontal collapse is 4-10 times smaller than that caused by thinning. Scaled over the entire icefield, including frontal loss (so-called calving when ice masses collapse into the lakes), it was calculated that 13.5 cubic kilometers of ice was lost each year over the study period. This number becomes more meaningful compared with the rate measured in the last five years of the study (1995-2000), when the rate increased almost threefold, averaging 38.7 cubic kilometers per year. Extrapolating results from the low altitude glacier tongues implies that the high plateau ice on the spine of the Andes is thinning as well. In the decade since this study the often-imaged Upsala Glacier has retreated a further three kilometers, as shown recently in images taken by crew members aboard the space station. Glacier Pio X, named for Pope Pius X, is the only large glacier that is growing in length.