
This image acquired on Jan. 17, 2016 by NASA Terra spacecraft shows major flooding along the Mississippi River, affecting Missouri, Illinois, Arkansas and Tennessee. As of January 17, flood warnings were issued for the area around Baton Rouge, Louisiana, as the river crested at 43.3 feet (13.1 meters), 8 feet (2.4 meters) above flood stage. Shipping and industrial activities were significantly affected; low-lying areas were flooded, and agricultural operations were impacted on the west side of the river. This image from the Advanced Spaceborne Thermal Emission and Reflection Radiometer (ASTER) on NASA's Terra spacecraft was acquired Jan. 17, 2016, covers an area of 23.6 by 23.6 miles (38 by 38 kilometers), and is located at 30.6 degrees north, 91.3 degrees west. http://photojournal.jpl.nasa.gov/catalog/PIA20364

The Advanced Rapid Imaging and Analysis (ARIA) team at NASA's Jet Propulsion Laboratory in Pasadena, California, created these flood proxy maps depicting areas of Mozambique that are likely flooded as a result of Cyclone Idai. The likely flooding zones are indicated by light blue pixels. The maps were derived from synthetic aperture radar (SAR) images from the ICEYE-X2 (March 18), Sentinel-1 (March 19, 20), and ALOS-2 (March 23) satellites operated by ICEYE (Finnish satellite manufacturer Every Square Meter, Every Hour), European Space Agency (ESA), and Japan Aerospace Exploration Agency (JAXA), respectively. The processed images were compared to each other for cross-validation. These flood proxy maps should be used as guidance to identify areas that are likely flooded, and may be less reliable over urban and vegetated areas. https://photojournal.jpl.nasa.gov/catalog/PIA23142
A Molten Flood
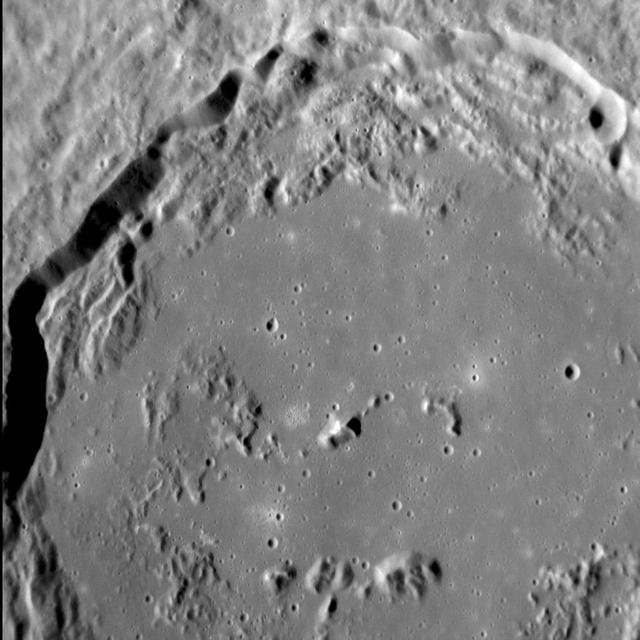
Flooded Firdousi
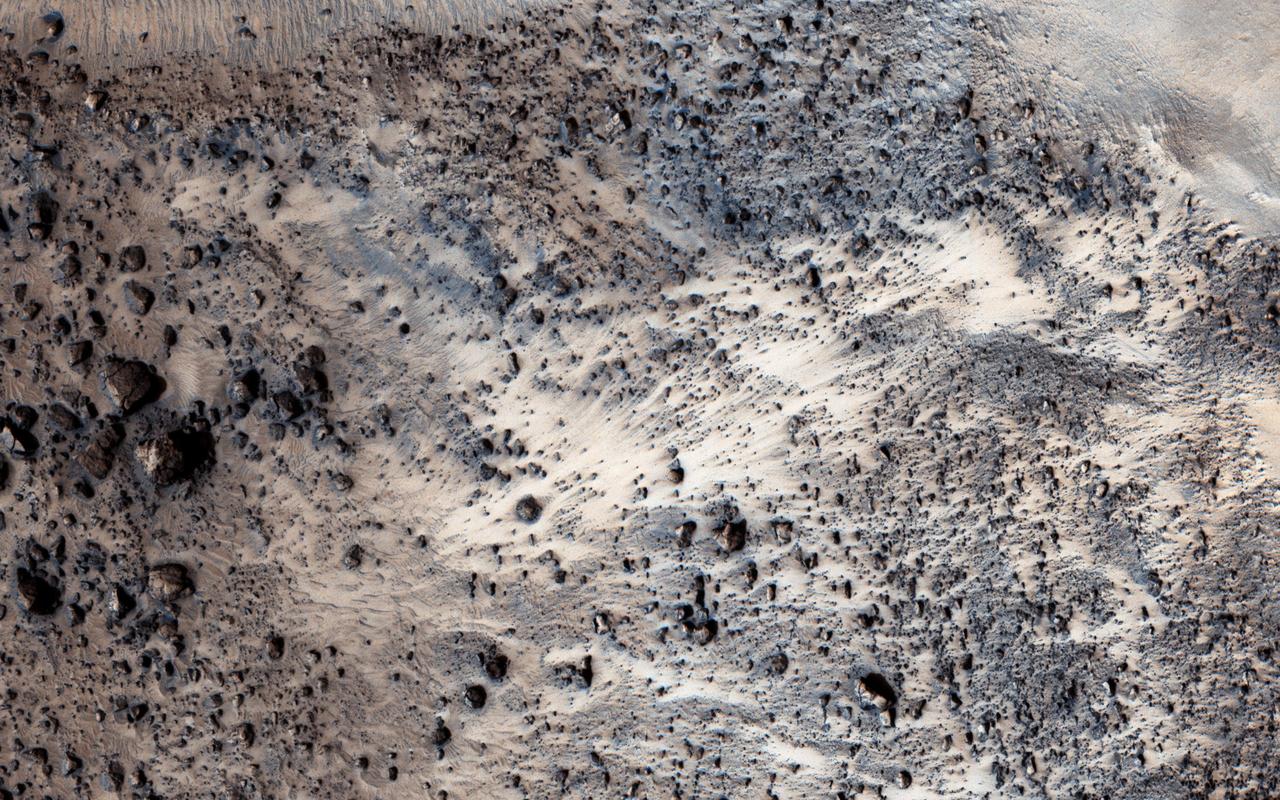
A Flood of Rock

NASA image acquired July 17, 2011 In mid-July 2011, more than a month after the Missouri River broke through two levees and flooded fields near Hamburg, Iowa, muddy water lingered near the city. Hamburg residents were relieved, however, that a newly built levee had spared the town from flooding. On July 17, 2011, the Advanced Land Imager (ALI) on NASA’s Earth Observing-1 (EO-1) satellite captured this natural-color image. Compared to an image acquired on June 24, flooding has apparently receded slightly in some areas. Sediment-choked water nevertheless lingers on large swaths of land. On July 13, 2011, KETV of Omaha, Nebraska, reported that a newly built, 2-mile levee designed to protect Hamburg already exceeded federal standards. The U.S. Army Corps of Engineers handed control of the levee over to city officials on July 12. In the end, the levee was expected to cost the Army Corps $6 million, and the city of Hamburg about $800,000. On July 18, 2011, the Advanced Hydrological Prediction Service reported moderate flooding along the Missouri River not far from Hamburg, Iowa. In the northwest, the river reached 24.37 feet (7.43 meters) at Nebraska City. In the southeast, the river reached 38.98 feet (11.88 meters) at Brownville, Nebraska. NASA Earth Observatory image created by Jesse Allen and Robert Simmon, using EO-1 ALI data provided courtesy of the NASA EO-1 team. Caption by Michon Scott. Instrument: EO-1 - ALI Credit: <b><a href="http://www.earthobservatory.nasa.gov/" rel="nofollow"> NASA Earth Observatory</a></b> <b><a href="http://www.nasa.gov/centers/goddard/home/index.html" rel="nofollow">NASA Goddard Space Flight Center</a></b> enables NASA’s mission through four scientific endeavors: Earth Science, Heliophysics, Solar System Exploration, and Astrophysics. Goddard plays a leading role in NASA’s accomplishments by contributing compelling scientific knowledge to advance the Agency’s mission. <b>Follow us on <a href="http://twitter.com/NASA_GoddardPix" rel="nofollow">Twitter</a></b> <b>Like us on <a href="http://www.facebook.com/pages/Greenbelt-MD/NASA-Goddard/395013845897?ref=tsd" rel="nofollow">Facebook</a></b> <b>Find us on <a href="http://web.stagram.com/n/nasagoddard/?vm=grid" rel="nofollow">Instagram</a></b>

The Advanced Rapid Imaging and Analysis (ARIA) team at NASA's Jet Propulsion Laboratory in Pasadena, California, in collaboration with the Earth Observatory of Singapore (EOS), created this flood map depicting areas of the Bahamas that are likely flooded (shown by light blue pixels) as a result of Hurricane Dorian. The map was derived from synthetic aperture radar (SAR) data acquired on Sept. 2, 2019, by the European Union's Copernicus Sentinel-1 satellites operated by the European Space Agency (ESA). The map covers an area of 109 miles by 106 miles (176 kilometers by 170 kilometers) shown by the large red polygon. Each pixel measures about 32 yards (30 meters) across. This map can be used as guidance to identify areas that are likely flooded, and may be less reliable over urban and vegetated areas. The image contains modified Copernicus Sentinel data (2019) processed by ESA and analyzed by NASA, JPL-Caltech, ARIA, and EOS. This work was funded by NASA along with the Earth Observatory of Singapore and a Singapore National Research Foundation Investigatorship. https://photojournal.jpl.nasa.gov/catalog/PIA23360
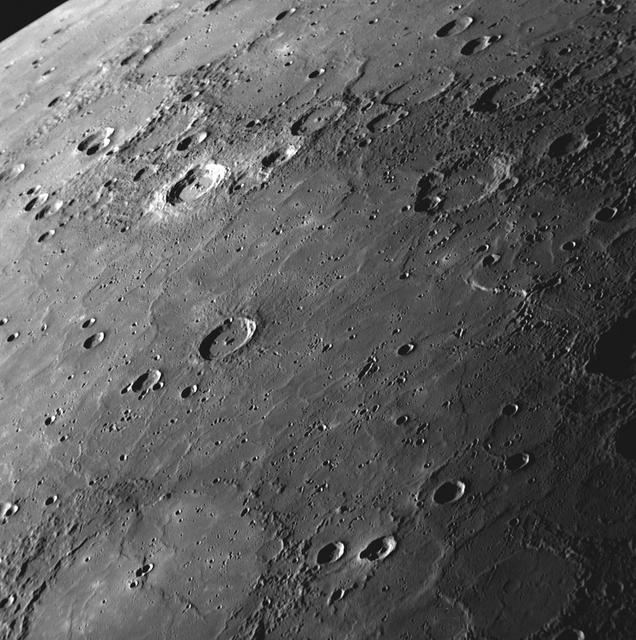
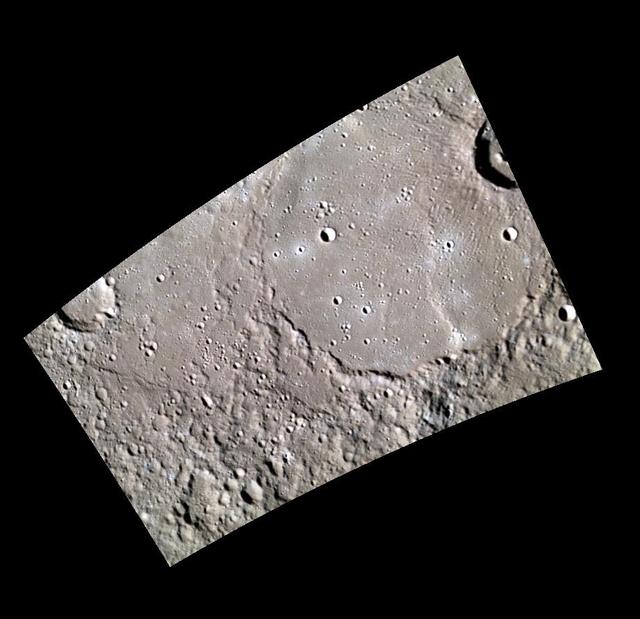
Flooding Mercury Surface
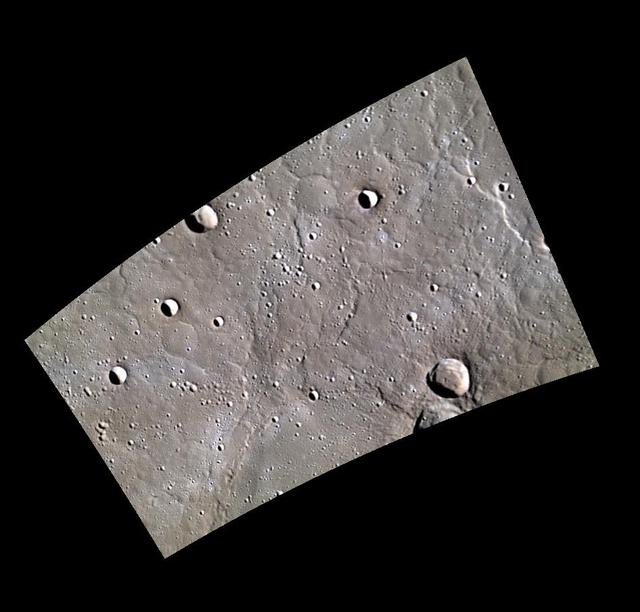
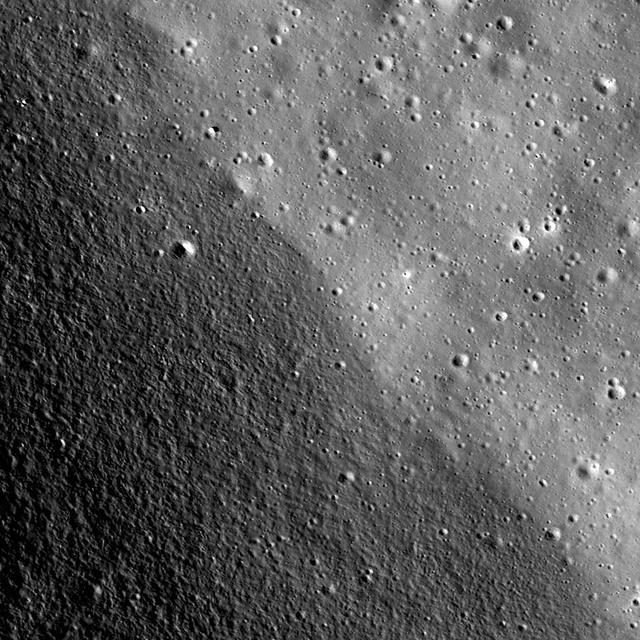
A Flood Covering Monteverdi
Archimedes - Mare Flooded Crater
Cerberus Flood Features
Tharsis Flood Features
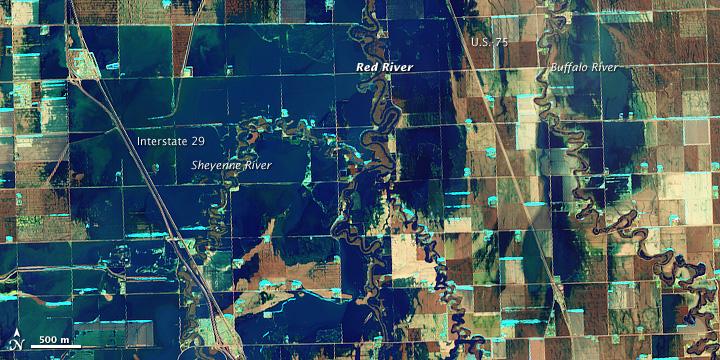
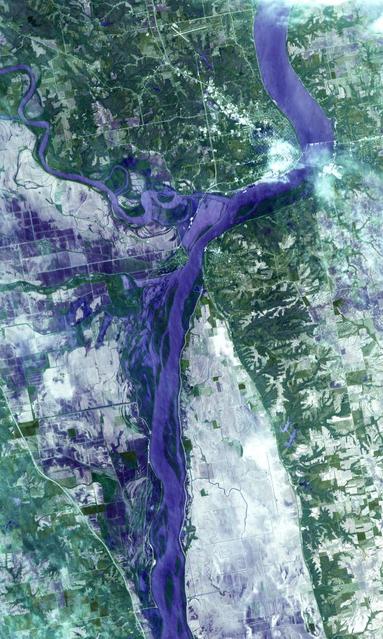
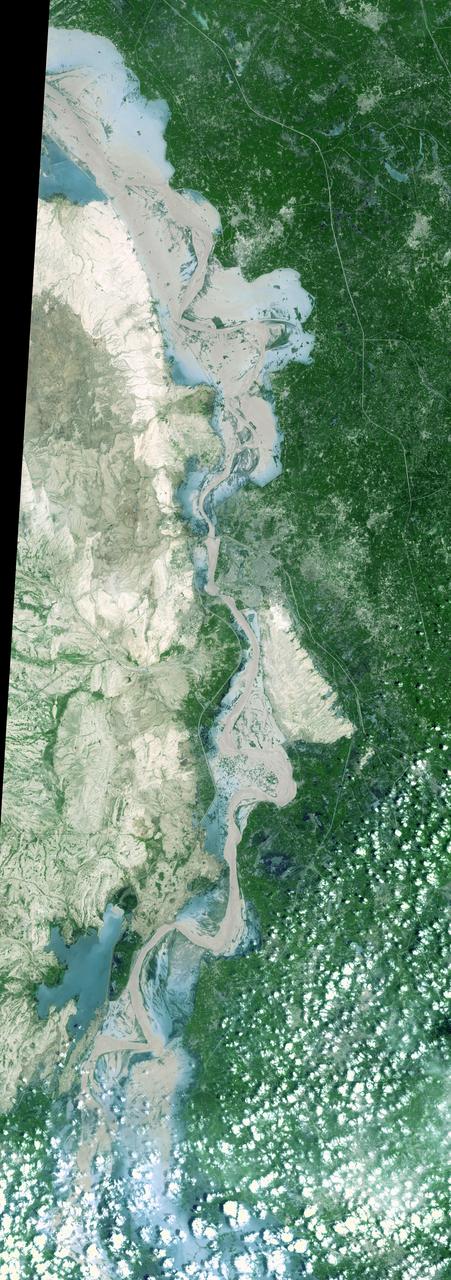
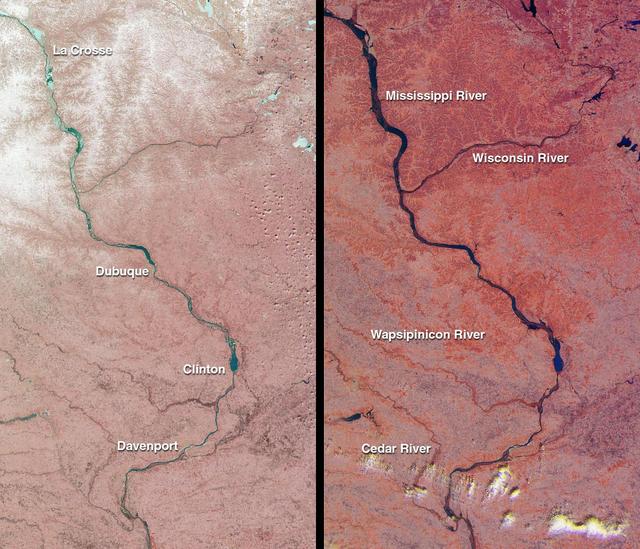
NASA Satellite image acquired March 21, 2010. To see a high res of this image go here: <a href="http://www.flickr.com/photos/gsfc/4455124807/in/photostream/">www.flickr.com/photos/gsfc/4455124807/in/photostream/</a> On March 21, 2010, the Red River crested at 36.99 feet (11.27 meters), according to the National Weather Service. The New York Times reported that the river’s crest was 1 foot (0.3 meters) below predictions and 4 feet (1 meter) below 2009’s record crest. A cold front passing through the area on March 19, 2010, slowed the rate of snowmelt feeding local rivers. That, combined with sandbags and dykes, spared the metropolitan area of Fargo, North Dakota, from serious flooding. North of town, however, agricultural fields and roads flooded. The Advanced Land Imager (ALI) on NASA’s Earth Observing-1 (EO-1) satellite captured these images of fields north of Fargo on March 21, 2010. The top image uses shortwave infrared light, and the bottom image uses visible light. Muddy waters and fallow fields blend together in the true-color image (bottom), but the false-color image (top) distinguishes better between water and land. Blue indicates water and green indicates vegetation. Fallow fields, bare ground, and paved surfaces appear in shades of brown. Cyan suggests pale water and/or sediment. Wide swaths of blue show large areas of standing water. The Sheyenne, Red, and Buffalo Rivers all flow through the area pictured here. According to The New York Times, flooding in rural areas around Fargo resulted primarily from the Red River’s failure to absorb water from the tributaries feeding it. Much of the standing water apparent in this image occurs around the Sheyenne and Buffalo Rivers. Overflowing tributaries left several inches of standing water in agricultural fields and on highways. About 10 miles (16 kilometers) north of Fargo, flooding forced the closure of Interstate 29. NASA image created by Jesse Allen, using EO-1 ALI data provided courtesy of the NASA EO-1 team and the United States Geological Survey. Caption by Michon Scott.. Instrument: EO-1 - ALI. To learn more about this image go here: <a href="http://earthobservatory.nasa.gov/NaturalHazards/view.php?id=43211" rel="nofollow">earthobservatory.nasa.gov/NaturalHazards/view.php?id=43211</a> To learn more about NASA's Goddard Space Flight Center go here: <a href="http://www.nasa.gov/centers/goddard/home/index.html" rel="nofollow">www.nasa.gov/centers/goddard/home/index.html</a>

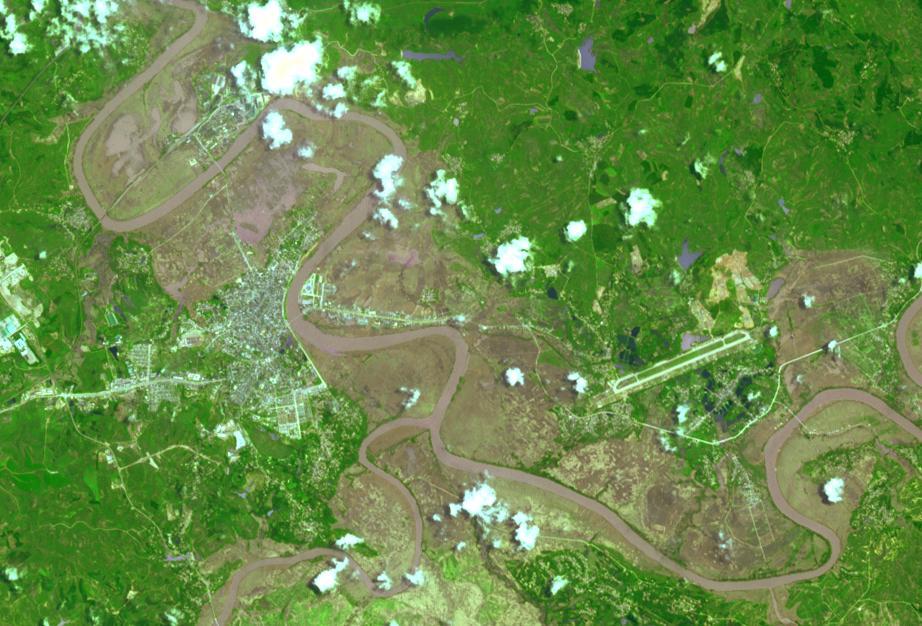
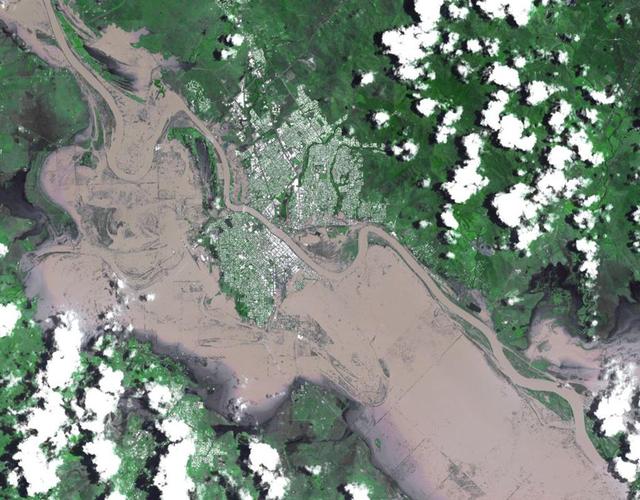
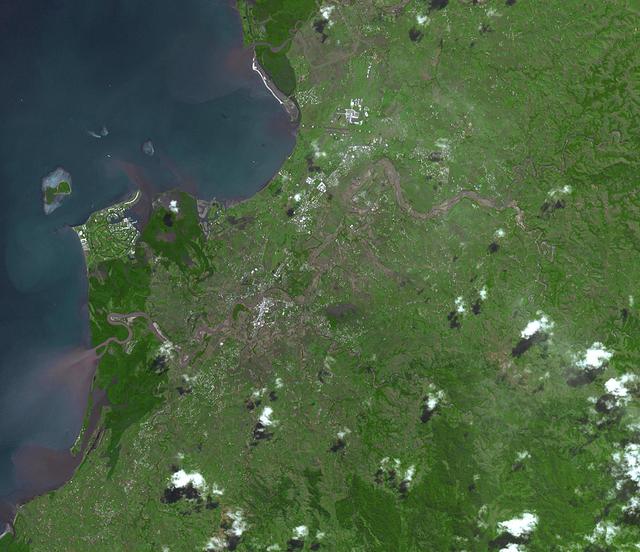
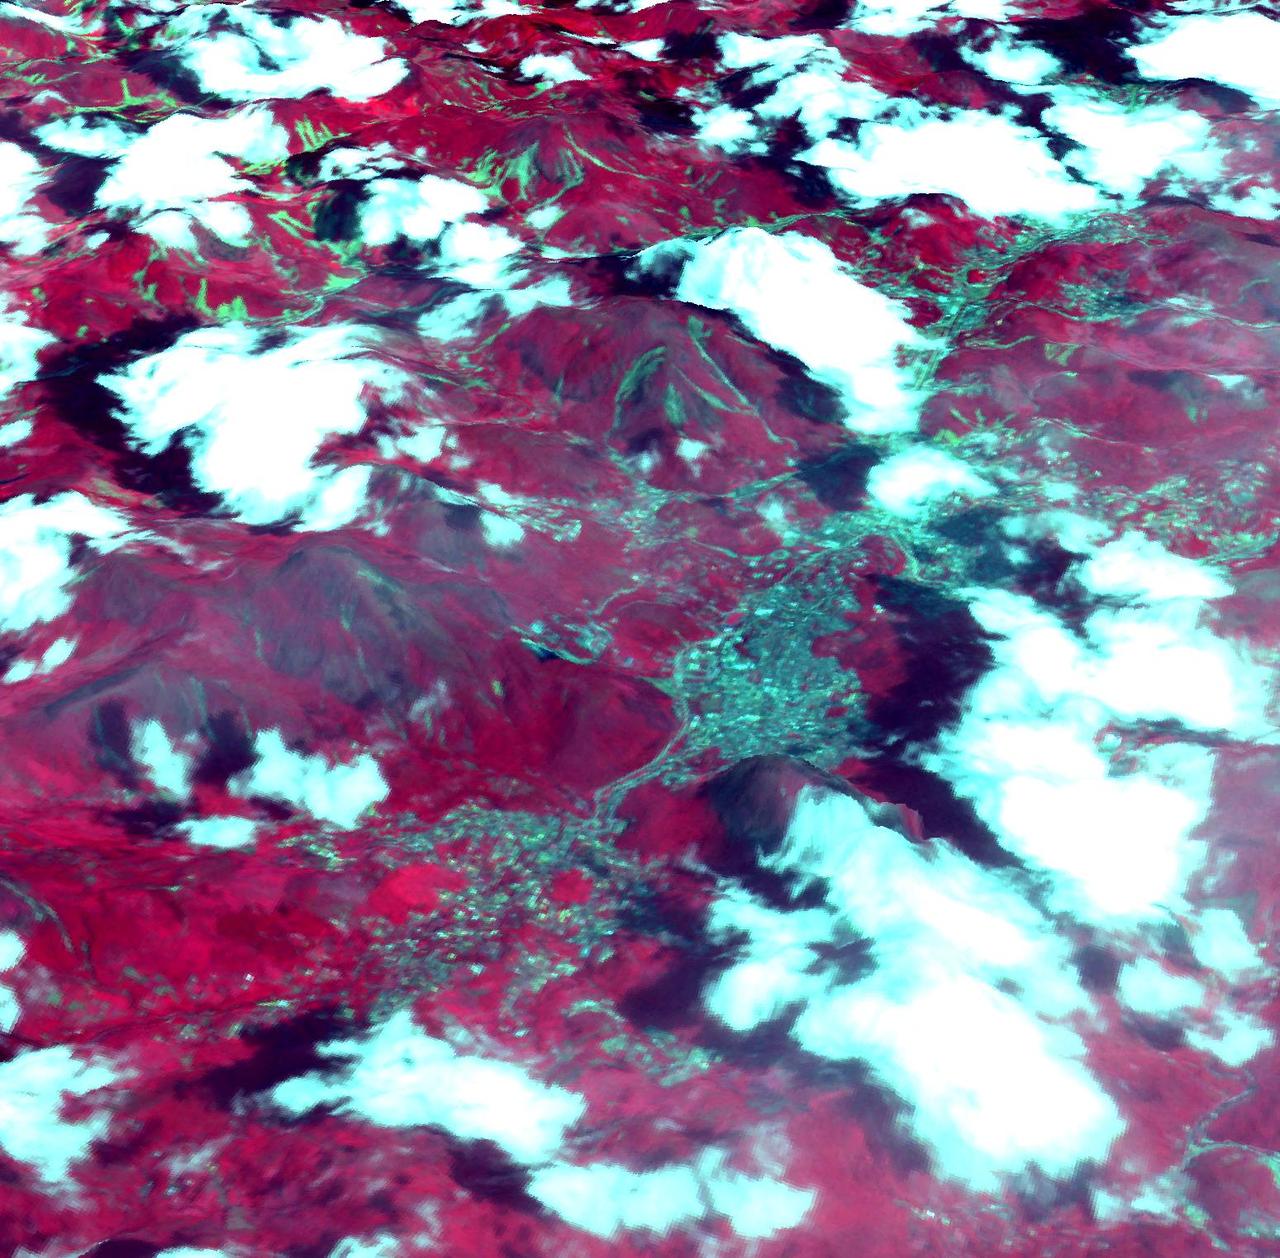
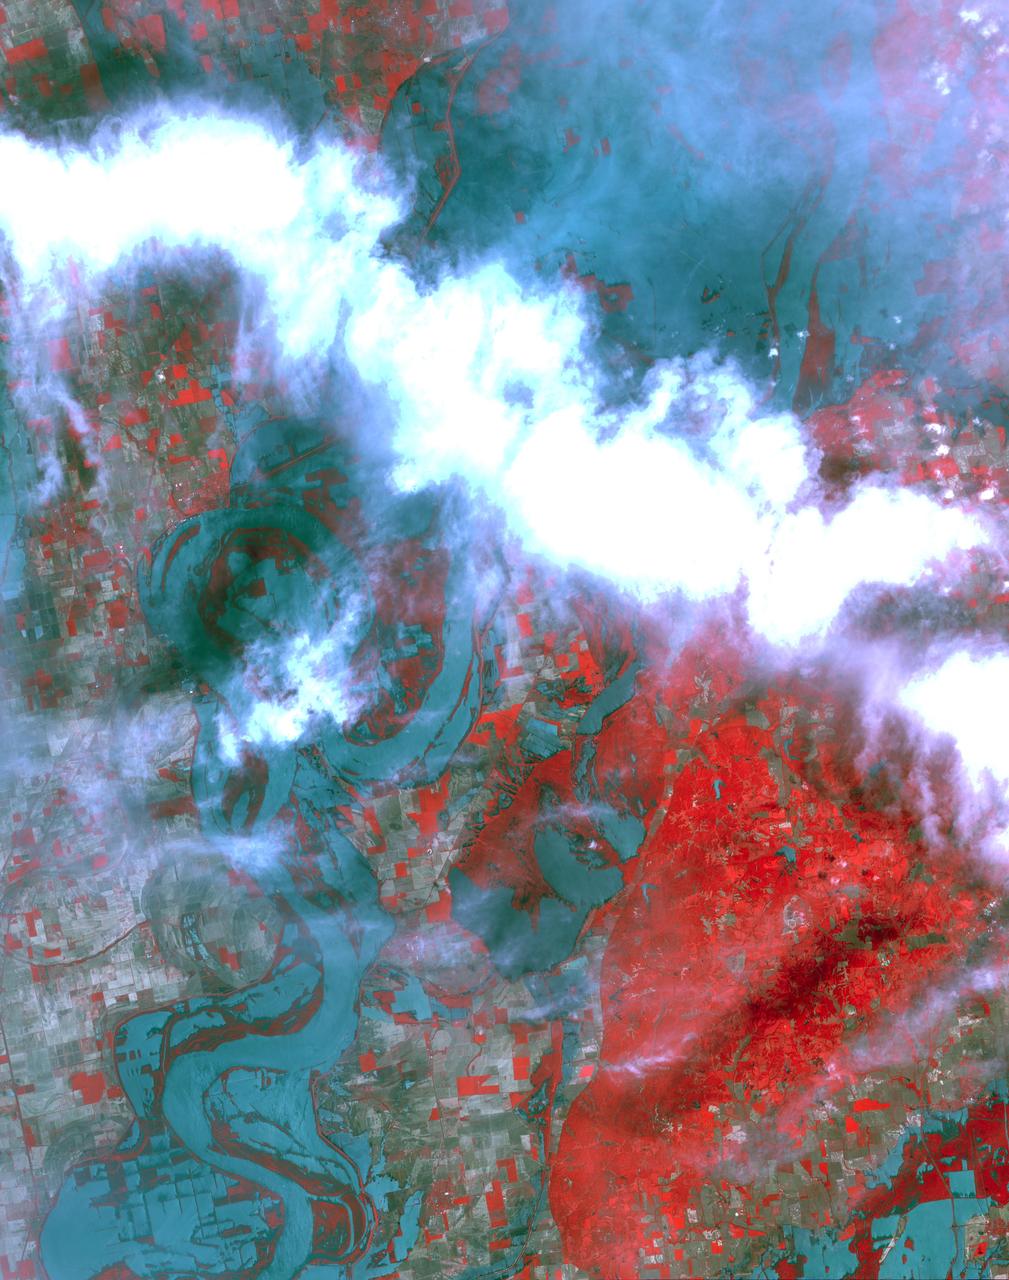
NASA image acquired August 4, 2010 Though many areas in northwest Pakistan were bracing for heavy rain and additional flash flooding on August 4, 2010, the city of Kheshgi, in northwest Pakistan, had clear skies. This image, taken by the Advanced Spaceborne Thermal Emission and Reflection Radiometer (ASTER) on NASA’s Terra satellite reveals a city awash in flood water. Thick with mud, the Kabul River is pale green in this false color image. Clearer water is dark blue. The river flows through its usual channel, but in places, water seeps over the channel and across the landscape. The buildings and roads of Kheshgi are silver. Spots of turquoise blue—shallow, muddy water or water-logged ground—covers several sections of the city. On the south side of the Kabul River, water flows down the hills, washing over neighborhoods. The bare ground in the hills is brown and tan. Plant-covered land, red in this image, is divided into long, narrow rectangles, pointing to agriculture. Geometric shapes under the water near the river are probably submerged fields of crops. Thousands of acres of crops had been lost in floods throughout Pakistan, said the United Nations. Kheshgi is in the Nowshera district in the Khyber Pakhutnkhwa province. As of August 2, Khyber Pakhutnkhwa was the hardest hit province in Pakistan, said the United Nations, and Nowshera was the most impacted district in the province. Nowshera reported 500,000 people displaced with 161 dead, said the Government of Khuber Pakhtunkhwa. The floods affected communities throughout Pakistan. More than 1,100 people had died, 15,000 homes were damaged or destroyed, and at least one million people were in need of emergency assistance throughout Pakistan, said the United Nations on August 2. The floods occurred as unusually heavy monsoon rains fell over Pakistan. NASA image courtesy NASA/GSFC/MITI/ERSDAC/JAROS, and U.S./Japan ASTER Science Team. Caption by Holli Riebeek. Instrument: Terra - ASTER Credit: <b><a href="#//earthobservatory.nasa.gov/" rel="nofollow"> NASA’s Earth Observatory</a></b> To learn more about this image go here: <a href="http://earthobservatory.nasa.gov/NaturalHazards/view.php?id=45050" rel="nofollow">earthobservatory.nasa.gov/NaturalHazards/view.php?id=45050</a> Or here: <a href="http://earthobservatory.nasa.gov/NaturalHazards/view.php?id=45343" rel="nofollow">earthobservatory.nasa.gov/NaturalHazards/view.php?id=45343</a> <b><a href="http://www.nasa.gov/centers/goddard/home/index.html" rel="nofollow">NASA Goddard Space Flight Center</a></b> is home to the nation's largest organization of combined scientists, engineers and technologists that build spacecraft, instruments and new technology to study the Earth, the sun, our solar system, and the universe. <b>Follow us on <a href="http://twitter.com/NASA_GoddardPix" rel="nofollow">Twitter</a></b> <b>Join us on <a href="http://www.facebook.com/pages/Greenbelt-MD/NASA-Goddard/395013845897?ref=tsd" rel="nofollow">Facebook</a></b>
This image from NASA Mars Odyssey spacecraft shows a flooded crater in Amazonis Planitia. This crater has been either flooded with mud and or lava. The fluid then ponded up, dried and formed the surface textures we see today.

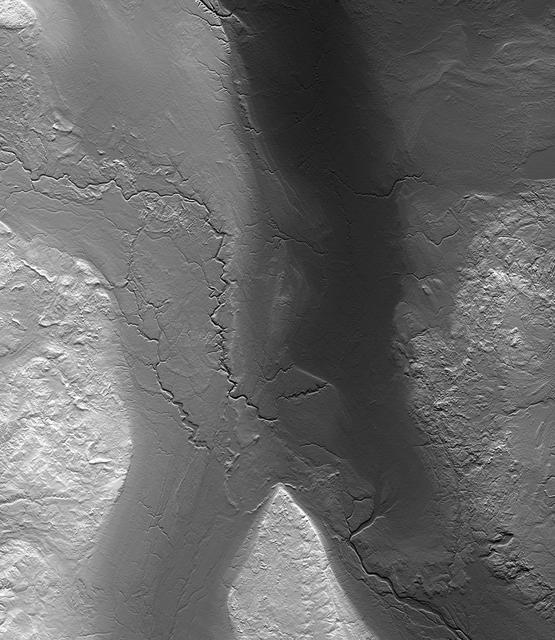
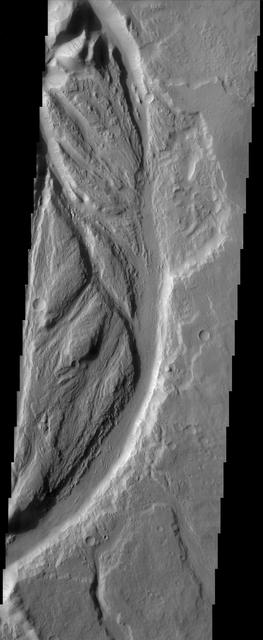
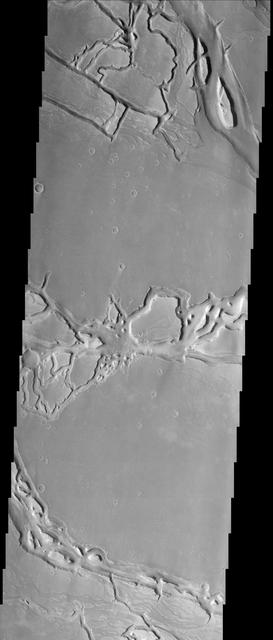
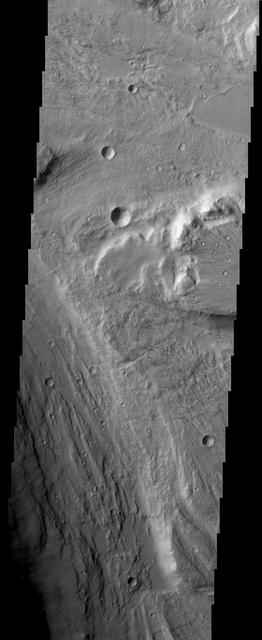
This MOC image shows gullies a portion of a flood-carved canyon within the larger Kasei Valles system on Mars. This canyon is the result of the very last flood event that poured through the Kasei valleys, long ago
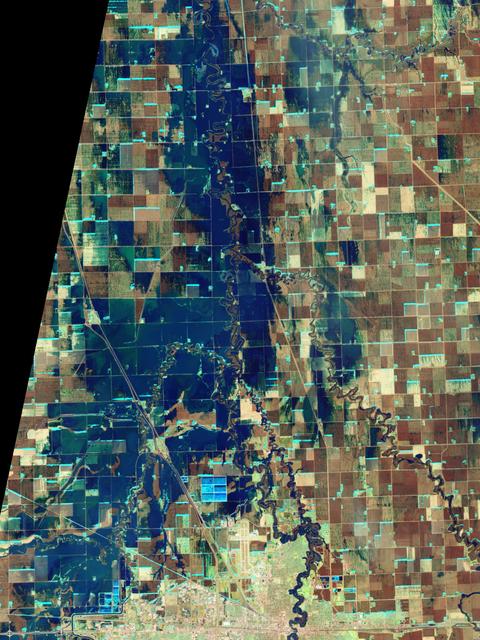
NASA Satellite image acquired March 21, 2010. To see a high res more detail of this image go here: <a href="http://www.flickr.com/photos/gsfc/4455125023/in/photostream/">www.flickr.com/photos/gsfc/4455125023/in/photostream/</a> On March 21, 2010, the Red River crested at 36.99 feet (11.27 meters), according to the National Weather Service. The New York Times reported that the river’s crest was 1 foot (0.3 meters) below predictions and 4 feet (1 meter) below 2009’s record crest. A cold front passing through the area on March 19, 2010, slowed the rate of snowmelt feeding local rivers. That, combined with sandbags and dykes, spared the metropolitan area of Fargo, North Dakota, from serious flooding. North of town, however, agricultural fields and roads flooded. The Advanced Land Imager (ALI) on NASA’s Earth Observing-1 (EO-1) satellite captured these images of fields north of Fargo on March 21, 2010. The top image uses shortwave infrared light, and the bottom image uses visible light. Muddy waters and fallow fields blend together in the true-color image (bottom), but the false-color image (top) distinguishes better between water and land. Blue indicates water and green indicates vegetation. Fallow fields, bare ground, and paved surfaces appear in shades of brown. Cyan suggests pale water and/or sediment. Wide swaths of blue show large areas of standing water. The Sheyenne, Red, and Buffalo Rivers all flow through the area pictured here. According to The New York Times, flooding in rural areas around Fargo resulted primarily from the Red River’s failure to absorb water from the tributaries feeding it. Much of the standing water apparent in this image occurs around the Sheyenne and Buffalo Rivers. Overflowing tributaries left several inches of standing water in agricultural fields and on highways. About 10 miles (16 kilometers) north of Fargo, flooding forced the closure of Interstate 29. NASA image created by Jesse Allen, using EO-1 ALI data provided courtesy of the NASA EO-1 team and the United States Geological Survey. Caption by Michon Scott. Instrument: EO-1 - ALI. To learn more about this image go here: <a href="http://earthobservatory.nasa.gov/NaturalHazards/view.php?id=43211" rel="nofollow">earthobservatory.nasa.gov/NaturalHazards/view.php?id=43211</a> To learn more about NASA's Goddard Space Flight Center go here: <a href="http://www.nasa.gov/centers/goddard/home/index.html" rel="nofollow">www.nasa.gov/centers/goddard/home/index.html</a>
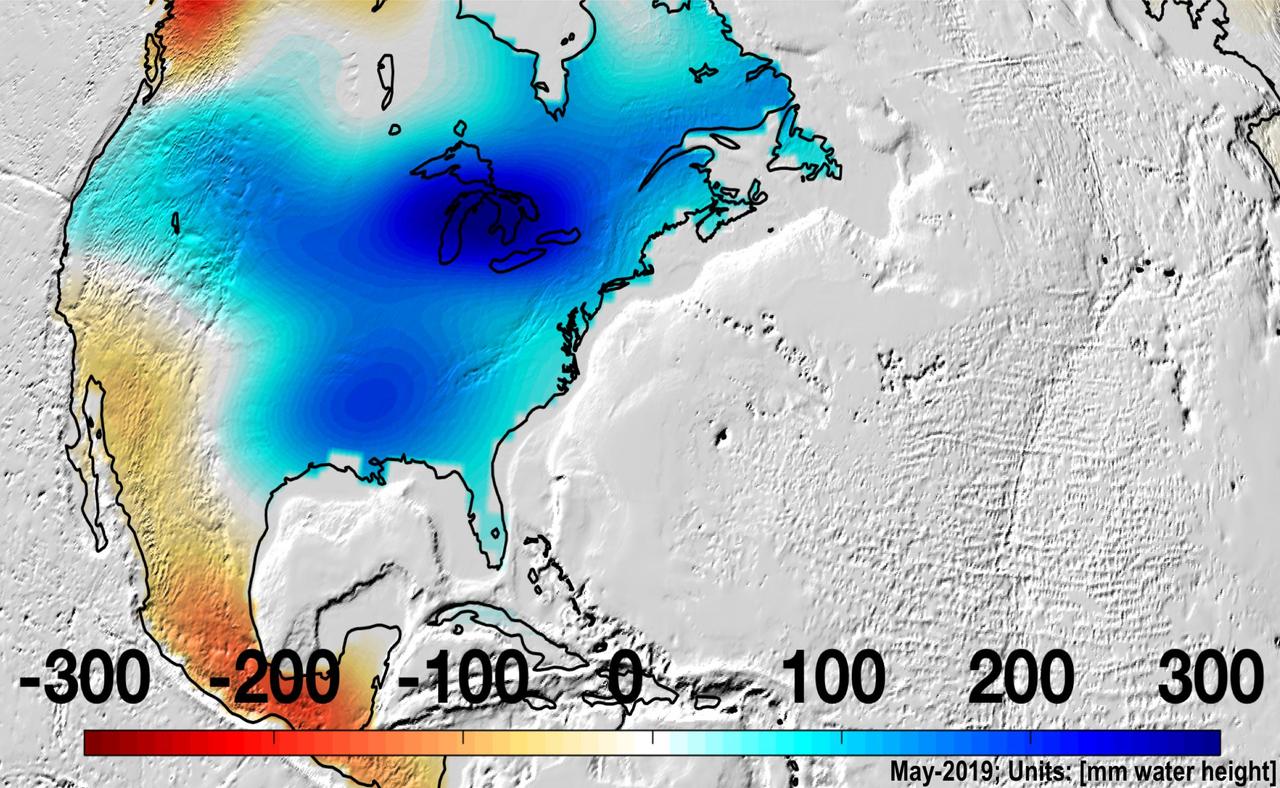
North America was almost entirely above its long-term average in mass in May 2019, due to Midwestern flooding, with the runoff raising the Great Lakes to record levels. https://photojournal.jpl.nasa.gov/catalog/PIA22840

On Oct. 25, 2011, the Chao Phraya River was in flood stage as NASA Terra spacecraft imaged flooded agricultural fields and villages depicted here in dark blue, and the sediment-laden water in shades of tan.

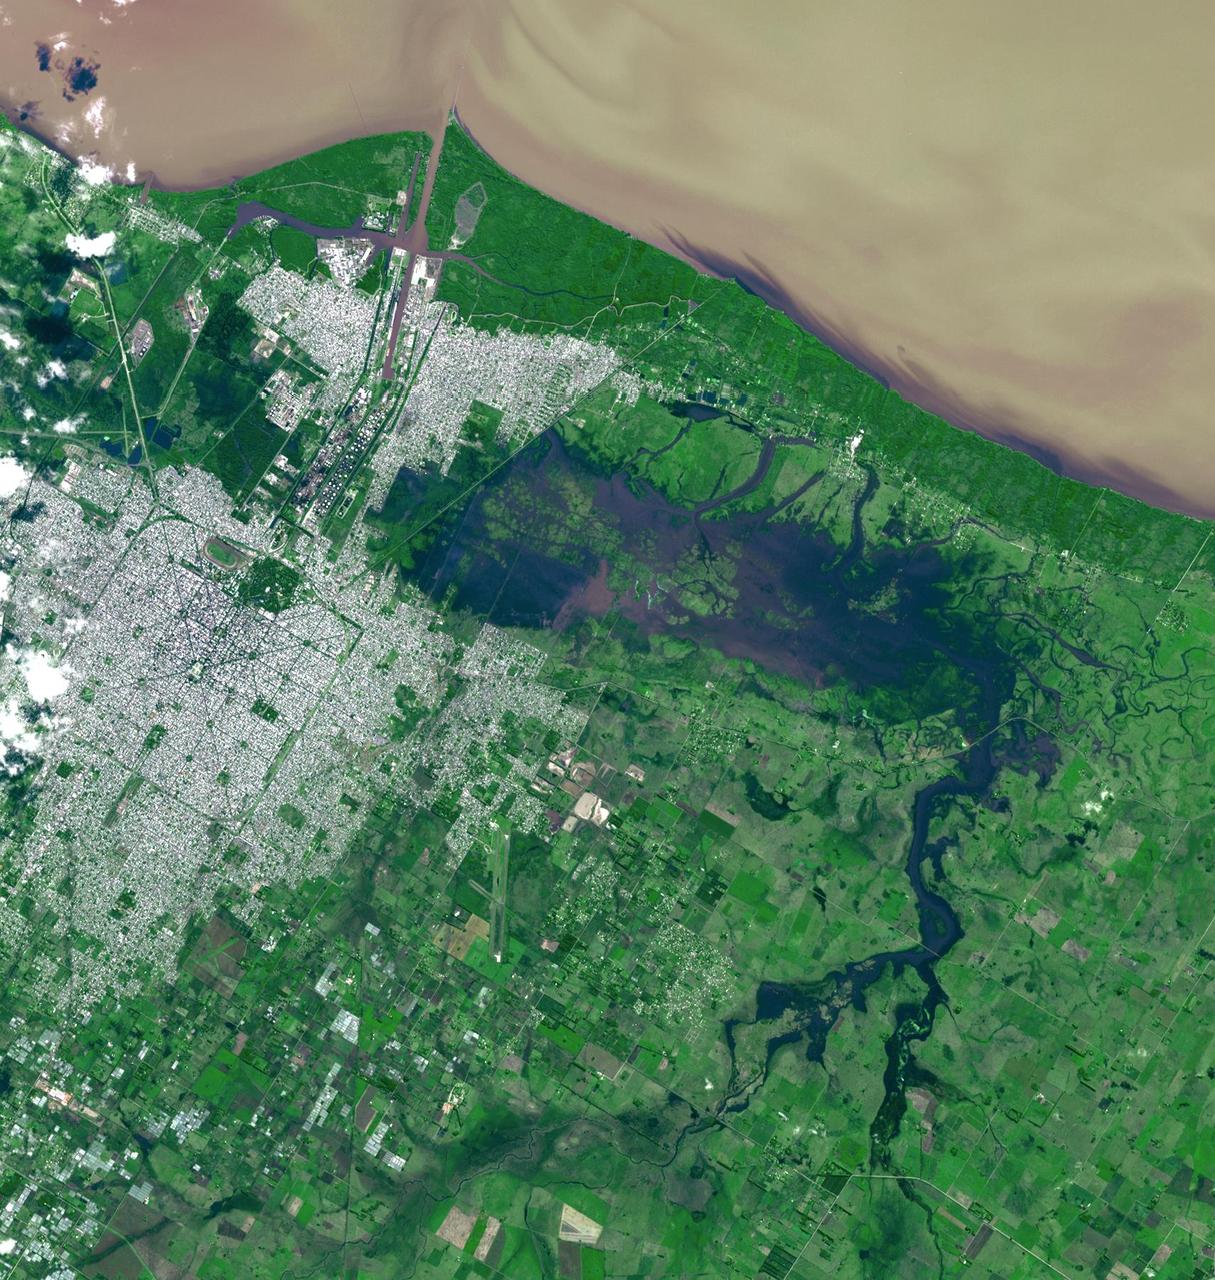
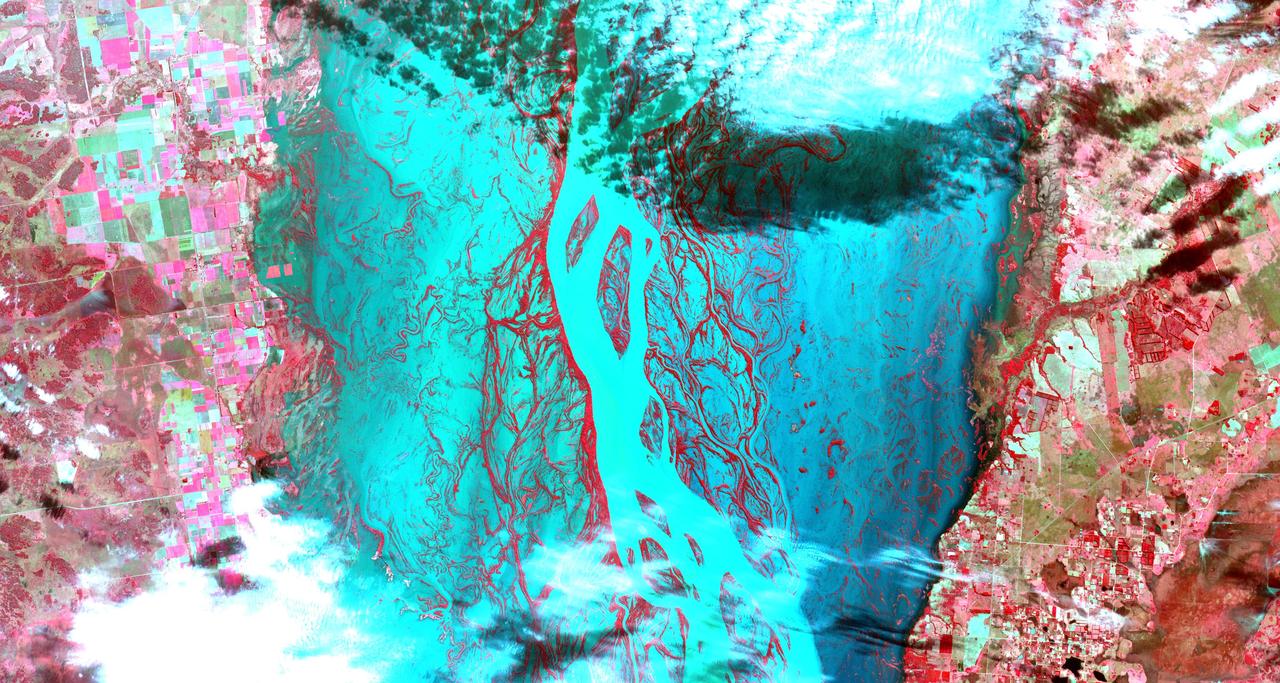
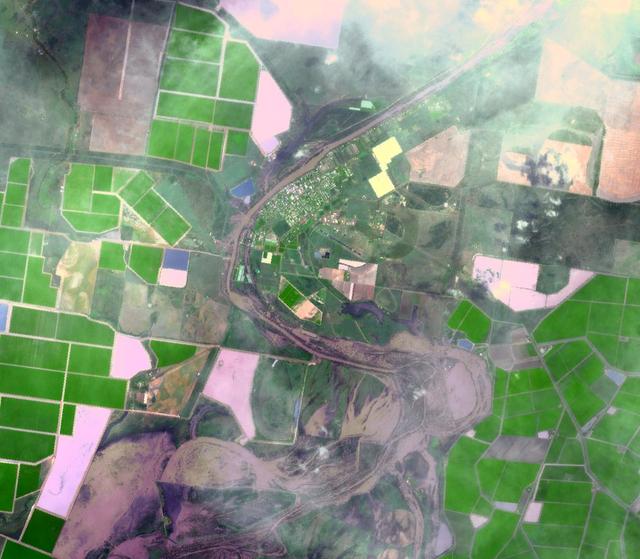
Since August 2015, heavy rains have caused rivers to overflow and forced tens of thousands from their homes in Paraguay, Argentina and Brazil. Rosario, Argentina is located 186 miles (300 kilometers) northwest of Buenos Aires, on the western shore of the Parana River. The entire Parana River floodplain for hundreds of kilometers is still under water or wet, as seen in this image from the Advanced Spaceborne Thermal Emission and Reflection Radiometer (ASTER) instrument on NASA's Terra spacecraft, acquired Jan. 6, 2016. The image covers an area of 30.8 by 33.9 miles (49.5 by 54.6 kilometers), and is located at 33 degrees south, 61 degrees west. http://photojournal.jpl.nasa.gov/catalog/PIA20295
At the time NASA Terra spacecraft acquired this image, the Mississippi River had reached a level of 53 feet 16.2 meters, 3 feet 1 meter above the major flood stage. Flood water had already inundated parts of Vicksburg, Mississippi.
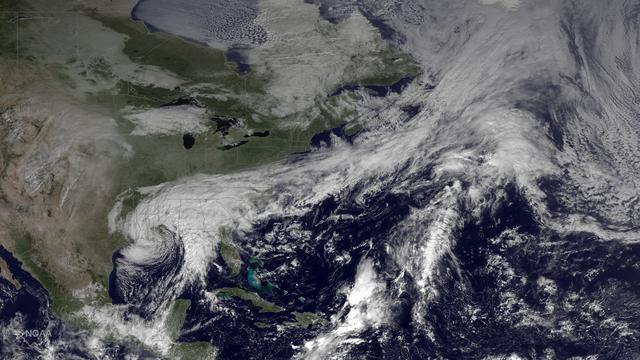
The system that brought heavy rainfall and flash flooding to parts of the southern Plains and western Gulf Coast over the past several days continues to push eastward, with the greatest potential for heavy rain and flash flooding on Monday across parts of the lower Mississippi Valley and Southeast. This image was taken by GOES East at 1515Z on October 26, 2015. <b><a href="http://goes.gsfc.nasa.gov/" rel="nofollow">Credit: NOAA/NASA GOES Project</a></b> Credit: NASA/NOAA via <b><a href="www.nnvl.noaa.gov/" rel="nofollow"> NOAA Environmental Visualization Laboratory</a></b> <b><a href="http://www.nasa.gov/audience/formedia/features/MP_Photo_Guidelines.html" rel="nofollow">NASA image use policy.</a></b> <b><a href="http://www.nasa.gov/centers/goddard/home/index.html" rel="nofollow">NASA Goddard Space Flight Center</a></b> enables NASA’s mission through four scientific endeavors: Earth Science, Heliophysics, Solar System Exploration, and Astrophysics. Goddard plays a leading role in NASA’s accomplishments by contributing compelling scientific knowledge to advance the Agency’s mission. <b>Follow us on <a href="http://twitter.com/NASAGoddardPix" rel="nofollow">Twitter</a></b> <b>Like us on <a href="http://www.facebook.com/pages/Greenbelt-MD/NASA-Goddard/395013845897?ref=tsd" rel="nofollow">Facebook</a></b> <b>Find us on <a href="http://instagrid.me/nasagoddard/?vm=grid" rel="nofollow">Instagram</a></b>
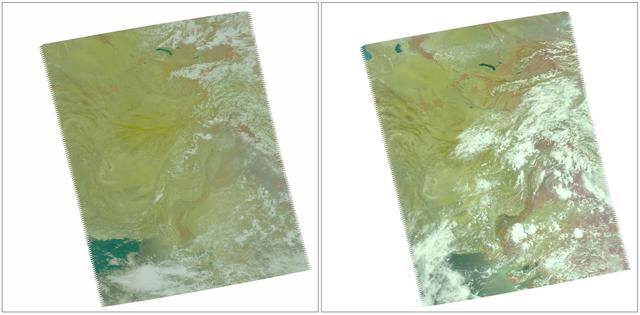
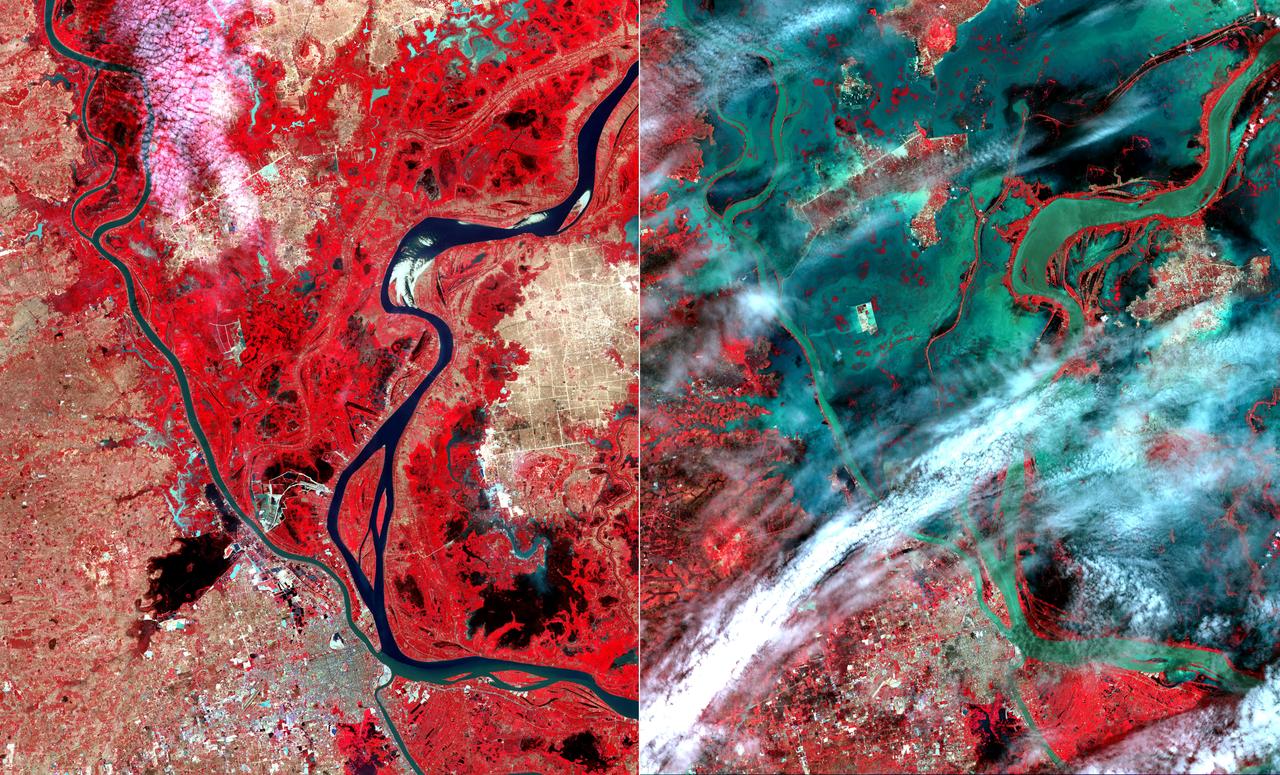
In late July 2010, flooding caused by heavy monsoon rains began in several regions of Pakistan. These images taken by NASA Aqua spacecraft show were taken before and after the flooding.
This image from the NASA Terra spacecraft shows extensive flooding resulting from Typhoon Rammasun in Ningming, China. This ASTER image was acquired on July 24, 2014.
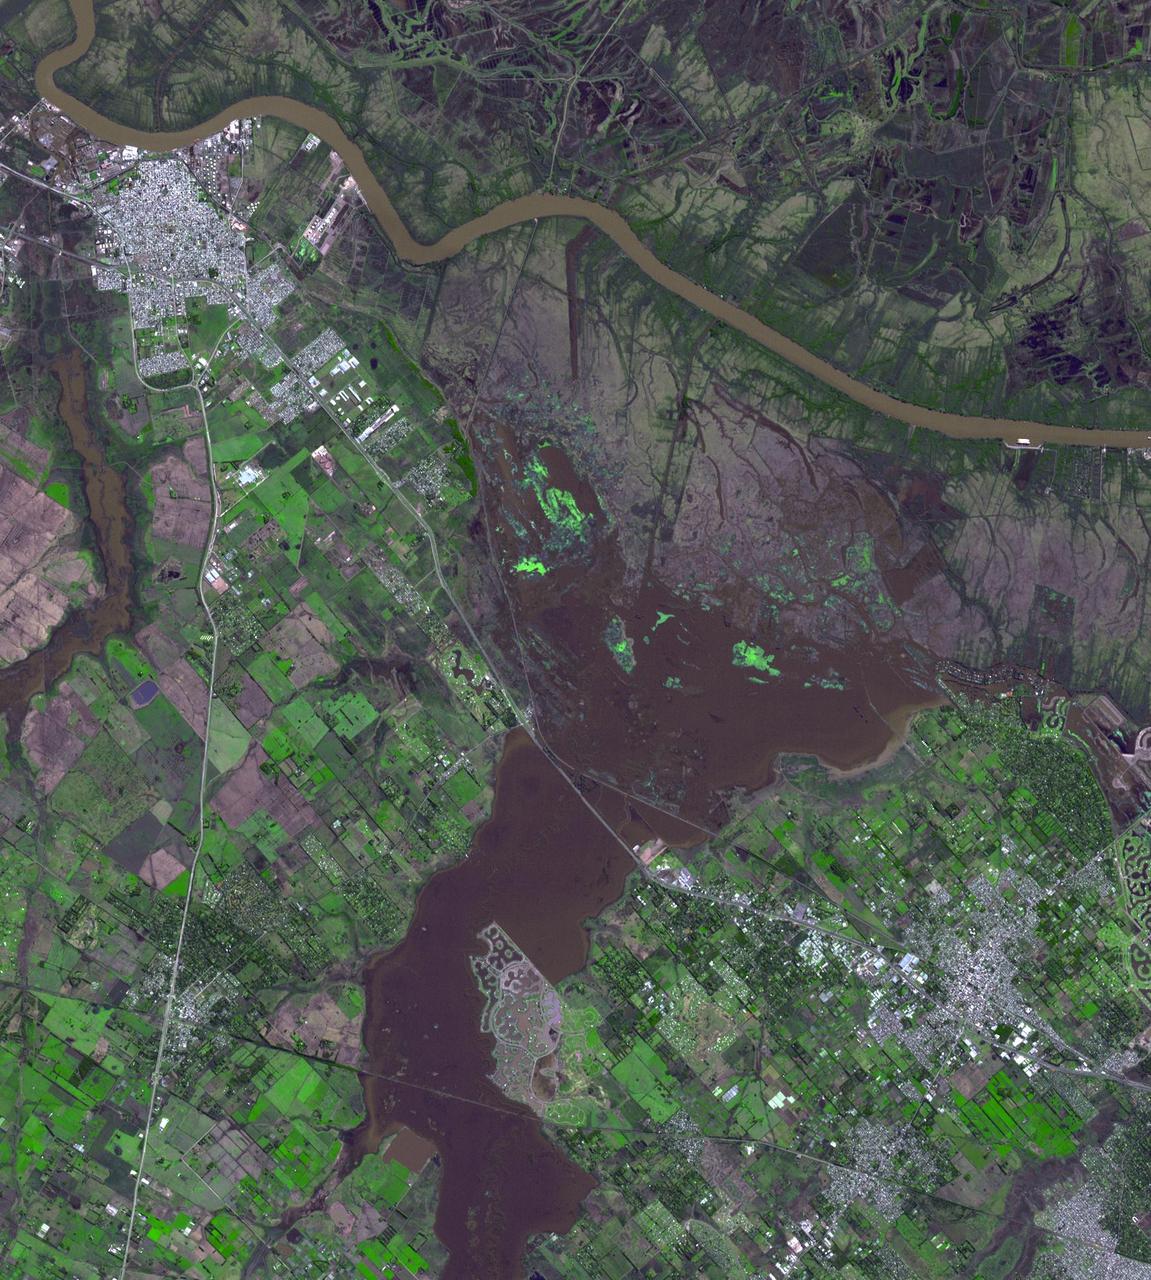
Northwest of Buenos Aires, Argentina, seven straight days of torrential rains of up to 16 inches 40 centimeters in August 2015 resulted in flooding between the cities of Escobar and Campana as seen by NASA Terra spacecraft. The flooding has since eased, allowing some evacuated residents of the 39 affected municipalities to return to their homes. The flooding was captured in this satellite image acquired Aug. 16, 2015, by the Advanced Spaceborne Thermal Emission and Reflection Radiometer (ASTER) instrument on NASA's Terra spacecraft. The image covers an area of 16.7 by 17.4 miles (26.9 by 28 kilometers), and is located at 34.2 degrees south, 58.6 degrees west. http://photojournal.jpl.nasa.gov/catalog/PIA19871
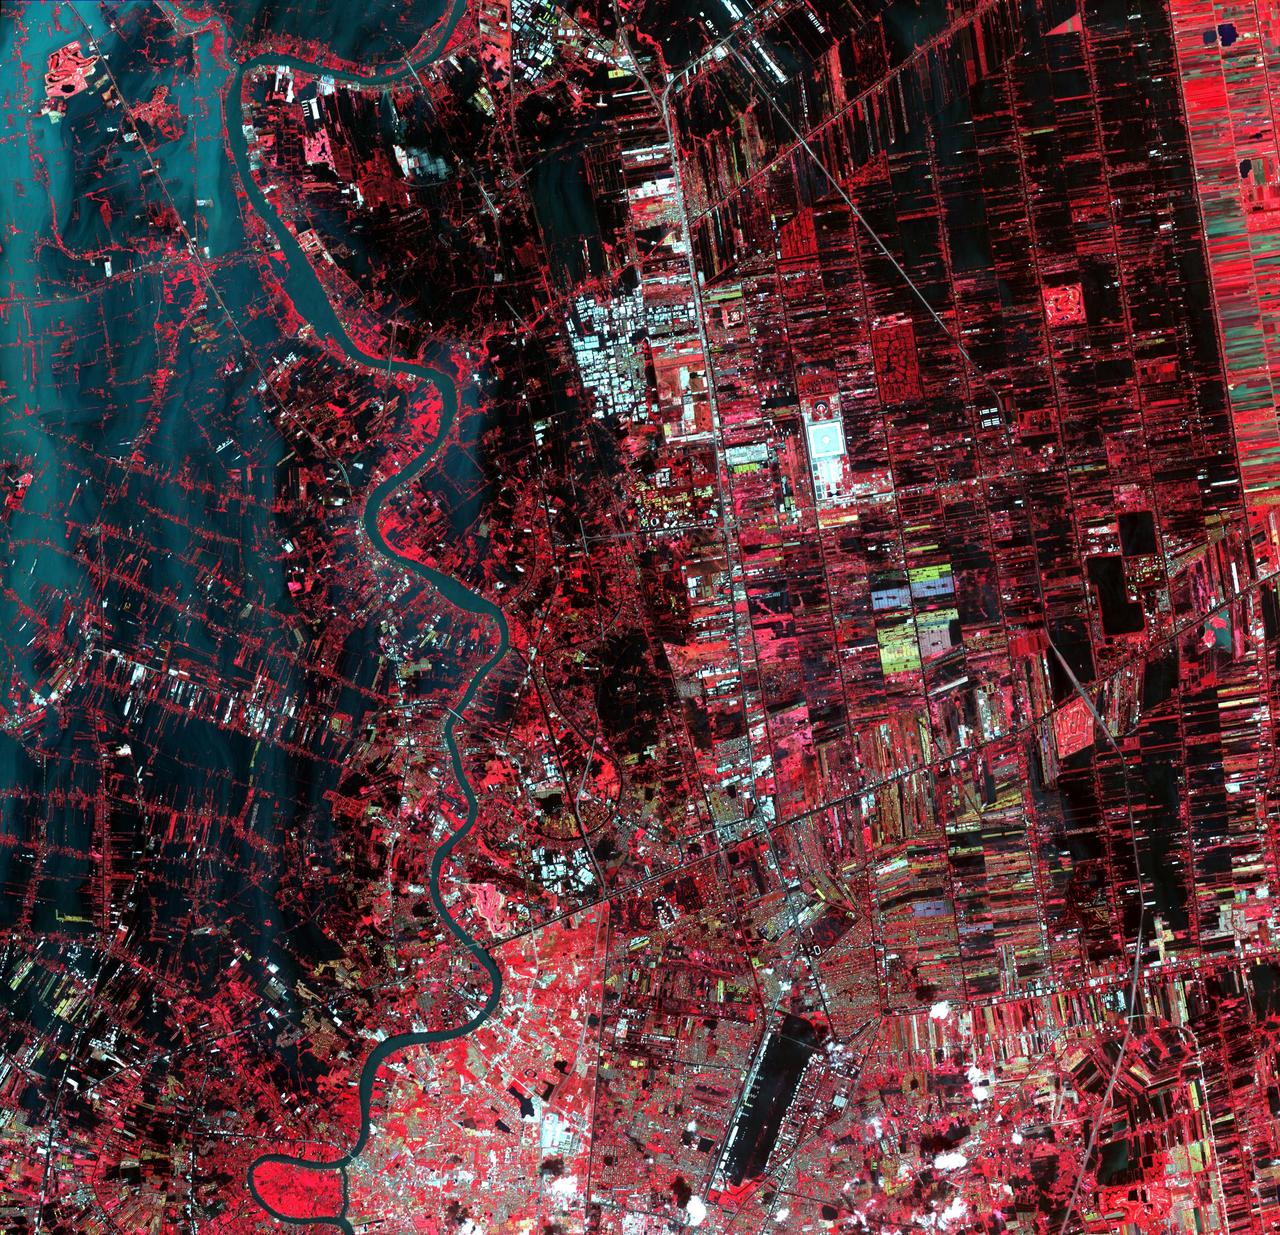
Flooding from the Chao Phraya River, Thailand, had begun to ebb in this image acquired by NASA Terra spacecraft on Nov. 1, 2011. Here, in blue-gray is the muddy water that had overflowed the banks of the river, flooding agricultural fields and villages.
NASA Terra spacecraft shows the water flow after the U.S. Army Corps of Engineers opened the Morganza Spillway, a flood control structure along the western bank of the Mississippi River in Louisiana, to ease flooding along levee systems on May 14, 2011.
NASA Terra spacecraft captured this view of severe flooding in La Plata, Argentina, on April 4, 2013. Torrential rains and record flash flooding has killed more than 50 and left thousands homeless, according to news reports.
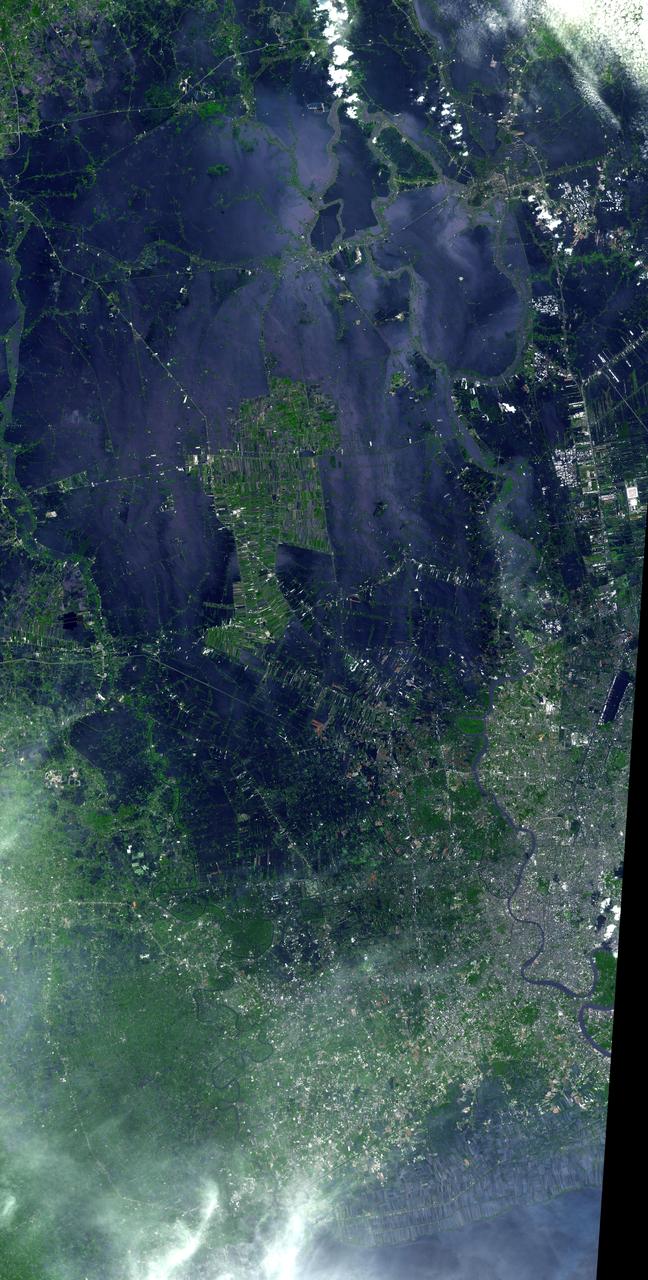
NASA Terra spacecraft acquired this image of flooding from the Chao Phraya River, Thailand on Nov. 8, 2011. The muddy water that had overflowed the banks of the river, flooding agricultural fields and villages, is seen in dark blue and blue-gray.

This image from NASA Aqua spacecraft shows how surface emissivity -- how efficiently Earth surface radiates heat -- changed in several regions of Pakistan over a 32-day period between July 11 pre-flood and August 12 post-flood.
NASA Terra spacecraft acquired this image on April 30, 2011, showing flooding along the Mississippi River at its junction with the Des Moines River near Keokuk, Iowa.
On Jan. 7, 2011, NASA Terra spacecraft captured this image of the inundated city of Rockhampton, Queensland, Australia. Torrential rains in NE Australia caused the Fitzroy River to overflow its banks and flood much of the city.
The floor of the crater in this NASA Mars Odyssey image displays interesting textures and it appears to have been flooded by some type of material. It is unclear if this material was fluvially emplaced mud hyperconcentrated flows or lava.
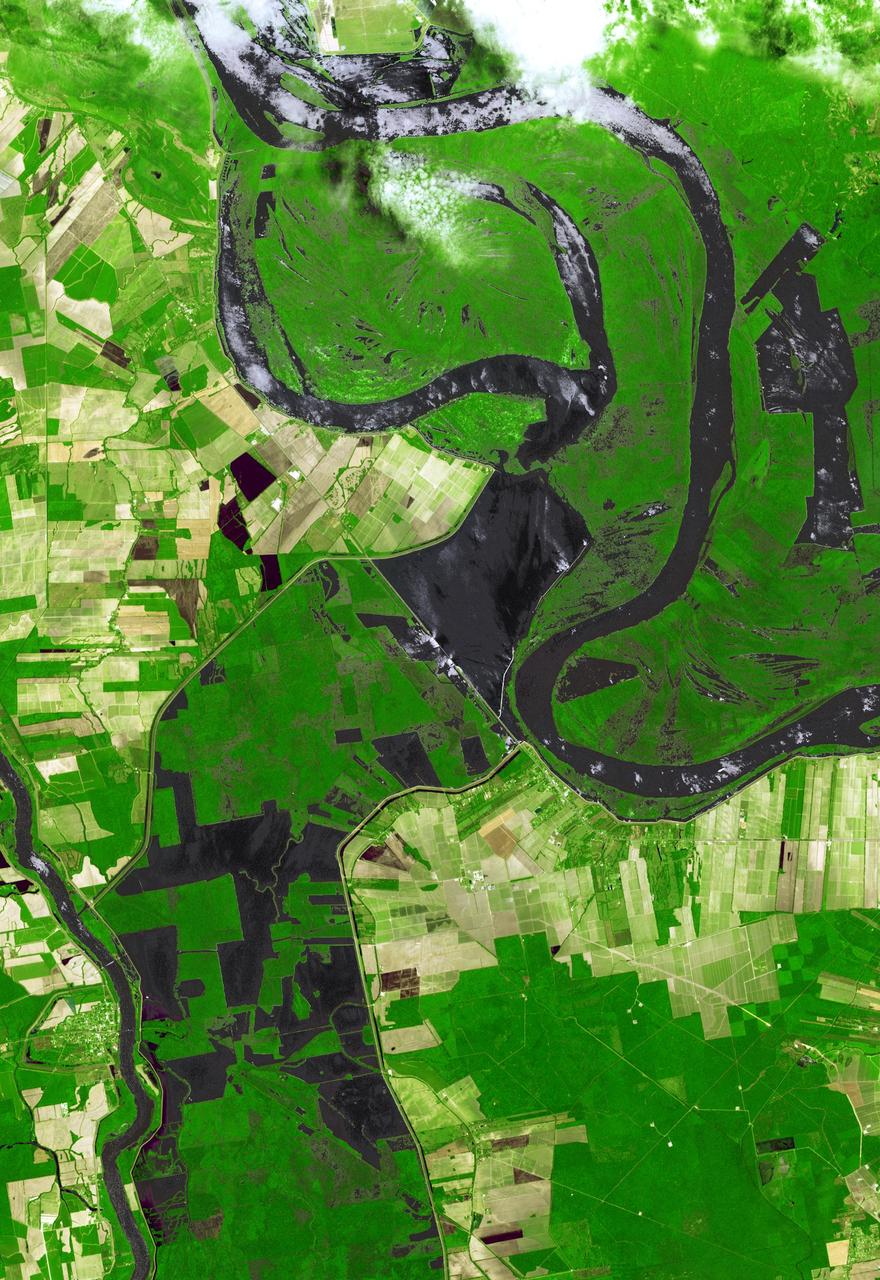
This image, acquired by NASA Terra satellite on July 6, 2013, shows heavy rains, which began in mid-June, resulting in major flooding along the Parana River in Argentina.
In mid-November 2013, extratropical cyclone Cleopatra brought devastating flooding to the Italian island of Sardinia as shown by the COSMO-SkyMed satellite.
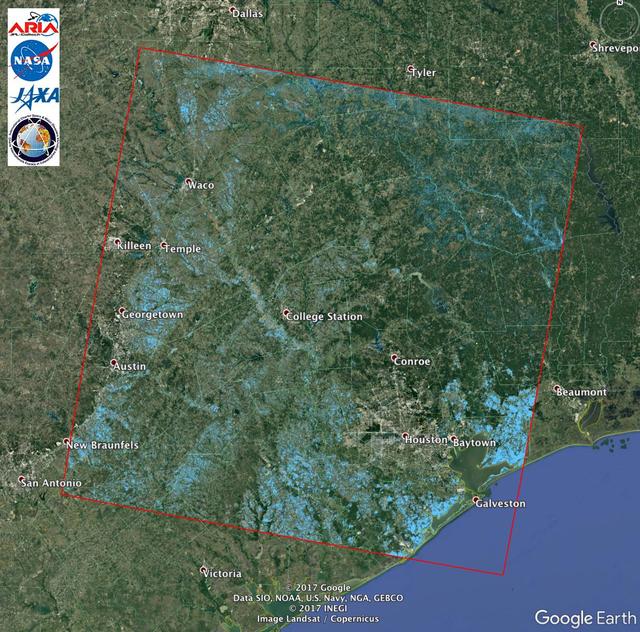
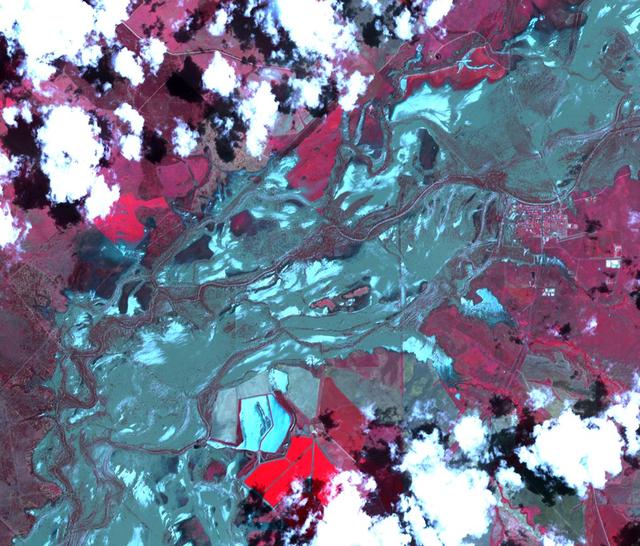
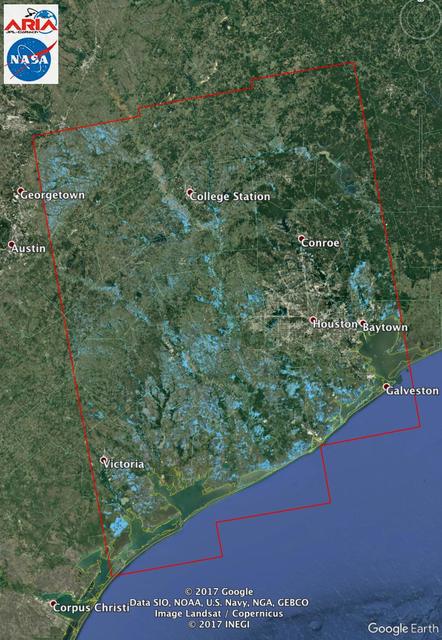
The Advanced Rapid Imaging and Analysis (ARIA) team at NASA's Jet Propulsion Laboratory in Pasadena, California, created this Flood Proxy Map depicting areas of Southeastern Texas that are likely flooded as a result of Hurricane Harvey, shown by light blue pixels. The map is derived from synthetic aperture radar amplitude images from the Japan Aerospace Exploration Agency's (JAXA) ALOS-2 PALSAR-2 satellite, taken before (July 30, 2017) and after (August 27, 2017) Hurricane Harvey made landfall. The map covers an area of 135 square miles (350 square kilometers). Each pixel measures about 538 square feet (50 square meters). Local ground observations provided anecdotal preliminary validation. This flood proxy map should be used as guidance to identify areas that are likely flooded, and may be less reliable over urban areas. ALOS-2 data were accessed through the International Charter. https://photojournal.jpl.nasa.gov/catalog/PIA21928
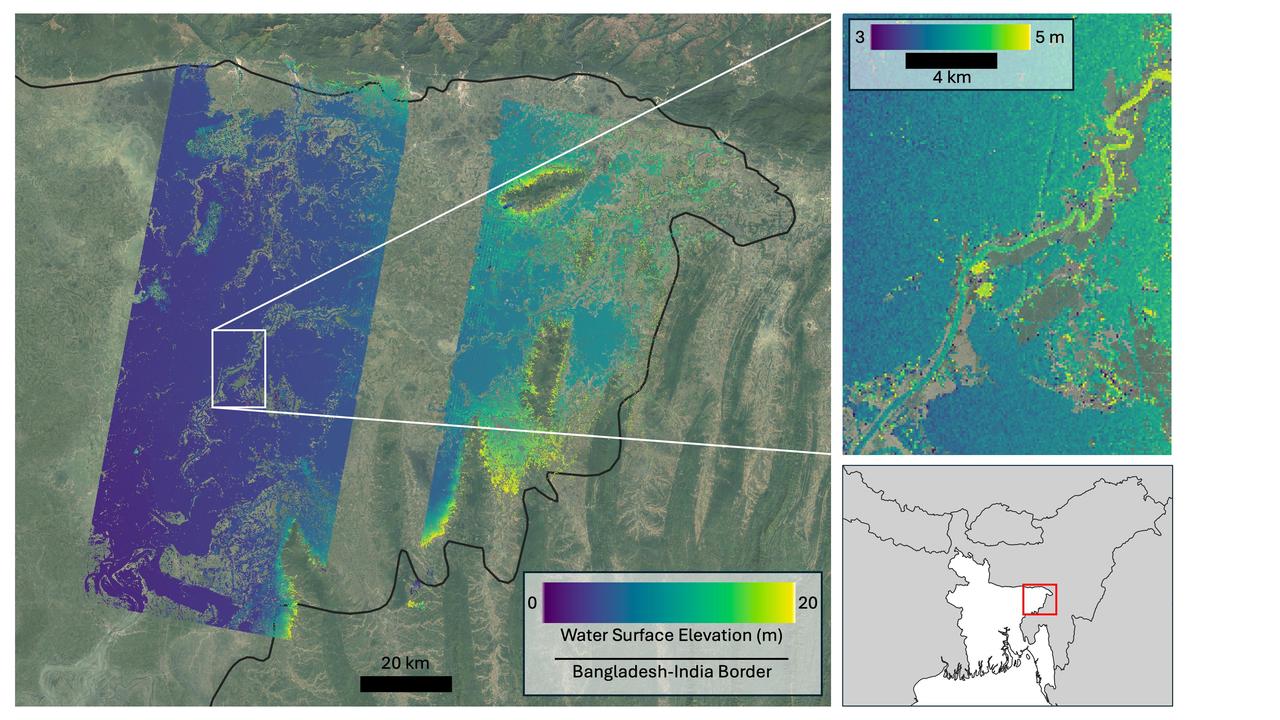
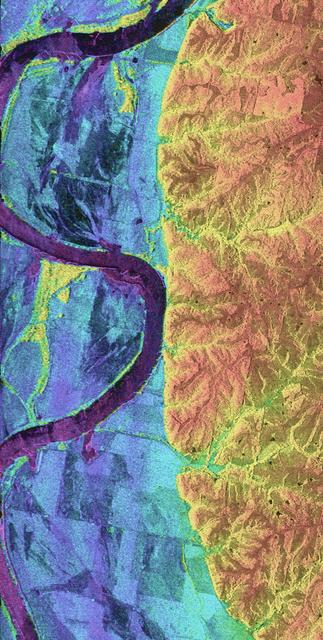
Flooding from monsoon rains covers a wide region of northeast Bangladesh near the India border in this Oct. 8, 2023, image showing data from the U.S.-French Surface Water and Ocean Topography (SWOT) satellite. Around that time, heavy monsoon rains affected various parts of Bangladesh, including the region depicted here, home to Sylhet, the country's fifth-largest city (population approximately 700,000). Sylhet and surrounding areas experienced substantial flooding. The SWOT data, overlaid on a standard Google Earth image, shows the precise surface elevation of the floodwaters. The vast majority of the land area within the region imaged by SWOT is flooded. In the main image at left, dark blue indicates waters just above sea level, while yellow represents 65 feet (20 meters) above sea level. The inset at top right zooms in on a section of the Kalni River, a tributary of one of Bangladesh's three major rivers, the Meghna. The main channel of the Kalni is about 650 feet (200 meters) wide. In the inset at top right, dark blue indicates water about 10 feet (3 meters) above sea level and yellow is used for waters about 16 feet (5 meters) above sea level. The zoomed-in data can be used to determine the slope of the river, which tells hydrologists how fast water flows through it and off a landscape. The water surface elevations depicted are higher in the top right of the inset than they are in the bottom left. The data also shows the elevation of the river is generally greater than that of water in the floodplain around it, telling hydrologists that water is likely flowing from the river into the floodplain. Each pixel in the image represents an area that is about 330 feet by 330 feet (100 meters by 100 meters). The image shows data from SWOT's Ka-band Radar Interferometer (KaRIn) instrument antennas, which don't cover a 12-mile-wide (20-kilometer-wide) strip right underneath the satellite. For that gap, a separate instrument collects water surface elevation data that isn't shown here. Bangladesh is a low-lying, generally flat country that chronically suffers from two types of flooding. Monsoon rains cause rivers that flow into Bangladesh from neighboring countries, especially India, to flood. And flash flooding occurs during the pre-monsoon season and can damage agricultural crops if not forecast with sufficient warning. While the use of satellite altimetry and precipitation in models has shown some promise for flood forecasting in Bangladesh, forecasting both types of flooding with sufficient lead time has remained challenging due to a lack of timely, high-spatial-resolution information on water elevation. SWOT is the first satellite to provide this information over entire regions, enabling improved forecasts and filling the data gap when places like Bangladesh become inundated. The Bangladesh Water Development Board, which is in charge of national flood forecasting and management, is now exploring how to incorporate SWOT water elevation information into its flood inundation forecasting system. Since shortly after launch in December 2022, SWOT has been measuring the height of nearly all water on Earth's surface, developing one of the most detailed, comprehensive views yet of the planet's oceans and freshwater lakes and rivers. The mission science team makes measurements using the KaRIn instrument. With two antennas spread 33 feet (10 meters) apart on a boom, KaRIn produces a pair of data swaths as it circles the globe, bouncing radar pulses off water surfaces to collect surface-height information. https://photojournal.jpl.nasa.gov/catalog/PIA26343
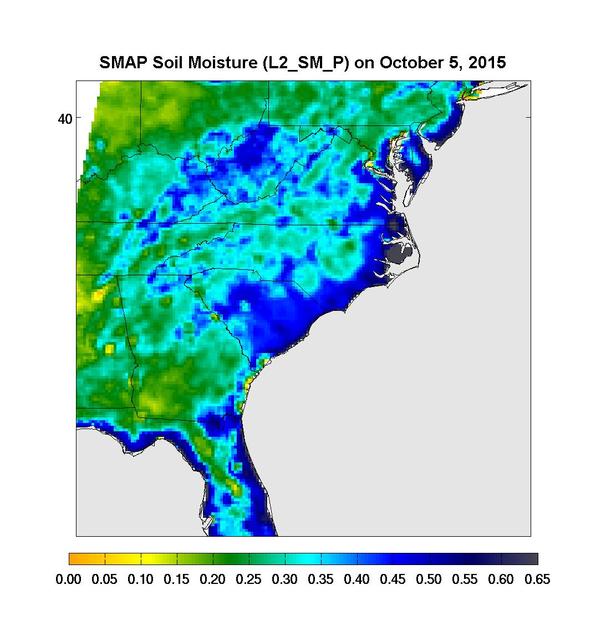
Surface soil moisture in the Southeastern United States as retrieved from NASA's Soil Moisture Active Passive (SMAP) satellite observatory at around 6 a.m. on Oct. 5, 2015. Large parts of South Carolina appear blue, representing the impact of heavy localized rains and flooding. Regions in blue indicate areas with saturated soil conditions and possible standing water. Large-scale flooding was experienced all over South Carolina on Oct. 5-6, 2015. As of Oct. 7, 17 deaths had been attributed to these floods, with heavy economic losses. In some regions, the intensity of these floods was described as a 1,000-year storm (1-in-1,000 chance of happening in any given year). At least 14 dams have already failed as a result of these floods. http://photojournal.jpl.nasa.gov/catalog/PIA20001
This image, acquired by NASA Terra spacecraft, shows Fiji, hard hit by heavy rains in early 2012, causing flooding and landslides. Hardest hit was the western part of the main Island of Viti Levu, Fiji, and the principal city of Nadi.
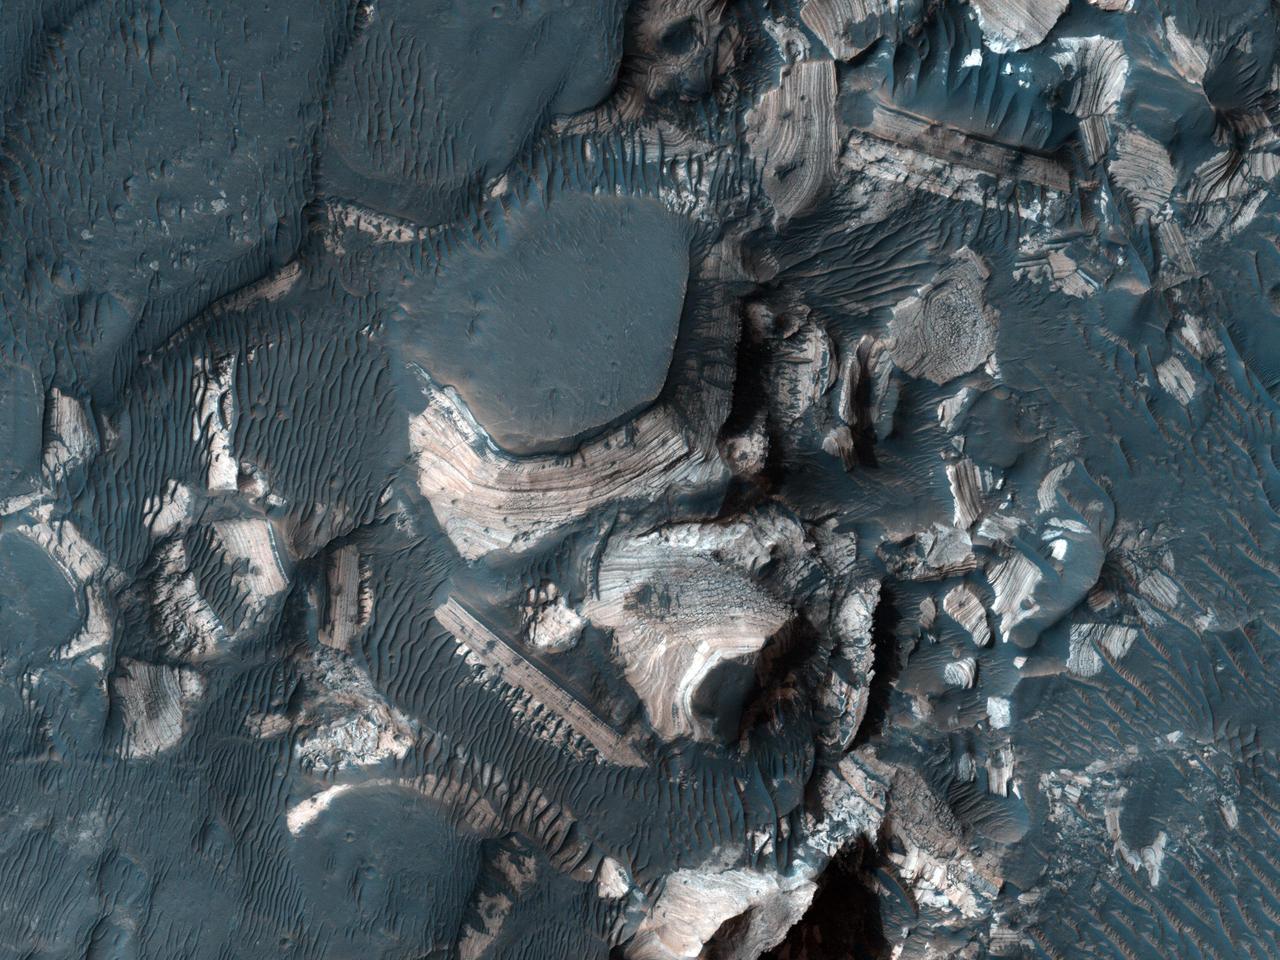
This image from NASA Mars Reconnaissance Orbiter shows blocks of bright, layered rock embedded in darker material that are thought to have been deposited by a giant flood that occurred when Uzboi Valles breached the rim of Holden Crater.
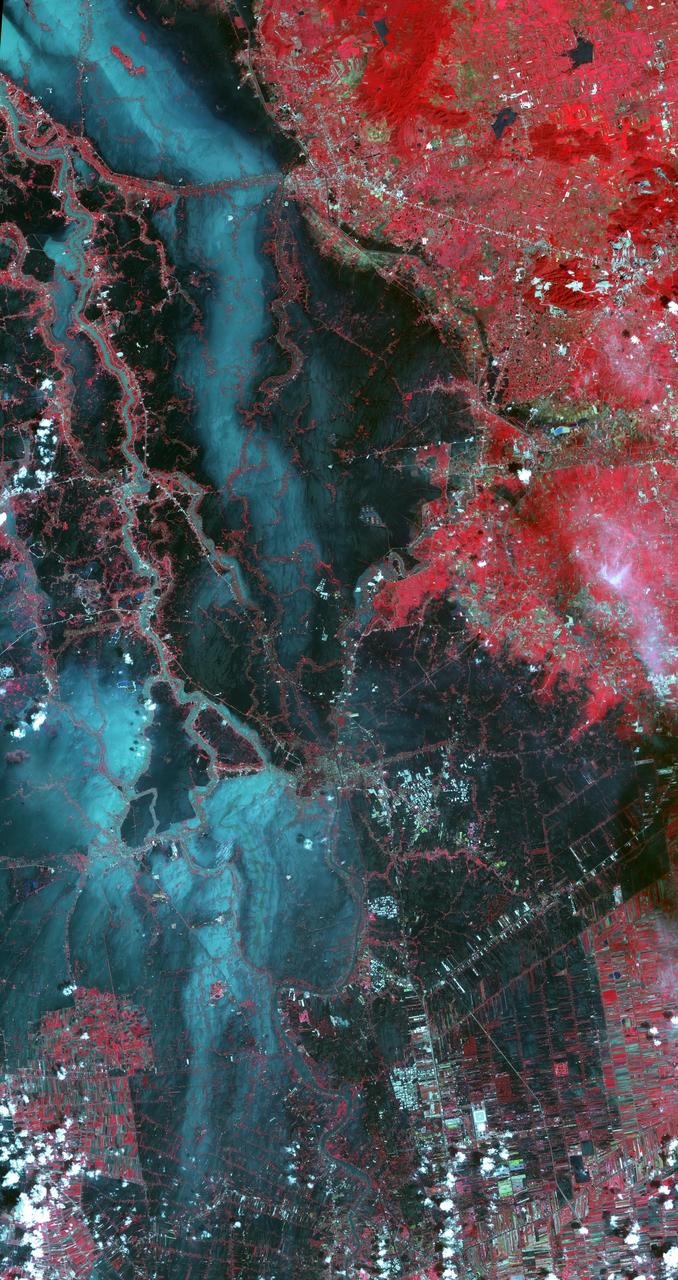
On Sept. 3, 2010, when NASA Terra spacecraft captured this image strip over the Indus River in Pakistan, severe flooding was still causing a major humanitarian crisis in Pakistan. The city of Hyderabad is near the middle of the image.
On Jan. 14, 2011, NASA Terra spacecraft captured this image of the inundated city of St. George, Queensland, Australia. Torrential rains in northeastern Australia caused the Balonne River to overflow its banks and flood much of the city.
This image acquired by NASA Terra spacecraft shows unusually heavy rains over the upper Mekong River in Laos and Thailand that led to severe flooding in Cambodia in mid-August 2011. The city of Phnom Penh is at the bottom center of the image.
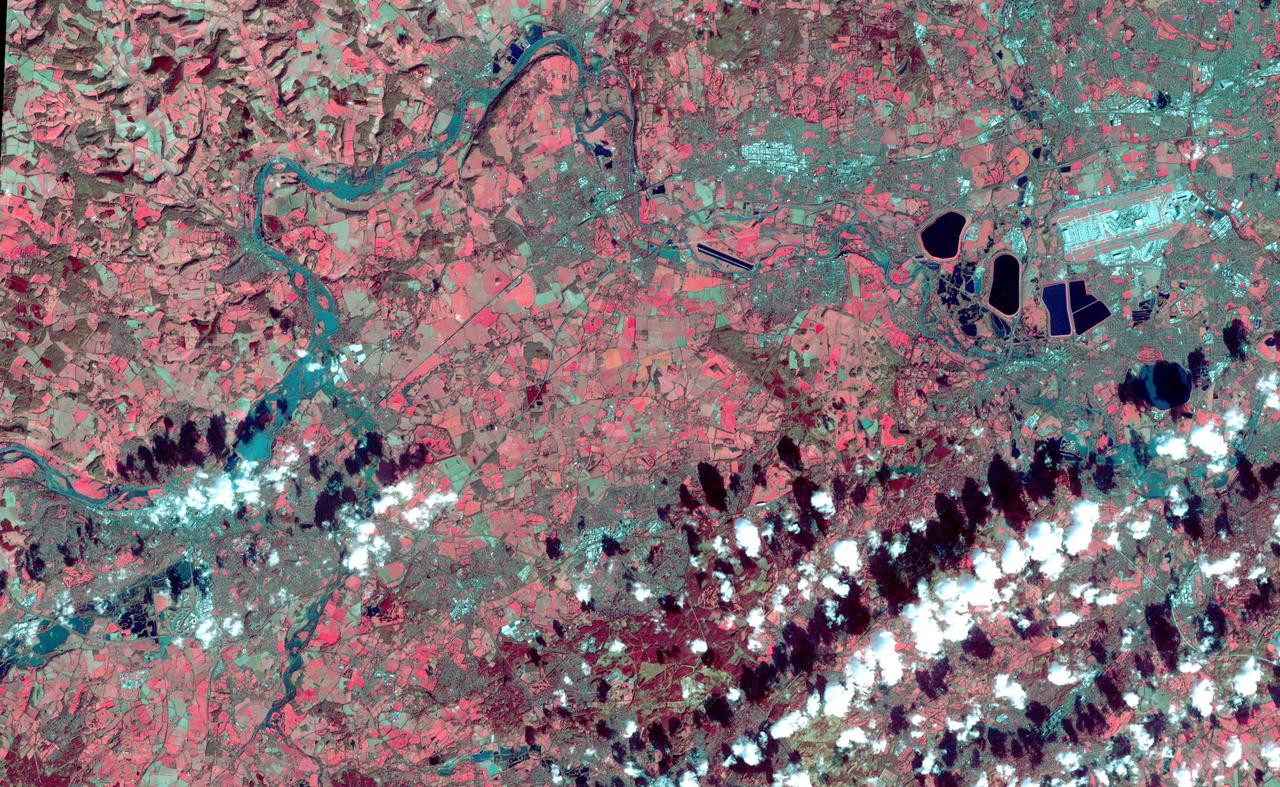
This image acquired by NASA Terra spacecraft depicts the high water levels and flooding along the Thames River west of London as record-breaking rains covered the United Kingdom in January and February.
In May 2014, historic floods inundated Serbia and neighboring countries, causing major population displacements and property destruction. This image was acquired by NASA Terra spacecraft.
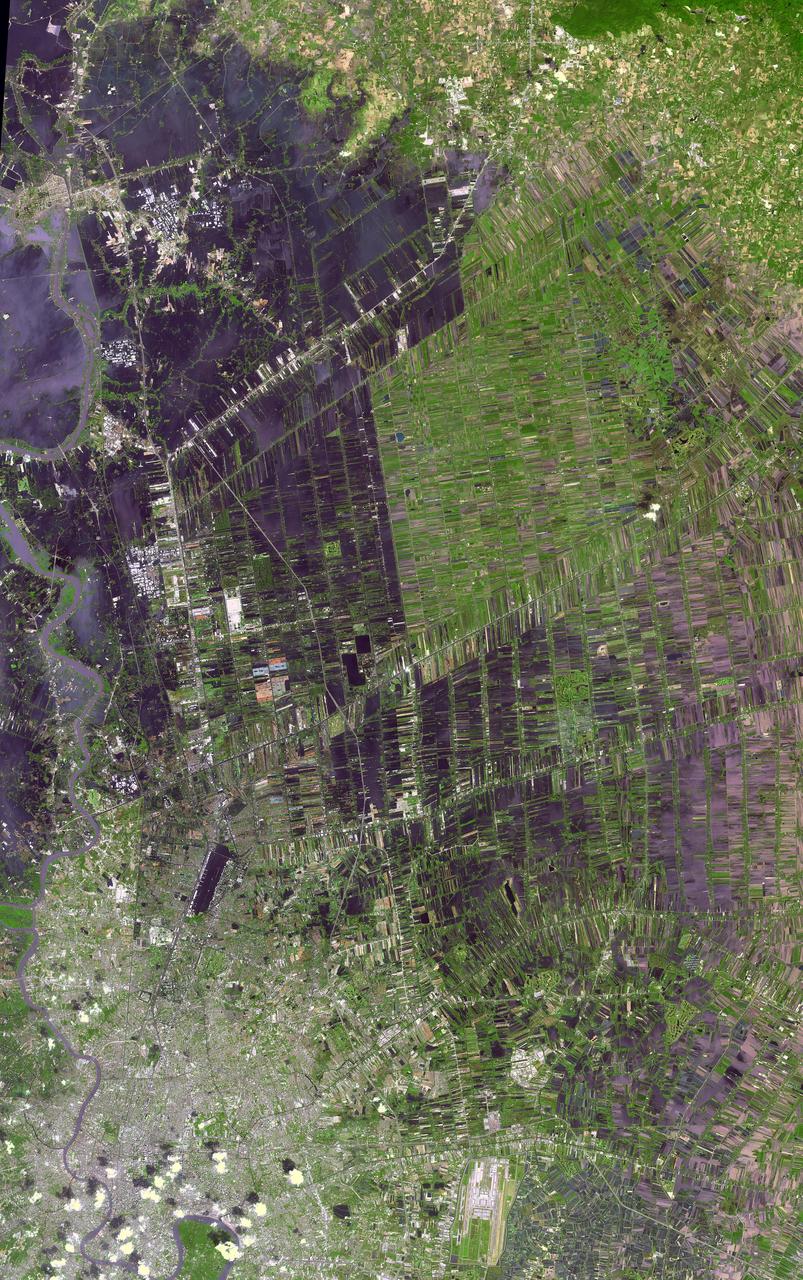
The flooding from the Chao Phraya River, Thailand, was draining slowly when this image was acquired on Nov. 17, 2011, by NASA Terra spacecraft.
On Sept. 3, 2010, NASA Terra spacecraft captured this image strip over the Indus River, Pakistan, where severe flooding caused a major humanitarian crisis.
The mighty Mississippi River, from its source at Lake Itasca, Minnesota to the Gulf of Mexico, is approximately 3780 kilometers long and has flooded many times during its history. NASA Terra satellite acquired these images one month apart in 2001.
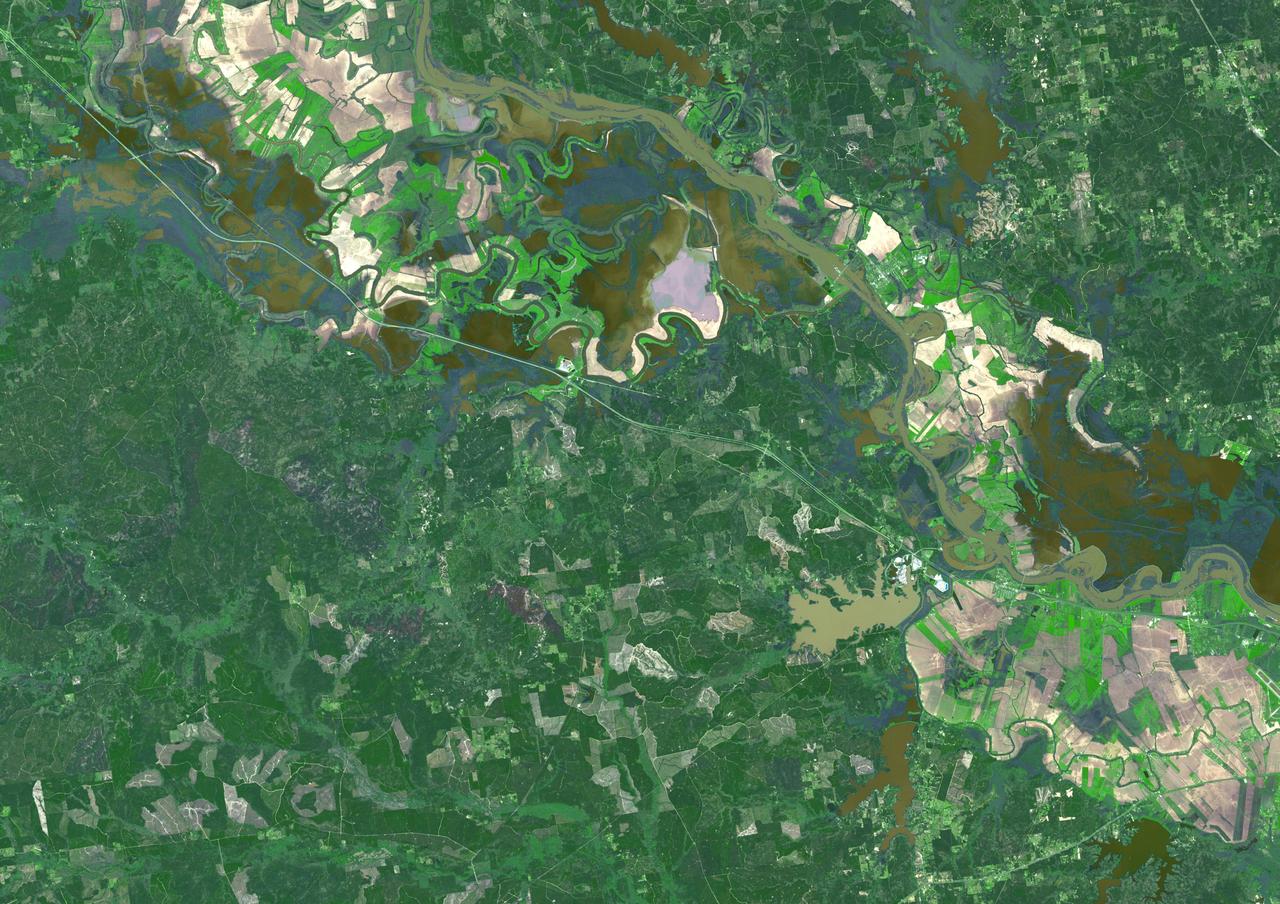
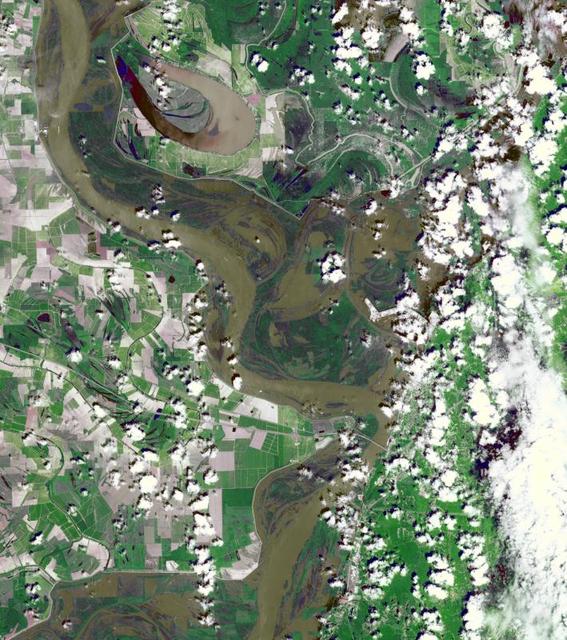
Torrential rains in the mid-South of the United States in mid-March 2016 produced flooding throughout Texas, Louisiana and Mississippi. On March 21, 2016, the Advanced Spaceborne Thermal Emission and Reflection Radiometer (ASTER) instrument on NASA's Terra spacecraft acquired this image showing persistent flooding along the Mississippi River between the Louisiana cities of Alexandria and Natchitoches. The image covers an area of 25 to 36 miles (41 by 58 kilometers), and is located at 31.5 degrees north, 92.8 degrees west. http://photojournal.jpl.nasa.gov/catalog/PIA20533
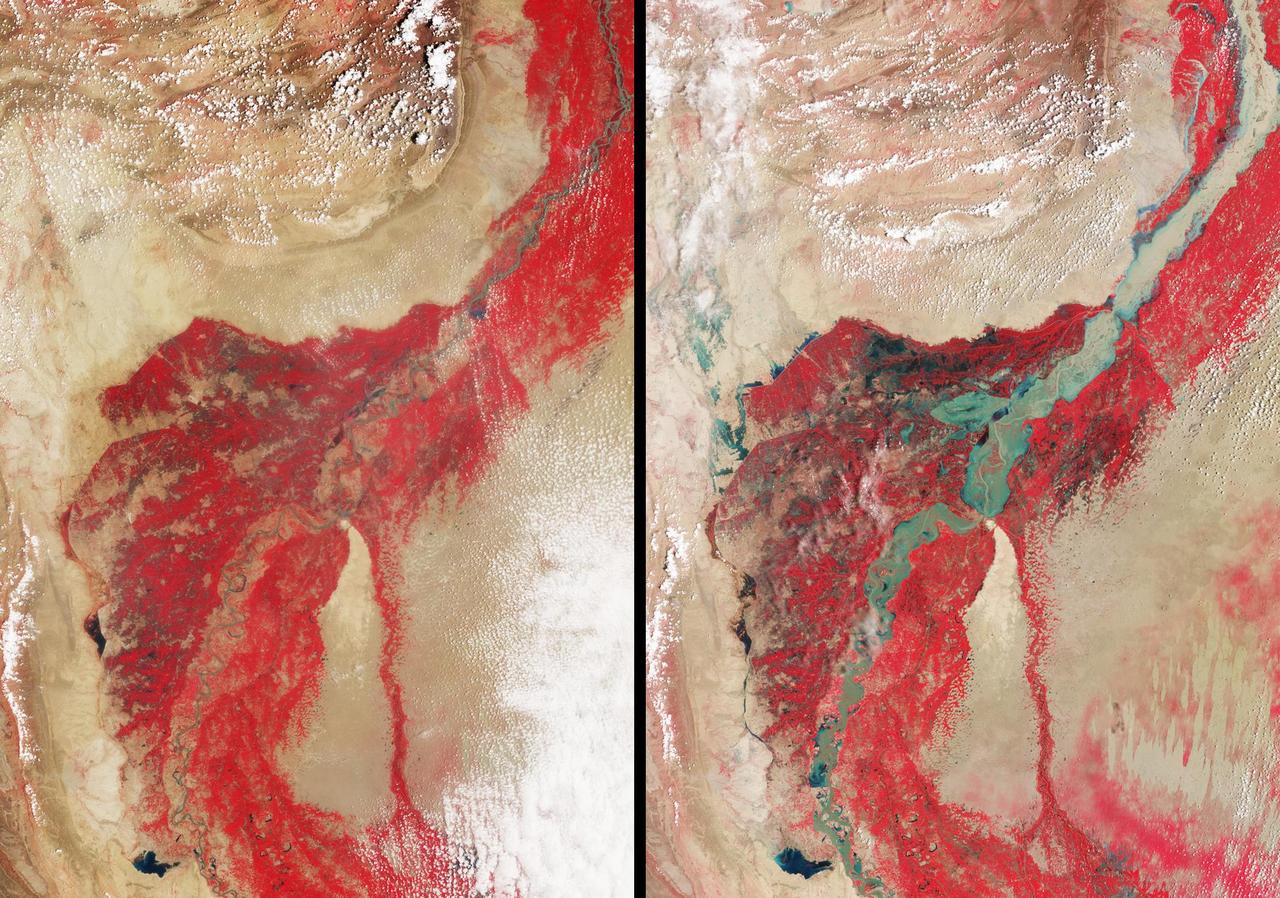
In late July 2010, flooding caused by heavy monsoon rains began in several regions of Pakistan, including the Khyber Pakhtunkhwa, Sindh, Punjab and parts of Baluchistan. This image was acquired by NASA Terra spacecraft on August 11, 2010.
On Jan. 18, 2011, NASA Terra spacecraft captured this 3-D perspective image of the city of Nova Friburgo, Brazil. A week of torrential rains triggered a series of deadly mudslides and floods. More details about this image at the Photojournal.
On Oct. 23, 2011, when this image from NASA Terra spacecraft was acquired, flood waters were approaching the capital city of Bangkok as the Ayutthaya River overflowed its banks.
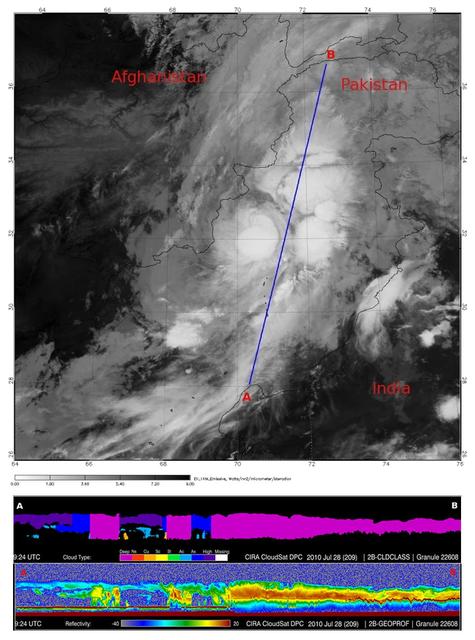
In late July 2010, flooding caused by heavy monsoon rains began in several regions of Pakistan. This image from NASA Aqua spacecraft reveals the bright white cloud tops from the cluster of thunderstorms.
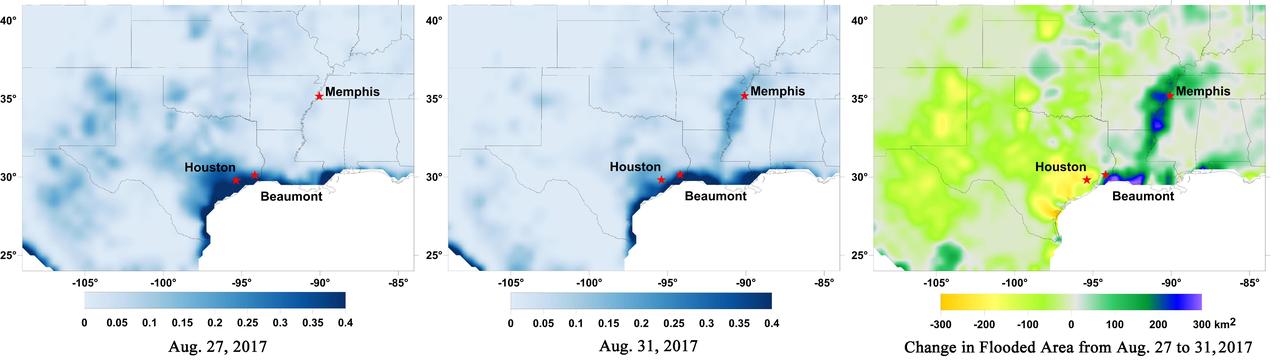
Data from NASA's Soil Moisture Active Passive (SMAP) satellite have been used to create new surface flooding maps of Southeast Texas and the Tennessee Valley following Hurricane Harvey. The SMAP observations detect the proportional cover of surface water within the satellite sensor's field of view. This sequence of images shows changes in the extent of surface flooding from successive five-day SMAP observation composite images. Widespread flooding can be seen in the Houston metropolitan area on Aug. 27 following record rainfall from the Category 4 hurricane, which made landfall on Aug. 25th, 2017 (left image). Flood waters around Houston had substantially receded by Aug. 31 (middle image), while flooding had increased across Louisiana, eastern Arkansas, and western Tennessee as then Tropical Storm Harvey passed over the area. The far right image shows the change in flooded area between Aug. 27 and Aug. 31, with regions showing the most flooding recession depicted in yellow and orange shades and those where flooding had increased depicted in blue shades. The SMAP satellite has a low-frequency (L-band) microwave radiometer with enhanced capabilities for detecting surface water changes in nearly all weather conditions and under low-to-moderate vegetation cover. SMAP provides global coverage with one-to-three-day repeat sampling that is well suited for global monitoring of inland surface water cover dynamics. https://photojournal.jpl.nasa.gov/catalog/PIA21951
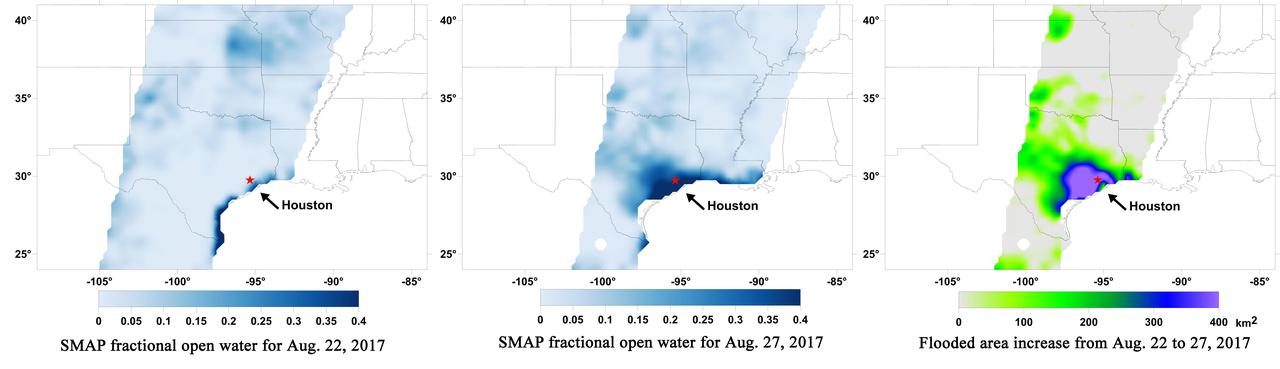
A new series of images generated with data from NASA's Soil Moisture Active Passive (SMAP) satellite illustrate the surface flooding caused by Hurricane Harvey from before its initial landfall through August 27, 2017. The SMAP observations detect the proportion of the ground covered by surface water within the satellite's field of view. The sequence of images depicts successive satellite orbital swath observations showing the surface water conditions on August 22, before Harvey's landfall (left), and then on Aug. 27, two days after landfall (middle). The resulting increase in surface flooding from record rainfall over the three-day period, shown at right, depicts regionally heavy flooding around the Houston metropolitan area. The hardest hit areas (blue and purple shades) cover more than 23,000 square miles (about 59,600 square kilometers) and indicate a more than 1,000-fold increase in surface water cover from rainfall-driven flooding. SMAP's low-frequency (L-band) microwave radiometer features enhanced capabilities for detecting surface water changes in nearly all weather conditions and under low-to-moderate vegetation cover. The satellite provides global coverage with one to three-day repeat sampling, which is well suited for monitoring dynamic inland waters around the world. https://photojournal.jpl.nasa.gov/catalog/PIA21930
On Jan. 21, 2011, the NASA Terra spacecraft captured this image of the flooding along the Balonne River and the town of Surat in southeastern Queensland, Australia.
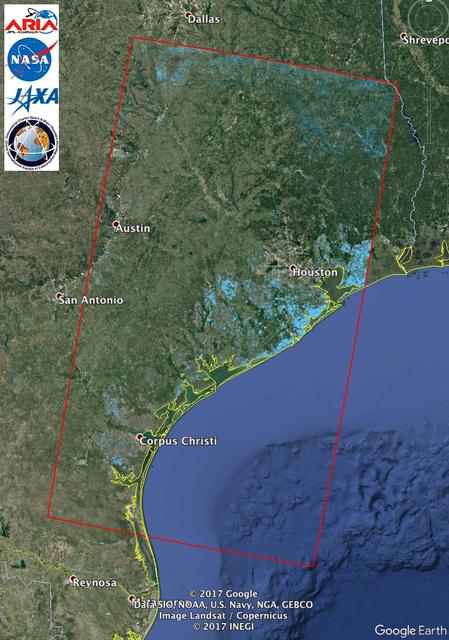
The Advanced Rapid Imaging and Analysis (ARIA) team at NASA's Jet Propulsion Laboratory in Pasadena, California, used synthetic aperture radar imagery from the Japan Aerospace Exploration Agency's (JAXA) ALOS-2 satellite to create this Flood Proxy Map depicting areas of Southeastern Texas that are likely flooded as a result of Hurricane Harvey (shown by light blue pixels). The map is derived images taken before (July 30, 2017) and after (Aug. 27, 2017) Hurricane Harvey made landfall. The map covers an area of 220 by 400 miles (350 by 640 kilometers). Each pixel measures about 55 yards (50 meters) across. Local ground observations provided anecdotal preliminary validation. The results are also cross-validated with ARIA Sentinel-1 flood proxy map v0.2. The map should be used as guidance, and may be less reliable over urban areas. ALOS-2 data were accessed through the International Charter. https://photojournal.jpl.nasa.gov/catalog/PIA21931
The Advanced Rapid Imaging and Analysis (ARIA) team at NASA's Jet Propulsion Laboratory in Pasadena, California, used synthetic aperture radar imagery from the European Space Agency's (ESA) Sentinel-1 satellite to create this Flood Proxy Map of Southeastern Texas, showing areas that are likely flooded as a result of Hurricane Harvey (light blue pixels). The images used to create the map were taken before (Aug. 5, 2017) and after (Aug. 29, 2017) Hurricane Harvey made landfall. The map covers an area of 155 by 211 miles (250 by 340 kilometers). Each pixel measures about 33 yards (30 meters) across. Local ground observations provided anecdotal preliminary validation. The results were also cross-validated with the ARIA ALOS-2 flood proxy map v0.2. The map should be used as guidance, and may be less reliable over urban areas. Sentinel-1 data were accessed through the Copernicus Open Access Hub. Contains modified Copernicus Sentinel data 2017. https://photojournal.jpl.nasa.gov/catalog/PIA21932
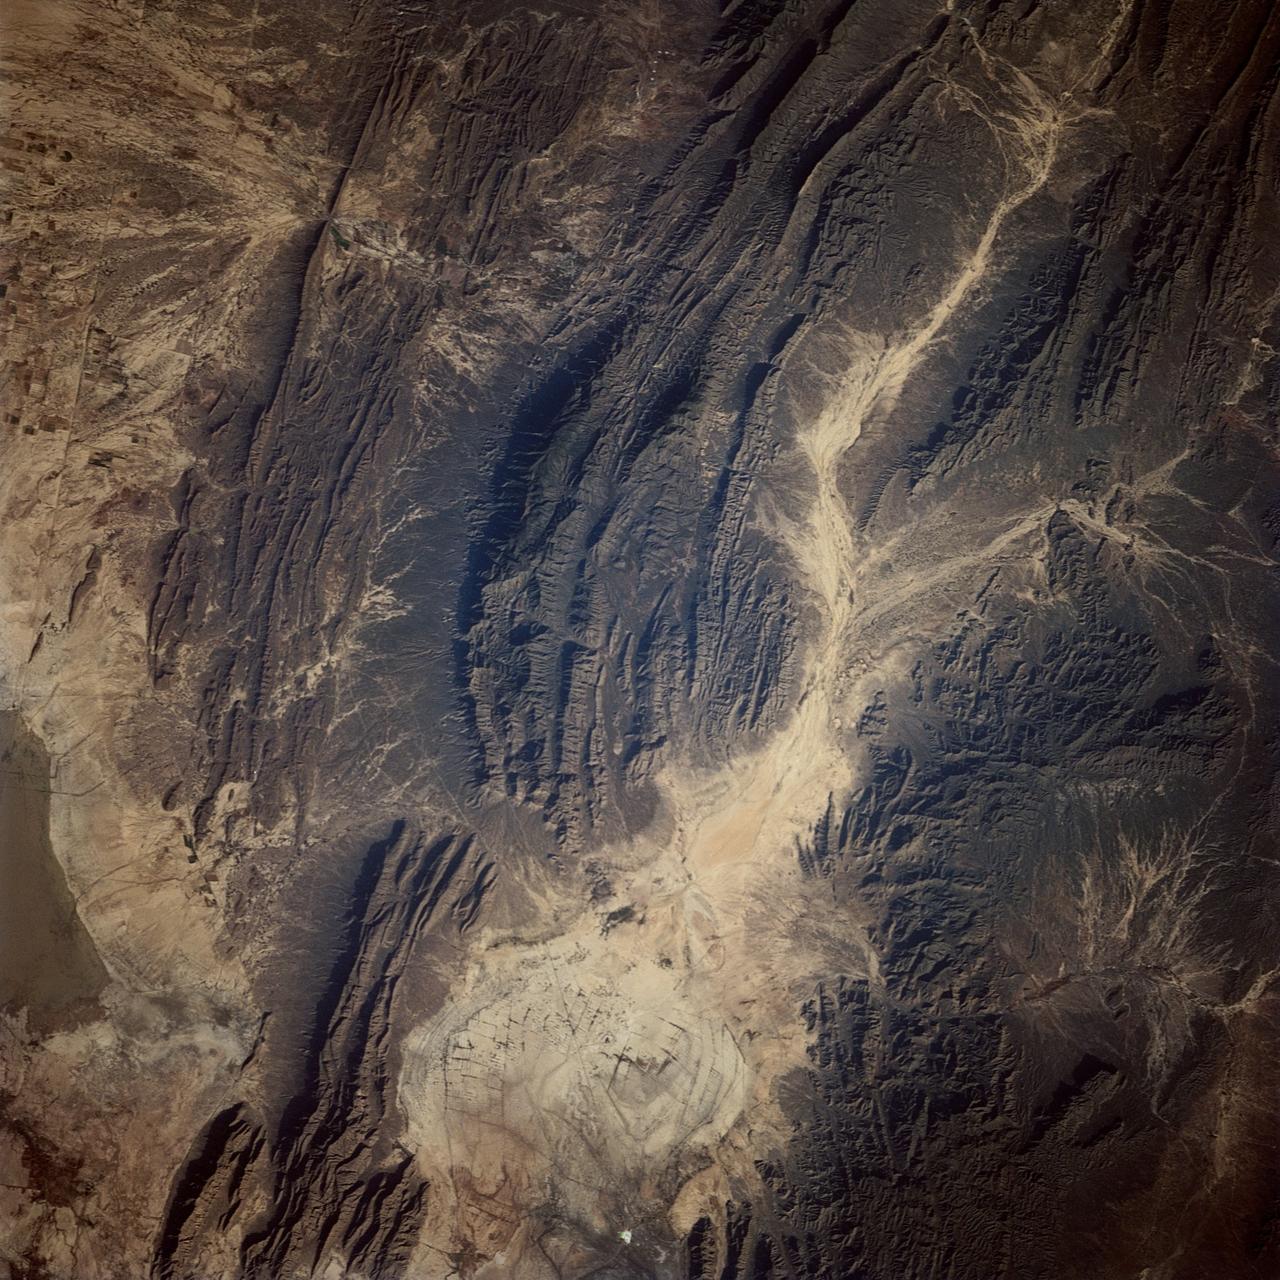
Evidence of a recent flash flood can be seen in the form of light brown sediment that flowed down gullies and mountain sides forming ponds of debris over agricultural areas in the broad valley near the town of Parras (26.5N, 102.5W). This part of Mexico has extensive vineyards, orchards and both dry land and irrigated agriculture. Based on the photo, it appears that flash flood waters damaged some 300 square miles of property in this area alone.
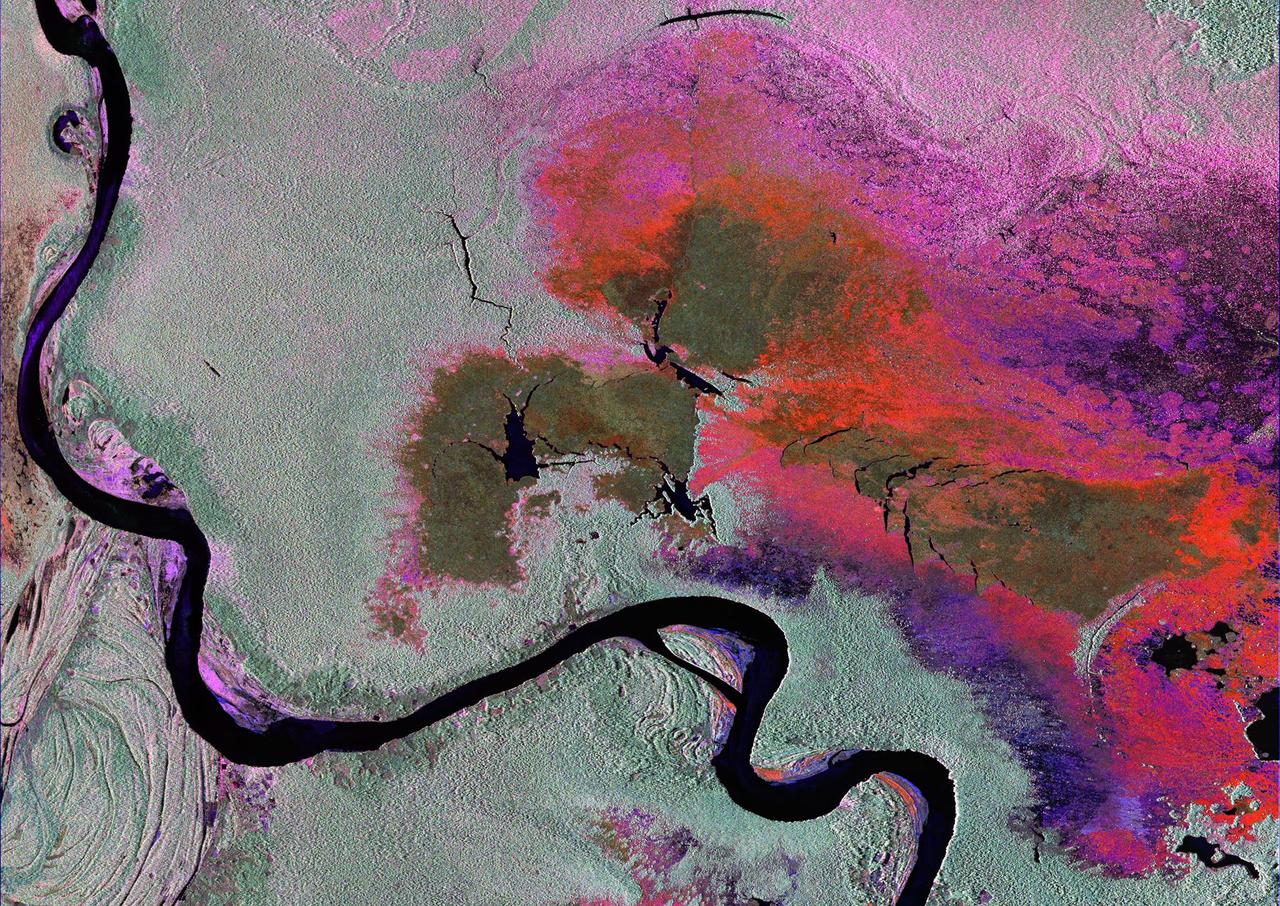
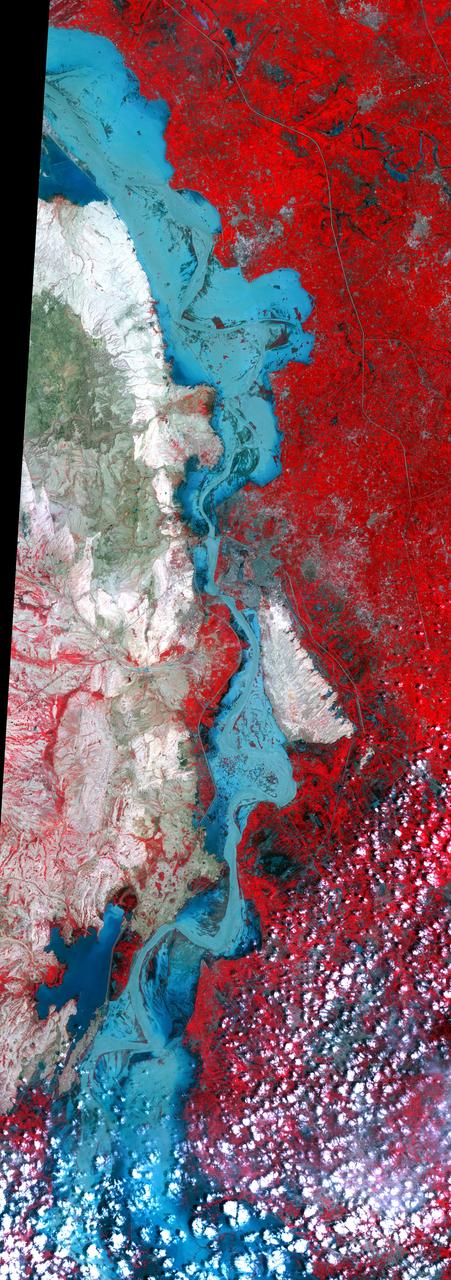
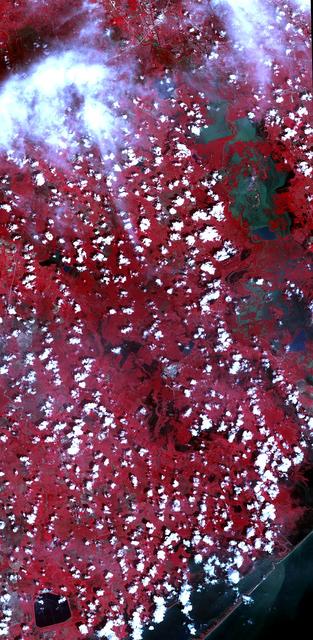
To show the kind of imagery that data from the NISAR (NASA-ISRO Synthetic Aperture Radar) satellite mission will be used to produce, researchers pointed to a 2013 image of flooding extent in the Pacaya-Samaria National Reserve that used data from the Uninhabited Aerial Vehicle Synthetic Aperture Radar (UAVSAR), an airborne system. In the image of this flood-prone area of the Amazonian jungle in Peru, black indicates open water, grayish-green is tropical forest, dark green is low-lying or floating vegetation, and red and pink are two different types of flooded vegetation. NISAR will offer detailed insights into the flooding patterns of the planet's wetland ecosystems, which will help researchers understand how these areas are being affected by climate change and human activity and the role they play in the global carbon cycle. NISAR is a joint mission of the U.S. and Indian space agencies. When in orbit, its sophisticated L- and S-band radar systems will scan nearly all of Earth's land and ice surfaces twice every 12 days with exquisite precision. Scheduled to launch in early 2024, NISAR is an equal collaboration between NASA and the Indian Space Research Organisation and marks the first time the two agencies have cooperated on hardware development for an Earth-observing mission. NASA's Jet Propulsion Laboratory, which is managed for the agency by Caltech in Pasadena, leads the U.S. component of the project and is providing the mission's L-band SAR. NASA is also providing the radar reflector antenna, the deployable boom, a high-rate communication subsystem for science data, GPS receivers, a solid-state recorder, and payload data subsystem. ISRO's U R Rao Satellite Centre in Bengaluru, which is leading the ISRO component of the mission, is providing the spacecraft bus, the S-band SAR electronics, the launch vehicle, and associated launch services and satellite mission operations. https://photojournal.jpl.nasa.gov/catalog/PIA26112
NASA Terra spacecraft shows the resultant flooding of farmland west of the Mississippi 20 miles south of the Mississippi River levee breach. U.S. Army Corps of Engineers detonated explosives at the Birds Point levee near Wyatt, Missouri, on May 2, 2011.
The torrential rains that lashed Texas in late May 2015 caused widespread flooding and devastation. Now that skies have partially cleared, evidence of the excessive water can still be seen in this image, acquired June 1, 2015 by the Advanced Spaceborne Thermal Emission and Reflection Radiometer (ASTER) instrument on NASA's Terra spacecraft. Located south of San Antonio, the Nueces River was one of many that overflowed its banks, sending water into adjacent fields and towns. The image covers an area of 23 by 13 miles (37 by 21 kilometers), and is located at 28.2 degrees north, 99 degrees west. http://photojournal.jpl.nasa.gov/catalog/PIA19681
Why does Fargo flood? The Red River of the North, which forms the border between North Dakota and Minnesota, has a long history of severe floods. Major floods include those of 1826, 1897, 1950, 1997, and now 2009.
On Sept. 5, 2017, the Advanced Spaceborne Thermal Emission and Reflection Radiometer (ASTER) instrument on NASA's Terra spacecraft captured this image of the area around Bay City, Texas, about 50 miles (80 kilometers) southwest of Houston. Hurricane Harvey caused extensive inland flooding, seen as dark blue areas where the water is relatively clear, and green-grey where the water carries sediment. The image covers an area of 32 by 65 miles (52 by 105 kilometers), and is centered at 29.2 degrees north, 95.8 degrees west. https://photojournal.jpl.nasa.gov/catalog/PIA21940
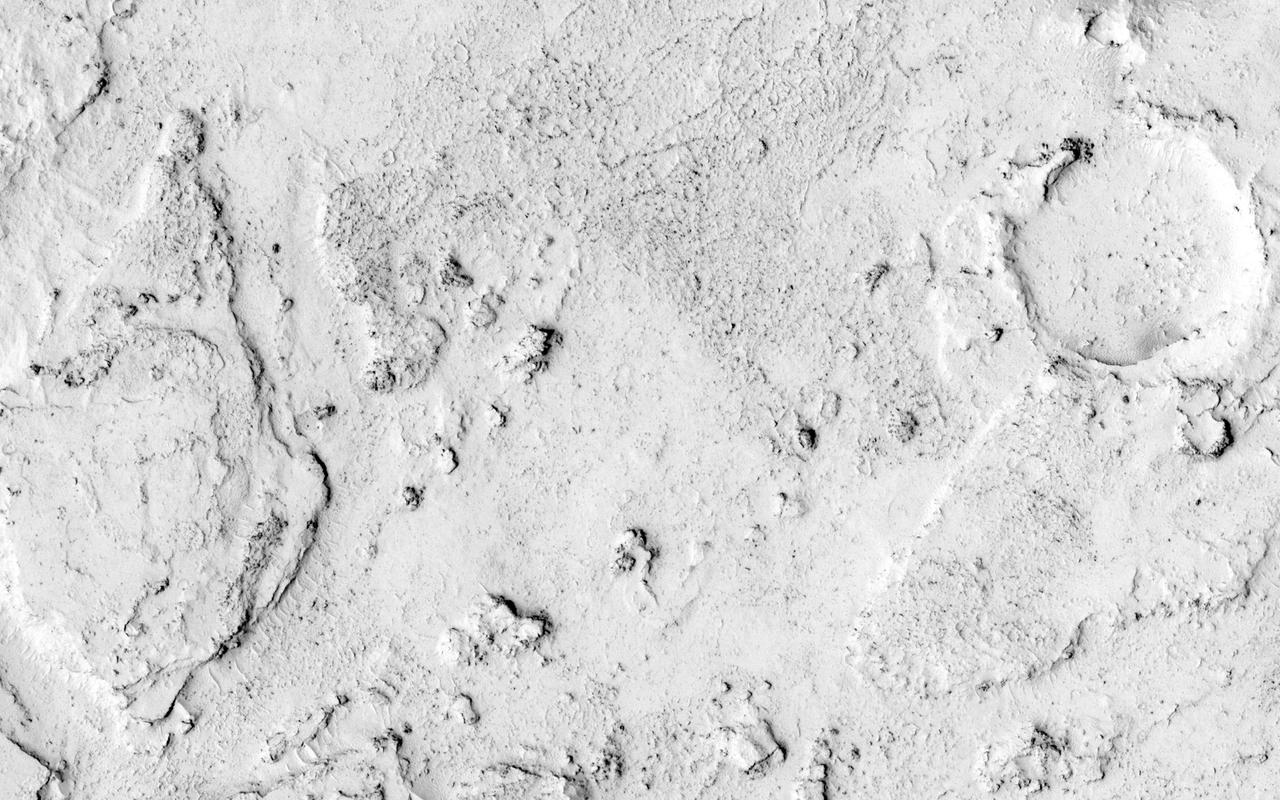
Hebrus Valles are a complex set of channels in the northern lowlands of Mars just to the west of the Elysium volcanic region. The channel segments to the north of this image display a variety of features, including streamlined forms and terracing that are suggestive of catastrophic flooding. However, this observation shows channels of uniform width suggesting more persistent flows eroding into and around two impact craters, each about two hundred meters in diameter. This complex geology may be the result of formation in volcanic terrains as fluid flows erode into basalt and interbedded ash or sediment layers. The channel system is thought to be early Amazonian in age (as far back as 3 billion years ago), which is younger than many of the other outflow channels on Mars. https://photojournal.jpl.nasa.gov/catalog/PIA25359
This image from NASA Mars Odyssey covers a portion of Ares Valles, an outflow channel carved into the surface of Mars by ancient catastrophic floods. The floods were most likely caused by huge discharges of groundwater at the channel heads. These floods are similar to (but much larger than) floods that created the Channeled Scablands in central Washington State during the last ice age on Earth. The Martian channels are hundreds of kilometers long and occur in a number of regions within equatorial Mars. The material that was eroded away by these floods was deposited as sediment in the northern lowlands. The Mars Pathfinder landing site is several hundred kilometers downstream from the location of this image and the surfaces are probably similar in nature. http://photojournal.jpl.nasa.gov/catalog/PIA04026
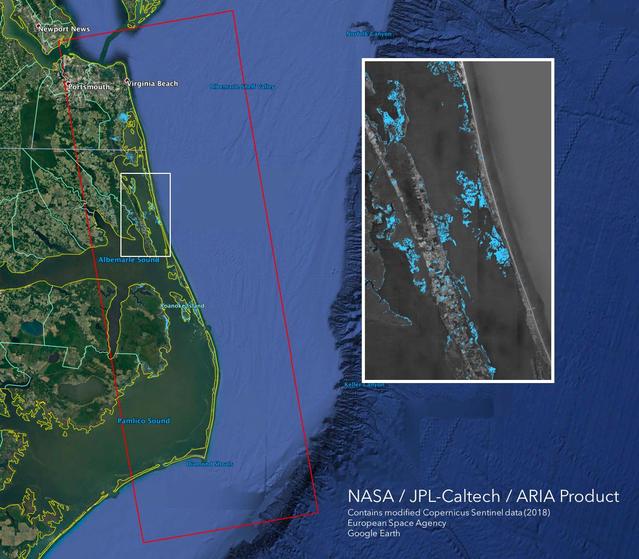
The Advanced Rapid Imaging and Analysis (ARIA) team at NASA's Jet Propulsion Laboratory in Pasadena, California, created this Flood Proxy Map depicting areas of the Carolinas that are likely flooded as a result of Hurricane Florence, shown by light blue pixels. The map is derived from synthetic aperture radar (SAR) images from the Copernicus Sentinel-1 satellites, operated by the European Space Agency (ESA). The images were taken before (September 09, 2018) and 36 hours after the hurricane's landfall (September 15, 2018 18:57 PM local time). The map covers an area of 53 miles x 152 miles (85 km x 245 km), indicated with the big red polygon. Each pixel measures about 33 yards x 33 yards (30 m x 30 m). Media reports provided anecdotal preliminary validation. This flood proxy map should be used as guidance to identify areas that are likely flooded and may be less reliable over urban and vegetated areas. https://photojournal.jpl.nasa.gov/catalog/PIA22704
This image of the Mississippi River in Mississippi, Arkansas, and Louisiana shows regions of the southern United States that are prone to flooding.

This poster highlights NASA JPL missions that provide important inputs to research on volcanoes, fires, earthquakes, droughts, tsunamis, floods and hurricanes.
This is a combined radar and topography image of an area along the Missouri River that experienced severe flooding and levee failure in the summer of 1993.
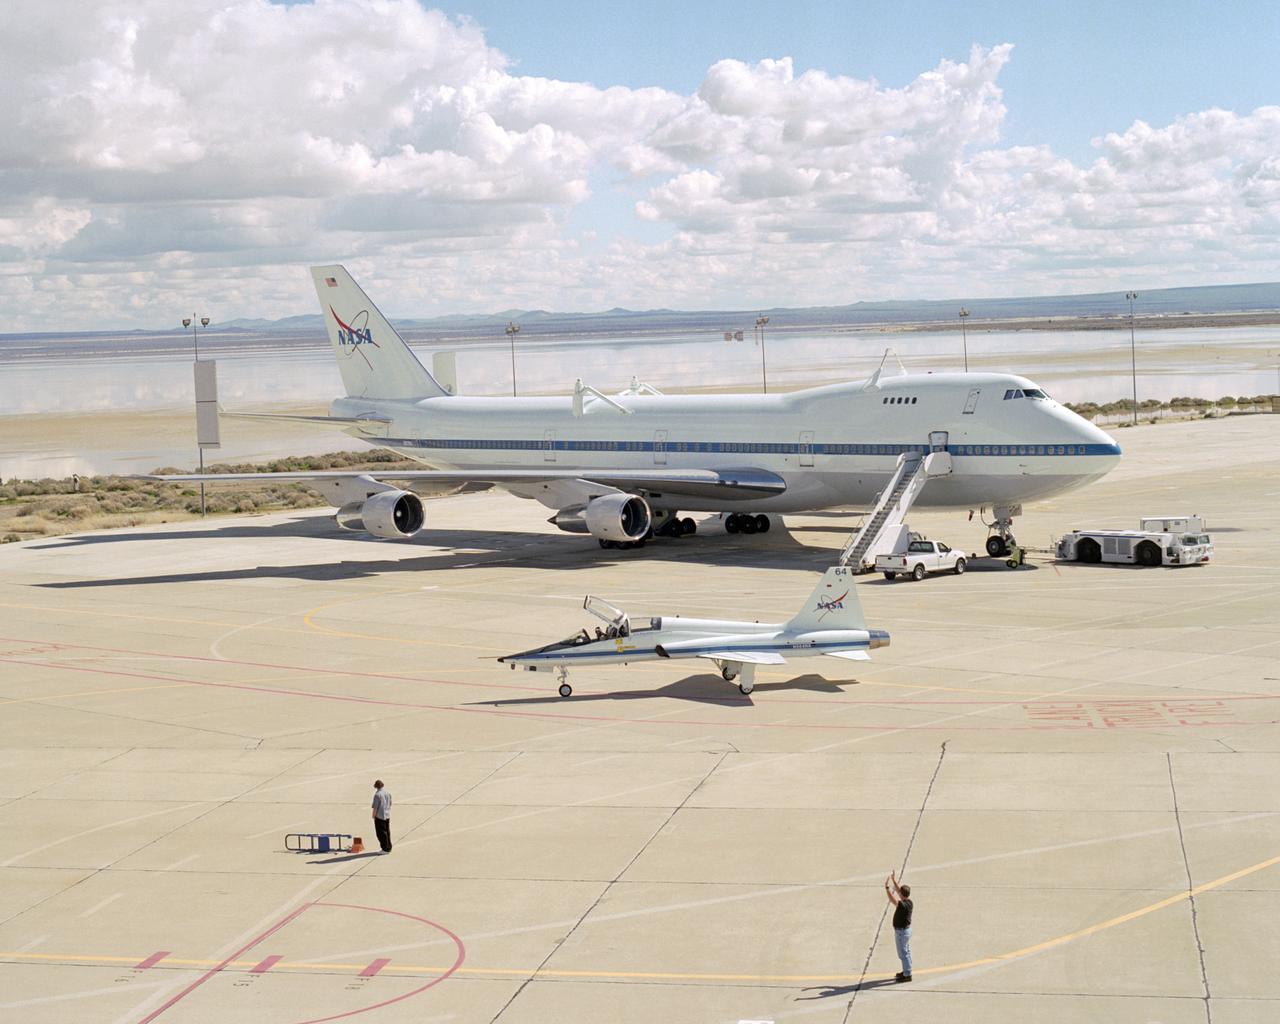
Puffy white clouds and a flooded lakebed form a backdrop as a T-38 support aircraft taxies across the ramp in front of NASA's Boeing 747 Shuttle Carrier Aircraft.
Except for the loss of its ring of ejecta, the crater at the leading edge of this streamlined island in Kasei Vallis, imaged here by NASA Mars Odyssey, shows no hint of the catastrophic floods that passed by it. Kasei Vallis is one of several major outflow channel systems that were active over 3 billion years ago. The intense floods scoured the landscape, eroding craters and producing streamlined islands. But in a close-up view, the evidence for these floods is not apparent. This true of the most similar terrestrial example, the channeled scablands of eastern Washington which also were formed by a catastrophic flood. http://photojournal.jpl.nasa.gov/catalog/PIA04022
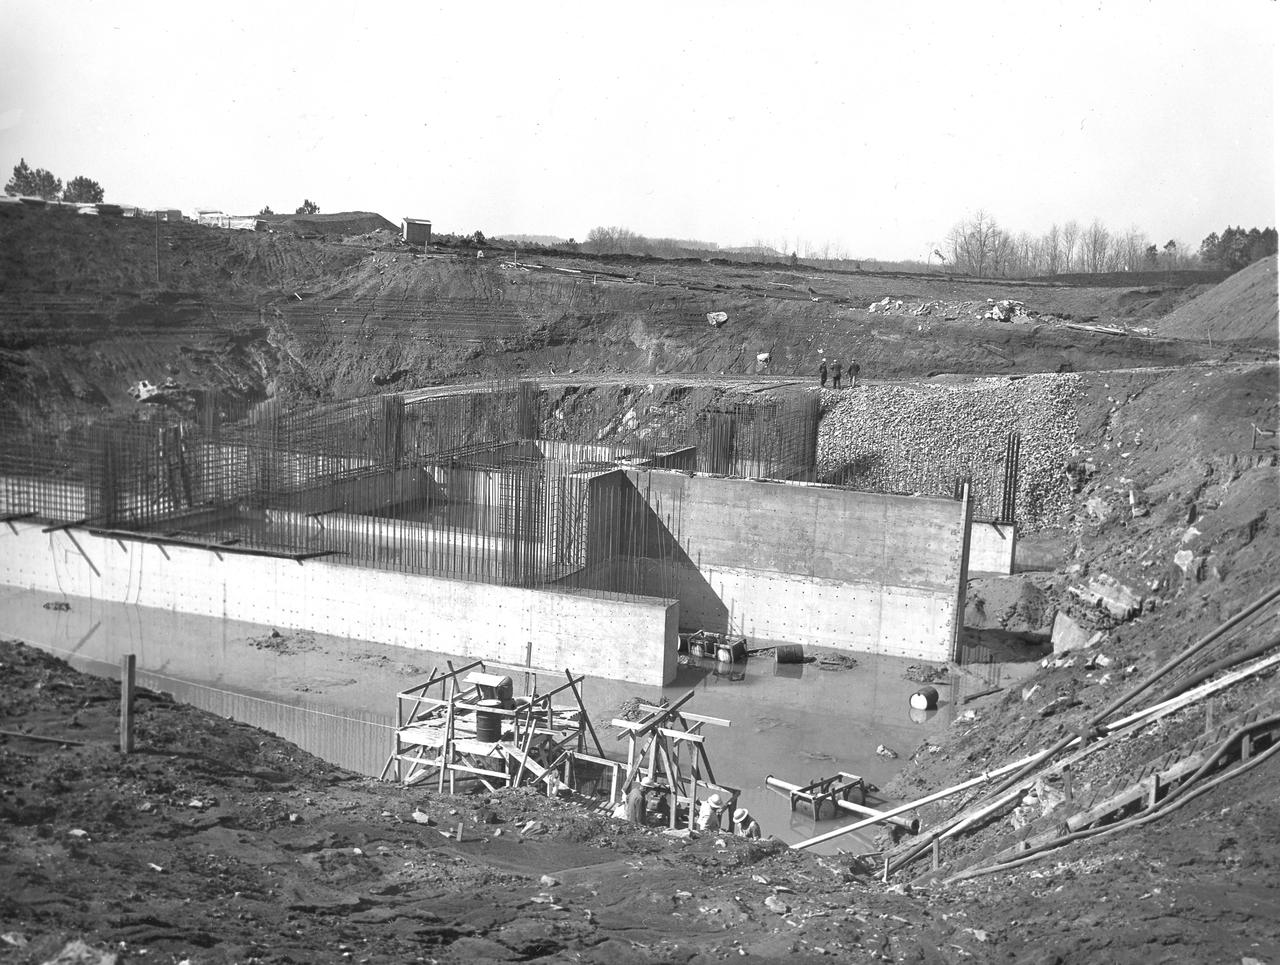
At its founding, the Marshall Space Flight Center (MSFC) inherited the Army’s Jupiter and Redstone test stands, but much larger facilities were needed for the giant stages of the Saturn V. From 1960 to 1964, the existing stands were remodeled and a sizable new test area was developed. The new comprehensive test complex for propulsion and structural dynamics was unique within the nation and the free world, and they remain so today because they were constructed with foresight to meet the future as well as on going needs. Construction of the S-IC Static test stand complex began in 1961 in the west test area of MSFC, and was completed in 1964. The S-IC static test stand was designed to develop and test the 138-ft long and 33-ft diameter Saturn V S-IC first stage, or booster stage, weighing in at 280,000 pounds. Required to hold down the brute force of a 7,500,000-pound thrust produced by 5 F-1 engines, the S-IC static test stand was designed and constructed with the strength of hundreds of tons of steel and 12,000,000 pounds of cement, planted down to bedrock 40 feet below ground level. The foundation walls, constructed with concrete and steel, are 4 feet thick. The base structure consists of four towers with 40-foot-thick walls extending upward 144 feet above ground level. The structure was topped by a crane with a 135-foot boom. With the boom in the upright position, the stand was given an overall height of 405 feet, placing it among the highest structures in Alabama at the time. Construction of the S-IC test stand came to a halt at the end of September 1961 as the determination was made that the Saturn booster size had to be increased. As a result, the stand had to be modified. With construction about to resume, portable, floating pump stations were placed in the site to drain the flood waters caused by a disturbed natural spring months prior during excavation. In this March 31, 1962 photo, the foundation walls can once again be seen.
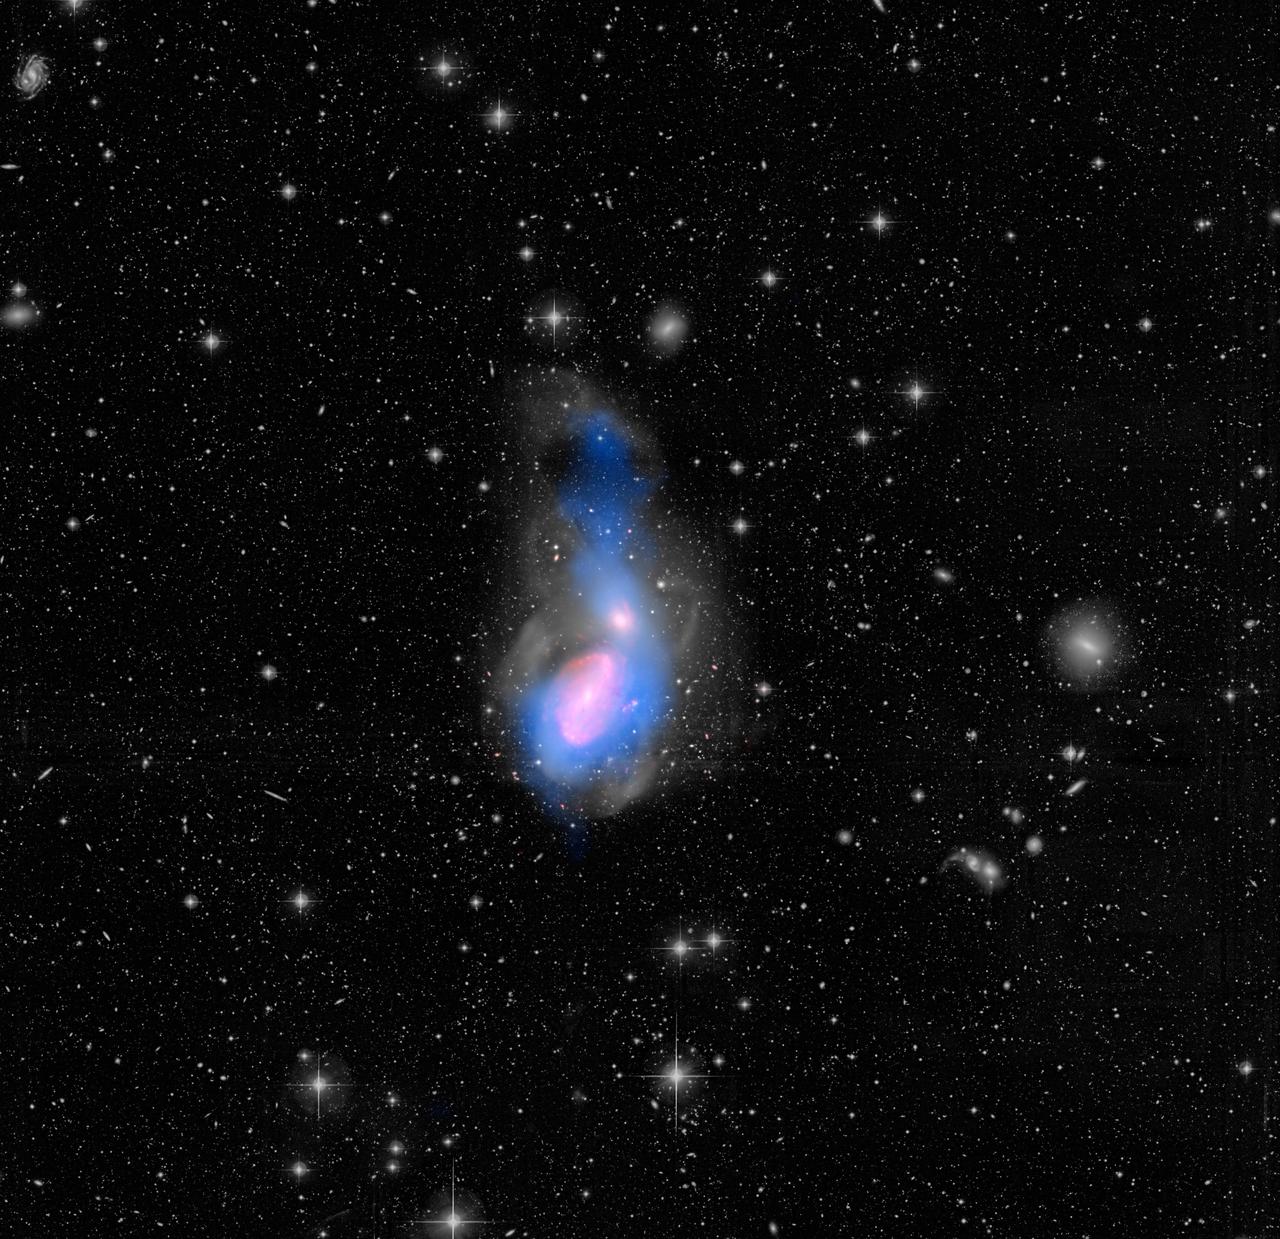
A new feature in the evolution of galaxies has been captured in this image of galactic interactions. The two galaxies seen here -- NGC 3226 at the top, NGC 3227 at the bottom.
Streamlined channels near Lucus Planum can be seen in this image from NASA Mars Odyssey spacecraft. These features were formed by catastrophic floods in the Martian past.
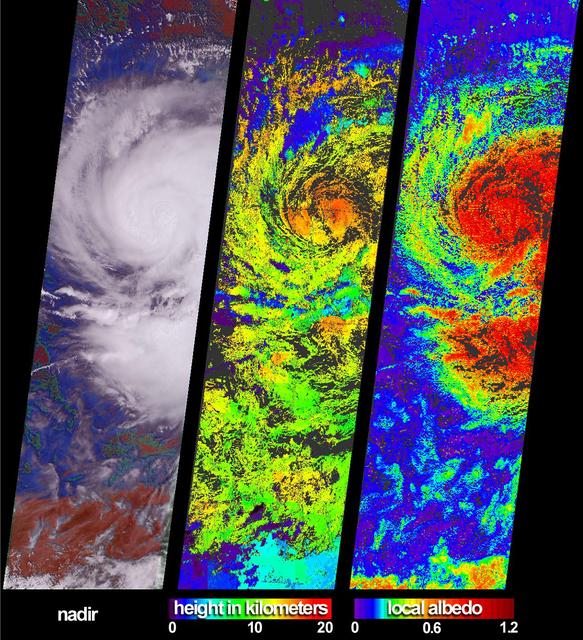
These views of Hurricane Isidore were acquired by NASA Terra satellite on September 20, 2002 as it flooded western Cuba and swept westward to Mexico Yucatan Peninsula.
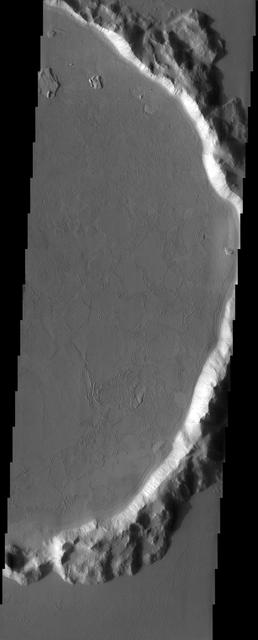
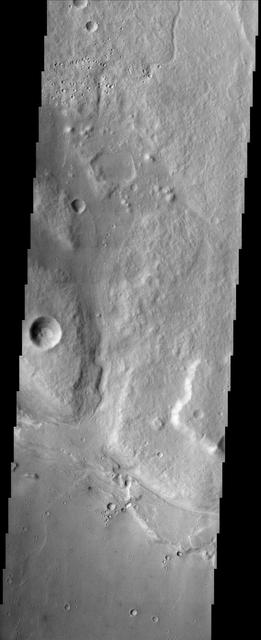
The predominant feature in this image from NASA Mars Odyssey spacecraft is a large flooded crater. Are the flows lava or mud? Scientists dont agree.
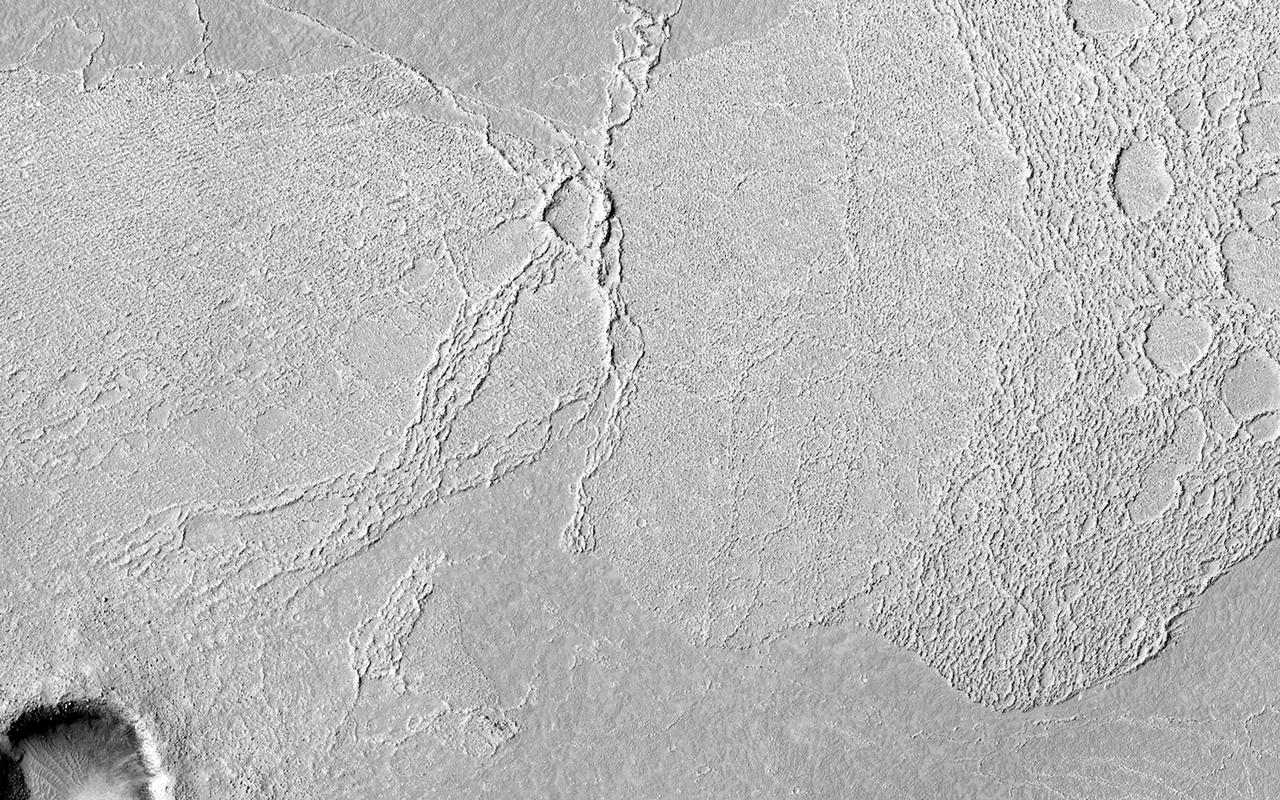
This image covers part of the Athabasca Valles flood lava plain, the youngest large lava flow on the surface of Mars as observed by NASA Mars Reconnaissance Orbiter.
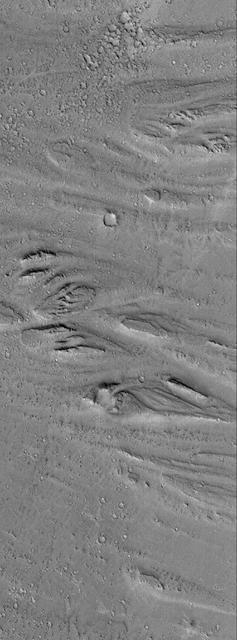
The force of moving water from a flood carved these teardrop-shaped islands within Granicus Valles. The orientation of the islands can be used as an indicator of the direction the water flowed. In this case, the water flowed primarily towards the upper left of the image. The image also contains many narrow sinuous channels. Geologists can determine that the floods occurred before a later tectonic event in the region. This event caused the crust to fracture into numerous blocks and fissures (grabens). Many fissures can be seen cutting across the former flood pathways. http://photojournal.jpl.nasa.gov/catalog/PIA04037
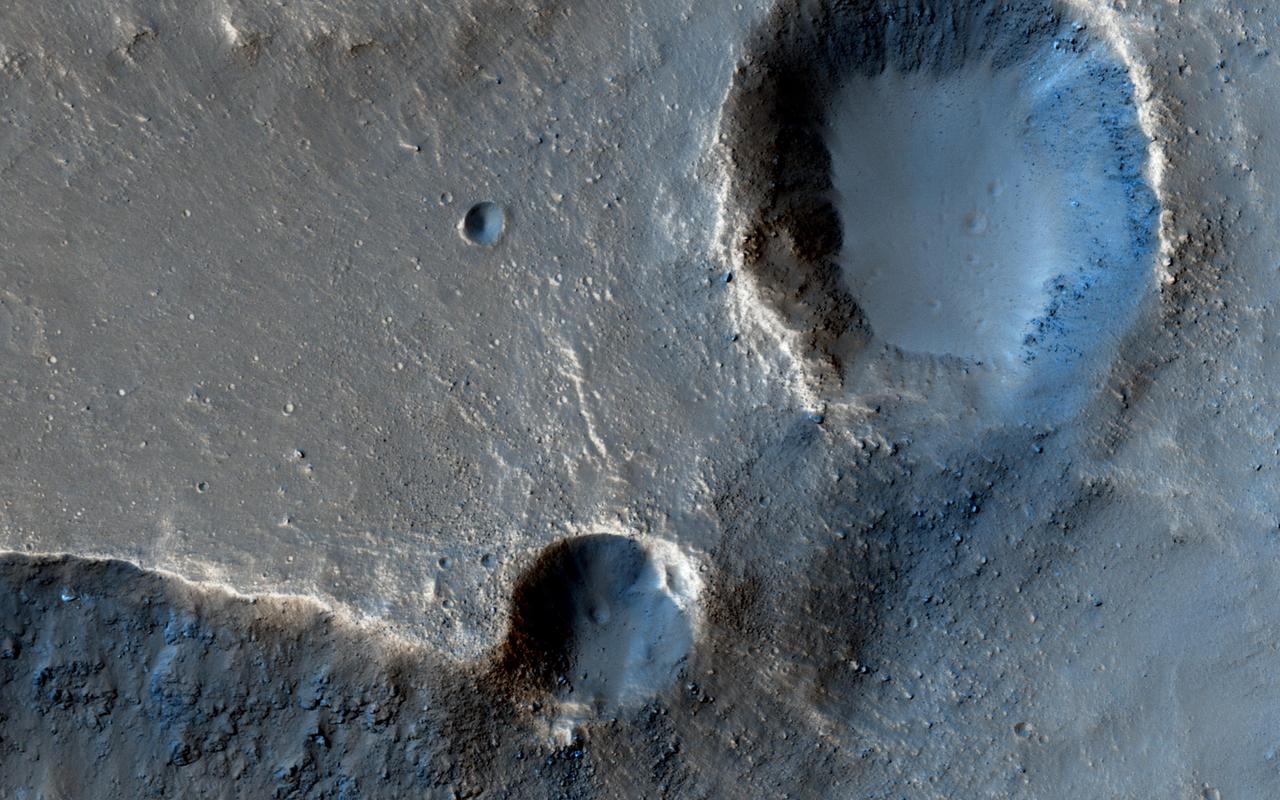
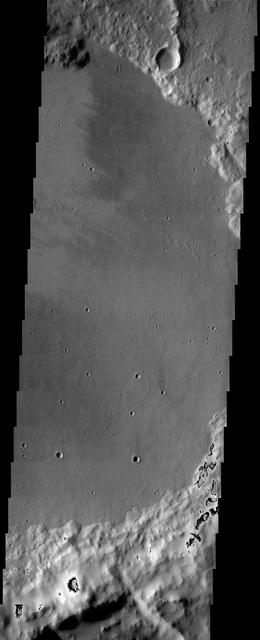
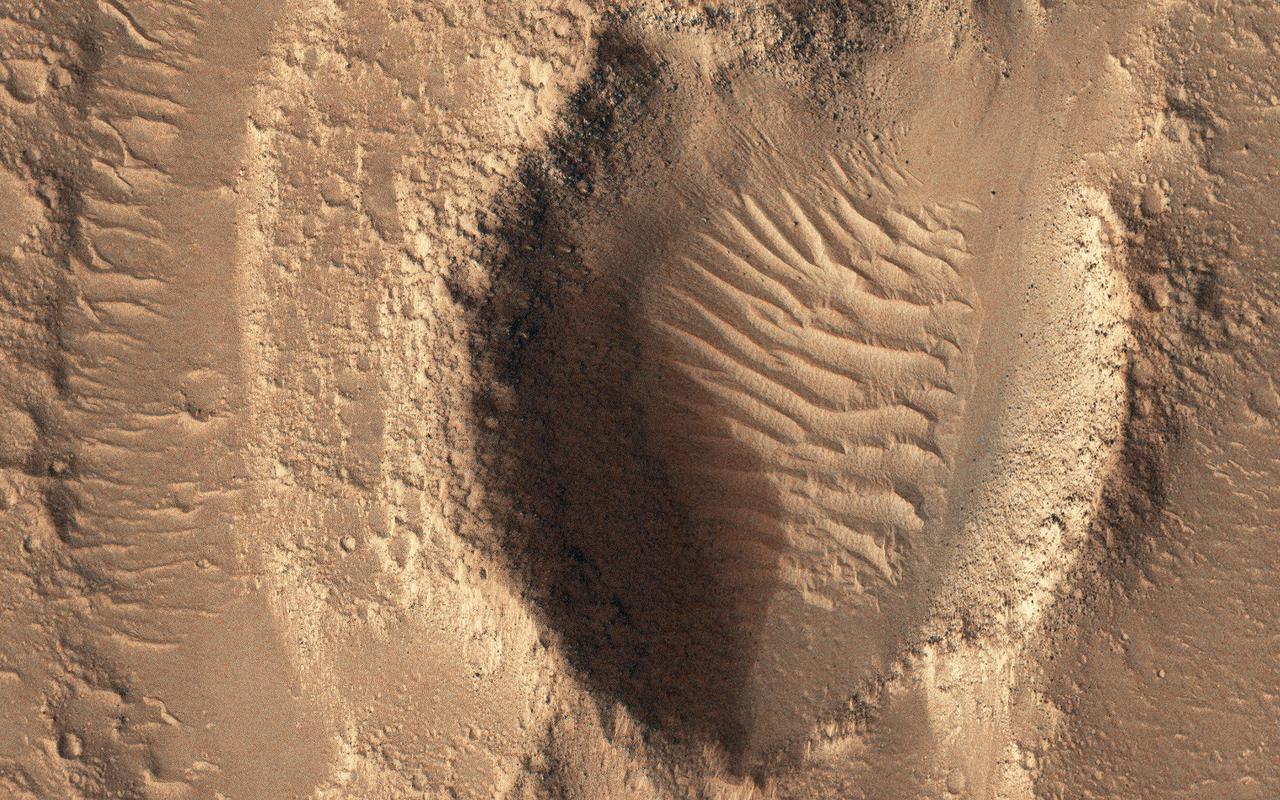
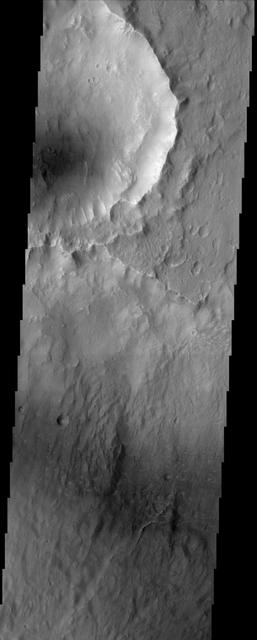
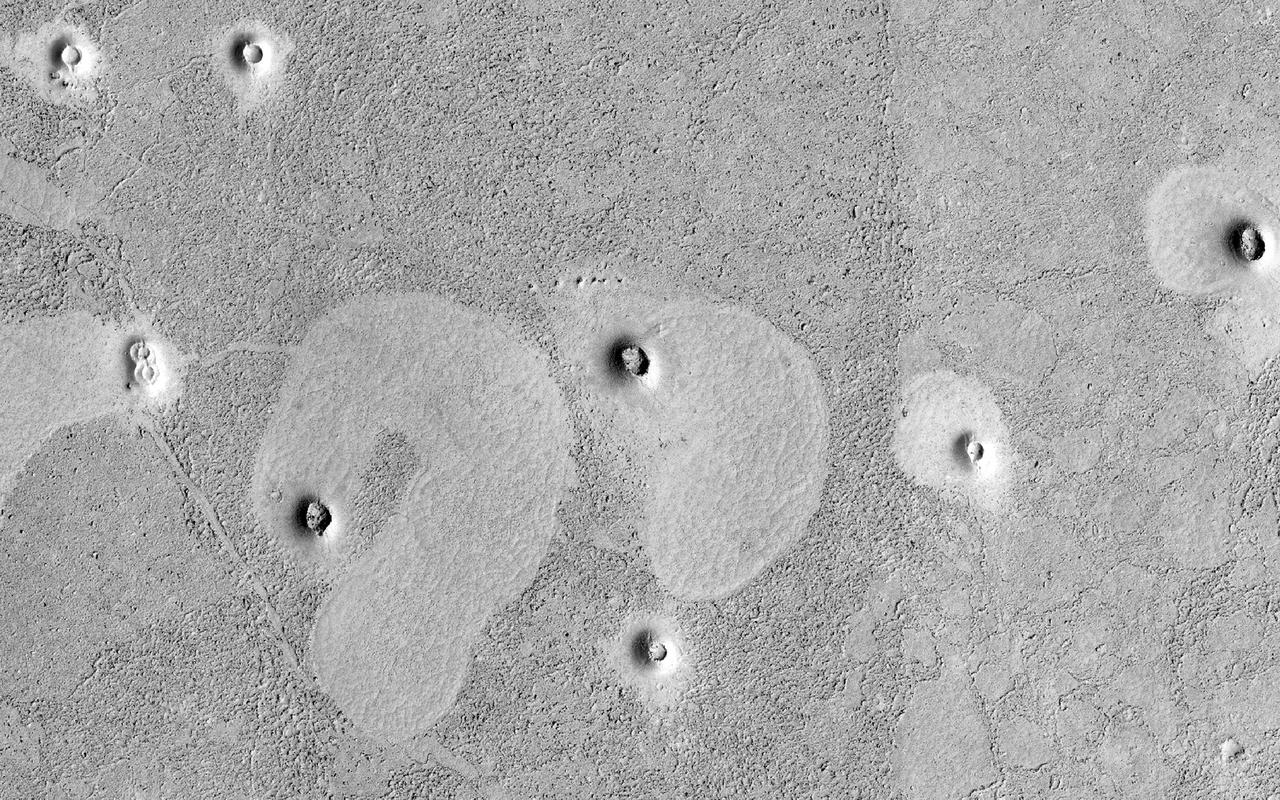
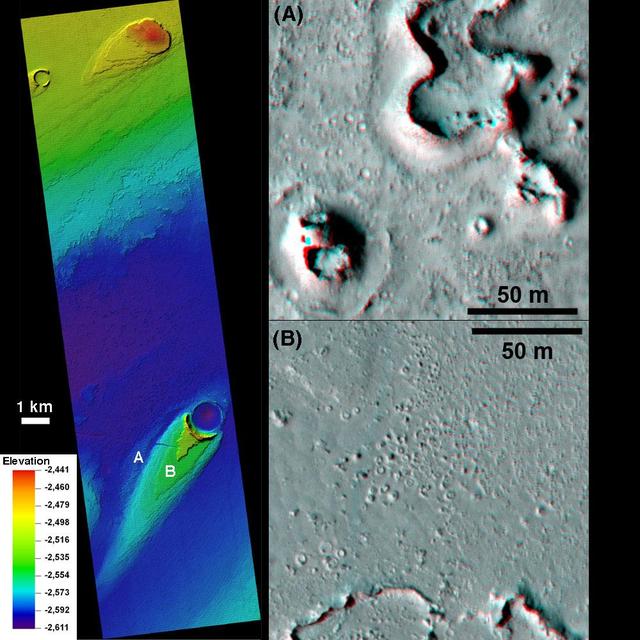
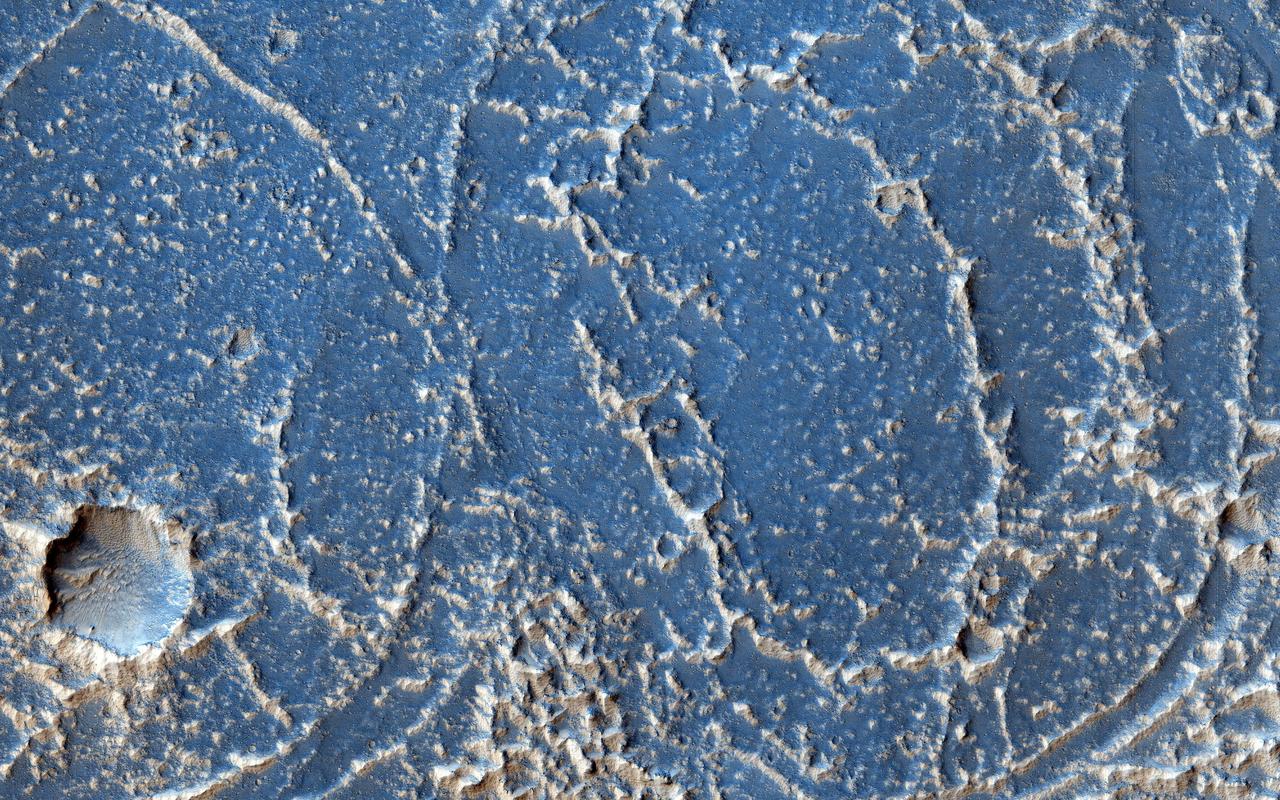
In this observation from NASA's Mars Reconnaissance Orbiter, these two craters perched at the edge of an outflow channel, appear to have lost a portion of their crater rims during a flood event. Alternatively, it is also possible that the craters impacted the edge of the outflow channel after the flood occurred and we are seeing the difference in the strength of the material impacted. https://photojournal.jpl.nasa.gov/catalog/PIA21881
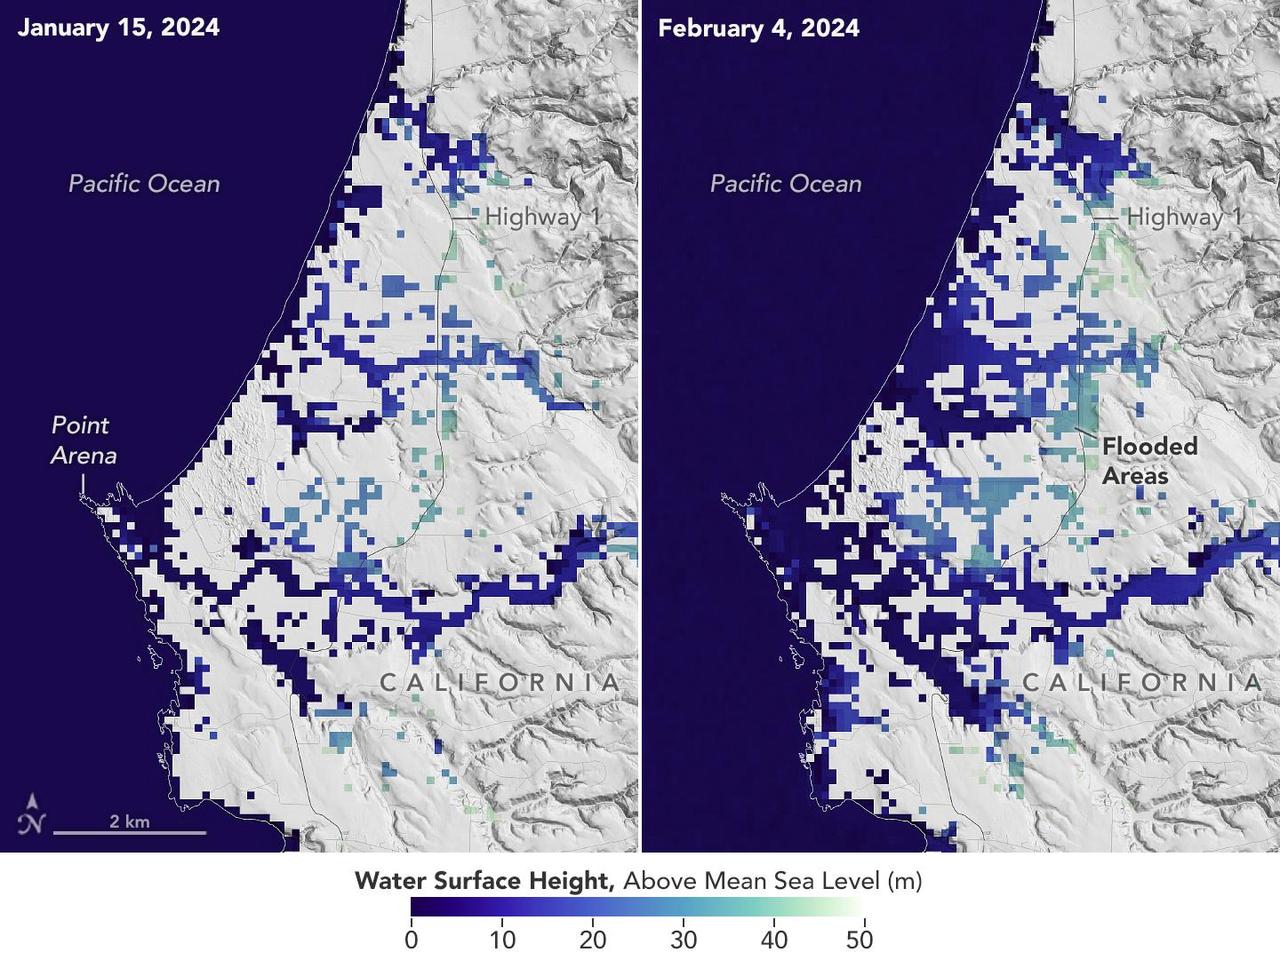
A series of atmospheric rivers drenched California in February 2024, with record amounts of rainfall and hurricane-force winds sweeping across parts of the state. The Surface Water and Ocean Topography (SWOT) mission captured data on coastal flooding near the community of Manchester, roughly 105 miles (169 kilometers) north of San Francisco. The satellite is a collaboration between NASA and the French space agency, CNES (Centre National d'Études Spatiales). The image shows the area on Jan. 15, 2024, before the rain and snow from atmospheric rivers hit California, and then again on Feb. 4, 2024, after the first in a series of storms soaked the state. Water heights are shown in shades of green and blue, with lighter hues indicating the highest levels relative to mean sea level. (Data for inland areas includes the height of the floodwaters plus the ground elevation beneath it.) Each pixel in the image represents an area that is 330 feet by 330 feet (100 meters by 100 meters). Since December 2022, SWOT has been measuring the height of nearly all water on Earth's surface, developing one of the most detailed, comprehensive views yet of the planet's oceans and freshwater lakes and rivers. Not only can the satellite detect the extent of the water on Earth's surface, as other satellites can, but SWOT can also provide water level data. The mission science team made the measurements using the Ka-band Radar Interferometer (KaRIn) instrument. With two antennas spread 33 feet (10 meters) apart on a boom, KaRIn produces a pair of data swaths as it circles the globe, bouncing radar pulses off water surfaces to collect surface-height measurements. Launched from Vandenberg Space Force Base in central California, SWOT is now in its operations phase, collecting data that will be used for research and other purposes. https://photojournal.jpl.nasa.gov/catalog/PIA26182
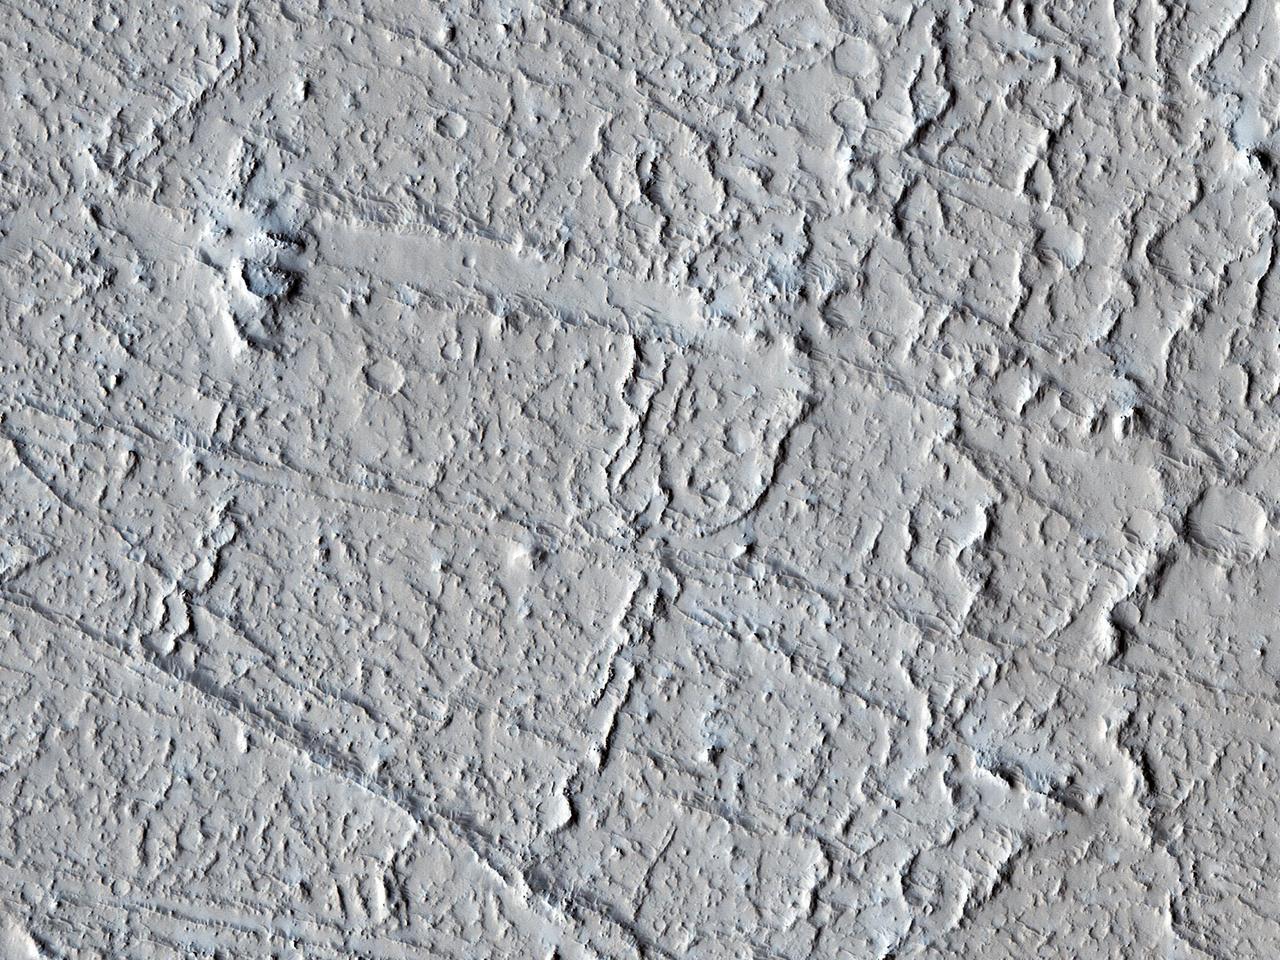
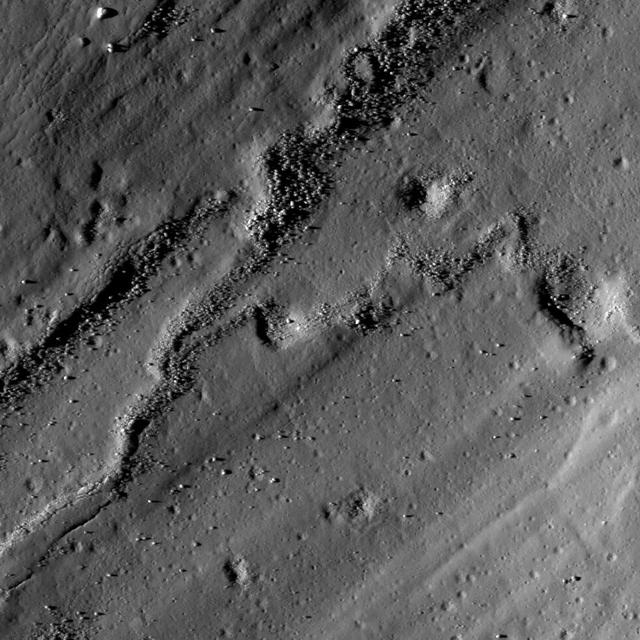
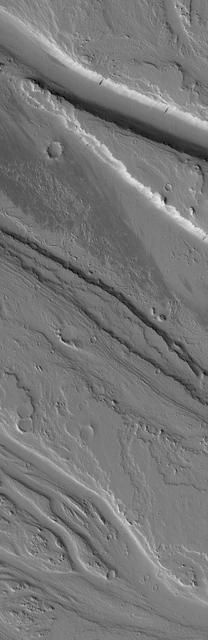
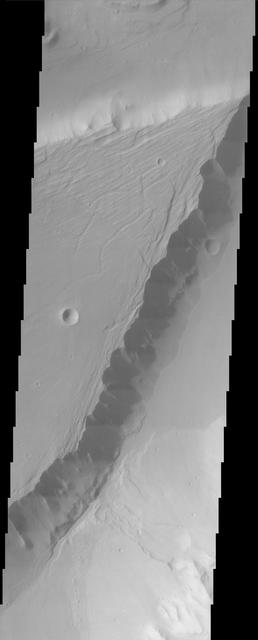
This area of Amazonis Planitia to the west of the large volcano Olympus Mons was once flooded with lava. A huge eruption flowed out across the relatively flat landscape. Sometimes called "flood basalt," the lava surface quickly cooled and formed a thin crust of solidified rock that was pushed along with the flowing hot liquid rock. Hills and mounds that pre-dated the flooding eruption became surrounded, forming obstructions to the relentless march of lava. In this image, these obstructions appeared to have poked up and sliced through the lava crust as the molten rock and crust moved together from west to east, over and past the stationary mounds. The result is a series of parallel grooves or channels with the obstructing mound remaining at the western end as the flow came to rest. From such images scientists can reconstruct the direction of the lava flow, potentially tracing it back to the source vent. http://photojournal.jpl.nasa.gov/catalog/PIA21204
The ancient, catastrophic floods on Mars, whose origins remain a mystery, produced a channeled and scoured landscape like this one, which is called Tiu Valles and was imaged by NASA Mars Odyssey spacecraft. http://photojournal.jpl.nasa.gov/catalog/PIA04013
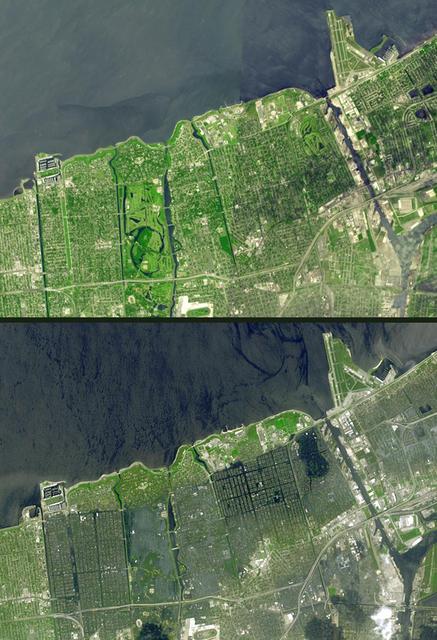
Seventeen days after Hurricane Katrina flooded New Orleans, much of the city was still under water. In this pair of images from NASA Terra satellite, the affected areas can clearly be seen.
A large streamlined island in Kasei Vallis, as seen in this NASA Mars Odyssey image, shows evidence of scour on its surface, probably from floods that preceded the formation of the island.
The north end of this long image from NASA Mars Reconnaissance Orbiter shows a lava surface in southern Elysium Planitia. Small cones are common on the extensive young flood lavas in this region.
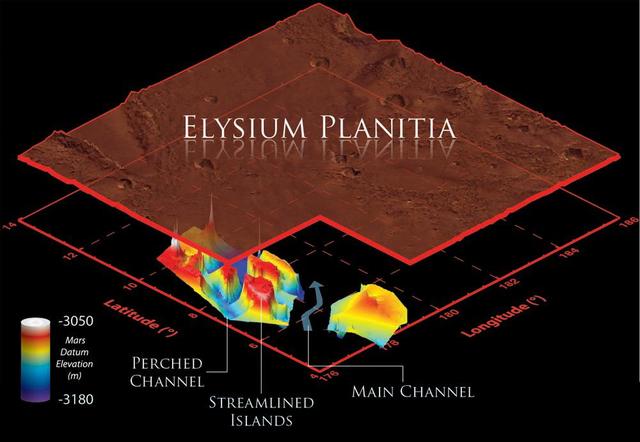
This illustration schematically shows where the Shallow Radar instrument on NASA Mars Reconnaissance Orbiter detected flood channels that had been buried by lava flows in the Elysium Planitia region of Mars.
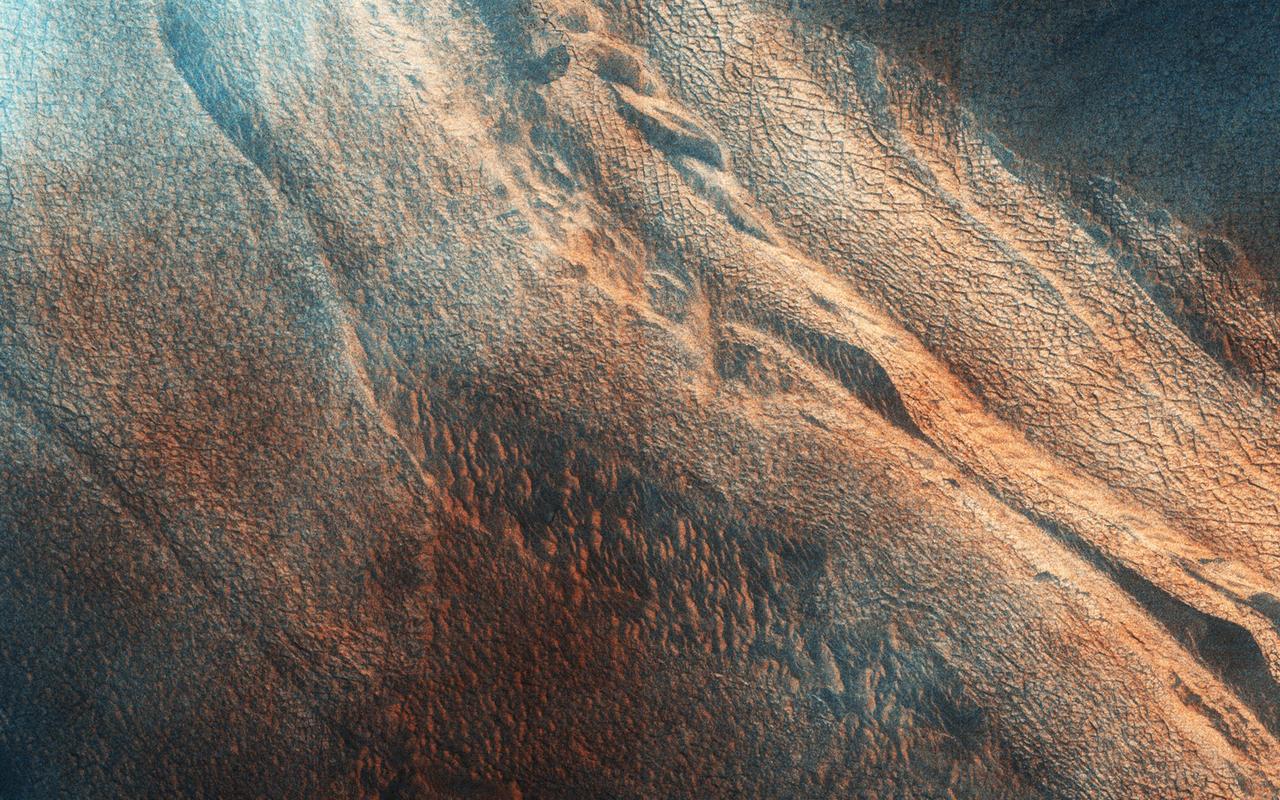
The north end of this long image from NASA Mars Reconnaissance Orbiter shows a lava surface in southern Elysium Planitia. Small cones are common on the extensive young flood lavas in this region.
This observation from NASA Mars Reconnaissance Orbiter shows the end of a small channel near Athabasca Valles on Mars. Athabasca is an example of a Martian outflow channel, likely carved by a massive flood of groundwater.
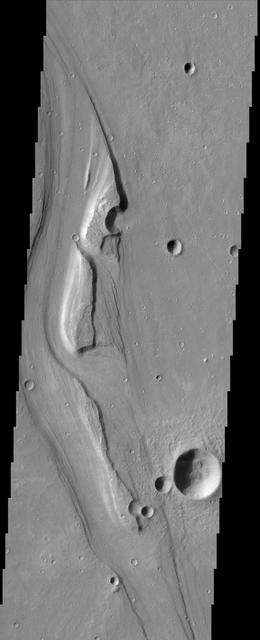
The sinuous channels and streamlined islands at the junction of Shalbatana and Simud Vallis, seen in this NASA Mars Odyssey image, present an erosional history of the catastrophic floods that scoured the Martian surface hundreds of millions of years ago.
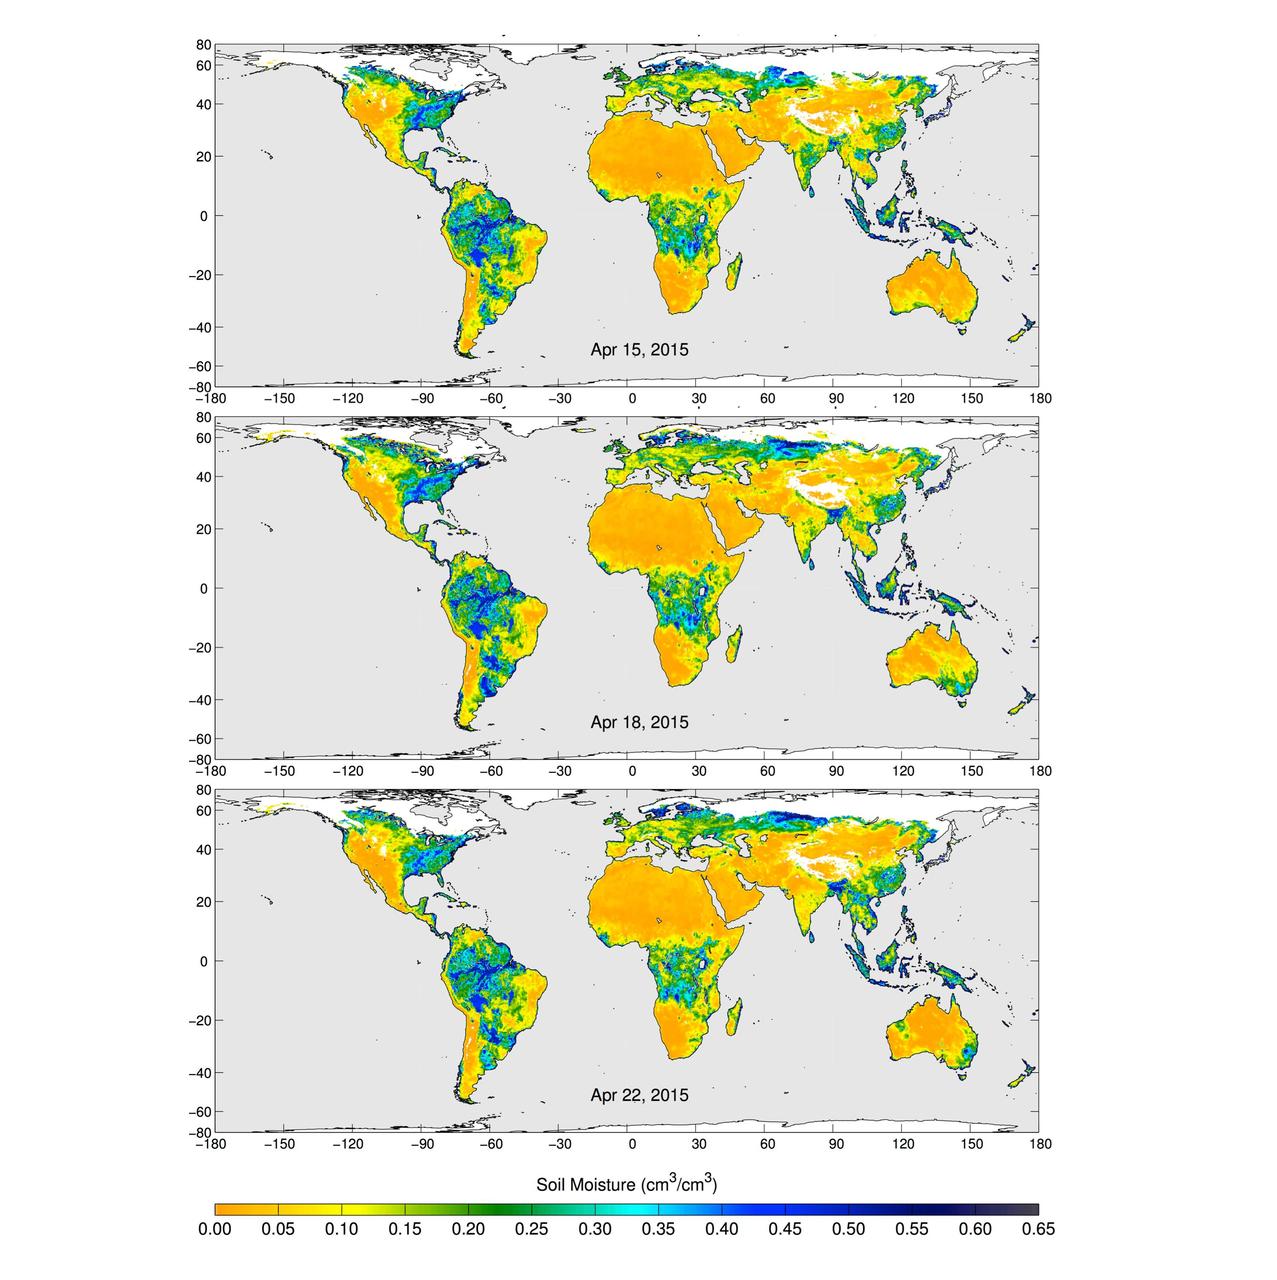
These maps of global soil moisture were created using data from the radiometer instrument on NASA Soil Moisture Active Passive SMAP observatory. Evident are regions of increased soil moisture and flooding during April, 2015.
This combination of images, taken by NASA Mars Reconnaissance Orbiter, helped researchers analyze the youngest flood lava on Mars, which is in Athabasca Valles, in the Elysium Planitia region of equatorial Mars.
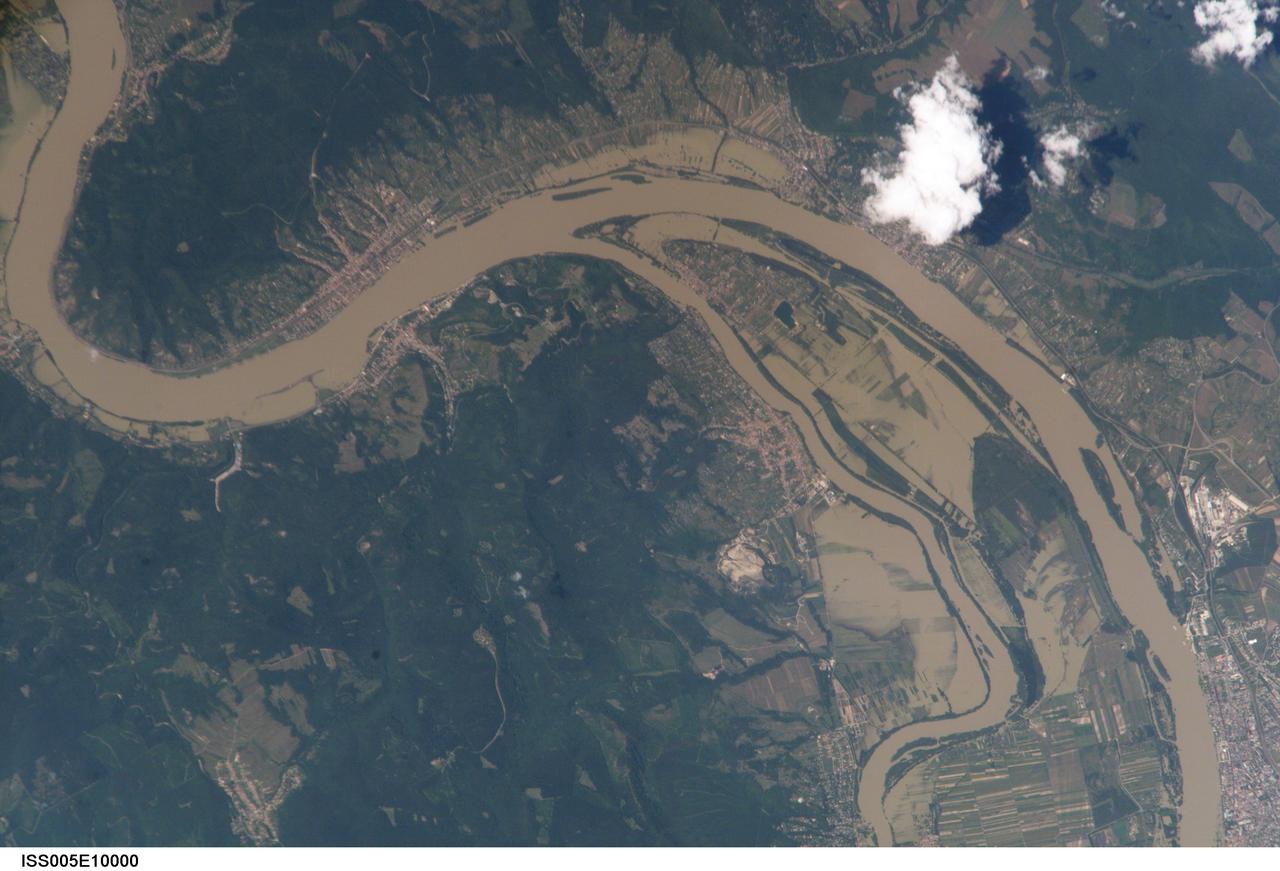
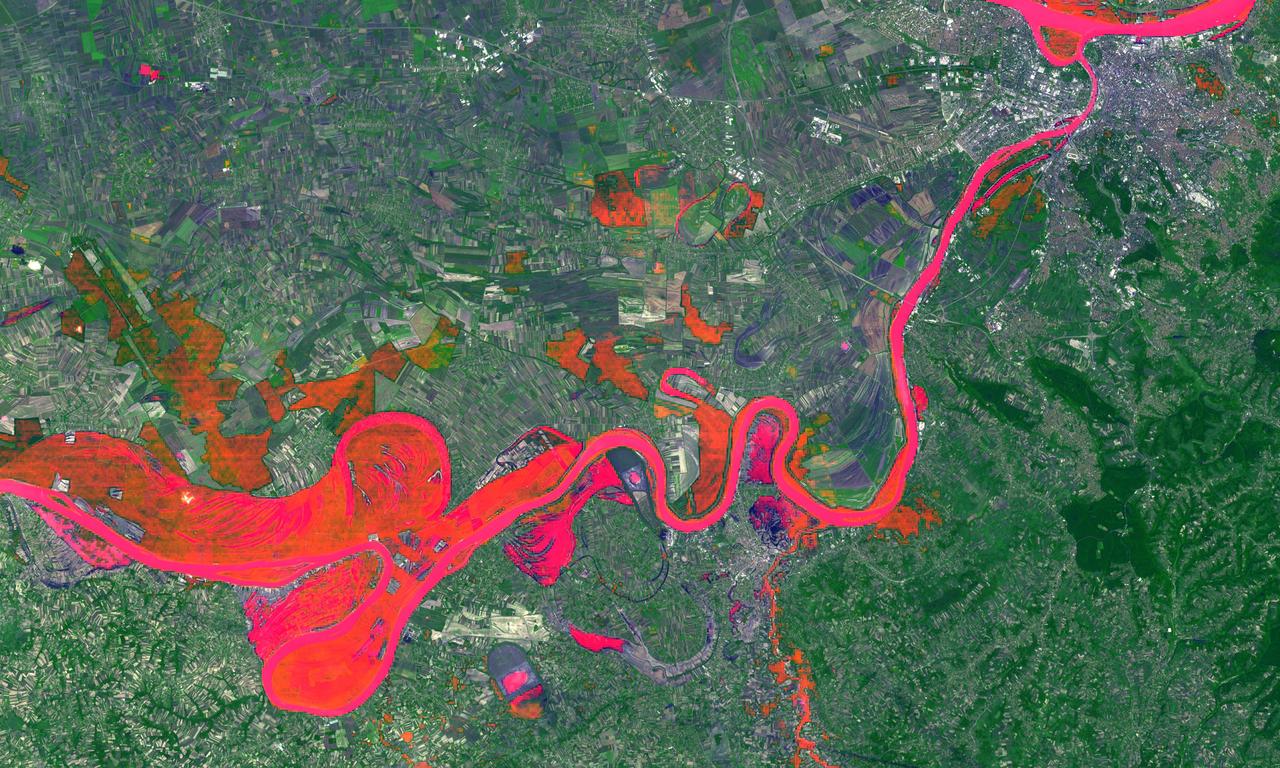
ISS005-E-10000 (18 August 2002) --- This is the first of two images recently released by the Earth Sciences and Image Analysis Laboratory at Johnson Space Center, showing the devastating European flooding in August. The images were captured by astronauts using a digital still camera onboard the International Space Station (ISS). The photographs show flooding around the Danube Bend area just north of Budapest near the city of Vác, Hungary. The flood peaked in Budapest the day after this photo was made, on August 19, at about 8.5 meters (28 feet), exceeding the previous 1965 flood record. This image shows the waters inundating farmland in the flood plain. Image no. ISS005-E-10926 shows the area four days later.
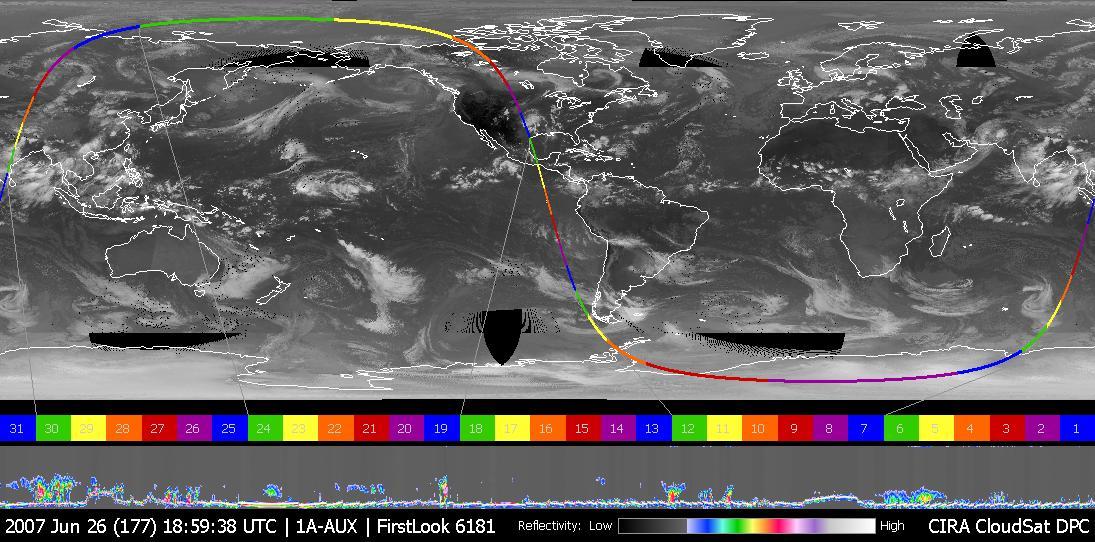
This image was taken on June 26, 2007, UTC 20:00. In this image an obvious storm hangs over the middle of the United States. Figure 1 shows NASA CloudSat data looking, in profile, at the cloud in this storm.
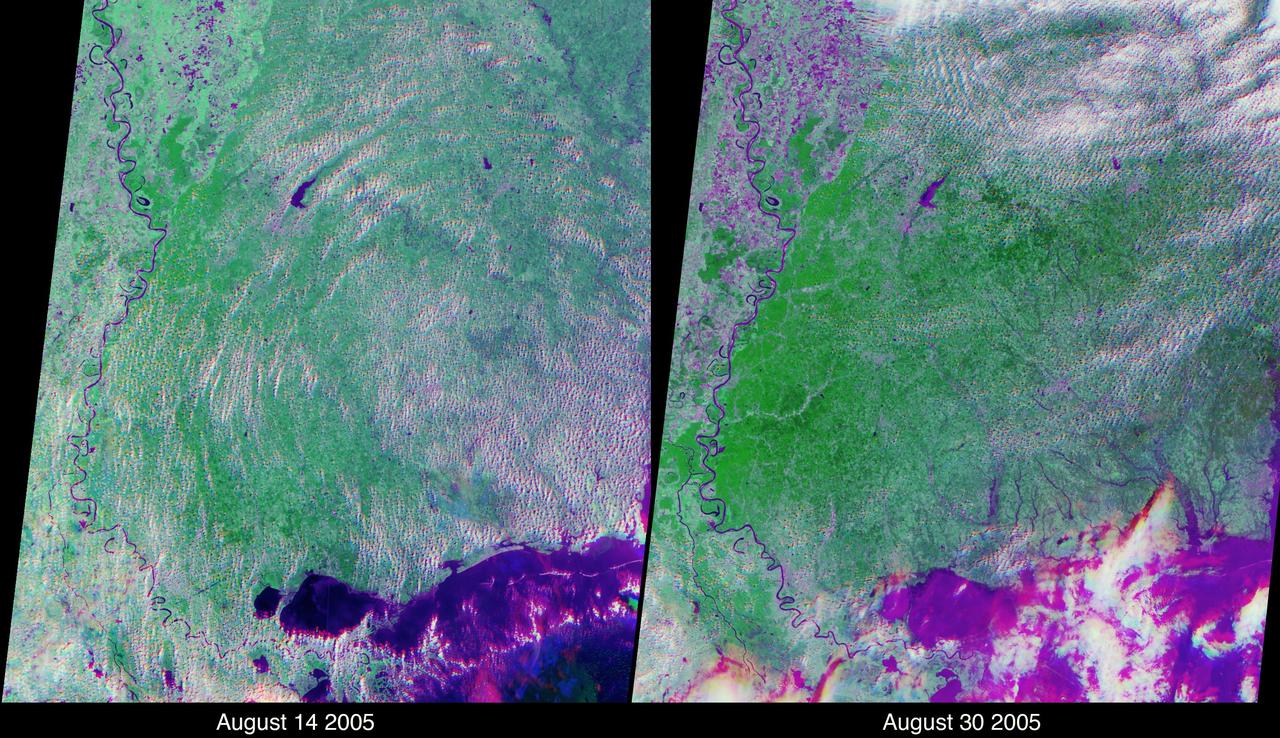
These views of the Louisiana and Mississippi regions were acquired before and one day after Katrina made landfall along the Gulf of Mexico coast. The images were acquired by NASA Terra spacecraft on August 14 and August 30, 2005.

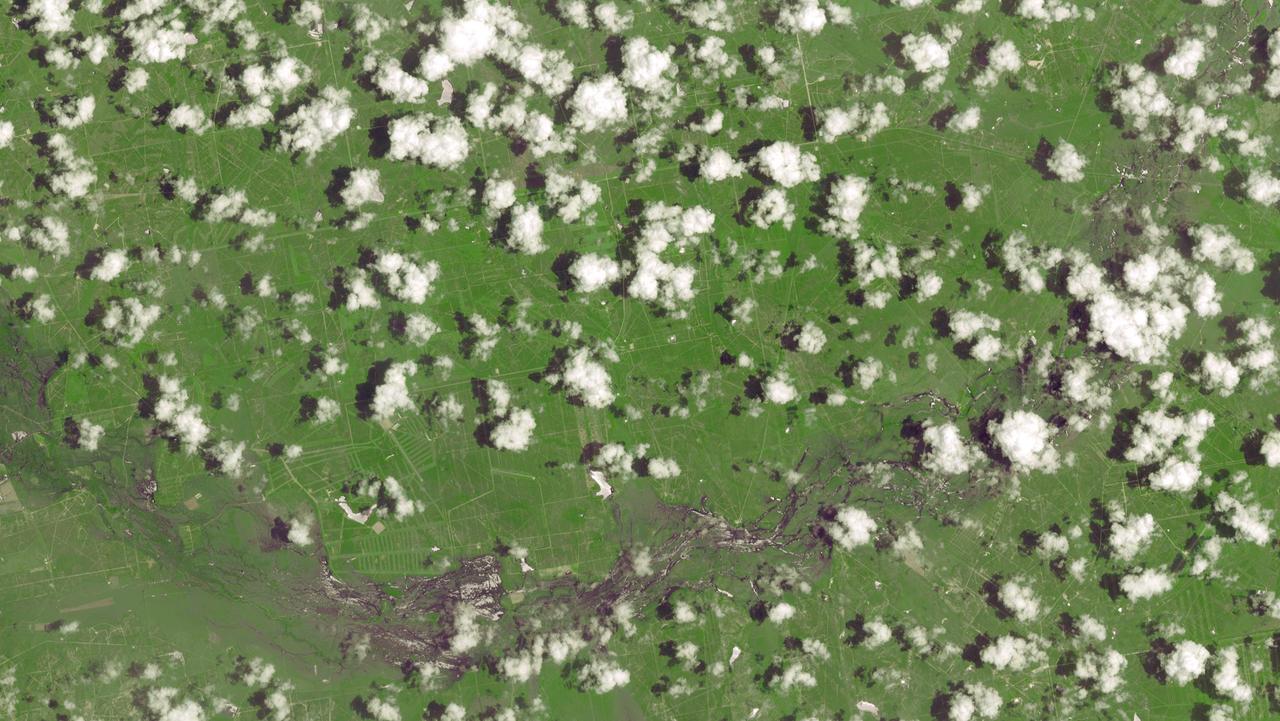
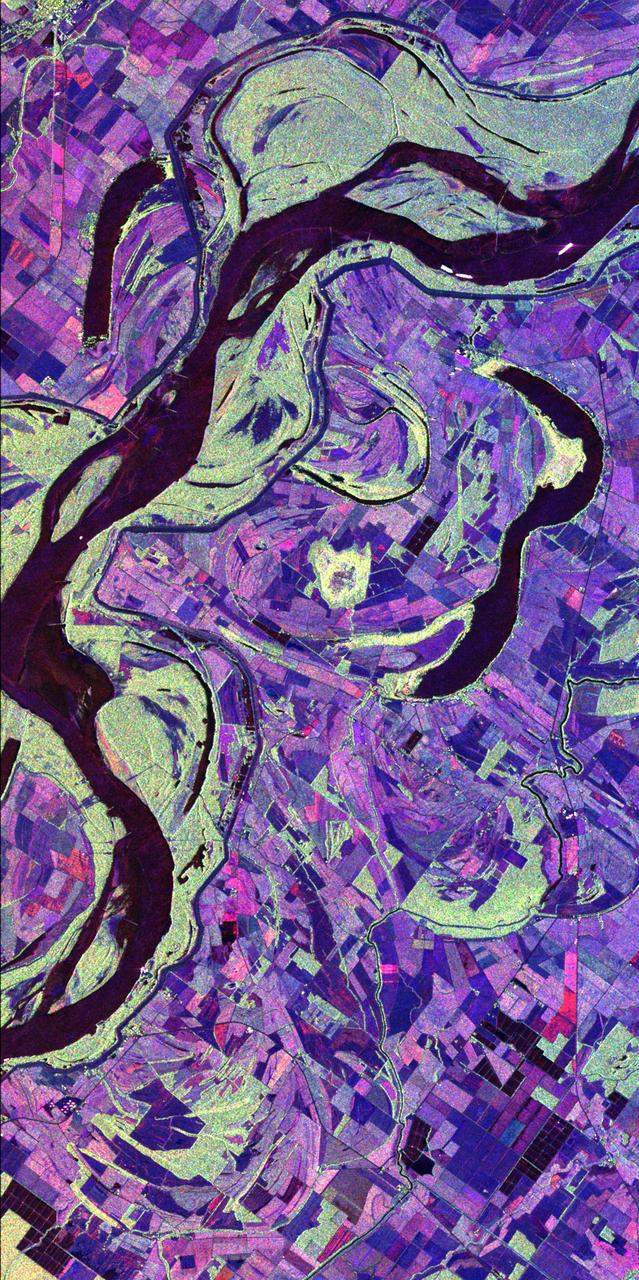
This is an image of equatorial Africa, centered on the equator at longitude 15degrees east. This image is a mosaic of almost 4,000 separate images obtained in 1996 by the L-band imaging radar onboard the Japanese Earth Resources Satellite. Using radar to penetrate the persistent clouds prevalent in tropical forests, the Japanese Earth Resources Satellite was able for the first time to image at high resolution this continental scale region during single flooding seasons. The area shown covers about 7.4 million square kilometers (2.8 million square miles) of land surface, spans more than 5,000 kilometers(3,100 miles) east and west and some 2,000 kilometers (1,240 miles) north and south. North is up in this image. At the full resolution of the mosaic (100 meters or 330 feet), this image is more than 500 megabytes in size, and was processed from imagery totaling more than 60 gigabytes. Central Africa was imaged twice in 1996, once between January and March, which is the major low-flood season in the Congo Basin, and once between October and November, which is the major high-flood season in the Congo Basin. The red color corresponds to the data from the low-flood season, the green to the high-flood season, and the blue to the "texture" of the low-flood data. The forests appear green as a result, the flooded and palm forests, as well as urban areas, appear yellow, the ocean and lakes appear black, and savanna areas appear blue, black or green, depending on the savanna type, surface topography and other factors. The areas of the image that are black and white were mapped only between January and March 1996. In these areas, the black areas are savanna or open water, the gray are forests, and the white areas are flooded forests or urban areas. The Congo River dominates the middle of the image, where the nearby forests that are periodically flooded by the Congo and its tributaries stand out as yellow. The Nile River flows north from Lake Victoria in the middle right of the color portion of the mosaic. http://photojournal.jpl.nasa.gov/catalog/PIA01348
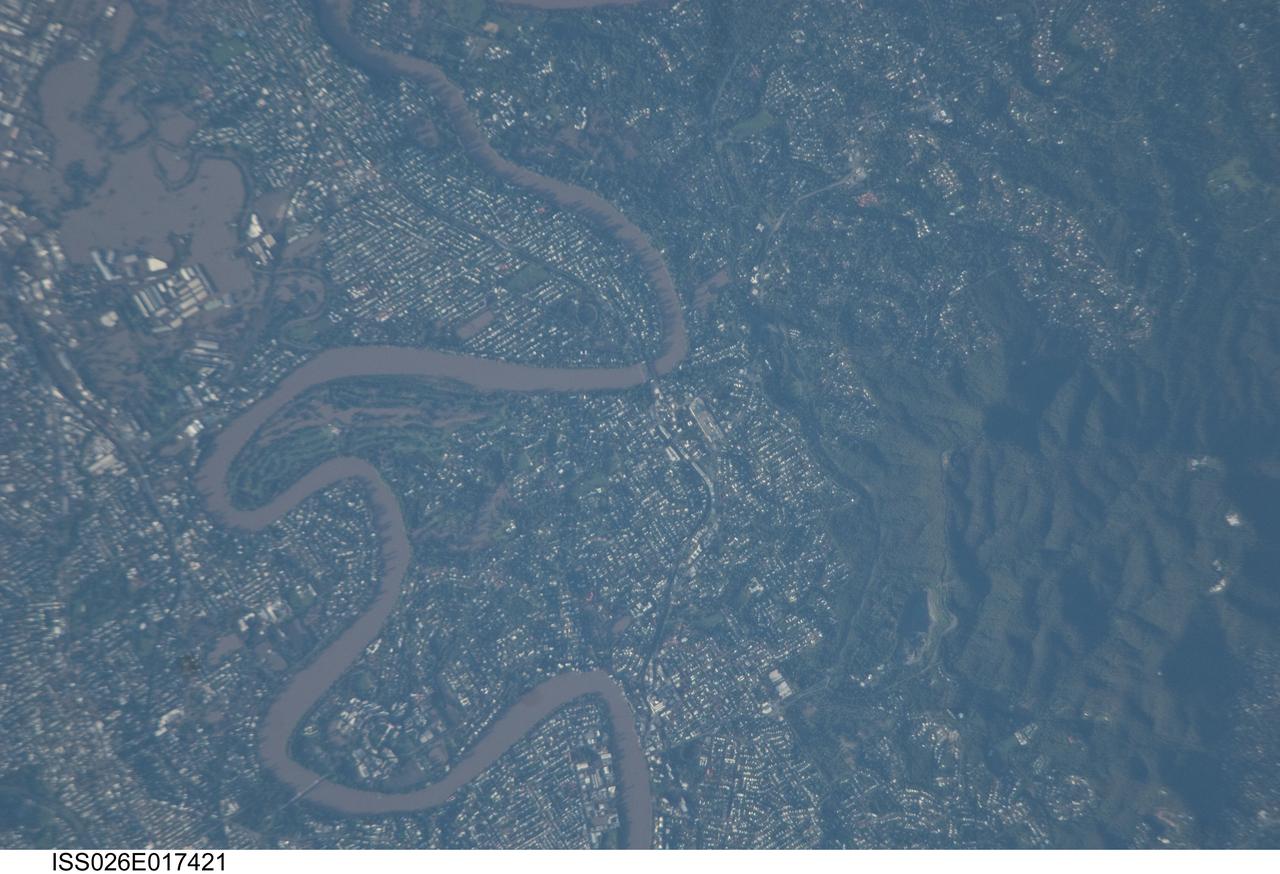
ISS026-E-017421 (13 Jan. 2011) --- Photographed by an Expedition 26 crew member on the International Space Station, this detailed photograph illustrates flooding in suburbs of the Brisbane, Australia metropolitan region. The Brisbane area experienced catastrophic flooding following unusually heavy rainfall on Jan. 10, 2011. With surficial soils already saturated from previous rainfall events, eastward-draining surface flow caused the Brisbane River to flood—inundating an estimated 20,000 homes in suburbs of the capital city of Queensland. Other cities in Queensland have also experienced damaging floods during previous heavy rainfall events this year. The image highlights several suburbs along the Brisbane River in the southern part of the Brisbane metropolitan area. The light-colored rooftops of residences and other structures contrast sharply with green vegetation and brown, sediment laden floodwaters. Most visible low-lying areas are inundated by floodwater, perhaps the most striking being Rocklea at upper left. The suburb of Yeronga (lower left) also has evident regions of flooding, as does a park and golf course located along a bend in the Brisbane River to the south of St. Lucia (center). Flooding becomes less apparent near the higher elevations of Mt. Coot-Tha at right.
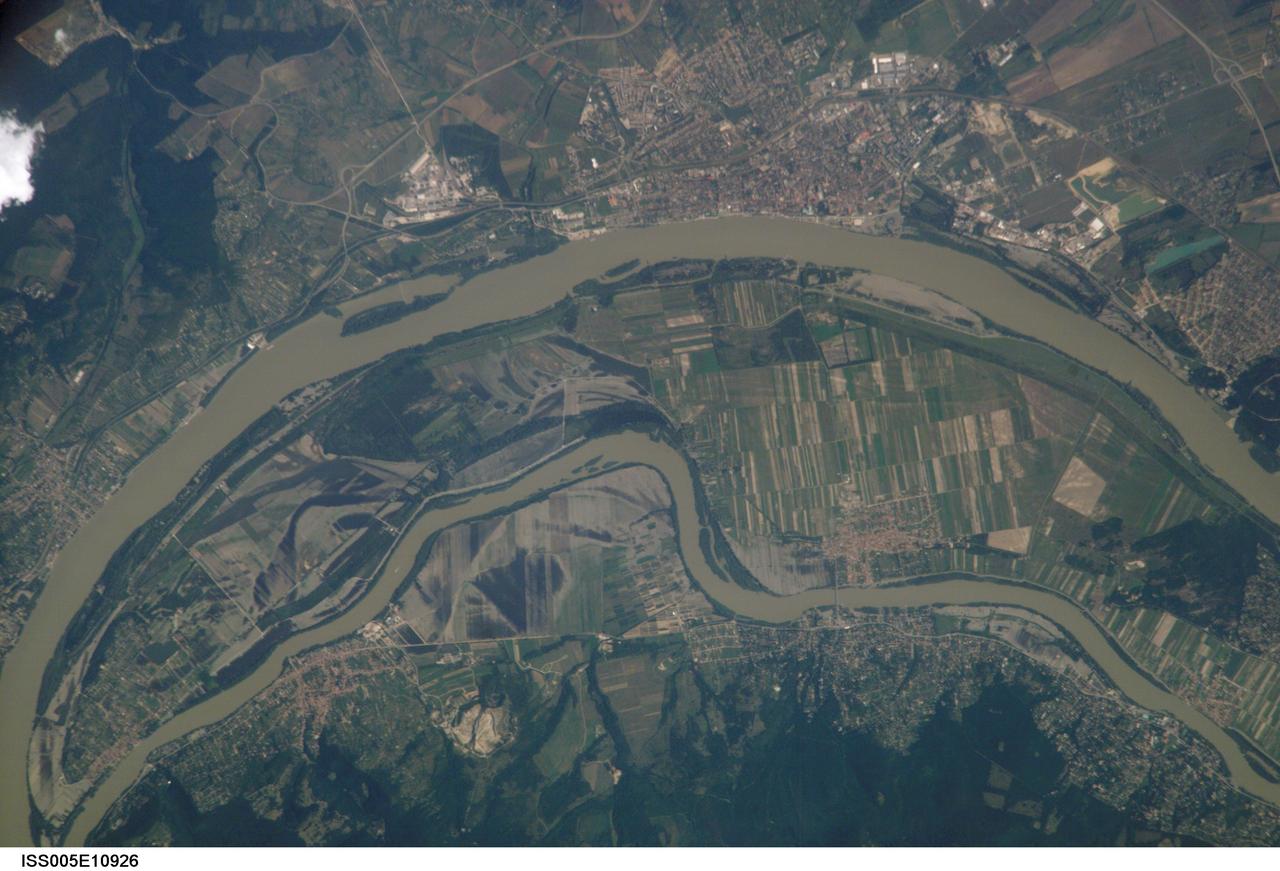
ISS005-E-10926 (23 August 2002) --- This is the second of two images recently released by the Earth Sciences and Image Analysis Laboratory at Johnson Space Center, showing some of the devastating late summer 2002 European flooding. The images were captured by astronauts using a digital still camera onboard the International Space Station (ISS). The photographs show flooding around the Danube Bend area just north of Budapest near the city of Vác, Hungary. The flood peaked in Budapest four days before this photo was made, on August 19, at about 8.5 meters (28 feet), exceeding the previous 1965 flood record. Water had begun to recede when this image was made. Image no. ISS005-E-10000 shows the area four days earlier.
This image shows bright and dark patterns with curving boundaries, a good example of Mars art. What caused this appearance? This region of Echus Chasma has been flooded by lava flows that produced rough and smooth surfaces. The rough areas then trap bright dust, creating the contrasts in brightness. http://photojournal.jpl.nasa.gov/catalog/PIA20209
This image from NASA Mars Reconnaissance Orbiter shows a fresh well-preserved landslide scarp and rocky deposit off the edge of a streamlined mesa in Simud Valles, a giant outflow channel carved by ancient floods. A stereo anaglyph is available at https://photojournal.jpl.nasa.gov/catalog/PIA21633