Platy lava flows in Elysium look very different from the thicker flows of the Tharsis region. In this image from NASA 2001 Mars Odyssey spacecraft, the darker plates are separated by lighter material and some edges match-up like puzzle pieces.
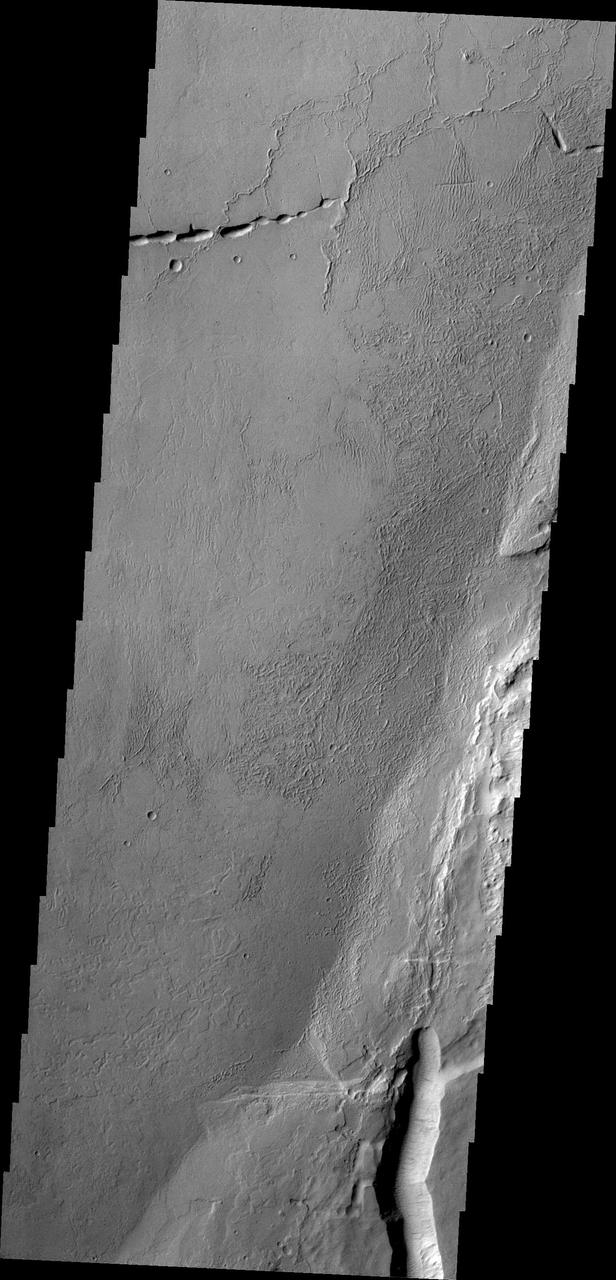
Echus Chasma separates the Tharsis region from Lunae Planum. This image from NASA 2001 Mars Odyssey shows volcanic flow materials from Tharsis within the chasma.

Two Phase Flow Separator Experiment, TPFSE
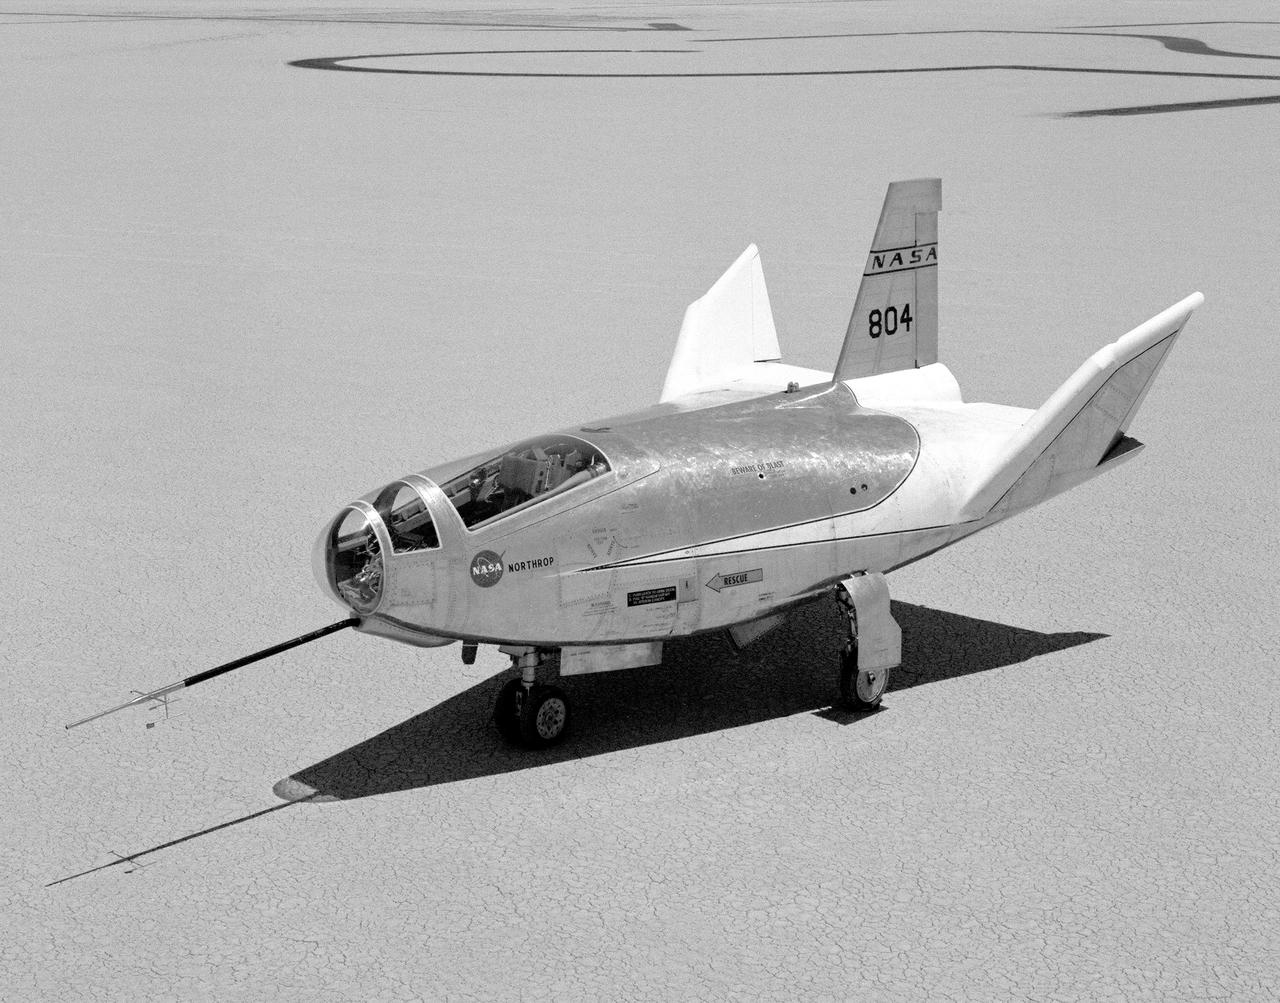
The HL-10 Lifting Body is seen here parked on Rogers Dry Lake, the unique location where it landed after research flights. This 1968 photo shows the vehicle after the fins were modified to remove instabilities encountered on the first flight. It involved a change to the shape of the leading edge of the fins to eliminate flow separation. It required extensive wind-tunnel testing at Langley Research Center, Hampton, Va. NASA Flight Research Center (FRC) engineer Bob Kempel than plotted thousands of data points by hand to come up with the modification, which involved a fiberglass glove backed with a metal structure on each fin's leading edge. This transformed the vehicle from a craft that was difficult to control into the best handling of the original group of lifting bodies at the FRC.

Center Director John McCarthy, left, and researcher Al Johns pose with a one-third scale model of a Grumman Aerospace tilt engine nacelle for Vertical and Short Takeoff and Landing (V/STOL) in the 9- by 15-Foot Low Speed Wind Tunnel at the National Aeronautics and Space Administration (NASA) Lewis Research Center. Lewis researchers had been studying tilt nacelle and inlet issues for several years. One area of concern was the inlet flow separation during the transition from horizontal to vertical flight. The separation of air flow from the inlet’s internal components could significantly stress the fan blades or cause a loss of thrust. In 1978 NASA researchers Robert Williams and Al Johns teamed with Grumman’s H.C. Potonides to develop a series of tests in the Lewis 9- by 15-foot tunnel to study a device designed to delay the flow separation by blowing additional air into the inlet. A jet of air, supplied through the hose on the right, was blown over the inlet surfaces. The researchers verified that the air jet slowed the flow separation. They found that the blowing on boundary layer control resulted in a doubling of the angle-of-attack and decreases in compressor blade stresses and fan distortion. The tests were the first time the concept of blowing air for boundary layer control was demonstrated. Boundary layer control devices like this could result in smaller and lighter V/STOL inlets.

STS040-34-001 (5-14 June 1991) --- This 35mm scene shows a close-up of a prototype filter designed to remove contamination from air and water, before it flows into the Orbiter's humidity separators. This experiment is part of Development Test Objective (DTO) 647, Water Separator Filter Performance Evaluation. Astronauts Bryan D. O'Connor, mission commander, and Sidney M. Gutierrez, pilot, carried out the test and down linked television to the ground for engineering analysis.
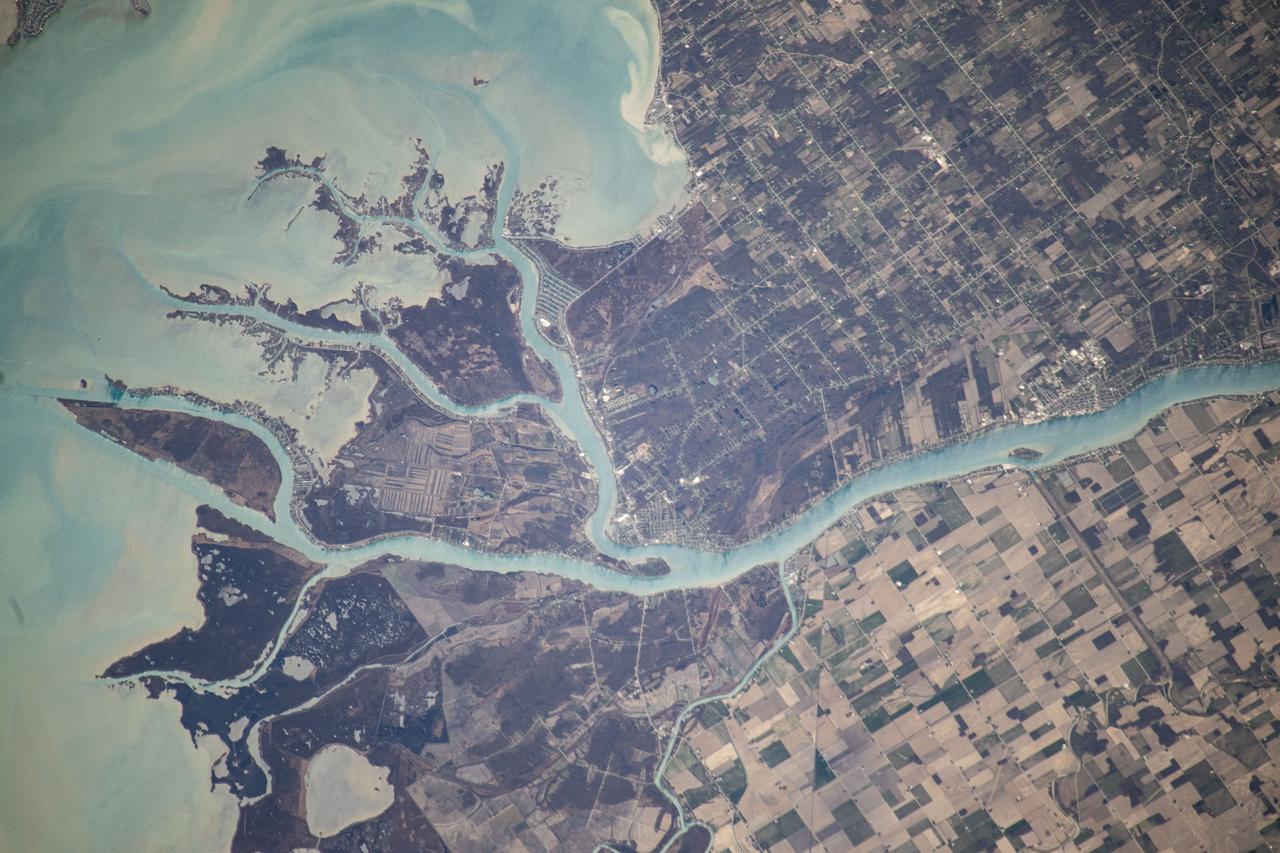
iss073e0000481 (April 22, 2025) --- The St. Clair River flows into the freshwater Lake St. Clair and separates the American state of Michigan (top) from the Canadian province of Ontario (bottom) in this photograph from the International Space Station as it orbited 260 miles above.
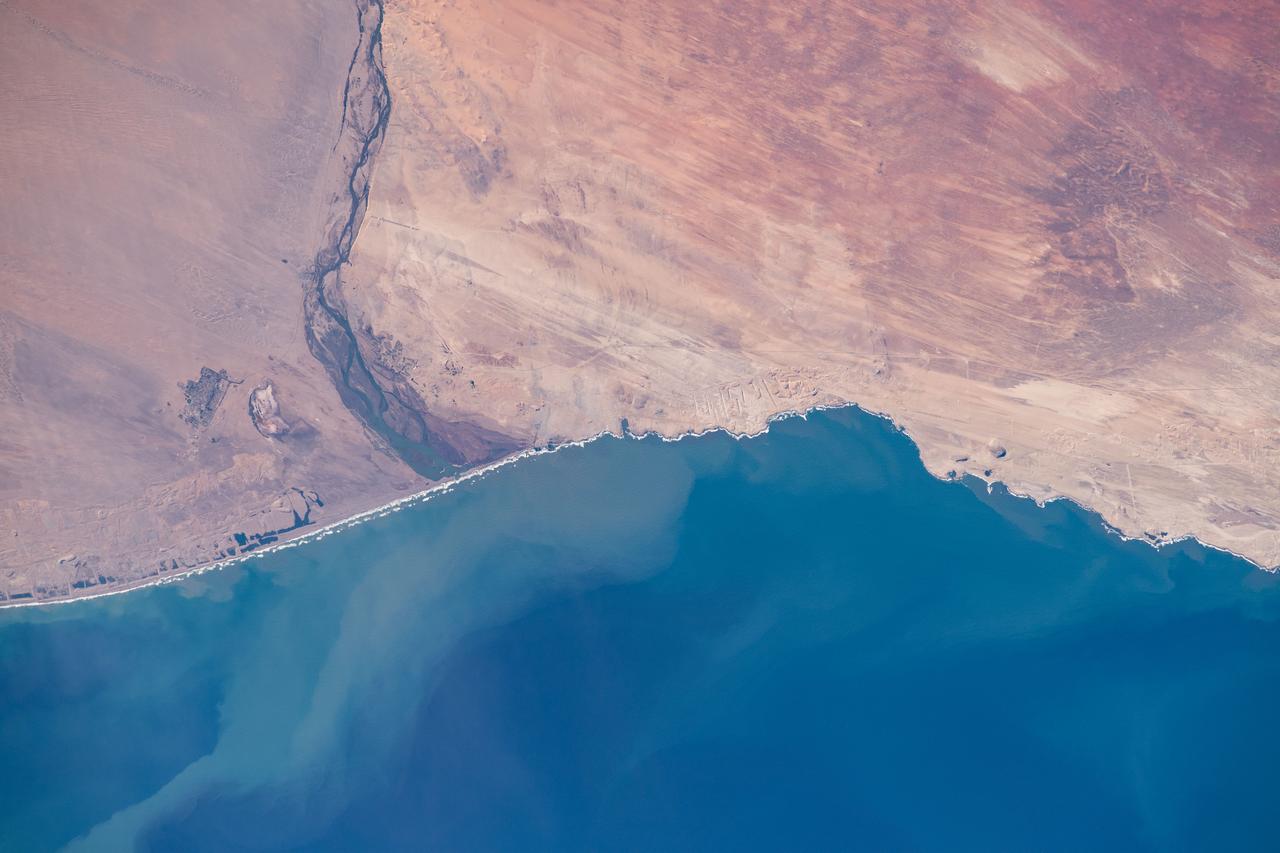
iss060e006420 (July 10, 2019) --- The Orange River separates the nations of Namibia and South Africa as it flows into Alexander Bay on the edge of the Atlantic Ocean. The International Space Station was on a southeastern orbital trek 262 miles above the African continent when an Expedition 60 crewmember captured this Earth observation.
iss056e084388 (July 6, 2018) --- The eastern-flowing Amur River forms a portion of the border between northeastern China and far eastern Russia. At the time of this photograph, the International Space Station was orbiting almost 257 miles above the Strait of Tartary which separates mainland Asia from the Russian island of Sakhalin.

iss050e014941 (12/8/2016) --- NASA astronaut Shane Kimbrough during Capillary Flow Experiment-2 (CFE-2) with the Interior Corner Flow 1 hardware. The Capillary Flow Experiments demonstrate how capillary forces work in space, how differently shaped containers change the wicking behavior of a wetting fluid, and how such can be used to passively separate liquids and gases. Understanding how microgravity amplifies these behaviors could improve the reliability of such key processes as water purification fuel storage and supply, and general liquid transport aboard spacecraft.

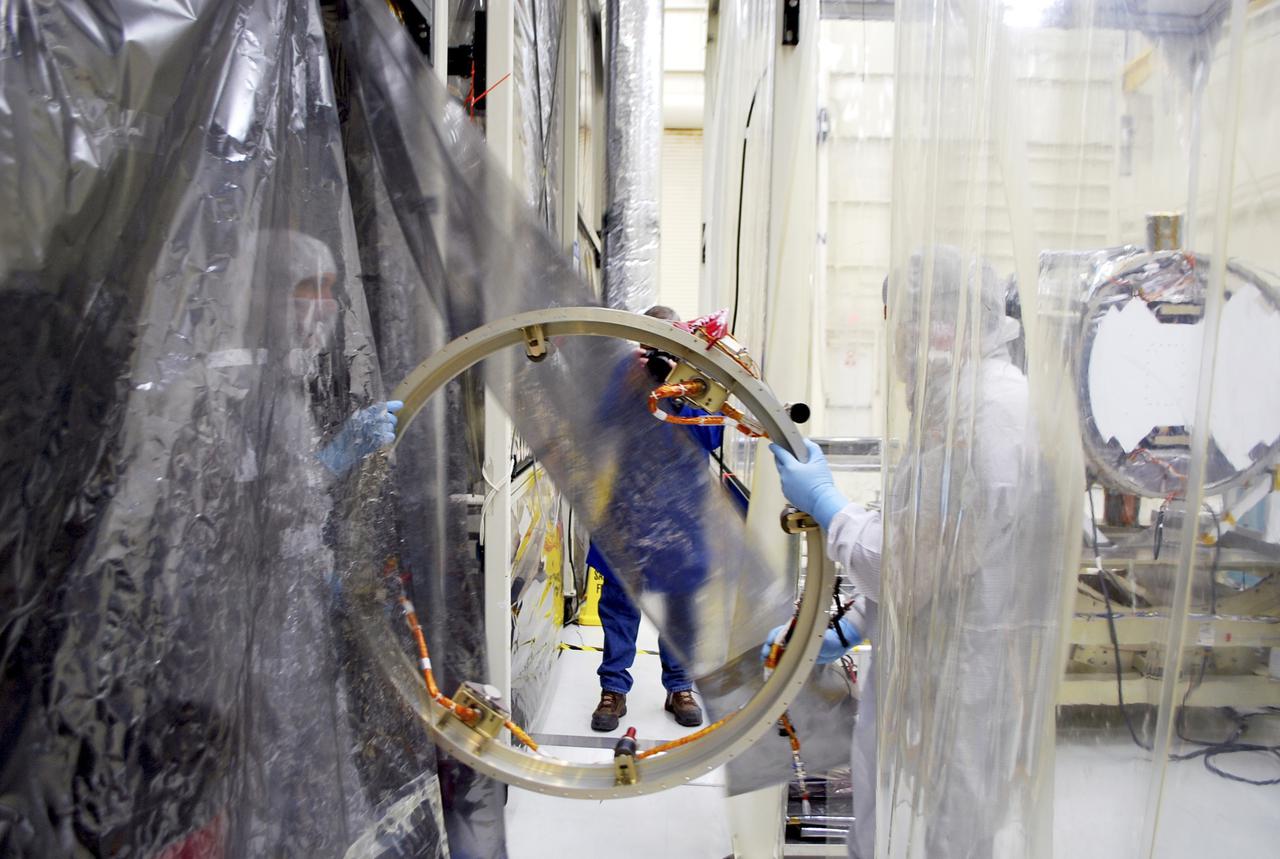
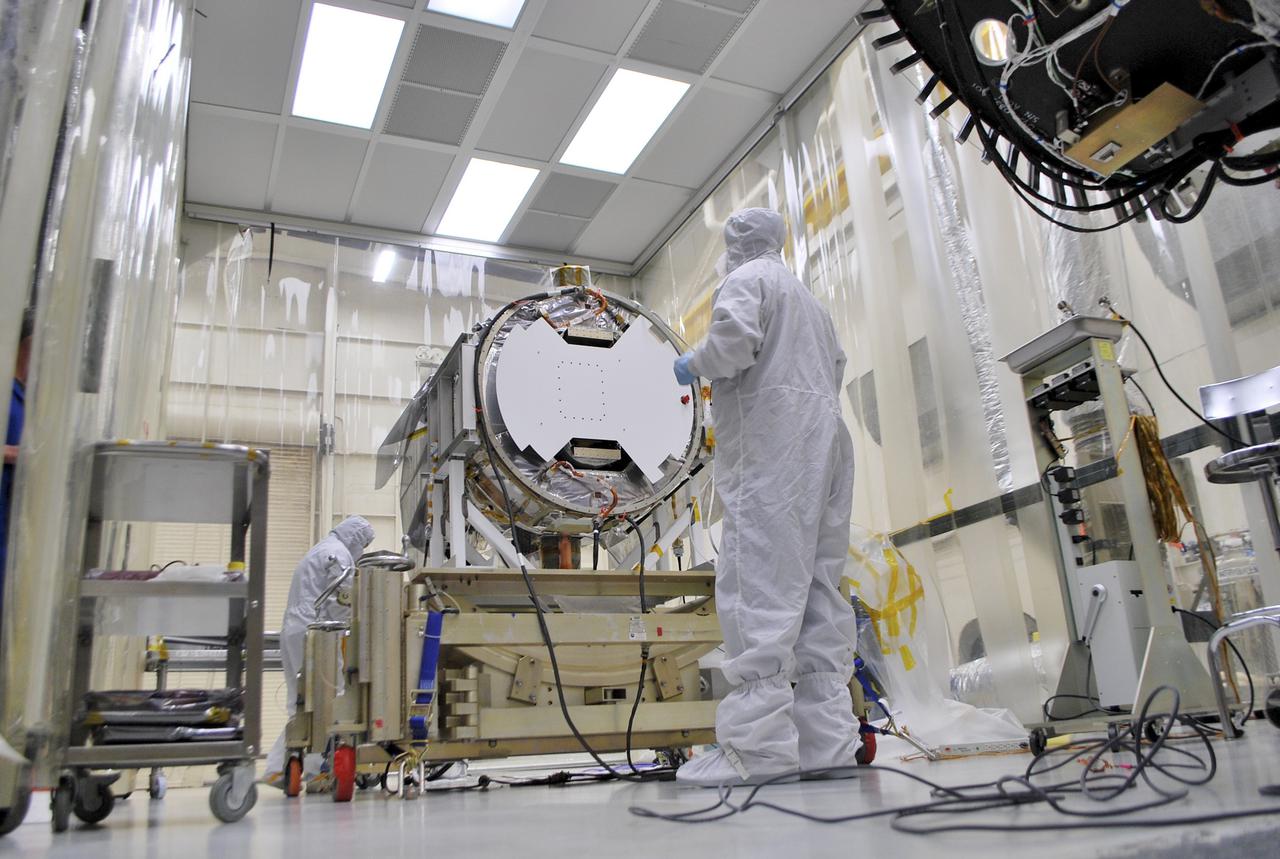
VANDENBERG AFB, Calif. – Members of the IRIS and Pegasus launch teams working in a hangar at Vandenberg prepare the separation ring for connection to NASA's IRIS spacecraft, short for Interface Region Imaging Spectrograph. The separation system will push IRIS away from an Orbital Pegasus XL rocket when the spacecraft reaches its proper orbit after launch. Scheduled for launch from Vandenberg Air Force Base no earlier than June 26, 2013, IRIS will open a new window of discovery by tracing the flow of energy and plasma through the chromospheres and transition region into the sun’s corona using spectrometry and imaging. IRIS fills a crucial gap in our ability to advance studies of the sun-to-Earth connection by tracing the flow of energy and plasma through the foundation of the corona and the region around the sun known as the heliosphere. Photo credit: NASA_Doug Gruben
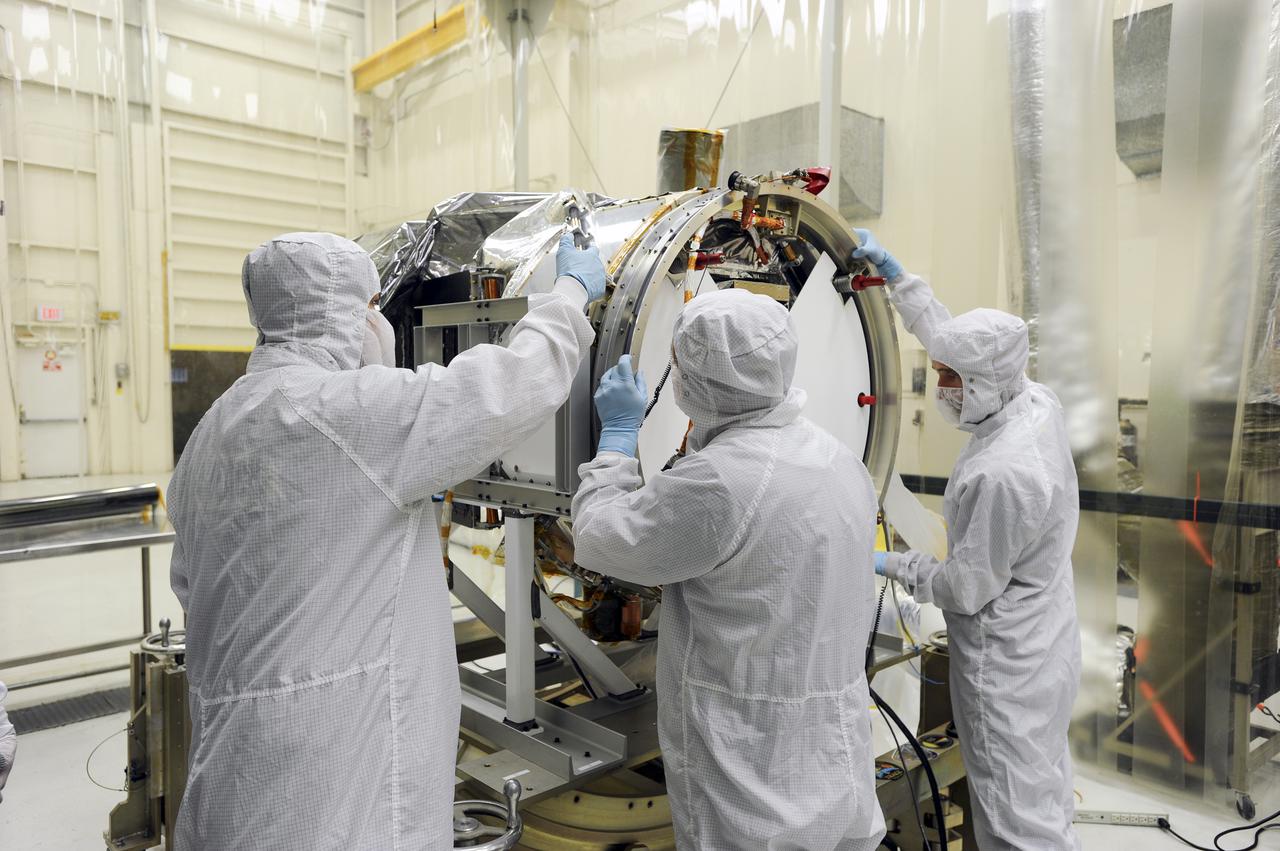
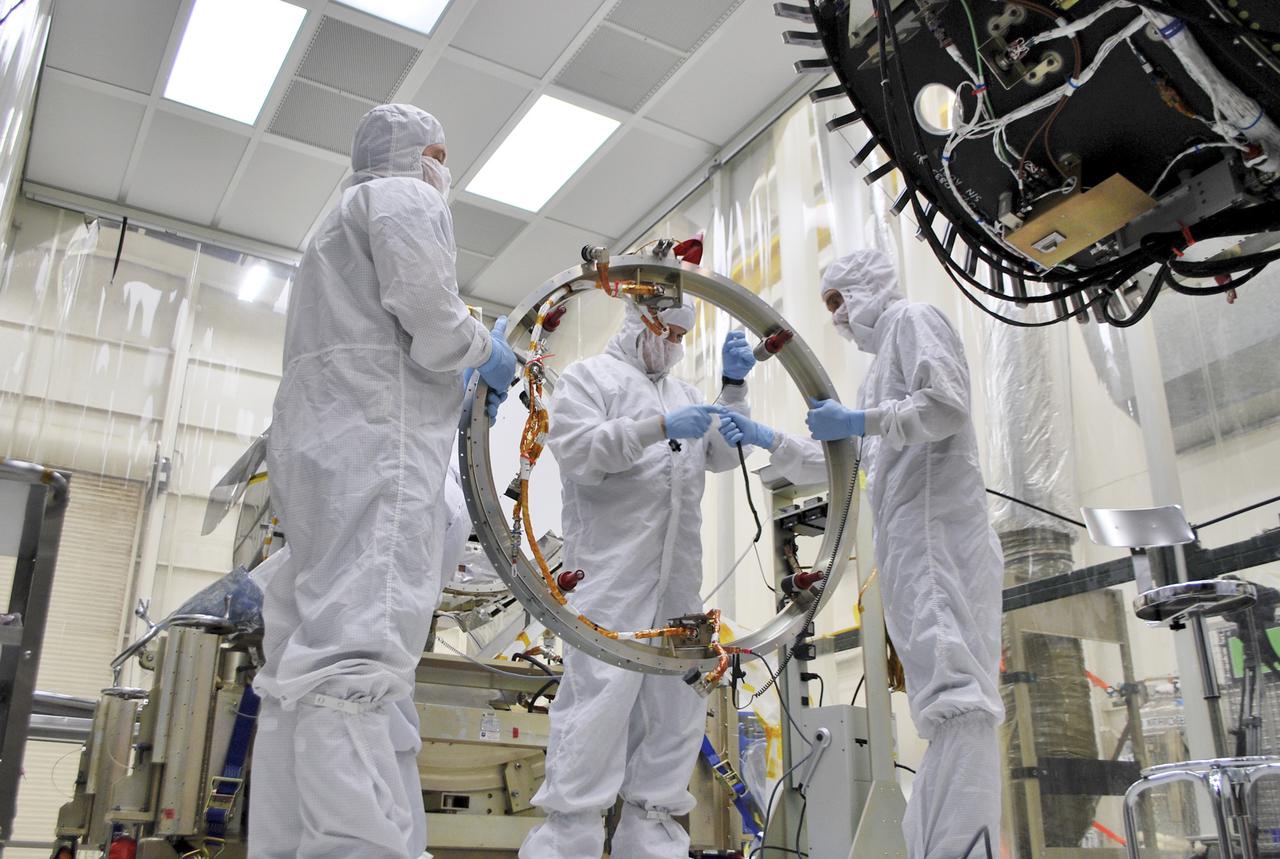
VANDENBERG AFB, Calif. – Members of the IRIS and Pegasus launch teams working in a hangar at Vandenberg connect the separation ring for NASA's IRIS spacecraft, short for Interface Region Imaging Spectrograph. The separation system will push IRIS away from an Orbital Pegasus XL rocket when the spacecraft reaches its proper orbit after launch. Scheduled for launch from Vandenberg Air Force Base no earlier than June 26, 2013, IRIS will open a new window of discovery by tracing the flow of energy and plasma through the chromospheres and transition region into the sun’s corona using spectrometry and imaging. IRIS fills a crucial gap in our ability to advance studies of the sun-to-Earth connection by tracing the flow of energy and plasma through the foundation of the corona and the region around the sun known as the heliosphere. Photo credit: NASA_Doug Gruben
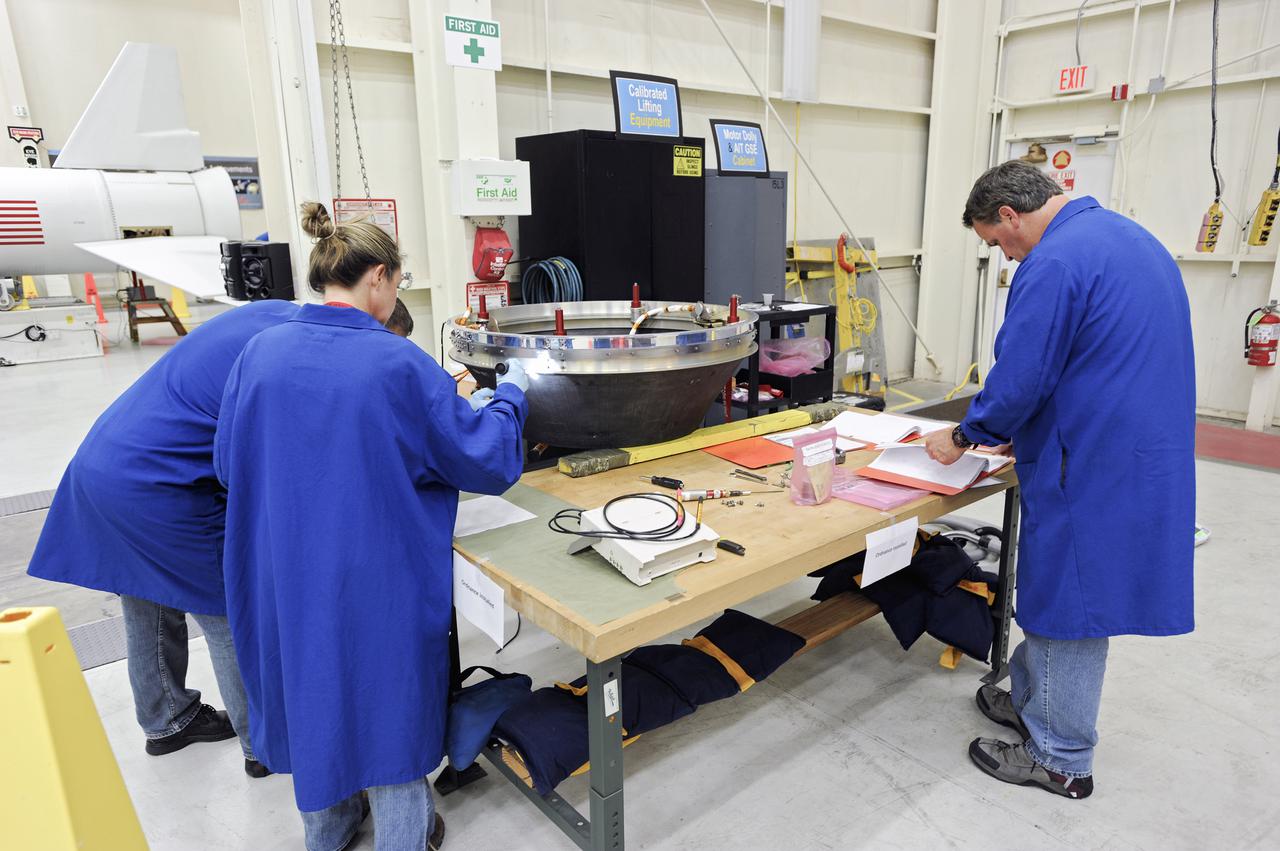
VANDENBERG AIR FORCE BASE, Calif. – At Vandenberg Air Force Base in California, technicians and engineers prepare a separation system ring that will be attached to NASA's Interface Region Imaging Spectrograph, or IRIS, spacecraft. The separation system will push IRIS away from an Orbital Pegasus XL rocket when the spacecraft reaches its proper orbit after launch. Scheduled for launch from Vandenberg Air Force Base no earlier than June 26, 2013, IRIS will open a new window of discovery by tracing the flow of energy and plasma through the chromospheres and transition region into the sun’s corona using spectrometry and imaging. IRIS fills a crucial gap in our ability to advance studies of the sun-to-Earth connection by tracing the flow of energy and plasma through the foundation of the corona and the region around the sun known as the heliosphere. For more information, visit http:__iris.gsfc.nasa.gov Photo credit: NASA_Randy Beaudoin

VANDENBERG AIR FORCE BASE, Calif. – At Vandenberg Air Force Base in California, technicians and engineers prepare a separation system ring that will be attached to NASA's Interface Region Imaging Spectrograph, or IRIS, spacecraft. The separation system will push IRIS away from an Orbital Pegasus XL rocket when the spacecraft reaches its proper orbit after launch. Scheduled for launch from Vandenberg Air Force Base no earlier than June 26, 2013, IRIS will open a new window of discovery by tracing the flow of energy and plasma through the chromospheres and transition region into the sun’s corona using spectrometry and imaging. IRIS fills a crucial gap in our ability to advance studies of the sun-to-Earth connection by tracing the flow of energy and plasma through the foundation of the corona and the region around the sun known as the heliosphere. For more information, visit http:__iris.gsfc.nasa.gov Photo credit: NASA_Randy Beaudoin
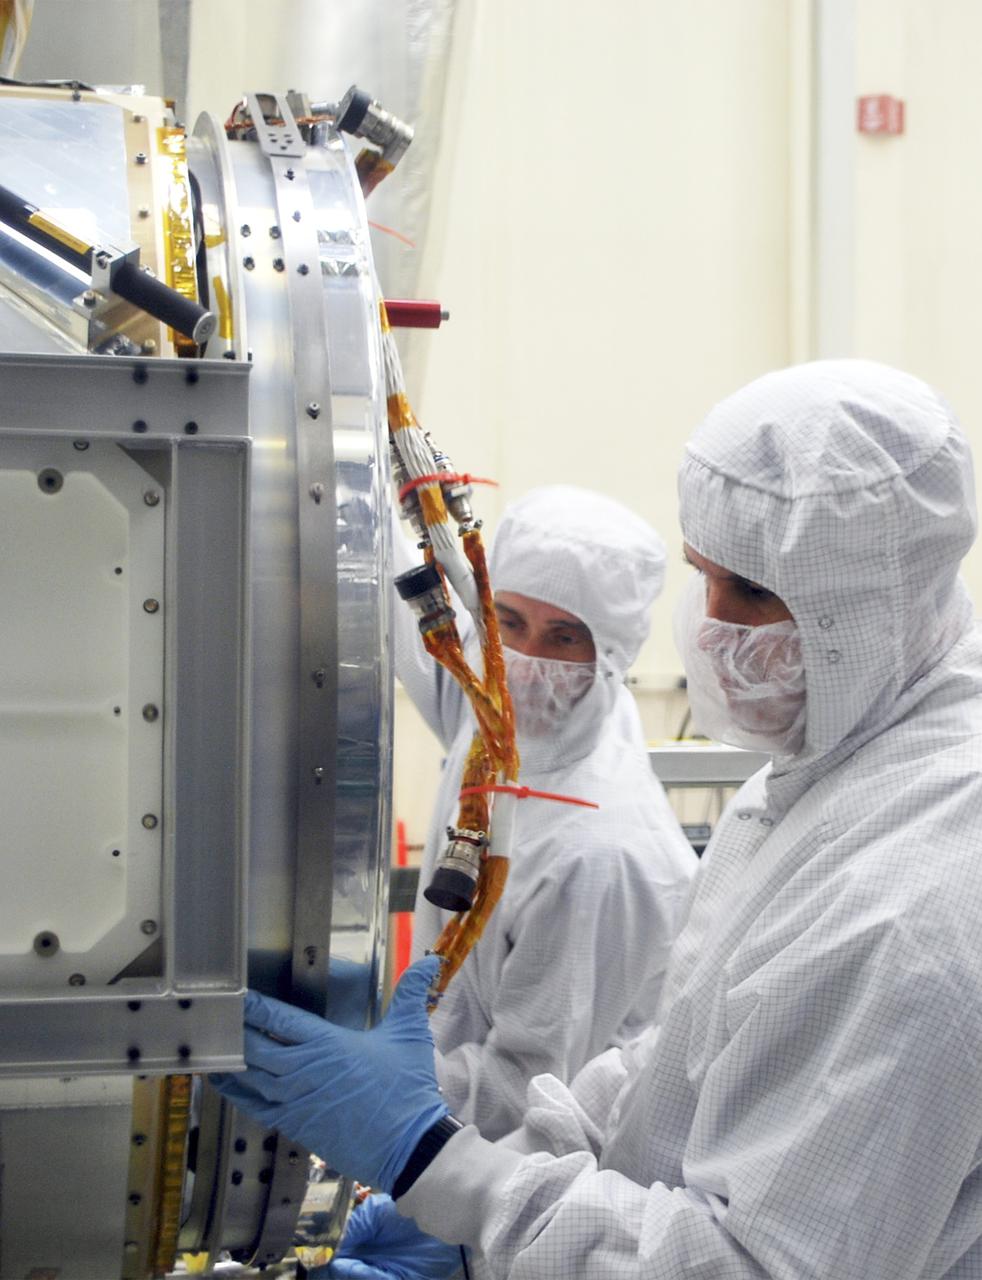
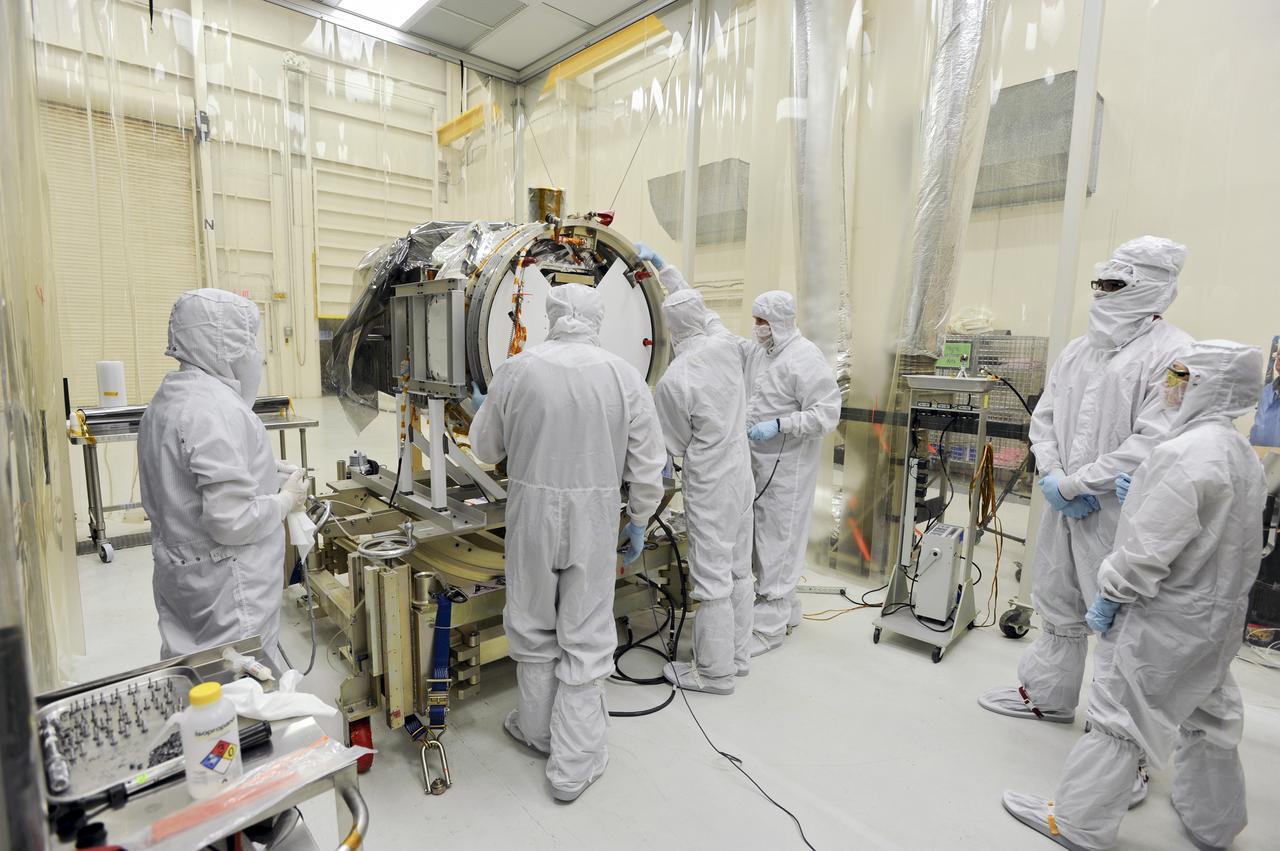
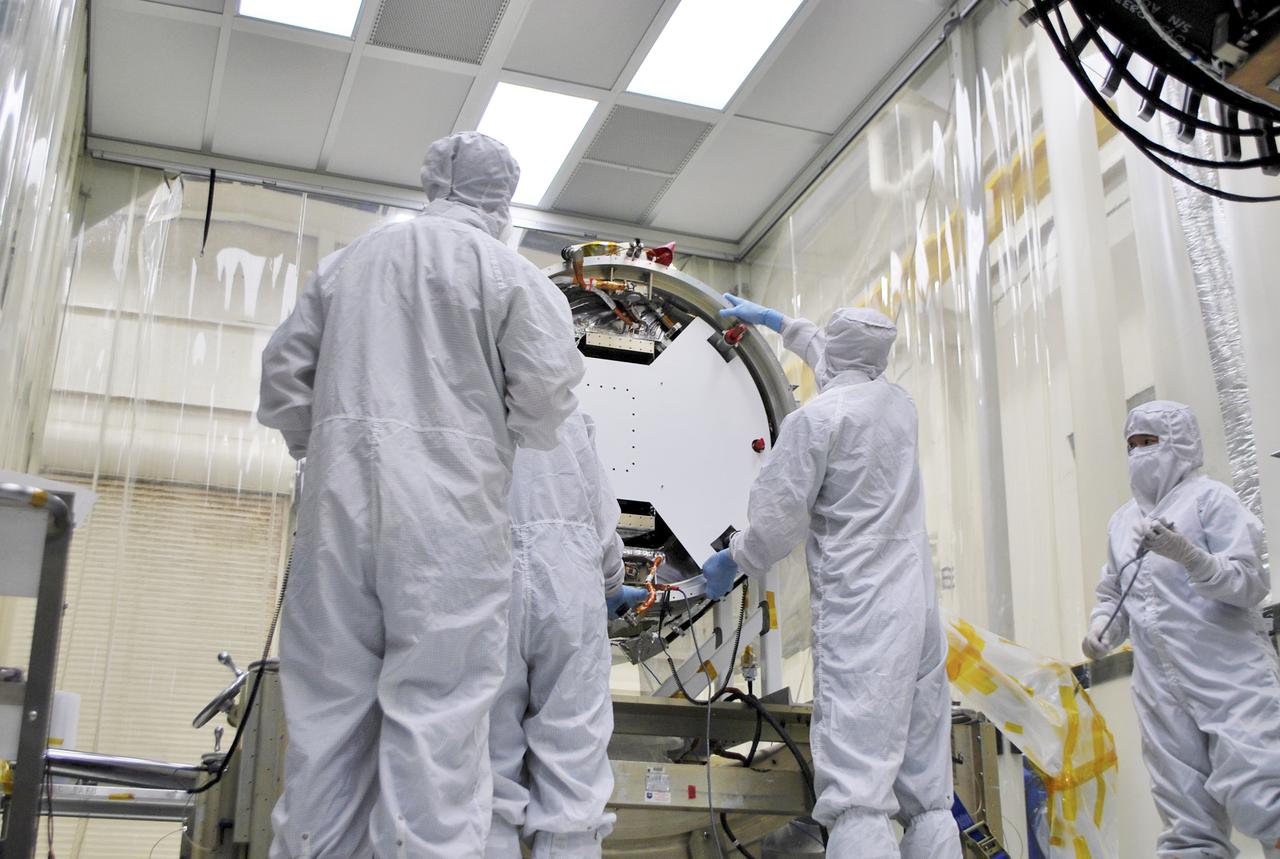
VANDENBERG AIR FORCE BASE, Calif. – At Vandenberg Air Force Base in California, technicians and engineers install a separation system ring that will be attached to NASA's Interface Region Imaging Spectrograph, or IRIS, spacecraft. The separation system will push IRIS away from an Orbital Pegasus XL rocket when the spacecraft reaches its proper orbit after launch. Scheduled for launch from Vandenberg Air Force Base no earlier than June 26, 2013, IRIS will open a new window of discovery by tracing the flow of energy and plasma through the chromospheres and transition region into the sun’s corona using spectrometry and imaging. IRIS fills a crucial gap in our ability to advance studies of the sun-to-Earth connection by tracing the flow of energy and plasma through the foundation of the corona and the region around the sun known as the heliosphere. For more information, visit http:__iris.gsfc.nasa.gov Photo credit: NASA_Randy Beaudoin
VANDENBERG AFB, Calif. – Members of the IRIS and Pegasus launch teams working in a hangar at Vandenberg prepare the separation ring for connection to NASA's IRIS spacecraft, short for Interface Region Imaging Spectrograph. The separation system will push IRIS away from an Orbital Pegasus XL rocket when the spacecraft reaches its proper orbit after launch. Scheduled for launch from Vandenberg Air Force Base no earlier than June 26, 2013, IRIS will open a new window of discovery by tracing the flow of energy and plasma through the chromospheres and transition region into the sun’s corona using spectrometry and imaging. IRIS fills a crucial gap in our ability to advance studies of the sun-to-Earth connection by tracing the flow of energy and plasma through the foundation of the corona and the region around the sun known as the heliosphere. Photo credit: NASA_Doug Gruben
VANDENBERG AIR FORCE BASE, Calif. – At Vandenberg Air Force Base in California, technicians and engineers prepare a separation system ring that will be attached to NASA's Interface Region Imaging Spectrograph, or IRIS, spacecraft. The separation system will push IRIS away from an Orbital Pegasus XL rocket when the spacecraft reaches its proper orbit after launch. Scheduled for launch from Vandenberg Air Force Base no earlier than June 26, 2013, IRIS will open a new window of discovery by tracing the flow of energy and plasma through the chromospheres and transition region into the sun’s corona using spectrometry and imaging. IRIS fills a crucial gap in our ability to advance studies of the sun-to-Earth connection by tracing the flow of energy and plasma through the foundation of the corona and the region around the sun known as the heliosphere. For more information, visit http:__iris.gsfc.nasa.gov Photo credit: NASA_Randy Beaudoin

VANDENBERG AIR FORCE BASE, Calif. – At Vandenberg Air Force Base in California, technicians and engineers prepare a separation system ring that will be attached to NASA's Interface Region Imaging Spectrograph, or IRIS, spacecraft. The separation system will push IRIS away from an Orbital Pegasus XL rocket when the spacecraft reaches its proper orbit after launch. Scheduled for launch from Vandenberg Air Force Base no earlier than June 26, 2013, IRIS will open a new window of discovery by tracing the flow of energy and plasma through the chromospheres and transition region into the sun’s corona using spectrometry and imaging. IRIS fills a crucial gap in our ability to advance studies of the sun-to-Earth connection by tracing the flow of energy and plasma through the foundation of the corona and the region around the sun known as the heliosphere. For more information, visit http:__iris.gsfc.nasa.gov Photo credit: NASA_Randy Beaudoin
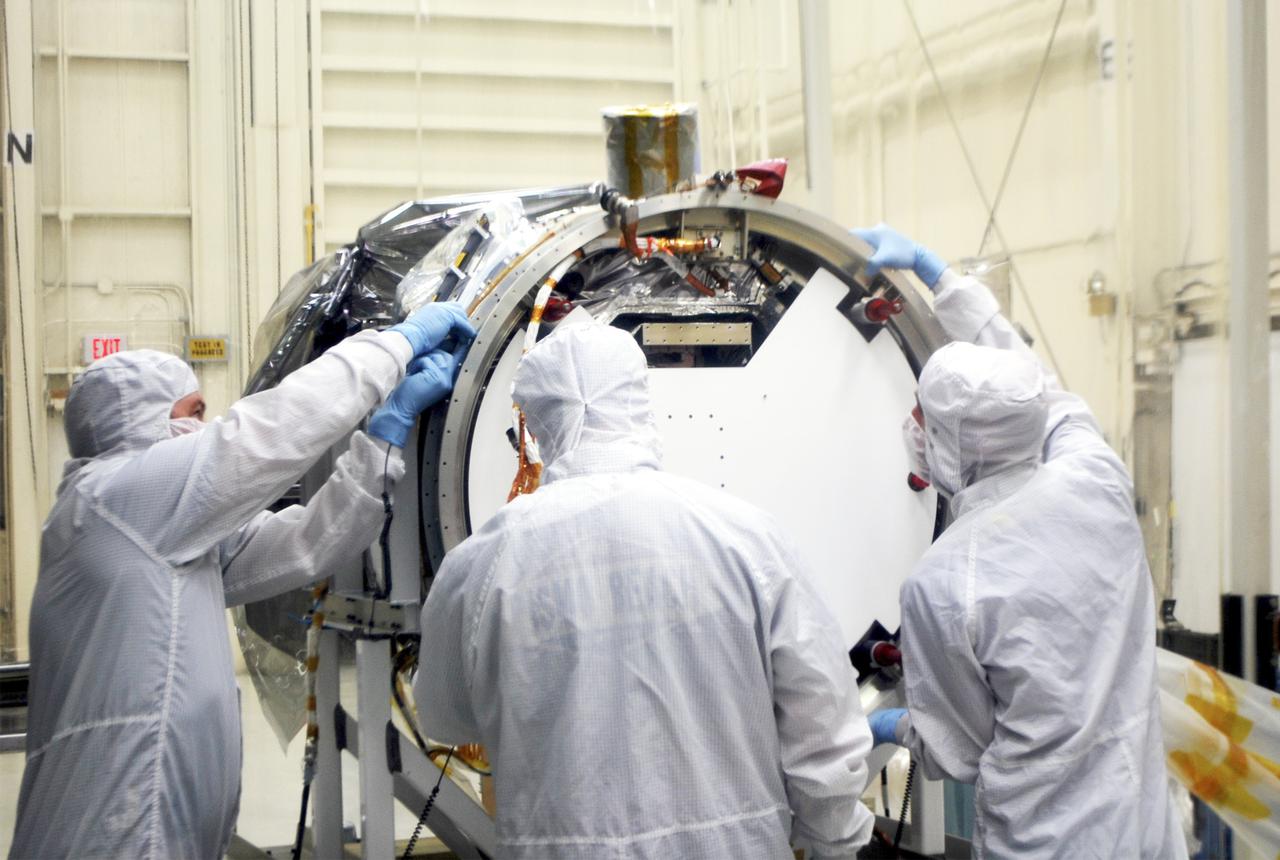
VANDENBERG AIR FORCE BASE, Calif. – At Vandenberg Air Force Base in California, technicians and engineers install a separation system ring that will be attached to NASA's Interface Region Imaging Spectrograph, or IRIS, spacecraft. The separation system will push IRIS away from an Orbital Pegasus XL rocket when the spacecraft reaches its proper orbit after launch. Scheduled for launch from Vandenberg Air Force Base no earlier than June 26, 2013, IRIS will open a new window of discovery by tracing the flow of energy and plasma through the chromospheres and transition region into the sun’s corona using spectrometry and imaging. IRIS fills a crucial gap in our ability to advance studies of the sun-to-Earth connection by tracing the flow of energy and plasma through the foundation of the corona and the region around the sun known as the heliosphere. For more information, visit http:__iris.gsfc.nasa.gov Photo credit: NASA_Randy Beaudoin

VANDENBERG AIR FORCE BASE, Calif. – At Vandenberg Air Force Base in California, technicians and engineers install a separation system ring that will be attached to NASA's Interface Region Imaging Spectrograph, or IRIS, spacecraft. The separation system will push IRIS away from an Orbital Pegasus XL rocket when the spacecraft reaches its proper orbit after launch. Scheduled for launch from Vandenberg Air Force Base no earlier than June 26, 2013, IRIS will open a new window of discovery by tracing the flow of energy and plasma through the chromospheres and transition region into the sun’s corona using spectrometry and imaging. IRIS fills a crucial gap in our ability to advance studies of the sun-to-Earth connection by tracing the flow of energy and plasma through the foundation of the corona and the region around the sun known as the heliosphere. For more information, visit http:__iris.gsfc.nasa.gov Photo credit: NASA_Randy Beaudoin
VANDENBERG AIR FORCE BASE, Calif. – At Vandenberg Air Force Base in California, technicians and engineers prepare a separation system ring that will be attached to NASA's Interface Region Imaging Spectrograph, or IRIS, spacecraft. The separation system will push IRIS away from an Orbital Pegasus XL rocket when the spacecraft reaches its proper orbit after launch. Scheduled for launch from Vandenberg Air Force Base no earlier than June 26, 2013, IRIS will open a new window of discovery by tracing the flow of energy and plasma through the chromospheres and transition region into the sun’s corona using spectrometry and imaging. IRIS fills a crucial gap in our ability to advance studies of the sun-to-Earth connection by tracing the flow of energy and plasma through the foundation of the corona and the region around the sun known as the heliosphere. For more information, visit http:__iris.gsfc.nasa.gov Photo credit: NASA_Randy Beaudoin
VANDENBERG AFB, Calif. – Members of the IRIS and Pegasus launch teams working in a hangar at Vandenberg work connect the separation ring for NASA's IRIS spacecraft, short for Interface Region Imaging Spectrograph. The separation system will push IRIS away from an Orbital Pegasus XL rocket when the spacecraft reaches its proper orbit after launch. Scheduled for launch from Vandenberg Air Force Base no earlier than June 26, 2013, IRIS will open a new window of discovery by tracing the flow of energy and plasma through the chromospheres and transition region into the sun’s corona using spectrometry and imaging. IRIS fills a crucial gap in our ability to advance studies of the sun-to-Earth connection by tracing the flow of energy and plasma through the foundation of the corona and the region around the sun known as the heliosphere. Photo credit: NASA_Doug Gruben
VANDENBERG AIR FORCE BASE, Calif. – At Vandenberg Air Force Base in California, technicians and engineers install a separation system ring that will be attached to NASA's Interface Region Imaging Spectrograph, or IRIS, spacecraft. The separation system will push IRIS away from an Orbital Pegasus XL rocket when the spacecraft reaches its proper orbit after launch. Scheduled for launch from Vandenberg Air Force Base no earlier than June 26, 2013, IRIS will open a new window of discovery by tracing the flow of energy and plasma through the chromospheres and transition region into the sun’s corona using spectrometry and imaging. IRIS fills a crucial gap in our ability to advance studies of the sun-to-Earth connection by tracing the flow of energy and plasma through the foundation of the corona and the region around the sun known as the heliosphere. For more information, visit http:__iris.gsfc.nasa.gov Photo credit: NASA_Randy Beaudoin

Astronaut Karen Nyberg,Expedition 36 flight engineer,works on the Capillary Flow Experiment (CFE) Vane Gap-1 (VG-1) setup in the Node 2/Harmony. The CFE-2 vessel is used to observe fluid interface and critical wetting behavior in a cylindrical chamber with elliptic cross-section and an adjustable central perforated vane. The primary objective of the Vane Gap experiments is to determine equilibrium interface configurations and critical wetting conditions for interfaces between interior corners separated by a gap.
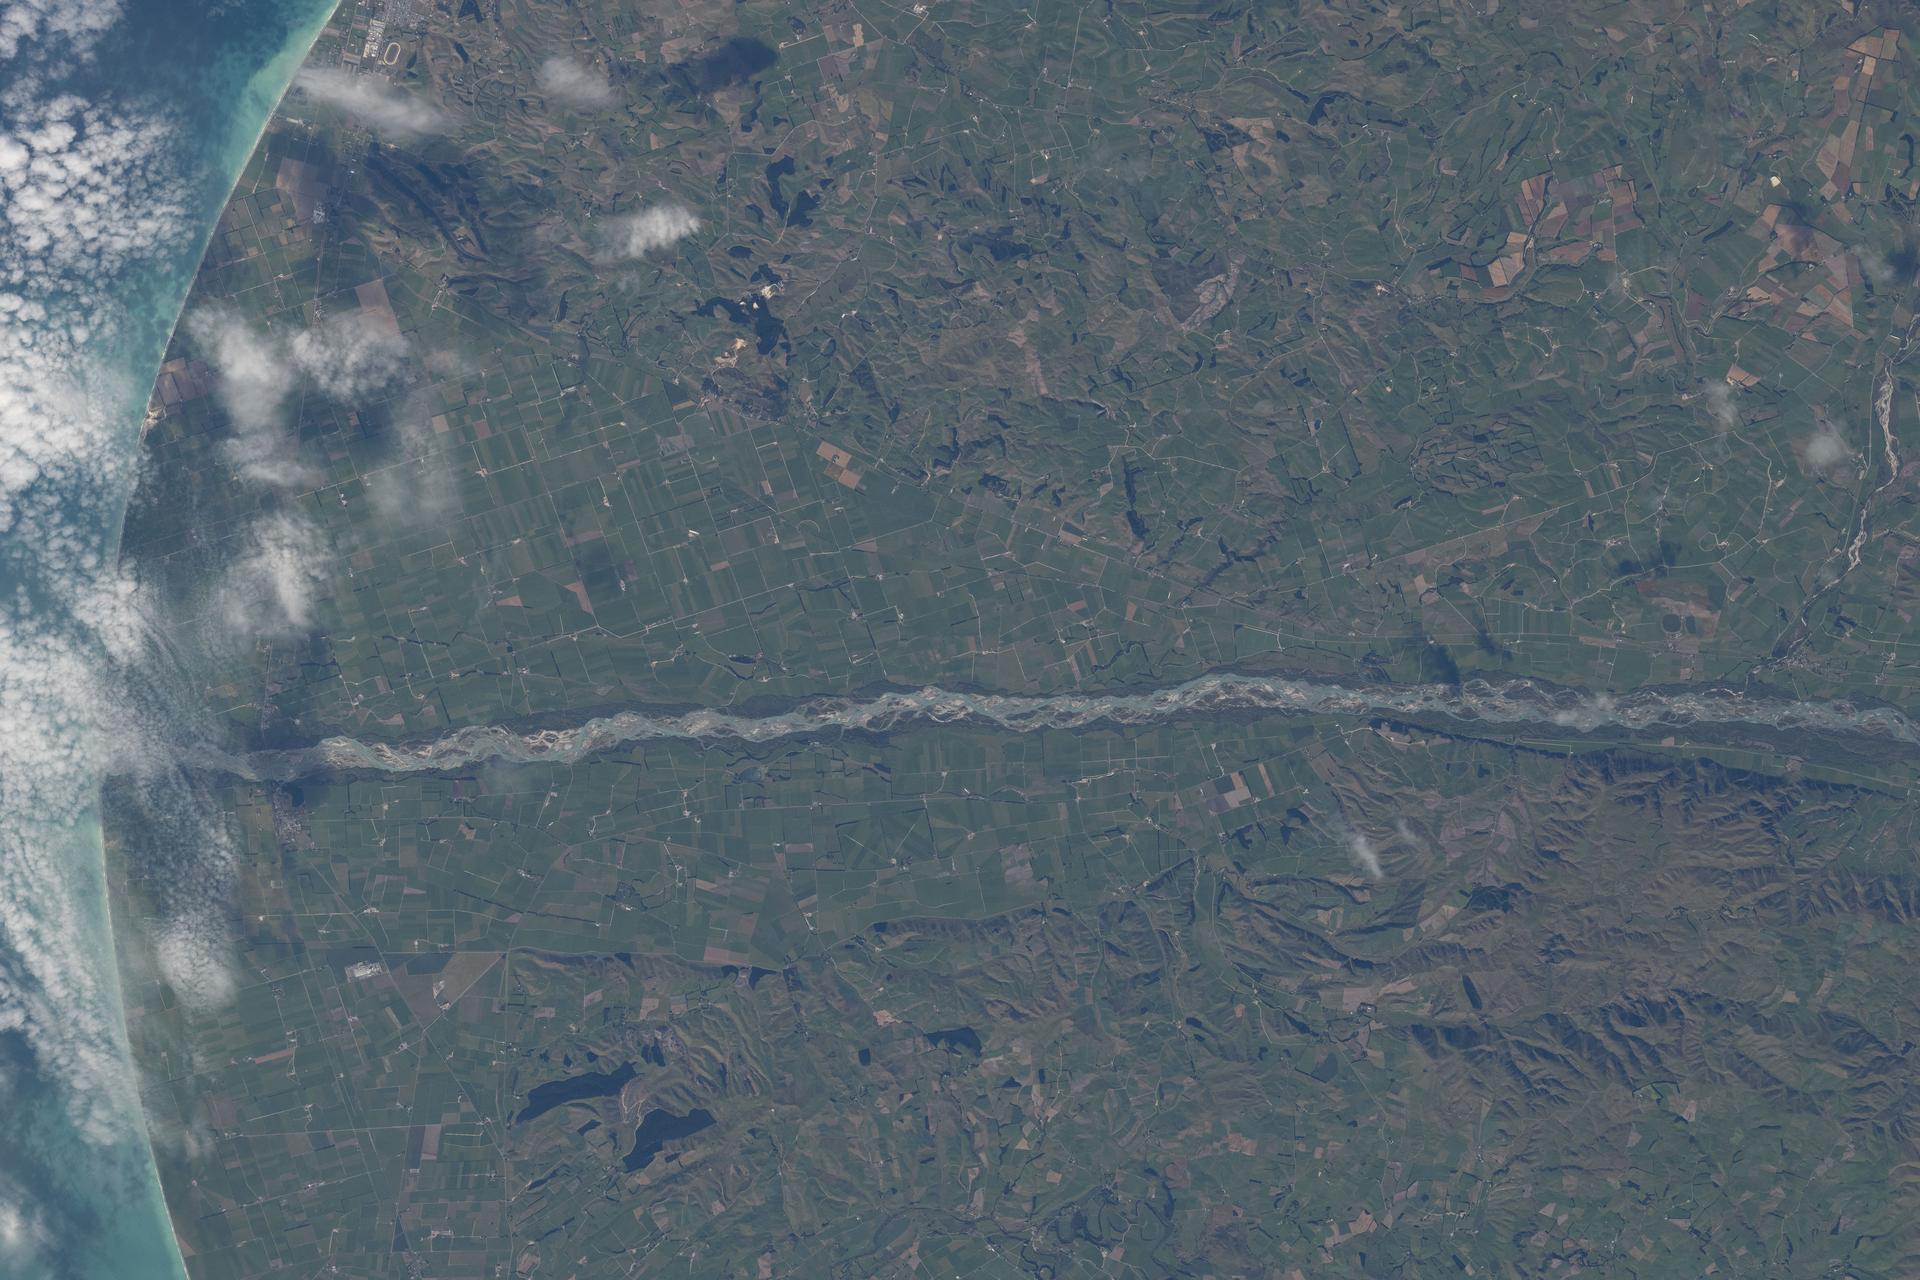
iss074e0375261 (March 7, 2026) --- The Waitaki River separates New Zealand’s Otago Region (top) from the Canterbury Region (bottom) along the nation’s South Pacific coast. The Waitaki is fed by glacial lakes, flows through three major hydroelectric lakes, and anchors one of New Zealand’s largest hydroelectric networks. The coastal area surrounding the river is flat, fertile, and ideal for farming. Credit: NASA/Chris Williams
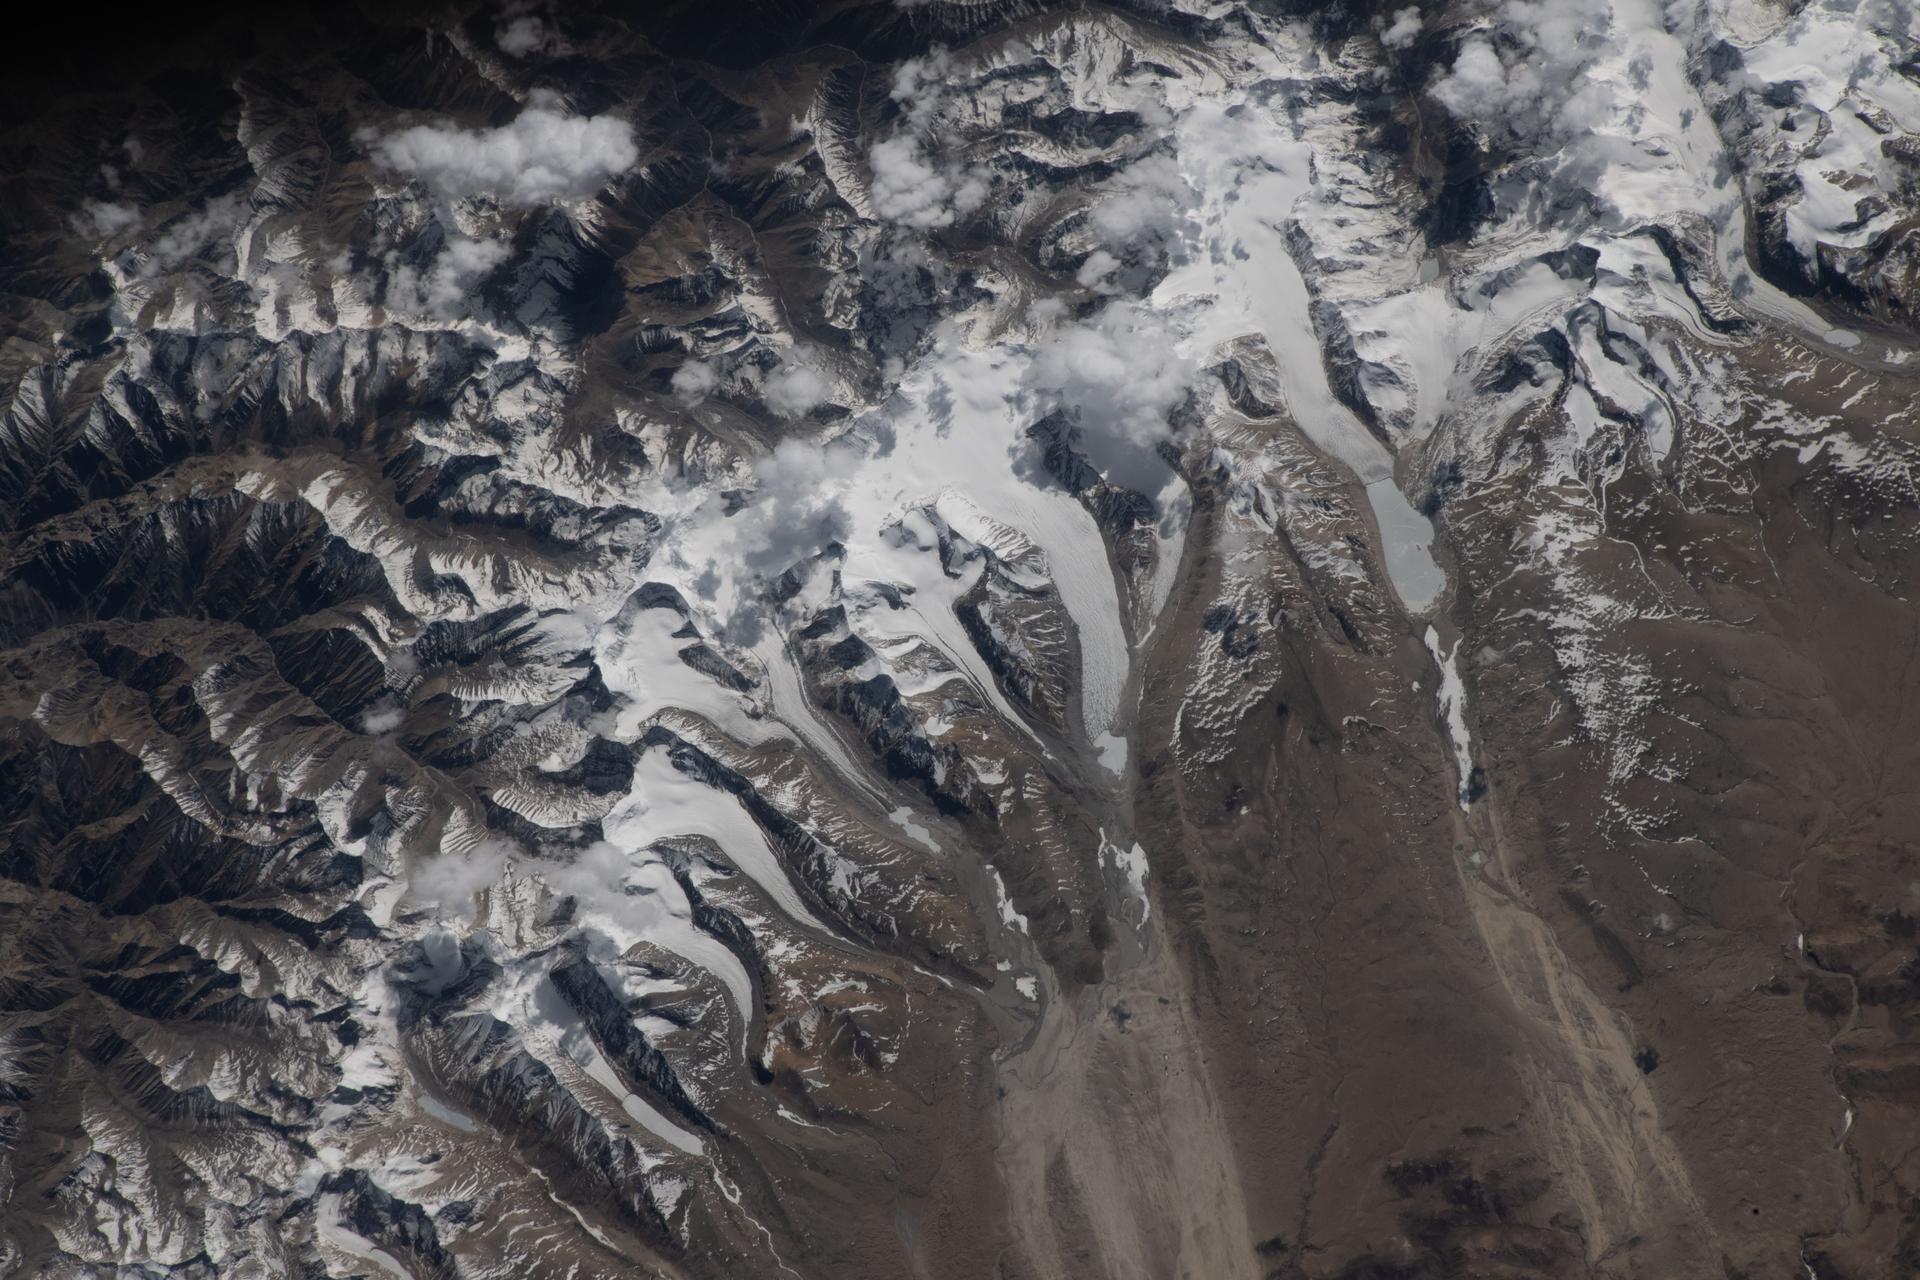
iss074e0603582 (May 20, 2026) --- The Himalayas separate Nepal from China in this photograph from the International Space Station as it orbited 259 miles above the western Tibetan Plateau. Glaciers—slow‑moving rivers of ice that carve paths into mountainsides—flow downhill from the Himalayas’ northern slopes onto China's Tibetan Plateau. Credit: NASA/Jessica Meir
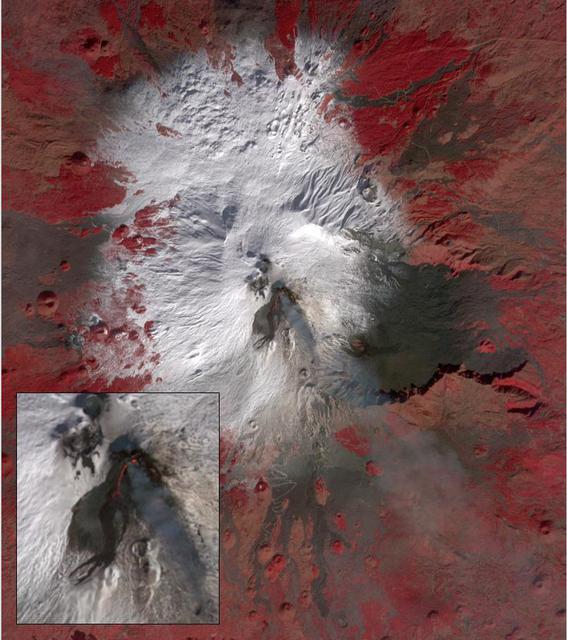
Starting December 13, 2020, a strong eruptive episode began at Mt. Etna's New SE summit crater. Lava fountains produced a new lava flow, traveling to the SW. The fresh lava is hot enough to be incandescent, and appears as a red "snake" issuing from the crater's flank. The lava fountain appears as a separate red area at the crater's summit. A faint gray plume streams southeastward from the crater. Analysis of the thermal infrared data reveals that the plume's composition is dominated by SO2. The image was acquired December 15, 2020, covers an area of 12 by 13.5 km, and is located at 37.7 degrees north, 15 degrees east. https://photojournal.jpl.nasa.gov/catalog/PIA24283
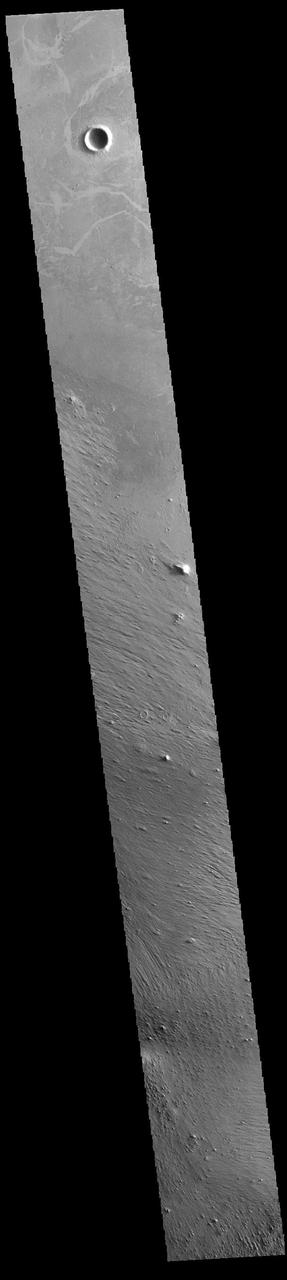
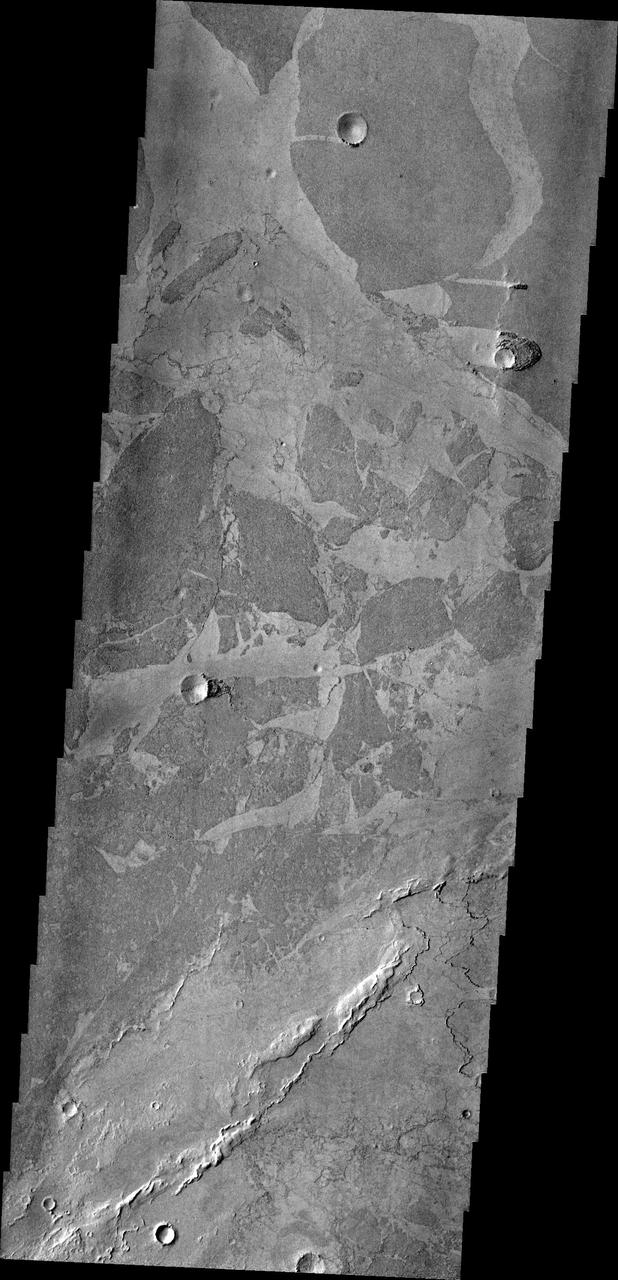
Today's VIS image shows part of Zephyria Planum. Zephyria Planum is located south of Elysium Planitia. Long term winds have eroded the surface of Zephyria Planum (bottom half of image). Elysium Planitia covers the top half of the image. The surface contains what looks like plates of material separated by lighter toned regions. This morphology is common in southern Elysium Planitia and it has been suggested that the 'plates' were cooled lava carried along the top of a still molten volcanic flow. Orbit Number: 94719 Latitude: 3.29115 Longitude: 153.155 Instrument: VIS Captured: 2023-04-22 11:11 https://photojournal.jpl.nasa.gov/catalog/PIA26153

STS004-28-312 (27 June-4 July 1982) --- Astronaut Thomas K. Mattingly II, STS-4 crew commander, prepares a meal in the middeck area of space shuttle Columbia. He uses scissors to open a drink container. Various packages of food and meal accessories are attached to locker doors. At far left edge of the frame is the tall payload called continuous flow electrophoresis experiment (CFES) system-designed to separate biological materials according to their surface electrical charges as they pass through an electrical field. Astronaut Henry W. Hartsfield Jr. exposed this frame with a 35mm camera. Photo credit: NASA

An artist's rendition of how a rocky planet forms. As a rocky planet forms, the planet-forming material gathers in a process known as "accretion." It grows larger in size, and increases in temperature, along with the pressure at its core. The energy from this initial planet forming process causes the planet's elements to heat up and melt. Upon melting, layers form and separate. The heavier elements sink to the bottom, the lighter ones float to the top. This material then separates into layers as it cools, which is known as "differentiation." A fully formed planet slowly emerges, with an upper layer known as the crust, the mantle in the middle, and a solid iron core. InSight is short for Interior Exploration using Seismic Investigations, Geodesy and Heat Transport. The InSight mission will help answer key questions about how the rocky planets of the solar system, as well as how rocky exoplanets, formed. So while InSight is a Mars mission, it's also more than a Mars mission. The lander seeks the fingerprints of the processes that formed the rocky planets of the solar system, more than 4 billion years ago. It measures the planet's "vital signs:" its "pulse" (seismology), "temperature" (heat flow) and "reflexes" (precision tracking). https://photojournal.jpl.nasa.gov/catalog/PIA22233
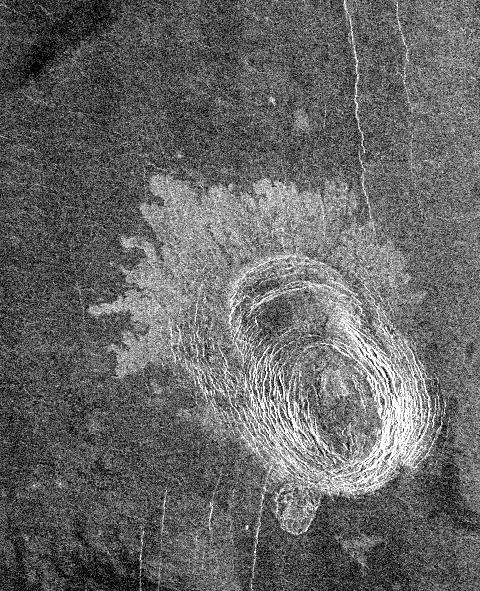
This image from NASA Magellan spacecraft is of Sachs Patera on Venus, centered at 49 degrees north, 334 degrees east. Defined as a sag-caldera, Sachs is an elliptical depression 130 meters (81 feet) in depth, spanning 40 kilometers (25 miles) in width along its longest axis. The morphology implies that a chamber of molten material drained and collapsed, forming a depression surrounded by concentric scarps spaced 2-to-5 kilometers (1.2- to-3 miles) apart. The arc-shaped set of scarps, extending out to the north from the prominent ellipse, is evidence for a separate episode of withdrawal; the small lobe-shaped extension to the southwest may represent an additional event. Solidified lava flows 10-to-25 kilometers (6-to-16 miles) long, give the caldera its flower-like appearance. The flows are a lighter tone of gray in the radar data because the lava is blockier in texture and consequently returns more radar waves. Much of the lava, which was evacuated from the chamber, probably traveled to other locations underground, while some of it may have surfaced further south. This is unlike calderas on Earth, where a rim of lava builds up in the immediate vicinity of the caldera. http://photojournal.jpl.nasa.gov/catalog/PIA00473
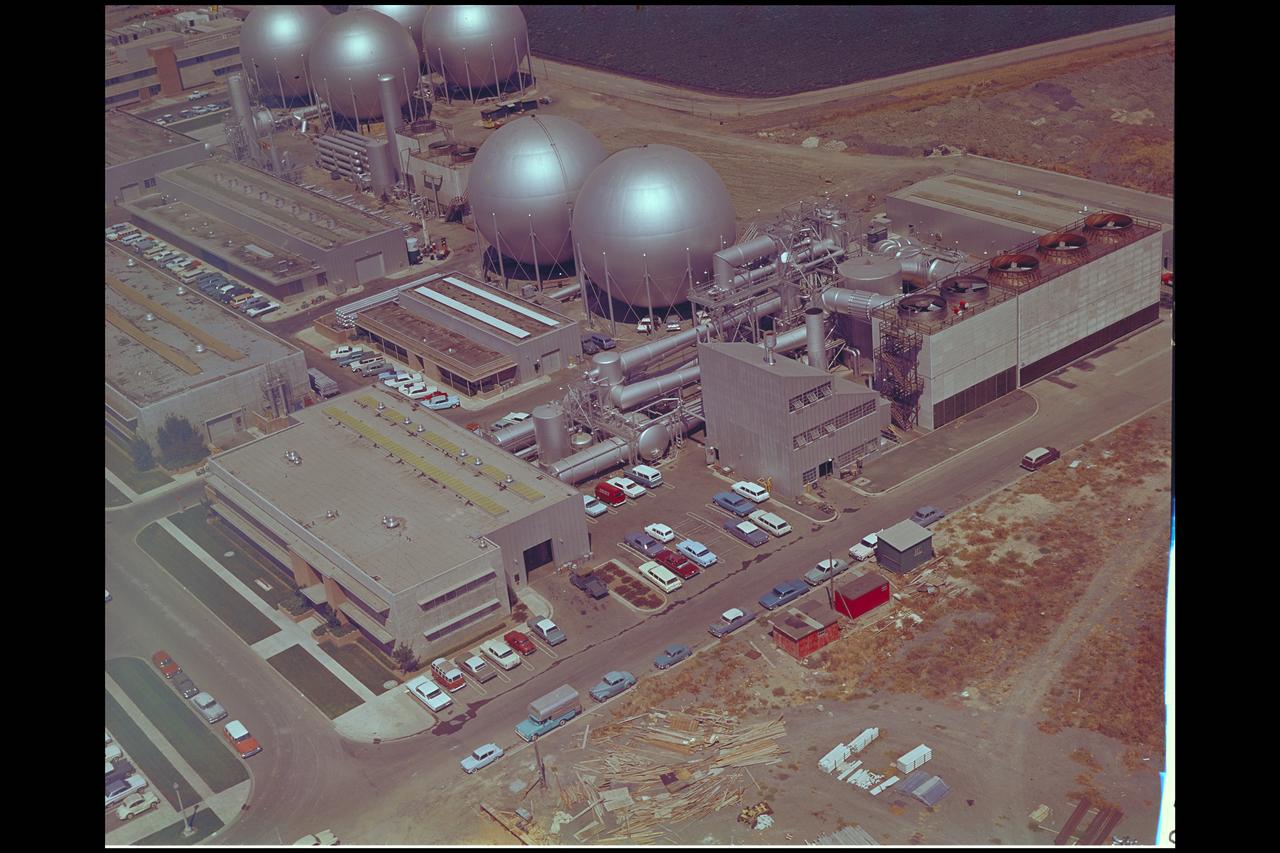
Aerial view of Gasdynamics facility in 1964 and the 20 inch helium tunnel Part of the Thermal Protection Laboratory used to research materials for heat shield applications and for aerodynamic heating and materials studies of vehicles in planetary atmospheres. This laboratory is comprised of five separate facilities: an Aerodynamic Heating Tunnel, a Heat Transfer Tunnel, two Supersonic Turbulent Ducts, and a High-Power CO2 Gasdynamic Laser. All these facilities are driven by arc-heaters, with the exception of the large, combustion-type laser. The arc-heated facilities are powered by a 20 Megawatt DC power supply. Their effluent gas stream (test gases; Air, N2, He, CO2 and mixtures; flow rates from 0.05 to 5.0 lbs/sec) discharges into a five-stage stream-ejector-driven vacuum system. The vacuum system and power supply are common to the test faciities in building N-238. All of the facilities have high pressure water available at flow rates up to 4, 000 gals/min. The data obtained from these facilities are recorded on magnetic tape or oscillographs. All forms of data can be handled whether from thermo-couples, pressure cells, pyrometers, or radiometers, etc. in addition, closed circuit T. V. monitors and various film cameras are available. (operational since 1962)
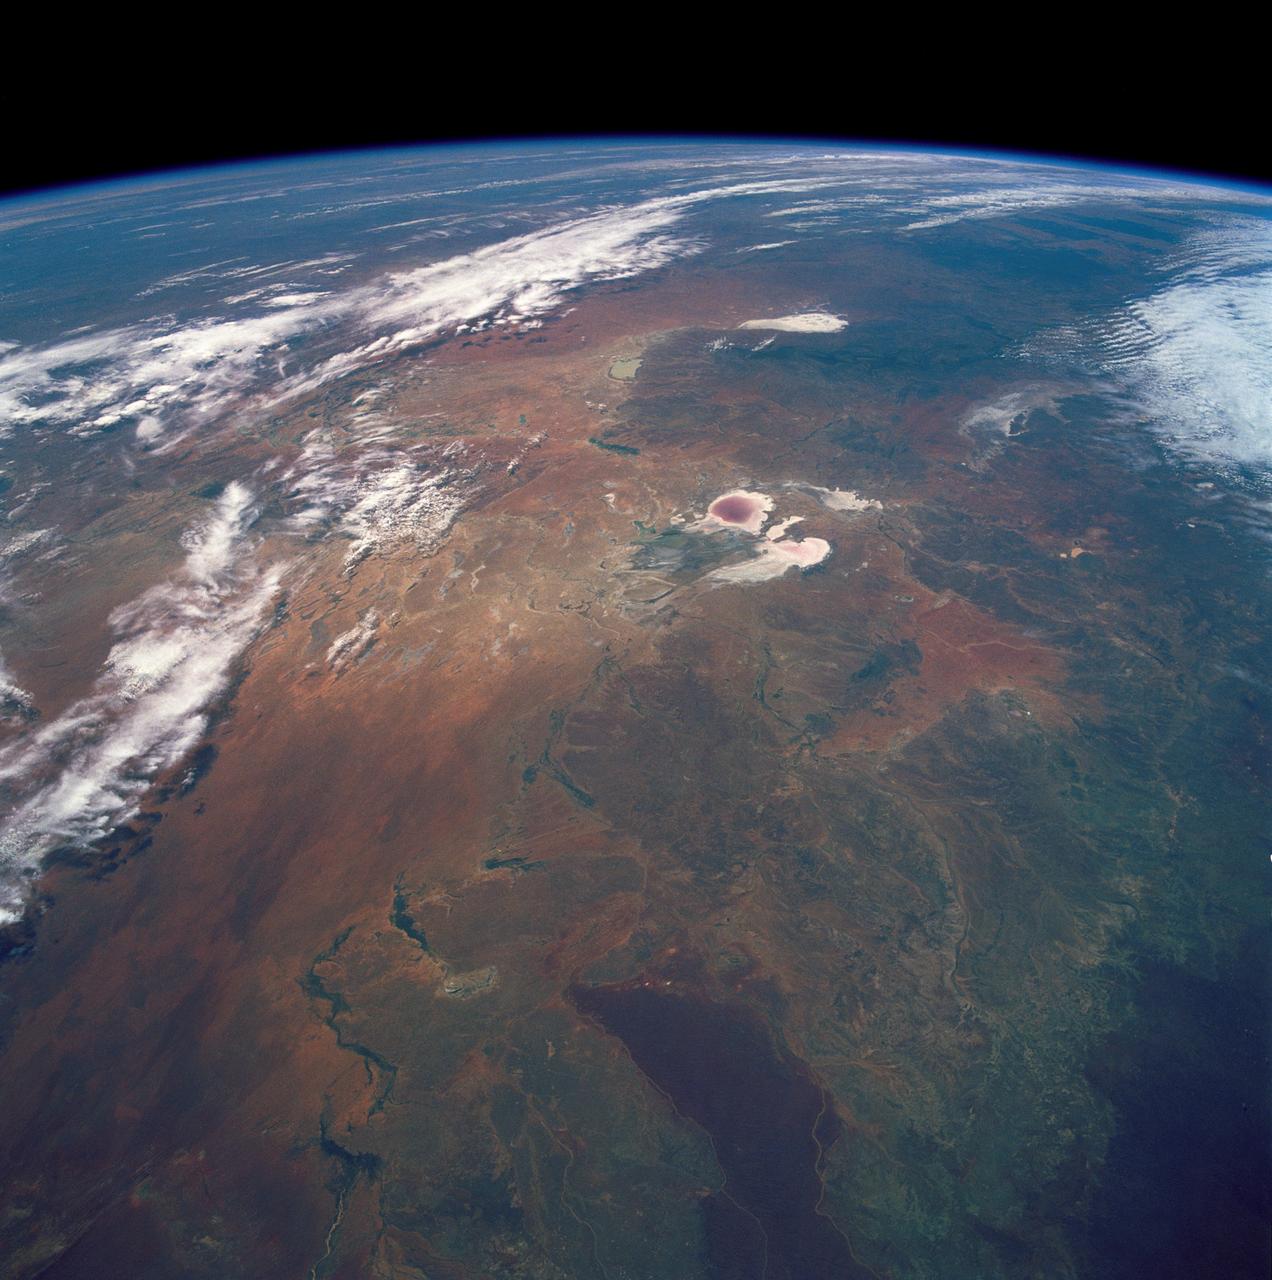
STS035-501-007 (2-10 Dec. 1990) --- The STS-35 crewmembers aboard the Earth-orbiting Space Shuttle Columbia photographed this view of the Arid Simpson Desert of Australia with a handheld Rolleiflex camera. Lake Eyre is normally dry; however, the STS-35 crew was able to recognize water in the lowest parts of the lake (dark pink area) and possibly in Lake Blanche east of Lake Eyre. Lake Frome lies in the distance separated from Lake Torrens (top right) by dark hills of Flinders Range. The Finke River (bottom left to middle) flows into the Eyre basin from the northwest. Although it is the largest river entering the basin, Finke's floods seldom reach Lake Eyre. The dark brown patch in the foreground is an area of ancient, brown lateritic soils partly covered by dunes.
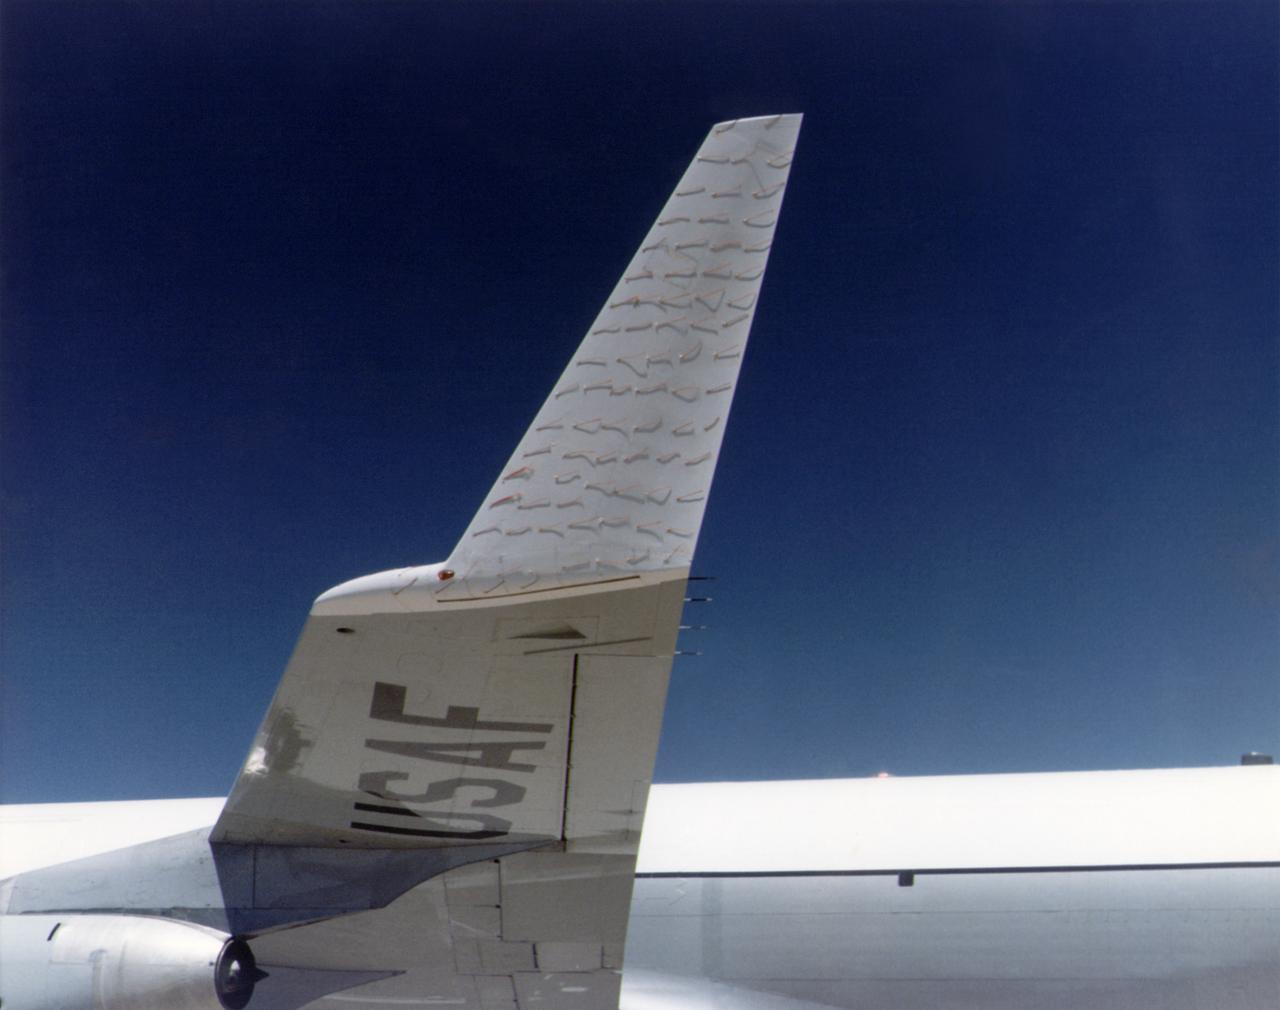
A chase plane view of the tufts on the KC-135 winglet. The use of tufts in flight research dates back to the early days of the NACA, and remains an effective means of observing airflow even today. In this procedure, rows of strings are attached to an airplane's surface, with one end of each string taped to the airplane and the other end free to swing about in the airflow. The movements of the tufts are photographed by on-board cameras or a chase plane. If the tufts are arrayed in neat rows, as seen here, then the airflow is smooth over the airplane's surface. If, however, they are moving about violently, it suggests turbulent airflow. Such motions may indicate high drag, flow separation (such as in a stall), or buffeting. In some cases, tufts will actually point forward, indicating the airflow has reversed direction.
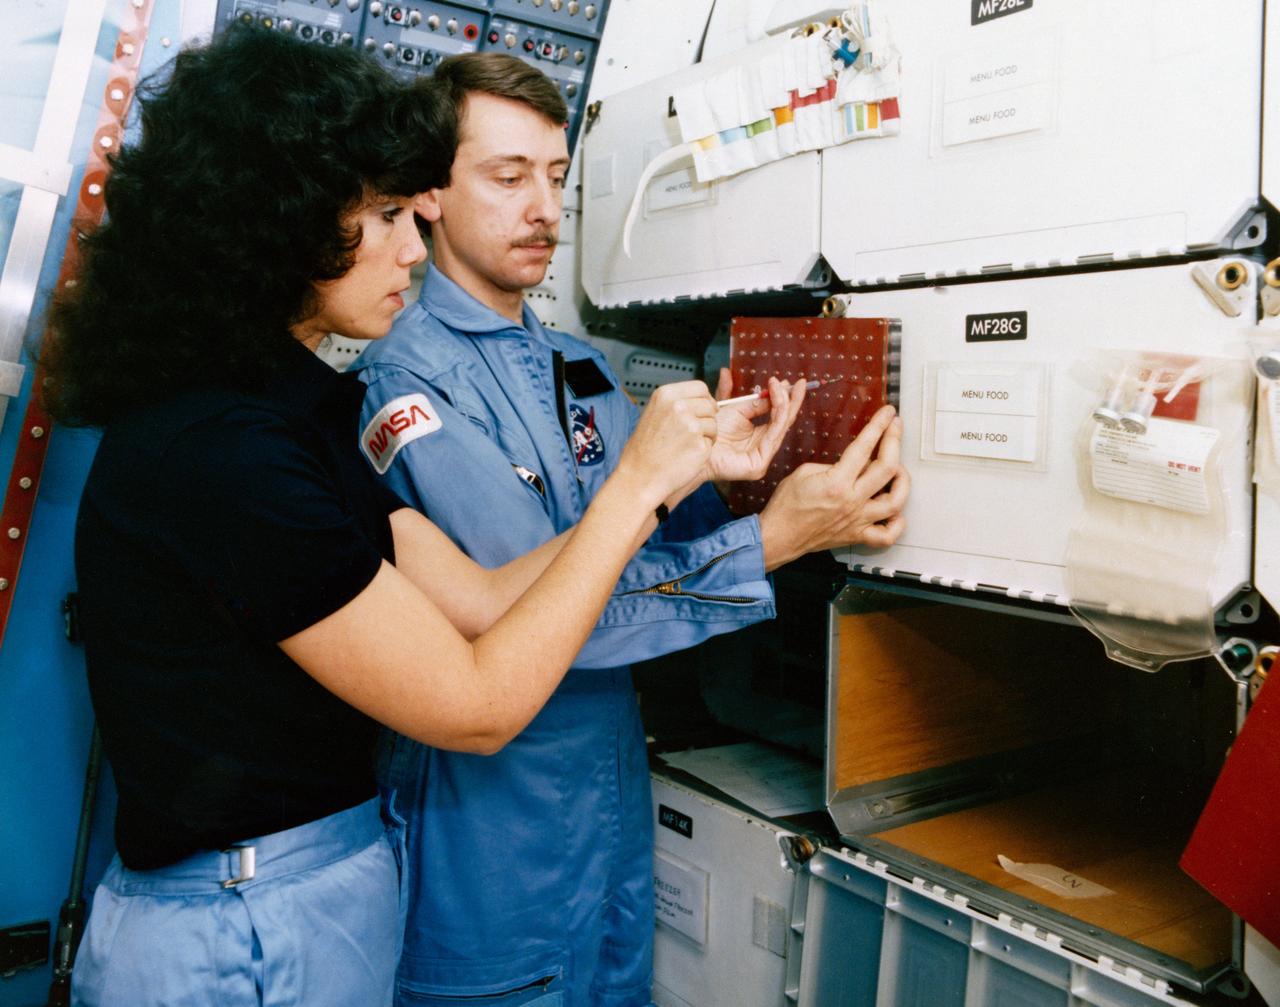
S84-35757 (May 1984) --- Astronaut Judith A. Resnik, 41-D mission specialist, and Charles Walker, payload specialist for that June 1984 flight, prepare for some scheduled intravehicular activity involving the continuous flow electrophoresis systems (CFES) experiment. CFES will join the six-member crew aboard the Earth-orbiting Discovery for a seven day mission. The two share in preparing a sample to be processed by the CFES. In the background are stowage lockers and a CFES trainer-- part of the Shuttle one-g trainer at NASA's Johnson Space Center (JSC). Walker, an engineer at McDonnell Douglas Astronautics Co. in St. Louis, Missouri, will be the first Shuttle payload specialist to represent a project designed for commercial purposes. As payload specialist, his job will be to run the materials electrophoresis-operations-in-space project. The project is aimed at separating large quantities of biological materials in space for ultimate use in new pharmaceuticals. The photo was taken by a McDonnell Douglas photographer.

This image shows a portion of an enigmatic formation called banded terrain, which is only observed in the northwest of the Hellas basin. This basin was formed by a giant impact around 4 billion years ago. It is the deepest impact basin on the planet, and banded terrain is in the deepest part of the basin (at elevations around 7 kilometers). This terrain is characterized by smooth bands of material separated by ridges or troughs, with circular and lobe shapes that are typically several kilometers long and a few hundred meters wide. A closeup shows banded terrain deforming around a mesa (bottom) and the transition of smooth banded terrain into surrounding rough terrain (top). Other banded terrain appears to have undergone deformation, like by a glacier, though it is not quite like terrestrial landforms. There are several ideas for what it could be, including a thin, flowing, ice-rich layer or sediment that was deformed beneath a former ice sheet. https://photojournal.jpl.nasa.gov/catalog/PIA24947
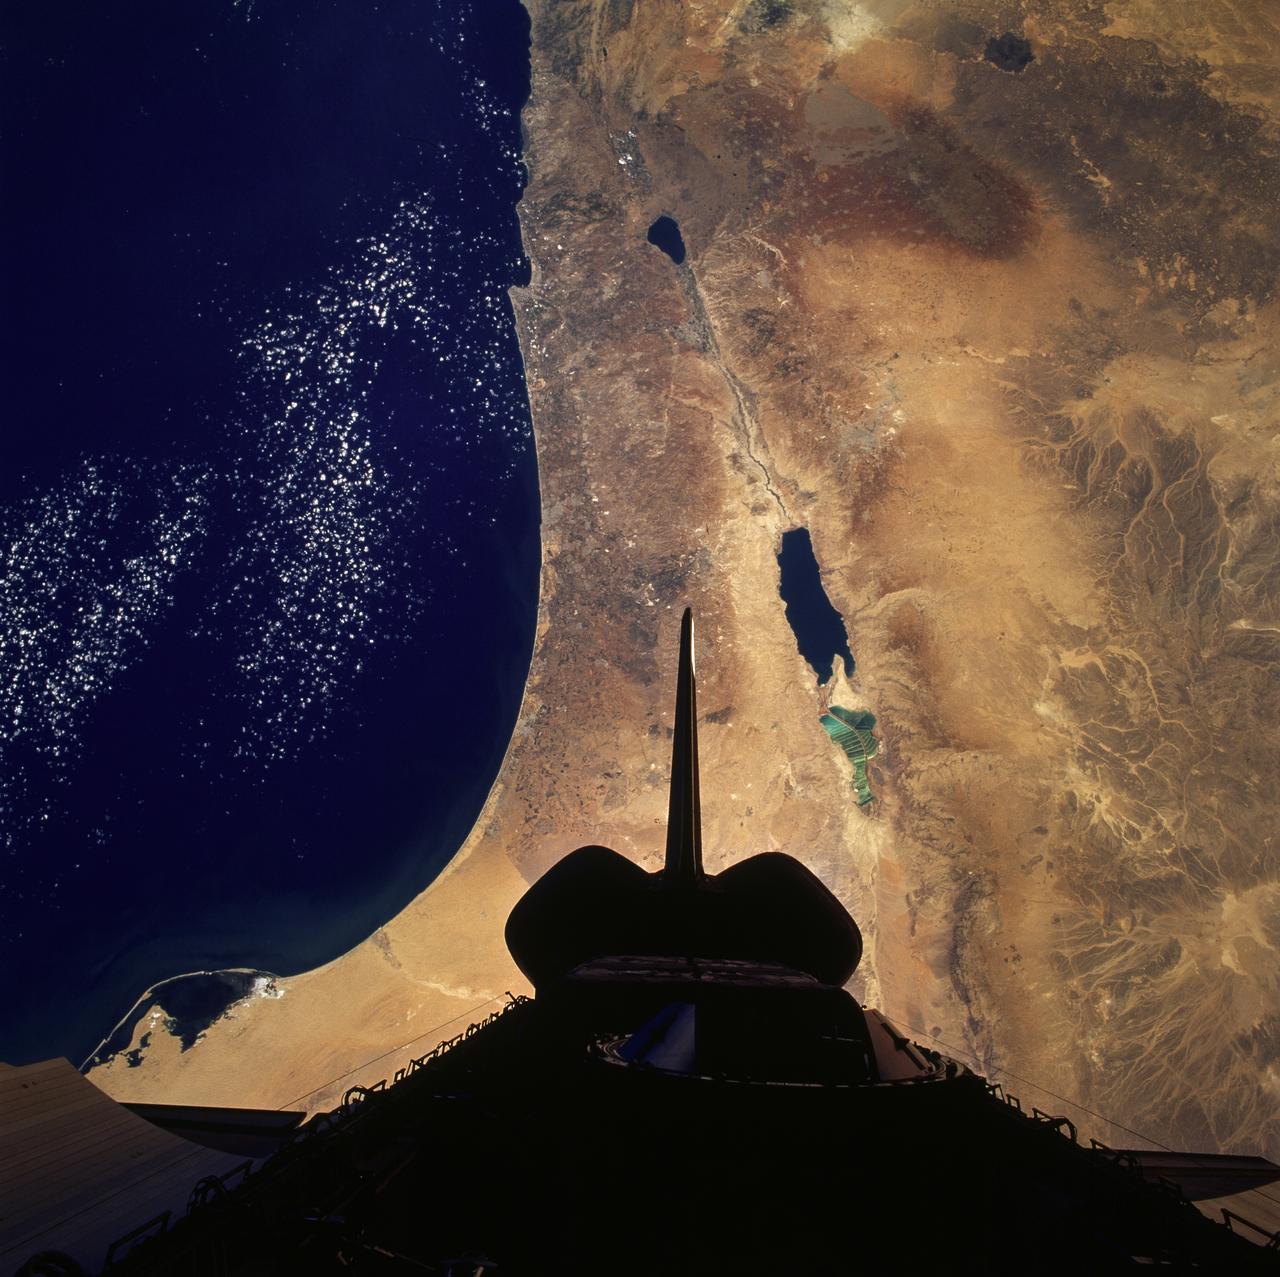
STS079-824-081 (16-26 Sept. 1996) --- In this 70mm frame from the space shuttle Atlantis, the Jordan River Valley can be traced as it separates Lebanon, Palestine and Israel on the west, from Syria and Jordan on the east. The river flows along the Dead Sea rift; the east side of the fault zone (Syria, Jordan, Saudi Arabia) has moved north about 100 kilometers relative to the west side (Lebanon, Israel, Egypt) during the past 24 million years. The Dead Sea and Sea of Galilee are in depressions formed where faults of the zone diverge or step over. The Dead Sea once covered the area of salt evaporation pans (the bright blue water). The lagoon, barrier islands and evaporite deposits (bright white) along the Mediterranean coast of the Sinai Peninsula (lower left of frame) are just east of Port Said.
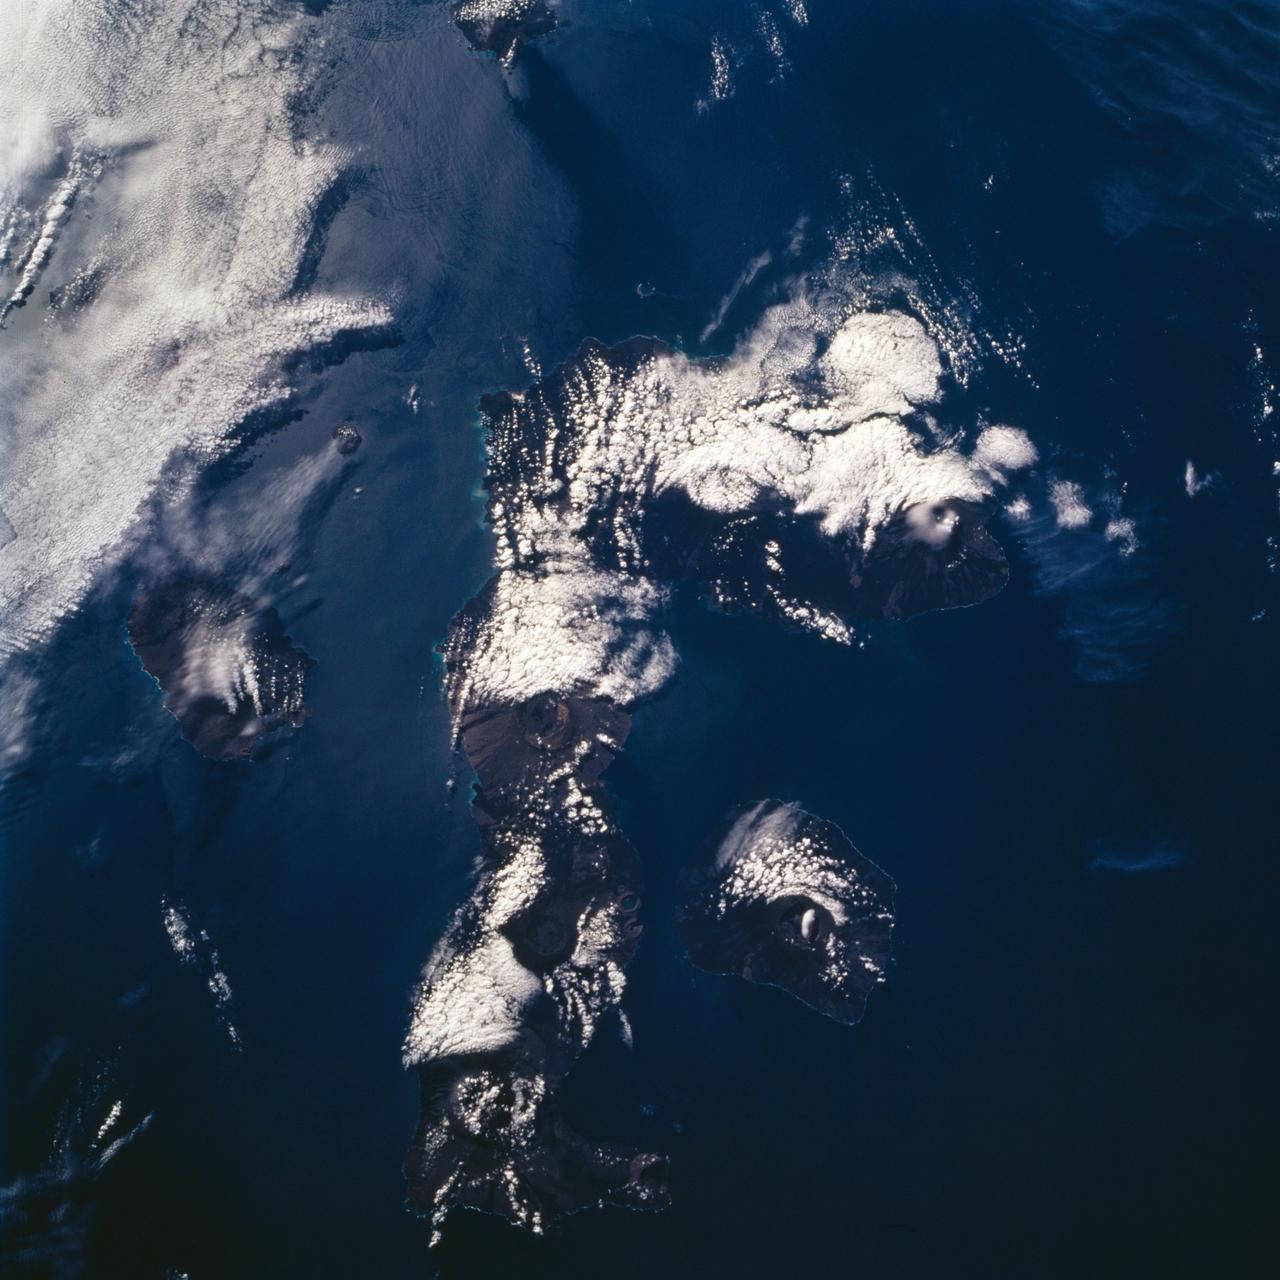
STS072-732-072 (11-20 Jan. 1996) --- Three of the nineteen Galapagos Islands are visible in this image, photographed from the Earth-orbiting Space Shuttle Endeavour. The Galapagos Islands are located 600 miles (1,000 kilometers) to the west of Ecuador. The largest of the islands, Isabela, is at center (north is toward the upper right corner). The numerous circular features on the island, highlighted by clouds, are volcanoes. The Galapagos Islands owe their existence to a hot spot, or persistent heat source in the mantle, which also is located over a rift, or place where plates are separating and new crust is being created. The rift is located between the Cocos and Nazca Plates. The dark linear features on the islands are lava flows from past eruptions. The island to the left of Isabela is Fernandina, while the island to the right is San Salvador. The Galapagos Islands were visited by the English naturalist Charles Darwin in 1835.

ISS007-E-07360 (14 June 2003) --- This regional view of Salt Lake City, Utah taken by an Expedition 7 crewmember onboard the International Space Station (ISS) shows the city and its suburbs nestled between the Wasatch Front and the Great Salt Lake. The core of Interstate Highway 15 runs North-South through the valley, with suburbs arrayed east and west of the highway. An important issue facing Salt Lake City’s growing population is preservation and allocation of water resources. Utah is in its fifth year of drought. One of the most dramatic effects of the drought visible in this picture is the fact that the lake levels are so low that Antelope Island is separated from the mainland by dry lakebed. Expansive productive wetlands occur where freshwater flows from the Wasatch Range and into the lake. The southern end of this network of wetlands can be seen in the image.
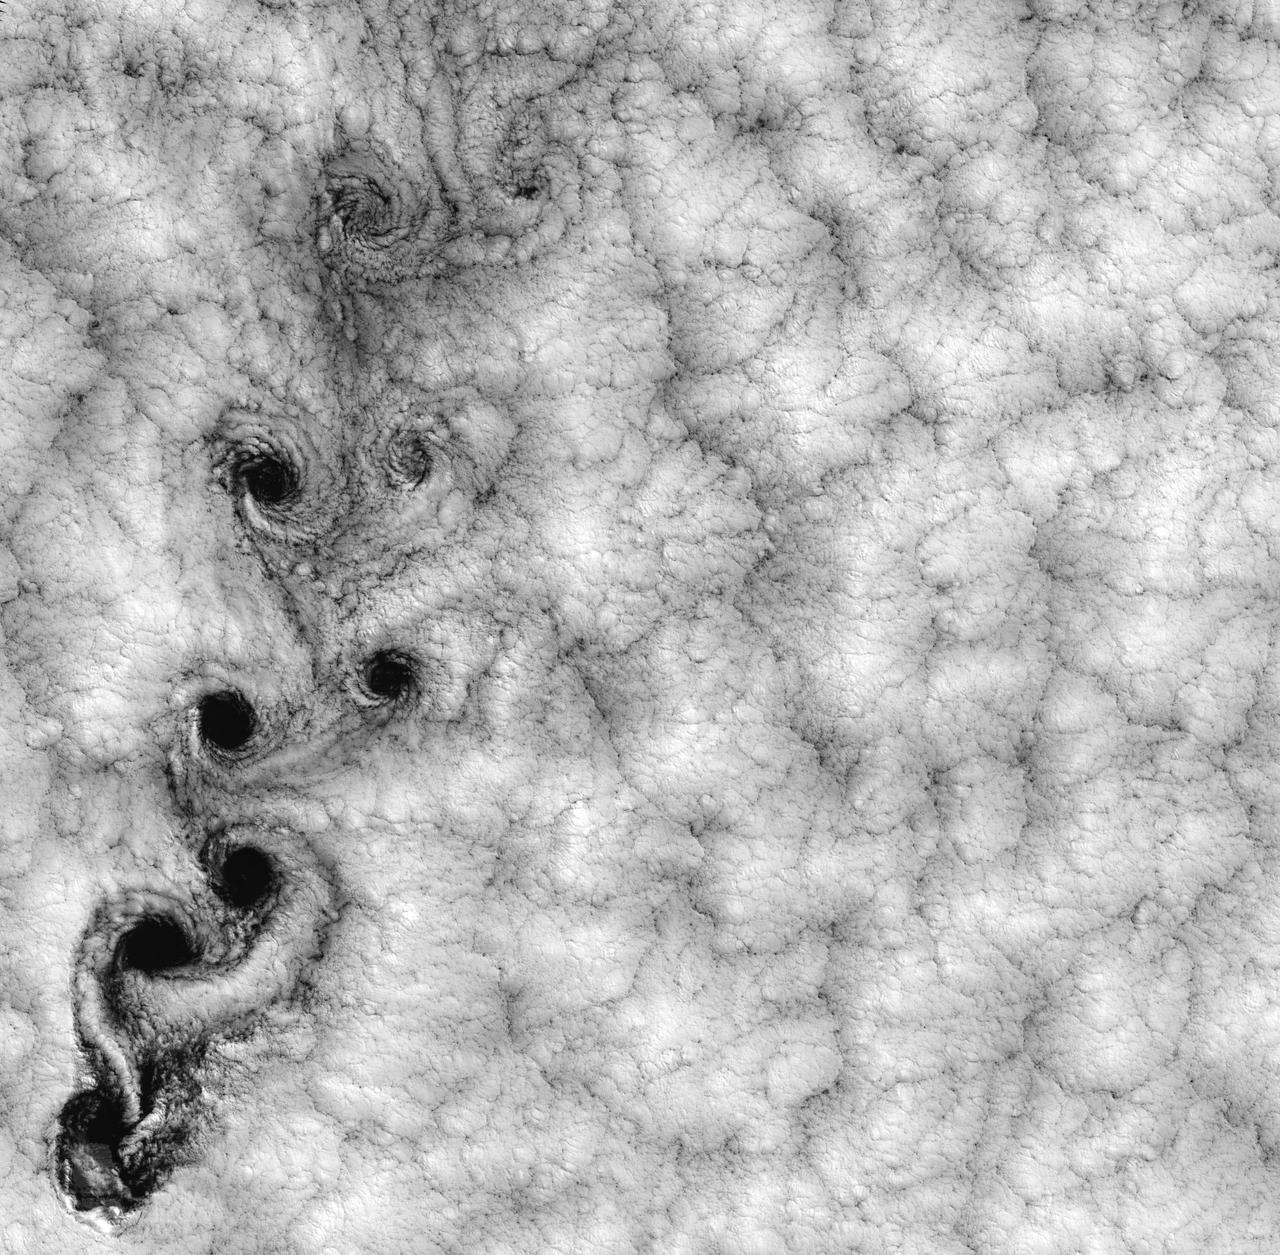
NASA image acquired September 15, 1999 This Landsat 7 image of clouds off the Chilean coast near the Juan Fernandez Islands (also known as the Robinson Crusoe Islands) on September 15, 1999, shows a unique pattern called a “von Karman vortex street.” This pattern has long been studied in the laboratory, where the vortices are created by oil flowing past a cylindrical obstacle, making a string of vortices only several tens of centimeters long. Study of this classic “flow past a circular cylinder” has been very important in the understanding of laminar and turbulent fluid flow that controls a wide variety of phenomena, from the lift under an aircraft wing to Earth’s weather. Here, the cylinder is replaced by Alejandro Selkirk Island (named after the true “Robinson Crusoe,” who was stranded here for many months in the early 1700s). The island is about 1.5 km in diameter, and rises 1.6 km into a layer of marine stratocumulus clouds. This type of cloud is important for its strong cooling of the Earth’s surface, partially counteracting the Greenhouse warming. An extended, steady equatorward wind creates vortices with clockwise flow off the eastern edge and counterclockwise flow off the western edge of the island. The vortices grow as they advect hundreds of kilometers downwind, making a street 10,000 times longer than those made in the laboratory. Observing the same phenomenon extended over such a wide range of sizes dramatizes the “fractal” nature of atmospheric convection and clouds. Fractals are characteristic of fluid flow and other dynamic systems that exhibit “chaotic” motions. Both clockwise and counter-clockwise vortices are generated by flow around the island. As the flow separates from the island’s leeward (away from the source of the wind) side, the vortices “swallow” some of the clear air over the island. (Much of the island air is cloudless due to a local “land breeze” circulation set up by the larger heat capacity of the waters surrounding the island.) The “swallowed” gulps of clear island air get carried along within the vortices, but these are soon mixed into the surrounding clouds. Landsat is unique in its ability to image both the small-scale eddies that mix clear and cloudy air, down to the 30 meter pixel size of Landsat, but also having a wide enough field-of-view, 180 km, to reveal the connection of the turbulence to large-scale flows such as the subtropical oceanic gyres. Landsat 7, with its new onboard digital recorder, has extended this capability away from the few Landsat ground stations to remote areas such as Alejandro Island, and thus is gradually providing a global dynamic picture of evolving human-scale phenomena. For more details on von Karman vortices, refer to <a href="http://climate.gsfc.nasa.gov/~cahalan" rel="nofollow">climate.gsfc.nasa.gov/~cahalan</a>. Image and caption courtesy Bob Cahalan, NASA GSFC Instrument: Landsat 7 - ETM+ Credit: NASA/GSFC/Landsat <b><a href="http://www.nasa.gov/centers/goddard/home/index.html" rel="nofollow">NASA Goddard Space Flight Center</a></b> enables NASA’s mission through four scientific endeavors: Earth Science, Heliophysics, Solar System Exploration, and Astrophysics. Goddard plays a leading role in NASA’s accomplishments by contributing compelling scientific knowledge to advance the Agency’s mission. <b>Follow us on <a href="http://twitter.com/NASA_GoddardPix" rel="nofollow">Twitter</a></b> <b>Join us on <a href="http://www.facebook.com/pages/Greenbelt-MD/NASA-Goddard/395013845897?ref=tsd" rel="nofollow">Facebook</a></b>

The electro-mechanical actuator, a new electronics technology, is an electronic system that provides the force needed to move valves that control the flow of propellant to the engine. It is proving to be advantageous for the main propulsion system plarned for a second generation reusable launch vehicle. Hydraulic actuators have been used successfully in rocket propulsion systems. However, they can leak when high pressure is exerted on such a fluid-filled hydraulic system. Also, hydraulic systems require significant maintenance and support equipment. The electro-mechanical actuator is proving to be low maintenance and the system weighs less than a hydraulic system. The electronic controller is a separate unit powering the actuator. Each actuator has its own control box. If a problem is detected, it can be replaced by simply removing one defective unit. The hydraulic systems must sustain significant hydraulic pressures in a rocket engine regardless of demand. The electro-mechanical actuator utilizes power only when needed. A goal of the Second Generation Reusable Launch Vehicle Program is to substantially improve safety and reliability while reducing the high cost of space travel. The electro-mechanical actuator was developed by the Propulsion Projects Office of the Second Generation Reusable Launch Vehicle Program at the Marshall Space Flight Center.
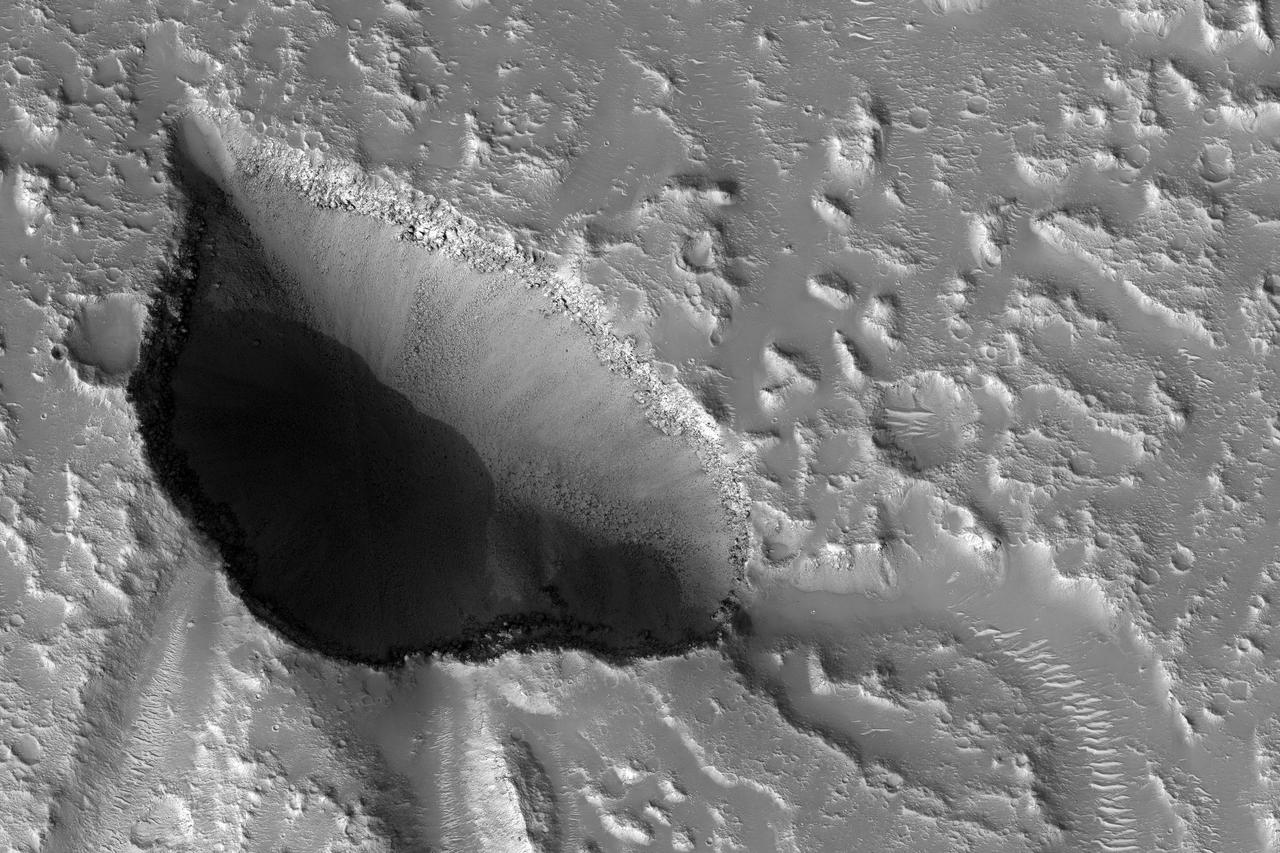
The drainages in this image are part of Hebrus Valles, an outflow channel system likely formed by catastrophic floods. Hebrus Valles is located in the plains of the Northern lowlands, just west of the Elysium volcanic region. Individual channels range from several hundred meters to several kilometers wide and form multi-threaded (anastamosing) patterns. Separating the channels are streamlined forms, whose tails point downstream and indicate that channel flow is to the north. The channels seemingly terminate in an elongated pit that is approximately 1875 meters long and 1125 meters wide. Using the shadow that the wall has cast on the floor of the pit, we can estimate that the pit is nearly 500 meters deep. The pit, which formed after the channels, exposes a bouldery layer below the dusty surface mantle and is underlain by sediments. Boulders several meters in diameter litter the slopes down into the pit. Pits such as these are of interest as possible candidate landing sites for human exploration because they might retain subsurface water ice (Schulze-Makuch et al. 2016, 6th Mars Polar Conf.) that could be utilized by future long-term human settlements. http://photojournal.jpl.nasa.gov/catalog/PIA11704
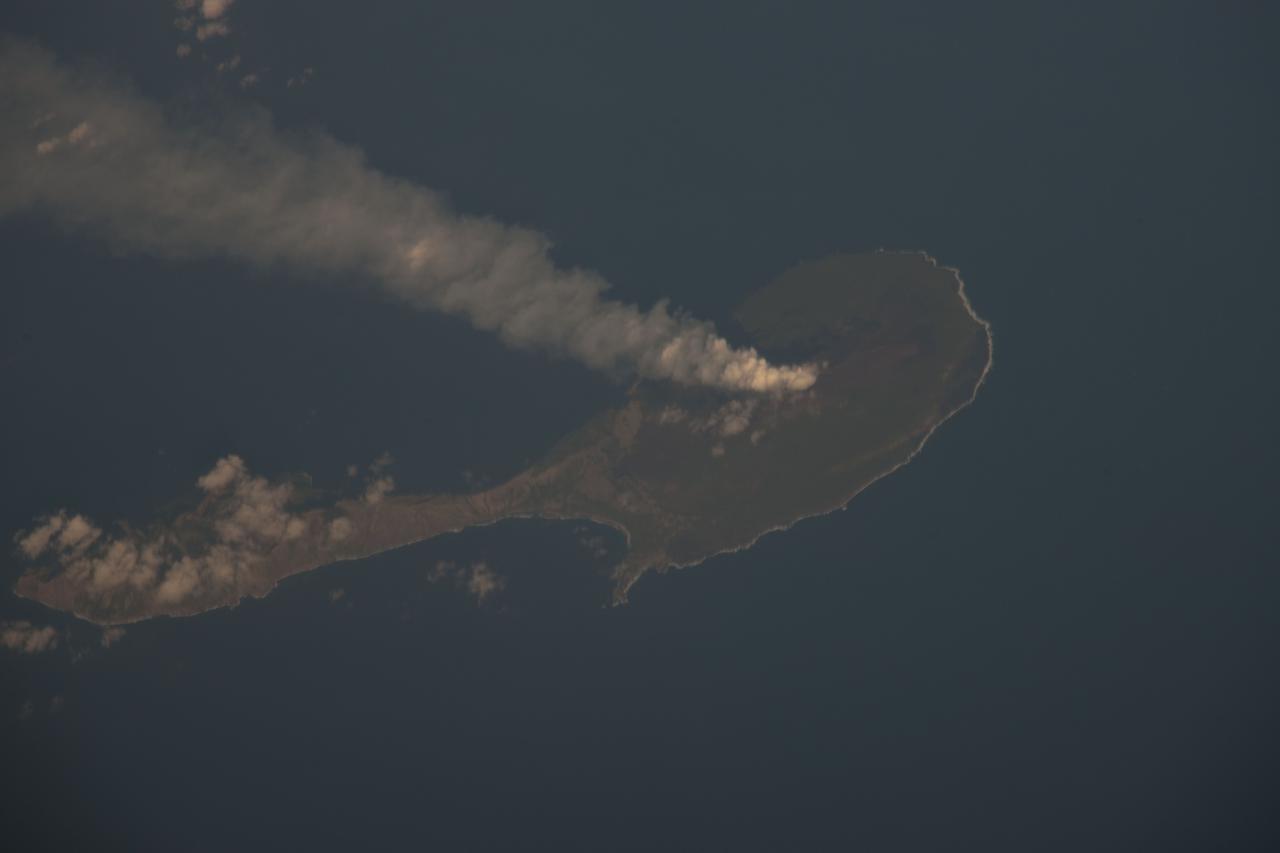
ISS030-E-122047 (6 March 2012) --- Pagan Island, Northern Marianas is featured in this image photographed by an Expedition 30 crew member on the International Space Station. A steam plume flows south from the peak of Pagan Island’s northernmost volcano in this photograph. Pagan is part of the Commonwealth of the Northern Marianas, an island chain of volcanoes that form the margin between the Pacific Ocean (to the east) and the Philippine Sea (to the west). Pagan is made up of two stratovolcanoes separated by an isthmus, and is one of the more volcanically active islands. The last eruption was in 2010, but the island was completely evacuated in 1981 when a large eruption forced the small Micronesian community to flee. According to NASA scientists, the islands themselves mark the tectonic boundary where the old, cold Pacific plate is subducted beneath the younger, less dense Philippine Sea crust at the Marianas Trench. The subduction results in substantial volcanic activity on the upper plate, forming the island arc of the Marianas. Considered to be one of the type examples for an oceanic subduction zone, the Marianas Trench includes the deepest spot in Earth’s oceans (more than 10,000 meters). The foreshortened appearance of the island is due to the viewing angle and distance from the space station, which was located over the Pacific Ocean approximately 480 kilometers to the southeast of Pagan Island when the image was taken.
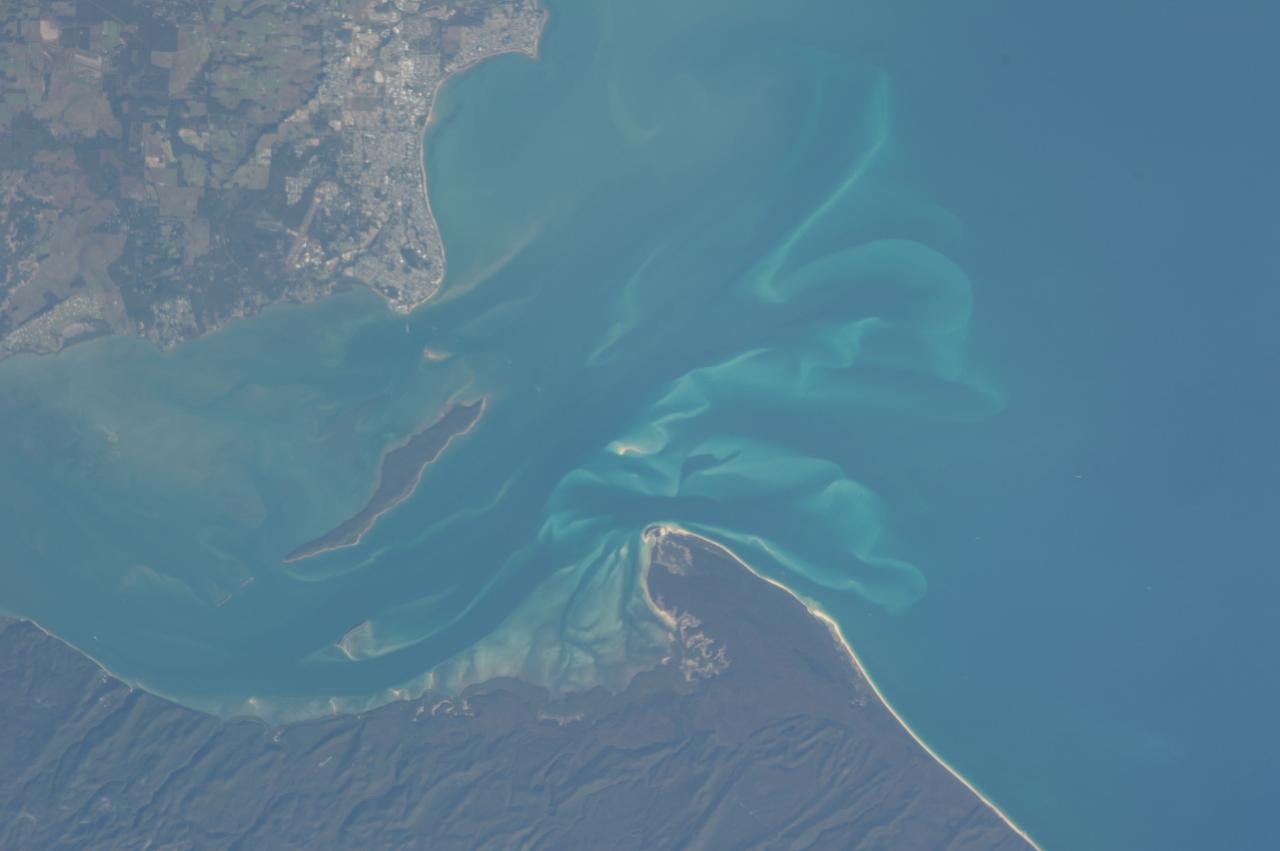
ISS036-E-028444 (3 Aug. 2013) --- Hervey Bay, Queensland, Australia is featured in this image photographed by an Expedition 36 crew member on the International Space Station. The northern end of the Great Sandy Strait and Hervey Bay are highlighted in this photograph. The Strait is an estuary that separates the mainland coastline of the state of Queensland, Australia from neighboring Fraser Island. The mainland side of the Strait includes the city of Hervey Bay, visible at top center. Other communities that have become part of the larger metropolitan area include Scarness, Booral, and Urangan. A small vegetated island and shallow sand bars of the Great Sandy Strait are visible at center left, while submerged sands appear as bright blue flowing ribbons at center. A small, bright white exposure of sand is visible above the water level near the center point of the image. While once a major freighting center for the sugar cane industry, the local economy is now largely based on tourism, with whale watching tours a popular attraction. The Great Sandy Strait estuary provides habitat for breeding fish, crustaceans, turtles, and other sea life, as well as a wide variety of birds. Nearby Fraser Island is the world?s largest sand island and a World Heritage site.
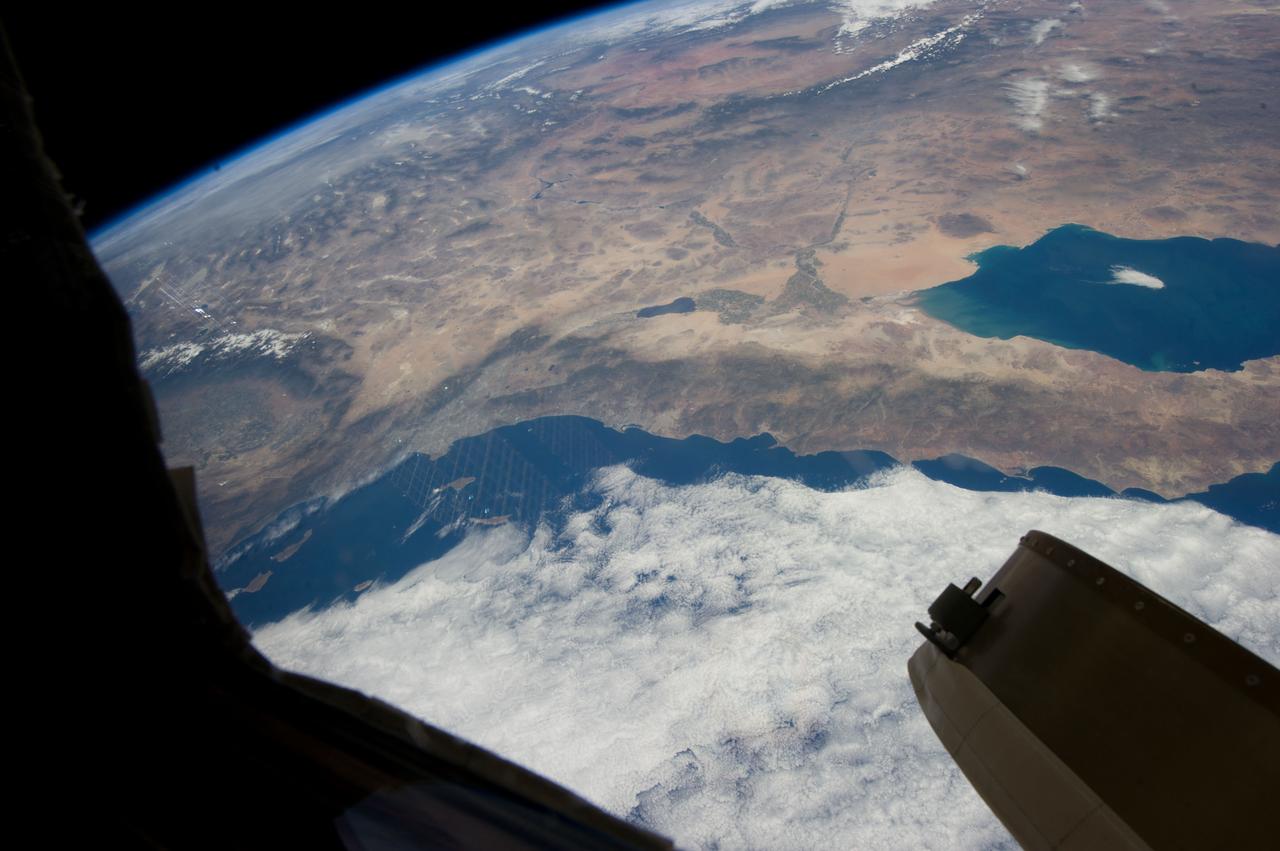
ISS035-E-027431 (23 April 2013) --- This oblique Expedition 35 image from the International Space Station shows parts of Mexico, California and Nevada. The Los Angeles Basin can be easily delineated at left center. If the nomenclature for the body of water in the upper right quadrant of the image were the subject of a trivia question, the answer might be "all the above," as it is recognized by a number of names. They include the Gulf of California, Sea of Cortez, Sea of Cortes, Vermilion Sea as well as its local designations in the Spanish language as Mar de Cortes or Mar Bermejo or Golfo de California. It serves to separate the Baja California Peninsula from the Mexican mainland. It is bordered by the states of Baja California, Baja California Sur, Sonora, and Sinaloa (some of which are out of the frame) with a coastline of approximately 4,000 kilometers (2,500 miles). Rivers which flow into the Gulf of California include the Colorado, Fuerte, Mayo, Sinaloa, Sonora and the Yaqui. The gulf's surface area is about 160,000 square kilometers (62,000 square miles). A mass of clouds sits just off the Pacific coast of Baja California and southern California.
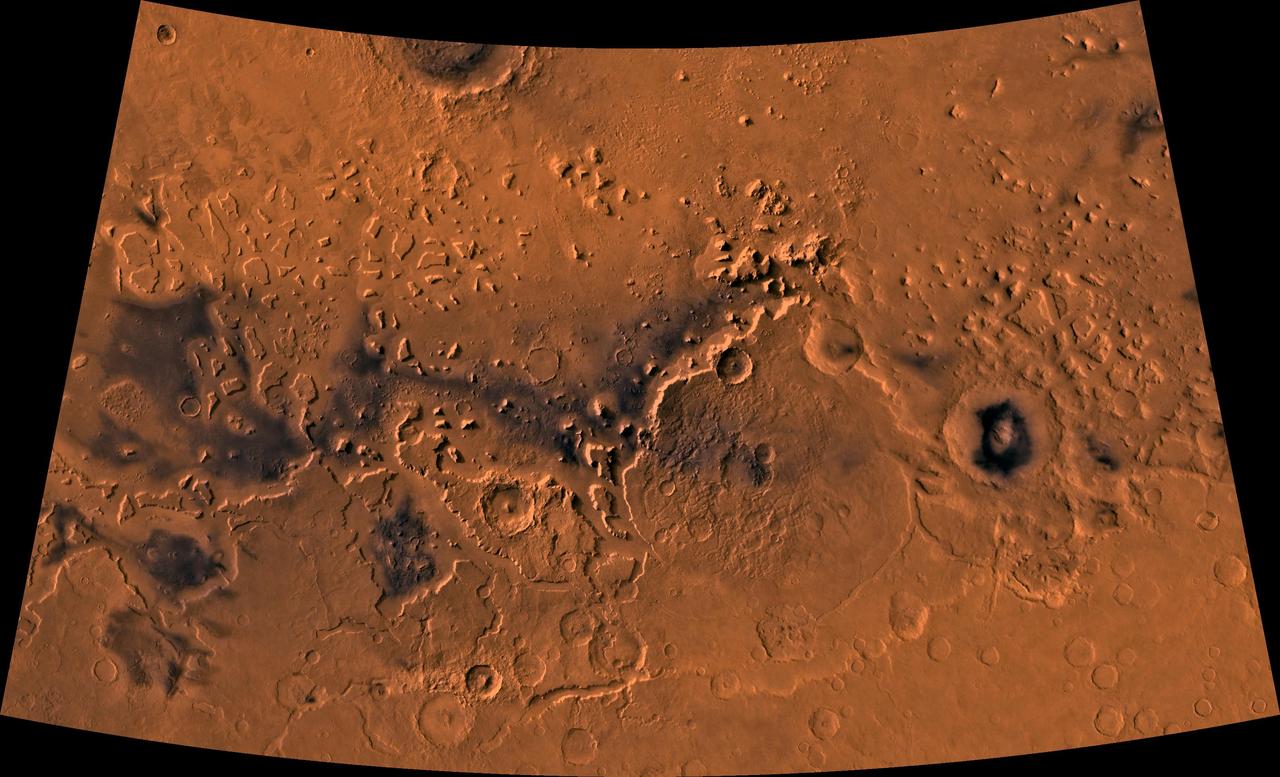
Color image of part of the Ismenius Lacus region of Mars (MC-5 quadrangle) containing the impact crater Moreux (right center); north toward top. The scene shows heavily cratered highlands in the south on relatively smooth lowland plains in the north separated by a belt of dissected terrain, containing flat-floored valleys, mesas, and buttes. This image is a composite of Viking medium-resolution images in black and white and low-resolution images in color. The image extends from latitude 36 degrees N. to 50 degrees N. and from longitude 310 degrees to 340 degrees; Lambert conformal conic projection. The dissected terrain along the highlands/lowlands boundary consists of the flat-floored valleys of Deuteronilus Mensae (on left) and Prontonilus Mensae (on right) and farther north the small, rounded hills of knobby terrain. Flows on the mensae floors contain striae that run parallel to valley walls; where valleys meet, the striae merge, similar to medial moraines on glaciers. Terraces within the valley hills have been interpreted as either layered rocks or wave terraces. The knobby terrain has been interpreted as remnants of the old, densely cratered highland terrain perhaps eroded by mass wasting. http://photojournal.jpl.nasa.gov/catalog/PIA00420

This image of the International Space Station (ISS) was photographed by one of the crewmembers of the STS-112 mission following separation from the Space Shuttle Orbiter Atlantis as the orbiter pulled away from the ISS. The newly added S1 truss is visible in the center frame. The primary payloads of this mission, International Space Station Assembly Mission 9A, were the Integrated Truss Assembly S-1 (S-One), the Starboard Side Thermal Radiator Truss,and the Crew Equipment Translation Aid (CETA) cart to the ISS. The S1 truss provides structural support for the orbiting research facility's radiator panels, which use ammonia to cool the Station's complex power system. The S1 truss was attached to the S0 (S Zero) truss, which was launched on April 8, 2002 aboard the STS-110, and flows 637 pounds of anhydrous ammonia through three heat rejection radiators. The truss is 45-feet long, 15-feet wide, 10-feet tall, and weighs approximately 32,000 pounds. The CETA cart was attached to the Mobil Transporter and will be used by assembly crews on later missions. Manufactured by the Boeing Company in Huntington Beach, California, the truss primary structure was transferred to the Marshall Space Flight Center in February 1999 for hardware installations and manufacturing acceptance testing. The launch of the STS-112 mission occurred on October 7, 2002, and its 11-day mission ended on October 18, 2002.

This image of the International Space Station (ISS) was photographed by one of the crewmembers of the STS-112 mission following separation from the Space Shuttle Orbiter Atlantis as the orbiter pulled away from the ISS. The primary payloads of this mission, International Space Station Assembly Mission 9A, were the Integrated Truss Assembly S1 (S-One), the Starboard Side Thermal Radiator Truss, and the Crew Equipment Translation Aid (CETA) cart to the ISS. The S1 truss provides structural support for the orbiting research facility's radiator panels, which use ammonia to cool the Station's complex power system. The S1 truss was attached to the S0 (S Zero) truss, which was launched on April 8, 2002 aboard the STS-110, and flows 637 pounds of anhydrous ammonia through three heat-rejection radiators. The truss is 45-feet long, 15-feet wide, 10-feet tall, and weighs approximately 32,000 pounds. The CETA cart was attached to the Mobil Transporter and will be used by assembly crews on later missions. Manufactured by the Boeing Company in Huntington Beach, California, the truss primary structure was transferred to the Marshall Space Flight Center in February 1999 for hardware installations and manufacturing acceptance testing. The launch of the STS-112 mission occurred on October 7, 2002, and its 11-day mission ended on October 18, 2002.
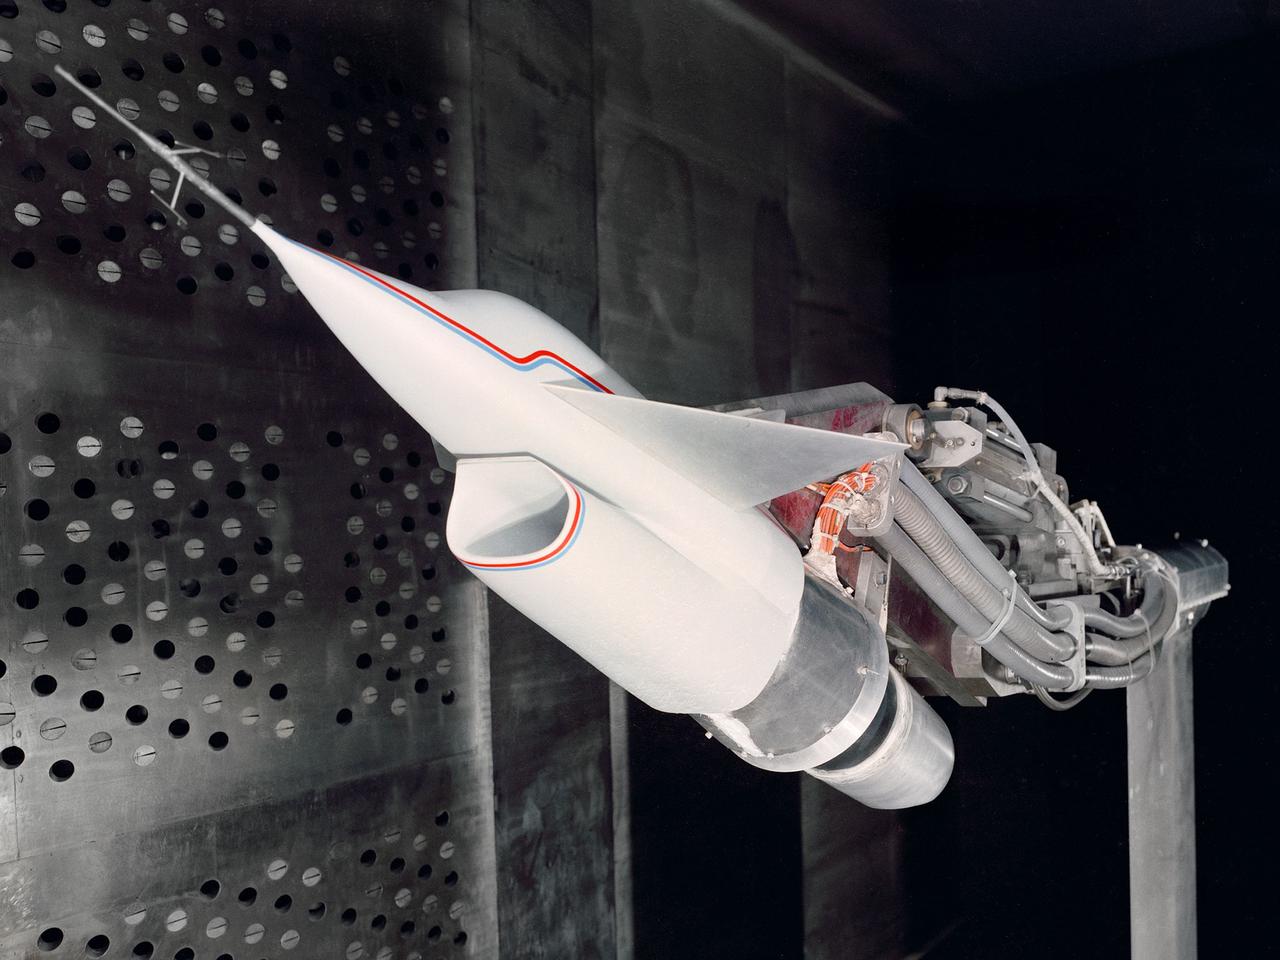
A Highly Maneuverable Aircraft Technology (HiMAT) inlet model installed in the test section of the 8- by 6-Foot Supersonic Wind Tunnel at the National Aeronautics and Space Administration (NASA) Lewis Research Center. Engineers at the Ames Research Center, Dryden Flight Research Center, and Rockwell International designed two pilotless subscale HiMAT vehicles in the mid-1970s to study new design concepts for fighter aircraft in the transonic realm without risking the lives of test pilots. The aircraft used sophisticated technologies such as advanced aerodynamics, composite materials, digital integrated propulsion control, and digital fly-by-wire control systems. In late 1977 NASA Lewis studied the HiMAT’s General Electric J85-21 jet engine in the Propulsion Systems Laboratory. The researchers charted the inlet quality with various combinations anti-distortion screens. HiMAT employed a relatively short and curved inlet compared to actual fighter jets. In the spring of 1979, Larry Smith led an in-depth analysis of the HiMAT inlet in the 8- by 6 tunnel. The researchers installed vortex generators to battle flow separation in the diffuser. The two HiMAT aircraft performed 11 hours of flying over the course of 26 missions from mid-1979 to January 1983 at Dryden and Ames. Although the HiMAT vehicles were considered to be overly complex and expensive, the program yielded a wealth of data that would validate computer-based design tools.
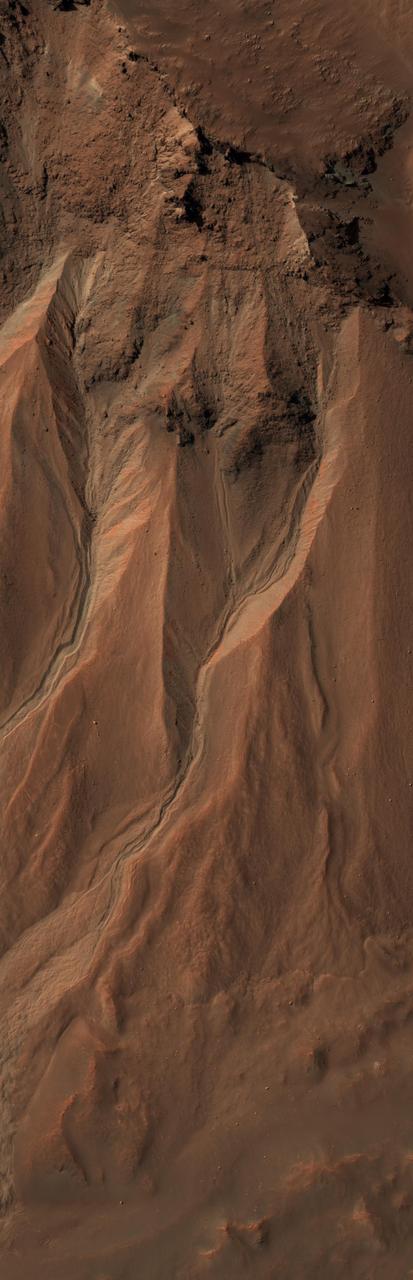
This image from the High Resolution Imaging Science Experiment (HiRISE) camera on NASA's Mars Reconnaissance Orbiter shows gullies near the edge of Hale crater on southern Mars. The view covers an area about 1 kilometer (0.6 mile) across and was taken on Aug. 3, 2009. Martian gullies carved into hill slopes and the walls of impact craters were discovered several years ago. Scientists are excited to study these features because, on Earth, they usually form through the action of liquid water -- long thought to be absent on the Martian surface. Whether liquid water carves gullies under today's cold and dry conditions on Mars is a major question that planetary scientists are trying to answer. The gullies pictured here are examples of what a typical Martian gully looks like. You can see wide V-shaped channels running downhill (from top to bottom) where the material that carved the gully flowed. At the bottom of the channel this material empties out onto a fan-shaped mound. The fans from each gully overlap one other in complicated ways. At the tops of the channels, large amphitheater-shaped alcoves are carved in the rock. The material removed from these alcoves likely flowed downhill to the aprons through the gullies. The terrain in this image is at 36.5 degrees south latitude, 322.7 degrees east longitude. Gullies at this site are especially interesting because scientists recently discovered actively changing examples at similar locations. Images separated by several years showed changes in the appearance of some of these gullies. Today, planetary scientists are using the HiRISE camera to examine gullies such as the one in this image for change that might provide a clue about whether liquid water occurs on the surface of Mars. http://photojournal.jpl.nasa.gov/catalog/PIA12194
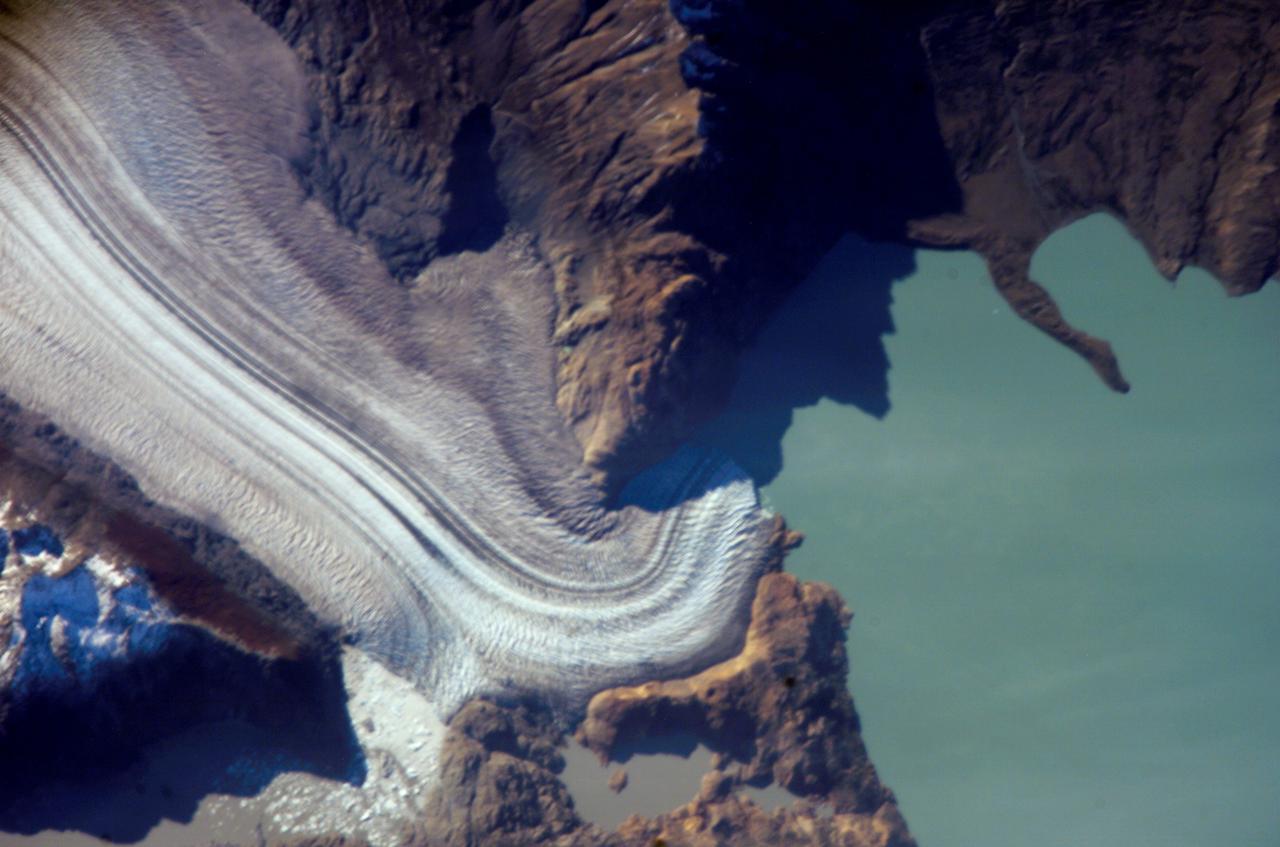
ISS013-E-06947 (12 April 2006) --- Viedma Glacier, Argentina is featured in this image photographed by an Expedition 13 crewmember on the International Space Station. The ice fields of Patagonia, located at the southern end of South America, are the largest masses of ice in the temperate Southern Hemisphere (approximately 55,000 square kilometers in area). The ice fields contain numerous valley glaciers that terminate in melt-water-fed lakes. These are known as "calving" glaciers, as they lose mass by collapse of large ice chunks from the terminus--or end--of the glacier. These newly separated chunks of ice are then free to float away, much like ice cubes in a punch bowl. The Patagonian glaciers are closely monitored using remotely sensed data as they respond to regional climate change. Visual comparison of time series of images is typically performed to quantify change in ice extent and position. The terminus of the Viedma Glacier, approximately two kilometers across where it enters Lake Viedma, is shown in this image. Moraines are accumulations of soil and rock debris that form along the sides and front of a glacier as it flows across the landscape (much like a bulldozer). Independent valley glaciers can merge together as they flow down-slope, and the moraines become entrained in the center of the new ice mass. These medial moraines are visible as dark parallel lines within the white central mass of the glacier (image center and left). Crevasses - oriented roughly perpendicular to the medial moraines - are also visible in the grey-brown ice along the sides of the glacier. According to scientists, the canyon-like crevasses form as a result of stress between the slower moving ice along the valley sides and the more rapidly moving ice in the center of the glacier. Calving of ice from the southwestern fork of the glacier terminus is visible at image lower left.

Shown here in a new image taken with the Advanced Camera for Surveys (ACS) on board the NASA/ESA Hubble Space Telescope, is the globular cluster NGC 1783. This is one of the biggest globular clusters in the Large Magellanic Cloud, a satellite galaxy of our own galaxy, the Milky Way, in the southern hemisphere constellation of Dorado. First observed by John Herschel in 1835, NGC 1783 is nearly 160 000 light-years from Earth, and has a mass around 170 000 times that of the Sun. Globular clusters are dense collections of stars held together by their own gravity, which orbit around galaxies like satellites. The image clearly shows the symmetrical shape of NGC 1783 and the concentration of stars towards the centre, both typical features of globular clusters. By measuring the colour and brightness of individual stars, astronomers can deduce an overall age for a cluster and a picture of its star formation history. NGC 1783 is thought to be under one and a half billion years old — which is very young for globular clusters, which are typically several billion years old. During that time, it is thought to have undergone at least two periods of star formation, separated by 50 to 100 million years. This ebb and flow of star-forming activity is an indicator of how much gas is available for star formation at any one time. When the most massive stars created in the first burst of formation explode as supernovae they blow away the gas needed to form further stars, but the gas reservoir can later be replenished by less massive stars which last longer and shed their gas less violently. After this gas flows to the dense central regions of the star cluster, a second phase of star formation can take place and once again the short-lived massive stars blow away any leftover gas. This cycle can continue a few times, at which time the remaining gas reservoir is thought to be too small to form any new stars. A version of this image was entered into the Hubble's Hidden Treasures image pr

National Aeronautics and Space Administration (NASA) researchers install a small-scale model of the capsule for Project Mercury in the 1- by 1-Foot Supersonic Wind Tunnel at the Lewis Research Center. NASA Lewis conducted a variety of tests for Project Mercury, including retrorocket calibration, escape tower engine performance, and separation of the capsule from simulated Atlas and Redstone boosters. The test of this capsule and escape tower model in the 1- by 1-foot tunnel were run in January and February 1960. The 1-by 1-Foot Supersonic Wind Tunnel had a 15-inch long test section, seen here, that was one foot wide and one foot high. The sides were made of glass to allow cameras to capture the supersonic air flow over the models. The tunnel could generate air flows from Mach 1.3 to 3.0. At the time, it was one of nine small supersonic wind tunnels at Lewis. These tunnels used the exhauster and compressor equipment of the larger facilities. The 1- by 1 tunnel, which began operating in the early 1950s, was built inside a test cell in the expansive Engine Research Building. During the 1950s the 1- by 1 was used to study a variety of inlets, nozzles, and cones for missiles and scramjets. The Mercury capsule tests were among the last at the facility for many years. The tunnel was mothballed in 1960. The 1- by 1 was briefly restored in 1972, then brought back online for good in 1979. The facility has maintained a brisk operating schedule ever since.
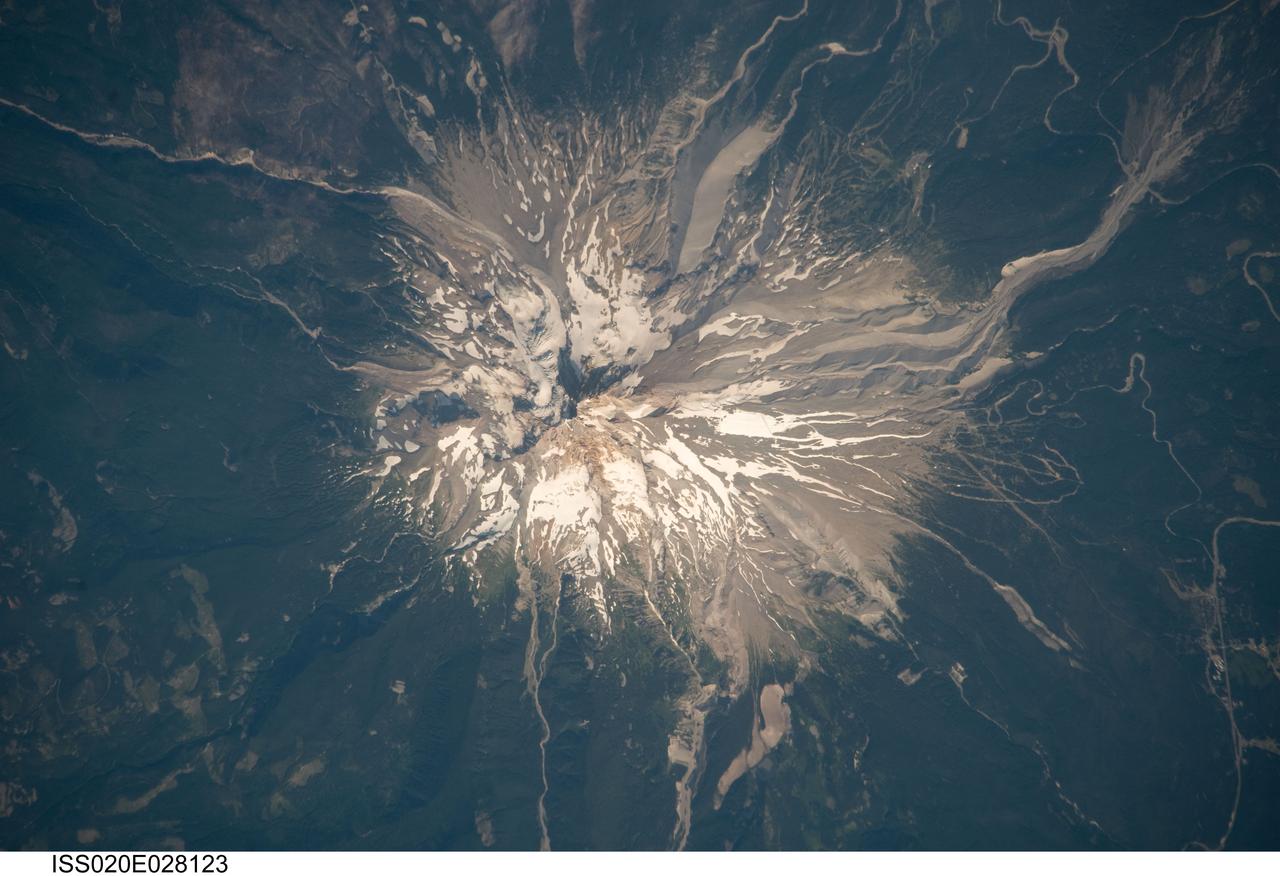
ISS020-E-028123 (5 Aug. 2009) --- Mount Hood, Oregon is featured in this image photographed by an Expedition 20 crew member on the International Space Station. Mount Hood is located within the Cascade Range of the western United States, and is the highest peak (3,426 m) in Oregon. The Cascade Range is characterized by a line of volcanoes associated with a slab of oceanic crust that is subducting, or descending underneath, the westward moving continental crust of North America. Magma generated by the subduction process rises upward through the crust and feeds a line of active volcanoes that extends from northern California in the United States to southern British Columbia in Canada. While hot springs and steam vents are still active on Mount Hood, the last eruption from the volcano occurred in 1866. The volcano is considered dormant, but still actively monitored. Separate phases of eruptive activity produced pyroclastic flows and lahars ? mudflows ? that carried erupted materials down all of the major rivers draining the volcano. Gray volcanic deposits extend southwards along the banks of the White River (upper right), and form several prominent ridges along the southeast to southwest flanks of the volcano. The deposits contrast sharply with the green vegetated lower flanks of the volcano. The Mount Hood stratovolcano ? a typically cone-shaped volcanic structure formed by interlayered lava flows and explosive eruption deposits ? hosts twelve mapped glaciers along its upper flanks (center). Like other glaciers in the Pacific Northwest, the Hood glaciers have been receding due to global warming, and have lost an estimated 61 percent of their volume over the past century. The predicted loss of glacial meltwater under future warming scenarios will have significant effects on regional hydrology and water supplies.
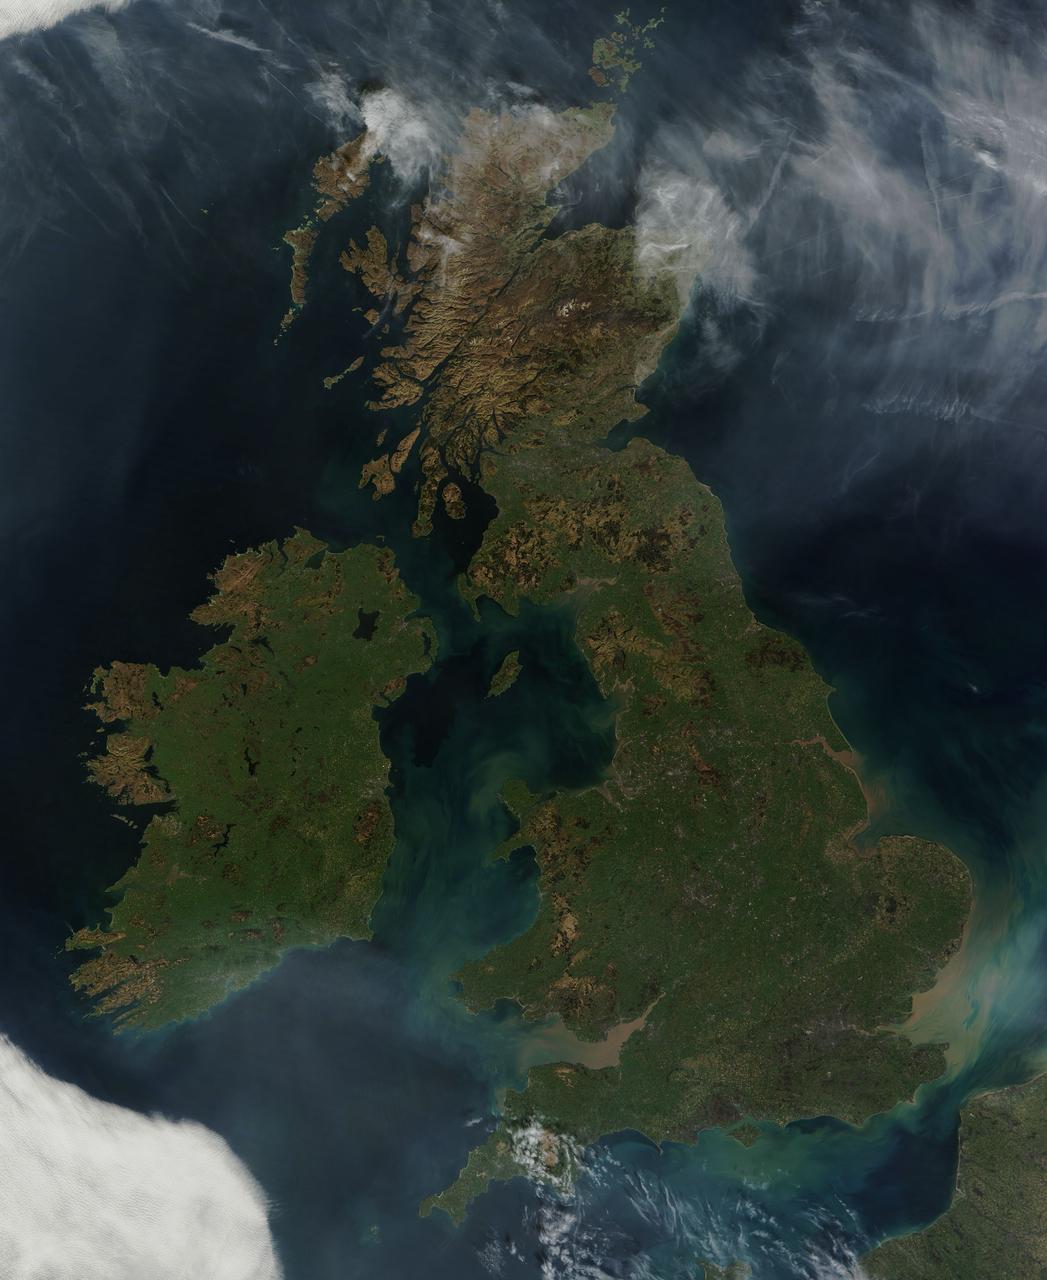
NASA image acquired March 26, 2012 This nearly cloud-free view of Great Britain and Ireland was acquired by the Moderate Resolution Imaging Spectroradiometer (MODIS) aboard NASA’s Terra satellite on March 26, 2012. Just a few days into spring, most of the land appears green, although not quite as brilliant as the summertime hues that give Ireland the nickname “the Emerald Island”. The islands of Ireland (west) and Great Britain (east) are separated by the Irish Sea, which is filled with the turquoise, green and tan swirls typical of sediment, although blooming algae could also contribute some color to the waters. To the southeast, the English Channel separates the island of Great Britain from France (south) and Belgium (north). London can be seen as a gray circle situated inland on the tan-colored River Thames. The sediment from the Thames flows into the English Channel due east of London. The United Kingdom is made up of Wales, Scotland and England, all located primarily on the island of Great Britain, and of Northern Ireland, which comprises the northern section of the island of Ireland. Dublin, in the Republic of Ireland, can be seen as a gray smudge on the eastern coast of the island. Almost due west Galway can be seen as a linear gray streak on the northern coast of Galway Bay, with the blue waters of Loch Corrib to the north. Most of the United Kingdom and Ireland are part of the Celtic broadleaf forest ecoregion, where acid-loving oak and mixed oak forests abound, along with fen and swamp forests and ombrotrophic mires. A portion of the Scottish Highlands, in the north of Great Britain, are covered by the Caledon conifer forest ecoregion. The Caledonia conifers once covered a large area of Scotland, but now only about 1% of the original forest survives, mostly high in the cooler areas of the Highlands. NASA/GSFC/Jeff Schmaltz/MODIS Land Rapid Response Team <b><a href="http://www.nasa.gov/audience/formedia/features/MP_Photo_Guidelines.html" rel="nofollow">NASA image use policy.</a></b> <b><a href="http://www.nasa.gov/centers/goddard/home/index.html" rel="nofollow">NASA Goddard Space Flight Center</a></b> enables NASA’s mission through four scientific endeavors: Earth Science, Heliophysics, Solar System Exploration, and Astrophysics. Goddard plays a leading role in NASA’s accomplishments by contributing compelling scientific knowledge to advance the Agency’s mission. <b>Follow us on <a href="http://twitter.com/NASA_GoddardPix" rel="nofollow">Twitter</a></b> <b>Like us on <a href="http://www.facebook.com/pages/Greenbelt-MD/NASA-Goddard/395013845897?ref=tsd" rel="nofollow">Facebook</a></b> <b>Find us on <a href="http://instagrid.me/nasagoddard/?vm=grid" rel="nofollow">Instagram</a></b>
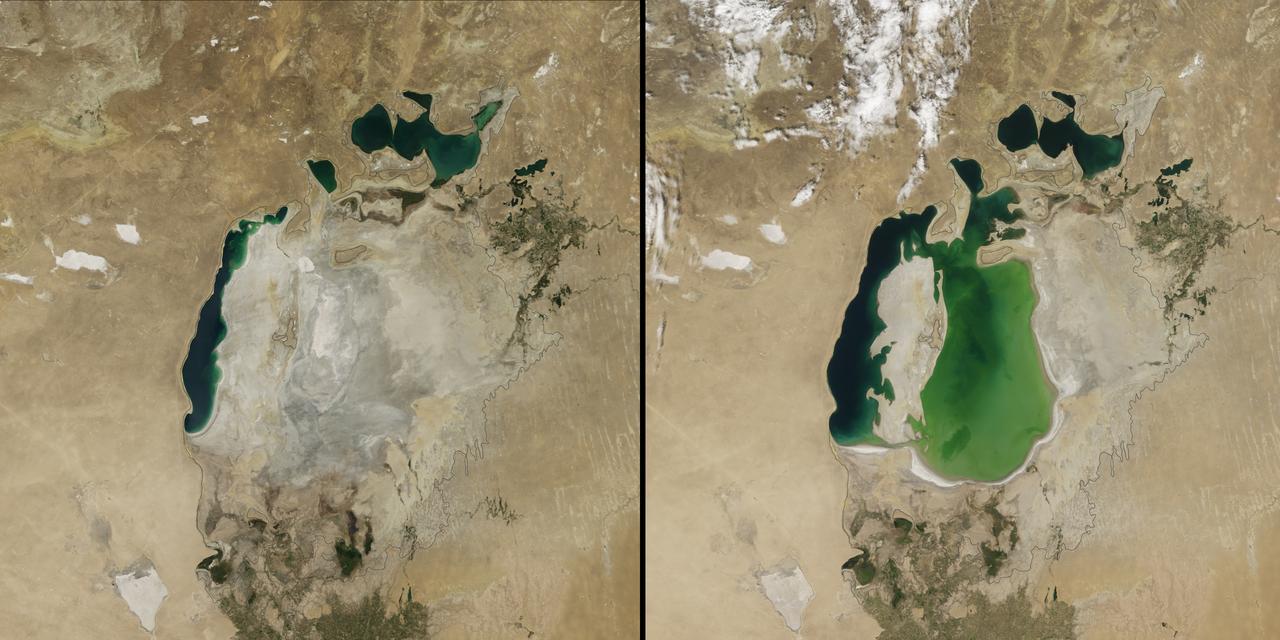
(Aral Sea: left 2014 and right 2000, 1960 extent black line) In the 1960s, the Soviet Union undertook a major water diversion project on the arid plains of Kazakhstan, Uzbekistan, and Turkmenistan. The region’s two major rivers, fed by snowmelt and precipitation in faraway mountains, were used to transform the desert into farms for cotton and other crops. Before the project, the Syr Darya and the Amu Darya rivers flowed down from the mountains, cut northwest through the Kyzylkum Desert, and finally pooled together in the lowest part of the basin. The lake they made, the Aral Sea, was once the fourth largest in the world. Although irrigation made the desert bloom, it devastated the Aral Sea. This series of images from the Moderate Resolution Imaging Spectroradiometer (MODIS) on NASA’s Terra satellite documents the changes. At the start of the series in 2000, the lake was already a fraction of its 1960 extent (black line). The Northern Aral Sea (sometimes called the Small Aral Sea) had separated from the Southern (Large) Aral Sea. The Southern Aral Sea had split into eastern and western lobes that remained tenuously connected at both ends. By 2001, the southern connection had been severed, and the shallower eastern part retreated rapidly over the next several years. Especially large retreats in the eastern lobe of the Southern Sea appear to have occurred between 2005 and 2009, when drought limited and then cut off the flow of the Amu Darya. Water levels then fluctuated annually between 2009 and 2014 in alternately dry and wet years. Dry conditions in 2014 caused the Southern Sea’s eastern lobe to completely dry up for the first time in modern times. Continue reading: <a href="http://1.usa.gov/1nLX9Ku" rel="nofollow">1.usa.gov/1nLX9Ku</a> Read more: <a href="http://1.usa.gov/1pqEnDj" rel="nofollow">1.usa.gov/1pqEnDj</a> Credit: <b><a href="http://www.earthobservatory.nasa.gov/" rel="nofollow"> NASA Earth Observatory</a></b> <b><a href="http://www.nasa.gov/audience/formedia/features/MP_Photo_Guidelines.html" rel="nofollow">NASA image use policy.</a></b> <b><a href="http://www.nasa.gov/centers/goddard/home/index.html" rel="nofollow">NASA Goddard Space Flight Center</a></b> enables NASA’s mission through four scientific endeavors: Earth Science, Heliophysics, Solar System Exploration, and Astrophysics. Goddard plays a leading role in NASA’s accomplishments by contributing compelling scientific knowledge to advance the Agency’s mission. <b>Follow us on <a href="http://twitter.com/NASAGoddardPix" rel="nofollow">Twitter</a></b> <b>Like us on <a href="http://www.facebook.com/pages/Greenbelt-MD/NASA-Goddard/395013845897?ref=tsd" rel="nofollow">Facebook</a></b> <b>Find us on <a href="http://instagram.com/nasagoddard?vm=grid" rel="nofollow">Instagram</a></b>
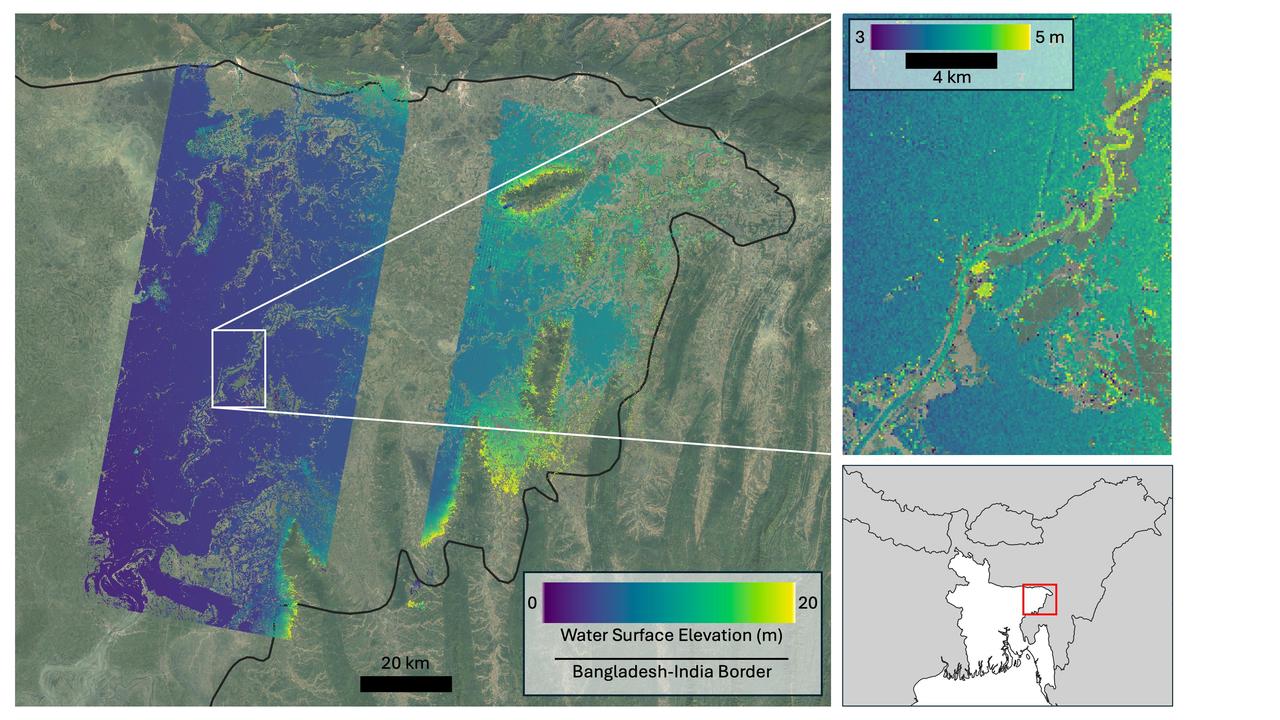
Flooding from monsoon rains covers a wide region of northeast Bangladesh near the India border in this Oct. 8, 2023, image showing data from the U.S.-French Surface Water and Ocean Topography (SWOT) satellite. Around that time, heavy monsoon rains affected various parts of Bangladesh, including the region depicted here, home to Sylhet, the country's fifth-largest city (population approximately 700,000). Sylhet and surrounding areas experienced substantial flooding. The SWOT data, overlaid on a standard Google Earth image, shows the precise surface elevation of the floodwaters. The vast majority of the land area within the region imaged by SWOT is flooded. In the main image at left, dark blue indicates waters just above sea level, while yellow represents 65 feet (20 meters) above sea level. The inset at top right zooms in on a section of the Kalni River, a tributary of one of Bangladesh's three major rivers, the Meghna. The main channel of the Kalni is about 650 feet (200 meters) wide. In the inset at top right, dark blue indicates water about 10 feet (3 meters) above sea level and yellow is used for waters about 16 feet (5 meters) above sea level. The zoomed-in data can be used to determine the slope of the river, which tells hydrologists how fast water flows through it and off a landscape. The water surface elevations depicted are higher in the top right of the inset than they are in the bottom left. The data also shows the elevation of the river is generally greater than that of water in the floodplain around it, telling hydrologists that water is likely flowing from the river into the floodplain. Each pixel in the image represents an area that is about 330 feet by 330 feet (100 meters by 100 meters). The image shows data from SWOT's Ka-band Radar Interferometer (KaRIn) instrument antennas, which don't cover a 12-mile-wide (20-kilometer-wide) strip right underneath the satellite. For that gap, a separate instrument collects water surface elevation data that isn't shown here. Bangladesh is a low-lying, generally flat country that chronically suffers from two types of flooding. Monsoon rains cause rivers that flow into Bangladesh from neighboring countries, especially India, to flood. And flash flooding occurs during the pre-monsoon season and can damage agricultural crops if not forecast with sufficient warning. While the use of satellite altimetry and precipitation in models has shown some promise for flood forecasting in Bangladesh, forecasting both types of flooding with sufficient lead time has remained challenging due to a lack of timely, high-spatial-resolution information on water elevation. SWOT is the first satellite to provide this information over entire regions, enabling improved forecasts and filling the data gap when places like Bangladesh become inundated. The Bangladesh Water Development Board, which is in charge of national flood forecasting and management, is now exploring how to incorporate SWOT water elevation information into its flood inundation forecasting system. Since shortly after launch in December 2022, SWOT has been measuring the height of nearly all water on Earth's surface, developing one of the most detailed, comprehensive views yet of the planet's oceans and freshwater lakes and rivers. The mission science team makes measurements using the KaRIn instrument. With two antennas spread 33 feet (10 meters) apart on a boom, KaRIn produces a pair of data swaths as it circles the globe, bouncing radar pulses off water surfaces to collect surface-height information. https://photojournal.jpl.nasa.gov/catalog/PIA26343

Taken by the Wide Field Planetary Camera 2 (WFPC2) of the Hubble Space Telescope (HST), this image of MyCn18, a young planetary nebula located about 8,000 light-years away, reveals its true shape to be an hourglass with an intricate pattern of "etchings" in its walls. The arc-like etchings could be the remnants of discrete shells ejected from the star when it was younger, flow instabilities, or could result from the action of a narrow beam of matter impinging on the hourglass walls. According to one theory on the formation of planetary nebulae, the hourglass shape is produced by the expansion of a fast stellar wind within a slowly expanding cloud, which is denser near its equator than near its poles. Hubble has also revealed other features in MyCn18 which are completely new and unexpected. For example, there is a pair of intersecting elliptical rings in the central region which appear to be the rims of a smaller hourglass. This picture has been composed from three separate images taken in the light of ionized nitrogen (represented by red), hydrogen (green) and doubly-ionized oxygen (blue). The results are of great interest because they shed new light on the poorly understood ejection of stellar matter which accompanies the slow death of sun-like stars. An unseen companion star and accompanying gravitational effects may well be necessary in order to explain the structure of MyCn18. The Marshall Space Flight Center (MSFC) had responsibility for design, development, and construction of the HST.
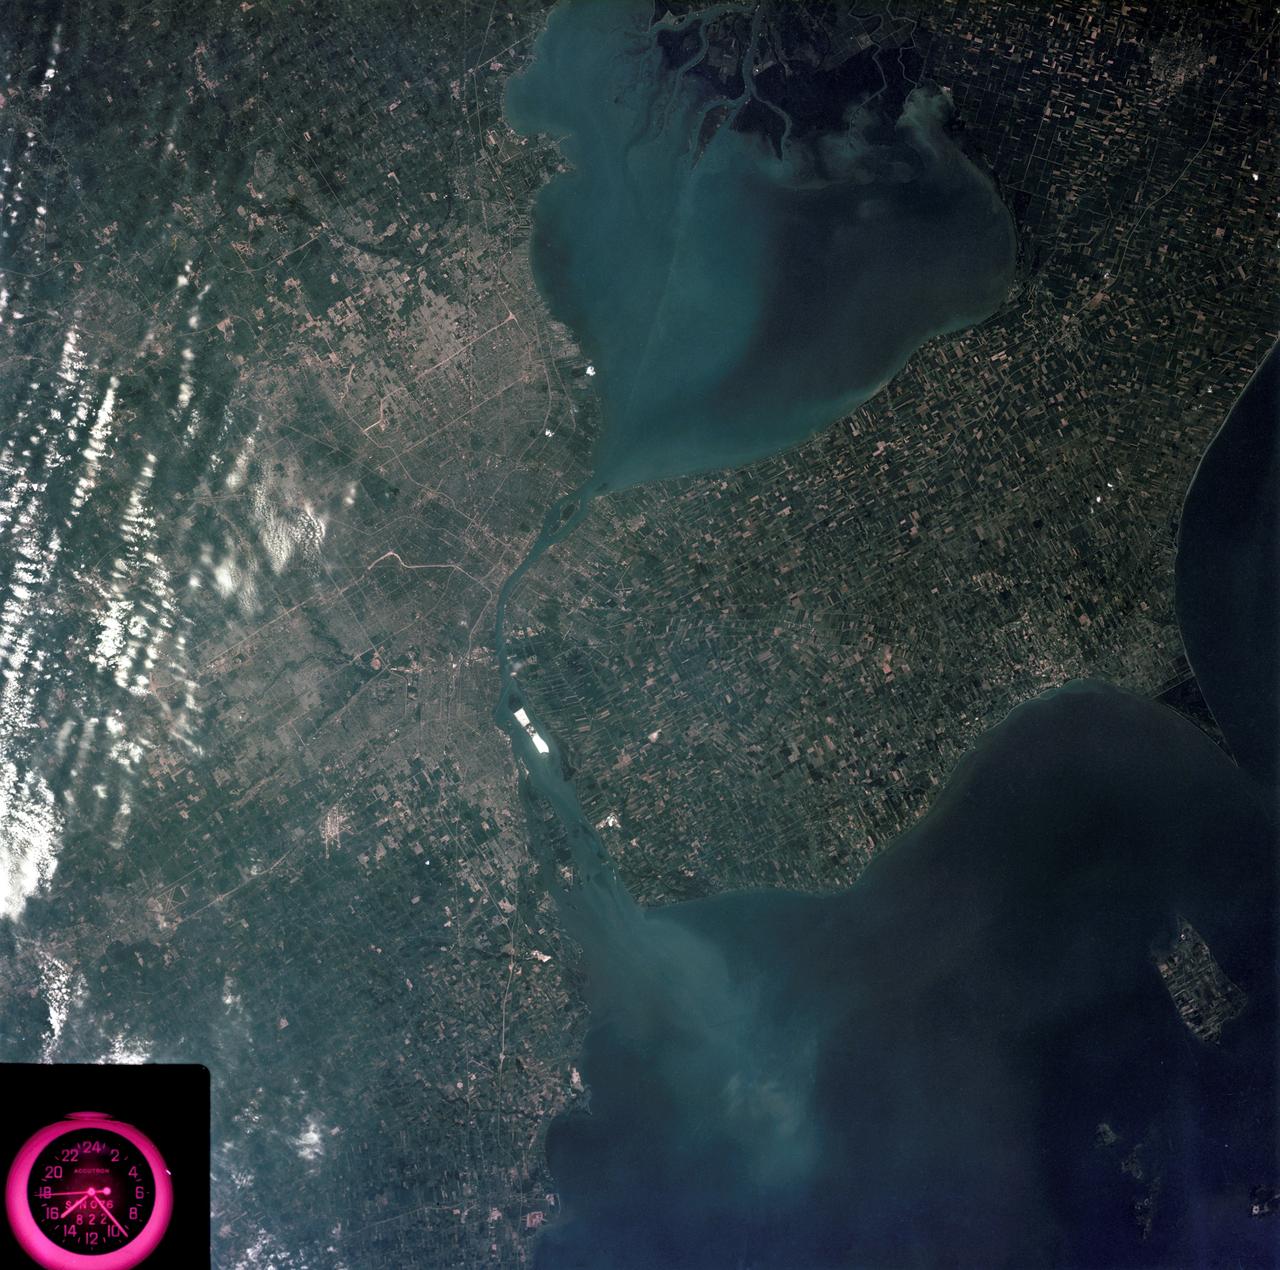
SL3-83-0152 (July-September 1973) --- A near vertical view of the metropolitan Detroit, Michigan area is seen in this Skylab 3 Earth Resources Experiments Package S190-B (five-inch Earth terrain camera) photograph taken from the Skylab space station in Earth orbit. The 25-mile long Detroit River drains the smaller body of water (Lake St. Clair) and flows southwestward separating Detroit from Windsor, Ontario, and empties into Lake Erie. The Detroit River handles a great deal of Great Lakes barge and ship traffic. Major streets and thoroughfares radiating from the city are clearly visible. Fighting Island is the highly reflective, white area located almost in the center of the picture. This high reflectivity is caused by the functional use of the island-disposal ponds for chemical salts. Sedimentation and/or pollution patterns in the area provide interesting visual phenomena for speculation and analysis. Distinct and rather unique cultivated field patterns can be observed south and east of Windsor, Ontario. This is a direct result of an English survey and land tenure system which was utilized when the area was settled. New areas of residential development are fairly easy to differentiate from older, established residential areas. Vegetation and extent of area coverage can be determined. The Oakland County Planning Commission and the Federal Bureau of Outdoor Recreation working closely with Irv Sattinger of the Environmental Research Institute of Michigan (University of Michigan) are presently processing and analyzing photographic and Multispectral scanner data to determine its usefulness for recreation and open space site studies for this area. Photo credit: NASA
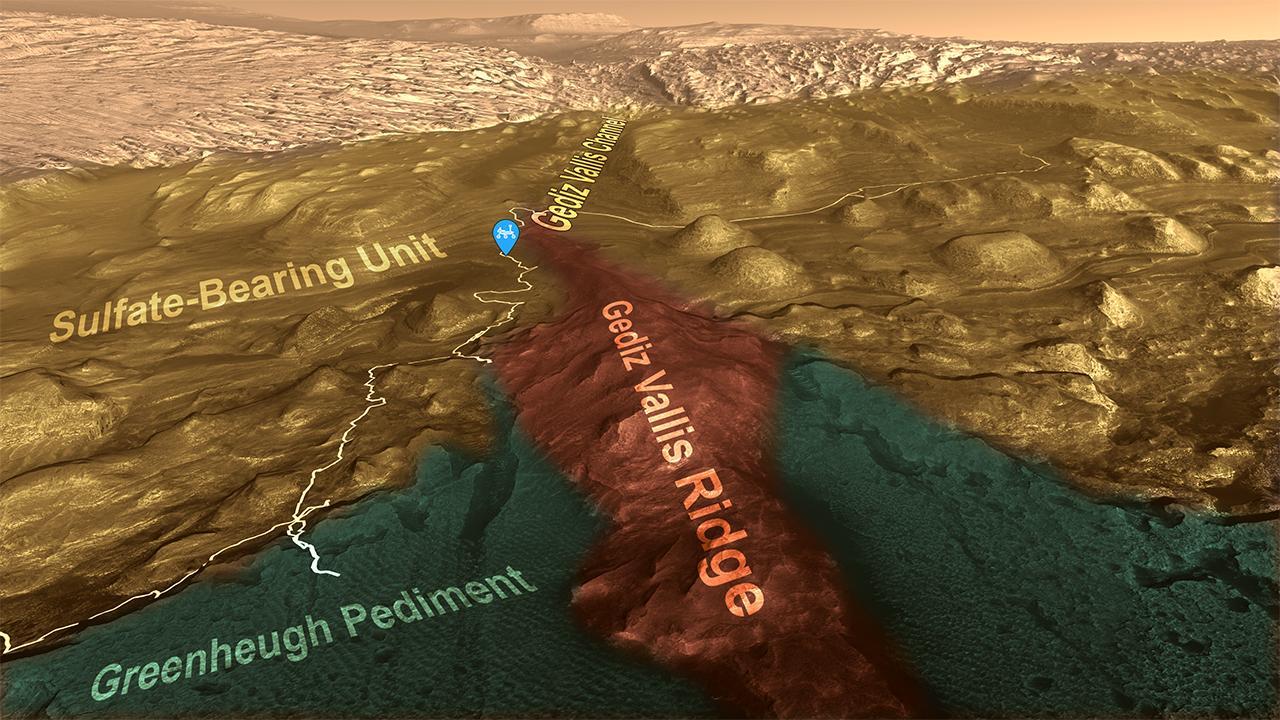
This animation shows the route NASA's Curiosity Mars rover has taken while driving up the lower part of 3-mile-tall (5-kilometer-tall) Mount Sharp. In August 2023, Curiosity was near the top end of Gediz Vallis Ridge (shown in red.) The rover's past and future path is illustrated by the pale line through the landscape. Different layers of Mount Sharp represent different eras of Martian history. As Curiosity ascends, scientists learn more about how the landscape changed over time. The rover is currently in the sulfate-bearing unit (colored gold in this animation), which may be the highest elevation layer it will ever visit. Sulfates are salty minerals that form as water is drying up, and the sulfate-bearing layer is believed to represent a transition to a drier climate 3 billion years ago on ancient Mars. (The green-colored area, the Greenheugh Pediment, is a separate layer that cuts across the sulfate-bearing unit and the clay-bearing unit, which the rover explored from 2019 until entering the sulfate-bearing unit last year.) Near the top of this animation is Gediz Vallis Channel, a snake-like path reminiscent of river channels on Earth. Further down, the channel is buried by debris flows that carried mud and boulders farther down the mountain. That material – most of it from the upper layers of Mount Sharp – is believed to have spread into a debris fan that was later eroded by wind into the towering Gediz Vallis Ridge. The ridge is thus a rare opportunity to study material from higher-elevation layers Curiosity will never reach. Curiosity sought to visit the ridge several times in the past, including when it tried to drive across the Greenheugh Pediment. The rover was forced to turn back (as seen in the lower left of the animation) because of knife-sharp "gator-back" rocks that would have damaged its wheels. Other attempts to reach the ridge proved too steep. Finally, after one of the most difficult climbs the mission has faced, Curiosity arrived Aug. 14, 2023, at an area where it could study the long-sought ridge with its 7-foot (2-meter) robotic arm. Movie available at https://photojournal.jpl.nasa.gov/catalog/PIA26042
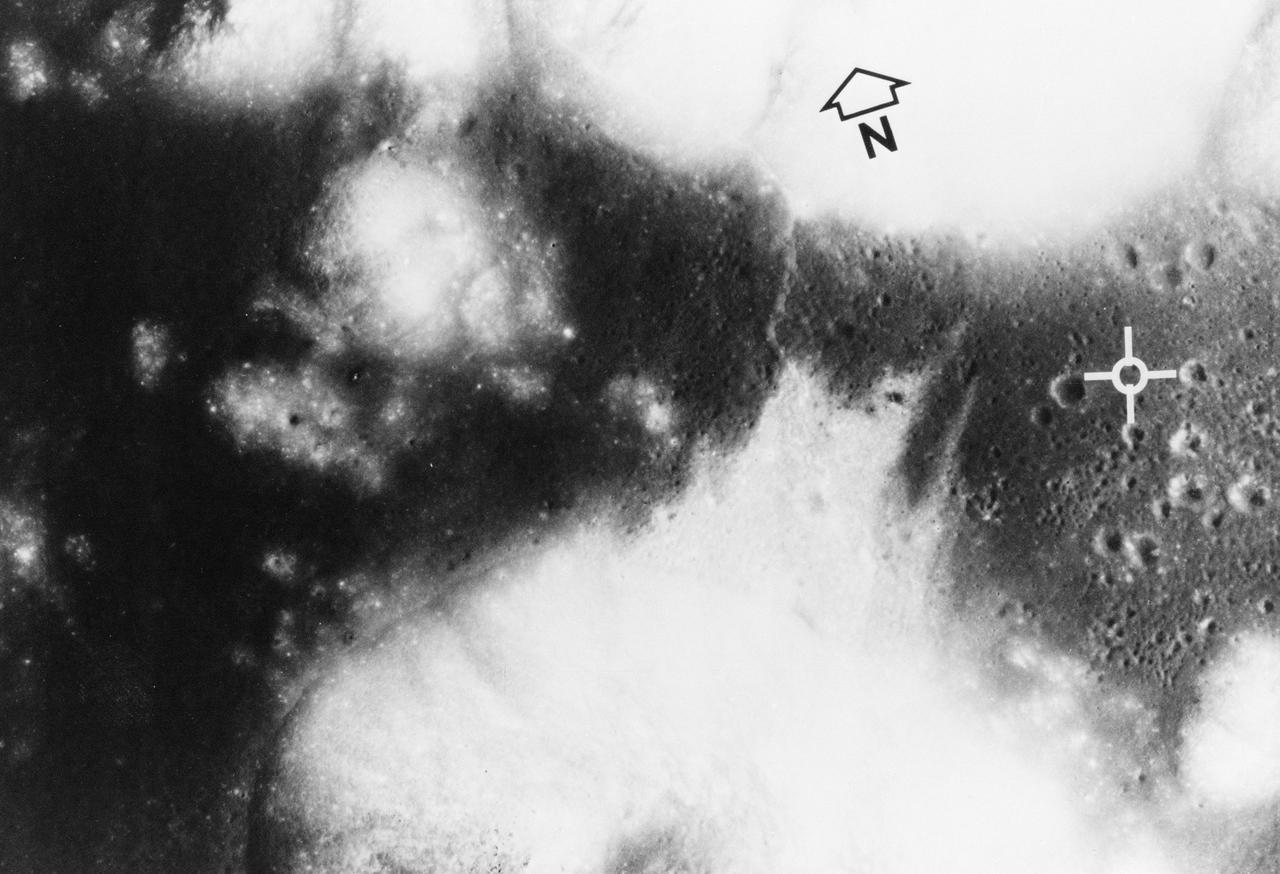
S72-35010 (April 1972) --- The Apollo Program's final manned landing on the moon will explore a site designated Taurus-Littrow on the southeastern rim of the Sea of Serenity. This photograph from the Apollo 15 Metric Camera gives a vertical view of the Apollo 17 landing site at 20 degrees north latitude and 30 degrees east longitude. The site (white cross) is on a dark-cratered plain at the base of light-colored highland mountains. The major scientific objective is to study the highlands for new knowledge about what is believed to be representative of the most ancient part of the moon. The darker material forms a bay amid steep-sided mountains that rise almost 2 kilometers (1 1/4 miles) above the adjacent plain or basin. Mountain slopes in excess of 25 degrees are common. The individual mountain masses and ridges are believed to represent very old highland crustal blocks structurally separated by various basin-forming events. The basin and parts of the highlands are mantled (covered) with dark deposits that may be fragmented rocks of volcanic origin. The dark mantle, a very low albedo, (low light-reflective) loose material which covers pre-existing terrain, is extensively developed in this region. Sampling of the dark deposits is given a high priority since its age and composition wouls shed light on the thermal history of the moon. Panoramic photography and command module pilot observations on Apollo 15 documented the presence here of a number of cinder cones which may be related to the dark mantle. It might be dust blown out by a volcanic eruption. Radar maps indicate this dark mantle is different because of its scarcity of block material. The photo covers 22 kilometers (13.5 miles) from east to west and 15 kilometers (9 miles) north to south. A ridge-like feature snakes from north to south across the basin and highlands about 6 kilometers (3.7 miles) west of the landing point, and is partly covered by a northward debris flow from the base of a mountain southwest
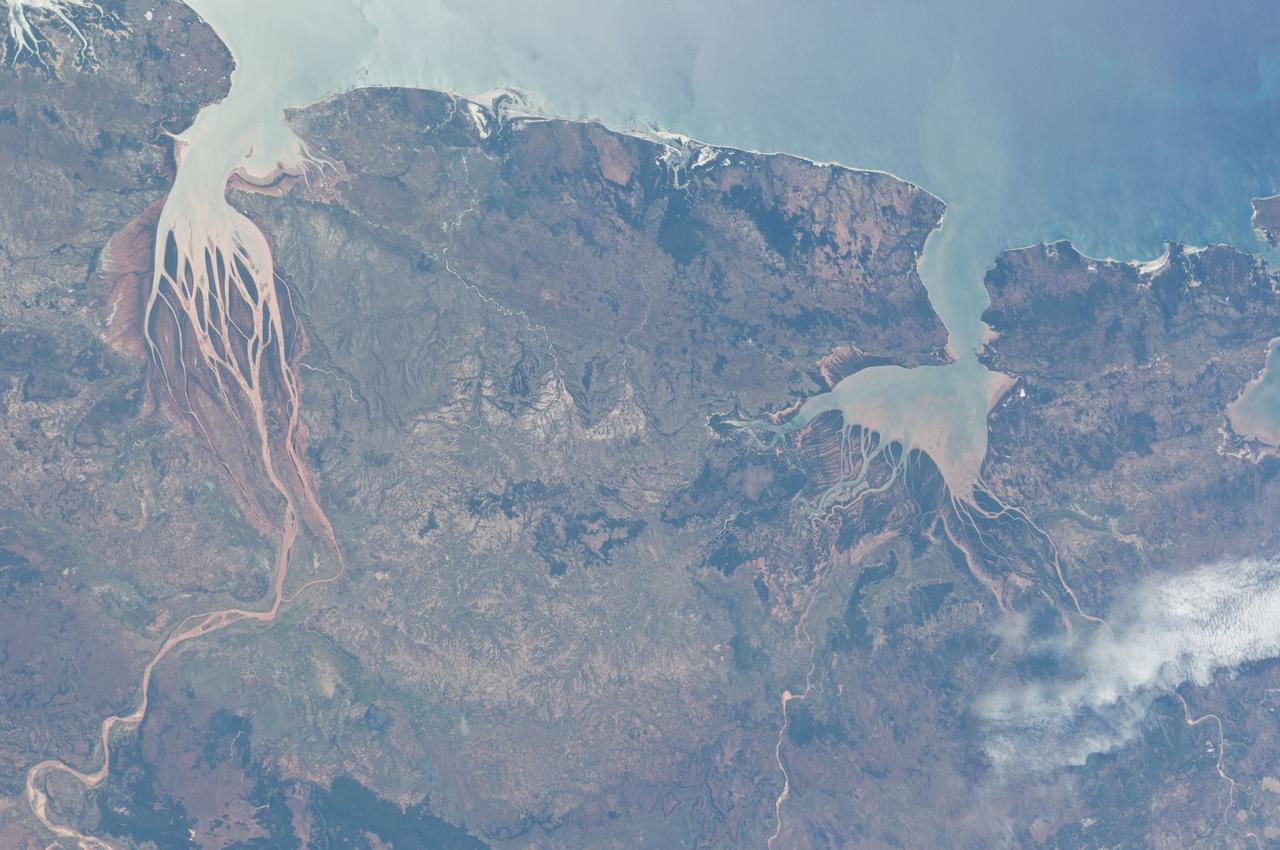
ISS028-E-006687 (2 June 2011) --- Estuaries on the northwestern coast of Madagascar are featured in this image photographed by an Expedition 28 crew member on the International Space Station. Regions where fresh water flowing in rivers and salt water from the seas and oceans mix are called estuaries, and they are among the most biologically productive ecosystems on Earth. This photograph highlights two estuaries located along the northwestern coastline of the island of Madagascar. The Mozambique Channel (top) separates Madagascar from the southeastern coast of Africa. Bombetoka Bay (upper left) is fed by the Betsiboka River and is a frequent subject of astronaut photography due to its striking red floodplain sediments. Mahajamba Bay (right) is fed by several rivers including the Mahajamba and Sofia Rivers; like the Betsiboka, the floodplains of these rivers also contain reddish sediments eroded from their basins upstream. The brackish (mix of fresh and salty water) conditions found in most estuaries host unique plant and animal species adapted to live in such environments. Mangroves in particular are a common plant species found in and around Madagascar estuaries, and Bombetoka Bay contains some of the largest remaining stands. Estuaries also host abundant fish and shellfish species ? many of which need access to freshwater for a portion of their life cycles ? and these in turn support local and migratory bird species that prey on them. However, human activities such as urban development, overfishing, and increased sediment loading from erosion of upriver highlands threaten the ecosystem health of the estuaries. In particular, the silt deposits in Bombetoka Bay at the mouth of the Betsiboka River have been filling in the bay.
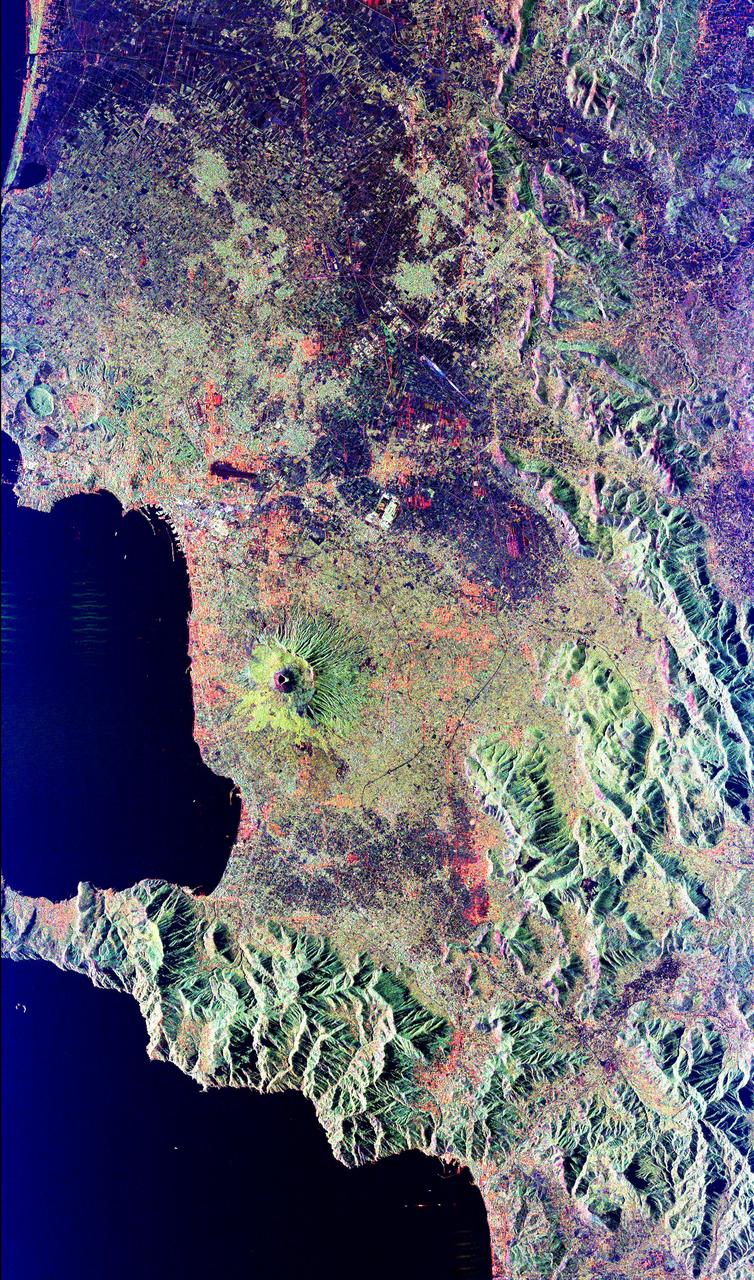
Mt. Vesuvius, one of the best known volcanoes in the world primarily for the eruption that buried the Roman city of Pompeii, is shown in the center of this radar image. The central cone of Vesuvius is the dark purple feature in the center of the volcano. This cone is surrounded on the northern and eastern sides by the old crater rim, called Mt. Somma. Recent lava flows are the pale yellow areas on the southern and western sides of the cone. Vesuvius is part of a large volcanic zone which includes the Phalagrean Fields, the cluster of craters seen along the left side of the image. The Bay of Naples, on the left side of the image, is separated from the Gulf of Salerno, in the lower left, by the Sorrento Peninsula. Dense urban settlement can be seen around the volcano. The city of Naples is above and to the left of Vesuvius; the seaport of the city can be seen in the top of the bay. Pompeii is located just below the volcano on this image. The rapid eruption in 79 A.D. buried the victims and buildings of Pompeii under several meters of debris and killed more than 2,000 people. Due to the violent eruptive style and proximity to populated areas, Vesuvius has been named by the international scientific community as one of fifteen Decade Volcanoes which are being intensively studied during the 1990s. The image is centered at 40.83 degrees North latitude, 14.53 degrees East longitude. It shows an area 100 kilometers by 55 kilometers (62 miles by 34 miles.) This image was acquired on April 15, 1994 by the Spaceborne Imaging Radar-C/X-Band Synthetic Aperture Radar (SIR-C/X-SAR) aboard the Space Shuttle Endeavour. SIR-C/X-SAR, a joint mission of the German, Italian and the United States space agencies, is part of NASA's Mission to Planet Earth. http://photojournal.jpl.nasa.gov/catalog/PIA01780

ISS038-E-003612 (15 Nov. 2013) --- Islands of the Four Mountains are featured in this image photographed by an Expedition 38 crew member on the International Space Station. Morning sunlight illuminates the southeast-facing slopes of the islands in the photograph. The islands, part of the Aleutian Island chain, are actually the upper slopes of volcanoes rising from the sea floor; Carlisle, Cleveland, Herbert, and Tana. Carlisle and Herbert volcanoes are distinct cones and form separate islands. Cleveland volcano and the Tana volcanic complex form the eastern and western ends respectively of Chuginadak Island; a cloud bank obscures the connecting land mass in this image. Cleveland volcano (peak elevation 1,730 meters above sea level) is one of the most active in the Aleutian chain, with its most recent activity--eruptions and lava flow emplacement--taking place in May of 2013. The northernmost of the islands, Carlisle volcano's (peak elevation 1,620 meters above sea level) last confirmed eruption occurred in 1828, with unconfirmed reports of activity in 1987. Herbert volcano (peak elevation 1,280 meters above sea level) to the southwest displays a classic cone structure breached by a two-kilometer wide summit caldera (upper right), but there are no historical records of volcanic activity. The easternmost peak, Tana (1,170 meters above sea level) is a volcanic complex comprised of two east-west trending volcanoes and associated younger cinder cones; like Herbert volcano, there is no historical record of activity at Tana. A layer of low clouds and/or fog obscures much of the lower elevations of the islands and the sea surface, but the clouds also indicate the general airflow pattern around and through the islands. Directly to the south-southeast of Cleveland volcano a Von Karman vortex "street" is visible. Shadows cast by the morning sun extend from the peaks towards the northwest. The peaks of all of the Four Islands have snow cover; this is distinct from the clouds due to both higher brightness (white versus gray) and specific location on the landscape.
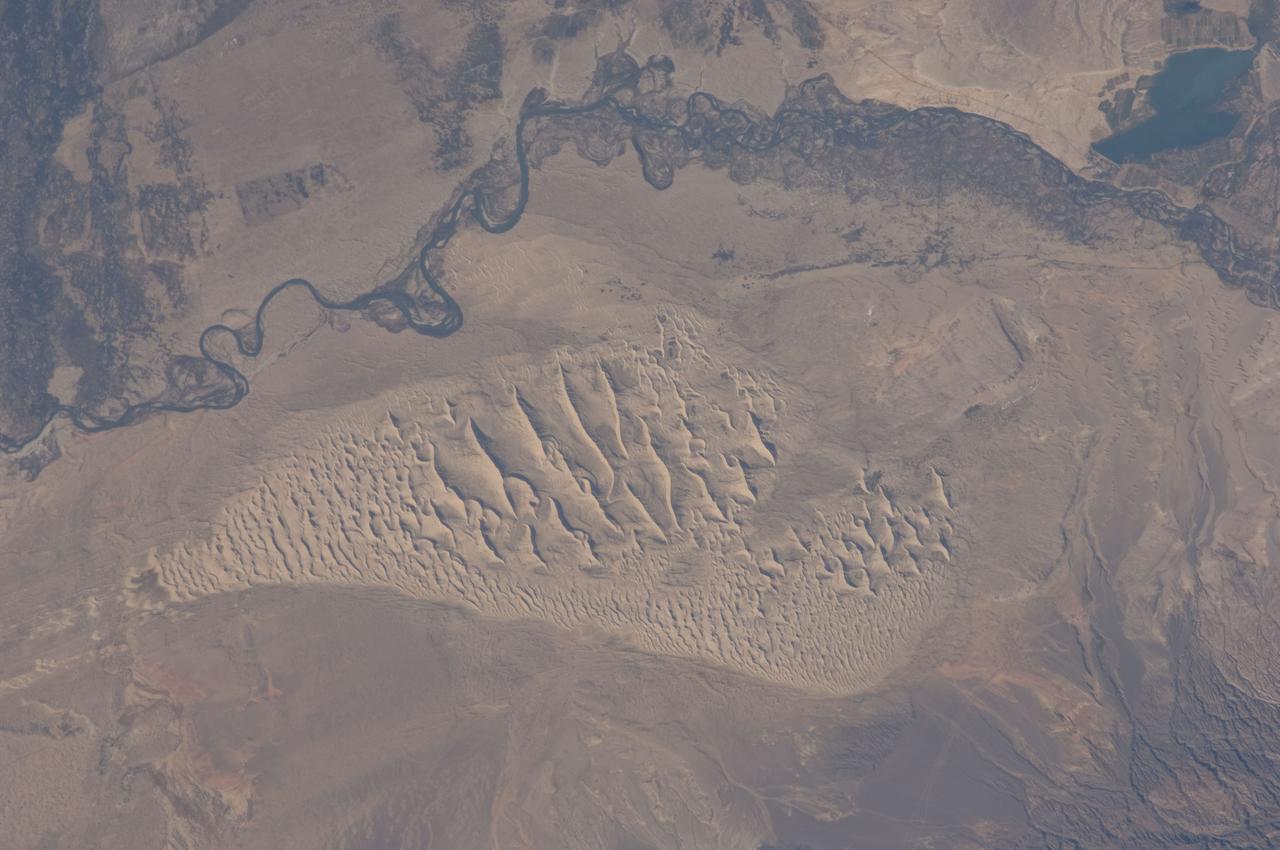
ISS028-E-044444 (8 Sept. 2011) --- This image, photographed by an Expedition 28 crew member on the International Space Station, highlights a sand dune field within the Burqin-Haba River-Jimunai Desert near the borders of China, Mongolia, Russia and Kazakhstan. The dune field (approximately 32 kilometers long) is located immediately to the west-northwest of the city of Burqin (not shown), and is part of the Junggar Basin, a region of active petroleum production in northwestern China. The Irtysh River, with associated wetlands and riparian vegetation (appearing grey-green in the image) flows from its headwaters in the Altay Mountains to the east towards Siberia to the west (right to left). Tan sandy linear dunes at center on the south side of the Irtysh River dominate the view. The linear dunes are formed from mobile barchan (crescent-shaped) dunes moving from left to right in this view; the barchans eventually merge to form the large linear dunes some of which reach 50-100 meters in height. Sand moving along the southern edge of the dune field appears to be feeding a southeastern lobe with a separate population of linear dunes (lower right). The Burqin-Haba River-Jimunai Desert area also includes darker gravel covered surfaces that form pavements known locally as gobi. These are somewhat indistinguishable from vegetated areas arresting some of the dunes at the resolution of the image, but tend to be located on the flat regions between the dunes.
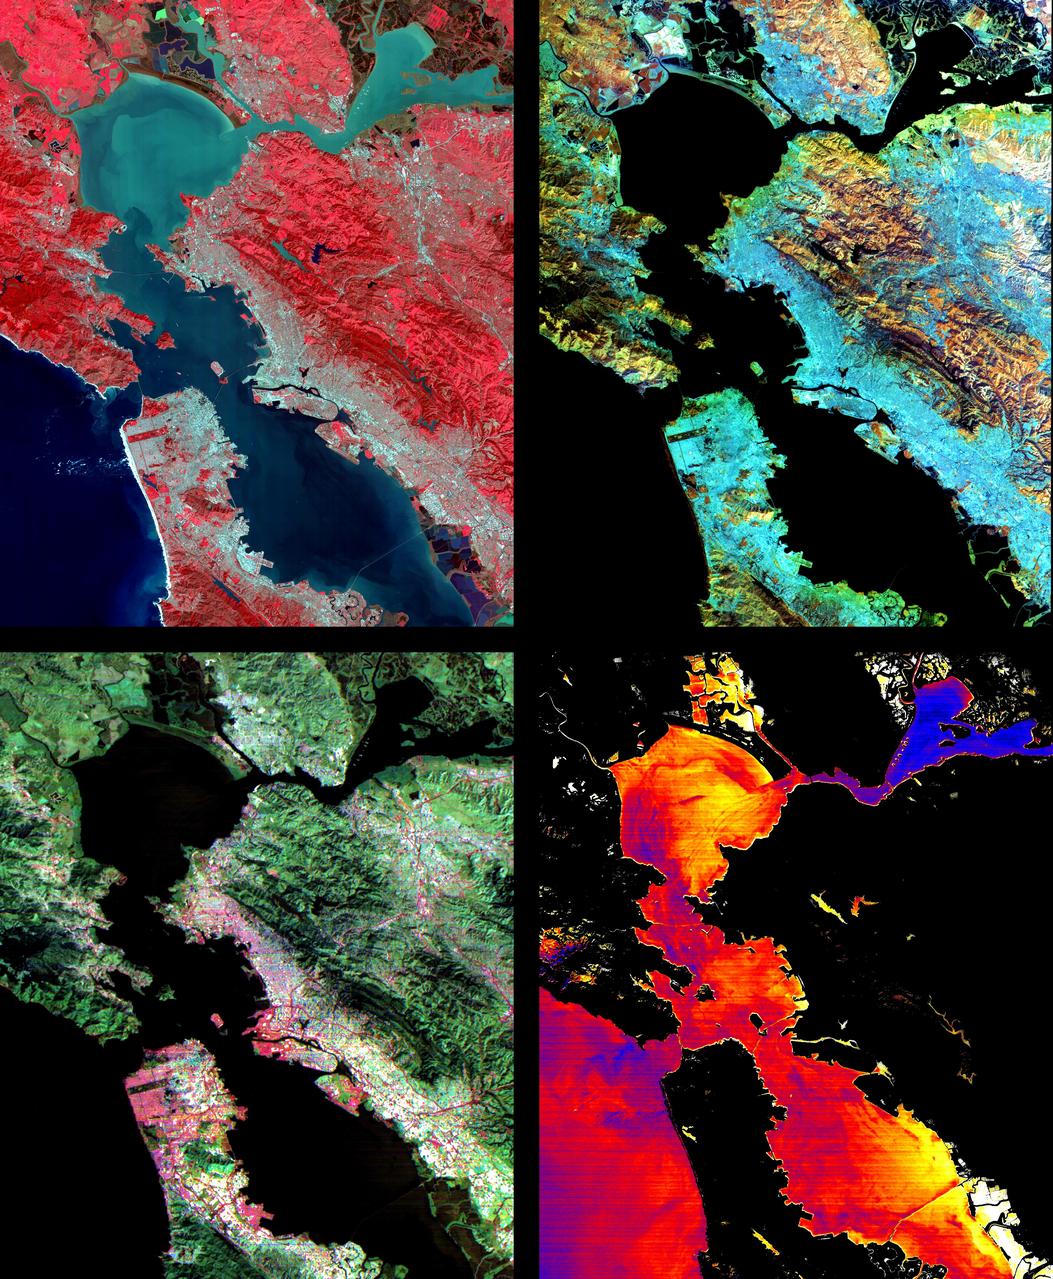
These images of the San Francisco Bay region were acquired on March 3, 2000 by the Advanced Spaceborne Thermal Emission and Reflection Radiometer (ASTER) on NASA's Terra satellite. Each covers an area 60 kilometers (37 miles) wide and 75 kilometers (47 miles) long. With its 14 spectral bands from the visible to the thermal infrared wavelength region, and its high spatial resolution of 15 to 90 meters (about 50 to 300 feet), ASTER will image the Earth for the next 6 years to map and monitor the changing surface of our planet. Upper Left: The color infrared composite uses bands in the visible and reflected infrared. Vegetation is red, urban areas are gray; sediment in the bays shows up as lighter shades of blue. Thanks to the 15 meter (50-foot) spatial resolution, shadows of the towers along the Bay Bridge can be seen. Upper right: A composite of bands in the short wave infrared displays differences in soils and rocks in the mountainous areas. Even though these regions appear entirely vegetated in the visible, enough surface shows through openings in the vegetation to allow the ground to be imaged. Lower left: This composite of multispectral thermal bands shows differences in urban materials in varying colors. Separation of materials is due to differences in thermal emission properties, analogous to colors in the visible. Lower right: This is a color coded temperature image of water temperature, derived from the thermal bands. Warm waters are in white and yellow, colder waters are blue. Suisun Bay in the upper right is fed directly from the cold Sacramento River. As the water flows through San Pablo and San Francisco Bays on the way to the Pacific, the waters warm up. http://photojournal.jpl.nasa.gov/catalog/PIA02605

Africa is front and center in this image of Earth taken by a NASA camera on the Deep Space Climate Observatory (DSCOVR) satellite. The image, taken July 6 from a vantage point one million miles from Earth, was one of the first taken by NASA’s Earth Polychromatic Imaging Camera (EPIC). Central Europe is toward the top of the image with the Sahara Desert to the south, showing the Nile River flowing to the Mediterranean Sea through Egypt. The photographic-quality color image was generated by combining three separate images of the entire Earth taken a few minutes apart. The camera takes a series of 10 images using different narrowband filters -- from ultraviolet to near infrared -- to produce a variety of science products. The red, green and blue channel images are used in these Earth images. The DSCOVR mission is a partnership between NASA, the National Oceanic and Atmospheric Administration (NOAA) and the U.S. Air Force, with the primary objective to maintain the nation’s real-time solar wind monitoring capabilities, which are critical to the accuracy and lead time of space weather alerts and forecasts from NOAA. DSCOVR was launched in February to its planned orbit at the first Lagrange point or L1, about one million miles from Earth toward the sun. It’s from that unique vantage point that the EPIC instrument is acquiring images of the entire sunlit face of Earth. Data from EPIC will be used to measure ozone and aerosol levels in Earth’s atmosphere, cloud height, vegetation properties and a variety of other features. Image Credit: NASA
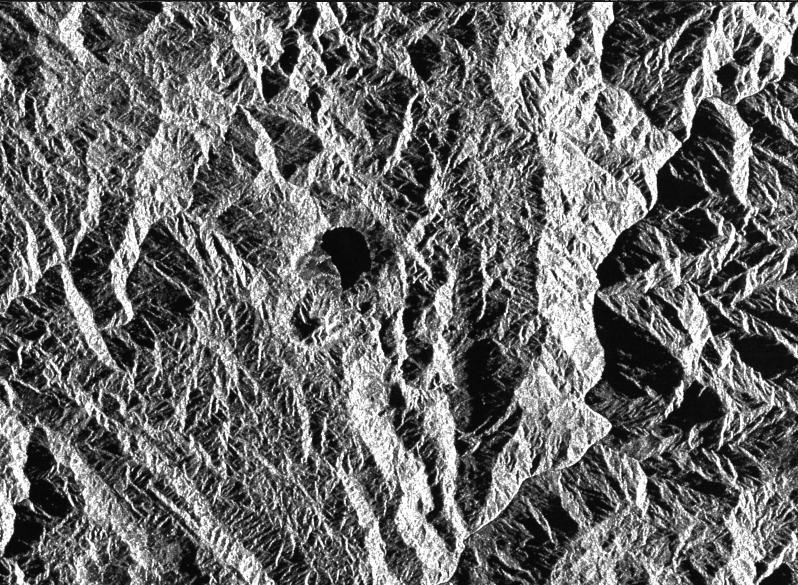
This is a radar image of a little known volcano in northern Colombia. The image was acquired on orbit 80 of space shuttle Endeavour on April 14, 1994, by NASA Spaceborne Imaging Radar C/X-Band Synthetic Aperture Radar SIR-C/X-SAR. The volcano near the center of the image is located at 5.6 degrees north latitude, 75.0 degrees west longitude, about 100 kilometers (65 miles) southeast of Medellin, Colombia. The conspicuous dark spot is a lake at the bottom of an approximately 3-kilometer-wide (1.9-mile) volcanic collapse depression or caldera. A cone-shaped peak on the bottom left (northeast rim) of the caldera appears to have been the source for a flow of material into the caldera. This is the northern-most known volcano in South America and because of its youthful appearance, should be considered dormant rather than extinct. The volcano's existence confirms a fracture zone proposed in 1985 as the northern boundary of volcanism in the Andes. The SIR-C/X-SAR image reveals another, older caldera further south in Colombia, along another proposed fracture zone. Although relatively conspicuous, these volcanoes have escaped widespread recognition because of frequent cloud cover that hinders remote sensing imaging in visible wavelengths. Four separate volcanoes in the Northern Andes nations of Colombia and Ecuador have been active during the last 10 years, killing more than 25,000 people, including scientists who were monitoring the volcanic activity. Detection and monitoring of volcanoes from space provides a safe way to investigate volcanism. The recognition of previously unknown volcanoes is important for hazard evaluations because a number of major eruptions this century have occurred at mountains that were not previously recognized as volcanoes. http://photojournal.jpl.nasa.gov/catalog/PIA01722

This is an image of equatorial Africa, centered on the equator at longitude 15degrees east. This image is a mosaic of almost 4,000 separate images obtained in 1996 by the L-band imaging radar onboard the Japanese Earth Resources Satellite. Using radar to penetrate the persistent clouds prevalent in tropical forests, the Japanese Earth Resources Satellite was able for the first time to image at high resolution this continental scale region during single flooding seasons. The area shown covers about 7.4 million square kilometers (2.8 million square miles) of land surface, spans more than 5,000 kilometers(3,100 miles) east and west and some 2,000 kilometers (1,240 miles) north and south. North is up in this image. At the full resolution of the mosaic (100 meters or 330 feet), this image is more than 500 megabytes in size, and was processed from imagery totaling more than 60 gigabytes. Central Africa was imaged twice in 1996, once between January and March, which is the major low-flood season in the Congo Basin, and once between October and November, which is the major high-flood season in the Congo Basin. The red color corresponds to the data from the low-flood season, the green to the high-flood season, and the blue to the "texture" of the low-flood data. The forests appear green as a result, the flooded and palm forests, as well as urban areas, appear yellow, the ocean and lakes appear black, and savanna areas appear blue, black or green, depending on the savanna type, surface topography and other factors. The areas of the image that are black and white were mapped only between January and March 1996. In these areas, the black areas are savanna or open water, the gray are forests, and the white areas are flooded forests or urban areas. The Congo River dominates the middle of the image, where the nearby forests that are periodically flooded by the Congo and its tributaries stand out as yellow. The Nile River flows north from Lake Victoria in the middle right of the color portion of the mosaic. http://photojournal.jpl.nasa.gov/catalog/PIA01348

Shown here in a new image taken with the Advanced Camera for Surveys (ACS) on board the NASA/ESA Hubble Space Telescope is the globular cluster NGC 1783. This is one of the biggest globular clusters in the Large Magellanic Cloud, a satellite galaxy of our own galaxy, the Milky Way, in the southern hemisphere constellation of Dorado. First observed by John Herschel in 1835, NGC 1783 is nearly 160,000 light-years from Earth, and has a mass around 170,000 times that of the sun. Globular clusters are dense collections of stars held together by their own gravity, which orbit around galaxies like satellites. The image clearly shows the symmetrical shape of NGC 1783 and the concentration of stars towards the center, both typical features of globular clusters. By measuring the color and brightness of individual stars, astronomers can deduce an overall age for a cluster and a picture of its star formation history. NGC 1783 is thought to be less than one and a half billion years old — which is very young for globular clusters, which are typically several billion years old. During that time, it is thought to have undergone at least two periods of star formation, separated by 50 to 100 million years. This ebb and flow of star-forming activity is an indicator of how much gas is available for star formation at any one time. When the most massive stars created in the first burst of formation explode as supernovae they blow away the gas needed to form further stars, but the gas reservoir can later be replenished by less massive stars which last longer and shed their gas less violently. After this gas flows to the dense central regions of the star cluster, a second phase of star formation can take place and once again the short-lived massive stars blow away any leftover gas. This cycle can continue a few times, at which time the remaining gas reservoir is thought to be too small to form any new stars. Image credit: ESA/Hubble & NASA, Acknowledgement: Judy Schmidt <b><a href="http://www.nasa.gov/audience/formedia/features/MP_Photo_Guidelines.html" rel="nofollow">NASA image use policy.</a></b> <b><a href="http://www.nasa.gov/centers/goddard/home/index.html" rel="nofollow">NASA Goddard Space Flight Center</a></b> enables NASA’s mission through four scientific endeavors: Earth Science, Heliophysics, Solar System Exploration, and Astrophysics. Goddard plays a leading role in NASA’s accomplishments by contributing compelling scientific knowledge to advance the Agency’s mission. <b>Follow us on <a href="http://twitter.com/NASAGoddardPix" rel="nofollow">Twitter</a></b> <b>Like us on <a href="http://www.facebook.com/pages/Greenbelt-MD/NASA-Goddard/395013845897?ref=tsd" rel="nofollow">Facebook</a></b> <b>Find us on <a href="http://instagrid.me/nasagoddard/?vm=grid" rel="nofollow">Instagram</a></b>

Wonders in the Antarctic Sea and Sky NASA aircraft and scientists have returned to the United States after a short ice-surveying mission to #Antarctica. Despite having only a week of flying time, the team returned with crucial scientific data and a trove of spectacular aerial photographs. The flights over Antarctica were part of Operation #IceBridge, a multi-year mission to monitor conditions in Antarctica and the Arctic until a new ice-monitoring satellite, ICESat-2, launches in 2016. ICESat-1 was decommissioned in 2009, and IceBridge aircraft have been flying ever since. Laser altimeter and radar data are the primary products of the mission, but IceBridge project scientist Michael Studinger almost always has his digital camera ready as well. On November 24, 2013, he took this photograph of a multi-layered lenticular cloud hovering near Mount Discovery, a volcano about 70 kilometers (44 miles) southwest of McMurdo. Lenticular #clouds are a type of wave cloud. They usually form when a layer of air near the surface encounters a topographic barrier, gets pushed upward, and flows over it as a series of atmospheric gravity waves. Lenticular clouds form at the crest of the waves, where the air is coolest and water vapor is most likely to condense into cloud droplets. The bulging sea ice in the foreground is a pressure ridge, which formed when separate ice floes collided and piled up on each other. Read more: <a href="http://1.usa.gov/18lXIQS" rel="nofollow">1.usa.gov/18lXIQS</a> Photograph courtesy of Michael Studinger. Caption by Adam Voiland of NASA's Earth Observatory. <b><a href="http://www.nasa.gov/audience/formedia/features/MP_Photo_Guidelines.html" rel="nofollow">NASA image use policy.</a></b> <b><a href="http://www.nasa.gov/centers/goddard/home/index.html" rel="nofollow">NASA Goddard Space Flight Center</a></b> enables NASA’s mission through four scientific endeavors: Earth Science, Heliophysics, Solar System Exploration, and Astrophysics. Goddard plays a leading role in NASA’s accomplishments by contributing compelling scientific knowledge to advance the Agency’s mission. <b>Follow us on <a href="http://twitter.com/NASA_GoddardPix" rel="nofollow">Twitter</a></b> <b>Like us on <a href="http://www.facebook.com/pages/Greenbelt-MD/NASA-Goddard/395013845897?ref=tsd" rel="nofollow">Facebook</a></b> <b>Find us on <a href="http://instagram.com/nasagoddard?vm=grid" rel="nofollow">Instagram</a></b>
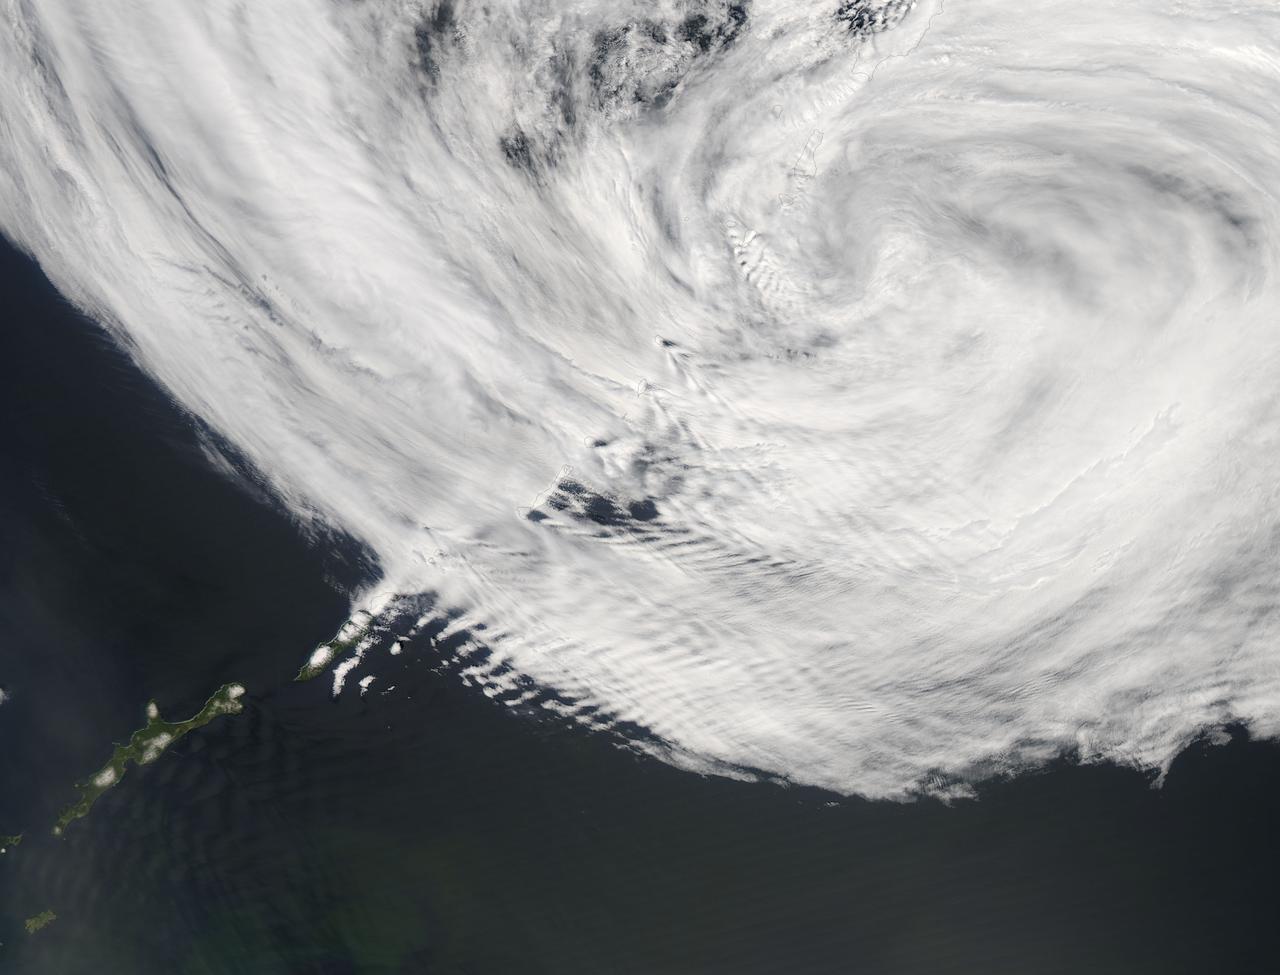
The Kuril Islands are a string of volcanically-formed islands that stretch between Russia and Japan, separating the North Pacific Ocean from the Sea of Okhotsk. Subject to the cold, moist breezes from the North Atlantic, and the frigid air from Siberia, the climate is severe, with frequent storms, and ever-present winds, which often reach hurricane strength. Cloudy, windy conditions are common. On June 1, 2015 the Moderate Resolution Imaging Spectroradiometer (MODIS) aboard NASA’s Aqua satellite captured this true-color image as it passed over the Kuril Islands. Clouds curl into the center of a storm system, bringing strong winds to the region. As the winds scrape over the tall volcanic peaks of the Kuril Islands, they become turbulent air behind the islands. The turbulence disturbs the cloudbank, etching its passage into a striking pattern that can be seen from space. This particular pattern is called “ship-waved-shaped wave clouds”, because the pattern can be likened to that formed behind a ship cutting through a smooth ocean. On the windward side of the Kuril Islands, the cloud bank is generally smooth, with streaks that are lined up parallel to the movement of the wind, blowing from the west and towards the east. Behind the tall volcanic peaks of the islands, V’s fan out on the leeward side, illustrating the flow of the turbulent air. Image Credit: Jeff Schmaltz, MODIS Land Rapid Response Team, NASA GSFC <b><a href="http://www.nasa.gov/audience/formedia/features/MP_Photo_Guidelines.html" rel="nofollow">NASA image use policy.</a></b> <b><a href="http://www.nasa.gov/centers/goddard/home/index.html" rel="nofollow">NASA Goddard Space Flight Center</a></b> enables NASA’s mission through four scientific endeavors: Earth Science, Heliophysics, Solar System Exploration, and Astrophysics. Goddard plays a leading role in NASA’s accomplishments by contributing compelling scientific knowledge to advance the Agency’s mission. <b>Follow us on <a href="http://twitter.com/NASAGoddardPix" rel="nofollow">Twitter</a></b> <b>Like us on <a href="http://www.facebook.com/pages/Greenbelt-MD/NASA-Goddard/395013845897?ref=tsd" rel="nofollow">Facebook</a></b> <b>Find us on <a href="http://instagrid.me/nasagoddard/?vm=grid" rel="nofollow">Instagram</a></b>

Africa is front and center in this image of Earth taken by a NASA camera on the Deep Space Climate Observatory (DSCOVR) satellite. The image, taken July 6 from a vantage point one million miles from Earth, was one of the first taken by NASA’s Earth Polychromatic Imaging Camera (EPIC). Central Europe is toward the top of the image with the Sahara Desert to the south, showing the Nile River flowing to the Mediterranean Sea through Egypt. The photographic-quality color image was generated by combining three separate images of the entire Earth taken a few minutes apart. The camera takes a series of 10 images using different narrowband filters -- from ultraviolet to near infrared -- to produce a variety of science products. The red, green and blue channel images are used in these Earth images. The DSCOVR mission is a partnership between NASA, the National Oceanic and Atmospheric Administration (NOAA) and the U.S. Air Force, with the primary objective to maintain the nation’s real-time solar wind monitoring capabilities, which are critical to the accuracy and lead time of space weather alerts and forecasts from NOAA. DSCOVR was launched in February to its planned orbit at the first Lagrange point or L1, about one million miles from Earth toward the sun. It’s from that unique vantage point that the EPIC instrument is acquiring images of the entire sunlit face of Earth. Data from EPIC will be used to measure ozone and aerosol levels in Earth’s atmosphere, cloud height, vegetation properties and a variety of other features. Image Credit: NASA <b><a href="http://www.nasa.gov/audience/formedia/features/MP_Photo_Guidelines.html" rel="nofollow">NASA image use policy.</a></b> <b><a href="http://www.nasa.gov/centers/goddard/home/index.html" rel="nofollow">NASA Goddard Space Flight Center</a></b> enables NASA’s mission through four scientific endeavors: Earth Science, Heliophysics, Solar System Exploration, and Astrophysics. Goddard plays a leading role in NASA’s accomplishments by contributing compelling scientific knowledge to advance the Agency’s mission. <b>Follow us on <a href="http://twitter.com/NASAGoddardPix" rel="nofollow">Twitter</a></b> <b>Like us on <a href="http://www.facebook.com/pages/Greenbelt-MD/NASA-Goddard/395013845897?ref=tsd" rel="nofollow">Facebook</a></b> <b>Find us on <a href="http://instagrid.me/nasagoddard/?vm=grid" rel="nofollow">Instagram</a></b>
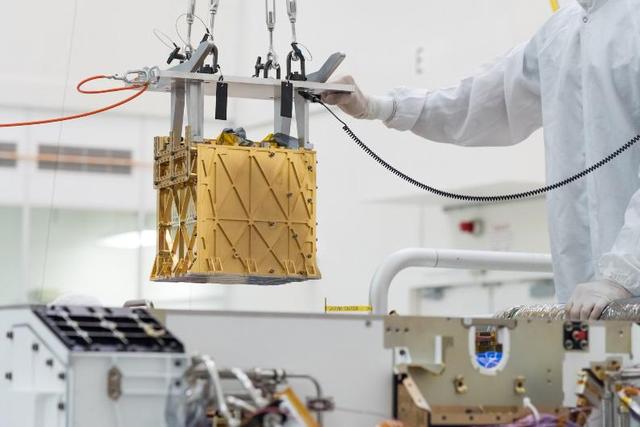
MOXIE (Mars Oxygen In-Situ Resource Utilization Experiment) was launched aboard NASA's Perseverance rover to test a technology for extracting oxygen from the Red Planet's carbon dioxide-rich atmosphere. Audio of MOXIE's air compressor at work on Mars was captured by the microphone on Perseverance's SuperCam instrument on May 27, 2021, the 96th day of the rover's mission. Since Perseverance landed on Mars in 2021, MOXIE generated a total of 122 grams of oxygen – about what a small dog breathes in 10 hours. At its most efficient, MOXIE was able to produce 12 grams of oxygen an hour – twice as much as NASA's original goals for the instrument – at 98% purity or better. On its final, 16th run, on Aug. 7, 2023, the instrument made 9.8 grams of oxygen. MOXIE successfully completed all of its technical requirements and was operated at a variety of conditions throughout a full Mars year, allowing the instrument's developers to learn a great deal about the technology. MOXIE produces molecular oxygen through an electrochemical process that separates one oxygen atom from each molecule of carbon dioxide pumped in from Mars' thin atmosphere. As these gases flow through the system, they're analyzed to check the purity and quantity of oxygen produced. While many of Perseverance's experiments are addressing primary science goals, MOXIE was focused on future human exploration. MOXIE served as the first-ever demonstration of technology that humans could use to survive on, and leave, the Red Planet. An oxygen-producing system could help future missions in various ways, but the most important of them would be as a source of rocket propellant, which would be required in industrial quantities to launch rockets with astronauts for their return trip home. Rather than bringing large quantities of oxygen with them to Mars, future astronauts could live off the land, using materials they find on the planet's surface to survive. This concept – called in-situ resource utilization, or ISRU – has evolved into a growing area of research. A key objective for Perseverance's mission on Mars is astrobiology, including the search for signs of ancient microbial life. The rover will characterize the planet's geology and past climate, pave the way for human exploration of the Red Planet, and be the first mission to collect and cache Martian rock and regolith (broken rock and dust). Subsequent NASA missions, in cooperation with ESA (European Space Agency), would send spacecraft to Mars to collect these sealed samples from the surface and return them to Earth for in-depth analysis. The Mars 2020 Perseverance mission is part of NASA's Moon to Mars exploration approach, which includes Artemis missions to the Moon that will help prepare for human exploration of the Red Planet. Audio file available at https://photojournal.jpl.nasa.gov/catalog/PIA26041
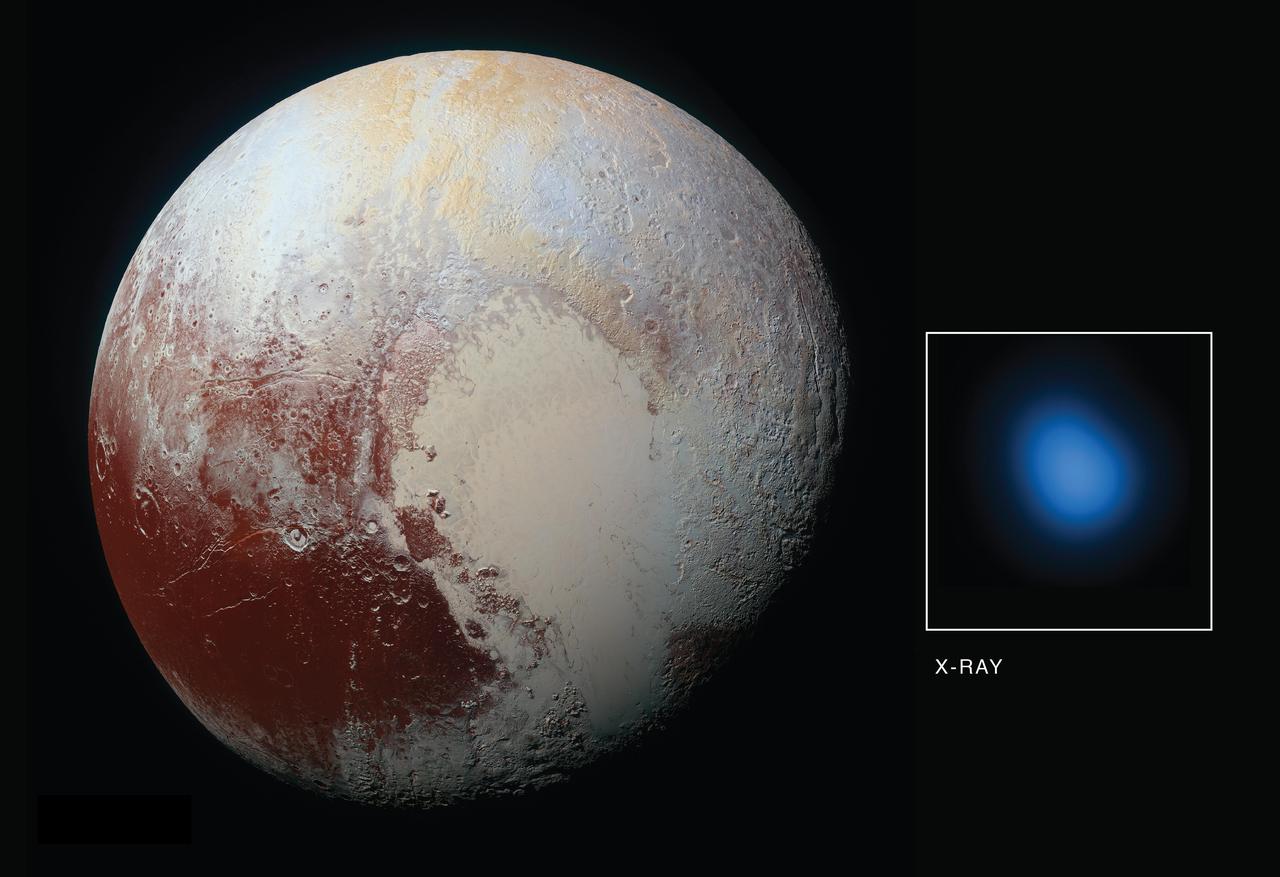
The first detection of Pluto in X-rays has been made using NASA's Chandra X-ray Observatory in conjunction with observations from NASA's New Horizons spacecraft. As New Horizons approached Pluto in late 2014 and then flew by the planet during the summer of 2015, Chandra obtained data during four separate observations. During each observation, Chandra detected low-energy X-rays from the small planet. The main panel in this graphic is an optical image taken from New Horizons on its approach to Pluto, while the inset shows an image of Pluto in X-rays from Chandra. There is a significant difference in scale between the optical and X-ray images. New Horizons made a close flyby of Pluto but Chandra is located near the Earth, so the level of detail visible in the two images is very different. The Chandra image is 180,000 miles across at the distance of Pluto, but the planet is only 1,500 miles across. Pluto is detected in the X-ray image as a point source, showing the sharpest level of detail available for Chandra or any other X-ray observatory. This means that details over scales that are smaller than the X-ray source cannot be seen here. Detecting X-rays from Pluto is a somewhat surprising result given that Pluto - a cold, rocky world without a magnetic field - has no natural mechanism for emitting X-rays. However, scientists knew from previous observations of comets that the interaction between the gases surrounding such planetary bodies and the solar wind - the constant streams of charged particles from the sun that speed throughout the solar system -- can create X-rays. The researchers were particularly interested in learning more about the interaction between the gases in Pluto's atmosphere and the solar wind. The New Horizon spacecraft carries an instrument designed to measure that activity up-close -- Solar Wind Around Pluto (SWAP) -- and scientists examined that data and proposed that Pluto contains a very mild, close-in bowshock, where the solar wind first "meets" Pluto (similar to a shock wave that forms ahead of a supersonic aircraft) and a small wake or tail behind the planet. The immediate mystery is that Chandra's readings on the brightness of the X-rays are much higher than expected from the solar wind interacting with Pluto's atmosphere. The Chandra detection is also surprising since New Horizons discovered Pluto's atmosphere was much more stable than the rapidly escaping, "comet-like" atmosphere that many scientists expected before the spacecraft flew past in July 2015. In fact, New Horizons found that Pluto's interaction with the solar wind is much more like the interaction of the solar wind with Mars, than with a comet. While Pluto is releasing enough gas from its atmosphere to make the observed X-rays, there isn't enough solar wind flowing directly at Pluto at its great distance from the Sun to make them according to certain theoretical models. There are several suggested possibilities for the enhanced X-ray emission from Pluto. These include a much wider and longer tail of gases trailing Pluto than New Horizons detected using its SWAP instrument. Because Pluto is so small compared to the size of a Chandra point source, scientists may be unable to detect such a tail in X-rays. Other possibilities are that interplanetary magnetic fields are focusing more particles than expected from the solar wind into the region around Pluto, or the low density of the solar wind in the outer solar system at the distance of Pluto could allow for the formation of a doughnut, or torus, of neutral gas centered around Pluto's orbit. It will take deeper and higher resolution images of X-rays from Pluto's environment than we currently have from Chandra to distinguish between these possibilities. http://photojournal.jpl.nasa.gov/catalog/PIA21061
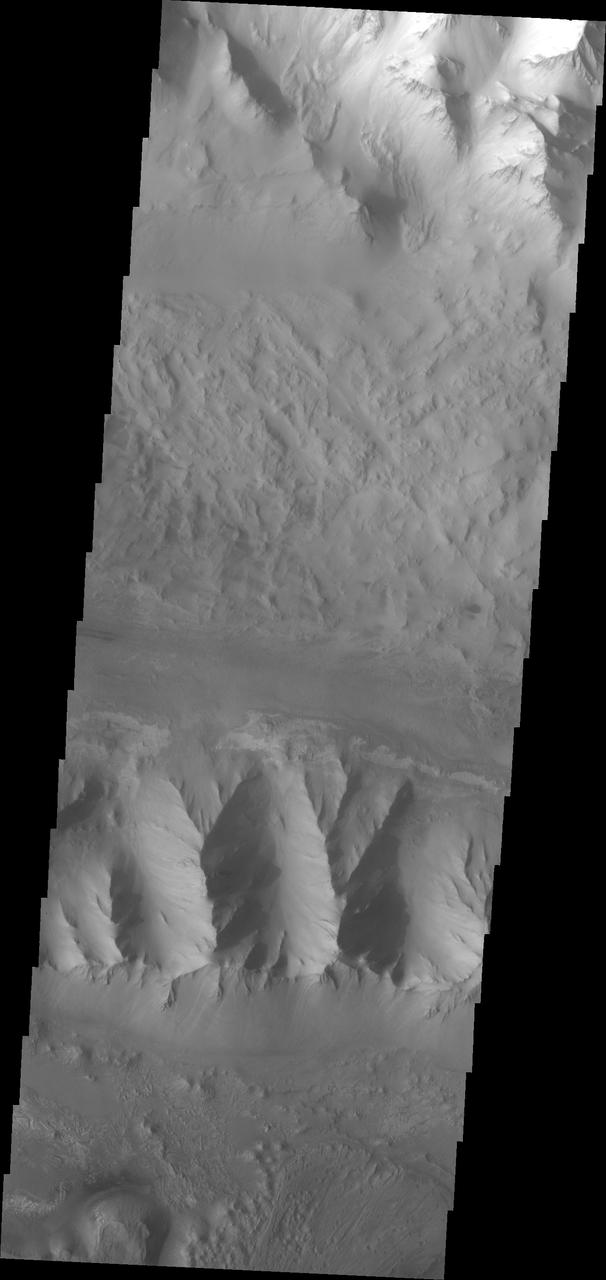
Moving into the central part of Ius Chasma, the canyon profile changes. What started as a large graben south of the main chasma wall, has widened to create a central high ridge separating the chasm into two parallel sections. This interior ridge is called Geryon Montes. The northern canyon wall is at the top of the image, including several tongue shaped landslide deposits. The floor has been covered in deposits that may include landslide material and later materials such as air fall particles like dust and water lain layered deposits. The Geryon Montes are in the lower 1/3 of the image. Just to the top of the Montes are materials with different "colors". These are part of the layered materials inside the canyon. At the very bottom of the image a highly eroded landslide deposit exists. The materials on this side of Geryon Montes are at a higher elevation than the floor on the opposite side. The unusual texture of the canyon floor also points to layered materials that may have been laid down in standing water. A landslide is a failure of slope due to gravity. They initiate due to several reasons. A lower layer of poorly cemented/resistant material may have been eroded, undermining the wall above which then collapses; earth quake seismic waves can cause the slope to collapse; and even an impact event near the canyon wall can cause collapse. As millions of tons of material fall and slide down slope a scalloped cavity forms at the upper part where the slope failure occurred. At the material speeds downhill it will pick up more of the underlying slope, increasing the volume of material entrained into the landslide. Whereas some landslides spread across the canyon floor forming lobate deposits, very large volume slope failures will completely fill the canyon floor in a large complex region of chaotic blocks. Ius Chasma is at the western end of Valles Marineris, south of Tithonium Chasma. Valles Marineris is over 4000 kilometers long, wider than the United States. Ius Chasma is almost 850 kilometers long (528 miles), 120 kilometers wide and over 8 kilometers deep. In comparison, the Grand Canyon in Arizona is about 175 kilometers long, 30 kilometers wide, and only 2 kilometers deep. The canyons of Valles Marineris were formed by extensive fracturing and pulling apart of the crust during the uplift of the vast Tharsis plateau. Landslides have enlarged the canyon walls and created deposits on the canyon floor. Weathering of the surface and influx of dust and sand have modified the canyon floor, both creating and modifying layered materials. There are many features that indicate flowing and standing water played a part in the chasma formation. The Odyssey spacecraft has spent over 15 years in orbit around Mars, circling the planet more than 71,000 times. It holds the record for longest working spacecraft at Mars. THEMIS, the IR/VIS camera system, has collected data for the entire mission and provides images covering all seasons and lighting conditions. Over the years many features of interest have received repeated imaging, building up a suite of images covering the entire feature. From the deepest chasma to the tallest volcano, individual dunes inside craters and dune fields that encircle the north pole, channels carved by water and lava, and a variety of other feature, THEMIS has imaged them all. For the next several months the image of the day will focus on the Tharsis volcanoes, the various chasmata of Valles Marineris, and the major dunes fields. We hope you enjoy these images! Orbit Number: 26151 Latitude: -7.12079 Longitude: 275.703 Instrument: VIS Captured: 2007-11-06 12:17 https://photojournal.jpl.nasa.gov/catalog/PIA22280