
This image shows a plastic 1/48-scale model of an F-18 aircraft inside the "Water Tunnel" more formally known as the NASA Dryden Flow Visualization Facility. Water is pumped through the tunnel in the direction of normal airflow over the aircraft; then, colored dyes are pumped through tubes with needle valves. The dyes flow back along the airframe and over the airfoils highlighting their aerodynamic characteristics. The aircraft can also be moved through its pitch axis to observe airflow disruptions while simulating actual flight at high angles of attack. The Water Tunnel at NASA's Dryden Flight Research Center, Edwards, CA, became operational in 1983 when Dryden was a Flight Research Facility under the management of the Ames Research Center in Mountain View, CA. As a medium for visualizing fluid flow, water has played a significant role. Its use dates back to Leonardo da Vinci (1452-1519), the Renaissance Italian engineer, architect, painter, and sculptor. In more recent times, water tunnels have assisted the study of complex flows and flow-field interactions on aircraft shapes that generate strong vortex flows. Flow visualization in water tunnels assists in determining the strength of vortices, their location, and possible methods of controlling them. The design of the Dryden Water Tunnel imitated that of the Northrop Corporation's tunnel in Hawthorne, CA. Called the Flow Visualization Facility, the Dryden tunnel was built to assist researchers in understanding the aerodynamics of aircraft configured in such a way that they create strong vortex flows, particularly at high angles of attack. The tunnel provides results that compare well with data from aircraft in actual flight in another fluid-air. Other uses of the tunnel have included study of how such flight hardware as antennas, probes, pylons, parachutes, and experimental fixtures affect airflow. The facility has also been helpful in finding the best locations for emitting smoke from flight vehicles for flow vi
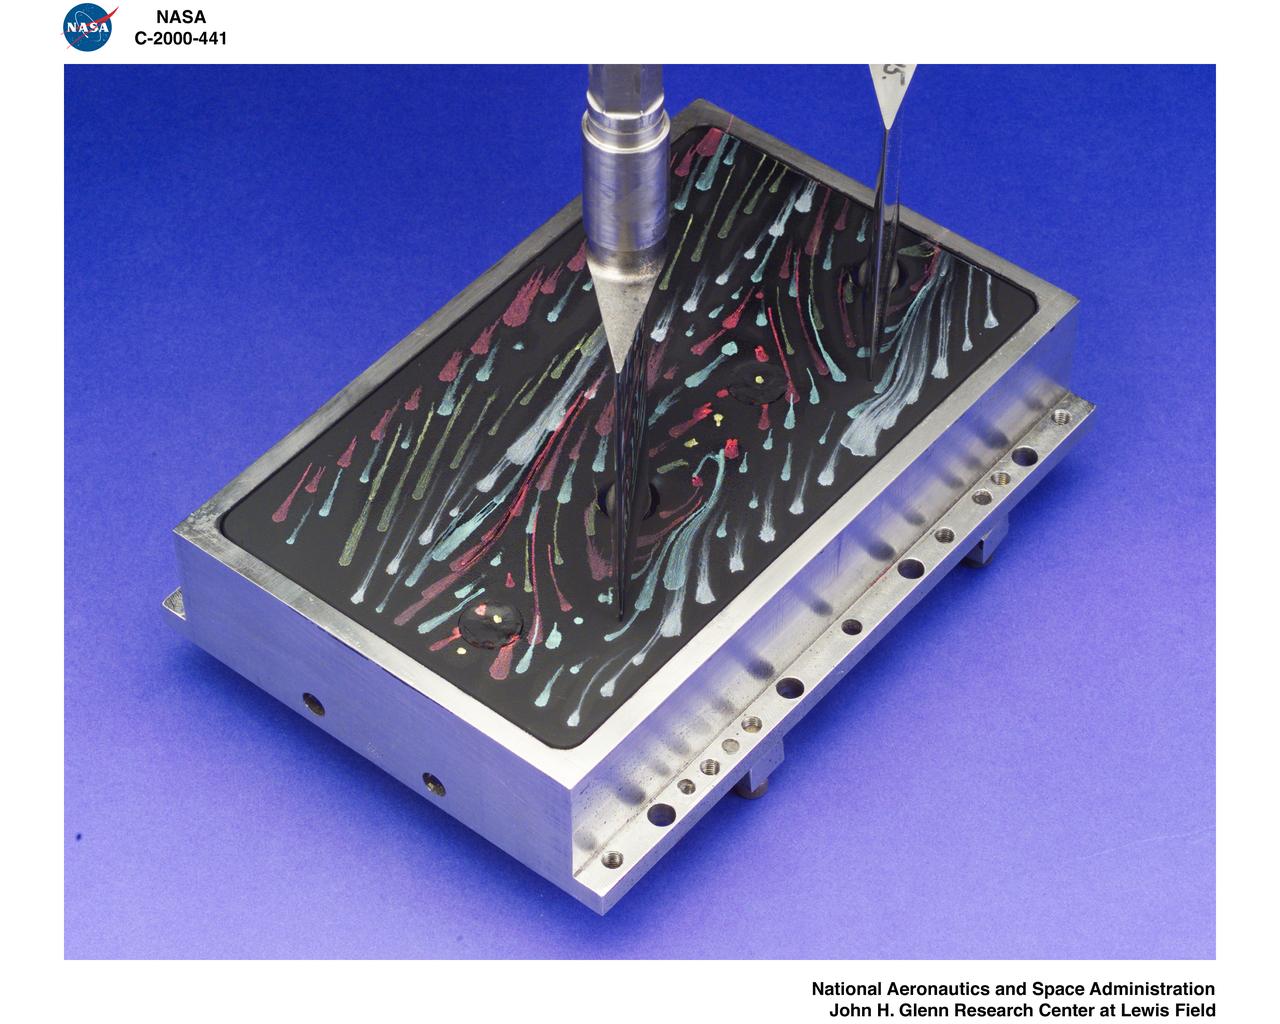
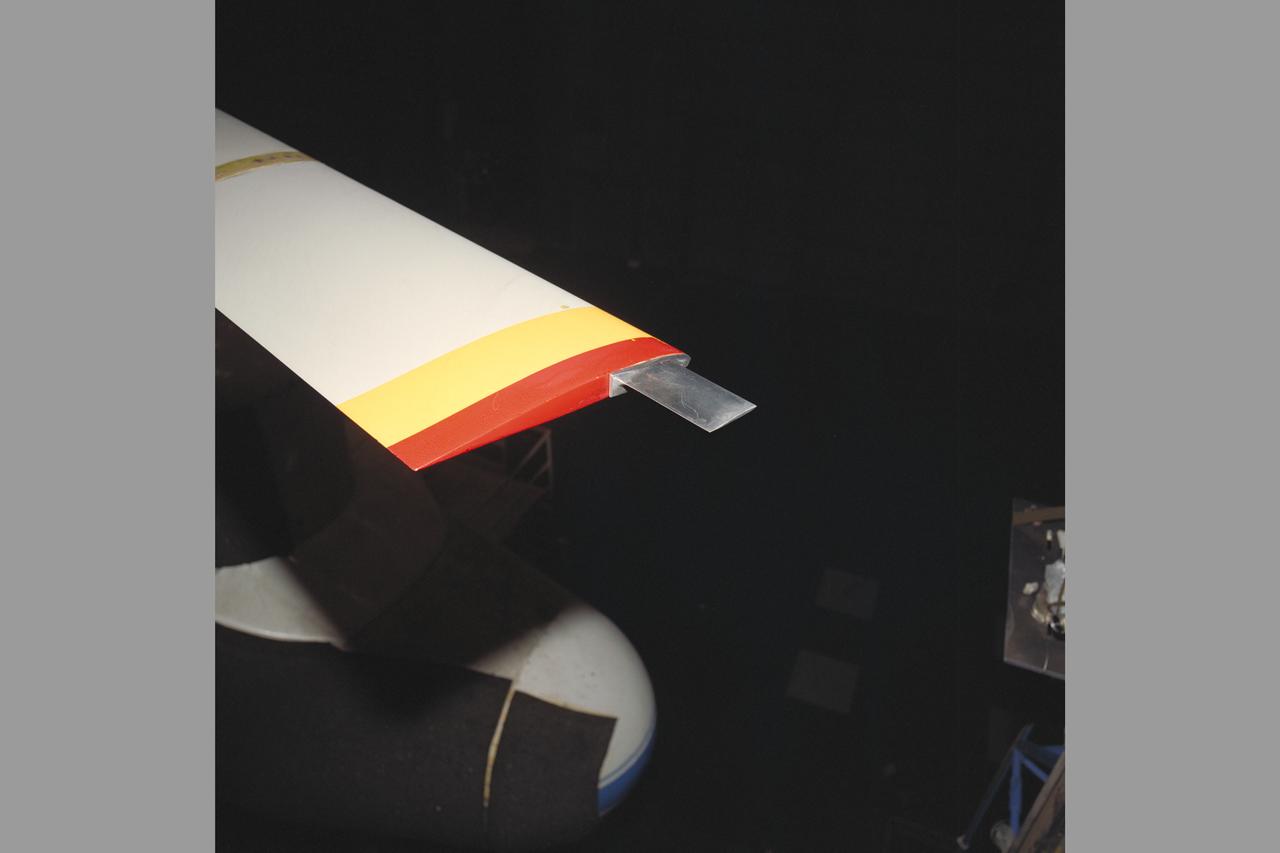
STALL FLUTTER TEST - FLOW VISUALIZATION
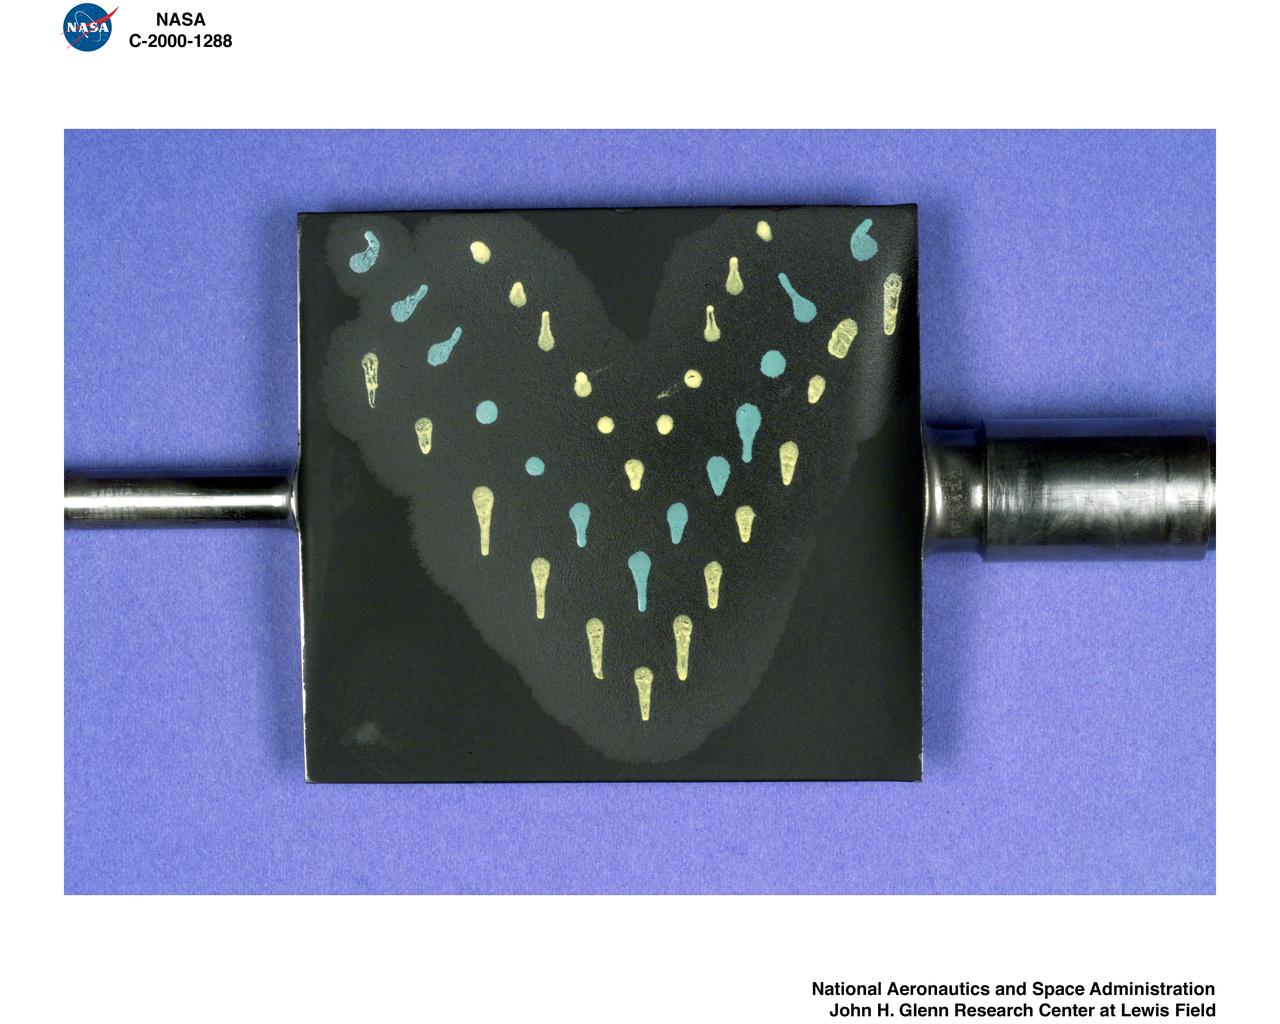
STALL FLUTTER TEST - FLOW VISUALIZATION
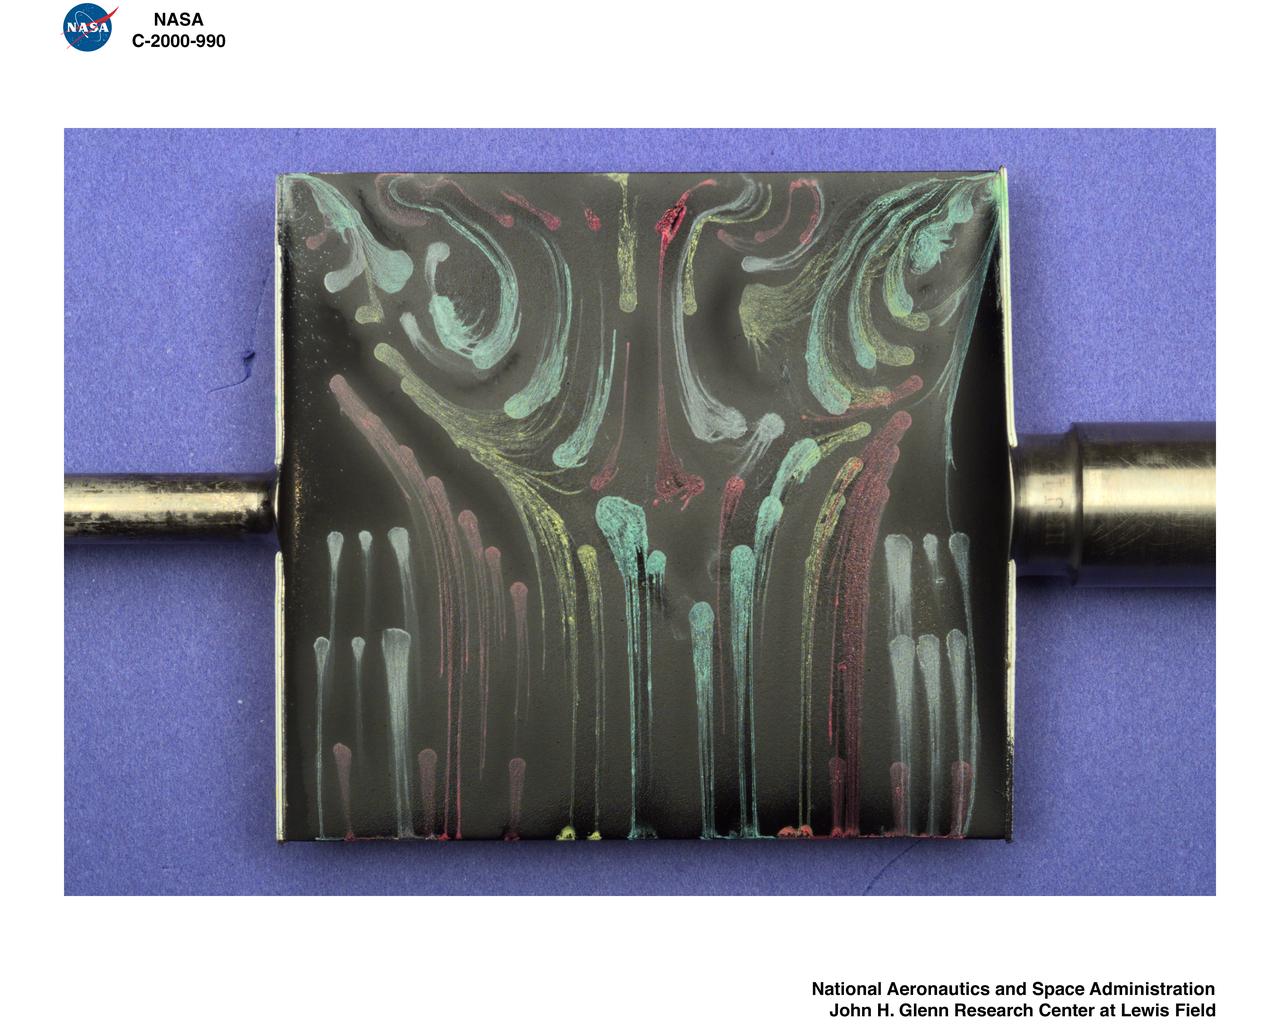
STALL FLUTTER TEST - FLOW VISUALIZATION
XV-15 Rotor Test Apparatus (RTA) flow visualization Hover test-80-0021 in 80x120ft w.t. (rotor tip)
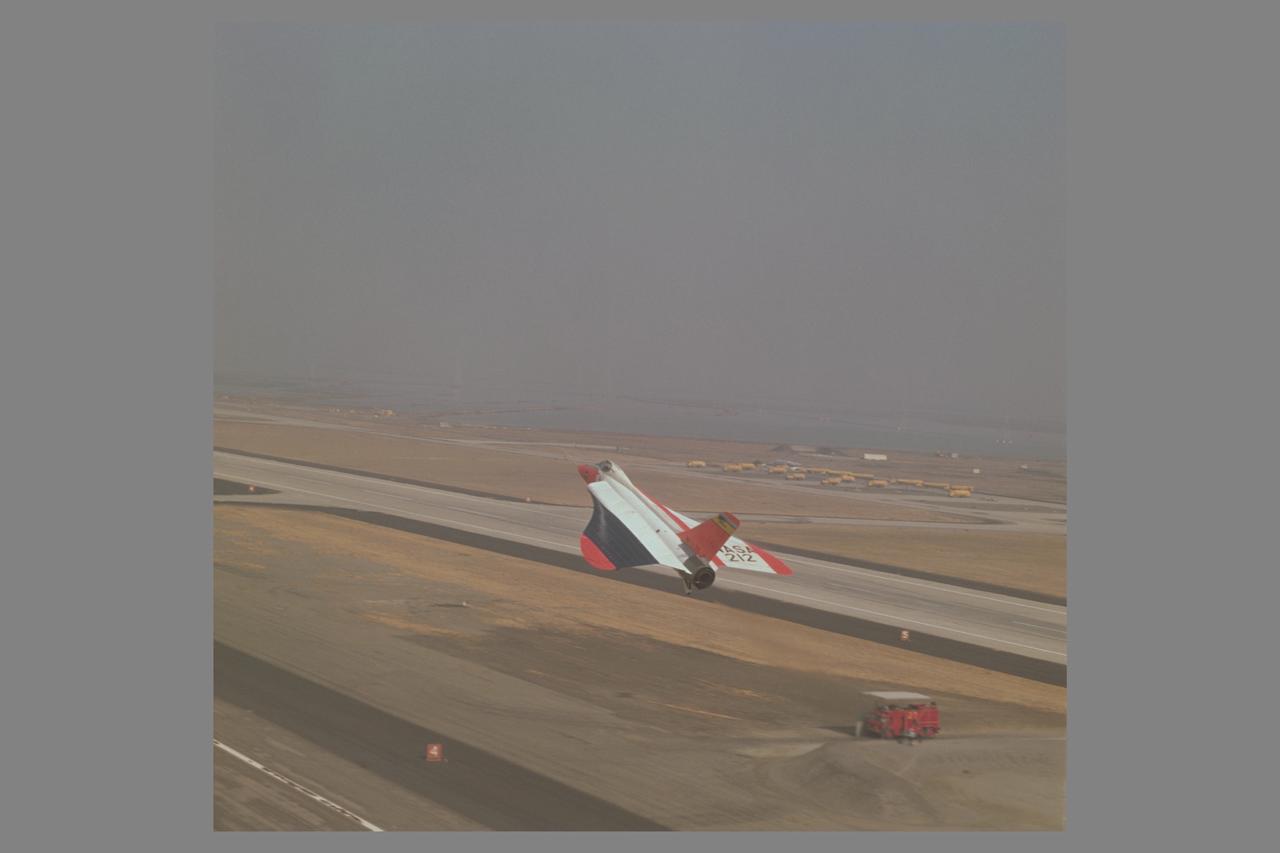
ON LANDING. OGEE Wing Plan Form on F5D-1 Airplane FLight Tests. 'Flow Visualization Photographs'.
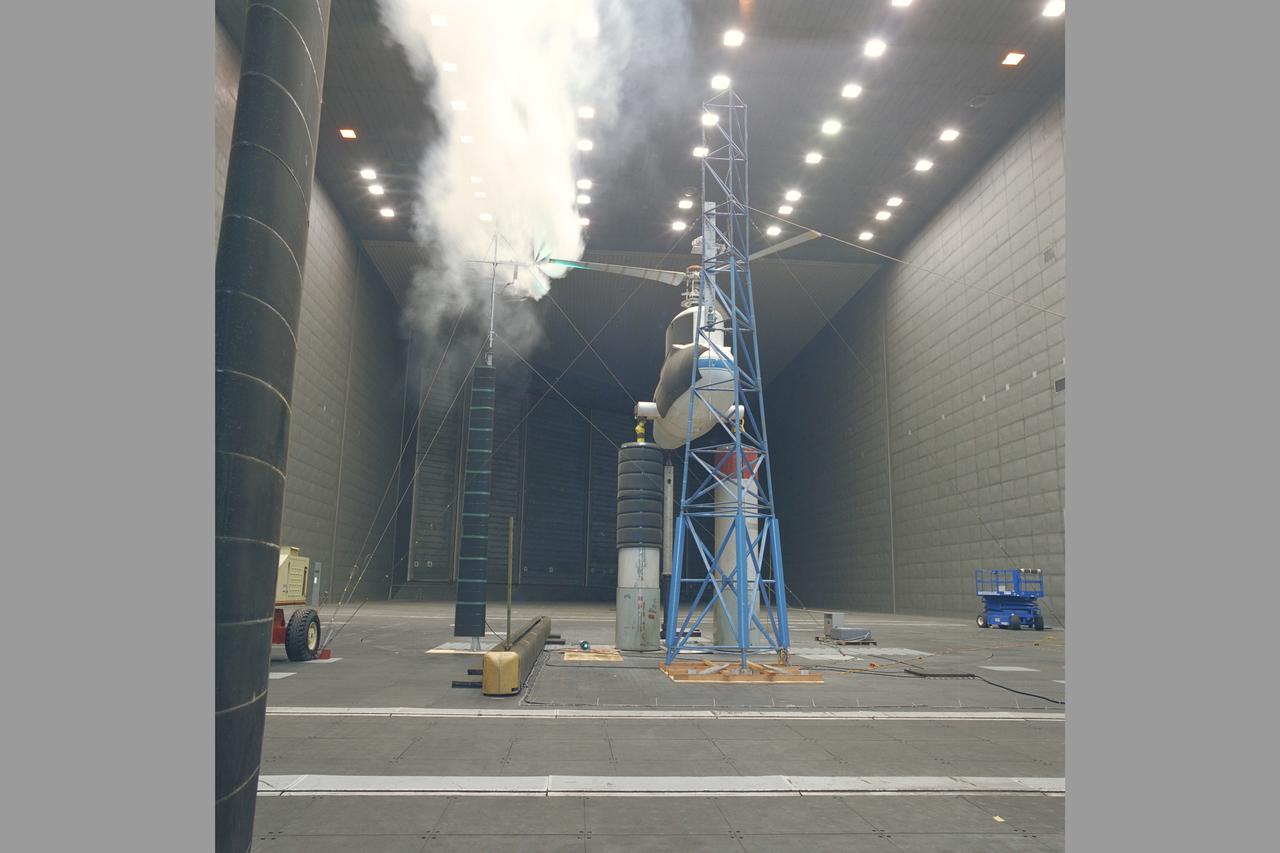
XV-15 Rotor Test Apparatus (RTA) flow visualization Hover test-80-0021 in 80x120ft w.t.

Brimmer All Body Hypersonic Aircraft Model 3.5ft W.T. Test-260 Flow Visualization
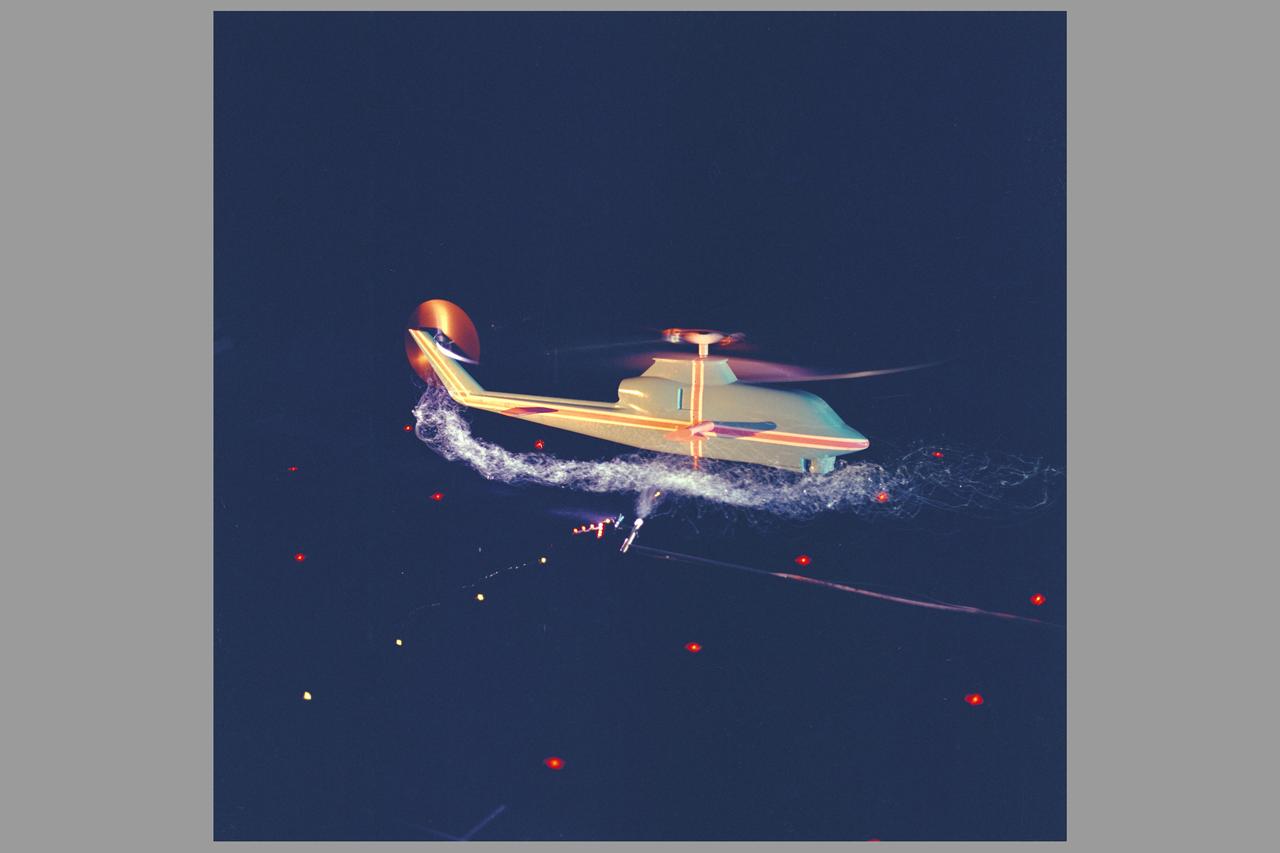
AH-1G Cobra helicopter model tail rotor flow visualization testing in 7X10ft#2 W.T. (Army tunnel - no test number)
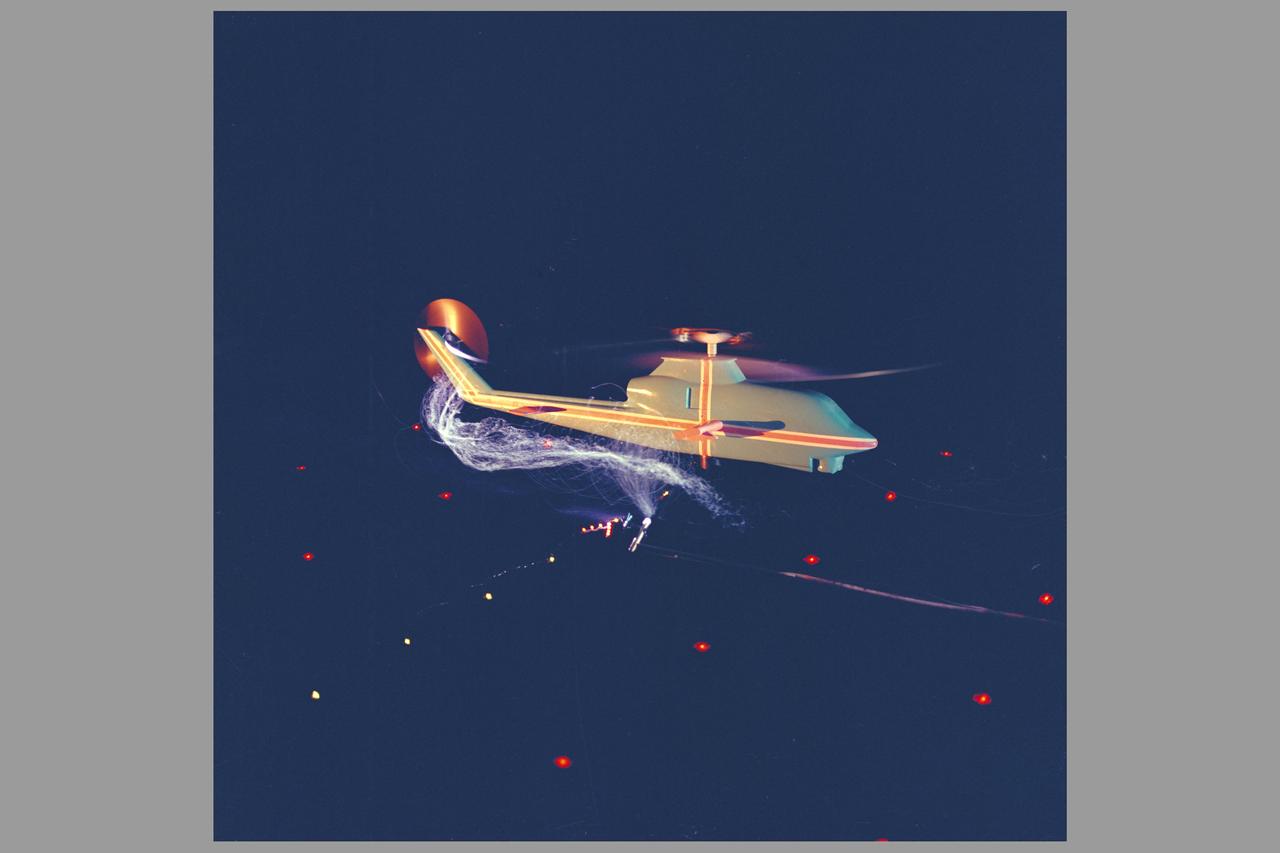
AH-1G Cobra helicopter model tail rotor flow visualization testing in 7X10ft#2 W.T. (Army tunnel - no test number)

DURING APPROACH. OGEE Wing Planform on modified F5D-1 SkylancerAirplane Flight Tests. 'Flow Visualization Photographs'. In landing approach trials at Moffett Field, vapor trails are generated by low pressure in votex flow near wing leading edge on upper wing surface. Studies were undertaken in efforts to determine if there were adverse effects of vortex flow on the dynamic stability of the aircraft.
ISS030-E-034228 (14 Jan. 2012) --- The Great Salt Lake in Utah serves as a striking visual marker for the Expedition 30 crew members orbiting over the western states aboard the International Space Station. A sharp line across the lake's center is caused by the restriction in water flow from the railroad causeway. The eye-catching colors of the lake stem from the fact that Great Salt Lake is hypersaline, typically 3-5 times saltier than the ocean.
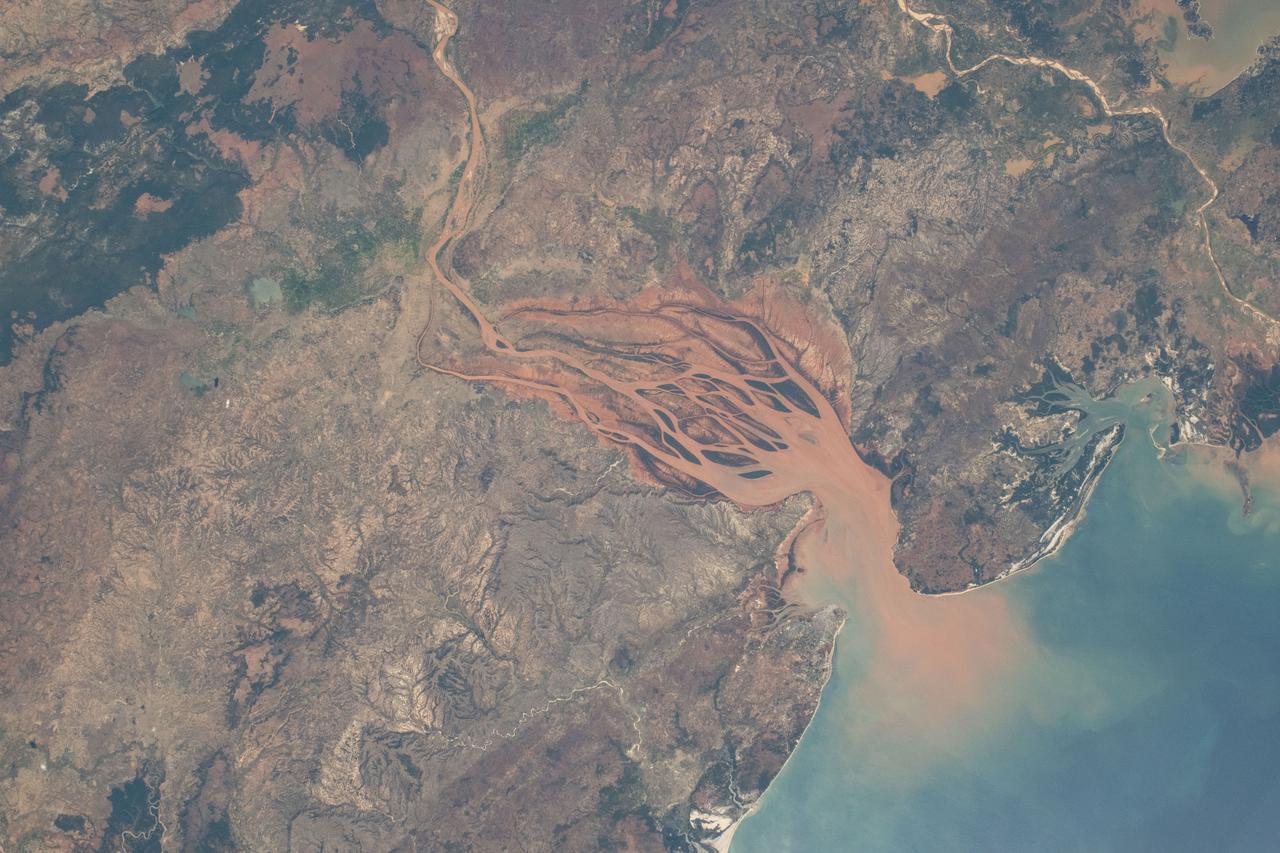
iss071e218069 (June 26, 2024) -- On Madagascar's northwestern coast, the Mozambique Channel flows inland to the Betsiboka River, forming Bombetoka Bay. The reddish-brown color is the result of iron-rich sediment transporting through, creating a striking visual marker for astronauts aboard the International Space Station. This photograph was taken as the orbiting laboratory soared 266 miles above Earth.
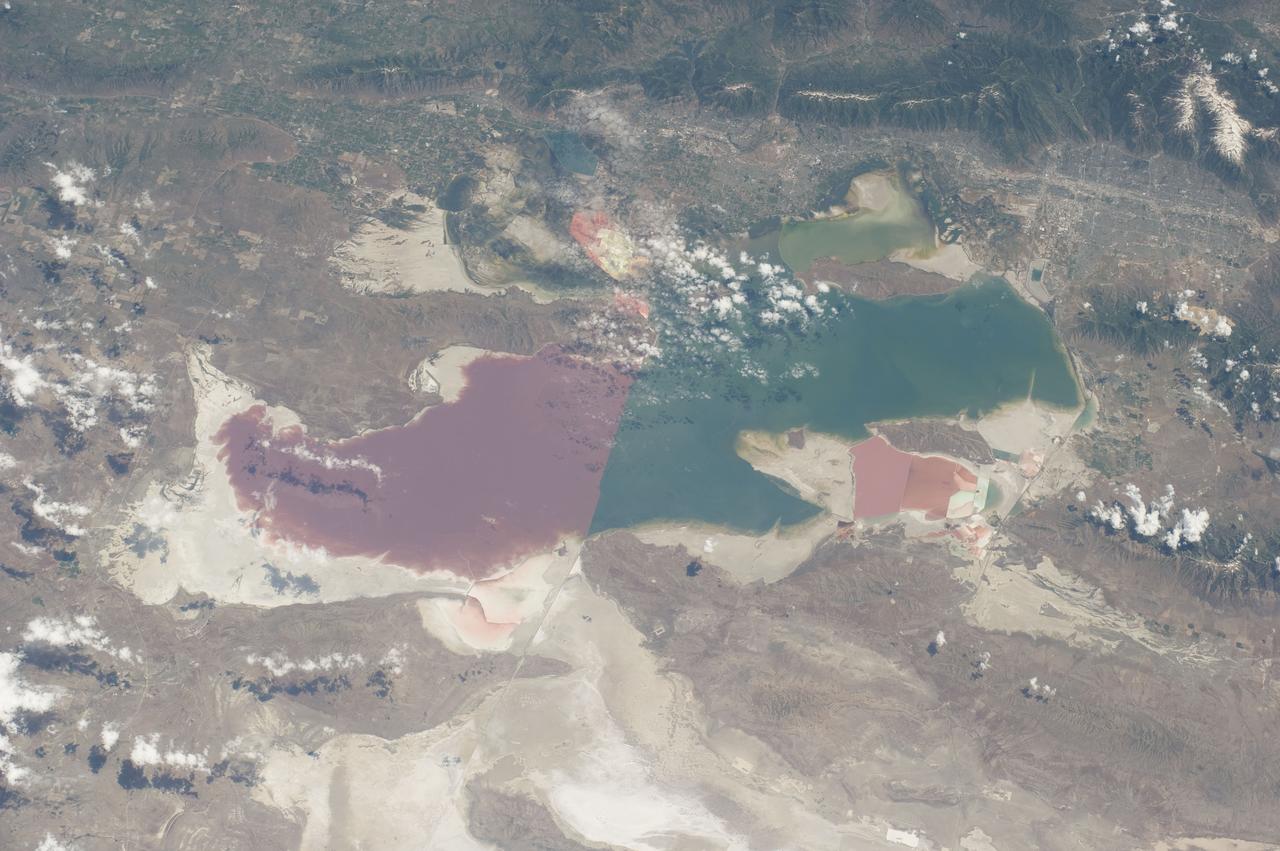
S135-E-006466 (9 July 2011) --- As in the case of many previous space missions, the Great Salt Lake in Utah serves as a striking visual marker for the STS-135 astronauts orbiting over North America in the space shuttle Atlantis. A sharp line across the lake's center is caused by the restriction in water flow from the railroad causeway. The eye-catching colors of the lake stem from the fact that Great Salt Lake is hypersaline, typically 3-5 times saltier than the ocean. Photo credit: NASA

NASA Photographer Carla Thomas holds the Airborne Schlieren Photography System (ASPS), aiming it out the window in flight. The ASPS uses a photographic method called schlieren imaging, capable of visualizing changes in air density and revealing shock waves and air flow patterns around moving objects. The system is one of several tools validated during recent dual F-15 flights at NASA’s Armstrong Flight Research Center in Edwards, California, in support of NASA’s Quesst mission, ahead of the X-59’s first flight.

Release Date: March 10, 2010 - Distant galaxy clusters mysteriously stream at a million miles per hour along a path roughly centered on the southern constellations Centaurus and Hydra. A new study led by Alexander Kashlinsky at NASA's Goddard Space Flight Center in Greenbelt, Md., tracks this collective motion -- dubbed the "dark flow" -- to twice the distance originally reported, out to more than 2.5 billion light-years. Abell 1689, redshift 0.181. Credit: NASA/Goddard Space Flight Center/Scientific Visualization Studio/ESA/L. Bradley/JHU To learn more go to: <a href="http://www.nasa.gov/centers/goddard/news/releases/2010/10-023.html" rel="nofollow">www.nasa.gov/centers/goddard/news/releases/2010/10-023.html</a> To see other visualizations related to this story go to: <a href="http://svs.gsfc.nasa.gov/goto?10580" rel="nofollow">svs.gsfc.nasa.gov/goto?10580</a>
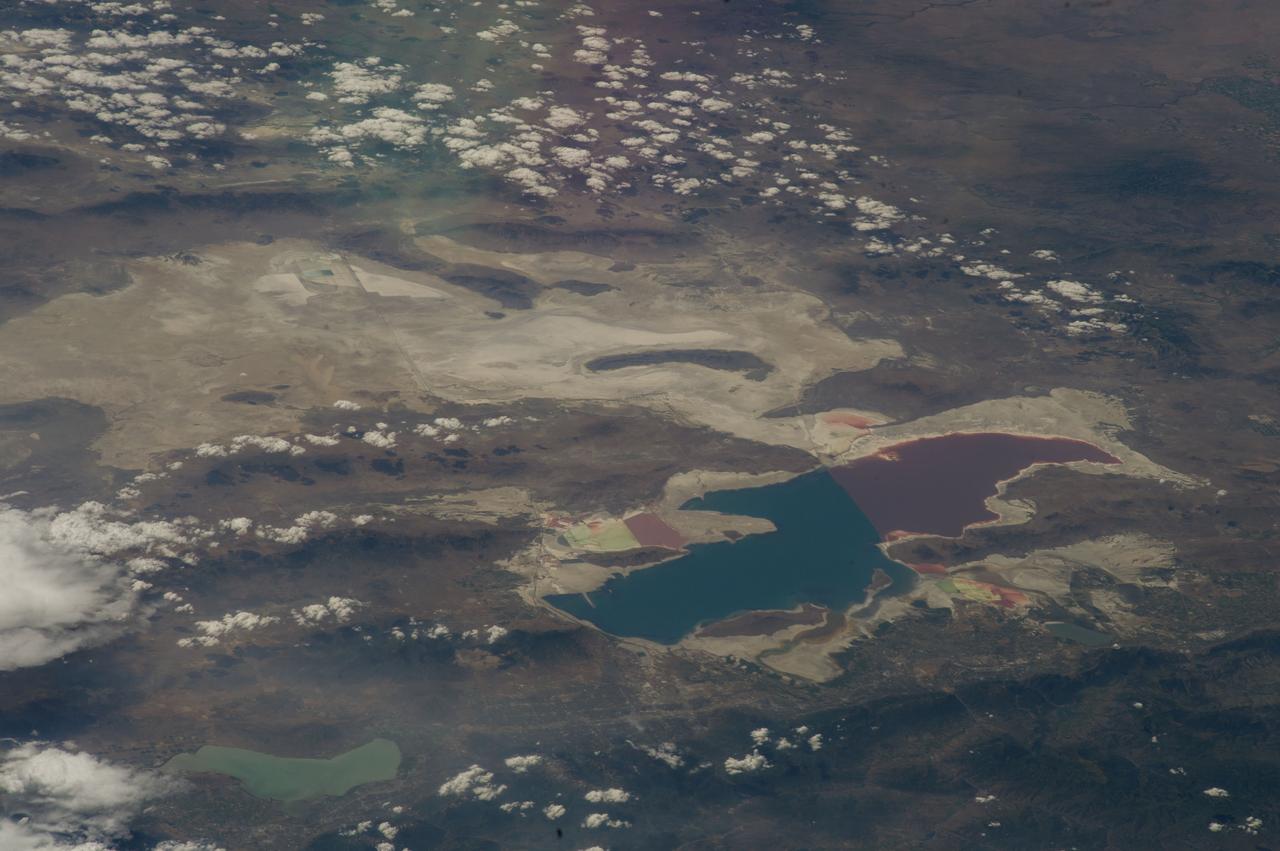
ISS040-E-043231 (6 July 2014) --- As in the case of many previous space missions, the Great Salt Lake in Utah serves as a striking visual marker for the Expedition 40 crew members orbiting 222 nautical miles over North America aboard the International Space Station. A 200mm focal length was used to capture the image. A sharp line across the lake's center is caused by the restriction in water flow from the railroad causeway. The eye-catching colors of the lake stem from the fact that Great Salt Lake is hypersaline, typically 3-5 times saltier than the ocean.
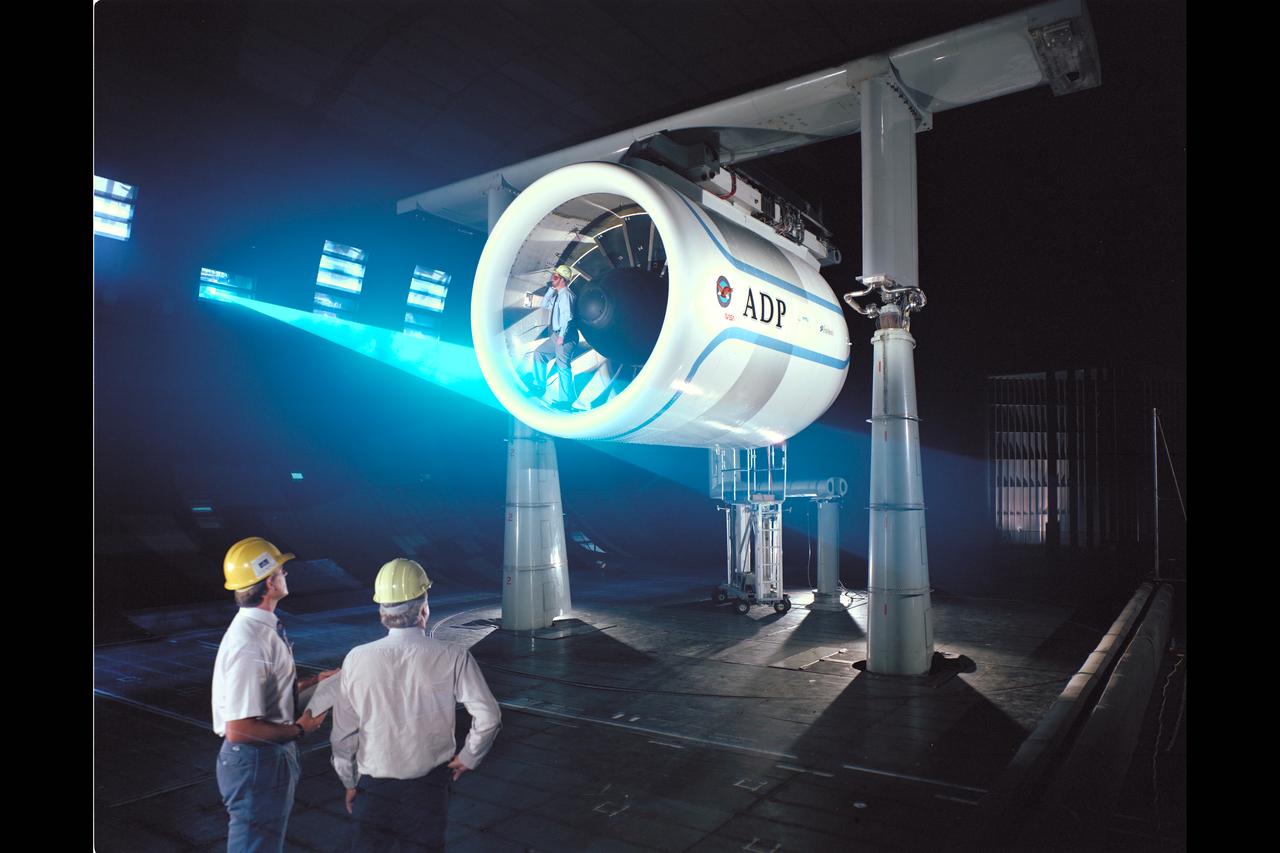
Pratt & Whitney Advanced Ducted Propulsor (ADP) Engine Test-590 in NASA Ames 40x80ft Subsonic Wind Tunnel. The Pratt & Whitney advanced ducted prop (ADP) demonstrator undergoing acoustic and fan performance testing. ADP technology could lead to decreased fuel consumption and noise. Shown here are NASA Ames engineers Peter Zell (left) and Dr Clifton Horne (right) preparing for a laser light sheet for a flow visualization test. Shown standing in the nacelle of the ADP is John Girvin, senior test engineer for Pratt & Whitney.
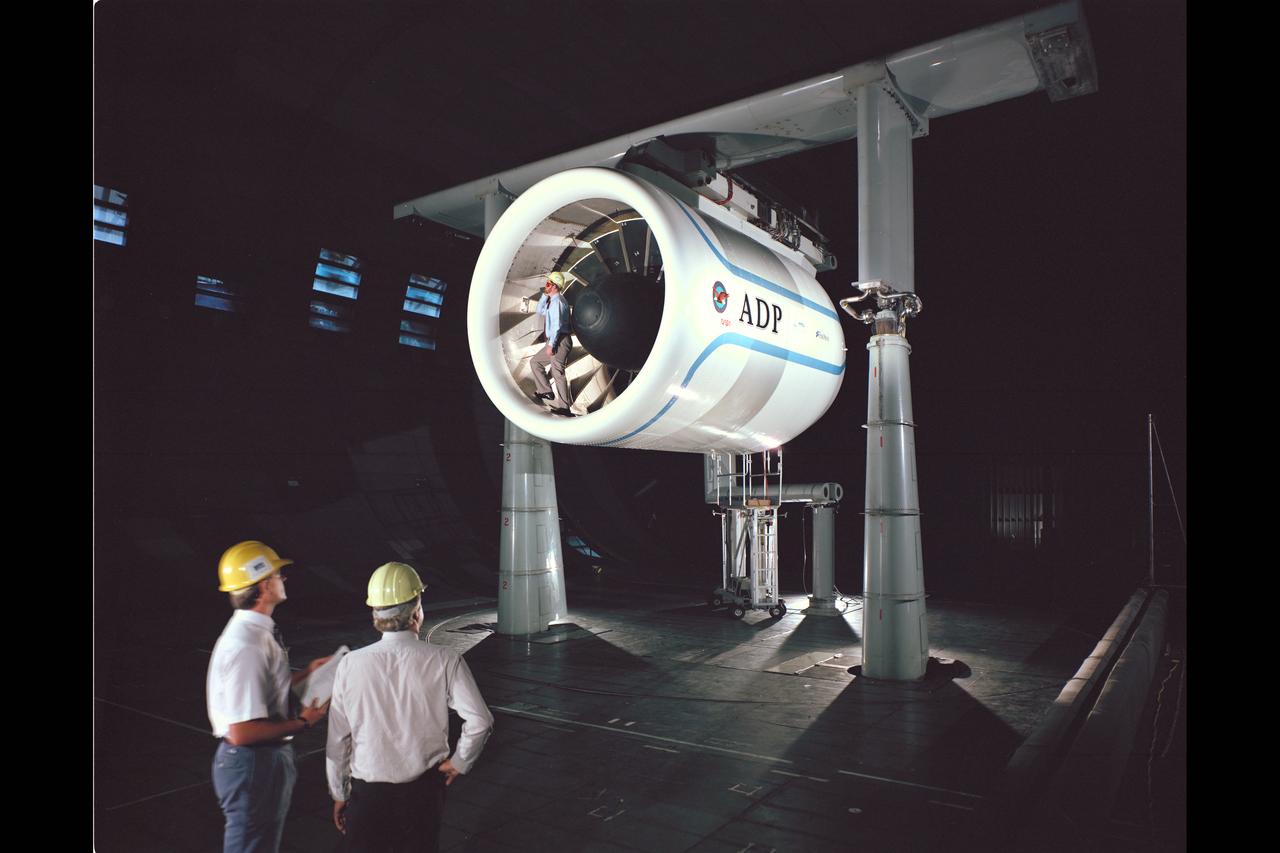
Pratt & Whitney Advanced Ducted Propulsor (ADP) Engine Test-590 in NASA Ames 40x80ft Subsonic Wind Tunnel. The Pratt & Whitney advanced ducted prop (ADP) demonstrator undergoing acoustic and fan performance testing. ADP technology could lead to decreased fuel consumption and noise. Shown here are NASA Ames engineers Peter Zell (left) and Dr Clifton Horne (right) preparing for a laser light sheet for a flow visualization test. Shown standing in the nacelle of the ADP is John Girvin, senior test engineer for Pratt & Whitney.
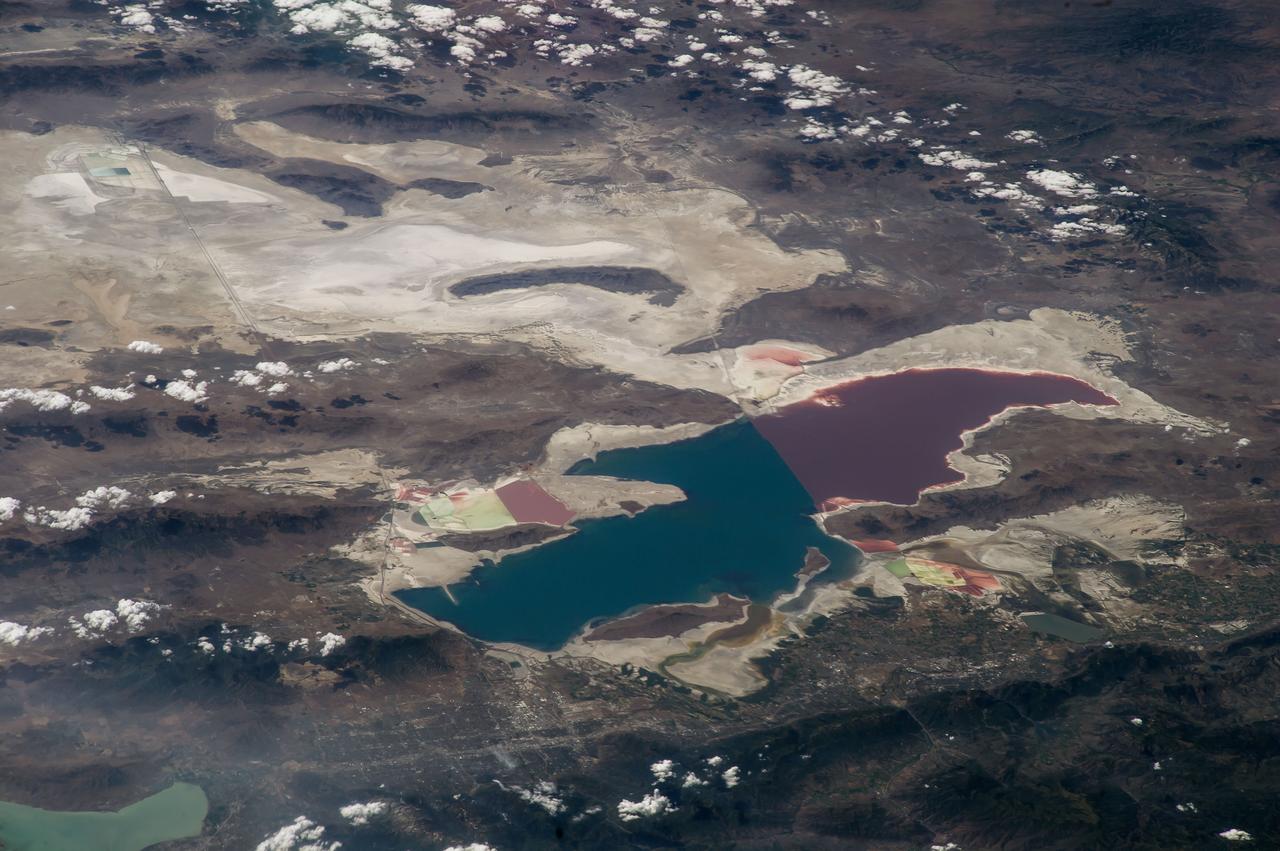
ISS040-E-043230 (6 July 2014) --- As in the case of many previous space missions, the Great Salt Lake in Utah serves as a striking visual marker for the Expedition 40 crew members orbiting 222 nautical miles over North America aboard the International Space Station. A 200mm focal length was used to capture the image. A sharp line across the lake's center is caused by the restriction in water flow from the railroad causeway. The eye-catching colors of the lake stem from the fact that Great Salt Lake is hypersaline, typically 3-5 times saltier than the ocean.
ISS038-S-001 (April 2013) --- As the International Space Station (ISS) has become a stepping stone to future space exploration, the Expedition 38 mission patch design paints a visual roadmap of exploration beyond low Earth orbit, most prominently represented by the design?s flowing Expedition 38 mission numbers that wrap around Earth, the moon and Mars. Just as the sun is a guiding light in the galaxy, the ISS illuminates the bottom of the design as it is a shining beacon of the advancement of science, knowledge, and technology carried out aboard the Space Station. To visually capture the idea of the ISS being a foundation for infinite discovery, the space station?s iconic solar arrays span upwards, providing the number 38 and its exploration roadmap a symbolic pedestal to rest on. Finally, the overall use of red, white, and blue in the design acknowledges the flags of the countries of origin for Expedition 38?s crew ? the United States, Russia, and Japan. The NASA insignia design for space shuttle flights is reserved for use by the astronauts and for other official use as the NASA Administrator may authorize. Public availability has been approved only in the forms of illustrations by the various news media. When and if there is any change in this policy, which is not anticipated, the change will be publicly announced. Photo credit: NASA
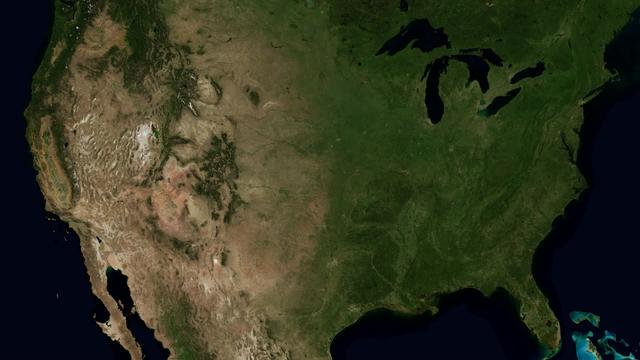
The Mississippi Watershed is the largest drainage basin in North America at 3.2 million square kilometers in area. The USGS has created a database of this area which indicates the direction of waterflow at each point. By assembling these directions into streamflows, it is possible to trace the path of water from every point of the area to the mouth of the Mississippi in the Gulf of Mexico. This animation starts with the points furthest from the Gulf and reveals the streams and rivers as a steady progression towards the mouth of the Mississippi until all the major rivers are revealed. The speed of the reveal of the rivers is not dependent on the actual speed of the water flow. The reveal proceeds at a constant velocity along each river path, timed so that all reveals reach the mouth of the Mississippi at the same time. This animation does not show actual flow rates of the rivers. All rivers are shown with identical rates. The river colors and widths correspond to the relative lengths of river segments. Credit: NASA's Scientific Visualization Studio/Horace Mitchell Go here to download this video: <a href="http://svs.gsfc.nasa.gov/4493" rel="nofollow">svs.gsfc.nasa.gov/4493</a>
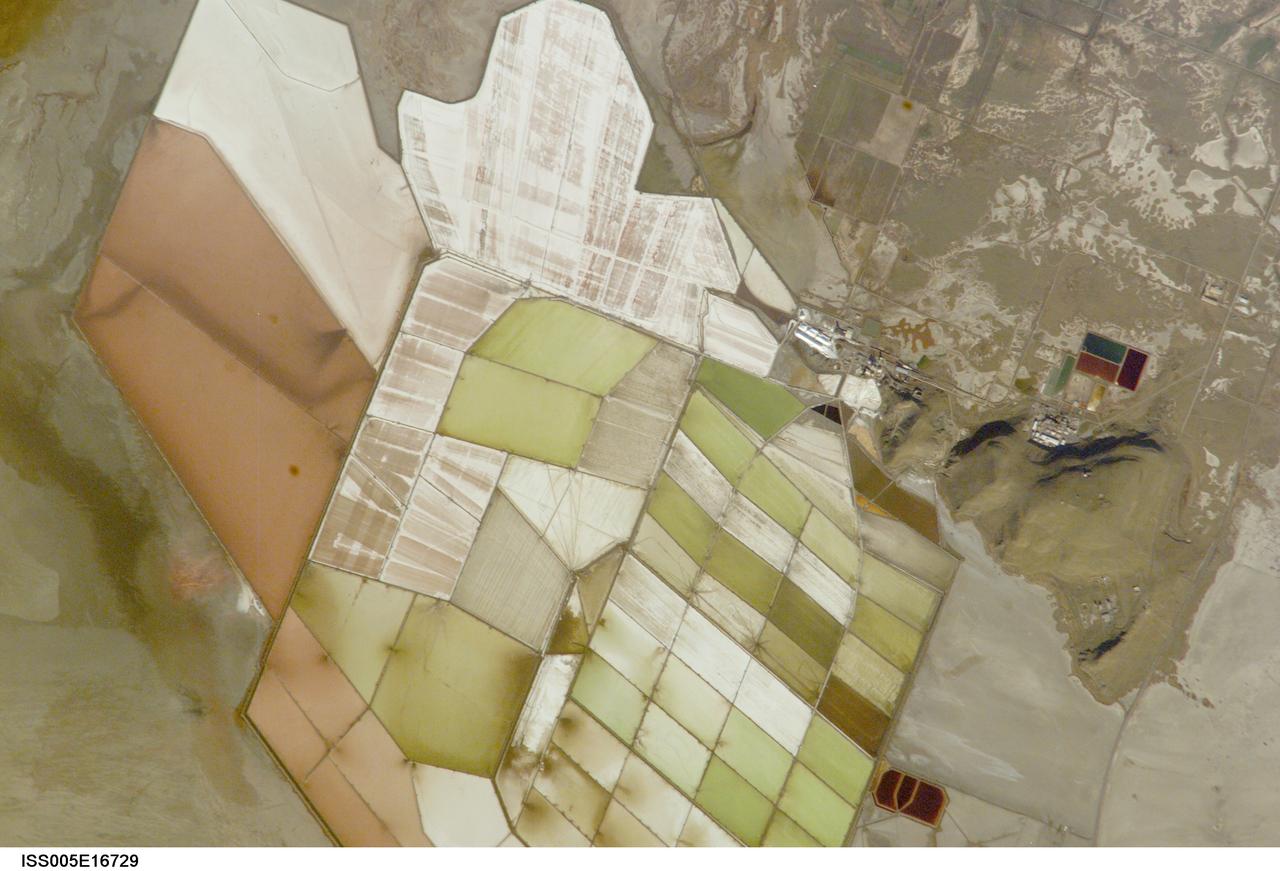
ISS005-E-16729 (7 October 2002) --- Great Salt Lake, Utah, is featured in this image photographed by an Expedition 5 crewmember on the International Space Station (ISS). Great Salt Lake serves as a striking visual marker for crewmembers orbiting over North America. A sharp line across its center is caused by the restriction in water flow from the railroad causeway. The eye-catching colors of the lake stem from the fact that Great Salt Lake is hyper saline, typically 3-5 times saltier than the ocean, and the high salinities support sets of plants and animals that affect the light-absorbing qualities of the water. North of the causeway salinities are higher, and the water turns red from the pigments of halophilic bacteria. In the shallower corner of the lake, earthen dikes mark large salt evaporation works, which take on the jewel tones of turquoise, russet, tamber and pearl white.
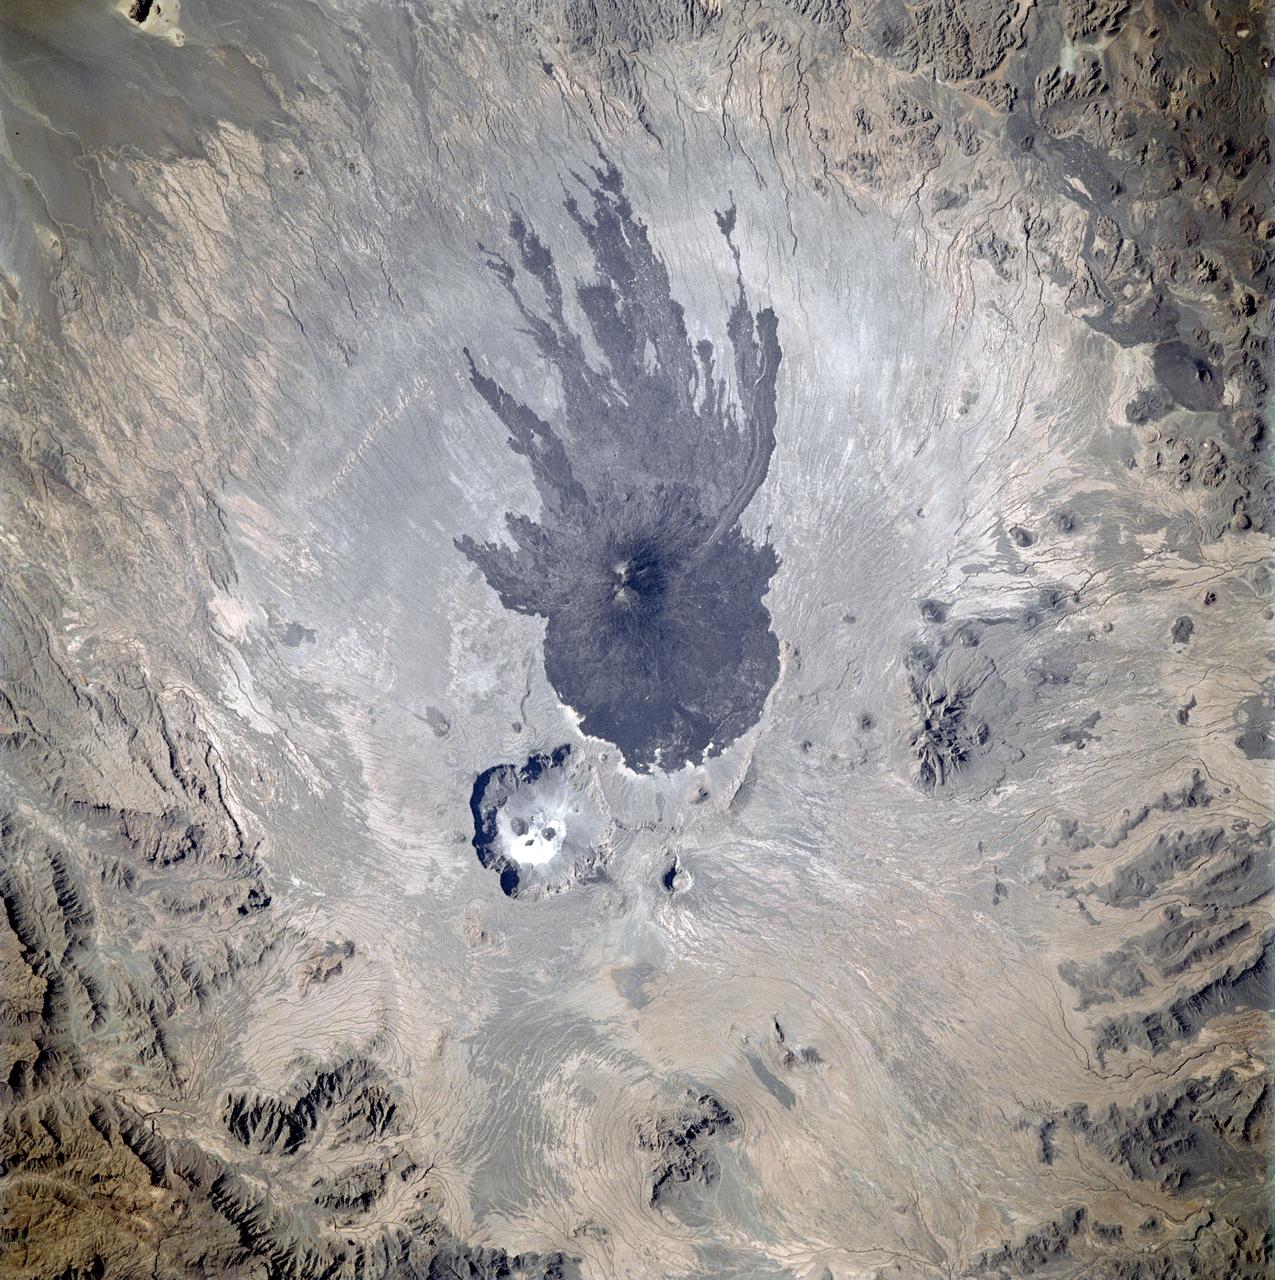
STS087-717-075 (19 November – 5 December 1997) --- Featured in this view is the Tibesti Massif in northern Chad in central Saharan Africa is a very large mountain range of old, dark, hard rocks, which is surrounded by sand seas. The mountains are capped with recent volcanoes and volcanic flows. The volcanoes of Tibesti are similar to those of Hawaii -- they are thought to be the result of a large hot spot deep in the Earth underneath northern Africa. The most striking volcano is the Pic Tousside (3,265 meters). The lava flows down the flanks of Pic Tousside make a characteristic and recognizable shape something like a giant squid -- thus providing astronauts a key visual marker as they fly across northern Africa. Because northern Africa receives very little rainfall, the volcano and crater shapes look very “young”. The occasional rainfall has created small gullies down the sides of the mountains, which can be seen when the sunlight is relatively low. Small amounts of water leach the soluble elements, like sodium, from the lavas. When the water collects in low places, like at the bottom of craters such as Trou au Natron (the crater adjacent to Pic Tousside) and subsequently evaporates, sodium-rich deposits are left behind. The white region at the bottom of the crater Trou au Natron is a sodium carbonate (natronite) deposit. This picture is one of the 70mm Earth observations visuals used by the crew at its post flight presentation events.
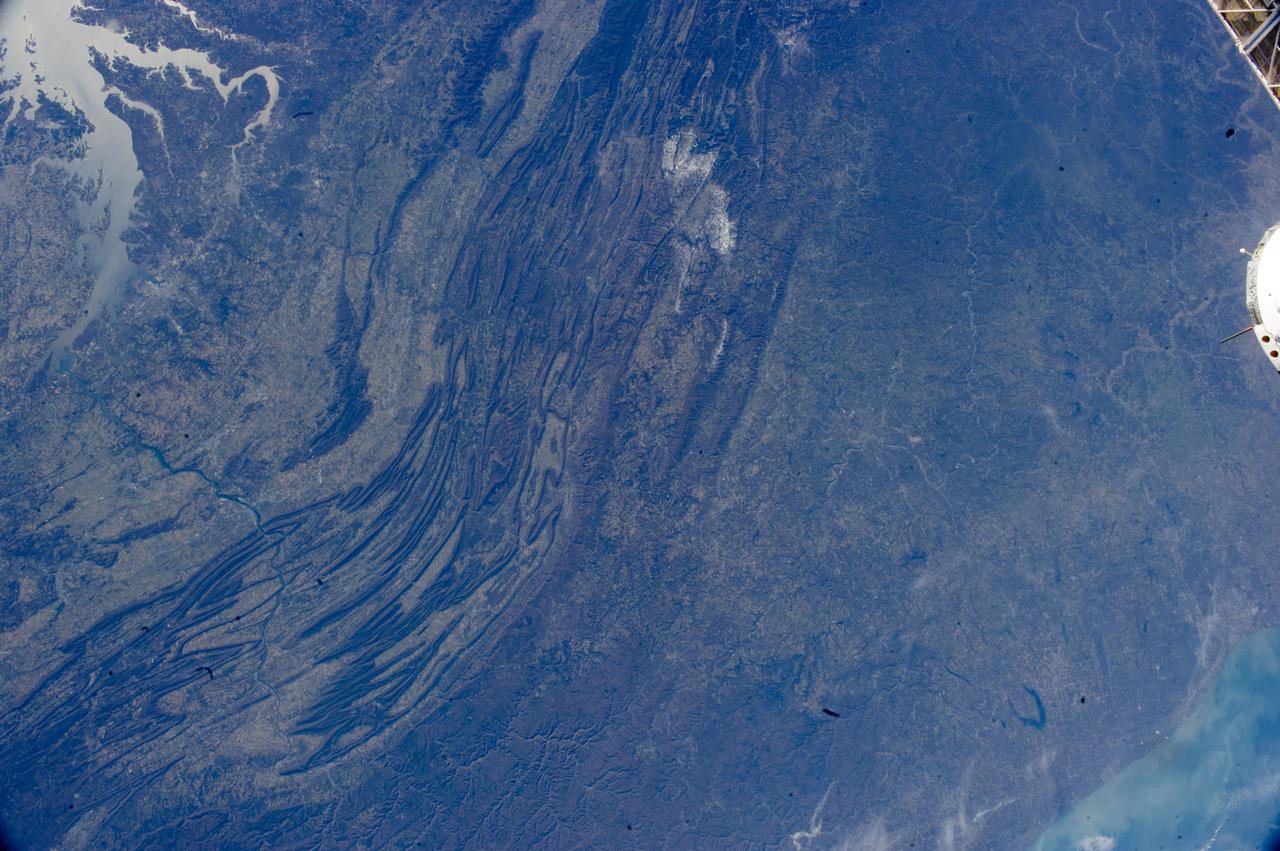
ISS033-E-022378 (17 Nov. 2012) --- The Appalachian Mountains in the eastern Unites States are featured in this image photographed by an Expedition 33 crew member on the International Space Station. This regional view shows the striking visual effect of the valley-and-ridge topography of the Appalachian Mountains as viewed from orbit. The view shows more than 300 miles (500 kilometers) of this low mountain chain, from northeast Pennsylvania (lower left) to southern West Virginia, where a dusting of snow can be seen (top center). Sunglint reflections reveal detail of Chesapeake Bay and the great bend of the Potomac River. Cities are difficult to detect from space during daylight hours, so the sickle-shaped bend of the river is a good visual guide for station crew members trying to photograph the nation?s capital, Washington D.C. (upper left). The farm-dominated Piedmont Plateau is the light-toned area between the mountains and the bay. The Appalachian Mountains appear striped because the ridges are forested; providing a dense and dark canopy cover, while the valleys are farmed with crops that generally appear as lighter-toned areas. Geologically the valleys are the softer, more erodible rock layers, much the preferred places for human settlement. Not only do the larger rivers occupy the valley floors, but all the larger rivers flow in them, soils are thicker, slopes are gentle, and valleys are better protected from winter winds. According to scientists, rocks that form the valley-and-ridge province, as it is known, are relatively old (540-300 million years old), and were laid down in horizontal layers when North America was attached to Europe as the ancient supercontinent of Laurasia. During this time Gondwanaland ? an ancient supercontinent that included present-day Africa, India, South America, Australia and Antarctica - was approaching Laurasia under the influence of plate tectonics. The northwest coastline of modern Africa was the section of Gondwanaland that ?bumped up? against modern North America over a long period (320 ? 260 million years ago), according to scientists. The net result of the tectonic collision was the building of a major mountain chain, much higher than the present Appalachian range?in the process of which the flat-lying rock layers were crumpled up into a series of tight folds, at right angles to the advance of Gondwanaland. The collision also formed the singular supercontinent of Pangaea. The scientists say that, over the following 200 million years, Pangaea broke apart; the modern Atlantic Ocean formed; and erosion wore down the high mountains. What is left to see are the coastline of North America, and the eroded stumps of the mountain chain as the relatively low, but visually striking present-day Appalachian Mountains.
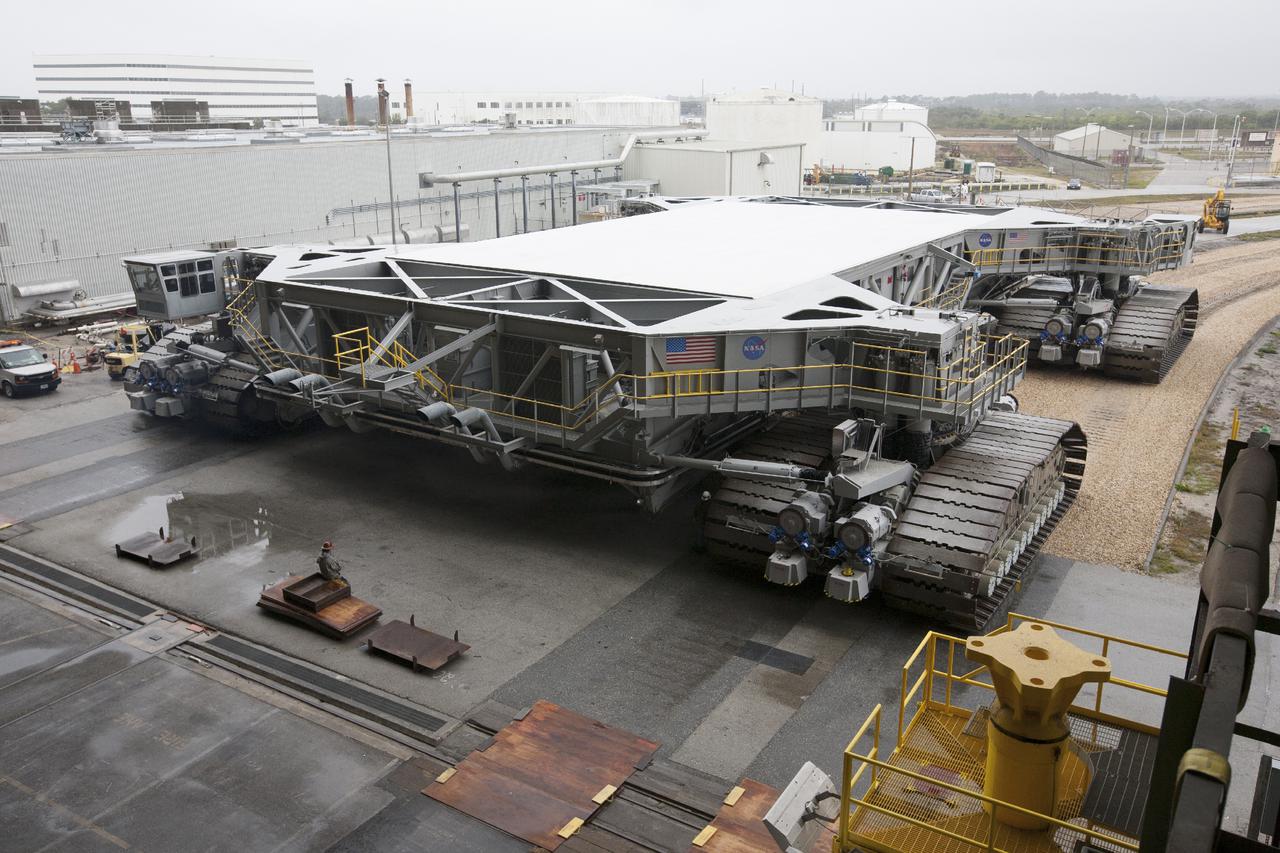
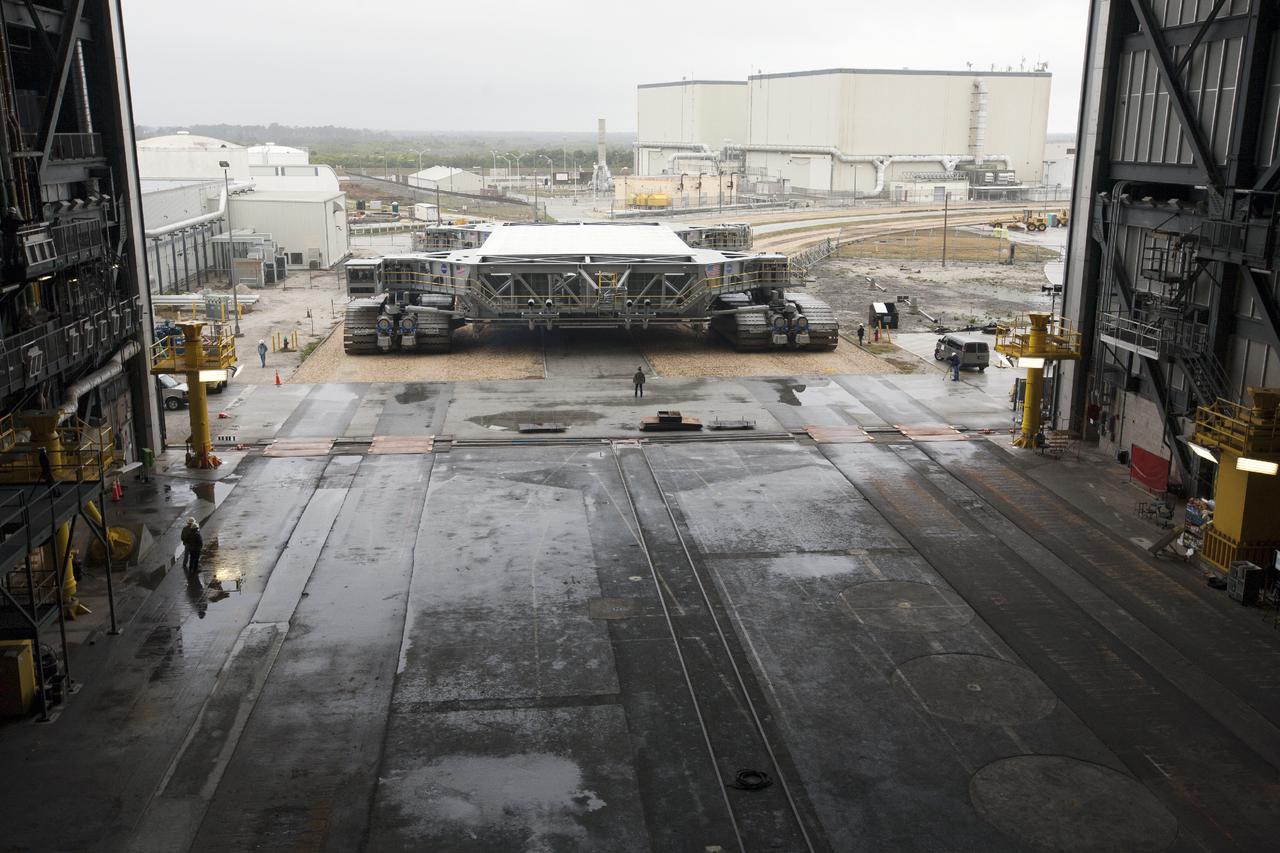
CAPE CANAVERAL, Fla. – Crawler-transporter 2, or CT-2, nears the entrance to the Vehicle Assembly Building at NASA’s Kennedy Space Center in Florida. The Ground Systems Development and Operations Program completed a roller bearing assembly test on CT-2 truck sections A and C. The left- and right-hand steering was tested in both directions. The temperature of the roller assemblies was monitored and recorded as it traveled along the crawlerway. Engineers and technicians performed visual inspections of the roller bearing pumps, valves and lines to ensure that the grease injectors worked properly and provided the required flow of grease to the new roller assemblies. Work continues in high bay 2 to upgrade CT-2. The modifications are designed to ensure CT-2’s ability to transport launch vehicles currently in development, such as the agency’s Space Launch System, to the launch pad. The Ground Systems Development and Operations Program office at Kennedy is overseeing the upgrades. For more than 45 years the crawler-transporters were used to transport the mobile launcher platform and the Apollo-Saturn V rockets and, later, space shuttles to Launch Pads 39A and B. For more information, visit: http:__www.nasa.gov_exploration_systems_ground_crawler-transporter. Photo credit: NASA_Kim Shiflett
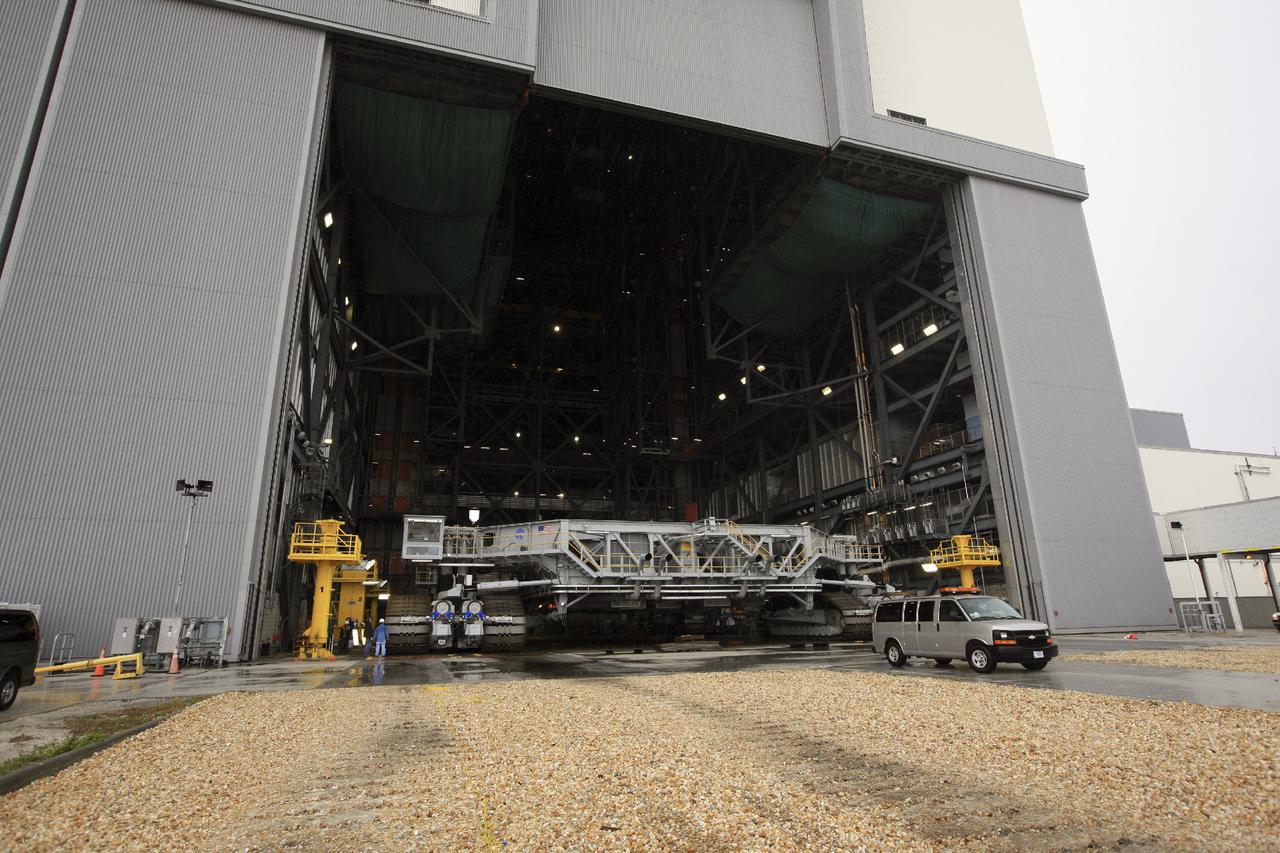
CAPE CANAVERAL, Fla. – Crawler-transporter 2, or CT-2, slowly enters the Vehicle Assembly Building at NASA’s Kennedy Space Center in Florida. The Ground Systems Development and Operations Program completed a roller bearing assembly test on CT-2 truck sections A and C. The left- and right-hand steering was tested in both directions. The temperature of the roller assemblies was monitored and recorded as it traveled along the crawlerway. Engineers and technicians performed visual inspections of the roller bearing pumps, valves and lines to ensure that the grease injectors worked properly and provided the required flow of grease to the new roller assemblies. Work continues in high bay 2 to upgrade CT-2. The modifications are designed to ensure CT-2’s ability to transport launch vehicles currently in development, such as the agency’s Space Launch System, to the launch pad. The Ground Systems Development and Operations Program office at Kennedy is overseeing the upgrades. For more than 45 years the crawler-transporters were used to transport the mobile launcher platform and the Apollo-Saturn V rockets and, later, space shuttles to Launch Pads 39A and B. For more information, visit: http:__www.nasa.gov_exploration_systems_ground_crawler-transporter. Photo credit: NASA_Kim Shiflett
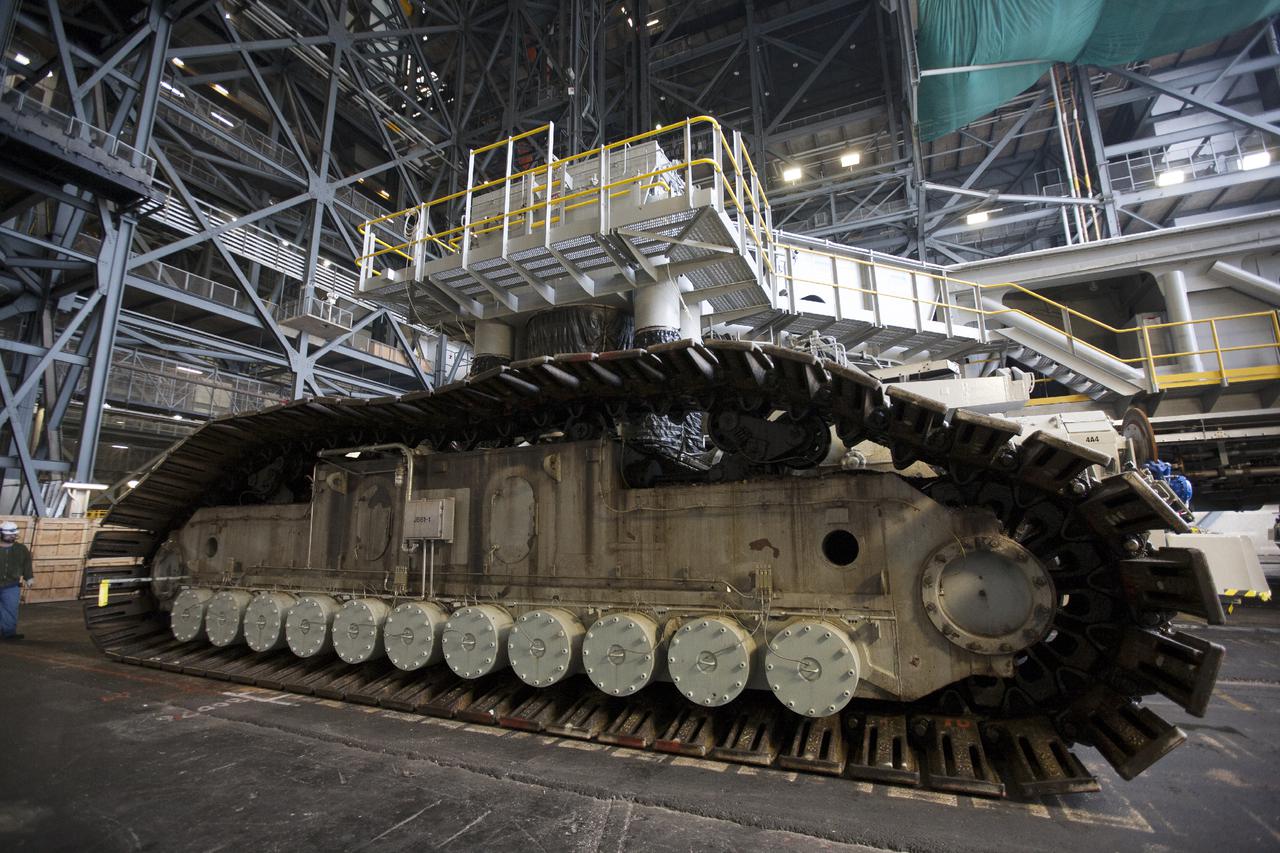
CAPE CANAVERAL, Fla. – Crawler-transporter 2, or CT-2, enters the Vehicle Assembly Building at NASA’s Kennedy Space Center in Florida. Visible are the new roller bearing assemblies that were installed on one side of the crawler. The Ground Systems Development and Operations Program completed a roller bearing assembly test on CT-2 truck sections A and C. The left- and right-hand steering was tested in both directions. The temperature of the roller assemblies was monitored and recorded as it traveled along the crawlerway. Engineers and technicians performed visual inspections of the roller bearing pumps, valves and lines to ensure that the grease injectors worked properly and provided the required flow of grease to the new roller assemblies. Work continues in high bay 2 to upgrade CT-2. The modifications are designed to ensure CT-2’s ability to transport launch vehicles currently in development, such as the agency’s Space Launch System, to the launch pad. The Ground Systems Development and Operations Program office at Kennedy is overseeing the upgrades. For more than 45 years the crawler-transporters were used to transport the mobile launcher platform and the Apollo-Saturn V rockets and, later, space shuttles to Launch Pads 39A and B. For more information, visit: http:__www.nasa.gov_exploration_systems_ground_crawler-transporter. Photo credit: NASA_Kim Shiflett
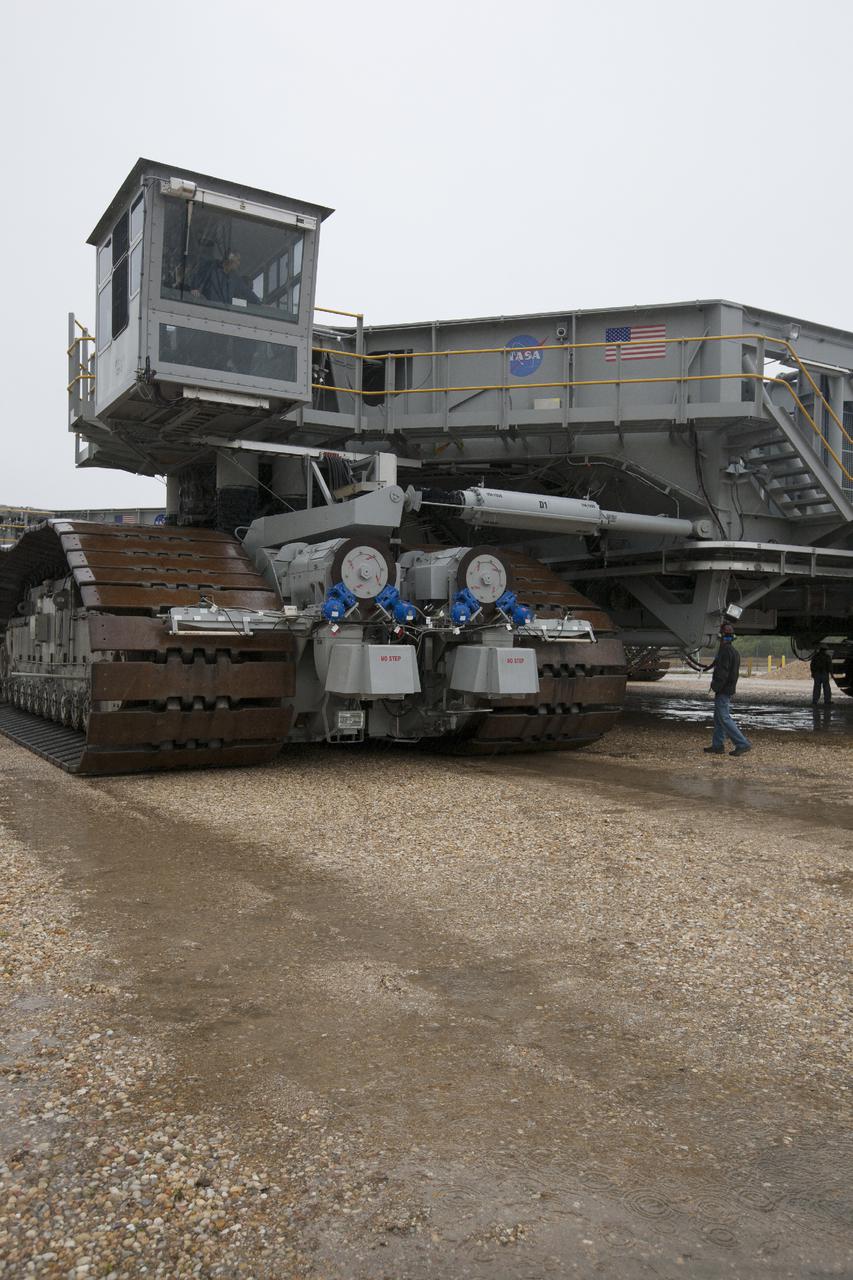
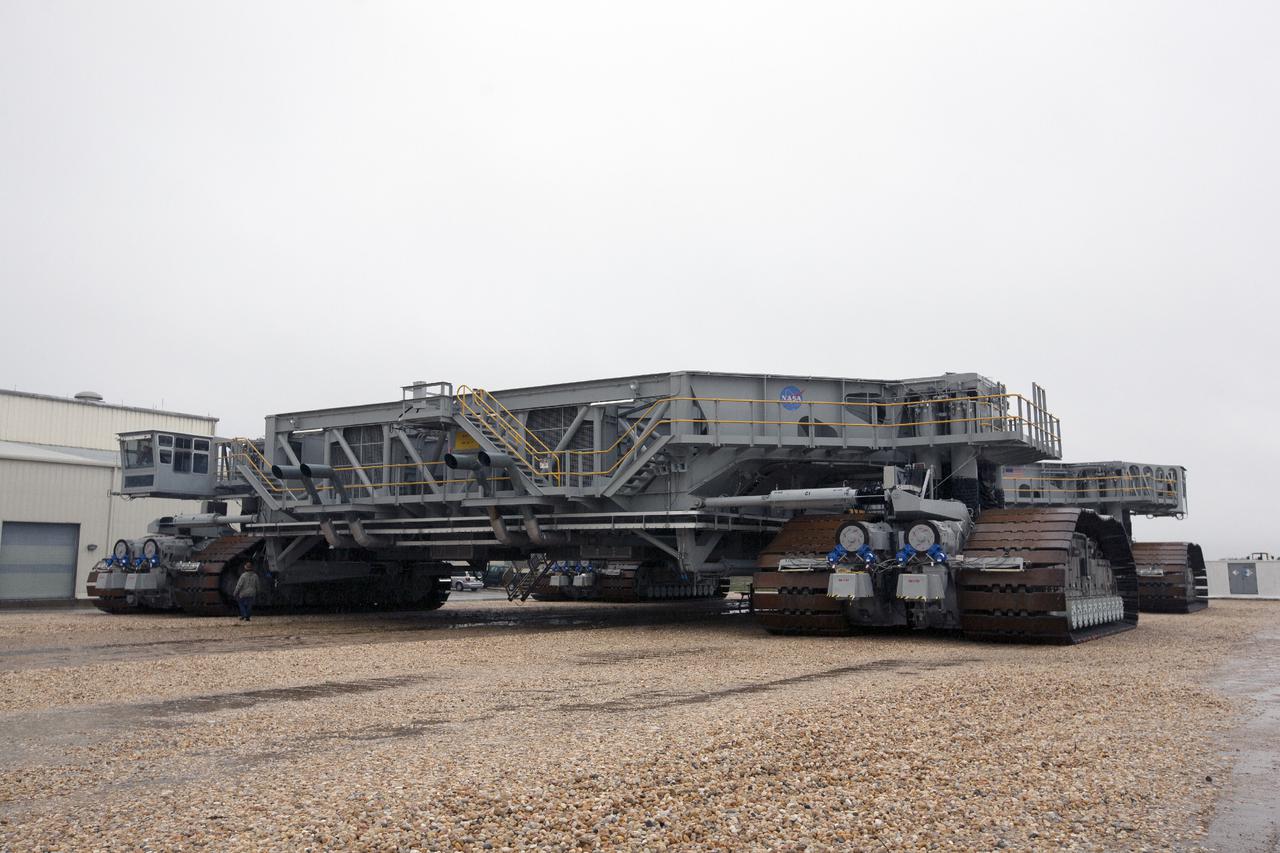
CAPE CANAVERAL, Fla. – A technician in the cab of crawler-transporter 2, or CT-2, drives along the crawlerway toward the Vehicle Assembly Building at NASA’s Kennedy Space Center in Florida. The Ground Systems Development and Operations Program completed a roller bearing assembly test on CT-2 truck sections A and C. The left- and right-hand steering was tested in both directions. The temperature of the roller assemblies was monitored and recorded. Engineers and technicians performed visual inspections of the roller bearing pumps, valves and lines to ensure that the grease injectors worked properly and provided the required flow of grease to the new roller assemblies. Work continues in high bay 2 to upgrade CT-2. The modifications are designed to ensure CT-2’s ability to transport launch vehicles currently in development, such as the agency’s Space Launch System, to the launch pad. The Ground Systems Development and Operations Program office at Kennedy is overseeing the upgrades. For more than 45 years the crawler-transporters were used to transport the mobile launcher platform and the Apollo-Saturn V rockets and, later, space shuttles to Launch Pads 39A and B. For more information, visit: http:__www.nasa.gov_exploration_systems_ground_crawler-transporter. Photo credit: NASA_Kim Shiflett
CAPE CANAVERAL, Fla. – Crawler-transporter 2, or CT-2, nears the entrance to the Vehicle Assembly Building at NASA’s Kennedy Space Center in Florida. The Ground Systems Development and Operations Program completed a roller bearing assembly test on CT-2 truck sections A and C. The left- and right-hand steering was tested in both directions. The temperature of the roller assemblies was monitored and recorded as it traveled along the crawlerway. Engineers and technicians performed visual inspections of the roller bearing pumps, valves and lines to ensure that the grease injectors worked properly and provided the required flow of grease to the new roller assemblies. Work continues in high bay 2 to upgrade CT-2. The modifications are designed to ensure CT-2’s ability to transport launch vehicles currently in development, such as the agency’s Space Launch System, to the launch pad. The Ground Systems Development and Operations Program office at Kennedy is overseeing the upgrades. For more than 45 years the crawler-transporters were used to transport the mobile launcher platform and the Apollo-Saturn V rockets and, later, space shuttles to Launch Pads 39A and B. For more information, visit: http:__www.nasa.gov_exploration_systems_ground_crawler-transporter. Photo credit: NASA_Kim Shiflett
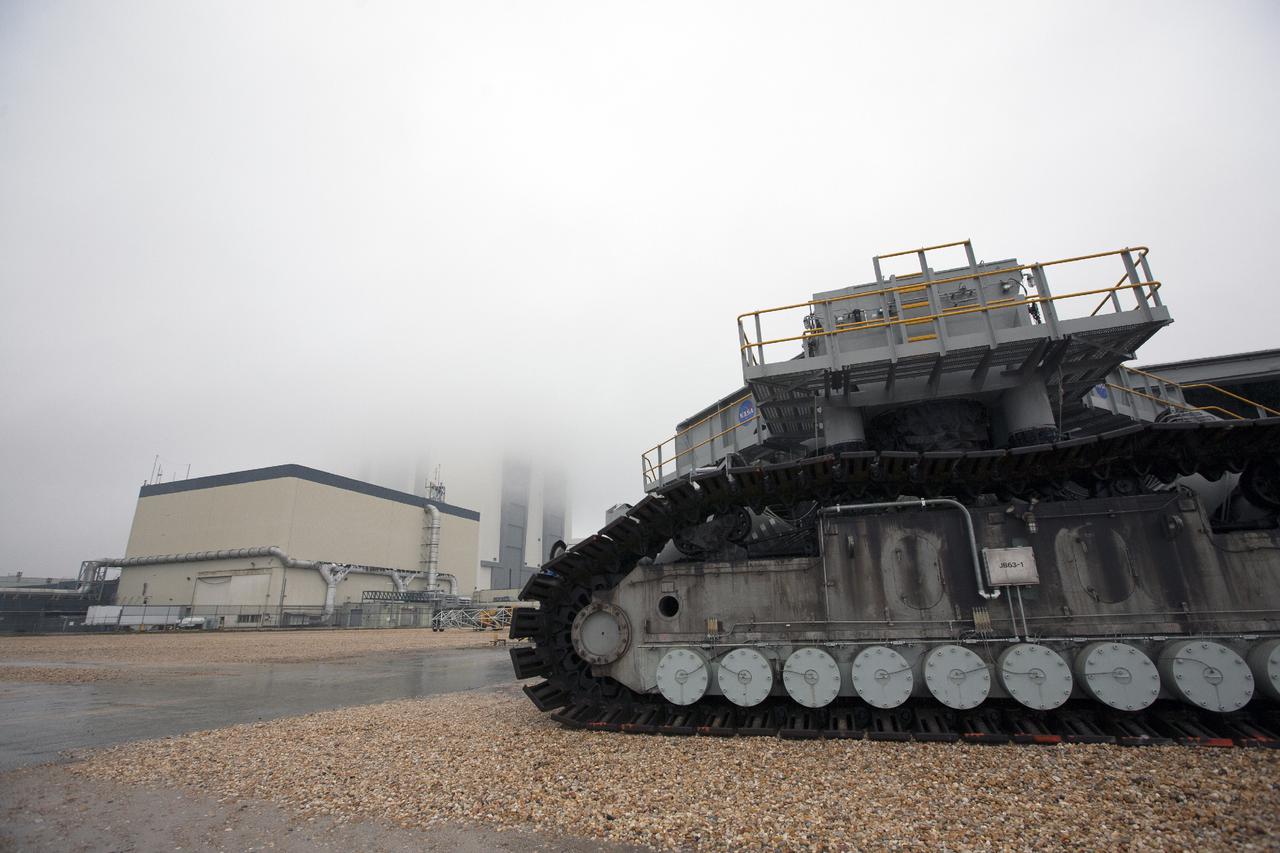
CAPE CANAVERAL, Fla. – Crawler-transporter 2, or CT-2, travels along the crawlerway toward the Vehicle Assembly Building, or VAB, at NASA’s Kennedy Space Center in Florida. The VAB is partially hidden by fog. The Ground Systems Development and Operations Program completed a roller bearing assembly test on CT-2 truck sections A and C. The left- and right-hand steering was tested in both directions. The temperature of the roller assemblies was monitored and recorded. Engineers and technicians performed visual inspections of the roller bearing pumps, valves and lines to ensure that the grease injectors worked properly and provided the required flow of grease to the new roller assemblies. Work continues in high bay 2 to upgrade CT-2. The modifications are designed to ensure CT-2’s ability to transport launch vehicles currently in development, such as the agency’s Space Launch System, to the launch pad. The Ground Systems Development and Operations Program office at Kennedy is overseeing the upgrades. For more than 45 years the crawler-transporters were used to transport the mobile launcher platform and the Apollo-Saturn V rockets and, later, space shuttles to Launch Pads 39A and B. For more information, visit: http:__www.nasa.gov_exploration_systems_ground_crawler-transporter. Photo credit: NASA_Kim Shiflett

CAPE CANAVERAL, Fla. – Crawler-transporter 2, or CT-2, travels along the crawlerway toward the Vehicle Assembly Building at NASA’s Kennedy Space Center in Florida. The Ground Systems Development and Operations Program completed a roller bearing assembly test on CT-2 truck sections A and C. The left- and right-hand steering was tested in both directions. The temperature of the roller assemblies was monitored and recorded as it traveled along the crawlerway. Engineers and technicians performed visual inspections of the roller bearing pumps, valves and lines to ensure that the grease injectors worked properly and provided the required flow of grease to the new roller assemblies. Work continues in high bay 2 to upgrade CT-2. The modifications are designed to ensure CT-2’s ability to transport launch vehicles currently in development, such as the agency’s Space Launch System, to the launch pad. The Ground Systems Development and Operations Program office at Kennedy is overseeing the upgrades. For more than 45 years the crawler-transporters were used to transport the mobile launcher platform and the Apollo-Saturn V rockets and, later, space shuttles to Launch Pads 39A and B. For more information, visit: http:__www.nasa.gov_exploration_systems_ground_crawler-transporter. Photo credit: NASA_Kim Shiflett
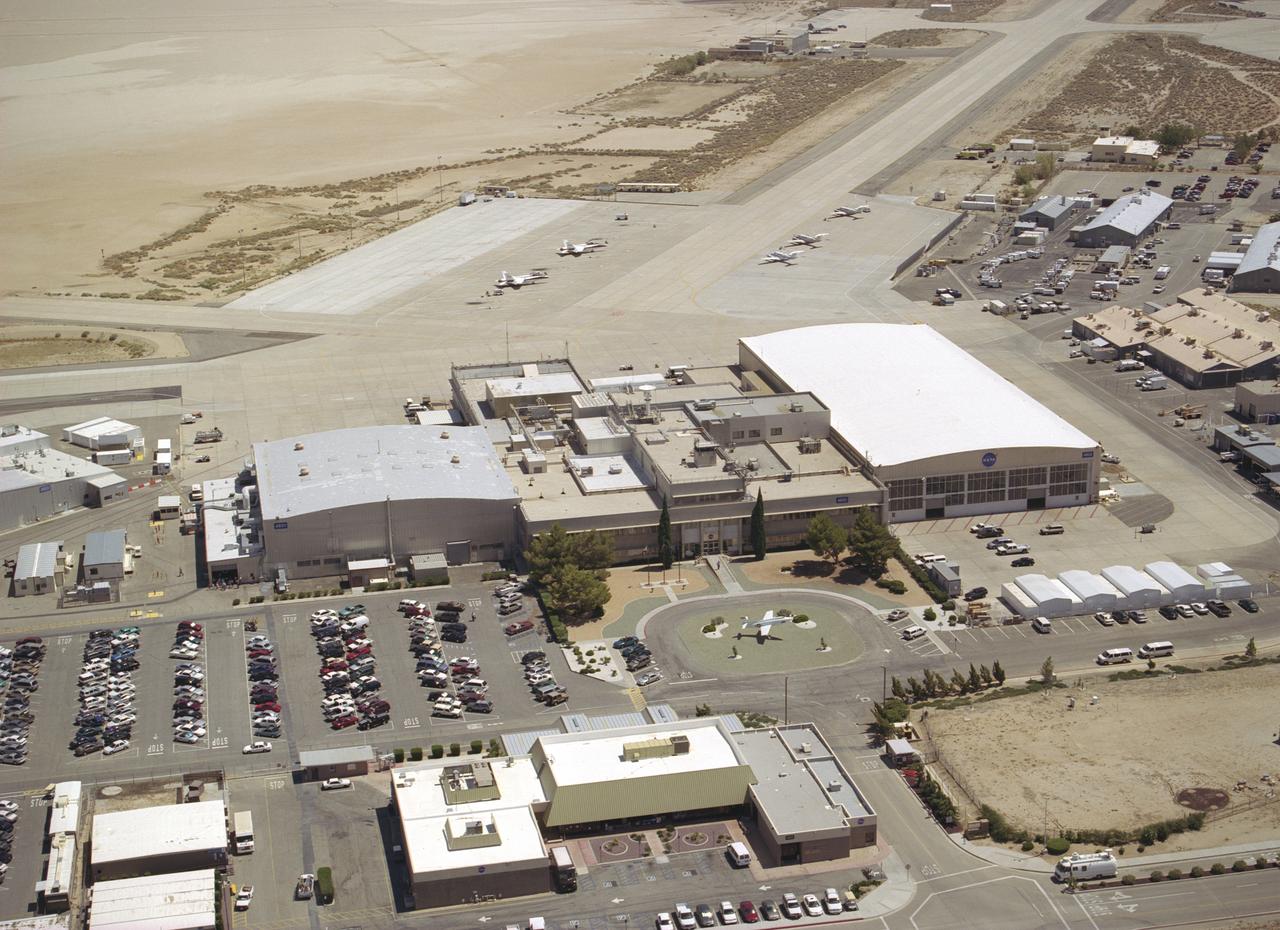
Since the 1940s the Dryden Flight Research Center, Edwards, California, has developed a unique and highly specialized capability for conducting flight research programs. The organization, made up of pilots, scientists, engineers, technicians, and mechanics, has been and will continue to be leaders in the field of advanced aeronautics. Located on the northwest "shore" of Rogers Dry Lake, the complex was built around the original administrative-hangar building constructed in 1954. Since then many additional support and operational facilities have been built including a number of unique test facilities such as the Thermalstructures Research Facility, Flow Visualization Facility, and the Integrated Test Facility. One of the most prominent structures is the space shuttle program's Mate-Demate Device and hangar in Area A to the north of the main complex. On the lakebed surface is a Compass Rose that gives pilots an instant compass heading. The Dryden complex originated at Edwards Air Force Base in support of the X-1 supersonic flight program. As other high-speed aircraft entered research programs, the facility became permanent and grew from a staff of five engineers in 1947 to a population in 2006 of nearly 1100 full-time government and contractor employees.
CAPE CANAVERAL, Fla. – Crawler-transporter 2, or CT-2, travels along the crawlerway toward the Vehicle Assembly Building at NASA’s Kennedy Space Center in Florida. The Ground Systems Development and Operations Program completed a roller bearing assembly test on CT-2 truck sections A and C. The left- and right-hand steering was tested in both directions. The temperature of the roller assemblies was monitored and recorded. Engineers and technicians performed visual inspections of the roller bearing pumps, valves and lines to ensure that the grease injectors worked properly and provided the required flow of grease to the new roller assemblies. Work continues in high bay 2 to upgrade CT-2. The modifications are designed to ensure CT-2’s ability to transport launch vehicles currently in development, such as the agency’s Space Launch System, to the launch pad. The Ground Systems Development and Operations Program office at Kennedy is overseeing the upgrades. For more than 45 years the crawler-transporters were used to transport the mobile launcher platform and the Apollo-Saturn V rockets and, later, space shuttles to Launch Pads 39A and B. For more information, visit: http:__www.nasa.gov_exploration_systems_ground_crawler-transporter. Photo credit: NASA_Kim Shiflett

On June 15, NASA's Swift caught the onset of a rare X-ray outburst from a stellar-mass black hole in the binary system V404 Cygni. Astronomers around the world are watching the event. In this system, a stream of gas from a star much like the sun flows toward a 10 solar mass black hole. Instead of spiraling toward the black hole, the gas accumulates in an accretion disk around it. Every couple of decades, the disk switches into a state that sends the gas rushing inward, starting a new outburst. Read more: <a href="http://www.nasa.gov/feature/goddard/nasa-missions-monitor-a-waking-black-hole" rel="nofollow">www.nasa.gov/feature/goddard/nasa-missions-monitor-a-waki...</a> Credits: NASA's Goddard Space Flight Center Download this video in HD formats from NASA Goddard's Scientific Visualization Studio <a href="http://svs.gsfc.nasa.gov/cgi-bin/details.cgi?aid=11110" rel="nofollow">svs.gsfc.nasa.gov/cgi-bin/details.cgi?aid=11110</a>
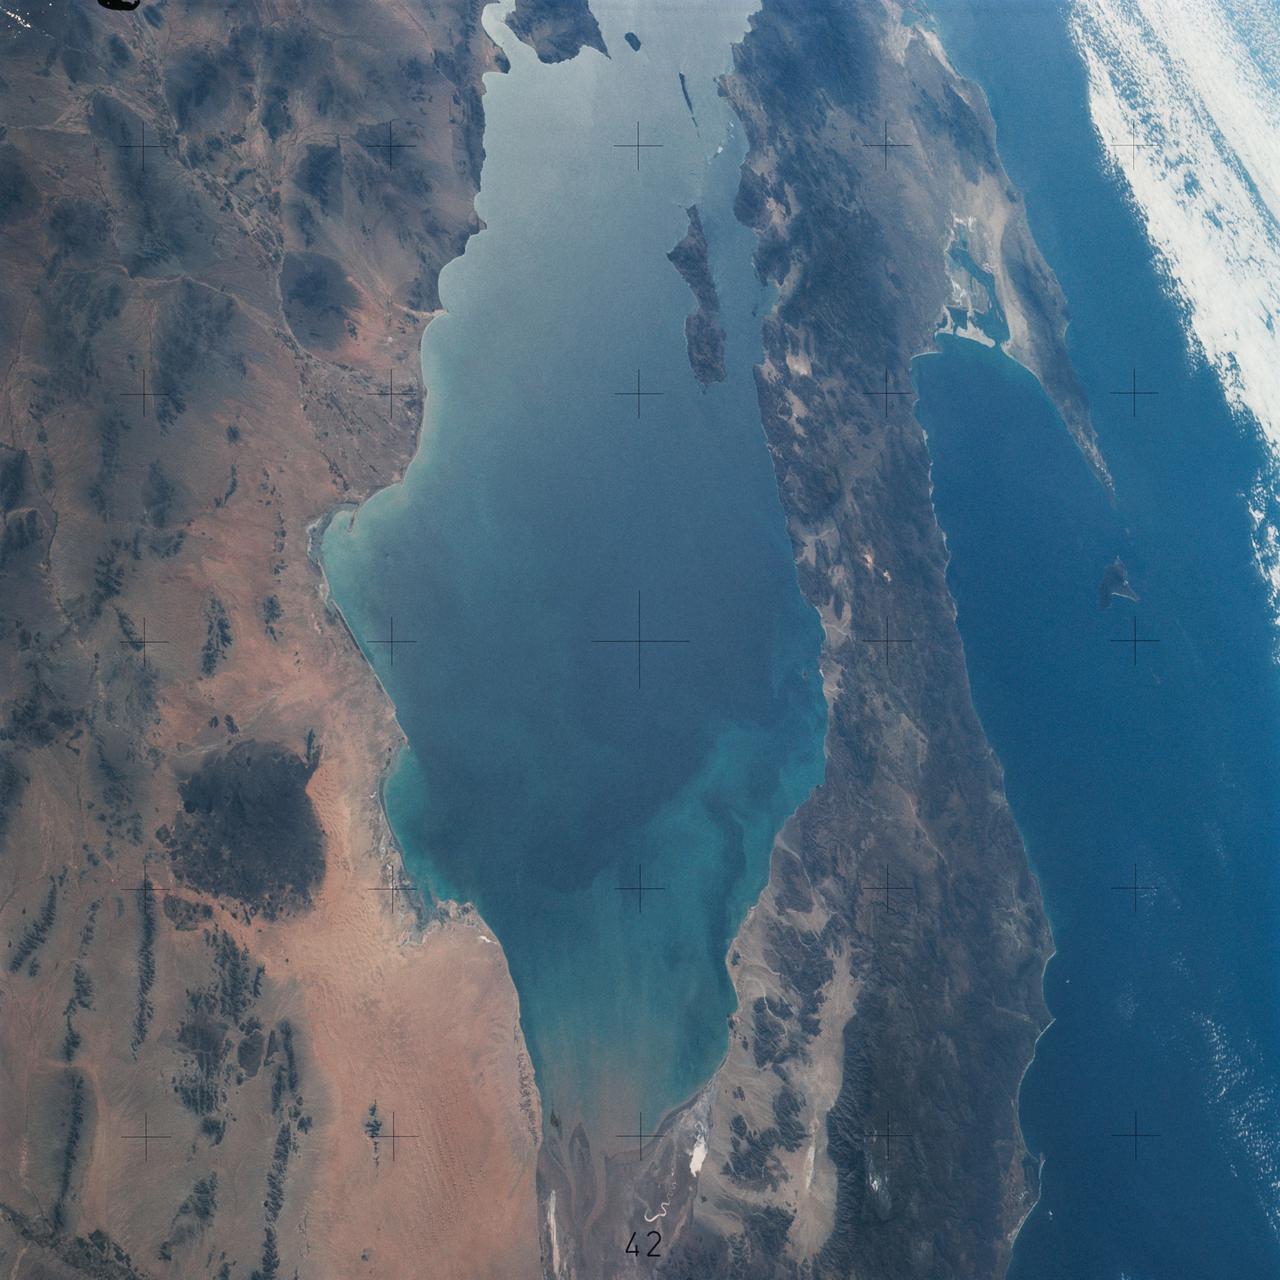
SL4-142-4548 (27 Jan. 1974) --- An oblique view of northwestern Mexico, as photographed from the Skylab space station in Earth orbit by one of the Skylab 4 crewmen. The camera used was a hand-held 70mm Hasselblad, with SO-368 medium-speed Ektachrome film. This photograph was taken on a sweep down the coast to document the fault patterns of southern California and northwest Mexico. SL4-142-4532 gives an excellent overview of the entire region. The specific reason for this picture was an attempt to see if the Agua Blanca Fault in Baja California extends to the east toward the Gulf of California. Several attempts were made by the Skylab 4 crew to visually detect such an extension, but none was found. The report was that the fault disappeared into an area of sand and heavily eroded material that obscured any feature that might be present deeper. This area of sand and loose material is the light-colored area in the center of Baja at the extreme north part of the photograph. In addition to this geology the Pinacate volcanic field in Sonora, the sand dunes in Sonora, and the sediment flow patterns of the Colorado River entering the Gulf are additional areas of study utilizing this photograph. Photo credit: NASA

ISS040-E-027042 (30 June 2014) --- Kulunda Steppe, Siberia in central Russia is featured in this image photographed by an Expedition 40 crew member on the International Space Station. The crew on the station called down to Houston to ask for an explanation of this strange pattern of spikes crossing the Kulunda Steppe in central Russia. The ?spikes? are a prominent visual feature (center) visible from the top of the ISS orbit (approximately 52 degrees north), the highest latitude flown over by the spacecraft. In fact these linear zones are gentle folds in the surface rocks of the area, lying slightly lower than the surrounding lighter-toned agricultural lands. The dark zones are forested with pines and dotted with salt-rich lakes. The image width (left to right edge) represents more than 300 kilometers ground distance, and the forested spikes are nearly that length. The green floodplain of the famous Ob River (right) is the westernmost of Siberia?s three great rivers (the others being the Yenisei and Lena). The Ob flows north (towards the top of the image) for another 2,000 kilometers to the Arctic Ocean. The city of Barnaul (population 612,000), a major center of industry, trade and culture in Siberia, lies on the banks of the river with riverboat, air and rail links to the rest of the country. A broader, winter image of the Kulunda geology and the Ob River can be seen here.
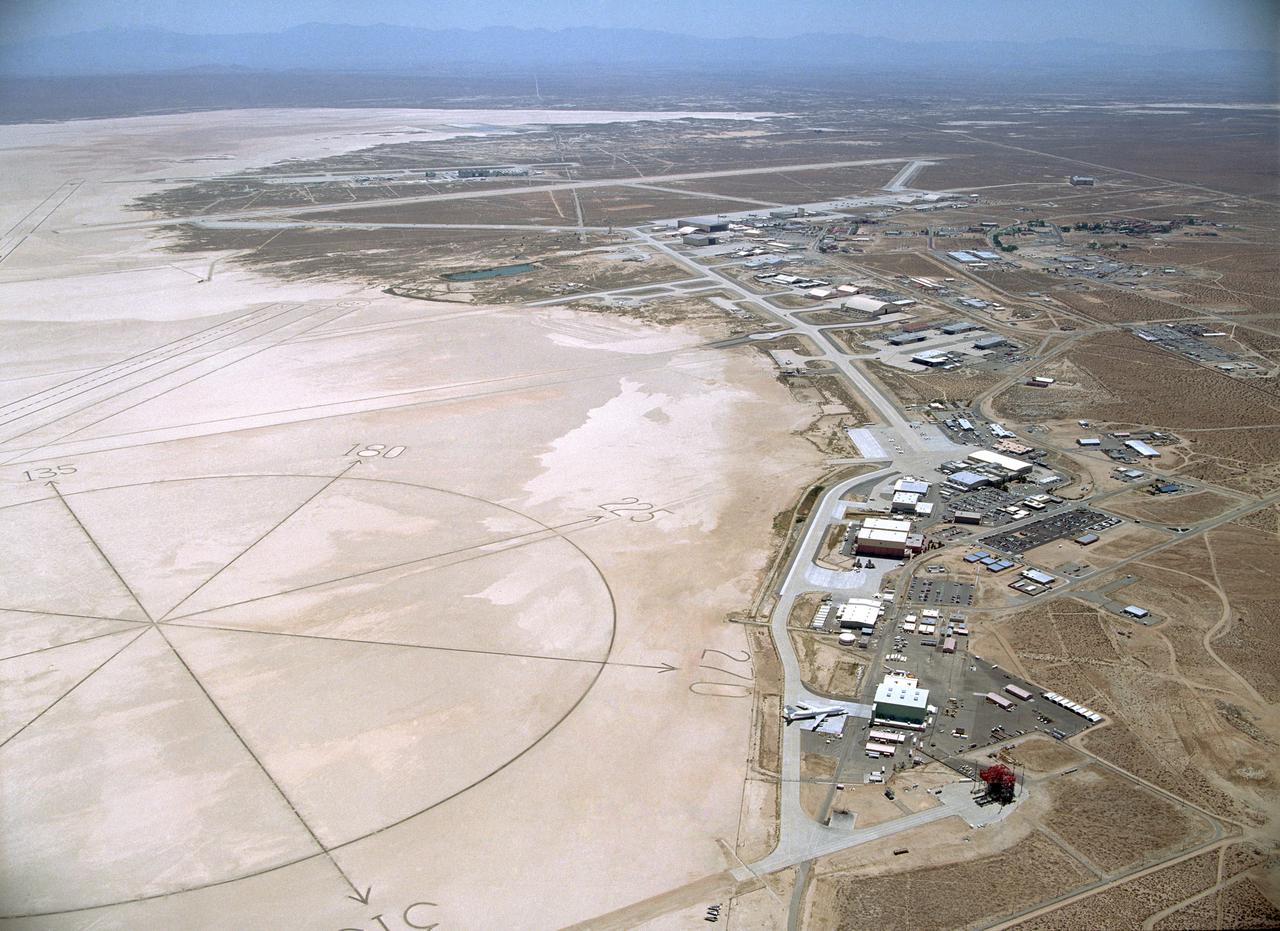
Since the 1940s the Dryden Flight Research Center, Edwards, California, has developed a unique and highly specialized capability for conducting flight research programs. The organization, made up of pilots, scientists, engineers, technicians, and mechanics, has been and will continue to be leaders in the field of advanced aeronautics. Located on the northwest "shore" of Rogers Dry Lake, the complex was built around the original administrative-hangar building constructed in 1954. Since then many additional support and operational facilities have been built including a number of unique test facilities such as the Thermalstructures Research Facility, Flow Visualization Facility, and the Integrated Test Facility. One of the most prominent structures is the space shuttle program's Mate-Demate Device and hangar in Area A to the north of the main complex. On the lakebed surface is a Compass Rose that gives pilots an instant compass heading. The Dryden complex originated at Edwards Air Force Base in support of the X-1 supersonic flight program. As other high-speed aircraft entered research programs, the facility became permanent and grew from a staff of five engineers in 1947 to a population in 2006 of nearly 1100 full-time government and contractor employees.

The X-1E research aircraft provides a striking view at the entrance of NASA's Dryden Flight Research Center, Edwards, California. The X-1E, one of the three original X-1 aircraft modified with a raised cockpit canopy and an ejection seat, was flown at the facility between 1953 and 1958 to investigate speeds at twice that of sound, and also to evaluate a thin wing designed for high-speed flight. The Dryden complex was originally established in 1946 as a small high-speed flight station to support the X-1 program. The X-1 was the first aircraft to fly at supersonic speeds. The main administrative building is to the rear of the X-1E and is the center of a research installation that has grown to more than 450 government employees and nearly 400 civilian contractors. Located on the northwest "shore" of Rogers Dry Lake, the Dryden Center was built around the original administrative-hangar building constructed in 1954 at a cost of $3.8 million. Since then many additional support and operational facilities have been built including a number of unique test facilities such as the Thermalstructures Research Facility, Flow Visualization Facility, and the newest addition, the Integrated Test Facility.
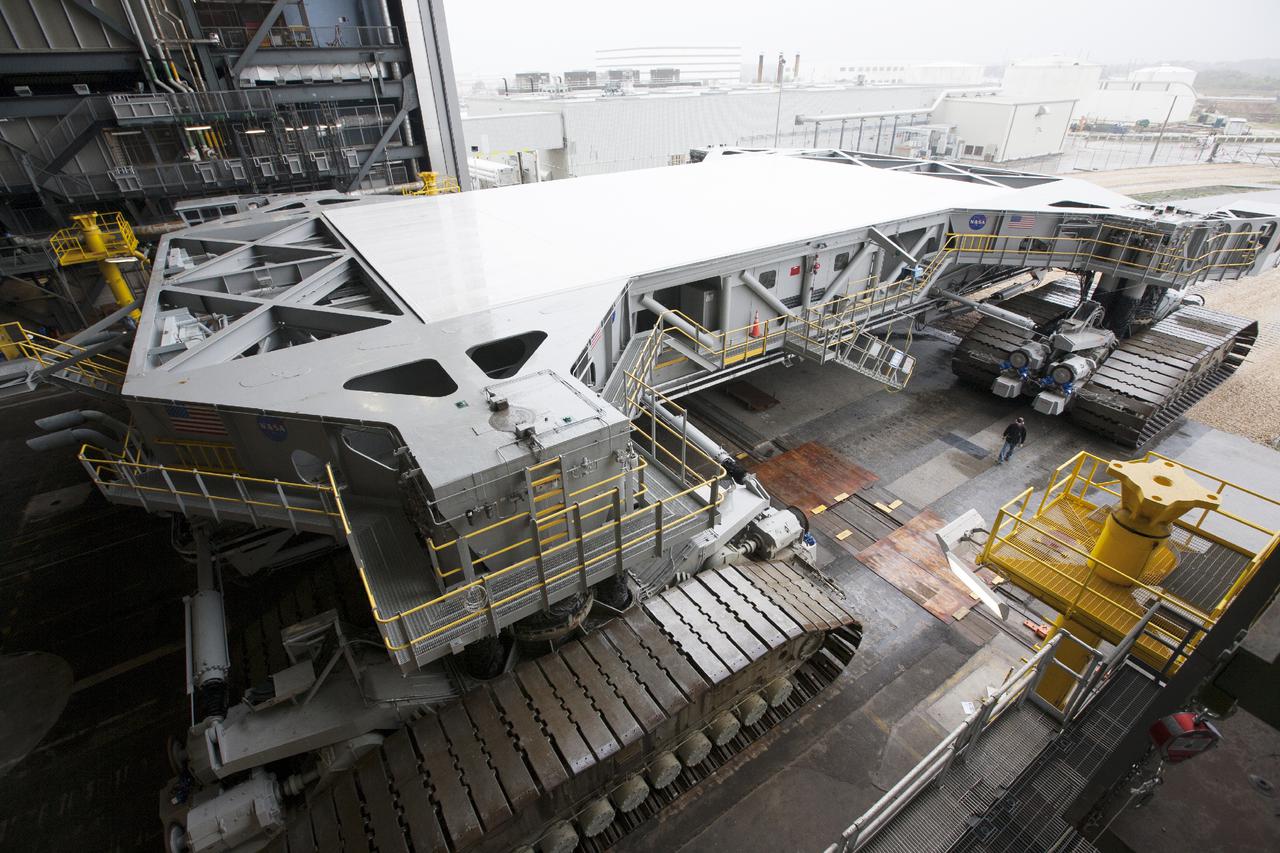
CAPE CANAVERAL, Fla. – Crawler-transporter 2, or CT-2, slowly enters the Vehicle Assembly Building at NASA’s Kennedy Space Center in Florida. The Ground Systems Development and Operations Program completed a roller bearing assembly test on CT-2 truck sections A and C. The left- and right-hand steering was tested in both directions. The temperature of the roller assemblies was monitored and recorded as it traveled along the crawlerway. Engineers and technicians performed visual inspections of the roller bearing pumps, valves and lines to ensure that the grease injectors worked properly and provided the required flow of grease to the new roller assemblies. Work continues in high bay 2 to upgrade CT-2. The modifications are designed to ensure CT-2’s ability to transport launch vehicles currently in development, such as the agency’s Space Launch System, to the launch pad. The Ground Systems Development and Operations Program office at Kennedy is overseeing the upgrades. For more than 45 years the crawler-transporters were used to transport the mobile launcher platform and the Apollo-Saturn V rockets and, later, space shuttles to Launch Pads 39A and B. For more information, visit: http:__www.nasa.gov_exploration_systems_ground_crawler-transporter. Photo credit: NASA_Kim Shiflett

This rendering shows the area where NASA's Curiosity Mars rover climbed a steep slope to reach a location called Gediz Vallis channel, which it began exploring for several months starting in February 2024. Imagery captured by the High-Resolution Imaging Experiment (HiRISE) camera on NASA's Mars Reconnaissance Orbiter, along with other instruments, were used to make the visualization. Since 2014, Curiosity has been ascending the foothills of Mount Sharp, which stands 3 miles (5 kilometers) above the floor of Gale Crater. The layers in this lower part of the mountain formed over millions of years under a changing Martian climate, providing scientists with a way to study how the presence of both water and the chemical ingredients required for life changed over time. This image covers part of a region on Mount Sharp enriched in sulfates, salty minerals that often form as water evaporates. At the bottom of the image is the slope Curiosity climbed to get here, which includes alternating dark and light bands of sedimentary material that scientists are still puzzling over. Above those bands is the roughly 300-foot-wide (91-meter-wide) Gediz Vallis channel. The formation's sides are filled with dark sand while its center is filled with mounds of boulders and other debris. Scientists aren't entirely sure how the channel was formed; it could have been carved into the surrounding bedrock by an ancient river or debris flows (rapid, wet landslides). The debris currently filling the channel could have been carried down the channel as debris flows or in dry avalanches. On the right side of the image, the mounds of debris form a large ridge that continues farther down Mount Sharp. The route in Figure A shows how Curiosity veered off to study the ridge up close. https://photojournal.jpl.nasa.gov/catalog/PIA26241
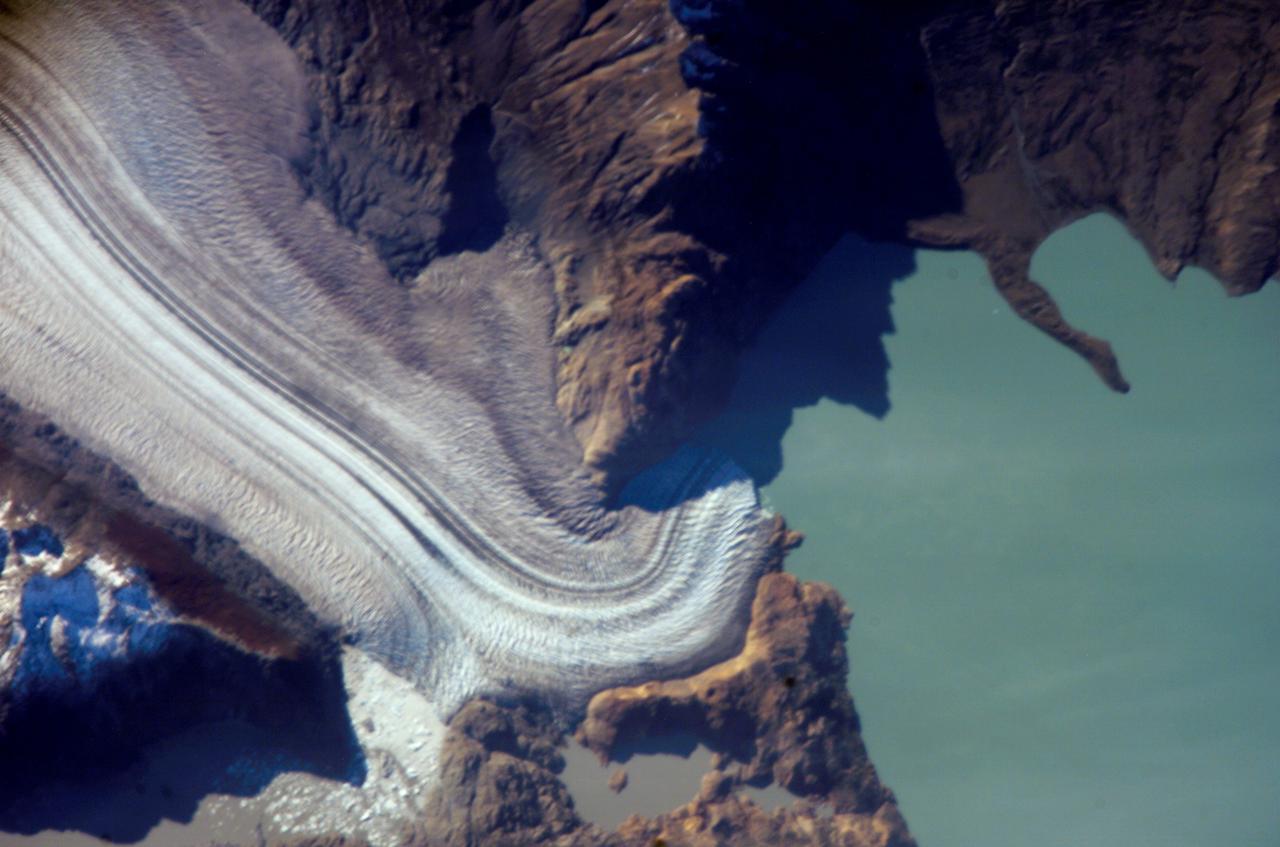
ISS013-E-06947 (12 April 2006) --- Viedma Glacier, Argentina is featured in this image photographed by an Expedition 13 crewmember on the International Space Station. The ice fields of Patagonia, located at the southern end of South America, are the largest masses of ice in the temperate Southern Hemisphere (approximately 55,000 square kilometers in area). The ice fields contain numerous valley glaciers that terminate in melt-water-fed lakes. These are known as "calving" glaciers, as they lose mass by collapse of large ice chunks from the terminus--or end--of the glacier. These newly separated chunks of ice are then free to float away, much like ice cubes in a punch bowl. The Patagonian glaciers are closely monitored using remotely sensed data as they respond to regional climate change. Visual comparison of time series of images is typically performed to quantify change in ice extent and position. The terminus of the Viedma Glacier, approximately two kilometers across where it enters Lake Viedma, is shown in this image. Moraines are accumulations of soil and rock debris that form along the sides and front of a glacier as it flows across the landscape (much like a bulldozer). Independent valley glaciers can merge together as they flow down-slope, and the moraines become entrained in the center of the new ice mass. These medial moraines are visible as dark parallel lines within the white central mass of the glacier (image center and left). Crevasses - oriented roughly perpendicular to the medial moraines - are also visible in the grey-brown ice along the sides of the glacier. According to scientists, the canyon-like crevasses form as a result of stress between the slower moving ice along the valley sides and the more rapidly moving ice in the center of the glacier. Calving of ice from the southwestern fork of the glacier terminus is visible at image lower left.
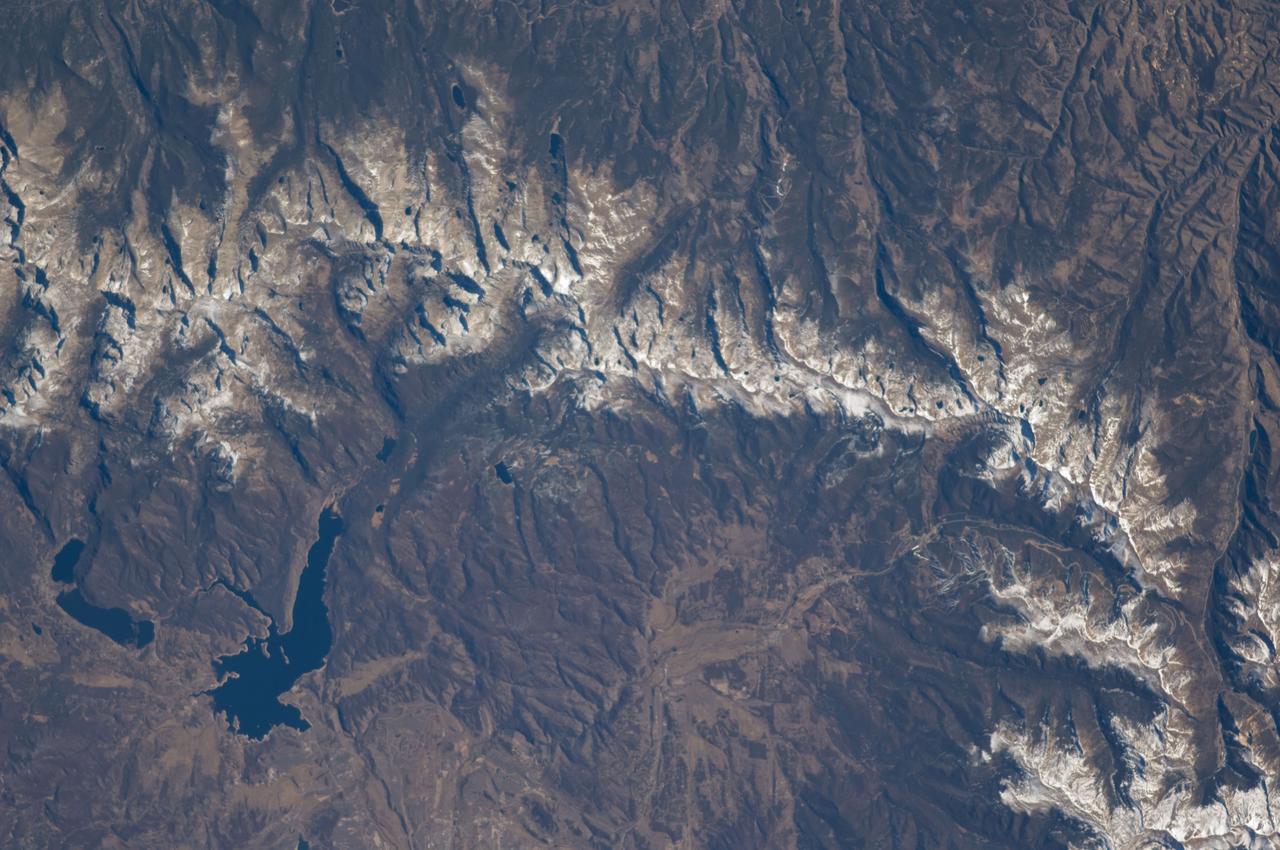
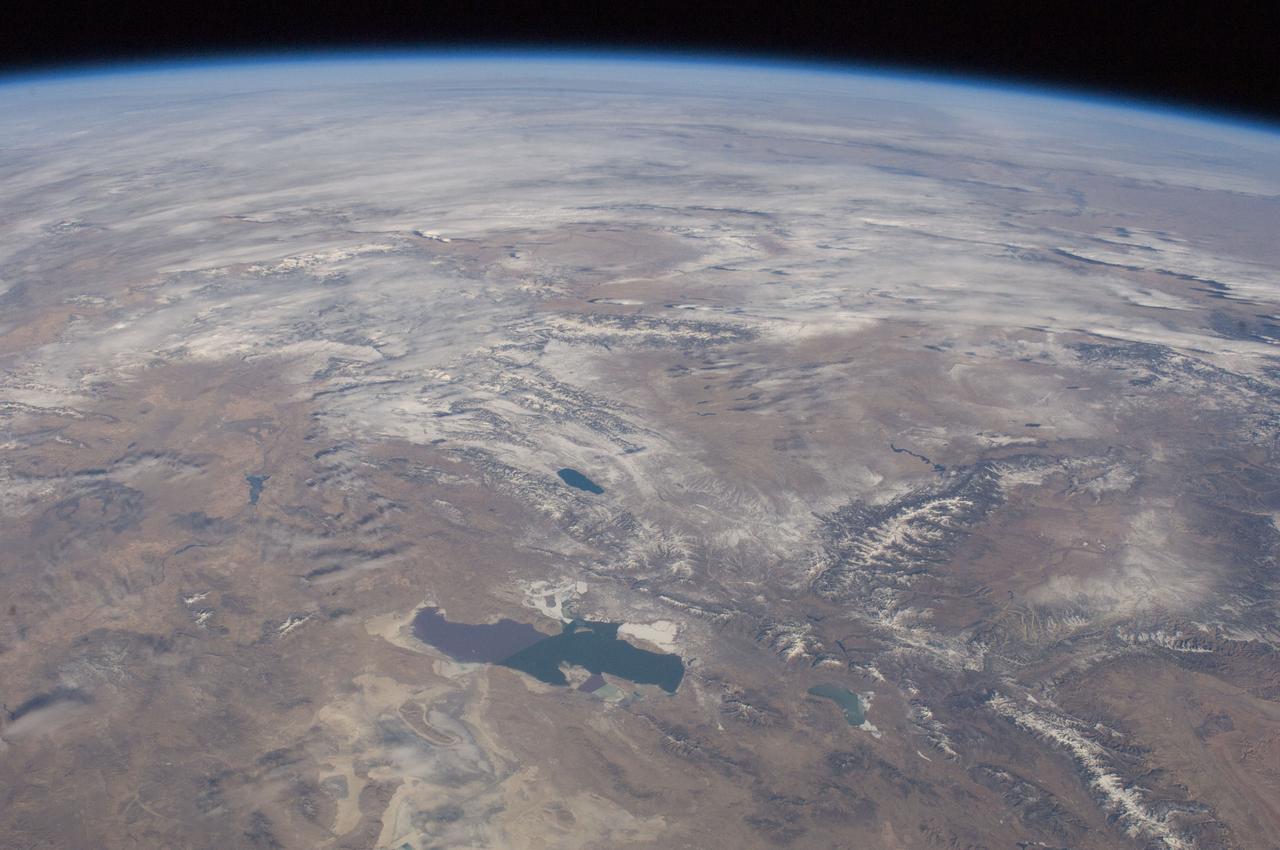
ISS018-E-005660 (28 Oct. 2008) --- The Great Divide of the Rocky Mountains in Colorado is featured in this image photographed by an Expedition 18 crewmember on the International Space Station. This view highlights a portion of the Great Divide in the Rocky Mountains approximately 31 kilometers due west of Boulder, Colorado. The Great Divide is one of four continental divides recognized by geographers and hydrologists in North America -- the others being the Northern, Eastern, and Saint Lawrence Seaway Divides -- but it is still generally (and erroneously) known as "the" Continental Divide. The Great Divide is a hydrologic boundary defined by the ultimate destination of precipitation -- rainfall on the western side of the Divide flows to the Pacific Ocean, while rainfall on the eastern side of the Divide flows to the Gulf of Mexico. It is easy to visualize such a boundary traced along the high ridges of the Rocky Mountains, but in regions of less topography more detailed study of the local geomorphology and hydrology are required to map the location of the Divide. This portion of the Rocky Mountains also hosts the Niwot Ridge Long Term Ecological Research (LTER) site. Part of the National Science Foundation LTER program, the Niwot Ridge LTER site studies climate interactions with tundra and alpine ecosystems. Niwot Ridge is visible in this image as a large eastward spur off the central spine of the mountains. The entire Niwot LTER site is located at elevations higher than 3000 m, and includes an active cirque glacier and glacial landforms, tarns (glacial lakes), and permafrost. Lake Granby, located to the west of the Great Divide, is a reservoir on the Colorado River and the second-largest manmade body of water in the state of Colorado. Storage of water began in 1949. Today, the Lake is popular location for fishing, boating and camping.
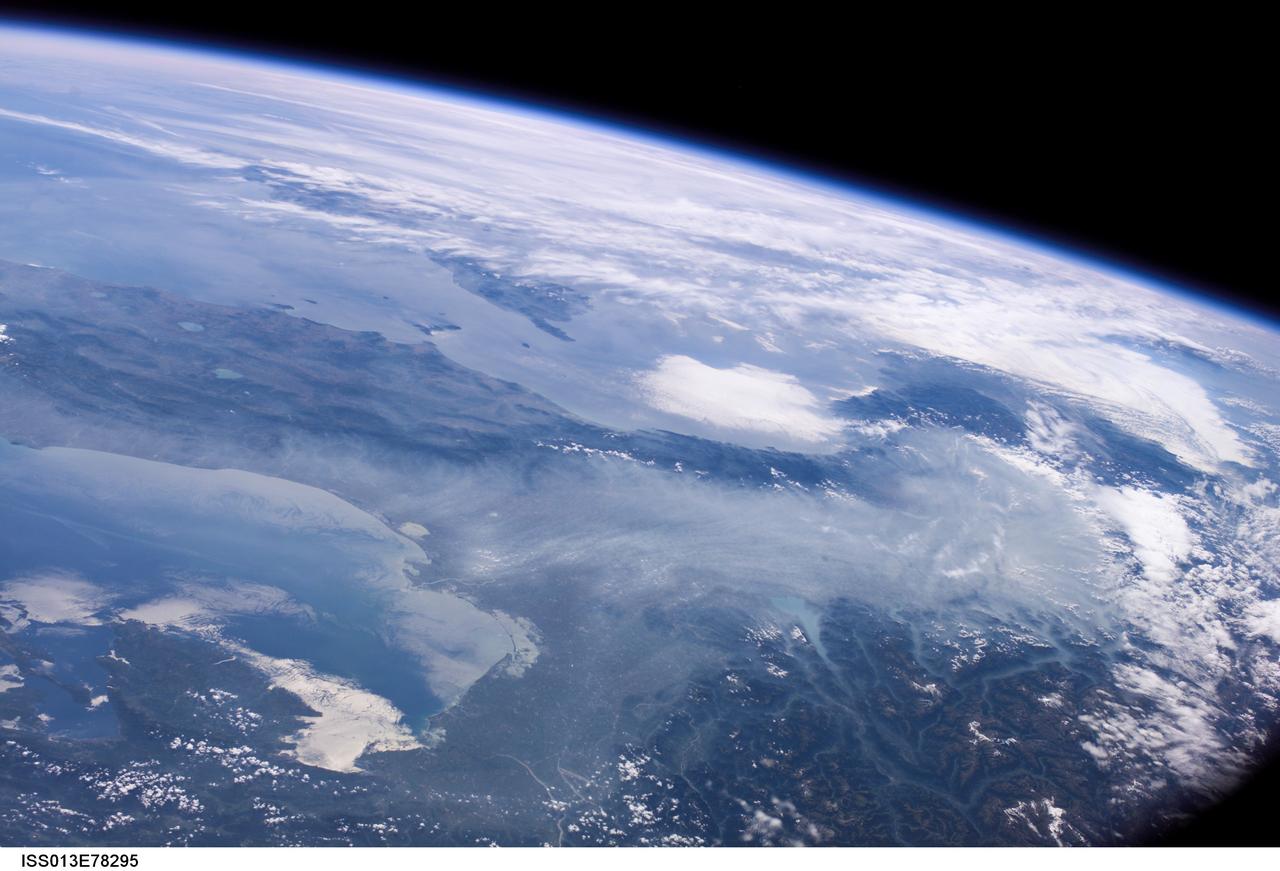
ISS013-E-78295 (6 Sept. 2006) --- Haze in the Po River Valley of Italy is featured in this image photographed by an Expedition 13 crewmember onboard the International Space Station. The valley is visible across the horizontal center of the frame, with the floor obscured by what NASA scientists refer to as frequent atmospheric haze, a mixture of industrial pollutants, dust and smoke. The visual texture of such haze is perceptibly different from that of bright white clouds which stretch across the top of the scene and cover part of the Alps. The Po River Valley is Italy's industrial heartland and one of the most industrialized regions on Earth, according to scientists. Northern Italy is in the foreground of this southwesterly view. The partially cloud-covered Alps are at lower right; the Adriatic Sea at lower left. Corsica is under partial cloud cover at center; and Sardinia, almost totally obscured, is to its south. The island of Elba is visible just to the west of Italy. By contrast with haze accumulation along the axis of the valley, the Alps and the Apennines are clearly visible, and Lake Garda can be seen in the foothills of the Alps. Other visible geographic features are the lagoon at Venice north of the Po River delta, and three small lakes north of Rome. The winds on the day this image was taken are mainly from the north, as shown by the flow lines in the haze near Venice. The haze typically flows south down the Adriatic Sea. Visibility in the Mediterranean basin is often reduced by hazes such as these, deriving from different sources in industrialized Europe.
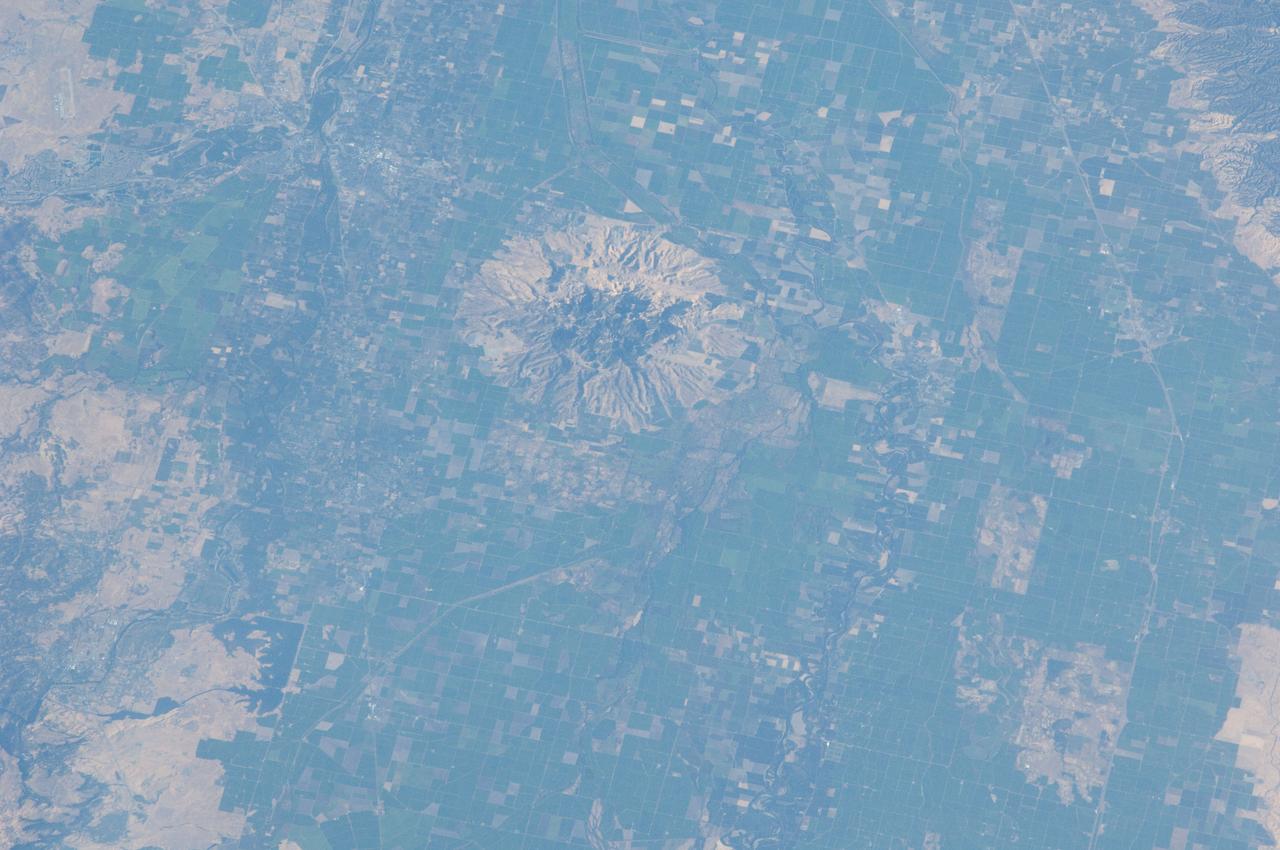
ISS032-E-010482 (29 July 2012) --- Sutter Buttes in California are featured in this image photographed by an Expedition 32 crew member on the International Space Station. Sometimes called the ?smallest mountain range in the world?, the Sutter Buttes rise almost 610 meters above the surrounding flat agricultural fields of the Great Valley of central California. Scientists believe the Sutter Buttes are remnants of a volcano that was active approximately 1.6 ? 1.4 million years ago during the Pleistocene Epoch. The central core of the Buttes is characterized by lava domes?piles of viscous lava that erupted onto the surface, building higher with each successive layer. Today, these lava domes form the high central hills of the Buttes; shadows cast by the hills are visible at center. Surrounding the central core is an apron of fragmental material created by occasional eruptions of the lava domes ? this apron extends roughly 18 kilometers east-west and 16 kilometers north-south. The volcanic material was transported outwards from the central core during eruptions by hot gasses (pyroclastic flows) or by cooler water-driven flows (lahars). Later stream erosion of the debris apron is evident from the radial drainage pattern surrounding the central core. A third geomorphic region of valleys known as the ?moat? is present between the core and the debris apron, and was formed from erosion of older, exposed sedimentary rocks that underlie the volcanic rocks. The Sutter Buttes present a striking visual contrast with the surrounding green agricultural fields?here mostly rice, with some sunflower, winter wheat, tomato, and almonds?of the Great Valley. Urban areas such as Yuba City, CA (located 18 kilometers to the southeast) appear as light to dark gray stippled regions. Sacramento, CA (not shown) is located approximately 80 kilometers to the south-southeast. The image appears slightly distorted (oblique) due to the viewing angle from the space station.
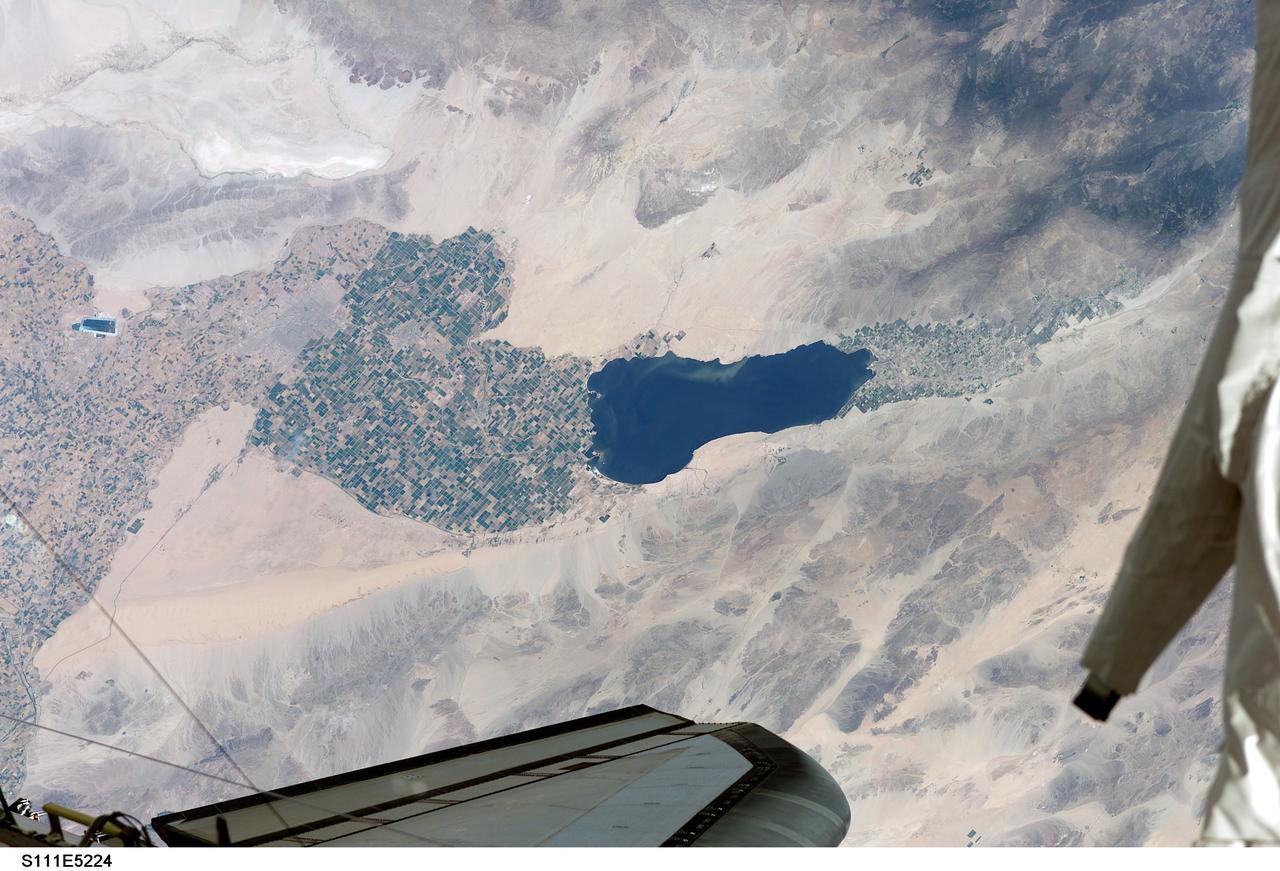
STS111-E-5224 (12 June 2002) --- Southern California’s Salton Sea is routinely a prominent visual for astronauts passing overhead on the shuttle or International Space Station (ISS). This large lake, photographed from the station while docked to the Space Shuttle Endeavour by one of the STS-111 crew members, supports the rich agricultural fields of the Imperial, Coachella and Mexicali Valleys in the California and Mexico desert. According to geologists, the Salton Sea formed by accident in 1905 when an irrigation canal ruptured, allowing the Colorado River to flood the Salton Basin. Today the Sea performs an important function as the sink for agricultural runoff. Water levels are maintained by the runoff from the surrounding agricultural valleys. The Salton Sea salinity is high -- nearly 1/4 saltier than ocean water --but it remains an important stopover point for migratory water birds, including several endangered species. Scientists also noted that the region experiences several environmental problems. The recent increased demands for the limited Colorado River water, the scientists point out, threatens the amount of water allowed to flow into the Salton Sea, and increased salinity with decreased water levels could trigger several regional environmental crises. The agricultural flow into the Sea includes nutrients and agricultural by-products, increasing the productivity and likelihood of algae blooms. This image shows either a bloom, or suspended sediment (usually highly organic) in the water that has been stirred up by winds.
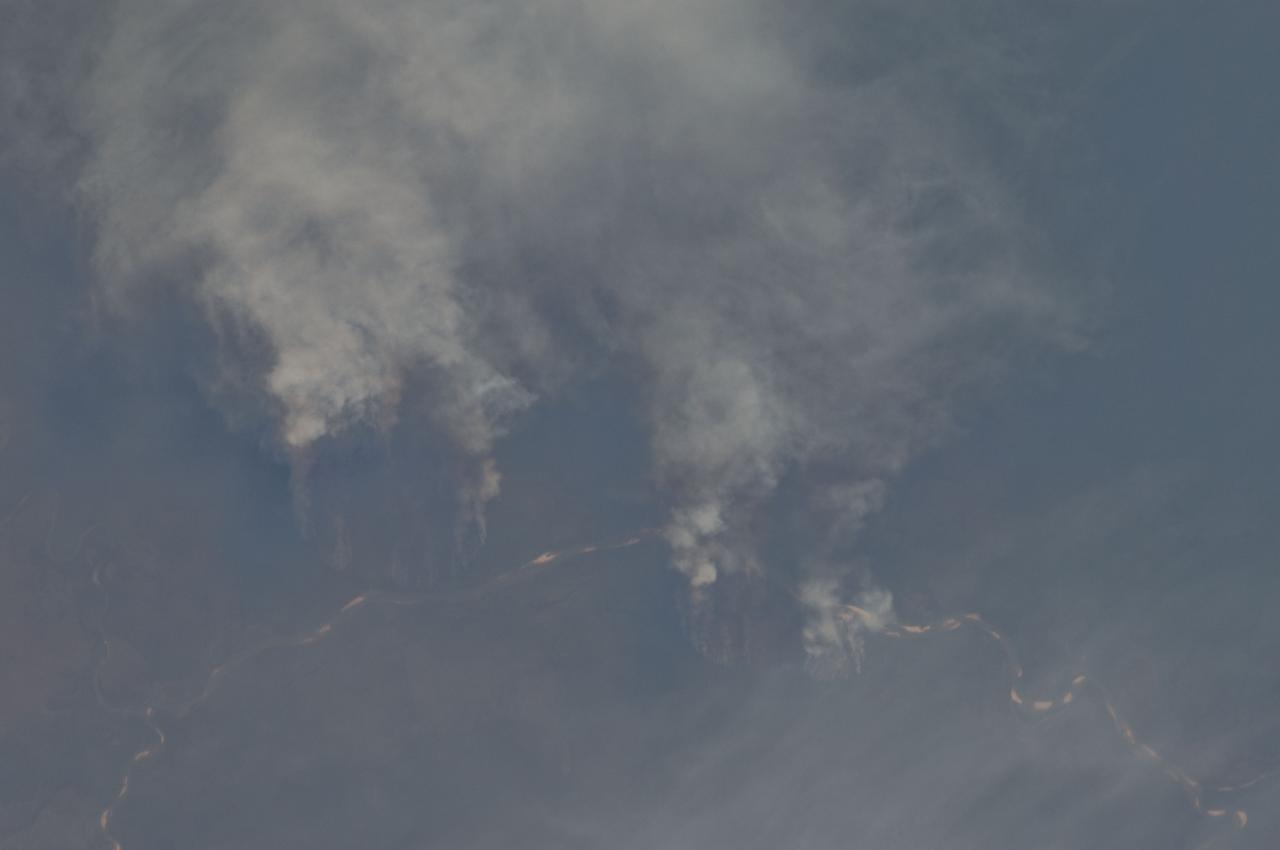
ISS029-E-008032 (17 Sept. 2011) --- Fires along the Rio Xingu, Brazil are featured in this image photographed by an Expedition 29 crew member on the International Space Station. The rain forest of South America, also known as ?Amazonia??the largest such forest on Earth?has been undergoing a continual and accelerated land use conversion process into farmlands (including pasture for livestock) since the early 1960s. This process has typically been achieved by clearing of the forest using fire ? ?slash and burn? ? followed by planting of crops. The generally infertile soils of the region make sustainable farming difficult; this drives more forest conversion into new farmland. The area of clearing can be considerable, and as the deforested regions are easily identifiable and measurable from space the rate of deforestation is likewise easy to track. This detailed photograph illustrates slash-and-burn forest clearing along the Xingu River (Rio) in the northeast of the state of Matto Grasso, Brazil. The perspective of this image allows for a striking visualization of both the horizontal position and extent of the fire lines next to the river, as well as providing a sense of the vertical structure of the smoke plumes due to the viewing angle and shadowing. Light colored areas within the river channel are sand bars, which show that the river is in its annual low-flow/ low water stage. For a sense of scale, the Xingu River channel within the view is approximately 63 kilometers long. Rivers in Amazonia are its natural highways, which may explain why the burning is occurring right next to the Xingu River, one of Amazonia?s largest. In recent years, preservation has gained traction in the region as a result of such considerations as new valuation of the ecosystem services provided by the forest, concerns about the impact of widespread burning on global climate change, and greater sensitivity to the ethnic and biological heritage of Amazonia.
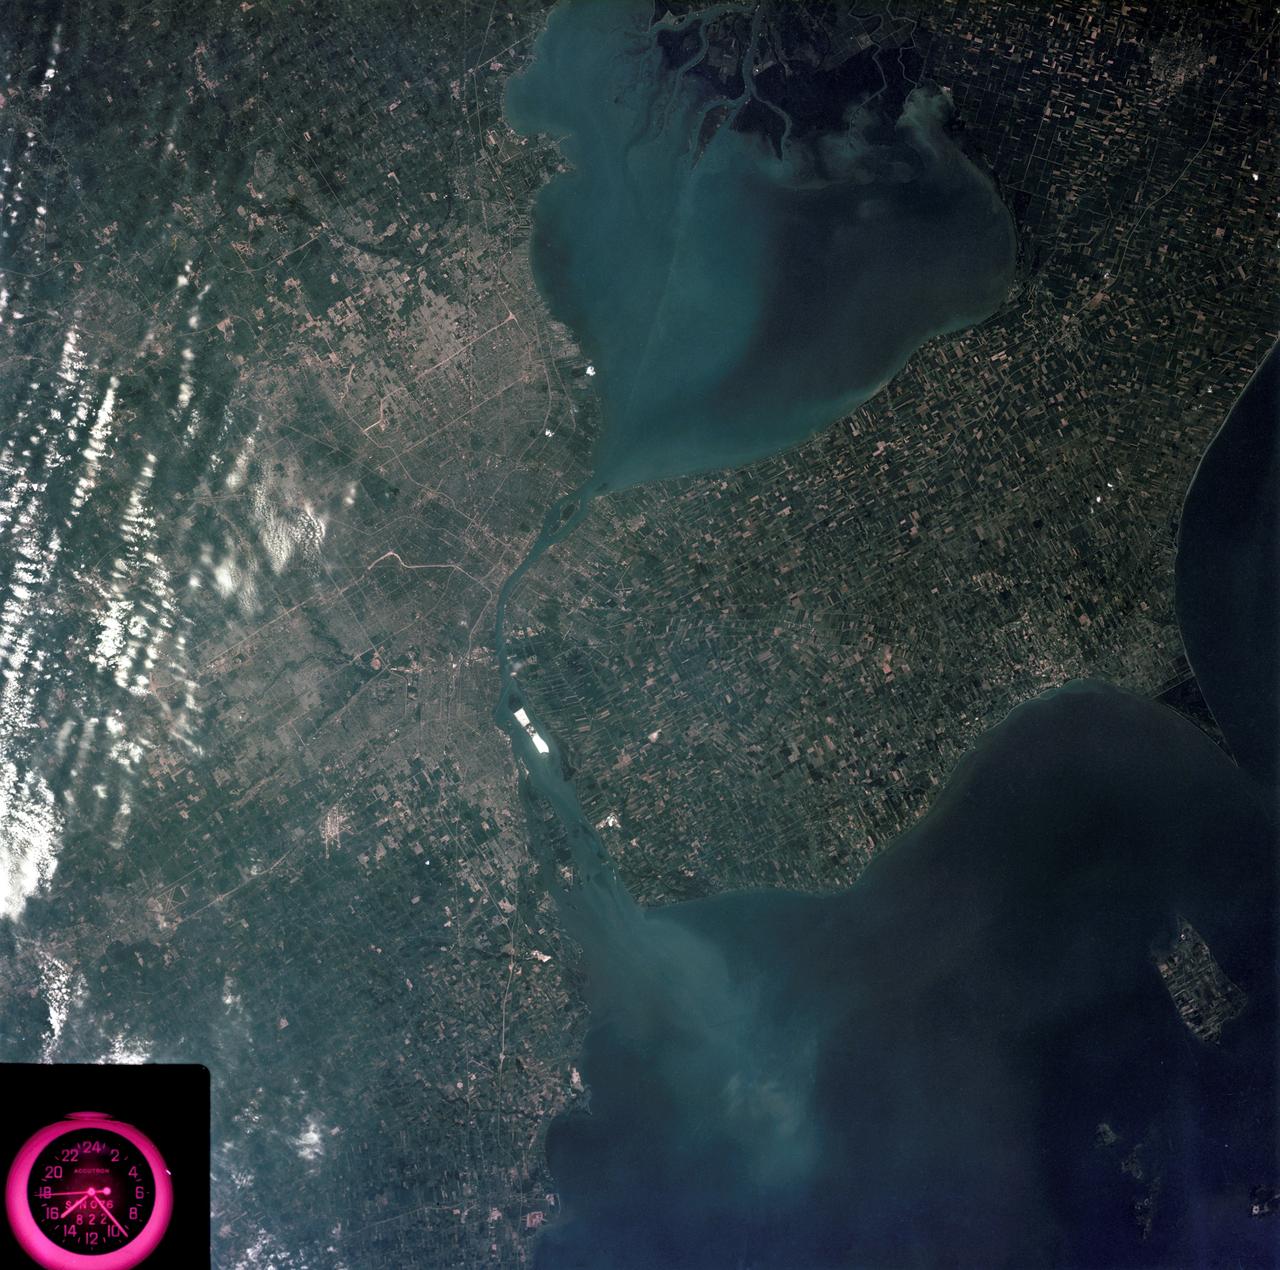
SL3-83-0152 (July-September 1973) --- A near vertical view of the metropolitan Detroit, Michigan area is seen in this Skylab 3 Earth Resources Experiments Package S190-B (five-inch Earth terrain camera) photograph taken from the Skylab space station in Earth orbit. The 25-mile long Detroit River drains the smaller body of water (Lake St. Clair) and flows southwestward separating Detroit from Windsor, Ontario, and empties into Lake Erie. The Detroit River handles a great deal of Great Lakes barge and ship traffic. Major streets and thoroughfares radiating from the city are clearly visible. Fighting Island is the highly reflective, white area located almost in the center of the picture. This high reflectivity is caused by the functional use of the island-disposal ponds for chemical salts. Sedimentation and/or pollution patterns in the area provide interesting visual phenomena for speculation and analysis. Distinct and rather unique cultivated field patterns can be observed south and east of Windsor, Ontario. This is a direct result of an English survey and land tenure system which was utilized when the area was settled. New areas of residential development are fairly easy to differentiate from older, established residential areas. Vegetation and extent of area coverage can be determined. The Oakland County Planning Commission and the Federal Bureau of Outdoor Recreation working closely with Irv Sattinger of the Environmental Research Institute of Michigan (University of Michigan) are presently processing and analyzing photographic and Multispectral scanner data to determine its usefulness for recreation and open space site studies for this area. Photo credit: NASA
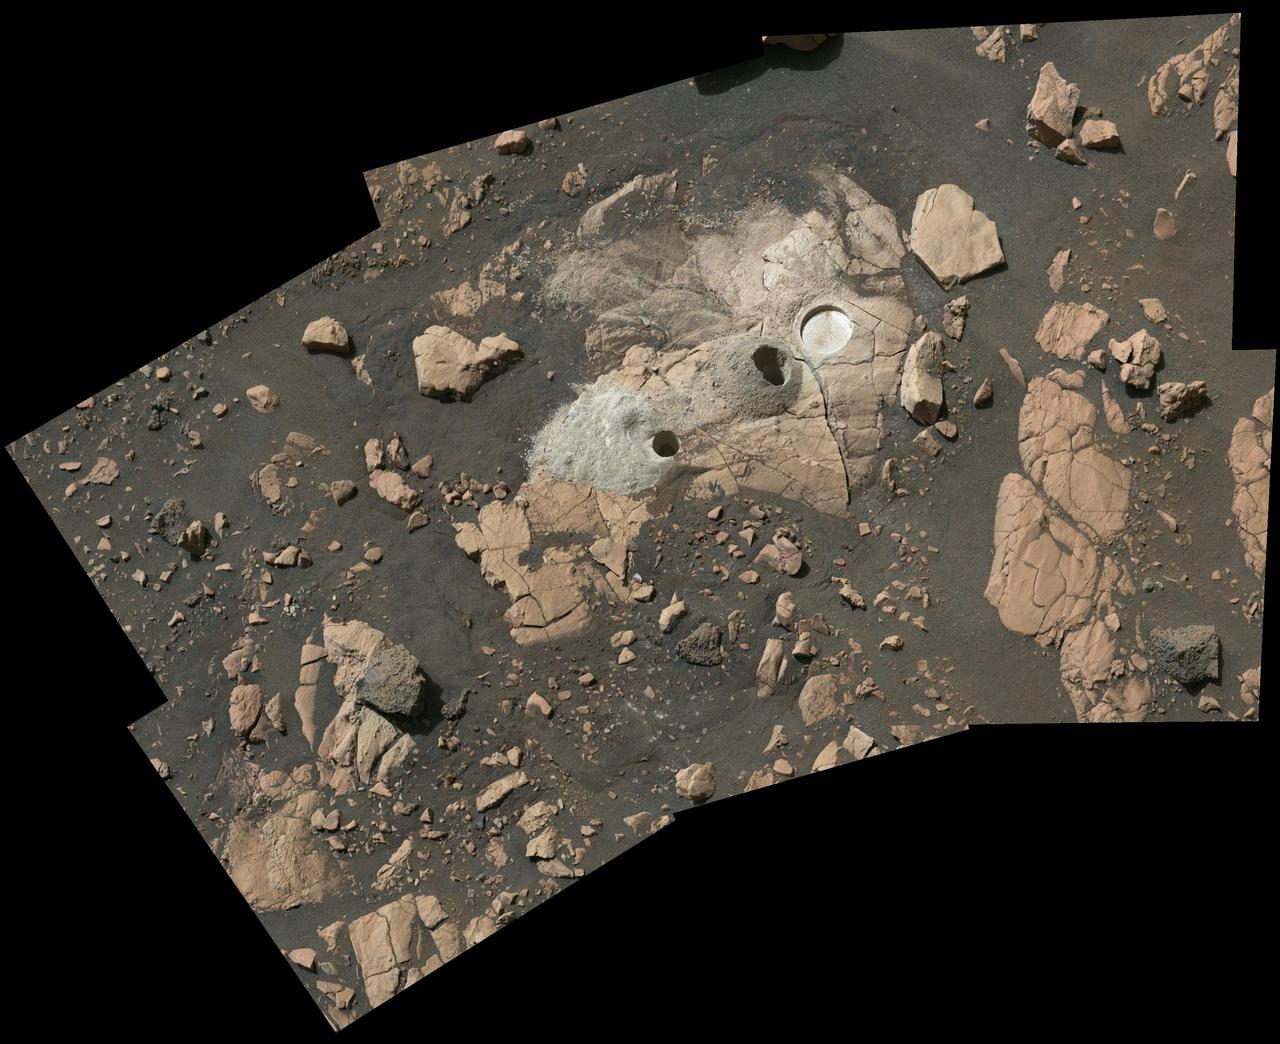
Composed of multiple images from NASA's Perseverance Mars rover, this mosaic shows a rocky outcrop called "Wildcat Ridge," where the rover extracted two rock cores and abraded a circular patch to investigate the rock's composition. The site is in the delta, a fan-shaped area where, billions of years ago, a river once flowed into a lake in Jezero Crater. Scientists consider this area one of the best places on Mars to search for potential signs of ancient microbial life. The images were obtained by the Mastcam-Z instrument on Aug. 4, 2022, the 518th Martian day, or sol, of the rover's mission. For scale, the bright circular abrasion patch on the right is approximately 2 inches (5 centimeters) in diameter. The color bands of the image have been processed to improve visual contrast and accentuate color differences. The rock cores obtained by Perseverance – each about the size of a piece of classroom chalk – were sealed in ultra-clean sample tubes. They are currently stored in the rover's Sampling and Caching System. The verification of ancient life on Mars carries an enormous burden of proof. A key objective for Perseverance's mission on Mars is astrobiology, including the search for signs of ancient microbial life. The rover will characterize the planet's geology and past climate, pave the way for human exploration of the Red Planet, and be the first mission to collect and cache Martian rock and regolith (broken rock and dust). Subsequent NASA missions, in cooperation with ESA (European Space Agency), would send spacecraft to Mars to collect these sealed samples from the surface and return them to Earth for in-depth analysis. The Mars 2020 Perseverance mission is part of NASA's Moon to Mars exploration approach, which includes Artemis missions to the Moon that will help prepare for human exploration of the Red Planet. https://photojournal.jpl.nasa.gov/catalog/PIA24928
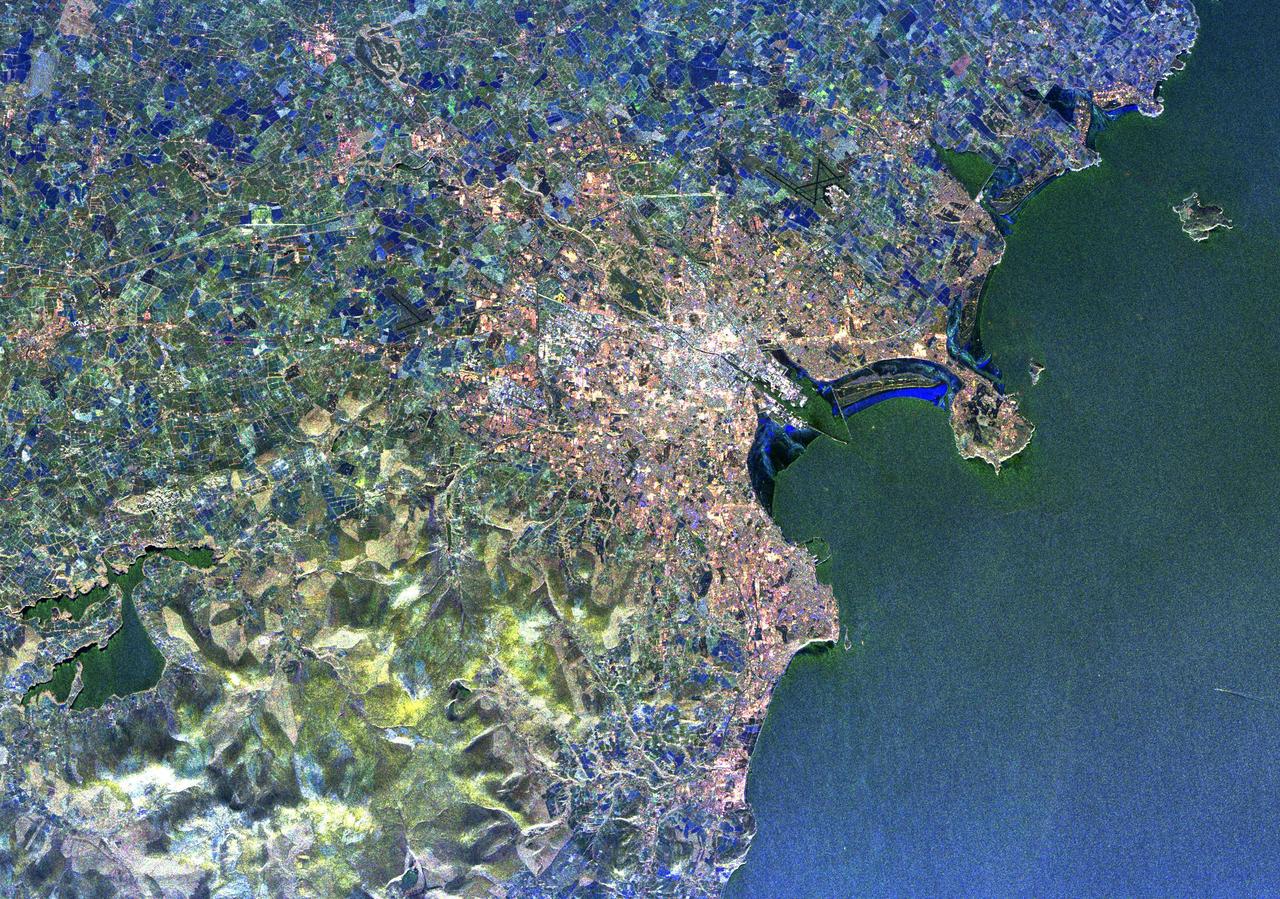
Visualization Date 1994-04-11 This radar image of Dublin, Ireland, shows how the radar distingishes between densely populated urban areas and nearby areas that are relatively unsettled. In the center of the image is the city's natural harbor along the Irish Sea. The pinkish areas in the center are the densely populated parts of the city and the blue/green areas are the suburbs. The two ends of the Dublin Bay are Howth Point, the circular peninsula near the upper right side of the image, and Dun Laoghaire, the point to the south. The small island just north of Howth is called "Ireland's Eye," and the larger island, near the upper right corner of the image is Lambay Island. The yellow/green mountains in the lower left of the image (south) are the Wicklow Mountains. The large lake in the lower left, nestled within these mountains, is the Poulaphouca Reservoir along River Liffey. The River Liffey, the River Dodder and the Tolka River are the three rivers that flow into Dublin. The straight features west of the city are the Grand Canal and the three rivers are the faint lines above and below these structures. The dark X-shaped feature just to the north of the city is the Dublin International Airport. The image was acquired by the Spaceborne Imaging Radar-C/X-band Synthetic Aperture (SIR-C/X-SAR) when it flew aboard the space shuttle Endeavour on April 11, 1994. This area is centered at 53.3 degrees north latitude, 6.2 degrees west longitude. The area shown is approximately 55 kilometers by 42 kilometers (34 miles by 26 miles). The colors are assigned to different frequencies and polarizations of the radar as follows: Red is L-band horizontally transmitted, horizontally received; green is L-band vertically transmitted, vertically received; and blue is C-band vertically transmitted, vertically received. SIR-C/X-SAR, a joint mission of the German, Italian, and the United States space agencies, is part of NASA's Mission to Planet Earth. Credit: NASA/GSFC For more information go to: <a href="http://visibleearth.nasa.gov/view_rec.php?id=467" rel="nofollow">visibleearth.nasa.gov/view_rec.php?id=467</a>
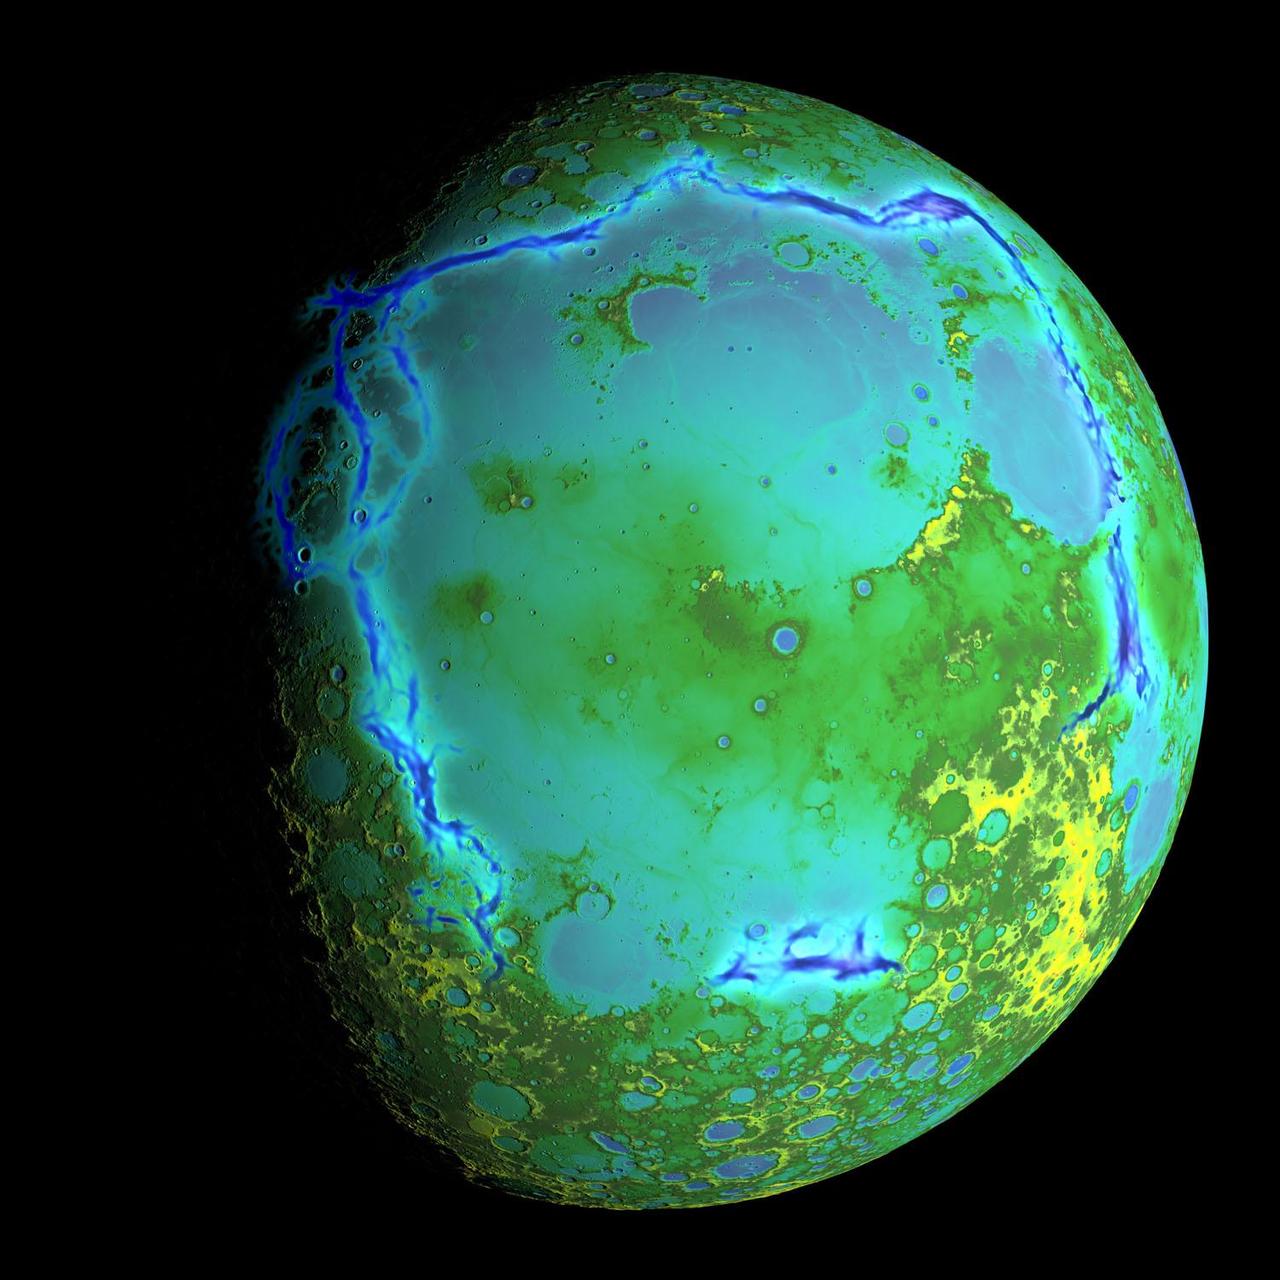
Topography of Earth's moon generated from data collected by the Lunar Orbiter Laser Altimeter, aboard NASA's Lunar Reconnaissance Orbiter, with the gravity anomalies bordering the Procellarum region superimposed in blue. The border structures are shown using gravity gradients calculated with data from NASA's Gravity Recovery and Interior Laboratory (GRAIL) mission. These gravity anomalies are interpreted as ancient lava-flooded rift zones buried beneath the volcanic plains (or maria) on the nearside of the Moon. Launched as GRAIL A and GRAIL B in September 2011, the probes, renamed Ebb and Flow, operated in a nearly circular orbit near the poles of the moon at an altitude of about 34 miles (55 kilometers) until their mission ended in December 2012. The distance between the twin probes changed slightly as they flew over areas of greater and lesser gravity caused by visible features, such as mountains and craters, and by masses hidden beneath the lunar surface. The twin spacecraft flew in a nearly circular orbit until the end of the mission on Dec. 17, 2012, when the probes intentionally were sent into the moon's surface. NASA later named the impact site in honor of late astronaut Sally K. Ride, who was America's first woman in space and a member of the GRAIL mission team. GRAIL's prime and extended science missions generated the highest-resolution gravity field map of any celestial body. The map will provide a better understanding of how Earth and other rocky planets in the solar system formed and evolved. The GRAIL mission was managed by NASA's Jet Propulsion Laboratory (JPL) in Pasadena, California, for NASA's Science Mission Directorate in Washington. The mission was part of the Discovery Program managed at NASA's Marshall Space Flight Center in Huntsville, Alabama. GRAIL was built by Lockheed Martin Space Systems in Denver. For more information about GRAIL, please visit <a href="http://grail.nasa.gov" rel="nofollow">grail.nasa.gov</a>. Credit: NASA/Colorado School of Mines/MIT/GSFC/Scientific Visualization Studio

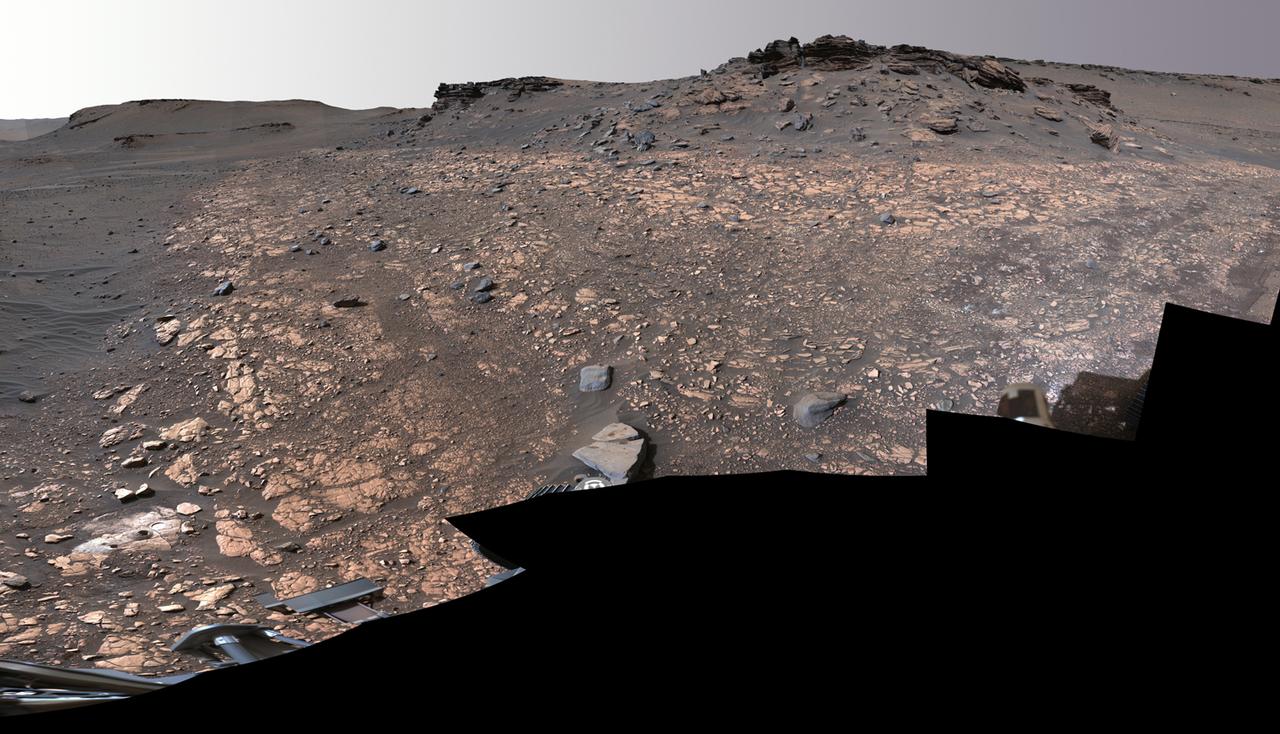
NASA's Perseverance rover puts its robotic arm to work around a rocky outcrop called "Skinner Ridge" in Mars' Jezero Crater. Composed of multiple images, this mosaic shows layered sedimentary rocks in the face of a cliff in the delta, as well as one of the locations where the rover abraded a circular patch to analyze a rock's composition. The delta is an area where, billions of years ago, a river once flowed into a lake in Jezero Crater and deposited rocks and sediments in a fan shape. Scientists consider the delta one of the best places on Mars to search for potential signs of ancient microbial life. The verification of ancient life on the Red Planet carries an enormous burden of proof. The multiple images that compose this mosaic were acquired by Perseverance's Mastcam-Z instrument between June 30 and July 8, 2022 (PDT), the 484th and 492nd Martian days, or sols, of the rover's mission. The color bands of the image have been processed to improve visual contrast and accentuate color differences. In the days after this mosaic was taken, Perseverance also extracted two classroom chalk-size pieces of rock (cylinders about 0.5 inches, or 13 millimeters, in diameter and 2.4 inches, or 60 millimeters, long) from Skinner Ridge and sealed them in ultra-clean sample tubes. A key objective for Perseverance's mission on Mars is astrobiology, including the search for signs of ancient microbial life. The rover will characterize the planet's geology and past climate, pave the way for human exploration of the Red Planet, and be the first mission to collect and cache Martian rock and regolith (broken rock and dust). Subsequent NASA missions, in cooperation with ESA (European Space Agency), would send spacecraft to Mars to collect these sealed samples from the surface and return them to Earth for in-depth analysis. The Mars 2020 Perseverance mission is part of NASA's Moon to Mars exploration approach, which includes Artemis missions to the Moon that will help prepare for human exploration of the Red Planet. https://photojournal.jpl.nasa.gov/catalog/PIA24925
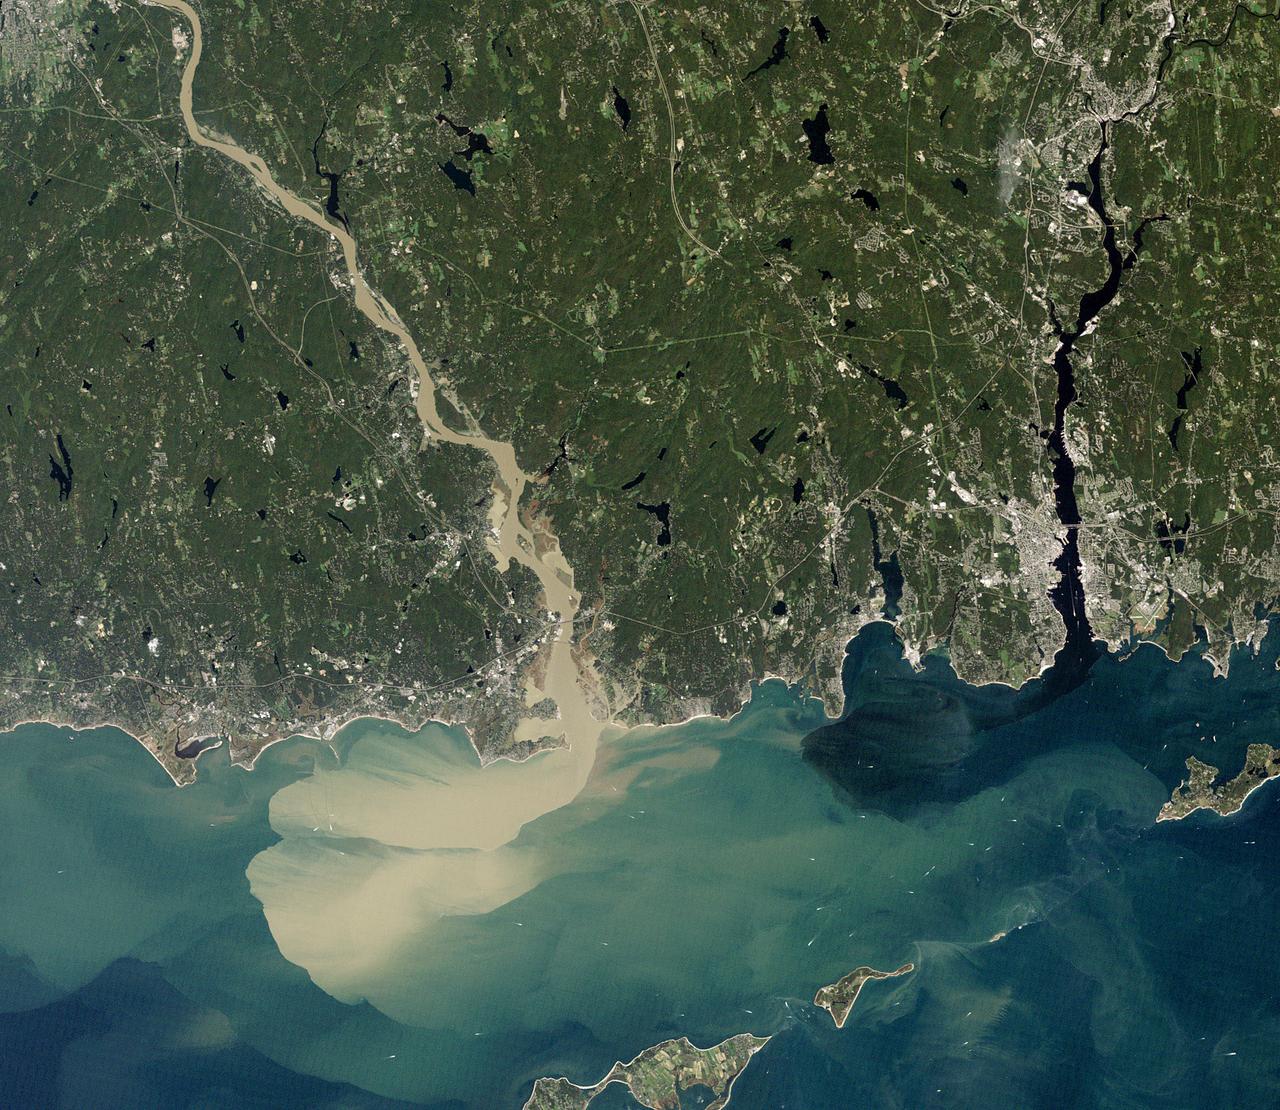
NASA image acquired September 2, 2011 To download the full high res go to: <a href="http://earthobservatory.nasa.gov/IOTD/view.php?id=52059" rel="nofollow">earthobservatory.nasa.gov/IOTD/view.php?id=52059</a> Nearly a week after Hurricane Irene drenched New England with rainfall in late August 2011, the Connecticut River was spewing muddy sediment into Long Island Sound and wrecking the region's farmland just before harvest. The Thematic Mapper on the Landsat 5 satellite acquired this true-color satellite image on September 2, 2011. With its headwaters near the Canadian border, the Connecticut River drains nearly 11,000 square miles (28,500 square kilometers) and receives water from at least 33 tributaries in Vermont, New Hampshire, Massachusetts, and Connecticut. The 410-mile river—New England's longest—enters Long Island Sound near Old Lyme, Connecticut, and is estimated to provide 70 percent of the fresh water entering the Sound. When Irene blew through the region on August 27-28, substantial portions of the Connecticut River watershed received more than 6 to 8 inches (15-20 centimeters) of rainfall, and several locations received more than 10 inches (25 centimeters). Whole towns were cut off from overland transportation—particularly upstream in Vermont, which suffered its worst flooding in 80 years. Thousands of people saw their homes flooded, if not washed off their foundations, at a time of year when rivers are usually at their lowest. Preliminary estimates of river flow at Thompsonville, Connecticut, (not shown in this image) reached 128,000 cubic feet per second (cfs) on August 30, nearly 64 times the usual flow (2,000 cfs) for early fall and the highest flow rate since May 1984. At the mouth of the river—where flow is tidal, and therefore not gauged—the peak water height reached 6.9 feet (2.1 meters) above sea level, almost a foot higher than at any time in the past 10 years. According to Suzanne O'Connell, an environmental scientist working along the Connecticut River at Wesleyan University, the torrent of water coursing through New England picked up silt and clay from the river valleys, giving it the tan color shown in the image above. At Essex, Connecticut, the turbidity (muddiness) of the water was 50 times higher than pre-Irene values. To the east, the Thames River appears to be carrying very little sediment at all on September 2. According to O'Connell, the Thames "drains glaciated terrain, so fine sediment was removed long ago." Most of the land surface in the Thames basin is "just bedrock, till, and glacial erratics." Unlike the Connecticut, areas within the Thames watershed only received 2 to 4 inches of rain in most locations. The flooding that occurred in the aftermath of Hurricane Irene inundated farmland in Massachusetts and Connecticut just before harvest time, the Associated Press noted. Crops were drowned under inches to feet of water. The substantial amounts of soil, sediment, and water deposited on land during the flood could also pose trouble for farmers in coming seasons. "It's notable that whole segments of river bank are just gone," said Andrew Fisk of the Connecticut River Watershed Council. "That's not just loss of sediment. That's land disappearing down river." <b>NASA Earth Observatory image by Robert Simmon, using Landsat 5 data from the U.S. Geological Survey Global Visualization Viewer. Caption by Michael Carlowicz, with interpretation help from Suzanne O'Connell, Wesleyan University, and Andrew Fisk, Connecticut River Watershed Council.</b> Instrument: Landsat 5 - TM Credit: <b><a href="http://www.earthobservatory.nasa.gov/" rel="nofollow"> NASA Earth Observatory</a></b> <b><a href="http://www.nasa.gov/centers/goddard/home/index.html" rel="nofollow">NASA Goddard Space Flight Center</a></b> enables NASA’s mission through four scientific endeavors: Earth Science, Heliophysics, Solar System Exploration, and Astrophysics. Goddard plays a leading role in NASA’s accomplishments by contributing compelling scientific knowledge to advance the Agency’s mission. <b>Follow us on <a href="http://twitter.com/NASA_GoddardPix" rel="nofollow">Twitter</a></b> <b>Like us on <a href="http://www.facebook.com/pages/Greenbelt-MD/NASA-Goddard/395013845897?ref=tsd" rel="nofollow">Facebook</a></b> <b>Find us on <a href="http://web.stagram.com/n/nasagoddard/?vm=grid" rel="nofollow">Instagram</a></b>
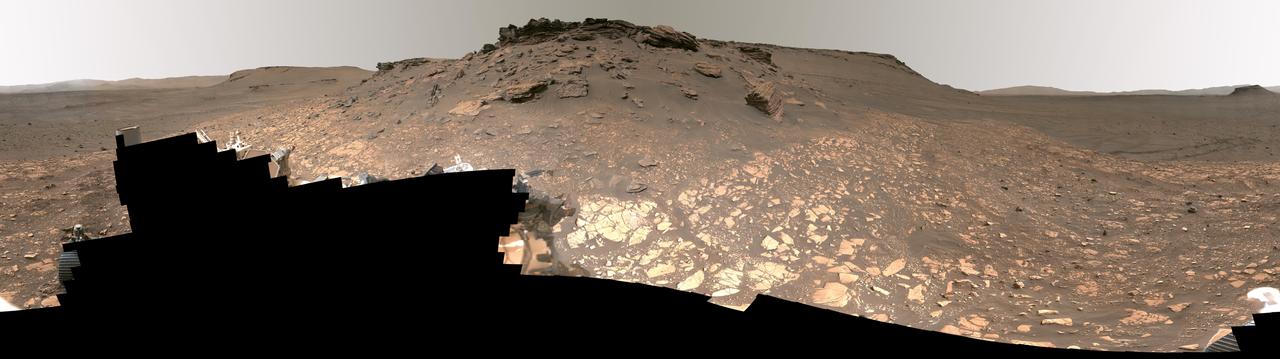
Intriguing Martian rocks surround NASA's Perseverance rover in this panorama showing an ancient river delta, made from images captured by the Mastcam-Z camera system. This 2.5-billion-pixel mosaic, which combines 1,118 individual frames, is the most detailed landscape panorama ever returned from Mars. The delta in Mars' Jezero Crater is an area where scientists surmise that, billions of years ago, a river once flowed into a lake and deposited rocks and sediments in a fan shape. Deltas are believed to be the best places on Mars to search for potential signs of ancient microbial life. Arrival at the Jezero delta has been a primary goal of the Perseverance mission since the rover landed in the crater in February 2021. The panorama shows sedimentary rocks of great interest to scientists. The Perseverance rover has abraded the surface of several rocks in this area and acquired compositional information. It also has collected rock samples that the Mars Sample Return campaign could bring back to Earth in the future, enabling detailed laboratory studies as part of a search for signs of ancient life. In this enhanced-color view, the color bands of the image have been processed to improve visual contrast and accentuate color differences. Figure A shows the same panorama using a natural-color view. A guided tour of the panorama is available at https://images.nasa.gov/details-JPL-20220906-Perseverance_Explores_Jezero_Crater_Delta_UHD. These images were taken in 2022 on June 12, 13, 16, 17, and 20 (the 466th, 467th, 470th, 471st, and 474th Martian days, or sols, of Perseverance's mission). A key objective for Perseverance's mission on Mars is astrobiology, including the search for signs of ancient microbial life. The rover will characterize the planet's geology and past climate, pave the way for human exploration of the Red Planet, and be the first mission to collect and cache Martian rock and regolith (broken rock and dust). Subsequent NASA missions, in cooperation with ESA (European Space Agency), would send spacecraft to Mars to collect these sealed samples from the surface and return them to Earth for in-depth analysis. The Mars 2020 Perseverance mission is part of NASA's Moon to Mars exploration approach, which includes Artemis missions to the Moon that will help prepare for human exploration of the Red Planet. https://photojournal.jpl.nasa.gov/catalog/PIA24921
This image shows two locations in Mars's Jezero Crater where NASA's Perseverance rover collected rock samples for possible return to Earth in the future: "Wildcat Ridge" (lower left) and "Skinner Ridge" (upper right). These two outcrops are within about 70 feet (20 meters) of each other. The rover cored two cylinders of rock the size of classroom chalk (about 0.5 inches, or 13 millimeters, in diameter and 2.4 inches, or 60 millimeters, long) from each location. The two sites are in the delta, a fan-shaped area where, billions of years ago, a river once flowed into a lake in Jezero Crater and deposited rocks and sediment. Scientists consider the sedimentary rocks preserved in the delta one of the best places on Mars to search for potential signs of ancient microbial life. The verification of ancient life on Mars carries an enormous burden of proof. A light-colored, circular patch of abraded rock can be seen in the lower-left corner of the image, next to areas where Perseverance used its drill to extract the rock-core samples. The abrasion patch to the right of one of the holes is about 2 inches (5 centimeters) in diameter. The samples taken from these areas were sealed inside ultra-clean sample tubes, which are currently stored inside Perseverance. The multiple images that make up this mosaic were acquired by Perseverance's Mastcam-Z instrument on Aug. 4, 2022, the 518st Martian day, or sol, of the rover's mission. The color bands of the image have been processed to improve visual contrast and accentuate color differences. A key objective for Perseverance's mission on Mars is astrobiology, including the search for signs of ancient microbial life. The rover will characterize the planet's geology and past climate, pave the way for human exploration of the Red Planet, and be the first mission to collect and cache Martian rock and regolith (broken rock and dust). Subsequent NASA missions, in cooperation with ESA (European Space Agency), would send spacecraft to Mars to collect these sealed samples from the surface and return them to Earth for in-depth analysis. The Mars 2020 Perseverance mission is part of NASA's Moon to Mars exploration approach, which includes Artemis missions to the Moon that will help prepare for human exploration of the Red Planet. https://photojournal.jpl.nasa.gov/catalog/PIA24924

The Visible Infrared Imaging Radiometer Suite (VIIRS) on the Suomi NPP satellite captured this view of extensive sea-ice fracturing off the northern coast of Alaska. The event began in late-January and spread west toward Banks Island throughout February and March 2013. Visualizations of the Arctic often give the impression that the ice cap is a continuous sheet of stationary, floating ice. In fact, it is a collection of smaller pieces that constantly shift, crack, and grind against one another as they are jostled by winds and ocean currents. Especially during the summer—but even during the height of winter—cracks—or leads—open up between pieces of ice. That was what was happening on the left side of the animation (seen here: <a href="http://bit.ly/10kE7sh" rel="nofollow">bit.ly/10kE7sh</a>) in late January. A high-pressure weather system was parked over the region, producing warmer temperatures and winds that flowed in a southwesterly direction. That fueled the Beaufort Gyre, a wind-driven ocean current that flows clockwise. The gyre was the key force pulling pieces of ice west past Point Barrow, the northern nub of Alaska that protrudes into the Beaufort Sea. “A fracturing event in this area is not unusual because the Beaufort Gyre tends to push ice away from Banks Island and the Canadian Archipelago,” explained Walt Meier of the National Snow & Ice Data Center (NSIDC). “Point Barrow can act like a ‘pin point’ where the ice catches and fractures to the north and east.” In February, however, a series of storms passing over central Alaska exacerbated the fracturing. Strong westerly winds prompted several large pieces of ice to break away in an arc-shaped wave that moved progressively east. By the end of February, large pieces of ice had fractured all the way to the western coast of Banks Island, a distance of about 1,000 kilometers (600 miles). The data used to create the animation came from the longwave infrared (thermal) portion of the electromagnetic spectrum, so the animation illustrates how much heat the surface was emitting as VIIRS surveyed the area. Cooler areas (sea ice) appear white, while warmer areas (open water) are dark. The light gray plume near the cracks is warmer, moister air escaping from the ocean and blowing downwind. Clouds do not show up well in the VIIRS thermal band, so the storms that fueled the fracturing are not readily visible. While fracturing events are common, few events sprawl across such a large area or produce cracks as long and wide as those seen here. The age of the sea ice in this area was one of the key reasons this event became so widespread. “The region is covered almost completely by seasonal or first-year ice—ice that has formed since last September,” said Meier. “This ice is thinner and weaker than the older, multi-year ice, so it responds more readily to winds and is more easily broken up.” NASA Earth Observatory images by Jesse Allen using VIIRS day-night band data from the Suomi National Polar-orbiting Partnership. Suomi NPP is the result of a partnership between NASA, the National Oceanic and Atmospheric Administration, and the Department of Defense. Caption by Adam Voiland. Instrument: Suomi NPP - VIIRS For more info go to: <a href="http://earthobservatory.nasa.gov/IOTD/view.php?id=80752" rel="nofollow">earthobservatory.nasa.gov/IOTD/view.php?id=80752</a> Credit: <b><a href="http://www.earthobservatory.nasa.gov/" rel="nofollow"> NASA Earth Observatory</a></b> <b><a href="http://www.nasa.gov/audience/formedia/features/MP_Photo_Guidelines.html" rel="nofollow">NASA image use policy.</a></b> <b><a href="http://www.nasa.gov/centers/goddard/home/index.html" rel="nofollow">NASA Goddard Space Flight Center</a></b> enables NASA’s mission through four scientific endeavors: Earth Science, Heliophysics, Solar System Exploration, and Astrophysics. Goddard plays a leading role in NASA’s accomplishments by contributing compelling scientific knowledge to advance the Agency’s mission. <b>Follow us on <a href="http://twitter.com/NASA_GoddardPix" rel="nofollow">Twitter</a></b> <b>Like us on <a href="http://www.facebook.com/pages/Greenbelt-MD/NASA-Goddard/395013845897?ref=tsd" rel="nofollow">Facebook</a></b> <b>Find us on <a href="http://instagram.com/nasagoddard?vm=grid" rel="nofollow">Instagram</a></b>

The Visible Infrared Imaging Radiometer Suite (VIIRS) on the Suomi NPP satellite captured this view of extensive sea-ice fracturing off the northern coast of Alaska. The event began in late-January and spread west toward Banks Island throughout February and March 2013. Visualizations of the Arctic often give the impression that the ice cap is a continuous sheet of stationary, floating ice. In fact, it is a collection of smaller pieces that constantly shift, crack, and grind against one another as they are jostled by winds and ocean currents. Especially during the summer—but even during the height of winter—cracks—or leads—open up between pieces of ice. That was what was happening on the left side of the animation (seen here: <a href="http://bit.ly/10kE7sh" rel="nofollow">bit.ly/10kE7sh</a>) in late January. A high-pressure weather system was parked over the region, producing warmer temperatures and winds that flowed in a southwesterly direction. That fueled the Beaufort Gyre, a wind-driven ocean current that flows clockwise. The gyre was the key force pulling pieces of ice west past Point Barrow, the northern nub of Alaska that protrudes into the Beaufort Sea. “A fracturing event in this area is not unusual because the Beaufort Gyre tends to push ice away from Banks Island and the Canadian Archipelago,” explained Walt Meier of the National Snow & Ice Data Center (NSIDC). “Point Barrow can act like a ‘pin point’ where the ice catches and fractures to the north and east.” In February, however, a series of storms passing over central Alaska exacerbated the fracturing. Strong westerly winds prompted several large pieces of ice to break away in an arc-shaped wave that moved progressively east. By the end of February, large pieces of ice had fractured all the way to the western coast of Banks Island, a distance of about 1,000 kilometers (600 miles). The data used to create the animation came from the longwave infrared (thermal) portion of the electromagnetic spectrum, so the animation illustrates how much heat the surface was emitting as VIIRS surveyed the area. Cooler areas (sea ice) appear white, while warmer areas (open water) are dark. The light gray plume near the cracks is warmer, moister air escaping from the ocean and blowing downwind. Clouds do not show up well in the VIIRS thermal band, so the storms that fueled the fracturing are not readily visible. While fracturing events are common, few events sprawl across such a large area or produce cracks as long and wide as those seen here. The age of the sea ice in this area was one of the key reasons this event became so widespread. “The region is covered almost completely by seasonal or first-year ice—ice that has formed since last September,” said Meier. “This ice is thinner and weaker than the older, multi-year ice, so it responds more readily to winds and is more easily broken up.” NASA Earth Observatory images by Jesse Allen using VIIRS day-night band data from the Suomi National Polar-orbiting Partnership. Suomi NPP is the result of a partnership between NASA, the National Oceanic and Atmospheric Administration, and the Department of Defense. Caption by Adam Voiland. Instrument: Suomi NPP - VIIRS For more info go to: <a href="http://earthobservatory.nasa.gov/IOTD/view.php?id=80752" rel="nofollow">earthobservatory.nasa.gov/IOTD/view.php?id=80752</a> Credit: <b><a href="http://www.earthobservatory.nasa.gov/" rel="nofollow"> NASA Earth Observatory</a></b> <b><a href="http://www.nasa.gov/audience/formedia/features/MP_Photo_Guidelines.html" rel="nofollow">NASA image use policy.</a></b> <b><a href="http://www.nasa.gov/centers/goddard/home/index.html" rel="nofollow">NASA Goddard Space Flight Center</a></b> enables NASA’s mission through four scientific endeavors: Earth Science, Heliophysics, Solar System Exploration, and Astrophysics. Goddard plays a leading role in NASA’s accomplishments by contributing compelling scientific knowledge to advance the Agency’s mission. <b>Follow us on <a href="http://twitter.com/NASA_GoddardPix" rel="nofollow">Twitter</a></b> <b>Like us on <a href="http://www.facebook.com/pages/Greenbelt-MD/NASA-Goddard/395013845897?ref=tsd" rel="nofollow">Facebook</a></b> <b>Find us on <a href="http://instagram.com/nasagoddard?vm=grid" rel="nofollow">Instagram</a></b>

The Visible Infrared Imaging Radiometer Suite (VIIRS) on the Suomi NPP satellite captured this view of extensive sea-ice fracturing off the northern coast of Alaska. The event began in late-January and spread west toward Banks Island throughout February and March 2013. Visualizations of the Arctic often give the impression that the ice cap is a continuous sheet of stationary, floating ice. In fact, it is a collection of smaller pieces that constantly shift, crack, and grind against one another as they are jostled by winds and ocean currents. Especially during the summer—but even during the height of winter—cracks—or leads—open up between pieces of ice. That was what was happening on the left side of the animation (seen here: <a href="http://bit.ly/10kE7sh" rel="nofollow">bit.ly/10kE7sh</a>) in late January. A high-pressure weather system was parked over the region, producing warmer temperatures and winds that flowed in a southwesterly direction. That fueled the Beaufort Gyre, a wind-driven ocean current that flows clockwise. The gyre was the key force pulling pieces of ice west past Point Barrow, the northern nub of Alaska that protrudes into the Beaufort Sea. “A fracturing event in this area is not unusual because the Beaufort Gyre tends to push ice away from Banks Island and the Canadian Archipelago,” explained Walt Meier of the National Snow & Ice Data Center (NSIDC). “Point Barrow can act like a ‘pin point’ where the ice catches and fractures to the north and east.” In February, however, a series of storms passing over central Alaska exacerbated the fracturing. Strong westerly winds prompted several large pieces of ice to break away in an arc-shaped wave that moved progressively east. By the end of February, large pieces of ice had fractured all the way to the western coast of Banks Island, a distance of about 1,000 kilometers (600 miles). The data used to create the animation came from the longwave infrared (thermal) portion of the electromagnetic spectrum, so the animation illustrates how much heat the surface was emitting as VIIRS surveyed the area. Cooler areas (sea ice) appear white, while warmer areas (open water) are dark. The light gray plume near the cracks is warmer, moister air escaping from the ocean and blowing downwind. Clouds do not show up well in the VIIRS thermal band, so the storms that fueled the fracturing are not readily visible. While fracturing events are common, few events sprawl across such a large area or produce cracks as long and wide as those seen here. The age of the sea ice in this area was one of the key reasons this event became so widespread. “The region is covered almost completely by seasonal or first-year ice—ice that has formed since last September,” said Meier. “This ice is thinner and weaker than the older, multi-year ice, so it responds more readily to winds and is more easily broken up.” NASA Earth Observatory images by Jesse Allen using VIIRS day-night band data from the Suomi National Polar-orbiting Partnership. Suomi NPP is the result of a partnership between NASA, the National Oceanic and Atmospheric Administration, and the Department of Defense. Caption by Adam Voiland. Instrument: Suomi NPP - VIIRS For more info go to: <a href="http://earthobservatory.nasa.gov/IOTD/view.php?id=80752" rel="nofollow">earthobservatory.nasa.gov/IOTD/view.php?id=80752</a> Credit: <b><a href="http://www.earthobservatory.nasa.gov/" rel="nofollow"> NASA Earth Observatory</a></b> <b><a href="http://www.nasa.gov/audience/formedia/features/MP_Photo_Guidelines.html" rel="nofollow">NASA image use policy.</a></b> <b><a href="http://www.nasa.gov/centers/goddard/home/index.html" rel="nofollow">NASA Goddard Space Flight Center</a></b> enables NASA’s mission through four scientific endeavors: Earth Science, Heliophysics, Solar System Exploration, and Astrophysics. Goddard plays a leading role in NASA’s accomplishments by contributing compelling scientific knowledge to advance the Agency’s mission. <b>Follow us on <a href="http://twitter.com/NASA_GoddardPix" rel="nofollow">Twitter</a></b> <b>Like us on <a href="http://www.facebook.com/pages/Greenbelt-MD/NASA-Goddard/395013845897?ref=tsd" rel="nofollow">Facebook</a></b> <b>Find us on <a href="http://instagram.com/nasagoddard?vm=grid" rel="nofollow">Instagram</a></b>
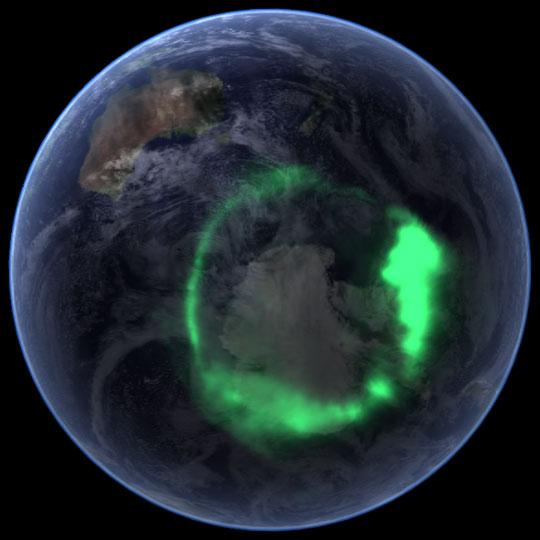
NASA file image acquired September 11, 2005 <b>To view a video of this event go here: <a href="http://www.flickr.com/photos/gsfc/6257608714">www.flickr.com/photos/gsfc/6257608714</a></b> From space, the aurora is a crown of light that circles each of Earth’s poles. The IMAGE satellite captured this view of the aurora australis (southern lights) on September 11, 2005, four days after a record-setting solar flare sent plasma—an ionized gas of protons and electrons—flying towards the Earth. The ring of light that the solar storm generated over Antarctica glows green in the ultraviolet part of the spectrum, shown in this image. The IMAGE observations of the aurora are overlaid onto NASA’s satellite-based Blue Marble image. From the Earth’s surface, the ring would appear as a curtain of light shimmering across the night sky. Like all solar storms, the September storm distorted the shape of the magnetic field that surrounds the Earth. Without buffeting from the solar wind (charged particles like protons and electrons that are ejected from the Sun), the Earth’s magnetic field would look something like a plump doughnut, with the North and South poles forming the slender hole in the center. In reality, the nearly constant solar winds flatten the space side of the “doughnut” into a long tail. The amount of distortion changes when solar storms, such as the flare on September 7, send stronger winds towards the Earth. Changes to the magnetic field release fast-moving particles, which flow with charged particles from the Sun towards the center of the “doughnut” at the Earth’s poles. As the particles sink into the atmosphere, they collide with oxygen and nitrogen, lighting the sky with Nature’s version of neon lights, the aurora. Though scientists knew that the aurora were caused by charged particles from the Sun and their interaction with the Earth’s magnetic field, they had no way to measure the interaction until NASA launched the Imager for Magnetopause-to-Aurora Global Exploration (IMAGE) satellite in 2000. The satellite’s mission was to collect data that would allow scientists to study the structure and dynamics of the Earth’s magnetic field for the first time. Designed to operate for two years, IMAGE sent its last data to Earth in December 2005 after a highly successful five-year mission. Since 2000, IMAGE has provided insight into how the Earth’s powerful magnetic field protects the planet from solar winds. Without the shield the magnetic field provides, the upper atmosphere would evaporate into space under the influence of solar winds. IMAGE has shown scientists what sort of changes the magnetic field undertakes as it diverts solar winds from the Earth. For a summary of the discoveries that IMAGE has made possible, see IMAGE Discovers. Instrument: IMAGE Credit: <a href="http://svs.gsfc.nasa.gov/index.html" rel="nofollow">NASA/Goddard Space Flight Center Scientific Visualization Studio</a> <b><a href="http://www.nasa.gov/audience/formedia/features/MP_Photo_Guidelines.html" rel="nofollow">NASA image use policy.</a></b> <b><a href="http://www.nasa.gov/centers/goddard/home/index.html" rel="nofollow">NASA Goddard Space Flight Center</a></b> enables NASA’s mission through four scientific endeavors: Earth Science, Heliophysics, Solar System Exploration, and Astrophysics. Goddard plays a leading role in NASA’s accomplishments by contributing compelling scientific knowledge to advance the Agency’s mission. <b>Follow us on <a href="http://twitter.com/NASAGoddardPix" rel="nofollow">Twitter</a></b> <b>Like us on <a href="http://www.facebook.com/pages/Greenbelt-MD/NASA-Goddard/395013845897?ref=tsd" rel="nofollow">Facebook</a></b> <b>Find us on <a href="http://instagrid.me/nasagoddard/?vm=grid" rel="nofollow">Instagram</a></b>
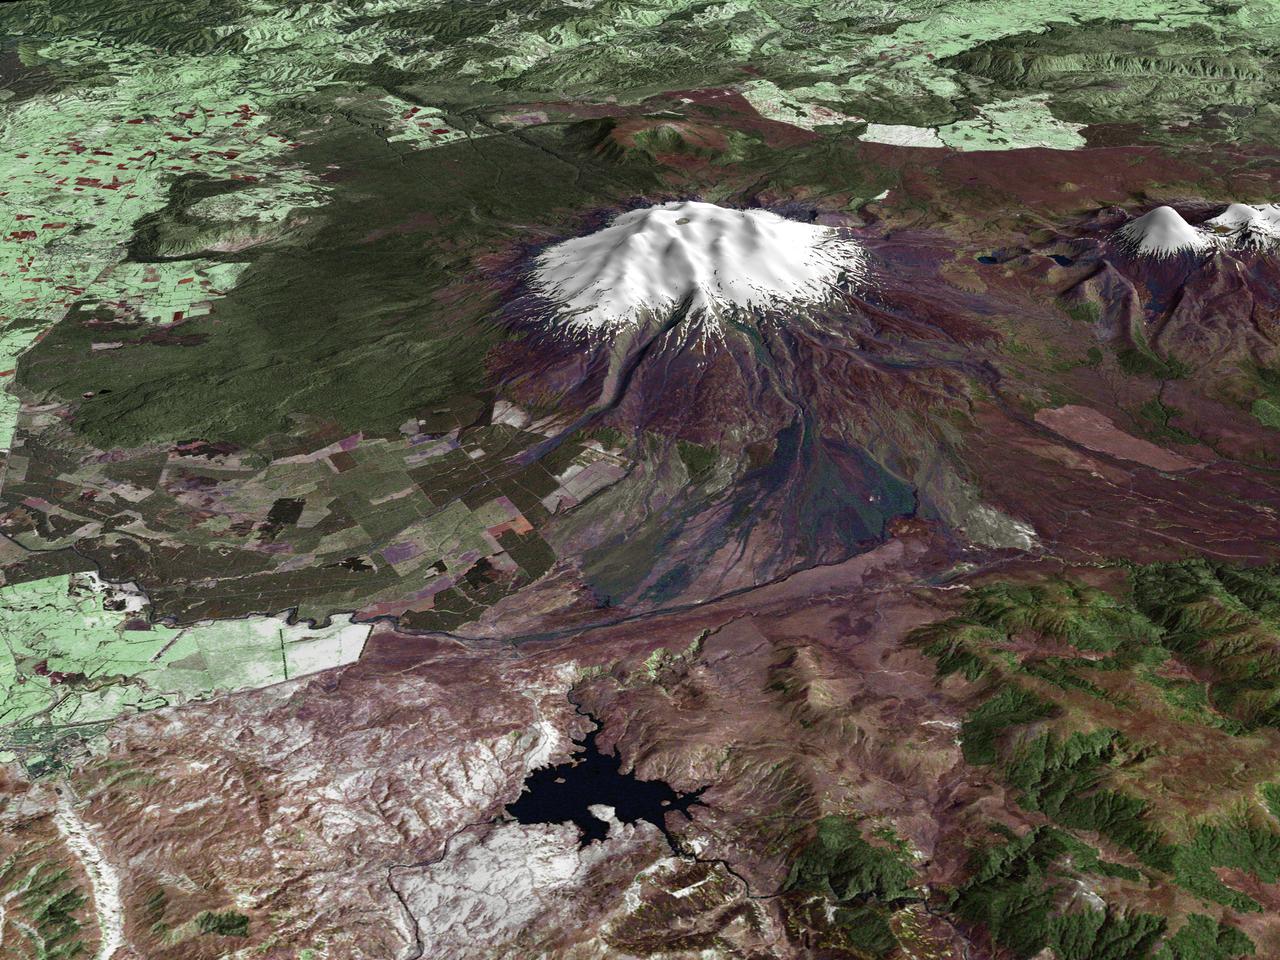
All around the world, people live in places where the threat of natural disaster is high. On the North Island of New Zealand, the Mount Ruapehu volcano is just such a threat. A towering, active stratovolcano (the classic cone-shaped volcano), snow-capped Ruapehu Volcano is pictured in this enhanced-color image. The image is made from topography data collected by the Shuttle Radar Topography Mission aboard the Space Shuttle Endeavour, launched on February 11, 2000, and imagery collected by the Landsat satellite on October 23, 2002. Ruapehu is one of New Zealand’s most active volcanoes, with ten eruptions since 1861. The eruptions aren’t the only threat from the volcano, however. Among the most serious threats is a volcanic mudflow called a lahar. In between eruptions, a lake forms in the volcano’s caldera from melting snow. If a previous eruption has deposited a dam of ash, rocks and mud in the lake’s natural overflow point, then the lake becomes dangerously full, held back only by the temporary dam. In this scene, the lake is nestled among the ridges at the top of the volcano. Eventually, the dam gives way and a massive flow of mud and debris churns down the mountain toward farmland and towns below. Scientists estimate that Ruapehu has experienced 60 lahars in the last 150 years. A devastating lahar in 1953 killed more than 150 people, who died when a passenger train plunged into a ravine when a railroad bridge was taken out by the lahar. The flank of the volcano below the lake is deeply carved by the path of previous lahars; the gouge can be seen just left of image center. Currently scientists in the region are predicting that the lake will overflow in a lahar sometime in the next year. There is great controversy about how to deal with the threat. News reports from the region indicate that the government is planning to invest in a high-tech warning system that will alert those who might be affected well in advance of any catastrophic release. Others feel that the government should combat the threat through engineering at the top of the mountain, for example, by undertaking a controlled release of the lake. Credit Landsat data provided courtesy of the University of Maryland Global Land Cover Facility Landsat processing by Laura Rocchio, Landsat Project Science Office SRTM 3-arcsecond elevation data courtesy of SRTM Team NASA/JPL/NIMA Visualization created by Earth Observatory staff. <b><a href="http://www.nasa.gov/centers/goddard/home/index.html" rel="nofollow">NASA Goddard Space Flight Center</a></b> enables NASA’s mission through four scientific endeavors: Earth Science, Heliophysics, Solar System Exploration, and Astrophysics. Goddard plays a leading role in NASA’s accomplishments by contributing compelling scientific knowledge to advance the Agency’s mission. <b>Follow us on <a href="http://twitter.com/NASA_GoddardPix" rel="nofollow">Twitter</a></b> <b>Join us on <a href="http://www.facebook.com/pages/Greenbelt-MD/NASA-Goddard/395013845897?ref=tsd" rel="nofollow">Facebook</a></b>