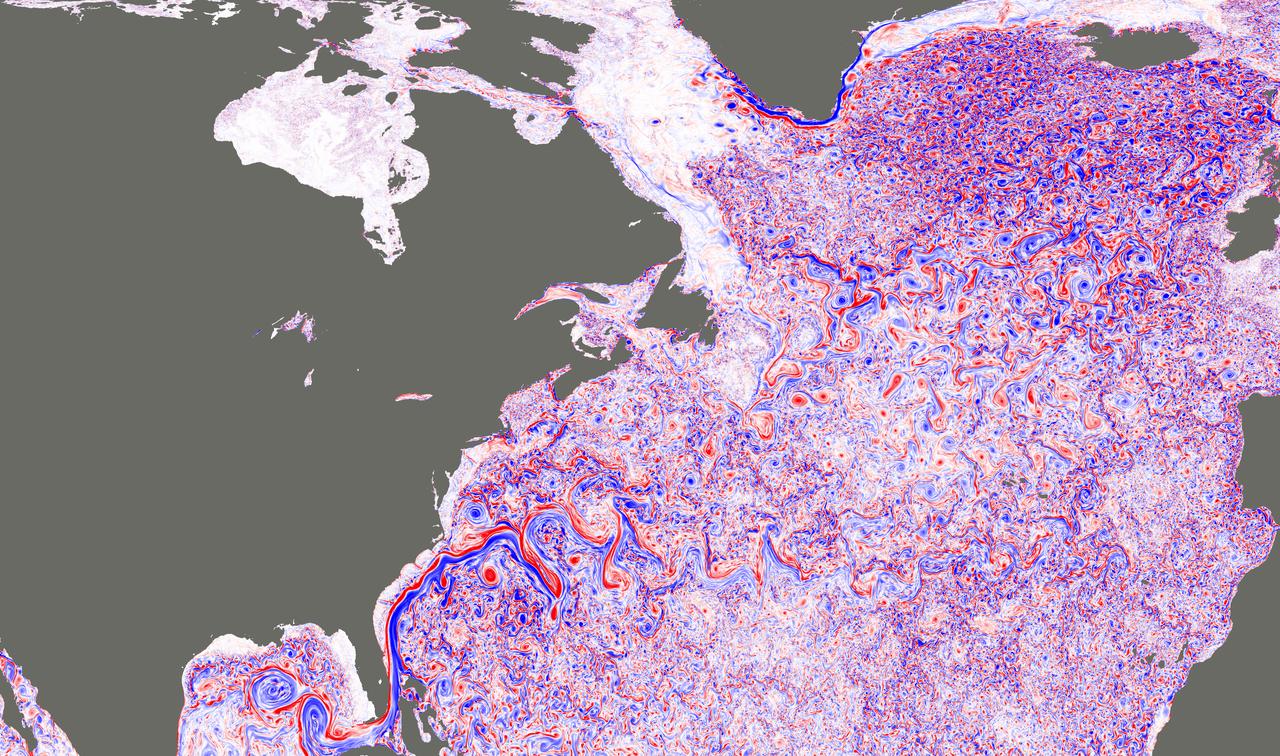
This image shows a simulated snapshot of ocean turbulence in the North Atlantic Ocean in March 2012, from a groundbreaking super-high-resolution global ocean simulation (approximately 1.2 miles, or 2 kilometers, horizontal resolution) developed at JPL (http://wwwcvs.mitgcm.org/viewvc/MITgcm/MITgcm_contrib/llc_hires/llc_4320/). The colors represent the magnitude of surface relative vorticity, a measure of the spin of fluid parcels. The image emphasizes fast-rotating, small-scale (defined here as 6.2 to 31-mile, or 10 to 50 kilometer, range) turbulence, especially during the winter. High levels of relative vorticity caused by small-scale turbulence are believed to strongly transport heat and carbon vertically in the ocean. The image appears in a study (Su et al. 2018), entitled "Ocean submesoscales as a key component of the global heat budget," published recently in Nature Communications. The study suggests that upper-ocean small-scale turbulence transports heat upward in the ocean at a level five times larger than larger-scale heat transport by ocean eddies, significantly affecting the exchange of heat between the ocean interior and atmosphere. Such interactions have a crucial impact on the Earth's climate. A movie is available at https://photojournal.jpl.nasa.gov/catalog/PIA22256
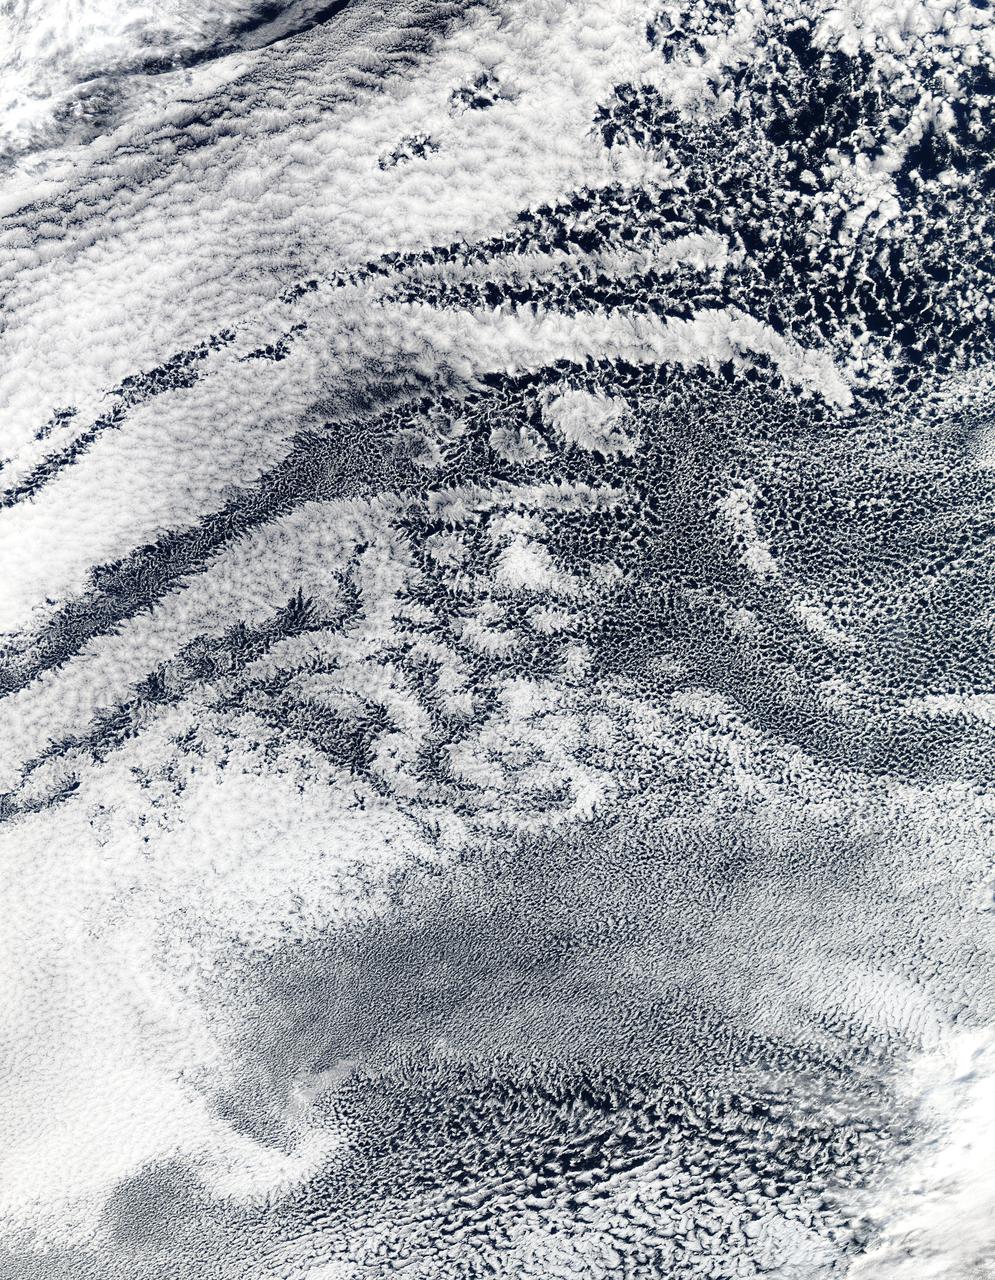
2010/107 - 04/17 at 21 :05 UTC. Open-cell and closed-cell clouds off Peru, Pacific Ocean Resembling a frosted window on a cold winter's day, this lacy pattern of marine clouds was captured off the coast of Peru in the Pacific Ocean by the MODIS on the Aqua satellite on April 19, 2010. The image reveals both open- and closed-cell cumulus cloud patterns. These cells, or parcels of air, often occur in roughly hexagonal arrays in a layer of fluid (the atmosphere often behaves like a fluid) that begins to "boil," or convect, due to heating at the base or cooling at the top of the layer. In "closed" cells warm air is rising in the center, and sinking around the edges, so clouds appear in cell centers, but evaporate around cell edges. This produces cloud formations like those that dominate the lower left. The reverse flow can also occur: air can sink in the center of the cell and rise at the edge. This process is called "open cell" convection, and clouds form at cell edges around open centers, which creates a lacy, hollow-looking pattern like the clouds in the upper right. Closed and open cell convection represent two stable atmospheric configurations — two sides of the convection coin. But what determines which path the "boiling" atmosphere will take? Apparently the process is highly chaotic, and there appears to be no way to predict whether convection will result in open or closed cells. Indeed, the atmosphere may sometimes flip between one mode and another in no predictable pattern. Satellite: Aqua NASA/GSFC/Jeff Schmaltz/MODIS Land Rapid Response Team To learn more about MODIS go to: <a href="http://rapidfire.sci.gsfc.nasa.gov/gallery/?latest" rel="nofollow">rapidfire.sci.gsfc.nasa.gov/gallery/?latest</a> <b><a href="http://www.nasa.gov/centers/goddard/home/index.html" rel="nofollow">NASA Goddard Space Flight Center</a></b> is home to the nation's largest organization of combined scientists, engineers and technologists that build spacecraft, instruments and new technology to study the Earth, the sun, our solar system, and the universe.
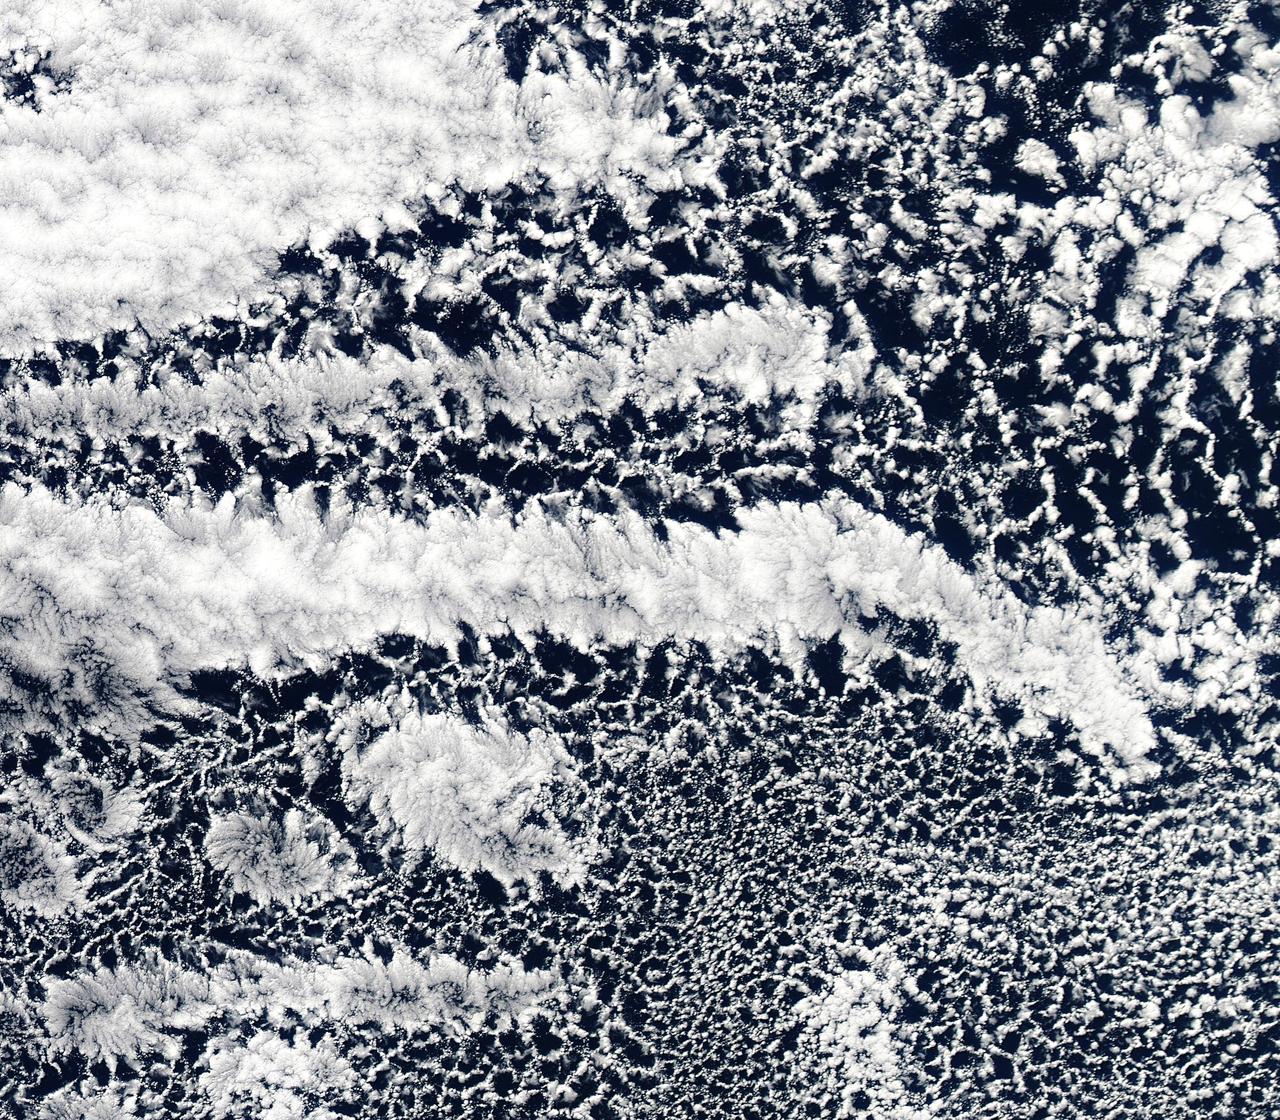
2010/107 - 04/17 at 21 :05 UTC. Open-cell and closed-cell clouds off Peru, Pacific Ocean. To view the full fame of this image to go: <a href="http://www.flickr.com/photos/gsfc/4557497219/">www.flickr.com/photos/gsfc/4557497219/</a> Resembling a frosted window on a cold winter's day, this lacy pattern of marine clouds was captured off the coast of Peru in the Pacific Ocean by the MODIS on the Aqua satellite on April 19, 2010. The image reveals both open- and closed-cell cumulus cloud patterns. These cells, or parcels of air, often occur in roughly hexagonal arrays in a layer of fluid (the atmosphere often behaves like a fluid) that begins to "boil," or convect, due to heating at the base or cooling at the top of the layer. In "closed" cells warm air is rising in the center, and sinking around the edges, so clouds appear in cell centers, but evaporate around cell edges. This produces cloud formations like those that dominate the lower left. The reverse flow can also occur: air can sink in the center of the cell and rise at the edge. This process is called "open cell" convection, and clouds form at cell edges around open centers, which creates a lacy, hollow-looking pattern like the clouds in the upper right. Closed and open cell convection represent two stable atmospheric configurations — two sides of the convection coin. But what determines which path the "boiling" atmosphere will take? Apparently the process is highly chaotic, and there appears to be no way to predict whether convection will result in open or closed cells. Indeed, the atmosphere may sometimes flip between one mode and another in no predictable pattern. Satellite: Aqua NASA/GSFC/Jeff Schmaltz/MODIS Land Rapid Response Team To learn more about MODIS go to: <a href="http://rapidfire.sci.gsfc.nasa.gov/gallery/?latest" rel="nofollow">rapidfire.sci.gsfc.nasa.gov/gallery/?latest</a> <b><a href="http://www.nasa.gov/centers/goddard/home/index.html" rel="nofollow">NASA Goddard Space Flight Center</a></b> is home to the nation's largest organization of combined scientists, engineers and technologists that build spacecraft, instruments and new technology to study the Earth, the sun, our solar system, and the universe.