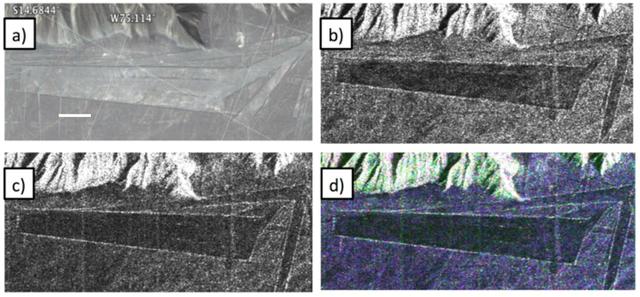
Different visualizations of an area with geometric geoglyphs at the Nasca World Heritage Site in Peru as seen by NASA Uninhabited Aerial Vehicle Synthetic Aperture Radar UAVSAR.
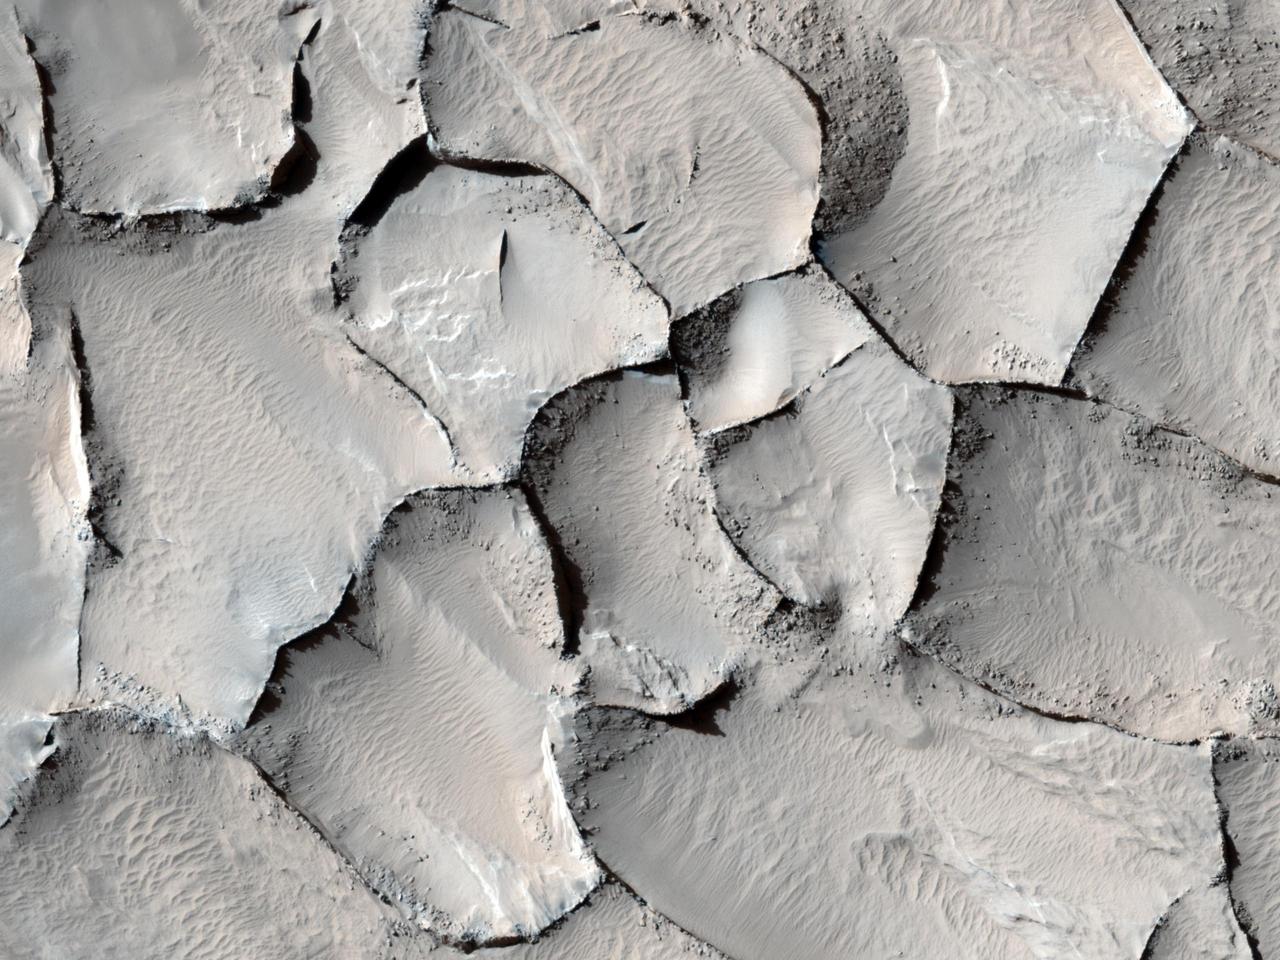
This image captured by NASA Mars Reconnaissance Orbiter from the Gordii Dorsum region of Mars shows a large area covered with polygonal ridges in an almost geometric pattern.

Sunlight washes over the exterior of the integration and testing facility at Goddard Space Flight Center, Greenbelt, Md., Feb 20, 2023. This photo is approved for public release. NASA/Mike Guinto

This is a more recent geometrically improved, color enhanced version of the 360-degree Gallery Pan, the first contiguous, uniform panorama taken by the Imager for Mars IMP over the course of Sols 8, 9, and 10.
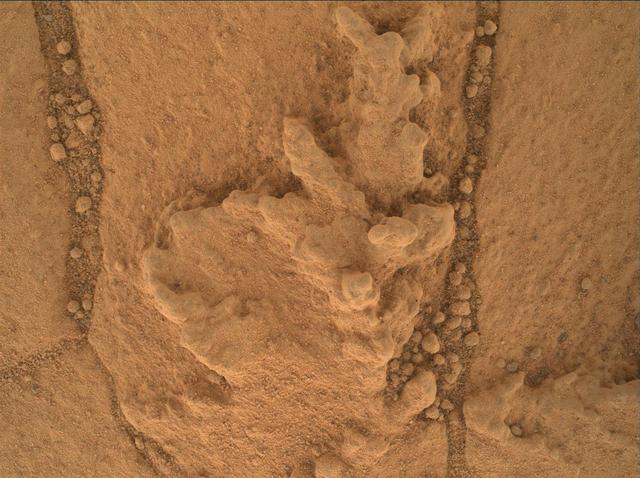
This image from the Mars Hand Lens Imager MAHLI camera on NASA Curiosity Mars rover shows an example of a type of geometrically distinctive feature that researchers are using Curiosity to examine at a mudstone outcrop at the base of Mount Sharp.
NASA's Mars Exploration Rover Opportunity used its navigation camera to take the images combined into this 360-degree view of the rover's surroundings on the 397th martian day, or sol, of its surface mission (March 6, 2005). Opportunity had completed a drive of 124 meters (407 feet) across the rippled flatland of the Meridiani Planum region on the previous sol, but did not drive on this sol. This location is catalogued as Opportunity's site 48. The view is presented here as a vertical projection with geometric and brightness seam correction. http://photojournal.jpl.nasa.gov/catalog/PIA07463
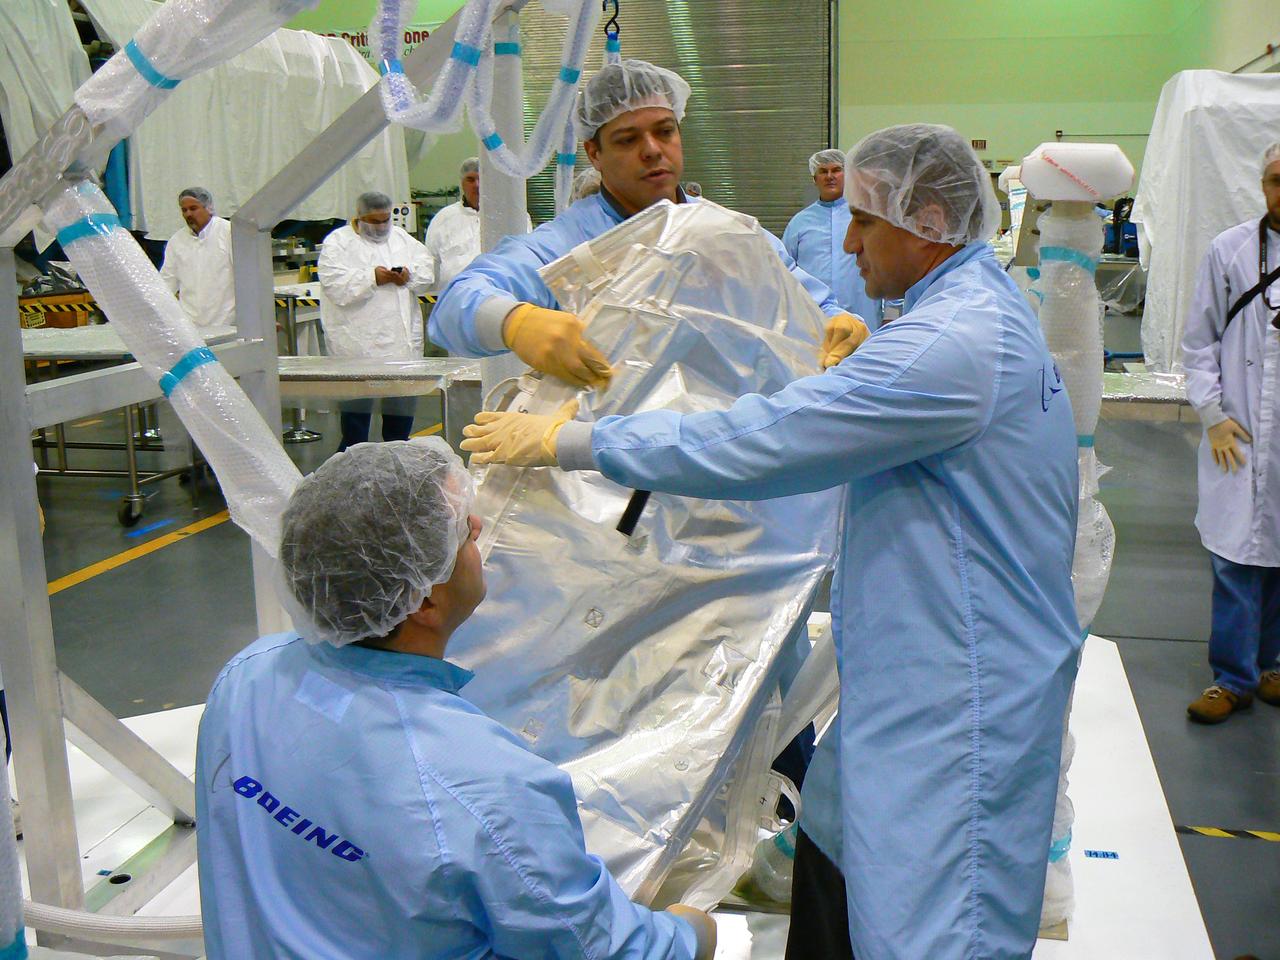
JSC2010-E-014774 (15 Jan. 2010) --- At Marshall Space Center?s building 4708 in the high-bay clean room, astronauts George Zamka (right), STS-130 commander; along with astronauts Nicholas Patrick (foreground) and Robert Behnken, both mission specialists, are seen with a 1G stand that simulates geometrically the interfaces of the ammonia hoses between node 3 and the U.S. lab on orbit. The three crew members are pulling the ammonia blanket from their EVA bag to verify how they would perform the installation procedure on orbit.

North and West-facing facades of the 8x6 Supersonic Wind Tunnel in the early morning light. Caption: In the early morning light, the strong geometric lines behind the soft pine trees caught the eye of a photographer at Glenn Research Center. Behind the commanding facade lies the 8- by 6-Foot Supersonic Wind Tunnel (8x6 SWT), an atmospheric tunnel with perforated stainless steel walls that provide boundary control during transonic operations. It is NASA's only transonic propulsion wind tunnel. http://facilities.grc.nasa.gov/8x6/8x6_quick.html

The New York-based artist team Geraluz, left, and WERC, right, and their son Amaru Alvarez, 5, pose for picture with the mural “To the Moon, and Back” by the artist team that was created as part of the reimagined NASA Art Program, Tuesday, September 24, 2024, at 350 Hudson Street in New York City. The murals use geometrical patterns to invite deeper reflection on the exploration, creativity, and connection with the cosmos. Photo Credit: (NASA/Joel Kowsky)

The inaugural murals for the relaunched NASA Art Program appear side-by-side at 350 Hudson Street, Monday, Sept. 23, 2024, in New York City. The murals, titled “To the Moon, and Back,” were created by New York-based artist team Geraluz and WERC and use geometrical patterns to invite deeper reflection on the exploration, creativity, and connection with the cosmos. Photo Credit: (NASA/Joel Kowsky)

The New York-based artist team Geraluz, left, and WERC, right, and their son Amaru Alvarez, 5, pose for picture with the mural “To the Moon, and Back” by the artist team that was created as part of the reimagined NASA Art Program, Tuesday, September 24, 2024, at 350 Hudson Street in New York City. The murals use geometrical patterns to invite deeper reflection on the exploration, creativity, and connection with the cosmos. Photo Credit: (NASA/Joel Kowsky)

Amaru Alvarez, 5, the son of the artist team Geraluz and WERC and model for the mural, poses for picture with the mural “To the Moon, and Back” by the New York-based artist team that was created as part of the reimagined NASA Art Program, Tuesday, September 24, 2024, at 350 Hudson Street in New York City. The murals use geometrical patterns to invite deeper reflection on the exploration, creativity, and connection with the cosmos. Photo Credit: (NASA/Joel Kowsky)
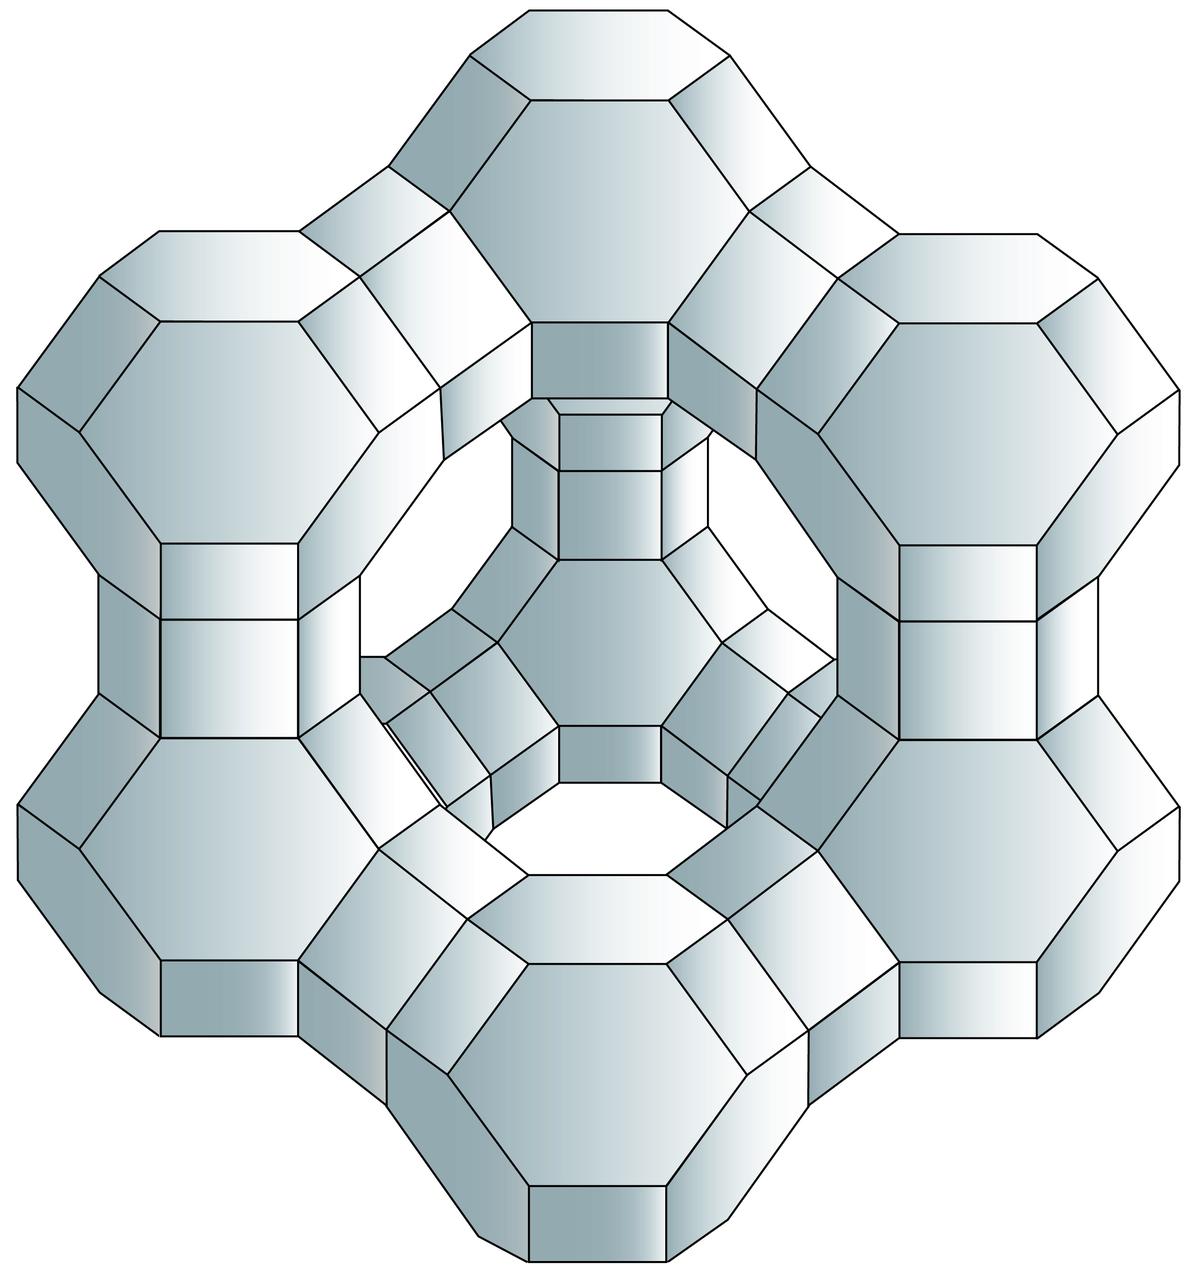
The Center for Advanced Microgravity Materials Processing (CAMMP) in Cambridge, MA, a NASA-sponsored Commercial Space Center, is working to improve zeolite materials for storing hydrogen fuel. CAMMP is also applying zeolites to detergents, optical cables, gas and vapor detection for environmental monitoring and control, and chemical production techniques that significantly reduce by-products that are hazardous to the environment. Depicted here is one of the many here complex geometric shapes which make them highly absorbent. Zeolite experiments have also been conducted aboard the International Space Station

The inaugural murals for the relaunched NASA Art Program appear side-by-side at 350 Hudson Street, Tuesday, Sept. 24, 2024, in New York City. The murals, titled “To the Moon, and Back,” were created by New York-based artist team Geraluz and WERC and use geometrical patterns to invite deeper reflection on the exploration, creativity, and connection with the cosmos. Photo Credit: (NASA/Joel Kowsky)
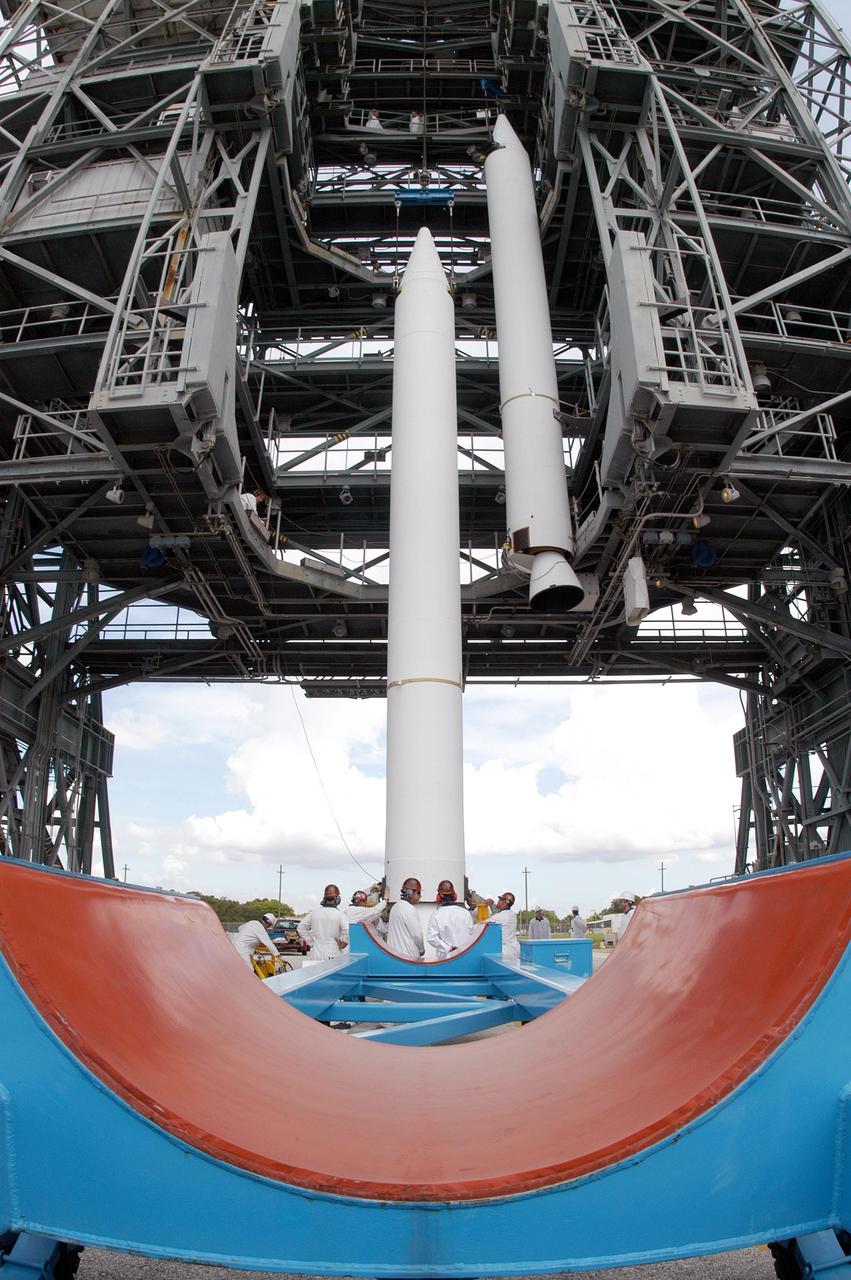
KENNEDY SPACE CENTER, FLA. - Creating a geometric design while viewed from behind its transporter, the second Solid Rocket Booster (SRB), at center, is ready for lifting up the mobile service tower on Pad 17-B, Cape Canaveral Air Force Station. At right in the tower is the first SRB. The SRBs will be mated to the Boeing Delta II Heavy rocket for the Aug. 2 launch of the MESSENGER spacecraft to the planet Mercury. The spacecraft is expected to reach orbit around Mercury in March 2011. MESSENGER was built for NASA by the Johns Hopkins University Applied Physics Laboratory in Laurel, Md.
NASA's Mars Exploration Rover Spirit used its navigation camera to take the images combined into this 360-degree view of the rover's surroundings on Spirit's 409th martian day, or sol (Feb. 26, 2005). Spirit had driven 2 meters (7 feet) on this sol to get in position on "Cumberland Ridge" for looking into "Tennessee Valley" to the east. This location is catalogued as Spirit's Site 108. Rover-wheel tracks from climbing the ridge are visible on the right. The summit of "Husband Hill" is at the center, to the south. This view is presented in a vertical projection with geometric and brightness seam correction. http://photojournal.jpl.nasa.gov/catalog/PIA07410
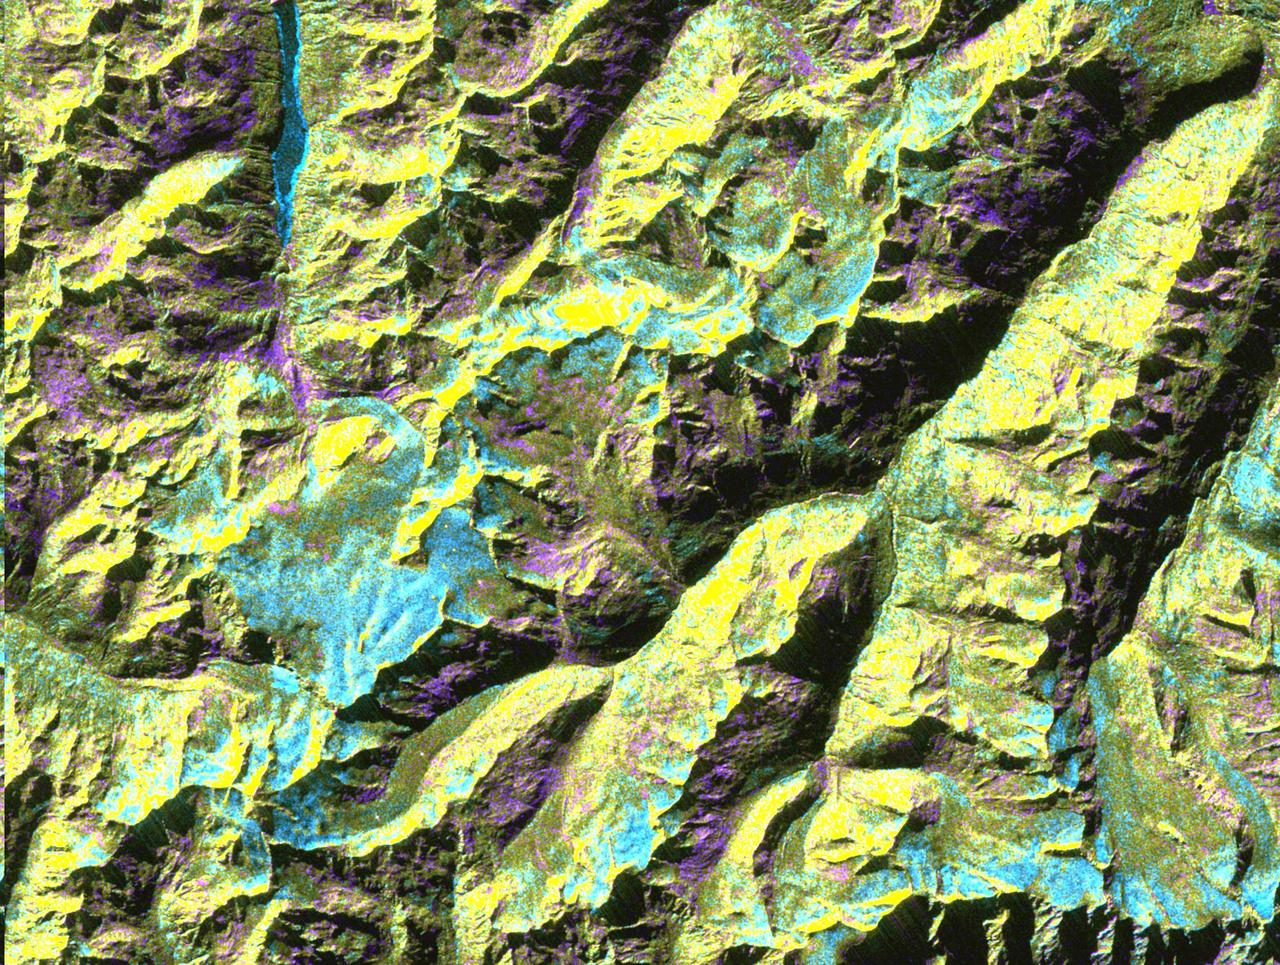
This is a digital elevation model that was geometrically coded directly onto an X-band seasonal change image of the Oetztal supersite in Austria. The image is centered at 46.82 degrees north latitude and 10.79 degrees east longitude. This image is located in the Central Alps at the border between Switzerland, Italy and Austria, 50 kilometers (31 miles) southwest of Innsbruck. It was acquired by the Spaceborne Imaging Radar-C/X-band Synthetic Aperture aboard the space shuttle Endeavour on April 14, 1994 and on October 5, 1994. It was produced by combining data from these two different data sets. Data obtained in April is green; data obtained in October appears in red and blue, and was used as an enhancement based on the ratio of the two data sets. Areas with a decrease in backscatter from April to October appear in light blue (cyan), such as the large Gepatschferner glacier seen at the left of the image center, and most of the other glaciers in this view. A light blue hue is also visible at the east border of the dark blue Lake Reschensee at the upper left side. This shows a significant rise in the water level. Magenta represents areas with an increase of backscatter from April 10 to October 5. Yellow indicates areas with high radar signal response during both passes, such as the mountain slopes facing the radar. Low radar backscatter signals refer to smooth surface (lakes) or radar grazing areas to radar shadow areas, seen in the southeast slopes. The area is approximately 29 kilometers by 21 kilometers (18 miles by 13.5 miles). The summit of the main peaks reaches elevations of 3,500 to 3,768 meters (xx feet to xx feet) above sea level. The test site's core area is the glacier region of Venter Valley, which is one of the most intensively studied areas for glacier research in the world. Research in Venter Valley (below center) includes studies of glacier dynamics, glacier-climate regions, snowpack conditions and glacier hydrology. About 25 percent of the core test site is covered by glaciers. Corner reflectors are set up for calibration. Five corner reflectors can be seen on the Gepatschferner and two can be seen on the Vernagtferner. http://photojournal.jpl.nasa.gov/catalog/PIA01760

iss075-s-001 (June 11, 2025) -- The official mission insignia of the Expedition 75 crew aboard the International Space Station. This patch embodies Expedition 75's mission on the orbital ouitpost, a beacon of human aspiration. Radiant golden and white lines surge from Earth, forging a bond between our planet and the cosmos, illustrating the profound impact of the International Space Station's work on humanity. Above, the cupola's windows, depicted as geometric blue forms, serve as a poignant reminder of our home, connecting astronauts to their loved ones and the breathtaking beauty of Earth. Below, majestic mountain ranges underscore the vital role of our planet's landscapes and ecosystems in our quest for knowledge and preservation. The gradient arc, cradling Earth's curvature, symbolizes our fragile atmosphere and the International Space Station's orbital path, a testament to our relentless pursuit of discovery and growth.
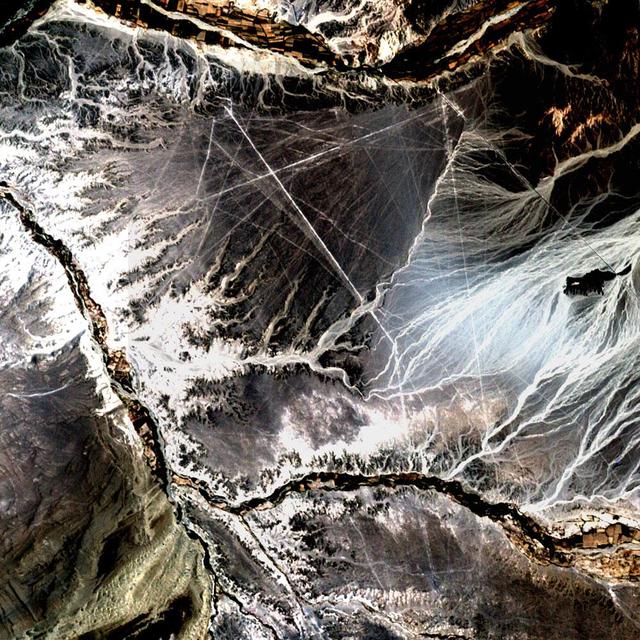
Acquisition Date: November 10, 2002 In the desert of southwest Peru, between the Andes Mountains and the Peruvian coast, lies a plateau with huge geometric patterns and spirals, animal figures including a monkey, a spider, and an 'owl man,' and thousands of perfectly straight lines. The last of these was drawn about a thousand years ago. Known as the Nazca lines, the drawings have mystified scientists since they were first discovered in the 1920s. Pictured here is all that can be seen of these lines by Landsat 7's 15 meter pan band, which has been used to sharpen the 30 meter Bands 3, 2, and 1. Credit: NASA/GSFC/Landsat/USGS To learn more about Landsat and to see the orginal high res file go to: <a href="http://landsat.usgs.gov/gallery_view.php?category=greenflag&thesort=mainTitle" rel="nofollow">landsat.usgs.gov/gallery_view.php?category=greenflag&...</a>

ISS032-E-026306 (10 Sept. 2012) ---Inside 16.5-ton H-II Transfer Vehicle (HTV-3), also known as Kounotori3, the six members of the Expedition 32 crew pose for a "non-geometrical" group portrait before half of the crew leaves the International Space Station in a few days. First to leave the orbital outpost, however, will be the HTV-3 itself, which will be undocked after fulfilling its mission of carrying supplies to the station and of "carrying out the trash" one final time. On the six person crew are Japan Aerospace Exploration Agency (JAXA) astronaut Akihiko Hoshide, Russian cosmonaut Yuri Malenchenko, NASA astronauts Sunita Williams and Joe Acaba, all flight engineers; Russian cosmonauts Gennady Padalka, commander; and Sergei Revin, flight engineer. Scheduled to leave the station on Sept. 16 are Padalka, Acaba and Revin; and prior to their departure, Williams will become the next crew commander.

ISS021-S-001 (February 2009) --- The central element of the patch is inspired by a fractal of six, symbolizing the teamwork of the six-person crew. From the basic element of one person, together six people form a much more complex and multifaceted entity, toward the infinity of the universe. The patch shows children, on Earth in the bright Sun, as our future and the reason we explore. The Soyuz and Shuttle are the vehicles that enable human space exploration today, while the International Space Station is leading to our next goals, the moon and Mars. The patch shape has six tips, geometrically sound yet reminiscent of a leaf, representing symmetry and ecological harmony, while the six stars in deep space represent the current crew and future exploration crews. The insignia design for ISS flights is reserved for use by the astronauts and cosmonauts and for other official use as the NASA Administrator and NASA's international partners may authorize. Public availability has been approved only in the form of illustrations by the various news media. When and if there is any change in this policy, which we do not anticipate, it will be publicly announced

ISS038-E-057977 (22 Feb. 2014) --- Snow-covered fields appear as geometric patterns on Washington Island, on Lake Michigan, in this photograph taken by the Expedition 38 crew of the International Space Station. The island is nine kilometers long (5.6 miles) and lies on the western shore of Lake Michigan, as a continuation of Door Peninsula (Wisconsin). Note that north is to the lower left in the image. White coastal ice hugs the shoreline and connects Washington Island with Detroit Island and Rock Island. Ice typically accumulates first near land, where cooling is more rapid than in deeper lake water. Two other snow-covered islands (image top left) are small enough and far enough from land to evade the collars of ice. On the day this image was taken, southwesterly winds were blowing ice into the lake in the form of long, coherent stringers. The thickness of a stringer is related to the length of coastline that feeds it. The smallest northern stringer (image left) is fed by the shortest section of upwind coastline, and the longest (image right) is supplied by the large amount of shore ice around Detroit Island.
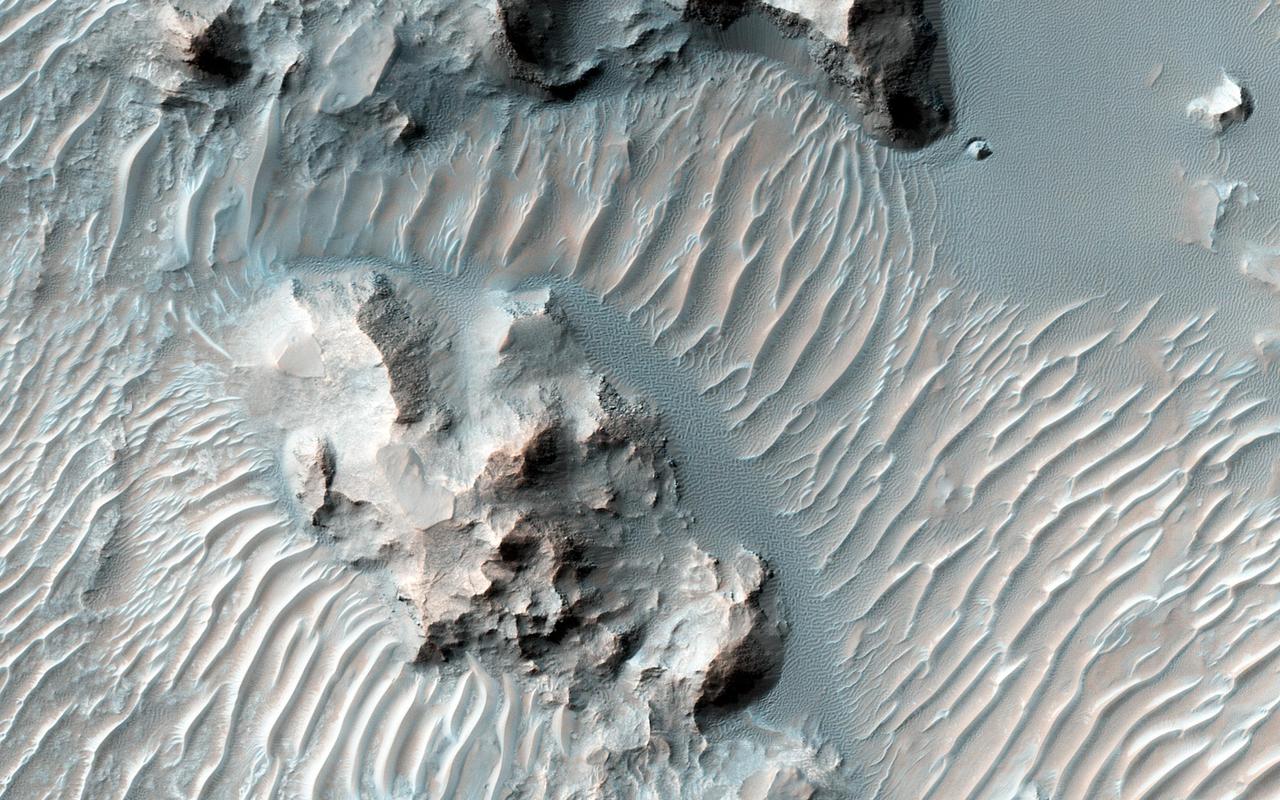
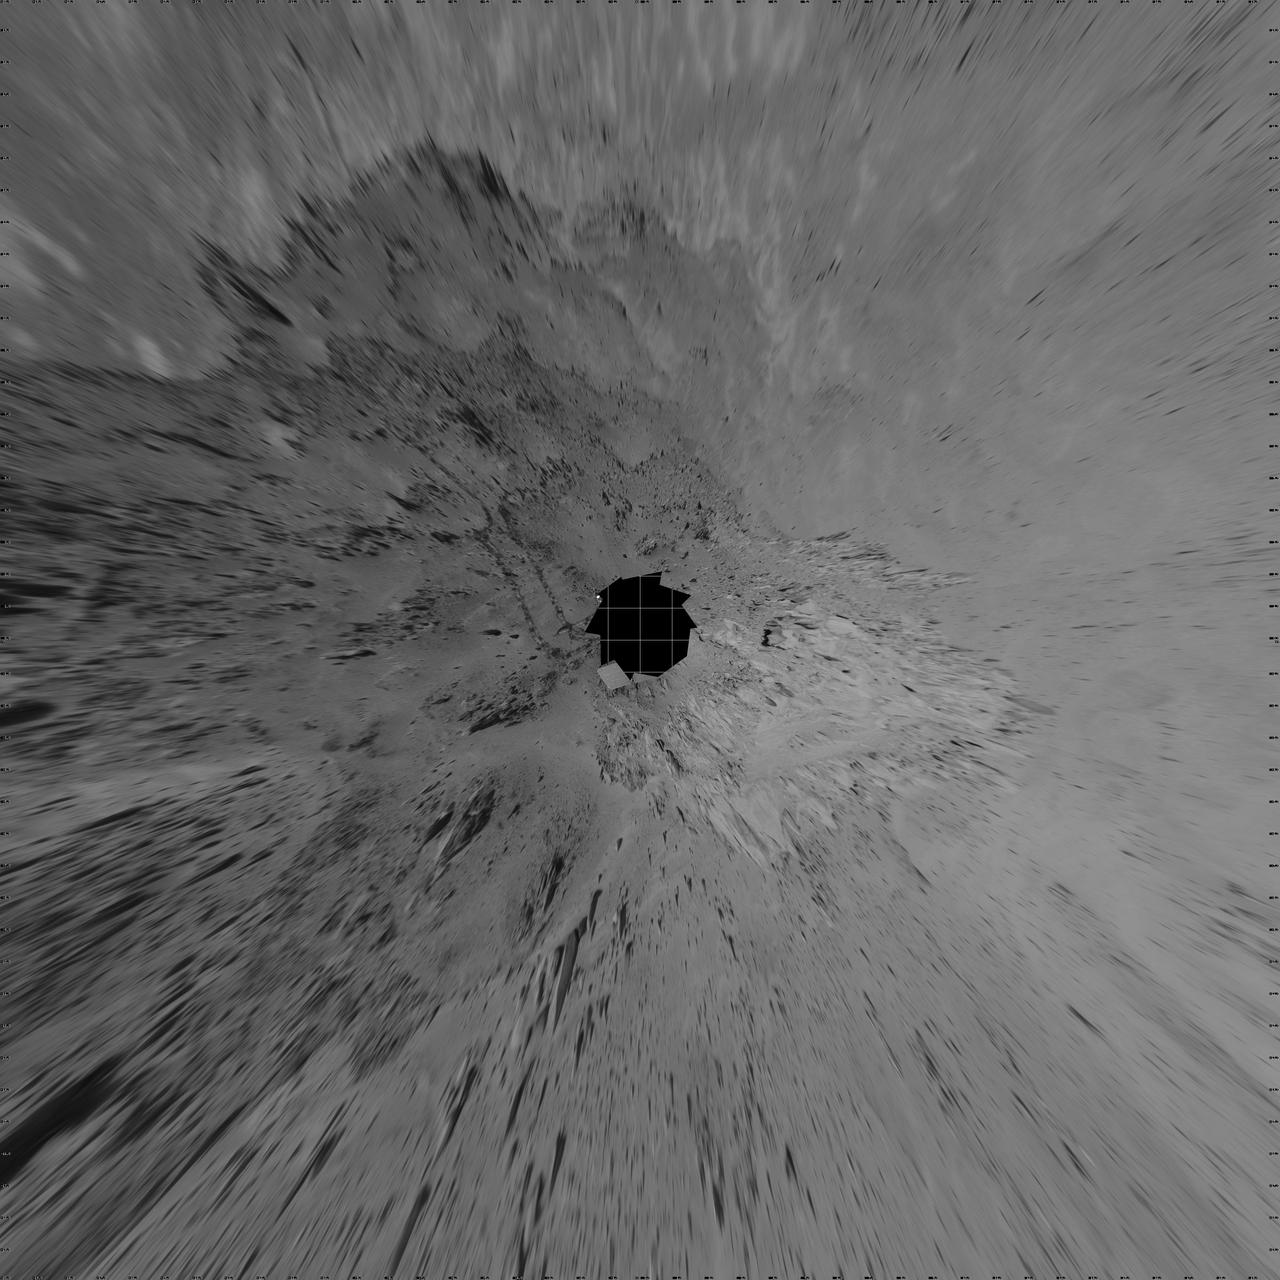
Schaeberle Crater is a large, heavily-infilled crater with many interesting features. This image NASA Mars Reconnaissance Orbiter spacecraft shows a window into the crater fill deposit, showcasing eroding bedrock and aeolian landforms. This pit is located near the geometric center of our image, making it a central pit crater. Central pit craters are thought to form from impact melt draining through subsurface cracks in the deepest part of the crater shortly following impact. A closeup image shows light-toned bedrock and a small cliff that appears to be weathering away. Below the cliff there are several different types of aeolian features, including ripples and transverse aeolian ridges (TAR). The sand that forms the small, bluish ripples may be weathering out of the cliff face, in contrast to the larger, light-toned TAR which are thought to be currently inactive. More of the TAR are visible in another closeup image. In this case, they are clearly covered by a dark, ripple-covered sand sheet. We have only imaged this location once, so it is impossible to determine whether or not the sand sheet is blowing in the wind. But due to repeated HiRISE imaging in other areas, active dunes are now known to be common across Mars and we can reasonably speculate that these dunes are moving, too. http://photojournal.jpl.nasa.gov/catalog/PIA20339
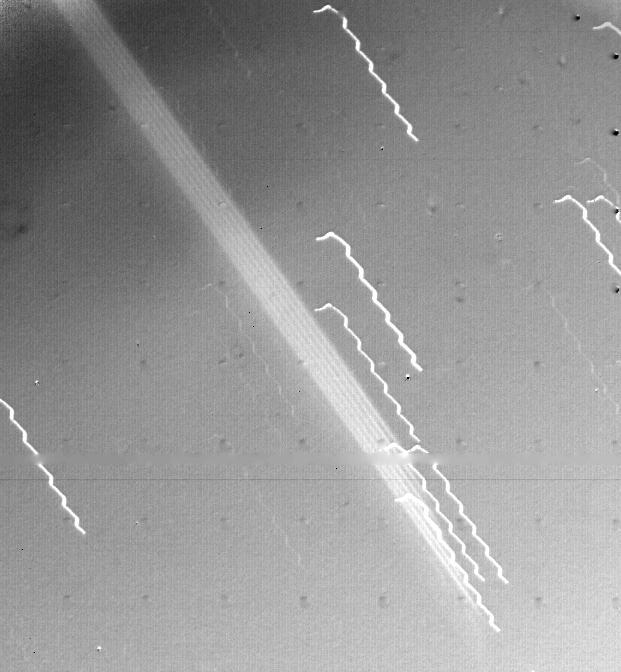
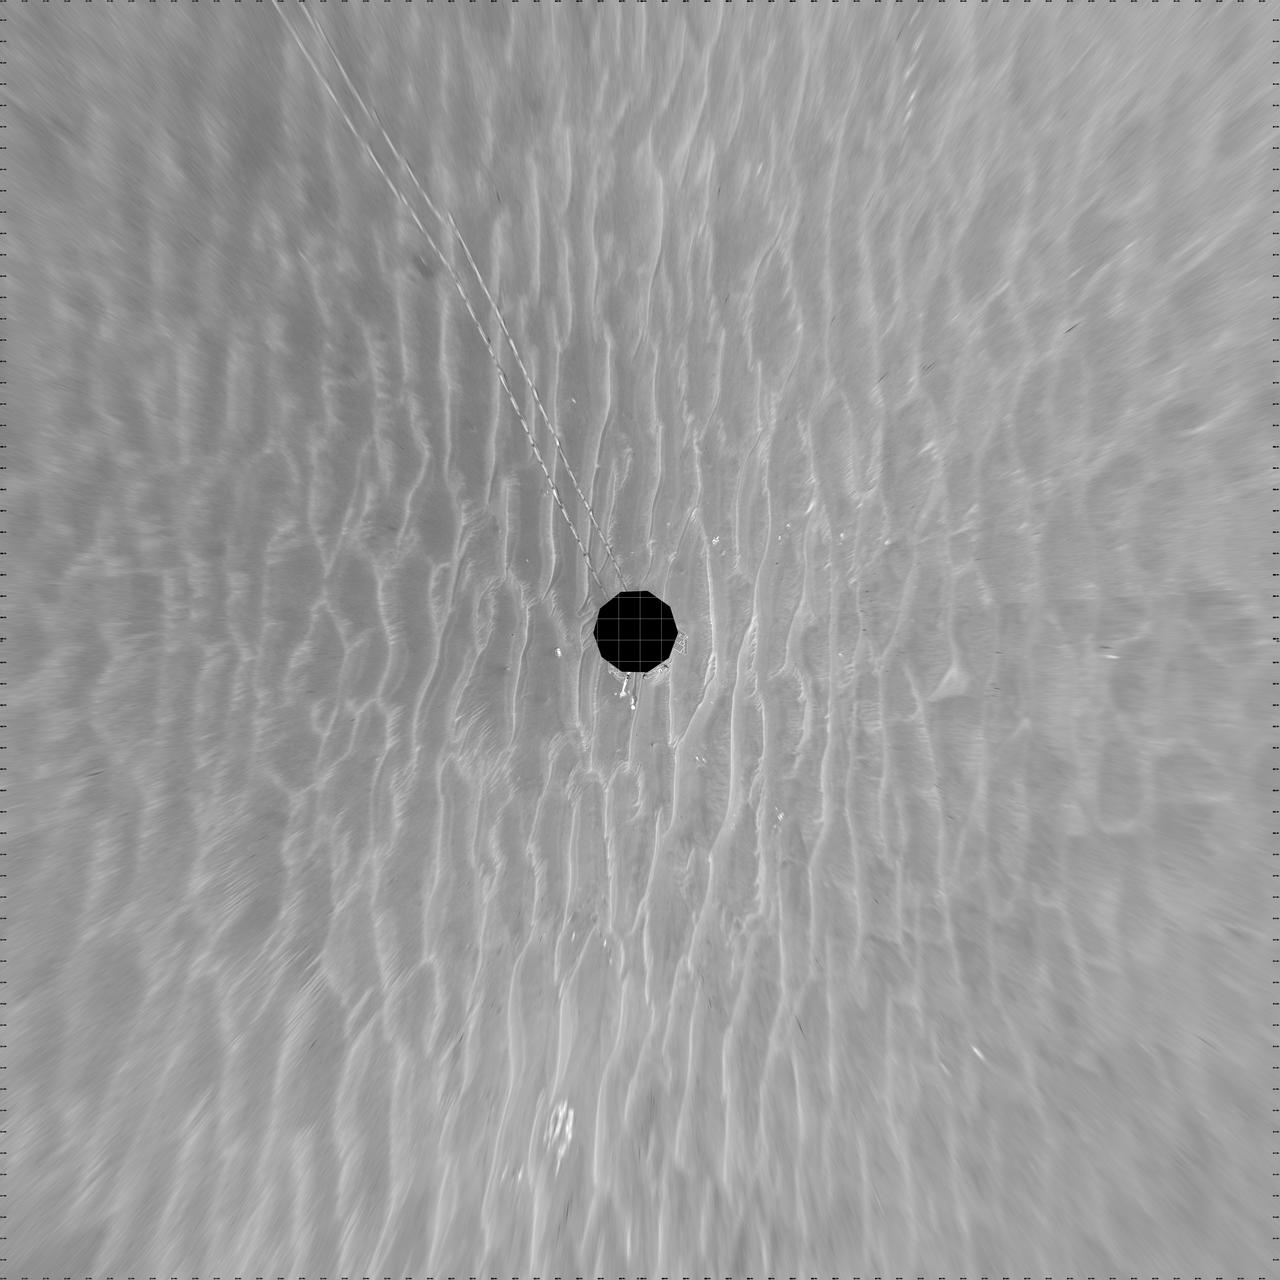
First evidence of a ring around the planet Jupiter is seen in this photograph taken by Voyager 1 on March 4, 1979. The multiple exposure of the extremely thin faint ring appears as a broad light band crossing the center of the picture. The edge of the ring is 1,212,000 km from the spacecraft and 57,000 km from the visible cloud deck of Jupiter. The background stars look like broken hair pins because of spacecraft motion during the 11 minute 12 second exposure. The wavy motion of the star trails is due to the ultra-slow natural oscillation of the spacecraft (with a period of 78 seconds). The black dots are geometric calibration points in the camera. The ring thickness is estimated to be 30 km or less. The photograph was part of a sequence planned to search for such rings in Jupiter's equatorial plane. The ring has been invisible from Earth because of its thinness and its transparency when viewed at any angle except straight on. JPL manages and controls the Voyager Project for NASA's Office of Space Science. http://photojournal.jpl.nasa.gov/catalog/PIA02251

This chart describes the Skylab student experiment Web Formation. Judith S. Miles of Lexington High School, Lexington, Massachusetts, proposed a study of the spider's behavior in a weightless environment. The geometrical structure of the web of the orb-weaving spider provides a good measure of the condition of its central nervous system. Since the spider senses its own weight to determine the required thickness of web material and uses both the wind and gravity to initiate construction of its web, the lack of gravitational force in Skylab provided a new and different stimulus to the spider's behavioral response. Two common cross spiders, Arabella and Anita, were used for the experiment aboard the Skylab-3 mission. After initial disoriented attempts, both spiders produced almost Earth-like webs once they had adapted to weightlessness. In March 1972, NASA and the National Science Teachers Association selected 25 experiment proposals for flight on Skylab. Science advisors from the Marshall Space Flight Center aided and assisted the students in developing the proposals for flight on Skylab.
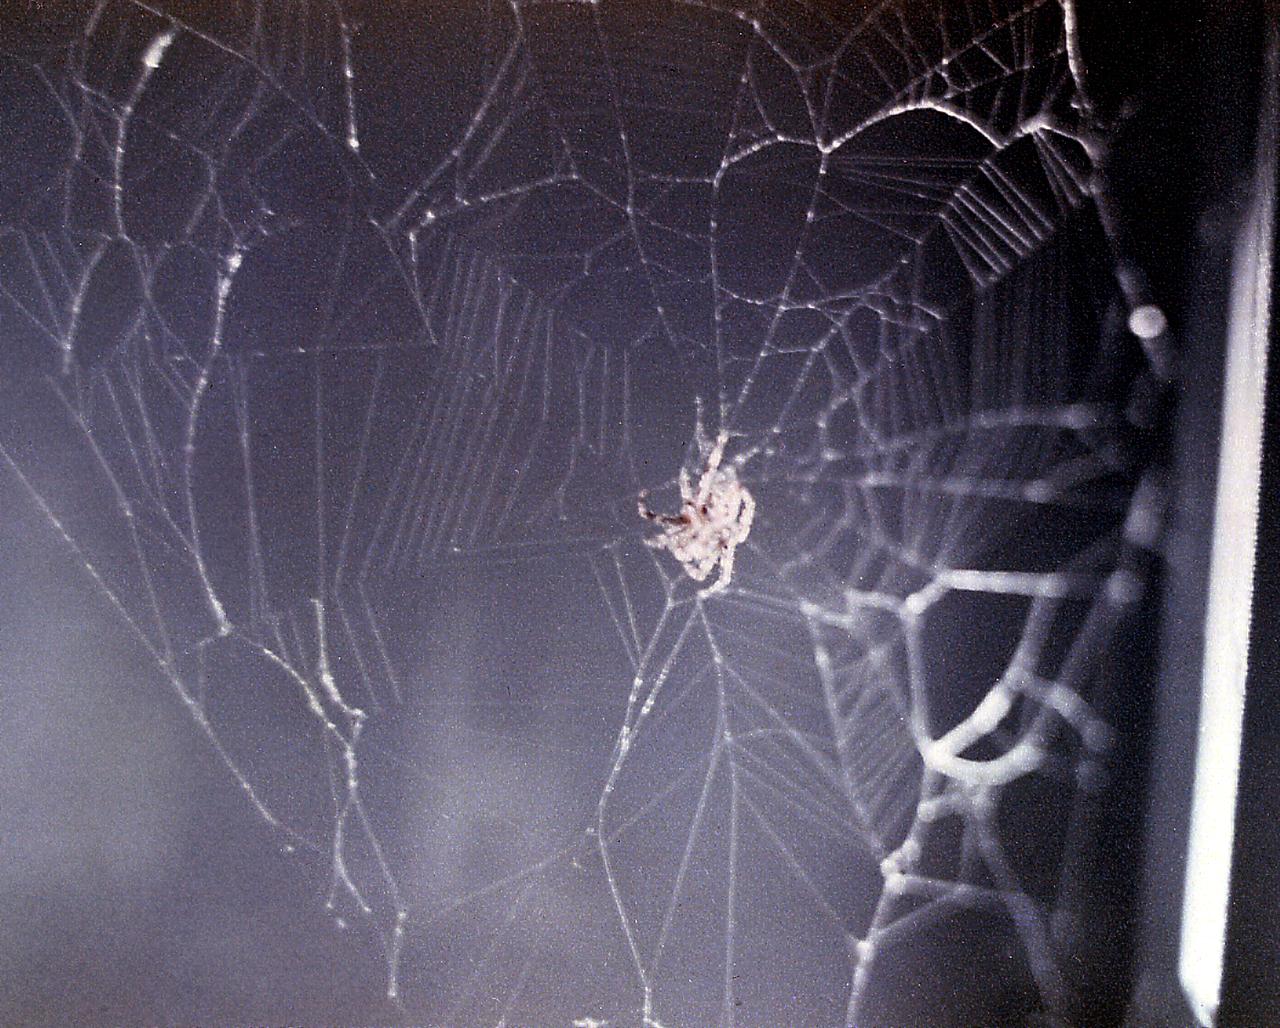
Judith S. Miles of Lexington High School, Lexington, Massachusetts, proposed skylab student experiment ED-52, Web Formation. This experiment was a study of a spider's behavior in a weightless environment. The geometrical structure of the web of the orb-weaving spider provides a good measure of the condition of its central nervous system. Since the spider senses its own weight to determine the required thickness of web material and uses both the wind and gravity to initiate construction of its web, the lack of gravitational force in Skylab provided a new and different stimulus to the spider's behavioral response. Two common cross spiders, Arabella and Anita, were used for the experiment aboard the Skylab-3 mission. After initial disoriented attempts, both spiders produced almost Earth-like webs once they had adapted to weightlessness. This photograph is of Arabella, a cross spider, in her initial attempt at spirning a web. This picture was taken by the crew of the Skylab 3 mission before Arabella adapted to her new environment.

Closeup photo of an optical cube mounted to OSAM-1 hardware inside cleanroom at Goddard Space Flight Center, Greenbelt Md., Jun 4, 2024. This photo has been reviewed by OSAM1 project management and the Export Control Office and is released for public view. NASA/Mike Guinto
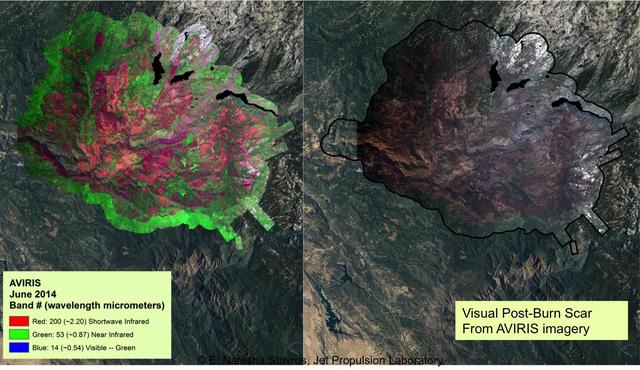
At left, a NASA AVIRIS map shows the spectral signature of the 2013 Rim fire in and near Yosemite National Park, California, the third largest in the state's history, burning more than 250,000 acres. Almost two years later, forest restoration efforts are still ongoing. Charred wood has a strong signal in the wavelengths shown here in red, so areas that are predominantly red in the image were heavily burned. The wavelengths of green, visible light (the color of vegetation) appear on this map as blue. There are no solid blue patches on the map because no large areas of green, living foliage survived the fire. Purple, a mixture of red and blue, indicates an area where charred wood and living plants are mingled. This image provides far more information about the state of the post-fire vegetation than the view on the right, which is what an observer flying overhead would see. AVIRIS is a unique NASA science instrument that measures the complete solar reflected portion of the electromagnetic spectrum with unmatched spectral range, calibration accuracy and signal-to-noise ratio. AVIRIS spectra are measured from 370 to 2,500 nanometers at 9.8-nanometer intervals. Images are acquired with 20-, 6- or 4-meter (66-, 20, or 13-feet) spatial resolution with a 34 degree swath. Up to 100 million spectra are measured in image format on each flight. The spectral image measurements are provided in orthorectified (geometrically corrected) format for direct use by scientists. http://photojournal.jpl.nasa.gov/catalog/PIA19361
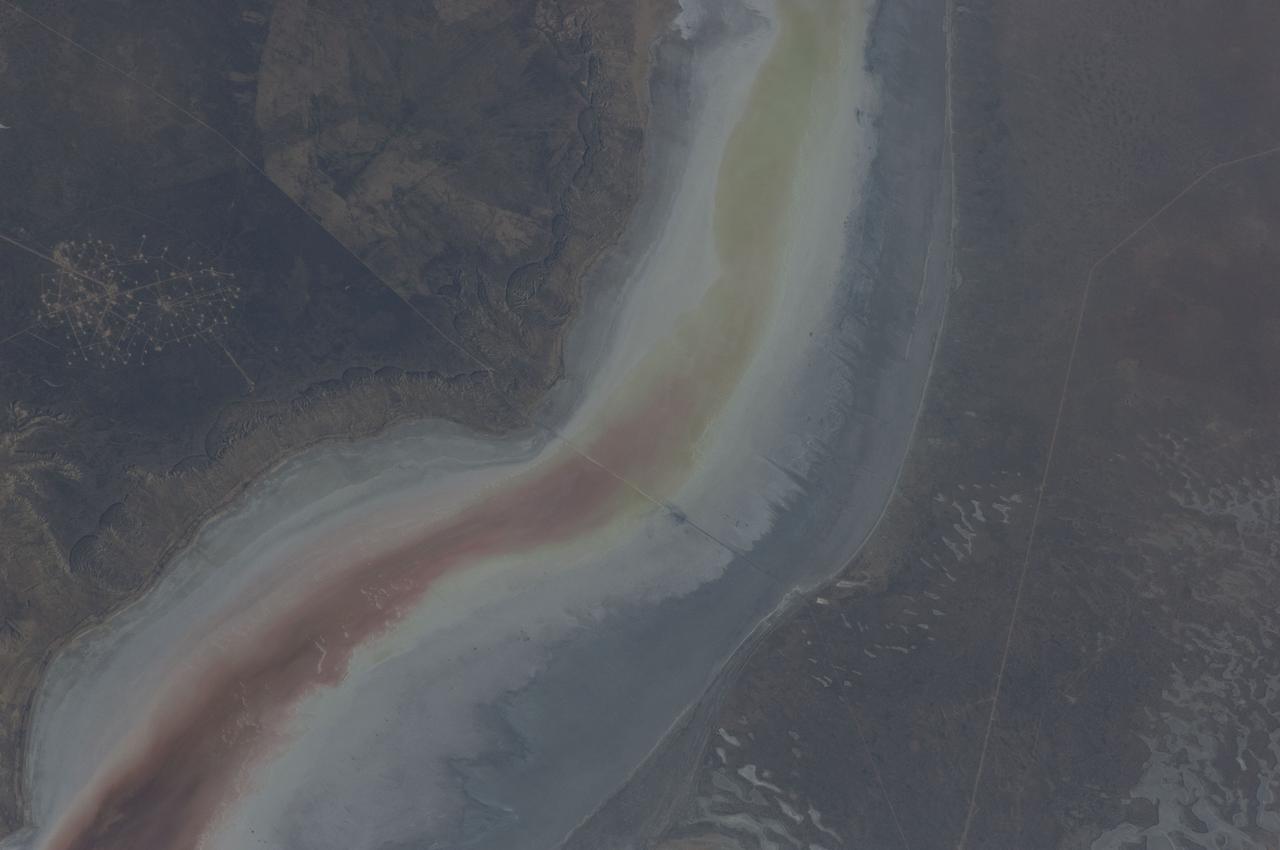
ISS031-E-030896 (11 May 2012) --- The Sor Kaydak near the northeast Caspian Sea in Kazakhstan are featured in this image photographed by an Expedition 31 crew member on the International Space Station. This striking image shows saline water of different colors in the Sor Kaydak, a salt marsh that leads into the northeast bulb of the Caspian Sea. The central 50 kilometers of this 180 kilometer-long depression is shown in this photograph. The Sor Kaydak depression is inundated on occasion by water from the Caspian Sea since it lies at the same elevation?that is, 29 meters below global sea level?though separated from the Sea by a low bar of land that is 1?2 meters high. The different colors of marsh water (brown to pink to light green, northeast to southwest) result from the interplay of water depth and resident organisms such as algae. Algae color varies depending on water temperature and salinity. The irregular gray areas at bottom right are wet zones between low sand dunes. These interdune flats are whitened with salt derived by evaporation of Caspian Sea water (the sea is just outside the image bottom right). The jagged line following the colored water (crossing the center of the image top to bottom) is the limit of the wetting zone (or perimeter), an irregular zone influenced by wind and the depth of water in the marsh. Small cliffs can be seen marking the east margin of the depression that contains Sor Kaydak. Above the cliffs a plateau surface (approximately 200 meters above the salt marsh, approximately 160 meters above global sea level) extends eastward for hundreds of kilometers. Here the plateau is occupied by a dense pattern of well heads which appear as a geometric pattern of tan dots. By contrast, the west margin (right) rises less than 10 meters above the marsh altitude. The straight line visible at center is a pipeline built across the salt marsh which takes oil to a terminal on the Caspian shore 100 kilometers northwest of the area shown here.
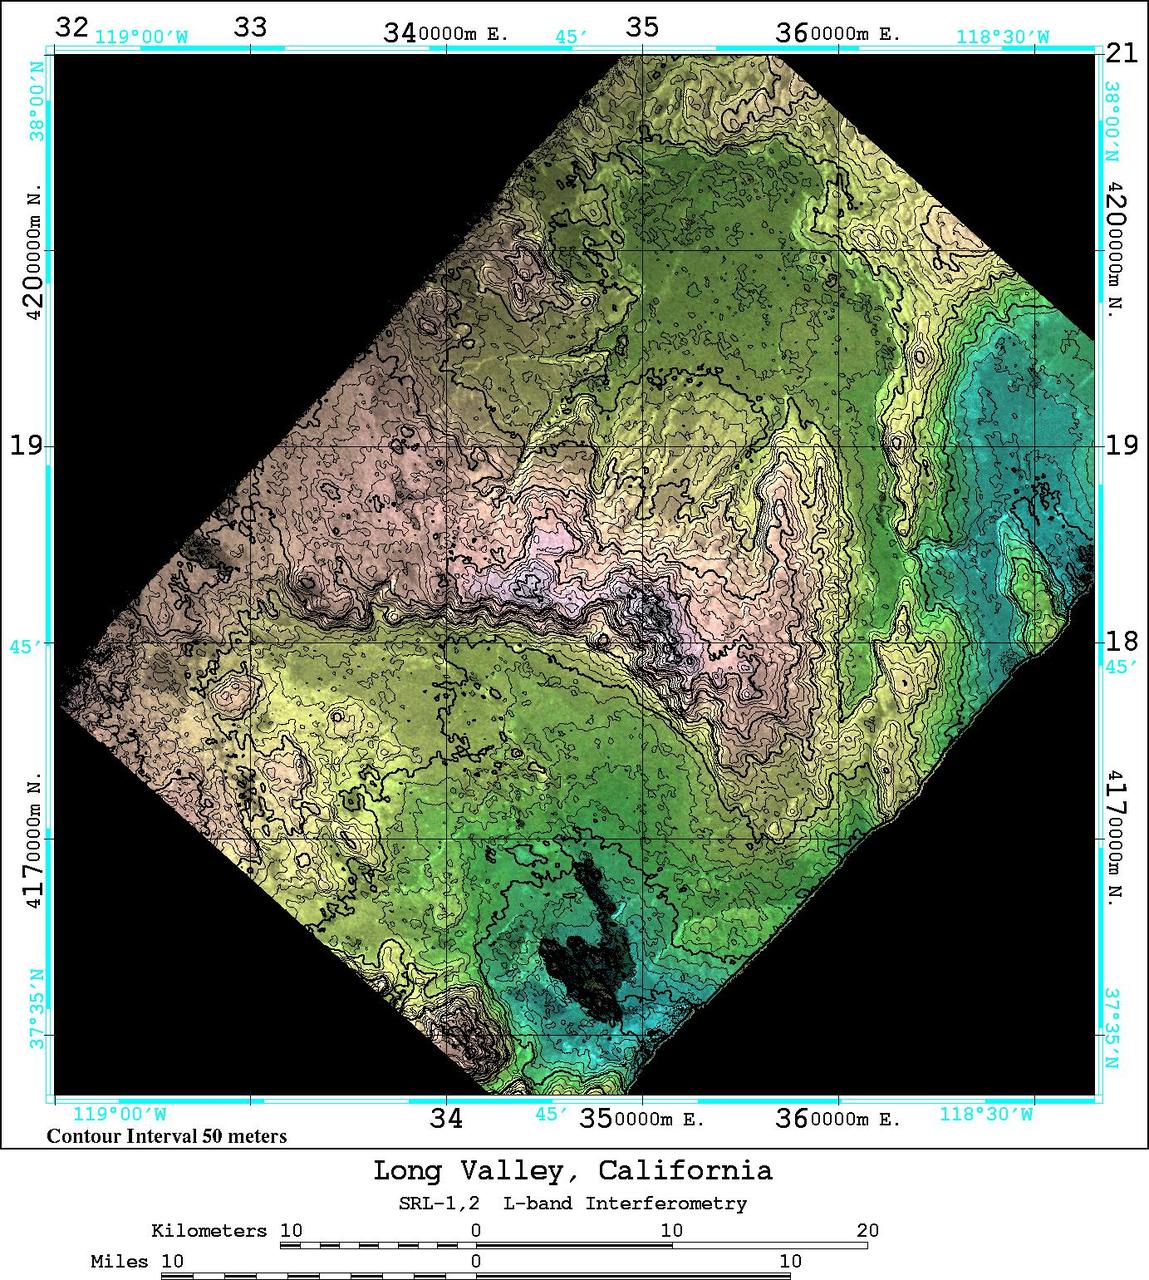
An area near Long Valley, California, was mapped by the Spaceborne Imaging Radar-C and X-band Synthetic Aperture Radar aboard the space shuttle Endeavor on April 13, 1994, during the first flight of the radar instrument, and on October 4, 1994, during the second flight of the radar instrument. The orbital configurations of the two data sets were ideal for interferometric combination -- that is overlaying the data from one image onto a second image of the same area to create an elevation map and obtain estimates of topography. Once the topography is known, any radar-induced distortions can be removed and the radar data can be geometrically projected directly onto a standard map grid for use in a geographical information system. The 50 kilometer by 50 kilometer (31 miles by 31 miles) map shown here is entirely derived from SIR-C L-band radar (horizontally transmitted and received) results. The color shown in this image is produced from the interferometrically determined elevations, while the brightness is determined by the radar backscatter. The map is in Universal Transverse Mercator (UTM) coordinates. Elevation contour lines are shown every 50 meters (164 feet). Crowley Lake is the dark feature near the south edge of the map. The Adobe Valley in the north and the Long Valley in the south are separated by the Glass Mountain Ridge, which runs through the center of the image. The height accuracy of the interferometrically derived digital elevation model is estimated to be 20 meters (66 feet) in this image. http://photojournal.jpl.nasa.gov/catalog/PIA01749
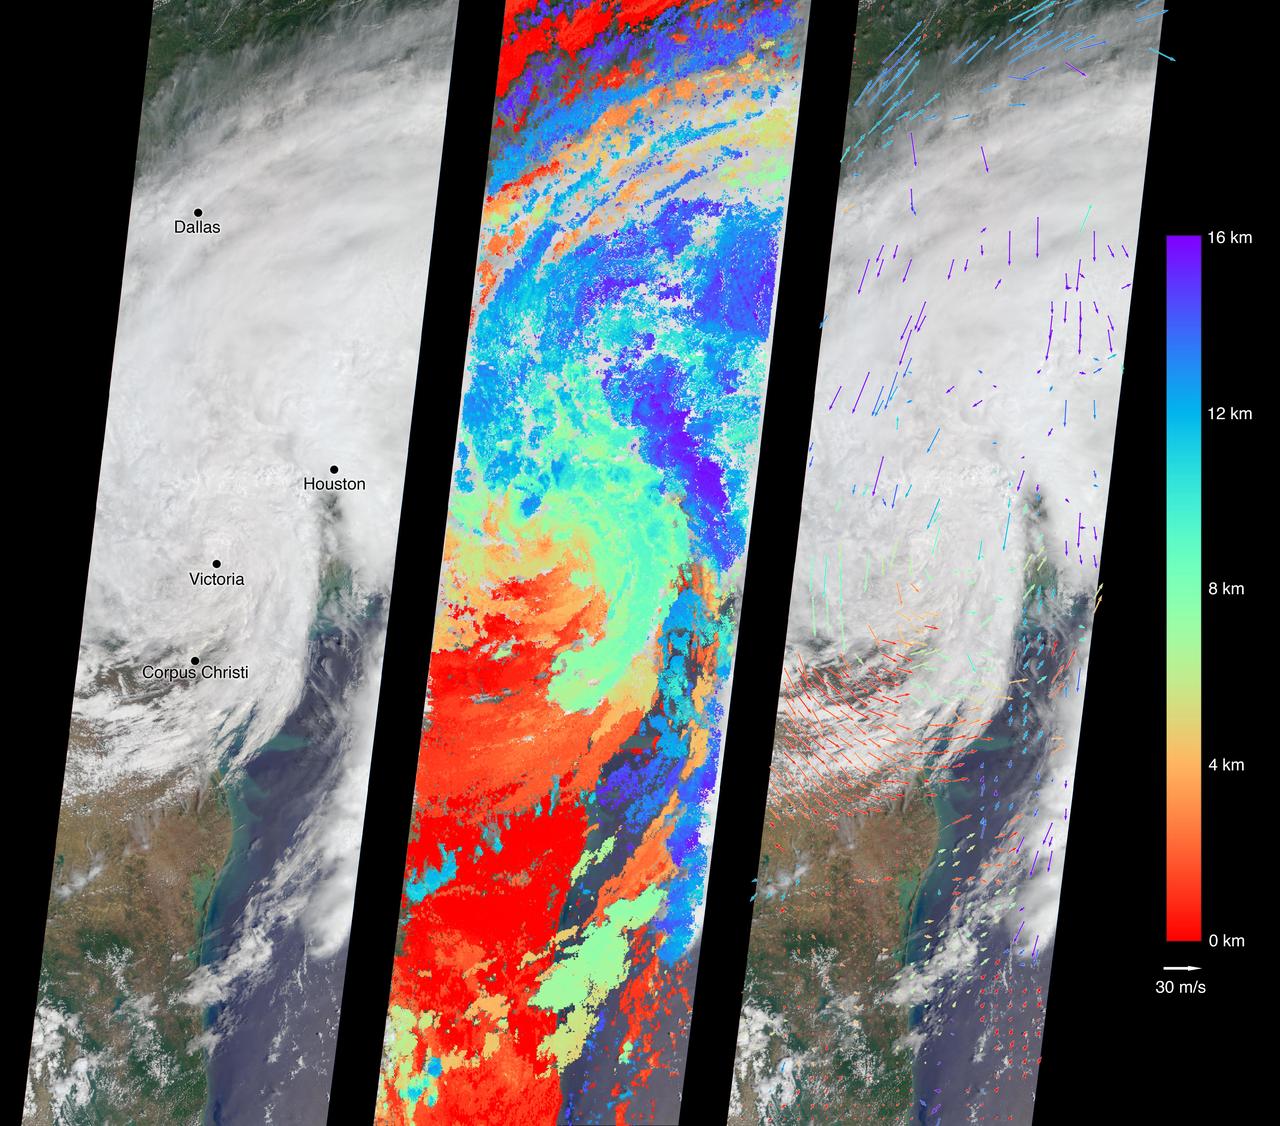
On Aug. 27, 2017, the Multi-angle Imaging SpectroRadiometer (MISR) instrument on NASA's Terra satellite passed over then-Tropical Storm Harvey about noon local time, the day after the storm first made landfall in Texas as a Category 4 hurricane. The MISR instrument is equipped with nine cameras that observe Earth at different angles over a time period of seven minutes. Geometric information from the multiple camera views is used to compute the cloud top heights, and motion of the clouds during the image sequence is used to calculate wind speed. This composite image shows the storm as viewed by the central, downward-looking camera (left), as well as the cloud top heights in kilometers (center) and the wind speeds (right) superimposed on the image. The length of the arrows is proportional to the wind speed, while their color shows the altitude at which the winds were calculated. Also included is an animation made by combining all nine images from the MISR cameras, showing the motion of the storm during the seven-minute period. At this time, the center of the tropical storm was located just northwest of the city of Victoria and maximum wind speeds on the ground were around 40 miles per hour (65 kilometers per hour) according to the National Oceanic and Atmospheric Administration (NOAA), which matches well with the near-surface winds calculated by MISR to the west of Corpus Christi. In the 36 hours or so since it had made landfall, Harvey had weakened considerably -- these images show that the eye had disappeared and much of the circular motion of storm had dissipated, as shown by the calculated wind directions. However, the area of very high clouds and strong winds near Houston shows that the storm was continuing to produce powerful rain bands. At this point, hydrographs managed by NOAA in downtown Houston were already recording flood stage at both the Buffalo Bayou (28 feet or 8.5 meters as of 12:15 p.m. CDT August 27) and the White Oak Bayou (40 feet or 12 meters at last record that morning). The MISR data show the storm clouds reaching an altitude of about 10 miles (16 kilometers). These data were captured during Terra orbit 94108. An animation is available at https://photojournal.jpl.nasa.gov/catalog/PIA21927
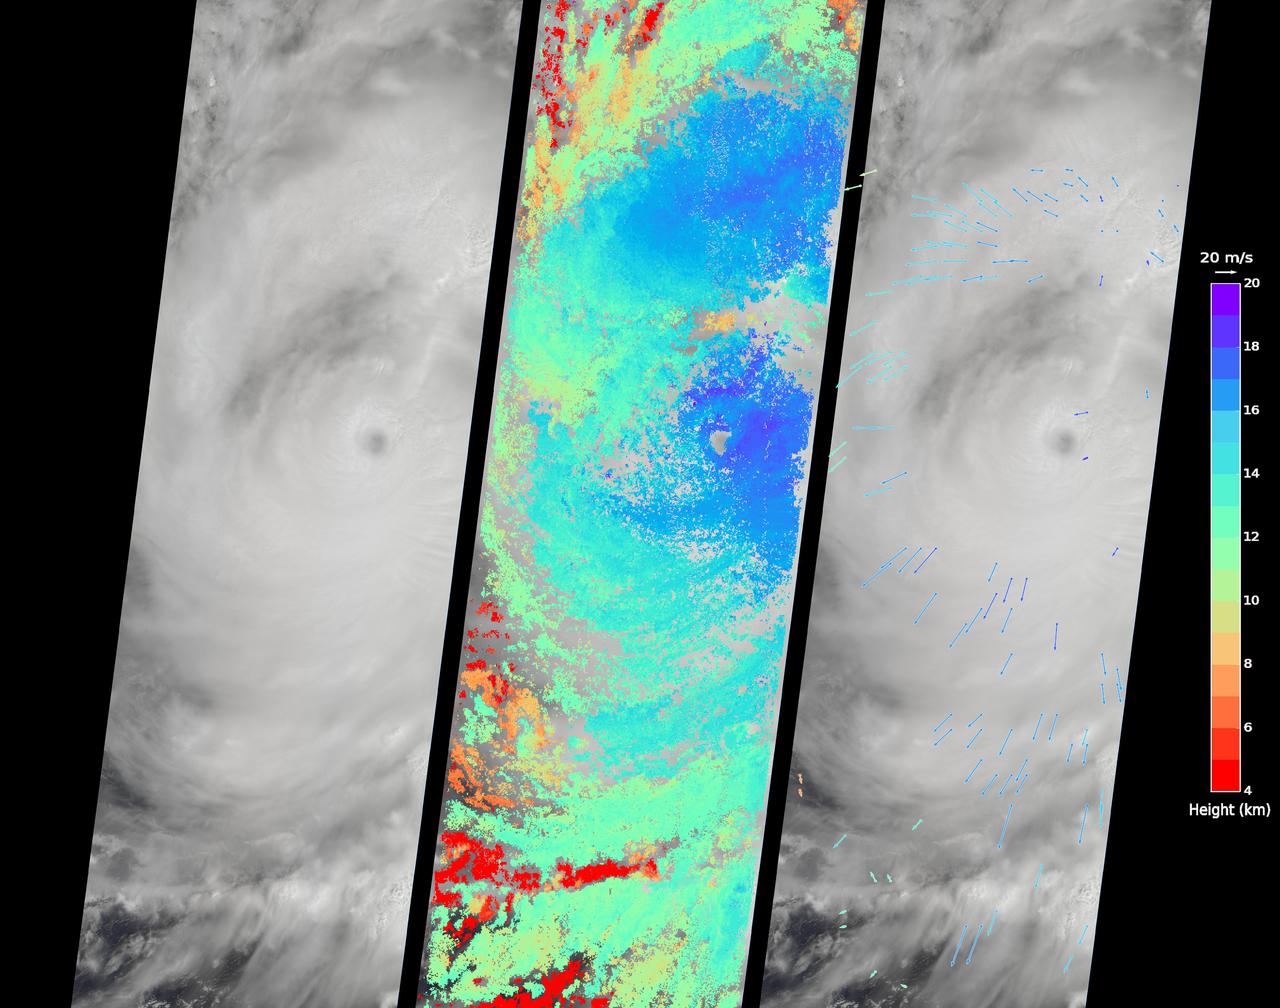
On Sept. 14, 2016, the eye of Super Typhoon Meranti passed just south of Taiwan. The enormous storm, classified as a Category 5 typhoon at the time, still caused much disruption on the island. Nearly 500,000 homes lost power, schools were closed, and most flights were cancelled. Maximum wind speeds were 180 miles per hour (290 kilometers per hour) as the storm passed, and more than 25 inches (64 centimeters) of rain fell on some areas of the country. However, the storm did not pass over Taiwan's mountainous landscape, which would have weakened it. That means it will remain strong as it heads toward mainland China, unlike Super Typhoon Nepartak in July, which weakened from a Category 5 typhoon to a tropical storm after crossing Taiwan. Meranti is currently maintaining Category 4 strength and is expected to make landfall near Shantou, Guangdong province, on Thursday, September 15. The coast of China is more vulnerable to storm surges than Taiwan due to shallower coastal waters and recent rainfall. There is risk of substantial flooding. On Sept. 14, at 10:45 AM local time, the Multi-angle Imaging SpectroRadiometer (MISR) instrument aboard NASA's Terra satellite passed directly over the eye of Meranti. On the left is a natural-color image from MISR's nadir-pointing camera. At this time the eye of Meranti was just off the southern tip of Taiwan, which is invisible under the clouds. The coast of China is barely visible through the clouds in the upper left portion of the image. The small eye and dense high clouds are both markers of the storm's power. MISR's nine cameras, each pointed at a different angle, can be used to determine the heights of clouds based on geometric shifts among the nine images. The middle panel shows these stereo-derived cloud top heights superimposed on the natural color image. The clouds of the central core of Typhoon Meranti have heights ranging between 16 and 20 kilometers (10 and 12.5 miles). It takes about seven minutes for all nine cameras to image the same location on the ground, and wind velocity can be calculated from the motion of the clouds over this seven-minute period. The right panel plots these wind velocities as vectors which indicate both direction and speed. The length of the arrow corresponds to the wind speed, which can be compared to the reference 20 meters per second (45 miles per hour) arrow in the key. Hurricanes and typhoons in the Northern Hemisphere rotate counterclockwise due to the Earth's rotation, but these wind vectors mainly show motion outward from the eye at the storm tops. This is due to the fact that hurricanes draw in moist air at low altitudes, which then flows upwards and outwards around the eye reversing direction. These data were acquired during Terra orbit 88865. http://photojournal.jpl.nasa.gov/catalog/PIA17309
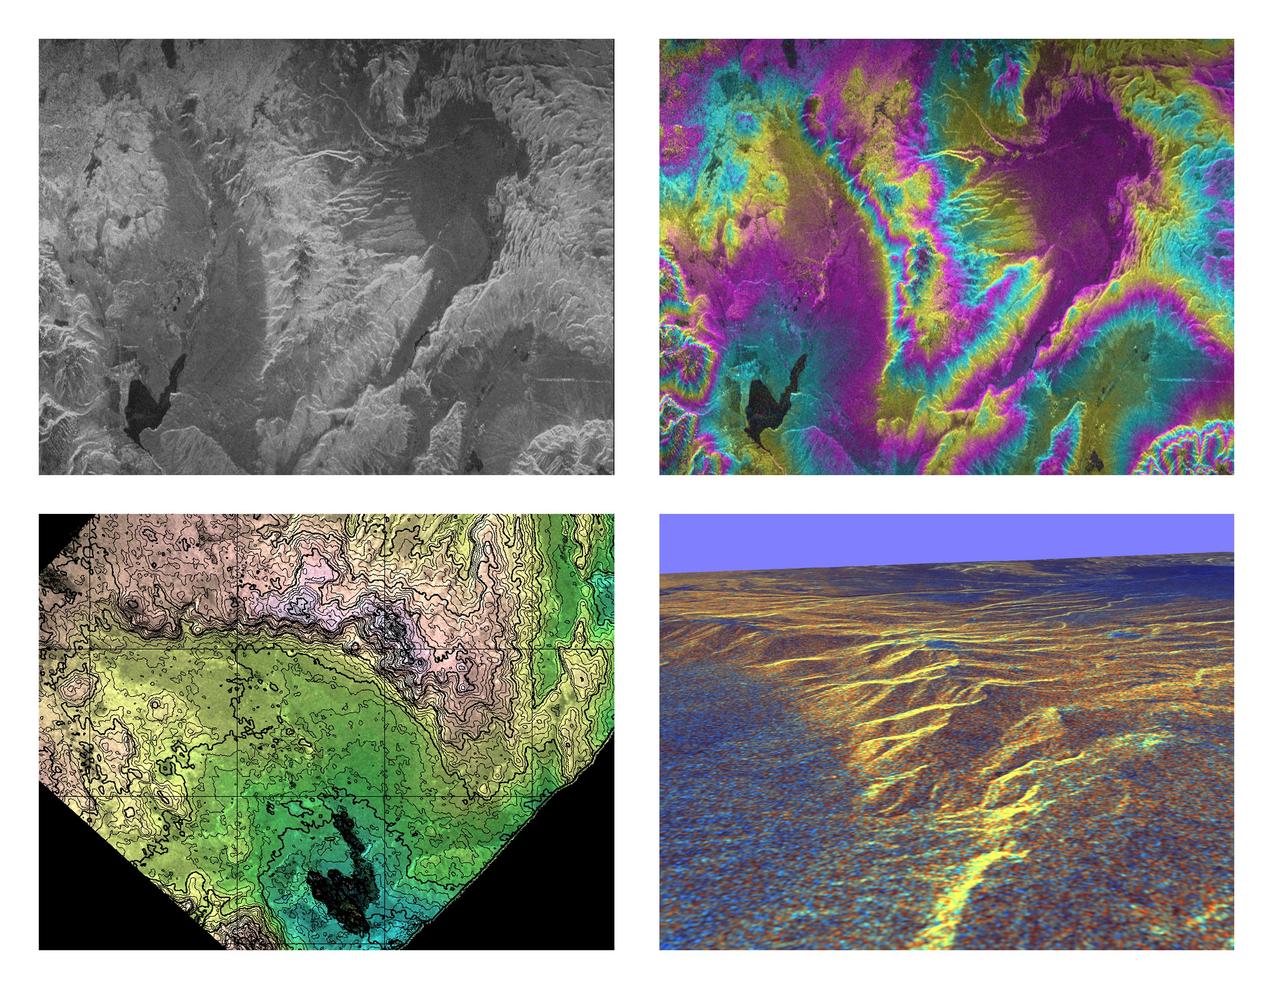
These four images of the Long Valley region of east-central California illustrate the steps required to produced three dimensional data and topographics maps from radar interferometry. All data displayed in these images were acquired by the Spaceborne Imaging Radar-C/X-band Synthetic Aperture Radar (SIR-C/X-SAR) aboard the space shuttle Endeavour during its two flights in April and October, 1994. The image in the upper left shows L-band (horizontally transmitted and received) SIR-C radar image data for an area 34 by 59 kilometers (21 by 37 miles). North is toward the upper right; the radar illumination is from the top of the image. The bright areas are hilly regions that contain exposed bedrock and pine forest. The darker gray areas are the relatively smooth, sparsely vegetated valley floors. The dark irregular patch near the lower left is Lake Crowley. The curving ridge that runs across the center of the image from top to bottom is the northeast rim of the Long Valley Caldera, a remnant crater from a massive volcanic eruption that occurred about 750,000 years ago. The image in the upper right is an interferogram of the same area, made by combining SIR-C L-band data from the April and October flights. The colors in this image represent the difference in the phase of the radar echoes obtained on the two flights. Variations in the phase difference are caused by elevation differences. Formation of continuous bands of phase differences, known as interferometric "fringes," is only possible if the two observations were acquired from nearly the same position in space. For these April and October data takes, the shuttle tracks were less than 100 meters (328 feet) apart. The image in the lower left shows a topographic map derived from the interferometric data. The colors represent increments of elevation, as do the thin black contour lines, which are spaced at 50-meter (164-foot) elevation intervals. Heavy contour lines show 250-meter intervals (820-foot). Total relief in this area is about 1,320 meters (4,330 feet). Brightness variations come from the radar image, which has been geometrically corrected to remove radar distortions and rotated to have north toward the top. The image in the lower right is a three-dimensional perspective view of the northeast rim of the Long Valley caldera, looking toward the northwest. SIR-C C-band radar image data are draped over topographic data derived from the interferometry processing. No vertical exaggeration has been applied. Combining topographic and radar image data allows scientists to examine relationships between geologic structures and landforms, and other properties of the land cover, such as soil type, vegetation distribution and hydrologic characteristics. http://photojournal.jpl.nasa.gov/catalog/PIA01770
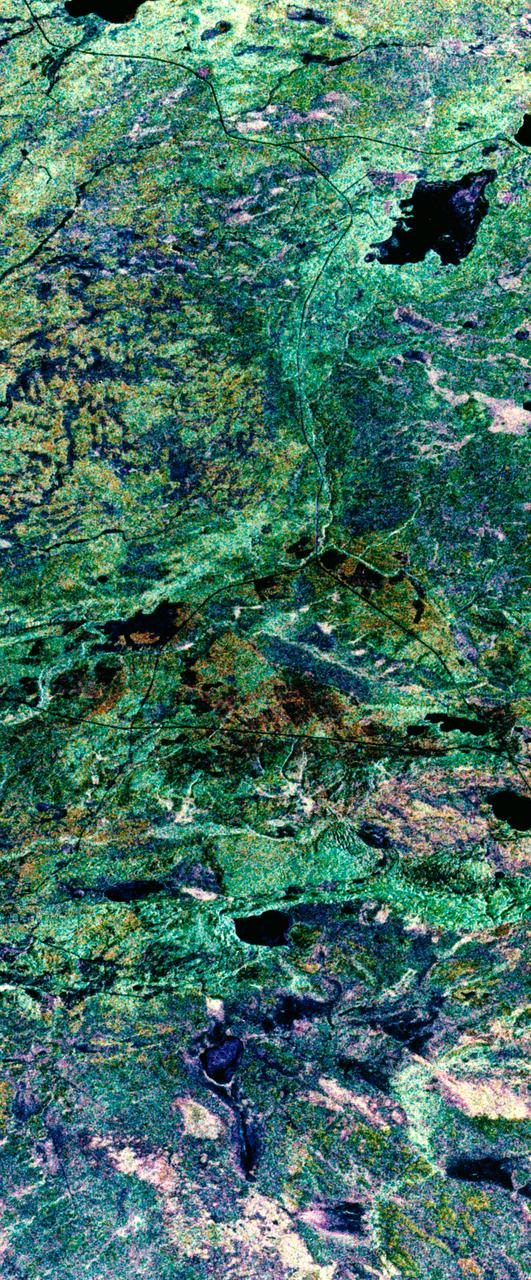
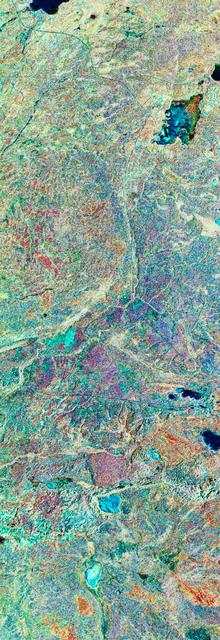
STS059-S-039 (11 April 1994) --- This is a false-color composite of Prince Albert, Canada, centered at 53.91 north latitude and 104.69 west longitude. This image was acquired by the Spaceborne Imaging Radar-C and X-Band Synthetic Aperture Radar (SIR-C/X-SAR) aboard the Space Shuttle Endeavour on its 20th orbit. The area is located 40 kilometers (25 miles) north and 30 kilometers (20 miles) east of the town of Prince Albert in the Saskatchewan province of Canada. The image covers the area east of the Candle Lake, between gravel surface Highways 120 and 106 and west of 106. The area in the middle of the image covers the entire Nipawin (Narrow Hills) provincial park. The look angle of the radar is 30 degrees and the size of the image is approximately 20 kilometers by 50 kilometers (12 by 30 miles). The image was produced by using only the L-Band. The three polarization channels HH, HV and VV are illustrated by red, green and blue respectively. The changes in the intensity of each color are related to various surface conditions such as variations in forest stands, frozen or thawed condition of the surface, disturbances (fire and deforestation), and areas of re-growth. Most of the dark areas in the image are the ice-covered lakes in the region. The dark area on the top right corner of the image is the White Gull Lake north of the intersection of Highway 120 and 913. The right middle part of the image shows Lake Ispuchaw and Lower Fishing Lake. The deforested areas are also shown by dark areas in the image. Since most of the logging practice at the Prince Albert area is around the major highways, the deforested areas can be easily detected as small geometrically shaped dark regions along the roads. At the time of the SIR-C/X-SAR overpass, a major part of the forest is either frozen or undergoing the spring thaw. The L-Band HH shows a high return in the jack pine forest. The reddish areas in the image are old jack pine forest, 12-17 meters (40-55 feet) in height and 60-75 years old. The orange-greenish areas are young jack pine trees, 3-5 meters (10-16 feet) in height and 11-16 years old. The green areas are due to the relative high intensity of the HV channel which is strongly correlated with the amount of biomass. L-Band HV channel shows the biomass variations over the entire region. Most of the green areas, when compared to the forest cover maps are identified as black spruce trees. The dark blue and dark purple colors show recently harvested or re-growth areas respectively. SIR-C/X-SAR is part of NASA's Mission to Planet Earth (MTPE). SIR-C/X-SAR radars illuminate Earth with microwaves allowing detailed observations at any time, regardless of weather or sunlight conditions. SIR-C/X-SAR uses three microwave wavelengths: L-Band (24 cm), C-Band (6 cm), and X-Band (3 cm). The multi-frequency data will be used by the international scientific community to better understand the global environment and how it is changing. The SIR-C/X-SAR data, complemented by aircraft and ground studies, will give scientists clearer insights into those environmental changes which are caused by nature and those changes which are induced by human activity. SIR-C was developed by NASA's Jet Propulsion Laboratory (JPL). X-SAR was developed by the Dornire and Alenia Spazio Companies for the German Space Agency, Deutsche Agentur fuer Raumfahrtangelegenheiten (DARA), and the Italian Space Agency, Agenzia Spaziale Italiana (ASI). JPL Photo ID: P-43886
STS059-S-079 (18 April 1994) --- This is a false-color, three frequency image of Prince Albert, Canada, centered at 53.91 north latitude and 104.69 west longitude. It was produced using data from the X-Band, C-Band and L-Band radars that comprise the Spaceborne Imaging Radar-C and X-Band Synthetic Aperture Radar (SIR-C/X-SAR). SIR-C/X-SAR acquired this image on the 20th orbit of the Space Shuttle Endeavour. The area is located 40 kilometers north and 30 kilometers east of the town of Prince Albert in the Saskatchewan province of Canada. The image covers the area east of the Candle Lake, between gravel surface Highways 120 and 106 and west of 106. The area in the middle of the image covers the entire Nipawin (Narrow Hills) provincial park. The look angle of the radar is 30 degrees and the size of the image is approximately 20 by 50 kilometers. The red, green, and blue colors represent L-Band total power, C-Band total power, and XVV respectively. The changes in the intensity of each color are related to various surface conditions such as frozen or thawed forest, fire, deforestation and areas of regrowth. Most of the dark blue areas in the image are the ice covered lakes. The dark area on the top right corner of the image is the White Gull Lake north of the intersection of Highway 120 and 913. The right middle part of the image shows Lake Ispuchaw and Lower Fishing Lake. The deforested areas are shown by light blue in the image. Since most of the logging practice at the Prince Albert area is around the major highways, the deforested areas can be easily detected as small geometrically shaped dark regions along the roads. At the time these data were taken, a major part of the forest was either frozen or undergoing the spring thaw. In such conditions, due to low volume of water in the vegetation, a deeper layer of the canopy is imaged by the radar, revealing valuable information about the type of trees, the amount of vegetation biomass and the condition of the surface. As the frequency increases, the penetration depth in the canopy decreases. Over forest canopies, the X-Band radar contains information about the top of the canopy. Whereas, C-Band and L-Band radar returns show contributions from the crown and trunk areas respectively. The bright areas in the image are dense mixed aspen and old jackpine forests where the return from all three bands is high. The reddish area corresponds to more sparse old jack pine (12 to 17 meters in height and 60 to 75 years old) where the L-Band signal penetrates deeper in the canopy and dominates C-Band and X-Band returns. Comparison of the image with the forest cover map of the area indicates that the three band radar can be used to classify various stands. SIR-C/X-SAR is part of NASA's Mission to Planet Earth (MTPE). SIR-C/X-SAR radars illuminate Earth with microwaves allowing detailed observations at any time, regardless of weather or sunlight conditions. SIR-C/X-SAR uses three microwave wavelengths: L-Band (24 cm), C-Band (6 cm), and X-Band (3 cm). The multi-frequency data will be used by the international scientific community to better understand the global environment and how it is changing. The SIR-C/X-SAR data, complemented by aircraft and ground studies, will give scientists clearer insights into those environmental changes which are caused by nature and those changes which are induced by human activity. SIR-C was developed by NASA's Jet Propulsion Laboratory (JPL). X-SAR was developed by the Dornire and Alenia Spazio Companies for the German Space Agency, Deutsche Agentur fuer Raumfahrtangelegenheiten (DARA), and the Italian Space Agency, Agenzia Spaziale Italiana (ASI). JPL Photo ID: P-43929

NASA image acquired August 4, 2010 Though many areas in northwest Pakistan were bracing for heavy rain and additional flash flooding on August 4, 2010, the city of Kheshgi, in northwest Pakistan, had clear skies. This image, taken by the Advanced Spaceborne Thermal Emission and Reflection Radiometer (ASTER) on NASA’s Terra satellite reveals a city awash in flood water. Thick with mud, the Kabul River is pale green in this false color image. Clearer water is dark blue. The river flows through its usual channel, but in places, water seeps over the channel and across the landscape. The buildings and roads of Kheshgi are silver. Spots of turquoise blue—shallow, muddy water or water-logged ground—covers several sections of the city. On the south side of the Kabul River, water flows down the hills, washing over neighborhoods. The bare ground in the hills is brown and tan. Plant-covered land, red in this image, is divided into long, narrow rectangles, pointing to agriculture. Geometric shapes under the water near the river are probably submerged fields of crops. Thousands of acres of crops had been lost in floods throughout Pakistan, said the United Nations. Kheshgi is in the Nowshera district in the Khyber Pakhutnkhwa province. As of August 2, Khyber Pakhutnkhwa was the hardest hit province in Pakistan, said the United Nations, and Nowshera was the most impacted district in the province. Nowshera reported 500,000 people displaced with 161 dead, said the Government of Khuber Pakhtunkhwa. The floods affected communities throughout Pakistan. More than 1,100 people had died, 15,000 homes were damaged or destroyed, and at least one million people were in need of emergency assistance throughout Pakistan, said the United Nations on August 2. The floods occurred as unusually heavy monsoon rains fell over Pakistan. NASA image courtesy NASA/GSFC/MITI/ERSDAC/JAROS, and U.S./Japan ASTER Science Team. Caption by Holli Riebeek. Instrument: Terra - ASTER Credit: <b><a href="#//earthobservatory.nasa.gov/" rel="nofollow"> NASA’s Earth Observatory</a></b> To learn more about this image go here: <a href="http://earthobservatory.nasa.gov/NaturalHazards/view.php?id=45050" rel="nofollow">earthobservatory.nasa.gov/NaturalHazards/view.php?id=45050</a> Or here: <a href="http://earthobservatory.nasa.gov/NaturalHazards/view.php?id=45343" rel="nofollow">earthobservatory.nasa.gov/NaturalHazards/view.php?id=45343</a> <b><a href="http://www.nasa.gov/centers/goddard/home/index.html" rel="nofollow">NASA Goddard Space Flight Center</a></b> is home to the nation's largest organization of combined scientists, engineers and technologists that build spacecraft, instruments and new technology to study the Earth, the sun, our solar system, and the universe. <b>Follow us on <a href="http://twitter.com/NASA_GoddardPix" rel="nofollow">Twitter</a></b> <b>Join us on <a href="http://www.facebook.com/pages/Greenbelt-MD/NASA-Goddard/395013845897?ref=tsd" rel="nofollow">Facebook</a></b>