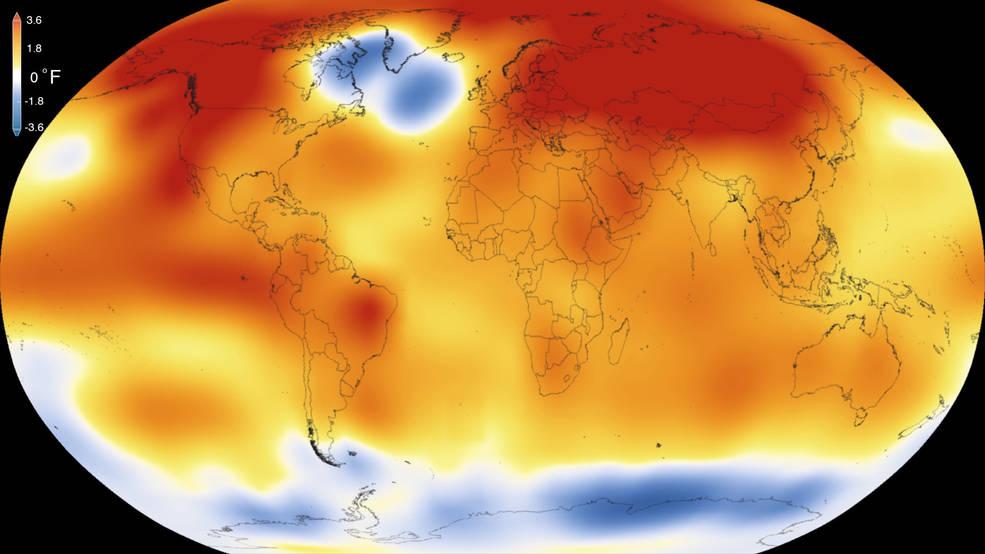
2015 was the warmest year since modern record-keeping began in 1880, according to a new analysis by NASA’s Goddard Institute for Space Studies. The record-breaking year continues a long-term warming trend — 15 of the 16 warmest years on record have now occurred since 2001. Credits: Scientific Visualization Studio/Goddard Space Flight Center Details: Earth’s 2015 surface temperatures were the warmest since modern record keeping began in 1880, according to independent analyses by NASA and the National Oceanic and Atmospheric Administration (NOAA). Globally-averaged temperatures in 2015 shattered the previous mark set in 2014 by 0.23 degrees Fahrenheit (0.13 Celsius). Only once before, in 1998, has the new record been greater than the old record by this much. The 2015 temperatures continue a long-term warming trend, according to analyses by scientists at NASA’s Goddard Institute for Space Studies (GISS) in New York (GISTEMP). NOAA scientists agreed with the finding that 2015 was the warmest year on record based on separate, independent analyses of the data. Because weather station locations and measurements change over time, there is some uncertainty in the individual values in the GISTEMP index. Taking this into account, NASA analysis estimates 2015 was the warmest year with 94 percent certainty.

2015 was the warmest year since modern record-keeping began in 1880, according to a new analysis by NASA’s Goddard Institute for Space Studies. The record-breaking year continues a long-term warming trend — 15 of the 16 warmest years on record have now occurred since 2001. Credits: Scientific Visualization Studio/Goddard Space Flight Center Details: Earth’s 2015 surface temperatures were the warmest since modern record keeping began in 1880, according to independent analyses by NASA and the National Oceanic and Atmospheric Administration (NOAA). Globally-averaged temperatures in 2015 shattered the previous mark set in 2014 by 0.23 degrees Fahrenheit (0.13 Celsius). Only once before, in 1998, has the new record been greater than the old record by this much. The 2015 temperatures continue a long-term warming trend, according to analyses by scientists at NASA’s Goddard Institute for Space Studies (GISS) in New York (GISTEMP). NOAA scientists agreed with the finding that 2015 was the warmest year on record based on separate, independent analyses of the data. Because weather station locations and measurements change over time, there is some uncertainty in the individual values in the GISTEMP index. Taking this into account, NASA analysis estimates 2015 was the warmest year with 94 percent certainty. Read more: <a href="http://www.nasa.gov/press-release/nasa-noaa-analyses-reveal-record-shattering-global-warm-temperatures-in-2015" rel="nofollow">www.nasa.gov/press-release/nasa-noaa-analyses-reveal-reco...</a> <b><a href="http://www.nasa.gov/audience/formedia/features/MP_Photo_Guidelines.html" rel="nofollow">NASA image use policy.</a></b> <b><a href="http://www.nasa.gov/centers/goddard/home/index.html" rel="nofollow">NASA Goddard Space Flight Center</a></b> enables NASA’s mission through four scientific endeavors: Earth Science, Heliophysics, Solar System Exploration, and Astrophysics. Goddard plays a leading role in NASA’s accomplishments by contributing compelling scientific knowledge to advance the Agency’s mission. <b>Follow us on <a href="http://twitter.com/NASAGoddardPix" rel="nofollow">Twitter</a></b> <b>Like us on <a href="http://www.facebook.com/pages/Greenbelt-MD/NASA-Goddard/395013845897?ref=tsd" rel="nofollow">Facebook</a></b> <b>Find us on <a href="http://instagrid.me/nasagoddard/?vm=grid" rel="nofollow">Instagram</a></b>

This image from NASA Terra spacecraft shows the town of Kirkenes in northernmost Norway, with its 3400 inhabitants, as they prepare for an expected boom as a shipping hub, as global warming has led to the opening up of the Northern Sea Route.
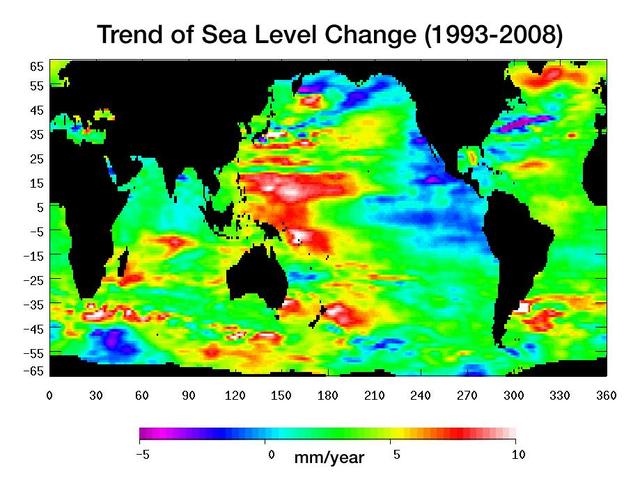
Warming water and melting land ice have raised global mean sea level 4.5 centimeters 1.7 inches from 1993 to 2008. But the rise is by no means uniform.
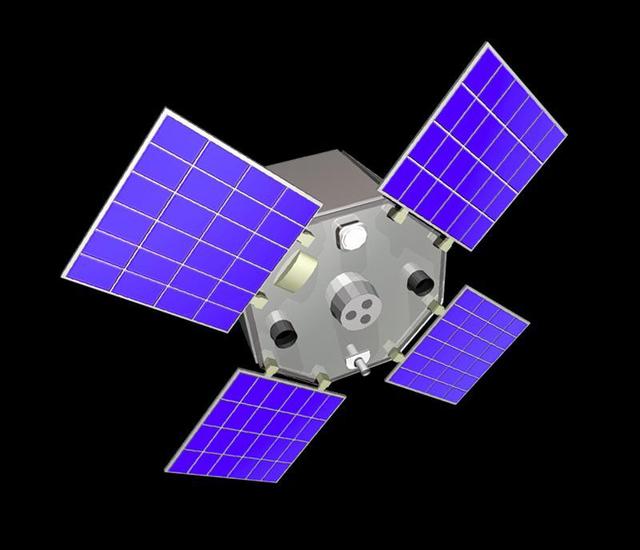
The Active Cavity Irradiance Monitor Satellite, or ACRIMSAT, mission is a climate change investigation that measures changes in how much of the sun's energy reaches Earth's atmosphere. This energy, called solar irradience, creates winds, heats the land and drives ocean currents, and therefore contains significant data that climatologists can use to improve predictions of climate change and global warming. The satellite's Active Cavity Irradiance Monitor III instrument, now in its third generation, has been used since the 1980s to study solar irradiance and its impacts on global warming. Scientists, using data from the instrument, now theorize that there is a significant correlation between solar radiation and global warming. ACRIMSAT completed its five-year primary mission in 2005 when it began operating under its extended mission. http://photojournal.jpl.nasa.gov/catalog/PIA18157
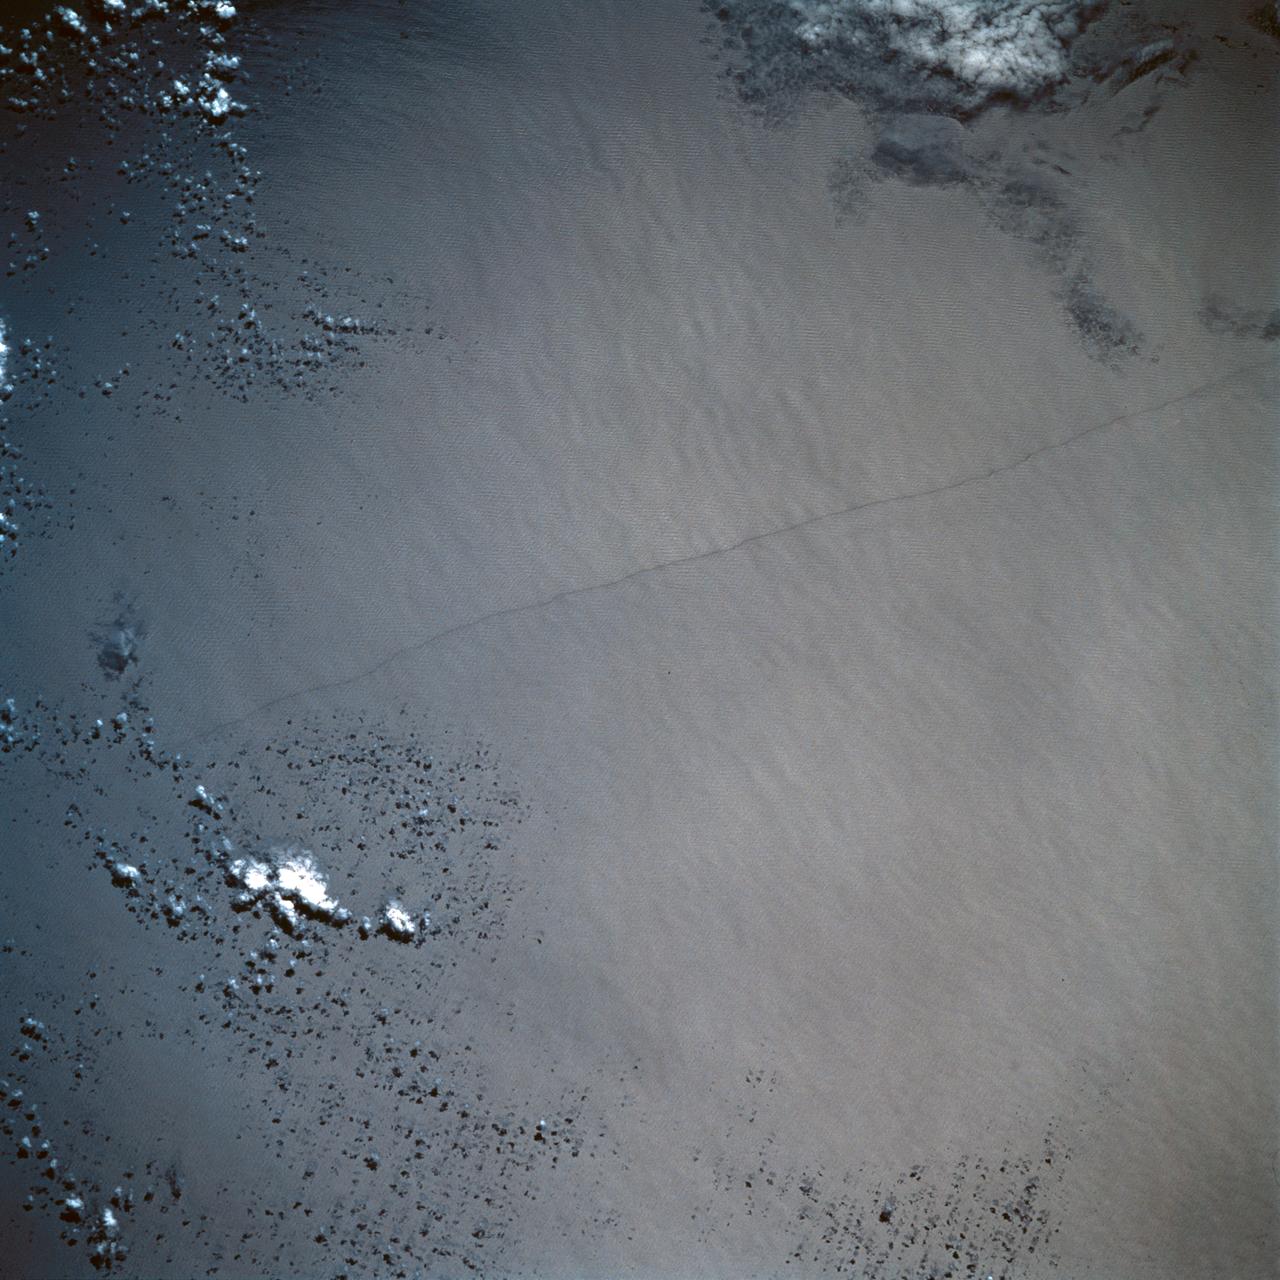
STS054-95-042 (13-19 Jan 1993) --- The Equatorial Pacific Ocean is represented in this 70mm view. The international oceanographic research community is presently conducting a program called Joint Global Ocean Flux Study (JGOFS) to study the global ocean carbon budget. A considerable amount of effort within this program is presently being focused on the Equatorial Pacific Ocean because of the high annual average biological productivity. The high productivity is the result of nearly constant easterly winds causing cool, nutrient-rich water to well up at the equator. In this view of the sun glint pattern was photographed at about 2 degrees north latitude, 103 degrees west longitude, as the Space Shuttle passed over the Equatorial Pacific. The long narrow line is the equatorial front, which defines the boundary between warm surface equatorial water and cool, recently upwelled water. Such features are of interest to the JGOFS researchers and it is anticipated that photographs such as this will benefit the JGOFS program.
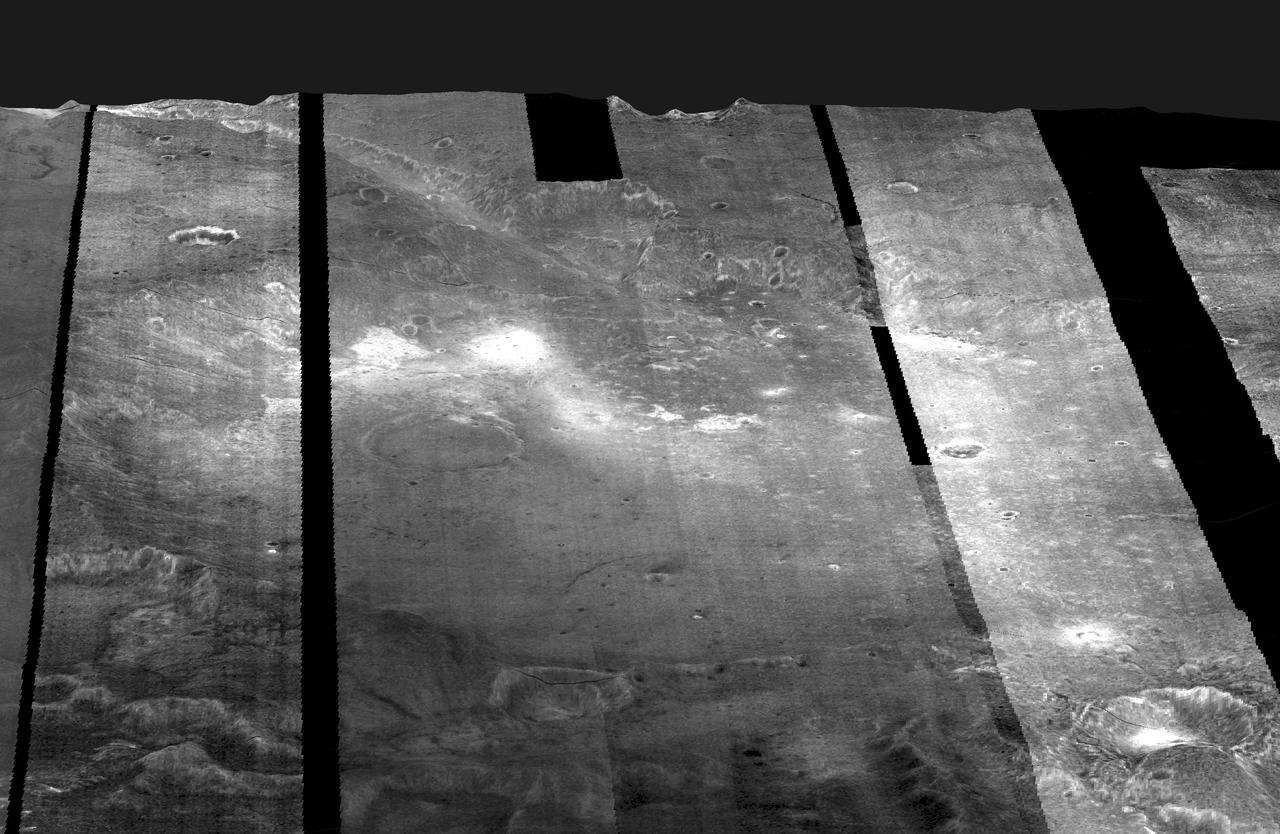
Images from NASA's Mars Odyssey spacecraft were used to create this mosaic of nighttime infrared images of Gusev Crater, which has been draped over topography data obtained by NASA Mars Global Surveyor. Variations in nighttime temperatures are due to differences in the abundance of rocky materials that retain their heat at night and stay relatively warm (bright). Fine grained dust and sand (dark) cools off more rapidly at night. This image mosaic covers an area approximately 180 kilometers (110 miles) on each side centered near 14 degrees S, 175 degrees E, looking toward the south in this simulated view. http://photojournal.jpl.nasa.gov/catalog/PIA04261
The year 2014 now ranks as the warmest on record since 1880, according to an analysis by NASA scientists. Nine of the 10 warmest years since modern records began have now occurred since 2000, according to a global temperature analysis by scientists at NASA’s Goddard Institute for Space Studies in New York. 2014’s record-breaking warmth continues a long-term trend of a warming climate. The global average temperature has increased about 1.4 degrees Fahrenheit (0.8 degrees Celsius) since 1880, with most of that warming occurring during the last three to four decades. The warming trend is largely driven by the increasing concentrations of carbon dioxide and other heat-trapping greenhouse gases in the atmosphere, caused by human emissions. Read more: <a href="http://1.usa.gov/1znaGfS" rel="nofollow">1.usa.gov/1znaGfS</a> <b><a href="http://www.nasa.gov/audience/formedia/features/MP_Photo_Guidelines.html" rel="nofollow">NASA image use policy.</a></b> <b><a href="http://www.nasa.gov/centers/goddard/home/index.html" rel="nofollow">NASA Goddard Space Flight Center</a></b> enables NASA’s mission through four scientific endeavors: Earth Science, Heliophysics, Solar System Exploration, and Astrophysics. Goddard plays a leading role in NASA’s accomplishments by contributing compelling scientific knowledge to advance the Agency’s mission. <b>Follow us on <a href="http://twitter.com/NASAGoddardPix" rel="nofollow">Twitter</a></b> <b>Like us on <a href="http://www.facebook.com/pages/Greenbelt-MD/NASA-Goddard/395013845897?ref=tsd" rel="nofollow">Facebook</a></b> <b>Find us on <a href="http://instagram.com/nasagoddard?vm=grid" rel="nofollow">Instagram</a></b>

This global map of Mars shows a growing dust storm as of June 6, 2018. The map was produced by the Mars Color Imager (MARCI) camera on NASA's Mars Reconnaissance Orbiter spacecraft. The blue dot shows the approximate location of Opportunity. The storm was first detected on June 1. The MARCI camera has been used to monitor the storm ever since. Full dust storms like this one are not surprising, but are infrequent. They can crop up suddenly but last weeks, even months. During southern summer, sunlight warms dust particles, lifting them higher into the atmosphere and creating more wind. That wind kicks up yet more dust, creating a feedback loop that NASA scientists still seek to understand. https://photojournal.jpl.nasa.gov/catalog/PIA22329
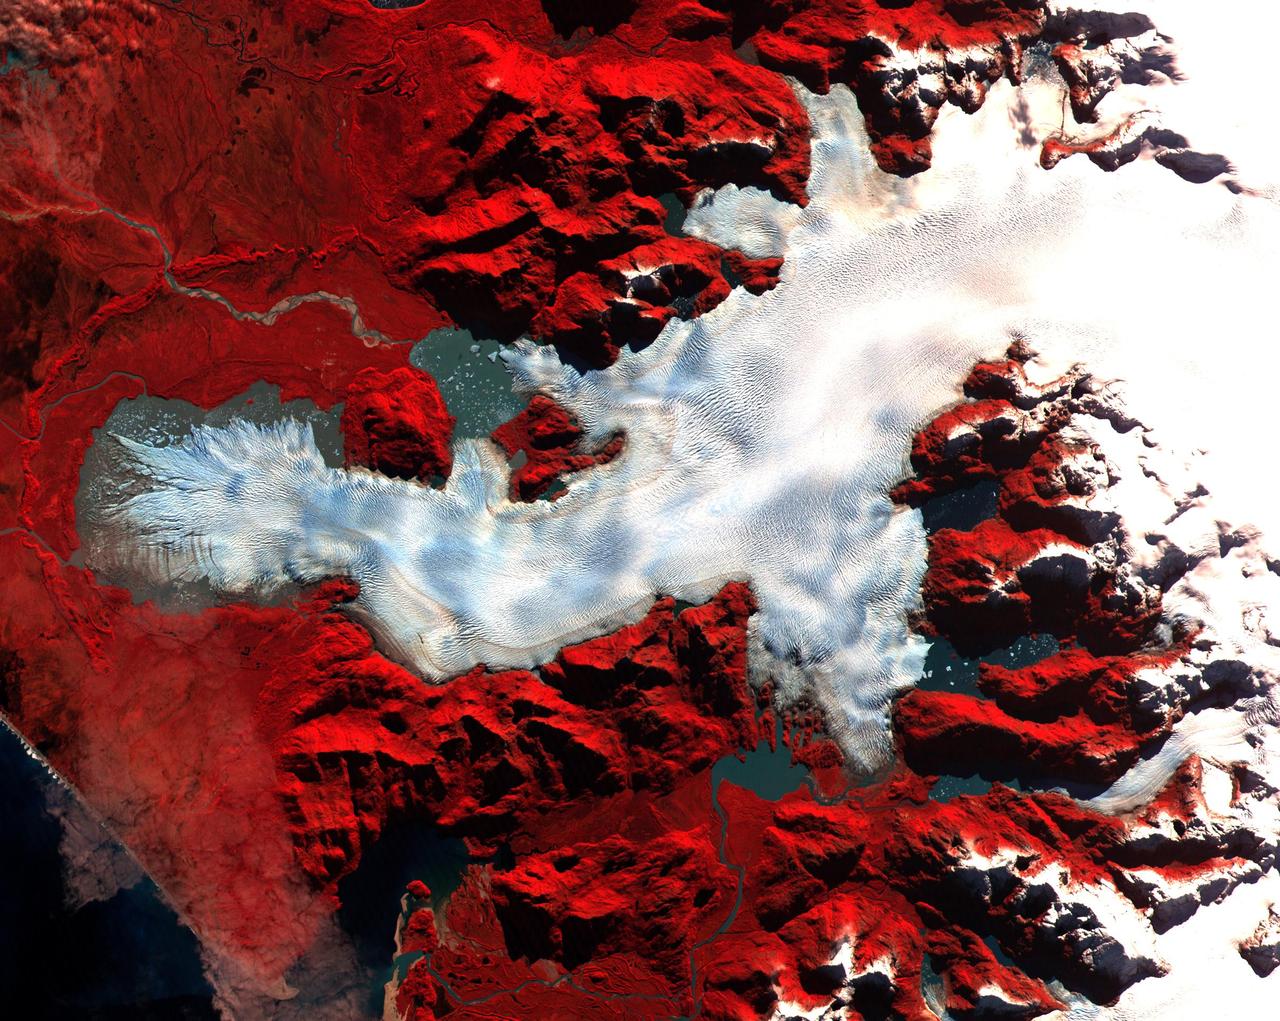
This ASTER image was acquired on May 2, 2000 over the North Patagonia Ice Sheet, Chile near latitude 47 degrees south, longitude 73 degrees west. The image covers 36 x 30 km. The false color composite displays vegetation in red. The image dramatically shows a single large glacier, covered with crevasses. A semi-circular terminal moraine indicates that the glacier was once more extensive than at present. ASTER data are being acquired over hundreds of glaciers worldwide to measure their changes over time. Since glaciers are sensitive indicators of warming or cooling, this program can provide global data set critical to understand climate change. This image is located at 46.5 degrees south latitude and 73.9 degrees west longitude. http://photojournal.jpl.nasa.gov/catalog/PIA02670
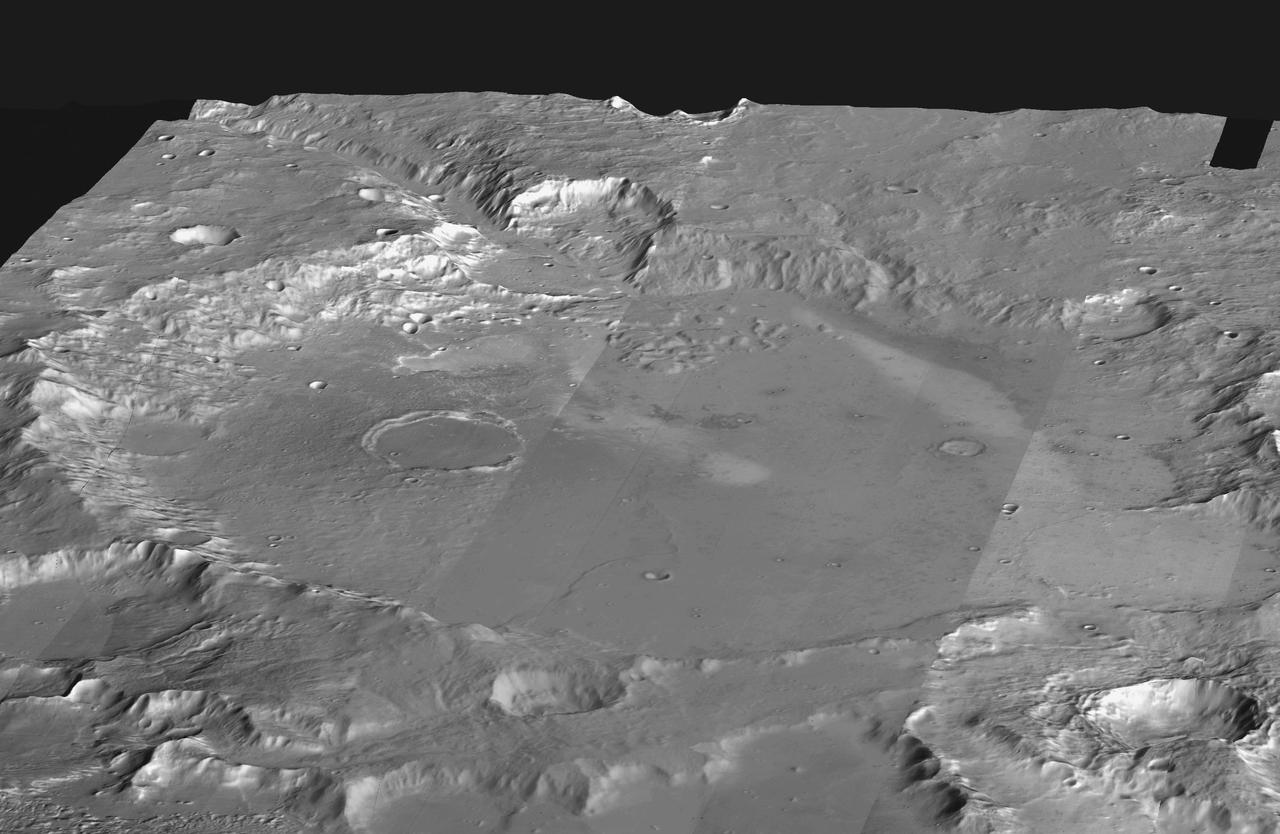
This mosaic of daytime infrared images of Gusev Crater, taken by NASA Mars Odyssey spacecraft, has been draped over topography data obtained by NASA Mars Global Surveyor. The daytime temperatures range from approximately minus 45 degrees C (black) to minus 5 degrees C (white). The temperature differences in these daytime images are due primarily to lighting effects, where sunlit slopes are warm (bright) and shadowed slopes are cool (dark). Gusev crater is a potential landing site for the Mars Exploration Rovers. The large ancient river channel of Ma'Adim that once flowed into Gusev can be seen at the top of the mosaic. This image mosaic covers an area approximately 180 kilometers (110 miles) on each side centered near 14 degrees S, 175 degrees E, looking toward the south in this simulated view. http://photojournal.jpl.nasa.gov/catalog/PIA04260
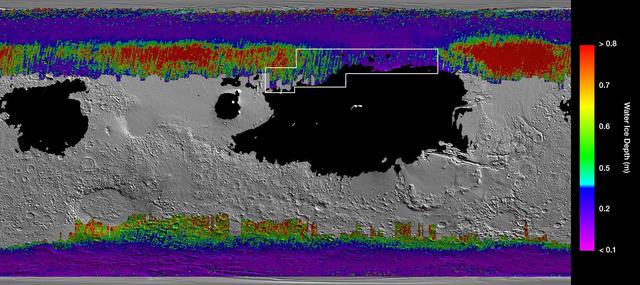
This rainbow-colored map shows underground water ice on Mars. Cool colors represent less than one foot (30 centimeters) below the surface; warm colors are over two feet (60 centimeters) deep. Sprawling black zones on the map represent areas where a landing spacecraft would sink into fine dust. The outlined box represents the ideal region to send astronauts for them to be able to dig up water ice. The map was created by combining data from multiple NASA orbiters, including the Mars Reconnaissance Orbiter and its Mars Climate Sounder instrument; Mars Odyssey and its Thermal Emission Imaging System; and the Mars Global Surveyor. https://photojournal.jpl.nasa.gov/catalog/PIA23514
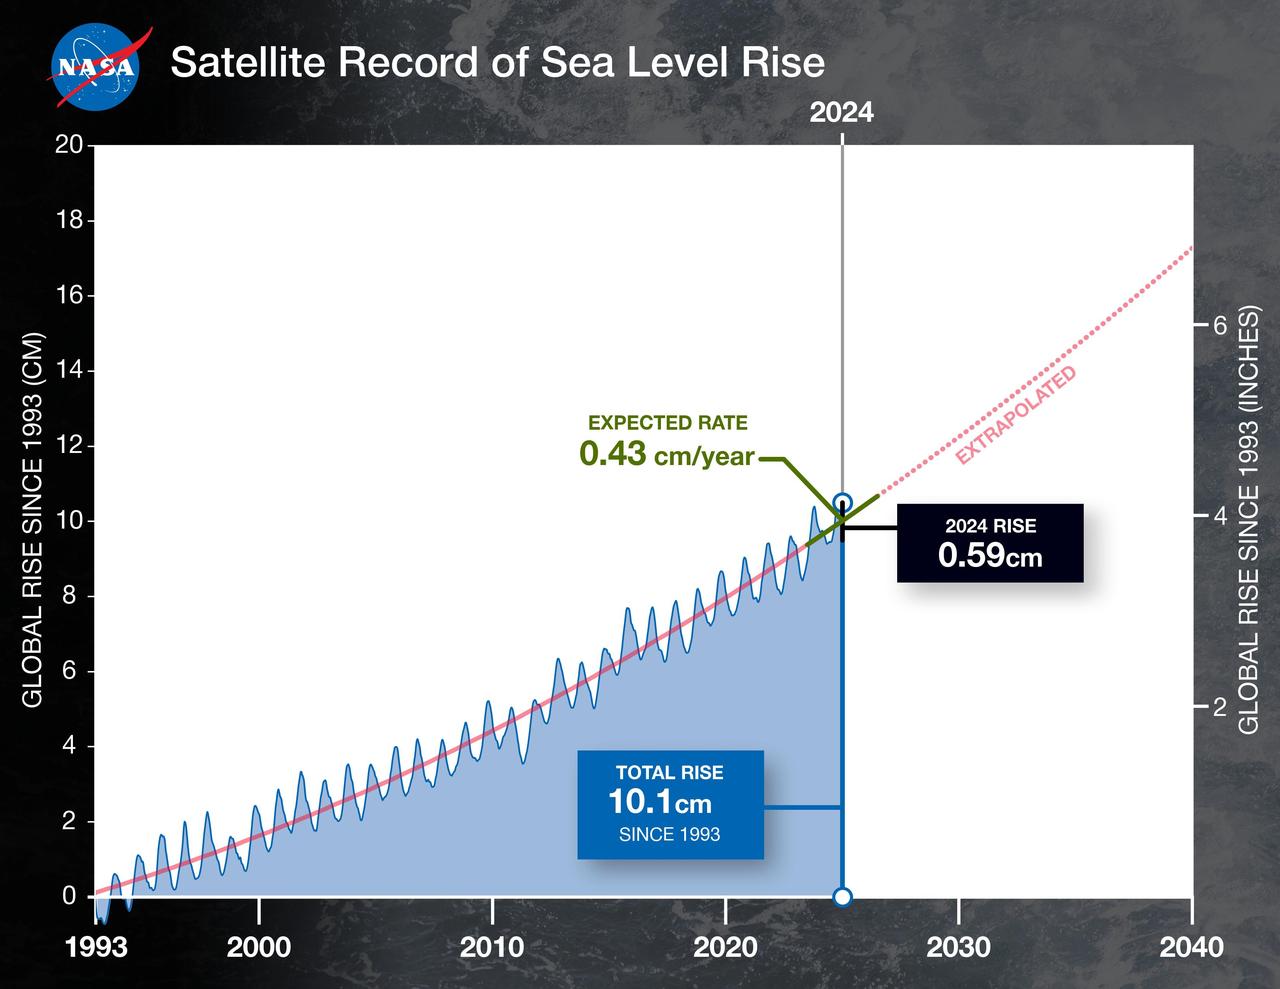
This graph shows the rise in global mean sea level from 1993 to 2024 based on data from a series of five international satellites. The solid red line indicates the trajectory of this increase, which has more than doubled over the three decades. The dotted red line projects future sea level rise. Global sea level rose faster than expected in 2024 due mostly to ocean water expanding as it warms, or thermal expansion. According to a NASA-led analysis, last year's rate of rise was 0.23 inches (0.59 centimeters) per year, compared to the expected rate of 0.17 inches (0.43 centimeters) per year. In recent years, about two-thirds of sea level rise was due to the addition of water from land into the ocean by melting ice sheets and glaciers. About a third came from thermal expansion of seawater. But in 2024, those contributions flipped, with two-thirds of sea level rise coming from thermal expansion. This NASA-led analysis is based on a sea level dataset featuring more than 30 years of satellite observations, starting with the U.S.-French TOPEX/Poseidon mission, which launched in 1992. The Sentinel-6 Michael Freilich mission, which launched in November 2020, is the latest in the series of satellites that have contributed to this sea level record. https://photojournal.jpl.nasa.gov/catalog/PIA26189
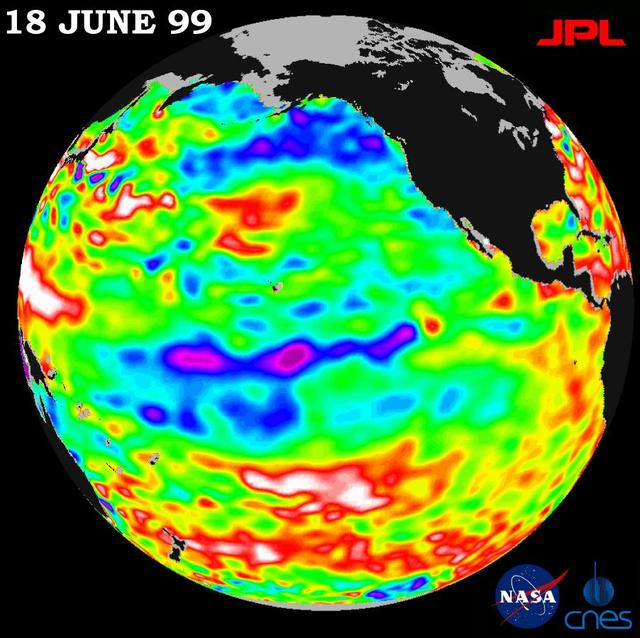
Lingering just a month ago in the eastern Pacific Ocean, the La Niña phenomenon, with its large volume of chilly water, barely has a pulse this month, according to new satellite data from NASA U.S.-French TOPEX/Poseidon mission. The data, taken during a 10-day cycle of data collection ending June 18, show that the equatorial Pacific Ocean is warming up and returning to normal (green) as La Niña all but vanishes. The warming trend is most apparent in the equatorial Pacific Ocean, where only a few patches of cooler, low sea levels (seen in blue and purple) remain. The blue areas are between 5 and 13 centimeters (2 and 5 inches) below normal, whereas the purple areas range from 14 to 18 centimeters (6 to 7 inches) below normal. Like its counterpart, El Niño, a La Niña condition will influence global climate and weather until it has completely subsided. As summer begins in the northern hemisphere, lower-than-normal sea surface levels and cool ocean temperatures persist in the northeastern Gulf of Alaska and along the western coast of North America. In contrast, the trend is the opposite over most of the Pacific, where above-normal sea surface heights and warmer ocean temperatures (indicated by the red and white areas) appear to be increasing and dominating the overall Pacific Ocean. Red areas are about 10 centimeters (4 inches) above normal; white areas show the sea surface height is between 14 and 32 centimeters (6 and 13 inches) above normal. Scientists are not ready to administer last rites to La Niña, though. In the last 12 months, the pool of unusually cold water in the Pacific has shrunk (warmed) several times before cooling (expanding) again. This summer's altimeter data will help them determine whether La Niña has truly dissipated or whether they will see another resurgence of cool water in the Pacific. http://photojournal.jpl.nasa.gov/catalog/PIA01586
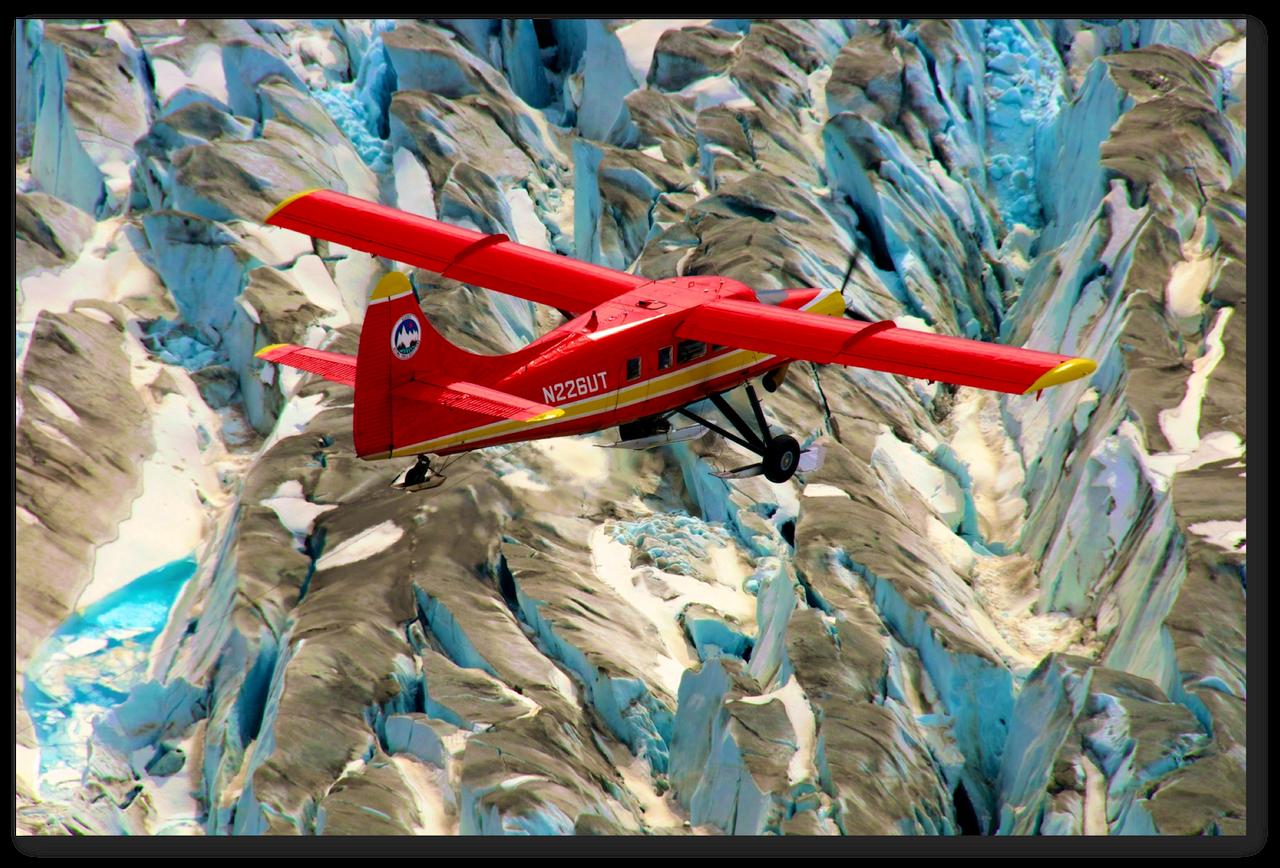
This red plane is a DHC-3 Otter, the plane flown in NASA's Operation IceBridge-Alaska surveys of mountain glaciers in Alaska. Credit: Chris Larsen, University of Alaska-Fairbanks Over the past few decades, average global temperatures have been on the rise, and this warming is happening two to three times faster in the Arctic. As the region’s summer comes to a close, NASA is hard at work studying how rising temperatures are affecting the Arctic. NASA researchers this summer and fall are carrying out three Alaska-based airborne research campaigns aimed at measuring greenhouse gas concentrations near Earth’s surface, monitoring Alaskan glaciers, and collecting data on Arctic sea ice and clouds. Observations from these NASA campaigns will give researchers a better understanding of how the Arctic is responding to rising temperatures. The Arctic Radiation – IceBridge Sea and Ice Experiment, or ARISE, is a new NASA airborne campaign to collect data on thinning sea ice and measure cloud and atmospheric properties in the Arctic. The campaign was designed to address questions about the relationship between retreating sea ice and the Arctic climate. Arctic sea ice reflects sunlight away from Earth, moderating warming in the region. Loss of sea ice means more heat from the sun is absorbed by the ocean surface, adding to Arctic warming. In addition, the larger amount of open water leads to more moisture in the air, which affects the formation of clouds that have their own effect on warming, either enhancing or reducing it. Read more: <a href="http://www.nasa.gov/earthrightnow" rel="nofollow">www.nasa.gov/earthrightnow</a> <b><a href="http://www.nasa.gov/audience/formedia/features/MP_Photo_Guidelines.html" rel="nofollow">NASA image use policy.</a></b> <b><a href="http://www.nasa.gov/centers/goddard/home/index.html" rel="nofollow">NASA Goddard Space Flight Center</a></b> enables NASA’s mission through four scientific endeavors: Earth Science, Heliophysics, Solar System Exploration, and Astrophysics. Goddard plays a leading role in NASA’s accomplishments by contributing compelling scientific knowledge to advance the Agency’s mission. <b>Follow us on <a href="http://twitter.com/NASAGoddardPix" rel="nofollow">Twitter</a></b> <b>Like us on <a href="http://www.facebook.com/pages/Greenbelt-MD/NASA-Goddard/395013845897?ref=tsd" rel="nofollow">Facebook</a></b> <b>Find us on <a href="http://instagram.com/nasagoddard?vm=grid" rel="nofollow">Instagram</a></b>
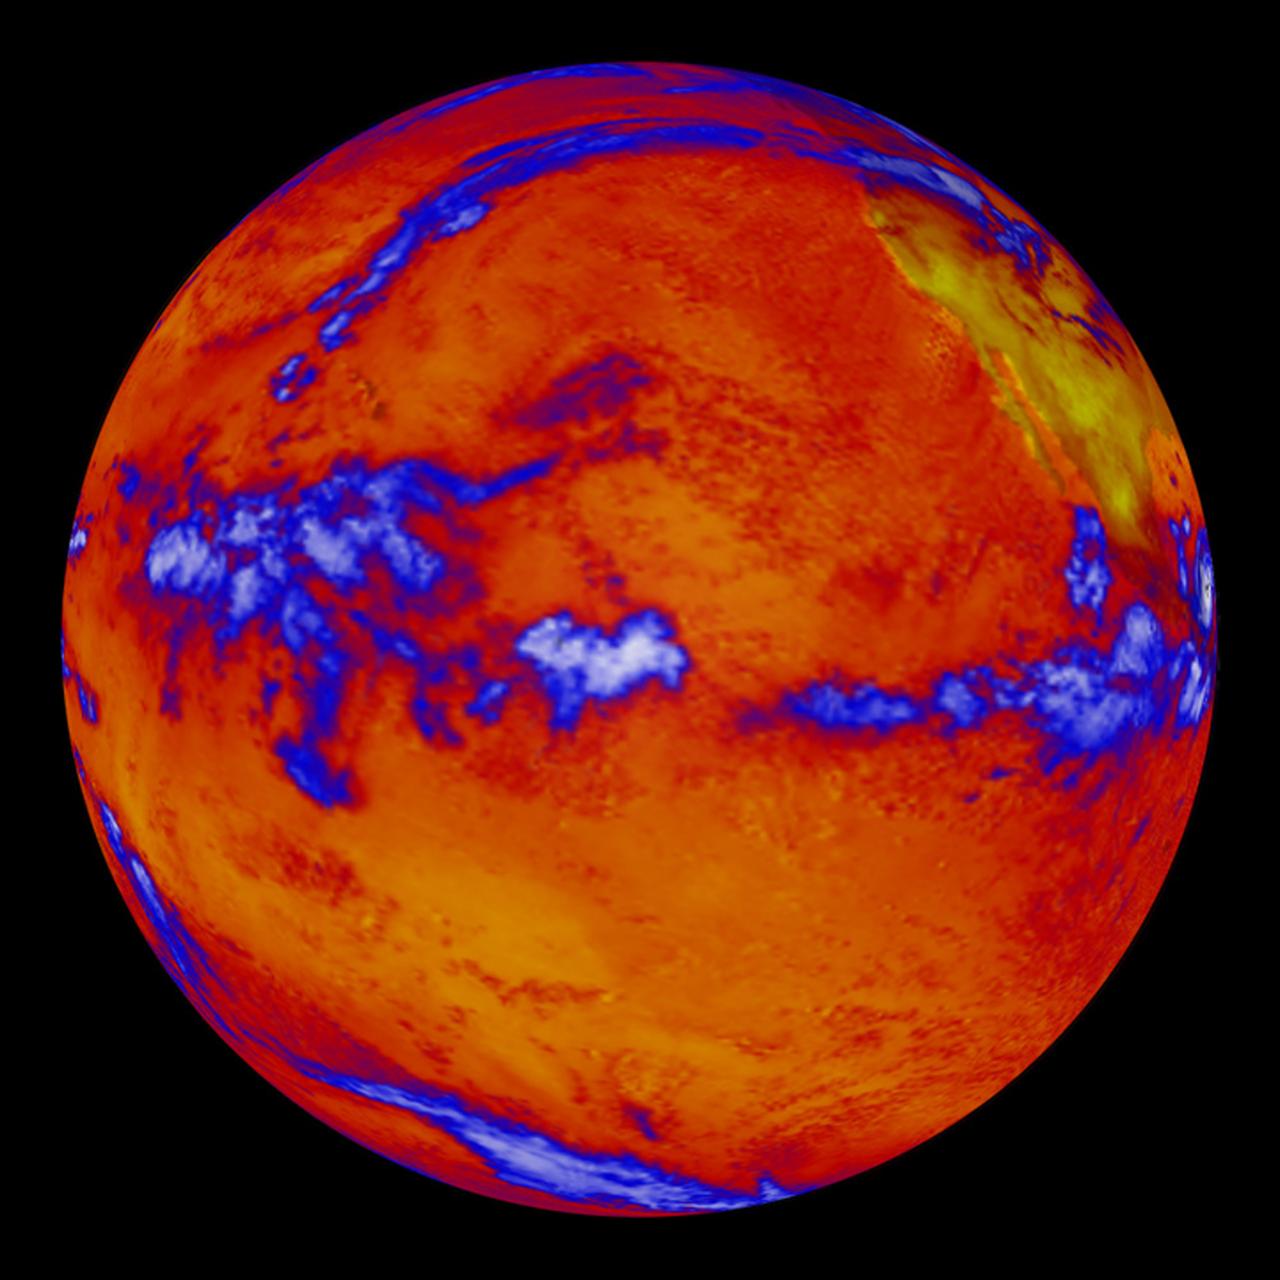
Absorption of solar energy heats up our planet's surface and atmosphere making life for us possible. But the energy carnot stay bound up in the Earth's environment forever. If it did, the Earth would be as hot as the sun. Instead, as the surface and atmosphere warm, they emit thermal long wave radiation, some of which escapes into space and allows the Earth to cool. This false color image of the Earth was produced by the Clouds and the Earth's Radiant Energy System (CERES) instrument flying aboard NASA's Terra spacecraft. The image shows where more or less heat, in the form of long-wave radiation, is emanating from the top of the Earth's atmosphere. As one can see in the image, the thermal radiation leaving the oceans is fairly uniform. The blue swaths represent thick clouds, the tops of which are so high they are among the coldest places on Earth. In the American Southwest, which can be seen in the upper right hand corner of the globe, there is often little cloud cover to block outgoing radiation and relatively little water to absorb solar energy making the amount of outgoing radiation in this area exceeding that of the oceans. Recently, NASA researchers discovered that incoming solar radiation and outgoing thermal radiation increased in the tropics from the 1980s to the 1990s. They believe the unexpected change has to do with apparent change in circulation patterns around the globe, which effectively reduce the amount of water vapor and cloud cover in the upper reaches of the atmosphere. Without the clouds, more sunlight was allowed to enter the tropical zones and more thermal energy was allowed to leave. The findings may have big implications for climate change and future global warming. (Image courtesy NASA Goddard)
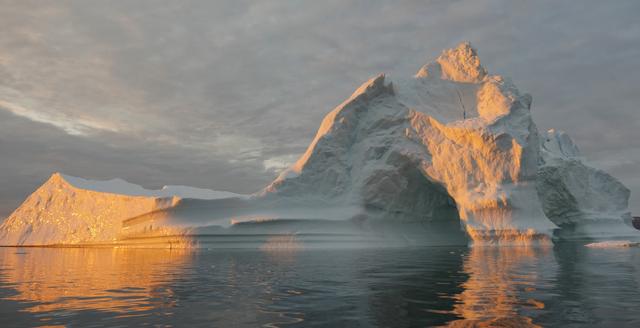
Sea level rise is a natural consequence of the warming of our planet. We know this from basic physics. When water heats up, it expands. So when the ocean warms, sea level rises. When ice is exposed to heat, it melts. And when ice on land melts and water runs into the ocean, sea level rises. For thousands of years, sea level has remained relatively stable and human communities have settled along the planet’s coastlines. But now Earth’s seas are rising. Globally, sea level has risen about eight inches since the beginning of the 20th century and more than two inches in the last 20 years alone. All signs suggest that this rise is accelerating. Read more: <a href="http://go.nasa.gov/1heZn29" rel="nofollow">go.nasa.gov/1heZn29</a> Caption: An iceberg floats in Disko Bay, near Ilulissat, Greenland, on July 24, 2015. The massive Greenland ice sheet is shedding about 300 gigatons of ice a year into the ocean, making it the single largest source of sea level rise from melting ice. Credits: NASA/Saskia Madlener <b><a href="http://www.nasa.gov/audience/formedia/features/MP_Photo_Guidelines.html" rel="nofollow">NASA image use policy.</a></b> <b><a href="http://www.nasa.gov/centers/goddard/home/index.html" rel="nofollow">NASA Goddard Space Flight Center</a></b> enables NASA’s mission through four scientific endeavors: Earth Science, Heliophysics, Solar System Exploration, and Astrophysics. Goddard plays a leading role in NASA’s accomplishments by contributing compelling scientific knowledge to advance the Agency’s mission. <b>Follow us on <a href="http://twitter.com/NASAGoddardPix" rel="nofollow">Twitter</a></b> <b>Like us on <a href="http://www.facebook.com/pages/Greenbelt-MD/NASA-Goddard/395013845897?ref=tsd" rel="nofollow">Facebook</a></b> <b>Find us on <a href="http://instagrid.me/nasagoddard/?vm=grid" rel="nofollow">Instagram</a></b>
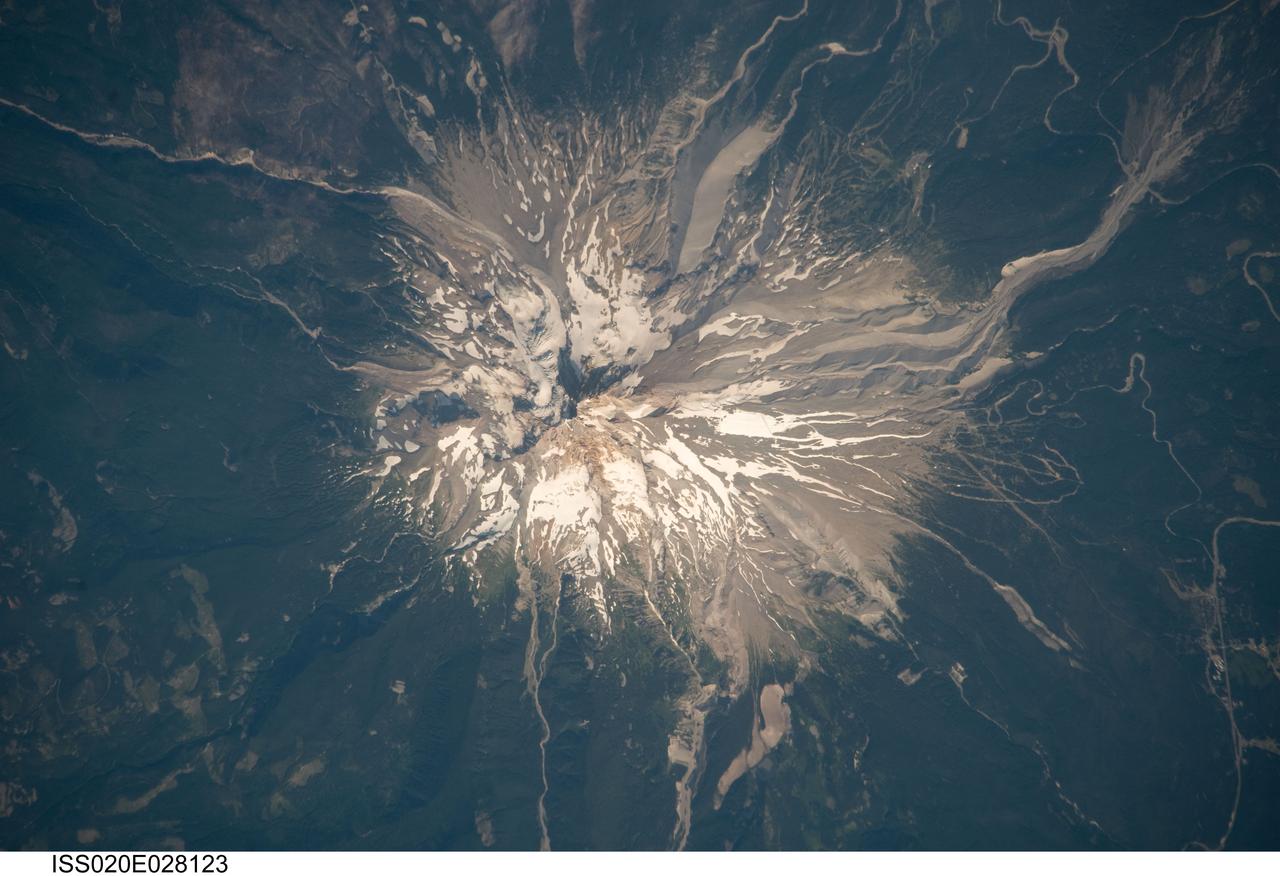
ISS020-E-028123 (5 Aug. 2009) --- Mount Hood, Oregon is featured in this image photographed by an Expedition 20 crew member on the International Space Station. Mount Hood is located within the Cascade Range of the western United States, and is the highest peak (3,426 m) in Oregon. The Cascade Range is characterized by a line of volcanoes associated with a slab of oceanic crust that is subducting, or descending underneath, the westward moving continental crust of North America. Magma generated by the subduction process rises upward through the crust and feeds a line of active volcanoes that extends from northern California in the United States to southern British Columbia in Canada. While hot springs and steam vents are still active on Mount Hood, the last eruption from the volcano occurred in 1866. The volcano is considered dormant, but still actively monitored. Separate phases of eruptive activity produced pyroclastic flows and lahars ? mudflows ? that carried erupted materials down all of the major rivers draining the volcano. Gray volcanic deposits extend southwards along the banks of the White River (upper right), and form several prominent ridges along the southeast to southwest flanks of the volcano. The deposits contrast sharply with the green vegetated lower flanks of the volcano. The Mount Hood stratovolcano ? a typically cone-shaped volcanic structure formed by interlayered lava flows and explosive eruption deposits ? hosts twelve mapped glaciers along its upper flanks (center). Like other glaciers in the Pacific Northwest, the Hood glaciers have been receding due to global warming, and have lost an estimated 61 percent of their volume over the past century. The predicted loss of glacial meltwater under future warming scenarios will have significant effects on regional hydrology and water supplies.
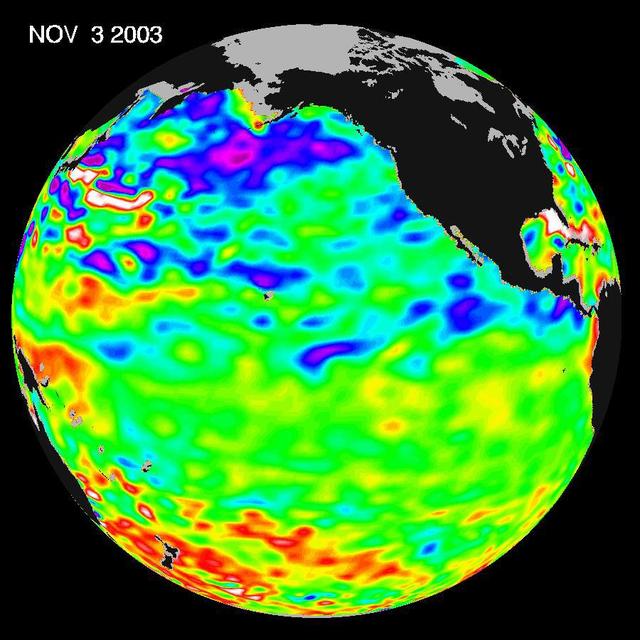
Some climate forecast models indicate there is an above average chance that there could be a weak to borderline El Niño by the end of November 2003. However, the trade winds, blowing from east to west across the equatorial Pacific Ocean, remain strong. Thus, there remains some uncertainty among climate scientists as to whether the warm temperature anomaly will form again this year. The latest remote sensing data from NASA's Jason satellite show near normal conditions across the equatorial Pacific. There are currently no visible signs in sea surface height of an impending El Niño. This equatorial quiet contrasts with the Bering Sea, Gulf of Alaska and U.S. West Coast where lower-than-normal sea surface levels and cool ocean temperatures continue (indicated by blue and purple areas). The image above is a global map of sea surface height, accurate to within 30 millimeters. The image represents data collected and composited over a 10-day period, ending on Nov. 3, 2003. The height of the water relates to the temperature of the water. As the ocean warms, its level rises; and as it cools, its level falls. Yellow and red areas indicate where the waters are relatively warmer and have expanded above sea level, green indicates near normal sea level, and blue and purple areas show where the waters are relatively colder and the surface is lower than sea level. The blue areas are between 5 and 13 centimeters (2 and 5 inches) below normal, whereas the purple areas range from 14 to 18 centimeters (6 to 7 inches) below normal. http://photojournal.jpl.nasa.gov/catalog/PIA04878
STS059-S-027 (10 April 1994) --- This image is a false-color composite of Raco, Michigan, centered at 46.39 degrees north latitude, 84.88 degrees east longitude. This image was acquired by the Spaceborne Imaging Radar-C and X-Band Synthetic Aperture Radar (SIR-C/X-SAR) aboard the Space Shuttle Endeavour on its 6th orbit and during the first full-capacity test of the instrument. This image was produced using both L-Band and C-Band data. The area shown is approximately 20 kilometers by 50 kilometers. Raco is located at the eastern end of Michigan's upper peninsula, west of Sault Ste. Marie and south of Whitefish Bay on Lake Superior. The site is located at the boundary between the boreal forests and the northern temperate forests, a transitional zone that is expected to be ecologically sensitive to anticipated global changes resulting from climatic warming. On any given day, there is a 60 percent chance that this area will be obscured to some extent by cloud cover which makes it difficult to image using optical sensors. In this color representation (Red=LHH, Green=LHV, Blue=CHH), darker areas in the image are smooth surfaces such as frozen lakes and other non-forested areas. The colors are related to the types of trees and the brightness is related to the amount of plant material covering the surface, called forest biomass. Accurate information about land-cover is important to area resource managers and for use in regional- to global-scale scientific models used to understand global change. SIR-C/X-SAR radars illuminate Earth with microwaves allowing detailed observations at any time, regardless of weather or sunlight conditions. SIR-C/X-SAR uses three microwave wavelengths: L-Band (24 cm), C-Band (6 cm), and X-Band (3 cm). The multi-frequency data will be used by the international scientific community to better understand the global environment and how it is changing. The SIR-C/X-SAR data, complemented by aircraft and ground studies, will give scientists clearer insights into those environmental changes which are caused by nature and those changes which are induced by human activity. SIR-C was developed by NASA's Jet Propulsion Laboratory (JPL). X-SAR was developed by the Dornire and Alenia Spazio Companies for the German Space Agency, Deutsche Agentur fuer Raumfahrtangelegenheiten (DARA), and the Italian Space Agency, Agenzia Spaziale Italiana (ASI). JPL Photo ID: P-43882
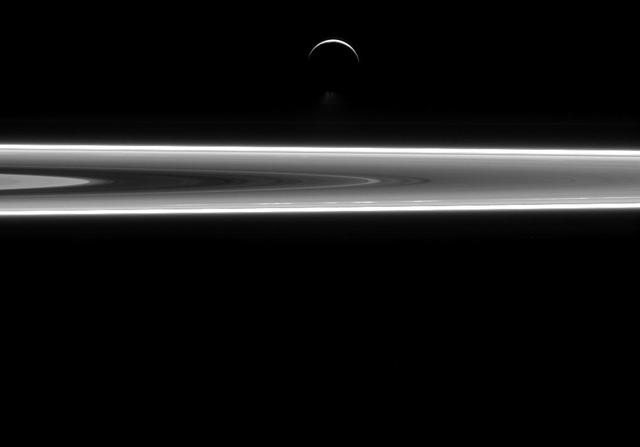
Although Enceladus and Saturn's rings are largely made up of water ice, they show very different characteristics. The small ring particles are too tiny to retain internal heat and have no way to get warm, so they are frozen and geologically dead. Enceladus, on the other hand, is subject to forces that heat its interior to this very day. This results in its famous south polar water jets, which are just visible above the moon's dark, southern limb, along with a sub-surface ocean. Recent work by Cassini scientists suggests that Enceladus (313 miles or 504 kilometers across) has a global ocean of liquid water under its surface. This discovery increases scientists' interest in Enceladus and the quest to understand the role of water in the development of life in the solar system. (For more on the sub-surface ocean, see this story.) This view looks toward the unilluminated side of the rings from about 0.3 degrees below the ring plane. The image was taken in visible light with the Cassini spacecraft narrow-angle camera on July 29, 2015. The view was acquired at a distance of approximately 630,000 miles (1.0 million kilometers) from Enceladus and at a Sun-Enceladus-spacecraft, or phase angle of 155 degrees. Image scale is 4 miles (6 kilometers) per pixel. http://photojournal.jpl.nasa.gov/catalog/PIA18343
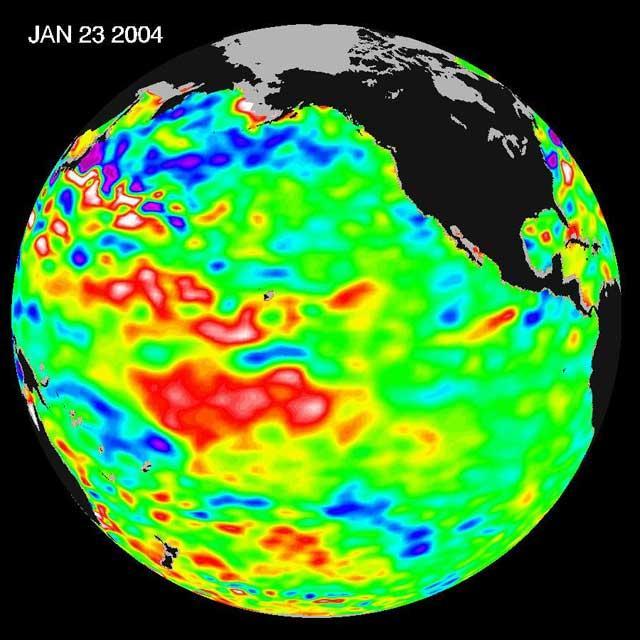
The latest remote sensing data from NASA's Jason satellite show that the equatorial Pacific sea surface levels are higher, indicating warmer sea surface temperatures in the central and west Pacific Ocean. This pattern has the appearance of La Niña rather than El Niño. This contrasts with the Bering Sea, Gulf of Alaska and U.S. West Coast where lower-than-normal sea surface levels and cool ocean temperatures continue (indicated by blue and purple areas). The image above is a global map of sea surface height, accurate to within 30 millimeters. The image represents data collected and composited over a 10-day period, ending on Jan 23, 2004. The height of the water relates to the temperature of the water. As the ocean warms, its level rises; and as it cools, its level falls. Yellow and red areas indicate where the waters are relatively warmer and have expanded above sea level, green indicates near normal sea level, and blue and purple areas show where the waters are relatively colder and the surface is lower than sea level. The blue areas are between 5 and 13 centimeters (2 and 5 inches) below normal, whereas the purple areas range from 14 to 18 centimeters (6 to 7 inches) below normal. http://photojournal.jpl.nasa.gov/catalog/PIA05071
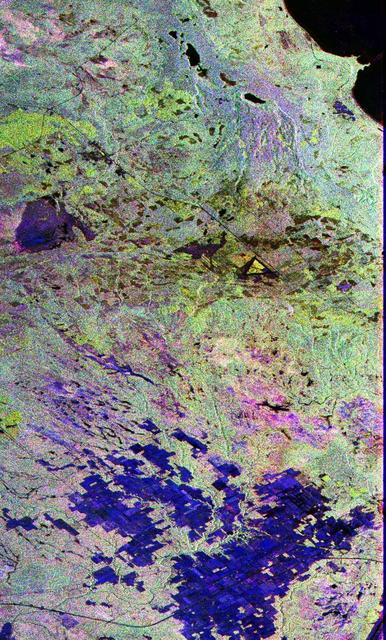
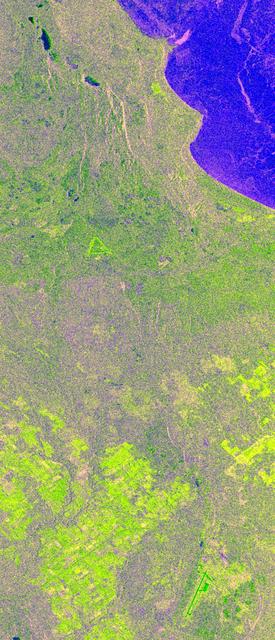
This image is a false-color composite of Raco, Michigan, centered at 46.39 degrees north latitude, 84.88 degrees west longitude. This image was acquired by the Spaceborne Imaging Radar-C and X-Band Synthetic Aperture Radar (SIR-C/X-SAR) aboard the space shuttle Endeavour on its sixth orbit and during the first full-capability test of the instrument on April 9, 1994. This image was produced using both L-band and C-band data. The area shown is approximately 20 kilometers by 50 kilometers (12 by 30 miles). Raco is located at the eastern end of Michigan's upper peninsula, west of Sault Ste. Marie and south of Whitefish Bay on Lake Superior. The site is located at the boundary between the boreal forests and the northern temperate forests, a transitional zone that is expected to be ecologically sensitive to anticipated global changes resulting from climatic warming. On any given day, there is a 60 percent chance that this area will be obscured to some extent by cloud clover which makes it difficult to image using optical sensors. http://photojournal.jpl.nasa.gov/catalog/PIA01700

This graph shows the rise in global mean sea level from 1993 to 2023 based on data from a series of five international satellites. The solid red line indicates the trajectory of this increase, which has more than doubled over the three decades. The dotted red line projects future sea level rise. The relatively large jump in sea level from 2022 to 2023, a rise of about 0.3 inches (0.76 centimeters), is due mostly to a warming climate and the development of a strong El Niño. The 2022-2023 rise is equivalent to draining a quarter of Lake Superior into the ocean over the course of a year. This NASA-led analysis is based on a sea level data set featuring more than 30 years of satellite observations, starting with the U.S.-French TOPEX/Poseidon mission, which launched in 1992. The Sentinel-6 Michael Freilich mission, which launched in November 2020, is the latest in the series of satellites that have contributed to this sea level record. https://photojournal.jpl.nasa.gov/catalog/PIA26183
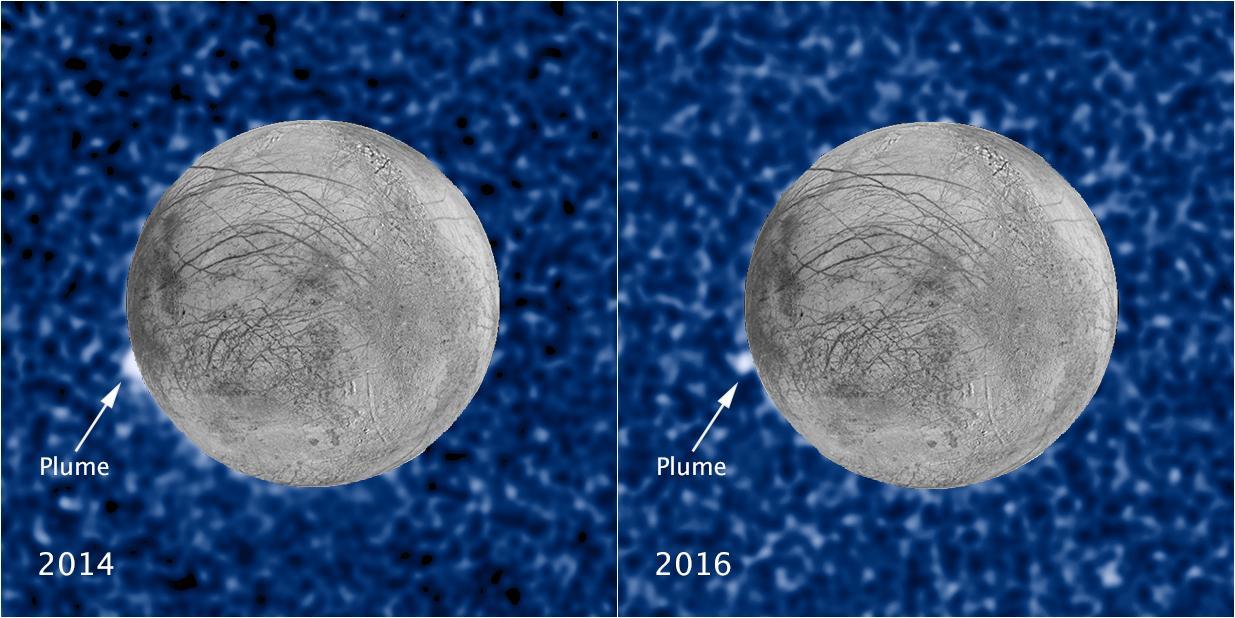
These composite images show a suspected plume of material erupting two years apart from the same location on Jupiter's icy moon Europa. The images bolster evidence that the plumes are a real phenomenon, flaring up intermittently in the same region on the satellite. Both plumes, photographed in ultraviolet light by NASA's Hubble's Space Telescope Imaging Spectrograph, were seen in silhouette as the moon passed in front of Jupiter. The newly imaged plume, shown at right, rises about 62 miles (100 kilometers) above Europa's frozen surface. The image was taken Feb. 22, 2016. The plume in the image at left, observed by Hubble on March 17, 2014, originates from the same location. It is estimated to be about 30 miles (50 kilometers) high. The snapshot of Europa, superimposed on the Hubble image, was assembled from data from NASA's Galileo mission to Jupiter. The plumes correspond to the location of an unusually warm spot on the moon's icy crust, seen in the late 1990s by the Galileo spacecraft (see PIA21444). Researchers speculate that this might be circumstantial evidence for water venting from the moon's subsurface. The material could be associated with the global ocean that is believed to be present beneath the frozen crust. https://photojournal.jpl.nasa.gov/catalog/PIA21443

NASA's Voyager images are used to create a global view of Ganymede. The cut-out reveals the interior structure of this icy moon. This structure consists of four layers based on measurements of Ganymede's gravity field and theoretical analyses using Ganymede's known mass, size and density. Ganymede's surface is rich in water ice and Voyager and Galileo images show features which are evidence of geological and tectonic disruption of the surface in the past. As with the Earth, these geological features reflect forces and processes deep within Ganymede's interior. Based on geochemical and geophysical models, scientists expected Ganymede's interior to either consist of: a) an undifferentiated mixture of rock and ice or b) a differentiated structure with a large lunar sized "core" of rock and possibly iron overlain by a deep layer of warm soft ice capped by a thin cold rigid ice crust. Galileo's measurement of Ganymede's gravity field during its first and second encounters with the huge moon have basically confirmed the differentiated model and allowed scientists to estimate the size of these layers more accurately. In addition the data strongly suggest that a dense metallic core exists at the center of the rock core. This metallic core suggests a greater degree of heating at sometime in Ganymede's past than had been proposed before and may be the source of Ganymede's magnetic field discovered by Galileo's space physics experiments. http://photojournal.jpl.nasa.gov/catalog/PIA00519
This animation shows global sea level data collected by the Surface Water and Ocean Topography (SWOT) satellite during its first 21-day science orbit, which it completed from July 26 to Aug. 16, 2023. Red and orange indicate ocean heights that were higher than the global mean sea surface height, while blue represents lower-than-the mean. Sea level differences can highlight ocean currents, like the Gulf Stream coming off the U.S. East Coast or the Kuroshio current off the east coast of Japan. Increased sea surface heights can also indicate regions of relatively warmer water – like the eastern part of the equatorial Pacific Ocean during an El Niño – because water expands as it warms. The SWOT science team made the measurements using the spacecraft's Ka-band Radar Interferometer (KaRIn) instrument. With two antennas spread 33 feet (10 meters) apart on a boom, KaRIn produces a pair of data swaths (tracks visible in the animation) as it circles the globe, bouncing radar pulses off the water's surface to collect surface-height measurements. Launched on Dec. 16, 2022, from Vandenberg Space Force Base in central California, SWOT is now in its operations phase, measuring the height of nearly all water on Earth's surface. The satellite will provide one of the most detailed, comprehensive views yet of the planet's oceans and fresh water lakes and rivers, collecting data that will be used for research and other purposes. Animation available at https://photojournal.jpl.nasa.gov/catalog/PIA26100
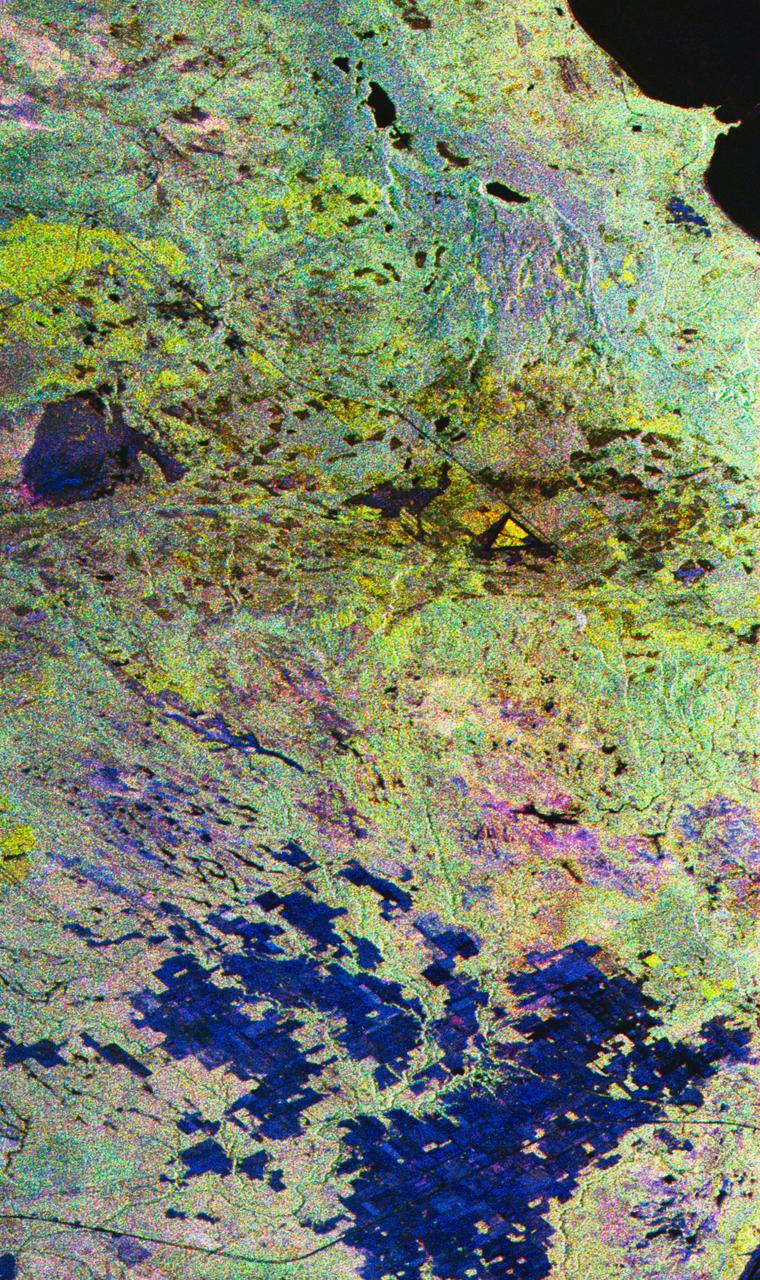
This is an X-band image of seasonal changes at the ecological test site of Raco, Michigan, located south of Whitefish Bay on Lake Superior. The image is centered at about 46 degrees north latitude and 85 degrees west longitude. This image was acquired by the X-band Synthetic Aperture Radar onboard the space shuttle Endeavour on April 10th, 1994, and on October 1, 1994. The areas shown in red correspond to the April 10th data; the areas in blue correspond to data acquired on October 1, 1994; green indicates the ratio of data acquired on April 10 and October 1, 1994. The area shown is 22.7 kilometers by 53 kilometers (14 miles by 33 miles). Lake Superior in the upper right was frozen in April and had small waves (ripples) on its surface in October. The land area contains mostly forests and, to a lesser extent, agricultural regions. In April the area was covered in wet snow. By October, there agricultural areas were covered with grass. Vegetation and soils were moist due to rainfalls three days before the data was acquired on October 1, 1994. The bright light green/yellow tones in the lower half of the image show the stronger reflections of the snow-covered agricultural fields. The pinkish color corresponds to the coniferous and deciduous forests. The green area represents red pines. These trees are smaller than the surrounding forest cover and allow more radar penetration. The area is green because the radar is sensing the surface, which undergoes great change from snow to grass and fern undergrowth between April and October. The bright green triangle in the upper half of the image is an old airstrip, while the modern airport can be seen on the bottom right side of the image. The Raco site is an important location for monitoring seasonal changes and future global change because it is situated at the ecological transition zone between the boreal forests and the northern temperate forests. This transitional zone is expected to be ecologically sensitive to anticipated global changes resulting from climatic warming. Baseline studies of vegetation are essential in monitoring these expected changes. http://photojournal.jpl.nasa.gov/catalog/PIA01734

This animation, created in 2012, shows the increasing clarity and detail of measurements of sea height made by successive satellite altimeters launched by NASA and other agencies over the past four decades, concluding with data at the resolution possible with the Surface Water and Ocean Topography (SWOT) satellite, expected to launch in December 2022. Each new spacecraft has been able to obtain higher-resolution observations than its predecessors. Sea height is key to understanding how much, and how fast, the oceans are rising in a warming climate. The animation starts with Seasat, launched in 1978 as one of the NASA's earliest Earth-observing satellites, then moves to Geosat, a U.S. Navy spacecraft launched in 1985, and on to ERS-1, TOPEX/Poseidon, ERS-2, Jason-1, Envisat, and Jason-2. Since the end of the time period shown in the animation, subsequent satellites have continued measuring sea height, creating an ongoing, decadeslong record. In March 2022, Sentinel-6 Michael Freilich, a joint U.S.-European mission, became the official reference satellite for global sea level measurements. SWOT will be latest spacecraft to observe ocean heights from Earth orbit. Its measurements will provide unprecedented insights into the activity of small-scale currents and their impact on climate change. Researchers believe small-scale currents, which are less than 60 miles (100 kilometers) in size, have a significant influence on the ocean's ability to absorb atmospheric heat and carbon and thereby moderate global temperature change. To measure these currents, SWOT will employ the Ka-band Radar Interferometer (KaRIn), a new technology developed at NASA's Jet Propulsion Laboratory in Southern California that will offer even greater spatial resolution than previous instruments that studied the ocean. SWOT will survey the water in Earth's lakes, rivers, reservoirs, and the ocean. The satellite will cover the planet's surface twice every 21 days and has a prime mission of three years. It was jointly developed by NASA and France's Centre National d'Études Spatiales (CNES), with contributions from the Canadian Space Agency (CSA) and the UK Space Agency. JPL, a division of Caltech in Southern California, manages the U.S. portion of the mission for NASA. Animation available at https://photojournal.jpl.nasa.gov/catalog/PIA25561
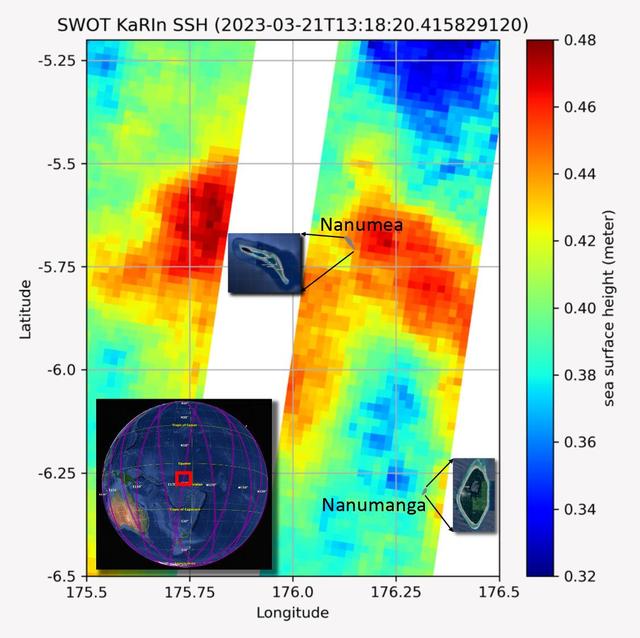
The recently launched Surface Water and Ocean Topography (SWOT) mission collected data on sea levels around two of the inhabited islands of Tuvalu, a nation in the South Pacific Ocean that has been threatened with sea level rise that substantially exceeds the global average. The image shows two areas of red that indicate higher than normal sea levels around two of Tuvalu's inhabited islands, Nanumanga and Nanumea. The higher sea levels were likely caused by internal tides or circular currents called eddies. The SWOT data illuminates for the first time these small ocean features that, when they occur on top of rising sea levels, can lead to episodic flooding along coastlines. The Tuvalu data was collected March 21, 2023. Rising seas are a direct consequence of climate change. On a global scale, the combination of warming ocean waters and ice melt from glaciers and ice sheets is leading to sea level rise that is occurring at an ever-increasing rate. The current rate of rise is more than 0.15 inches (4 millimeters) per year, an increase from 0.08 inches (2 millimeters) per year in 1993. This seemingly small increase holds great significance for coastal communities that have seen more than a century of persistent sea level rise. The gap between the average high tide and flooding conditions has narrowed, and coastal impacts driven by sea level rise have increased in frequency and severity in recent years. This is particularly true for low-lying island nations like Tuvalu, located about 620 miles (1,000 kilometers) north of Fiji. Sea level rise does not occur at the same rate everywhere across the globe, and can be exacerbated by natural ocean fluctuations that occur over time periods from years to decades. For Tuvalu, the amount of sea level rise has been substantially higher than the global average over the past three decades. The amount of rise, when coupled with Tuvalu's low land elevations, places the country increasingly under threat. In the near term, sea level rise will combine with naturally occurring ocean variability and storms to exacerbate events like coastal flooding. Monitoring and understanding sea level change is critical for Tuvalu and other low-lying island nations. Launched on Dec. 16, 2022, from Vandenberg Space Force Base in central California, SWOT collected the Tuvalu sea level data during a period of commissioning, calibration, and validation. Engineers are checking out the performance of the satellite's systems and science instruments before the planned start of science operations in summer 2023. https://photojournal.jpl.nasa.gov/catalog/PIA25777
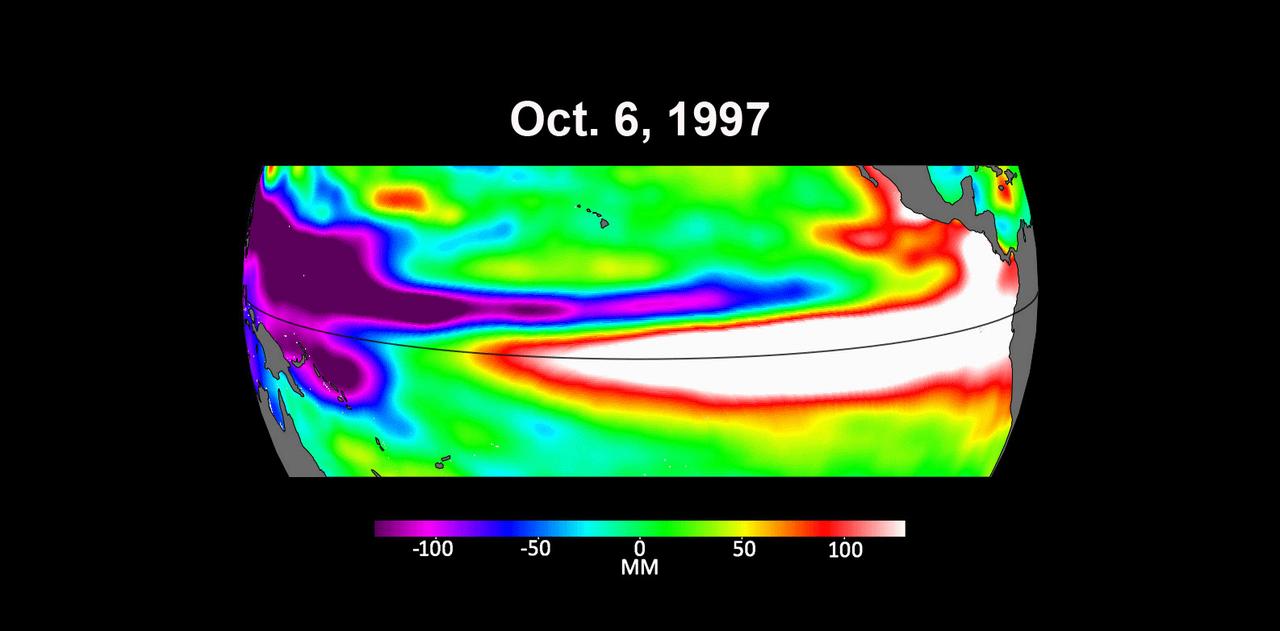
These three maps based on satellite data show sea levels in the Pacific Ocean during developing El Niño events in early October of 1997, 2015, and 2023. Higher-than-average ocean heights are shown in red and white, while lower-than-average heights are blue and purple. The two earlier maps represent the two extreme El Niño events from the past 30 years – the first from 1997 to 1998 and the second from 2015 to 2016. Both caused shifts in global air and ocean temperatures, atmospheric wind and rainfall patterns, and sea level. El Niños are characterized by higher-than-normal sea levels and warmer-than-average ocean temperatures along the equatorial Pacific. Water expands as it warms, so sea levels tend to be higher in places with warmer water. These temperature and sea level conditions can then propagate poleward along the western coasts of the Americas. El Niños can bring wetter conditions to the U.S. Southwest and drought to regions in the western Pacific, including Indonesia. Not all El Niño events are created equal, however, and their impacts vary widely. Satellites like the U.S.-European Sentinel-6 Michael Freilich, which captured the 2023 data, help anticipate those impacts on a global scale by tracking changes in sea surface height in the Pacific Ocean. The TOPEX/Poseidon satellite collected the 1997 data while Jason-2 collected data for the 2015 event. This year's El Niño is still developing, but researchers are looking to the recent past for clues as to how it is shaping up. By October 1997 and 2015, large areas of the central and eastern Pacific had sea levels more than 7 inches (18 centimeters) higher than normal. This year, sea levels are about 2 or 3 inches (5 to 8 centimeters) higher than normal and are elevated over a smaller area compared to the 1997 and 2015 events. Both of the past El Niños reached peak strength in late November or early December, so this year's event may still intensify. Launched in November 2020, Sentinel-6 Michael Freilich is named after former NASA Earth Science Division Director Michael Freilich. The satellite is one of two that compose the Copernicus Sentinel-6/Jason-CS (Continuity of Service) mission. Animation available at https://photojournal.jpl.nasa.gov/catalog/PIA26099
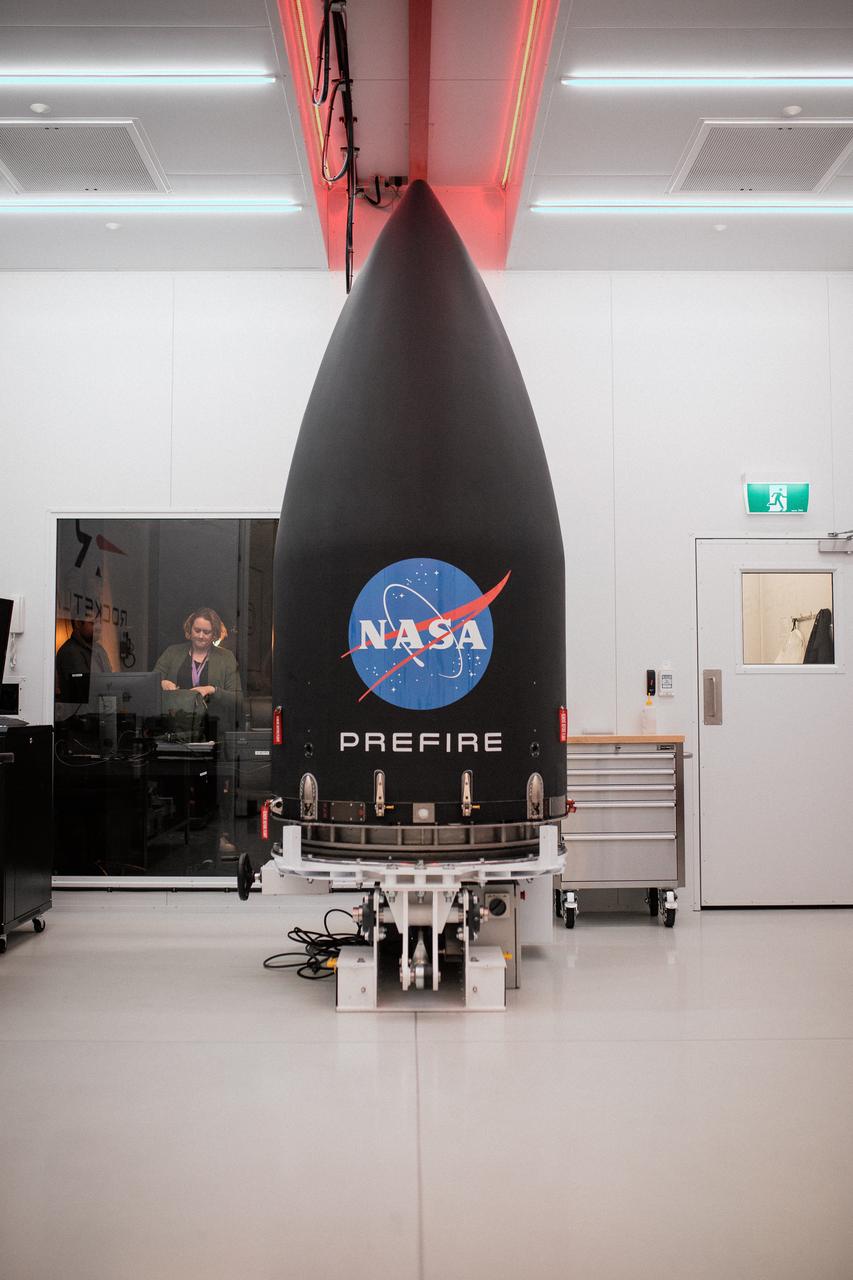
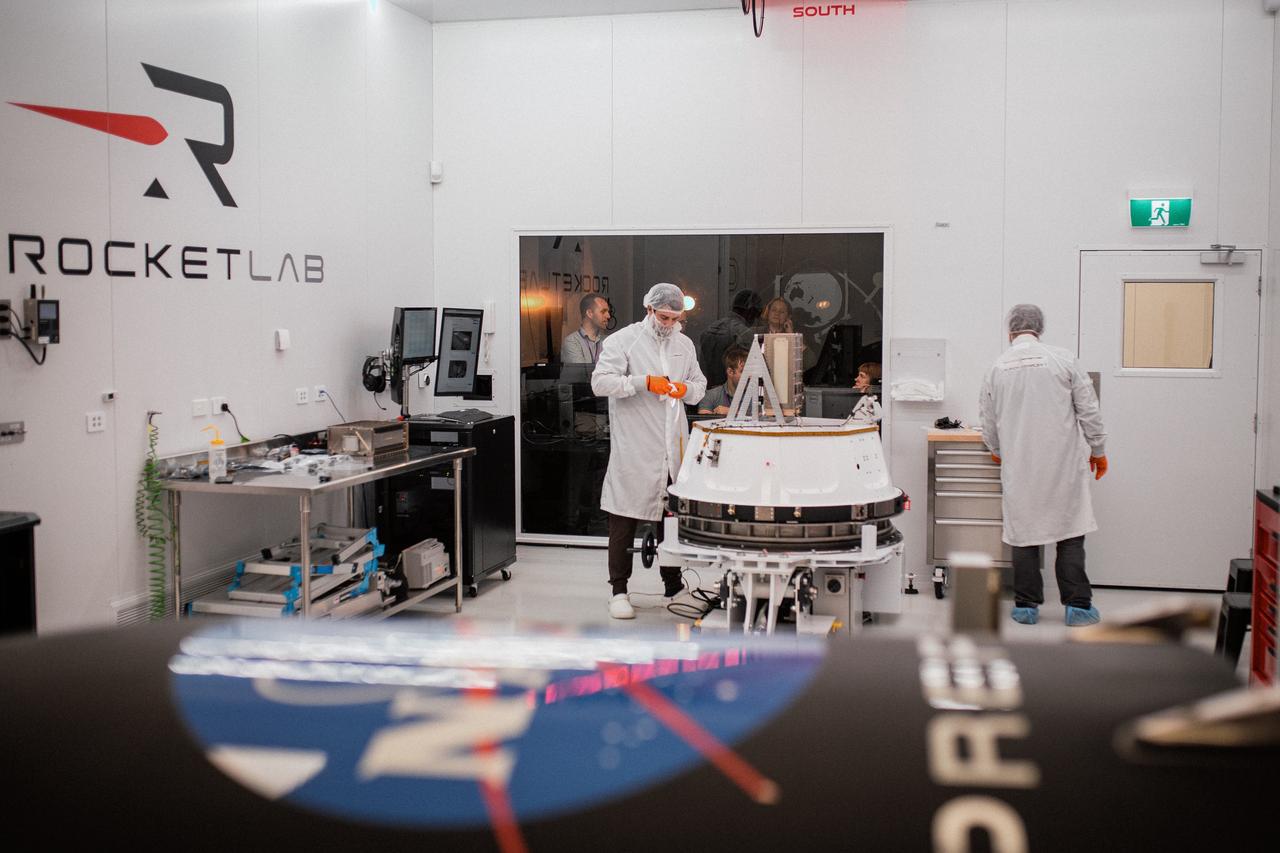
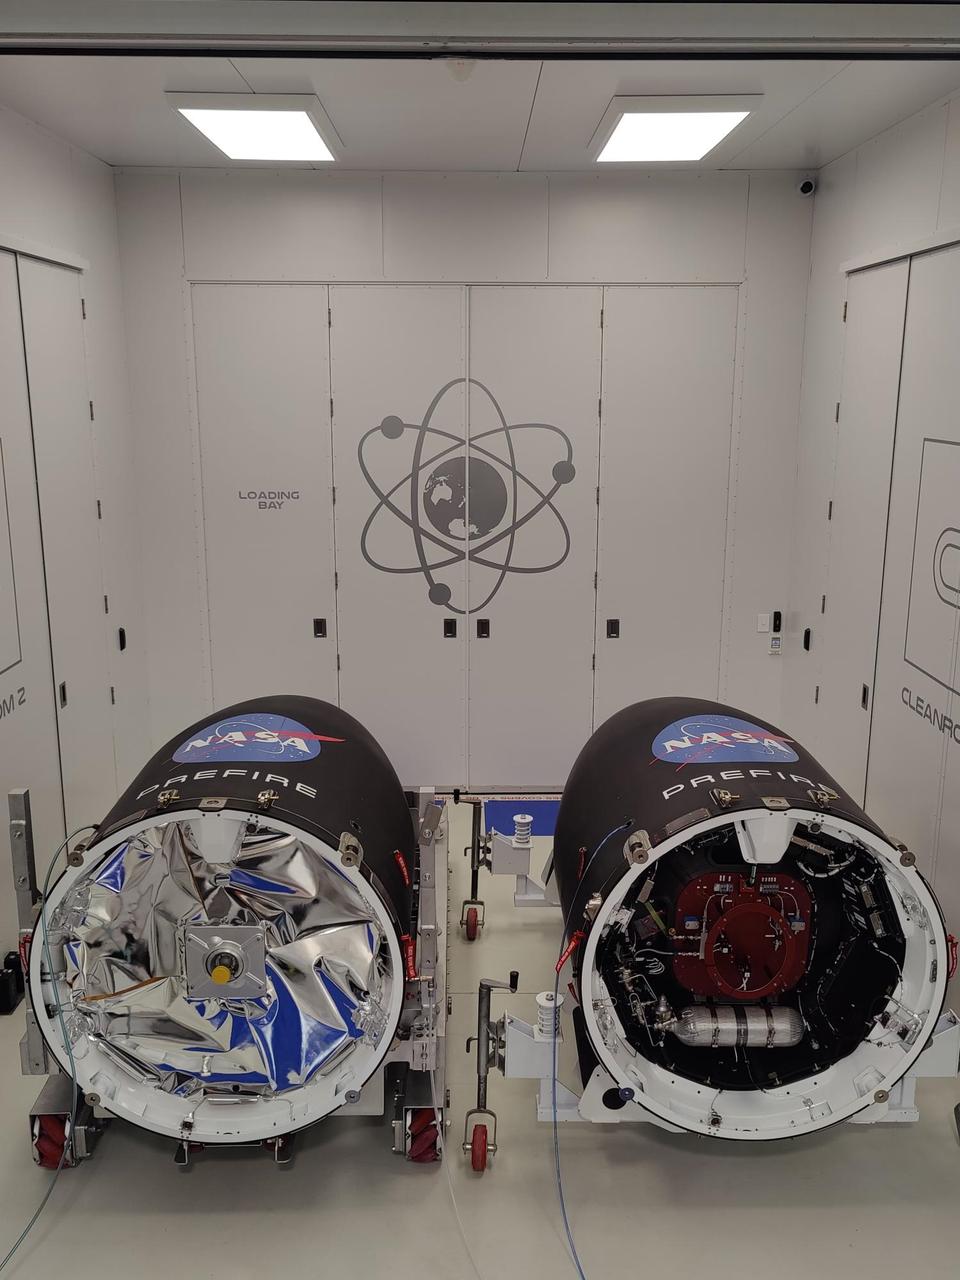
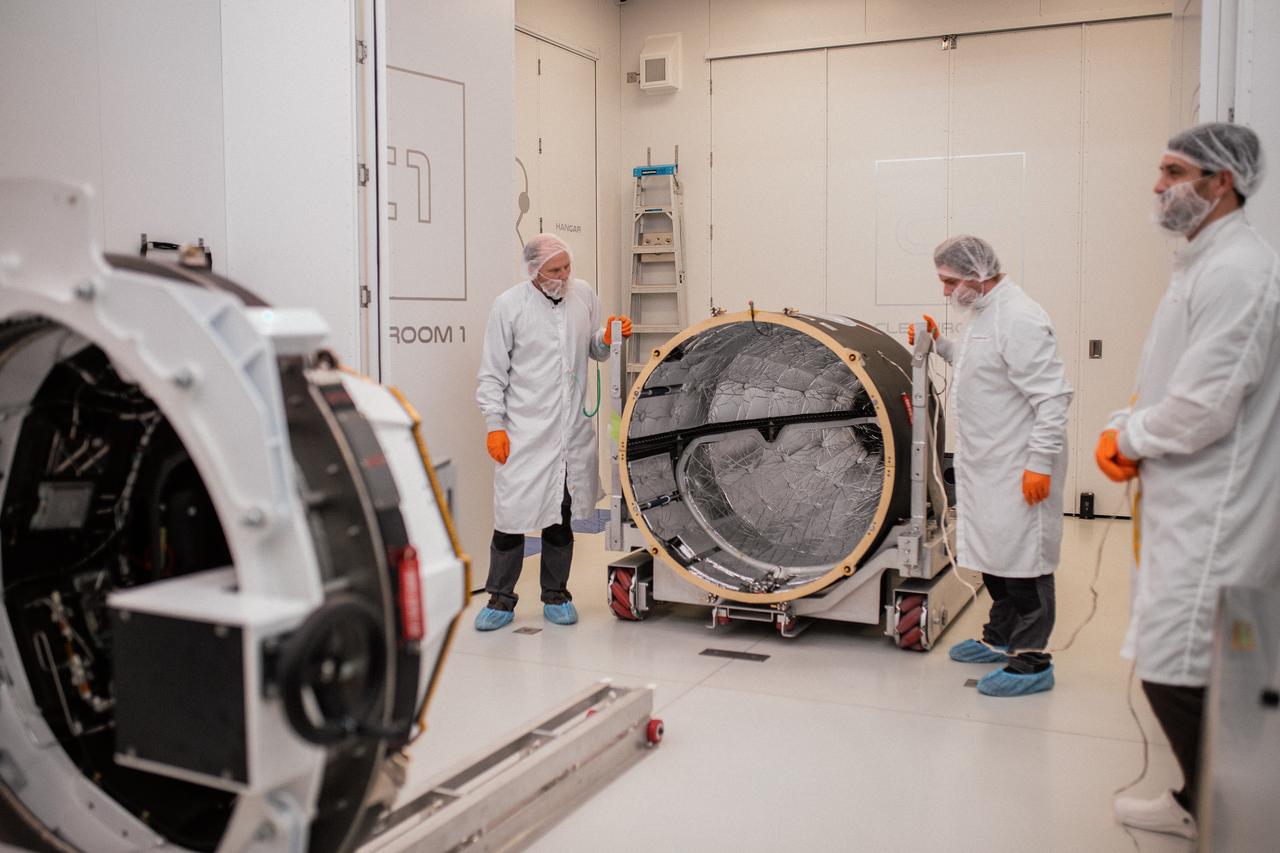
Technicians integrate NASA’s PREFIRE (Polar Radiant Energy in the Far-InfraRed Experiment) payload inside the Rocket Lab Electron rocket payload fairing on Wednesday, May 15, 2024, at the company’s facility in New Zealand. The agency’s PREFIRE mission to study heat loss to space in Earth’s polar regions will launch two CubeSats on two different flights aboard Rocket Lab's Electron rockets from the company’s Launch Complex 1 in Māhia, New Zealand.
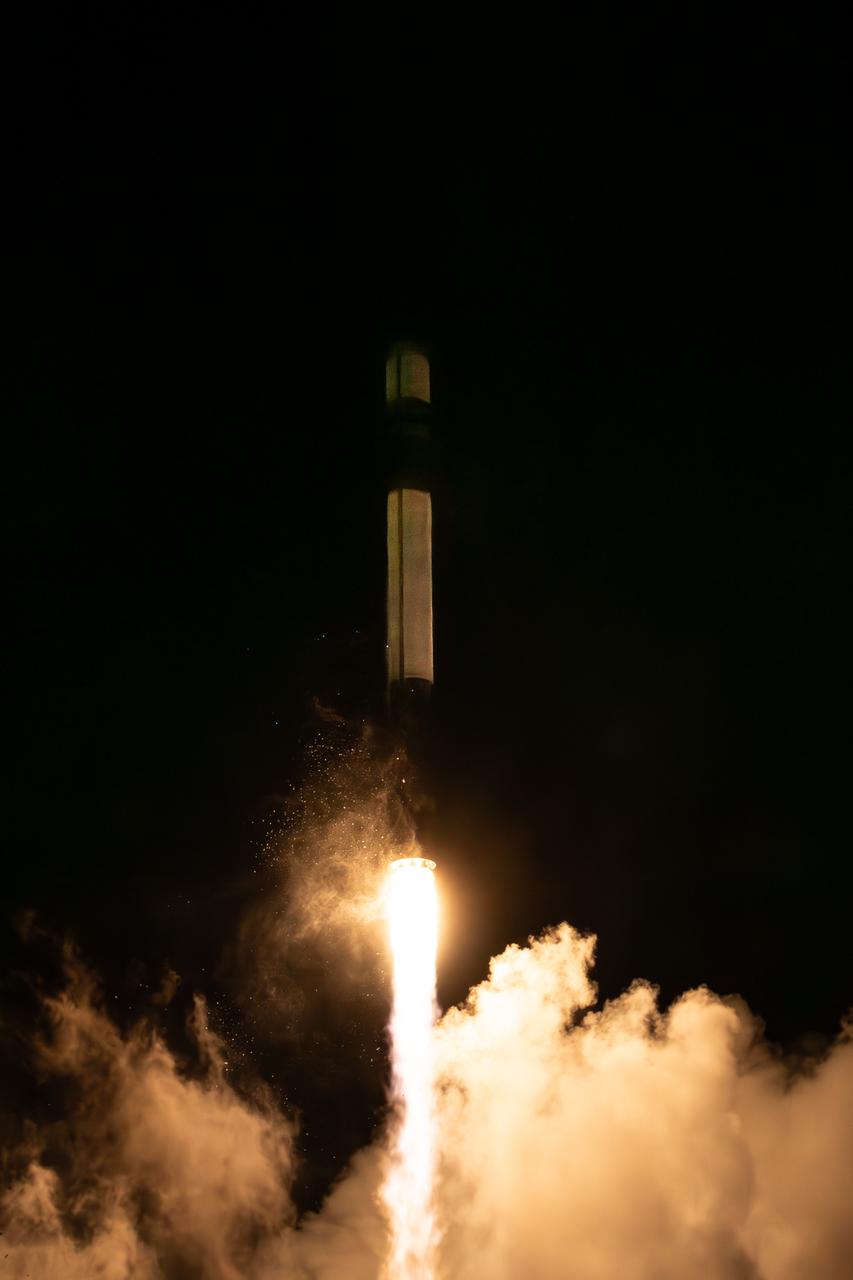
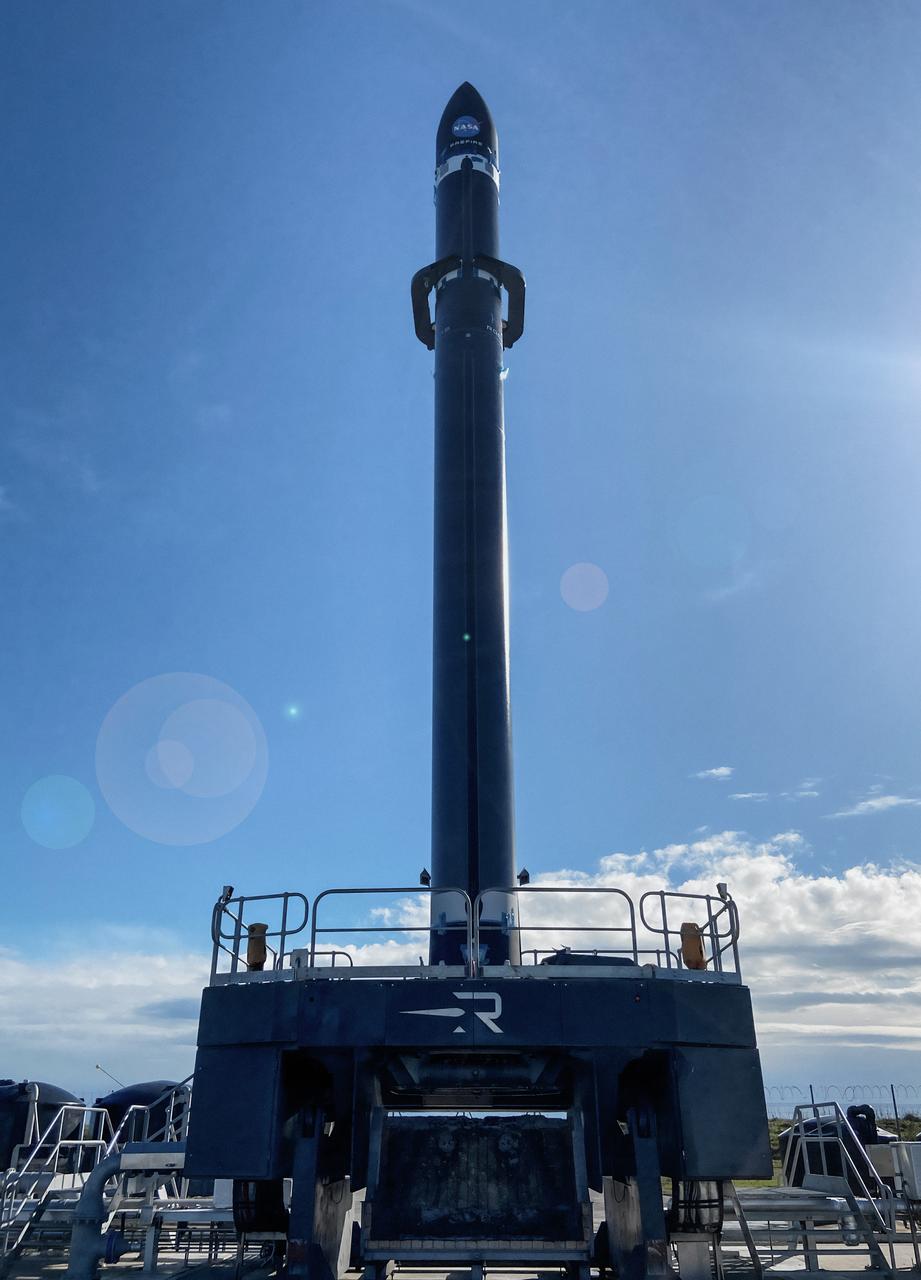
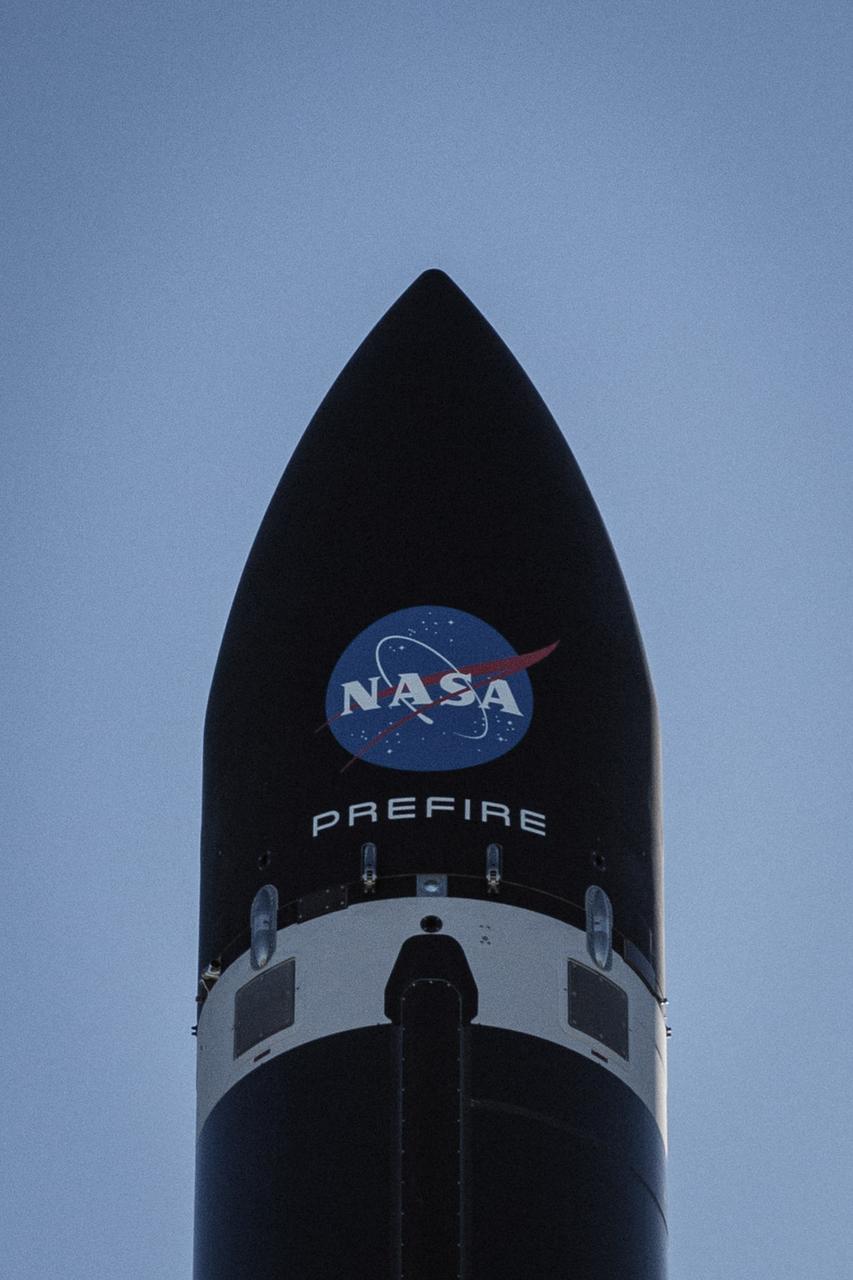
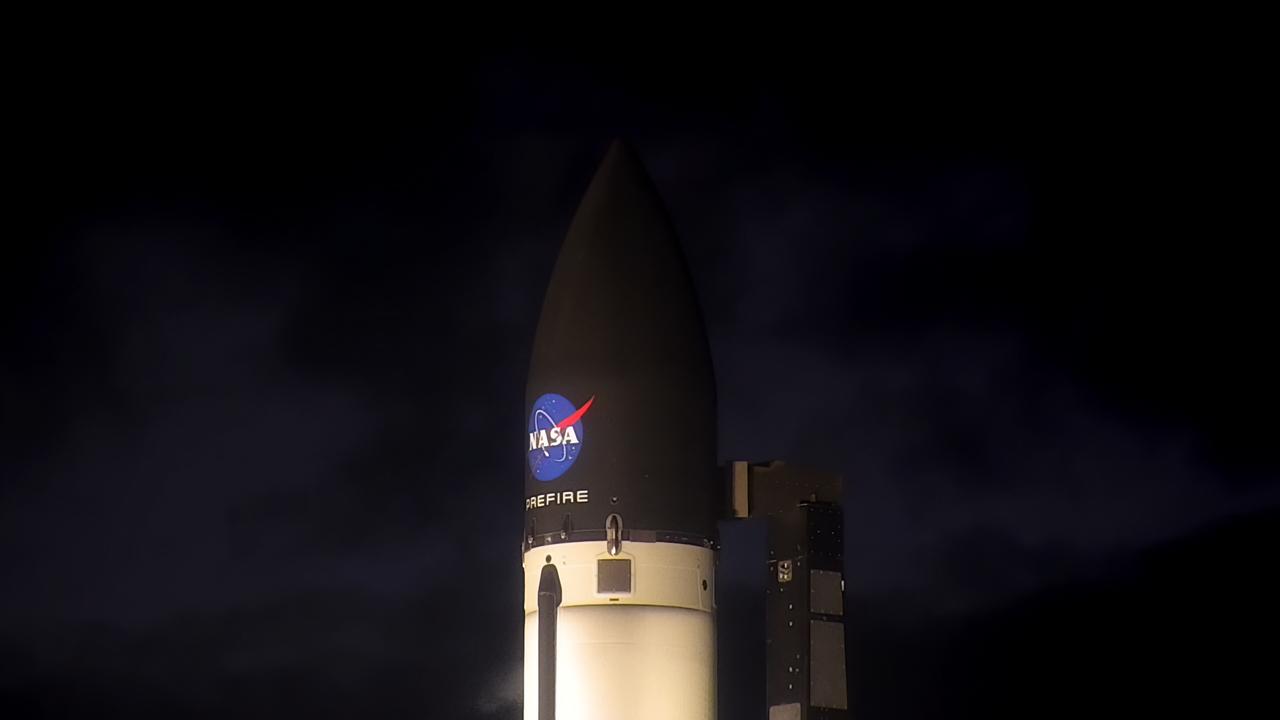
Rocket Lab’s Electron rocket called “PREFIRE and Ice,” is vertical on the pad awaiting liftoff at Launch Complex 1 in Mahia, New Zealand, ahead of NASA’s PREFIRE (Polar Radiant Energy in the Far-InfraRed Experiment) mission Wednesday, June 5, 2024. The mission, the second of two launches for NASA’S PREFIRE, features two identical 6U CubeSats in asynchronous, near-polar orbits, will study how much of Earth’s heat is lost to space from the Arctic and Antarctica.
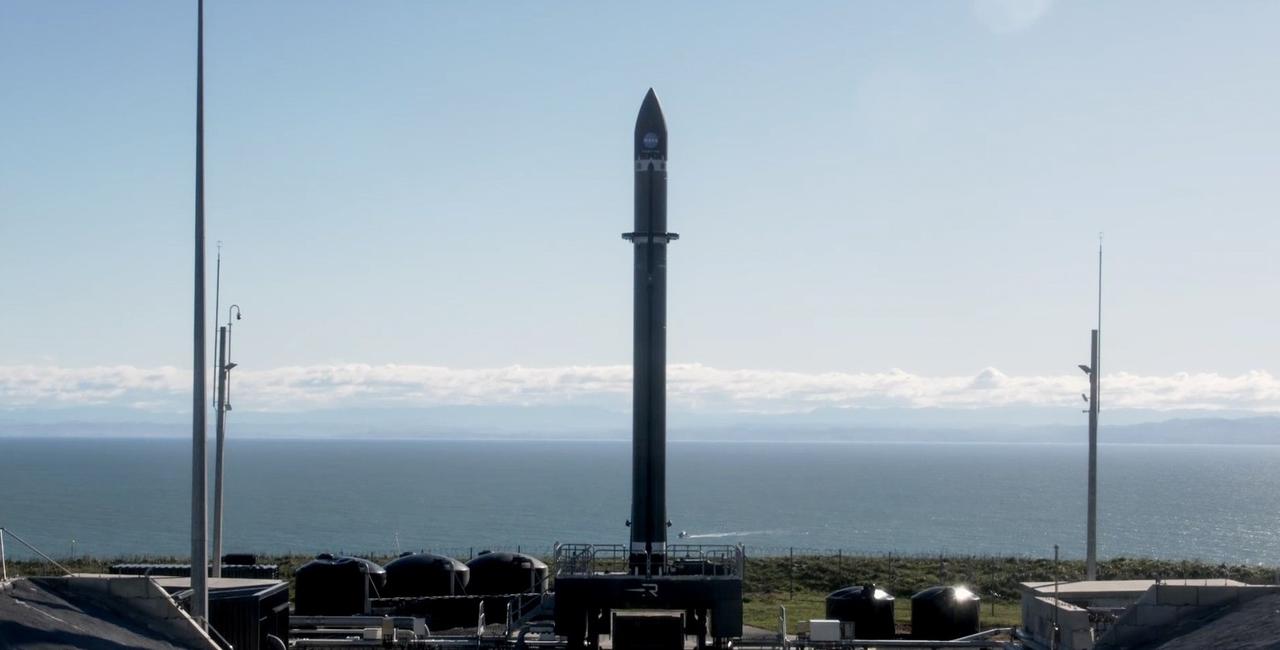
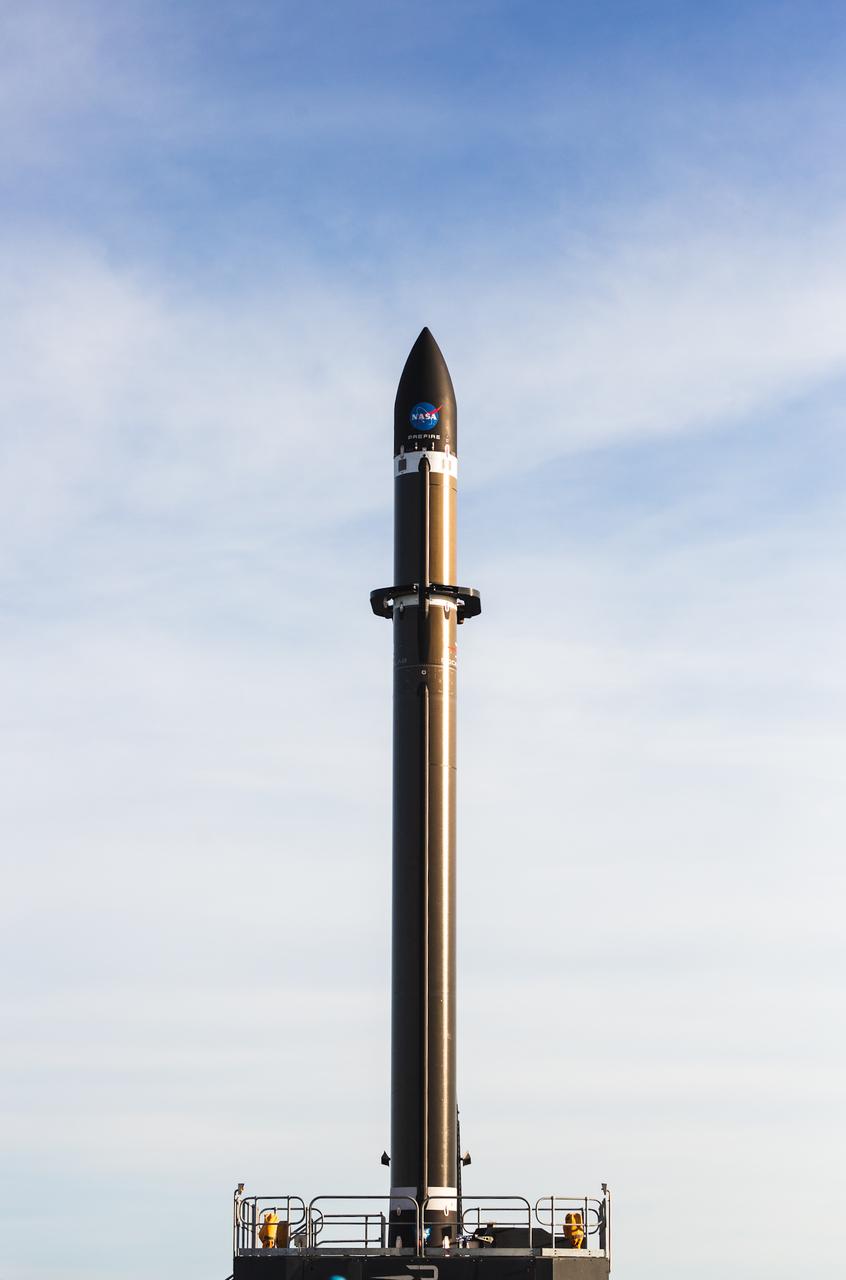
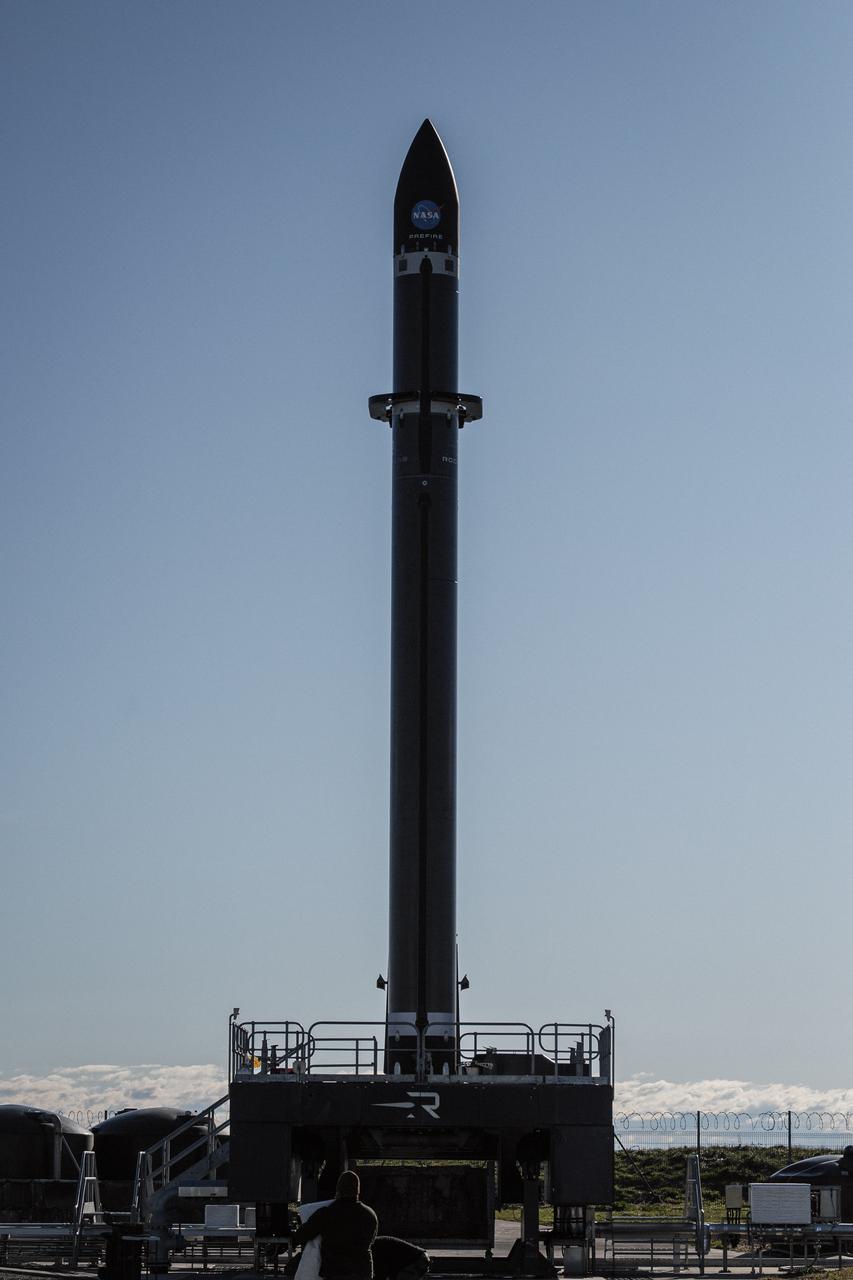
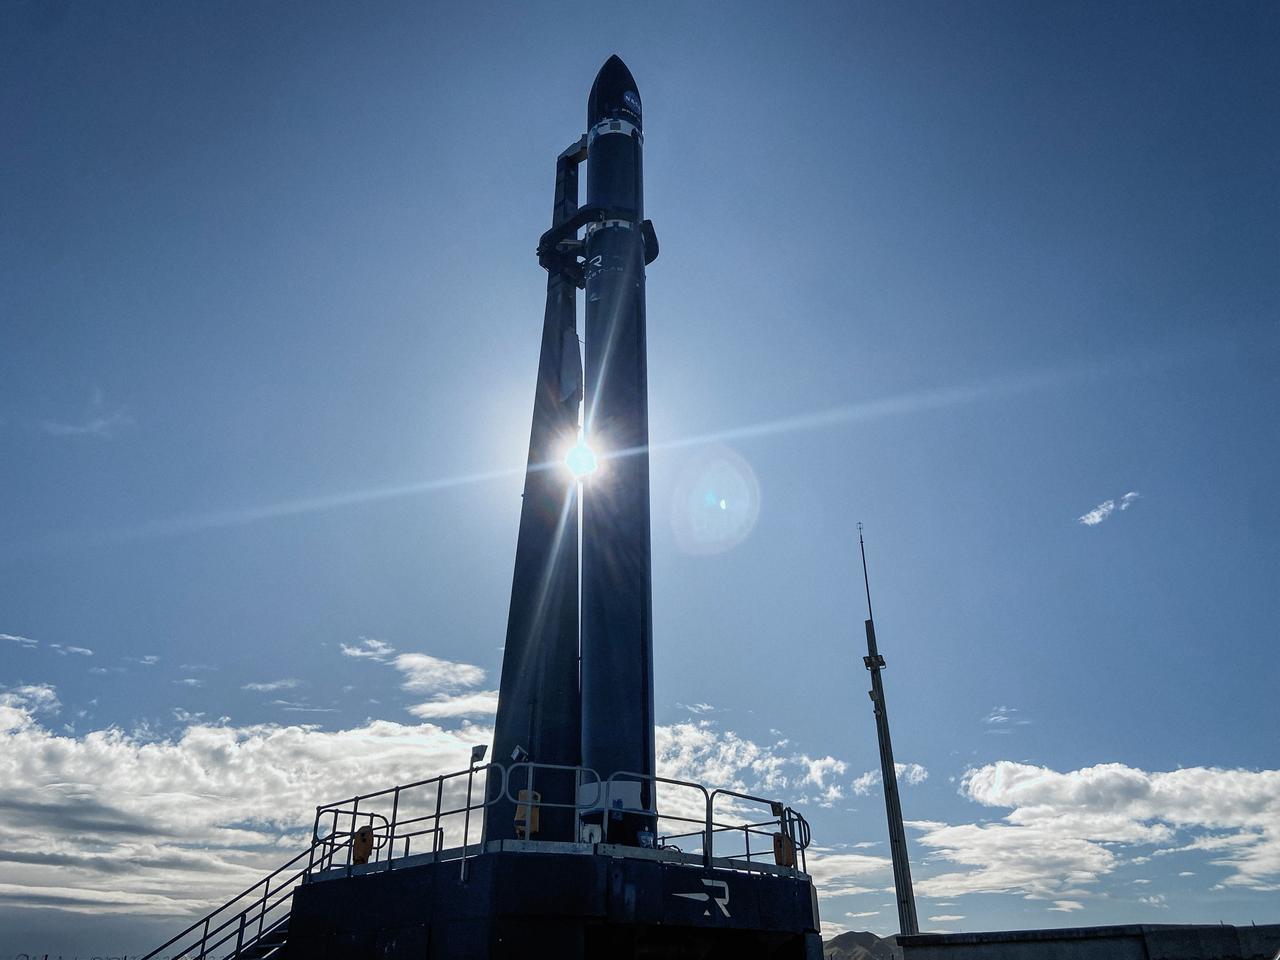
Rocket Lab’s Electron rocket is vertical on the pad Saturday, May 25, 2024, at Launch Complex 1 in Mahia, New Zealand, loaded with the first of two identical 6U CubeSats for NASA’s PREFIRE (Polar Radiant Energy in the Far-InfraRed Experiment) mission to help close a gap in our understanding of how much of Earth’s heat is lost to space from the Arctic and Antarctica. Liftoff of the first CubeSat launch, which Rocket Lab named “Ready, Aim, PREFIRE,” occurred at 7:41 p.m. NZST (3:41 a.m. EDT).
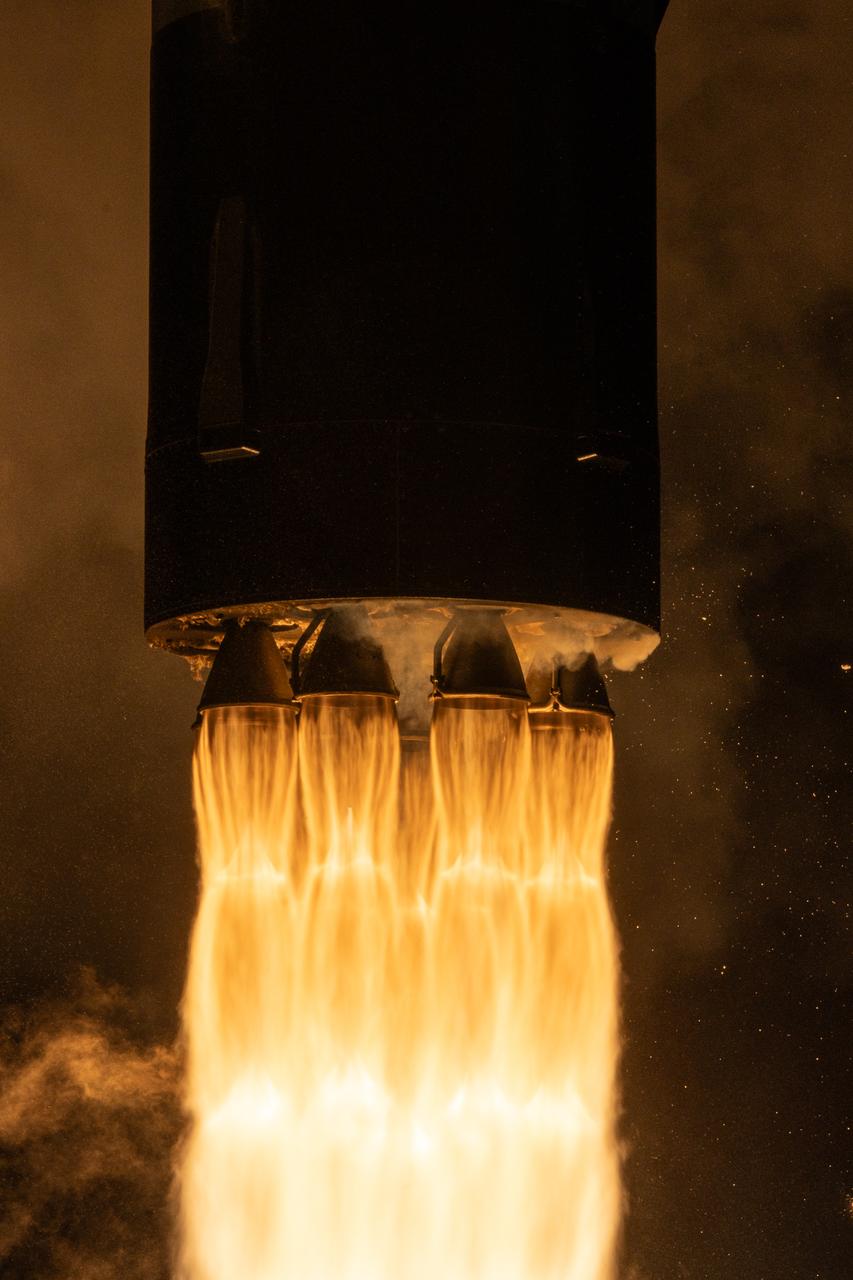
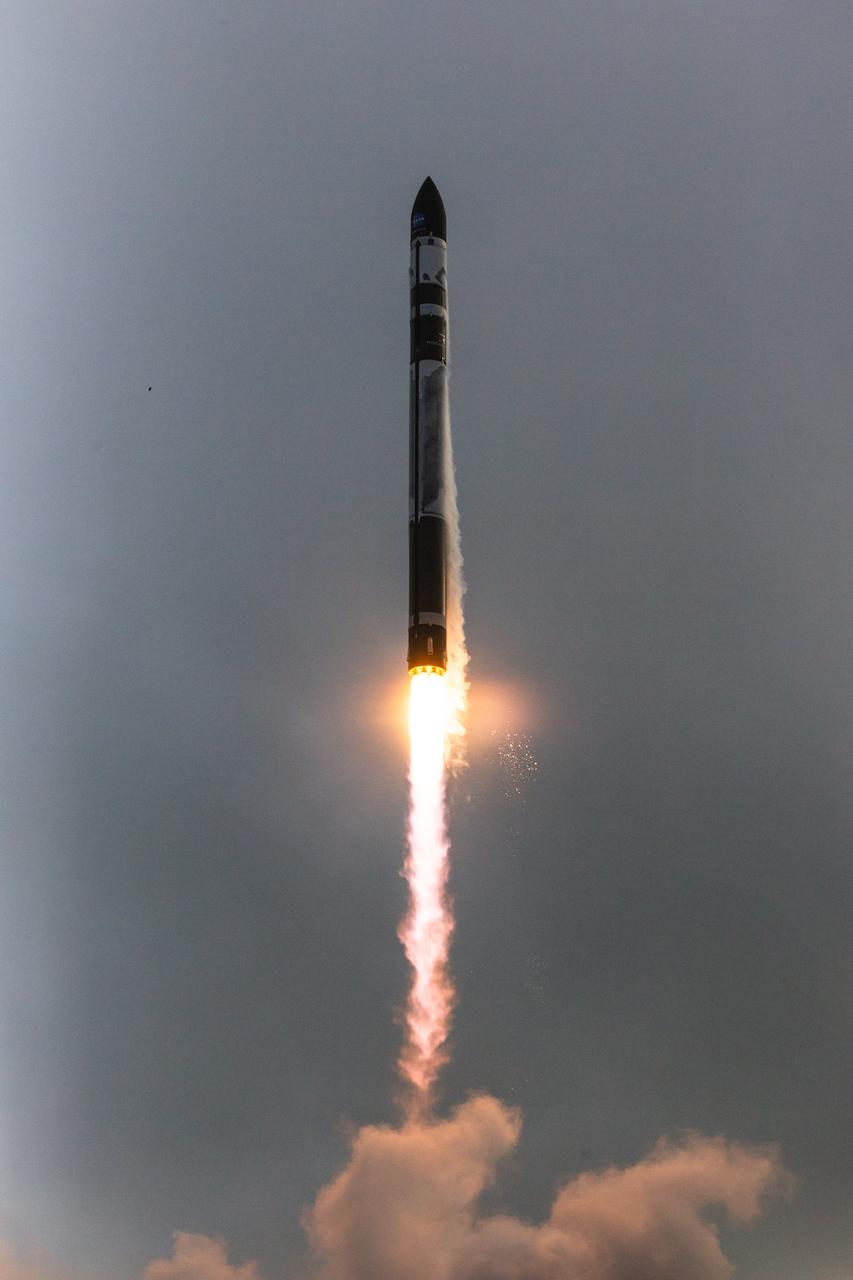
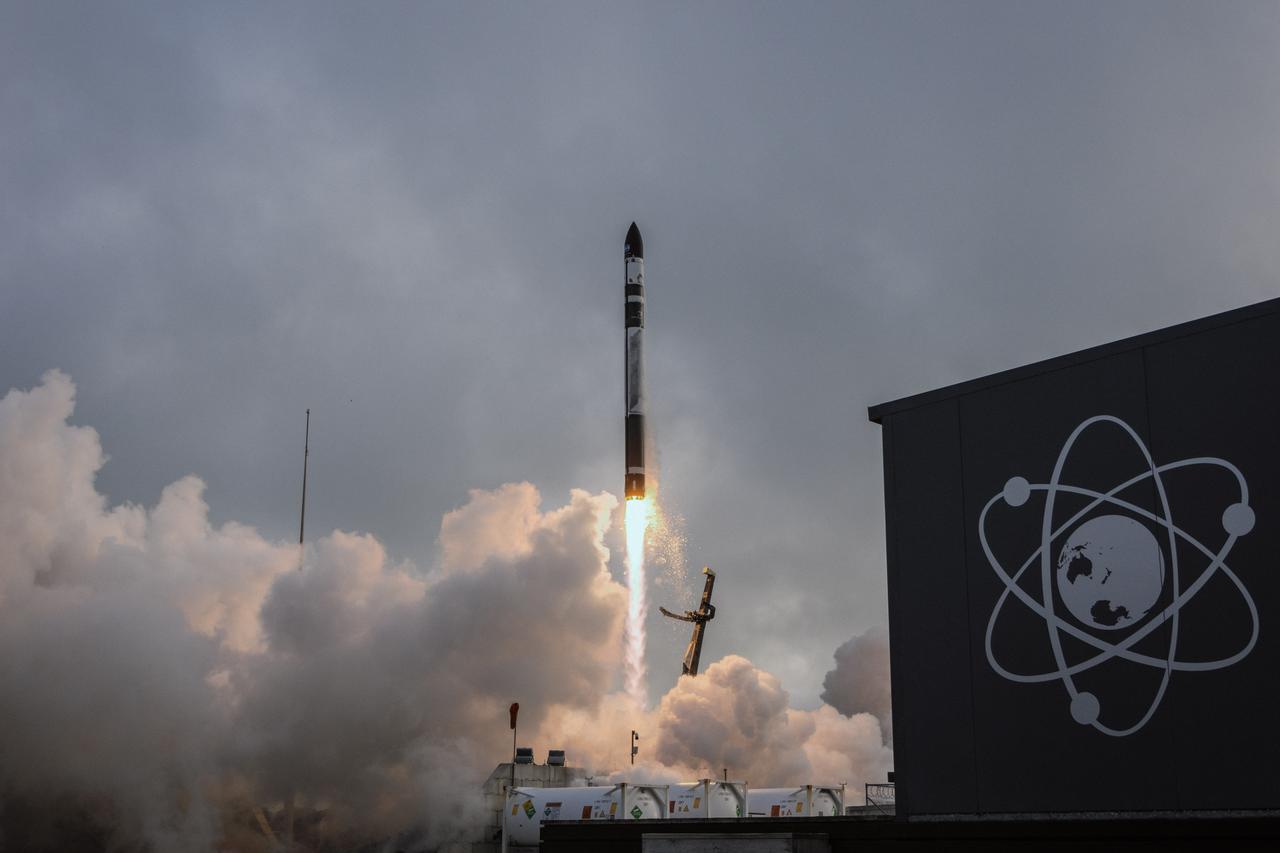
A Rocket Lab Electron rocket lifts off from Launch Complex 1 in Māhia, New Zealand at 7:41 p.m. NZST (3:41 a.m. EDT) Saturday, May 25, 2024, on the first of two launches which Rocket Lab named “Ready, Aim, PREFIRE,” for NASA’s PREFIRE (Polar Radiant Energy in the Far-InfraRed Experiment) mission. The PREFIRE mission, expected to last at least 10 months, consists of sending two CubeSats to asynchronous, near-polar orbits, to help close a gap in our understanding of how much of Earth’s heat is lost to space from the Arctic and Antarctica.
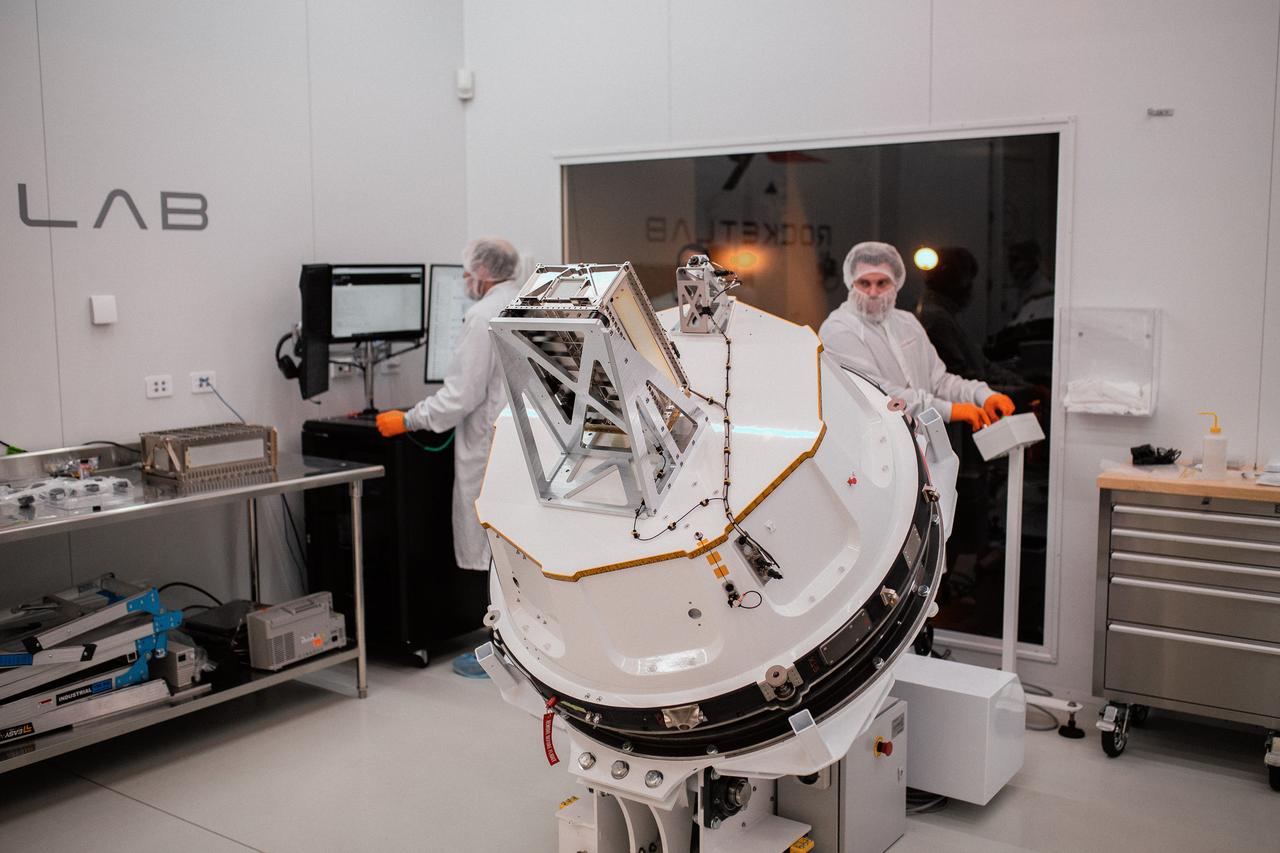
Technicians integrate NASA’s PREFIRE (Polar Radiant Energy in the Far-InfraRed Experiment) payload inside the Rocket Lab Electron rocket payload fairing on Wednesday, May 15, 2024, at the company’s facility in New Zealand. The agency’s PREFIRE mission to study heat loss to space in Earth’s polar regions will launch two CubeSats on two different flights aboard Rocket Lab's Electron rockets from the company’s Launch Complex 1 in Māhia, New Zealand.
A Rocket Lab Electron rocket lifts off from Launch Complex 1 in Māhia, New Zealand at 7:41 p.m. NZST (3:41 a.m. EDT) Saturday, May 25, 2024, on the first of two launches which Rocket Lab named “Ready, Aim, PREFIRE,” for NASA’s PREFIRE (Polar Radiant Energy in the Far-InfraRed Experiment) mission. The PREFIRE mission, expected to last at least 10 months, consists of sending two CubeSats to asynchronous, near-polar orbits, to help close a gap in our understanding of how much of Earth’s heat is lost to space from the Arctic and Antarctica.
Rocket Lab’s Electron rocket called “PREFIRE and Ice,” lifts off from Launch Complex 1 in Māhia, New Zealand at 3:15 p.m. NZST Wednesday, June 5, 2024 (11:15 p.m. EDT, Tuesday, June 4), on the second of two launches for NASA’s PREFIRE (Polar Radiant Energy in the Far-InfraRed Experiment). The PREFIRE mission, expected to last at least 10 months, consists of sending two CubeSats to asynchronous, near-polar orbits, to help close a gap in our understanding of how much of Earth’s heat is lost to space from the Arctic and Antarctica.
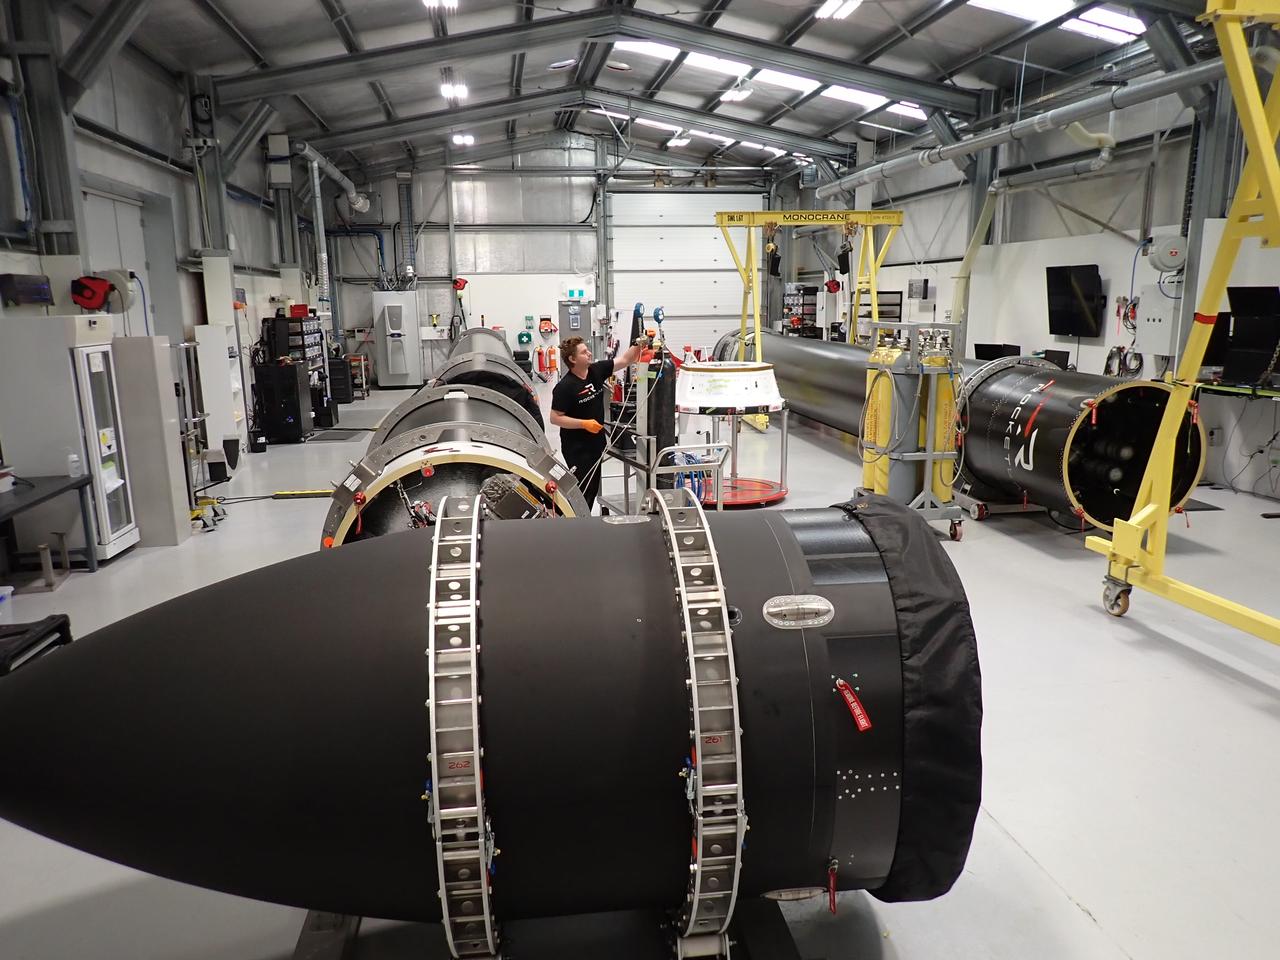
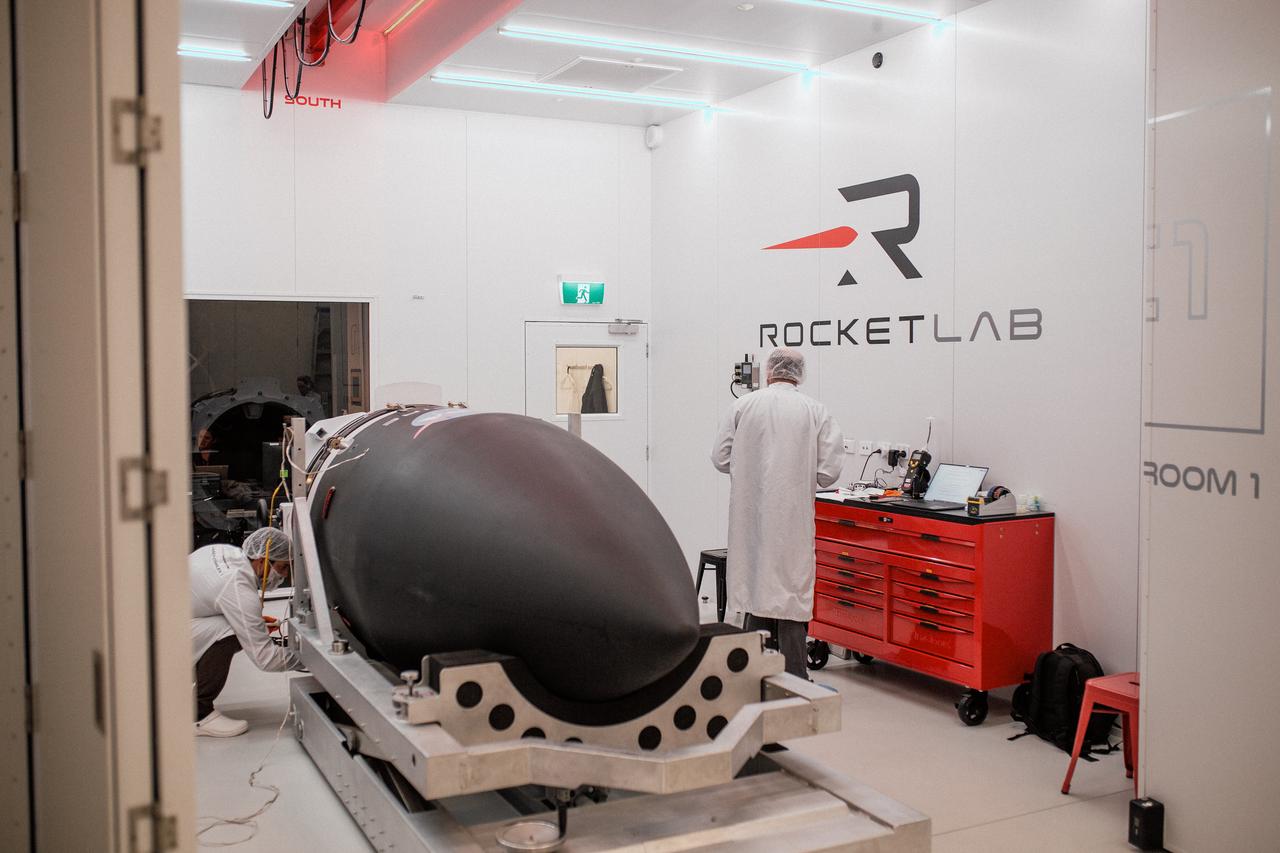
Technicians process NASA’s PREFIRE (Polar Radiant Energy in the Far-InfraRed Experiment) ahead of integration with a Rocket Lab Electron rocket on Thursday, May 2, 2024, at the company’s facility in New Zealand. The agency’s PREFIRE mission to study heat loss to space in Earth’s polar regions will launch two CubeSats on two different flights aboard Rocket Lab's Electron rockets from the company’s Launch Complex 1 in Māhia, New Zealand.
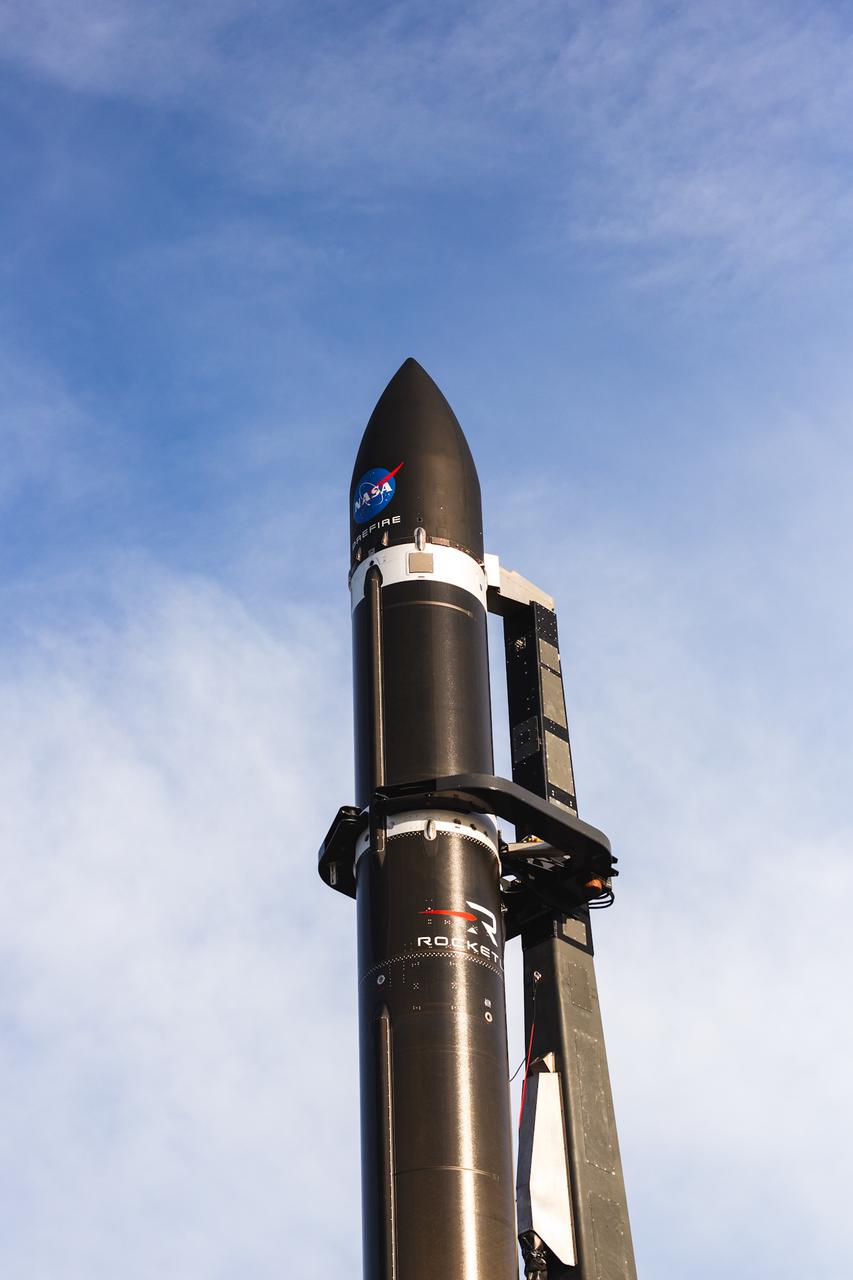
Rocket Lab’s Electron rocket called “PREFIRE and Ice,” is vertical on the pad awaiting liftoff at Launch Complex 1 in Mahia, New Zealand, ahead of NASA’s PREFIRE (Polar Radiant Energy in the Far-InfraRed Experiment) mission Wednesday, June 5, 2024. The mission, the second of two launches for NASA’S PREFIRE, features two identical 6U CubeSats in asynchronous, near-polar orbits, will study how much of Earth’s heat is lost to space from the Arctic and Antarctica.
Technicians integrate NASA’s PREFIRE (Polar Radiant Energy in the Far-InfraRed Experiment) payload inside the Rocket Lab Electron rocket payload fairing on Wednesday, May 15, 2024, at the company’s facility in New Zealand. The agency’s PREFIRE mission to study heat loss to space in Earth’s polar regions will launch two CubeSats on two different flights aboard Rocket Lab's Electron rockets from the company’s Launch Complex 1 in Māhia, New Zealand.
Technicians integrate NASA’s PREFIRE (Polar Radiant Energy in the Far-InfraRed Experiment) payload inside the Rocket Lab Electron rocket payload fairing on Wednesday, May 15, 2024, at the company’s facility in New Zealand. The agency’s PREFIRE mission to study heat loss to space in Earth’s polar regions will launch two CubeSats on two different flights aboard Rocket Lab's Electron rockets from the company’s Launch Complex 1 in Māhia, New Zealand.

Rocket Lab’s Electron rocket called “PREFIRE and Ice,” lifts off from Launch Complex 1 in Māhia, New Zealand at 3:15 p.m. NZST Wednesday, June 5, 2024 (11:15 p.m. EDT, Tuesday, June 4), on the second of two launches for NASA’s PREFIRE (Polar Radiant Energy in the Far-InfraRed Experiment). The PREFIRE mission, expected to last at least 10 months, consists of sending two CubeSats to asynchronous, near-polar orbits, to help close a gap in our understanding of how much of Earth’s heat is lost to space from the Arctic and Antarctica.
NASA’s PREFIRE (Polar Radiant Energy in the Far-InfraRed Experiment) CubeSats are encapsulated inside Rocket Lab Electron rocket payload fairings on Tuesday, May 21, 2024, at the company’s facility in New Zealand. The agency’s PREFIRE mission to study heat loss to space in Earth’s polar regions will launch two CubeSats on two different flights aboard Rocket Lab's Electron rockets from the company’s Launch Complex 1 in Māhia, New Zealand.
Rocket Lab’s Electron rocket is vertical on the pad Saturday, May 25, 2024, at Launch Complex 1 in Mahia, New Zealand, loaded with the first of two identical 6U CubeSats for NASA’s PREFIRE (Polar Radiant Energy in the Far-InfraRed Experiment) mission to help close a gap in our understanding of how much of Earth’s heat is lost to space from the Arctic and Antarctica. Liftoff of the first CubeSat launch, which Rocket Lab named “Ready, Aim, PREFIRE,” occurred at 7:41 p.m. NZST (3:41 a.m. EDT).
Rocket Lab’s Electron rocket is vertical on the pad at Launch Complex 1 in Mahia, New Zealand, loaded with the second of two identical 6U CubeSats for NASA’s PREFIRE (Polar Radiant Energy in the Far-InfraRed Experiment) mission to help close a gap in our understanding of how much of Earth’s heat is lost to space from the Arctic and Antarctica. Liftoff of the second CubeSat launch, which Rocket Lab named “PREFIRE and Ice” was targeted for Saturday, June 1, 2024, but was scrubbed for the day.
Rocket Lab’s Electron rocket called “PREFIRE and Ice,” lifts off from Launch Complex 1 in Māhia, New Zealand at 3:15 p.m. NZST Wednesday, June 5, 2024 (11:15 p.m. EDT, Tuesday, June 4), on the second of two launches for NASA’s PREFIRE (Polar Radiant Energy in the Far-InfraRed Experiment). The PREFIRE mission, expected to last at least 10 months, consists of sending two CubeSats to asynchronous, near-polar orbits, to help close a gap in our understanding of how much of Earth’s heat is lost to space from the Arctic and Antarctica.

Technicians integrate NASA’s PREFIRE (Polar Radiant Energy in the Far-InfraRed Experiment) payload inside the Rocket Lab Electron rocket payload fairing on Wednesday, May 15, 2024, at the company’s facility in New Zealand. The agency’s PREFIRE mission to study heat loss to space in Earth’s polar regions will launch two CubeSats on two different flights aboard Rocket Lab's Electron rockets from the company’s Launch Complex 1 in Māhia, New Zealand.
Technicians integrate NASA’s PREFIRE (Polar Radiant Energy in the Far-InfraRed Experiment) payload inside the Rocket Lab Electron rocket payload fairing on Wednesday, May 15, 2024, at the company’s facility in New Zealand. The agency’s PREFIRE mission to study heat loss to space in Earth’s polar regions will launch two CubeSats on two different flights aboard Rocket Lab's Electron rockets from the company’s Launch Complex 1 in Māhia, New Zealand.
Rocket Lab’s Electron rocket is vertical on the pad Saturday, May 25, 2024, at Launch Complex 1 in Mahia, New Zealand, loaded with the first of two identical 6U CubeSats for NASA’s PREFIRE (Polar Radiant Energy in the Far-InfraRed Experiment) mission to help close a gap in our understanding of how much of Earth’s heat is lost to space from the Arctic and Antarctica. Liftoff of the first CubeSat launch, which Rocket Lab named “Ready, Aim, PREFIRE,” occurred at 7:41 p.m. NZST (3:41 a.m. EDT).
Rocket Lab’s Electron rocket is vertical on the pad Saturday, May 25, 2024, at Launch Complex 1 in Mahia, New Zealand, loaded with the first of two identical 6U CubeSats for NASA’s PREFIRE (Polar Radiant Energy in the Far-InfraRed Experiment) mission to help close a gap in our understanding of how much of Earth’s heat is lost to space from the Arctic and Antarctica. Liftoff of the first CubeSat launch, which Rocket Lab named “Ready, Aim, PREFIRE,” occurred at 7:41 p.m. NZST (3:41 a.m. EDT).
Rocket Lab’s Electron rocket is vertical on the pad at Launch Complex 1 in Mahia, New Zealand, loaded with the second of two identical 6U CubeSats for NASA’s PREFIRE (Polar Radiant Energy in the Far-InfraRed Experiment) mission to help close a gap in our understanding of how much of Earth’s heat is lost to space from the Arctic and Antarctica. Liftoff of the second CubeSat launch, which Rocket Lab named “PREFIRE and Ice” was targeted for Saturday, June 1, 2024, but was scrubbed for the day.
Technicians integrate NASA’s PREFIRE (Polar Radiant Energy in the Far-InfraRed Experiment) payload inside the Rocket Lab Electron rocket payload fairing on Wednesday, May 15, 2024, at the company’s facility in New Zealand. The agency’s PREFIRE mission to study heat loss to space in Earth’s polar regions will launch two CubeSats on two different flights aboard Rocket Lab's Electron rockets from the company’s Launch Complex 1 in Māhia, New Zealand.

ISS031-E-116058 (13 June 2012) --- Polar mesospheric clouds in the Northern Hemisphere are featured in this image photographed by an Expedition 31 crew member on the International Space Station. In both the Northern and Southern Hemisphere, during their respective late spring and early summer seasons, polar mesospheric clouds are at the peak of their visibility. Visible from the ground during twilight, aircraft in flight, and the International Space Station, they typically appear as delicate shining threads against the darkness of space?hence their other name of noctilucent or ?night-shining? clouds. On the same day this image was taken from the space station while it was passing over the night-darkened Tibetan Plateau, polar mesospheric clouds were also visible to aircraft flying above Canada. In addition to this still image, the space station crew took a time-lapse image sequence of polar mesospheric clouds several days earlier (June 5, 2012) while passing over western Asia; this is first such sequence of images of the phenomena taken from orbit. Polar mesospheric clouds form between 76-85 kilometers above the Earth?s surface, when there is sufficient water vapor at these high altitudes to freeze into ice crystals. The clouds are illuminated by the setting sun while the ground surface below is in darkness, lending them their night-shining properties. In addition to the illuminated tracery of polar mesospheric clouds trending across the center of the image, lower layers of the atmosphere are also illuminated; the lowest layer of the atmosphere, the stratosphere, is indicated by dim orange and red tones. While the exact cause of formation of polar mesospheric clouds is still debated?dust from meteors, global warming, and rocket exhaust have all been suggested as contributing factors?recent research suggests that changes in atmospheric gas composition or temperature has caused the clouds to become brighter over time.
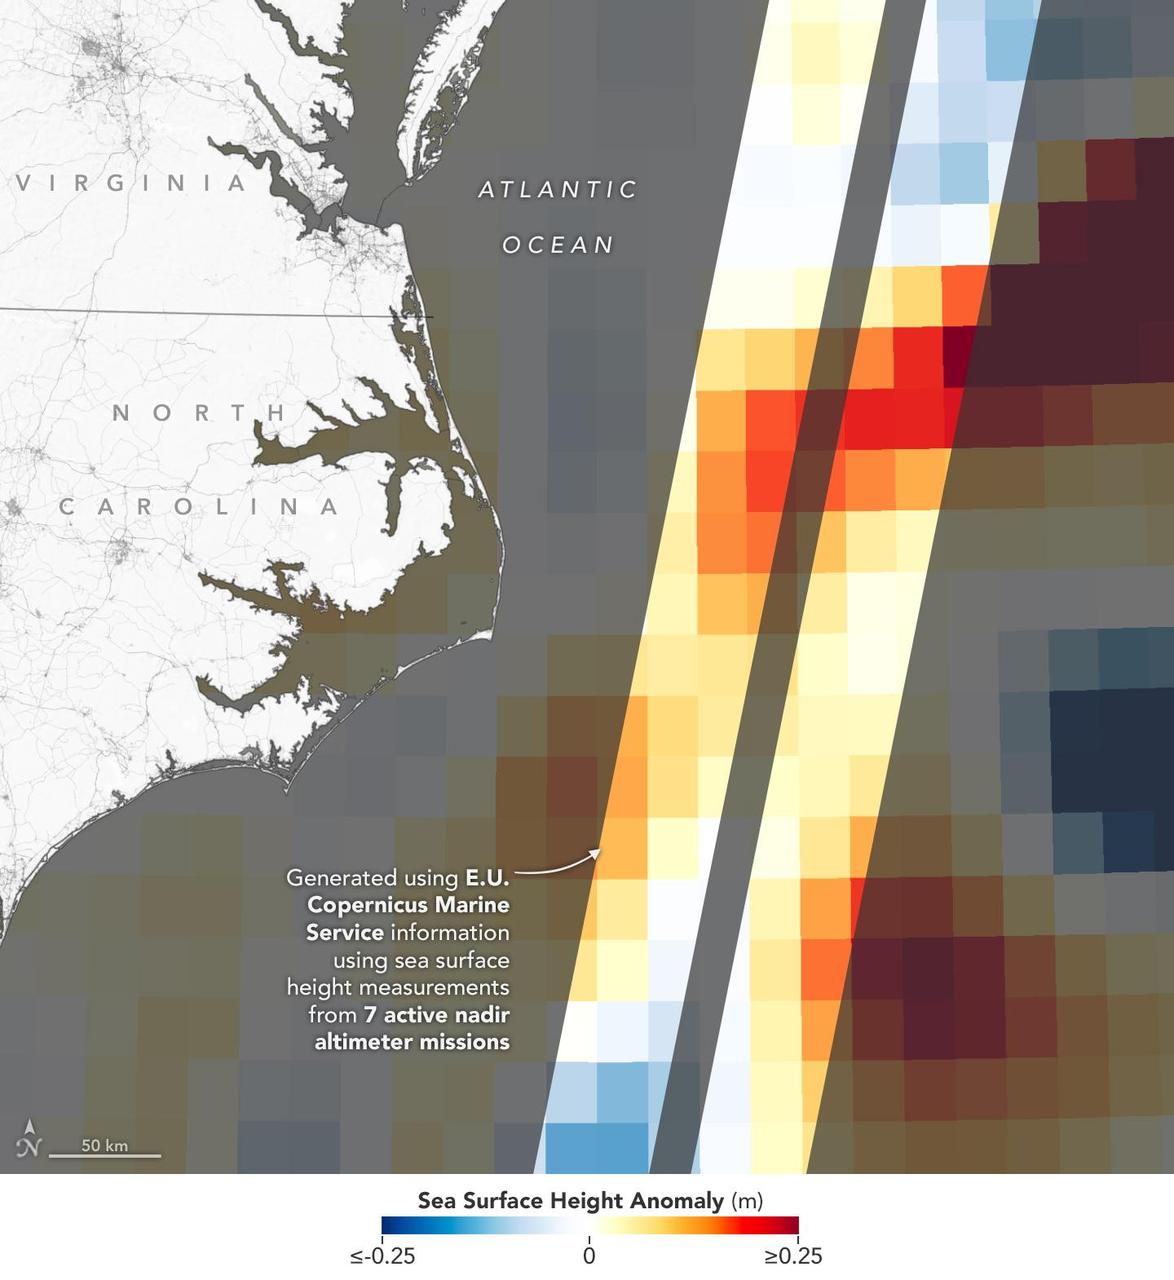
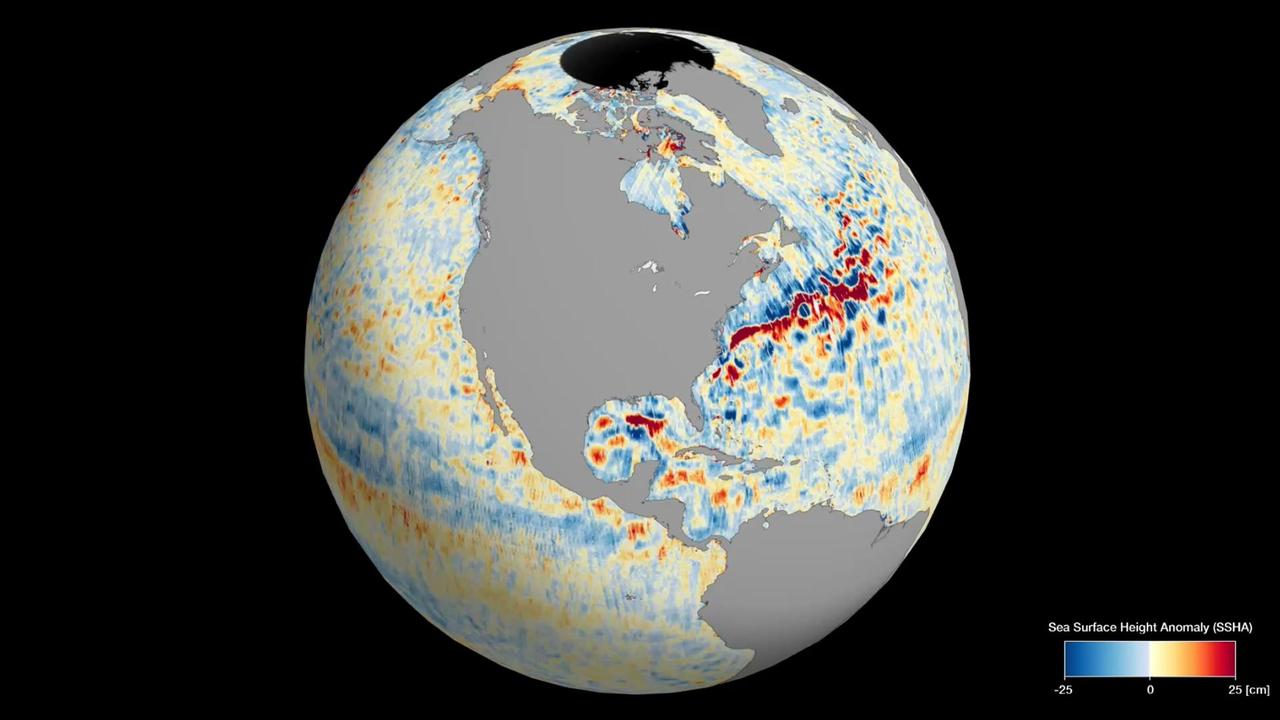
This visualization shows sea surface height measurements of the Gulf Stream off the coast of North Carolina and Virginia. The data was collected on Jan. 21, 2023, by seven satellites currently in operation. The information, provided by the Copernicus Marine Service of ESA (European Space Agency), comes from radar instruments called Earth-facing altimeters. In the visualization, red and orange areas represent sea levels that are higher than the global average, while shades of blue represent sea levels that are lower than average. An altimeter – widely used to measure sea level from space – works by bouncing radar signals off the ocean's surface directly beneath the instrument. It records both the time the signal takes to travel from a satellite to Earth and back, as well as the strength of the return signal. The spatial resolution offered by these instruments – shown in the composite image that's been modified so that different sea levels appear as different colors – is in contrast to the spatial resolution offered by a new instrument called the Ka-band Radar Interferometer (KaRIn), which is 10 times greater. KaRIn launched on board the Surface Water and Ocean Topography (SWOT) satellite on Dec. 16, 2022. SWOT is now in a six-month period called commissioning, calibration and validation. This is when engineers on the mission check out the performance of the satellite's systems and science instruments before the planned start of science operations in July 2023. Led by NASA and the French space agency Centre National d'Études Spatiales (CNES), SWOT will measure the height of water on over 90% of Earth's surface, providing a high-definition survey of our planet's water for the first time. The satellite's measurements of freshwater bodies and the ocean will provide insights into how the ocean influences climate change; how a warming world affects lakes, rivers, and reservoirs; and how communities can better prepare for floods and other disasters. https://photojournal.jpl.nasa.gov/catalog/PIA25773
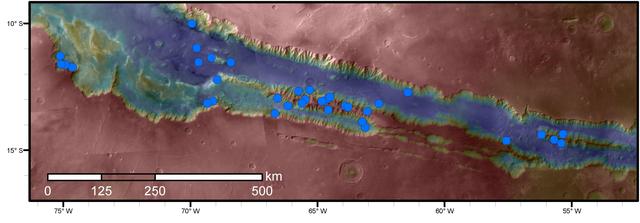
Blue dots on this map indicate sites of recurring slope lineae (RSL) in part of the Valles Marineris canyon network on Mars. RSL are seasonal dark streaks regarded as the strongest evidence for the possibility of liquid water on the surface of modern Mars. The area mapped here has the highest density of known RSL on the Red Planet. The RSL were identified by repeated observations of the sites using the High Resolution Imaging Science Experiment (HiRISE) camera on NASA's Mars Reconnaissance Orbiter. Map colors represent elevation, where red is high and blue is low. Valles Marineris is the largest canyon system in the solar system. The region shown here includes Melas Chasma and Coprates Chasma, in the central and eastern portions of Valles Marineris. The mapped area extends about 1,500 miles (2,400 kilometers) east to west and about 280 miles (450 kilometers) north to south, at latitudes from 9 to 17 degrees south of Mars' equator. The base map uses data from the Mars Orbiter Camera and Mars Orbiter Laser Altimeter of NASA's Mars Global Surveyor mission. RSL extend downslope during a warm season, fade in the colder part of the year, and repeat the process in a subsequent Martian year. A study of 41 RSL sites in this canyon area, published July 7, 2016, provides support for the notion that significant amounts of near-surface water can be found on modern Mars, though the work also indicates that puzzles remain unsolved in understanding how these seasonal features form. Each site includes anywhere from a few to more than 1,000 individual "lineae." http://photojournal.jpl.nasa.gov/catalog/PIA20756
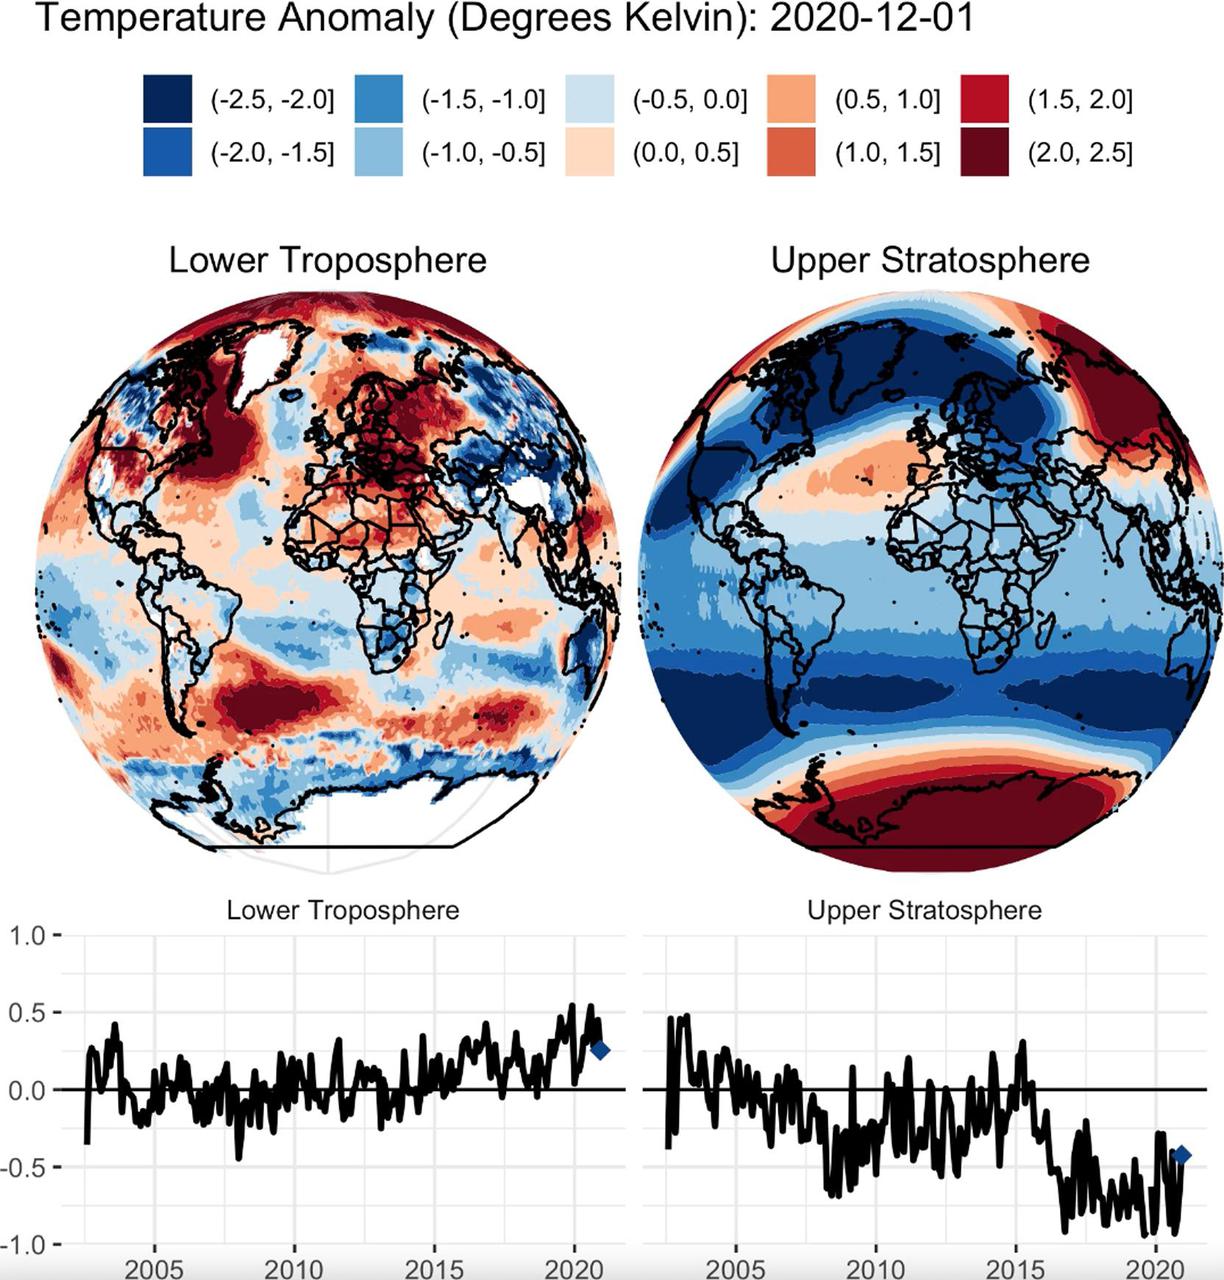
This animation shows a nearly 20-year record of temperature anomalies for two layers in Earth's atmosphere: the lower troposphere, where most of the planet's weather occurs; and the upper stratosphere, which contains the ozone layer. NASA's Atmospheric Infrared Sounder (AIRS), aboard the Aqua satellite, captured these measurements from 2002 to 2020. Preliminary data analysis shows a warming trend for the lower troposphere, and a strong cooling trend in the upper stratosphere. The globes show a map of where warmer than average or cooler than average temperatures for each atmospheric layer occurred during this time period. The line graphs show the deviation of temperatures averaged over the entire planet for the lower troposphere and upper stratosphere. AIRS, in conjunction with the Advanced Microwave Sounding Unit (AMSU), senses emitted infrared and microwave radiation from Earth to provide a three-dimensional look at the planet's weather and climate. Working in tandem, the two instruments make simultaneous observations down to Earth's surface. With more than 2,000 channels sensing different regions of the atmosphere, the system creates a global, three-dimensional map of atmospheric temperature and humidity, cloud amounts and heights, greenhouse gas concentrations and many other atmospheric phenomena. Launched into Earth orbit in 2002 aboard NASA's Aqua spacecraft, the AIRS and AMSU instruments are managed by NASA's Jet Propulsion Laboratory in Southern California, under contract to NASA. JPL is a division of Caltech. Movie available at https://photojournal.jpl.nasa.gov/catalog/PIA24139
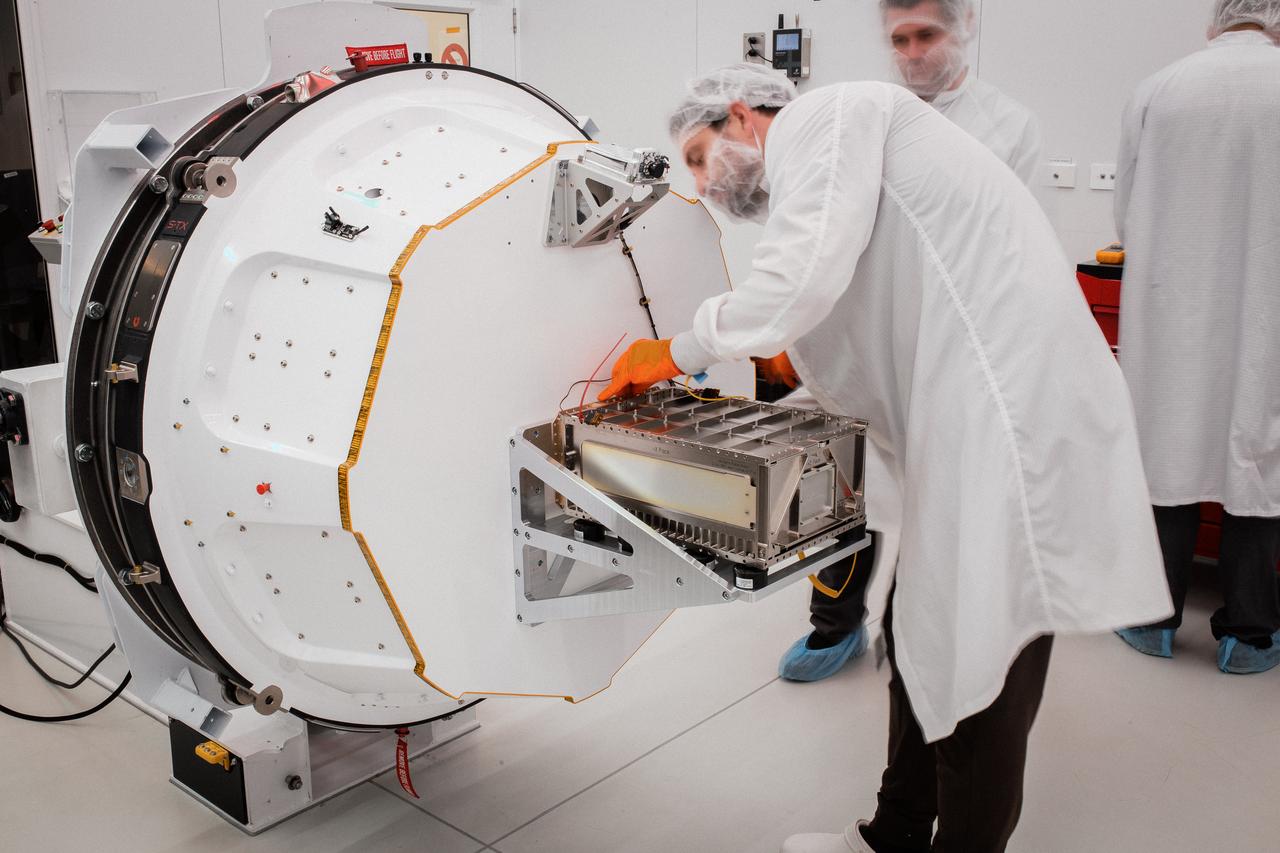
Engineers in a clean room at NASA's Jet Propulsion Laboratory in Southern California in April 2023 examine the imaging spectrometer that will ride aboard the first of two satellites to be launched by the Carbon Mapper Coalition. The instrument will help researchers detect emissions of carbon dioxide and methane from sources on Earth's surface from space. The gold-colored component is the spectrometer, which was developed at JPL. It's designed to receive sunlight reflected from Earth and divide that light into hundreds of distinct colors in the near-infrared and visible portion of the electromagnetic spectrum. By analyzing the light's spectroscopic signature – the wavelengths that show up in the signal as well as those that do not – researchers can determine whether the instrument is observing greenhouse gas emissions and, if so, estimate their concentrations. The black portion at the base of the instrument is a telescope that captures light from Earth's surface and reflects it into the spectrometer. When released into the atmosphere, carbon dioxide and methane are the greenhouse gases most responsible for human-caused global warming. Both have unique spectral signatures that make them detectable from space via spectroscopy. The imaging spectrometer is JPL's contribution to the Carbon Mapper Coalition, a joint effort led by the nonprofit Carbon Mapper that also includes Planet Labs PBC, the California Air Resources Board, Arizona State University, and the University of Arizona. Once the instrument is in orbit, researchers will use its measurements to identify the sources of carbon dioxide and methane plumes it detects. Identification of the origins of emissions is considered the first step towards mitigation. https://photojournal.jpl.nasa.gov/catalog/PIA25869
The front panel of this image cube features the true-color view of an area in southwest Libya observed by NASA's Earth Surface Mineral Dust Source Investigation (EMIT) imaging spectrometer, which orbits the planet aboard the International Space Station. The side panels depict the spectral fingerprint for every point in the image, which shows an area about 500 miles (800 kilometers) south of Tripoli. The instrument works by measuring reflected solar energy from Earth across hundreds of wavelengths, from the visible to the infrared range of the spectrum. The intensity of the reflected light varies by wavelength based on the material. Scientists use these patterns, called spectral fingerprints, to identify surface minerals and pinpoint their locations on a map. The cube is among the first created by scientists with EMIT data. Analysis of the patterns indicated that the surface contains kaolinite, a light-colored clay mineral, and goethite and hematite, two varieties of iron oxide, which is darker. When dust from the kaolinite-dominated areas is lofted into the atmosphere, the particles tend to scatter sunlight and reflect it back to space, cooling the air. The opposite effect occurs with airborne particles of iron oxide, which tend to absorb heat and warm the surrounding air. Over the course of its 12-month mission, EMIT will collect measurements of 10 important surface minerals – kaolinite, hematite, goethite, illite, vermiculite, calcite, dolomite, montmorillonite, chlorite, and gypsum – in arid regions between 50-degree south and north latitudes in Africa, Asia, North and South America, and Australia. The data EMIT collects will help scientists better understand the role of airborne dust particles in heating and cooling Earth's atmosphere on global and regional scales. https://photojournal.jpl.nasa.gov/catalog/PIA25430
This visualization shows sea surface height measurements in the Gulf Stream off the coast of North Carolina and Virginia. The data was collected on Jan. 21, 2023, by an instrument on the Surface Water and Ocean Topography (SWOT) satellite called the Ka-band Radar Interferometer (KaRIn). KaRIn's two antennas acquired data that was mapped as two wide, colored strips spanning a total of 75 miles (120 kilometers) across. In the visualization, red and orange areas represent sea levels that are higher than the global average, while shades of blue represent sea levels that are lower than average. The spatial resolution of SWOT ocean measurements is 10 times greater than the composite of sea surface height data gathered over the same area by seven other satellites that same day. KaRIn is the scientific heart of the SWOT mission. It's a radar instrument with one antenna at each end of a boom that's 33 feet (10 meters) long. This enables KaRIn to look off to either side of a center line directly below the satellite as the instrument bounces microwave signals off of Earth's surface. The returning radar signals arrive at each antenna slightly out of step, or phase, from one another. When these signals are combined with other information about the antennas and the satellite's altitude, scientists will be able to map the height of water on Earth's surface with never-before-seen clarity. Led by NASA and the French space agency Centre National d'Études Spatiales (CNES), SWOT will measure the height of water on over 90% of Earth's surface, providing a high-definition survey of our planet's water for the first time. The satellite's measurements of freshwater bodies and the ocean will provide insights into how the ocean influences climate change; how a warming world affects lakes, rivers, and reservoirs; and how communities can better prepare for disasters like floods. Launched on Dec. 16, 2022, from Vandenberg Space Force Base in central California, SWOT is now in a six-month period called commissioning, calibration and validation. This is when engineers on the mission check out the satellite's systems and science instruments to ensure data accuracy before the start of science operations in July. https://photojournal.jpl.nasa.gov/catalog/PIA25772
The mineral map shows an area of southwestern Libya in the Sahara Desert observed by NASA's Earth Surface Mineral Dust Source Investigation (EMIT) mission as it maps the world's mineral dust sources, gathering information about surface composition as the instrument, designed at NASA's Jet Propulsion Laboratory in Southern California, orbits aboard the International Space Station. The instrument works by measuring reflected solar energy from Earth across hundreds of wavelengths from the visible to the infrared range of the spectrum. The intensity of the reflected light varies by wavelength based on the material. Scientists are using these patterns, called spectral fingerprints, to identify surface minerals and pinpoint their locations on a map. The map is among the first produced by scientists with EMIT data. Analysis of the patterns indicate that the surface contains kaolinite, a light-colored clay mineral, and goethite and hematite, two varieties of iron oxide, which is darker. When dust from the kaolinite-dominated areas is lofted into the atmosphere, the particles tend to scatter sunlight and reflect it back to space, cooling the air. The opposite effect occurs with airborne particles of iron oxide, which tend to absorb heat and warm the surrounding air. Over the course of its 12-month mission, EMIT will collect measurements of 10 important surface minerals – kaolinite, hematite, goethite, illite, vermiculite, calcite, dolomite, montmorillonite, chlorite, and gypsum – in arid regions between 50-degree south and north latitudes in Africa, Asia, North and South America, and Australia. The data EMIT collects will help scientists better understand the role of airborne dust particles in heating and cooling Earth's atmosphere on global and regional scales. EMIT was developed at NASA's Jet Propulsion Laboratory, which is managed for the agency by Caltech in Pasadena, California. It launched to the space station in July 2022. https://photojournal.jpl.nasa.gov/catalog/PIA25424
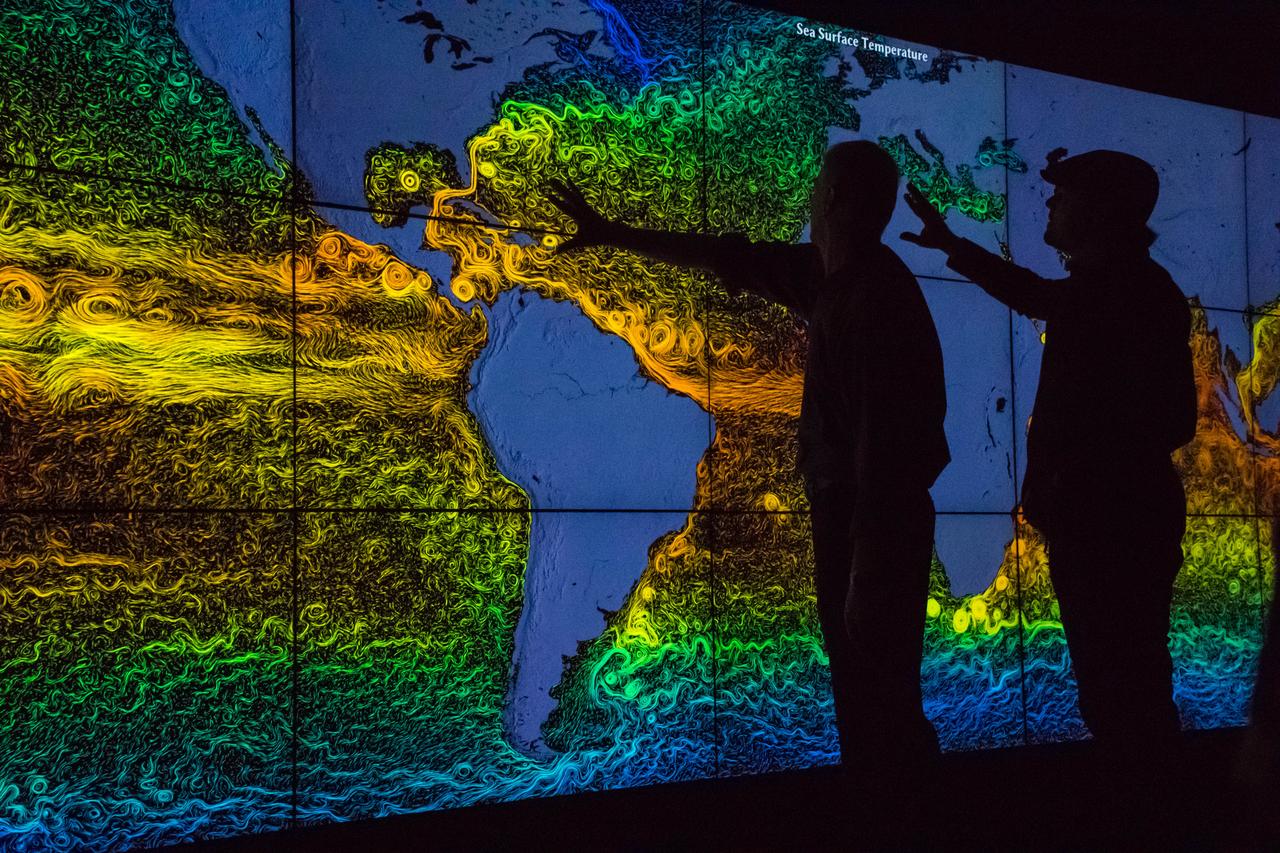
Academy Award®- winning actor and environmental activist Leonardo DiCaprio visited NASA’s Goddard Space Flight Center in Greenbelt, Maryland on Saturday, April 23, 2016. During his visit, Mr. DiCaprio interviewed Dr. Piers Sellers, an Earth scientist, former astronaut and current deputy director of Goddard’s Sciences and Exploration Directorate. The two discussed the different missions NASA has underway to study changes in the Earth’s atmosphere, water and land masses for a climate change documentary that Mr. DiCaprio has in production. Using a wall-size, high-definition display system that shows visual representations based on actual science data, Mr. DiCaprio and Dr. Sellers discussed data results from NASA’s fleet of satellites in Earth’s orbit. The background image showing global sea surface circulation colored by temperature where reds are warm areas (32 degrees Celsius) and blues are cold regions (0 degrees Celsius). The data used for this visual is a joint MIT/JPL project called Estimating the Circulation and Climate of the Ocean, Phase II (ECCO2). For more info on this visual, <a href="http://svs.gsfc.nasa.gov/cgi-bin/details.cgi?aid=3912" rel="nofollow">svs.gsfc.nasa.gov/cgi-bin/details.cgi?aid=3912</a> During his visit, Mr. DiCaprio also visited the facility holding NASA’s James Webb Space Telescope that is being developed as a large infrared telescope with a 6.5-meter primary mirror. The telescope will be launched on an Ariane 5 rocket from French Guiana in October of 2018, and will be a premier observatory of the next decade, serving thousands of astronomers worldwide. Credit: NASA/Goddard/Rebecca Roth <b><a href="http://www.nasa.gov/audience/formedia/features/MP_Photo_Guidelines.html" rel="nofollow">NASA image use policy.</a></b> <b><a href="http://www.nasa.gov/centers/goddard/home/index.html" rel="nofollow">NASA Goddard Space Flight Center</a></b> enables NASA’s mission through four scientific endeavors: Earth Science, Heliophysics, Solar System Exploration, and Astrophysics. Goddard plays a leading role in NASA’s accomplishments by contributing compelling scientific knowledge to advance the Agency’s mission. <b>Follow us on <a href="http://twitter.com/NASAGoddardPix" rel="nofollow">Twitter</a></b> <b>Like us on <a href="http://www.facebook.com/pages/Greenbelt-MD/NASA-Goddard/395013845897?ref=tsd" rel="nofollow">Facebook</a></b> <b>Find us on <a href="http://instagrid.me/nasagoddard/?vm=grid" rel="nofollow">Instagram</a></b>
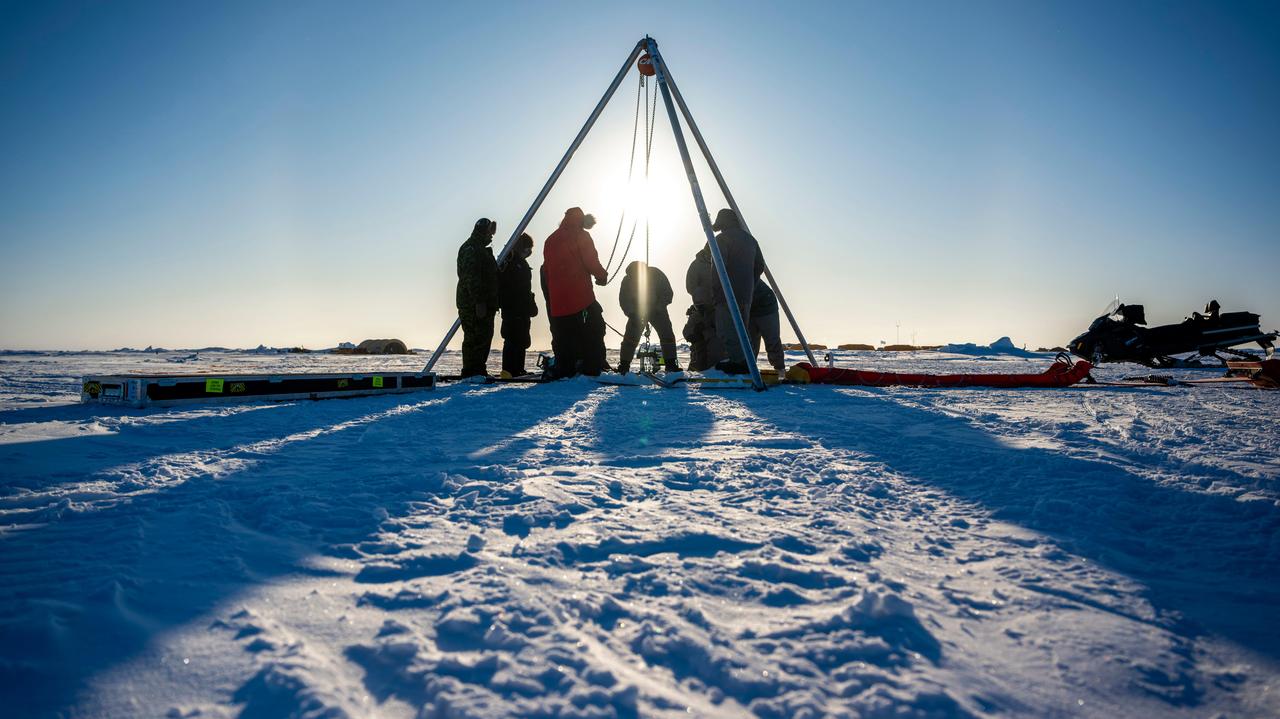
A prototype of an autonomous robot, part of a project called IceNode being developed at NASA's Jet Propulsion Laboratory, was tested in the Beaufort Sea north of Alaska in March 2024. The project envisions a fleet of such robots to venture beneath Antarctic ice shelves and gather data that would help scientists calculate how rapidly the ice shelves there are melting – and how fast that melting could cause global sea levels to rise. This image, as well as Figures A and B, shows the team lowering the prototype through a borehole in the sea ice. During this Arctic field test, the robot descended on a tether about 330 feet (100 meters) into the ocean, where its instruments gathered salinity, temperature, and flow data. The team also conducted tests to determine adjustments that would enable them to take the robot off-tether. Each about 8 feet (2.4 meters) long and 10 inches (25 centimeters) in diameter, the robots use three-legged "landing gear" that springs out from one end to attach the robot to the underside of the ice. Rather than using propulsion, the robots would autonomously position themselves with the help of novel algorithms based on models of ocean currents. Released from a borehole or a vessel in the open ocean, the robots would ride those currents on a long journey beneath an ice shelf. They would target the underwater area known as the "grounding zone," where floating ice shelves, ocean, and land meet, deep inside unmapped cavities where the ice may be melting the fastest. Each robot would detach a ballast and rise up to affix itself to the underside of the ice, where their suite of sensors would measure how fast warm, salty ocean water is circulating up to melt the ice, and how quickly cold meltwater is sinking. As conceived, the IceNode fleet would operate for up to a year, continuously capturing data, including seasonal fluctuations. Then the robots would detach themselves from the ice, drift back out to open ocean, and transmit their data via satellite. This test was conducted through the U.S. Navy Arctic Submarine Laboratory's biennial Ice Camp, a three-week operation that provides researchers a temporary base camp from which to conduct field work in the harsh Arctic environment. IceNode has been funded through JPL's internal research and technology development program and its Earth Science and Technology Directorate. JPL is managed for NASA by Caltech in Pasadena, California. https://photojournal.jpl.nasa.gov/catalog/PIA26349
This Spaceborne Imaging Radar-C/X-band Synthetic Aperture Radar color composite shows a portion of the Weddell Sea, which is adjacent to the continent of Antarctica. The image shows extensive coverage of first-year sea ice mixtures and patches of open water inside the ice margin. The image covers a 100 kilometer by 30 kilometer (62 mile by 18.5 mile) region of the southern ocean, centered at approximately 57 degrees south latitude and 3 degrees east longitude, which was acquired on October 3, 1994. Data used to create this image were obtained using the L-band (horizontally transmitted and vertically received) in red; the L-band (horizontally transmitted and received) in green; and the C-band (horizontally transmitted and received) in blue. The sea ice, which appears rust-brown in the image, is composed of loosely packed floes from approximately 1 meter to 2 meters (3 feet to 6.5 feet) thick and ranging from 1 meter to 20 meters (3 feet to 65.5 feet) in diameter. Large patches of open water, shown as turquoise blue, are scattered throughout the area, which is typical for ice margins experiencing off-ice winds. The thin, well-organized lines clearly visible in the ice pack are caused by radar energy reflected by floes riding the crest of ocean swells. The wispy, black features seen throughout the image represent areas where new ice is forming. Sea ice, because it acts as an insulator, reduces the loss of heat between the relatively warm ocean and cold atmosphere. This interaction is an important component of the global climate system. Because of the unique combination of winds, currents and temperatures found in this region, ice can extend many hundreds of kilometers north of Antarctica each winter, which classifies the Weddell Sea as one of nature's greatest ice-making engines. During the formation of sea ice, great quantities of salt are expelled from the frozen water. The salt increases the density of the upper layer of sea water, which then sinks to great depths. Oceanographers believe this process forms most of the oceans' deep water. Sea ice covering all of the southern oceans, including the Weddell Sea, typically reaches its most northerly extent in about September. As periods of daylight become gradually longer in the Southern Hemisphere, ice formation stops and the ice edge retreats southward. By February, most of the sea ice surrounding Antarctica disappears. Imaging radar is extremely useful for studying the polar regions because of the long periods of darkness and extensive cloud cover. The multiple frequencies of the SIR-C/X-SAR instruments allow further study into ways of improving the separation of the various thickness ranges of sea ice, which are vital to understanding the heat balance in the ice, ocean and atmospheric system. http://photojournal.jpl.nasa.gov/catalog/PIA01737
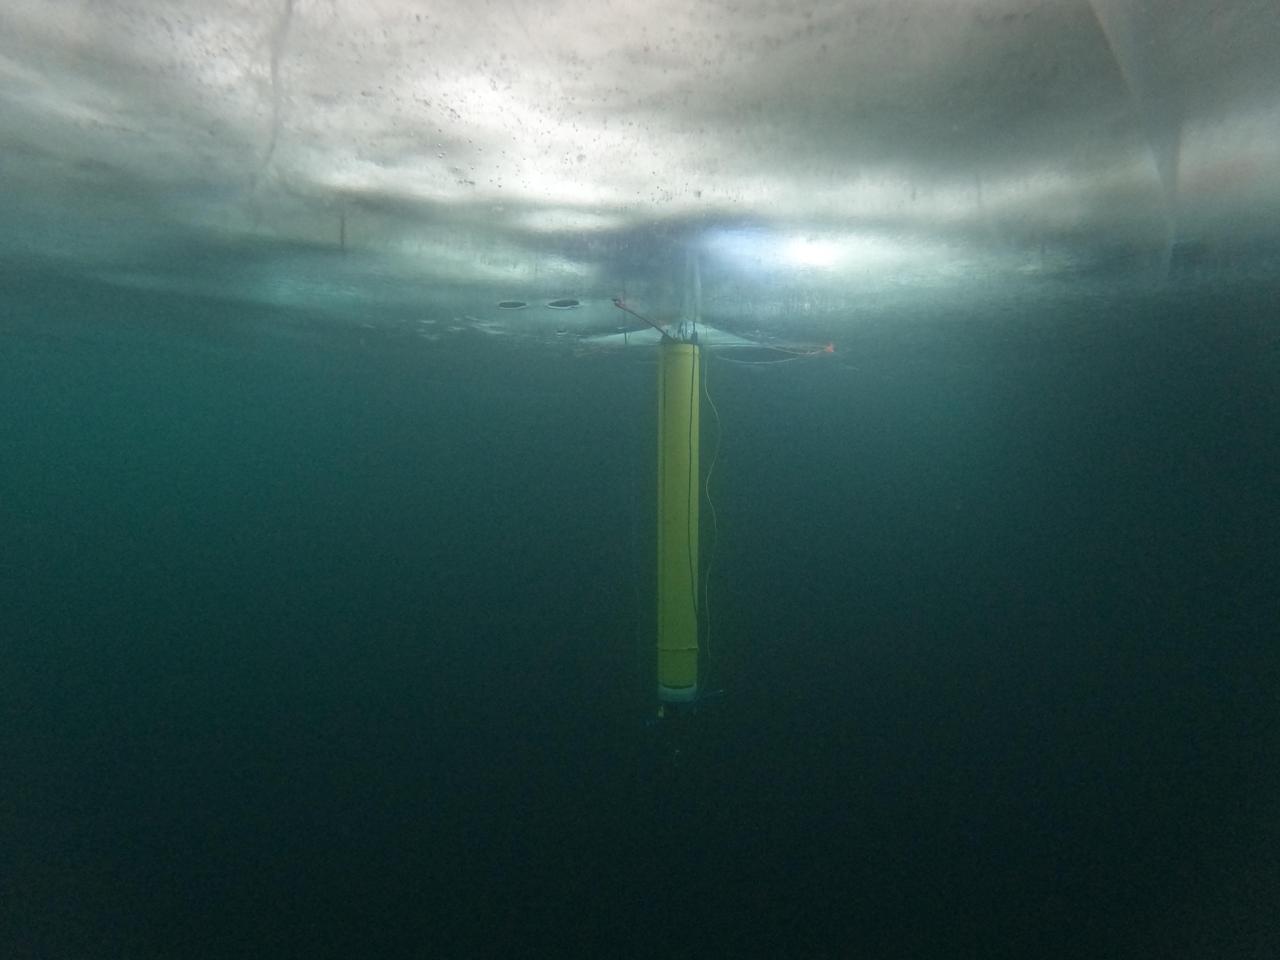
A prototype of an autonomous robot, part of a project called IceNode being developed at NASA's Jet Propulsion Laboratory, is seen from beneath the frozen surface of Lake Superior, off Michigan's Upper Peninsula. The three thin legs of the robot's "landing gear" affix it to the icy ceiling. A remote camera captured the image during a field test in 2022. The IceNode project envisions a fleet of such robots to venture beneath Antarctic ice shelves and gather data that would help scientists calculate how rapidly the ice shelves there are melting – and how fast that melting could cause global sea levels to rise. Each about 8 feet (2.4 meters) long and 10 inches (25 centimeters) in diameter, the robots use three-legged "landing gear" that springs out from one end to attach the robot to the underside of the ice. Rather than using propulsion, the robots would autonomously position themselves with the help of novel algorithms based on models of ocean currents. Released from a borehole or a vessel in the open ocean, the robots would ride those currents on a long journey beneath an ice shelf. They would target the underwater area known as the "grounding zone," where floating ice shelves, ocean, and land meet, deep inside unmapped cavities where the ice may be melting the fastest. Each robot would detach a ballast and rise up to affix itself to the underside of the ice, where their suite of sensors would measure how fast warm, salty ocean water is circulating up to melt the ice, and how quickly cold meltwater is sinking. As conceived, the IceNode fleet would operate for up to a year, continuously capturing data, including seasonal fluctuations. Then the robots would detach themselves from the ice, drift back out to open ocean, and transmit their data via satellite. This test was conducted through the U.S. Navy Arctic Submarine Laboratory's biennial Ice Camp, a three-week operation that provides researchers a temporary base camp from which to conduct field work in the harsh Arctic environment. IceNode has been funded through JPL's internal research and technology development program and its Earth Science and Technology Directorate. JPL is managed for NASA by Caltech in Pasadena, California. https://photojournal.jpl.nasa.gov/catalog/PIA26421
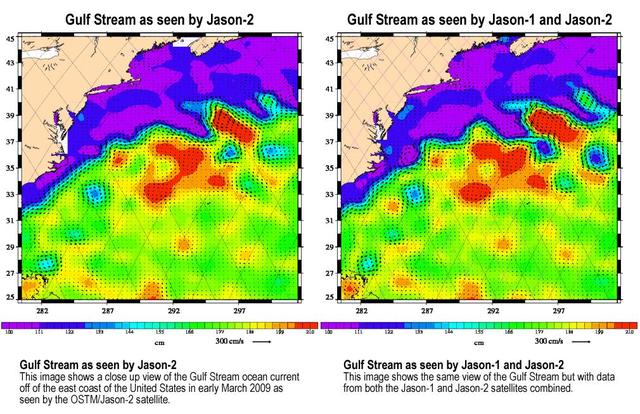
Created with altimeter data from NASA's Ocean Surface Topography Mission (OSTM)/Jason-2 satellite and the Jason-1 satellite, this image shows a portion of the Gulf Stream off the east coast of the United States. It demonstrates how much more detail is visible in the ocean surface when measured by two satellites than by one alone. The image on the left was created with data from OSTM/Jason-2. The image on the right is the same region but made with combined data from OSTM/Jason-2 and Jason-1.It shows the Gulf Stream's eddies and rings much more clearly. This image is a product of the new interleaved tandem mission of the Jason-1 and Ocean Surface Topography Mission (OSTM)/Jason-2 satellites. (The first global map from this tandem mission is available at PIA11859.) In January 2009, Jason-1 was maneuvered into orbit on the opposite side of Earth from its successor, OSTM/Jason-2 satellite. It takes 10 days for the satellites to cover the globe and return to any one place over the ocean. So, in this new tandem configuration, Jason-1 flies over the same region of the ocean that OSTM/Jason-2 flew over five days earlier. Its ground tracks fall mid-way between those of Jason-2, which are about 315 kilometers (195 miles) apart at the equator. Working together, the two spacecraft measure the surface topography of the ocean twice as often as would be possible with one satellite, and over a 10-day period, they return twice the amount of detailed measurements. Combining data from the two satellites makes it possible to map smaller, more rapidly changing features than one satellite could alone. These images show sea-level anomaly data from the first 14 days of the interleaved orbit of Jason-1 and OSTM/Jason-2, the period beginning on Feb. 20, 2009. An anomaly is a departure from a value averaged over a long period of time. Red and yellow are regions where sea levels are higher than normal. Purple and dark blue show where sea levels are lower. A higher-than-normal sea surface is usually a sign of warm waters below, while lower sea levels indicate cooler than normal temperatures. http://photojournal.jpl.nasa.gov/catalog/PIA11997

ISS036-E-028913 (4 Aug. 2013) --- A sunset over the Aleutian Islands, with noctilucent clouds, is featured in this image photographed by an Expedition 36 crew member on the International Space Station. The crew member took this panoramic view looking north from the Aleutian Islands when the space station was flying east at ?the top of the orbit,? the northernmost latitude reached by the orbital complex (51.6 degrees north). If the sun had been higher, the string of Aleutian Islands would have been visible in the foreground. Here the islands are on the dark side of the day-night line. From their vantage point at 222 kilometers altitude on this day, crew members were able to see as far north as the Arctic Ocean and the midnight sun. This image was taken just 20 minutes after local midnight in early August 2013. The midnight sun makes the red, diamond-shaped teardrop reflection (lower center)?perhaps a reflection within the camera lens, or from the window frame, or some item inside the ISS. Long blue-white stringers can be seen in the atmosphere above the midnight sun. These are known as noctilucent clouds (night-shining clouds). Some crew members say these wispy, rippling, iridescent clouds are the most beautiful phenomena they see from orbit. Noctilucents are thin so that they are best seen after sunset when the viewer is on the night side of the day-night line, but while these high clouds are still lit by the sun. Crews are trained in this somewhat complicated geometry?of clouds being lit from beneath, with the spacecraft in sunlight though the ground directly beneath is in darkness. Noctilucent clouds are also known as polar mesospheric clouds (PMCs) as they appear in the summer hemisphere over polar latitudes. Some data suggest that they are becoming brighter, and appearing at lower latitudes, perhaps as an effect of global warming. A comparison of noctilucent cloud formation from 2012 and 2013 has been compiled using data from NASA?s Aeronomy of Ice in the Mesosphere (AIM) shows an earlier start and an increase in the area covered by these clouds in 2013. Polar mesospheric clouds are interesting to scientists because they form much higher in the atmosphere (75-90 kilometers) compared with altitudes of normal rainclouds that form in the lowest, densest ?weather-layer? below approximately 15 kilometers. The weather layer, or troposphere, is most distinct in this image as a thin orange line along the left horizon.
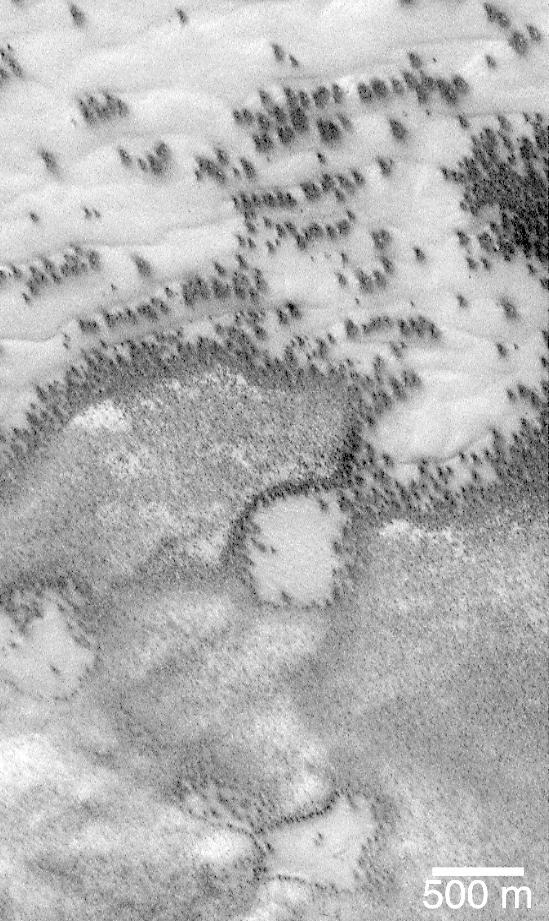
"They look like bushes!" That's what almost everyone says when they see the dark features found in pictures taken of sand dunes in the polar regions as they are beginning to defrost after a long, cold winter. It is hard to escape the fact that, at first glance, these images acquired by the Mars Global Surveyor (MGS) Mars Orbiter Camera (MOC) over both polar regions during the spring and summer seasons, do indeed resemble aerial photographs of sand dune fields on Earth -- complete with vegetation growing on and around them! Of course, this is not what the features are, as we describe below and in related picture captions. Still, don't they look like vegetation to you? Shown here are two views of the same MGS MOC image. On the left is the full scene, on the right is an expanded view of a portion of the scene on the left. The bright, smooth surfaces that are dotted with occasional, nearly triangular dark spots are sand dunes covered by winter frost. The MGS MOC has been used over the past several months (April-August 1999) to monitor dark spots as they form and evolve on polar dune surfaces. The dark spots typically appear first along the lower margins of a dune -- similar to the position of bushes and tufts of grass that occur in and among some sand dunes on Earth. Because the martian air pressure is very low -- 100 times lower than at Sea Level on Earth -- ice on Mars does not melt and become liquid when it warms up. Instead, ice sublimes -- that is, it changes directly from solid to gas, just as "dry ice" does on Earth. As polar dunes emerge from the months-long winter night, and first become exposed to sunlight, the bright winter frost and snow begins to sublime. This process is not uniform everywhere on a dune, but begins in small spots and then over several months it spreads until the entire dune is spotted like a leopard. The early stages of the defrosting process -- as in the picture shown here -- give the impression that something is "growing" on the dunes. The sand underneath the frost is dark, just like basalt beach sand in Hawaii. Once it is exposed to sunlight, the dark sand probably absorbs sunlight and helps speed the defrosting of each sand dune. This picture was taken by MGS MOC on July 21, 1999. The dunes are located in the south polar region and are expected to be completely defrosted by November or December 1999. North is approximately up, and sunlight illuminates the scene from the upper left. The 500 meter scale bar equals 547 yards; the 300 meter scale is also 328 yards. http://photojournal.jpl.nasa.gov/catalog/PIA02300
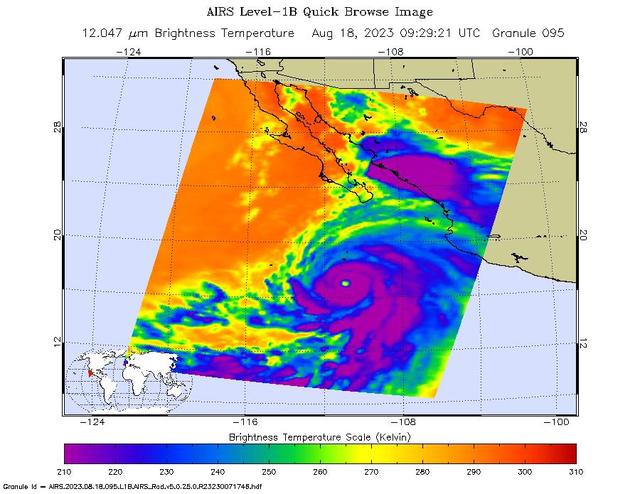
NASA's Atmospheric Infrared Sounder (AIRS) captured Hurricane Hilary on the morning of Aug. 18, 2023, when it was a Category 4 storm roughly 470 miles (760 kilometers) south of Baja California. Hilary could be the first tropical storm to make landfall in California since 1939, according to the National Weather Service. Hilary grew from a tropical storm into a Category 2 hurricane within 24 hours on Aug. 17. Another period of rapid intensification – an increase in maximum sustained wind speed of at least 30 knots (35 mph) within 24 hours – occurred Aug. 17-18. The animation shows some of this rapid growth, with images taken by AIRS Aug. 15-18. This intensification was driven by very warm ocean surface waters and weak wind shear, a term for vertical changes in wind speed. Strong wind shear can keep hurricanes from forming, or can tear them apart. AIRS measures cloud temperatures in infrared wavelengths, which can reveal information about the atmosphere not visible to the human eye. Hilary shows several indicators of a powerful hurricane: a well-defined eye surrounded by a ring of very cold clouds in purple, with warmer outer regions seen in yellows and oranges. Purple and violet areas are colder, between about minus 82 degrees Fahrenheit and minus 46 F (minus 63 degrees Celsius to minus 44 C). Blue and green regions are roughly minus 28 F to 26 F (minus 33 C to minus 3 C). The cooler parts of the clouds are associated with very heavy rainfall. Most hurricanes in the Pacific Ocean off Mexico travel westward, following tropical trade winds. Occasionally, one of these storms will head northward. Hurricane Hilary is being steered by a weak low-pressure system off the coast of California, an area normally dominated by high pressure and an atmospheric circulation pattern that would deflect storms from the region. The current forecast from the National Hurricane Center has Hilary closely following the western coastline of the Baja California peninsula, weakening as it moves north. Rainfall projections for Southern California range from 2 inches (5 centimeters) in coastal areas to 8 or more inches (20 or more centimeters) in local mountains. For comparison, San Diego and Los Angeles receive no rain in August most years, and the wettest parts of the local mountains receive about 1 inch (3 centimeters) of rain over a normal summer. In conjunction with the Advanced Microwave Sounding Unit (AMSU), AIRS senses emitted infrared and microwave radiation from Earth to provide a 3D look at the planet's weather and climate. Working in tandem, the two instruments make simultaneous observations down to Earth's surface. With more than 2,000 channels sensing different regions of the atmosphere, the system creates a global, 3D map of atmospheric temperature and humidity, cloud amounts and heights, greenhouse gas concentrations, and many other atmospheric phenomena. Launched into Earth orbit in 2002 aboard NASA's Aqua spacecraft, the AIRS and AMSU instruments are managed by NASA's Jet Propulsion Laboratory in Southern California, under contract to NASA. JPL is a division of Caltech. Animation available at https://photojournal.jpl.nasa.gov/catalog/PIA25779
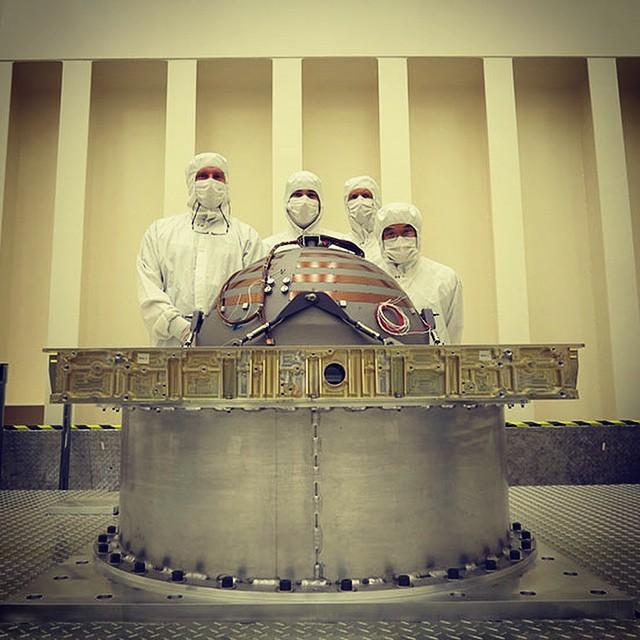
The Soil Moisture Active Passive (SMAP) mission, scheduled for launch on Jan. 29, will measure the moisture in Earth's soil with greater accuracy and higher resolution than any preceding mission, producing a global map of soil moisture every three days. Here are five quick facts about the spacecraft and what it studies. 1. Soil moisture is a tiny fraction of water with a big punch. Only 0.001 percent of Earth's total water is lodged in the top few feet of soil. That tiny percentage, however, affects all living things on land and plays an important role in moving water, carbon and heat between land and atmosphere. 2. Soil moisture can compound water risks. A flood follows a heavy rainfall -- but only if the ground cannot soak up the rain. Waterlogged soil makes a region more flood-prone. Going to the opposite extreme, a drought can parch soil to such an extent that plants are unable to grow even after a few rains have fallen. Knowing soil moisture allows hydrologists to make better decisions related to the risk of flooding and drought, such as how much water to retain in reservoirs. 3. Soil moisture controls the on-off switch for carbon dioxide cleanup. The world's vast northern forests remove carbon dioxide from the air as they grow, helping to clean up our emissions from burning fossil fuels. But when the ground freezes, that process switches off. Carbon dioxide builds up in the atmosphere until the ground thaws in the spring and plants begin growing again. Knowing where and for how long the ground is frozen or thawed is an important part of understanding the role of the northern forests in reducing greenhouse warming. SMAP will map frozen and thawed soils north of 45 degrees north latitude (about the latitude of Minneapolis), around the globe. 4. SMAP is a twofer. The spacecraft's radiometer produces an accurate reading of how much moisture is in the top two inches (five centimeters) of soil, but it has low spatial resolution, that is, one measurement covers a large area. A radar instrument produces an image with higher spatial resolution, but it can't measure soil moisture as accurately as a radiometer. Through sophisticated data processing, SMAP combines observations from the two instruments into a very accurate measurement with high spatial resolution. 5. SMAP has a huge, folding, spinning antenna. At 19 feet 8 inches (6 meters) in diameter, SMAP's rotating mesh antenna dwarfs the size of the instruments and spacecraft and is the largest rotating antenna of its kind that NASA has yet deployed. But the entire dish furls into a cylinder one foot (diameter) by four feet (30 by 120 centimeters) to fit inside the rocket’s fairing for launch, and it weighs only 128 pounds (about 58 kilograms). For more information about SMAP, see: <a href="http://smap.jpl.nasa.gov/" rel="nofollow">smap.jpl.nasa.gov/</a> <a href="http://www.nasa.gov/smap/" rel="nofollow">www.nasa.gov/smap/</a> <b><a href="http://www.nasa.gov/audience/formedia/features/MP_Photo_Guidelines.html" rel="nofollow">NASA image use policy.</a></b> <b><a href="http://www.nasa.gov/centers/goddard/home/index.html" rel="nofollow">NASA Goddard Space Flight Center</a></b> enables NASA’s mission through four scientific endeavors: Earth Science, Heliophysics, Solar System Exploration, and Astrophysics. Goddard plays a leading role in NASA’s accomplishments by contributing compelling scientific knowledge to advance the Agency’s mission. <b>Follow us on <a href="http://twitter.com/NASAGoddardPix" rel="nofollow">Twitter</a></b> <b>Like us on <a href="http://www.facebook.com/pages/Greenbelt-MD/NASA-Goddard/395013845897?ref=tsd" rel="nofollow">Facebook</a></b> <b>Find us on <a href="http://instagram.com/nasagoddard?vm=grid" rel="nofollow">Instagram</a></b>
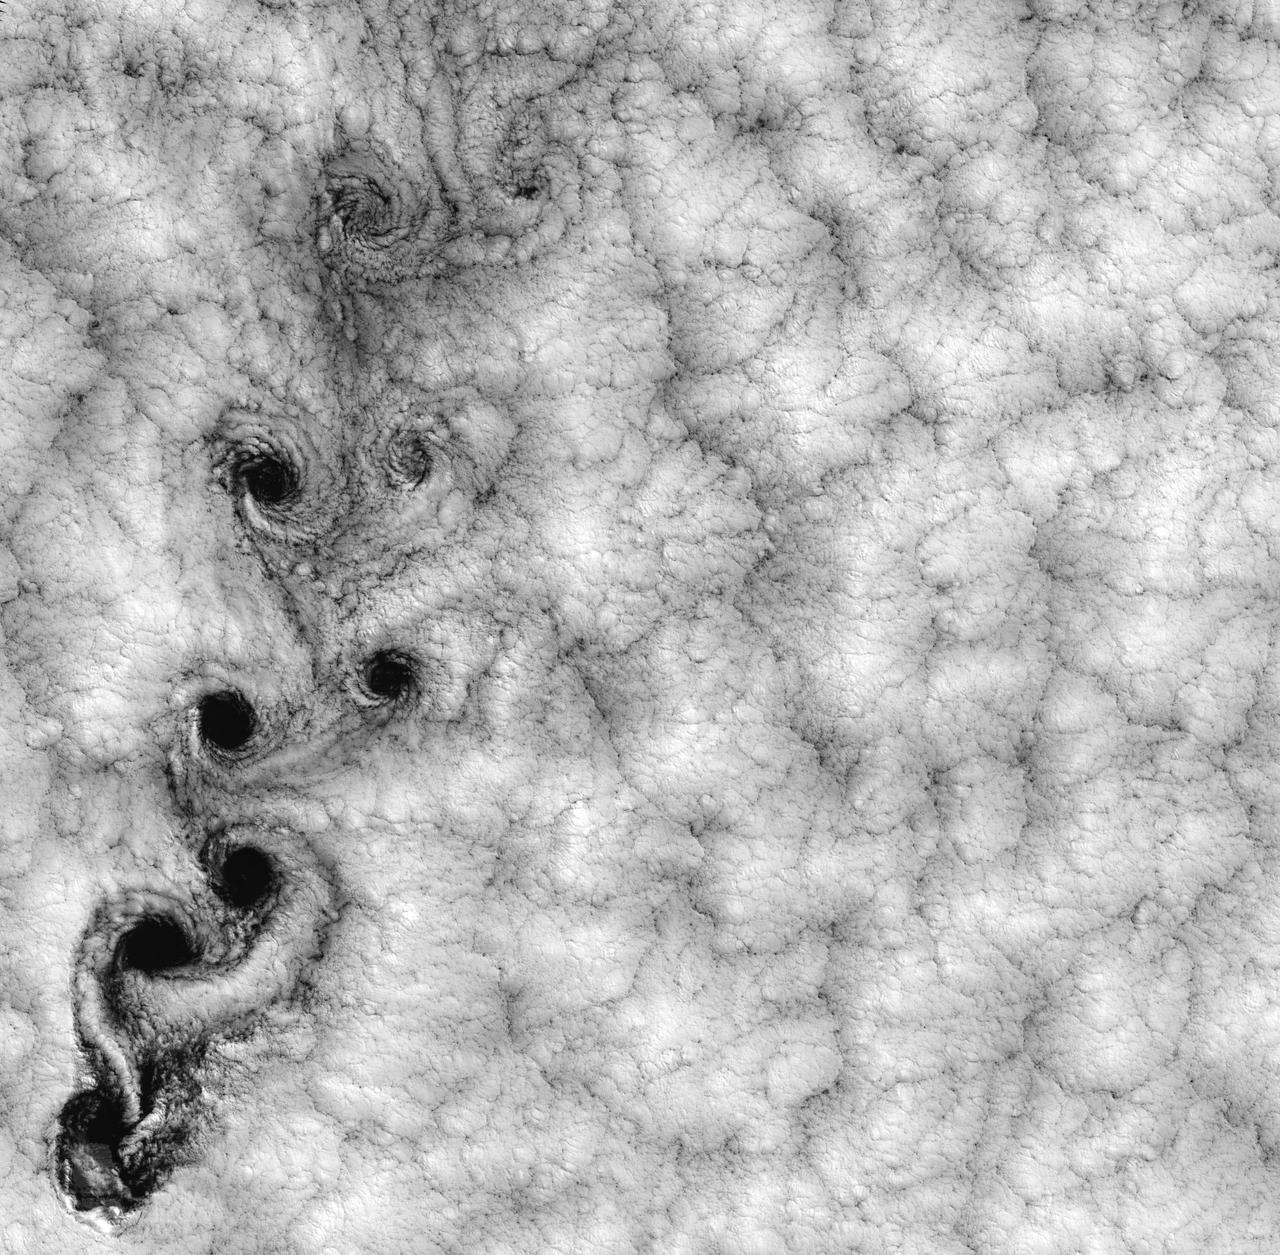
NASA image acquired September 15, 1999 This Landsat 7 image of clouds off the Chilean coast near the Juan Fernandez Islands (also known as the Robinson Crusoe Islands) on September 15, 1999, shows a unique pattern called a “von Karman vortex street.” This pattern has long been studied in the laboratory, where the vortices are created by oil flowing past a cylindrical obstacle, making a string of vortices only several tens of centimeters long. Study of this classic “flow past a circular cylinder” has been very important in the understanding of laminar and turbulent fluid flow that controls a wide variety of phenomena, from the lift under an aircraft wing to Earth’s weather. Here, the cylinder is replaced by Alejandro Selkirk Island (named after the true “Robinson Crusoe,” who was stranded here for many months in the early 1700s). The island is about 1.5 km in diameter, and rises 1.6 km into a layer of marine stratocumulus clouds. This type of cloud is important for its strong cooling of the Earth’s surface, partially counteracting the Greenhouse warming. An extended, steady equatorward wind creates vortices with clockwise flow off the eastern edge and counterclockwise flow off the western edge of the island. The vortices grow as they advect hundreds of kilometers downwind, making a street 10,000 times longer than those made in the laboratory. Observing the same phenomenon extended over such a wide range of sizes dramatizes the “fractal” nature of atmospheric convection and clouds. Fractals are characteristic of fluid flow and other dynamic systems that exhibit “chaotic” motions. Both clockwise and counter-clockwise vortices are generated by flow around the island. As the flow separates from the island’s leeward (away from the source of the wind) side, the vortices “swallow” some of the clear air over the island. (Much of the island air is cloudless due to a local “land breeze” circulation set up by the larger heat capacity of the waters surrounding the island.) The “swallowed” gulps of clear island air get carried along within the vortices, but these are soon mixed into the surrounding clouds. Landsat is unique in its ability to image both the small-scale eddies that mix clear and cloudy air, down to the 30 meter pixel size of Landsat, but also having a wide enough field-of-view, 180 km, to reveal the connection of the turbulence to large-scale flows such as the subtropical oceanic gyres. Landsat 7, with its new onboard digital recorder, has extended this capability away from the few Landsat ground stations to remote areas such as Alejandro Island, and thus is gradually providing a global dynamic picture of evolving human-scale phenomena. For more details on von Karman vortices, refer to <a href="http://climate.gsfc.nasa.gov/~cahalan" rel="nofollow">climate.gsfc.nasa.gov/~cahalan</a>. Image and caption courtesy Bob Cahalan, NASA GSFC Instrument: Landsat 7 - ETM+ Credit: NASA/GSFC/Landsat <b><a href="http://www.nasa.gov/centers/goddard/home/index.html" rel="nofollow">NASA Goddard Space Flight Center</a></b> enables NASA’s mission through four scientific endeavors: Earth Science, Heliophysics, Solar System Exploration, and Astrophysics. Goddard plays a leading role in NASA’s accomplishments by contributing compelling scientific knowledge to advance the Agency’s mission. <b>Follow us on <a href="http://twitter.com/NASA_GoddardPix" rel="nofollow">Twitter</a></b> <b>Join us on <a href="http://www.facebook.com/pages/Greenbelt-MD/NASA-Goddard/395013845897?ref=tsd" rel="nofollow">Facebook</a></b>