This graphic depicts the relative shapes and distances from Mars for five active orbiter missions plus the planet's two natural satellites. It illustrates the potential for intersections of the spacecraft orbits.  The number of active orbiter missions at Mars increased from three to five in 2014. With the increased traffic, NASA has augmented a process for anticipating orbit intersections and avoiding collisions.  NASA's Mars Odyssey and MRO (Mars Reconnaissance Orbiter) travel near-circular orbits. The European Space Agency's Mars Express, NASA's MAVEN (Mars Atmosphere and Volatile Evolution) and India's MOM (Mars Orbiter Mission), travel more elliptical orbits. Phobos and Deimos are the two natural moons of Mars.  http://photojournal.jpl.nasa.gov/catalog/PIA19396
Diverse Orbits Around Mars Graphic
High-Resolution MOC Image of Phobos with Graphics Overlay
This graphic details launch operations for SpaceX missions to the International Space Station. SpaceX is one of two commercial partners providing transportation to and from the space station as part of NASA’s Commercial Crew Program.
SpaceX Crew Mission Graphics - Launch
This graphic details the makeup of SpaceX’s Crew Dragon spacecraft. Crew Dragon is used for all crewed SpaceX missions to the International Space Station as part of NASA’s Commercial Crew Program.
SpaceX Crew Mission Graphics - Crew Dragon
This graphic details return operations for SpaceX missions to the International Space Station. SpaceX is one of two commercial partners providing transportation to and from the space station as part of NASA’s Commercial Crew Program.
SpaceX Crew Mission Graphics - Return to Earth
This graphic provides an overview of SpaceX mission operations. SpaceX is one of two commercial partners providing transportation to and from the International Space Station as part of NASA’s Commercial Crew Program.
SpaceX Crew Mission Graphics - Approach to ISS
This graphic details the makeup of SpaceX’s Crew Dragon spacecraft. Crew Dragon is used for all crewed SpaceX missions to the International Space Station as part of NASA’s Commercial Crew Program.
SpaceX Crew Mission Graphics - Crew Dragon
This graphic details the makeup of SpaceX’s Falcon 9 rocket. Falcon 9 is the launch vehicle SpaceX uses for all crewed missions to the International Space Station as part of NASA’s Commercial Crew Program.
SpaceX Crew Mission Graphics - Falcon 9
Cortez III Employee Delivers Work Between the Print Shop and the Building 60 Graphics Department
This graphic details ascent operations for NASA’s Boeing Orbital Flight Test-2 (OFT-2). OFT-2 is the second uncrewed flight test of the company’s CST-100 Starliner spacecraft for the agency’s Commercial Crew Program.
Boeing OFT-2 Graphics - Ascent
This graphic details landing operations for NASA’s Boeing Orbital Flight Test-2 (OFT-2). OFT-2 is the second uncrewed flight test of the company’s CST-100 Starliner spacecraft for the agency’s Commercial Crew Program.
Boeing OFT-2 Graphics - Landing
This graphic details docking operations for NASA’s Boeing Orbital Flight Test-2 (OFT-2). OFT-2 is the second uncrewed flight test of the company’s CST-100 Starliner spacecraft for the agency’s Commercial Crew Program.
Boeing OFT-2 Graphics - Docking
This graphic details undocking operations for NASA’s Boeing Orbital Flight Test-2 (OFT-2). OFT-2 is the second uncrewed flight test of the company’s CST-100 Starliner spacecraft for the agency’s Commercial Crew Program.
Boeing OFT-2 Graphics - Undocking
This image is an unannotated version of NASA Photojournal Home Page graphic released in October 2007.
Photojournal Home Page Graphic 2007
Graphics  (McAlister) Army Aeroflightdynamics Directorate 3D Laser Velocimeter for Rotor Flow Studies: Laser Velocimetry Program Tasks Composite.
ARC-1989-AC89-0013-4
Graphics  (McAlister) Army Aeroflightdynamics Directorate 3D Laser Velocimeter for Rotor Flow Studies: Fringe Model for Optical Partical Sizing Composite.
ARC-1989-AC89-0013-5
Graphics  (McAlister) Army Aeroflightdynamics Directorate 3D Laser Velocimeter for Rotor Flow Studies: Focusing of Laser Beam into Single-Mode Fiber Composite.
ARC-1989-AC89-0013-6
Graphics  (McAlister) Army Aeroflightdynamics Directorate 3D Laser Velocimeter for Rotor Flow Studies: Funding of Army 3D Laser Velocimeter Composite.
ARC-1989-AC89-0013-3
Comparison of a Computer Graphic Model of the Opportunity Lander and Rover with MOC Orbital Image
Top View of a Computer Graphic Model of the Opportunity Lander and Rover
This image is an unannotated version of NASA Planetary Photojournal Home Page graphic. This digital collage contains a highly stylized rendition of our solar system and points beyond.
Planetary Photojournal Home Page Graphic
This graphic shows the time, speed, and altitude of key events from launch of the SLS (Space Launch System) rocket and Orion spacecraft and ascent to space, through Orion's perigee raise burn during the Artemis II test flight.
Artemis II Ascent Graphic
This graphic provides a detailed overview of the makeup of Boeing’s CST-100 Starliner spacecraft, as well as the United Launch Alliance Atlas V rocket.
Boeing OFT-2 Graphics - Starliner Facts and Rocket Facts
This graphic illustrates how a faraway quasar (an extremely bright region in the center of some distant galaxies) is altered by a massive foreground galaxy. The galaxy's powerful gravity warps and magnifies the quasar's light, producing four distorted images of the quasar.  Dark matter is an invisible substance that makes up the bulk of the universe's mass and creates the scaffolding upon which galaxies are built.  Quadruple images of a quasar rare because the background quasar and foreground galaxy require an almost perfect alignment.  https://photojournal.jpl.nasa.gov/catalog/PIA23641
Gravitational Lensing Graphic
This graphic depicts the Mars Climate Sounder instrument on NASA Mars Reconnaissance Orbiter measuring the temperature of a cross section of the Martian atmosphere as the orbiter passes above the south polar region.
Scanning Martian Atmospheric Temperatures Graphic
This digital collage contains a highly stylized rendition of our solar system and points beyond. As this graphic was intended to be used as a navigation aid in searching for data within the Photojournal, certain artistic embellishments have been added.
Photojournal Home Page Graphic 2009 Artist Concept
N-258 NAS (Numerical Aerodynamic Simulation) Computers - Silicon Graphics Power Challenge
ARC-1997-AC97-0105-1
Ames Life Sciences Experiments: Cedi Snowden at Silicon Graphics with AX-5 spacesuit glove
ARC-1994-AC94-0261-7
NASA image release November 9, 2010  To view a video about this story go to: <a href="http://www.flickr.com/photos/gsfc/5162413062">www.flickr.com/photos/gsfc/5162413062</a>  From end to end, the newly discovered gamma-ray bubbles extend 50,000 light-years, or roughly half of the Milky Way's diameter, as shown in this illustration. Hints of the bubbles' edges were first observed in X-rays (blue) by ROSAT, a Germany-led mission operating in the 1990s. The gamma rays mapped by Fermi (magenta) extend much farther from the galaxy's plane.   To learn more go to: <a href="http://www.nasa.gov/mission_pages/GLAST/news/new-structure.html" rel="nofollow">www.nasa.gov/mission_pages/GLAST/news/new-structure.html</a>  <b><a href="http://www.nasa.gov/centers/goddard/home/index.html" rel="nofollow">NASA Goddard Space Flight Center</a></b> enables NASA’s mission through four scientific endeavors: Earth Science, Heliophysics, Solar System Exploration, and Astrophysics. Goddard plays a leading role in NASA’s accomplishments by contributing compelling scientific knowledge to advance the Agency’s mission.  <b>Follow us on <a href="http://twitter.com/NASA_GoddardPix" rel="nofollow">Twitter</a></b>  <b>Join us on <a href="http://www.facebook.com/pages/Greenbelt-MD/NASA-Goddard/395013845897?ref=tsd" rel="nofollow">Facebook</a></b>  Credit: <a href="http://svs.gsfc.nasa.gov/index.html" rel="nofollow">NASA/Goddard Space Flight Center Scientific Visualization Studio</a>
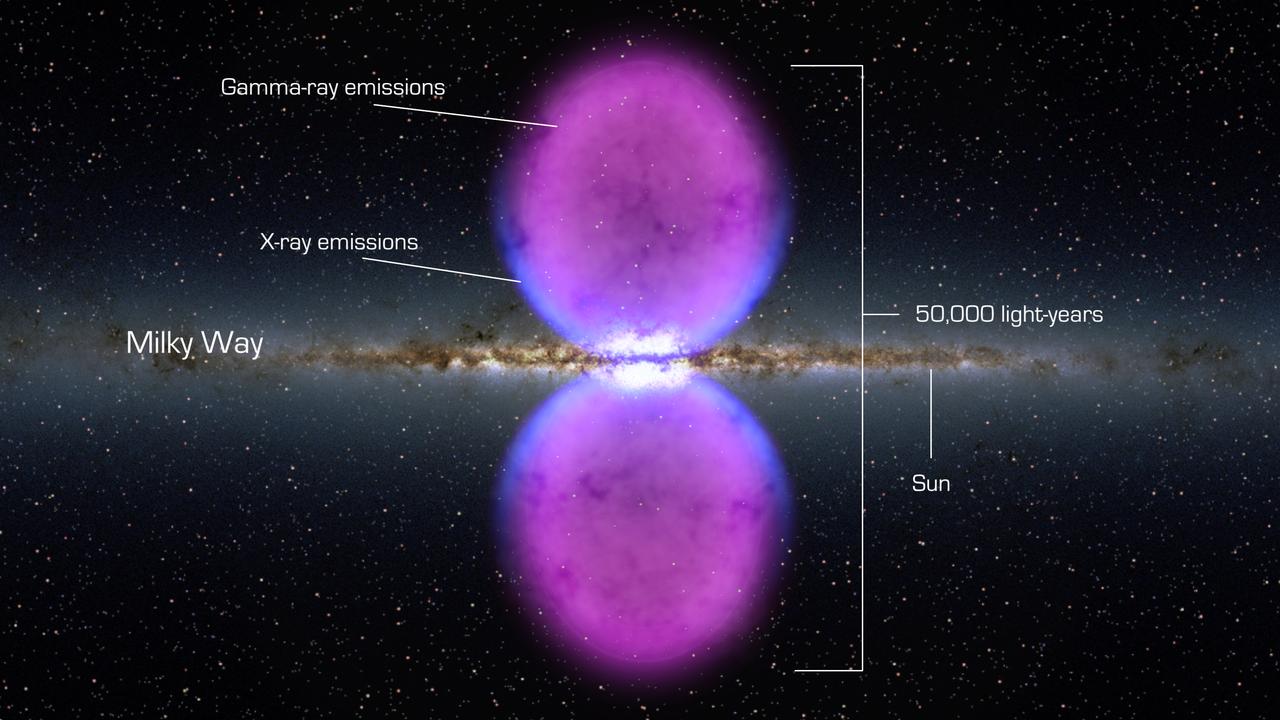
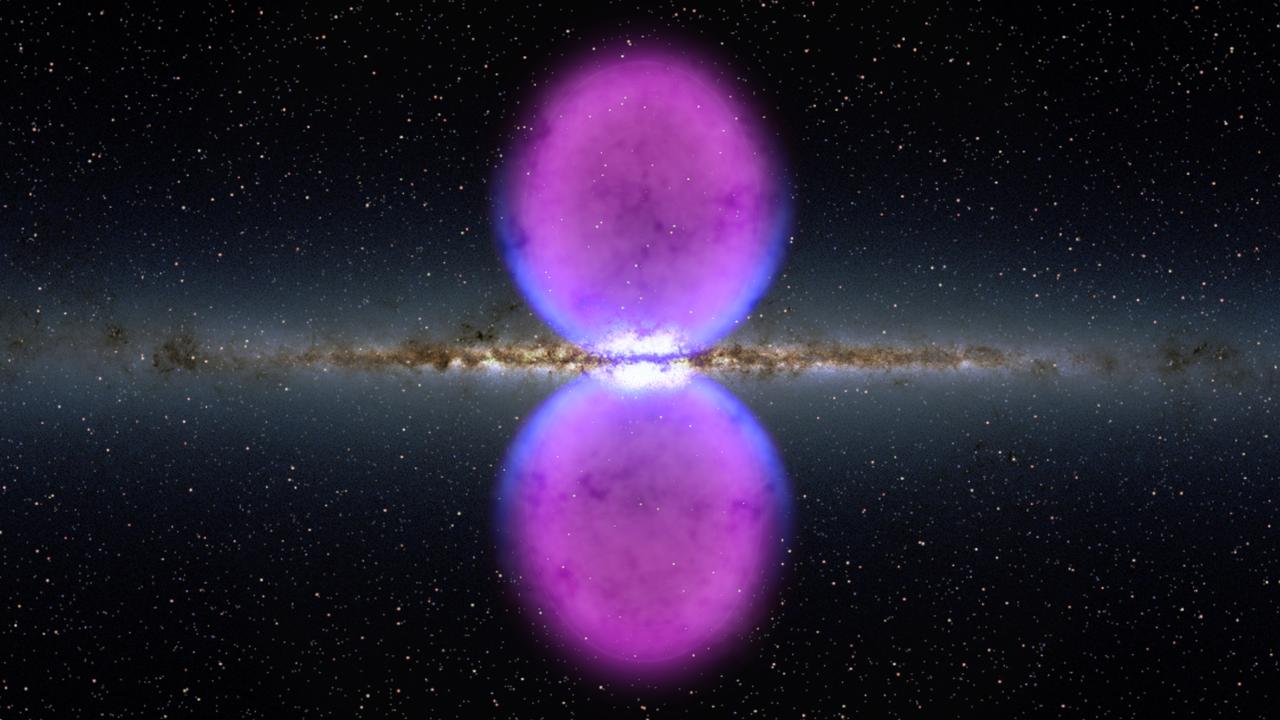
Fermi Bubble Graphic
NASA image release November 9, 2010  To view a video about this story go to: <a href="http://www.flickr.com/photos/gsfc/5162413062">www.flickr.com/photos/gsfc/5162413062</a>  From end to end, the gamma-ray bubbles extend 50,000 light-years, or roughly half of the Milky Way's diameter, as shown in this illustration. The bubbles stretch across 100 degrees, spanning the sky from the constellation Virgo to the constellation Grus. If the structure were rotated into the galaxy's plane, it would extend beyond our solar system. Hints of the bubbles' edges were first observed in X-rays (blue) by ROSAT (Röntgen Satellite), a Germany-led mission operating in the 1990s. The gamma rays mapped by Fermi (magenta) extend much farther from the galaxy's plane.  To learn more go to: <a href="http://www.nasa.gov/mission_pages/GLAST/news/new-structure.html" rel="nofollow">www.nasa.gov/mission_pages/GLAST/news/new-structure.html</a>  <b><a href="http://www.nasa.gov/centers/goddard/home/index.html" rel="nofollow">NASA Goddard Space Flight Center</a></b> enables NASA’s mission through four scientific endeavors: Earth Science, Heliophysics, Solar System Exploration, and Astrophysics. Goddard plays a leading role in NASA’s accomplishments by contributing compelling scientific knowledge to advance the Agency’s mission.  <b>Follow us on <a href="http://twitter.com/NASA_GoddardPix" rel="nofollow">Twitter</a></b>  <b>Join us on <a href="http://www.facebook.com/pages/Greenbelt-MD/NASA-Goddard/395013845897?ref=tsd" rel="nofollow">Facebook</a></b>  Credit: <a href="http://svs.gsfc.nasa.gov/index.html" rel="nofollow">NASA/Goddard Space Flight Center Scientific Visualization Studio</a>
Fermi Bubble Graphic
This graphic shows the locations of the cameras on NASA Curiosity rover.
Seventeen Cameras on Curiosity Artist Concept
Several projects supporting NASA's Advanced Air Mobility or AAM mission are working on different elements to help make AAM a reality and one of these research areas is automation. This concept graphic shows how elements of automation could be integrated into a future airspace. Technology like this could enable vehicles to operate without a pilot, or if a pilot is in the loop, increase the safety.
Advanced Air Mobility Looks Ahead to Automation
NOAA’s Geostationary Operational Environmental Satellite-U (GOES-U) mission graphic is displayed on the historic countdown clock at Kennedy Space Center’s NASA News Center in Florida on Tuesday, Jan. 23, 2024. GOES-U is the fourth and final satellite in NOAA's GOES-R series of advanced geostationary weather satellites. Data from the GOES satellite constellation – consisting of the GOES-R, GOES-S, GOES-T and GOES-U spacecraft – enables forecasters to predict, observe, and track local weather events that affect public safety like thunderstorms, hurricanes, and wildfires.
GOES-U Graphic on Countdown Clock
This graphic shows Venus, Earth and its Moon, and Mars.  https://photojournal.jpl.nasa.gov/catalog/PIA25285
Venus, Earth and Its Moon, and Mars
Computer Automatic Virtual Environment, CAVE Tours to Mark the 30th Anniversary of the Graphics and Visualization Lab, GVIS
Computer Automatic Virtual Environment, CAVE Tours to Mark the 3
This graphic shows a possible robotic lander for a future mission to Jupiter moon Europa.
A Possible Lander with Tools for Europa
Artist graphic of the asteroid belt, part of Dawn Mission Art series.  http://photojournal.jpl.nasa.gov/catalog/PIA19380
Asteroid Belt
This cross-section graphic provides an interpretation of the geologic relationship between the Murray Formation, the crater floor sediments, and the hematite ridge.
Geologic Cross-Section
This schematic graphic illustrates the bombardments that lead to colorful splotches and bands on the surfaces of several icy moons of Saturn.
Moons Under Bombardment
This graphic shows the geologic time scale of asteroid Vesta derived from geologic mapping.
Geological Time Scale of Vesta
This graphic shows the orbits of all the known Potentially Hazardous Asteroids PHAs, numbering over 1,400 as of early 2013.
Orbits of Potentially Hazardous Asteroids PHAs
This computer graphic image shows three craters in the eastern Hellas region of Mars containing concealed glaciers detected by radar.
Three Craters
This graphic compares the size of Earth and Kepler-1649c, an exoplanet only 1.06 times larger than Earth by radius.  https://photojournal.jpl.nasa.gov/catalog/PIA23774
Comparing the Size of Exoplanet Kepler-1649c and Earth (Illustration)
KENNEDY SPACE CENTER, FLA.  - This seal illustrates the mission of the Gravity Probe B spacecraft and the organizations who developed the experiment: Stanford University, NASA’s Marshall Space Flight Center and Lockheed Martin.  The Gravity Probe B mission will test the theory of curved spacetime and "frame-dragging," depicted graphically in the lower half, that was developed by Einstein and other scientists.   Above the graphic is a drawing of GP-B circling the Earth.
KENNEDY SPACE CENTER, FLA. - This seal illustrates the mission of the Gravity Probe B spacecraft and the organizations who developed the experiment: Stanford University, NASA’s Marshall Space Flight Center and Lockheed Martin. The Gravity Probe B mission will test the theory of curved spacetime and "frame-dragging," depicted graphically in the lower half, that was developed by Einstein and other scientists. Above the graphic is a drawing of GP-B circling the Earth.
This graphic from NASA Curiosity mission shows an analysis of the composition of two rocks called Crest and Rapitan in the Yellowknife Bay area of Mars
Signs of Hydrated Calcium Sulfates in Martian Rocks
This graphic depicts the position of the Philae lander of the European Space Agency Rosetta mission in the context of topographic modeling of the surface of comet 67P/Churyumov-Gerasimenko nucleus.
Philae Lander Setting on Comet Surface
This graphic shows the variation of radiation dose measured by the Radiation Assessment Detector on NASA Curiosity rover over about 50 sols, or Martian days, on Mars.
Longer-Term Radiation Variations at Gale Crater
This graphic of Jupiter moon Europa maps a relationship between the amount of energy deposited onto the moon from charged-particle bombardment and chemical contents of ice deposits.
Energy From Above Affecting Surface of Europa
This graphic from NASA Curiosity mission shows close-ups of light-toned veins in rocks in the Yellowknife Bay area of Mars together with analyses of their composition.
Calcium-Rich Veins in Martian Rocks
This graphic illuminates the process by which astronomers using NASA Spitzer Space Telescope have, for the first time, detected the light from a super Earth planet.
Measuring Brightness of Super Earth 55 Cancri e
This graphic depicts what Mars atmosphere would have looked like to a viewer with ultraviolet-seeing eyes after a meteor shower on Oct. 19, 2014.
Emission from Ionized Magnesium in Mars Atmosphere After Comet Flyby
Ruby Flottum reads the first issue of NASA's "First Woman" graphic novel, entitled "Dream to Reality," on Monday, July 25, 2022 at AirVenture at Oshkosh.
AirVenture 2022
This graphic highlights locations on the moon NASA considers lunar heritage sites and the path NASA Gravity Recovery and Interior Laboratory spacecraft will take on their final flight.
Lunar Heritage Sites and GRAIL Final Mile
This graphic shows the planned trek of NASA Dawn spacecraft from its launch in 2007 through its arrival at the dwarf planet Ceres in early 2015.
Journey to Ceres
This graphic shows the daily variations in Martian radiation and atmospheric pressure as measured by NASA Curiosity rover. As pressure increases, the total radiation dose decreases.
Daily Cycles of Radiation and Pressure at Gale Crater
This graphic shows the location of four cameras and a microphone on the spacecraft for NASA's Mars 2020 Perseverance mission. These cameras will capture the entry, descent, and landing phase of the mission.  https://photojournal.jpl.nasa.gov/catalog/PIA24378
Mars 2020 Camera and Microphone Location (Illustration)
IMMERSADESK II 2 IN GRAPHICS VISUALIZATION LAB
GRC-1998-C-01349
This graphic shows the level of natural radiation detected by the Radiation Assessment Detector shielded inside NASA Mars Science Laboratory on the trip from Earth to Mars from December 2011 to July 2012.
Radiation Measurements During Trip From Earth to Mars
This graphic depicting the bulk density of the lunar highlands on the near and far sides of the moon was generated using gravity data from NASA GRAIL mission and topography data from NASA Lunar Reconnaissance Orbiter.
Mapping Lunar Highlands
This graphic, constructed from data obtained by NASA Cassini spacecraft, shows the percentage of cloud coverage across the surface of Saturn moon Titan. The color scale from black to yellow signifies no cloud coverage to complete cloud coverage.
Mapping Titan Cloud Coverage
As on the Earth, many processes can move material down a Martian slope. This graphic compares seven different types of features observed on Mars that appear to result from material flowing or sliding or rolling down slopes.
Martian Features Formed When Material Moves Downslope
This graphic offers comparisons between the amount of an organic chemical named chlorobenzene detected in the Cumberland rock sample and amounts of it in samples from three other Martian surface targets analyzed by NASA Curiosity Mars rover.
Comparing Cumberland With Other Samples Analyzed by Curiosity
This graphic combines a perspective view from NASA Mars Reconnaissance Orbiter of the Botany Bay and Cape York areas of the rim of Endeavour Crater on Mars, and an inset with mapping-spectrometer data.
Botany Bay and Cape York with Vertical Exaggeration
This composite graphic illustrates the use of the Shallow Radar instrument on NASA Mars Reconnaissance Orbiter for mapping underground ice-rich layers of the north polar layered terrain on Mars.
Radar Mapping of Icy Layers Under Mars North Pole
This graphic shows the different streams of charged particles inside the bubble around our sun and outside, in the unexplored territory of interstellar space. The heliosheath, where NASA two Voyager spacecraft are now traveling, is shown in red.
Streams of Charged Particles
This graphic shows tenfold spiking in the abundance of methane in the Martian atmosphere surrounding NASA Curiosity Mars rover, as detected by a series of measurements made with the Tunable Laser Spectrometer instrument in the rover laboratory suite.
Methane Measurements by NASA Curiosity in Mars Gale Crater
This graphic illustrates a stellar fountain of crystal rain, beginning with a NASA Spitzer picture of the star in question, and ending with an artist concept of what the crystal rain might look like.
Finding Forsterite Around a Developing Star Artist Concept
This graphic illustrates the interior of Saturn moon Enceladus. It shows  warm, low-density material rising to the surface from within, in its icy  shell yellow and/or its rocky core red
Enceladus Roll
This graphic shows the relative positions of NASA most distant spacecraft in early 2011, looking at the solar system from the side. Voyager 1 is the most distant spacecraft, 10.9 billion miles away from the sun at a northward angle.
Relative Positions of Distant Spacecraft
This graphic, based on data from NASA Voyager spacecraft, shows a model of what our solar system looks like to an observer outside in interstellar space, watching our solar system fly towards the observer.
Our Solar System, from the Outside
This grouping of two test rovers and a flight spare provides a graphic comparison of three generations of Mars rovers developed at NASA Jet Propulsion Laboratory, Pasadena, Calif. The setting is JPL Mars Yard testing area.
Three Generations in Mars Yard, High Viewpoint
This graphic depicting the bulk density of the lunar highlands on the near and far sides of the moon was generated using gravity data from NASA GRAIL mission and topography data from NASA Lunar Reconnaissance Orbiter.
Mapping Lunar Highlands
This graphic shows the global distribution of craters that hit the giant asteroid Vesta, based on data from NASA Dawn mission. The yellow circles indicate craters of 2 miles or wider, with the size of the circles indicating the size of the crater.
Crater Impacts on Vesta
This graphic tracks the maximum relative humidity and the temperature at which that maximum occurred each Martian day, or sol, for about one-fourth of a Martian year, as measured by REMS on NASA Curiosity Mars rover.
Humidity in Gale Crater: Scant and Variable
This graphic portrays the sequence of key events in August 2012 from the time the NASA Mars Science Laboratory spacecraft, with its rover Curiosity, enters the Martian atmosphere to a moment after it touches down on the surface.
Final Minutes of Curiosity Arrival at Mars
This graphic shows a comparison of the observed change in Jupiter's radial magnetic field, over time, as well as the change calculated from the model, assuming eastward drift of the "Great Blue Spot" (GBS).  https://photojournal.jpl.nasa.gov/catalog/PIA25036
Mapping the Great Blue Spot
This graphic depicts the position of the Philae lander of the European Space Agency Rosetta mission, and a nearby cliff photographed by the lander, in the context of topographic modeling of the surface of comet 67P/Churyumov-Gerasimenko nucleus.
Philae Lander Setting on Comet, with Cliff-Image Inset
This graphic depicts the passage of asteroid 2014 EC past Earth on March 6, 2014. The asteroid closest approach is a distance equivalent to about one-sixth of the distance between Earth and the moon. The indicated times are in Universal Time.
Asteroid 2014 EC Flyby of Earth on March 6, 2014
This graphic plots the source locations of geysers scientists have located on Enceladus south polar terrain, with the 36 most active geyser sources marked and color coded by the behavior of the grains erupting from the geysers.
Tendril-producing Geysers on Enceladus South Polar Terrain
This graphic illustrates where astronomers at last found oxygen molecules in space -- near the star-forming core of the Orion nebula. The squiggly lines, or spectra, reveal the signatures of oxygen molecules, detected by ESA Hershel Space Observatory.
Oxygen in Orion
This graphic shows the pattern of winds predicted to be swirling around and inside Gale Crater, where NASA Curiosity rover landed on Mars. Modeling the winds gives scientists a context for the data from Curiosity Rover Environmental Monitoring Station
Mountain Winds at Gale Crater
Like a human working in a radiation environment, NASA Curiosity rover carries its own version of a dosimeter to measure radiation from outer space and the sun. This graphic shows the flux of radiation detected the rover Radiation Assessment Detector.
Curiosity First Radiation Measurements on Mars
This graphic, using data from NASA Cassini spacecraft, shows how the south polar terrain of Saturn moon Enceladus emits much more power than scientists had originally predicted.
Enceladus the Powerhouse
The yellow line on this graphic indicates the number of hours of sunlight each sol, or Martian day, beginning with the entire Martian day about 24 hours and 40 minutes for the first 90 sols, then declining to no sunlight by about sol 300.
Declining Sunshine for Phoenix Lander
The images at the top of this graphic represent two popular models describing how stars blast apart. The models point to different triggers of the explosion. Jet-driven models are illustrated with an artist concept shown at left.
NuSTAR Data Point to Sloshing Supernovas
This graphic shows the flux of radiation detected by NASA Mars Science Laboratory on the trip from Earth to Mars; the spikes in radiation levels occurred because of large solar energetic particle events caused by giant flares on the sun.
Radiation Levels on the Way to Mars
This graphic shows a 3-D model of 98 geysers whose source locations and tilts were found in a NASA Cassini imaging survey of Enceladus south polar terrain by the method of triangulation.
Geyser Basin in 3-D
This graphic demonstrates the hiss-like radio noise generated by electrons moving along magnetic field lines from the Saturnian moon Enceladus to a glowing patch of ultraviolet light on Saturn.
Hiss from Aurora Caused by Enceladus
This graphic depicts the passage of asteroid 2014 DX110 past Earth on March 5, 2014. The asteroid closest approach was at a distance equivalent to about nine-tenths of the distance between Earth and the moon.
Asteroid 2014 DX110 Flyby of Earth on March 5, 2014
This graphic shows the distribution of the organic molecule acetylene at the north and south poles of Jupiter, based on data obtained by NASA Cassini spacecraft in early January 2001. Movie is available at the Photojournal.
Acetylene around Jupiter Poles
This graphic illustrates the evolution of satellites designed to measure ancient light leftover from the big bang that created our universe 13.8 billion years ago; NASA COBE Explorer left and WMAP middle, and ESA Planck right.
The Universe Comes into Sharper Focus
This graphic shows the location of water vapor detected over Europa south pole in observations taken by NASA Hubble Space Telescope in December 2012. This is the first strong evidence of water plumes erupting off Europa surface.
Water Vapor Over Europa
This graphic shows the NASA Voyager 1 spacecraft and the location of its low-energy charged particle instrument. A labeled close-up of the low-energy charged particle instrument appears as the inset image.
Location of Low-Energy Charged Particle Instrument
This graphic illustrates how the Cosmic Infrared Background Experiment, or CIBER, team measures a diffuse glow of infrared light filling the spaces between galaxies. The glow does not come from any known stars and galaxies.
Masking Out Galaxies
This graphic presents results from APXS onboard NASA rover Curiosity, with the comparisons simplified across diverse elements by dividing the amount of each element measured in the rocks by the amount of the same element in a local soil.
Elemental Compositions of Yellowknife Bay Rocks
NASA Dawn spacecraft will be getting an up-close look at the dwarf planet Ceres starting in late March or the beginning of April 2015. This graphic shows the science-gathering orbits planned for the spacecraft.
Closing in on Ceres
This graphic compares the radiation dose equivalent for several types of experiences, including a calculation for a trip from Earth to Mars based on measurements made by the RAD instrument shielded inside NASA Mars Science Laboratory spacecraft.
Comparison of Some Radiation Exposures to Mars-Trip Level
This graphic shows results of the first analysis of Martian soil by the CheMin experiment on NASA Curiosity rover. The image reveals the presence of crystalline feldspar, pyroxenes and olivine mixed with some amorphous non-crystalline material.
First X-ray View of Martian Soil
This grouping of two test rovers and a flight spare provides a graphic comparison of three generations of Mars rovers developed at NASA Jet Propulsion Laboratory, Pasadena, Calif. The setting is JPL Mars Yard testing area.
Three Generations of Rovers in Mars Yard
ESIG-3000 Computer for VMS graphic creation with Chris Sweeney
ARC-1993-AC93-0590-1