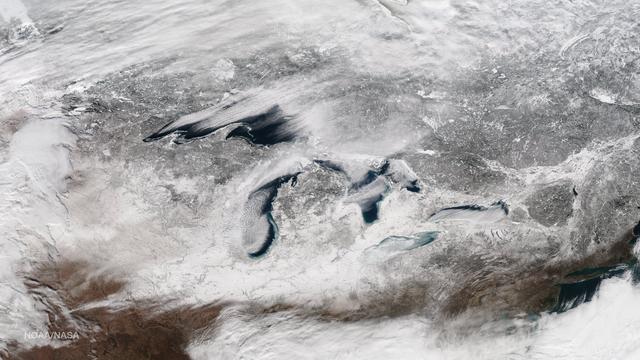
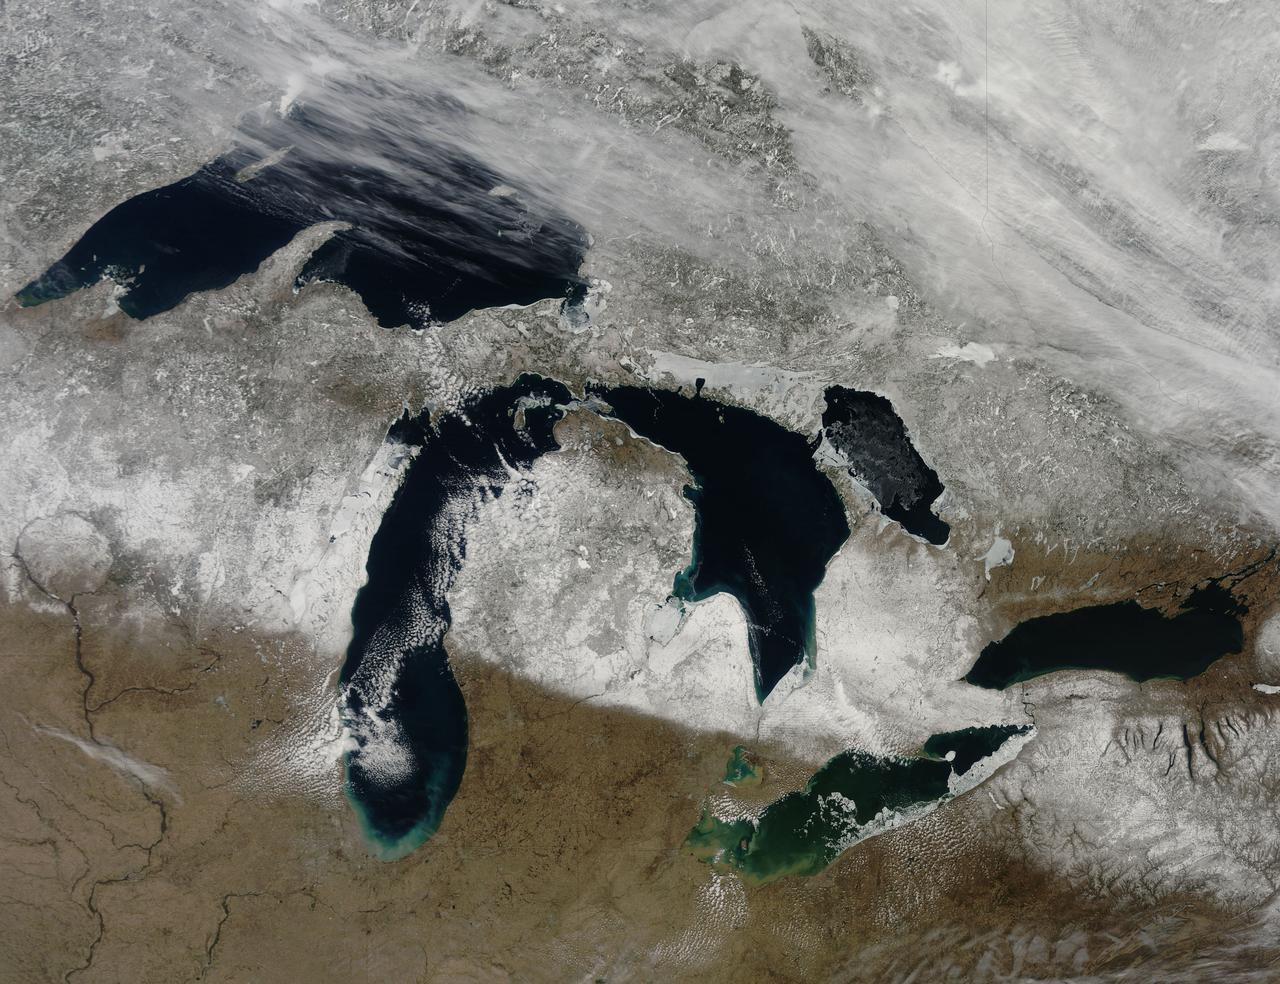
This image taken on January 13, 2015 from the Suomi NPP satellite's VIIRS instrument shows the Great Lakes and surrounding areas. The latest Great Lakes Surface Environmental Analysis (GLSEA) from the NOAA Great Lakes Environmental Research Laboratory shows total ice cover of 29.3% as of January 13th. Credit: NOAA/NASA/NPP Via <b><a href="www.nnvl.noaa.gov/" rel="nofollow"> NOAA Environmental Visualization Laboratory</a></b>
The Great Rift
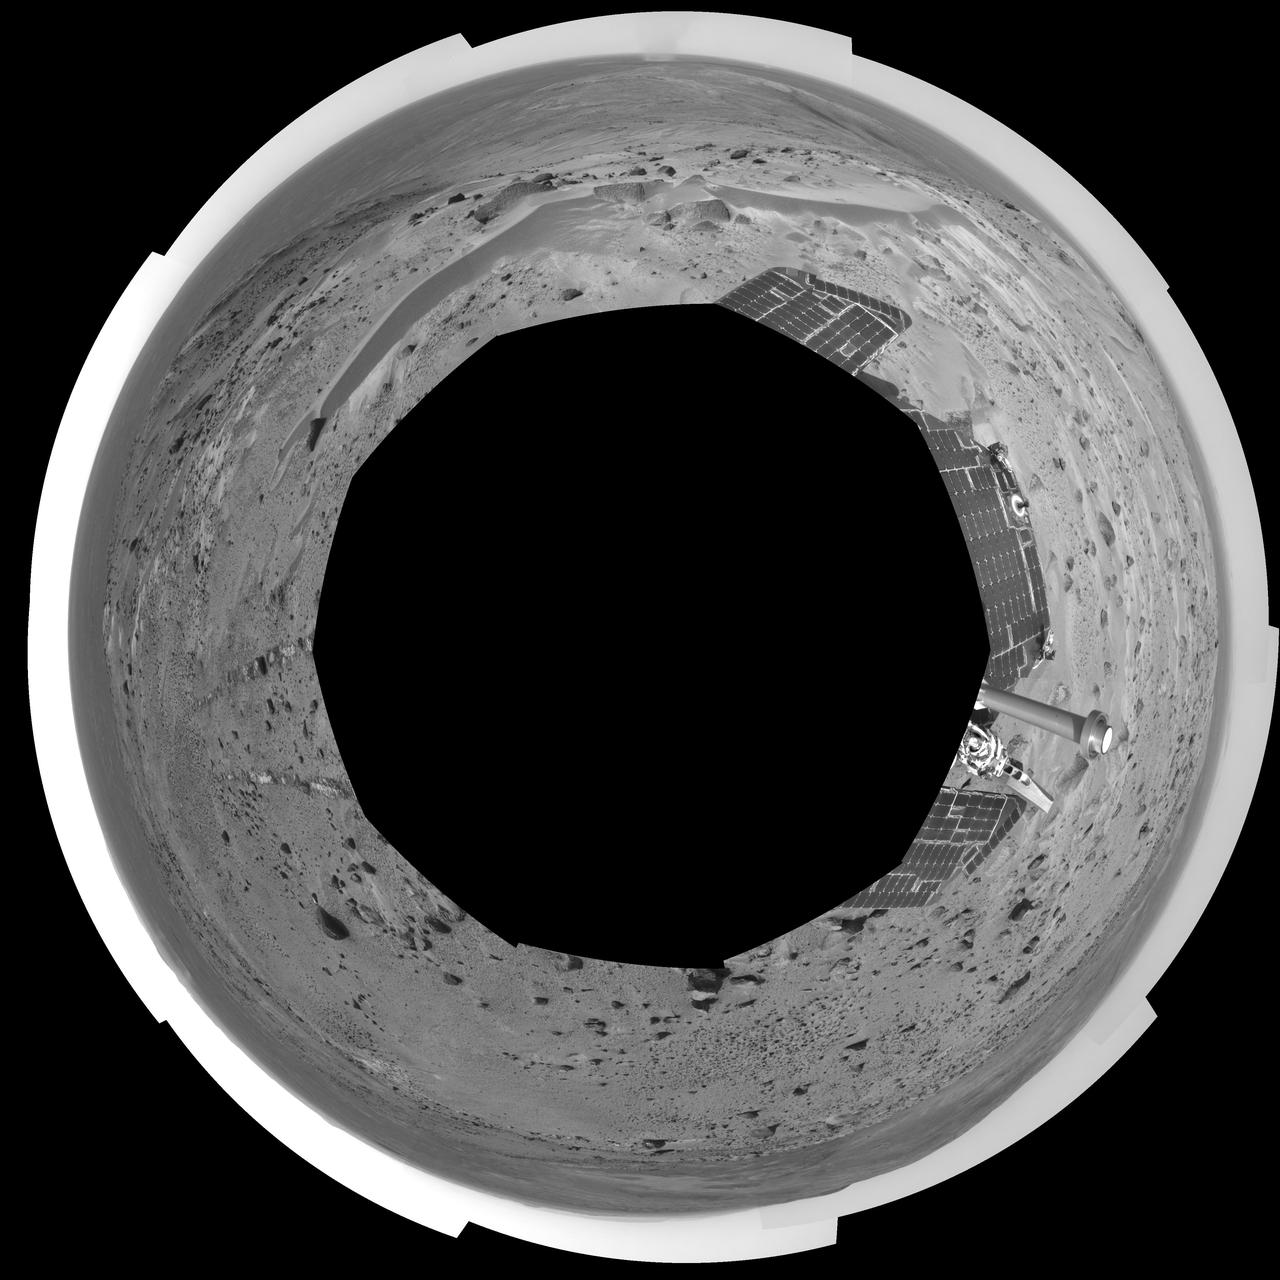
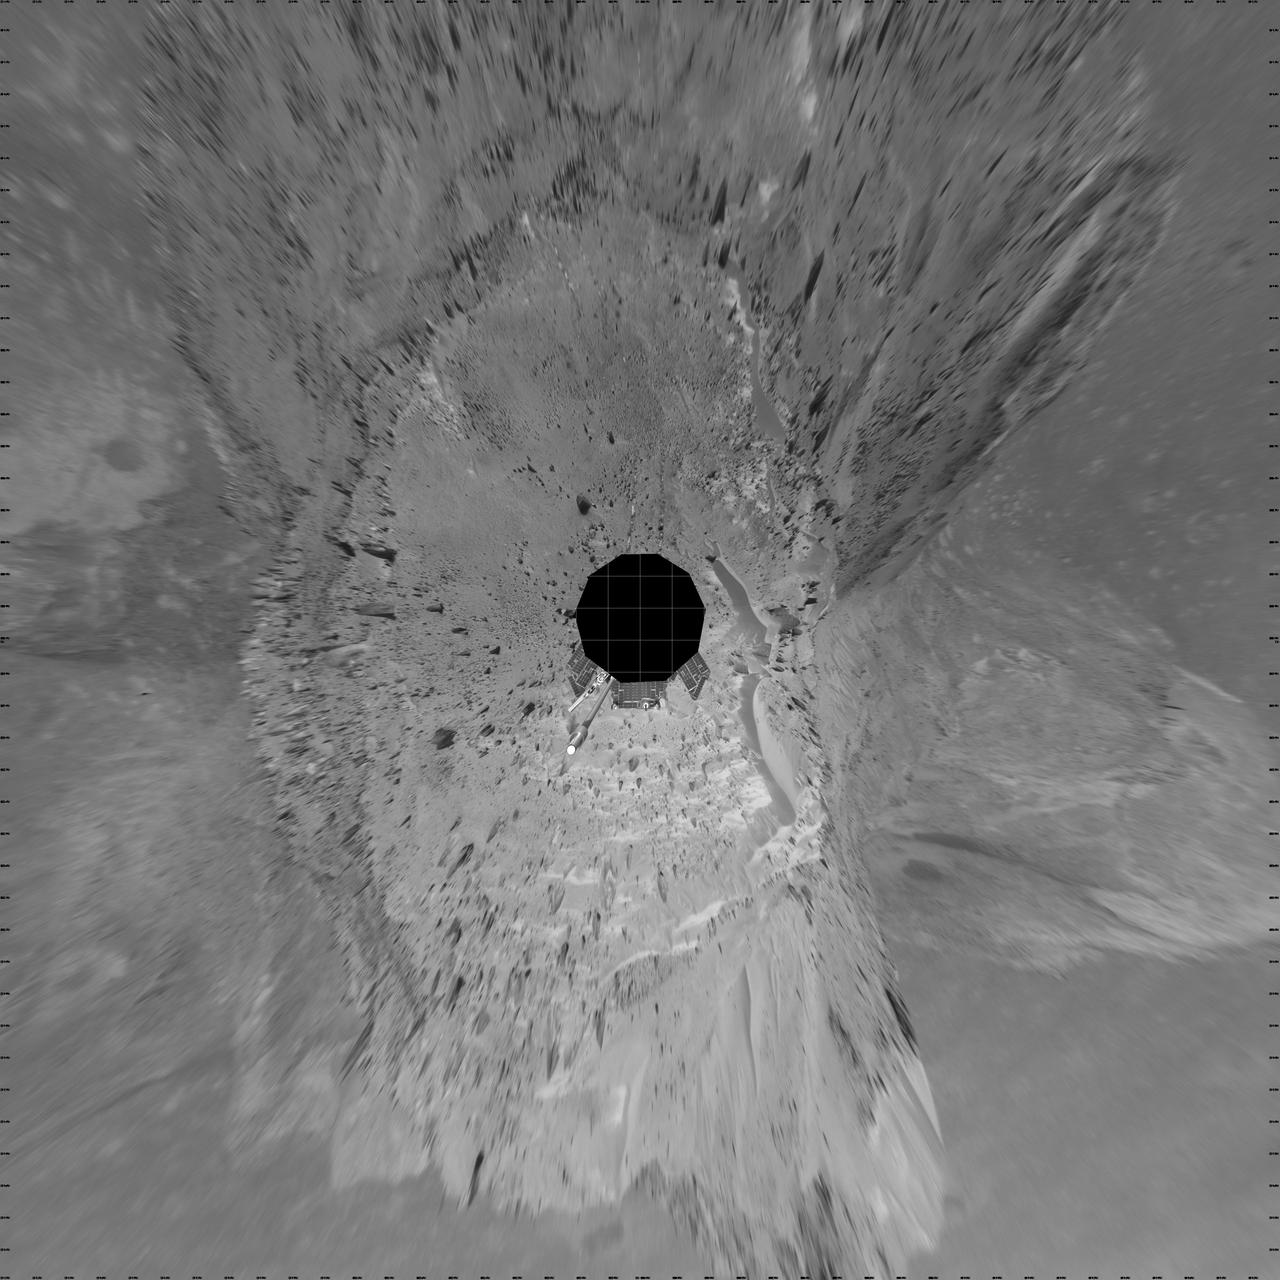
Such Great Heights
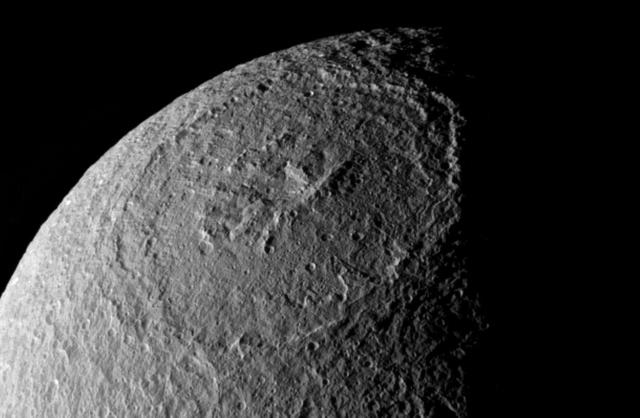
Odysseus the Great
The Great Basin

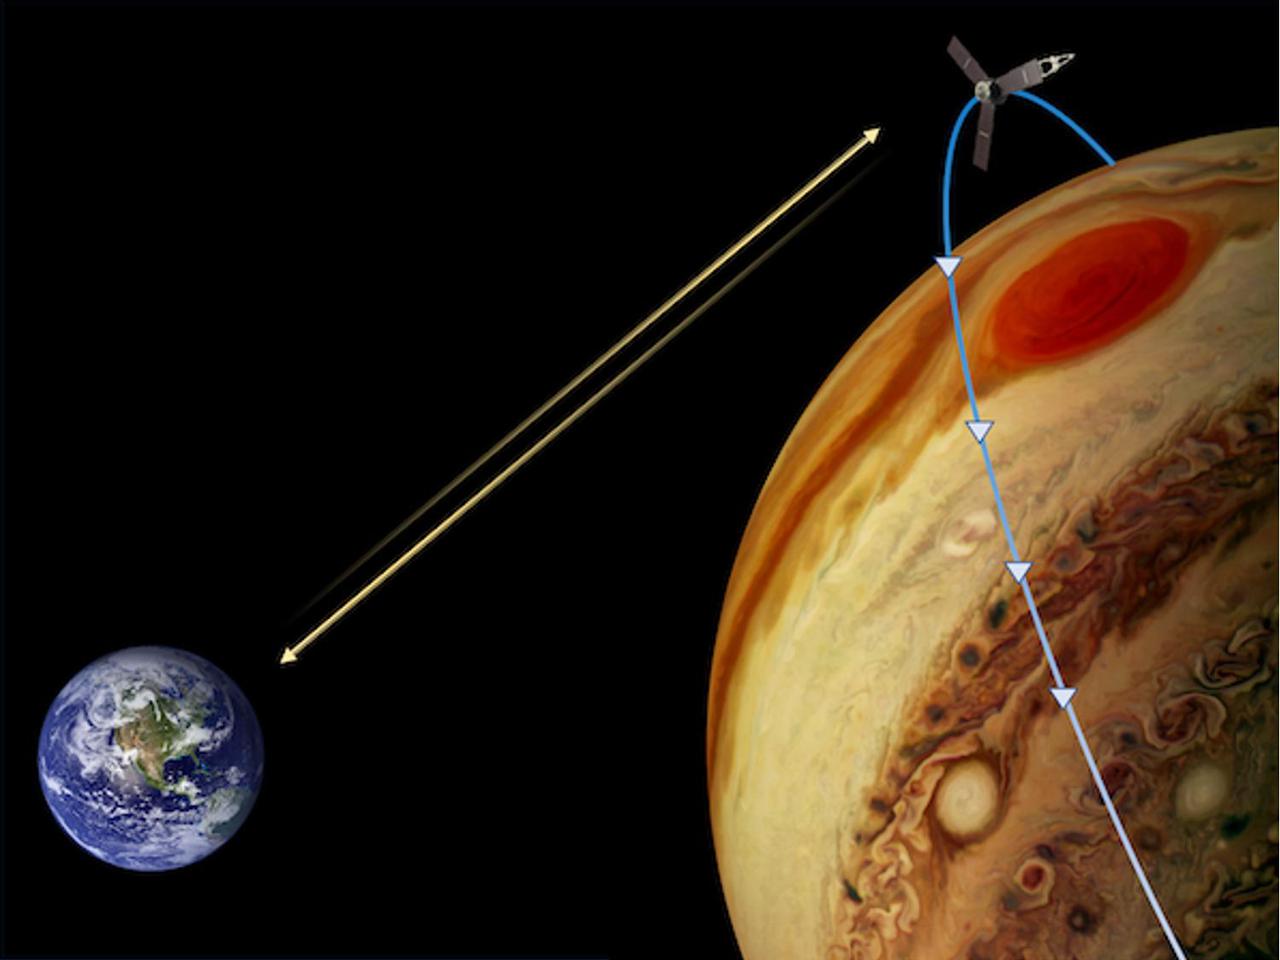
This illustration depicts NASA's Juno spacecraft in orbit above Jupiter's Great Red Spot. https://photojournal.jpl.nasa.gov/catalog/PIA21770
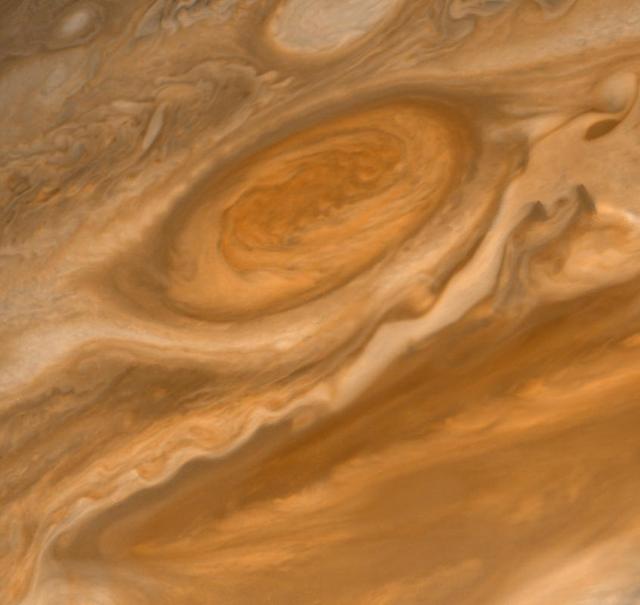
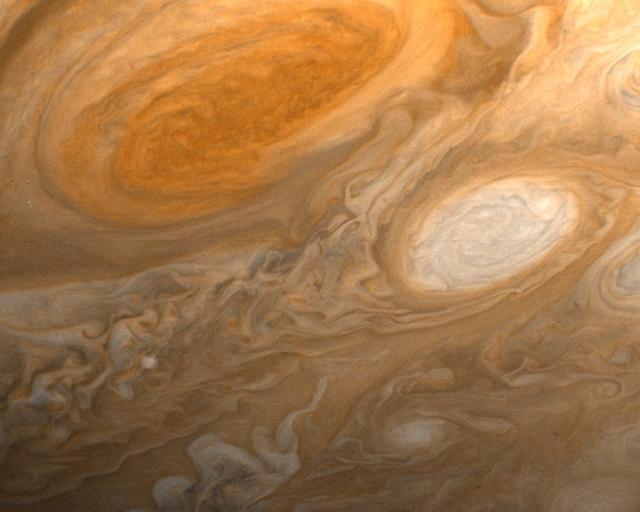
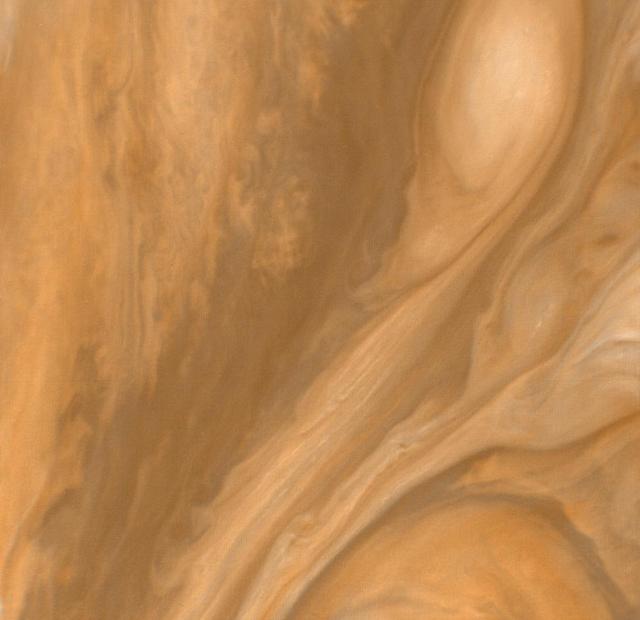
NASA Voyager 2 shows the Great Red Spot and the south equatorial belt extending into the equatorial region. At right is an interchange of material between the south equatorial belt and the equatorial zone. The clouds in the equatorial zone are more diffuse and do not display the structures seen in other locations. Considerable structure is evident within the Great Red Spot. http://photojournal.jpl.nasa.gov/catalog/PIA00456
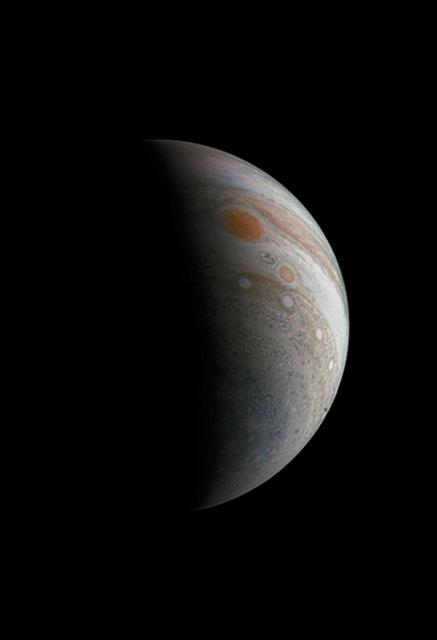
This image of a crescent Jupiter and the iconic Great Red Spot was created by a citizen scientist (Roman Tkachenko) using data from Juno's JunoCam instrument. You can also see a series of storms shaped like white ovals, known informally as the "string of pearls." Below the Great Red Spot a reddish long-lived storm known as Oval BA is visible. The image was taken on Dec. 11, 2016 at 2:30 p.m. PST (5:30 p.m. EST), as the Juno spacecraft performed its third close flyby of Jupiter. At the time the image was taken, the spacecraft was about 285,100 miles (458,800 kilometers) from the planet. http://photojournal.jpl.nasa.gov/catalog/PIA21376 . - Enhanced image by Roman Tkachenko (CC-BY) based on images provided courtesy of NASA/JPL-Caltech/SwRI/MSSS
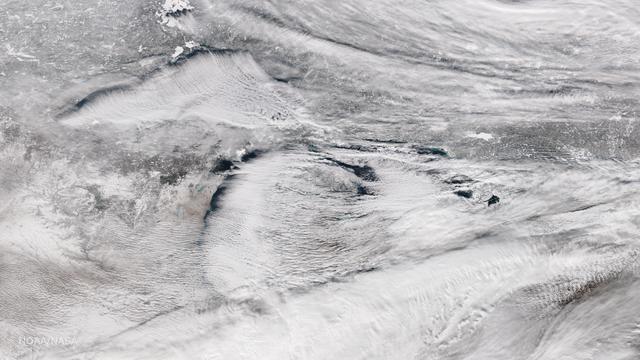
Bands of lake effect snow drift eastward from the western Great Lakes in this true-color image captured by the NOAA/NASA Suomi NPP satellite's Visible Infrared Imaging Radiometer Suite (VIIRS) instrument on January 5, 2017. National Weather Service forecasters expect light to moderate lake effect snow showers to continue throughout the day today and into Saturday (1/7). Lake-effect snow forms when cold air passes over the warmer waters of a lake. This causes some lake water to evaporate into the air and warm it. This warmer, wetter air rises and cools as it moves away from the lake. When it cools, it releases that moisture and, if it’s cold enough, that moisture turns into snow. Although true-color images like this may appear to be photographs of Earth, they aren't. They are created by combining data from the three color channels on the VIIRS instrument sensitive to the red, green and blue (or RGB) wavelengths of light into one composite image. In addition, data from several other channels are often also included to cancel out or correct atmospheric interference that may blur parts of the image. Credit: NOAA/NASA/Suomi NPP via NOAA's Environmental Visualization Laboratory
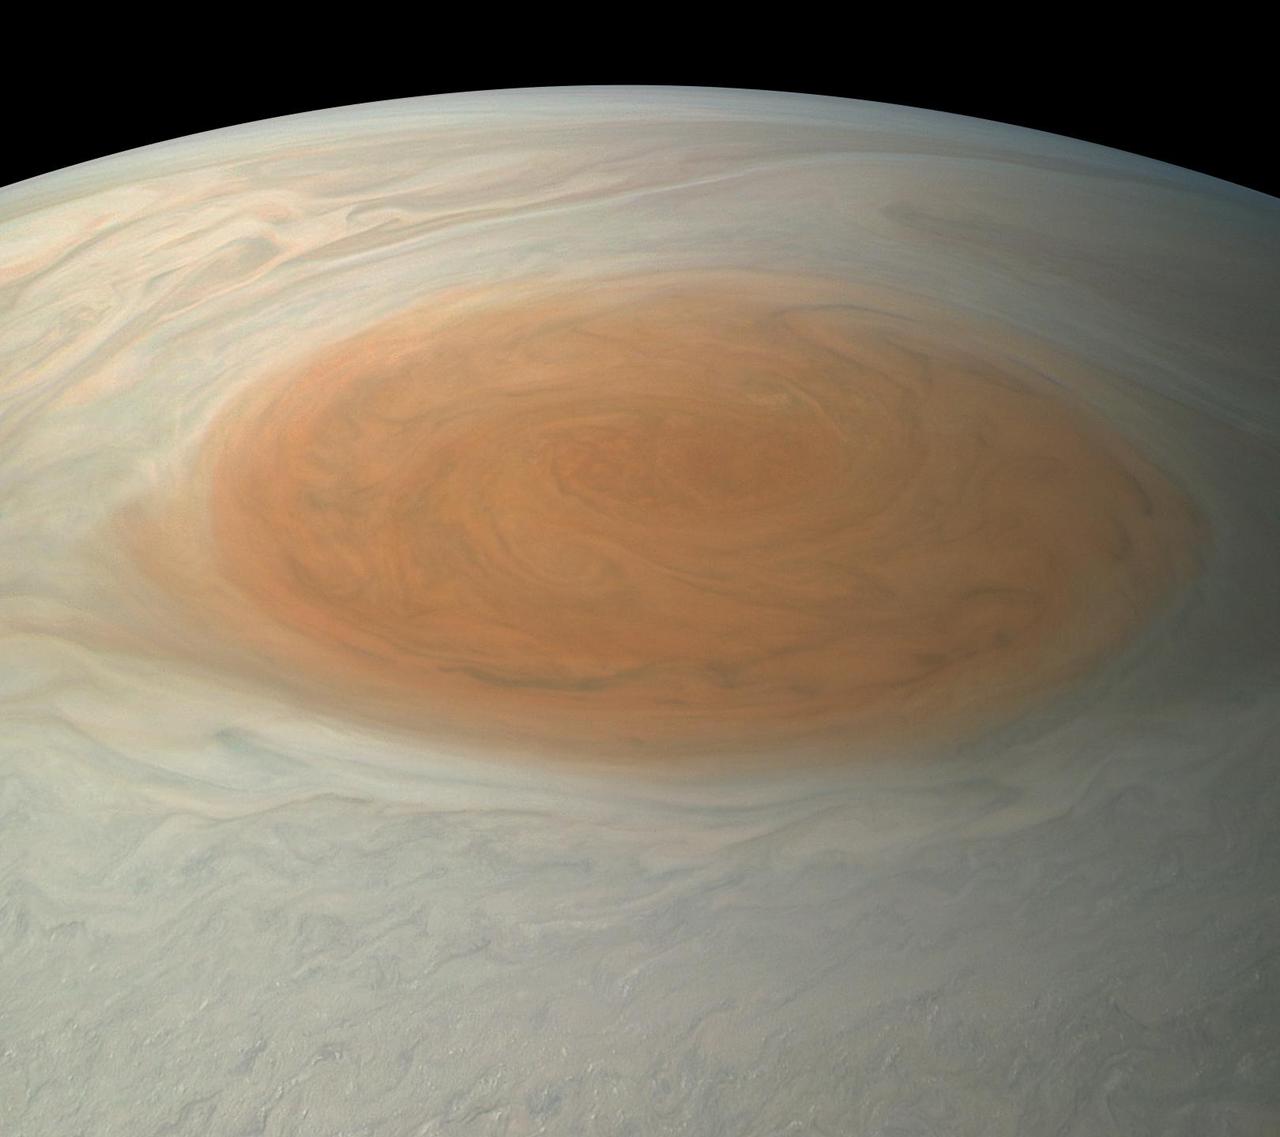
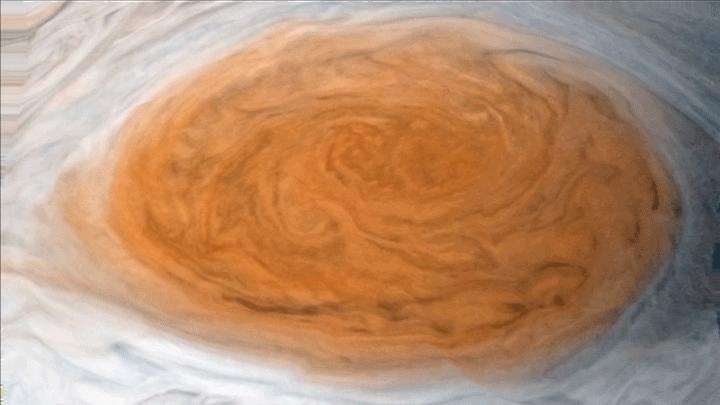
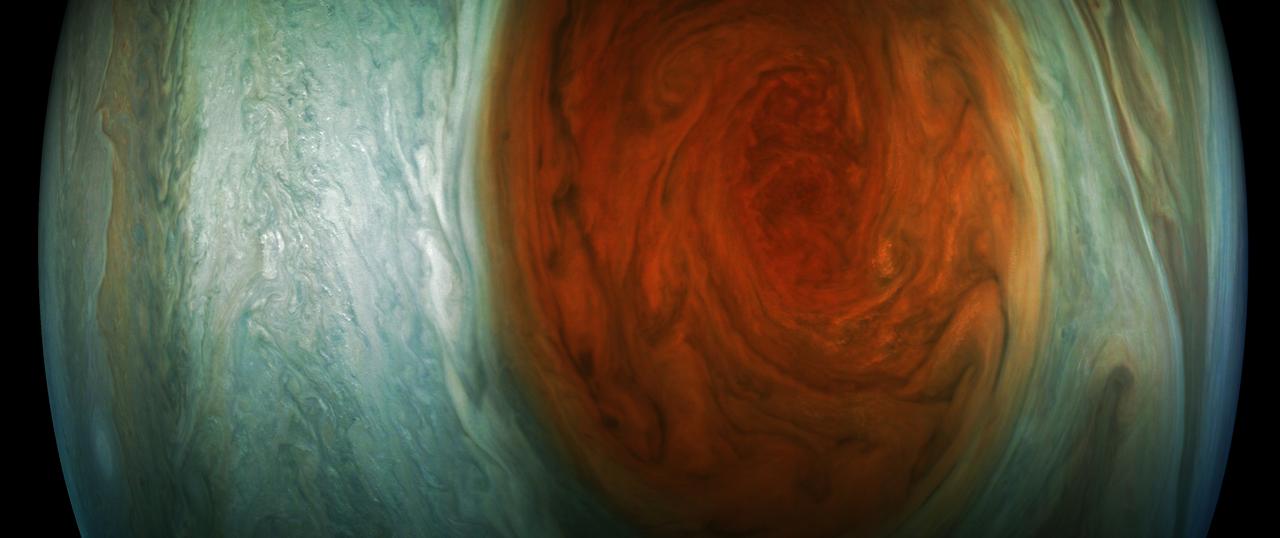
This image of Jupiter's iconic Great Red Spot (GRS) was created by citizen scientist Björn Jónsson using data from the JunoCam imager on NASA's Juno spacecraft. This true-color image offers a natural color rendition of what the Great Red Spot and surrounding areas would look like to human eyes from Juno's position. The tumultuous atmospheric zones in and around the Great Red Spot are clearly visible. The image was taken on July 10, 2017 at 07:10 p.m. PDT (10:10 p.m. EDT), as the Juno spacecraft performed its seventh close flyby of Jupiter. At the time the image was taken, the spacecraft was about 8,648 miles (13,917 kilometers) from the tops of the clouds of the planet at a latitude of -32.6 degrees. https://photojournal.jpl.nasa.gov/catalog/PIA21775. - Enhanced image by Björn Jónsson (CC-NC-SA) based on images provided courtesy of NASA/JPL-Caltech/SwRI/MSSS

Jupiter Great Red Spot
Tethys Great Rift
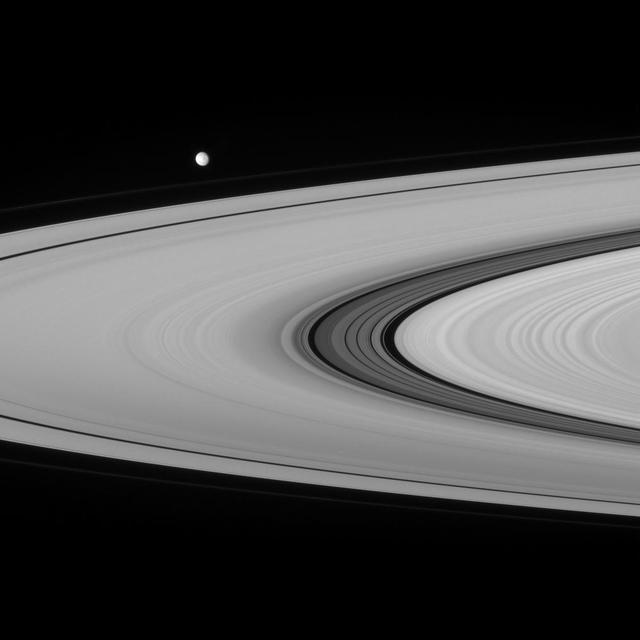
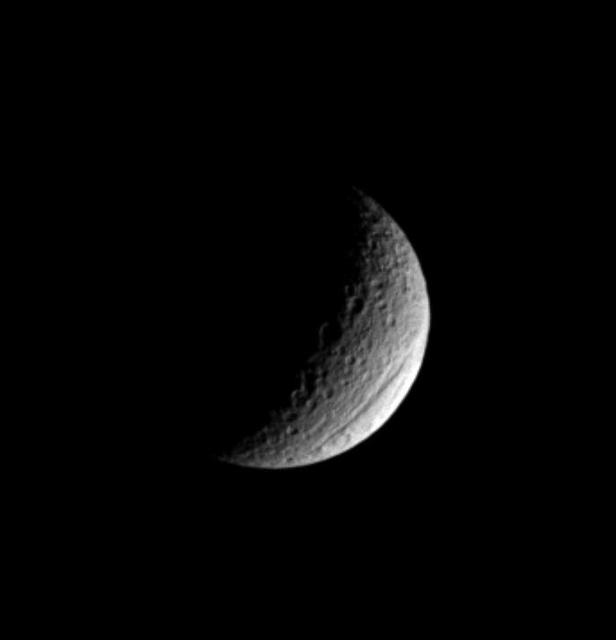
Mimas and the Great Division
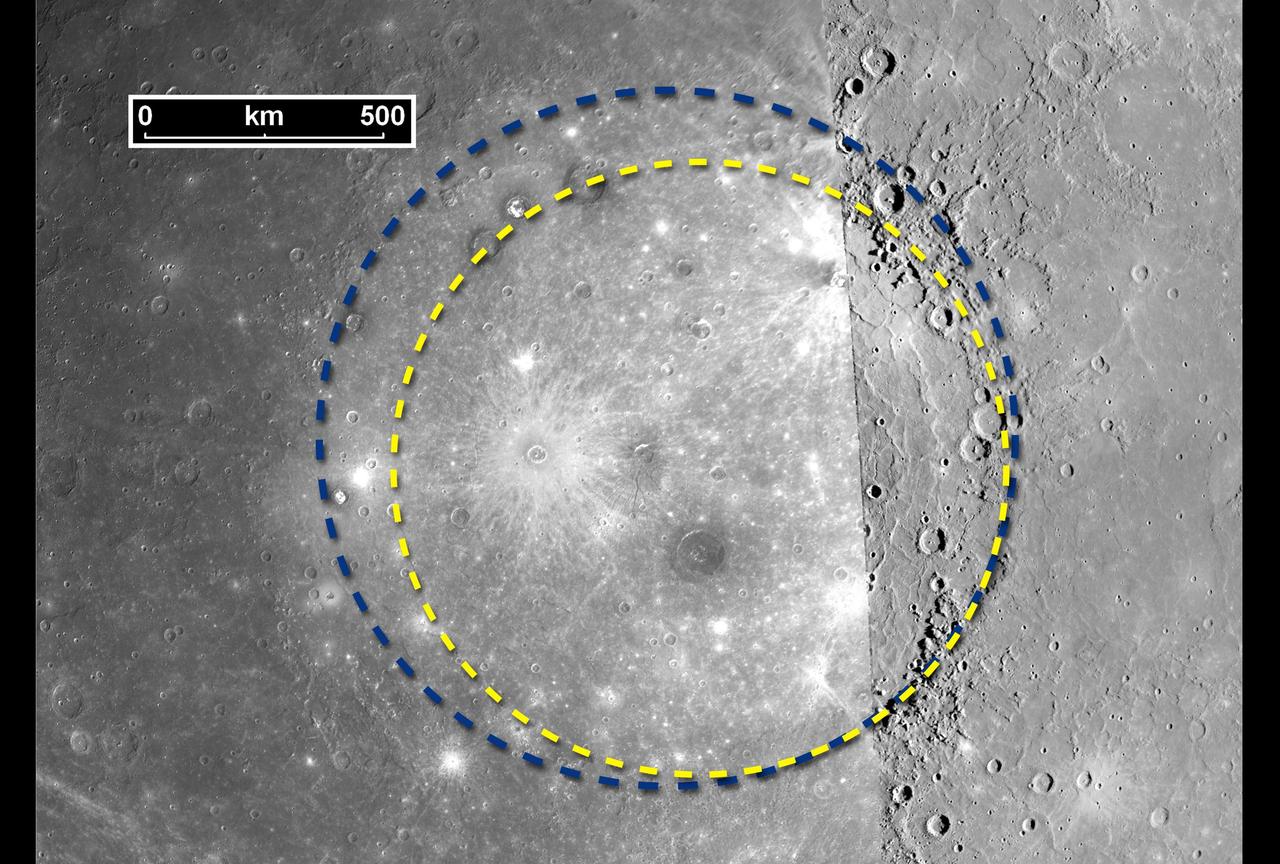
The Great Caloris Basin on Mercury
A Great Place to Watch the Weather

This frame from an animation takes the viewer on a simulated flight into, and then out of, Jupiter's upper atmosphere at the location of the Great Red Spot. The perspective begins about 2,000 miles (3,000 kilometers) above the cloud tops of the planet's southern hemisphere. The bar at far left indicates altitude during the quick descent; a second gauge next to that depicts the dramatic increase in temperature that occurs as the perspective dives deeper down. The clouds turn crimson as the perspective passes through the Great Red Spot. Finally, the view ascends out of the spot. This video was created by combining an image from the JunoCam imager on NASA's Juno spacecraft with a computer-generated animation. The animation is available at https://photojournal.jpl.nasa.gov/catalog/PIA22176. - Enhanced image by Gerald Eichstädt / Justin Cowart based on images provided courtesy of NASA/JPL-Caltech/SwRI/MSSS
Winds around Jupiter's Great Red Spot are simulated in this JunoCam view that has been animated using a model of the winds there. The wind model, called a velocity field, was derived from data collected by NASA's Voyager spacecraft and Earth-based telescopes. NASA's Juno spacecraft acquired the original, static view during passage over the spot on July 10, 2017. Citizen scientists Gerald Eichstädt and Justin Cowart turned the JunoCam data into a color image mosaic. Juno scientists Shawn Ewald and Andrew Ingersoll applied the velocity data to the image to produce a looping animation. An animation is available at https://photojournal.jpl.nasa.gov/catalog/PIA22178
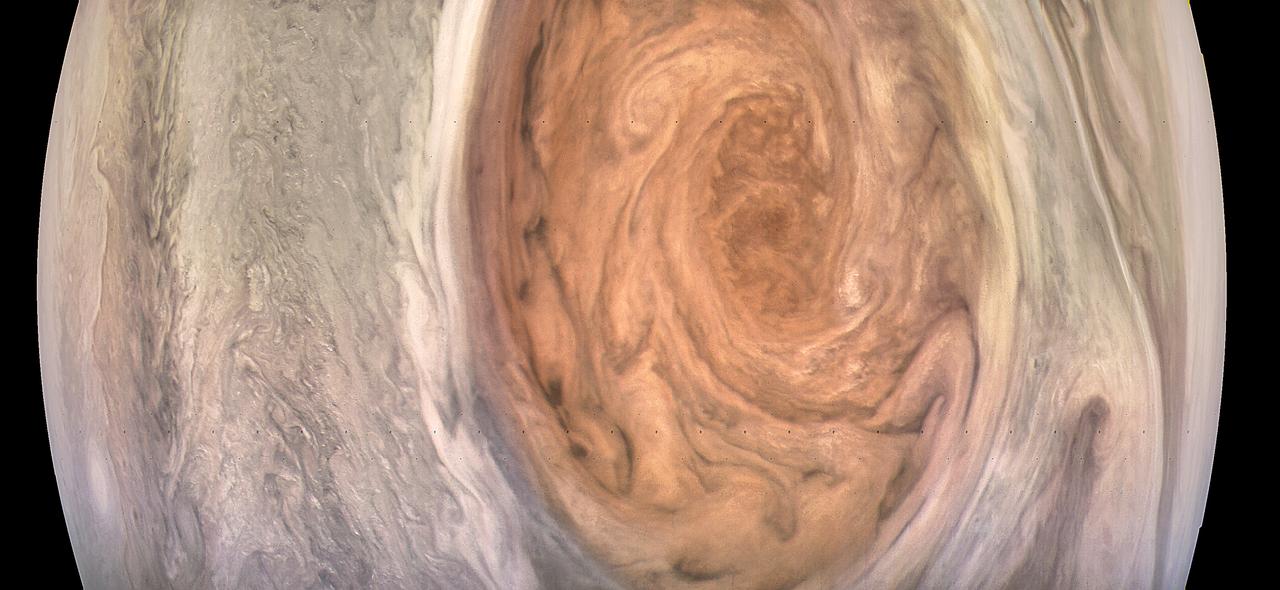
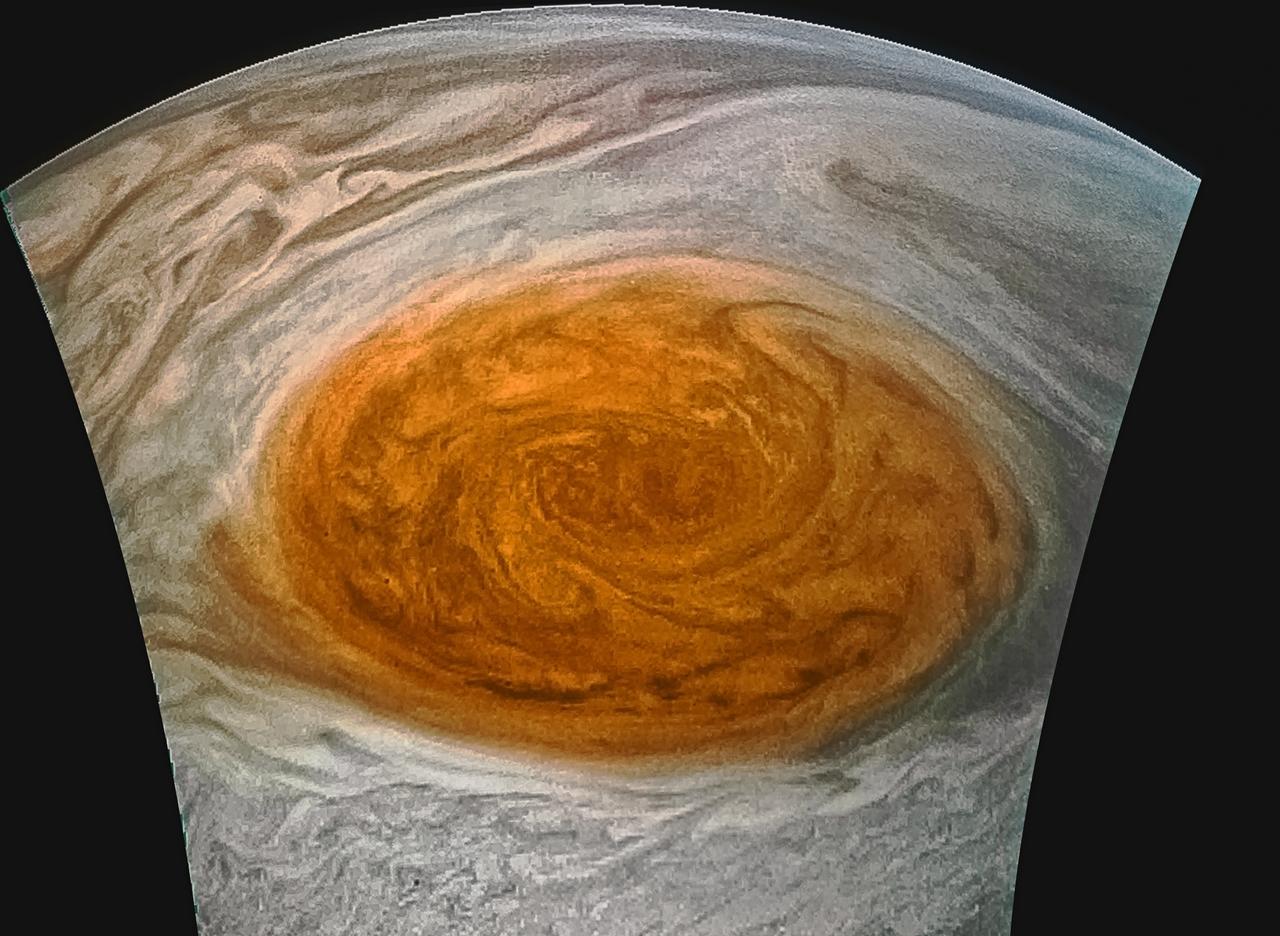
This enhanced-color image of Jupiter's Great Red Spot was created by citizen scientist Kevin Gill using data from the JunoCam imager on NASA's Juno spacecraft. The image was taken on July 10, 2017 at 07:07 p.m. PDT (10:07 p.m. EDT), as the Juno spacecraft performed its 7th close flyby of Jupiter. At the time the image was taken, the spacecraft was about 6,130 miles (9,866 kilometers) from the tops of the clouds of the planet. https://photojournal.jpl.nasa.gov/catalog/PIA21395 . - Enhanced image by Kevin M. Gill (CC-BY) based on images provided courtesy of NASA/JPL-Caltech/SwRI/MSSS
This image of Jupiter's iconic Great Red Spot and surrounding turbulent zones was captured by NASA's Juno spacecraft. The color-enhanced image is a combination of three separate images taken on April 1 between 3:09 a.m. PDT (6:09 a.m. EDT) and 3:24 a.m. PDT (6:24 a.m. EDT), as Juno performed its 12th close flyby of Jupiter. At the time the images were taken, the spacecraft was 15,379 miles (24,749 kilometers) to 30,633 miles (49,299 kilometers) from the tops of the clouds of the planet at a southern latitude spanning 43.2 to 62.1 degrees. Citizen scientists Gerald Eichstädt and Seán Doran processed this image using data from the JunoCam imager. https://photojournal.jpl.nasa.gov/catalog/PIA21985
NASA image captured March 28, 2011 The Great Lakes Satellite: Terra <b><a href="http://www.nasa.gov/centers/goddard/home/index.html" rel="nofollow">NASA Goddard Space Flight Center</a></b> enables NASA’s mission through four scientific endeavors: Earth Science, Heliophysics, Solar System Exploration, and Astrophysics. Goddard plays a leading role in NASA’s accomplishments by contributing compelling scientific knowledge to advance the Agency’s mission. <b>Follow us on <a href="http://twitter.com/NASA_GoddardPix" rel="nofollow">Twitter</a></b> <b>Join us on <a href="http://www.facebook.com/pages/Greenbelt-MD/NASA-Goddard/395013845897?ref=tsd" rel="nofollow">Facebook</a></b>

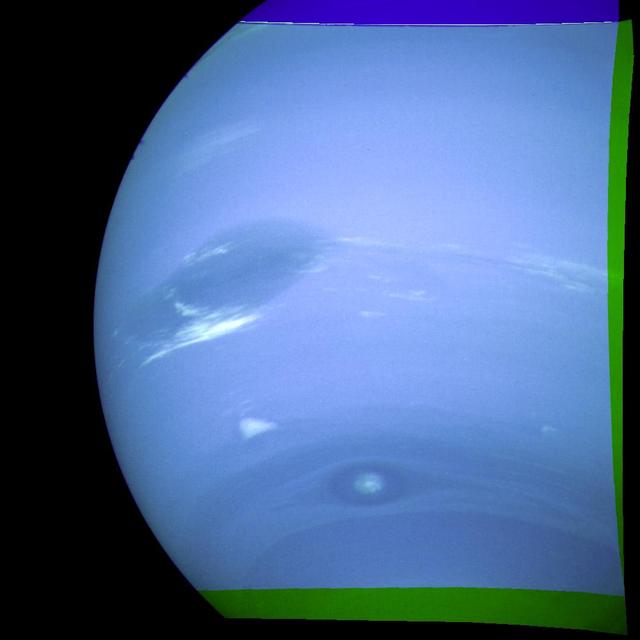
This photograph shows the last face on view of the Great Dark Spot that Voyager will make with the narrow angle camera. The image was shuttered 45 hours before closest approach at a distance of 2.8 million kilometers (1.7 million miles). The smallest structures that can be seen are of an order of 50 kilometers (31 miles). The image shows feathery white clouds that overlie the boundary of the dark and light blue regions. The pinwheel (spiral) structure of both the dark boundary and the white cirrus suggest a storm system rotating counterclockwise. Periodic small scale patterns in the white cloud, possibly waves, are short lived and do not persist from one Neptunian rotation to the next. This color composite was made from the clear and green filters of the narrow-angle camera. http://photojournal.jpl.nasa.gov/catalog/PIA00052
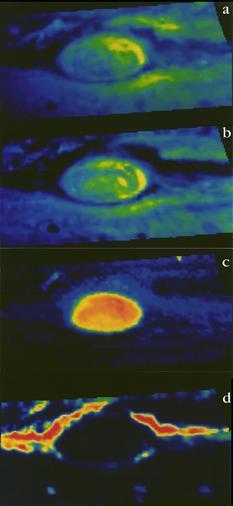
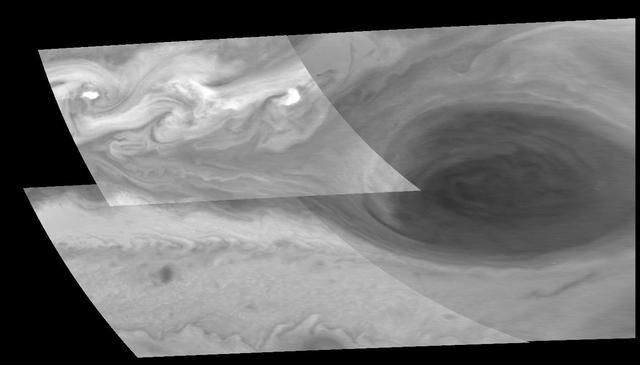
The Near-Infrared Mapping Spectrometer (NIMS) instrument looks at Jupiter's Great Red Spot, in these views from June 26, 1996. NIMS studies infrared wavelengths of light that our eye cannot see. These maps are at four different infrared wavelengths, each one picked to reveal something different about the atmosphere. The top image is a false color map of a wavelength that is at the red edge of our ability to see. It shows the shapes of features that we would see with our eyes. The second map is of ammonia ice, red showing where the most ice is, blue where none exists. The differences between this and the first image are due to the amount and size of ammonia ice crystals. The third map down is from a wavelength that shows cloud heights, with the highest clouds in red, and the lowest in blue. The bottom map uses a wavelength that shows the hot Jupiter shining through the clouds. Red represents the thinnest clouds, and blue is thickest where it is more difficult to see below. Comparing the bottom two images, note that the highest clouds are in the center of the Great Red Spot, while there are relatively few clouds around the edges. http://photojournal.jpl.nasa.gov/catalog/PIA00501
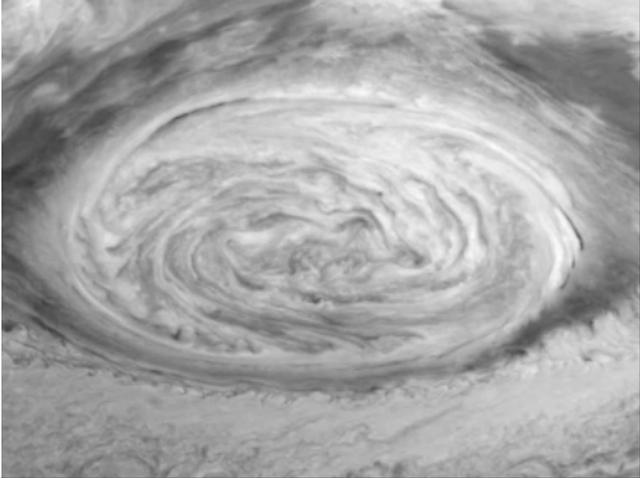
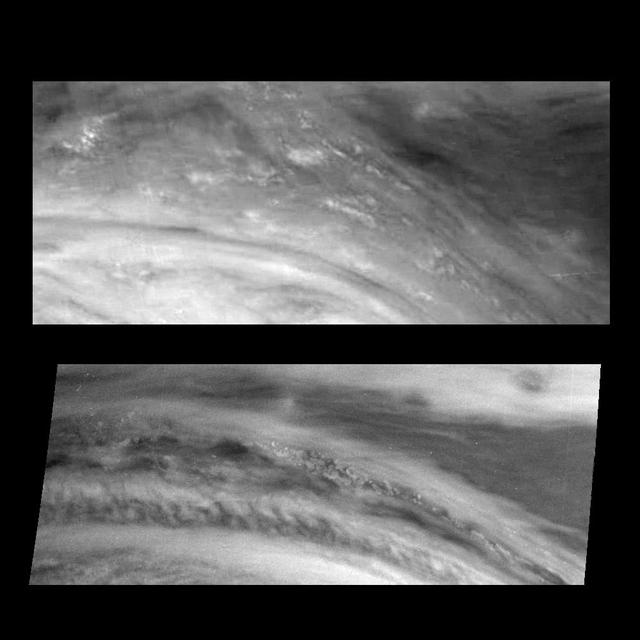
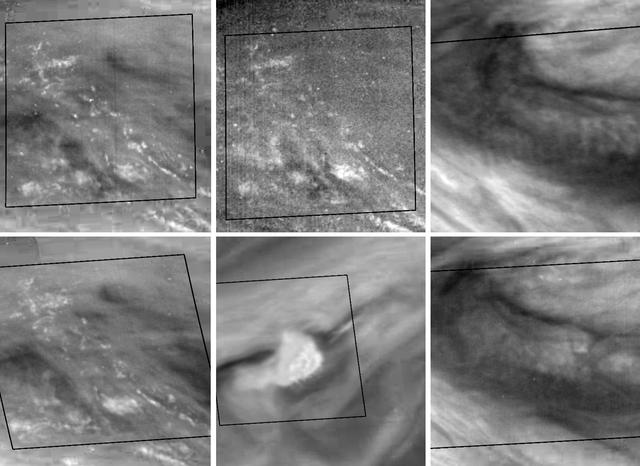
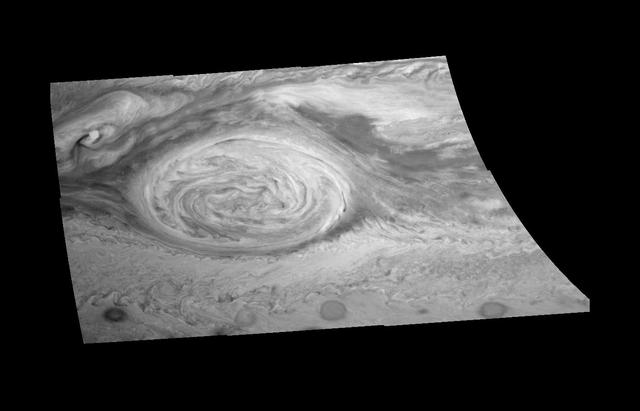
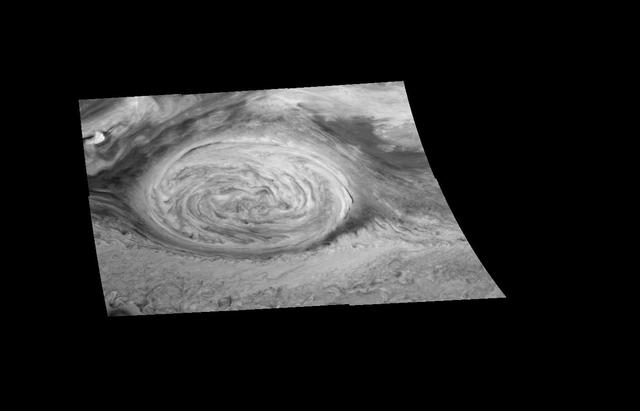
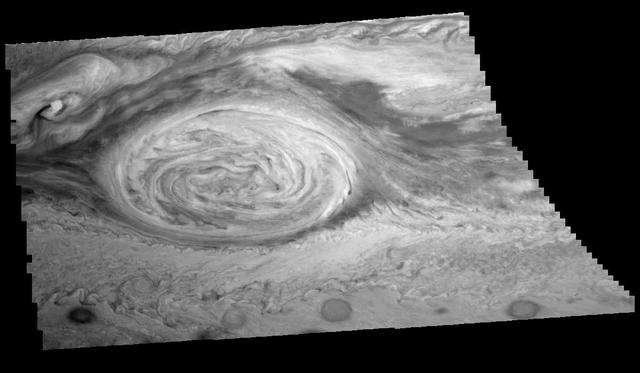
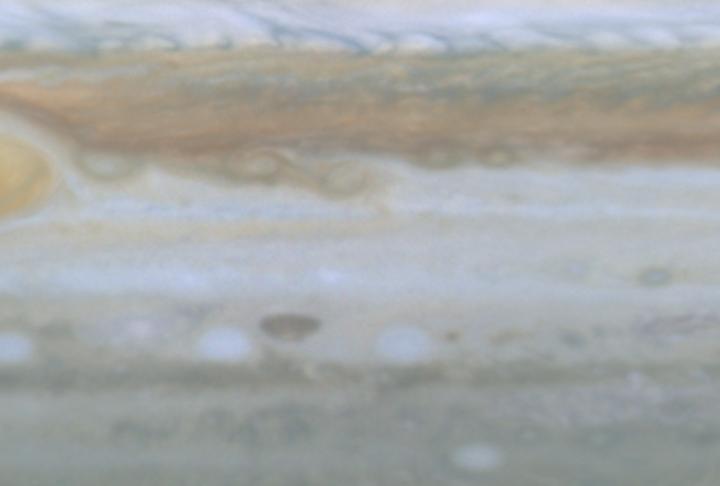
Dynamics of Jupiter's Great Red Spot in the NIR filter (756 nm) of the Galileo imaging system. Each of the three frames is a mosaic of six images that have been map-projected to a uniform grid of latitude and longitude. North is at the top. There is a nine-hour separation between the first two frames and seventy minutes between the next two. All of the images were taken on June 26, 1996. The Red Spot is 20,000 km long and has been followed by observers on Earth since the telescope was invented 300 years ago. It is a huge storm made visible by variations in the composition of the cloud particles and the amount of cloud cover. Winds in the outer part of the Red Spot reach 250 mph while the center remains quiescent. These Galileo data will help scientists understand what drives this storm and why it persists for so many years. http://photojournal.jpl.nasa.gov/catalog/PIA01083

Jupiter - Southeast of Great Red Spot
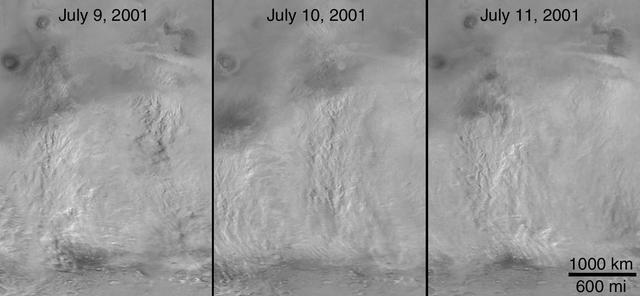
The 2001 Great Dust Storms - Tharsis
A Great Place to Watch the Weather polar
A Great Place to Watch the Weather vertical
This enhanced-color image of Jupiter's Great Red Spot was created by citizen scientist Gerald Eichstädt using data from the JunoCam imager on NASA's Juno spacecraft. The image was taken on July 10, 2017 at 07:10 p.m. PDT (10:10 p.m. EDT), as the Juno spacecraft performed its 7th close flyby of Jupiter. At the time the image was taken, the spacecraft was about 8,648 miles (13,917 kilometers) from the tops of the clouds of the planet. https://photojournal.jpl.nasa.gov/catalog/PIA21772. - Enhanced image by Gerald Eichstädt based on images provided courtesy of NASA/JPL-Caltech/SwRI/MSSS
This enhanced-color image of Jupiter's Great Red Spot was created by citizen scientist Jason Major using data from the JunoCam imager on NASA's Juno spacecraft. The image was taken on July 10, 2017 at 07:10 p.m. PDT (10:10 p.m. EDT), as the Juno spacecraft performed its 7th close flyby of Jupiter. At the time the image was taken, the spacecraft was about 8,648 miles (13,917 kilometers) from the tops of the clouds of the planet. https://photojournal.jpl.nasa.gov/catalog/PIA21772 . - Enhanced image by Jason Major based on images provided courtesy of NASA/JPL-Caltech/SwRI/MSSS
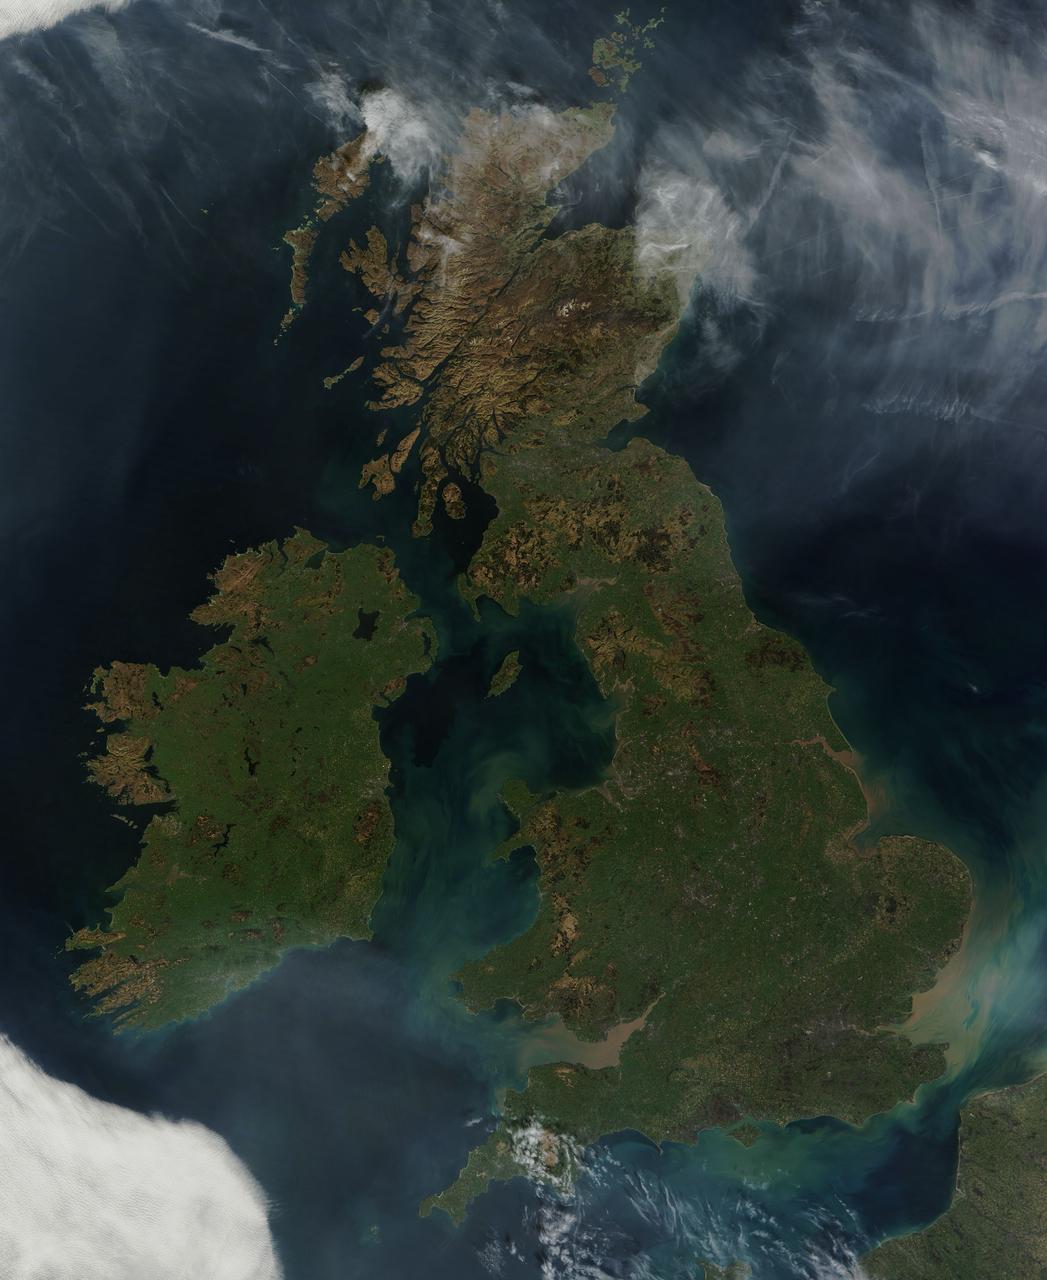
NASA image acquired March 26, 2012 This nearly cloud-free view of Great Britain and Ireland was acquired by the Moderate Resolution Imaging Spectroradiometer (MODIS) aboard NASA’s Terra satellite on March 26, 2012. Just a few days into spring, most of the land appears green, although not quite as brilliant as the summertime hues that give Ireland the nickname “the Emerald Island”. The islands of Ireland (west) and Great Britain (east) are separated by the Irish Sea, which is filled with the turquoise, green and tan swirls typical of sediment, although blooming algae could also contribute some color to the waters. To the southeast, the English Channel separates the island of Great Britain from France (south) and Belgium (north). London can be seen as a gray circle situated inland on the tan-colored River Thames. The sediment from the Thames flows into the English Channel due east of London. The United Kingdom is made up of Wales, Scotland and England, all located primarily on the island of Great Britain, and of Northern Ireland, which comprises the northern section of the island of Ireland. Dublin, in the Republic of Ireland, can be seen as a gray smudge on the eastern coast of the island. Almost due west Galway can be seen as a linear gray streak on the northern coast of Galway Bay, with the blue waters of Loch Corrib to the north. Most of the United Kingdom and Ireland are part of the Celtic broadleaf forest ecoregion, where acid-loving oak and mixed oak forests abound, along with fen and swamp forests and ombrotrophic mires. A portion of the Scottish Highlands, in the north of Great Britain, are covered by the Caledon conifer forest ecoregion. The Caledonia conifers once covered a large area of Scotland, but now only about 1% of the original forest survives, mostly high in the cooler areas of the Highlands. NASA/GSFC/Jeff Schmaltz/MODIS Land Rapid Response Team <b><a href="http://www.nasa.gov/audience/formedia/features/MP_Photo_Guidelines.html" rel="nofollow">NASA image use policy.</a></b> <b><a href="http://www.nasa.gov/centers/goddard/home/index.html" rel="nofollow">NASA Goddard Space Flight Center</a></b> enables NASA’s mission through four scientific endeavors: Earth Science, Heliophysics, Solar System Exploration, and Astrophysics. Goddard plays a leading role in NASA’s accomplishments by contributing compelling scientific knowledge to advance the Agency’s mission. <b>Follow us on <a href="http://twitter.com/NASA_GoddardPix" rel="nofollow">Twitter</a></b> <b>Like us on <a href="http://www.facebook.com/pages/Greenbelt-MD/NASA-Goddard/395013845897?ref=tsd" rel="nofollow">Facebook</a></b> <b>Find us on <a href="http://instagrid.me/nasagoddard/?vm=grid" rel="nofollow">Instagram</a></b>
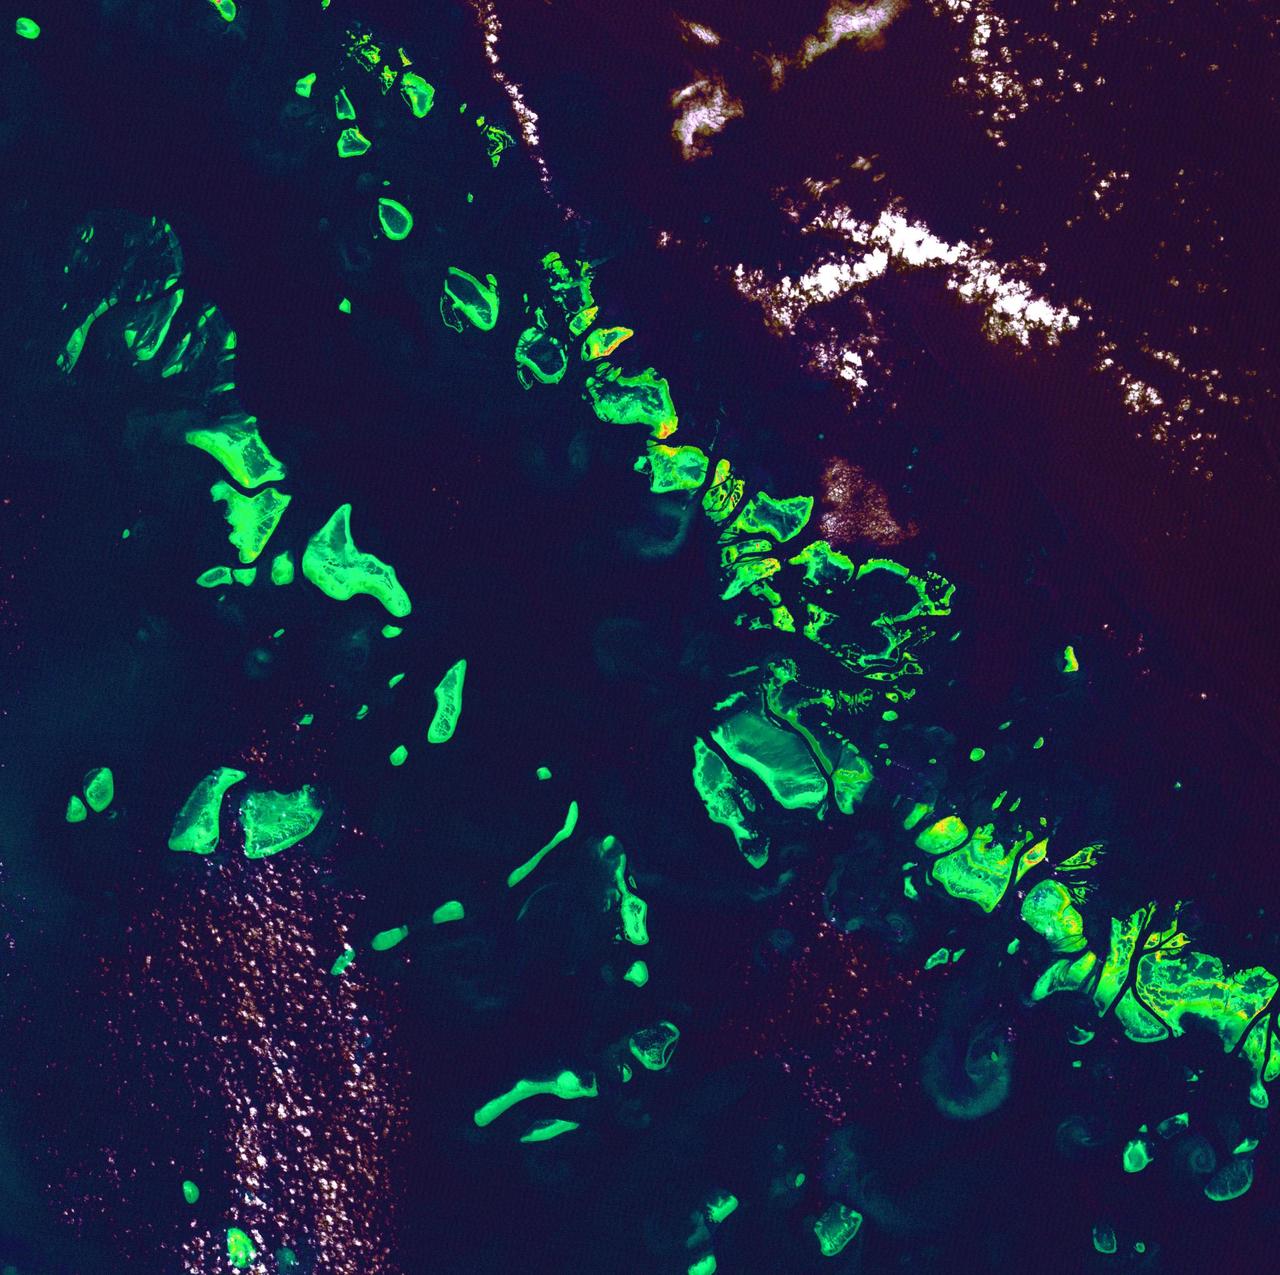
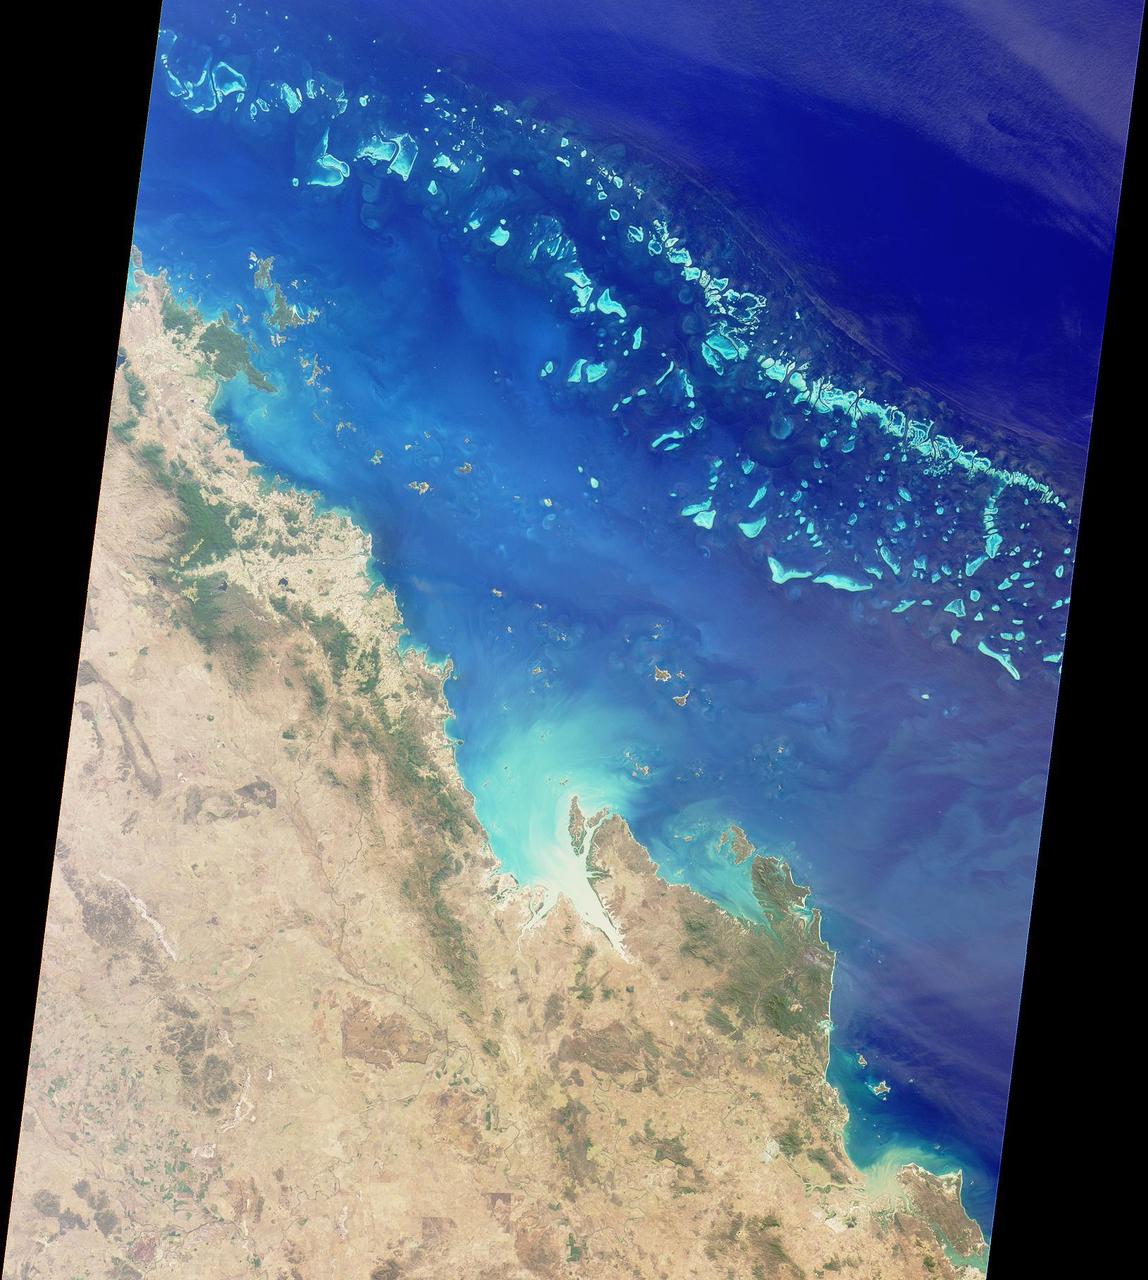
Great Barrier Reef - August 8th, 1999 Description: What might be mistaken for dinosaur bones being unearthed at a paleontological dig are some of the individual reefs that make up the Great Barrier Reef, the world's largest tropical coral reef system. The reef stretches more than 2,000 kilometers (1,240 miles) along the coast of Queensland, Australia. It supports astoundingly complex and diverse communities of marine life and is the largest structure on the planet built by living organisms. Credit: USGS/NASA/Landsat 7 To learn more about the Landsat satellite go to: <a href="http://landsat.gsfc.nasa.gov/" rel="nofollow">landsat.gsfc.nasa.gov/</a> <b><a href="http://www.nasa.gov/centers/goddard/home/index.html" rel="nofollow">NASA Goddard Space Flight Center</a></b> enables NASA’s mission through four scientific endeavors: Earth Science, Heliophysics, Solar System Exploration, and Astrophysics. Goddard plays a leading role in NASA’s accomplishments by contributing compelling scientific knowledge to advance the Agency’s mission. <b>Follow us on <a href="http://twitter.com/NASA_GoddardPix" rel="nofollow">Twitter</a></b> <b>Join us on <a href="http://www.facebook.com/pages/Greenbelt-MD/NASA-Goddard/395013845897?ref=tsd" rel="nofollow">Facebook</a></b>

This false-color image of Jupiter was taken on May 18, 2017, with a mid-infrared filter centered at a wavelength of 8.8 microns, at the Subaru Telescope in Hawaii, in collaboration with observations of Jupiter by NASA's Juno mission. The selected wavelength is sensitive to Jupiter's tropospheric temperatures and the thickness of a cloud near the condensation level of ammonia gas. The Great Red Spot appears distinctively at the lower center of the planet as a cold region with a thick cloud layer. It is surrounded by a warm and relatively clear periphery. To its northwest is a turbulent and chaotic region where bands of gas that is warm and dry alternate with bands of gas that is cold and moist. This image, taken a few hours before Juno's sixth close approach to Jupiter, shows the detailed atmospheric structure of the Great Red Spot and its surroundings that the Juno mission will encounter on its seventh closest approach to Jupiter on July 10, 2017, Pacific Time (July 11, Universal Time). The instrument used to take this image is Cooled Mid-Infrared Camera and Spectrometer (COMICS) of the National Astronomical Observatory of Japan's Subaru Telescope on Hawaii's Maunakea peak. https://photojournal.jpl.nasa.gov/catalog/PIA21714

Guests interact with the VIPER exhibit at the Total Solar Eclipse Fest at the Great Lakes Science Center in Cleveland, OH on April 6, 2024. A total solar eclipse swept across a narrow portion of the North American continent from Mexico’s Pacific coast to the Atlantic coast of Newfoundland, Canada. A partial solar eclipse was visible across the entire North American continent along with parts of Central America and Europe. Photo Credit: (NASA/Sara Lowthian-Hanna)
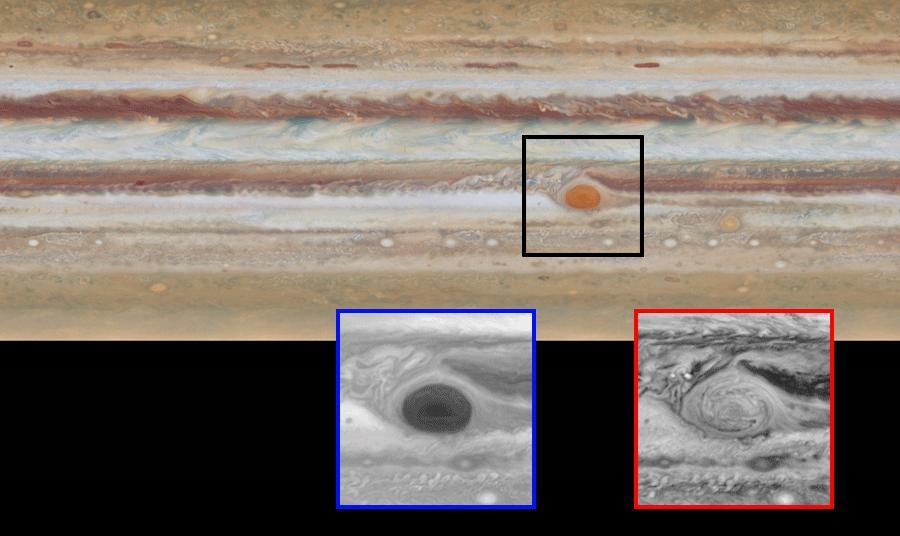
This image is one of two images from NASA Hubble Space Telescope comparing the movement of Jupiter clouds. The movement of Jupiter's clouds can be seen by comparing the first map to the second one in this animated pair of images. Zooming in on the Great Red Spot at blue (below, at left) and red (below, at right) wavelengths reveals a unique filamentary feature not previously seen. http://photojournal.jpl.nasa.gov/catalog/PIA19648
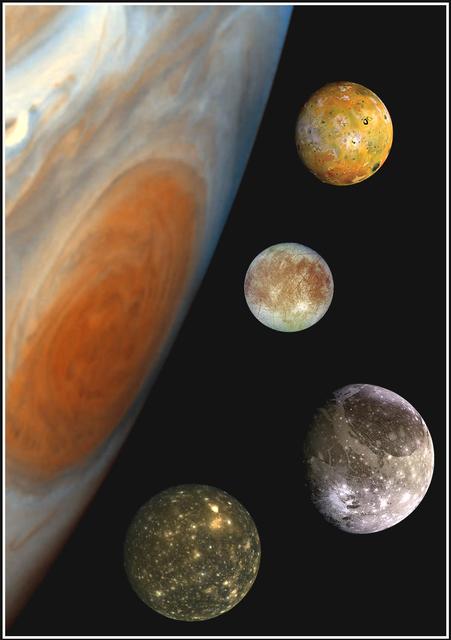
This "family portrait," a composite of the Jovian system, includes the edge of Jupiter with its Great Red Spot, and Jupiter's four largest moons, known as the Galilean satellites. From top to bottom, the moons shown are Io, Europa, Ganymede and Callisto. The Great Red Spot, a storm in Jupiter's atmosphere, is at least 300 years old. Winds blow counterclockwise around the Great Red Spot at about 400 kilometers per hour (250 miles per hour). The storm is larger than one Earth diameter from north to south, and more than two Earth diameters from east to west. In this oblique view, the Great Red Spot appears longer in the north-south direction. Europa, the smallest of the four moons, is about the size of Earth's moon, while Ganymede is the largest moon in the solar system. North is at the top of this composite picture in which the massive planet and its largest satellites have all been scaled to a common factor of 15 kilometers (9 miles) per picture element. The Solid State Imaging (CCD) system aboard NASA's Galileo spacecraft obtained the Jupiter, Io and Ganymede images in June 1996, while the Europa images were obtained in September 1996. Because Galileo focuses on high resolution imaging of regional areas on Callisto rather than global coverage, the portrait of Callisto is from the 1979 flyby of NASA's Voyager spacecraft. http://photojournal.jpl.nasa.gov/catalog/PIA00600
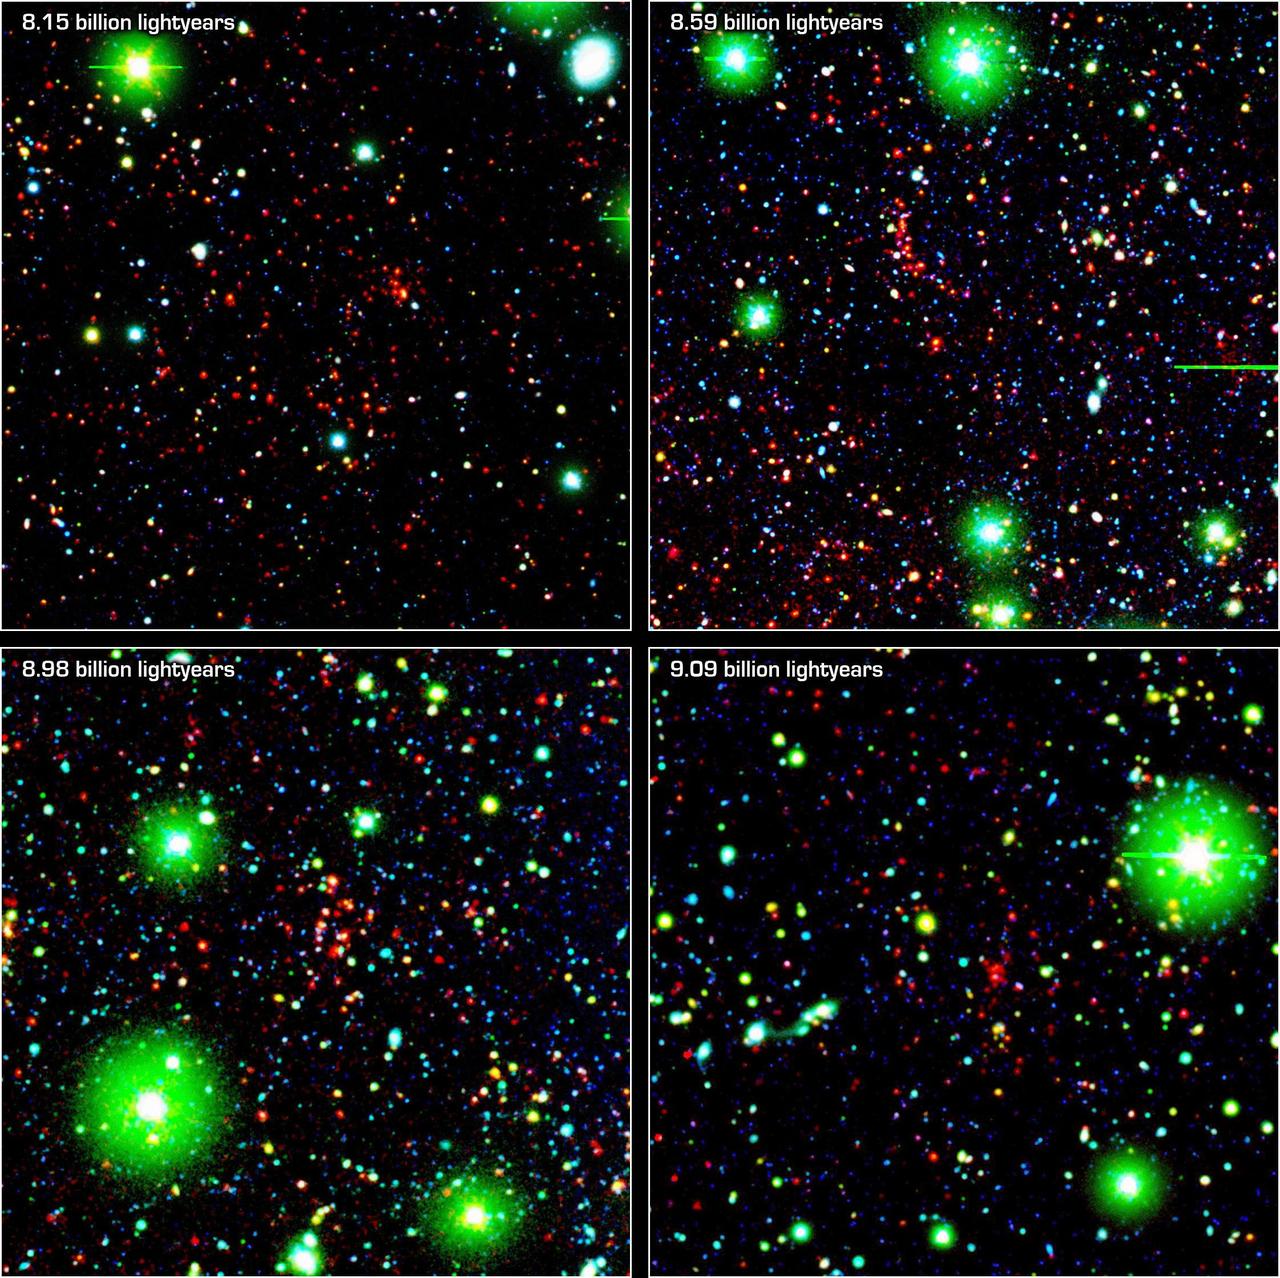
Like great friends, galaxies stick together. Astronomers using NASA Spitzer Space Telescope have spotted a handful of great galactic pals bonding back when the universe was a mere 4.6 billion years old.

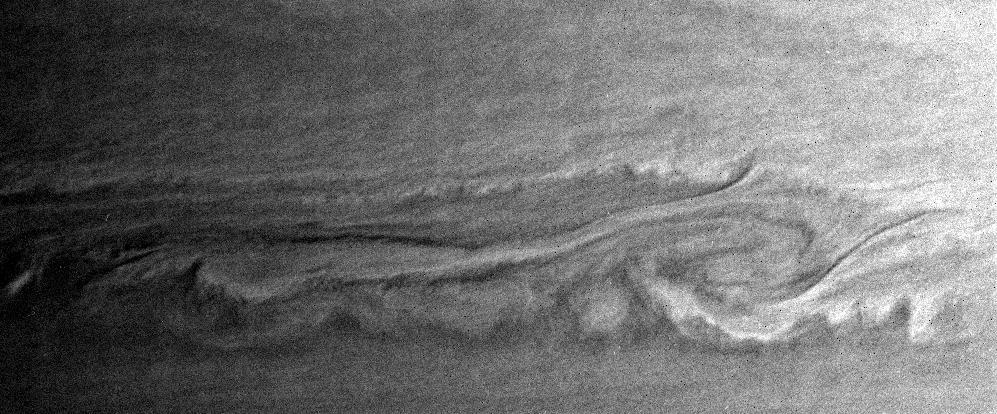
Turbulent Region Near Jupiter Great Red Spot
Jupiter Great Red Spot and White Ovals
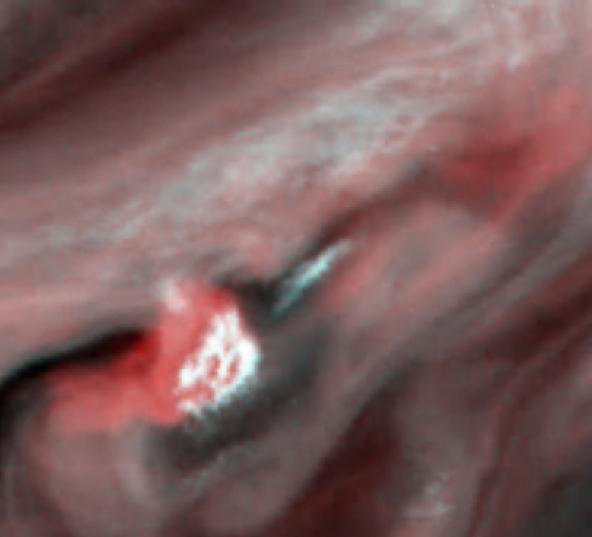
Water Cloud Thunderstorm Northwest of Great Red Spot
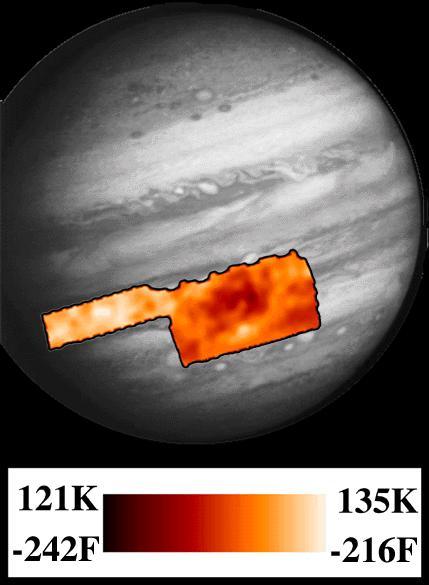
PPR Great Red Spot Temperature Map

Ammonia Ice near Jupiter Great Red Spot
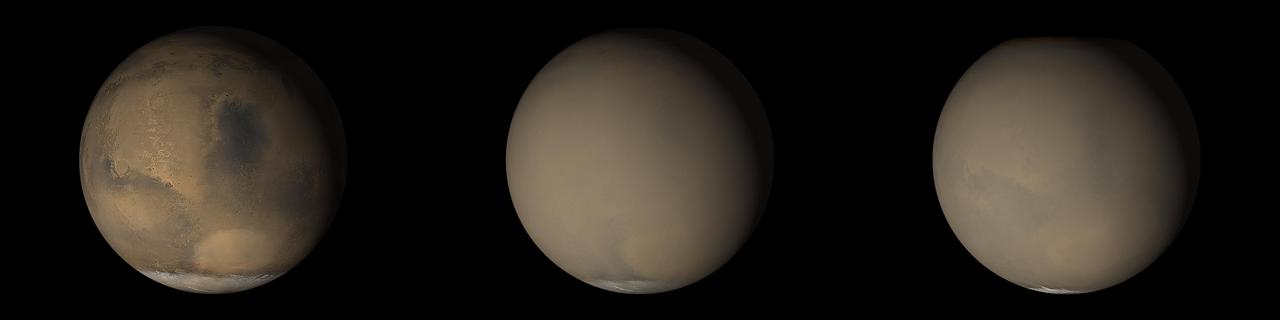
The 2001 Great Dust Storms - Hellas/Syrtis Major

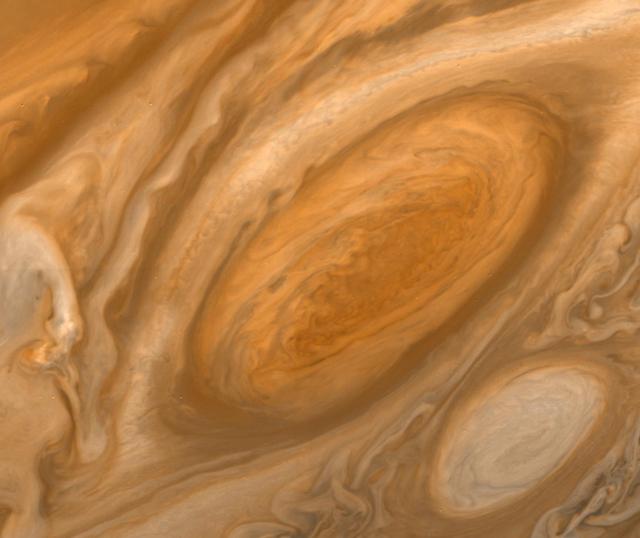
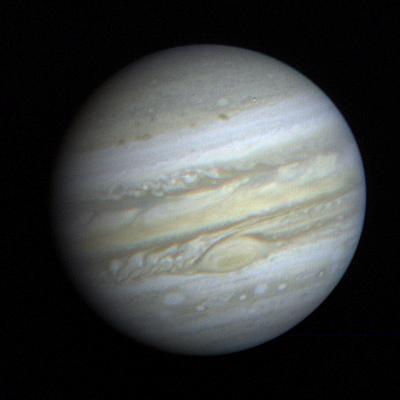
This view of Jupiter Great Red Spot is a mosaic of two images taken by NASA Galileo spacecraft. The Great Red Spot is a storm in Jupiter atmosphere and is at least 300 years-old. The image was taken on June 26, 1996. http://photojournal.jpl.nasa.gov/catalog/PIA00296
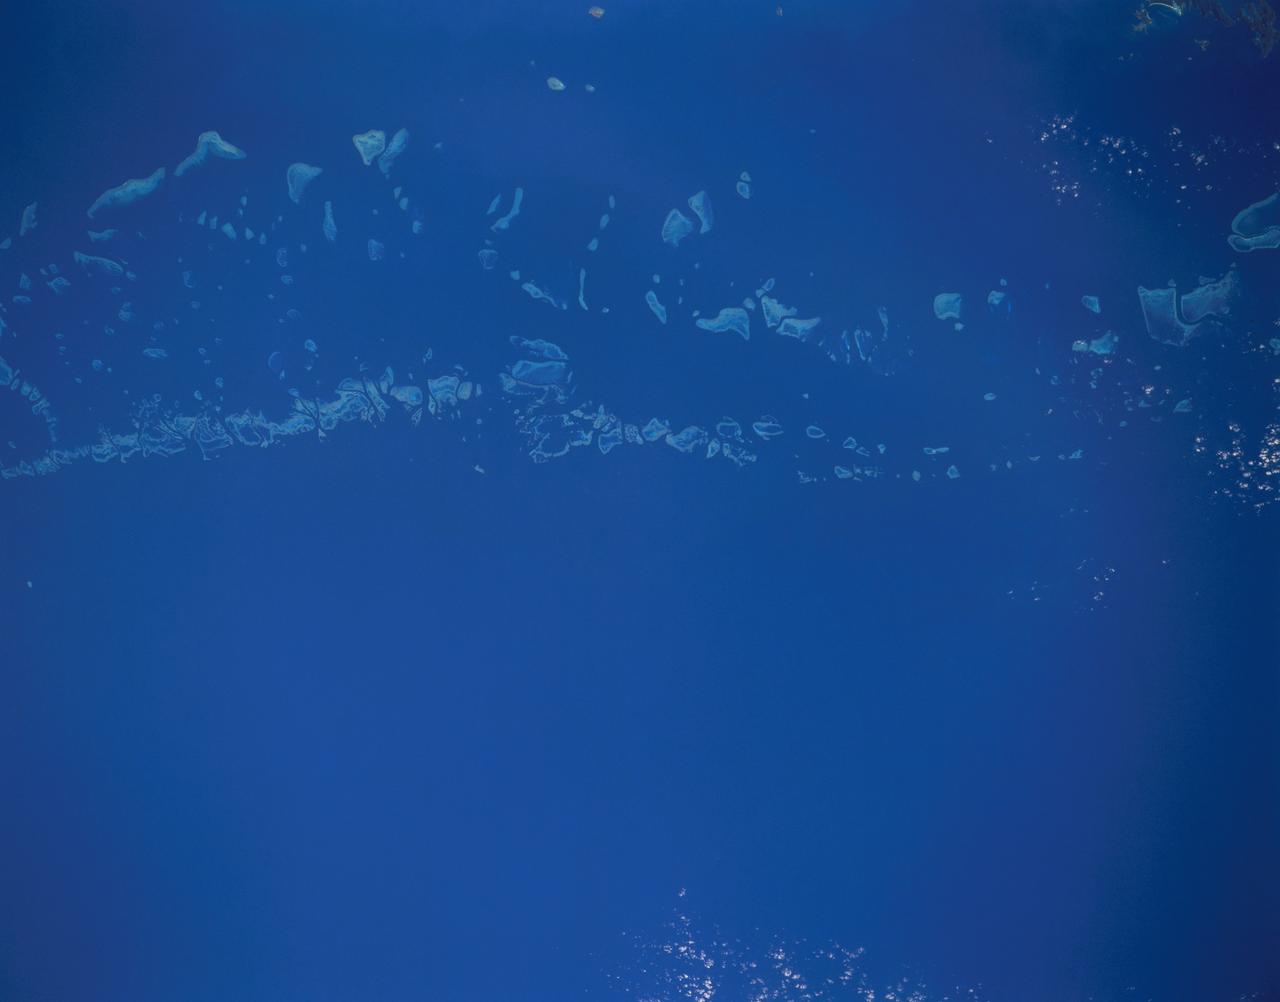
STS048-151-250 (12-18 Sept. 1991) --- The Great Barrier Reef extends for roughly 2,000 kilometers along the northeast coast of Australia. The great Barrier Reef is made up of thousands of individual reefs which define the edge of the continental shelf. The southern part of the feature, called Swain Reef, is seen here. Water depths around the reefs are quite shallow (less than 1 meter to about 36 meters in depth), but only a few kilometers offshore, water depths are roughly 1,000 meters.
A south tropical disturbance has just passed Jupiter's iconic Great Red Spot and is captured stealing threads of orange haze from the Great Red Spot in this series of color-enhanced images from NASA's Juno spacecraft. From left to right, this sequence of images was taken between 2:57 a.m. and 3:36 a.m. PDT (5:57 a.m. and 6:36 a.m. EDT) on April 1, 2018, as the spacecraft performed its 12th close flyby of Jupiter. Citizen scientists Gerald Eichstädt and Seán Doran created this image using data from the spacecraft's JunoCam imager. https://photojournal.jpl.nasa.gov/catalog/PIA22937 ** Image Credit: Enhanced Image by Gerald Eichstädt and Seán Doran (CC BY-NC-SA) based on images provided courtesy of NASA/JPL-Caltech/SwRI/MSSS
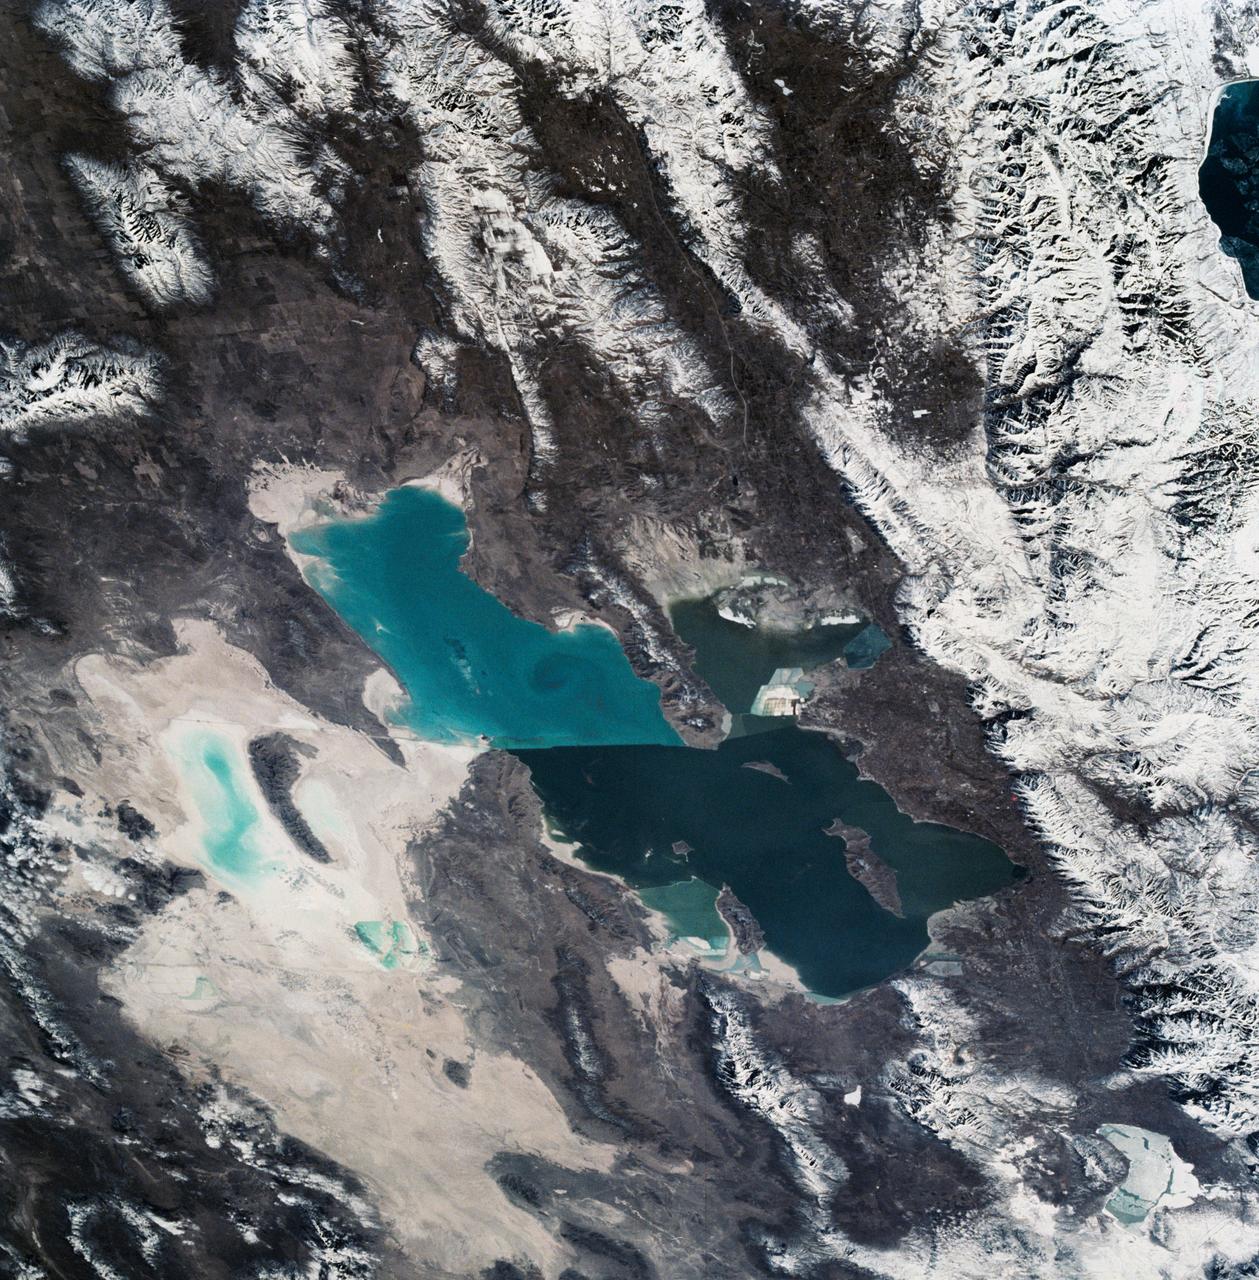
As seen from space, the Great Salt Lake, Utah, USA (41.5N, 112.5W) appears as two separate bodies of water with a narrow divider in the middle. At the turn of the century, a railroad bridge without culverts, was built across the lake and ever since, the water and salinity levels have been uneqal on either side. Fed by snowmelt from the nearby Wasatch Mountains, the lake in recent years has had record high water levels, threatening to flood the local areas.
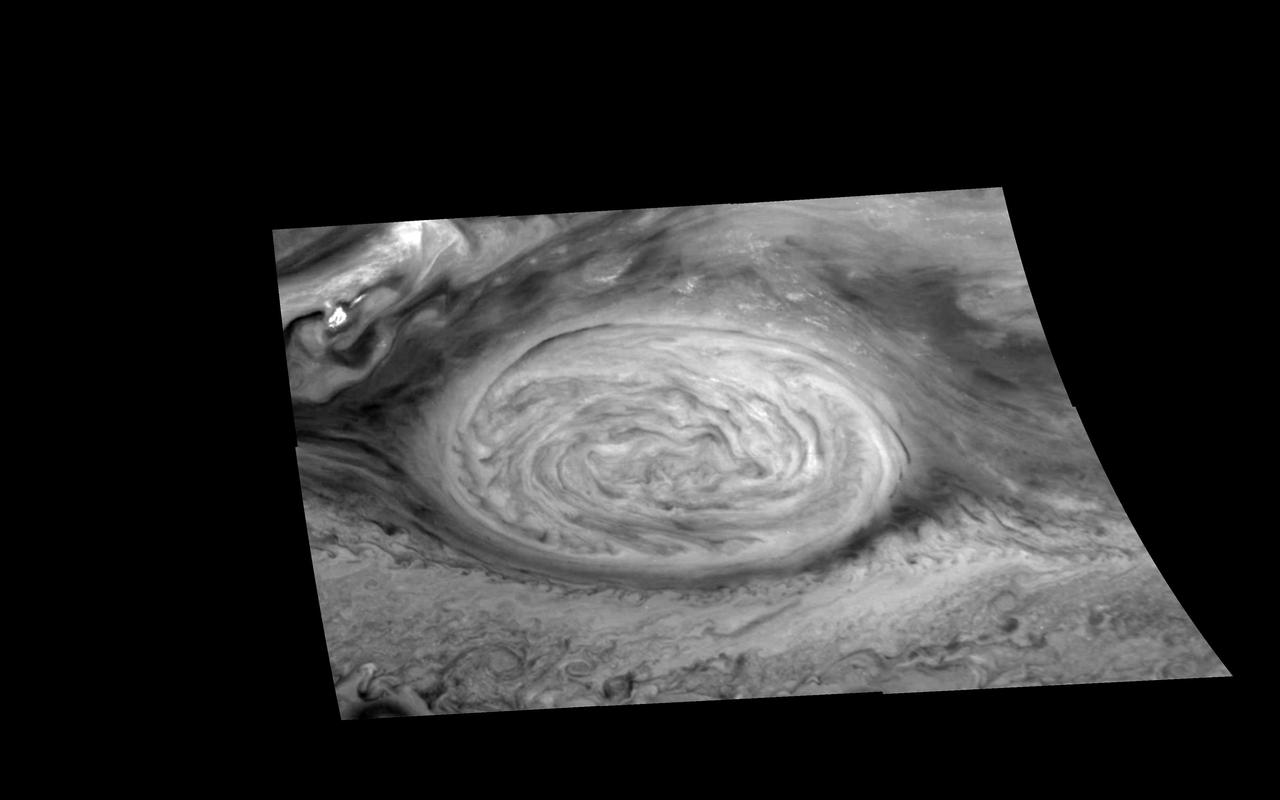
Turbulent region west of Jupiter Great Red Spot. This four image mosaic shows the Great Red Spot on Jupiter eastern edge or limb as seen by NASA Galileo orbiter d on June 26, 1996.
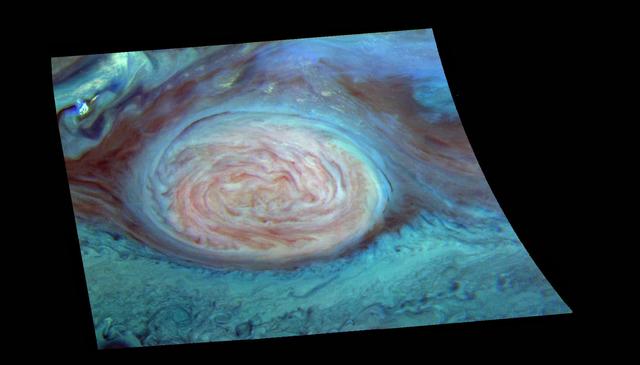
False color representation of Jupiter Great Red Spot GRS taken by NASA Galileo imaging system. The Great Red Spot appears pink and the surrounding region blue because of the particular color coding used in this representation.

This photo of Jupiter Great Red Spot was taken by Voyager 1 in early March 1979.
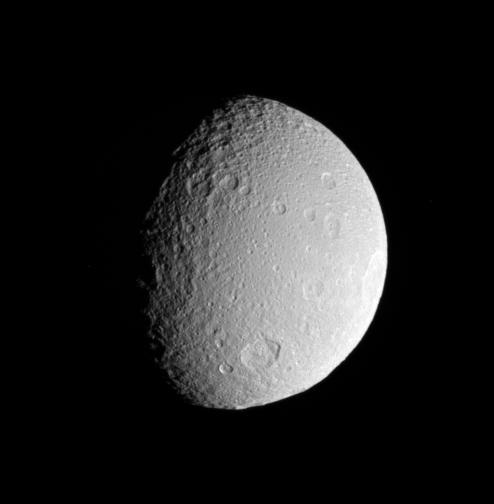
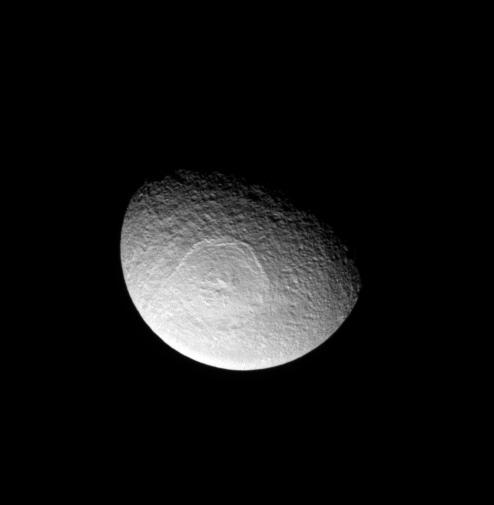
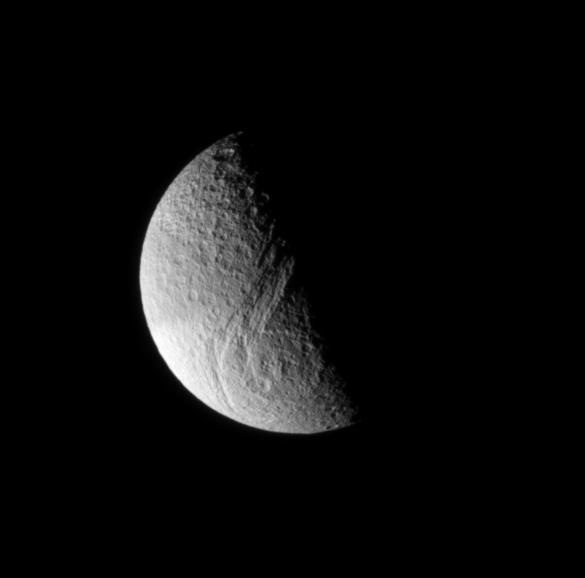
The Cassini spacecraft surveys the battered surface of icy Tethys. The great impact basin straddling the terminator is itself overprinted by many smaller impact sites
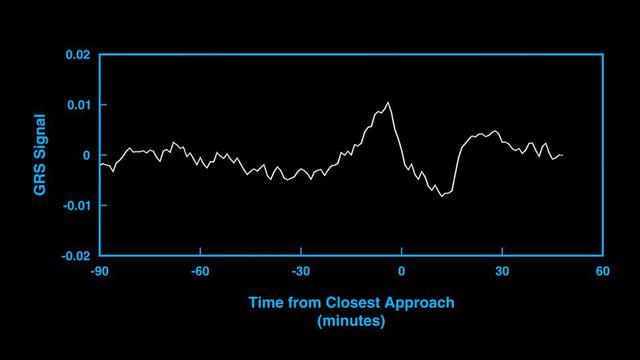
This animation and audio represent the subtle gravitational signal acquired by an antenna of NASA's Deep Space Network as the agency's Juno spacecraft performed a close flyby of Jupiter's Great Red Spot in July 2019. The changes in the signal frequency represent the changes in the local gravity as the spacecraft flew low overhead. Juno flew twice over the Great Red Spot in 2019, with the goal of picking up the subtle gravitational signal of the vortex. The concentration of mass caused by the powerful winds surrounding the Great Red Spot minutely change the spacecraft's velocity, inducing a Doppler shift on the radio signals relayed back to Earth. Movie available at https://photojournal.jpl.nasa.gov/catalog/PIA24963

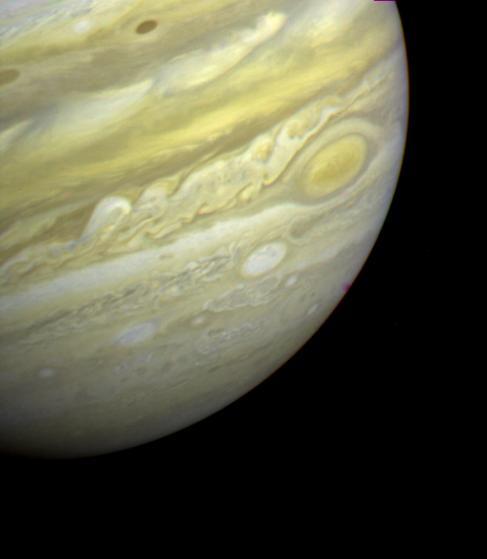
This view of Jupiter was taken by Voyager 1. This image was taken through color filters and recombined to produce the color image. This photo was assembled from three black and white negatives by the Image Processing Lab at Jet Propulsion Laboratory. http://photojournal.jpl.nasa.gov/catalog/PIA01384
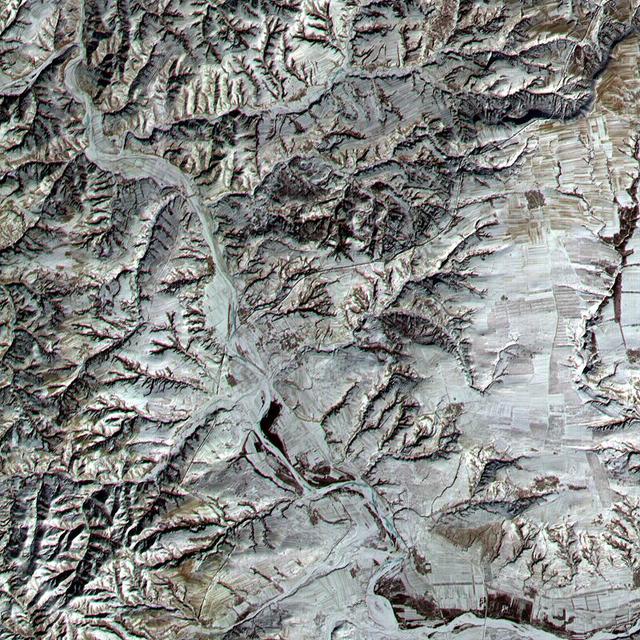
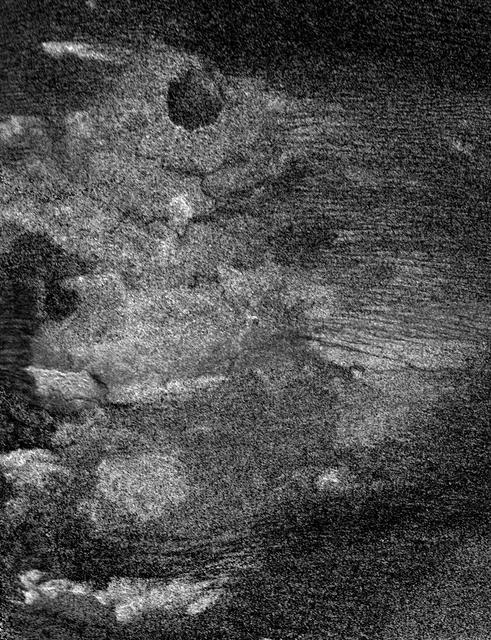
This ASTER sub-image covers a 12 x 12 km area in northern Shanxi Province, China, and was acquired January 9, 2001. The low sun angle, and light snow cover highlight a section of the Great Wall, visible as a black line running diagonally through the image from lower left to upper right. The Great Wall is over 2000 years old and was built over a period of 1000 years. Stretching 4500 miles from Korea to the Gobi Desert it was first built to protect China from marauders from the north. This image is located at 40.2 degrees north latitude and 112.8 degrees east longitude. http://photojournal.jpl.nasa.gov/catalog/PIA02669
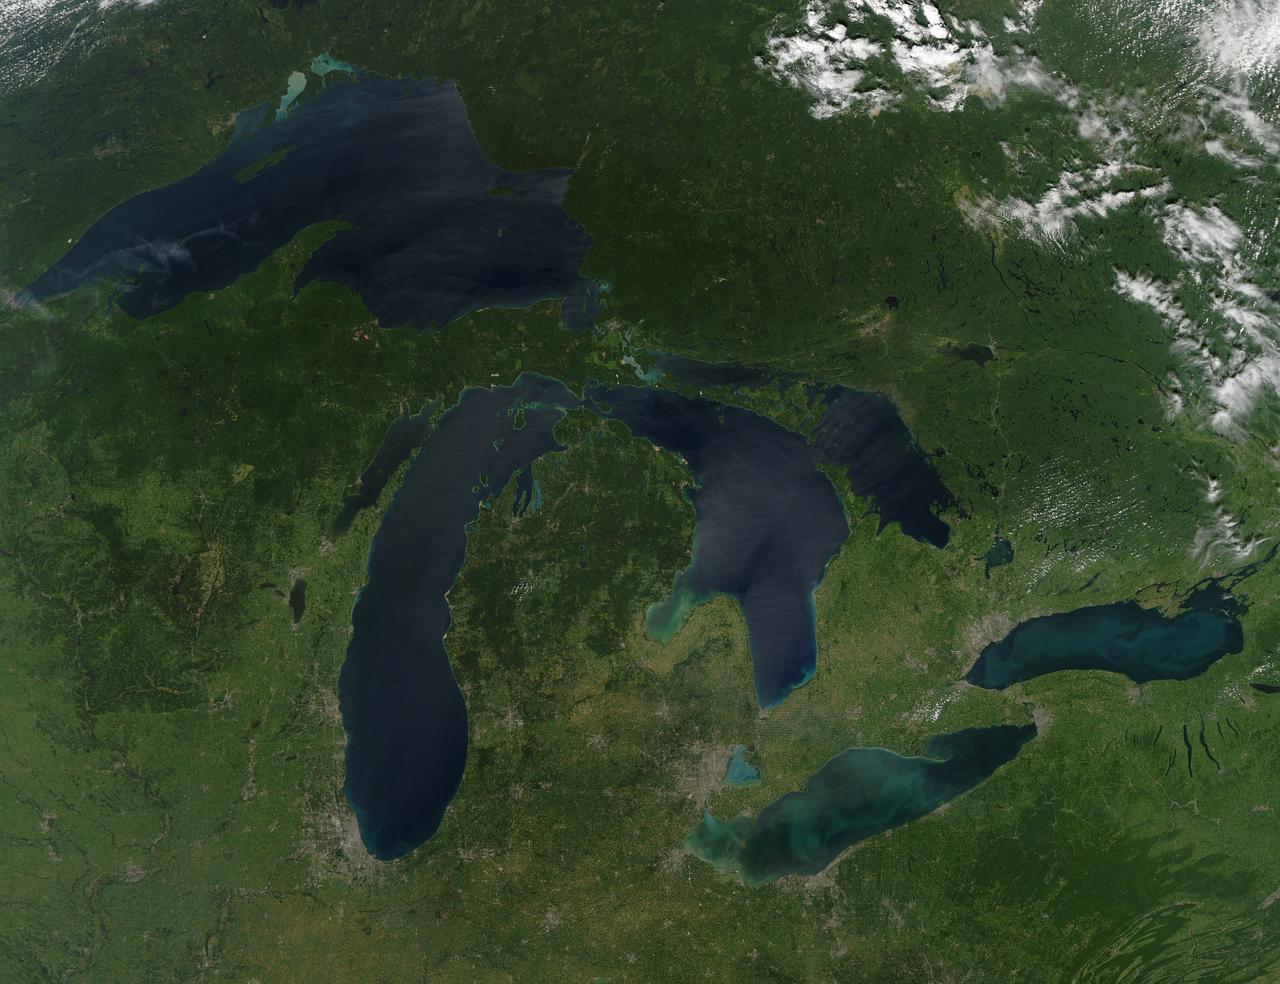
NASA image acquired August 28, 2010 Late August 2010 provided a rare satellite view of a cloudless summer day over the entire Great Lakes region. North Americans trying to sneak in a Labor Day weekend getaway on the lakes were hoping for more of the same. The Great Lakes comprise the largest collective body of fresh water on the planet, containing roughly 18 percent of Earth's supply. Only the polar ice caps contain more fresh water. The region around the Great Lakes basin is home to more than 10 percent of the population of the United States and 25 percent of the population of Canada. Many of those people have tried to escape record heat this summer by visiting the lakes. What they found, according to The Hamilton Spectator, was record-breaking water temperatures fueled by record-breaking air temperatures in the spring and summer. By mid-August, the waters of Lake Superior were 6 to 8°C (11 to 14°F) above normal. Lake Michigan set records at about 4°C (7°F) above normal. The other three Great Lakes – Huron, Erie, and Ontario -- were above normal temperatures, though no records were set. The image was gathered by the Moderate Resolution Imaging Spectroradiometer (MODIS) on NASA’s Aqua satellite at 1:30 p.m. Central Daylight Time (18:30 UTC) on August 28. Open water appears blue or nearly black. The pale blue and green swirls near the coasts are likely caused by algae or phytoplankton blooms, or by calcium carbonate (chalk) from the lake floor. The sweltering summer temperatures have produced an unprecedented bloom of toxic blue-green algae in western Lake Erie, according to the Cleveland Plain Dealer. NASA image by Jeff Schmaltz, MODIS Rapid Response Team, Goddard Space Flight Center. Caption by Mike Carlowicz. Instrument: Aqua - MODIS Click here to see more images from <b><a href="#//earthobservatory.nasa.gov/" rel="nofollow"> NASA Goddard’s Earth Observatory</a></b> <b><a href="http://www.nasa.gov/centers/goddard/home/index.html" rel="nofollow">NASA Goddard Space Flight Center</a></b> is home to the nation's largest organization of combined scientists, engineers and technologists that build spacecraft, instruments and new technology to study the Earth, the sun, our solar system, and the universe. <b>Follow us on <a href="http://twitter.com/NASA_GoddardPix" rel="nofollow">Twitter</a></b> <b>Join us on <a href="http://www.facebook.com/pages/Greenbelt-MD/NASA-Goddard/395013845897?ref=tsd" rel="nofollow">Facebook</a></b>
The 2001 Great Dust Storms - Daedalia/Claritas/Syria Dust Plumes
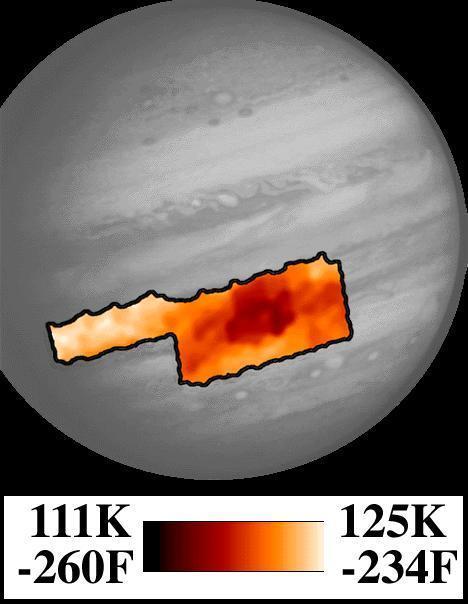
Photopolarimeter/Radiometer PPR Temperature Map of Great Red Spot
Changes in Jupiter Great Red Spot After Four Months
The Great Barrier Reef extends for 2,000 kilometers along the northeastern coast of Australia. It is not a single reef, but a vast maze of reefs, passages, and coral cays islands that are part of the reef.
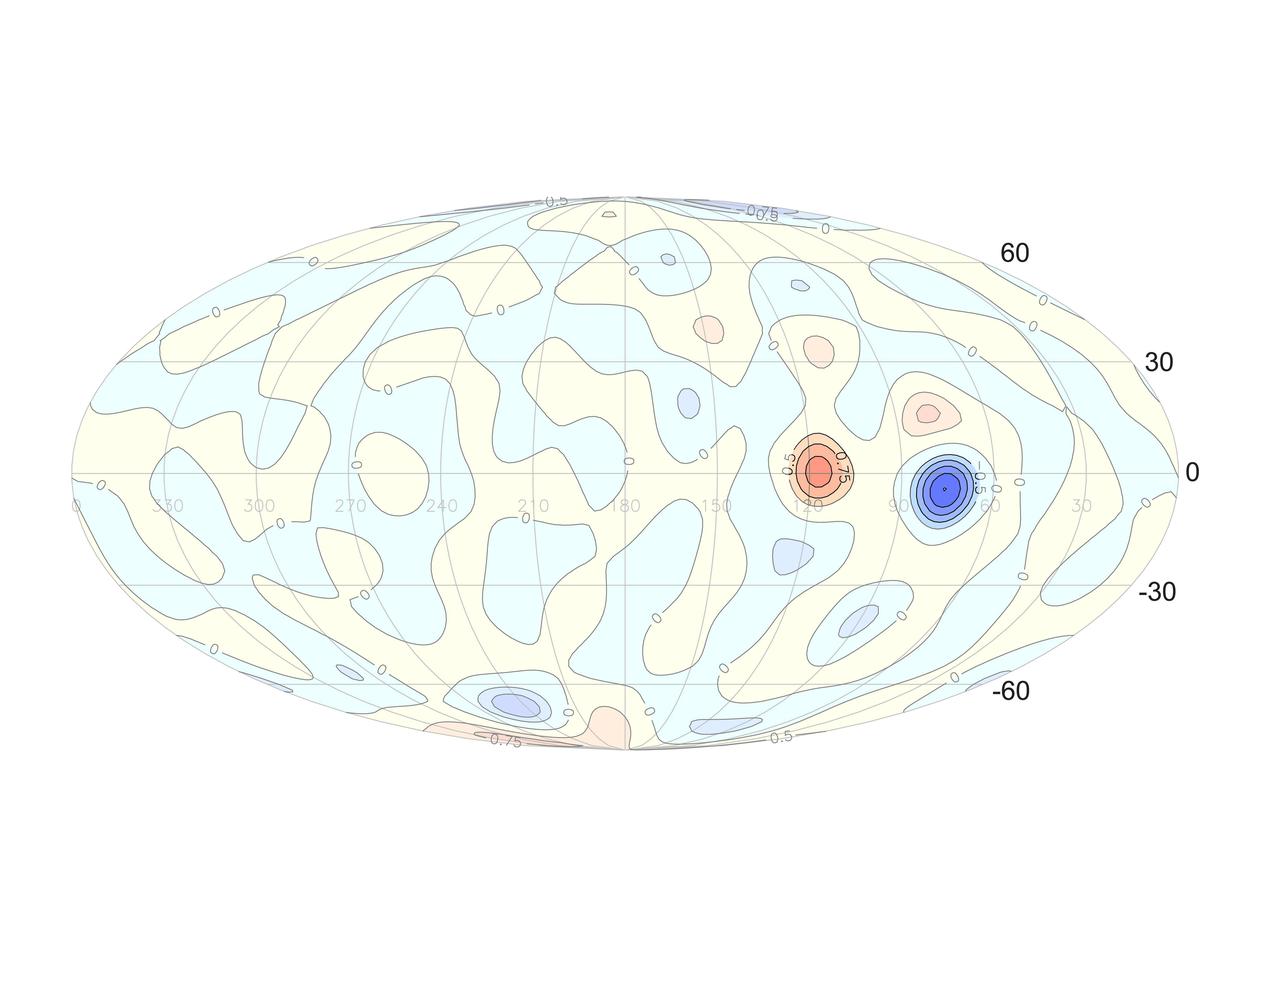
This graphic shows a comparison of the observed change in Jupiter's radial magnetic field, over time, as well as the change calculated from the model, assuming eastward drift of the "Great Blue Spot" (GBS). https://photojournal.jpl.nasa.gov/catalog/PIA25036
Radar Images Shikoku - Great

Roughly true color image of the Great Red Spot of Jupiter as taken by NASA Galileo spacecraft on June 26, 1996.
This montage features activity in the turbulent region of Jupiter Great Red Spot GRS. Four sets of images of the GRS were taken by NASA Galileo imaging system over an 11.5 hour period on 26 June, 1996.
This mosaic of Jupiter Great Red Spot taken by NASA Voyager 1, shows the area around the northern boundary where a white cloud is seen which extends to east of the region. http://photojournal.jpl.nasa.gov/catalog/PIA00065
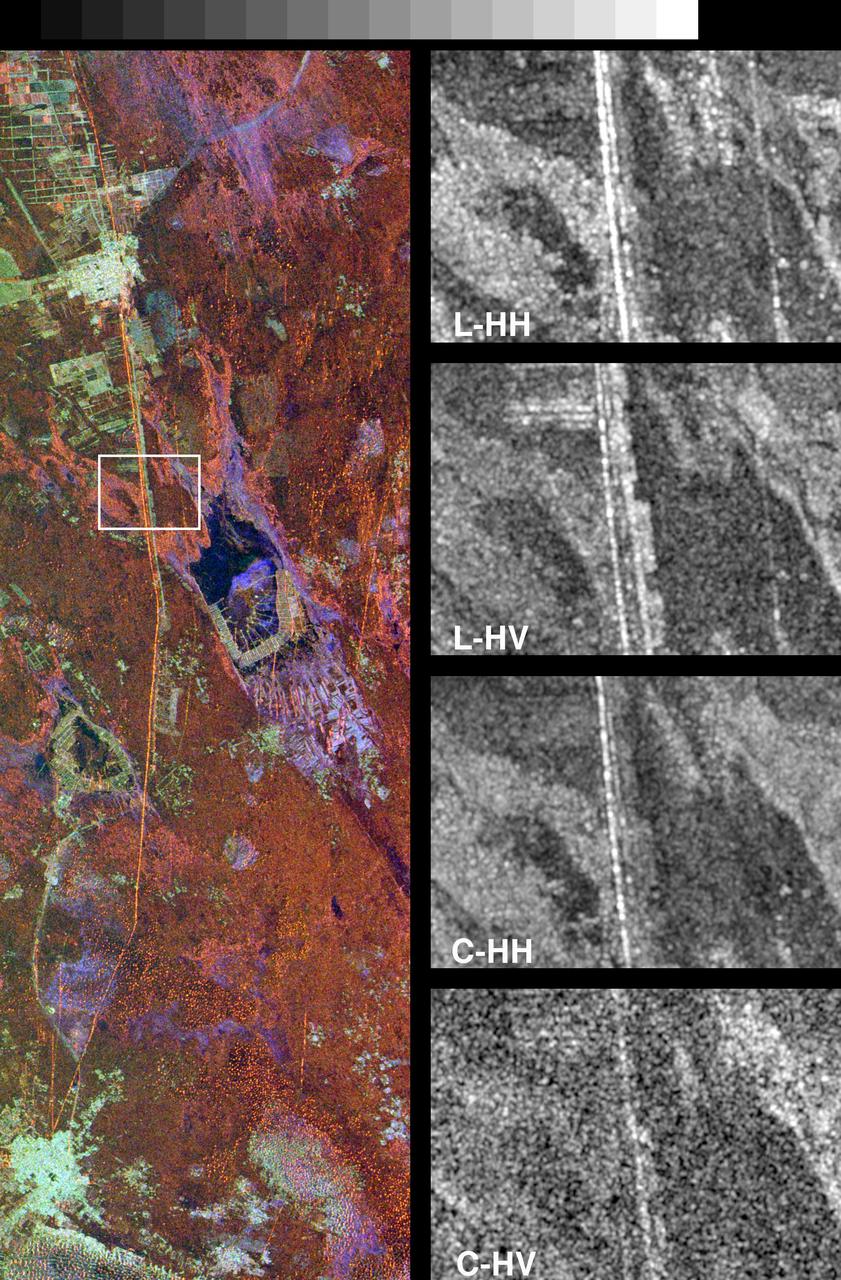
These spaceborne radar images show a segment of the Great Wall of China in a desert region of north-central China, about 700 kilometers 434 miles west of Beijing.
This photo from NASA Voyager 2 was taken on Jun. 9, 1979 and is centered over the long-lived disturbed region west of the Great Red Spot GRS.
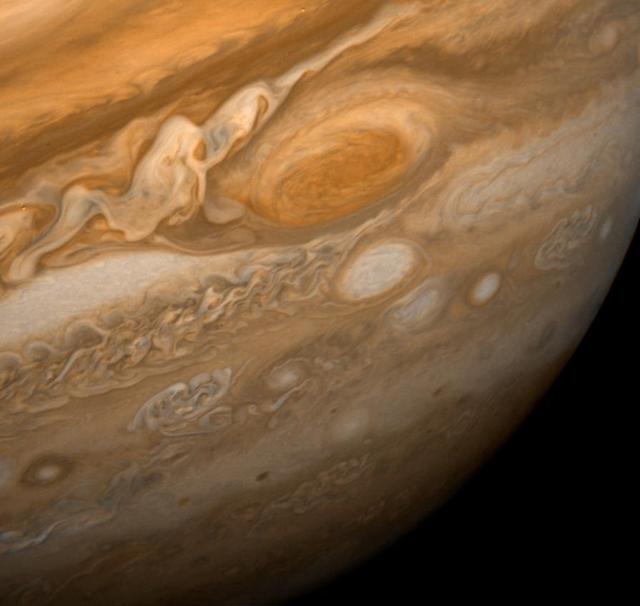
This dramatic view of Jupiter Great Red Spot and its surroundings was obtained by NASA Voyager 1 on Feb. 25, 1979. The colorful, wavy cloud pattern to the left of the Red Spot is a region of extraordinarily complex end variable wave motion. http://photojournal.jpl.nasa.gov/catalog/PIA00014
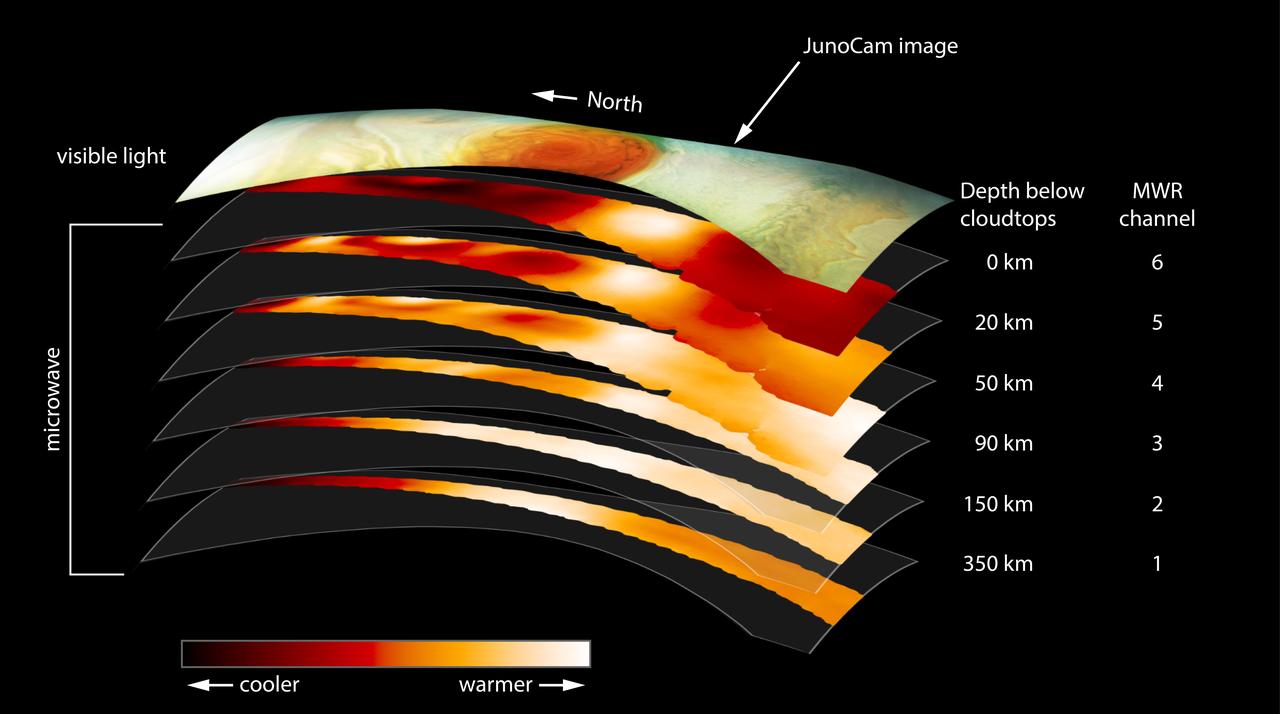
This figure shows data from the six channels of the microwave radiometer (MWR) instrument onboard NASA's Juno spacecraft. The data were collected in the mission's sixth science orbit (referred to as "perijove 7"), during which the spacecraft passed over Jupiter's Great Red Spot. The top layer in the figure is a visible light image from the mission's JunoCam instrument, provided for context. The MWR instrument enables Juno to see deeper into Jupiter than any previous spacecraft or Earth-based observations. Each MWR channel peers progressively deeper below the visible cloud tops. Channel 1 is sensitive to longer microwave wavelengths; each of the other channels is sensitive to progressively shorter wavelengths. The large-scale structure of the Great Red Spot is visible in the data as deep into Jupiter as MWR can observe. https://photojournal.jpl.nasa.gov/catalog/PIA22177
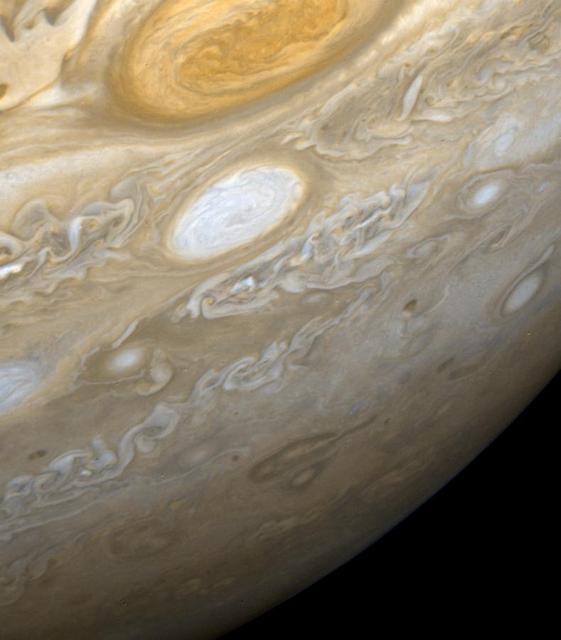
This picture from NASA Voyager 2 shows a region of the southern hemisphere extending from the Great Red Spot to the south pole. The white oval is seen beneath the Great Red Spot, and several small scale spots are visible farther to the south. http://photojournal.jpl.nasa.gov/catalog/PIA00372
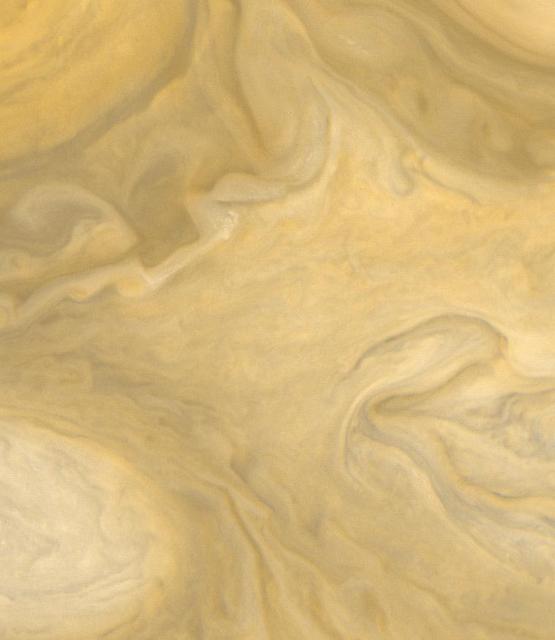
This view of the region just to the Southeast of the Great Red Spot was taken by NASA Voyager 1 on March 4, 1979 at a distance of 1,100,000 miles 1,800,000 km. http://photojournal.jpl.nasa.gov/catalog/PIA00017
This color view of the region just to the East of the Great Red Spot was taken by NASA Voyager 1 on March 4, 1979 at a distance of 1,000,000 miles 1,800,000 km. http://photojournal.jpl.nasa.gov/catalog/PIA00019
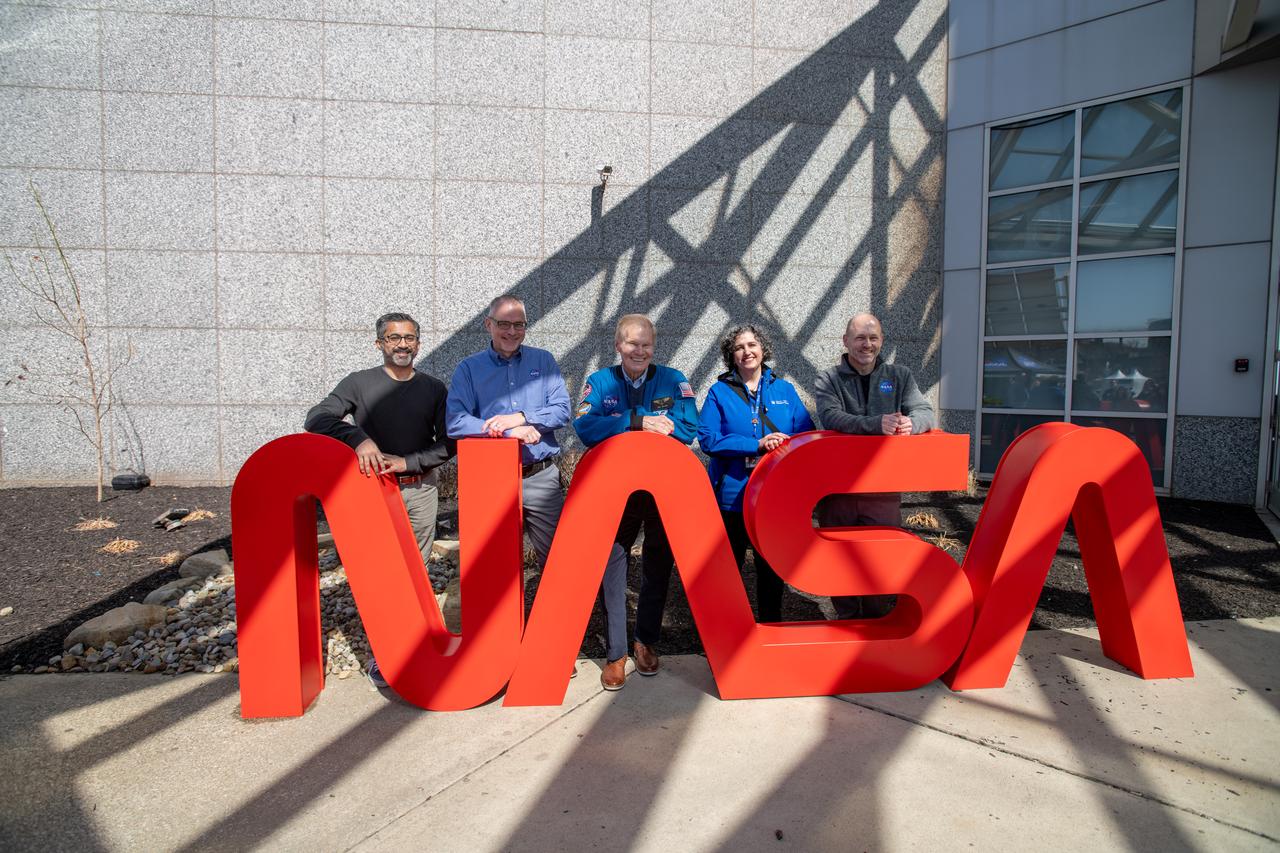
President & CEO of Greater Cleveland Partnership Baiju R. Shah, Jim Free, Administrator Bill Nelson, Great Lakes Science Center President and CEO Kristen Ellenbogen, GRC Center Director Jimmy Kenyon pose for a photo together. NASA Glenn Research Center and the Great Lakes Science Center hosted a three-day celestial celebration in downtown Cleveland, OH. This free, outdoor, family-friendly science and arts festival will feature free concerts, performances, speakers, and hands-on science activities with community partners. A total solar eclipse swept across a narrow portion of the North American continent from Mexico’s Pacific coast to the Atlantic coast of Newfoundland, Canada. A partial solar eclipse was visible across the entire North American continent along with parts of Central America and Europe.
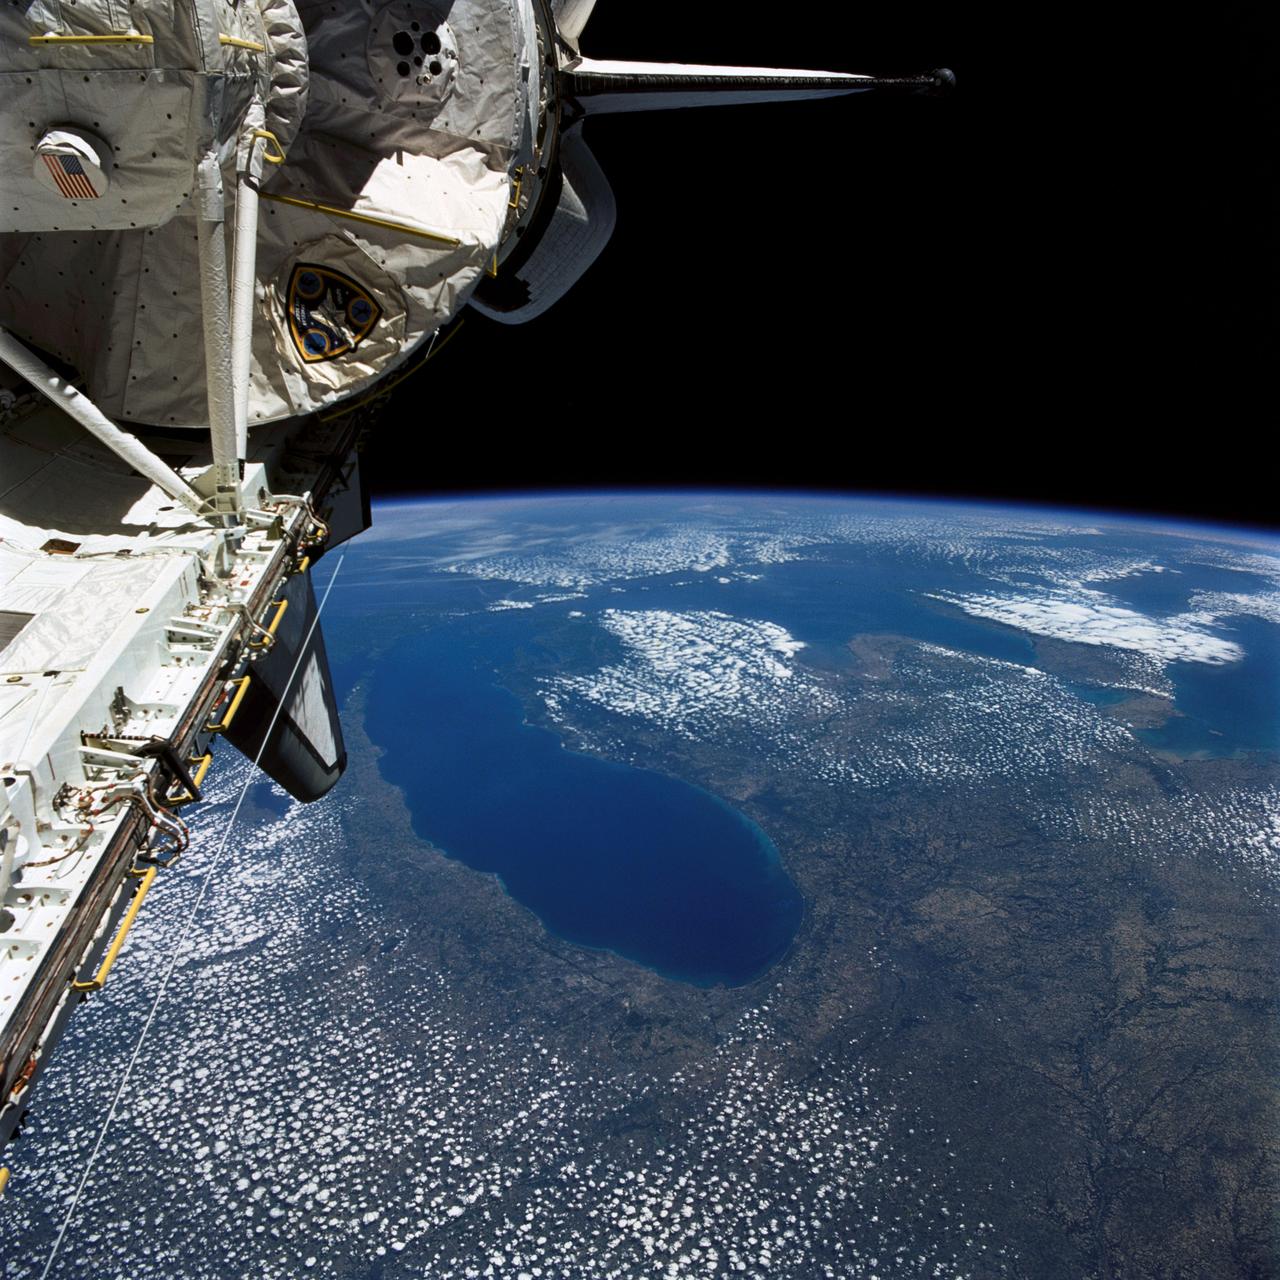
STS040-77-045 (6 June 1991) --- This image, photographed on June 6, 1991, is an oblique view looking north-northeast and shows most of the Great Lakes region. Part of Columbia's cargo bay and the Spacelab Life Sciences (SLS-1) module are in the foreground. In the center of the image is Lake Michigan with Chicago clearly visible along the southwest shore. According to NASA photo experts studying the STS-40 imagery, this image shows several interesting meteorological phenomena. The difference in temperature between the warming land and the cold lake waters is illustrated by the low level clouds. The warming land surface results in rising air and the formation of clouds, while the lake waters are cold and result in the lakes remaining cloud free. Also visible is evidence of lake breezes developing around several of the lakes. This phenomena is also driven by the difference in temperature between the land and the water. Winds blowing off the lakes must travel 25 - 30 miles inland before it warms sufficiently to create clouds.
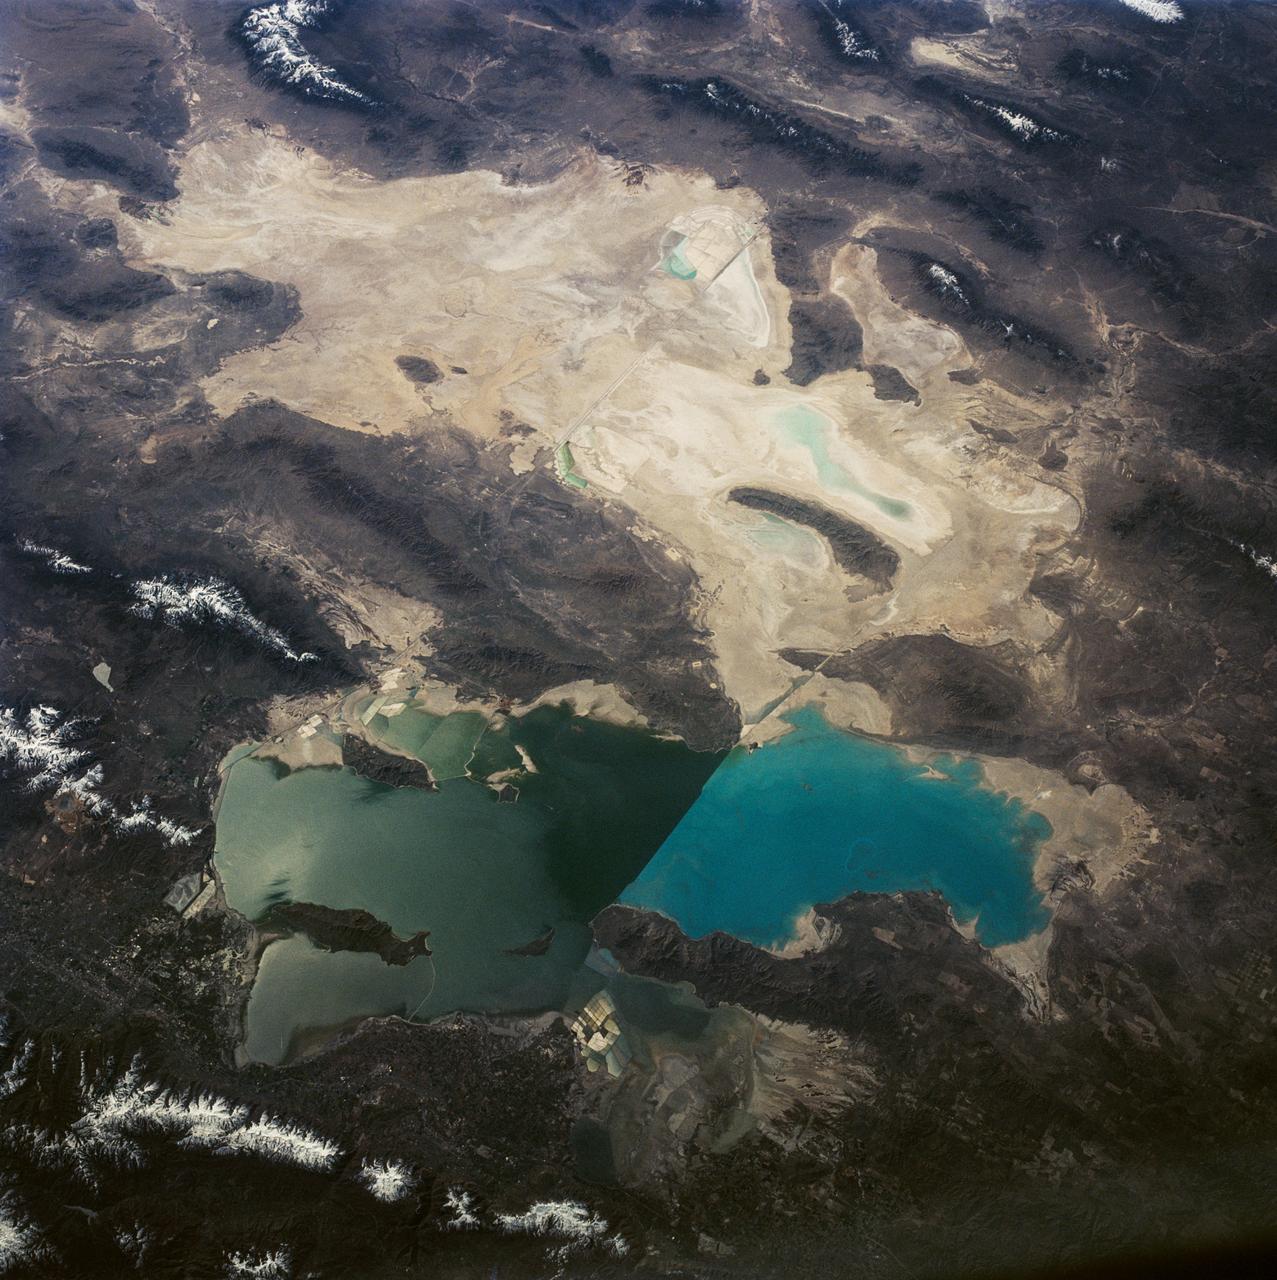
This is a view of the Great Salt Lake and nearby Bonneville Salt Flats, UT, (41.0N, 112.5W). A railroad causeway divides the lake with a stark straight line changing the water level and chemistry of the lake as a result. Fresh water runoff enters from the south adding to the depth and reducing the salinity. The north half receives little frsh water and is more saline and shallow. The Bonnieville Salt Flats is the lakebed of a onetime larger lake.
This photograph of Neptune was reconstructed from two images taken by NASA Voyager 2. At the north top is the Great Dark Spot. http://photojournal.jpl.nasa.gov/catalog/PIA00049
This representation depicts how NASA's Juno mission obtained gravity science data of Jupiter's Great Red Spot. The Juno spacecraft flew twice over the crimson vortex in 2019 at low altitudes with the goal of picking up its subtle gravitational signal. The concentration of mass related to the powerful winds surrounding the Great Red Spot induced a minute Doppler shift in the spacecraft's radio signals that could be measured by a NASA's Deep Space Network tracking antenna on Earth. With Juno traveling at about 130,000 mph (209,000 kph) over Jupiter's cloud deck, mission scientists were able to measure velocity changes as small 0.01 millimeter per second This enabled them to constrain the depth of the Great Red Spot to about 186 miles (300 kilometers) below the cloud tops. https://photojournal.jpl.nasa.gov/catalog/PIA24820
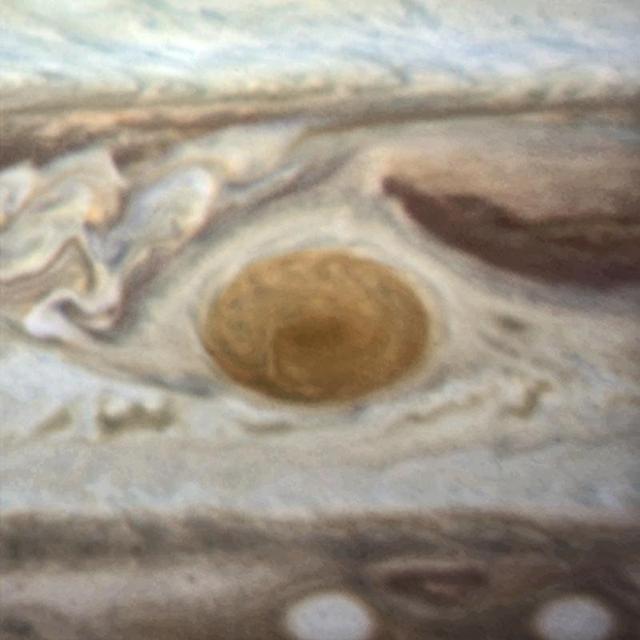
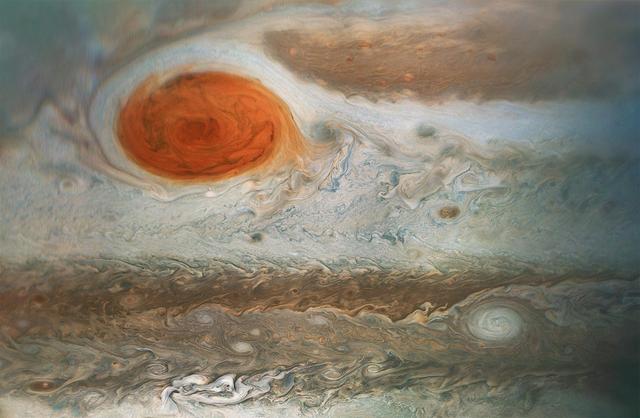
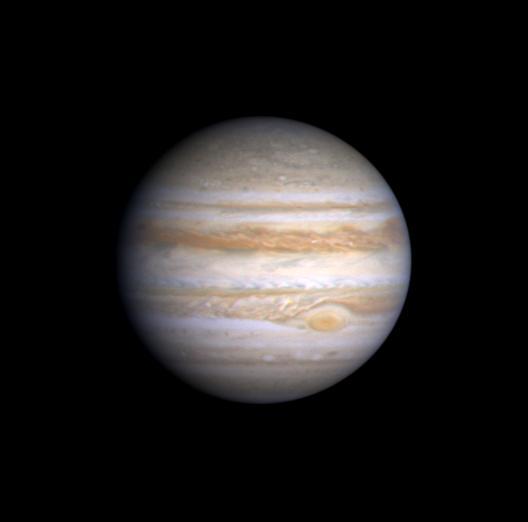
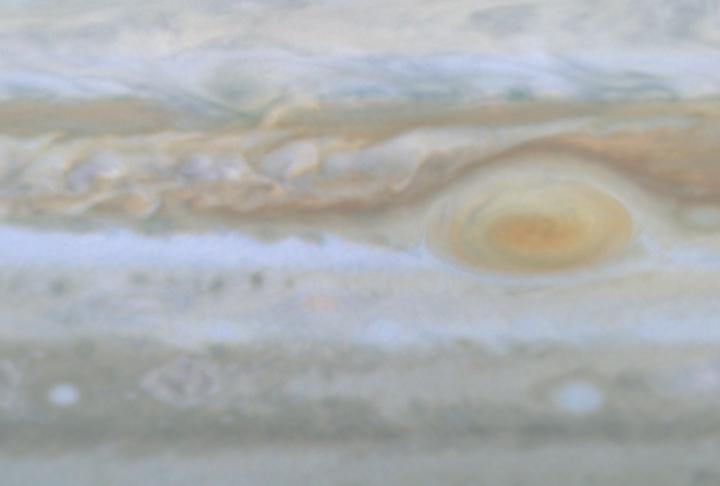
An image of Jupiter's Great Red Spot taken in 2014 with Hubble's WFC3 camera. The spot has a diameter here of 16 000km. -- Jupiter's trademark Great Red Spot -- a swirling anti-cyclonic storm larger than Earth -- has shrunk to its smallest size ever measured. According to Amy Simon of NASA's Goddard Space Flight Center in Greenbelt, Maryland, recent NASA Hubble Space Telescope observations confirm the Great Red Spot now is approximately 10,250 miles across. Astronomers have followed this downsizing since the 1930s. Historic observations as far back as the late 1800s gauged the storm to be as large as 25,500 miles on its long axis. NASA Voyager 1 and Voyager 2 flybys of Jupiter in 1979 measured it to be 14,500 miles across. In 1995, a Hubble photo showed the long axis of the spot at an estimated 13,020 miles across. And in a 2009 photo, it was measured at 11,130 miles across. Beginning in 2012, amateur observations revealed a noticeable increase in the rate at which the spot is shrinking -- by 580 miles per year -- changing its shape from an oval to a circle. Read more: <a href="http://1.usa.gov/1mvuo0R" rel="nofollow">1.usa.gov/1mvuo0R</a> Credit: NASA/ESA <b><a href="http://www.nasa.gov/audience/formedia/features/MP_Photo_Guidelines.html" rel="nofollow">NASA image use policy.</a></b> <b><a href="http://www.nasa.gov/centers/goddard/home/index.html" rel="nofollow">NASA Goddard Space Flight Center</a></b> enables NASA’s mission through four scientific endeavors: Earth Science, Heliophysics, Solar System Exploration, and Astrophysics. Goddard plays a leading role in NASA’s accomplishments by contributing compelling scientific knowledge to advance the Agency’s mission. <b>Follow us on <a href="http://twitter.com/NASAGoddardPix" rel="nofollow">Twitter</a></b> <b>Like us on <a href="http://www.facebook.com/pages/Greenbelt-MD/NASA-Goddard/395013845897?ref=tsd" rel="nofollow">Facebook</a></b> <b>Find us on <a href="http://instagram.com/nasagoddard?vm=grid" rel="nofollow">Instagram</a></b>
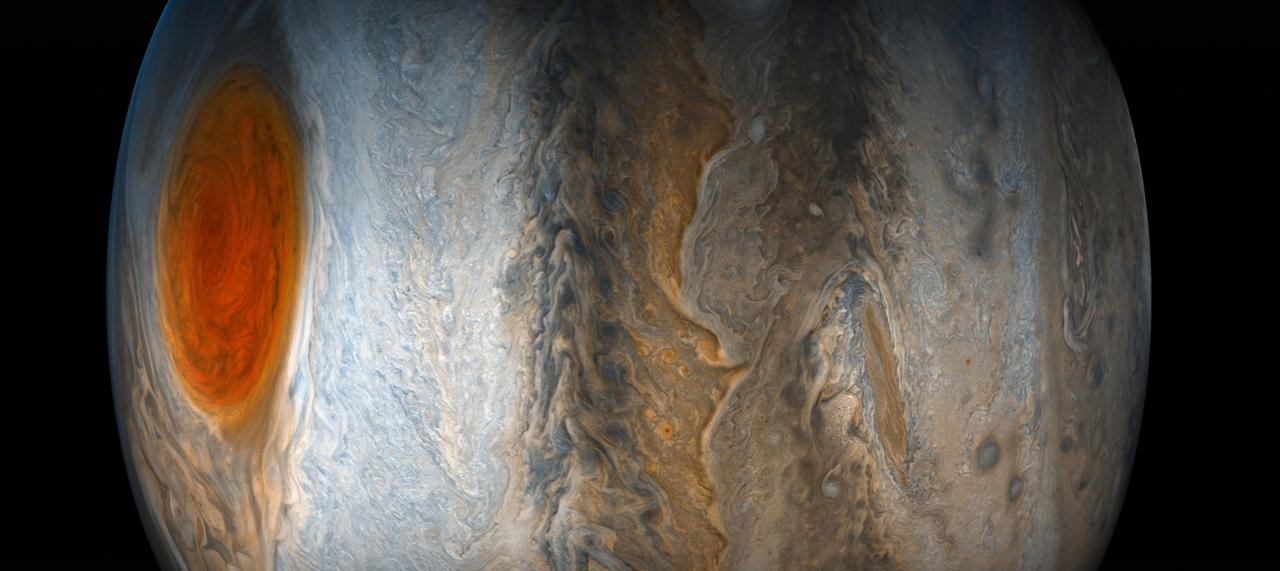
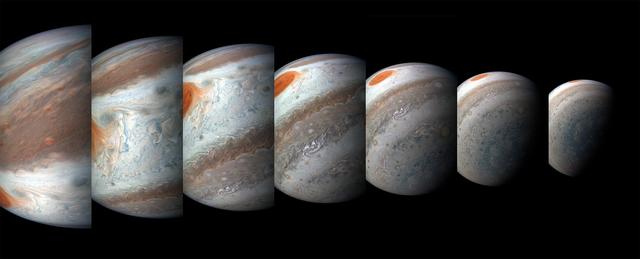
This striking Jovian vista was created by citizen scientists Gerald Eichstädt and Seán Doran using data from the JunoCam imager on NASA's Juno spacecraft. The tumultuous Great Red Spot is fading from Juno's view while the dynamic bands of the southern region of Jupiter come into focus. North is to the left of the image, and south is on the right. The image was taken on July 10, 2017 at 7:12 p.m. PDT (10:12 p.m. EDT), as the Juno spacecraft performed its seventh close flyby of Jupiter. At the time the image was taken, the spacecraft was 10,274 miles (16,535 kilometers) from the tops of the clouds of the planet at a latitude of -36.9 degrees. https://photojournal.jpl.nasa.gov/catalog/PIA21778 **Image Credit: Enhanced Image by Gerald Eichstädt and Seán Doran (CC BY-NC-SA) based on images provided courtesy of NASA/JPL-Caltech/SwRI/MSSS https://creativecommons.org/licenses/by-nc-sa/3.0/
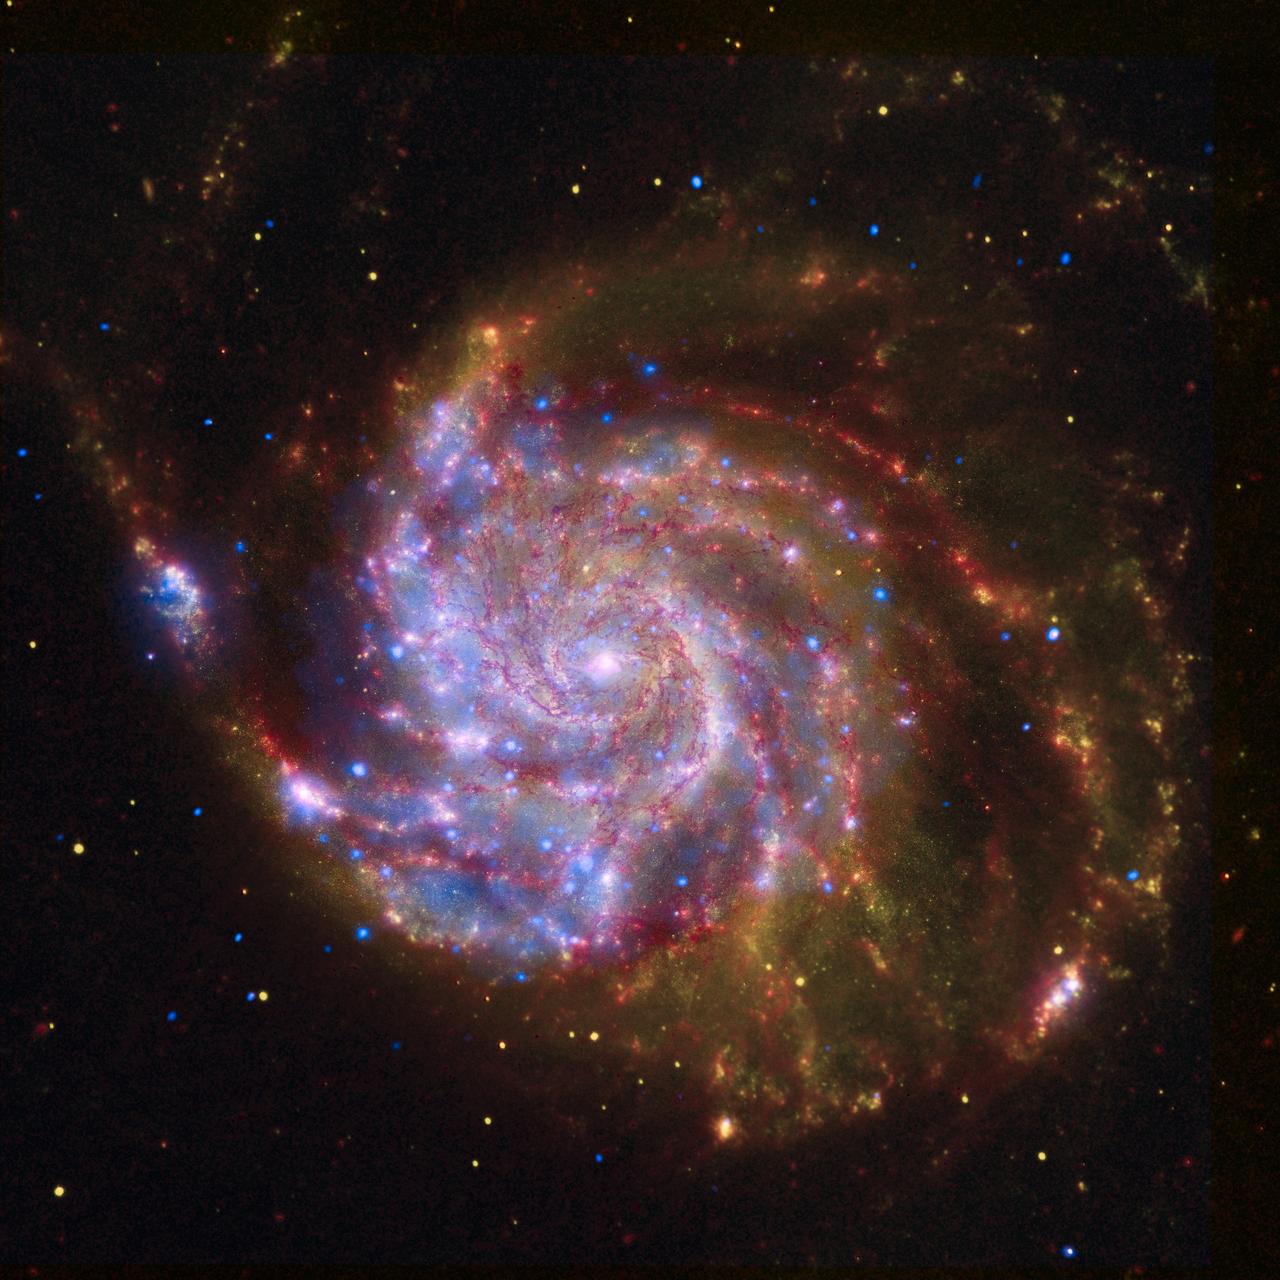
NASA Great Observatories continue Galileo legacy with stunning images and breakthrough science from the Hubble Space Telescope, the Spitzer Space Telescope, and the Chandra X-ray Observatory.
The Great Red Spot GRS of Jupiter as seen by NASA Galileo imaging system. The image is a mosaic of six images taken over an 80 second interval during the first GRS observing sequence on June 26, 1996.
The Great Red Spot below and right of center seen in this image from NASA Cassini spacecraft is a giant atmospheric storm as wide as two Earths and over 300 years old.
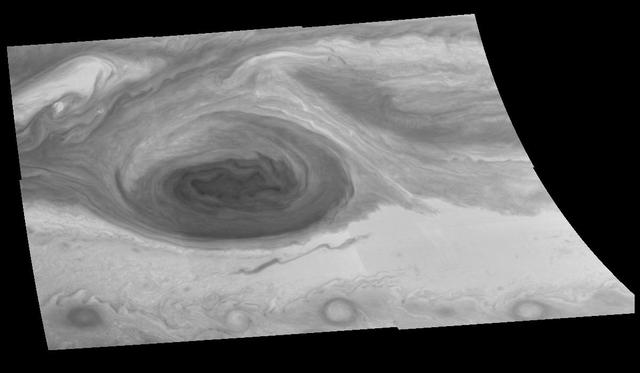
This mosaic of the Great Red Spot on Jupiter from NASA Galileo orbiter was taken over an 80 second interval beginning at universal time 14 hours, 30 minutes, 23 seconds, on June 26, 1996.
The mosaic of the Great Red Spot on Jupiter from NASA Galileo orbiter was taken over an 80 second interval beginning at universal time 14 hours, 30 minutes, 23 seconds, on June 26, 1996.
This image is a still frame, created from images taken by NASA Cassini spacecraft, shows a turbulent region west of Jupiter Great Red Spot. The small, bright white spots are believed to be thunderstorms.
The mosaic of the Great Red Spot on Jupiter from NASA Galileo orbiter was taken over a 76 second interval beginning at universal time 14 hours, 33 minutes, 22 seconds, on June 26, 1996.
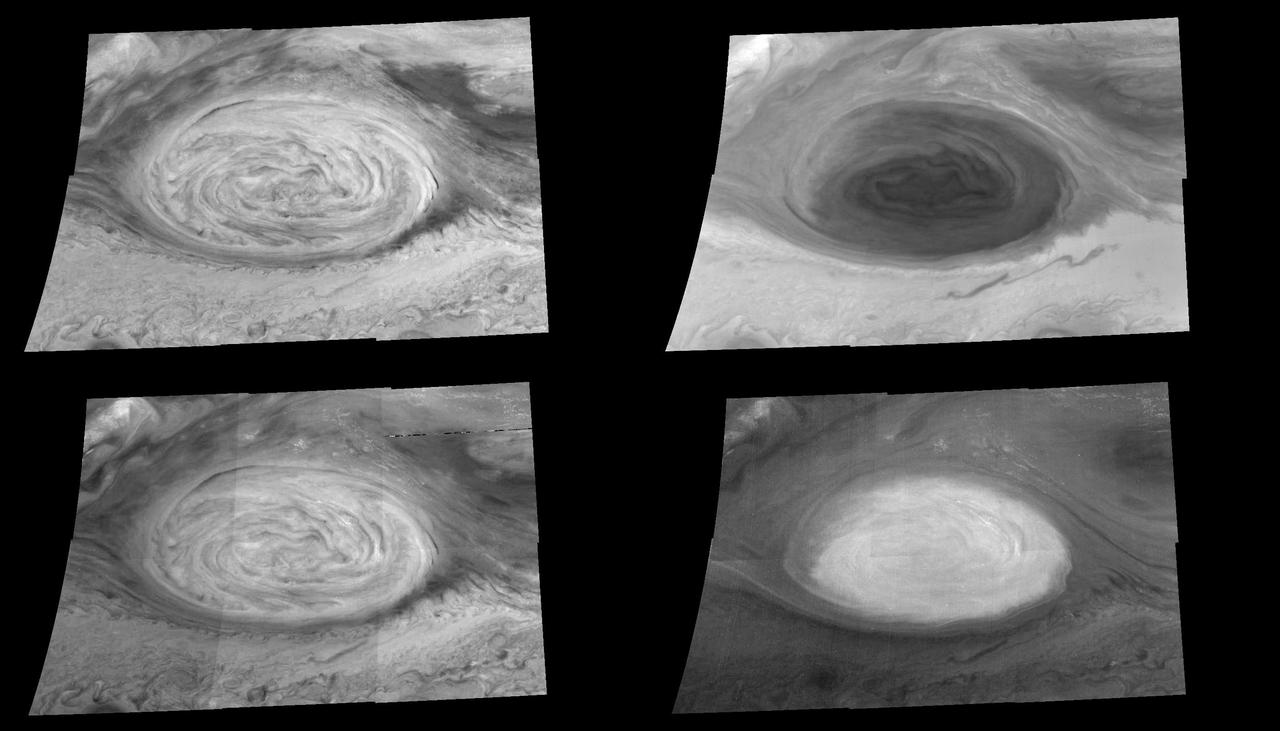
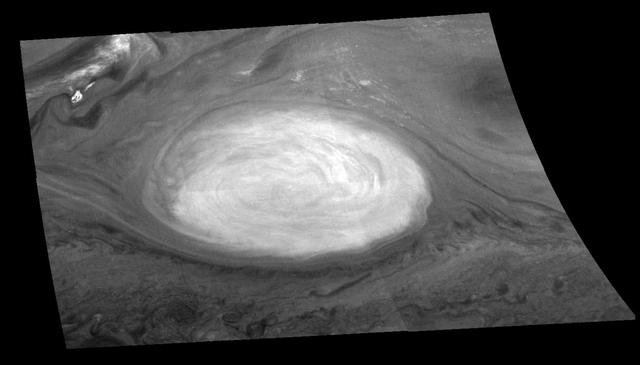
These mosaics 6 frames each show the appearance of the Great Red Spot in infrared light obtained on June 26, 1996 by the Solid State Imaging system on board NASA Galileo spacecraft.
This image is a still frame, created from images taken by NASA Cassini spacecraft, shows small spots slipping over each other east of Jupiter Great Red Spot.
This photo, taken on Jan. 9, 1979 by NASA Voyager 1, is dominated by the Great Red Spot. Swirling, storm-like features possibly associated with wind shear can be seen both to the left and above the Red Spot.

This photo of Jupiter was taken by NASA Voyager 1 on March 1, 1979. The photo shows Jupiter Great Red Spot upper right and the turbulent region immediately to the west. http://photojournal.jpl.nasa.gov/catalog/PIA00359
This mosaic of the Great Red Spot on Jupiter from NASA Galileo orbiter was taken over a 75 second interval beginning at universal time 4 hours, 18 minutes, 8 seconds on June 26, 1996.
This mosaic of the Great Red Spot on Jupiter from NASA Galileo orbiter was taken over a 76 second interval beginning at universal time 14 hours, 31 minutes, 52 seconds on June 26, 1996.
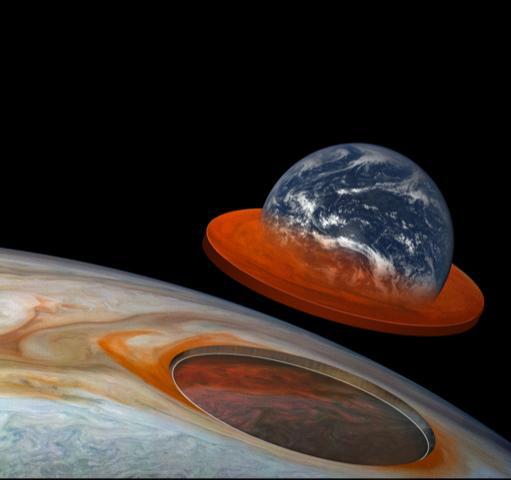
This illustration combines an image of Jupiter from the JunoCam instrument aboard NASA's Juno spacecraft with a composite image of Earth to depict the size and depth of Jupiter's Great Red Spot. https://photojournal.jpl.nasa.gov/catalog/PIA24817
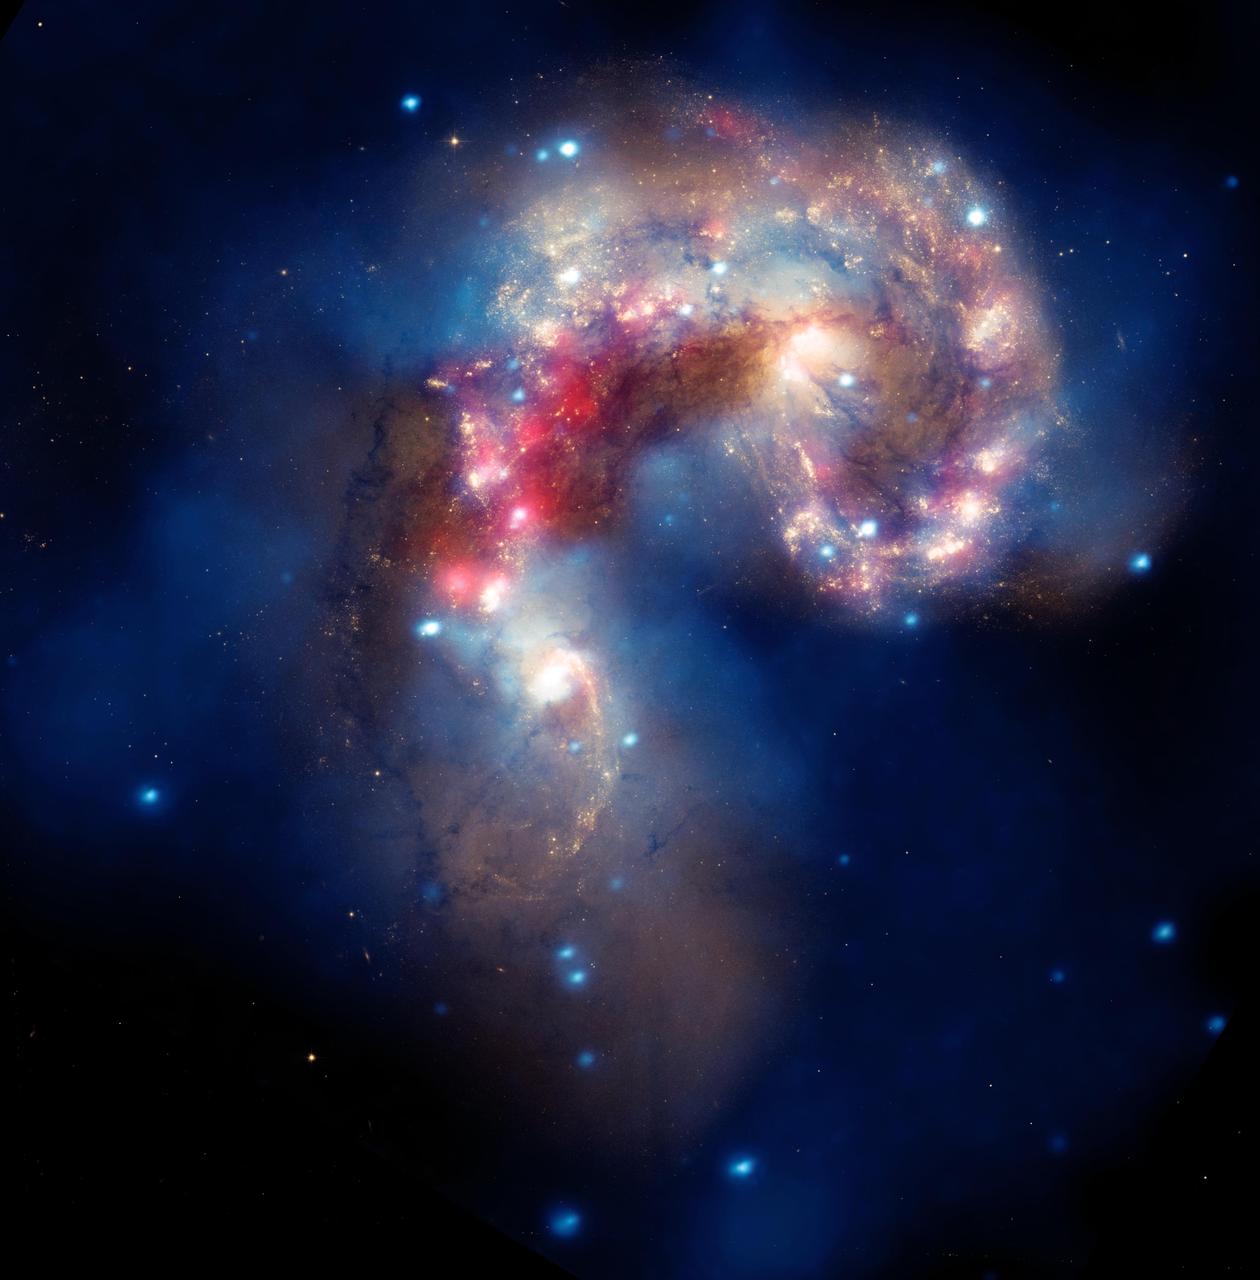
This image of two tangled galaxies has been released by NASA Great Observatories. The Antennae galaxies are shown in this composite image from the Chandra X-ray Observatory, the Hubble Space Telescope, and the Spitzer Space Telescope.
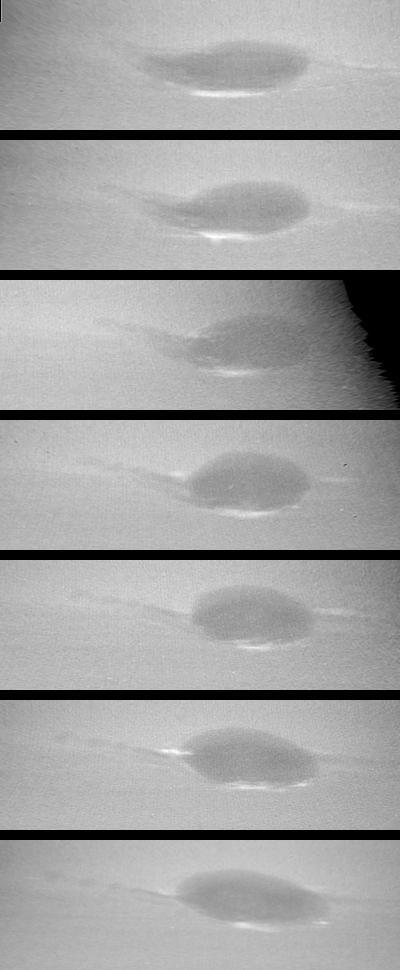
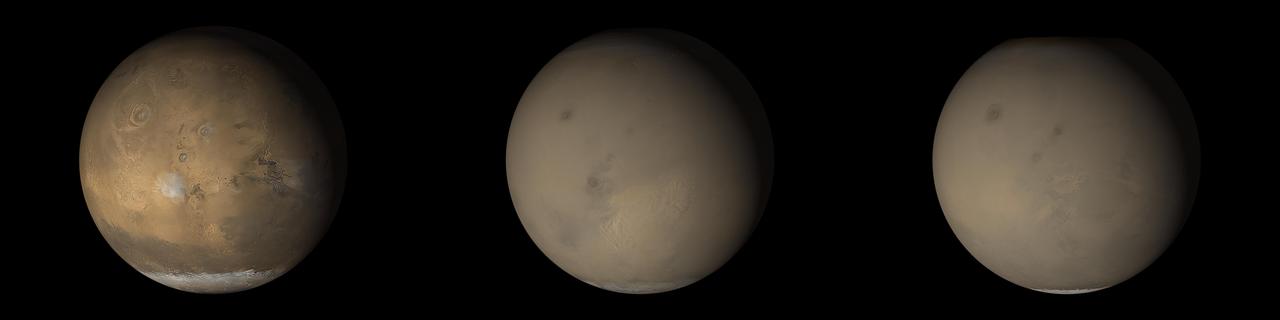
These images taken by NASA Voyager 2 show changes in the clouds around Neptune Great Dark Spot GDS over a four and one-half-day period. From top to bottom the images show successive rotations of the planet an interval of about 18 hours. http://photojournal.jpl.nasa.gov/catalog/PIA00045
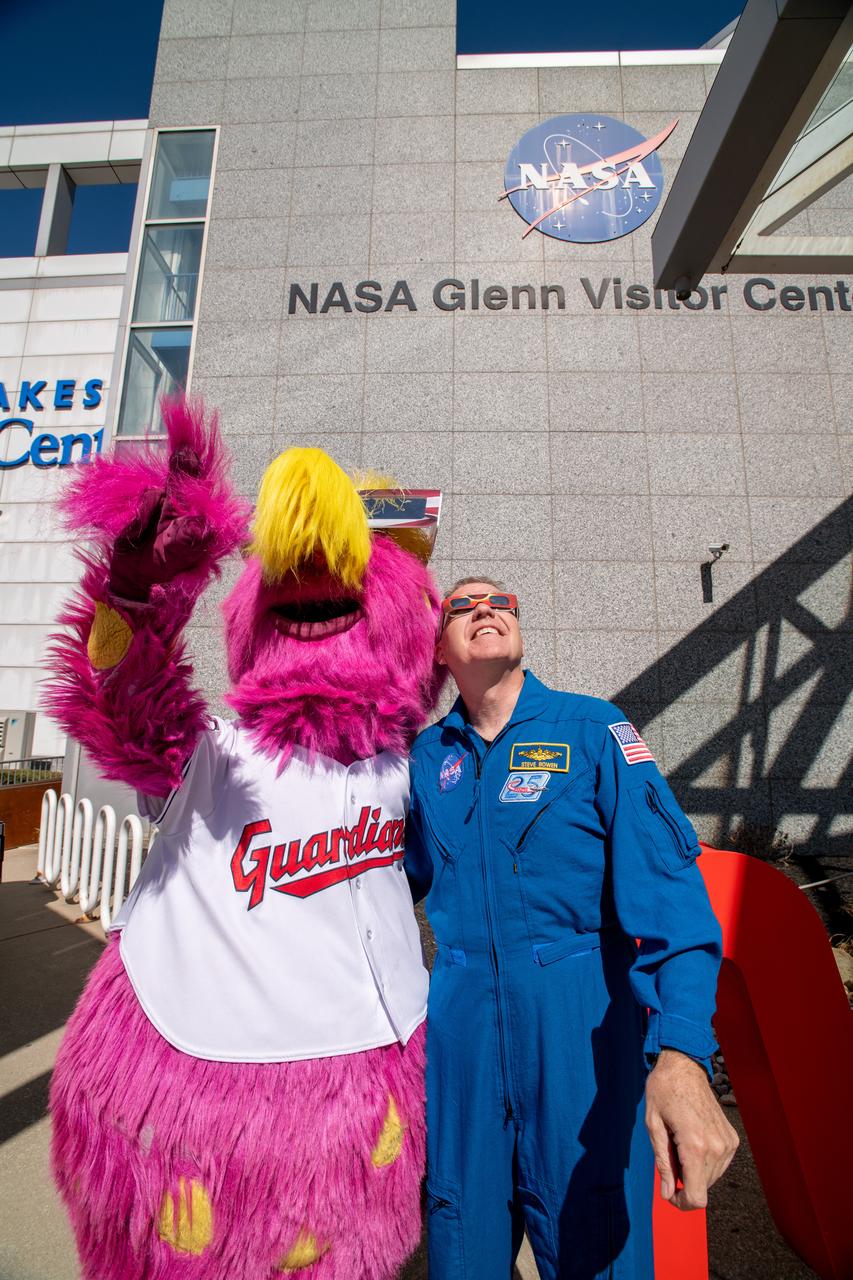
The Cleveland Guardians mascot, Slider and Astronaut Stephen Bowen view the solar eclipse at the Total Solar Eclipse Fest at the Great Lakes Science Center on April 6, 2024. A total solar eclipse swept across a narrow portion of the North American continent from Mexico’s Pacific coast to the Atlantic coast of Newfoundland, Canada. A partial solar eclipse was visible across the entire North American continent along with parts of Central America and Europe.
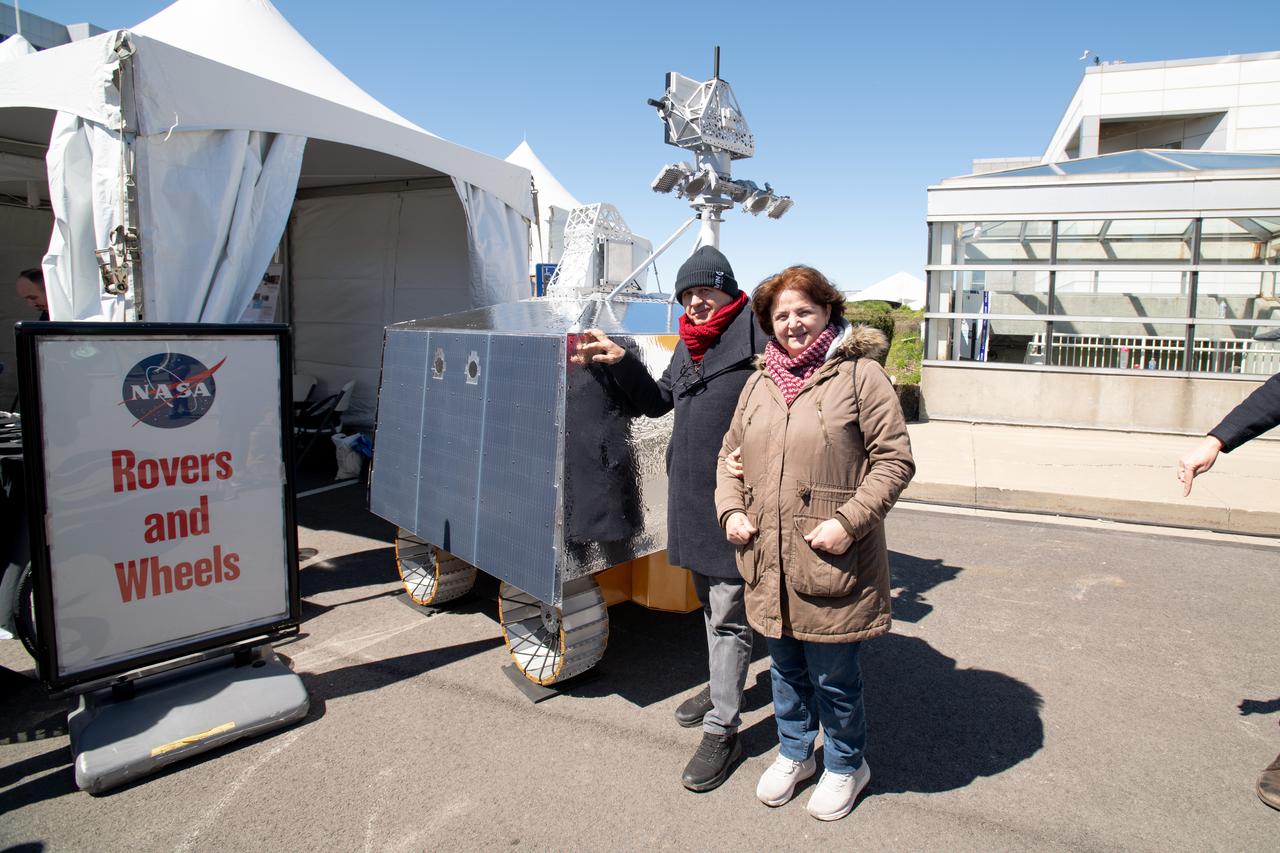
Event Attendees at pose in front of the VIPER model at the Total Eclipse Fest at the Great Lakes Science Center in Cleveland, OH April 6, 2024. A total solar eclipse swept across a narrow portion of the North American continent from Mexico’s Pacific coast to the Atlantic coast of Newfoundland, Canada. A partial solar eclipse was visible across the entire North American continent along with parts of Central America and Europe.

Guests pose for a photo at the Total Solar Eclipse Fest at the Great Lakes Science Center in Cleveland, OH April 6, 2024. A total solar eclipse swept across a narrow portion of the North American continent from Mexico’s Pacific coast to the Atlantic coast of Newfoundland, Canada. A partial solar eclipse was visible across the entire North American continent along with parts of Central America and Europe.
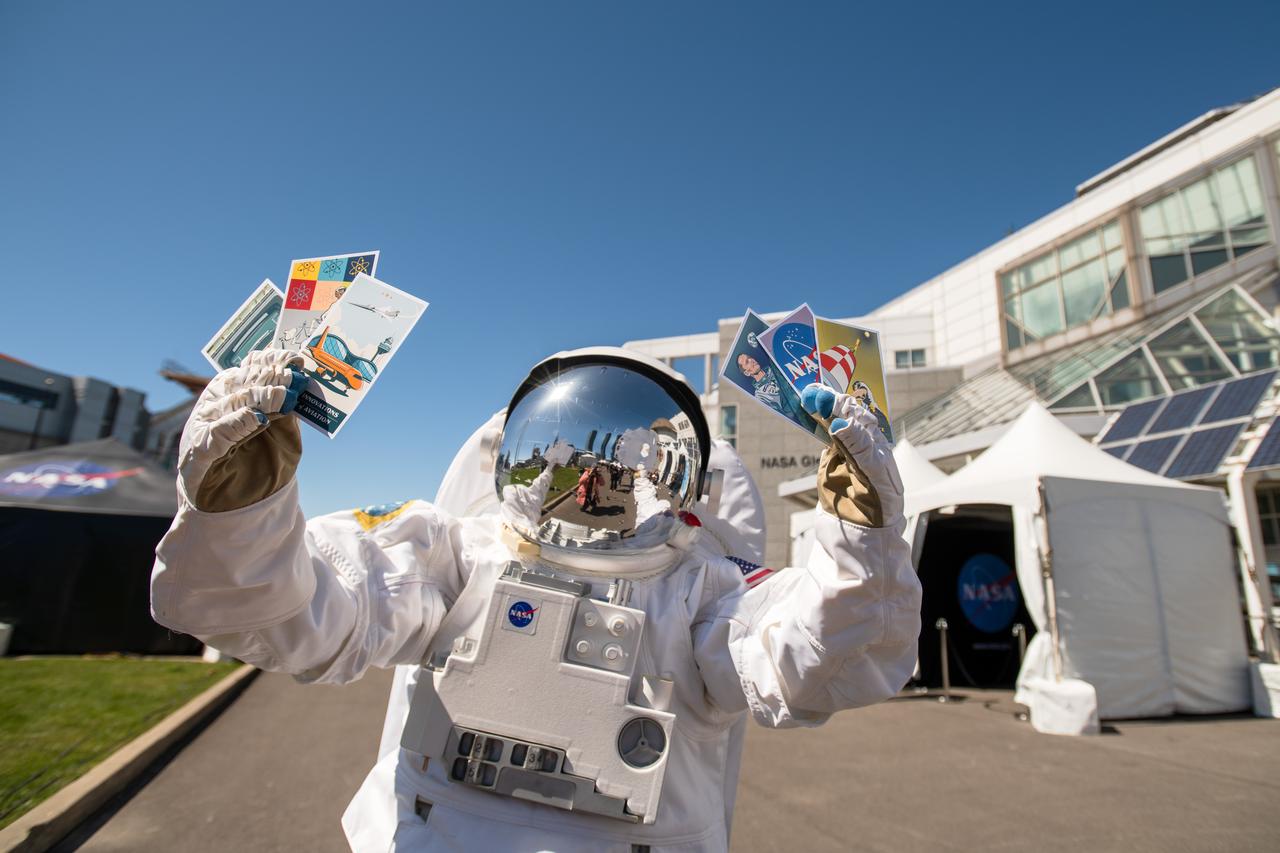
The astronaut mascot holds the 6 collectable postcards designed for the Total Eclipse Fest at the Great Lakes Science Center in Cleveland, OH on April 6, 2024. A total solar eclipse swept across a narrow portion of the North American continent from Mexico’s Pacific coast to the Atlantic coast of Newfoundland, Canada. A partial solar eclipse was visible across the entire North American continent along with parts of Central America and Europe.
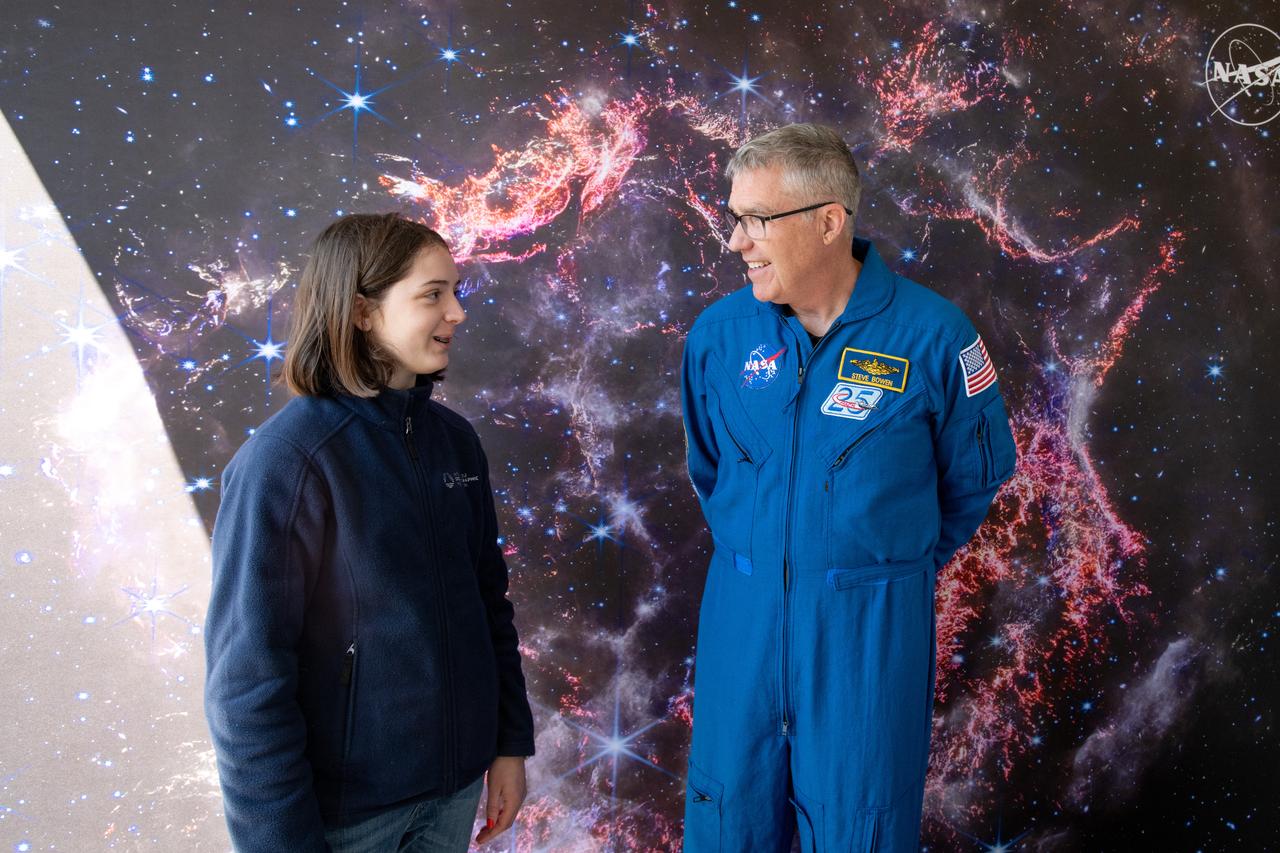
A guest interacts with Astronaut Stephen Bowen during meet and greets at the Total Eclipse Fest at the Great Lakes Science Center in Cleveland, OH on April 6, 2024. A total solar eclipse swept across a narrow portion of the North American continent from Mexico’s Pacific coast to the Atlantic coast of Newfoundland, Canada. A partial solar eclipse was visible across the entire North American continent along with parts of Central America and Europe.
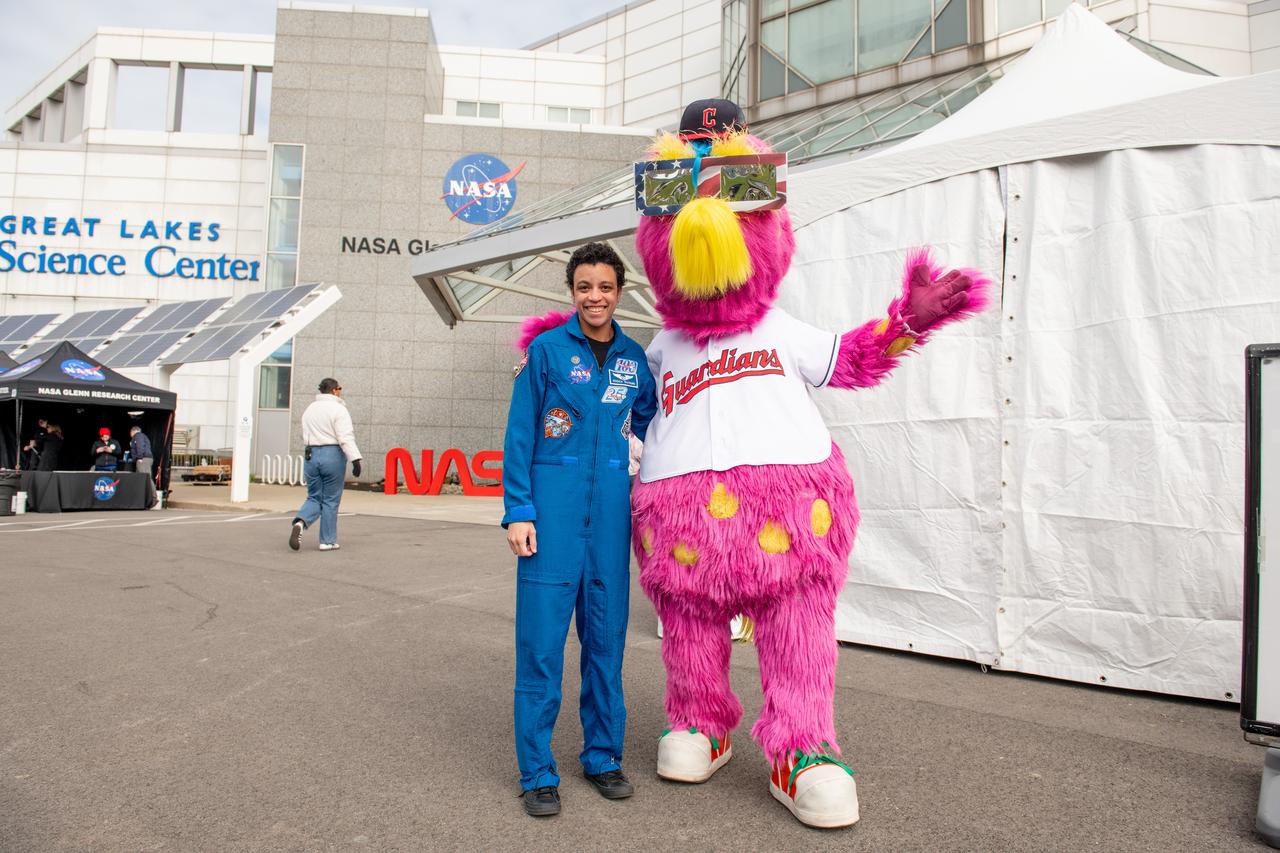
Astronaut Jessica Watkins and the Cleveland Guardians mascot, Slider pose together at Total Solar Eclipse Fest at the Great Lakes Science Center on April 6, 2024. A total solar eclipse swept across a narrow portion of the North American continent from Mexico’s Pacific coast to the Atlantic coast of Newfoundland, Canada. A partial solar eclipse was visible across the entire North American continent along with parts of Central America and Europe.
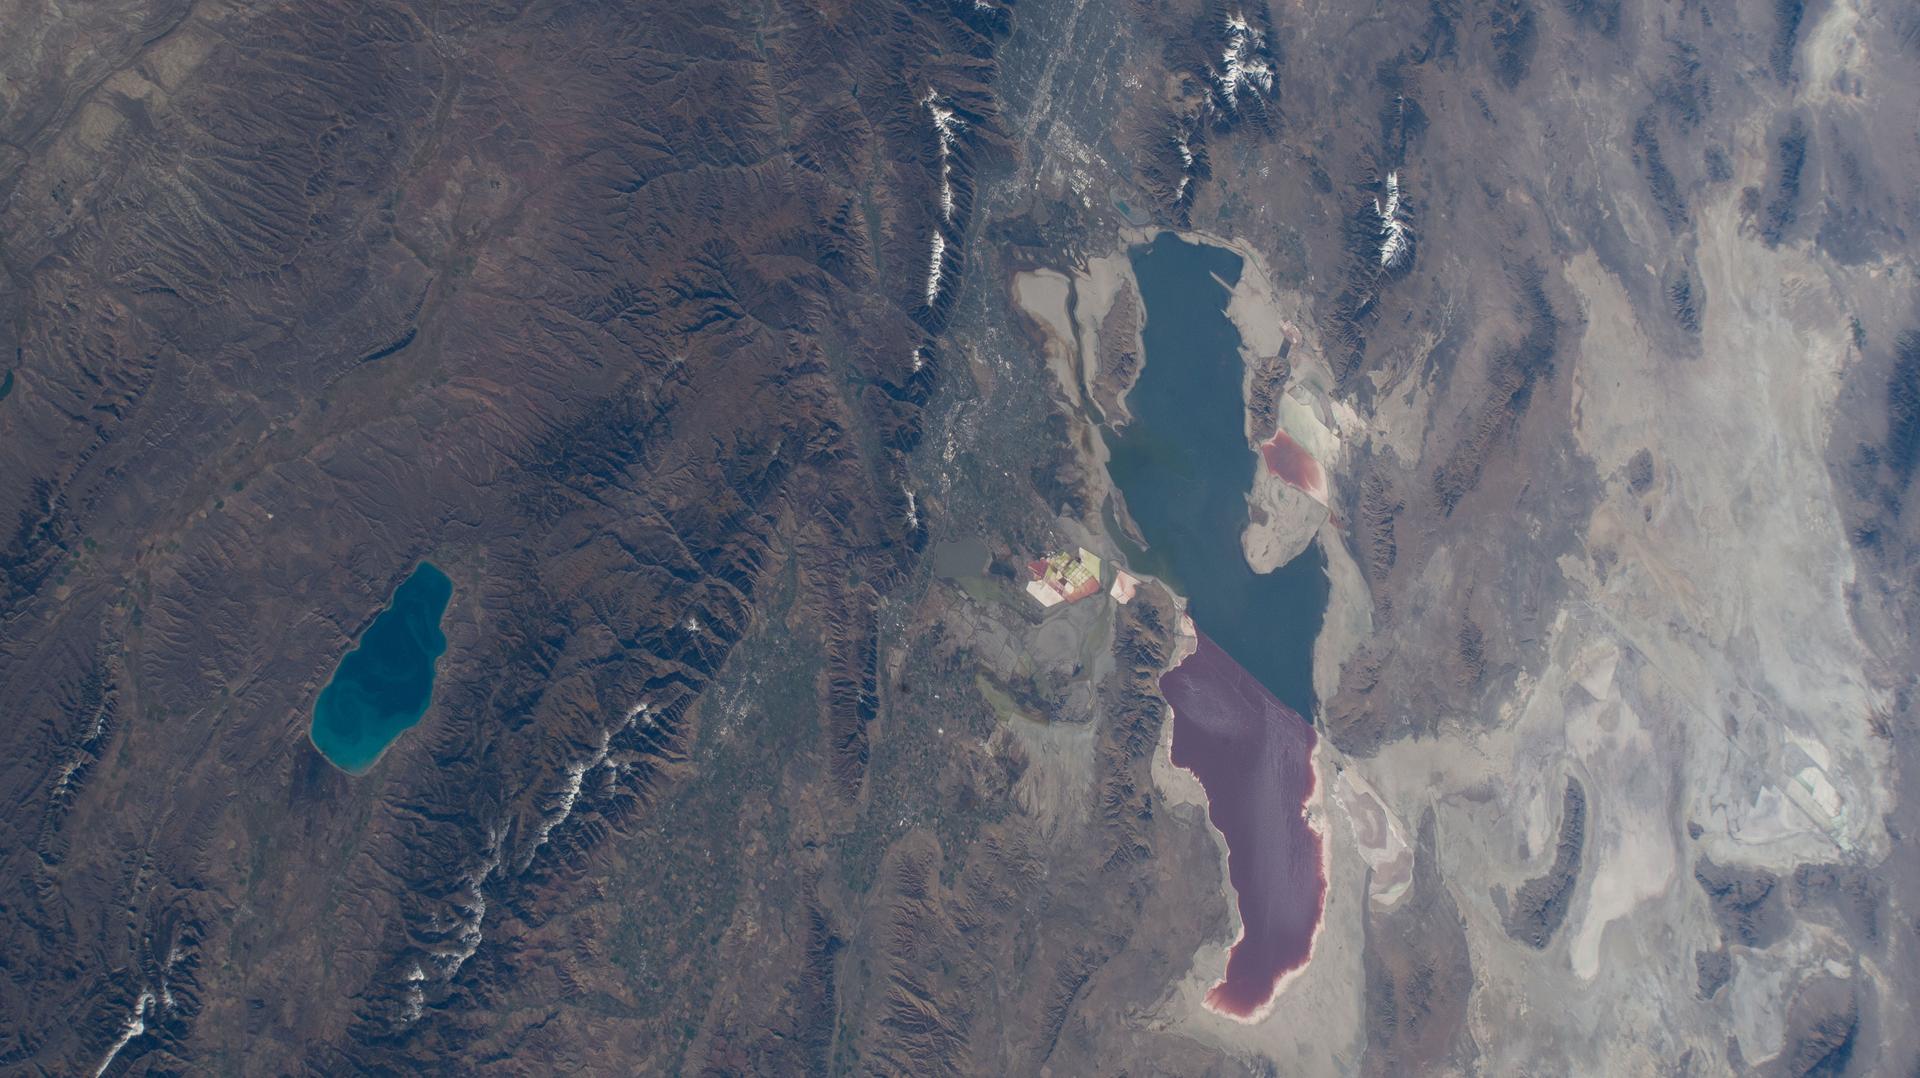
iss073e0865636 (Oct. 7, 2025) --- Bear Lake (left) is a freshwater lake spanning Idaho and Utah, and is smaller and much deeper than Utah's Great Salt Lake—averaging 208 feet compared to just 14 feet. The distinct color differences in the Great Salt Lake are caused by a railroad causeway: the red portion has much higher salinity than the blue, less saline section.