
This illustration depicts NASA's Juno spacecraft in orbit above Jupiter's Great Red Spot. https://photojournal.jpl.nasa.gov/catalog/PIA21770
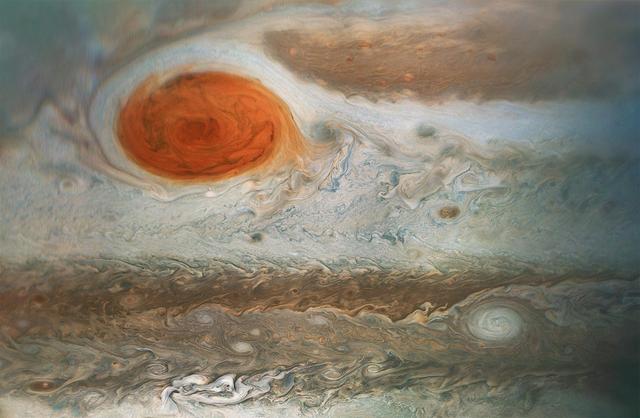
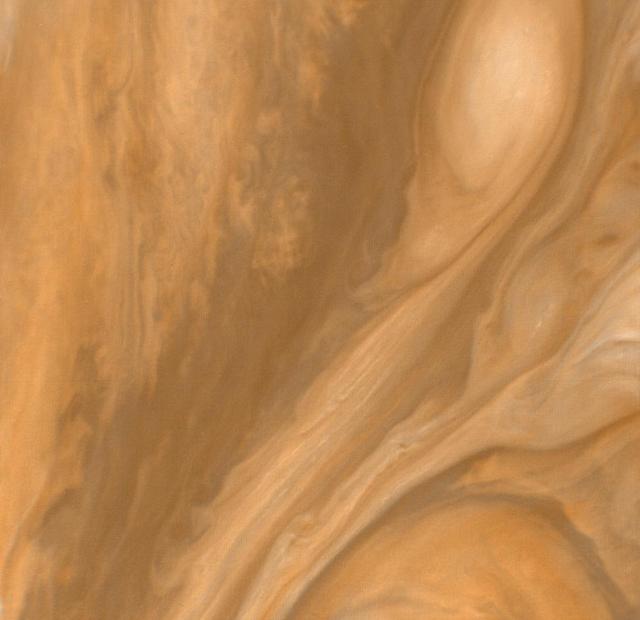
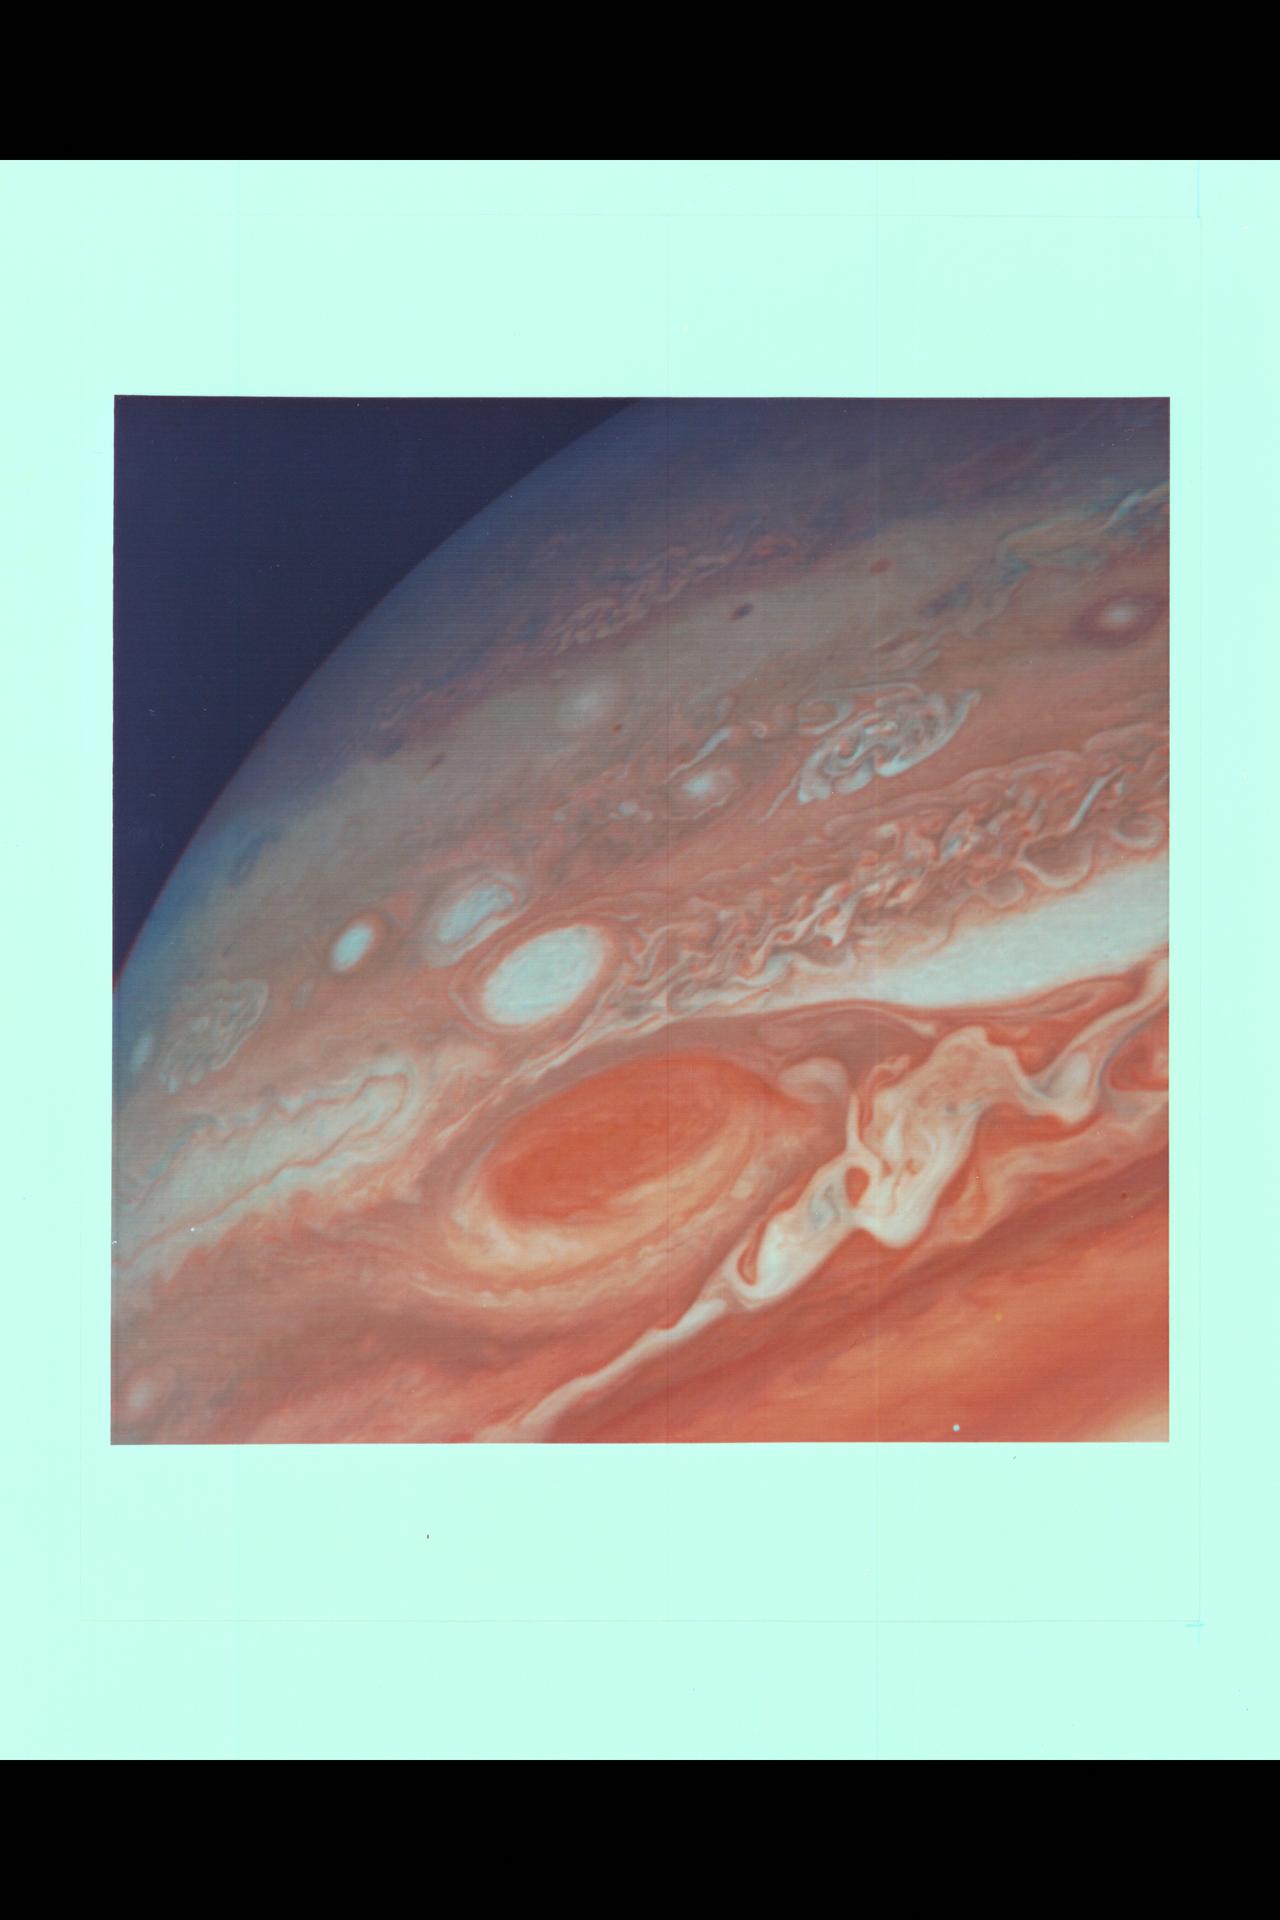
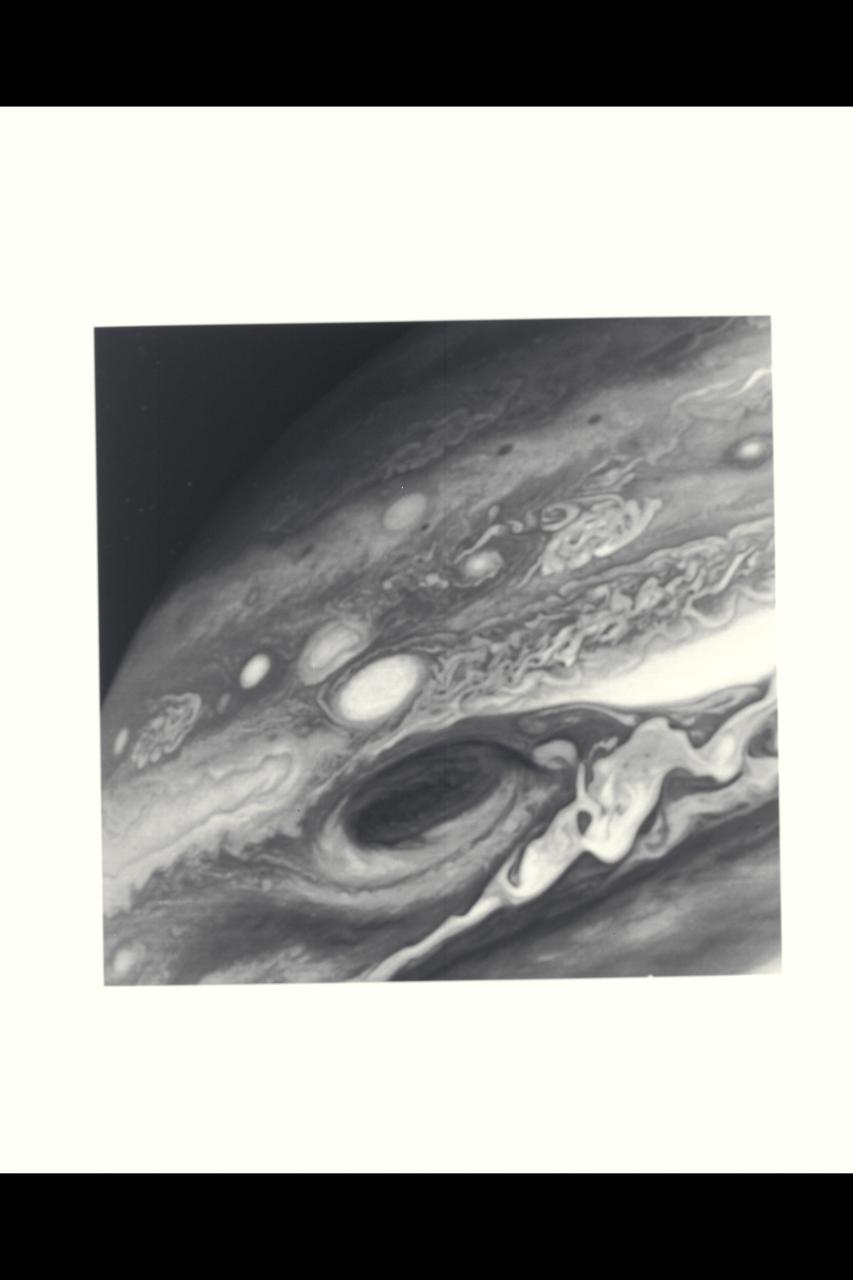
NASA Voyager 2 shows the Great Red Spot and the south equatorial belt extending into the equatorial region. At right is an interchange of material between the south equatorial belt and the equatorial zone. The clouds in the equatorial zone are more diffuse and do not display the structures seen in other locations. Considerable structure is evident within the Great Red Spot. http://photojournal.jpl.nasa.gov/catalog/PIA00456
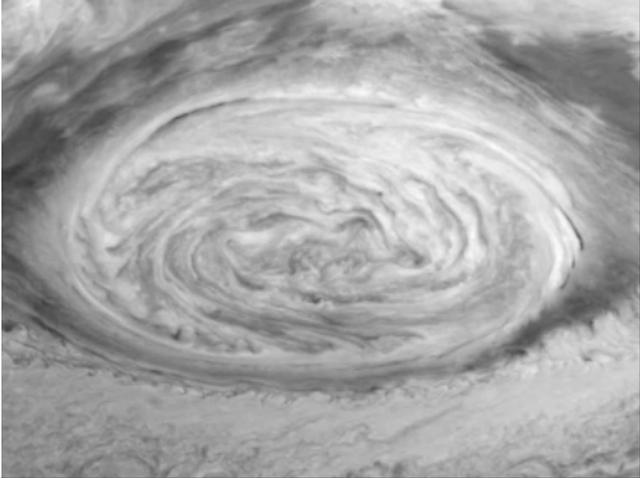
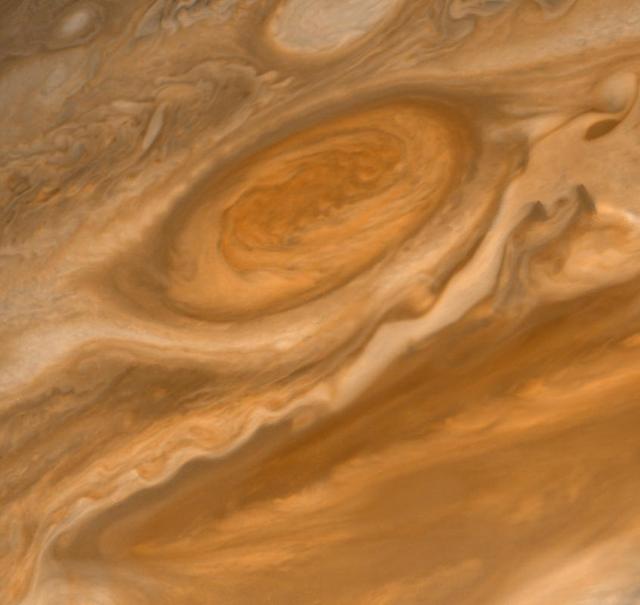
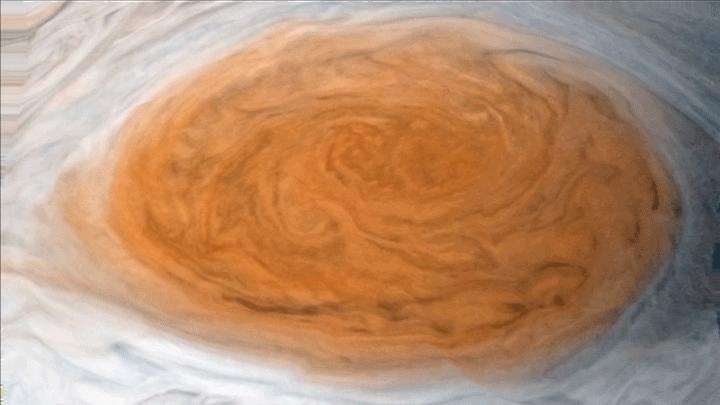
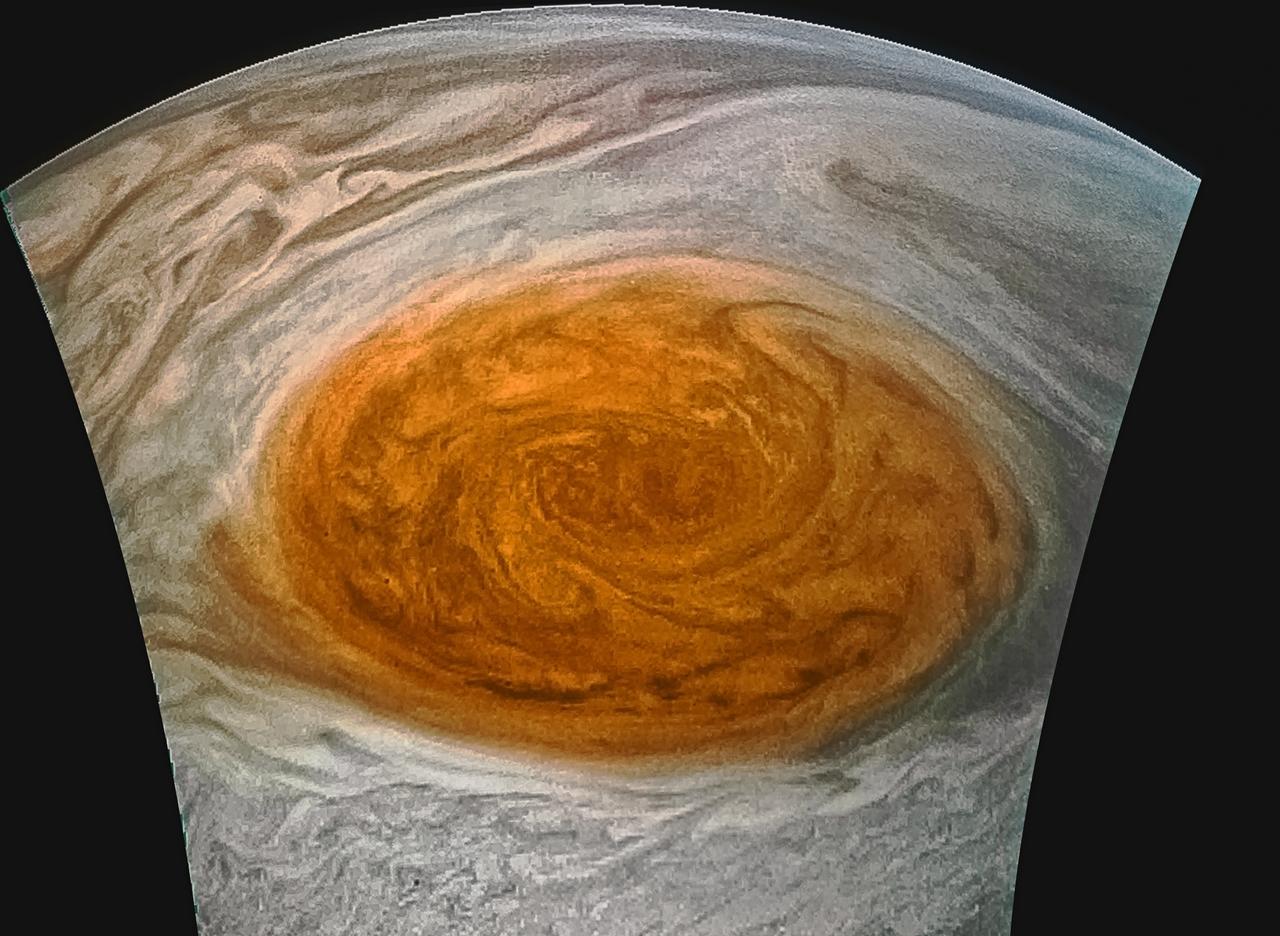
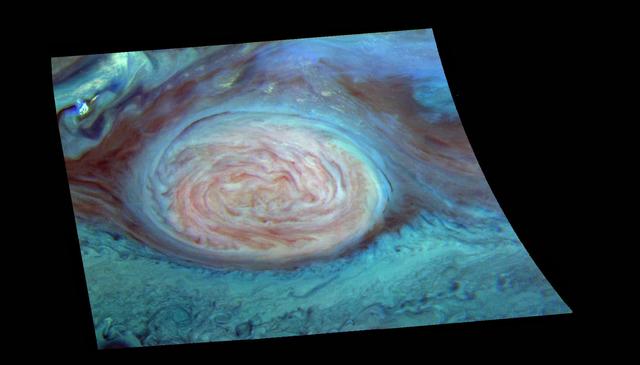
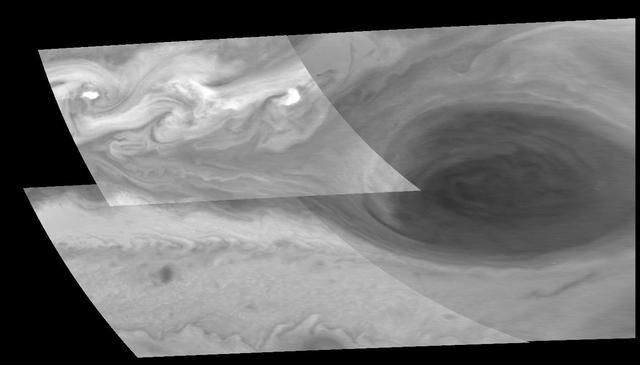
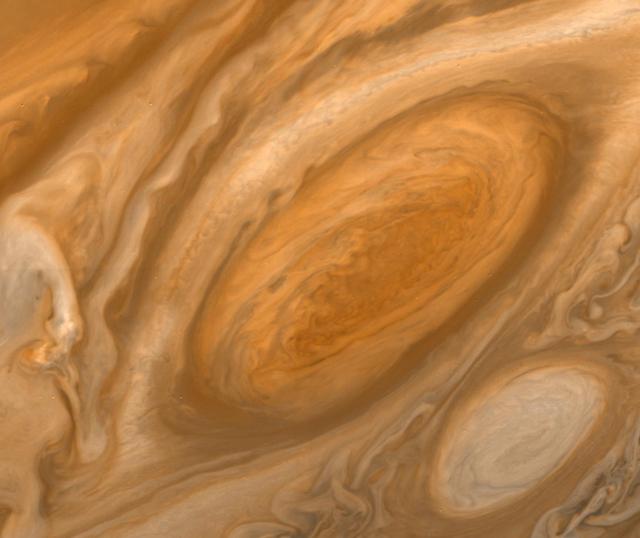
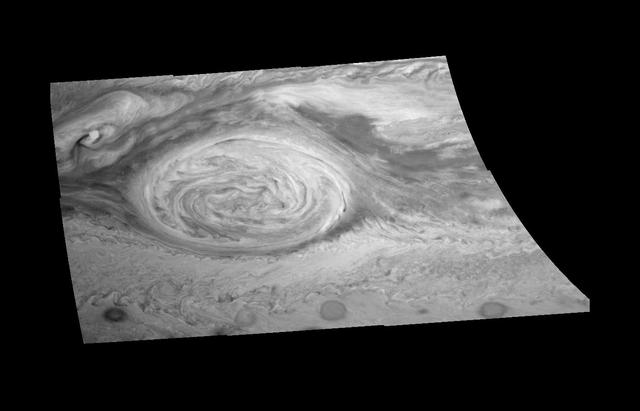
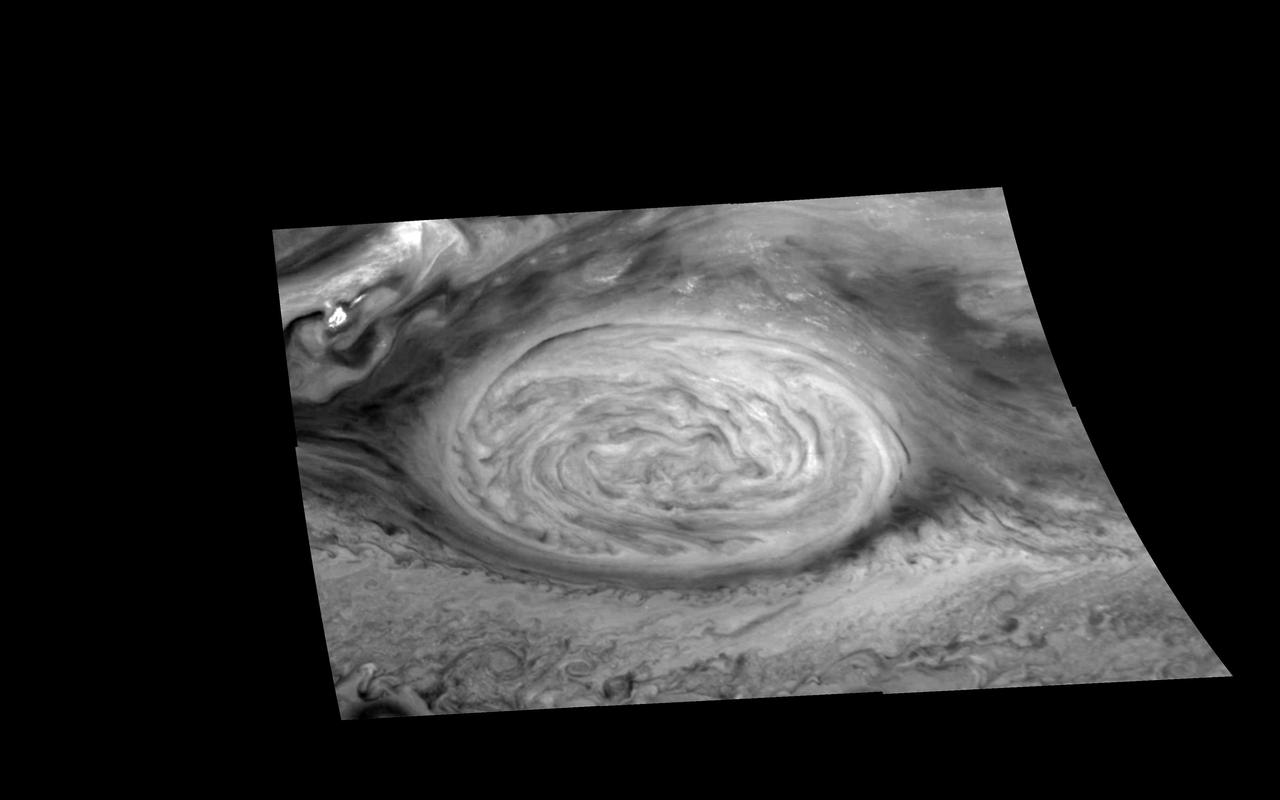
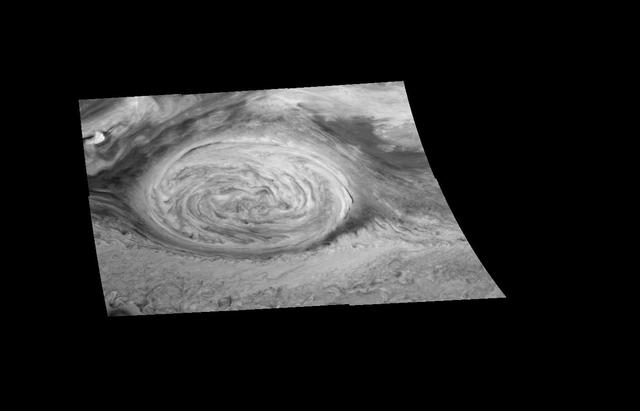
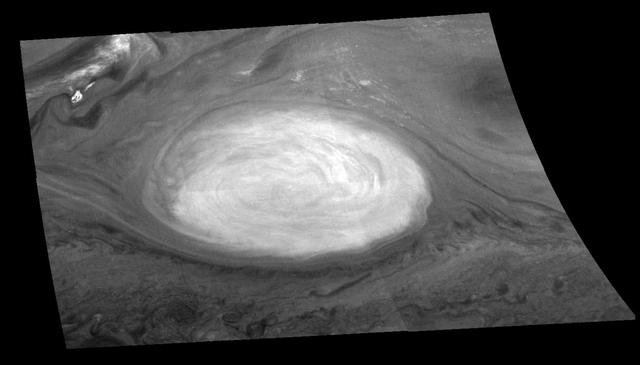
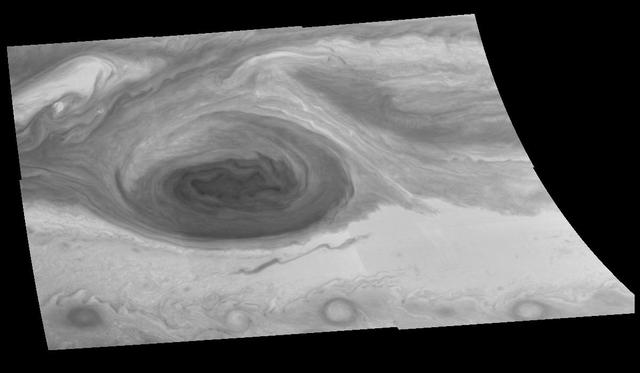
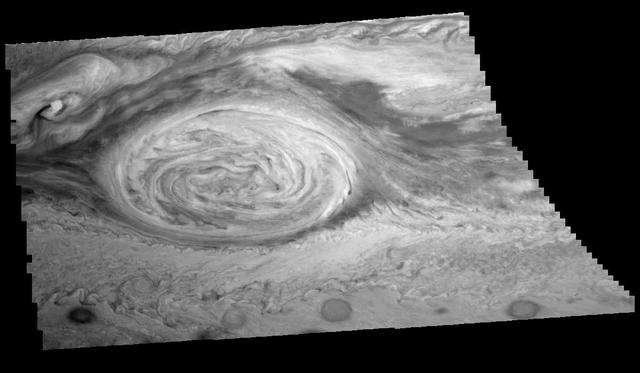
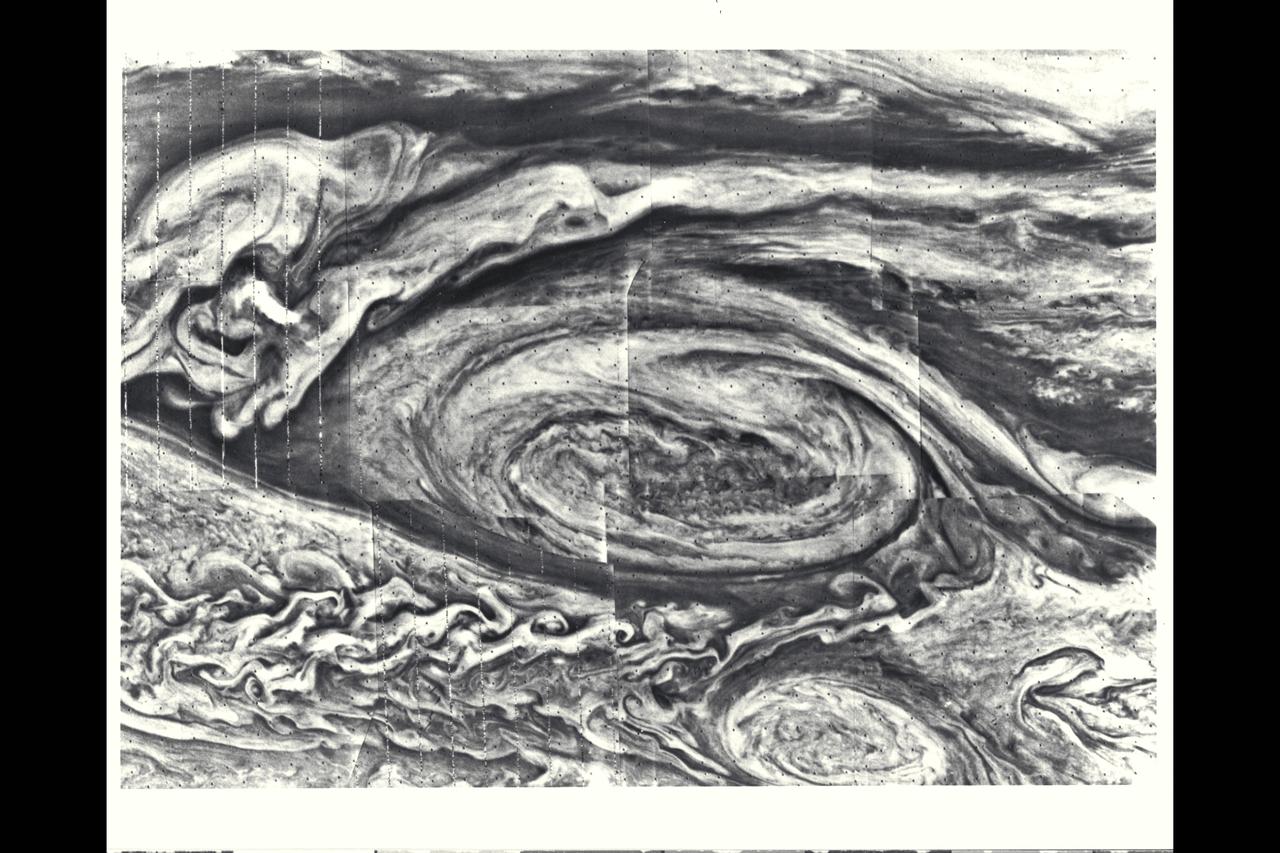
Dynamics of Jupiter's Great Red Spot in the NIR filter (756 nm) of the Galileo imaging system. Each of the three frames is a mosaic of six images that have been map-projected to a uniform grid of latitude and longitude. North is at the top. There is a nine-hour separation between the first two frames and seventy minutes between the next two. All of the images were taken on June 26, 1996. The Red Spot is 20,000 km long and has been followed by observers on Earth since the telescope was invented 300 years ago. It is a huge storm made visible by variations in the composition of the cloud particles and the amount of cloud cover. Winds in the outer part of the Red Spot reach 250 mph while the center remains quiescent. These Galileo data will help scientists understand what drives this storm and why it persists for so many years. http://photojournal.jpl.nasa.gov/catalog/PIA01083
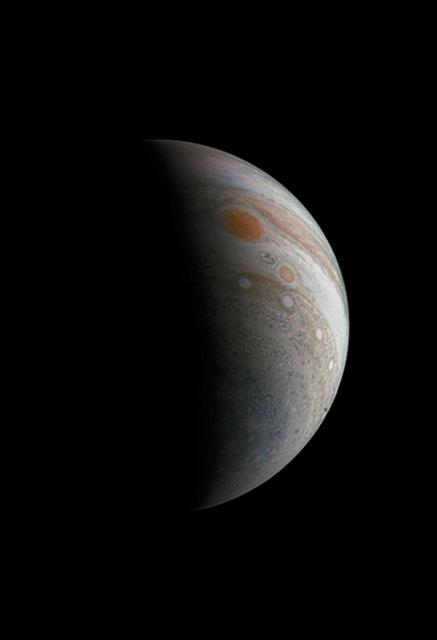
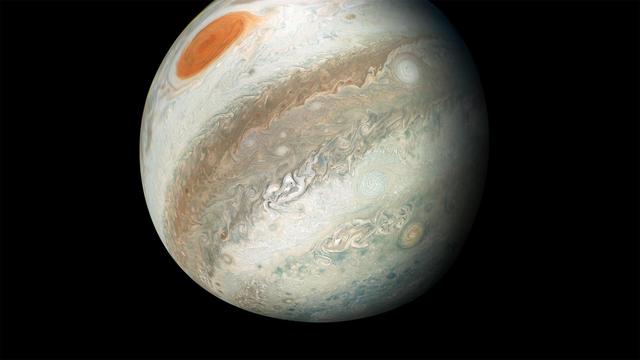
This image of a crescent Jupiter and the iconic Great Red Spot was created by a citizen scientist (Roman Tkachenko) using data from Juno's JunoCam instrument. You can also see a series of storms shaped like white ovals, known informally as the "string of pearls." Below the Great Red Spot a reddish long-lived storm known as Oval BA is visible. The image was taken on Dec. 11, 2016 at 2:30 p.m. PST (5:30 p.m. EST), as the Juno spacecraft performed its third close flyby of Jupiter. At the time the image was taken, the spacecraft was about 285,100 miles (458,800 kilometers) from the planet. http://photojournal.jpl.nasa.gov/catalog/PIA21376 . - Enhanced image by Roman Tkachenko (CC-BY) based on images provided courtesy of NASA/JPL-Caltech/SwRI/MSSS

This frame from an animation takes the viewer on a simulated flight into, and then out of, Jupiter's upper atmosphere at the location of the Great Red Spot. The perspective begins about 2,000 miles (3,000 kilometers) above the cloud tops of the planet's southern hemisphere. The bar at far left indicates altitude during the quick descent; a second gauge next to that depicts the dramatic increase in temperature that occurs as the perspective dives deeper down. The clouds turn crimson as the perspective passes through the Great Red Spot. Finally, the view ascends out of the spot. This video was created by combining an image from the JunoCam imager on NASA's Juno spacecraft with a computer-generated animation. The animation is available at https://photojournal.jpl.nasa.gov/catalog/PIA22176. - Enhanced image by Gerald Eichstädt / Justin Cowart based on images provided courtesy of NASA/JPL-Caltech/SwRI/MSSS
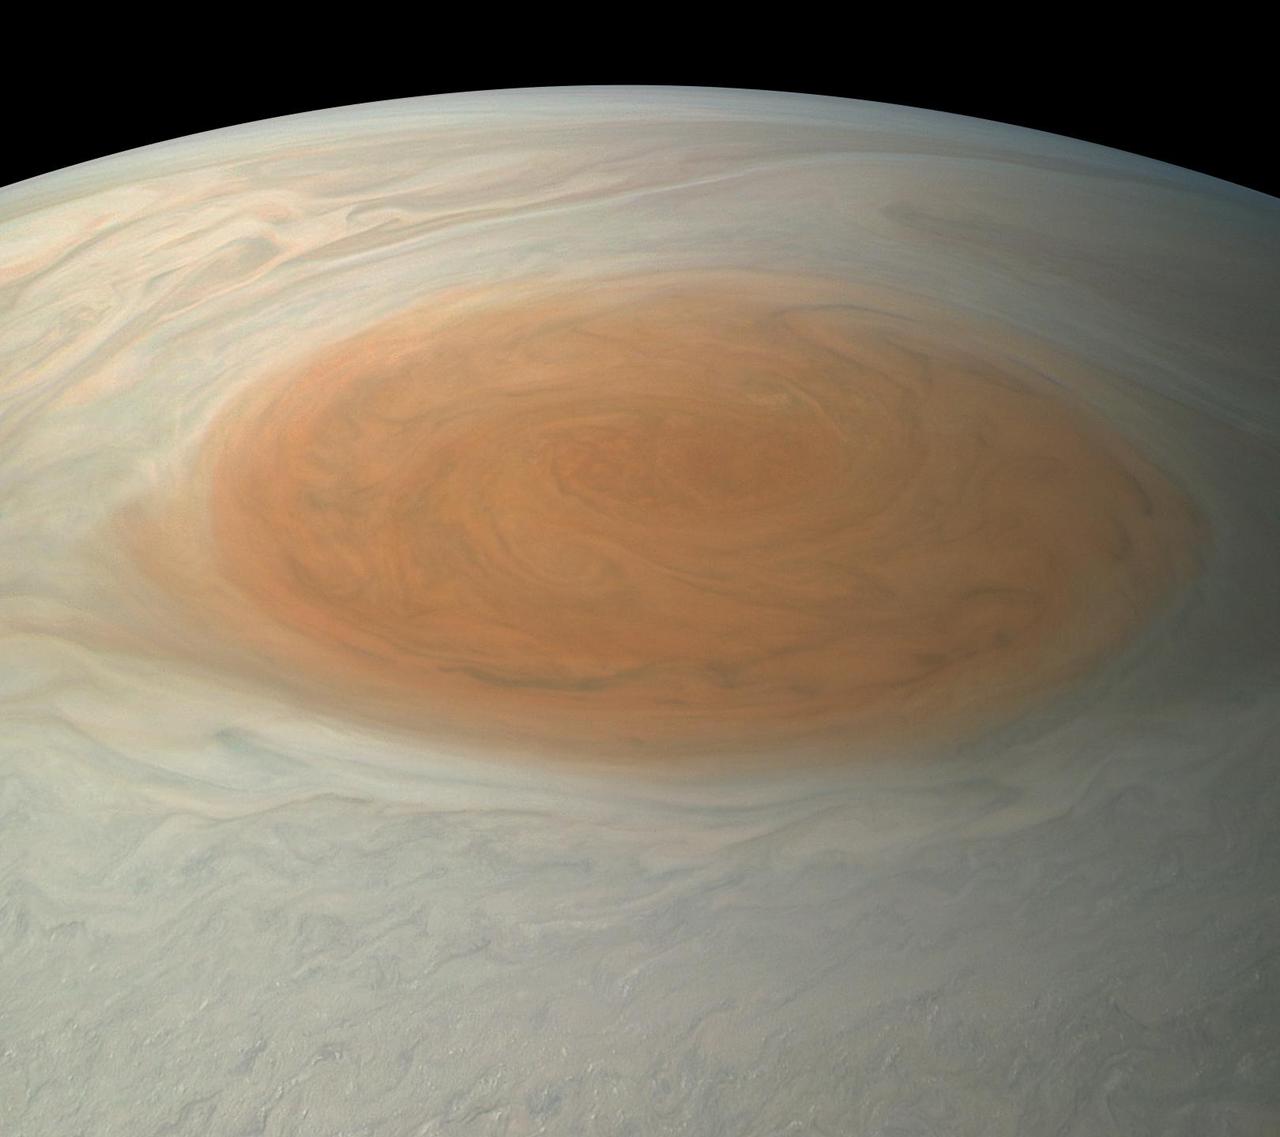
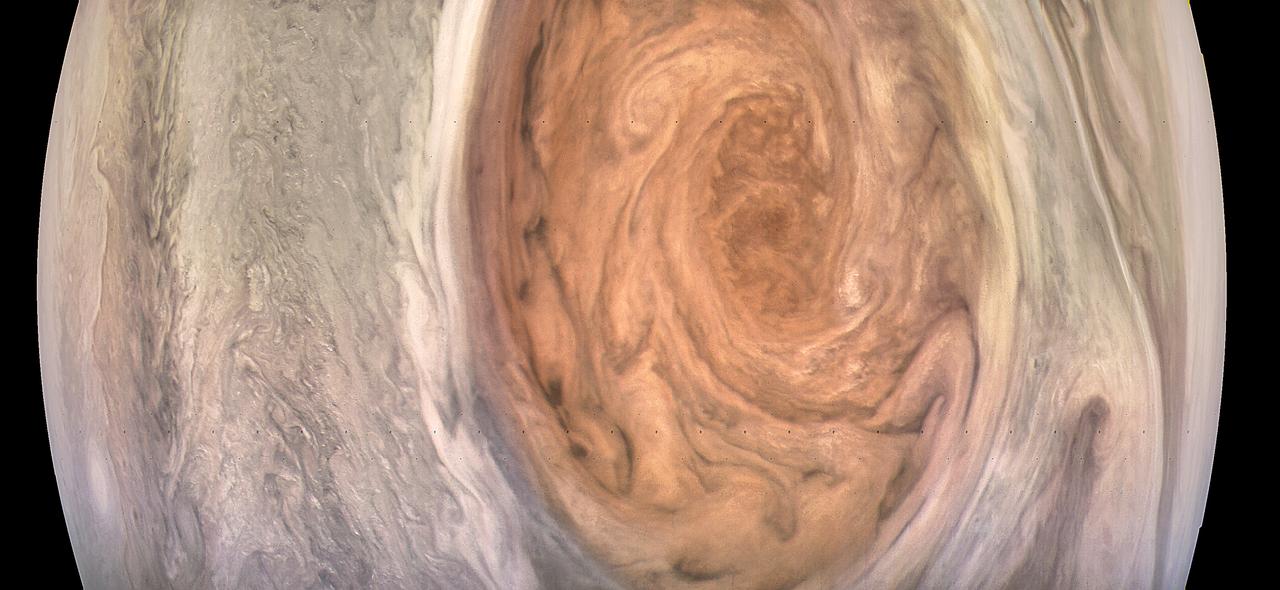
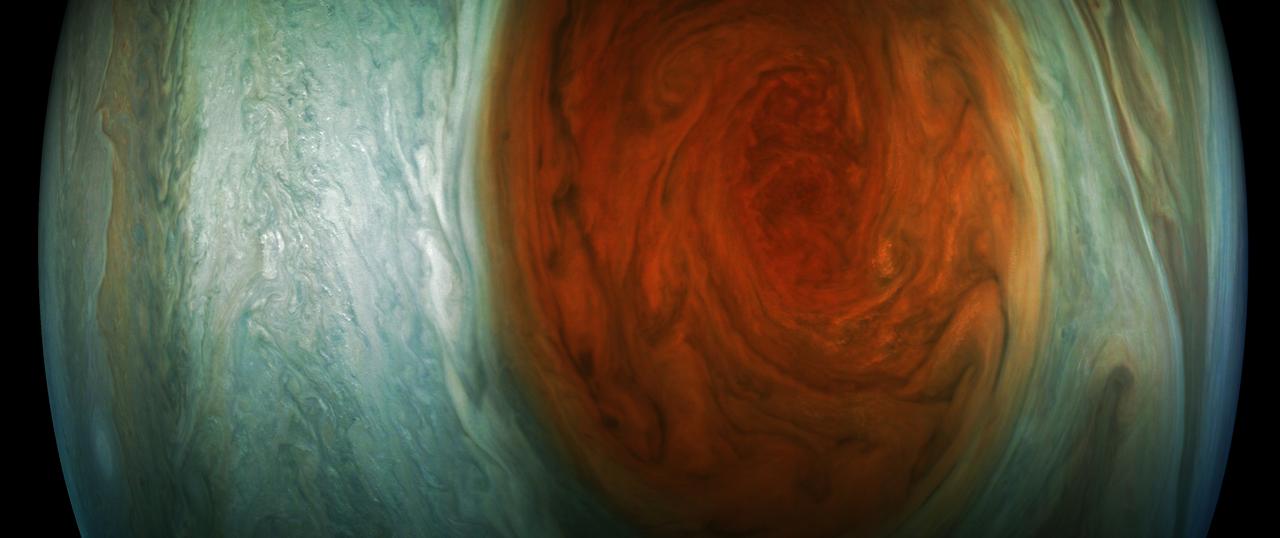
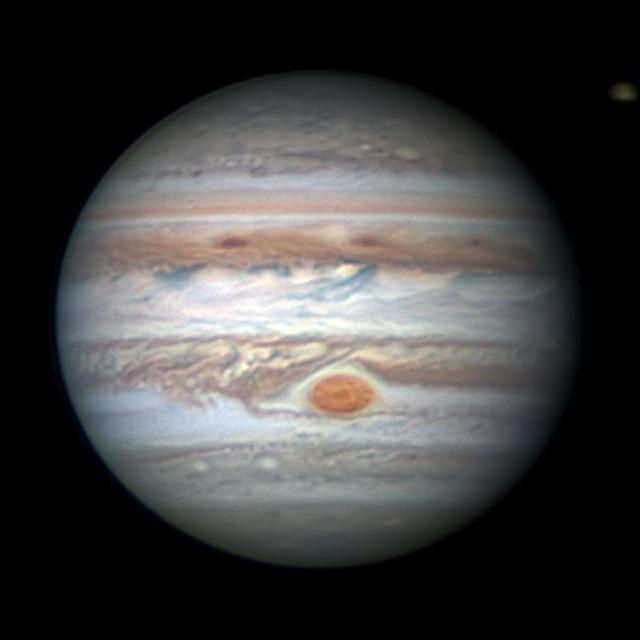
This image of Jupiter's iconic Great Red Spot (GRS) was created by citizen scientist Björn Jónsson using data from the JunoCam imager on NASA's Juno spacecraft. This true-color image offers a natural color rendition of what the Great Red Spot and surrounding areas would look like to human eyes from Juno's position. The tumultuous atmospheric zones in and around the Great Red Spot are clearly visible. The image was taken on July 10, 2017 at 07:10 p.m. PDT (10:10 p.m. EDT), as the Juno spacecraft performed its seventh close flyby of Jupiter. At the time the image was taken, the spacecraft was about 8,648 miles (13,917 kilometers) from the tops of the clouds of the planet at a latitude of -32.6 degrees. https://photojournal.jpl.nasa.gov/catalog/PIA21775. - Enhanced image by Björn Jónsson (CC-NC-SA) based on images provided courtesy of NASA/JPL-Caltech/SwRI/MSSS
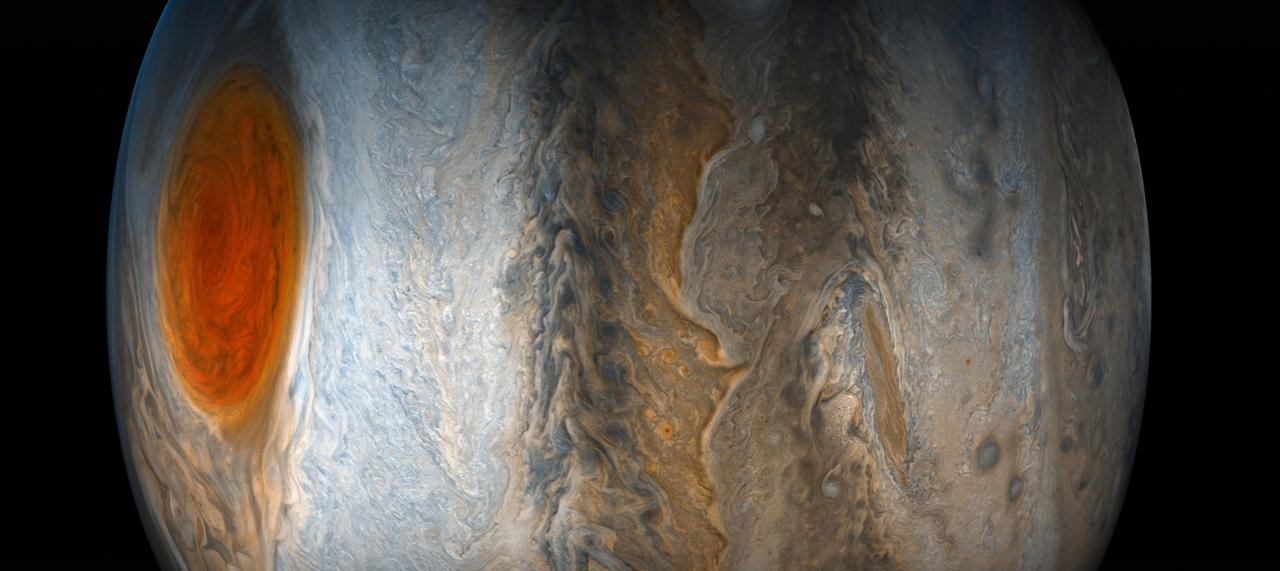
This image of Jupiter's iconic Great Red Spot and surrounding turbulent zones was captured by NASA's Juno spacecraft. The color-enhanced image is a combination of three separate images taken on April 1 between 3:09 a.m. PDT (6:09 a.m. EDT) and 3:24 a.m. PDT (6:24 a.m. EDT), as Juno performed its 12th close flyby of Jupiter. At the time the images were taken, the spacecraft was 15,379 miles (24,749 kilometers) to 30,633 miles (49,299 kilometers) from the tops of the clouds of the planet at a southern latitude spanning 43.2 to 62.1 degrees. Citizen scientists Gerald Eichstädt and Seán Doran processed this image using data from the JunoCam imager. https://photojournal.jpl.nasa.gov/catalog/PIA21985
Winds around Jupiter's Great Red Spot are simulated in this JunoCam view that has been animated using a model of the winds there. The wind model, called a velocity field, was derived from data collected by NASA's Voyager spacecraft and Earth-based telescopes. NASA's Juno spacecraft acquired the original, static view during passage over the spot on July 10, 2017. Citizen scientists Gerald Eichstädt and Justin Cowart turned the JunoCam data into a color image mosaic. Juno scientists Shawn Ewald and Andrew Ingersoll applied the velocity data to the image to produce a looping animation. An animation is available at https://photojournal.jpl.nasa.gov/catalog/PIA22178
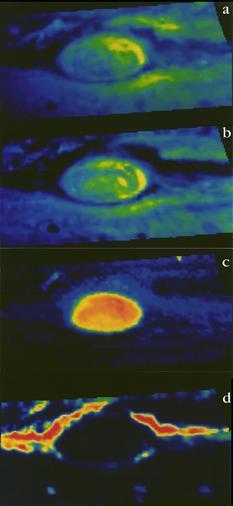
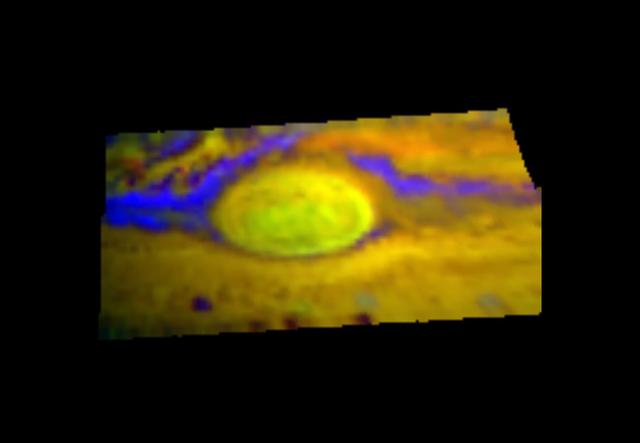
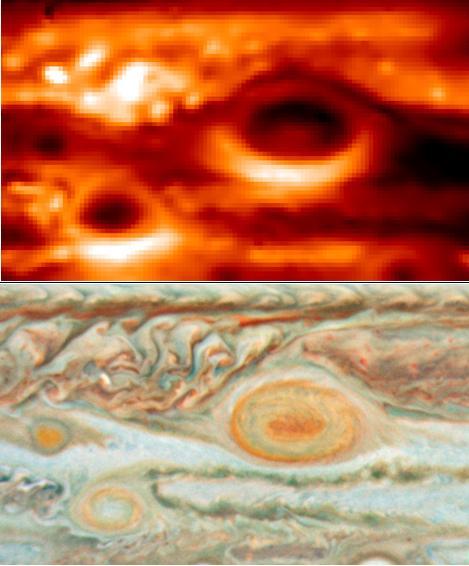
The Near-Infrared Mapping Spectrometer (NIMS) instrument looks at Jupiter's Great Red Spot, in these views from June 26, 1996. NIMS studies infrared wavelengths of light that our eye cannot see. These maps are at four different infrared wavelengths, each one picked to reveal something different about the atmosphere. The top image is a false color map of a wavelength that is at the red edge of our ability to see. It shows the shapes of features that we would see with our eyes. The second map is of ammonia ice, red showing where the most ice is, blue where none exists. The differences between this and the first image are due to the amount and size of ammonia ice crystals. The third map down is from a wavelength that shows cloud heights, with the highest clouds in red, and the lowest in blue. The bottom map uses a wavelength that shows the hot Jupiter shining through the clouds. Red represents the thinnest clouds, and blue is thickest where it is more difficult to see below. Comparing the bottom two images, note that the highest clouds are in the center of the Great Red Spot, while there are relatively few clouds around the edges. http://photojournal.jpl.nasa.gov/catalog/PIA00501

Jupiter Great Red Spot
This enhanced-color image of Jupiter's Great Red Spot was created by citizen scientist Kevin Gill using data from the JunoCam imager on NASA's Juno spacecraft. The image was taken on July 10, 2017 at 07:07 p.m. PDT (10:07 p.m. EDT), as the Juno spacecraft performed its 7th close flyby of Jupiter. At the time the image was taken, the spacecraft was about 6,130 miles (9,866 kilometers) from the tops of the clouds of the planet. https://photojournal.jpl.nasa.gov/catalog/PIA21395 . - Enhanced image by Kevin M. Gill (CC-BY) based on images provided courtesy of NASA/JPL-Caltech/SwRI/MSSS
This enhanced-color image of Jupiter's Great Red Spot was created by citizen scientist Gerald Eichstädt using data from the JunoCam imager on NASA's Juno spacecraft. The image was taken on July 10, 2017 at 07:10 p.m. PDT (10:10 p.m. EDT), as the Juno spacecraft performed its 7th close flyby of Jupiter. At the time the image was taken, the spacecraft was about 8,648 miles (13,917 kilometers) from the tops of the clouds of the planet. https://photojournal.jpl.nasa.gov/catalog/PIA21772. - Enhanced image by Gerald Eichstädt based on images provided courtesy of NASA/JPL-Caltech/SwRI/MSSS
This enhanced-color image of Jupiter's Great Red Spot was created by citizen scientist Jason Major using data from the JunoCam imager on NASA's Juno spacecraft. The image was taken on July 10, 2017 at 07:10 p.m. PDT (10:10 p.m. EDT), as the Juno spacecraft performed its 7th close flyby of Jupiter. At the time the image was taken, the spacecraft was about 8,648 miles (13,917 kilometers) from the tops of the clouds of the planet. https://photojournal.jpl.nasa.gov/catalog/PIA21772 . - Enhanced image by Jason Major based on images provided courtesy of NASA/JPL-Caltech/SwRI/MSSS

Jupiter - Southeast of Great Red Spot
This image is one of two images from NASA Hubble Space Telescope comparing the movement of Jupiter clouds. The movement of Jupiter's clouds can be seen by comparing the first map to the second one in this animated pair of images. Zooming in on the Great Red Spot at blue (below, at left) and red (below, at right) wavelengths reveals a unique filamentary feature not previously seen. http://photojournal.jpl.nasa.gov/catalog/PIA19648

This false-color image of Jupiter was taken on May 18, 2017, with a mid-infrared filter centered at a wavelength of 8.8 microns, at the Subaru Telescope in Hawaii, in collaboration with observations of Jupiter by NASA's Juno mission. The selected wavelength is sensitive to Jupiter's tropospheric temperatures and the thickness of a cloud near the condensation level of ammonia gas. The Great Red Spot appears distinctively at the lower center of the planet as a cold region with a thick cloud layer. It is surrounded by a warm and relatively clear periphery. To its northwest is a turbulent and chaotic region where bands of gas that is warm and dry alternate with bands of gas that is cold and moist. This image, taken a few hours before Juno's sixth close approach to Jupiter, shows the detailed atmospheric structure of the Great Red Spot and its surroundings that the Juno mission will encounter on its seventh closest approach to Jupiter on July 10, 2017, Pacific Time (July 11, Universal Time). The instrument used to take this image is Cooled Mid-Infrared Camera and Spectrometer (COMICS) of the National Astronomical Observatory of Japan's Subaru Telescope on Hawaii's Maunakea peak. https://photojournal.jpl.nasa.gov/catalog/PIA21714
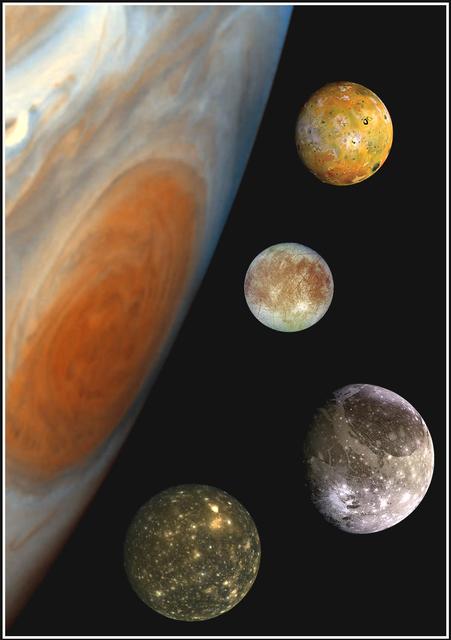
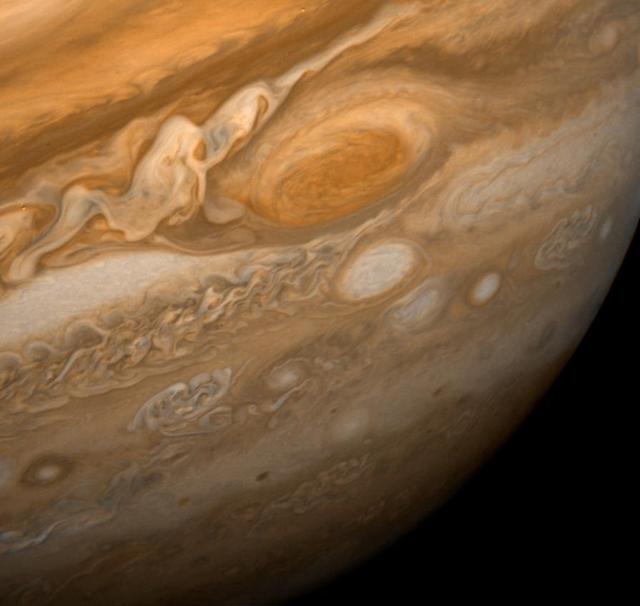
This "family portrait," a composite of the Jovian system, includes the edge of Jupiter with its Great Red Spot, and Jupiter's four largest moons, known as the Galilean satellites. From top to bottom, the moons shown are Io, Europa, Ganymede and Callisto. The Great Red Spot, a storm in Jupiter's atmosphere, is at least 300 years old. Winds blow counterclockwise around the Great Red Spot at about 400 kilometers per hour (250 miles per hour). The storm is larger than one Earth diameter from north to south, and more than two Earth diameters from east to west. In this oblique view, the Great Red Spot appears longer in the north-south direction. Europa, the smallest of the four moons, is about the size of Earth's moon, while Ganymede is the largest moon in the solar system. North is at the top of this composite picture in which the massive planet and its largest satellites have all been scaled to a common factor of 15 kilometers (9 miles) per picture element. The Solid State Imaging (CCD) system aboard NASA's Galileo spacecraft obtained the Jupiter, Io and Ganymede images in June 1996, while the Europa images were obtained in September 1996. Because Galileo focuses on high resolution imaging of regional areas on Callisto rather than global coverage, the portrait of Callisto is from the 1979 flyby of NASA's Voyager spacecraft. http://photojournal.jpl.nasa.gov/catalog/PIA00600

Turbulent Region Near Jupiter Great Red Spot
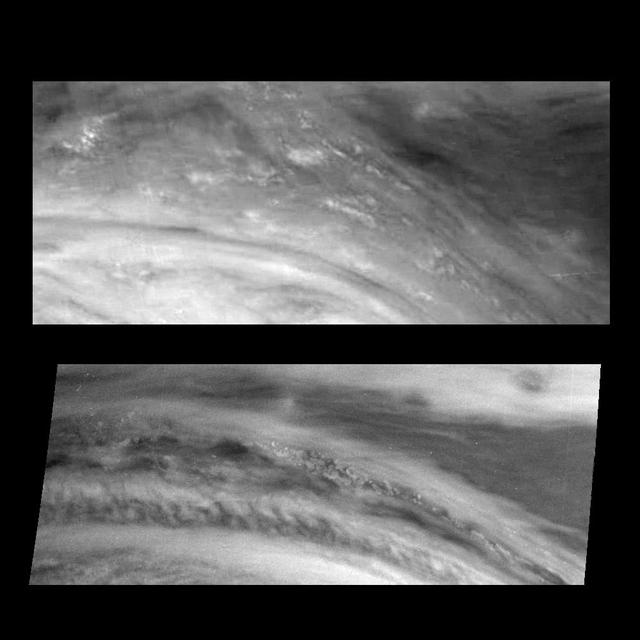
Water Cloud Thunderstorm Northwest of Great Red Spot
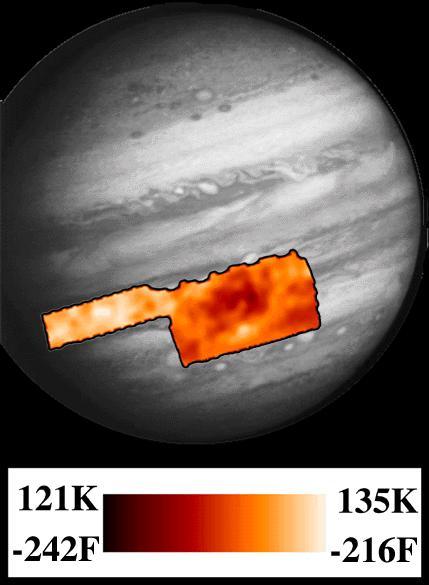
PPR Great Red Spot Temperature Map

Ammonia Ice near Jupiter Great Red Spot
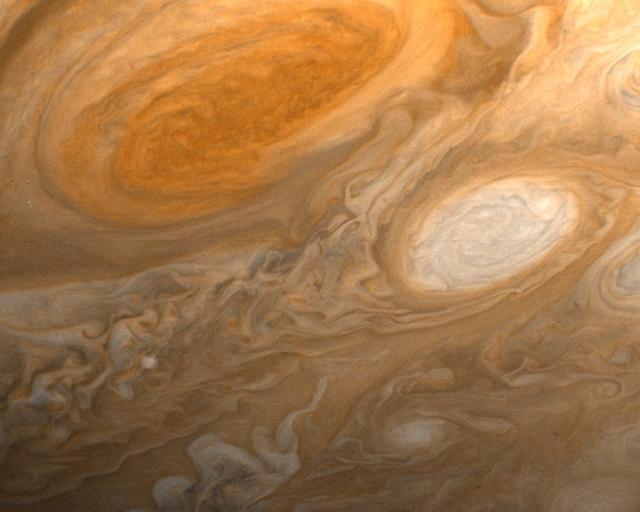
Jupiter Great Red Spot and White Ovals

This view of Jupiter Great Red Spot is a mosaic of two images taken by NASA Galileo spacecraft. The Great Red Spot is a storm in Jupiter atmosphere and is at least 300 years-old. The image was taken on June 26, 1996. http://photojournal.jpl.nasa.gov/catalog/PIA00296
A south tropical disturbance has just passed Jupiter's iconic Great Red Spot and is captured stealing threads of orange haze from the Great Red Spot in this series of color-enhanced images from NASA's Juno spacecraft. From left to right, this sequence of images was taken between 2:57 a.m. and 3:36 a.m. PDT (5:57 a.m. and 6:36 a.m. EDT) on April 1, 2018, as the spacecraft performed its 12th close flyby of Jupiter. Citizen scientists Gerald Eichstädt and Seán Doran created this image using data from the spacecraft's JunoCam imager. https://photojournal.jpl.nasa.gov/catalog/PIA22937 ** Image Credit: Enhanced Image by Gerald Eichstädt and Seán Doran (CC BY-NC-SA) based on images provided courtesy of NASA/JPL-Caltech/SwRI/MSSS
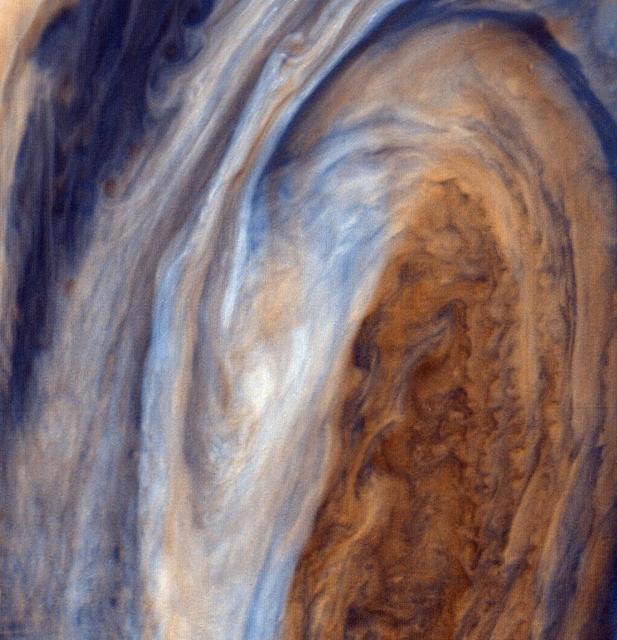
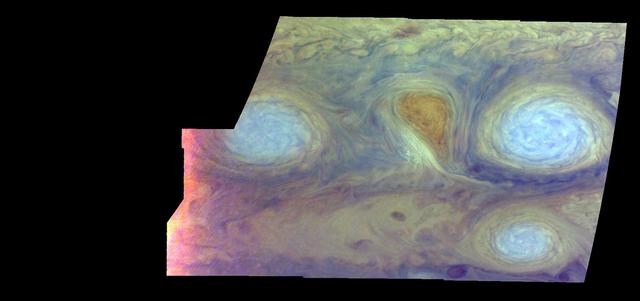
False color representation of Jupiter Great Red Spot GRS taken by NASA Galileo imaging system. The Great Red Spot appears pink and the surrounding region blue because of the particular color coding used in this representation.
Turbulent region west of Jupiter Great Red Spot. This four image mosaic shows the Great Red Spot on Jupiter eastern edge or limb as seen by NASA Galileo orbiter d on June 26, 1996.

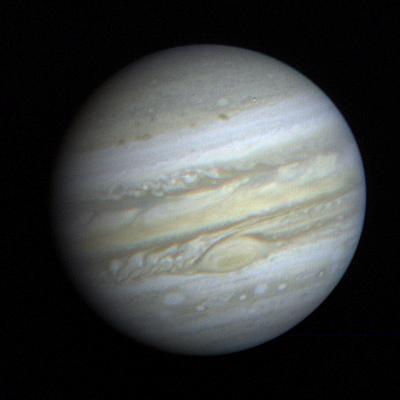
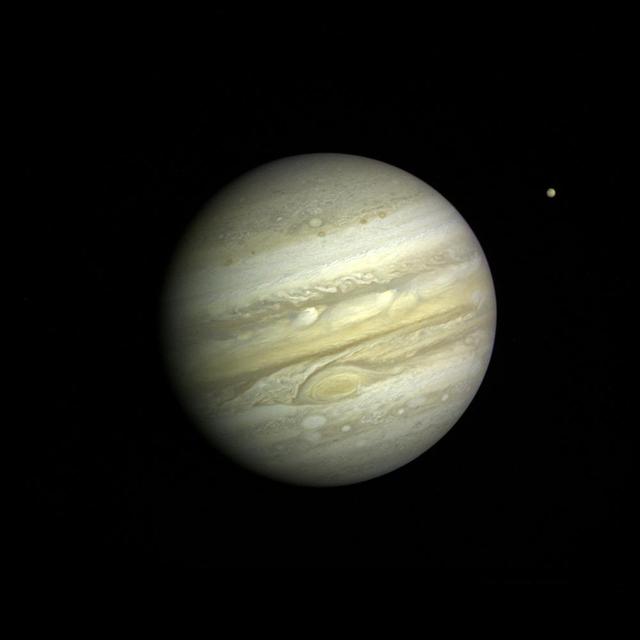
This view of Jupiter was taken by Voyager 1. This image was taken through color filters and recombined to produce the color image. This photo was assembled from three black and white negatives by the Image Processing Lab at Jet Propulsion Laboratory. http://photojournal.jpl.nasa.gov/catalog/PIA01384

This photo of Jupiter Great Red Spot was taken by Voyager 1 in early March 1979.
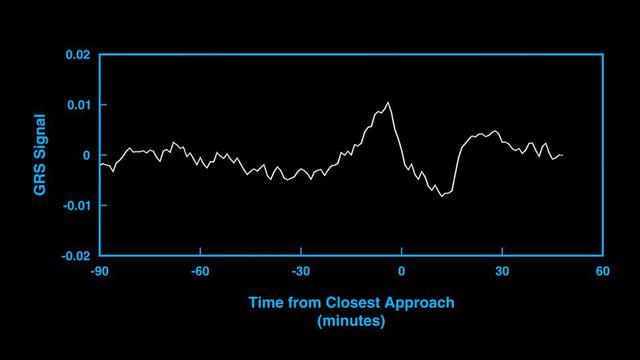
This animation and audio represent the subtle gravitational signal acquired by an antenna of NASA's Deep Space Network as the agency's Juno spacecraft performed a close flyby of Jupiter's Great Red Spot in July 2019. The changes in the signal frequency represent the changes in the local gravity as the spacecraft flew low overhead. Juno flew twice over the Great Red Spot in 2019, with the goal of picking up the subtle gravitational signal of the vortex. The concentration of mass caused by the powerful winds surrounding the Great Red Spot minutely change the spacecraft's velocity, inducing a Doppler shift on the radio signals relayed back to Earth. Movie available at https://photojournal.jpl.nasa.gov/catalog/PIA24963
This dramatic view of Jupiter Great Red Spot and its surroundings was obtained by NASA Voyager 1 on Feb. 25, 1979. The colorful, wavy cloud pattern to the left of the Red Spot is a region of extraordinarily complex end variable wave motion. http://photojournal.jpl.nasa.gov/catalog/PIA00014
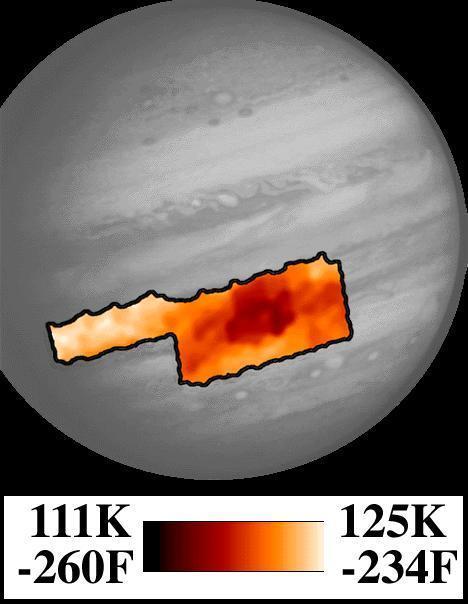
Photopolarimeter/Radiometer PPR Temperature Map of Great Red Spot
Changes in Jupiter Great Red Spot After Four Months
This photo, taken on Jan. 9, 1979 by NASA Voyager 1, is dominated by the Great Red Spot. Swirling, storm-like features possibly associated with wind shear can be seen both to the left and above the Red Spot.

Roughly true color image of the Great Red Spot of Jupiter as taken by NASA Galileo spacecraft on June 26, 1996.
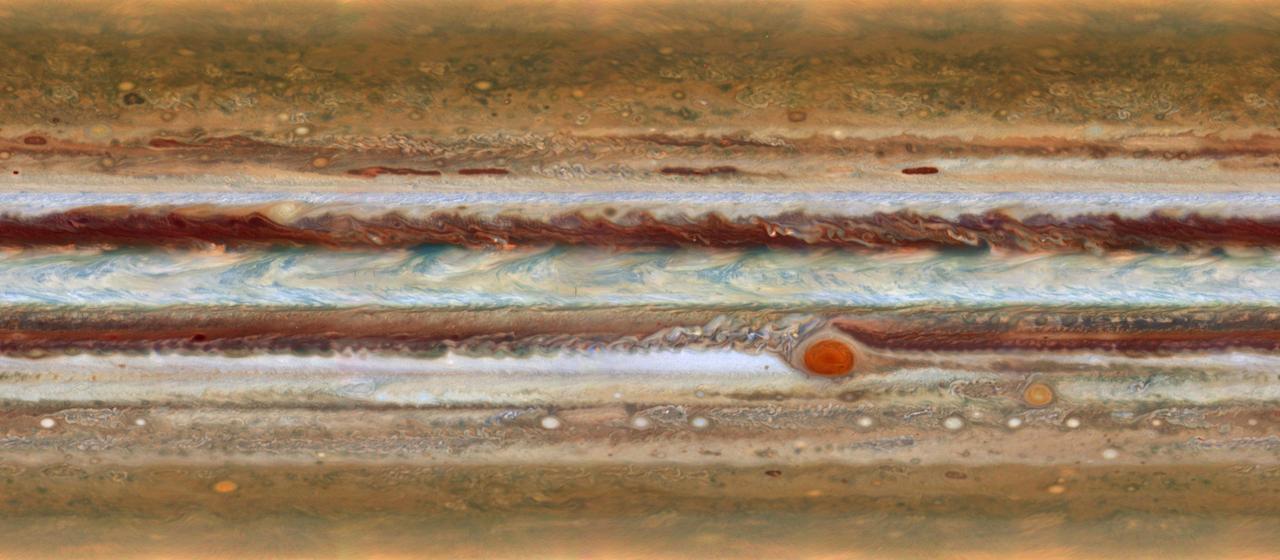
New imagery from the Hubble Space Telescope is revealing details never before seen on Jupiter. Hubble’s new Jupiter maps were used to create this Ultra HD animation. These new maps and spinning globes of Jupiter were made from observations performed with NASA’s Hubble Space Telescope. They are the first products to come from a program to study the solar system’s outer planets – Jupiter, Uranus, Neptune and, later, Saturn – each year using Hubble. The observations are designed to capture a broad range of features, including winds, clouds, storms and atmospheric chemistry. These annual studies will help current and future scientists see how these giant worlds change over time. Scientists at NASA’s Goddard Space Flight Center, the Jet Propulsion Laboratory, and the University of California at Berkeley produced two global maps of Jupiter from the observations, which were made using Hubble’s high-performance Wide Field Camera 3. The two maps represent nearly back-to-back rotations of the planet, making it possible to determine the speeds of Jupiter’s winds. Already, the images have revealed a rare wave just north of the planet’s equator and a unique filament-like feature in the core of the Great Red Spot that had not been seen previously. In addition, the new images confirm that the Great Red Spot continues to shrink and become more circular, as it has been doing for years. The long axis of this characteristic storm is about 150 miles (240 kilometers) shorter now than it was in 2014. Recently, the storm had been shrinking at a faster-than-usual rate, but the latest change is consistent with the long-term trend. Read more: <a href="http://www.nasa.gov/press-release/goddard/hubble-s-planetary-portrait-captures-new-changes-in-jupiter-s-great-red-spot" rel="nofollow">www.nasa.gov/press-release/goddard/hubble-s-planetary-por...</a> Credits: NASA/ESA/Goddard/UCBerkeley/JPL-Caltech/STScI <b><a href="http://www.nasa.gov/audience/formedia/features/MP_Photo_Guidelines.html" rel="nofollow">NASA image use policy.</a></b> <b><a href="http://www.nasa.gov/centers/goddard/home/index.html" rel="nofollow">NASA Goddard Space Flight Center</a></b> enables NASA’s mission through four scientific endeavors: Earth Science, Heliophysics, Solar System Exploration, and Astrophysics. Goddard plays a leading role in NASA’s accomplishments by contributing compelling scientific knowledge to advance the Agency’s mission. <b>Follow us on <a href="http://twitter.com/NASAGoddardPix" rel="nofollow">Twitter</a></b> <b>Like us on <a href="http://www.facebook.com/pages/Greenbelt-MD/NASA-Goddard/395013845897?ref=tsd" rel="nofollow">Facebook</a></b> <b>Find us on <a href="http://instagrid.me/nasagoddard/?vm=grid" rel="nofollow">Instagram</a></b>

New imagery from the Hubble Space Telescope is revealing details never before seen on Jupiter. Hubble’s new Jupiter maps were used to create this Ultra HD animation. These new maps and spinning globes of Jupiter were made from observations performed with NASA’s Hubble Space Telescope. They are the first products to come from a program to study the solar system’s outer planets – Jupiter, Uranus, Neptune and, later, Saturn – each year using Hubble. The observations are designed to capture a broad range of features, including winds, clouds, storms and atmospheric chemistry. These annual studies will help current and future scientists see how these giant worlds change over time. Scientists at NASA’s Goddard Space Flight Center, the Jet Propulsion Laboratory, and the University of California at Berkeley produced two global maps of Jupiter from the observations, which were made using Hubble’s high-performance Wide Field Camera 3. The two maps represent nearly back-to-back rotations of the planet, making it possible to determine the speeds of Jupiter’s winds. Already, the images have revealed a rare wave just north of the planet’s equator and a unique filament-like feature in the core of the Great Red Spot that had not been seen previously. In addition, the new images confirm that the Great Red Spot continues to shrink and become more circular, as it has been doing for years. The long axis of this characteristic storm is about 150 miles (240 kilometers) shorter now than it was in 2014. Recently, the storm had been shrinking at a faster-than-usual rate, but the latest change is consistent with the long-term trend. Read more:http://www.nasa.gov/press-release/goddard/hubble-s-planetary-portrait-captures-new-changes-in-jupiter-s-great-red-spot Credits: NASA/ESA/Goddard/UCBerkeley/JPL-Caltech/STScI <b><a href="http://www.nasa.gov/audience/formedia/features/MP_Photo_Guidelines.html" rel="nofollow">NASA image use policy.</a></b> <b><a href="http://www.nasa.gov/centers/goddard/home/index.html" rel="nofollow">NASA Goddard Space Flight Center</a></b> enables NASA’s mission through four scientific endeavors: Earth Science, Heliophysics, Solar System Exploration, and Astrophysics. Goddard plays a leading role in NASA’s accomplishments by contributing compelling scientific knowledge to advance the Agency’s mission. <b>Follow us on <a href="http://twitter.com/NASAGoddardPix" rel="nofollow">Twitter</a></b> <b>Like us on <a href="http://www.facebook.com/pages/Greenbelt-MD/NASA-Goddard/395013845897?ref=tsd" rel="nofollow">Facebook</a></b> <b>Find us on <a href="http://instagrid.me/nasagoddard/?vm=grid" rel="nofollow">Instagram</a></b>
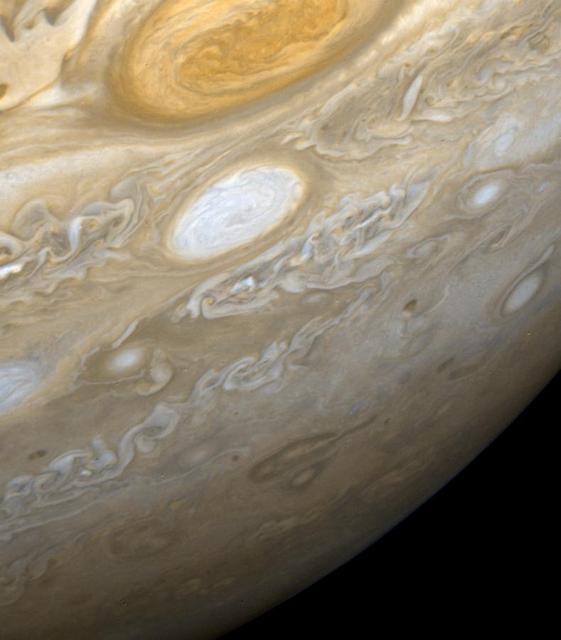
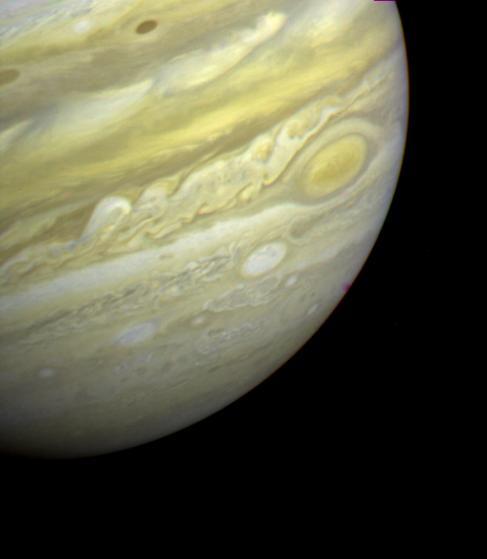
This picture from NASA Voyager 2 shows a region of the southern hemisphere extending from the Great Red Spot to the south pole. The white oval is seen beneath the Great Red Spot, and several small scale spots are visible farther to the south. http://photojournal.jpl.nasa.gov/catalog/PIA00372
This image is a still frame, created from images taken by NASA Cassini spacecraft, shows small spots slipping over each other east of Jupiter Great Red Spot.
This image is a still frame, created from images taken by NASA Cassini spacecraft, shows a turbulent region west of Jupiter Great Red Spot. The small, bright white spots are believed to be thunderstorms.
This mosaic of Jupiter Great Red Spot taken by NASA Voyager 1, shows the area around the northern boundary where a white cloud is seen which extends to east of the region. http://photojournal.jpl.nasa.gov/catalog/PIA00065
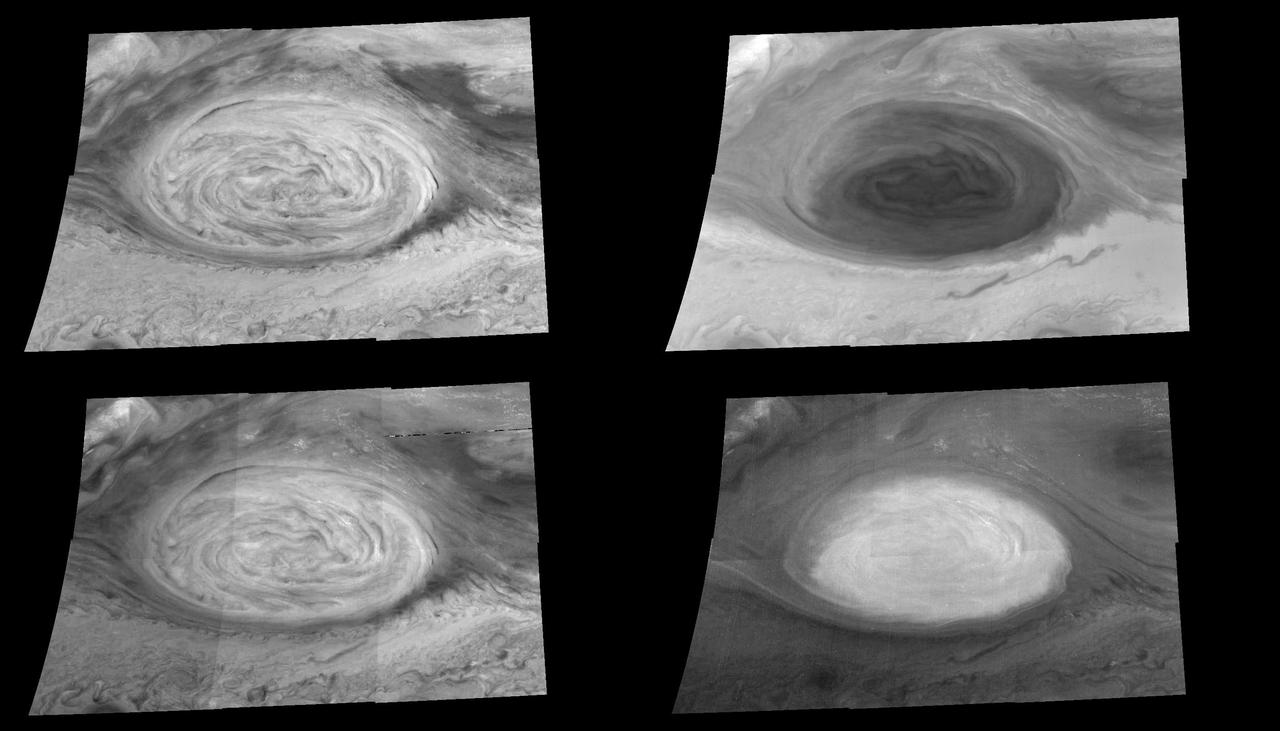
This montage features activity in the turbulent region of Jupiter Great Red Spot GRS. Four sets of images of the GRS were taken by NASA Galileo imaging system over an 11.5 hour period on 26 June, 1996.
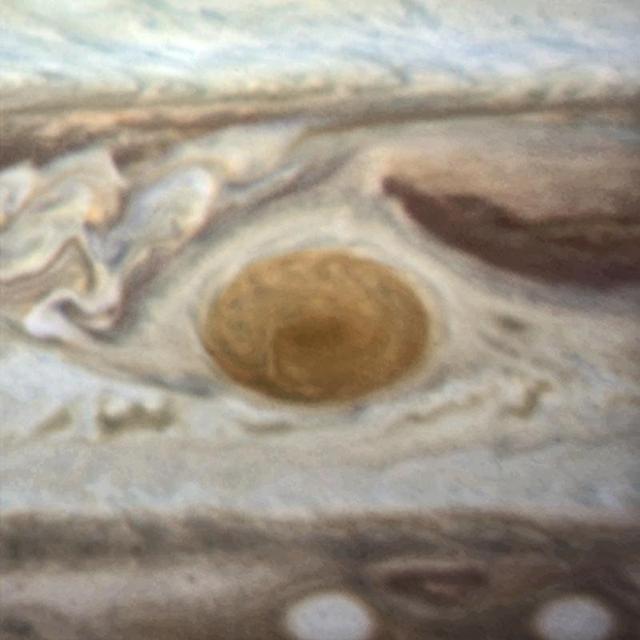
An image of Jupiter's Great Red Spot taken in 2014 with Hubble's WFC3 camera. The spot has a diameter here of 16 000km. -- Jupiter's trademark Great Red Spot -- a swirling anti-cyclonic storm larger than Earth -- has shrunk to its smallest size ever measured. According to Amy Simon of NASA's Goddard Space Flight Center in Greenbelt, Maryland, recent NASA Hubble Space Telescope observations confirm the Great Red Spot now is approximately 10,250 miles across. Astronomers have followed this downsizing since the 1930s. Historic observations as far back as the late 1800s gauged the storm to be as large as 25,500 miles on its long axis. NASA Voyager 1 and Voyager 2 flybys of Jupiter in 1979 measured it to be 14,500 miles across. In 1995, a Hubble photo showed the long axis of the spot at an estimated 13,020 miles across. And in a 2009 photo, it was measured at 11,130 miles across. Beginning in 2012, amateur observations revealed a noticeable increase in the rate at which the spot is shrinking -- by 580 miles per year -- changing its shape from an oval to a circle. Read more: <a href="http://1.usa.gov/1mvuo0R" rel="nofollow">1.usa.gov/1mvuo0R</a> Credit: NASA/ESA <b><a href="http://www.nasa.gov/audience/formedia/features/MP_Photo_Guidelines.html" rel="nofollow">NASA image use policy.</a></b> <b><a href="http://www.nasa.gov/centers/goddard/home/index.html" rel="nofollow">NASA Goddard Space Flight Center</a></b> enables NASA’s mission through four scientific endeavors: Earth Science, Heliophysics, Solar System Exploration, and Astrophysics. Goddard plays a leading role in NASA’s accomplishments by contributing compelling scientific knowledge to advance the Agency’s mission. <b>Follow us on <a href="http://twitter.com/NASAGoddardPix" rel="nofollow">Twitter</a></b> <b>Like us on <a href="http://www.facebook.com/pages/Greenbelt-MD/NASA-Goddard/395013845897?ref=tsd" rel="nofollow">Facebook</a></b> <b>Find us on <a href="http://instagram.com/nasagoddard?vm=grid" rel="nofollow">Instagram</a></b>
This photo from NASA Voyager 2 was taken on Jun. 9, 1979 and is centered over the long-lived disturbed region west of the Great Red Spot GRS.
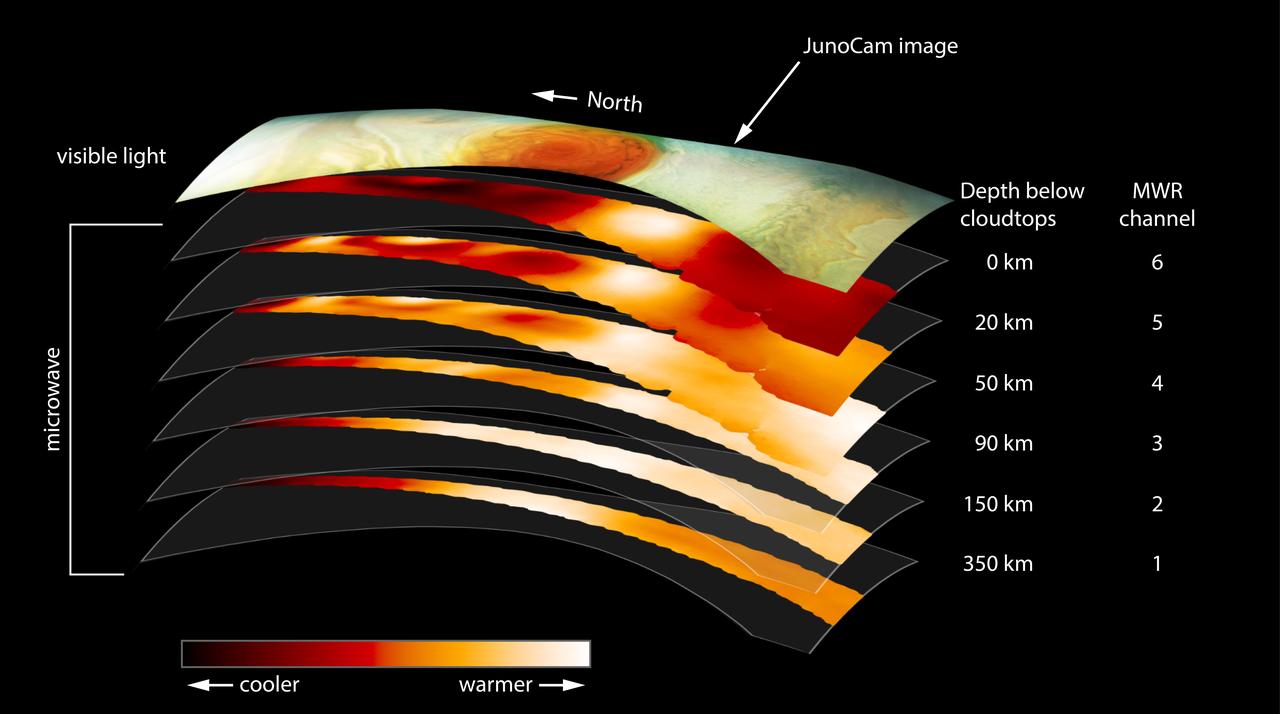
This figure shows data from the six channels of the microwave radiometer (MWR) instrument onboard NASA's Juno spacecraft. The data were collected in the mission's sixth science orbit (referred to as "perijove 7"), during which the spacecraft passed over Jupiter's Great Red Spot. The top layer in the figure is a visible light image from the mission's JunoCam instrument, provided for context. The MWR instrument enables Juno to see deeper into Jupiter than any previous spacecraft or Earth-based observations. Each MWR channel peers progressively deeper below the visible cloud tops. Channel 1 is sensitive to longer microwave wavelengths; each of the other channels is sensitive to progressively shorter wavelengths. The large-scale structure of the Great Red Spot is visible in the data as deep into Jupiter as MWR can observe. https://photojournal.jpl.nasa.gov/catalog/PIA22177
This color view of the region just to the East of the Great Red Spot was taken by NASA Voyager 1 on March 4, 1979 at a distance of 1,000,000 miles 1,800,000 km. http://photojournal.jpl.nasa.gov/catalog/PIA00019
This view of the region just to the Southeast of the Great Red Spot was taken by NASA Voyager 1 on March 4, 1979 at a distance of 1,100,000 miles 1,800,000 km. http://photojournal.jpl.nasa.gov/catalog/PIA00017
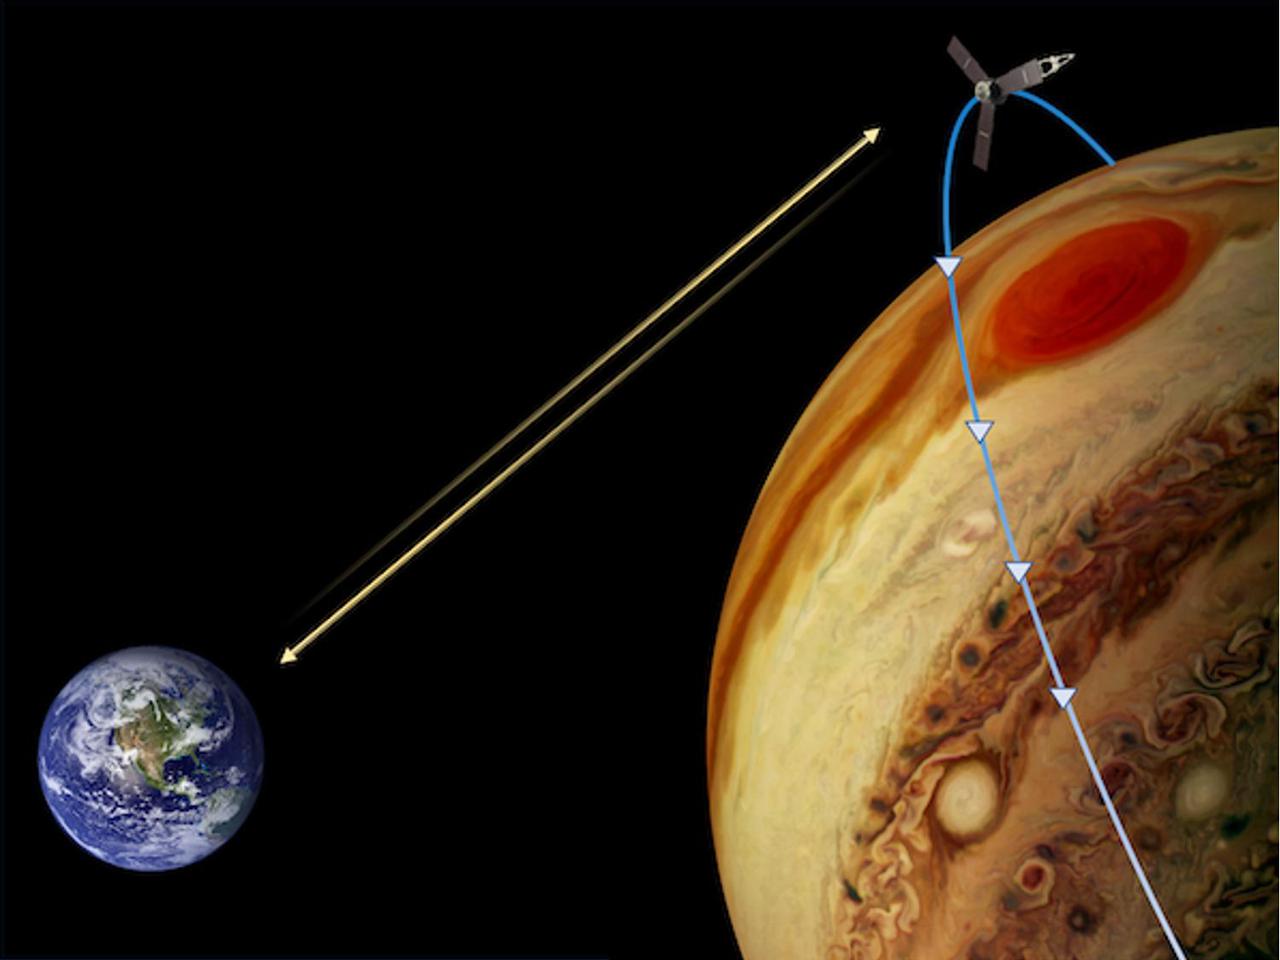
This representation depicts how NASA's Juno mission obtained gravity science data of Jupiter's Great Red Spot. The Juno spacecraft flew twice over the crimson vortex in 2019 at low altitudes with the goal of picking up its subtle gravitational signal. The concentration of mass related to the powerful winds surrounding the Great Red Spot induced a minute Doppler shift in the spacecraft's radio signals that could be measured by a NASA's Deep Space Network tracking antenna on Earth. With Juno traveling at about 130,000 mph (209,000 kph) over Jupiter's cloud deck, mission scientists were able to measure velocity changes as small 0.01 millimeter per second This enabled them to constrain the depth of the Great Red Spot to about 186 miles (300 kilometers) below the cloud tops. https://photojournal.jpl.nasa.gov/catalog/PIA24820
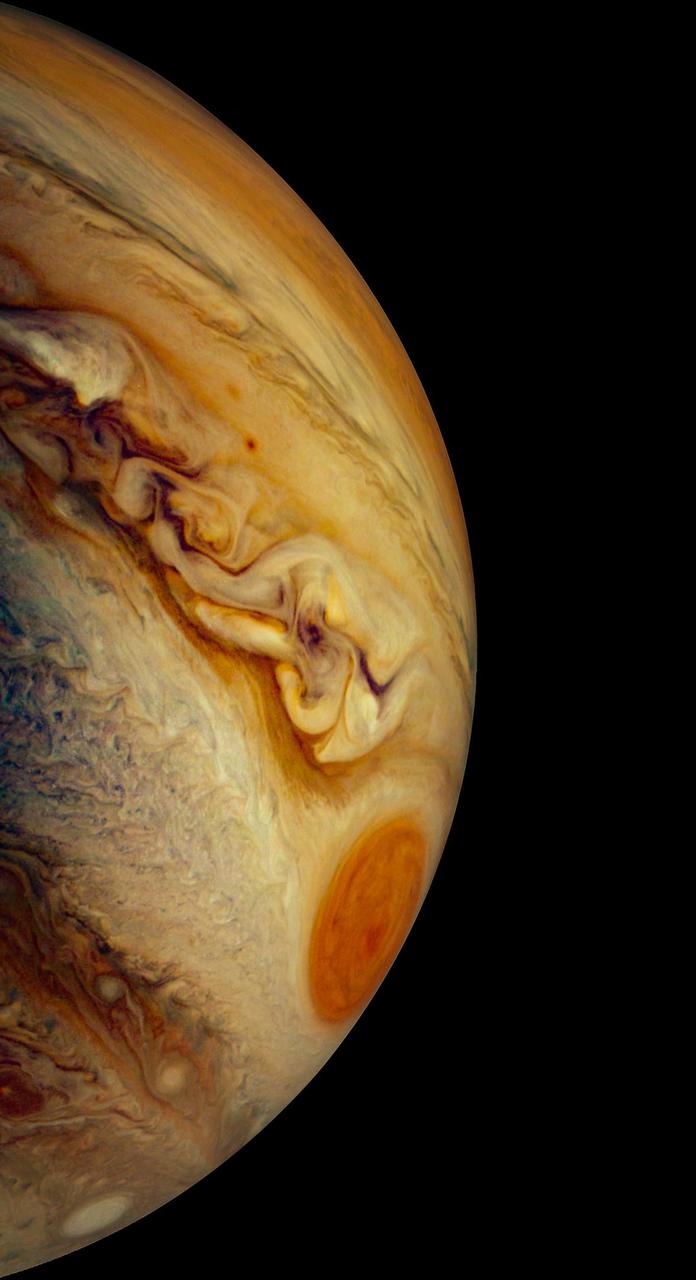
This striking Jovian vista was created by citizen scientists Gerald Eichstädt and Seán Doran using data from the JunoCam imager on NASA's Juno spacecraft. The tumultuous Great Red Spot is fading from Juno's view while the dynamic bands of the southern region of Jupiter come into focus. North is to the left of the image, and south is on the right. The image was taken on July 10, 2017 at 7:12 p.m. PDT (10:12 p.m. EDT), as the Juno spacecraft performed its seventh close flyby of Jupiter. At the time the image was taken, the spacecraft was 10,274 miles (16,535 kilometers) from the tops of the clouds of the planet at a latitude of -36.9 degrees. https://photojournal.jpl.nasa.gov/catalog/PIA21778 **Image Credit: Enhanced Image by Gerald Eichstädt and Seán Doran (CC BY-NC-SA) based on images provided courtesy of NASA/JPL-Caltech/SwRI/MSSS https://creativecommons.org/licenses/by-nc-sa/3.0/
The Great Red Spot GRS of Jupiter as seen by NASA Galileo imaging system. The image is a mosaic of six images taken over an 80 second interval during the first GRS observing sequence on June 26, 1996.
The Great Red Spot below and right of center seen in this image from NASA Cassini spacecraft is a giant atmospheric storm as wide as two Earths and over 300 years old.
This mosaic of the Great Red Spot on Jupiter from NASA Galileo orbiter was taken over a 76 second interval beginning at universal time 14 hours, 31 minutes, 52 seconds on June 26, 1996.
These mosaics 6 frames each show the appearance of the Great Red Spot in infrared light obtained on June 26, 1996 by the Solid State Imaging system on board NASA Galileo spacecraft.
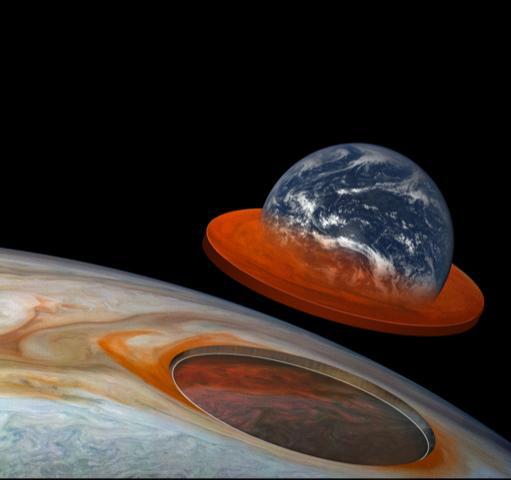
This illustration combines an image of Jupiter from the JunoCam instrument aboard NASA's Juno spacecraft with a composite image of Earth to depict the size and depth of Jupiter's Great Red Spot. https://photojournal.jpl.nasa.gov/catalog/PIA24817
This mosaic of the Great Red Spot on Jupiter from NASA Galileo orbiter was taken over an 80 second interval beginning at universal time 14 hours, 30 minutes, 23 seconds, on June 26, 1996.

This photo of Jupiter was taken by NASA Voyager 1 on March 1, 1979. The photo shows Jupiter Great Red Spot upper right and the turbulent region immediately to the west. http://photojournal.jpl.nasa.gov/catalog/PIA00359
The mosaic of the Great Red Spot on Jupiter from NASA Galileo orbiter was taken over a 76 second interval beginning at universal time 14 hours, 33 minutes, 22 seconds, on June 26, 1996.
This mosaic of the Great Red Spot on Jupiter from NASA Galileo orbiter was taken over a 75 second interval beginning at universal time 4 hours, 18 minutes, 8 seconds on June 26, 1996.
The mosaic of the Great Red Spot on Jupiter from NASA Galileo orbiter was taken over an 80 second interval beginning at universal time 14 hours, 30 minutes, 23 seconds, on June 26, 1996.
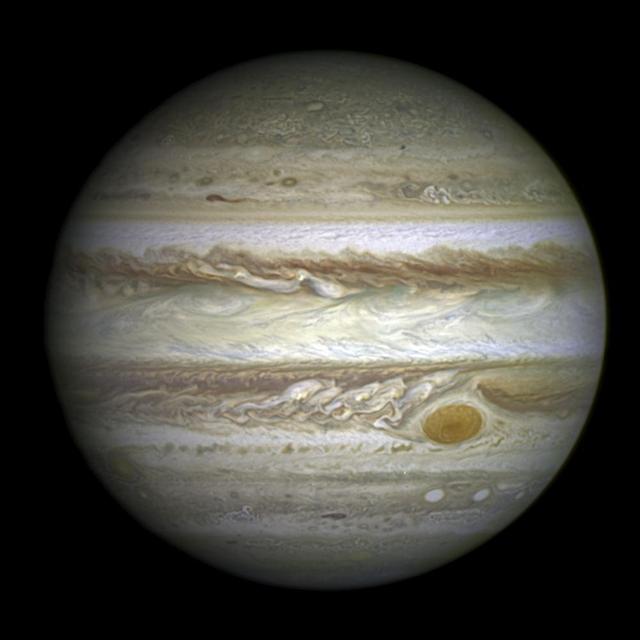
This full-disc image of Jupiter was taken on 21 April 2014 with Hubble's Wide Field Camera 3 (WFC3). -- Jupiter's trademark Great Red Spot -- a swirling anti-cyclonic storm larger than Earth -- has shrunk to its smallest size ever measured. According to Amy Simon of NASA's Goddard Space Flight Center in Greenbelt, Maryland, recent NASA Hubble Space Telescope observations confirm the Great Red Spot now is approximately 10,250 miles across. Astronomers have followed this downsizing since the 1930s. Historic observations as far back as the late 1800s gauged the storm to be as large as 25,500 miles on its long axis. NASA Voyager 1 and Voyager 2 flybys of Jupiter in 1979 measured it to be 14,500 miles across. In 1995, a Hubble photo showed the long axis of the spot at an estimated 13,020 miles across. And in a 2009 photo, it was measured at 11,130 miles across. Beginning in 2012, amateur observations revealed a noticeable increase in the rate at which the spot is shrinking -- by 580 miles per year -- changing its shape from an oval to a circle. Read more: <a href="http://1.usa.gov/1mvuo0R" rel="nofollow">1.usa.gov/1mvuo0R</a> Credit: NASA/ESA <b><a href="http://www.nasa.gov/audience/formedia/features/MP_Photo_Guidelines.html" rel="nofollow">NASA image use policy.</a></b> <b><a href="http://www.nasa.gov/centers/goddard/home/index.html" rel="nofollow">NASA Goddard Space Flight Center</a></b> enables NASA’s mission through four scientific endeavors: Earth Science, Heliophysics, Solar System Exploration, and Astrophysics. Goddard plays a leading role in NASA’s accomplishments by contributing compelling scientific knowledge to advance the Agency’s mission. <b>Follow us on <a href="http://twitter.com/NASAGoddardPix" rel="nofollow">Twitter</a></b> <b>Like us on <a href="http://www.facebook.com/pages/Greenbelt-MD/NASA-Goddard/395013845897?ref=tsd" rel="nofollow">Facebook</a></b> <b>Find us on <a href="http://instagram.com/nasagoddard?vm=grid" rel="nofollow">Instagram</a></b>
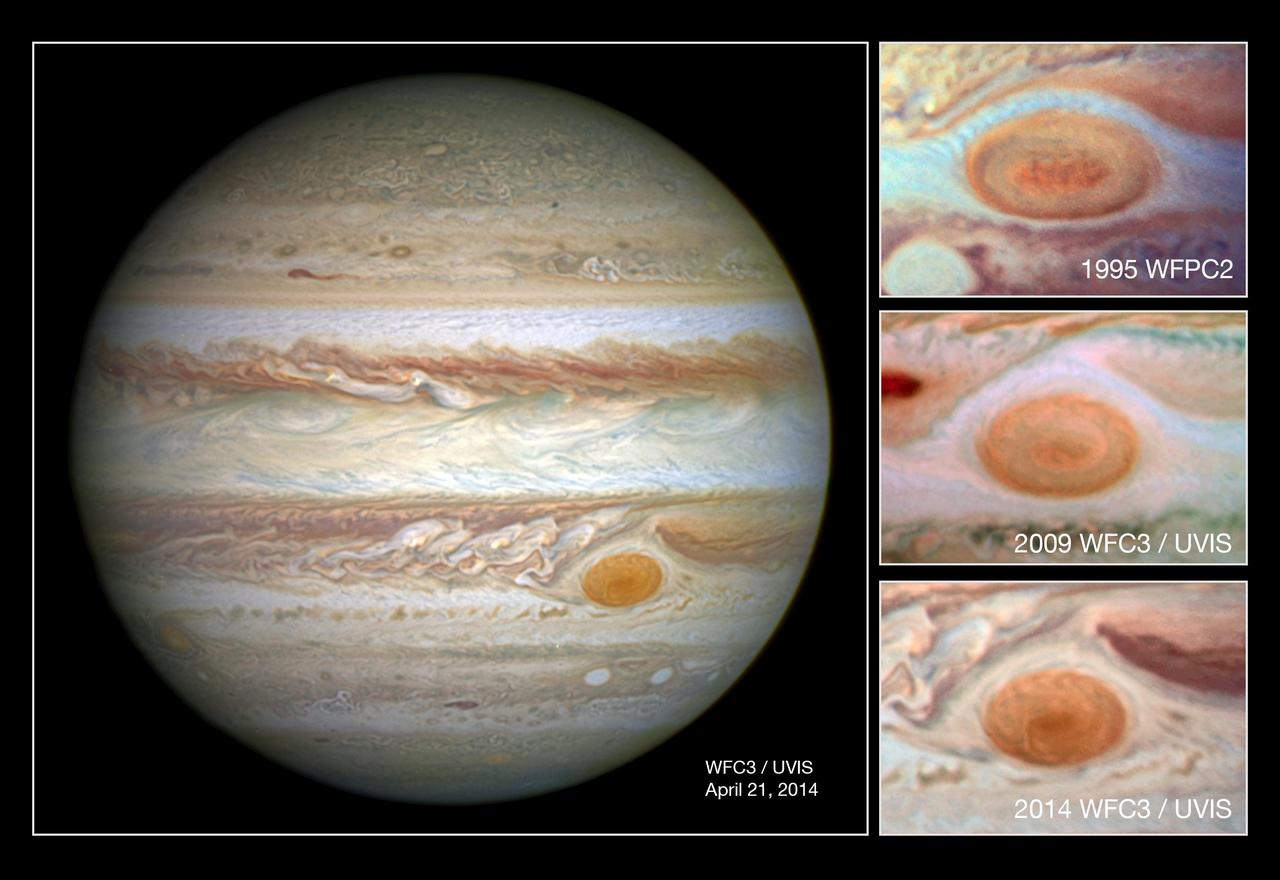
In this comparison image the photo at the top was taken by Hubble's Wide Field Planetary Camera 2 in 1995 and shows the spot at a diameter of just under 21 000km; the second down shows a 2009 WFC3 photo of the spot at a diameter of just under 18 000km; and the lowest shows the newest image from WFC3 taken in 2014 with the spot at its smallest yet, with diameter of just 16 000km. -- Jupiter's trademark Great Red Spot -- a swirling anti-cyclonic storm larger than Earth -- has shrunk to its smallest size ever measured. According to Amy Simon of NASA's Goddard Space Flight Center in Greenbelt, Maryland, recent NASA Hubble Space Telescope observations confirm the Great Red Spot now is approximately 10,250 miles across. Astronomers have followed this downsizing since the 1930s. Historic observations as far back as the late 1800s gauged the storm to be as large as 25,500 miles on its long axis. NASA Voyager 1 and Voyager 2 flybys of Jupiter in 1979 measured it to be 14,500 miles across. In 1995, a Hubble photo showed the long axis of the spot at an estimated 13,020 miles across. And in a 2009 photo, it was measured at 11,130 miles across. Beginning in 2012, amateur observations revealed a noticeable increase in the rate at which the spot is shrinking -- by 580 miles per year -- changing its shape from an oval to a circle. Read more: <a href="http://1.usa.gov/1mvuo0R" rel="nofollow">1.usa.gov/1mvuo0R</a> Credit: NASA/ESA <b><a href="http://www.nasa.gov/audience/formedia/features/MP_Photo_Guidelines.html" rel="nofollow">NASA image use policy.</a></b> <b><a href="http://www.nasa.gov/centers/goddard/home/index.html" rel="nofollow">NASA Goddard Space Flight Center</a></b> enables NASA’s mission through four scientific endeavors: Earth Science, Heliophysics, Solar System Exploration, and Astrophysics. Goddard plays a leading role in NASA’s accomplishments by contributing compelling scientific knowledge to advance the Agency’s mission. <b>Follow us on <a href="http://twitter.com/NASAGoddardPix" rel="nofollow">Twitter</a></b> <b>Like us on <a href="http://www.facebook.com/pages/Greenbelt-MD/NASA-Goddard/395013845897?ref=tsd" rel="nofollow">Facebook</a></b> <b>Find us on <a href="http://instagram.com/nasagoddard?vm=grid" rel="nofollow">Instagram</a></b>
This view of the Great Red Spot is seen in greatly exaggerated color. The colors do not represent the true hues seen in the Jovian atmosphere but have been produced by special computer processing to enhance subtle variations in both color and shading. http://photojournal.jpl.nasa.gov/catalog/PIA00018
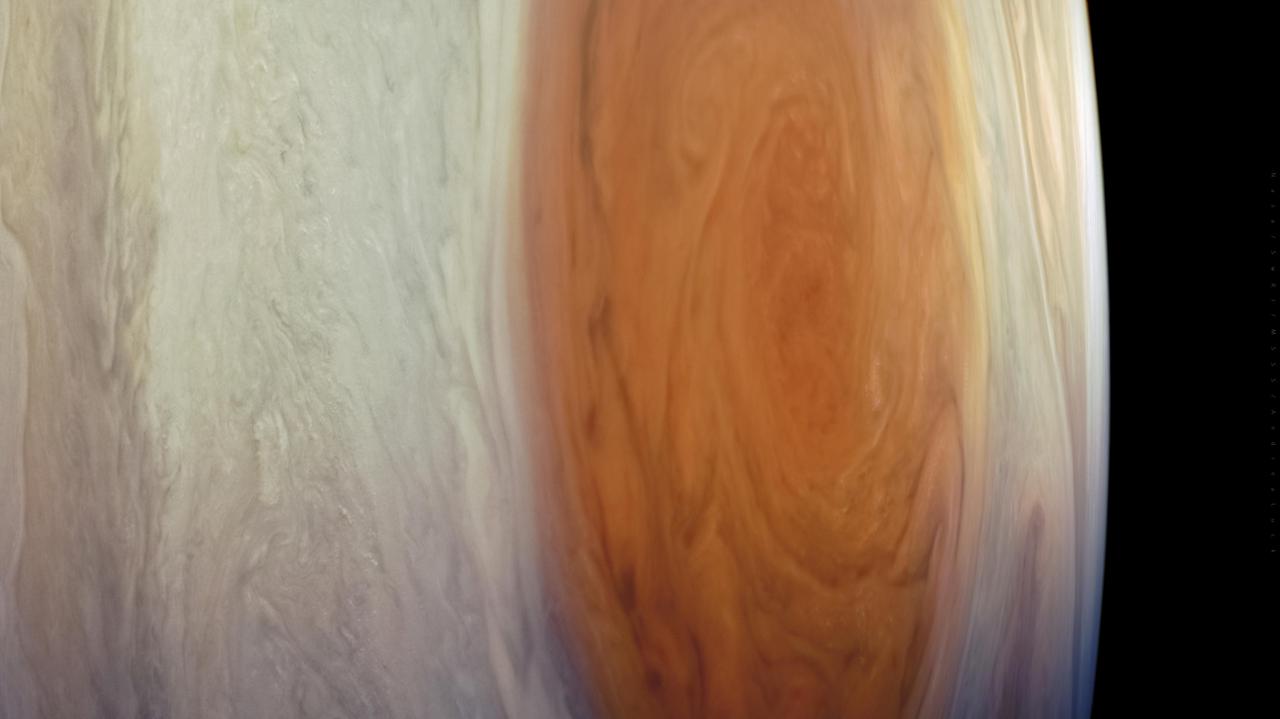
NASA's Juno spacecraft captured this detailed look at Jupiter's most recognizable feature, the Great Red Spot. Data from Juno's instruments indicate this giant, long-lived vortex extends far deeper into Jupiter's atmosphere than scientists previously expected, to about 300 miles (500 kilometers) below the cloud tops. The surprising discovery demonstrates that the Great Red Spot and other vortices descend below the depth where sunlight warms the atmosphere, providing new clues about the inner workings of the planet's beautiful but violent atmosphere. Researchers published the findings in the journal Science in Oct. 2021: https://www.nasa.gov/press-release/nasa-s-juno-science-results-offer-first-3d-view-of-jupiter-atmosphere Citizen scientist Andrea Luck processed this image from raw JunoCam data. The original image was taken on July 10, 2017, at 07:10 p.m. PDT (10:10 p.m. EDT), as the Juno spacecraft performed its seventh close flyby of Jupiter. At the time, the spacecraft was about 8,600 miles (13,840 kilometers) from the cloud tops, above latitude 33 degrees south. https://photojournal.jpl.nasa.gov/catalog/PIA25011
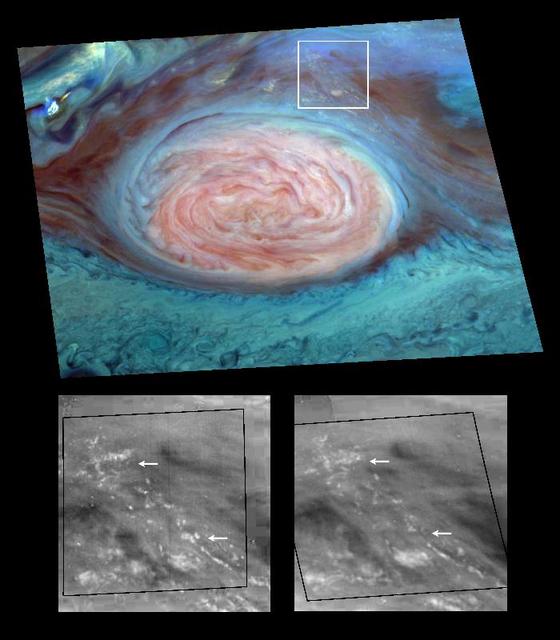
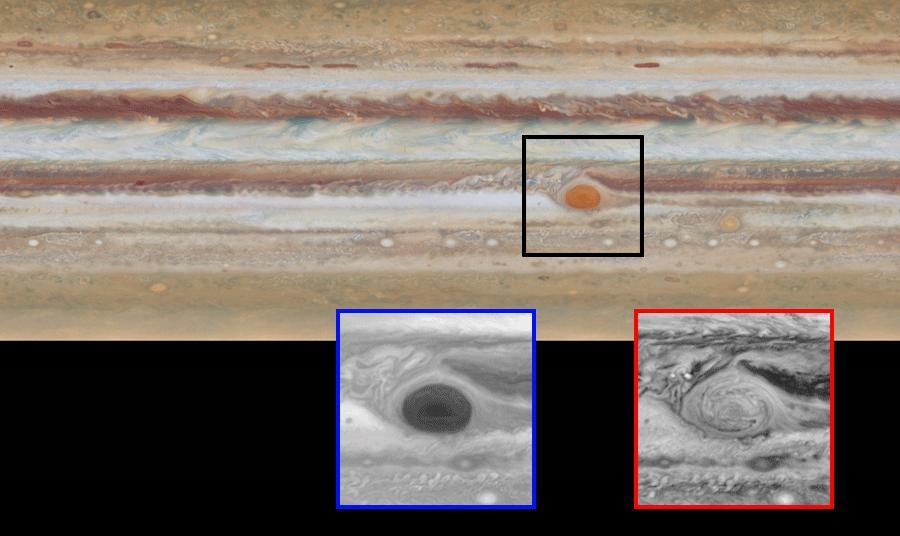
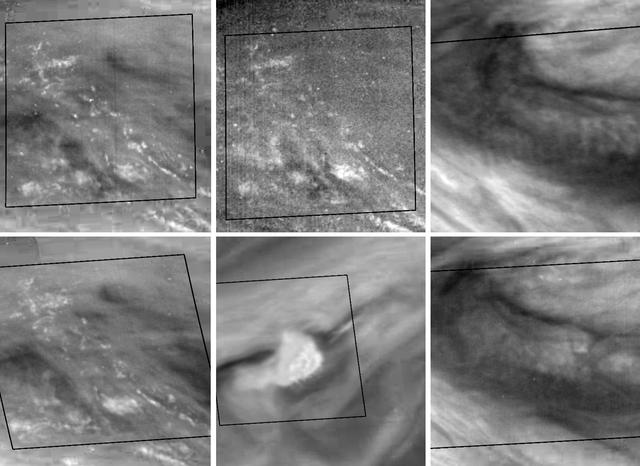
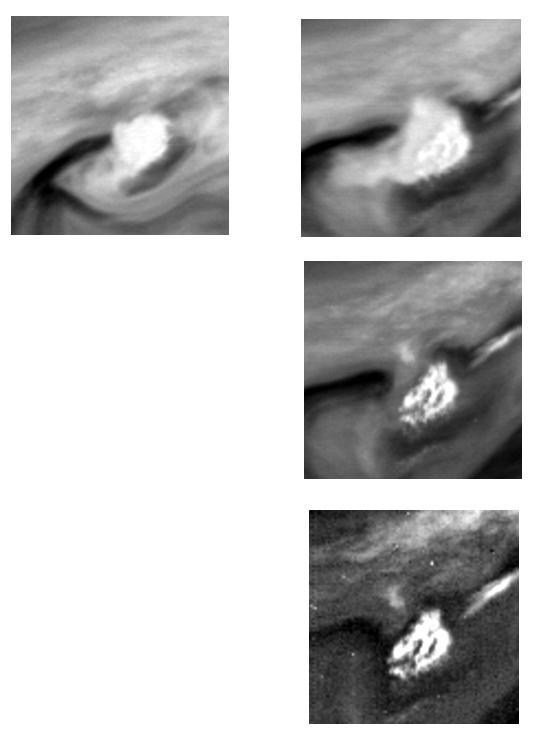
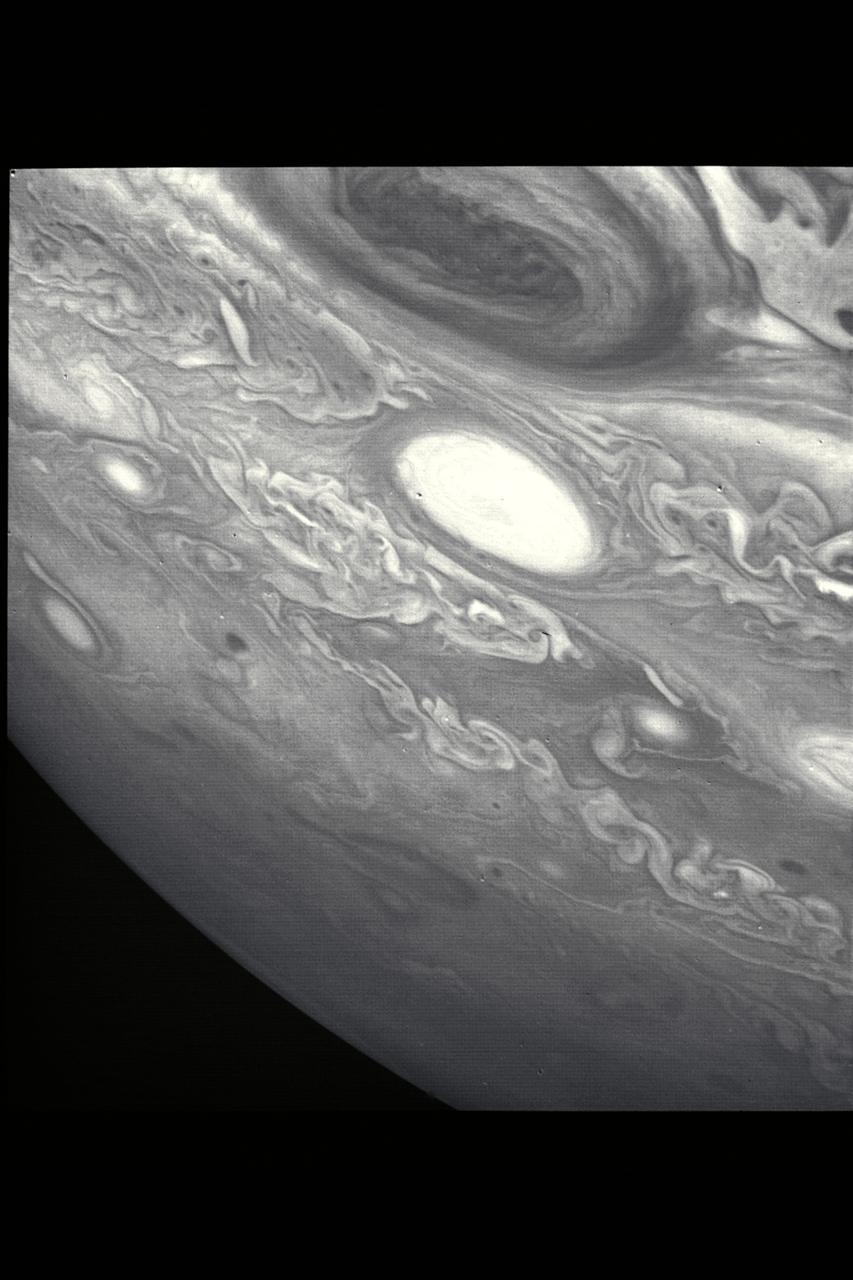
Scientists have spotted what appear to be thunderheads on Jupiter bright white cumulus clouds similar to those that bring thunderstorms on Earth - at the outer edges of Jupiter's Great Red Spot. Images from NASA's Galileo spacecraft now in orbit around Jupiter are providing new evidence that thunderstorms may be an important source of energy for Jupiter's winds that blow at more than 500 kilometers per hour (about 300 miles per hour). The photos were taken by Galileo's solid state imager camera on June 26, 1996 at a range of about 1.4 million kilometers (about 860,000 miles). The image at top is a mosaic of multiple images taken through near-infrared filters. False coloring in the image reveals cloud-top heights. High, thick clouds are white and high, thin clouds are pink. Low-altitude clouds are blue. The two black-and-white images at bottom are enlargements of the boxed area; the one on the right was taken 70 minutes after the image on the left. The arrows show where clouds have formed or dissipated in the short time between the images. The smallest clouds are tens of kilometers across. On Earth, moist convection in thunderstorms is a pathway through which solar energy, deposited at the surface, is transported and delivered to the atmosphere. Scientists at the California Institute of Technology analyzing data from Galileo believe that water, the most likely candidate for what composes these clouds on Jupiter, may be more abundant at the site seen here than at the Galileo Probe entry site, which was found to be unexpectedly dry. http://photojournal.jpl.nasa.gov/catalog/PIA00506
This infrared image, taken by NASA Galileo spacecraft in late June, 1996, of Jupiter Great Red Spot has different colors than what you normally see.
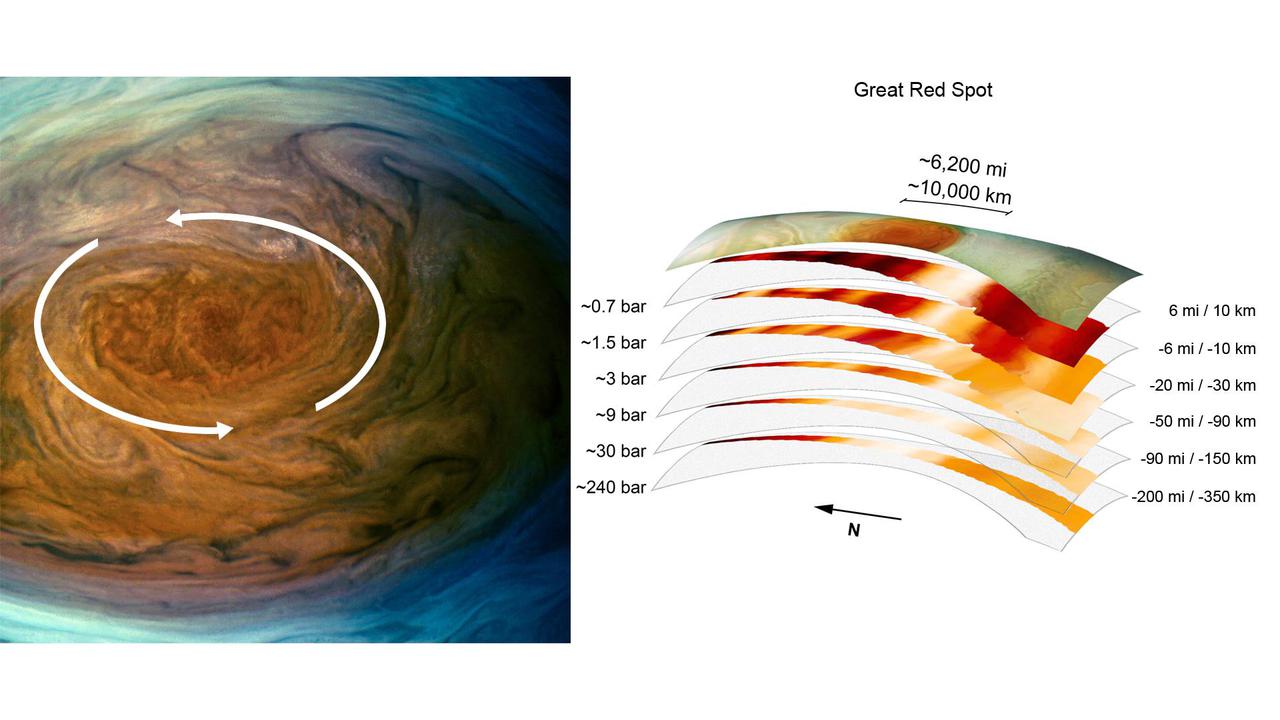
The annotated image on the left from the JunoCam imager aboard NASA's Juno spacecraft depicts the anticyclonic (counterclockwise) rotation of Jupiter's Great Red Spot. The graphic on the right highlights the large-scale structure of the Great Red Spot as seen by the spacecraft's microwave radiometer (MWR) instrument. Data for the image and the microwave radiometer results were collected during a low flyby of Jupiter which took place on July 11, 2017. The radiometer data was acquired from the six channels of MWR. Each MWR channel peers progressively deeper below the visible cloud tops. In fact, the MWR instrument enables Juno to see deeper into Jupiter than any previous spacecraft or Earth-based observations. Unlike Earth, which as a solid surface, Jupiter is a gas giant with no discernable solid surface. So the planetary science community has defined the "base" of Jupiter's atmosphere to be defined as the location where its pressure is equivalent to is 1 bar. The bar is a metric unit of pressure which at 14.5 pounds per square inch is slightly less than the average atmospheric pressure on Earth at sea level. The numbers noted to the left of each layer of MWR data indicates the pressure (in bars) that is present at the location in the atmosphere where the MWR reading occurred. The distance measurements to the right of each layer of MWR data provides the distance – either above or below the 1 bar level – that the corresponding MWR measurement was taken. For context, the top layer in the figure is a visible-light image depicting Jupiter's different levels of clouds, with an average altitude about 6 miles above the 1 bar pressure region. https://photojournal.jpl.nasa.gov/catalog/PIA24819
This extraordinary view of Jupiter was captured by NASA's Juno spacecraft on the outbound leg of its 12th close flyby of the gas giant planet. This new perspective of Jupiter from the south makes the Great Red Spot appear as though it is in northern territory. This view is unique to Juno and demonstrates how different our view is when we step off the Earth and experience the true nature of our three-dimensional universe. Juno took the images used to produce this color-enhanced image on April 1 between 3:04 a.m. PDT (6:04 a.m. EDT) and 3:36 a.m. PDT (6:36 a.m. EDT). At the time the images were taken, the spacecraft was between 10,768 miles (17,329 kilometers) to 42,849 miles (68,959 kilometers) from the tops of the clouds of the planet at a southern latitude spanning 34.01 to 71.43 degrees. Citizen scientists Gerald Eichstädt and Seán Doran created this image using data from the spacecraft's JunoCam imager. The view is a composite of several separate JunoCam images that were re-projected, blended, and healed. https://photojournal.jpl.nasa.gov/catalog/PIA22421
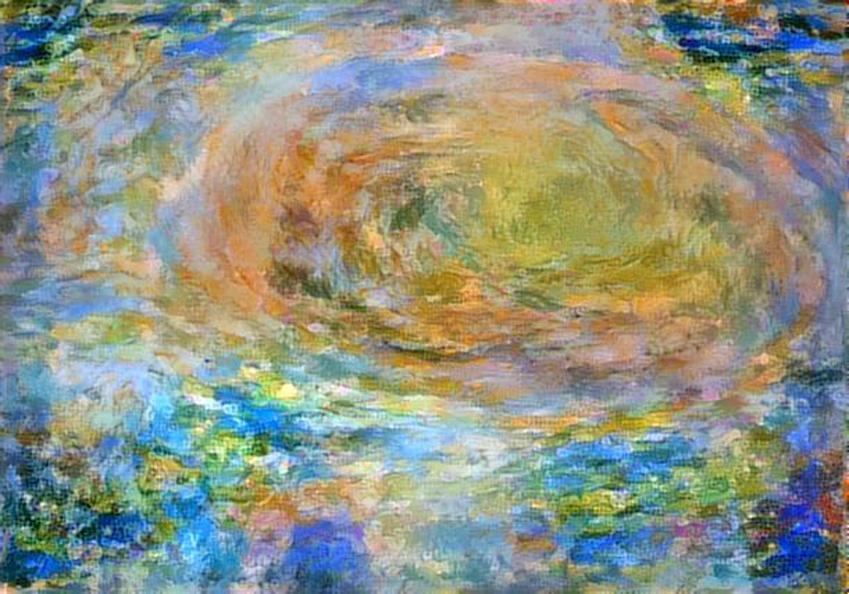
Citizen scientist David Englund created this avant-garde Jovian artwork using data from the JunoCam imager on NASA's Juno spacecraft. The unique interpretation of Jupiter's Great Red Spot was done in a style that pays tribute to French Impressionist painter Claude Monet. The original image was taken on July 10, 2017 at 7:12 p.m. PDT (10:12 p.m. EDT), as the Juno spacecraft performed its 7th close flyby of Jupiter. At the time the image was taken, the spacecraft was 10,274 miles (16,535 kilometers) from the tops of the clouds of the planet, at a latitude of -36.9 degrees. https://photojournal.jpl.nasa.gov/catalog/PIA21779 . - Enhanced image by David Englund based on images provided courtesy of NASA/JPL-Caltech/SwRI/MSSS
This JunoCam image of Jupiter's south temperate belt and Great Red Spot was taken on Dec. 30, 2020. Wide enough to contain Earth, the Great Red Spot is the most dominant atmospheric feature in the planet's southern hemisphere. https://photojournal.jpl.nasa.gov/catalog/PIA24962
These two images of Jupiter atmosphere were taken by NASA Galileo spacecraft on June 26, 1996. The bright white spot in the center of each image is to the northwest of Jupiter Great Red Spot GRS.
This Earth-based observation of Jupiter and the South Tropical Disturbance approaching the Great Red Spot was captured on Jan. 26, 2018. Amateur astronomer Christopher Go took and processed this image. https://photojournal.jpl.nasa.gov/catalog/PIA22936

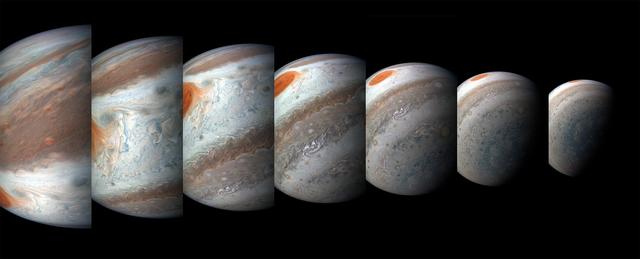
Jupiter's iconic Great Red Spot is a 10,000-mile-wide (16,000-kilometer-wide) storm that has been raging since at least the 1800s — and possibly for more than 350 years. Observations with NASA's Juno spacecraft previously indicated that the vertical extent of the Great Red Spot is over 120 miles (200 kilometers), consistent with a storm feature that develops deep in Jupiter's atmosphere. Since NASA's Voyager spacecraft visited Jupiter in 1979, the Great Red Spot has shrunk from about the size of 1.8 Earths to the size of about 1.3 Earths today. NASA's Juno spacecraft has imaged the Great Red Spot numerous times, providing unique information on the details of how the Great Red Spot dynamically changes while it is shrinking. This montage includes five map-projected mosaics of the giant storm, processed from images obtained by the JunoCam imager during several orbits between July 2017 and July 2019. The mosaics show how the Great Red Spot and nearby areas have changed over the course of the Juno mission. Will the Great Red Spot continue to shrink? Only time will tell, but as we study Jupiter's atmosphere, we learn more about how weather systems work, both on giant planets such as Jupiter and Saturn and also on our own home, Earth. Citizen scientist Björn Jónsson created this montage using JunoCam data. The images cover latitudes from about 5 degrees to 38 degrees south. Enhanced image by Björn Jónsson (CC-NC-SA) based on images provided courtesy of NASA/JPL-Caltech/SwRI/MSSS
NASA Voyager 1 took this photo of Jupiter Feb. 1, 1979. Voyager scientists saw that different colors in clouds around the Great Red Spot imply that the clouds swirl around the spot at varying altitudes. http://photojournal.jpl.nasa.gov/catalog/PIA00235

A south tropical disturbance that has just passed Jupiter's iconic Great Red Spot is captured in this color-enhanced image from NASA's Juno spacecraft. Threads of orange haze are pulled from the Great Red Spot by the turbulence of the south tropical disturbance. The image was taken at 3:04 a.m. PDT (6:04 p.m. EDT) on April 1, 2018, as the spacecraft performed its 12th close flyby of Jupiter. Citizen scientist Kevin M. Gill created this image using data from the spacecraft's JunoCam imager. https://photojournal.jpl.nasa.gov/catalog/PIA22938. - Enhanced image by Kevin M. Gill (CC-BY) based on images provided courtesy of NASA/JPL-Caltech/SwRI/MSSS
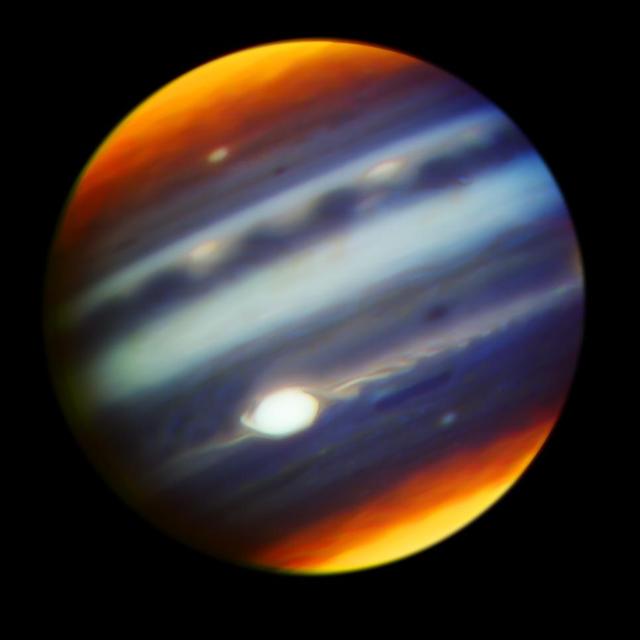
This composite, false-color infrared image of Jupiter reveals haze particles over a range of altitudes, as seen in reflected sunlight. It was taken using the Gemini North Telescope's Near-InfraRed Imager (NIRI) on May 18, 2017, in collaboration with the investigation of Jupiter by NASA's Juno mission. Juno completed its sixth close approach to Jupiter a few hours after this observation. The multiple filters corresponding to each color used in the image cover wavelengths between 1.69 microns and 2.275 microns. Jupiter's Great Red Spot (GRS) appears as the brightest (white) region at these wavelengths, which are primarily sensitive to high-altitude clouds and hazes near and above the top of Jupiter's convective region. The GRS is one of the highest-altitude features in Jupiter's atmosphere. Narrow spiral streaks that appear to lead into it or out of it from surrounding regions probably represent atmospheric features being stretched by the intense winds within the GRS, such as the hook-like structure on its western edge (left side). Some are being swept off its eastern edge (right side) and into an extensive wave-like flow pattern, and there is even a trace of flow from its northern edge. Other features near the GRS include the dark block and dark oval to the south and the north of the eastern flow pattern, respectively, indicating a lower density of cloud and haze particles in those locations. Both are long-lived cyclonic circulations, rotating clockwise -- in the opposite direction as the counterclockwise rotation of the GRS. A prominent wave pattern is evident north of the equator, along with two bright ovals, which are anticyclones that appeared in January 2017. Both the wave pattern and the ovals may be associated with an impressive upsurge in stormy activity that has been observed in these latitudes this year. Another bright anticyclonic oval is seen further north. The Juno spacecraft may pass over these ovals, as well as the Great Red Spot, during its close approach to Jupiter on July 10, 2017, Pacific Time (July 11, Universal Time). High hazes are evident over both polar regions with much spatial structure not previously been seen quite so clearly in ground-based images The filters used for observations combined into this image admit infrared light centered on the following infrared wavelengths (and presented here in these colors): 1.69 microns (blue), 2.045 microns (cyan), 2.169 microns (green), 2.124 microns https://photojournal.jpl.nasa.gov/catalog/PIA21713
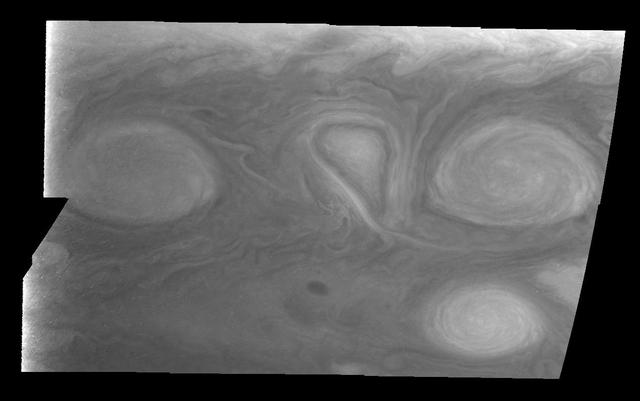
P-21737 BW This picture shows a region of the southern hemisphere extending from the Great Red Spot to the south pole. The white oval is seen beneath the Great Red Spot, and several small scale spots are visible farther to the south. Some of these organized cloud spots have similiar morphologies, such as anticyclonic rotations and cyclonic regions to their west. The presence of the white oval causes the streamlines of the flow to bunch up between it and the Great Red Spot.
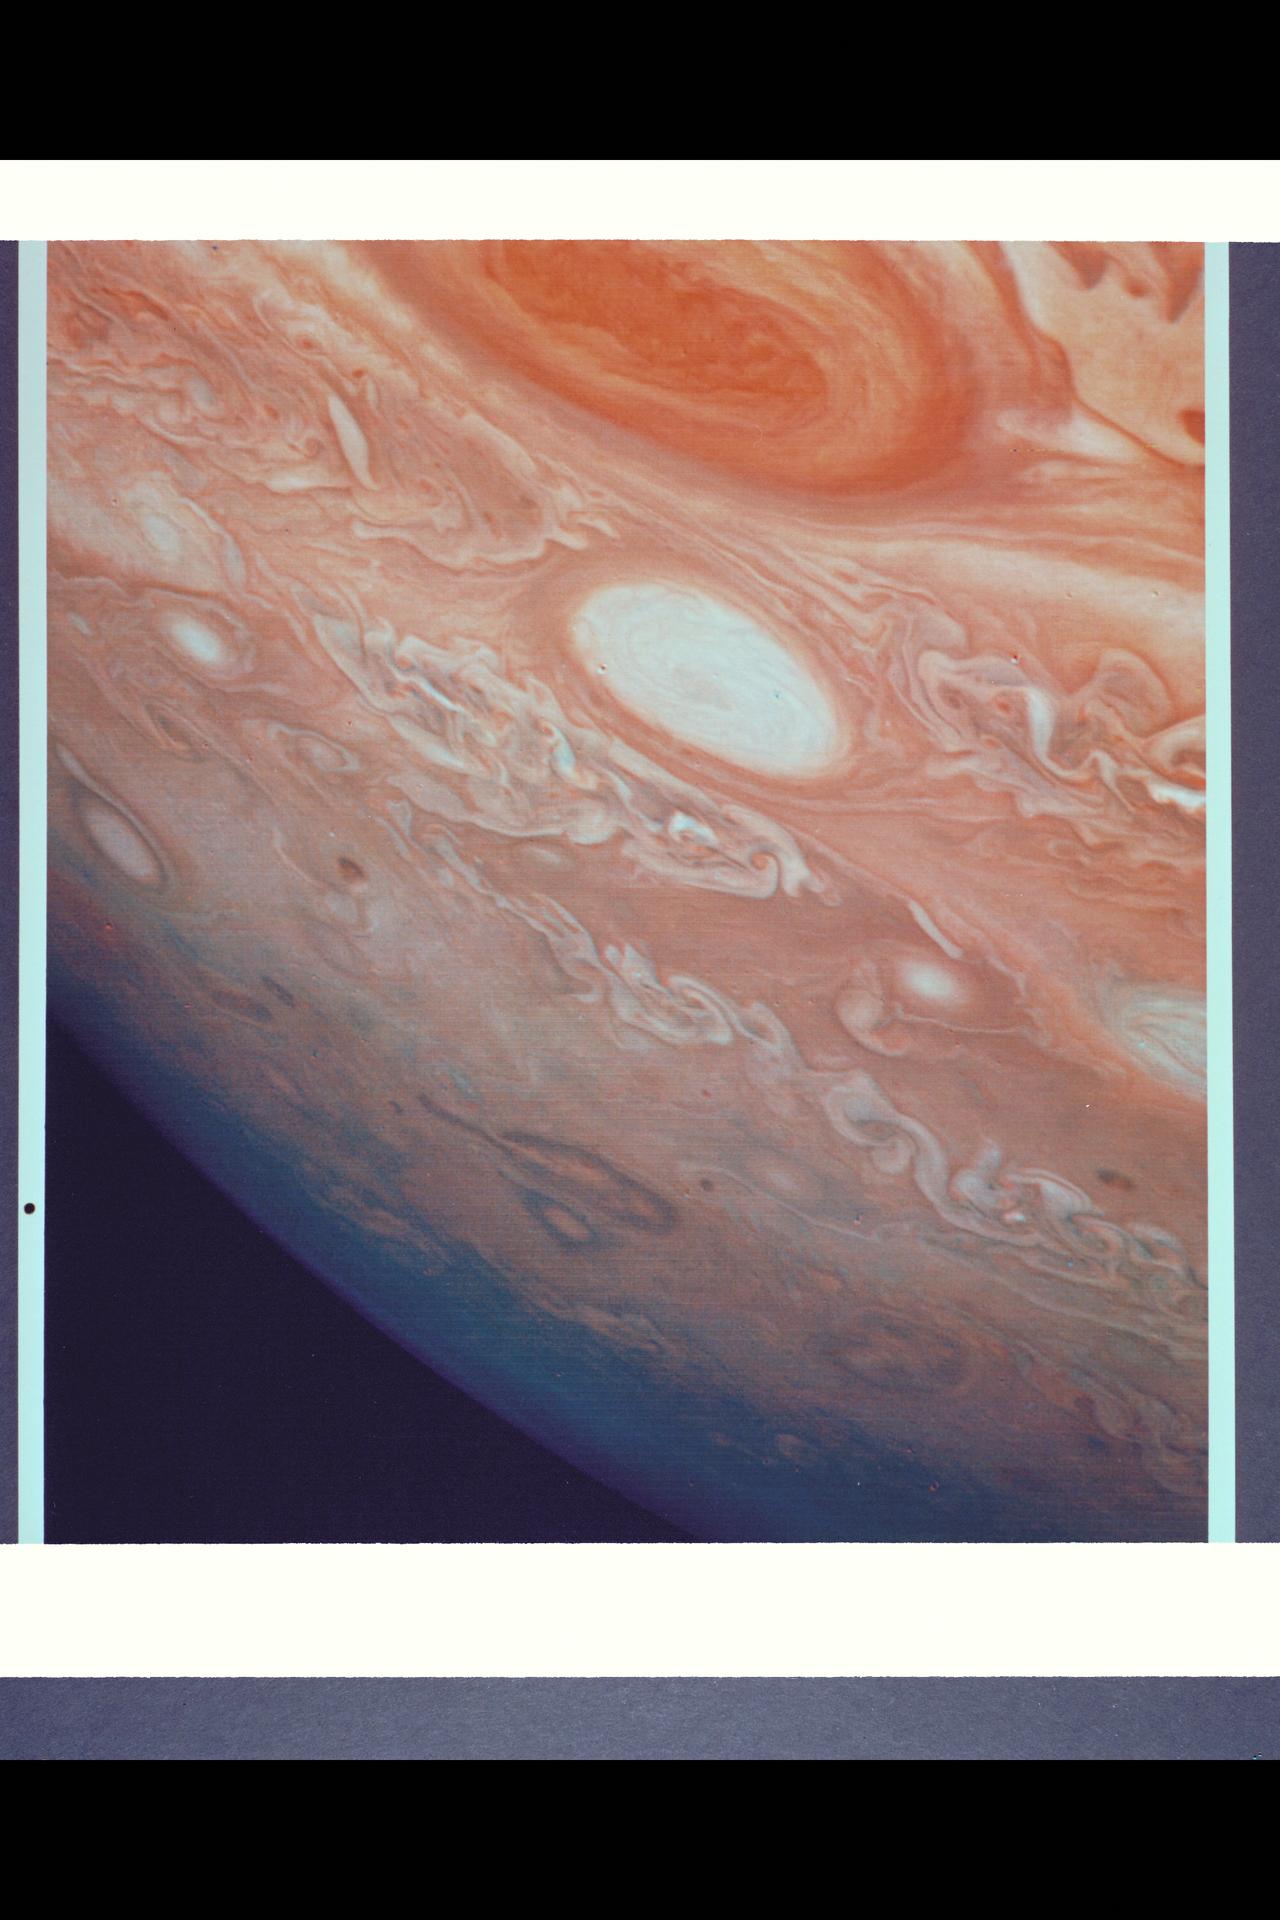
P-21737 C This picture shows a region of the southern hemisphere extending from the Great Red Spot to the south pole. The white oval is seen beneath the Great Red Spot, and several small scale spots are visible farther to the south. Some of these organized cloud spots have similiar morphologies, such as anticyclonic rotations and cyclonic regions to their west. The presence of the white oval causes the streamlines of the flow to bunch up between it and the Great Red Spot.
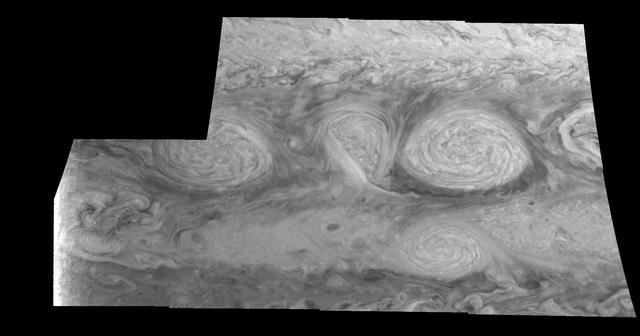
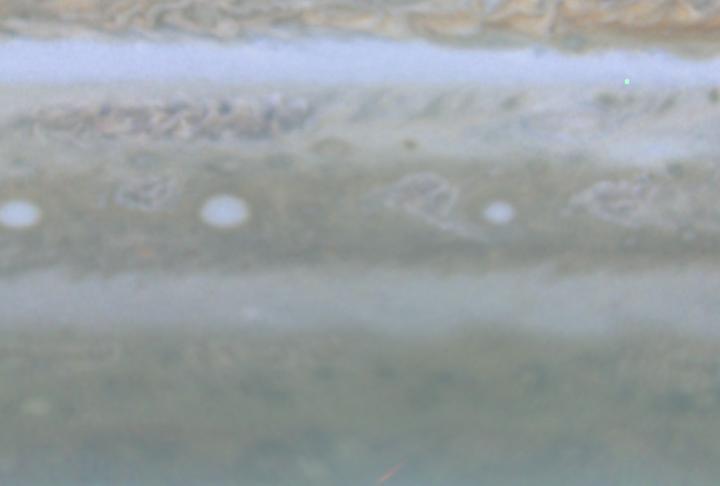
These images, taken on February 19, 1997 by NASA Galileo orbiter, show two of the three long-lived White Ovals that formed to the south of the Jupiter Great Red Spot.
This image is one frame from a movie clip of cloud motions on Jupiter, from the side of the planet opposite to the Great Red Spot. It was taken in the first week of October 2000 by the narrow-angle camera on NASA Cassini spacecraft,
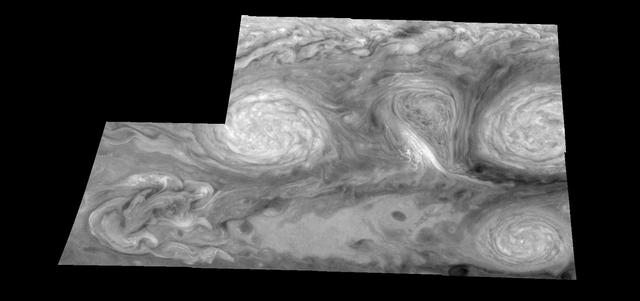
These images, taken on February 19, 1997 by NASA Galileo orbiter, show two of the three long-lived White Ovals that formed to the south of the Jupiter Great Red Spot.
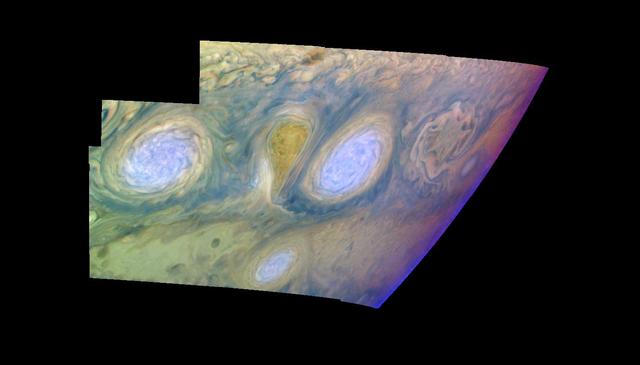
These images, taken on February 19, 1997 by NASA Galileo orbiter, show two of the three long-lived White Ovals that formed to the south of the Jupiter Great Red Spot.
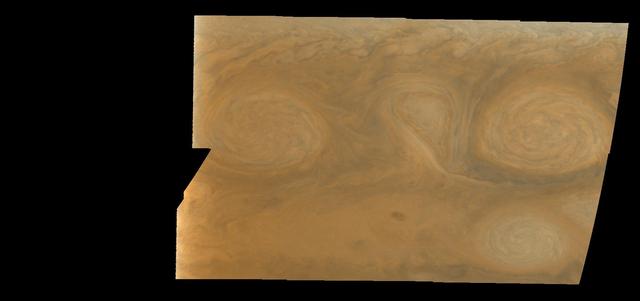
These images, taken on February 19, 1997 by NASA Galileo orbiter, show two of the three long-lived White Ovals that formed to the south of the Jupiter Great Red Spot.
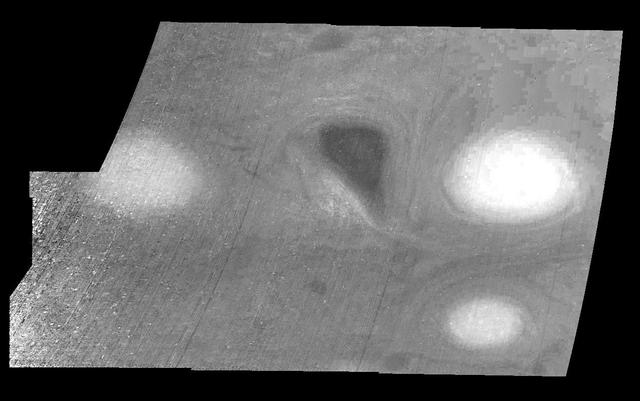
These images, taken on February 19, 1997 by NASA Galileo orbiter, show two of the three long-lived White Ovals that formed to the south of the Jupiter Great Red Spot.
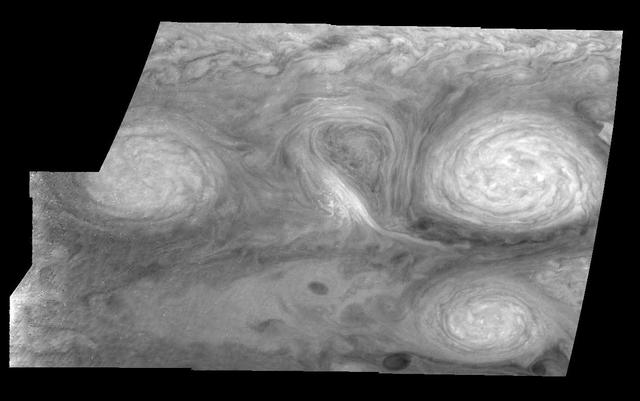
These images, taken on February 19, 1997 by NASA Galileo orbiter, show two of the three long-lived White Ovals that formed to the south of the Jupiter Great Red Spot.
These images, taken on February 19, 1997 by NASA Galileo orbiter, show two of the three long-lived White Ovals that formed to the south of the Jupiter Great Red Spot.

This image taken by NASA Cassini spacecraft on Dec. 1, 2000, shows details of Jupiter Great Red Spot and other features that were not visible in images taken earlier, when Cassini was farther from Jupiter.
This image is a still frame, created from images taken by NASA Cassini spacecraft, shows white oval storms in Jupiter southern hemisphere that rotate counterclockwise, similar to the larger Great Red Spot.

Following the path of one of Jupiter jet streams, a line of v-shaped chevrons travels west to east just above Jupiter Great Red Spot as seen by NASA Cassini spacecraft.
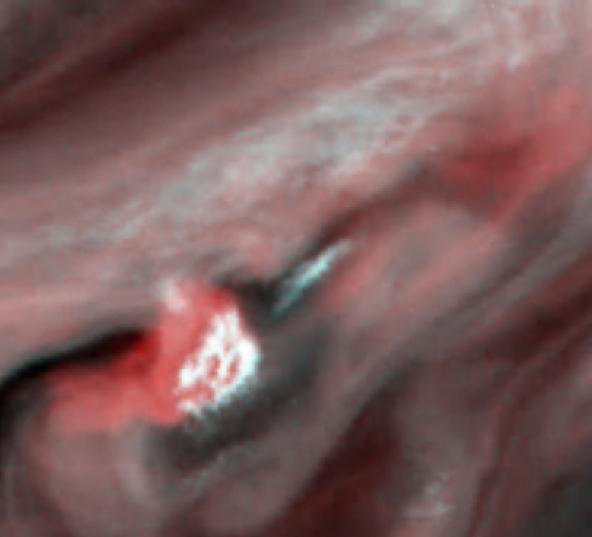
New thermal images from powerful ground-based telescopes show swirls of warmer air and cooler regions never seen before within Jupiter Great Red Spot.
These images, taken on February 19, 1997 by NASA Galileo orbiter, show two of the three long-lived White Ovals that formed to the south of the Jupiter Great Red Spot.
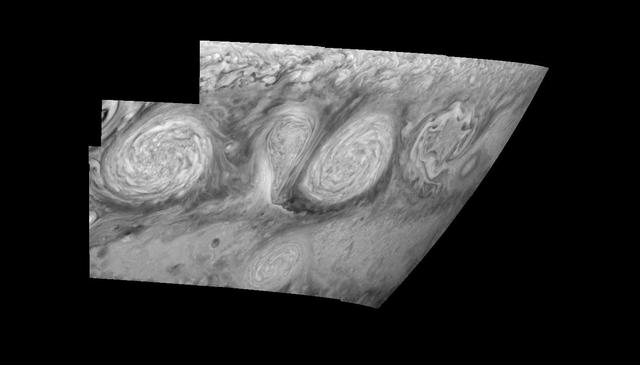
These images, taken on February 19, 1997 by NASA Galileo orbiter, show two of the three long-lived White Ovals that formed to the south of the Jupiter Great Red Spot.
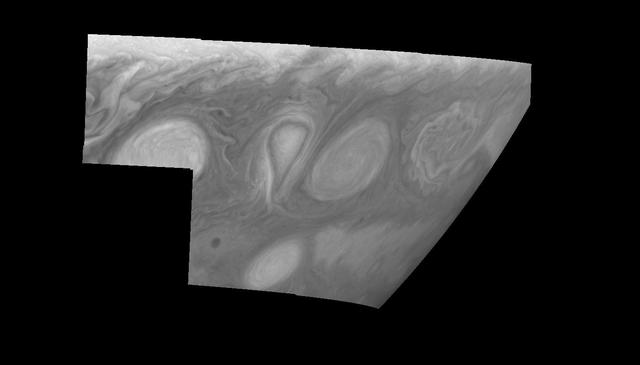
These images, taken on February 19, 1997 by NASA Galileo orbiter, show two of the three long-lived White Ovals that formed to the south of the Jupiter Great Red Spot.
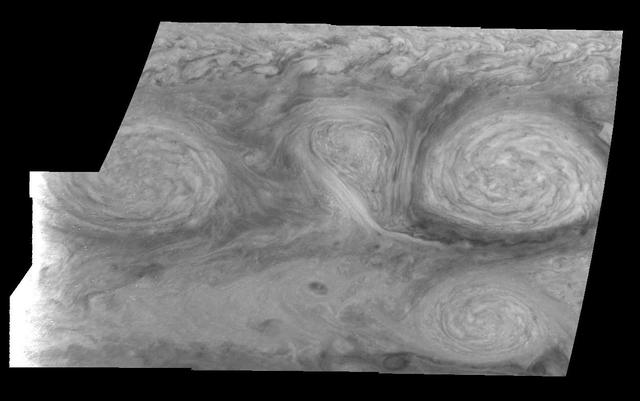
These images, taken on February 19, 1997 by NASA Galileo orbiter, show two of the three long-lived White Ovals that formed to the south of the Jupiter Great Red Spot.

These images, taken on February 19, 1997 by NASA Galileo orbiter, show two of the three long-lived White Ovals that formed to the south of the Jupiter Great Red Spot.
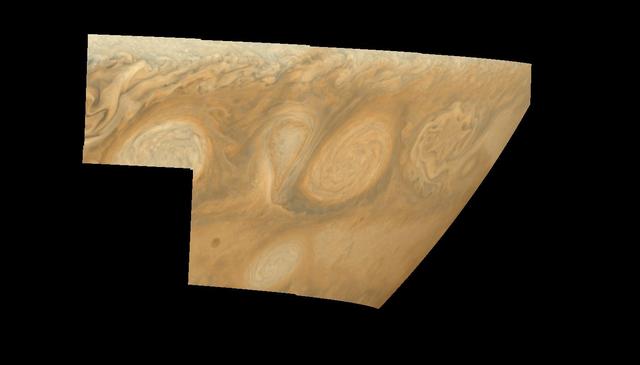
These images, taken on February 19, 1997 by NASA Galileo orbiter, show two of the three long-lived White Ovals that formed to the south of the Jupiter Great Red Spot.
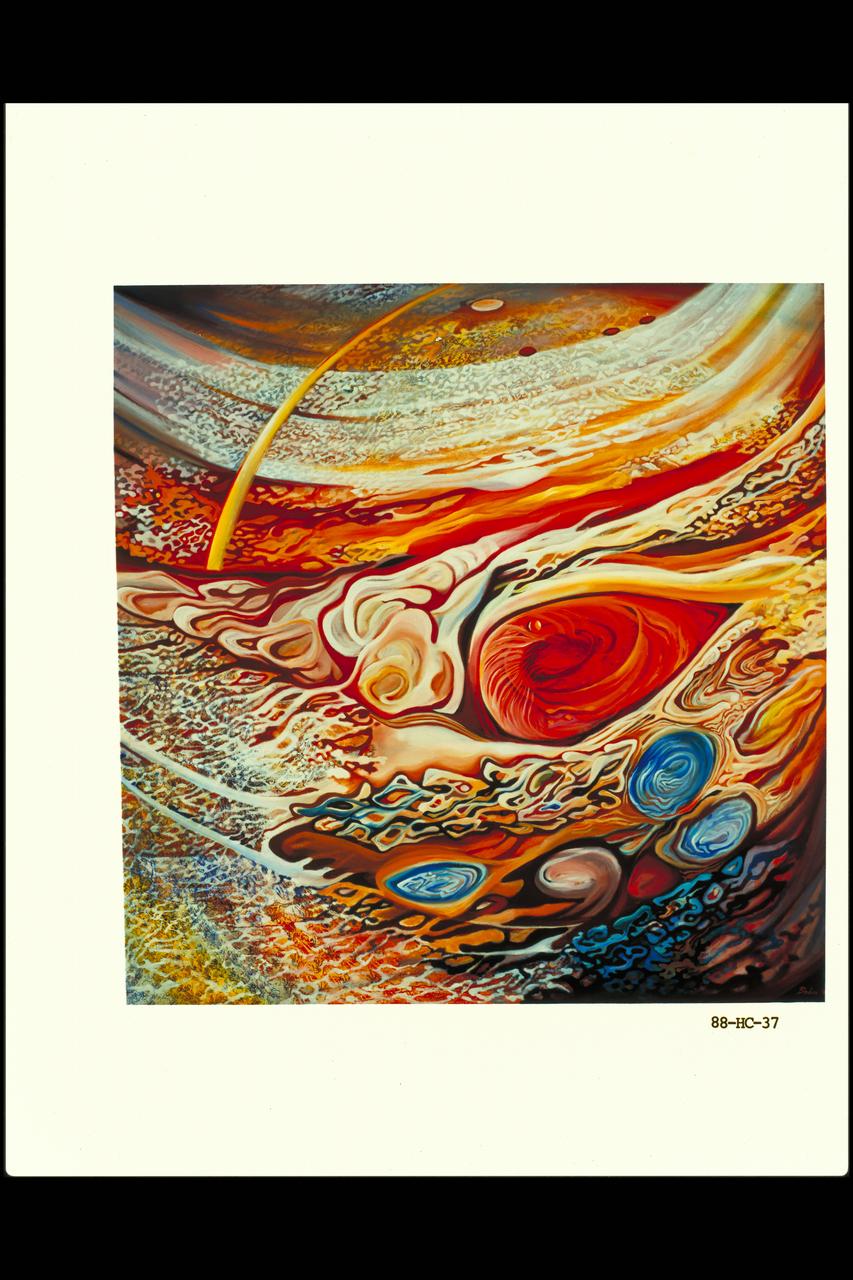
Oil painting depicting the storms of Jupiter, the satellite Io and the Great Red Spot

NASA's Voyager 1 took this photo of Jupiter and two of its satellites Io, left, and Europa on Feb. 13, 1979. Io is above Jupiter Great Red Spot; Europa is above Jupiter clouds. The poles are dark and reddish. http://photojournal.jpl.nasa.gov/catalog/PIA00144

Jupiter, its Great Red Spot and three of its four largest satellites are visible in this photo taken Feb. 5, 1979, by Voyager 1. Io, Europa, and Callisto are seen against Jupiter disk. http://photojournal.jpl.nasa.gov/catalog/PIA00358
Jupiter as seen by Voyager 1, mosic of Great Red Spot. (JPL ref. No. P-21203)
Range : 5.7 million miles(9.2 million kilometers) Image shows Jupiter's Great Red Spot and surroundings. Cloud detail as small as 100 miles (160 kilometers) across can be seen. Colorful, wavy cloud pattern left of the Red Spot is a region of complex and variable wave motion.
Range : 9.2 million kilometers (3.7 million miles) This photo shows Jupiter's Great Red Spot and its surroundings. Shown is cloud detail that is 100 miles (160 km) across. The colorful, wavy cloud pattern to the left of the Red Spot is a region of complex and variable wave motion. Photo taken through a violet filter.