NASA Shuttle Radar Topography Mission SRTM has produced the first high-resolution, near-global elevation dataset of Earth.
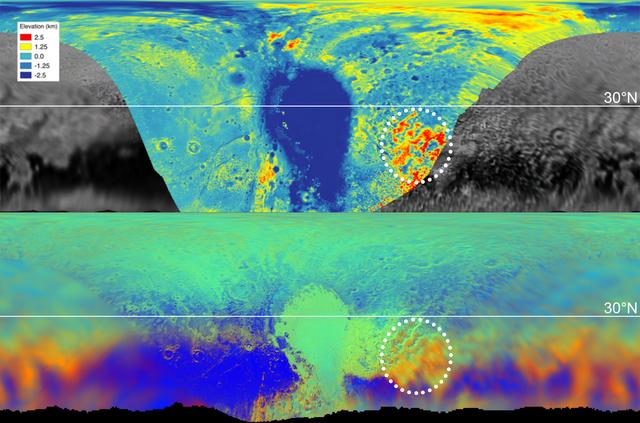
These maps are from New Horizons' data on the topography (top) and composition (bottom) of Pluto's surface. In the high-resolution topographical map, the highlighted red region is high in elevation. The map below, showing the composition, indicates the same section also contains methane, color-coded in orange. One can see the orange features spread into the fuzzier, lower-resolution data that covers the rest of the globe, meaning those areas, too, are high in methane, and therefore likely to be high in elevation. https://photojournal.jpl.nasa.gov/catalog/PIA22036
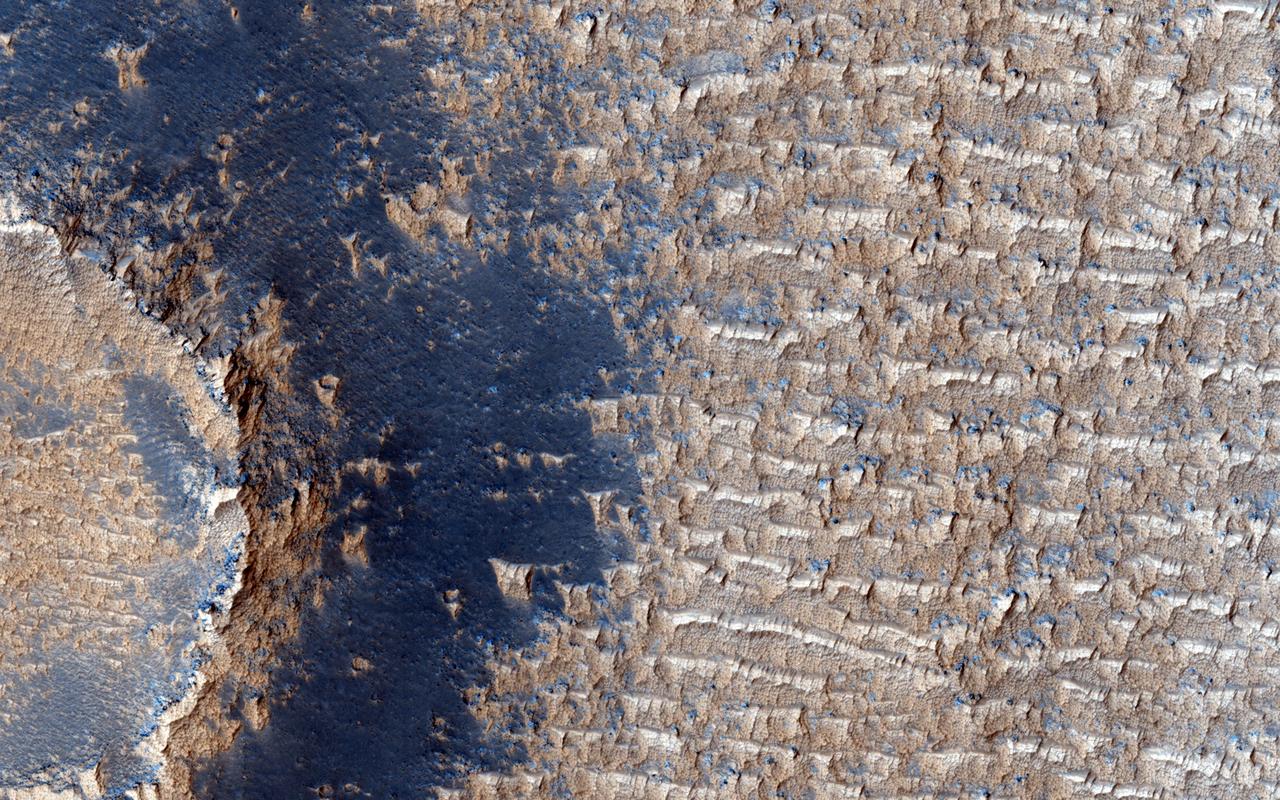
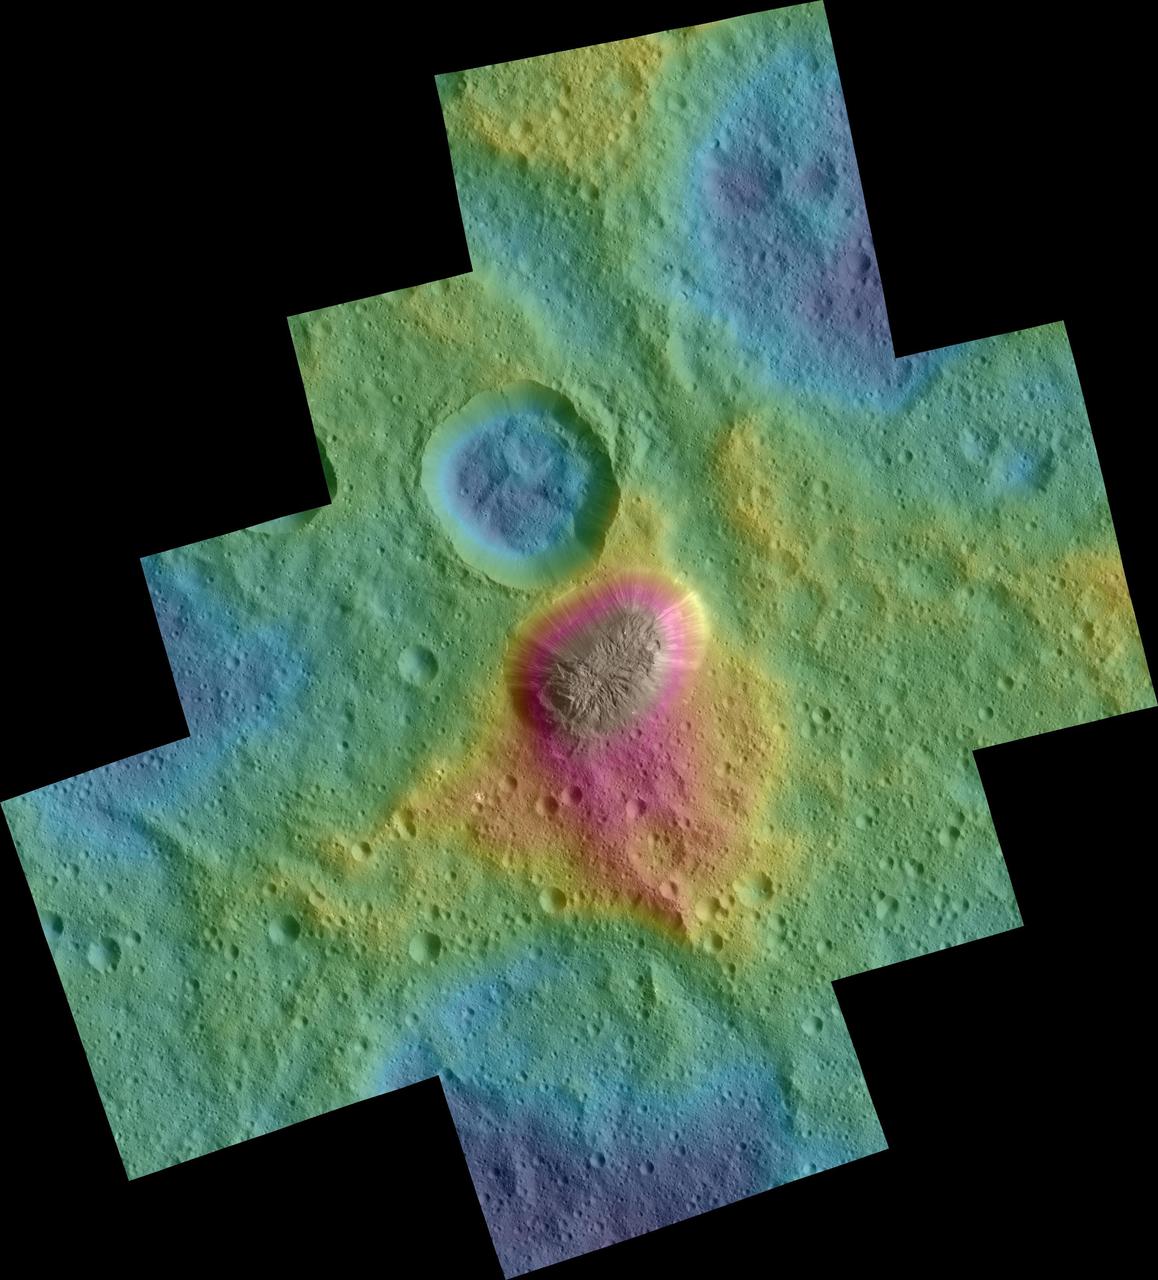
This image from NASA Mars Reconnaissance Orbiter shows curious bright deposits in Syria Planum, a high elevation region near the summit of the Tharsis rise.
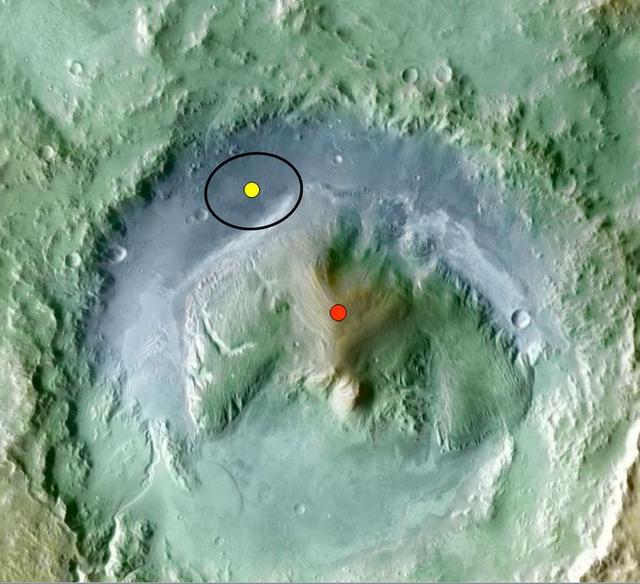
Color coding in this image of Gale Crater on Mars represents differences in elevation. The vertical difference from a low point inside the landing ellipse for NASA Mars Science Laboratory yellow dot to a high point on the mountain inside the crater.
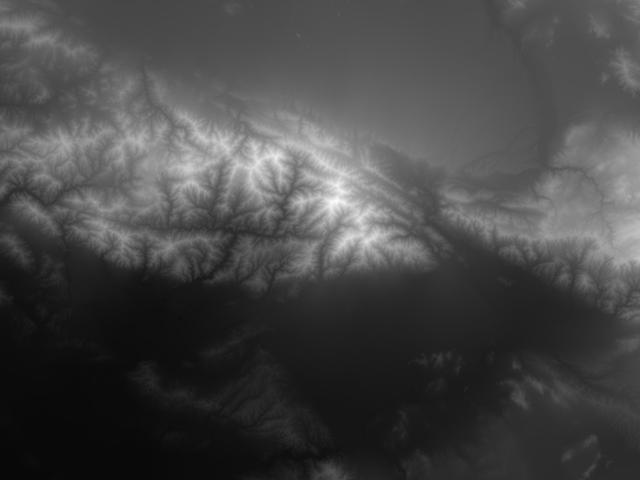
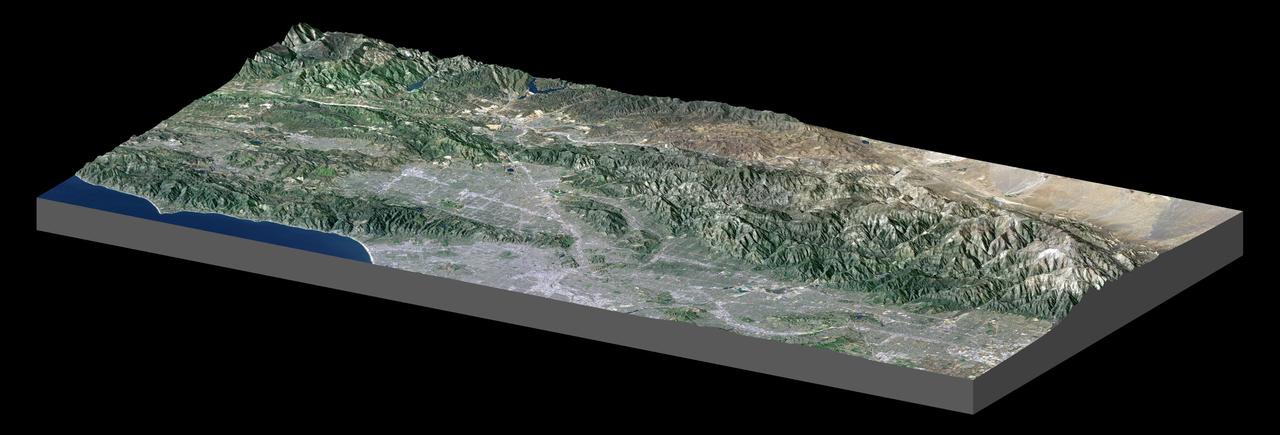
JSC2000E01553 (January 2000) --- This USGS elevation model showing increasing elevation as increasing brightness is included here for comparison purposes with the high-resolution topographic elevation map image in E01554. Both images depict the San Bernadino and San Gabriel Mountains in California, north of Los Angeles.
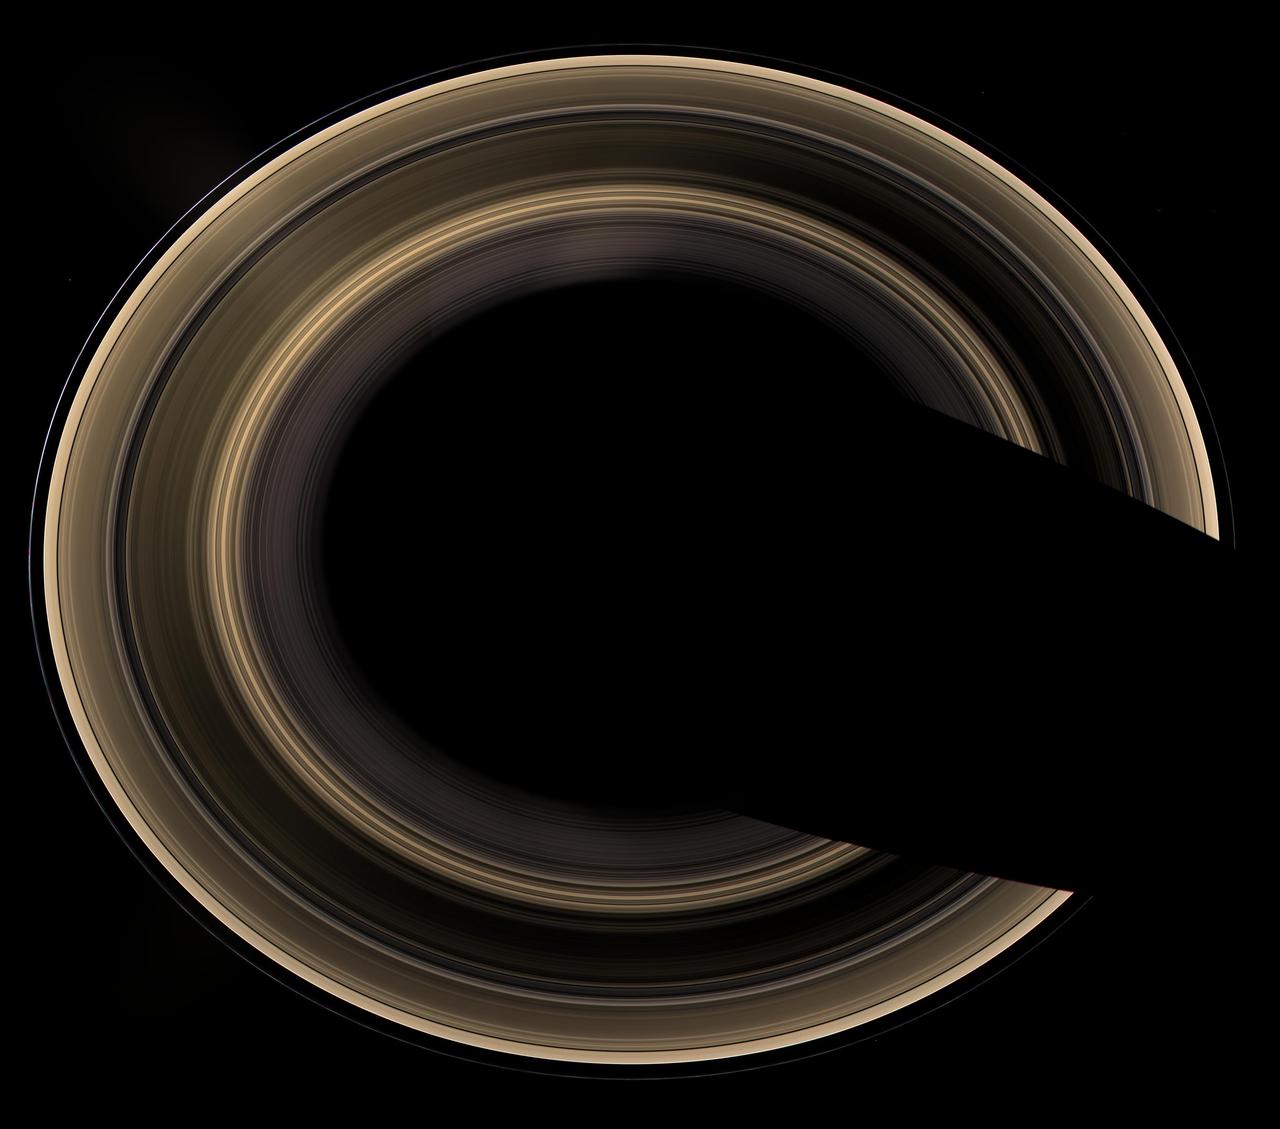
Our robotic emissary, flying high above Saturn, captured this view of an alien copper-colored ring world. The overexposed planet has deliberately been removed to show the unlit rings alone, seen from an elevation of 60 degrees
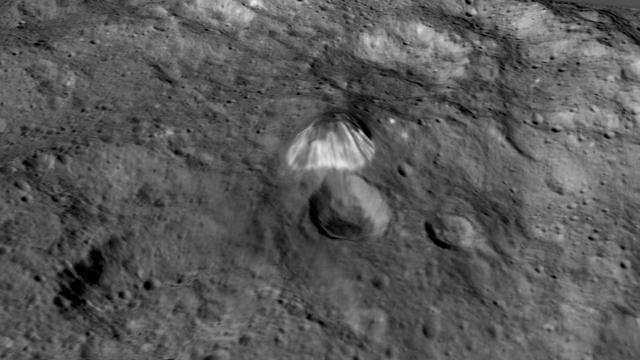
Among the highest features seen on Ceres so far is a mountain about 4 miles (6 kilometers) high, which is roughly the elevation of Mount McKinley in Alaska's Denali National Park. This image comes from an animation, shown in PIA19619, generated using data from NASA's Dawn spacecraft. Vertical relief has been exaggerated by a factor of five. Exaggerating the relief helps scientists understand and visualize the topography much more easily, and highlights features that are sometimes subtle. http://photojournal.jpl.nasa.gov/catalog/PIA19618
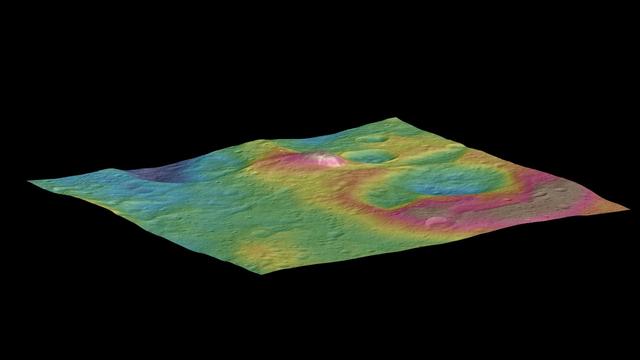
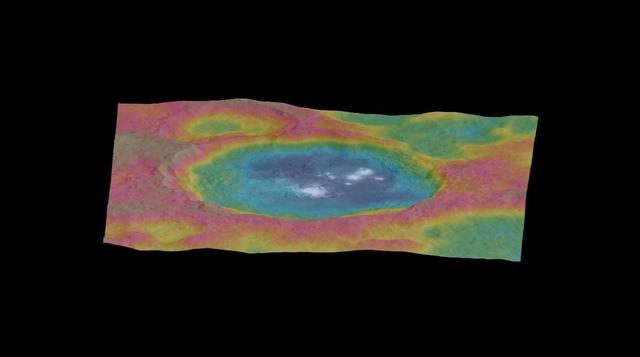
This view, made using images taken by NASA's Dawn spacecraft, features a tall conical mountain on Ceres. Elevations span a range of about 5 miles (8 kilometers) from the lowest places in this region to the highest terrains. Blue represents the lowest elevation, and brown is the highest. The white streaks seen running down the side of the mountain are especially bright parts of the surface. The image was generated using two components: images of the surface taken during Dawn's High Altitude Mapping Orbit (HAMO) phase, where it viewed the surface at a resolution of about 450 feet (140 meters) per pixel, and a shape model generated using images taken at varying sun and viewing angles during Dawn's lower-resolution Survey phase. The image of the region is color-coded according to elevation, and then draped over the shape model to give this view. http://photojournal.jpl.nasa.gov/catalog/PIA19976
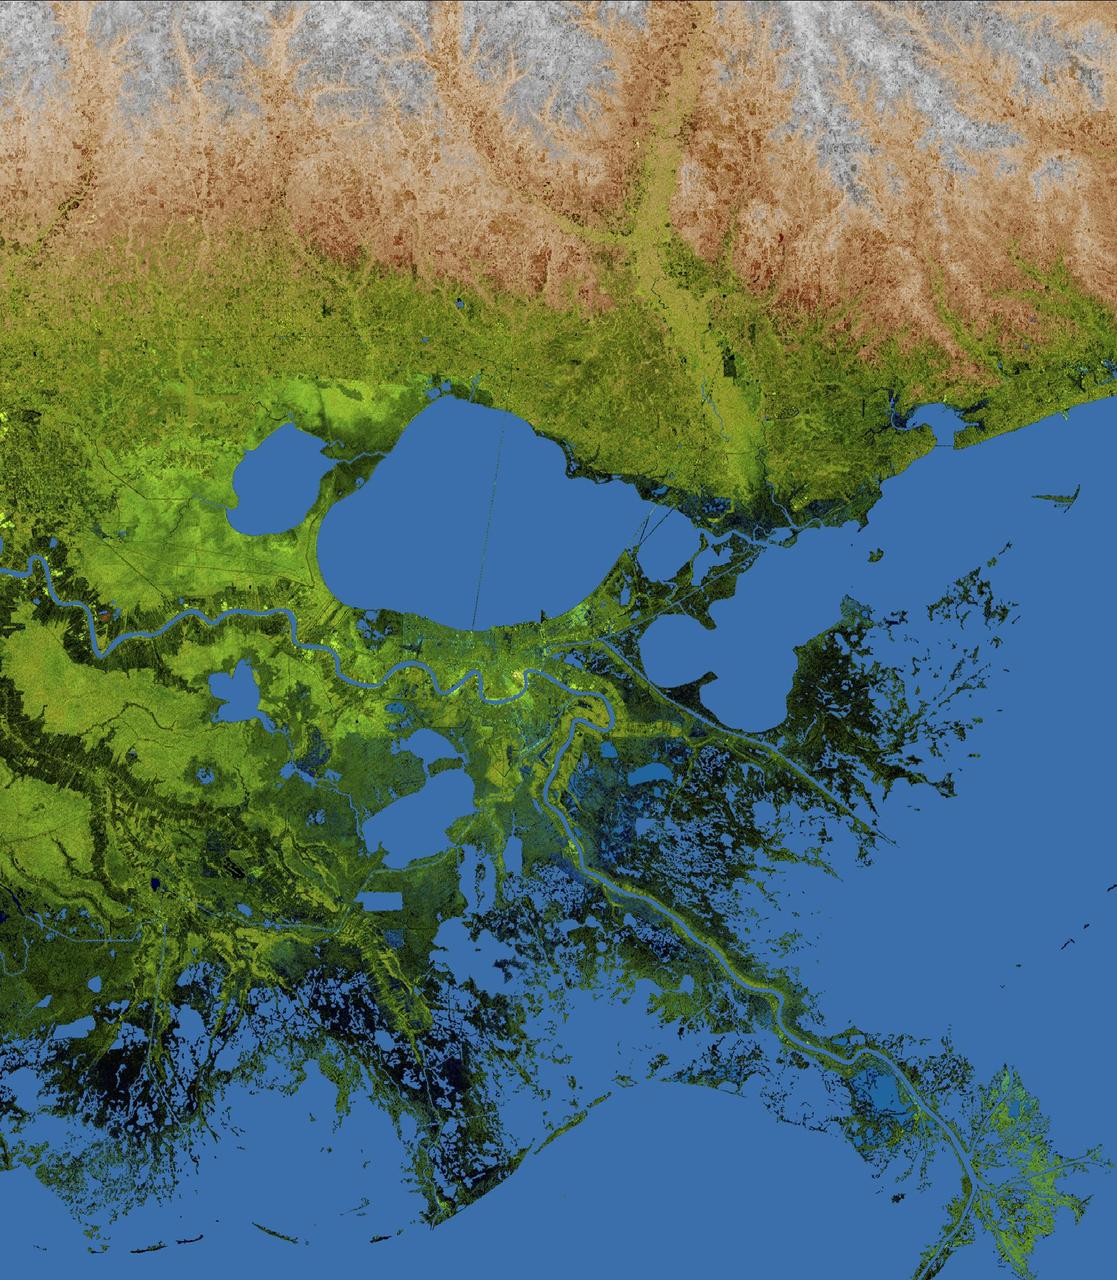
The geography of the New Orleans and Mississippi delta region is well shown in this radar image from the Shuttle Radar Topography Mission. In this image, bright areas show regions of high radar reflectivity, such as from urban areas, and elevations have been coded in color using height data also from the mission. Dark green colors indicate low elevations, rising through yellow and tan, to white at the highest elevations. New Orleans is situated along the southern shore of Lake Pontchartrain, the large, roughly circular lake near the center of the image. The line spanning the lake is the Lake Pontchartrain Causeway, the world's longest over water highway bridge. Major portions of the city of New Orleans are below sea level, and although it is protected by levees and sea walls, flooding during storm surges associated with major hurricanes is a significant concern. http://photojournal.jpl.nasa.gov/catalog/PIA04175
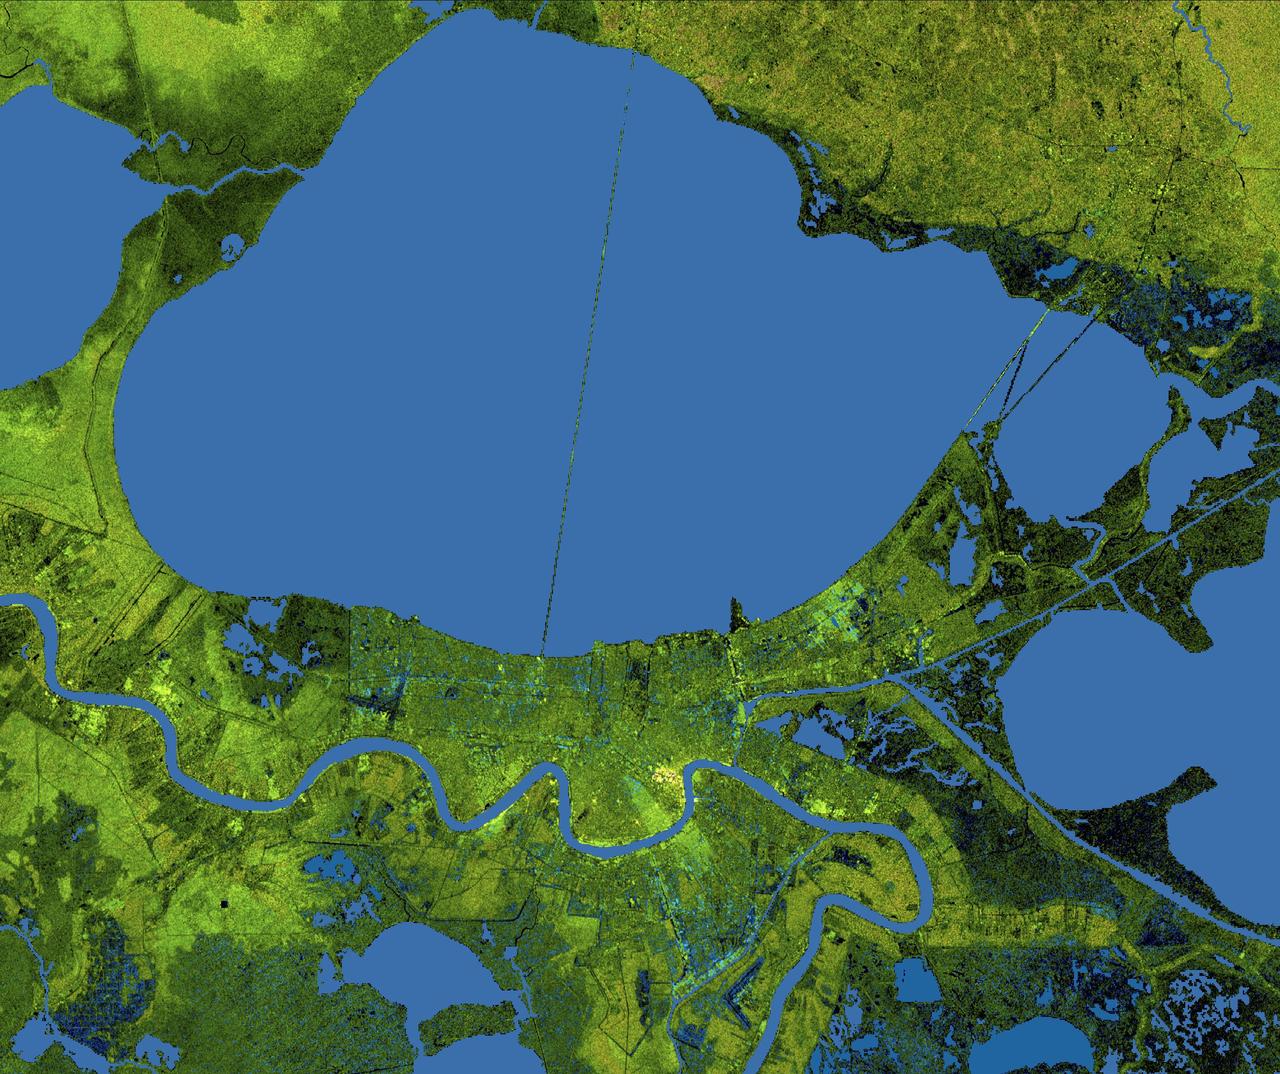
The city of New Orleans, situated on the southern shore of Lake Pontchartrain, is shown in this radar image from the Shuttle Radar Topography Mission (SRTM). In this image bright areas show regions of high radar reflectivity, such as from urban areas, and elevations have been coded in color using height data also from the SRTM mission. Dark green colors indicate low elevations, rising through yellow and tan, to white at the highest elevations. New Orleans is near the center of this scene, between the lake and the Mississippi River. The line spanning the lake is the Lake Pontchartrain Causeway, the world’s longest overwater highway bridge. Major portions of the city of New Orleans are actually below sea level, and although it is protected by levees and sea walls that are designed to protect against storm surges of 18 to 20 feet, flooding during storm surges associated with major hurricanes is a significant concern. http://photojournal.jpl.nasa.gov/catalog/PIA04174
These color topographic views show variations in surface height around Ahuna Mons, a mysterious mountain on Ceres. The views are colorized versions of PIA20348 and PIA20349. They represent an update to the view in PIA19976, which showed the mountain using data from an earlier, higher orbit. Both views were made using images taken by NASA's Dawn spacecraft during its low-altitude mapping orbit, at a distance of about 240 miles (385 kilometers) from the surface. The resolution of the component images is about 120 feet (35 meters) per pixel. Elevations span a range of about 5.5 miles (9 kilometers) from the lowest places in the region to the highest terrains. Blue represents the lowest elevation, and brown is the highest. The streaks running down the side of the mountain, which appear white in the grayscale view, are especially bright parts of the surface (the brightness does not relate to elevation). The elevations are from a shape model generated using images taken at varying sun and viewing angles during Dawn's lower-resolution, high-altitude mapping orbit (HAMO) phase. The side perspective view was generated by draping the image mosaics over the shape model. http://photojournal.jpl.nasa.gov/catalog/PIA20399
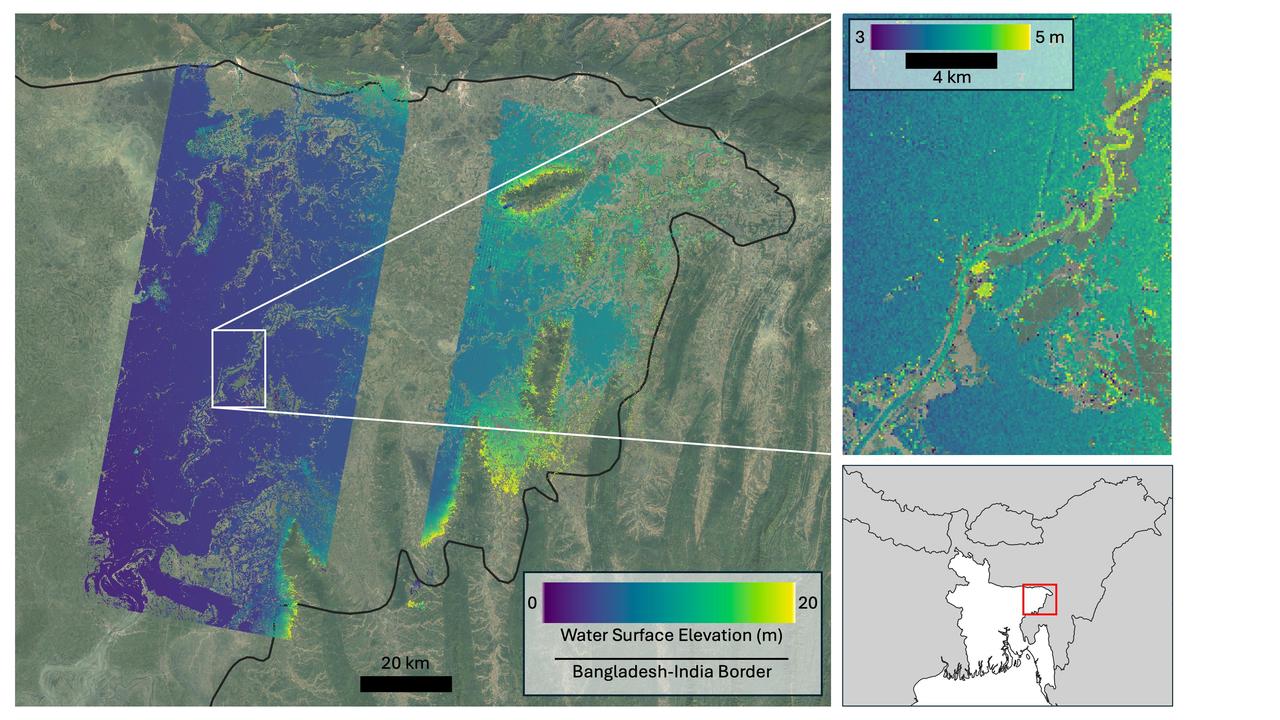
Flooding from monsoon rains covers a wide region of northeast Bangladesh near the India border in this Oct. 8, 2023, image showing data from the U.S.-French Surface Water and Ocean Topography (SWOT) satellite. Around that time, heavy monsoon rains affected various parts of Bangladesh, including the region depicted here, home to Sylhet, the country's fifth-largest city (population approximately 700,000). Sylhet and surrounding areas experienced substantial flooding. The SWOT data, overlaid on a standard Google Earth image, shows the precise surface elevation of the floodwaters. The vast majority of the land area within the region imaged by SWOT is flooded. In the main image at left, dark blue indicates waters just above sea level, while yellow represents 65 feet (20 meters) above sea level. The inset at top right zooms in on a section of the Kalni River, a tributary of one of Bangladesh's three major rivers, the Meghna. The main channel of the Kalni is about 650 feet (200 meters) wide. In the inset at top right, dark blue indicates water about 10 feet (3 meters) above sea level and yellow is used for waters about 16 feet (5 meters) above sea level. The zoomed-in data can be used to determine the slope of the river, which tells hydrologists how fast water flows through it and off a landscape. The water surface elevations depicted are higher in the top right of the inset than they are in the bottom left. The data also shows the elevation of the river is generally greater than that of water in the floodplain around it, telling hydrologists that water is likely flowing from the river into the floodplain. Each pixel in the image represents an area that is about 330 feet by 330 feet (100 meters by 100 meters). The image shows data from SWOT's Ka-band Radar Interferometer (KaRIn) instrument antennas, which don't cover a 12-mile-wide (20-kilometer-wide) strip right underneath the satellite. For that gap, a separate instrument collects water surface elevation data that isn't shown here. Bangladesh is a low-lying, generally flat country that chronically suffers from two types of flooding. Monsoon rains cause rivers that flow into Bangladesh from neighboring countries, especially India, to flood. And flash flooding occurs during the pre-monsoon season and can damage agricultural crops if not forecast with sufficient warning. While the use of satellite altimetry and precipitation in models has shown some promise for flood forecasting in Bangladesh, forecasting both types of flooding with sufficient lead time has remained challenging due to a lack of timely, high-spatial-resolution information on water elevation. SWOT is the first satellite to provide this information over entire regions, enabling improved forecasts and filling the data gap when places like Bangladesh become inundated. The Bangladesh Water Development Board, which is in charge of national flood forecasting and management, is now exploring how to incorporate SWOT water elevation information into its flood inundation forecasting system. Since shortly after launch in December 2022, SWOT has been measuring the height of nearly all water on Earth's surface, developing one of the most detailed, comprehensive views yet of the planet's oceans and freshwater lakes and rivers. The mission science team makes measurements using the KaRIn instrument. With two antennas spread 33 feet (10 meters) apart on a boom, KaRIn produces a pair of data swaths as it circles the globe, bouncing radar pulses off water surfaces to collect surface-height information. https://photojournal.jpl.nasa.gov/catalog/PIA26343
This still from an animation, made using images taken by NASA's Dawn spacecraft, features a color-coded topographic map of Occator crater on Ceres. Elevations span a range of about 4 miles (6 kilometers) from the lowest places in Occator to the highest terrains surrounding the crater. Blue is the lowest elevation, and brown is the highest. The animation was generated using two components: images of the surface taken during Dawn's High Altitude Mapping Orbit (HAMO) phase, where it viewed the surface at a resolution of about 450 feet (140 meters) per pixel, and a shape model generated using images taken at varying sun and viewing angles during Dawn's lower-resolution Survey phase. The shape model, which has been stretched by 1.5 times in the vertical direction to better illustrate the crater's topography. An animation is available is http://photojournal.jpl.nasa.gov/catalog/PIA19891
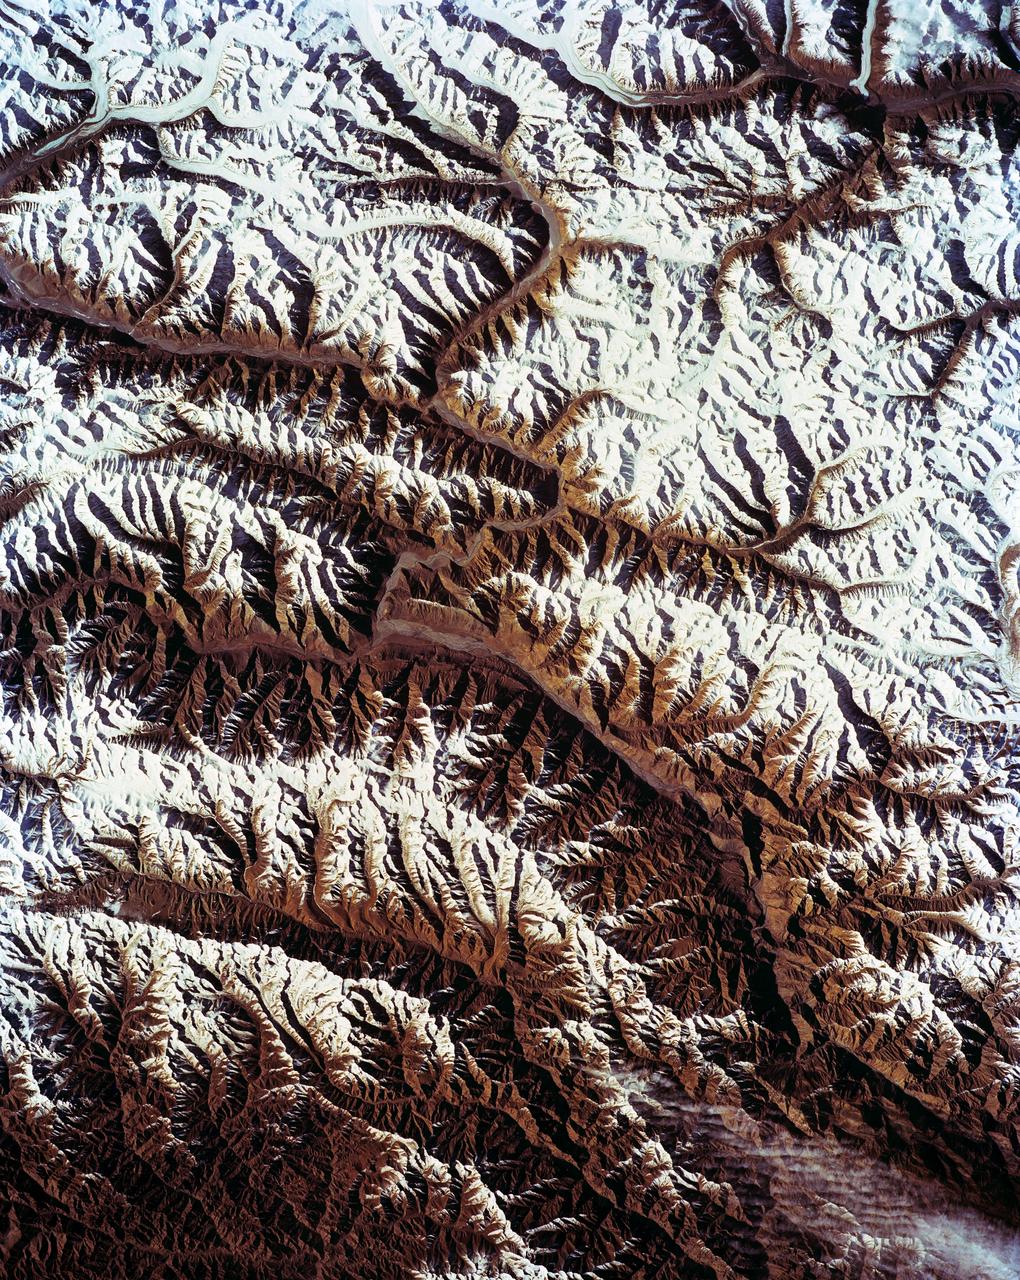
STS-56 Earth observation shows of some of the highest mountain peaks in the world taken from Discovery, Orbiter Vehicle (OV) 103, as it passed over India and China. The top of the view shows one of the snow and ice-covered massifs in the great Karakorum Range of north India. A star-shaped peak at top left reaches 23,850 feet. Glaciers can be seen in valleys at these high elevations. The international border between India to the south (top) and China (bottom) snakes left to right along a river near the top of the scene, then veers into the muntains at top left. Larger valleys, despite their elevation (all in excess of 14,000 feet), are occupied by transport routes joining points in India, China and the southern republics of the CIS. The ancient Silk Route between China and the Middle East lies not far to the north (outside the bottom of the frame).

NASA Administrator Charles Bolden, left, and Centre National d'Études Spatiales (CNES) President Jean-Yves Le Gall talk after signing an agreement to move from feasibility studies to implementation of the Surface Water and Ocean Topography (SWOT) mission, Friday, May 2, 2014 at NASA Headquarters in Washington. The SWOT mission will use wide swath altimetry technology to produce high-resolution elevation measurements of the surface of lakes, reservoirs, and wetlands and of the ocean surface. Photo Credit: (NASA/Bill Ingalls)
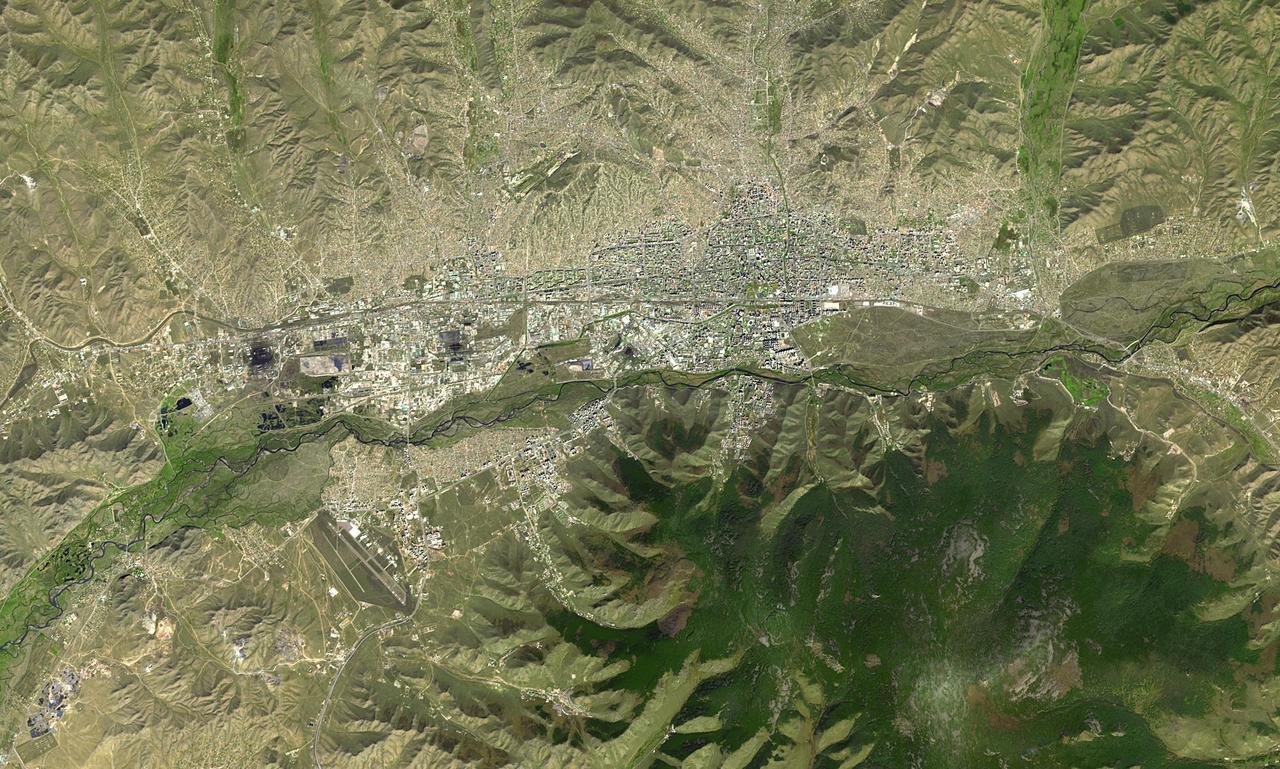
Ulaanbaatar is the capital of Mongolia, and is home to over half the country's population of about 3 million people. Human habitation dates back more than 300,000 years. The city is located along the Tuul River Valley. Due to its location deep in the interior of Asia, and its high elevation, Ulaanbaatar is the coldest national capital in the world. The image was acquired September 19, 2022, covers an area of 21.2 by 36.6 km, and is located at 47.9 degrees north, 106.9 degrees east. https://photojournal.jpl.nasa.gov/catalog/PIA26289

NASA Administrator Charles Bolden, left, and Centre National d'Études Spatiales (CNES) President Jean-Yves Le Gall sign an agreement to move from feasibility studies to implementation of the Surface Water and Ocean Topography (SWOT) mission, Friday, May 2, 2014 at NASA Headquarters in Washington. The SWOT mission will use wide swath altimetry technology to produce high-resolution elevation measurements of the surface of lakes, reservoirs, and wetlands and of the ocean surface. Photo Credit: (NASA/Bill Ingalls)
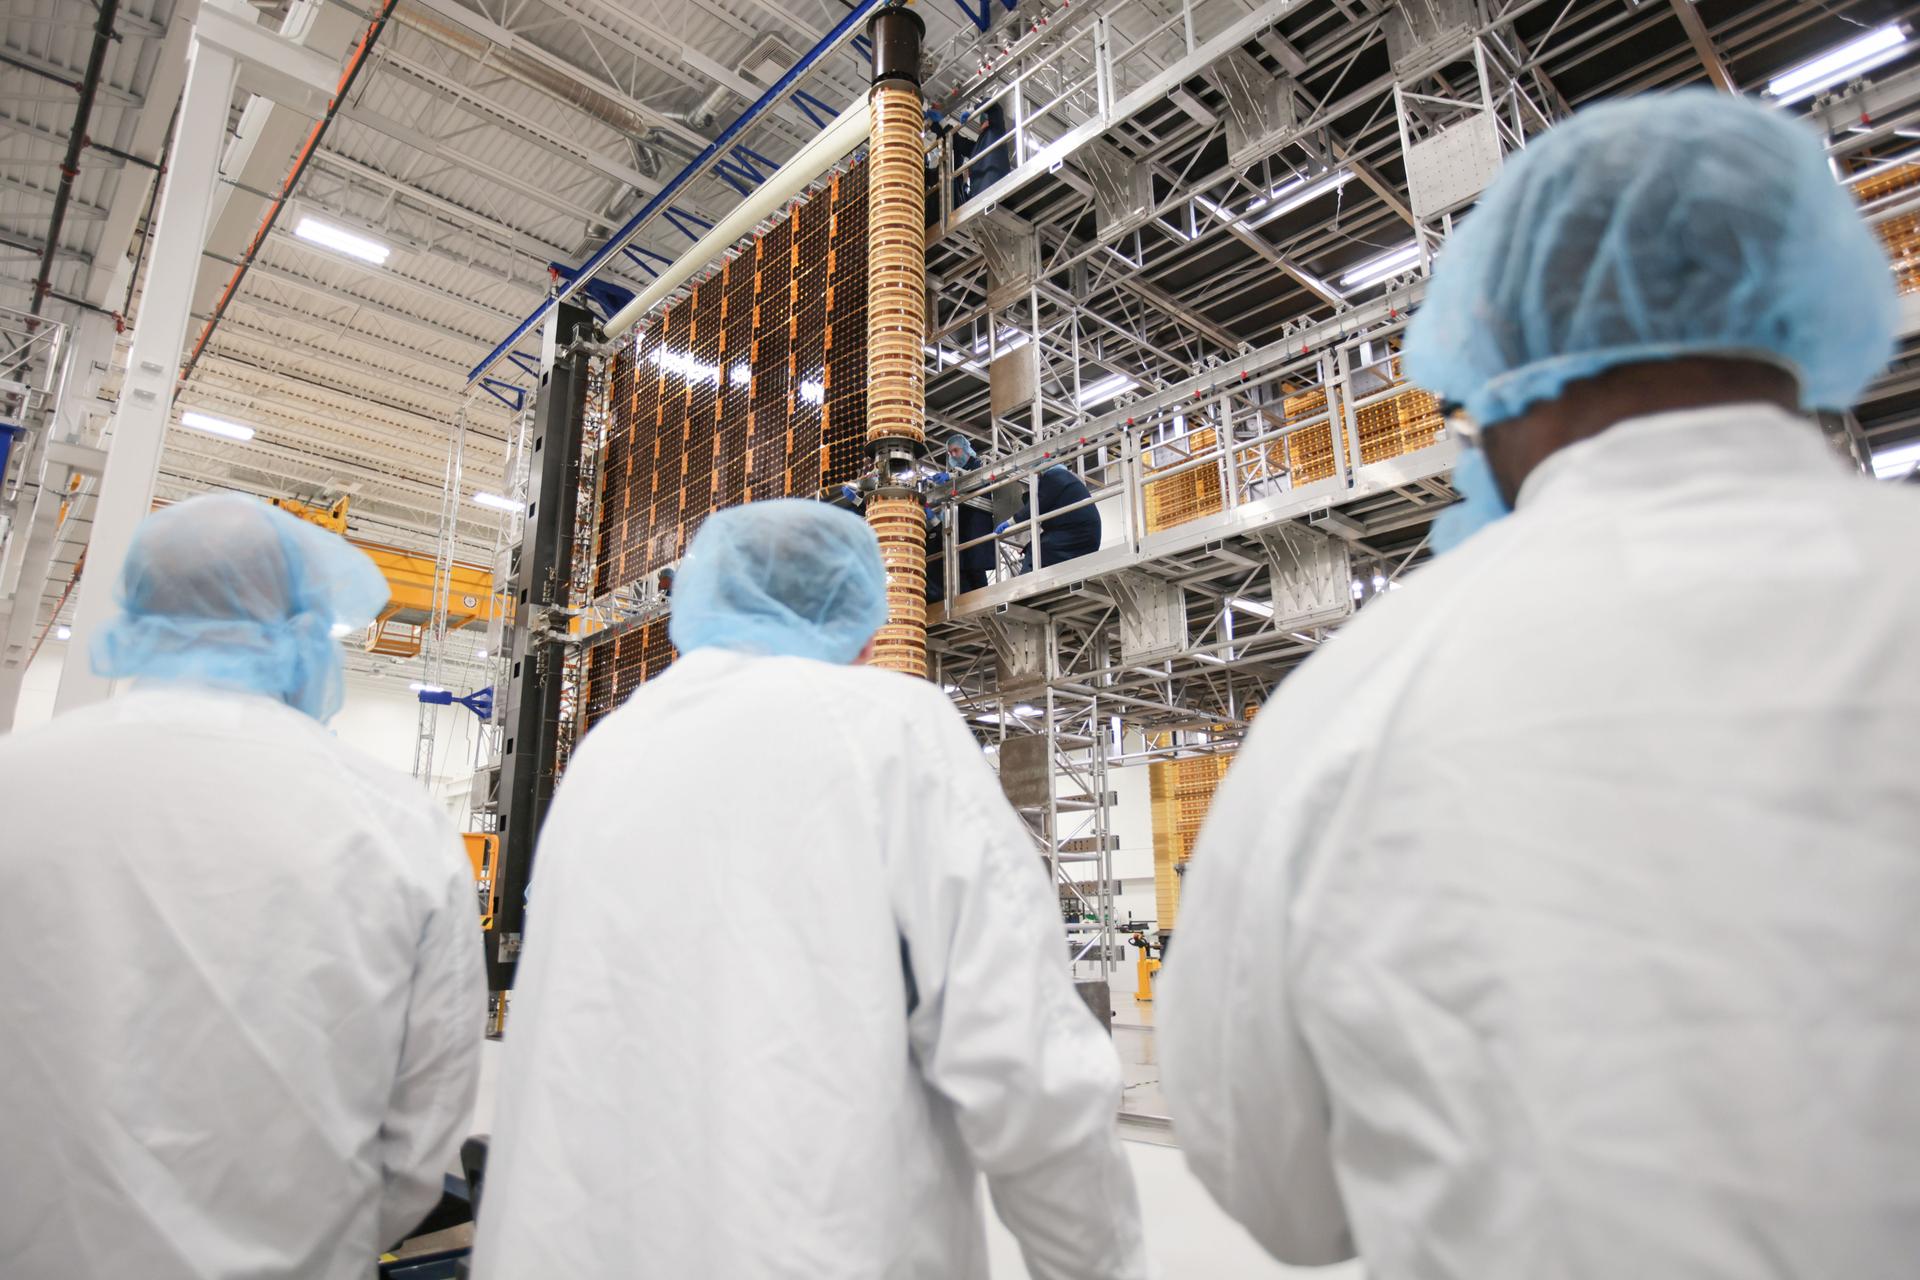
NASA and industry team members observe a Roll-Out Solar Array (ROSA) wing for Gateway as it deploys inside Redwire’s high-bay facility in Goleta, California, during a test on June 30, 2025. The image shows the solar array partially extended as technicians monitor the process from the facility floor and elevated work platforms. Credit: Lanteris Space Systems

NASA structural materials engineer, Jonathan Lee, displays blocks and pistons as examples of some of the uses for NASA’s patented high-strength aluminum alloy originally developed at Marshall Space Flight Center in Huntsville, Alabama. NASA desired an alloy for aerospace applications with higher strength and wear-resistance at elevated temperatures. The alloy is a solution to reduce costs of aluminum engine pistons and lower engine emissions for the automobile industry. The Boats and Outboard Engines Division at Bombardier Recreational Products of Sturtevant, Wisconsin is using the alloy for pistons in its Evinrude E-Tec outboard engine line.
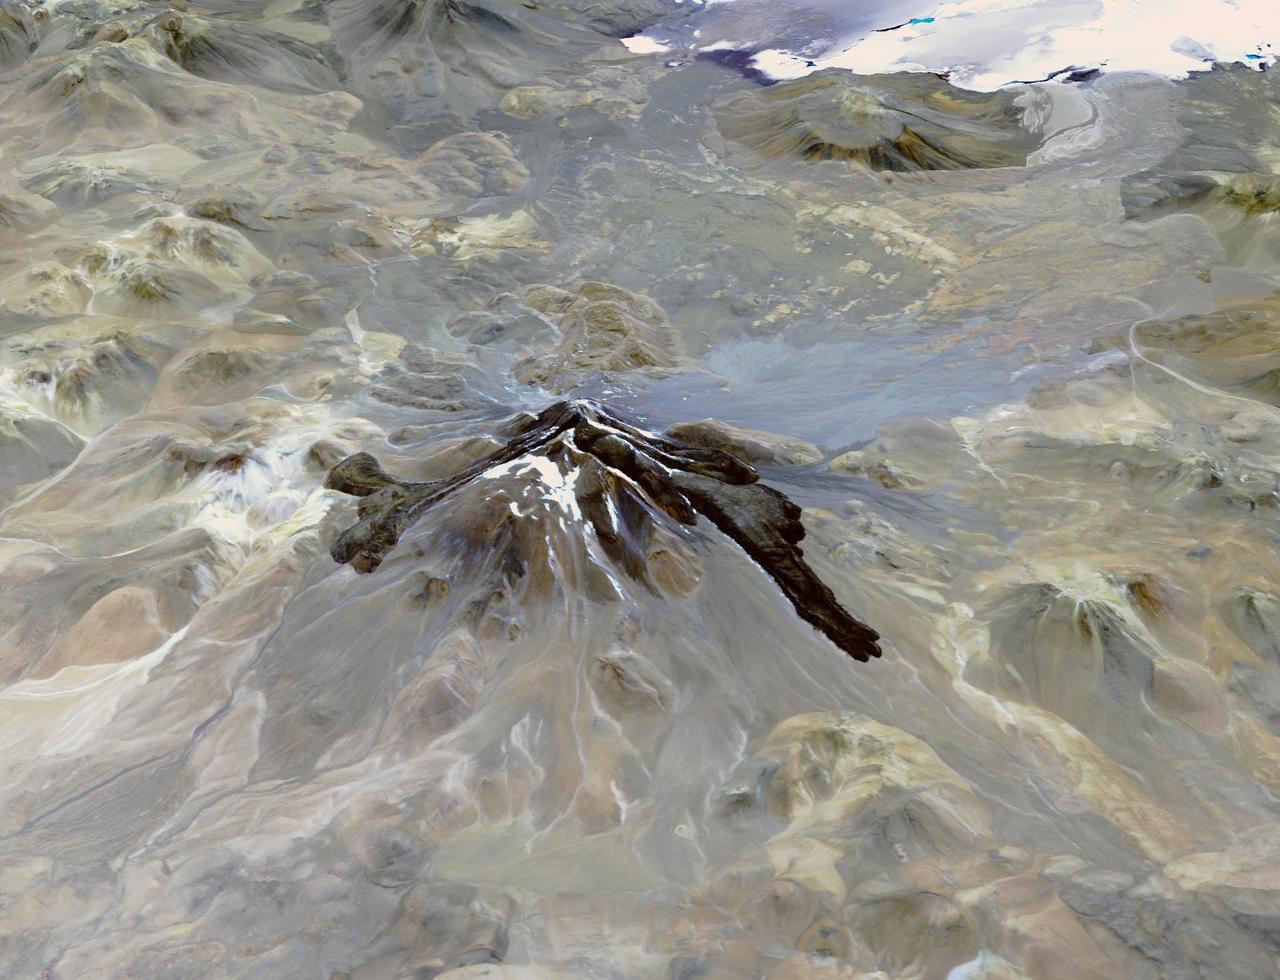
Llullaillaco is a stratovolcano at the border of Argentina and Chile. It lies on a high plateau close to the Atacama Desert. At an elevation of 6723 m ASL, it is the second highest active volcano in the world. About 150,000 years ago the volcano's southeastern flank collapsed, producing a debris avalanche that traveled 25 kilometers. The youngest dated rocks are about 5600 years old; but there are local reports of activity from the 1800s. The perspective image looking east was acquired December 19, 2014 and is located at 24.7 degrees south, 68.5 degrees west. https://photojournal.jpl.nasa.gov/catalog/PIA22721

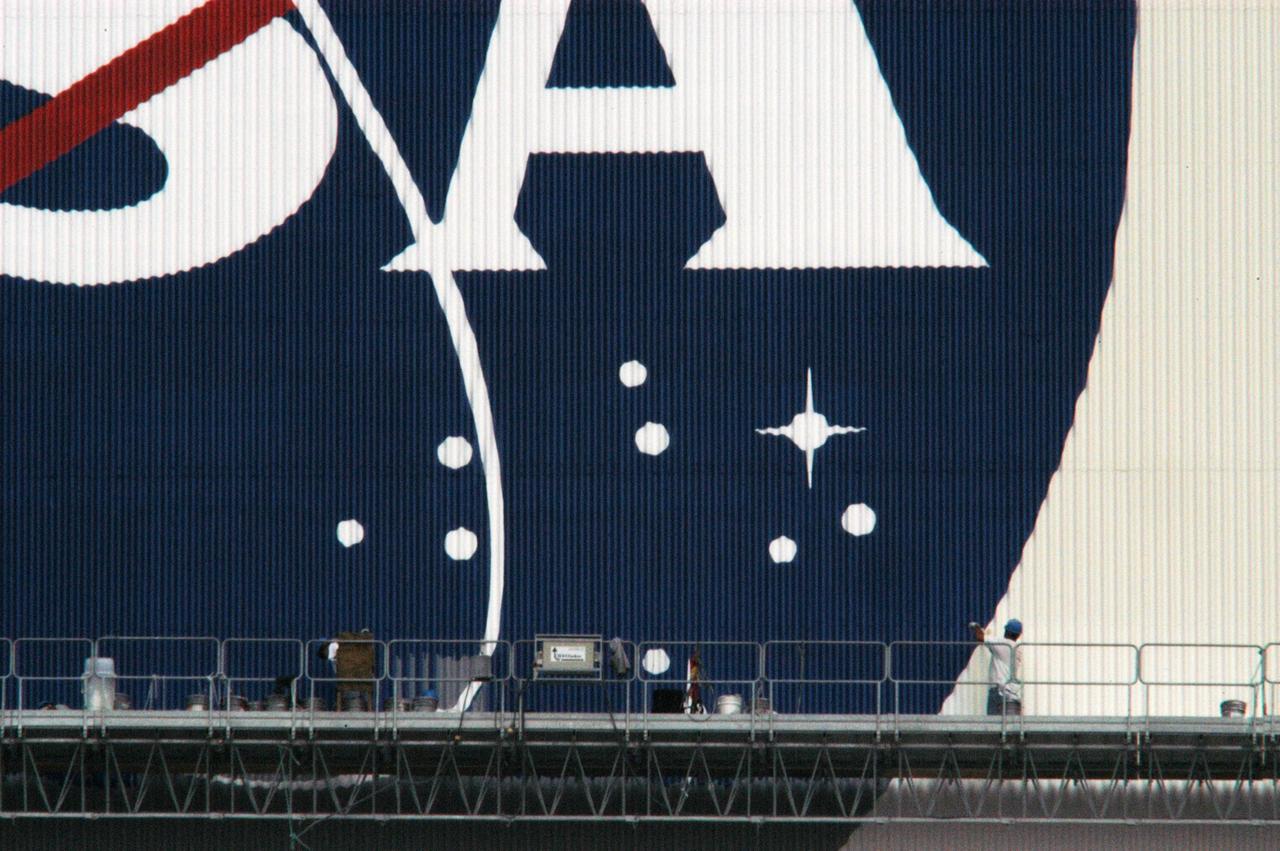
Elevated platforms are seen hanging in front of the NASA Logo on the side of Kennedy Space Center's Vehicle Assembly Building. Also in view on the east side of the building are platforms on the facility's large vertical doors. Workers, suspended on the platforms from the top of the 525-foot-high VAB, use rollers and brushes to do the painting. The flag and logo were last painted in 1998, honoring NASA's 40th anniversary. The flag spans an area 209 feet by 110 feet, or about 23, 437 square feet. Each stripe is 9 feet wide and each star is 6 feet in diameter. The logo, also known as the "meatball," measures 110 feet by 132 feet, or about 12,300 square feet.

Elevated platforms are seen hanging on the side of Kennedy Space Center's Vehicle Assembly Building in a view looking across from the turn basin. To the right is the large external tank barge. Workers, suspended on the platforms from the top of the 525-foot-high VAB, use rollers and brushes to do the painting. The flag and logo were last painted in 1998, honoring NASA's 40th anniversary. The flag spans an area 209 feet by 110 feet, or about 23, 437 square feet. Each stripe is 9 feet wide and each star is 6 feet in diameter. The logo, also known as the "meatball," measures 110 feet by 132 feet, or about 12,300 square feet.
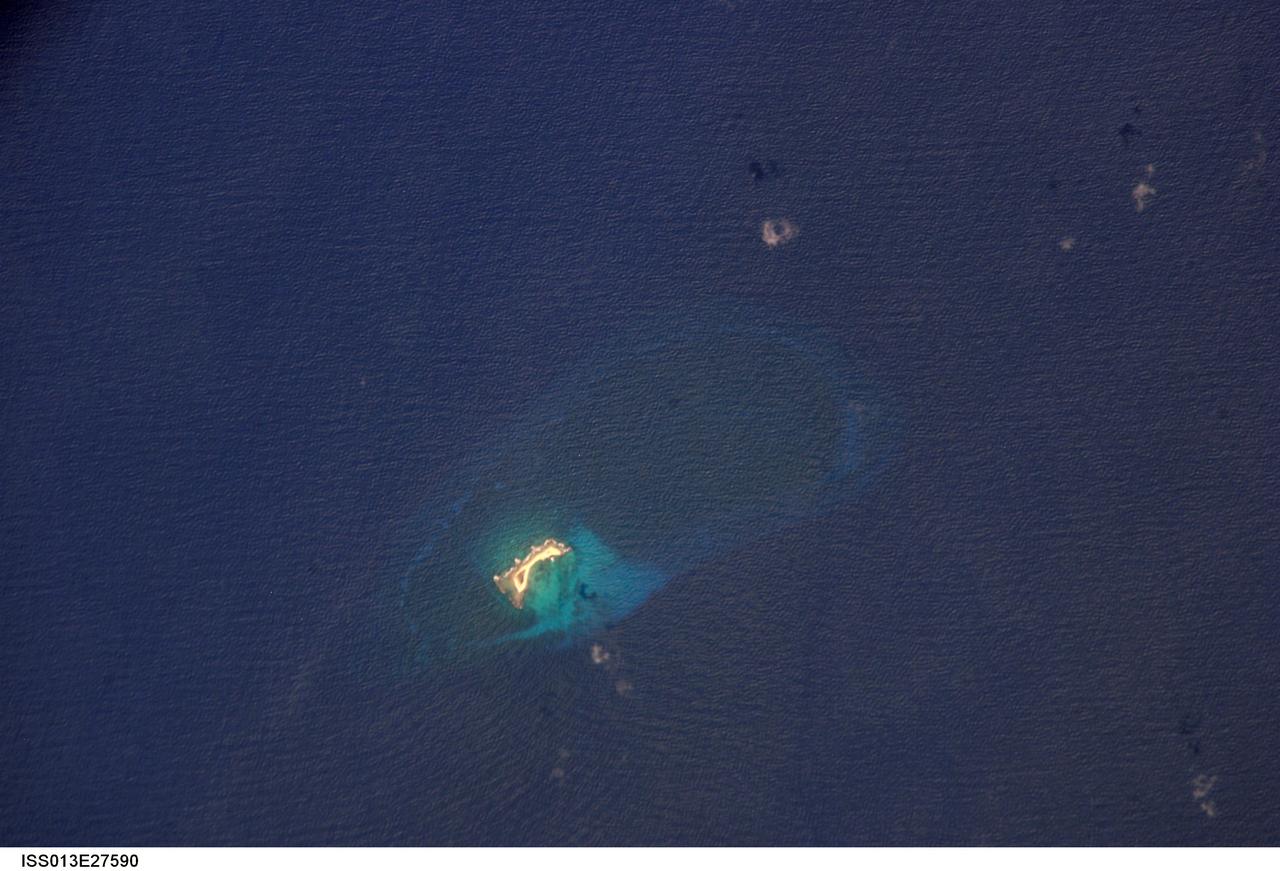
ISS013-E-27590 (27 May 2006) --- Aves Island, Caribbean Sea is featured in this image photographed by an Expedition 13 crewmember on the International Space Station. This image is a rare almost cloud free view of the island and the submerged fringing coral reef that surrounds it. Scientists believe the crosshatch-like pattern of roughness on the surrounding sea surface was caused by variable winds at the time of image acquisition. The island itself currently stands a mere 4 meters above the surrounding sea surface, and in high seas it can be completely submerged. While the low elevation of the island makes it a hazard to shipping, it also provides a major nesting site for green sea turtles (Chelonia mydas) in the Caribbean.
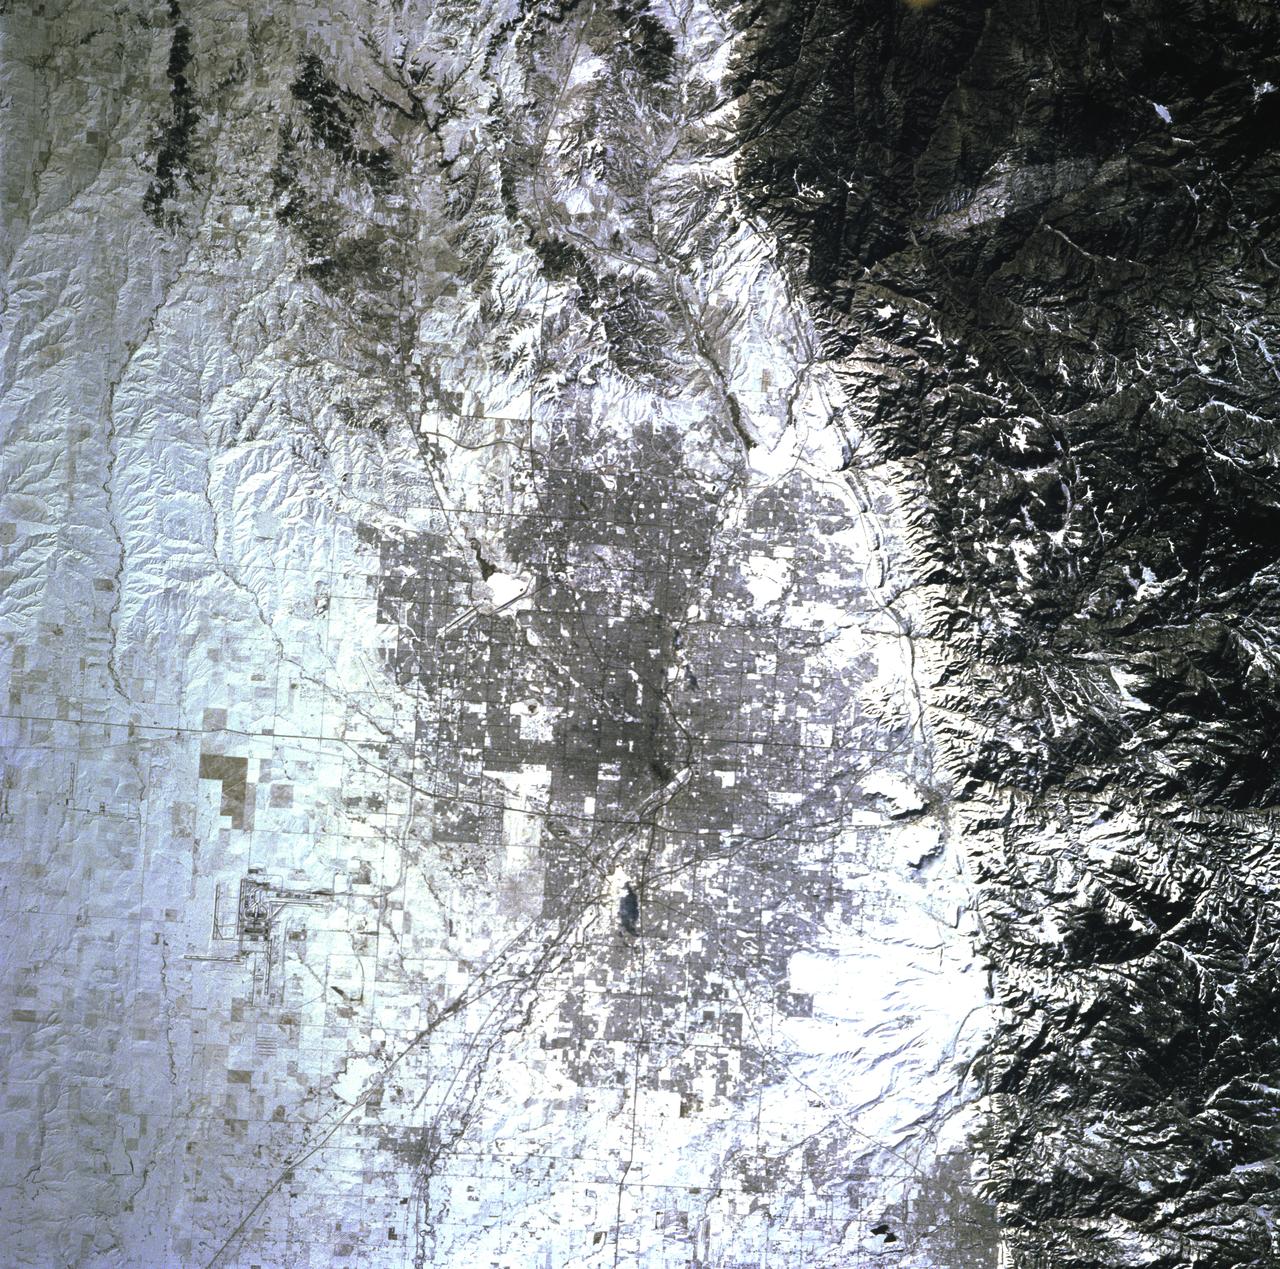
STS081-719-084 (12-22 Jan. 1997) --- The capital of the state of Colorado is featured prominently in this winter scene. Located at the foothills of the Rocky Mountains, Denver's elevation is 5,280 feet and is known as the "Mile High City". The new Denver International Airport (DIA) opened in 1995 and is one of the countries largest airports, can be seen towards the right corner of the photograph. Above and to the right of DIA is the closed Stapleton Airport with its snow covered runways. Other prominent cities featured are Golden, due east of Denver and against the Rockies, and Boulder, to the northeast of the city and also against the Rockies. Brighton is northwest of Denver, near the South Platte River.
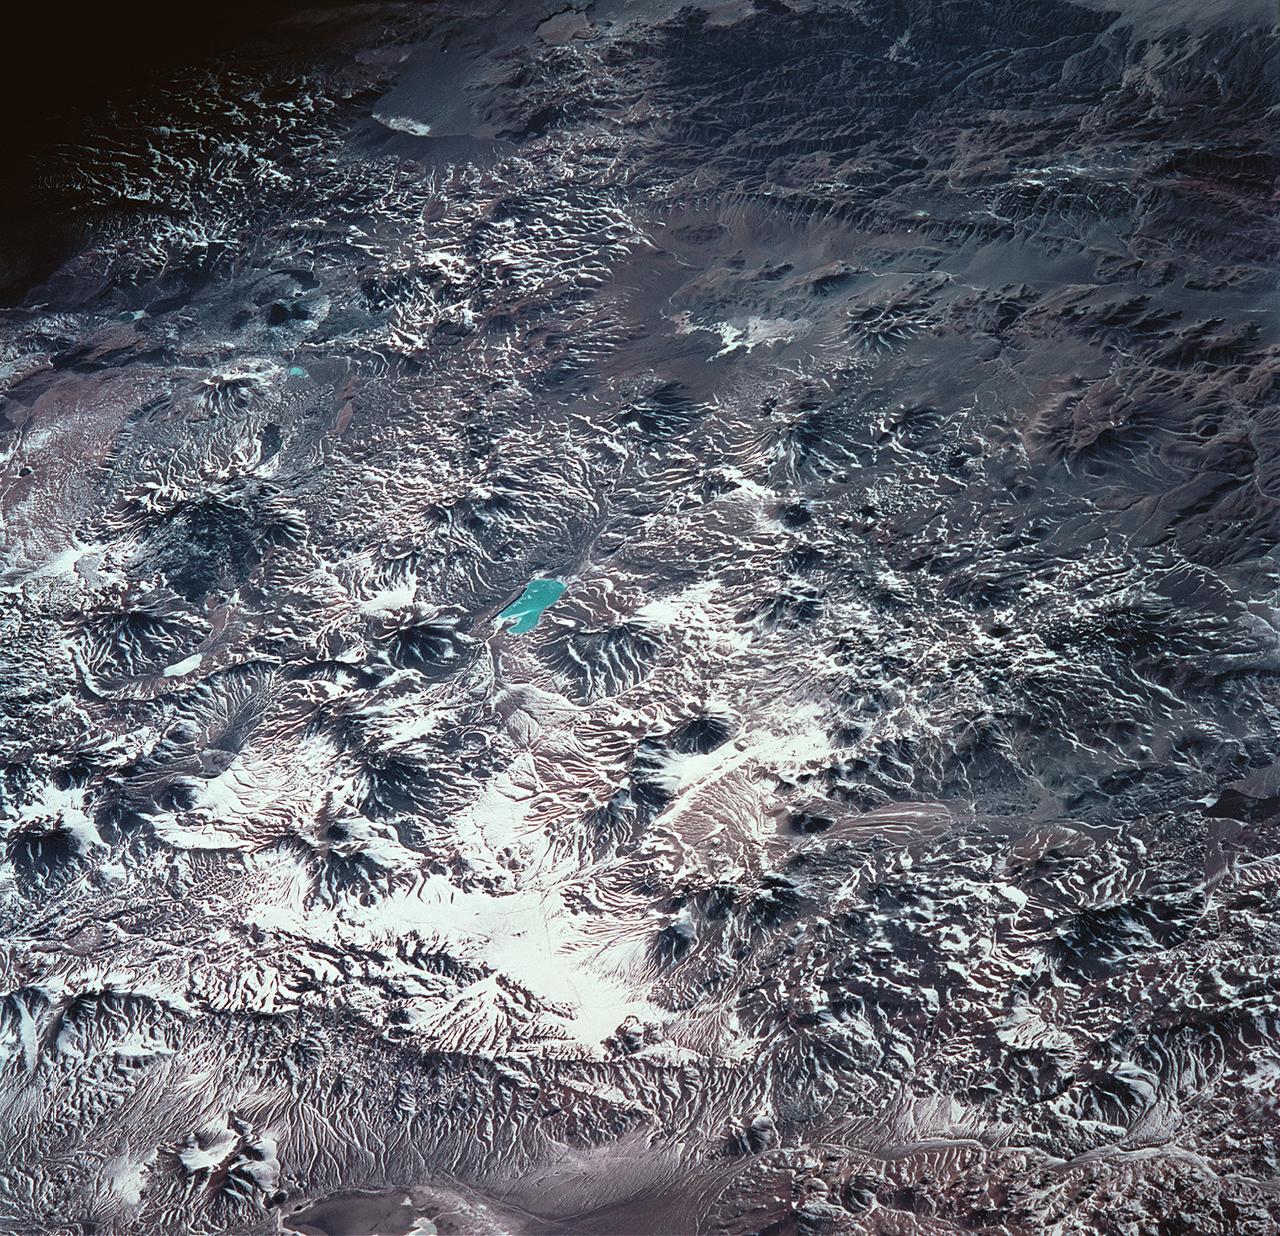
STS093-704-087 (23-27 July 1999) --- This low angle, early morning shot over Chile was photographed from the Earth-orbiting Space Shuttle Columbia during the STS-93 mission. In the words of one of the scientists studying the STS-93 Earth imagery, Laguna Verde, in the Atacama Province of Chile (near the Argentine border), lies like a turquoise jewel among the stark black and white snow covered volcanic peaks of the High Andes. The ambient elevation in this part of the Andes is 16,000 feet (4,877 meters) with the highest local peak, Nevada Ojas de Salado (just to the right of the lake), reaching to 23,240 feet. (7084 meters.)
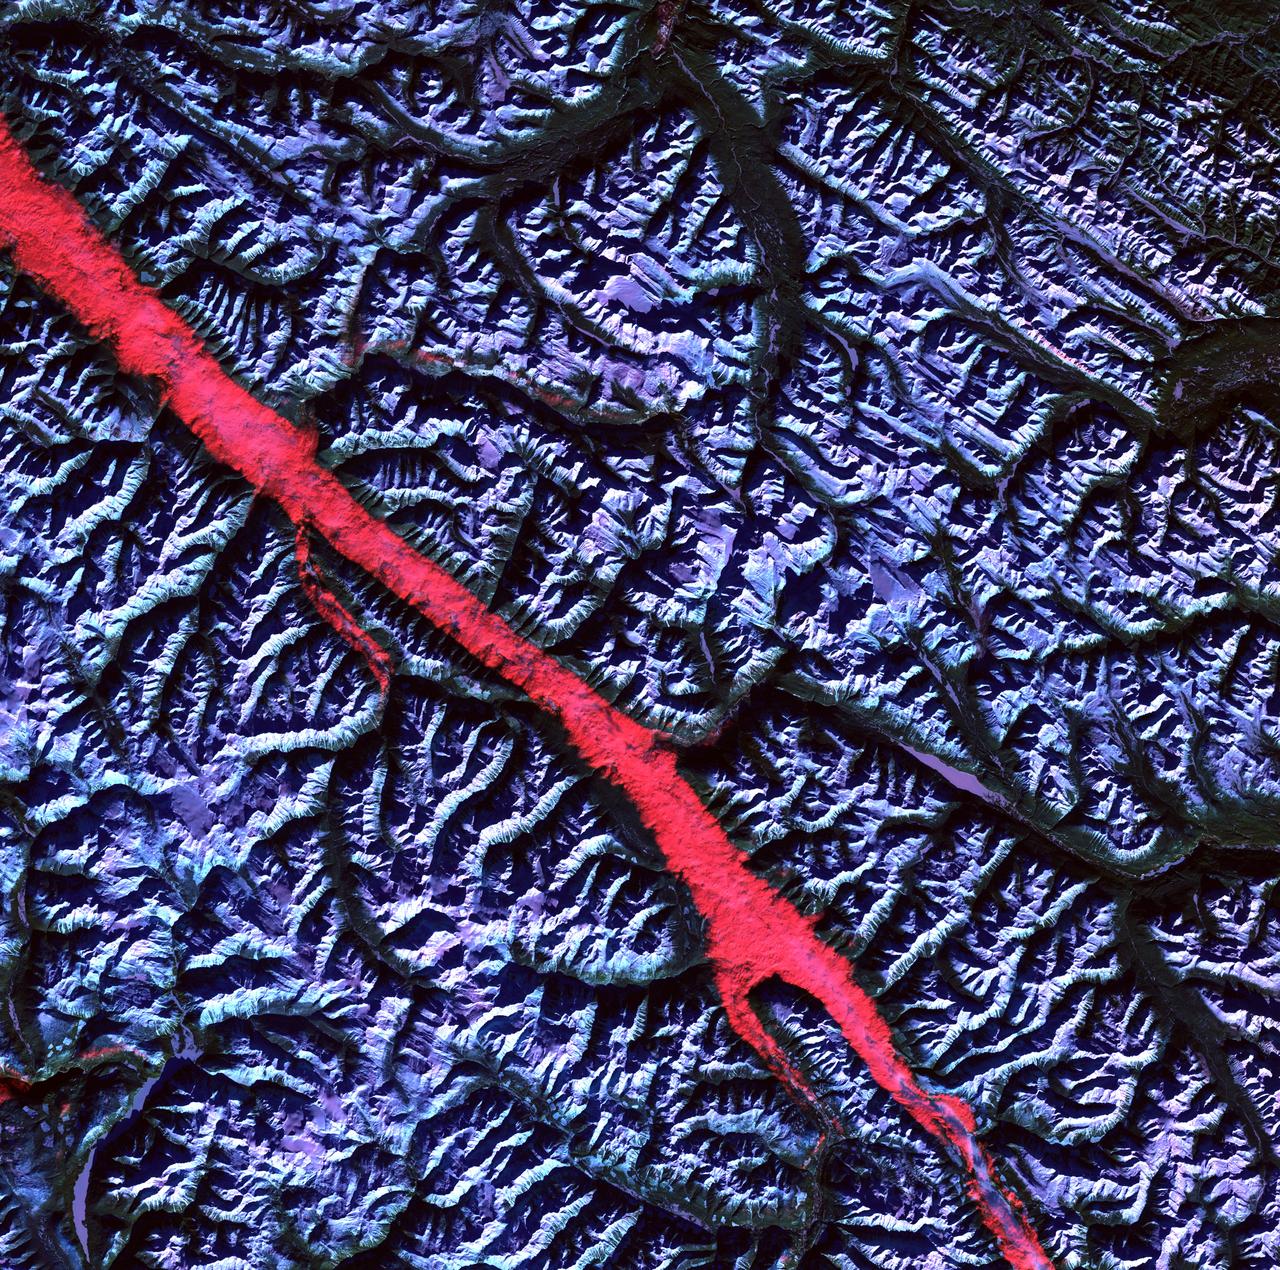
Acquisition Date: February 2004 The high reflectance of clouds compared to the surrounding land, coupled with the low sun elevation when this image was acquired, causes low clouds to appear red as they fill a portion of the Rocky Mountain Trench. Running parallel with the peaks of the Canadian Rockies and ranging from 2 to 10 miles (3 to 16 kilometers) wide and about 900 miles (1,448 kilometers) long, the Trench aligns with the Fraser River and makes its way past Mount Robson, the highest peak in the Canadian Rockies at 12,972 feet (3,954 meters). Mount Robson is near the center of this image. Credit: NASA/GSFC/Landsat/USGS To learn more about Landsat and to see the orginal high res file go to: <a href="http://landsat.usgs.gov/gallery_view.php?category=greenflag&thesort=mainTitle" rel="nofollow">landsat.usgs.gov/gallery_view.php?category=greenflag&...</a>
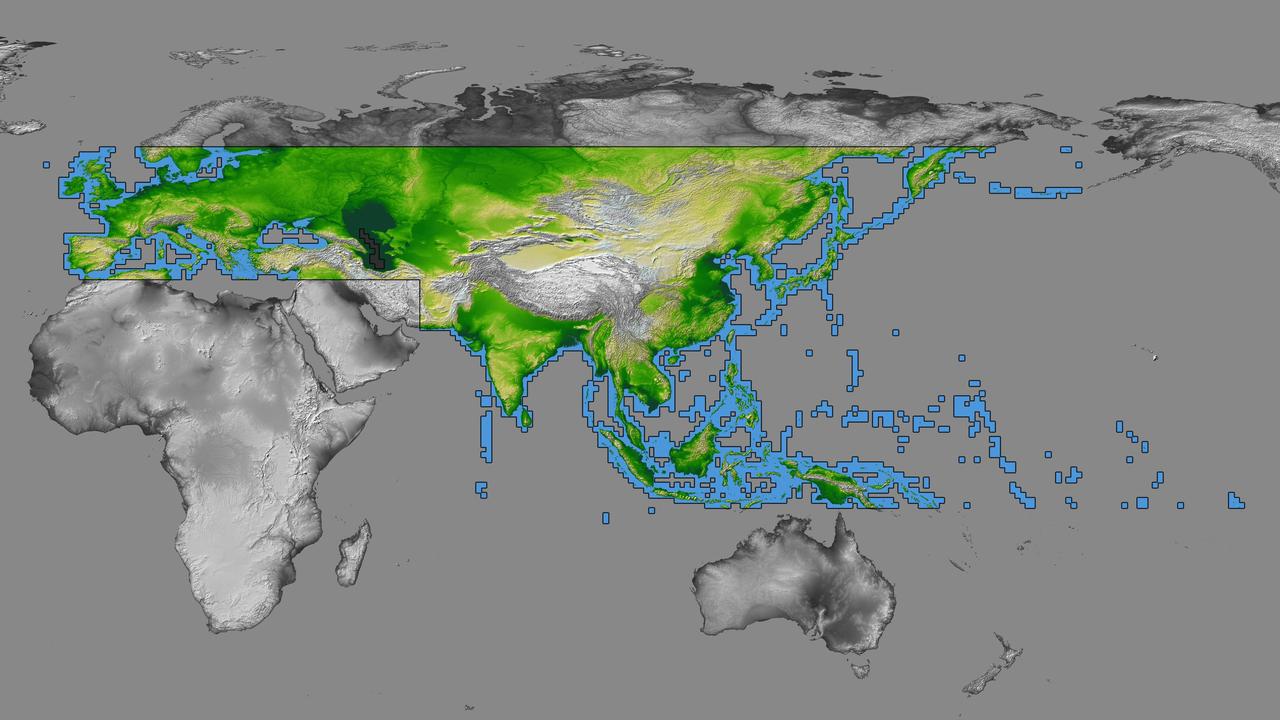
inal Caption Released with Image: The colored regions of this map show the extent of digital elevation data recently released by the Shuttle Radar Topography Mission (SRTM). This release includes data for most of Europe and Asia plus numerous islands in the Indian and Pacific Oceans. SRTM flew on board the Space Shuttle Endeavour in February 2000 and used an interferometric radar system to map the topography of Earth's landmass between latitudes 56 degrees south and 60 degrees north. The data were processed into geographic "tiles," each of which represents one by one degree of latitude and longitude. A degree of latitude measures 111 kilometers (69 miles) north-south, and a degree of longitude measures 111 kilometers or less east-west, decreasing away from the equator. The data are being released to the public on a continent-by-continent basis. This Eurasia segment includes 5,940 tiles, more than a third of the total data set. Previous releases covered North America and South America. Forthcoming releases will include Africa-Arabia and Australia plus an "Islands" release for those islands not included in the continental releases. Together these data releases constitute the world's first high-resolution, near-global elevation model. The resolution of the publicly released data is three arcseconds (1/1,200 of a degree of latitude and longitude), which is about 90 meters (295 feet). European coverage in the current data release stretches eastward from the British Isles and the Iberian Peninsula in the west, across the Alps and Carpathian Mountains, as well as the Northern European Plain, to the Ural and Caucasus Mountains bordering Asia. The Asian coverage includes a great diversity of landforms, including the Tibetan Plateau, Tarin Basin, Mongolian Plateau, and the mountains surrounding Lake Baikal, the world's deepest lake. Mt. Everest in the Himalayas, at 8,848 meters (29,029 feet) is the world's highest mountain. From India's Deccan Plateau, to Southeast Asia, coastal China, and Korea, various landforms place constraints upon land use planning for a great population. Volcanoes in the East Indies, the Philippines, Japan, and the Kamchatka Peninsula form the western part of the "Ring of Fire" around the Pacific Ocean. Many of these regions were previously very poorly mapped due to persistent cloud cover or the inaccessibility of the terrain. Digital elevation data, such as provided by SRTM, are particularly in high demand by scientists studying earthquakes, volcanism, and erosion patterns for use in mapping and modeling hazards to human habitation. But the shape of Earth's surface affects nearly every natural process and human endeavor that occurs there, so elevation data are used in a wide range of applications. In this index map color-coding is directly related to topographic height, with green at the lower elevations, rising through yellow and tan, to white at the highest elevations. The large, very dark green feature in western Asia is the Caspian Sea, which is below sea level. Blue areas on the map represent water within the mapped tiles, each of which includes shorelines or islands. http://photojournal.jpl.nasa.gov/catalog/PIA03398
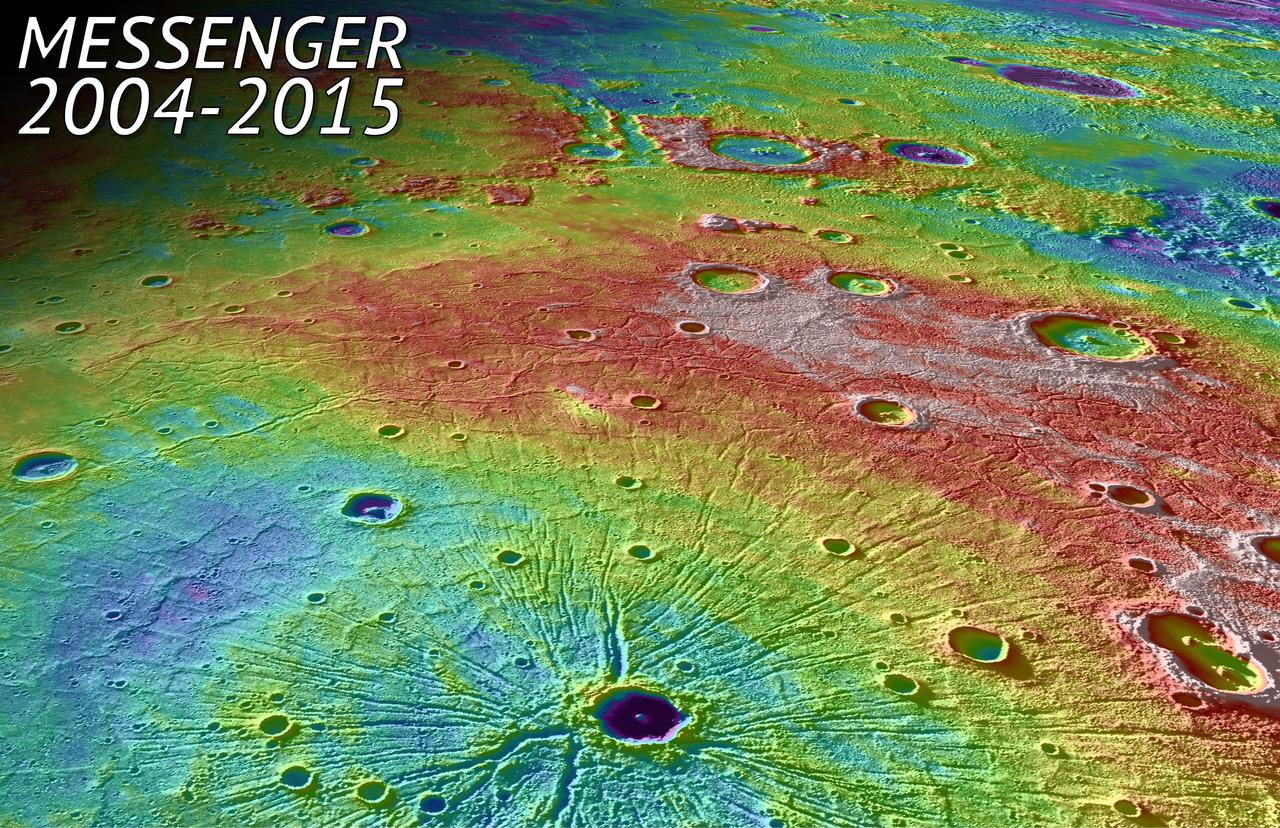
In this perspective view, NASA MESSENGER spacecraft looked northwest over the Caloris Basin, a depression about 1500 km in diameter formed several billion years ago by the impact of a large projectile into the surface of Mercury. The mountain range at the edge of the basin can be seen as an arc in the background. In the foreground, we see a set of tectonic troughs, known as Pantheon Fossae, radiating from the center of the basin outward toward the edge of the basin interior. A 41-km-diameter impact crater, Apollodorus, is superposed just slightly off from the center of Pantheon Fossae. White and red are high topography, and greens and blues are low topography, with a total height differences of roughly 4 km. The MESSENGER spacecraft was launched in 2004 and ended it's orbital operations yesterday, April 30, 2015, by impacting Mercury's surface. Background image texture is provided by the Mercury Dual Imaging System (MDIS) instrument while color corresponds to surface elevation data obtained from the Mercury Laser Altimeter (MLA) experiment, with both draped over a digital elevation model derived from MLA altimetric data. Instrument: Mercury Dual Imaging System (MDIS) and Mercury Laser Altimeter (MLA) Approximate Center Latitude: 33.7° N Approximate Center Longitude: 158.7° E Scale: Apollodorus crater is approximately 41 km (25 miles) in diameter http://photojournal.jpl.nasa.gov/catalog/PIA19450
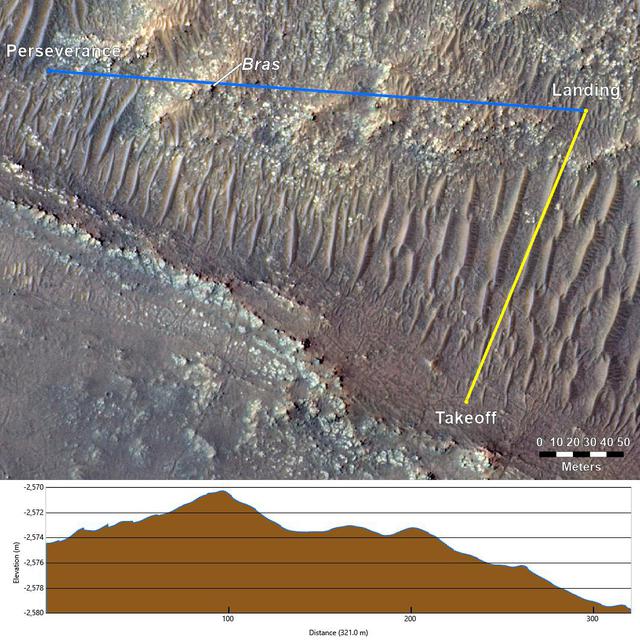
This annotated image from NASA's Mars Reconnaissance Orbiter (MRO), and the topographic map below it, provide a look at the altitude of surface features standing between the agency's Perseverance Mars rover and Ingenuity helicopter at the conclusion of the rotorcraft's 17th flight at Mars on Dec. 5, 2021. In the image of the surface – taken by MRO's High Resolution Science Experiment (HiRISE) camera – Ingenuity's flight path is depicted in yellow. Perseverance's location is indicated in the upper left, with the blue line delineating its line of sight to the helicopter's landing spot. The location of the tallest point on Mars' surface between rover and helicopter during its final descent is the hill near the center of image that the Perseverance science team has nicknamed "Bras," after a city in France. The topographic map below the orbital image provides the elevation of surface features along the blue line, or Perseverance's line of sight to helicopter. The height measurements to the left of the map are derived by comparing local elevations to the areoid (a model for an equipotential surface of Mars, analogous to "sea level" on Earth). The Ingenuity team believes the 13-foot (4-meter) height difference between the Perseverance rover and the top of Bras contributed to the loss of communications when the helicopter descended toward the surface at the end of its flight. The image's background terrain was generated using data collected by the HiRISE camera aboard NASA's Mars Reconnaissance Orbiter. https://photojournal.jpl.nasa.gov/catalog/PIA24980
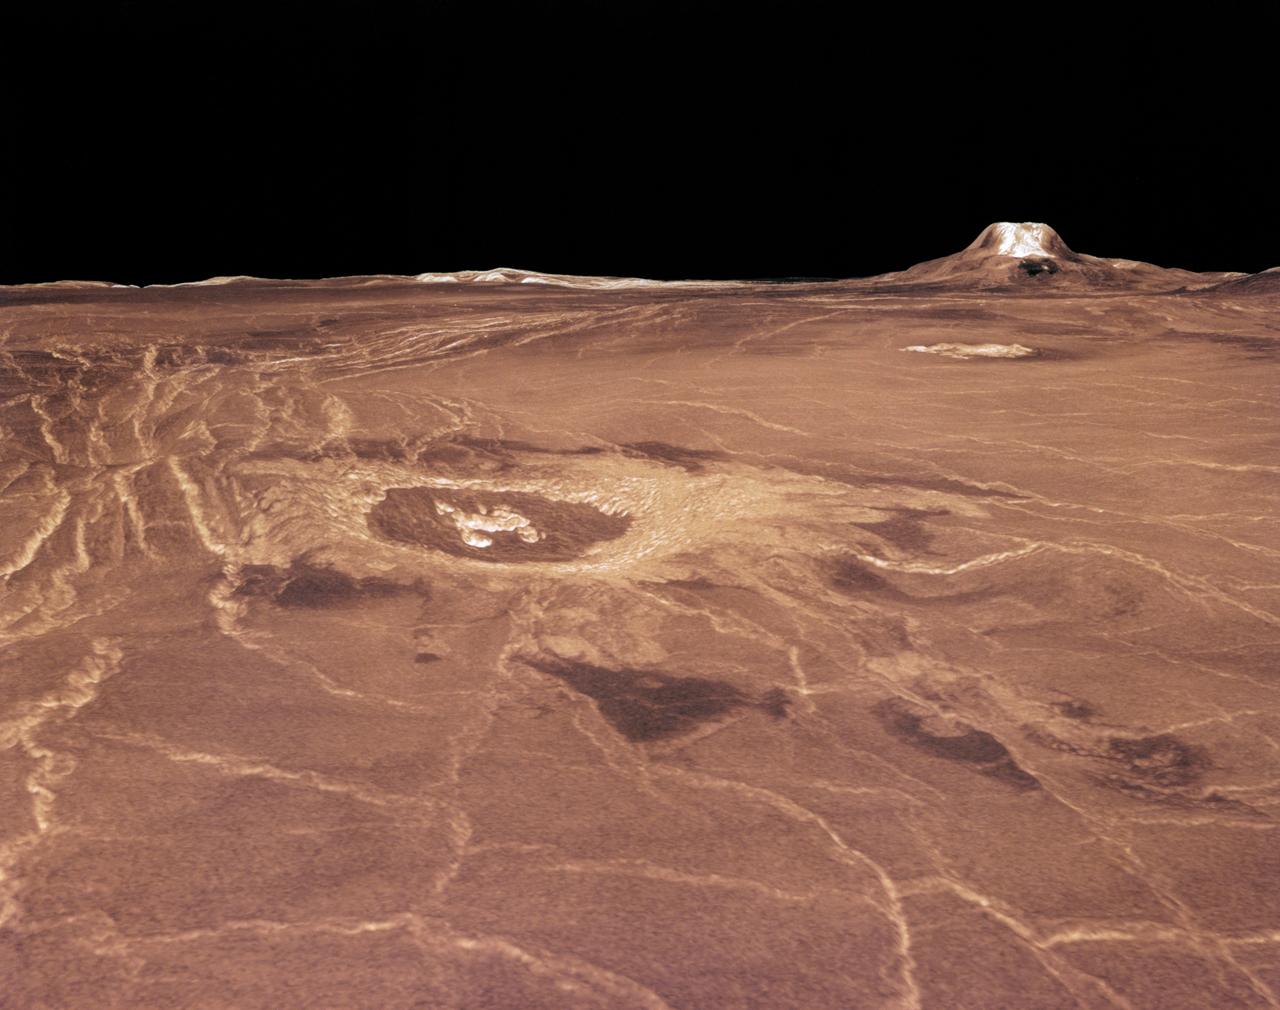
Magellan synthetic aperture radar data was used to create this three- dimensional (3D) perspective view of Venus' western Eistla Regio. This viewpoint is located at 1,310 kilometers (812 miles) southwest of Gula Mons at an elevation of 0.178 kilometers (0.48 miles). The view is of the northeast with Gula Mons appearing on the horizon. Gula Mons, a 3 kilometer (1.86 mile) high volcano, is located at approximately 22 degrees north latitude, 359 degrees east longitude. The impact crater Cunitz, named for the astronomer and mathematician Maria Cunitz, is visible in the center of the image. The crater is 48.5 kilometers (30 miles) in diameter and is 215 kilometers (133 miles) from the viewer's position. Magellan synthetic aperture radar data is combined with radar altimetry to develop a 3D map of the surface. Rays cast in a computer intersect the surface to create a 3D view. Simulated color and a digital elevation map developed by the United States (U.S.) Geological Survey is used to enhance small-scale structure. The simulated hues are based on color images recorded by the Soviet Venera 13 and 14 spacecraft. The image was produced at the Jet Propulsion Laboratory (JPL) Multimission Image Processing Laboratory and is a single frame from a video released at the JPL news conference 03-05-91. View was provided by JPL with alternate number P-38720 MGN76.
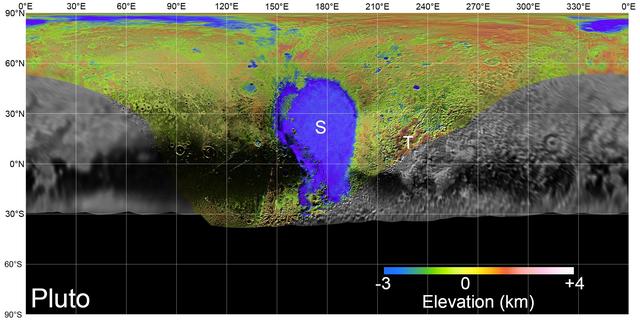
On July 14, 2015, NASA's New Horizons spacecraft made its historic flight through the Pluto system. This detailed, high-quality global mosaic of Pluto was assembled from nearly all of the highest-resolution images obtained by the Long-Range Reconnaissance Imager (LORRI) and the Multispectral Visible Imaging Camera (MVIC) on New Horizons. The mosaic is the most detailed and comprehensive global view yet of Pluto's surface using New Horizons data. It includes topography data of the hemisphere visible to New Horizons during the spacecraft's closest approach. The topography is derived from digital stereo-image mapping tools that measure the parallax -- or the difference in the apparent relative positions -- of features on the surface obtained at different viewing angles during the encounter. Scientists use these parallax displacements of high and low terrain to estimate landform heights. The global mosaic has been overlain with transparent, colorized topography data wherever on the surface stereo data is available. Terrain south of about 30°S was in darkness leading up to and during the flyby, so is shown in black. Examples of large-scale topographic features on Pluto include the vast expanse of very flat, low-elevation nitrogen ice plains of Sputnik Planitia ("P") -- note that all feature names in the Pluto system are informal -- and, on the eastern edge of the encounter hemisphere, the aligned, high-elevation ridges of Tartarus Dorsa ("T") that host the enigmatic bladed terrain, mountains, possible cryovolcanos, canyons, craters and more. https://photojournal.jpl.nasa.gov/catalog/PIA21861
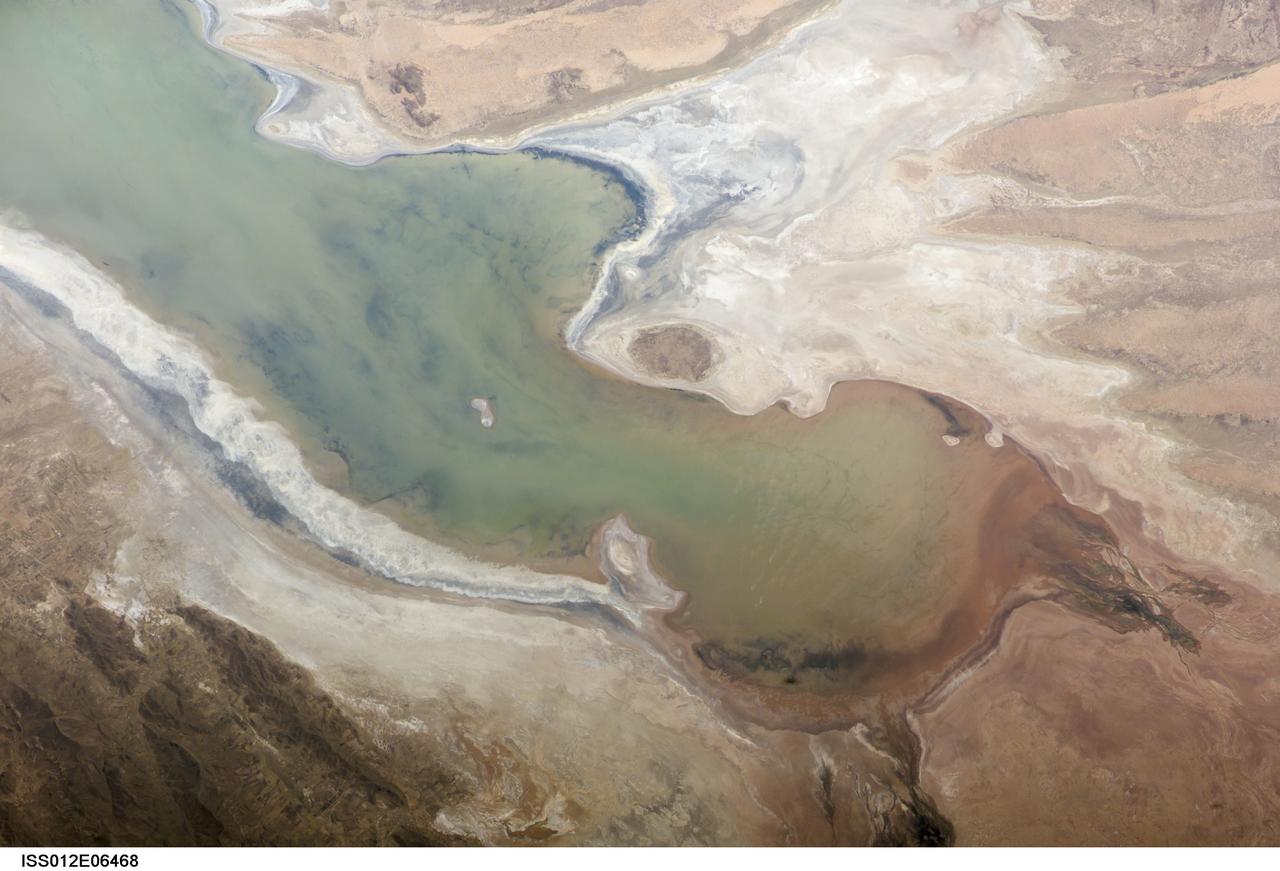
ISS012-E-06468 (3 Nov. 2005) --- A portion of Lake Poopo is featured in this image photographed by an Expedition 12 crewmember on the International Space Station. Lake Poopo sits high in the Bolivian Andes, catching runoff from its larger neighbor to the north - Lake Titicaca (not shown) - by way of the Desaguadero River (muddy area at the north end of the lake). Because Lake Poopo is very high in elevation (roughly 3400 meters or 11,000 feet above sea level), very shallow (generally less than 3 meters or 9 feet), and the regional climate is very dry, small changes in precipitation in the surrounding basin have large impacts on the water levels and areal extent of Lake Poopo. When the lake fills during wet periods, Poopo drains from the south end into Salar de Coipasa (not shown). Water levels in Poopo are important because it is one of South America’s largest saline lakes, and a prime stop for migratory birds, including flamingoes. NASA managers have tasked the station crew to track such changes, which are related to regional weather patterns. Lake Poopo’s sensitivity to precipitation in the high Andes (possibly reflecting larger climate cycles) provides an excellent visual indicator of these trends.

ISS012-E-06469 (3 Nov. 2005) --- A portion of Lake Poopo is featured in this image photographed by an Expedition 12 crewmember on the International Space Station. Lake Poopo sits high in the Bolivian Andes, catching runoff from its larger neighbor to the north - Lake Titicaca (not shown) - by way of the Desaguadero River (muddy area at the north end of the lake). Because Lake Poopo is very high in elevation (roughly 3400 meters or 11,000 feet above sea level), very shallow (generally less than 3 meters or 9 feet), and the regional climate is very dry, small changes in precipitation in the surrounding basin have large impacts on the water levels and areal extent of Lake Poopo. When the lake fills during wet periods, Poopo drains from the south end into Salar de Coipasa (not shown). Water levels in Poopo are important because it is one of South America’s largest saline lakes, and a prime stop for migratory birds, including flamingoes. NASA managers have tasked the station crew to track such changes, which are related to regional weather patterns. Lake Poopo’s sensitivity to precipitation in the high Andes (possibly reflecting larger climate cycles) provides an excellent visual indicator of these trends.
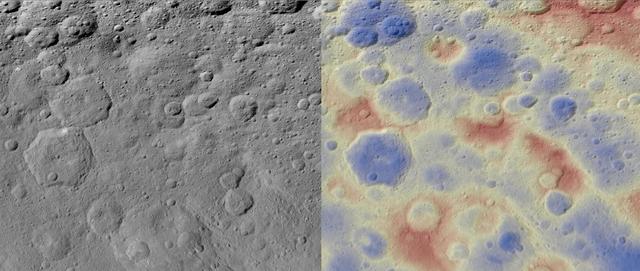
These images show a subtle feature on Ceres called Kwanzaa Tholus. Kwanzaa, meaning "first fruits" in Swahili, is an African-American festival based on ancient African harvest celebrations, and takes place from December 26 to January 1. A tholus is a type of small mountain. Kwanzaa Tholus measures about 22 by 12 miles (35 by 19 kilometers) and is elevated about 2 miles (3 km) above its surroundings. Because the mountain does not rise sharply above the ground, it is difficult to see in the mosaic on the left, although a small crescent-shaped shadow stands out. The image on the right, which is an elevation map of the area, shows where Kwanzaa Tholus is more prominently. The rounded shape of Kwanzaa Tholus is typical of tholi (plural of tholus) in general, but is different than other examples found on Ceres (like Dalien Tholus) and Mars. This region is particularly rich in this type of feature: The current Ceres map shows six named tholi and montes (slightly bigger mountains) in the region (centered around 32 degrees north, 327 degrees east) and several others including Ahuna Mons farther south. Scientists say Kwanzaa Tholus may have once been as prominent as Ahuna Mons, the tallest and most noticeable mountain on Ceres. Ahuna Mons is likely a cryovolcano, a volcano formed by the gradual accumulation of thick, slowly flowing icy materials. Because ice https://www.nasa.gov/feature/goddard/2016/ceres-cryo-volcano/is not strong enough to preserve an elevated structure for extended periods, cryovolcanoes on Ceres are expected to gradually collapse over tens of millions of years. This means Kwanzaa Tholus and other tholi in that area could be degraded mountains, which also formed from cryovolcanic activity. The mosaic on the left combines images taken by NASA's Dawn spacecraft in its high-altitude mapping orbit (HAMO) at about 915 miles (1,470 kilometers) above the surface. The spatial resolution is 450 feet (140 meters) per pixel. https://photojournal.jpl.nasa.gov/catalog/PIA21916
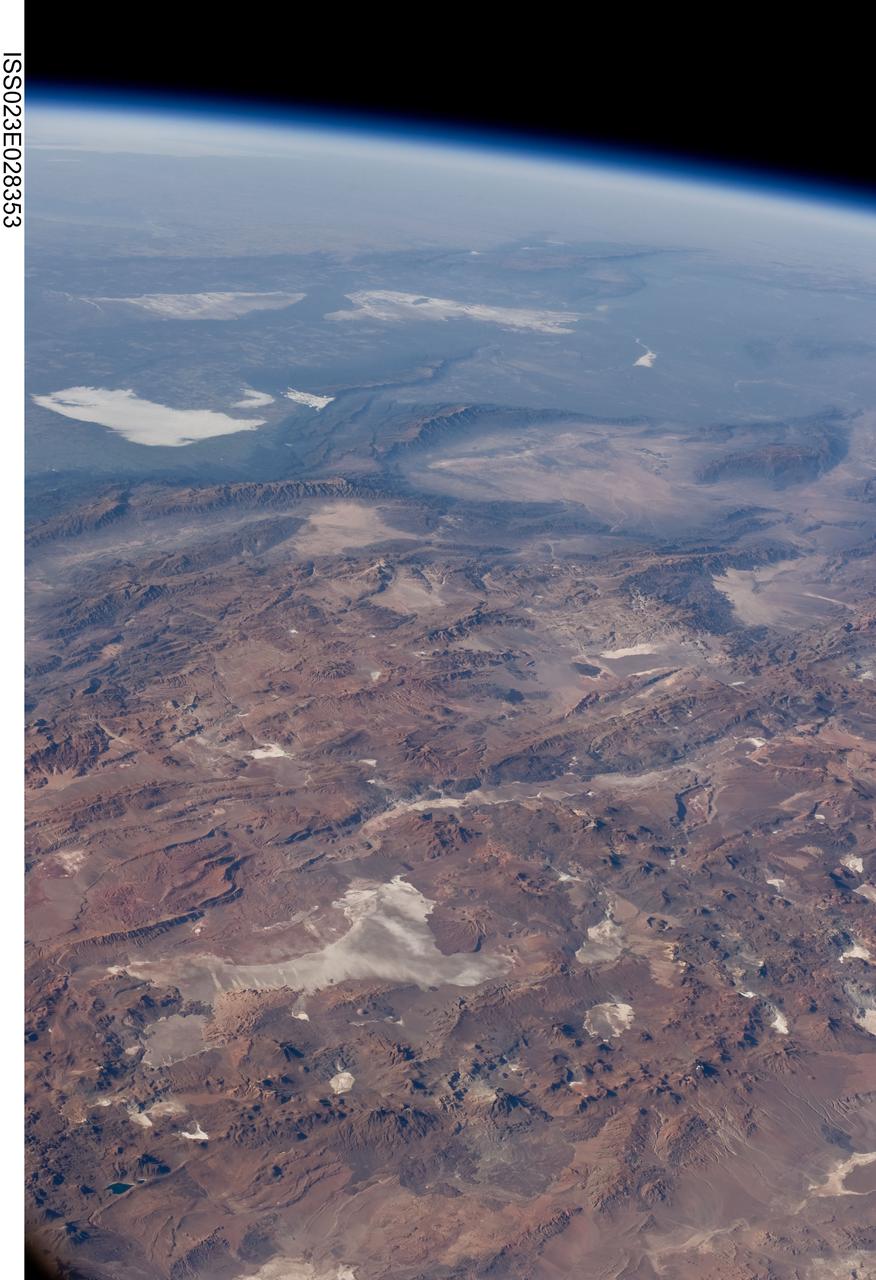
ISS023-E-028353 (26 April 2010) --- Central Andes Mountains, Salar de Arizaro, Argentina are featured in this image photographed by an Expedition 23 crew member on the International Space Station. The high plains (3,000 to greater than 5,000 meters elevation, 13,000 to 19,000 feet) of the Andes Mountains, also known as the Puna, appear in the foreground of this photograph, with a line of young volcanoes facing the much lower Atacama Desert (1,000–2,000 meters elevation). Several large dry lakes, marked by light-toned salt crusts, occupy the basins between major thrust faults in the Puna. Salar de Arizaro (foreground) is the largest of the dry lakes in this view (salar means waterless salt flat in Spanish). This panorama was taken by a station crew member looking southeast across the South American continent when the ISS was almost directly over the Atacama Desert near Chile’s Pacific coast. The Atlantic Ocean coastline (River Plate where Argentina’s capital city of Buenos Aires is located) is dimly visible at top left. A striking geological and landscape contrast is visible at center which separates two distinct geological zones, namely the Puna and the Sierras Pampeanas. The Sierras Pampeanas Mountains are lower in elevation and have few young volcanoes, in contrast to the Puna. Sharp-crested ranges are separated by wide, low valleys in this region. The Salinas Grandes—ephemeral shallow salt lakes at top left (salina means salt lake in Spanish) — occupies one of these valleys. The general color change from reds and browns in the foreground to blues and greens in the upper part of the image reflects the major climatic regions, namely the deserts of the Atacama and Puna, versus the low grassy plains of central Argentina where rainfall is sufficient to promote lush prairie grass growth—known famously as the pampas in Argentina. The Salinas Grandes mark an intermediate semiarid region. What accounts for the changes in landscape? The geology of this part of the Andes is a result of the eastward subduction of the Nazca tectonic plate underneath South America. Investigations using seismic data suggest that the Puna is underlain by a steeply dipping sector of the subducting Nazca plate. The Sierras Pampeanas zone however, is underlain by a sector of the Nazca plate that is almost horizontal, possibly due to the subduction of a submarine mountain range known as the Juan Fernandez Ridge. In the simplest terms, ridges are topographic highs that are difficult to stuff down subduction zones, with profound effects on the volcanism and structures of the upper plate.
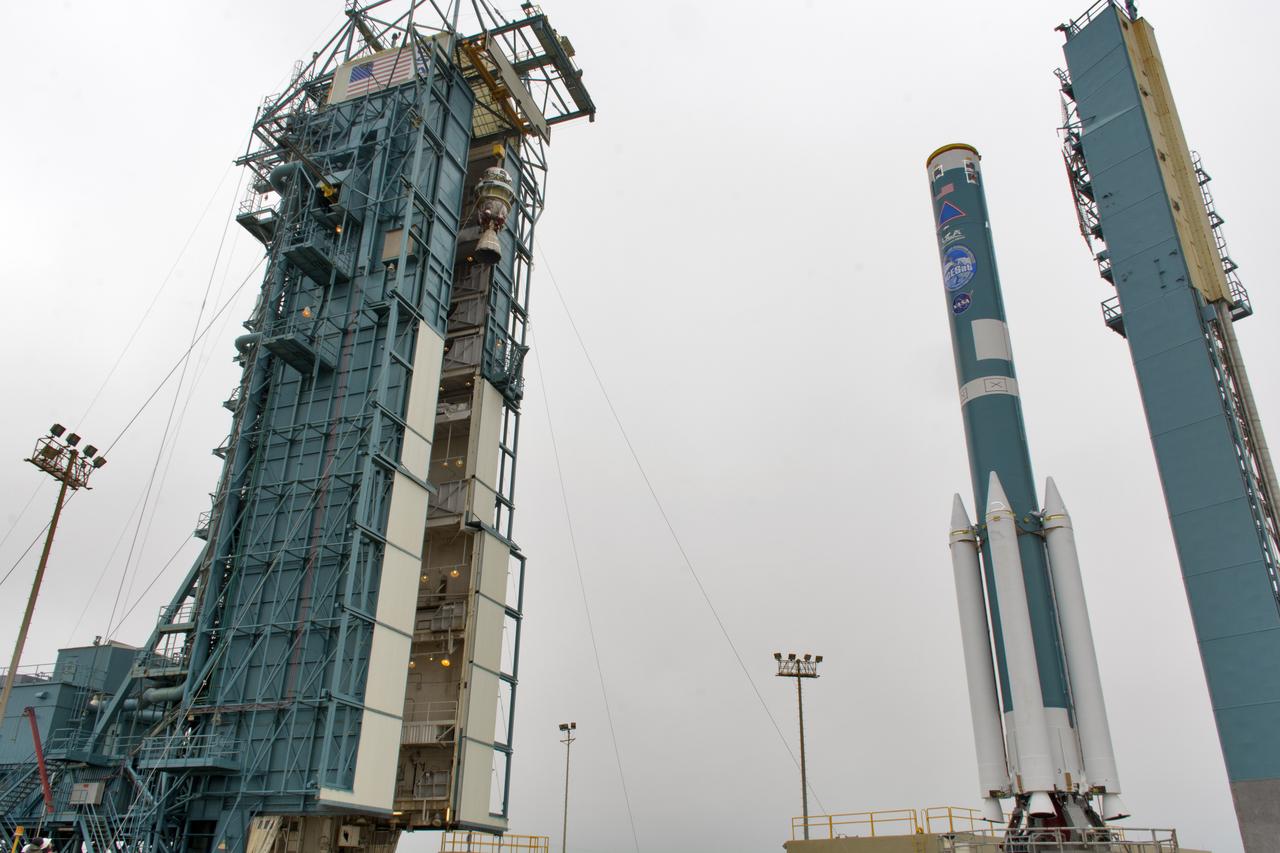
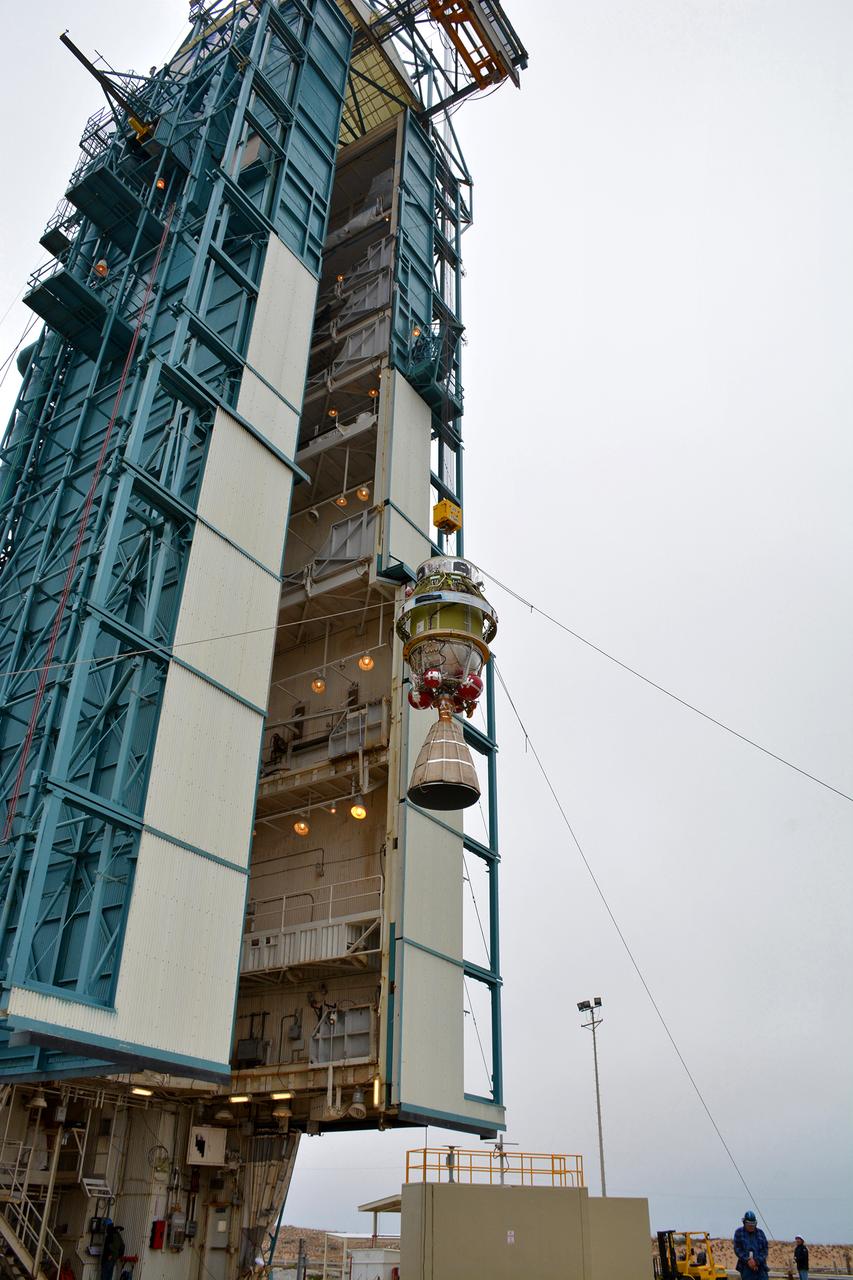
The second stage of the United Launch Alliance Delta II rocket is lifted high up at the Vertical Integration Facility, at left, at Space Launch Complex 2 on June 21, 2018, at Vandenberg Air Force Base in California. The second stage will be attached to the top of the booster, or first stage of the rocket, which is being moved out of the Mobile Service Tower, at right. NASA's Ice, Cloud and land Elevation Satellite-2 (ICESat-2) will launch on the final Delta II rocket. ICESat-2 will measure the height of a changing Earth, one laser pulse at a time, 10,000 laser pulses a second. The satellite will carry a single instrument, the Advanced Topographic Laser Altimeter System. ICESat-2 will help scientists investigate why, and how much our planet's frozen and icy areas, called the cryosphere, is changing in a warming climate.
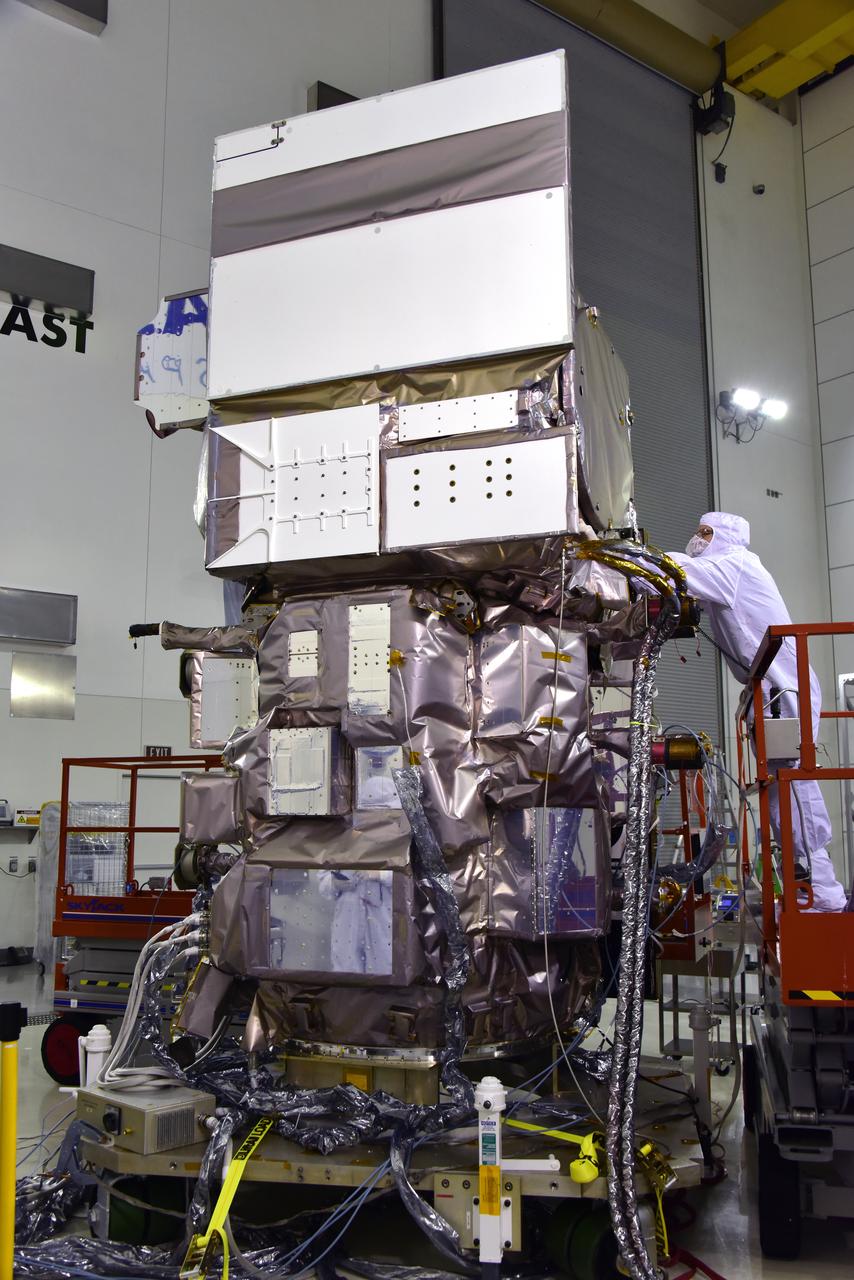
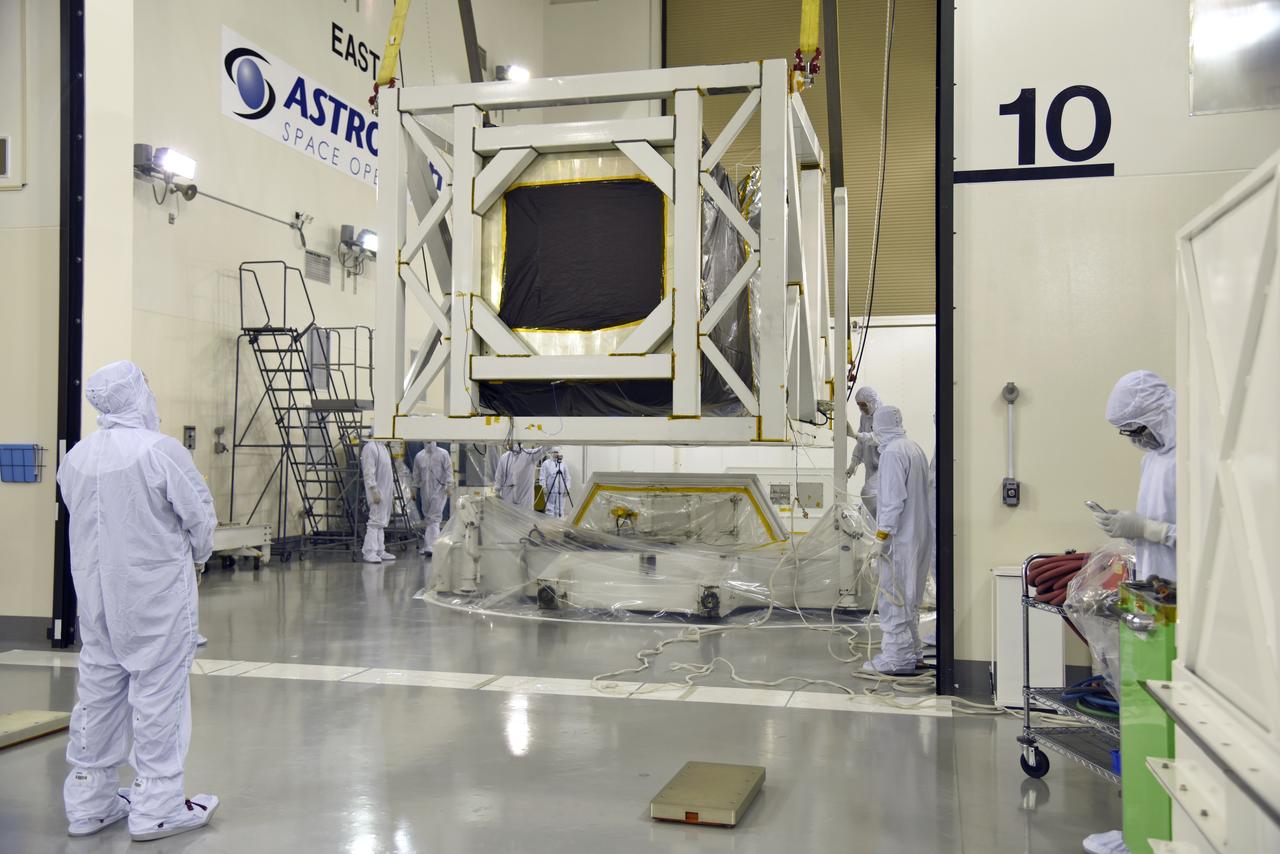
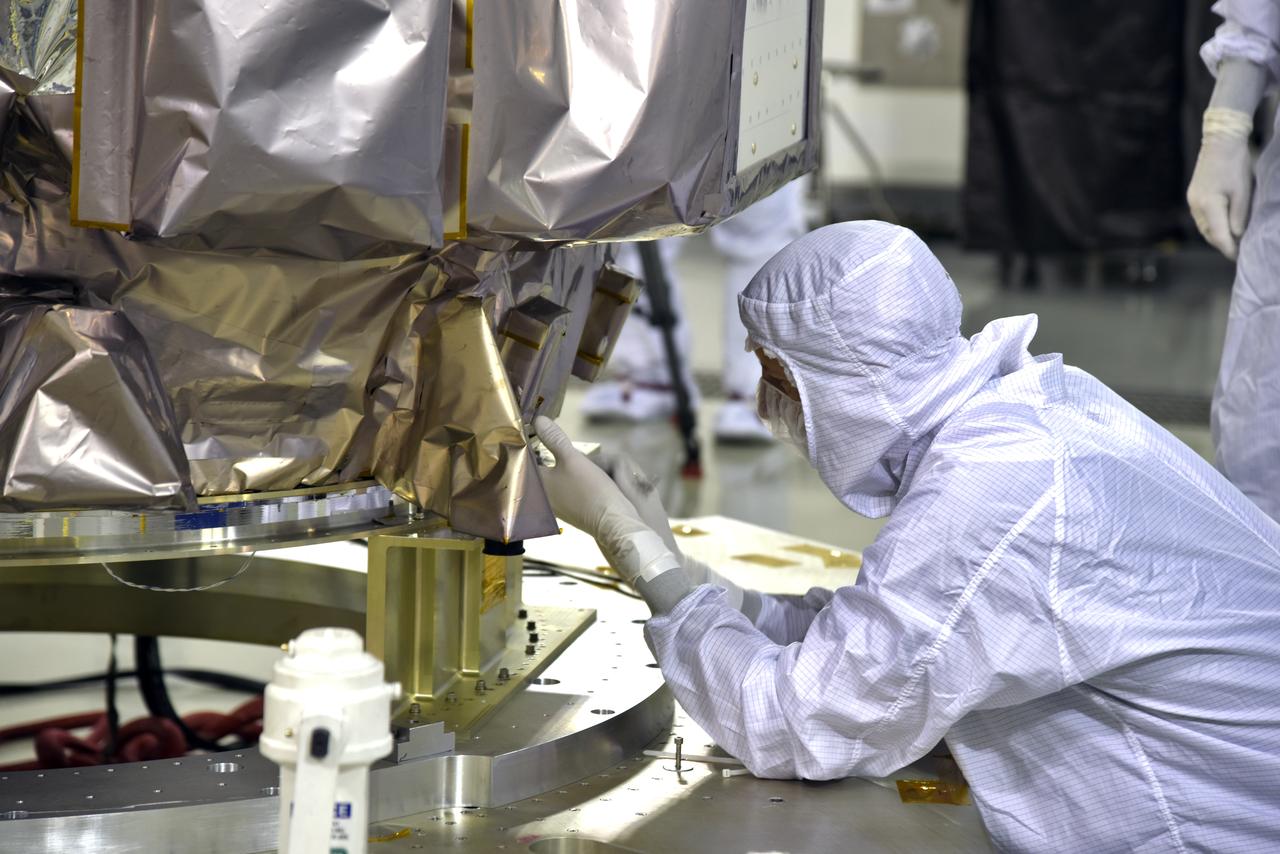
Inside the high bay of the Astrotech Space Operations facility at Vandenberg Air Force Base in California, a technician checks the flight door for the Advanced Topographic Laser Altimeter System (ATLAS) on NASA's Ice, Cloud and land Elevation Satellite-2 (ICESat-2) on June 21, 2018. The satellite is being prepared for its scheduled launch from Space Launch Complex-2 at Vandenberg on the final United Launch Alliance Delta II rocket. ICESat-2 will measure the height of a changing Earth, one laser pulse at a time, 10,000 laser pulses a second. The satellite will carry ATLAS. ICESat-2 will help scientists investigate why, and how much our planet's frozen and icy areas, called the cryosphere, is changing in a warming climate.
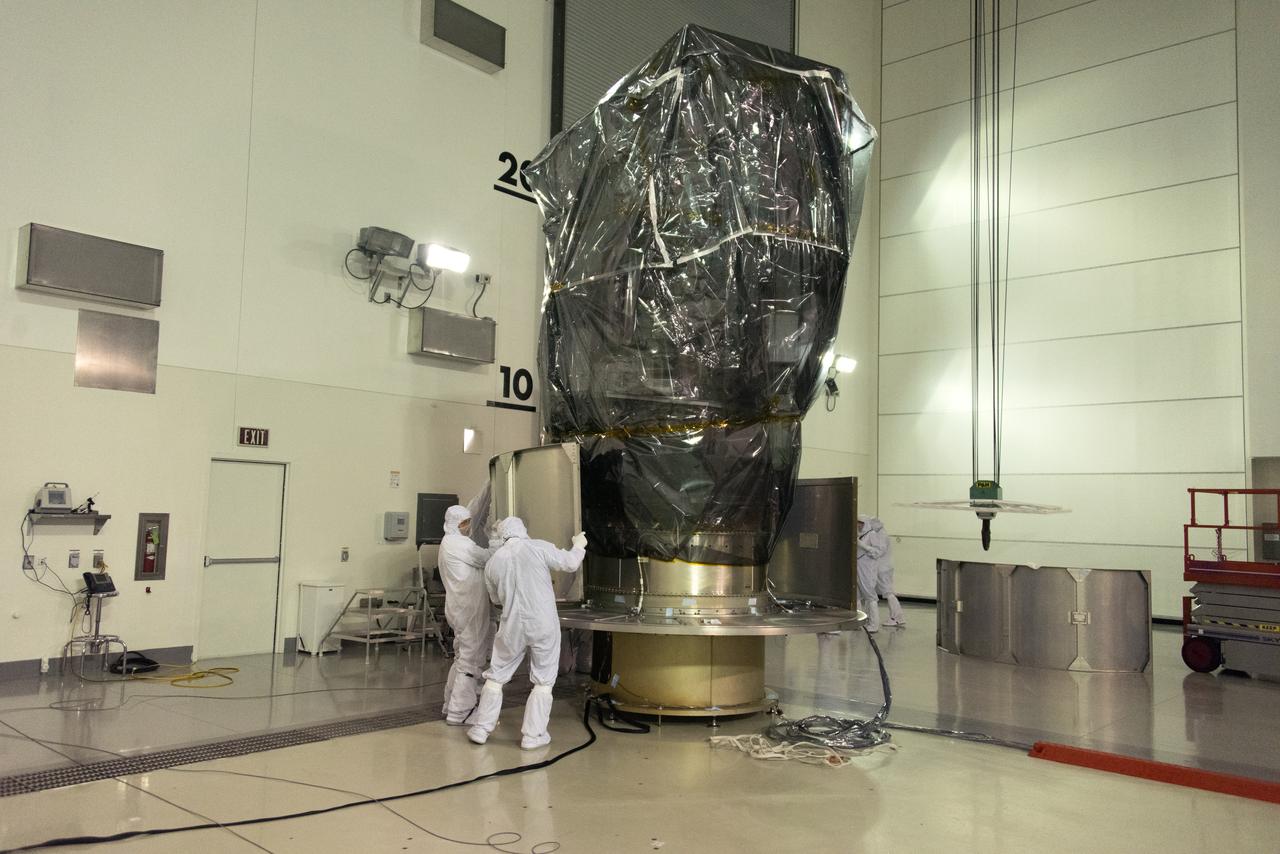
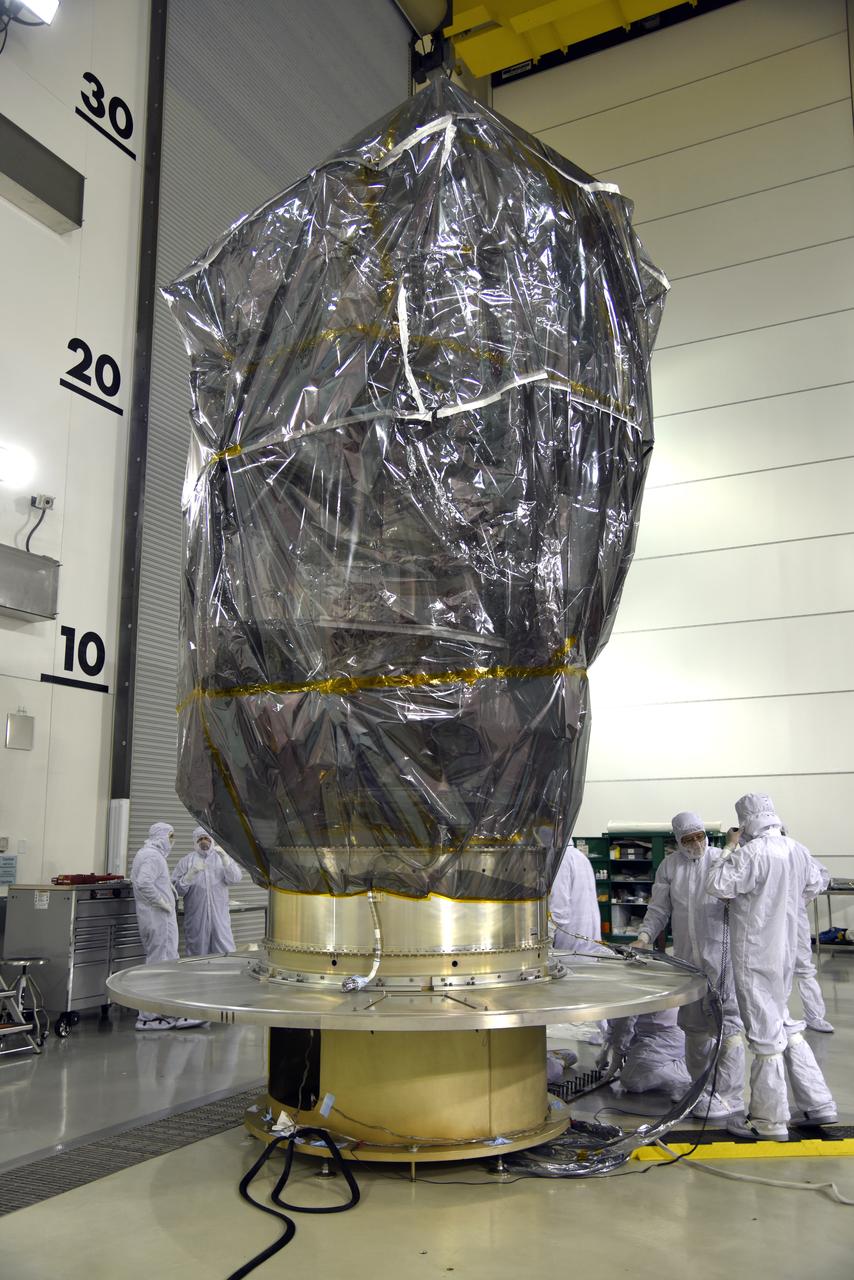
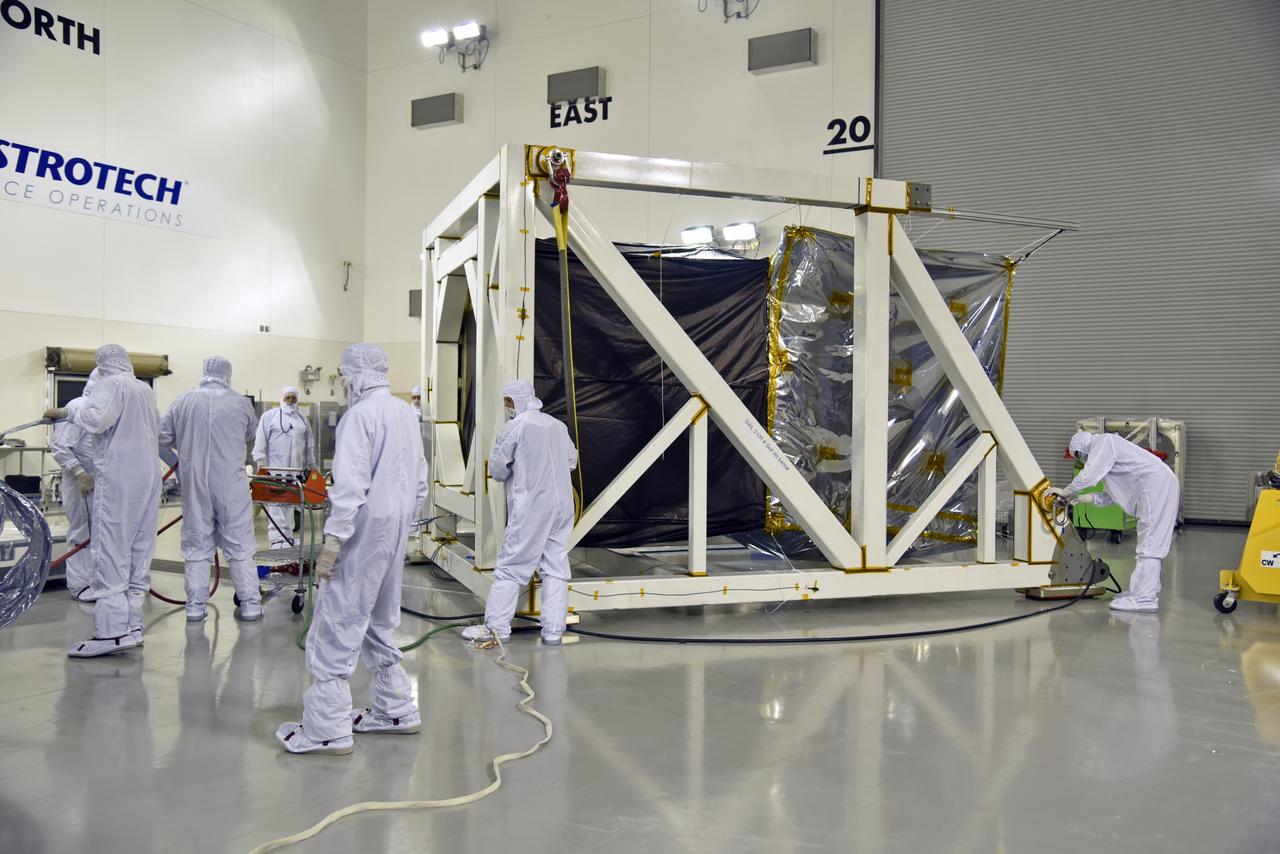
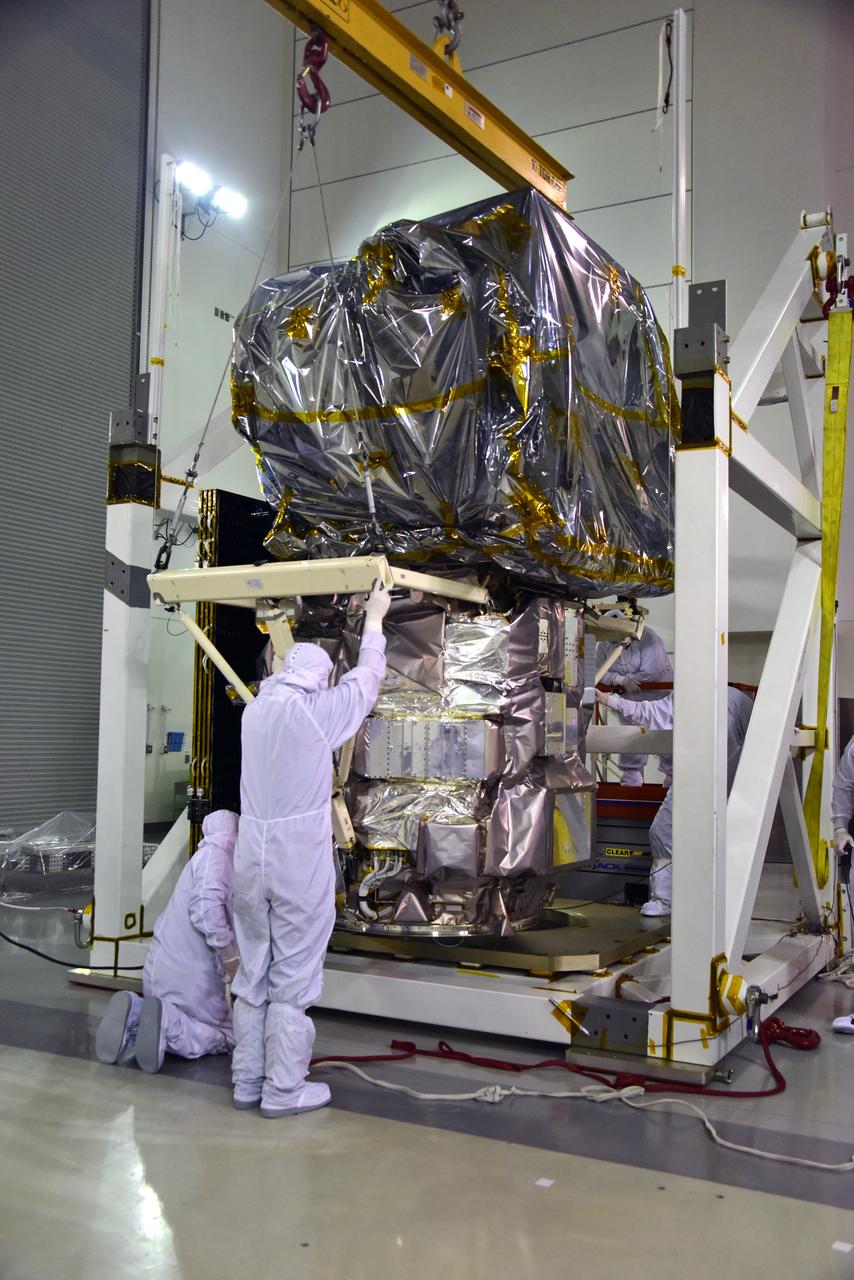
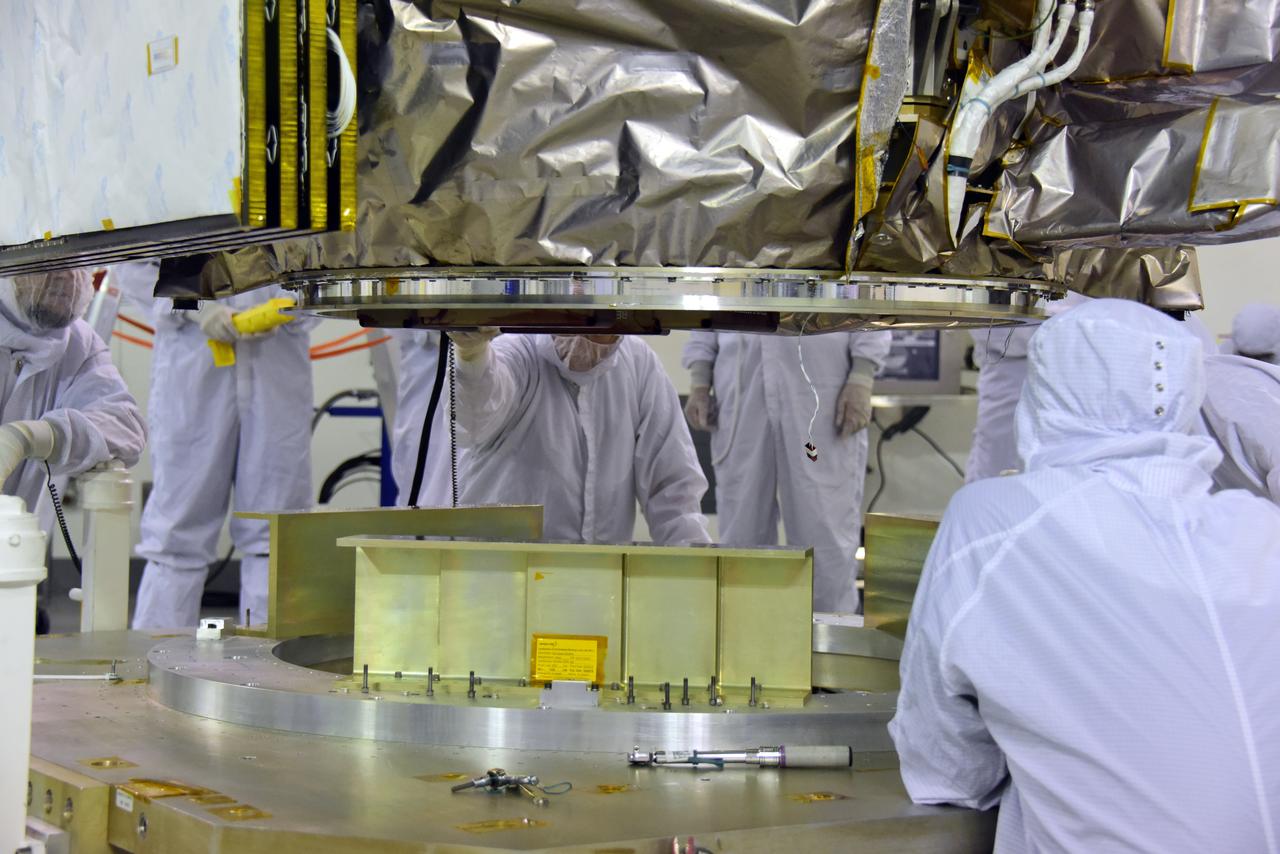
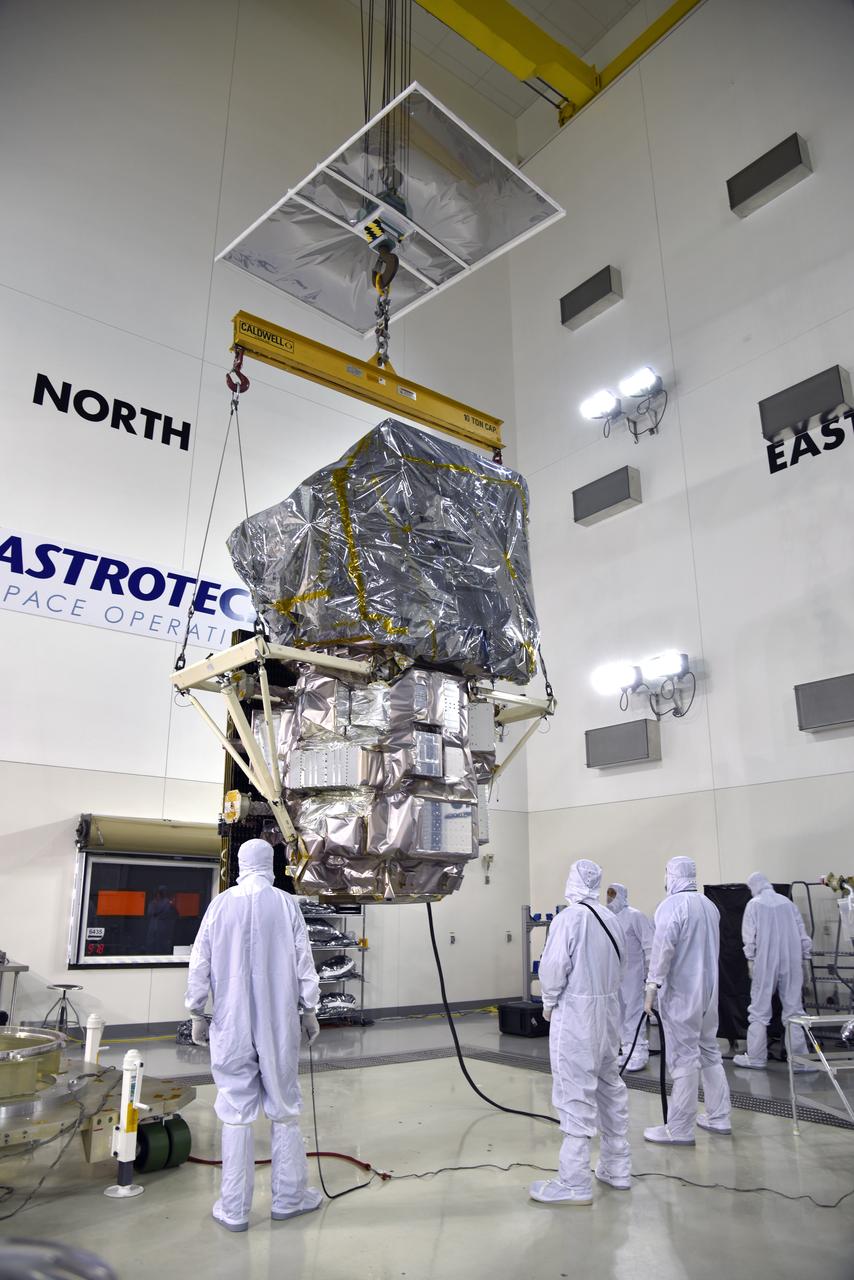
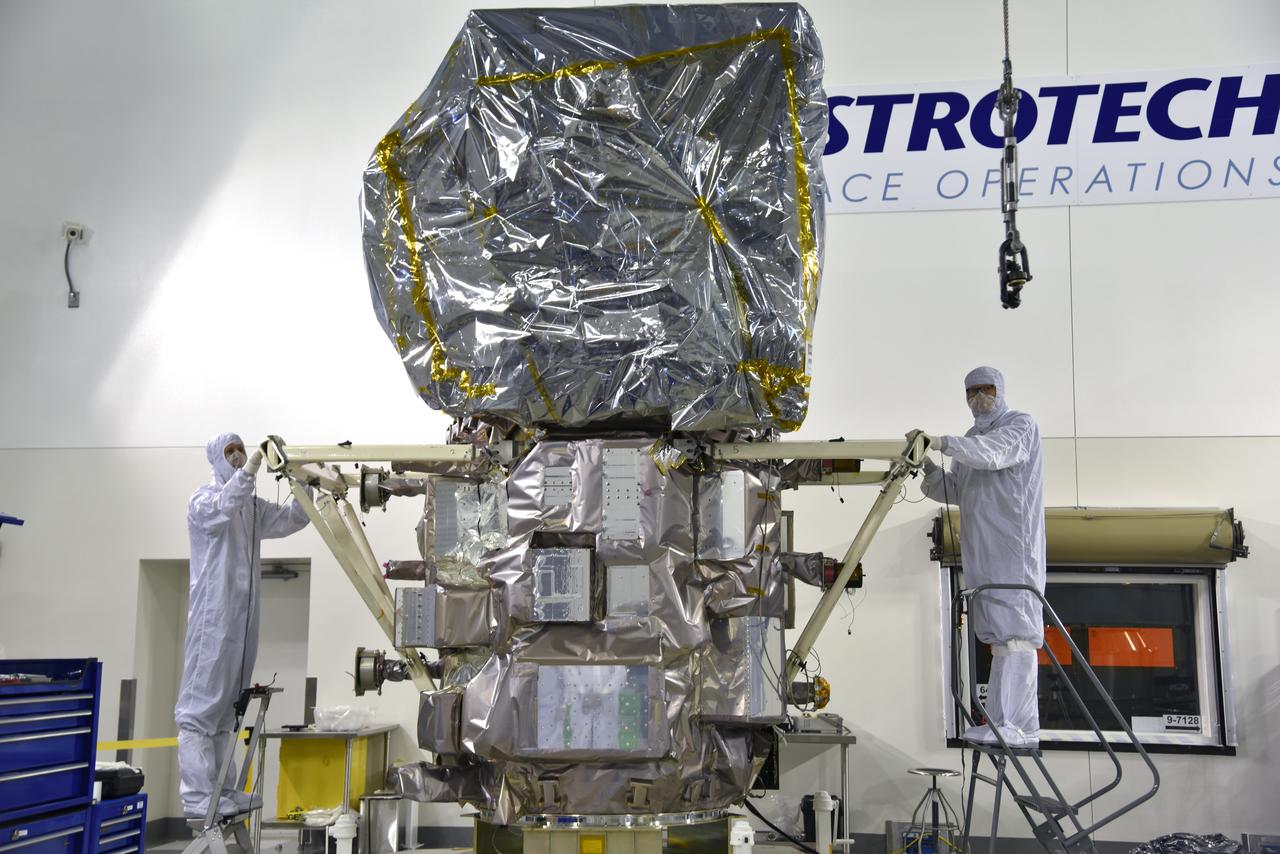
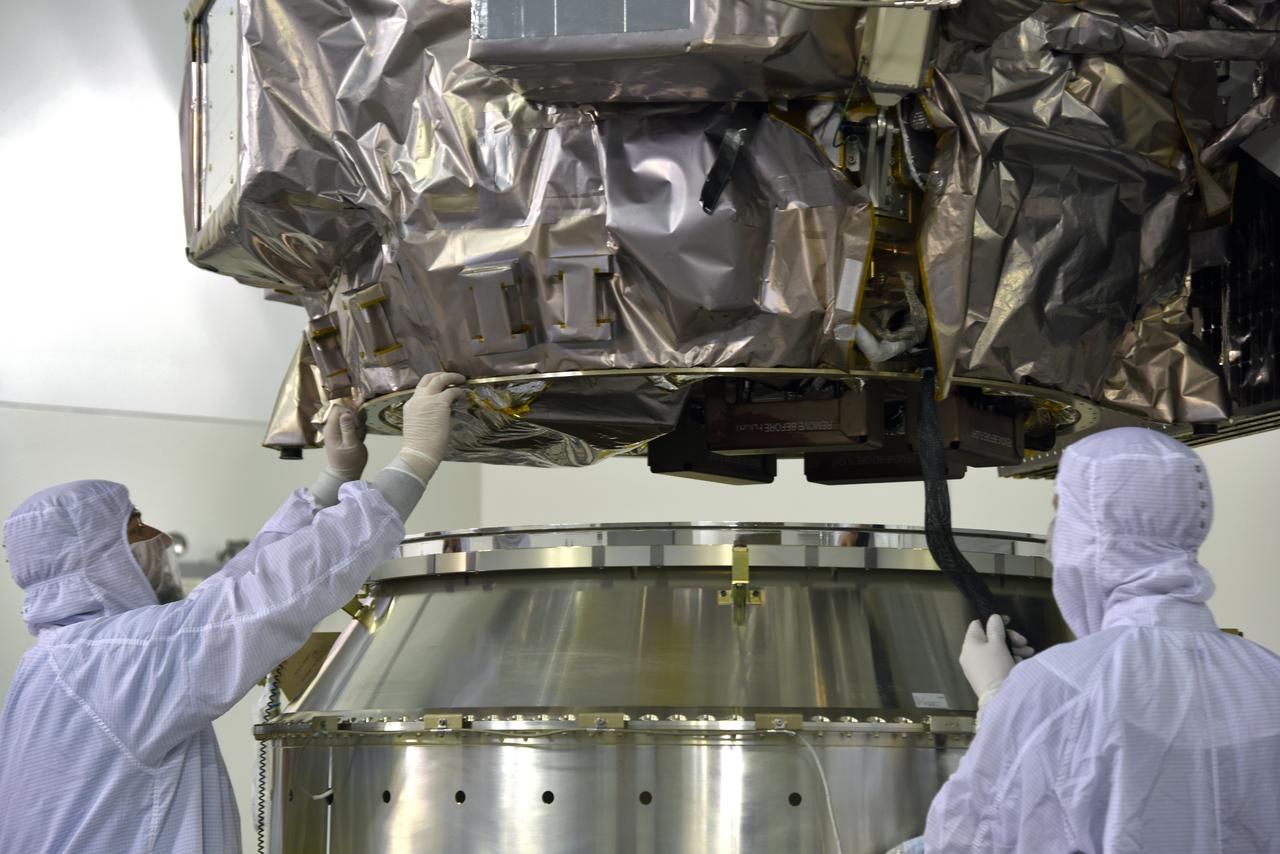
Inside the Astrotech Space Operations high bay at Vandenberg Air Force Base in California, technicians prepare NASA's Ice, Cloud and land Elevation Satellite-2 (ICESat-2), for installation of the protective canister on Aug. 25, 2018. The satellite will be transported to Space Launch Complex 2 where it will be hoisted up by crane and attached to the United Launch Alliance Delta II rocket. Launch is scheduled for Sept. 15, 2018. ICESat-2 will measure the height of a changing Earth, one laser pulse at a time, 10,000 laser pulses a second. The satellite will carry the Advanced Topographic Laser Altimeter System (ATLAS). ICESat-2 will help scientists investigate why, and how much our planet's frozen and icy areas, called the cryosphere, are changing in a warming climate.
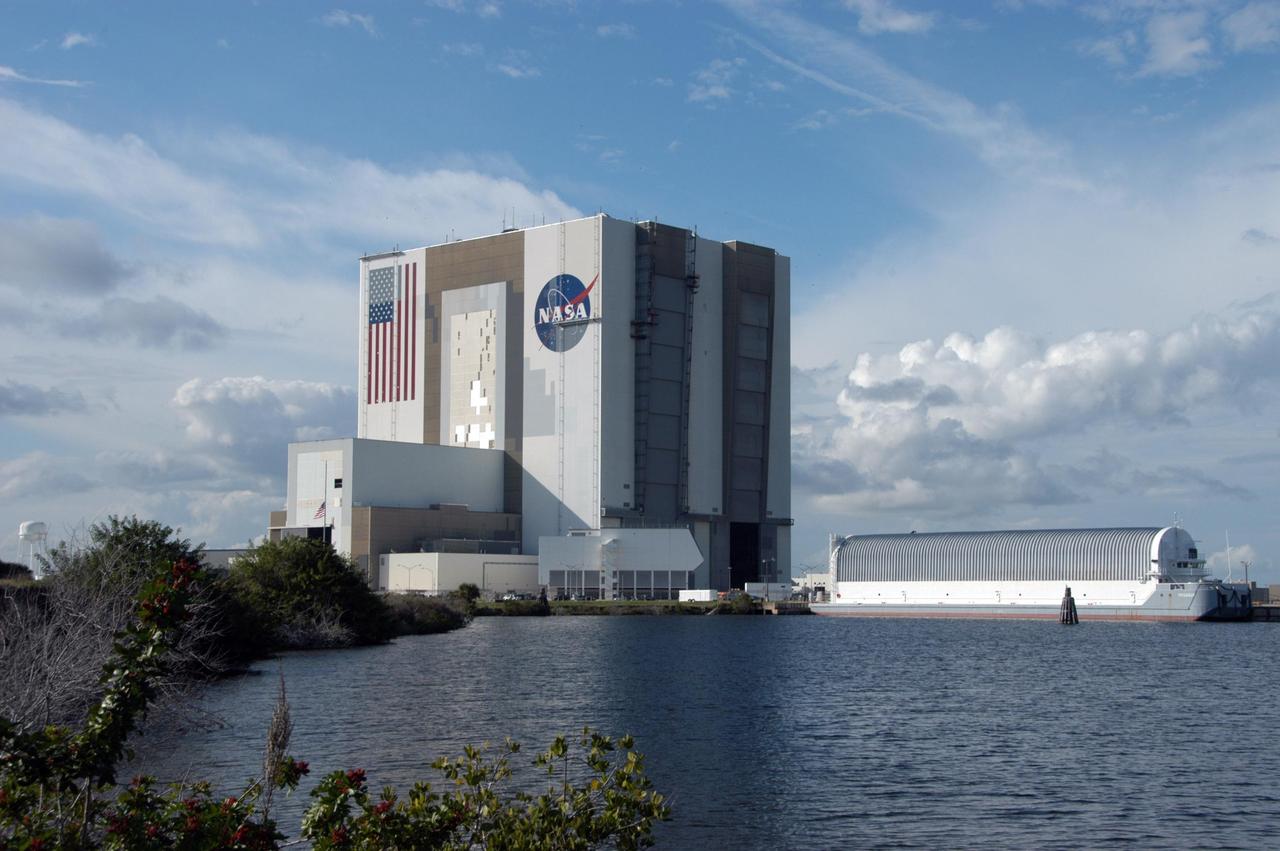
KENNEDY SPACE CENTER, FLA. -- Elevated platforms are seen hanging on the side of Kennedy Space Center's Vehicle Assembly Building in a view looking across from the turn basin. To the right is the large external tank barge. Workers, suspended on the platforms from the top of the 525-foot-high VAB, use rollers and brushes to do the painting. The flag and logo were last painted in 1998, honoring NASA's 40th anniversary. The flag spans an area 209 feet by 110 feet, or about 23, 437 square feet. Each stripe is 9 feet wide and each star is 6 feet in diameter. The logo, also known as the "meatball," measures 110 feet by 132 feet, or about 12,300 square feet. Photo credit: NASA/George Shelton
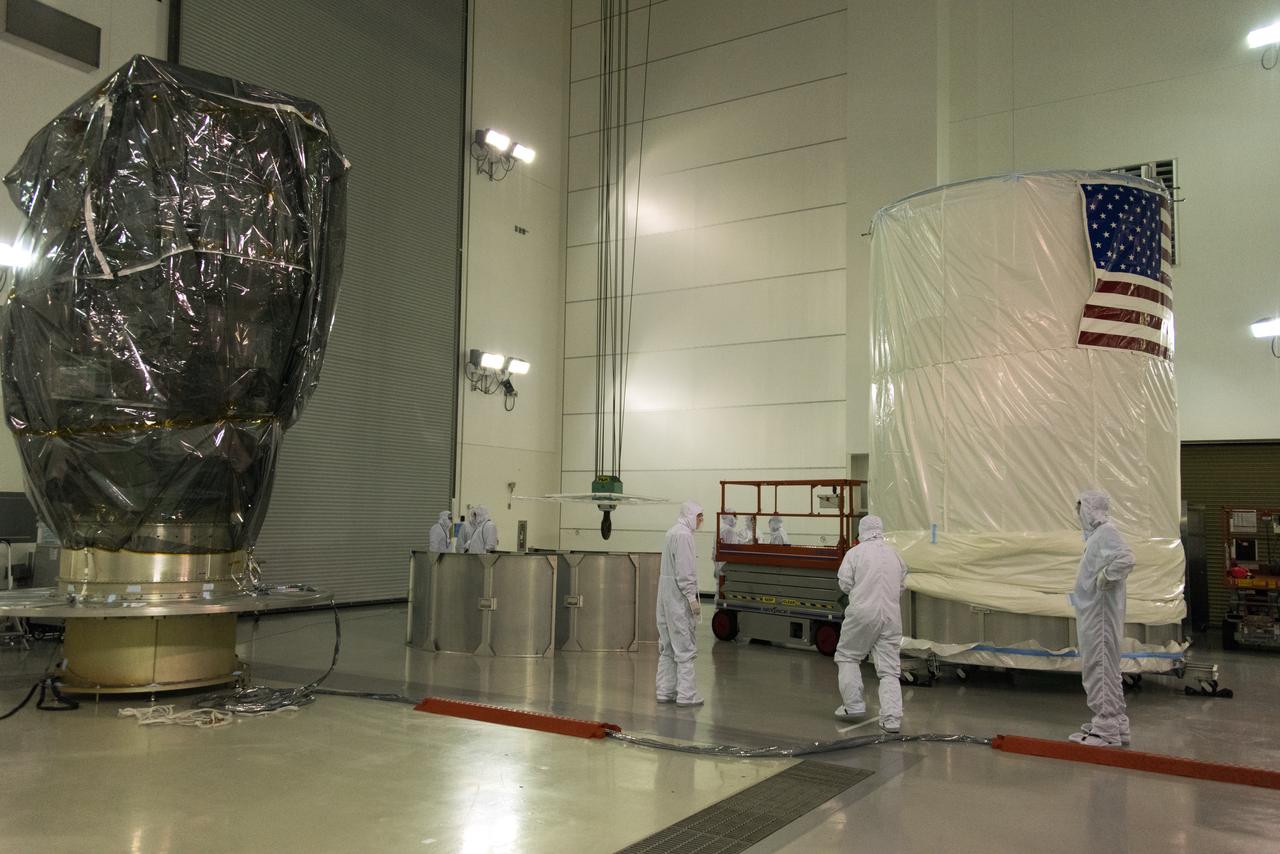
Inside the Astrotech Space Operations high bay at Vandenberg Air Force Base in California, technicians prepare the canister, at right, for installation around NASA's Ice, Cloud and land Elevation Satellite-2 (ICESat-2), at left, on Aug. 25, 2018. The satellite will be transported to Space Launch Complex 2 where it will be hoisted up by crane and attached to the United Launch Alliance Delta II rocket. Launch is scheduled for Sept. 15, 2018. ICESat-2 will measure the height of a changing Earth, one laser pulse at a time, 10,000 laser pulses a second. The satellite will carry the Advanced Topographic Laser Altimeter System (ATLAS). ICESat-2 will help scientists investigate why, and how much our planet's frozen and icy areas, called the cryosphere, are changing in a warming climate.
Inside the high bay of the Astrotech Space Operations facility at Vandenberg Air Force Base in California, a solar array first motion test is in progress on NASA's Ice, Cloud and land Elevation Satellite-2 (ICESat-2) on June 18, 2018. The satellite is being prepared for its scheduled launch from Space Launch Complex-2 at Vandenberg on the final United Launch Alliance Delta II rocket. ICESat-2 will measure the height of a changing Earth, one laser pulse at a time, 10,000 laser pulses a second. The satellite will carry the Advanced Topographic Laser Altimeter System. ICESat-2 will help scientists investigate why, and how much our planet's frozen and icy areas, called the cryosphere, is changing in a warming climate.
Inside the high bay of the Astrotech Space Operations facility at Vandenberg Air Force Base in California, technicians attach NASA's Ice, Cloud and land Elevation Satellite-2 (ICESat-2) to the payload direct mate adapter, on Aug. 24, 2018. The satellite is being prepared for its scheduled launch from Space Launch Complex 2 at Vandenberg on the final United Launch Alliance Delta II rocket. ICESat-2 will measure the height of a changing Earth, one laser pulse at a time, 10,000 laser pulses a second. The satellite will carry the Advanced Topographic Laser Altimeter System (ATLAS). ICESat-2 will help scientists investigate why, and how much our planet's frozen and icy areas, called the cryosphere, are changing in a warming climate.
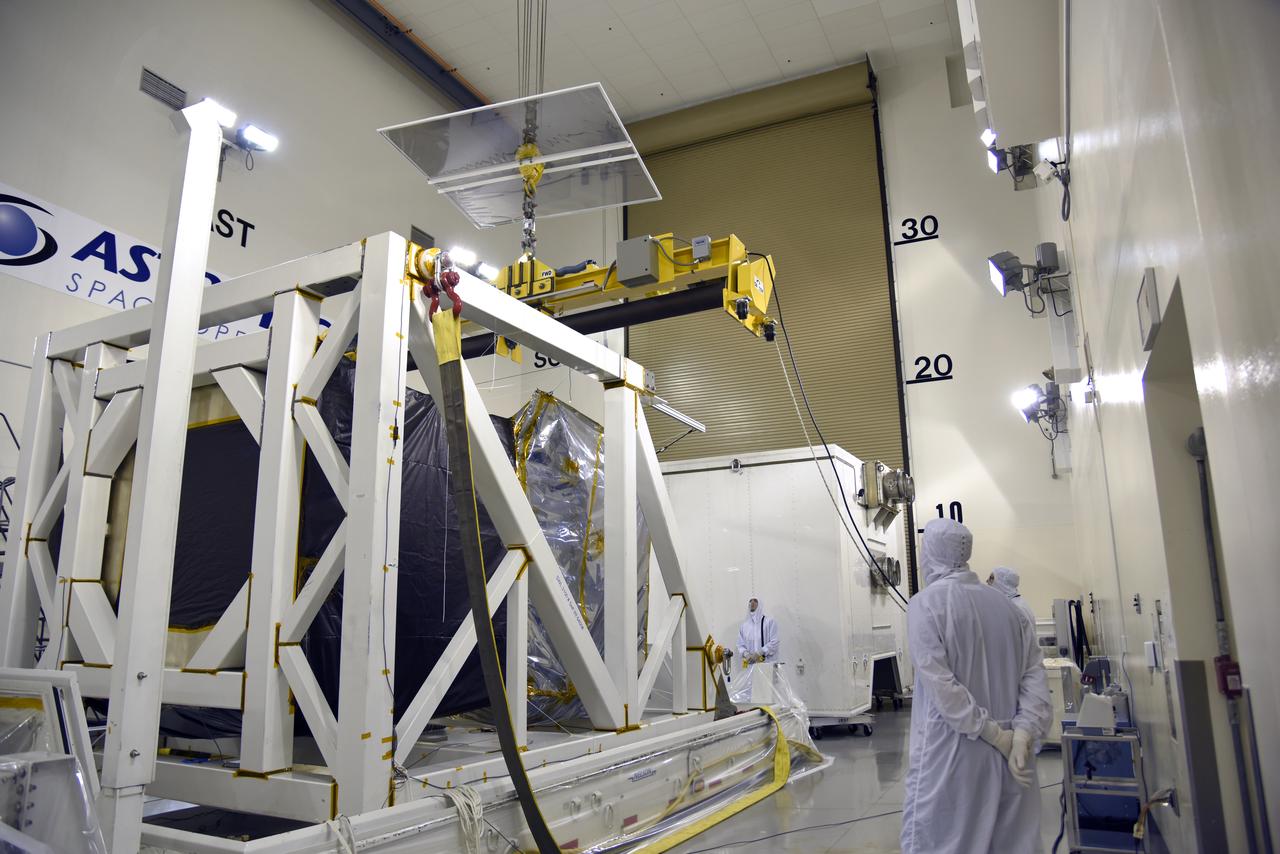
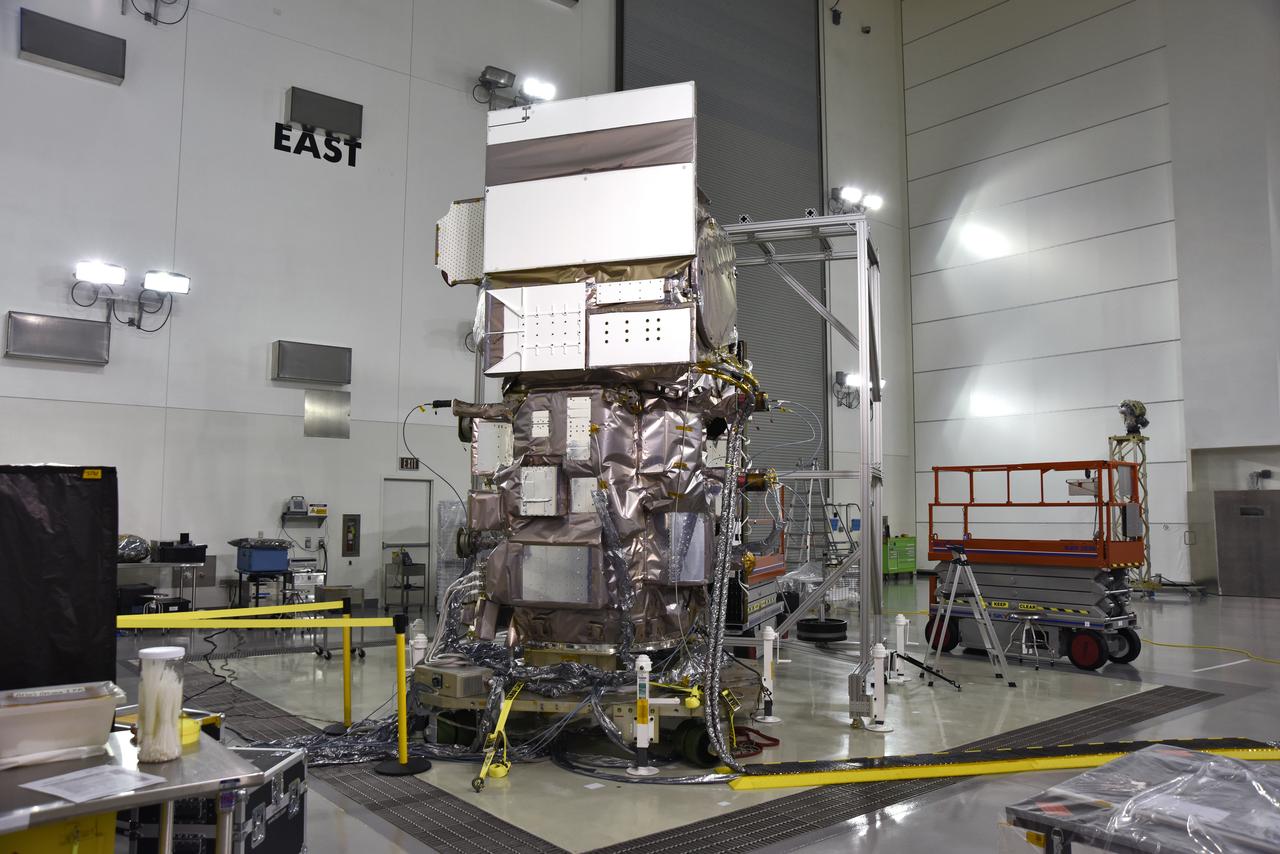
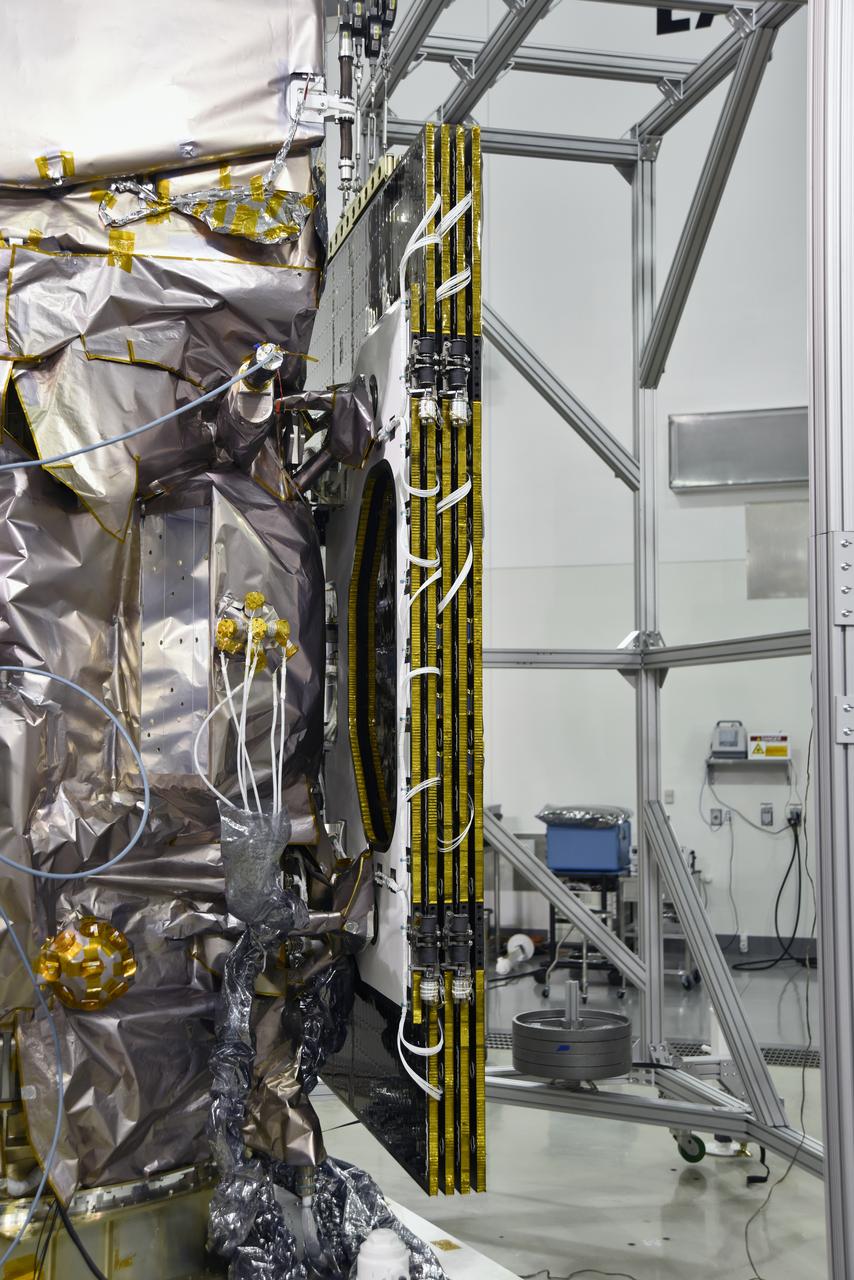
NASA's Ice, Cloud and land Elevation Satellite-2 (ICESat-2) is uncrated and is being prepared for its move to the high bay of the Astrotech processing facility on June 13, 2018, at Vandenberg Air Force Base in California. ICESat-2 was shipped from the Northrop Grumman facility in Gilbert, Arizona, where it was built and tested. The satellite is scheduled to launch from Space Launch Complex-2 at Vandenberg on the final United Launch Alliance Delta II rocket. ICESat-2 will measure the height of a changing Earth, one laser pulse at a time, 10,000 laser pulses a second. The satellite will carry the Advanced Topographic Laser Altimeter System. ICESat-2 will help scientists investigate why, and how much our planet's frozen and icy areas, called the cryosphere, is changing in a warming climate.
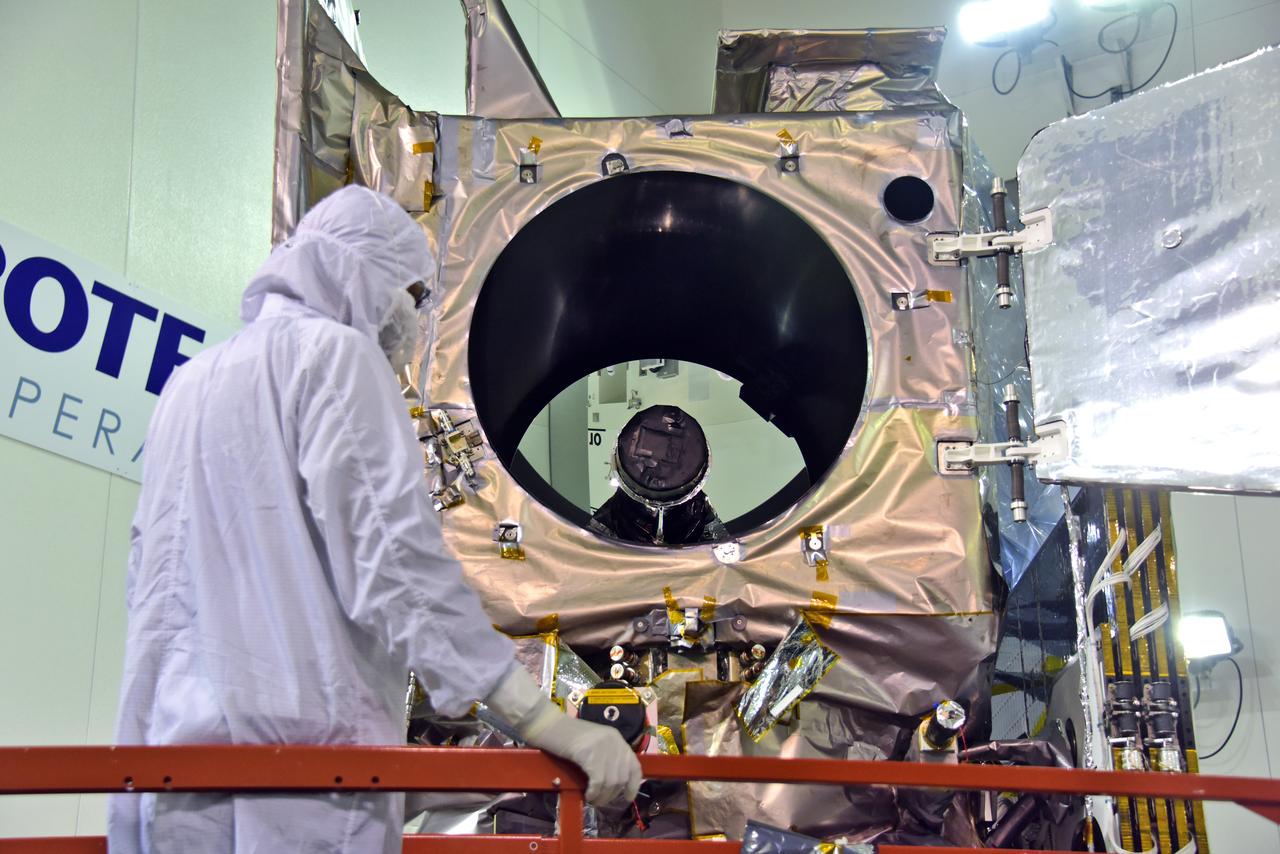
Inside the high bay of the Astrotech Space Operations facility at Vandenberg Air Force Base in California, a technician opens and checks the flight door for the Advanced Topographic Laser Altimeter System (ATLAS) on NASA's Ice, Cloud and land Elevation Satellite-2 (ICESat-2) on June 21, 2018. The satellite is being prepared for its scheduled launch from Space Launch Complex-2 at Vandenberg on the final United Launch Alliance Delta II rocket. ICESat-2 will measure the height of a changing Earth, one laser pulse at a time, 10,000 laser pulses a second. The satellite will carry ATLAS. ICESat-2 will help scientists investigate why, and how much our planet's frozen and icy areas, called the cryosphere, is changing in a warming climate.

KENNEDY SPACE CENTER, FLA. -- Elevated platforms are seen hanging on the side of Kennedy Space Center's Vehicle Assembly Building to facilitate the repainting of the American flag and NASA logo. Workers, suspended on the platforms from the top of the 525-foot-high VAB, use rollers and brushes to do the painting. The flag and logo were last painted in 1998, honoring NASA's 40th anniversary. The flag spans an area 209 feet by 110 feet, or about 23, 437 square feet. Each stripe is 9 feet wide and each star is 6 feet in diameter. The logo, also known as the "meatball," measures 110 feet by 132 feet, or about 12,300 square feet. Photo credit: NASA/George Shelton
A crane is used to rotate NASA's Ice, Cloud and land Elevation Satellite-2 (ICESat-2) in its fixture inside the high bay of the Astrotech Space Operations facility on June 14, 2018, at Vandenberg Air Force Base in California. ICESat-2 was shipped from the Northrop Grumman facility in Gilbert, Arizona, where it was built and tested. The satellite is scheduled to launch from Space Launch Complex-2 at Vandenberg on the final United Launch Alliance Delta II rocket. ICESat-2 will measure the height of a changing Earth, one laser pulse at a time, 10,000 laser pulses a second. The satellite will carry the Advanced Topographic Laser Altimeter System. ICESat-2 will help scientists investigate why, and how much our planet's frozen and icy areas, called the cryosphere, is changing in a warming climate.
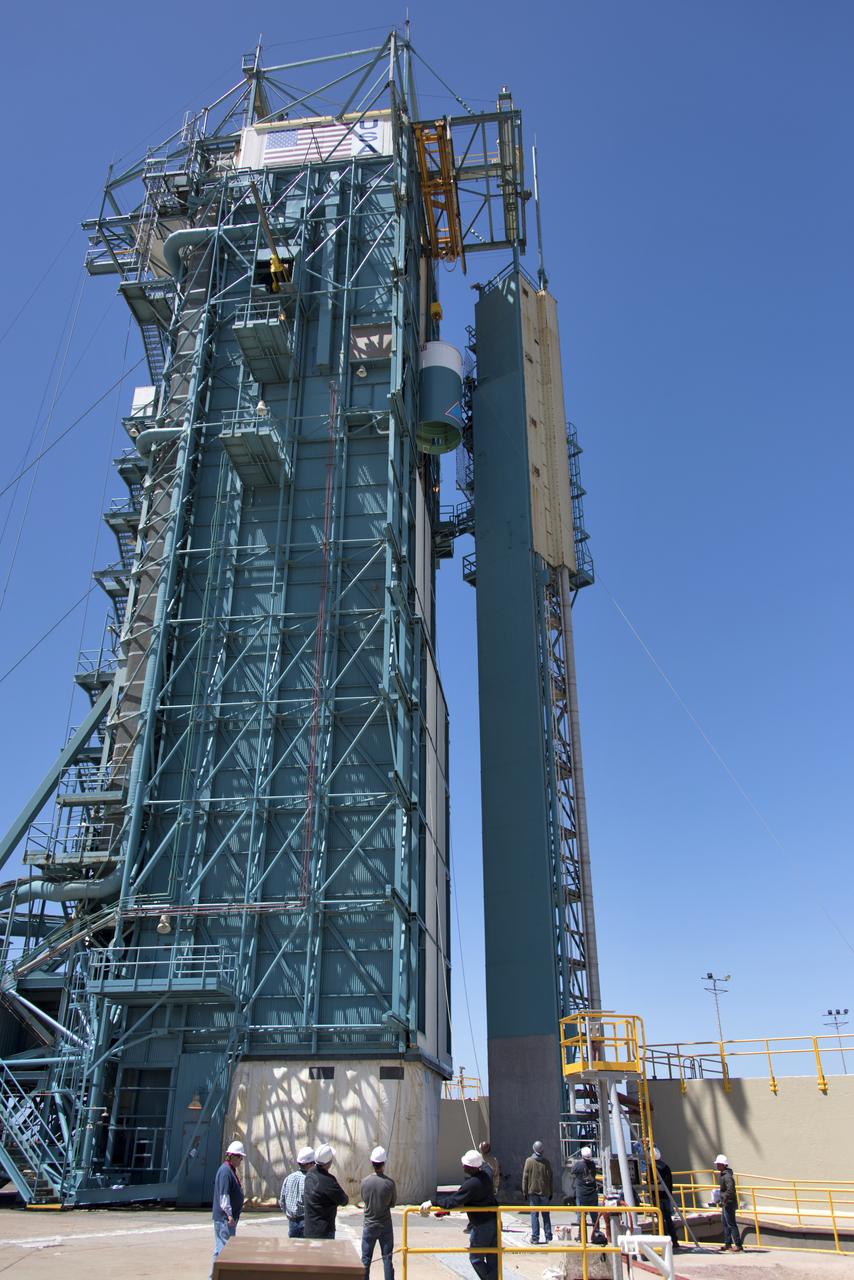
The United Launch Alliance Delta II interstage is lifted high up at the Vertical Integration Facility at Space Launch Complex 2 on June 12, 2018, at Vandenberg Air Force Base in California. The interstage will be moved in and mated to the top of the booster, or first stage of the rocket. NASA's Ice, Cloud and land Elevation Satellite-2 (ICESat-2) will launch on the final Delta II rocket. ICESat-2 will measure the height of a changing Earth, one laser pulse at a time, 10,000 laser pulses a second. The satellite will carry a single instrument, the Advanced Topographic Laser Altimeter System. ICESat-2 will help scientists investigate why, and how much our planet's frozen and icy areas, called the cryosphere, is changing in a warming climate.
A crane is used to move NASA's Ice, Cloud and land Elevation Satellite-2 (ICESat-2) into the high bay of the Astrotech processing facility on June 13, 2018, at Vandenberg Air Force Base in California. ICESat-2 was shipped from the Northrop Grumman facility in Gilbert, Arizona, where it was built and tested. The satellite is scheduled to launch from Space Launch Complex-2 at Vandenberg on the final United Launch Alliance Delta II rocket. ICESat-2 will measure the height of a changing Earth, one laser pulse at a time, 10,000 laser pulses a second. The satellite will carry the Advanced Topographic Laser Altimeter System. ICESat-2 will help scientists investigate why, and how much our planet's frozen and icy areas, called the cryosphere, is changing in a warming climate.
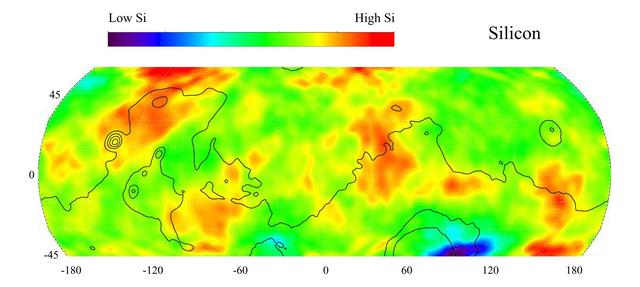
This gamma ray spectrometer map of the mid-latitude region of Mars is based on gamma-rays from the element silicon. Silicon is one of the most abundant elements on the surface of both Mars and Earth (second only to oxygen). The most extensive region of highest silicon content, shown in red, is located in the high latitudes north of Tharsis (centered near 45 degrees latitude, -120 degrees longitude). The area of lowest silicon content, shown in blue, lies just to the east of the Hellas Basin (-45 degrees latitude, 90 degrees longitude). Contours of constant surface elevation are also shown. The long continuous contour line running from east to west marks the approximate separation of the younger lowlands in the north from the older highlands in the south. http://photojournal.jpl.nasa.gov/catalog/PIA04256
Inside the high bay of the Astrotech Space Operations facility at Vandenberg Air Force Base in California, technicians attach NASA's Ice, Cloud and land Elevation Satellite-2 (ICESat-2) to the payload direct mate adapter, on Aug. 24, 2018. The satellite is being prepared for its scheduled launch from Space Launch Complex 2 at Vandenberg on the final United Launch Alliance Delta II rocket. ICESat-2 will measure the height of a changing Earth, one laser pulse at a time, 10,000 laser pulses a second. The satellite will carry the Advanced Topographic Laser Altimeter System (ATLAS). ICESat-2 will help scientists investigate why, and how much our planet's frozen and icy areas, called the cryosphere, are changing in a warming climate.
Inside the high bay of the Astrotech Space Operations facility at Vandenberg Air Force Base in California, technicians attach NASA's Ice, Cloud and land Elevation Satellite-2 (ICESat-2) to the payload direct mate adapter, on Aug. 24, 2018. The satellite is being prepared for its scheduled launch from Space Launch Complex 2 at Vandenberg on the final United Launch Alliance Delta II rocket. ICESat-2 will measure the height of a changing Earth, one laser pulse at a time, 10,000 laser pulses a second. The satellite will carry the Advanced Topographic Laser Altimeter System (ATLAS). ICESat-2 will help scientists investigate why, and how much our planet's frozen and icy areas, called the cryosphere, are changing in a warming climate.
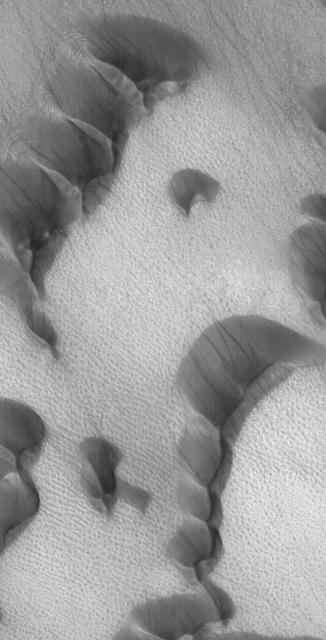
This Mars Global Surveyor (MGS) Mars Orbiter Camera (MOC) image of dunes in the martian north polar region is important because it shows one of the highest northern latitude views of streaks thought to be made by passing dust devils. The dark, thin, filamentary streaks on the dunes and on the adjacent plains were probably formed by dust devils. The dunes occur near 76.6°N, 62.7°W. Dust devil streaks are observed on Mars at very high latitudes, such as this, all the way down to the equator. They are also seen at all elevations, from the deepest parts of the Hellas Basin to the summit of Olympus Mons. This picture covers an area about 3 km (1.9 mi) wide. Sunlight illuminates the scene from the lower left. http://photojournal.jpl.nasa.gov/catalog/PIA06334
The United Launch Alliance Delta II second stage is lifted high up at the Vertical Integration Facility at Space Launch Complex 2 on June 12, 2018, at Vandenberg Air Force Base in California. The second stage will be attached to the top of the booster, or first stage of the rocket. NASA's Ice, Cloud and land Elevation Satellite-2 (ICESat-2) will launch on the final Delta II rocket. ICESat-2 will measure the height of a changing Earth, one laser pulse at a time, 10,000 laser pulses a second. The satellite will carry a single instrument, the Advanced Topographic Laser Altimeter System. ICESat-2 will help scientists investigate why, and how much our planet's frozen and icy areas, called the cryosphere, is changing in a warming climate.
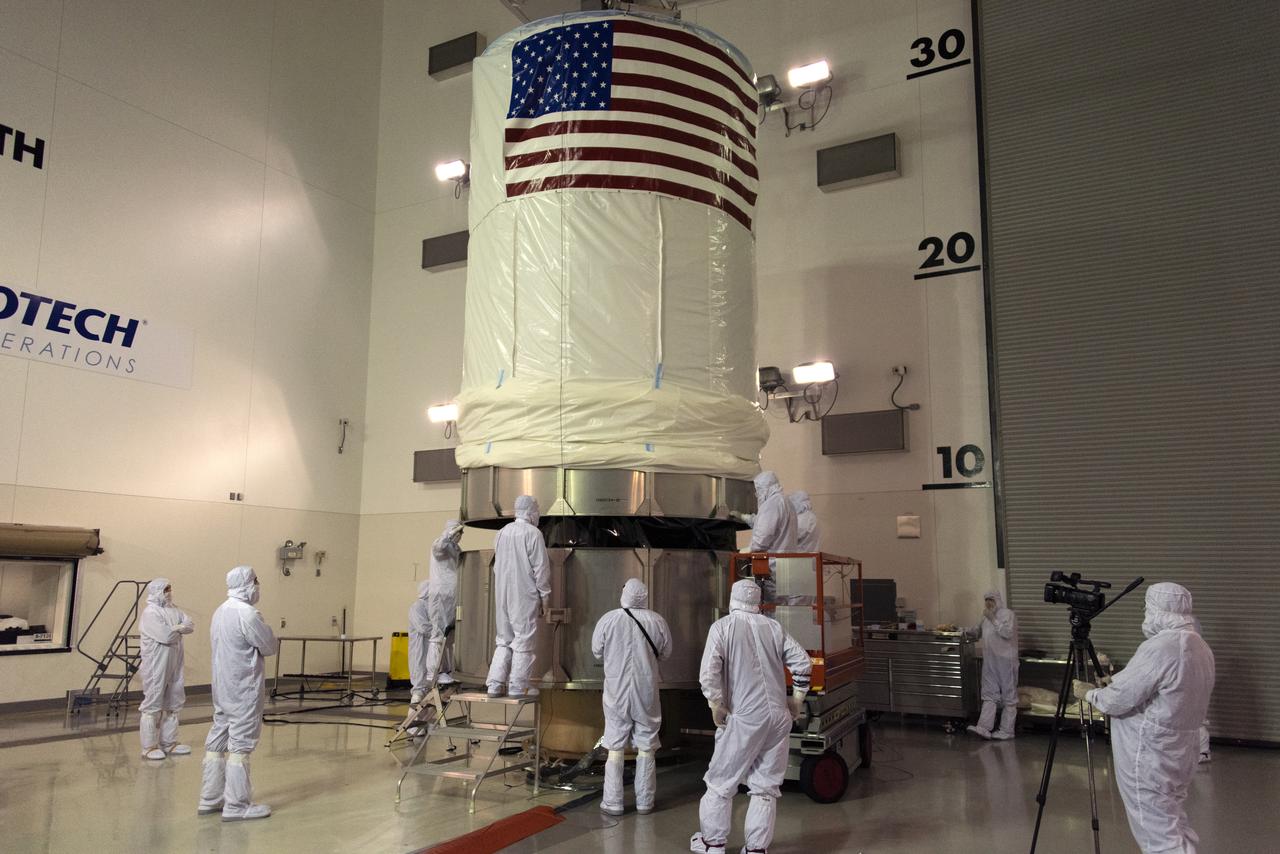
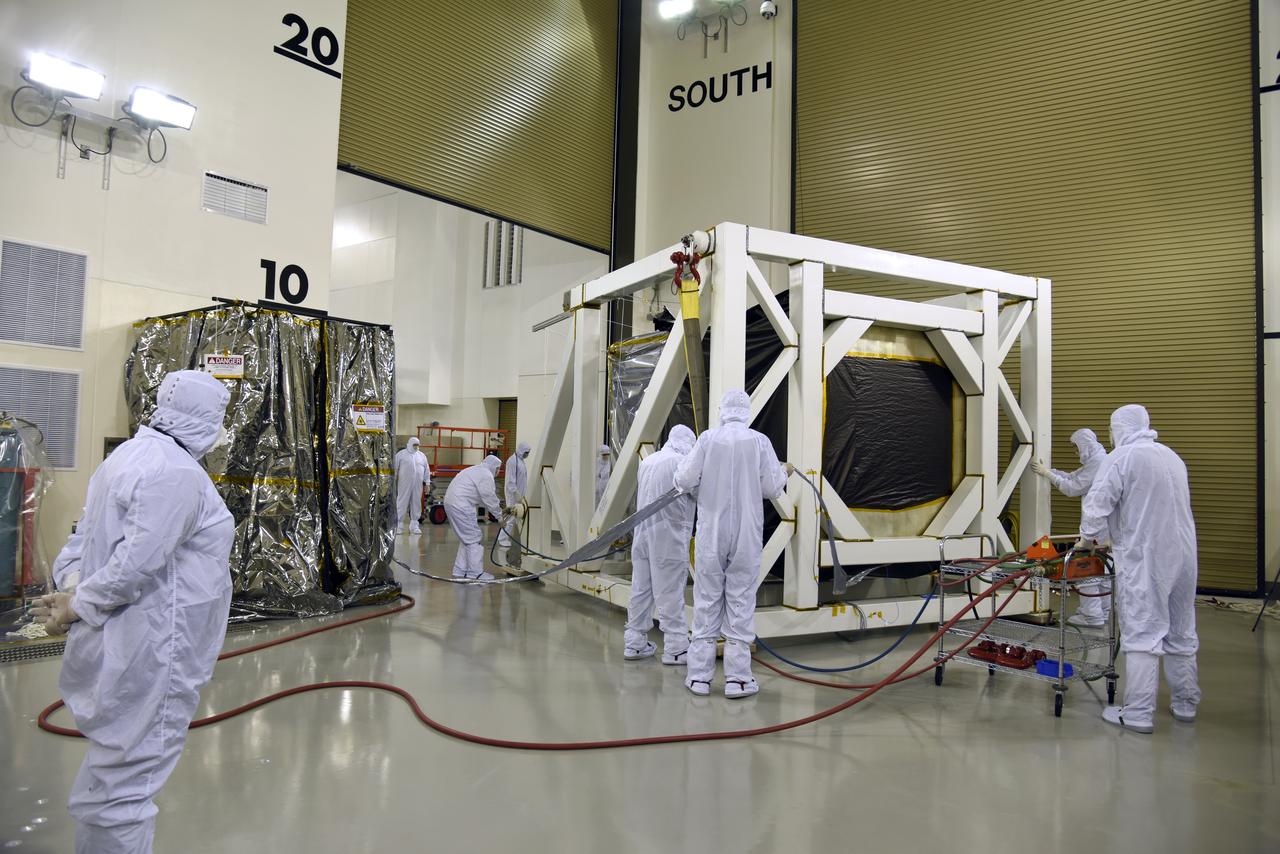
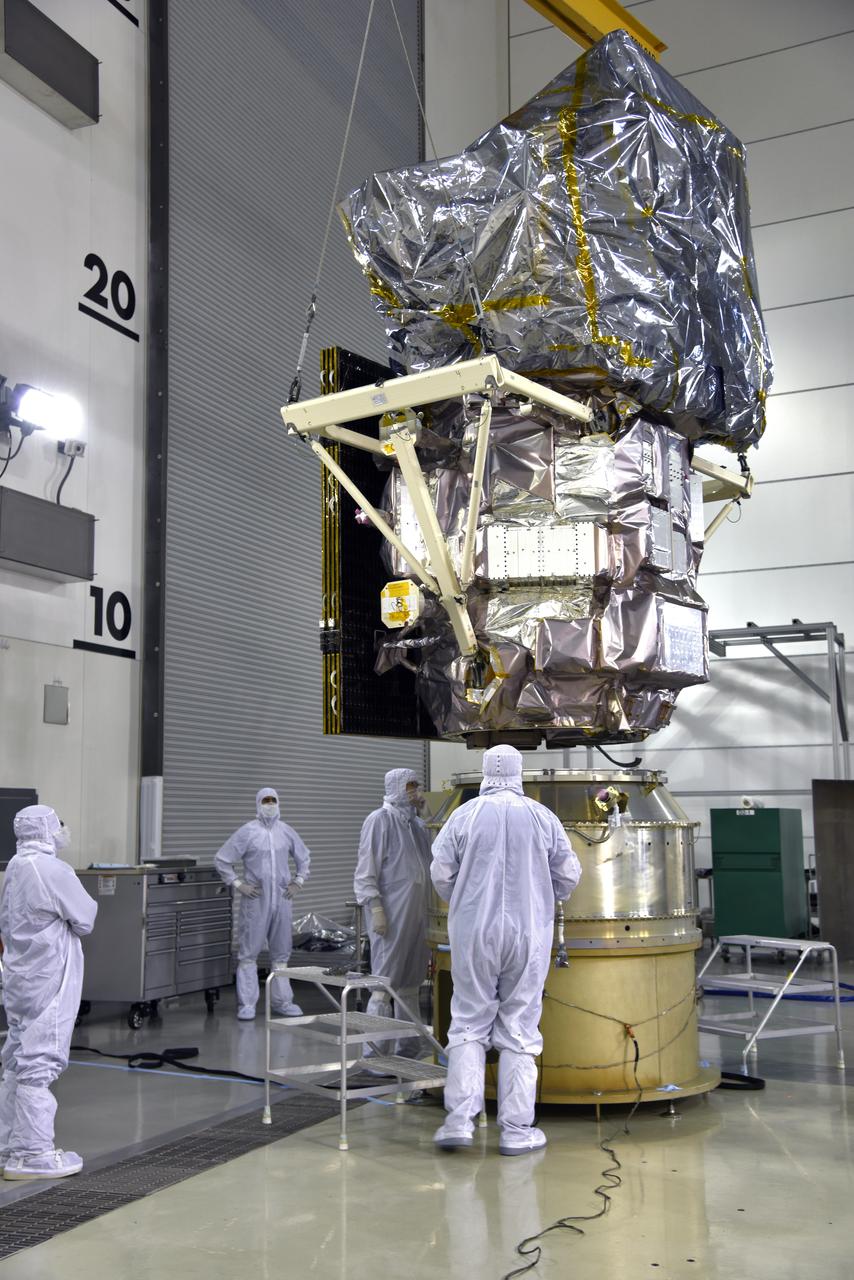
Inside the Astrotech Space Operations high bay at Vandenberg Air Force Base in California, the protective canister is lowered down over NASA's Ice, Cloud and land Elevation Satellite-2 (ICESat-2), on Aug. 25, 2018. The satellite will be transported to Space Launch Complex 2 where it will be hoisted up by crane and attached to the United Launch Alliance Delta II rocket. Launch is scheduled for Sept. 15, 2018. ICESat-2 will measure the height of a changing Earth, one laser pulse at a time, 10,000 laser pulses a second. The satellite will carry the Advanced Topographic Laser Altimeter System (ATLAS). ICESat-2 will help scientists investigate why, and how much our planet's frozen and icy areas, called the cryosphere, are changing in a warming climate.
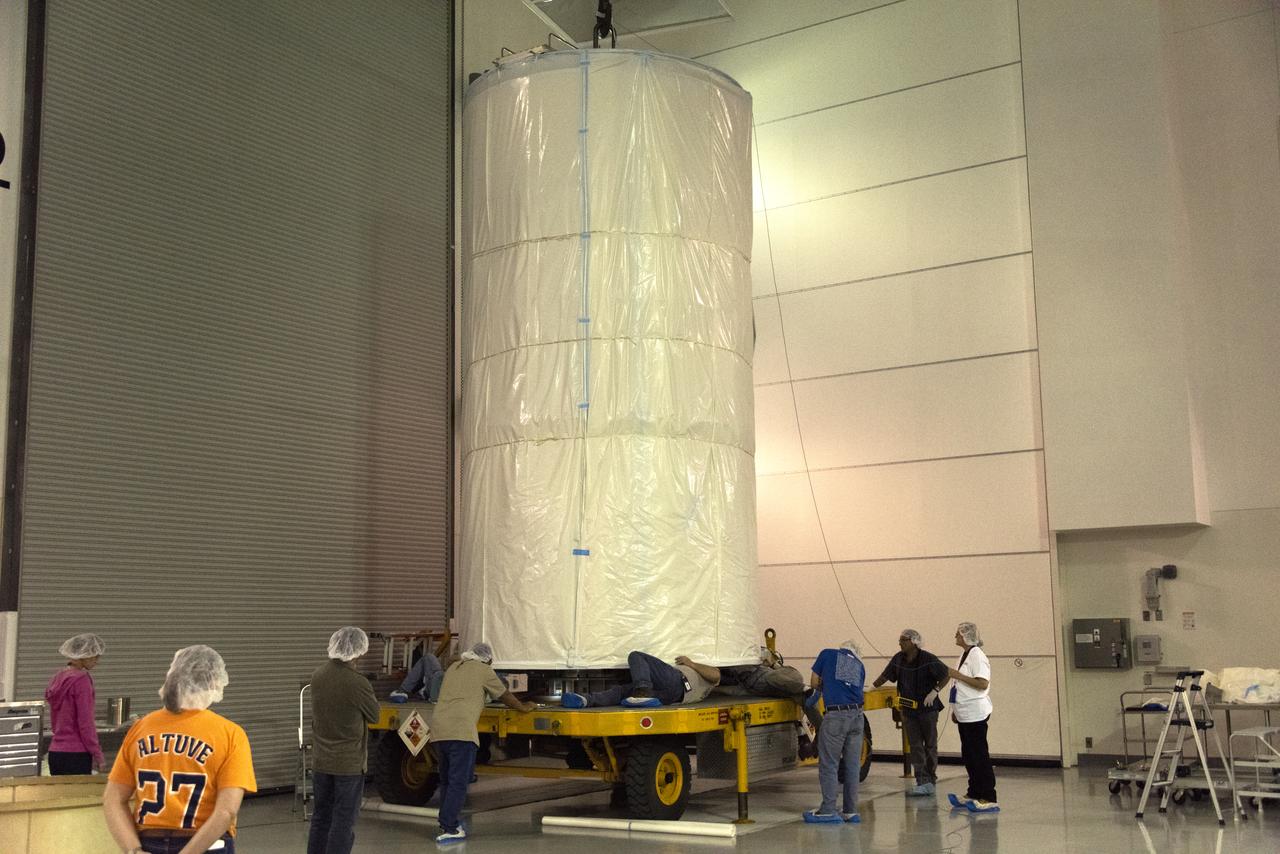
Technicians assist as NASA's Ice, Cloud and land Elevation Satellite-2 (ICESat-2), inside its protective canister, is lowered onto a transport trailer inside the Astrotech Space Operations high bay at Vandenberg Air Force Base in California, on Aug. 25, 2018. The satellite will be transported to Space Launch Complex 2 where it will be hoisted up by crane and attached to the United Launch Alliance Delta II rocket. Launch is scheduled for Sept. 15, 2018. ICESat-2 will measure the height of a changing Earth, one laser pulse at a time, 10,000 laser pulses a second. The satellite will carry the Advanced Topographic Laser Altimeter System (ATLAS). ICESat-2 will help scientists investigate why, and how much our planet's frozen and icy areas, called the cryosphere, are changing in a warming climate.
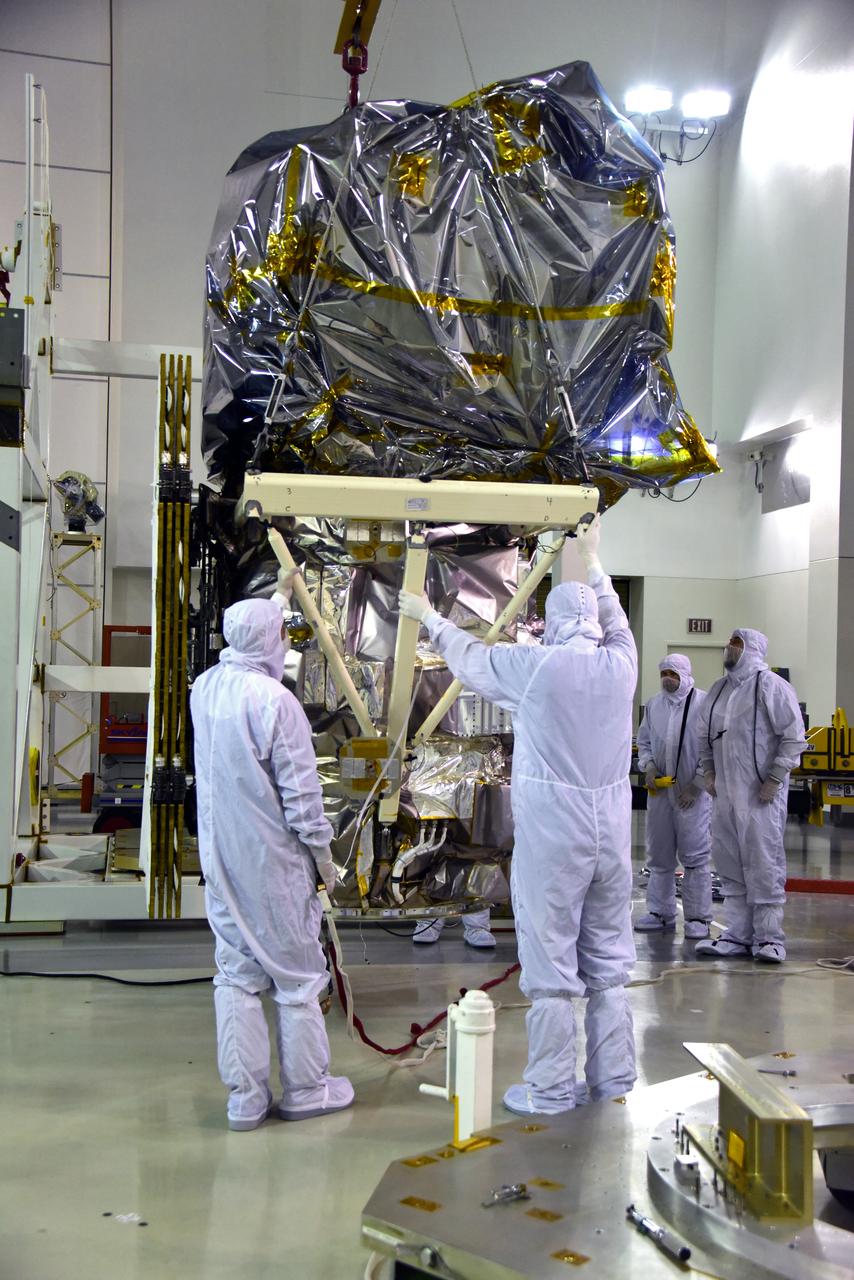
Technicians remove NASA's Ice, Cloud and land Elevation Satellite-2 (ICESat-2) from its fixture inside the high bay of the Astrotech Space Operations facility on June 14, 2018, at Vandenberg Air Force Base in California. The satellite will be secured on a work stand for processing. ICESat-2 was shipped from the Northrop Grumman facility in Gilbert, Arizona, where it was built and tested. The satellite is scheduled to launch from Space Launch Complex-2 at Vandenberg on the final United Launch Alliance Delta II rocket. ICESat-2 will measure the height of a changing Earth, one laser pulse at a time, 10,000 laser pulses a second. The satellite will carry the Advanced Topographic Laser Altimeter System. ICESat-2 will help scientists investigate why, and how much our planet's frozen and icy areas, called the cryosphere, is changing in a warming climate.
NASA's Ice, Cloud and land Elevation Satellite-2 (ICESat-2) is moved into the high bay of the Astrotech processing facility on June 13, 2018, at Vandenberg Air Force Base in California. ICESat-2 was shipped from the Northrop Grumman facility in Gilbert, Arizona, where it was built and tested. The satellite is scheduled to launch from Space Launch Complex-2 at Vandenberg on the final United Launch Alliance Delta II rocket. ICESat-2 will measure the height of a changing Earth, one laser pulse at a time, 10,000 laser pulses a second. The satellite will carry the Advanced Topographic Laser Altimeter System. ICESat-2 will help scientists investigate why, and how much our planet's frozen and icy areas, called the cryosphere, is changing in a warming climate.
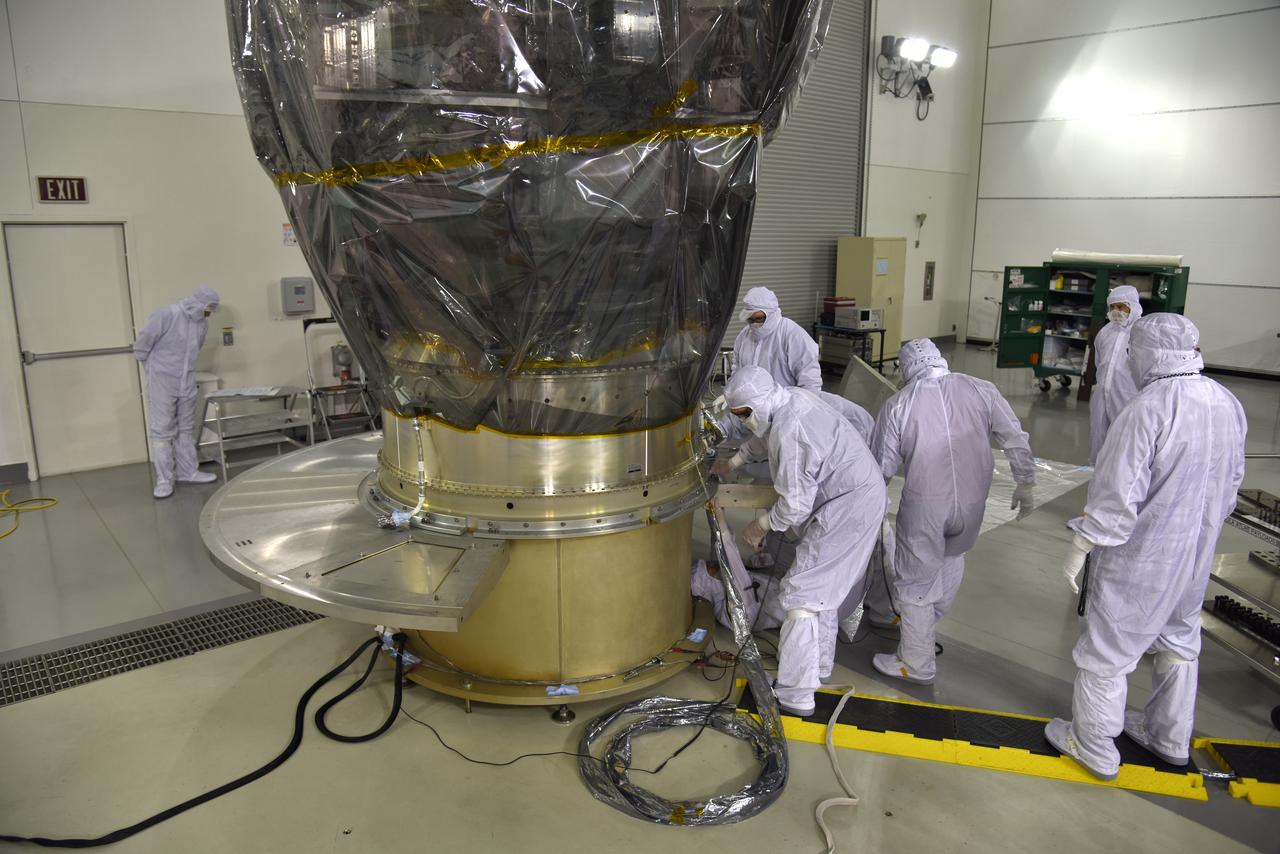
Inside the high bay of the Astrotech Space Operations facility at Vandenberg Air Force Base in California, technicians prepare to attach NASA's Ice, Cloud and land Elevation Satellite-2 (ICESat-2) to the payload adapter, on Aug. 20, 2018. The satellite is being prepared for its scheduled launch from Space Launch Complex 2 at Vandenberg on the final United Launch Alliance Delta II rocket. ICESat-2 will measure the height of a changing Earth, one laser pulse at a time, 10,000 laser pulses a second. The satellite will carry the Advanced Topographic Laser Altimeter System (ATLAS). ICESat-2 will help scientists investigate why, and how much our planet's frozen and icy areas, called the cryosphere, are changing in a warming climate.
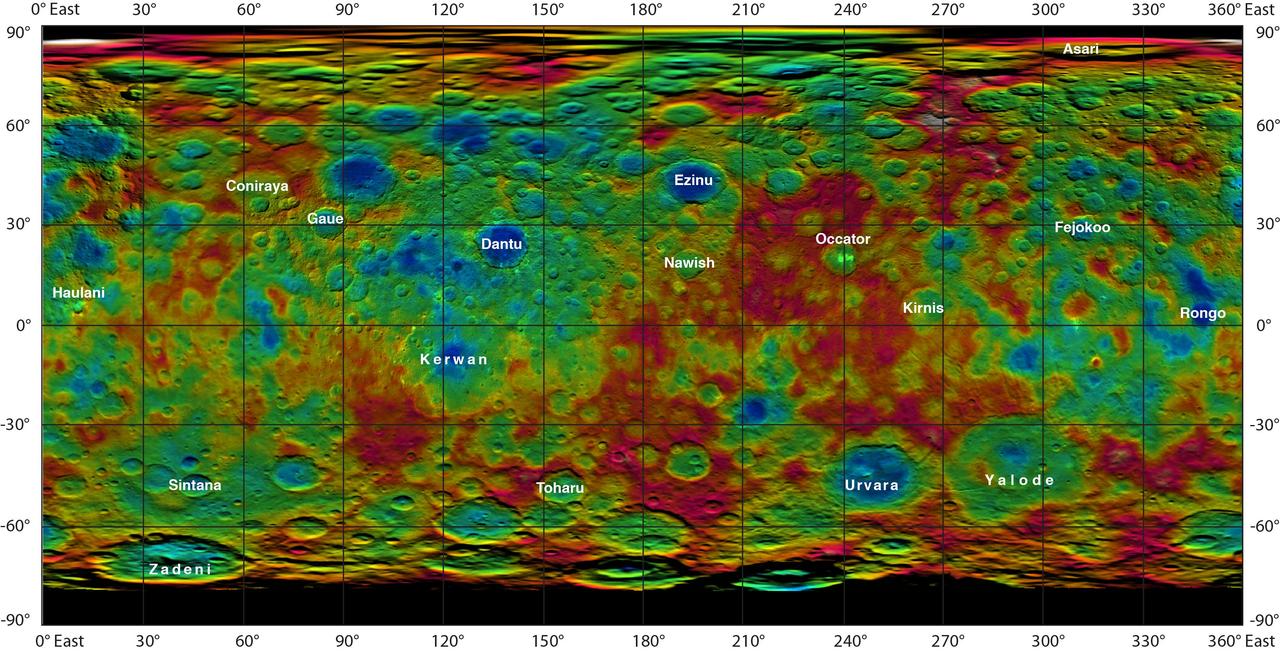
This color-coded map from NASA Dawn mission shows the highs and lows of topography on the surface of dwarf planet Ceres. It is labeled with names of features approved by the International Astronomical Union. Occator, the mysterious crater containing Ceres' mysterious bright spots, is named after the Roman agriculture deity of harrowing, a method of leveling soil. They retain their bright appearance in this map, although they are color-coded in the same green elevation of the crater floor in which they sit. The color scale extends about 5 miles (7.5 kilometers) below the surface in indigo to 5 miles (7.5 kilometers) above the surface in white. The topographic map was constructed from analyzing images from Dawn's framing camera taken from varying sun and viewing angles. The map was combined with an image mosaic of Ceres and projected as an simple cylindrical projection. http://photojournal.jpl.nasa.gov/catalog/PIA19606
Inside the high bay of the Astrotech Space Operations facility at Vandenberg Air Force Base in California, a solar array first motion test is in progress on NASA's Ice, Cloud and land Elevation Satellite-2 (ICESat-2) on June 18, 2018. The satellite is being prepared for its scheduled launch from Space Launch Complex-2 at Vandenberg on the final United Launch Alliance Delta II rocket. ICESat-2 will measure the height of a changing Earth, one laser pulse at a time, 10,000 laser pulses a second. The satellite will carry the Advanced Topographic Laser Altimeter System. ICESat-2 will help scientists investigate why, and how much our planet's frozen and icy areas, called the cryosphere, is changing in a warming climate.
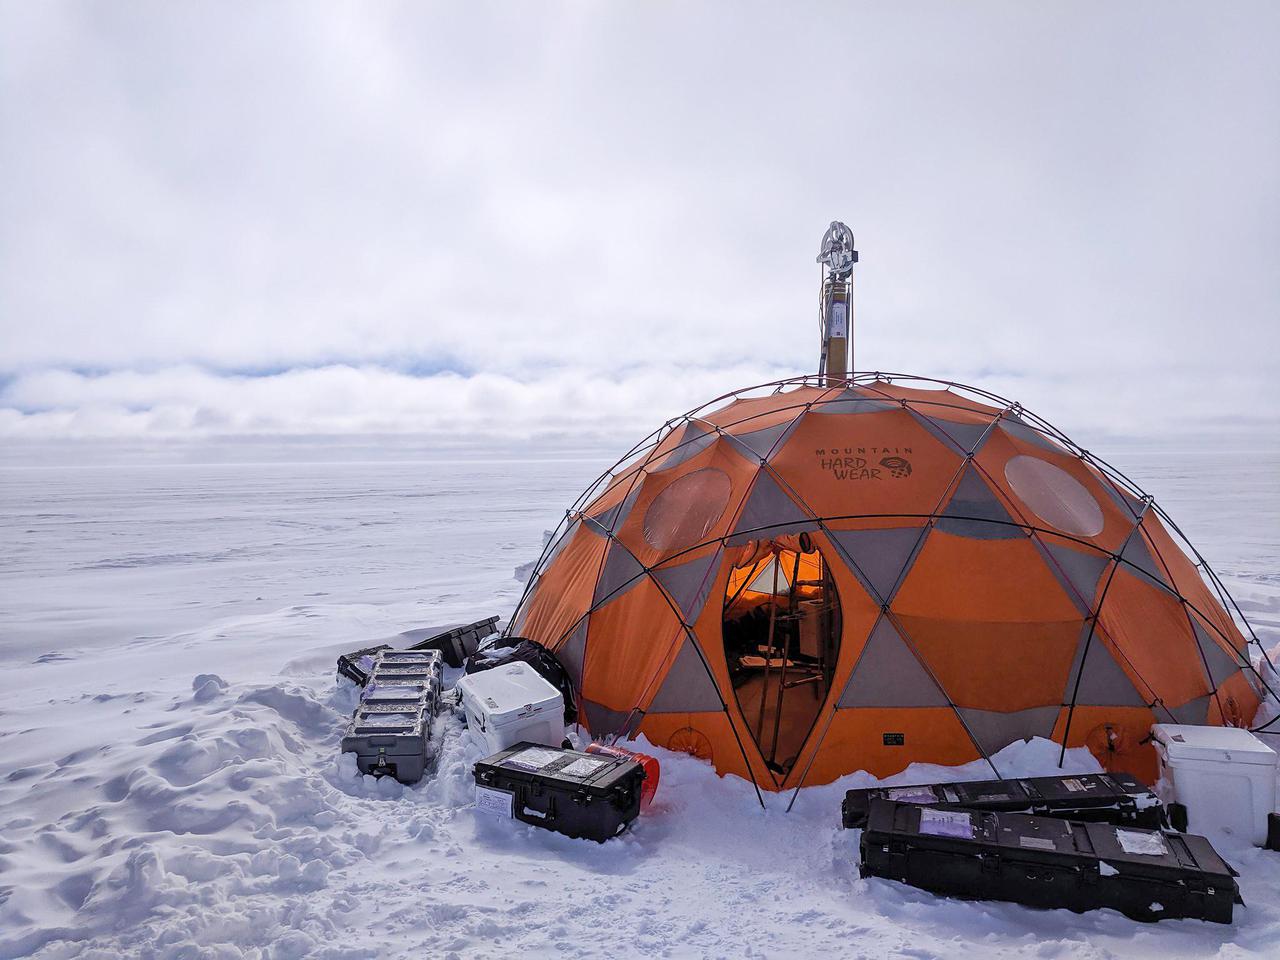
During 2019 field tests near Greenland's Summit Station, a high-elevation remote observing station, the WATSON (Wireline Analysis Tool for the Subsurface Observation of Northern ice sheets) instrument is put through its paces to seek out signs of life, or biosignatures, 360 feet (110 meters) down a borehole. In this photograph, the winch that holds the drill pokes out the top of the drill tent. WATSON could one day be launched aboard a robotic mission to seek out biosignatures on the ocean moons of Enceladus, Europa, or even Titan. The WATSON team hopes to test the instrument in a variety of cold locations on Earth to see how the distribution and variety of biosignatures change depending on where they are. By testing WATSON in different Earth analogs — areas on Earth that can stand in for those on other worlds — scientists would be able to better understand the chemical fingerprints of any biosignatures detected on other worlds. https://photojournal.jpl.nasa.gov/catalog/PIA24169
NASA's Ice, Cloud and land Elevation Satellite-2 (ICESat-2) is being secured in the high bay of the Astrotech processing facility on June 13, 2018, at Vandenberg Air Force Base in California. ICESat-2 was shipped from the Northrop Grumman facility in Gilbert, Arizona, where it was built and tested. The satellite is scheduled to launch from Space Launch Complex-2 at Vandenberg on the final United Launch Alliance Delta II rocket. ICESat-2 will measure the height of a changing Earth, one laser pulse at a time, 10,000 laser pulses a second. The satellite will carry the Advanced Topographic Laser Altimeter System. ICESat-2 will help scientists investigate why, and how much our planet's frozen and icy areas, called the cryosphere, is changing in a warming climate.
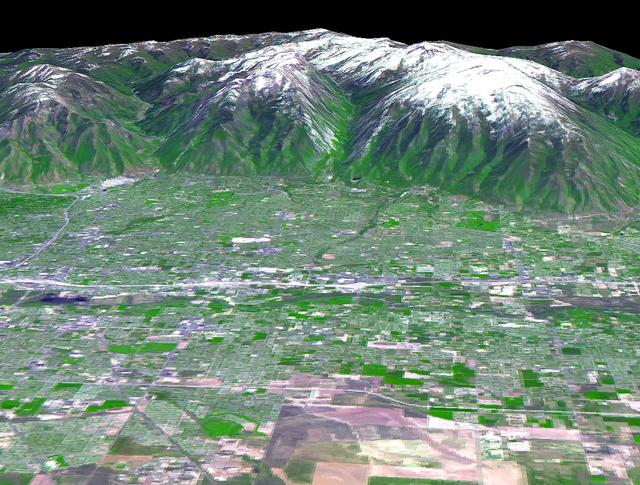
The 2002 Winter Olympics are hosted by Salt Lake City at several venues within the city, in nearby cities, and within the adjacent Wasatch Mountains. This 3-D perspective view, in simulated natural colors, presents a late spring view over Salt Lake City towards the snow-capped Wasatch Mountains to the east. The image was created by draping ASTER image data over digital topography data from the US Geological Survey's National Elevation Data. This image was acquired on May 28, 2000 by the Advanced Spaceborne Thermal Emission and Reflection Radiometer (ASTER) on NASA's Terra satellite. With its 14 spectral bands from the visible to the thermal infrared wavelength region, and its high spatial resolution of 15 to 90 meters (about 50 to 300 feet), ASTER will image Earth for the next 6 years to map and monitor the changing surface of our planet. http://photojournal.jpl.nasa.gov/catalog/PIA03466
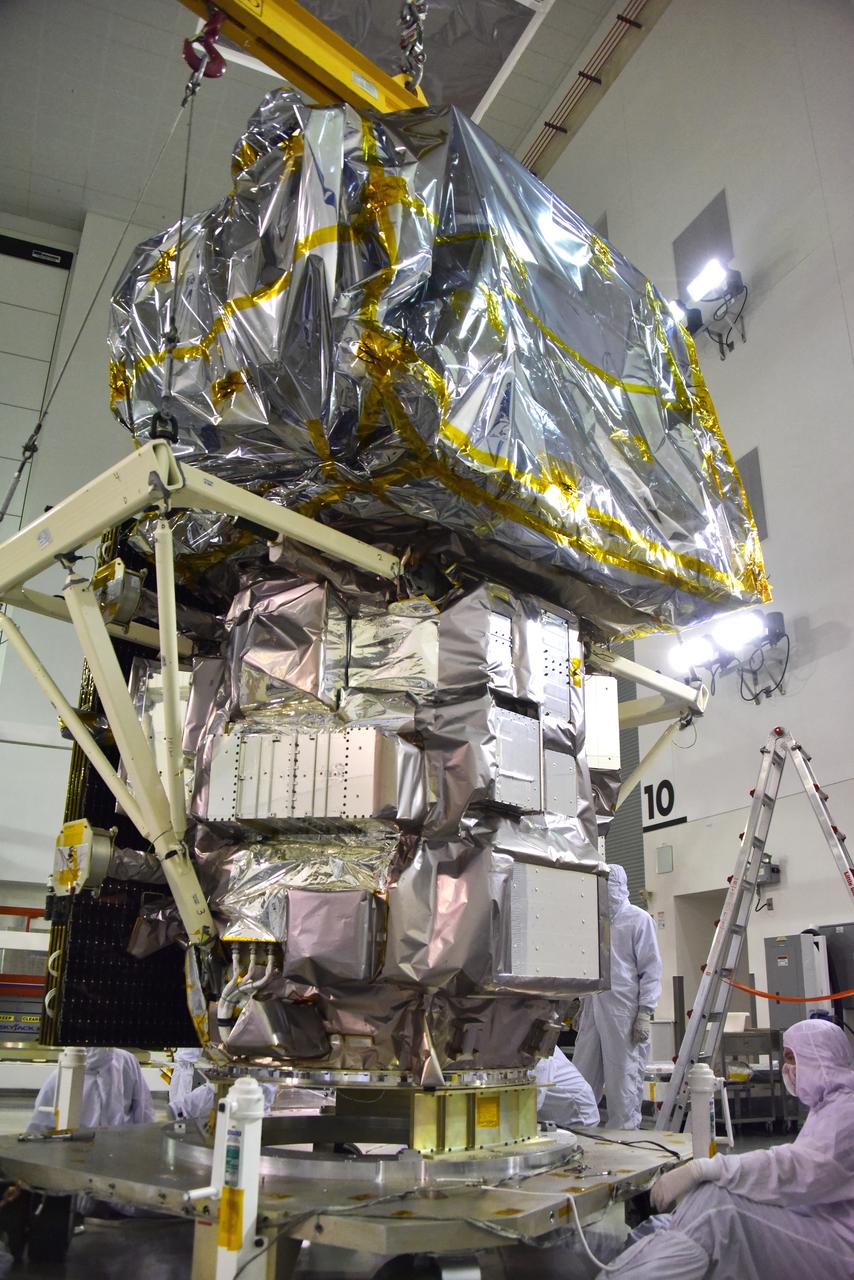
Technicians assist as a crane lowers NASA's Ice, Cloud and land Elevation Satellite-2 (ICESat-2) onto a work stand in the high bay of the Astrotech Space Operations facility on June 14, 2018, at Vandenberg Air Force Base in California. ICESat-2 was shipped from the Northrop Grumman facility in Gilbert, Arizona, where it was built and tested. The satellite is scheduled to launch from Space Launch Complex-2 at Vandenberg on the final United Launch Alliance Delta II rocket. ICESat-2 will measure the height of a changing Earth, one laser pulse at a time, 10,000 laser pulses a second. The satellite will carry the Advanced Topographic Laser Altimeter System. ICESat-2 will help scientists investigate why, and how much our planet's frozen and icy areas, called the cryosphere, is changing in a warming climate.
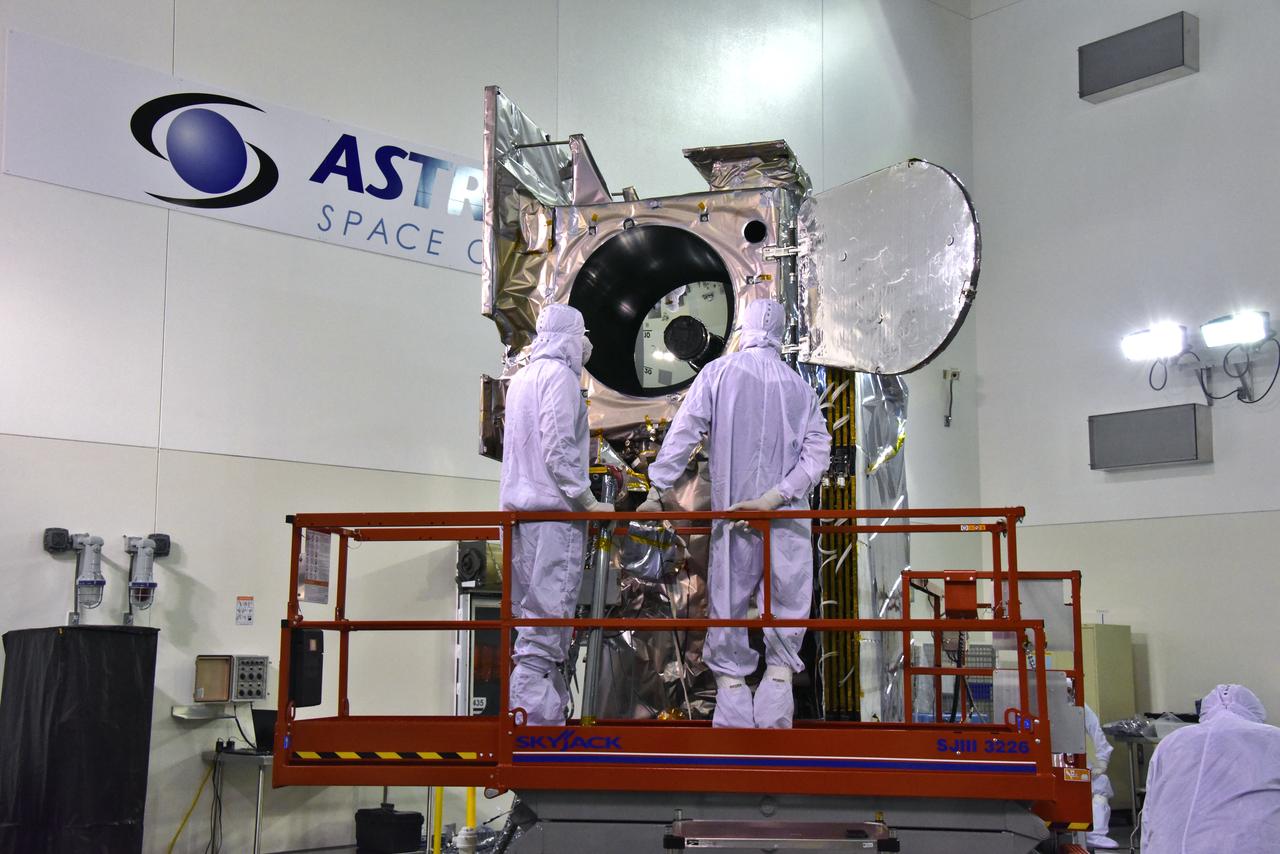
Inside the high bay of the Astrotech Space Operations facility at Vandenberg Air Force Base in California, technicians open and check the flight door for the Advanced Topographic Laser Altimeter System (ATLAS) on NASA's Ice, Cloud and land Elevation Satellite-2 (ICESat-2) on June 18, 2018. The satellite is being prepared for its scheduled launch from Space Launch Complex-2 at Vandenberg on the final United Launch Alliance Delta II rocket. ICESat-2 will measure the height of a changing Earth, one laser pulse at a time, 10,000 laser pulses a second. The satellite will carry ATLAS. ICESat-2 will help scientists investigate why, and how much our planet's frozen and icy areas, called the cryosphere, is changing in a warming climate.
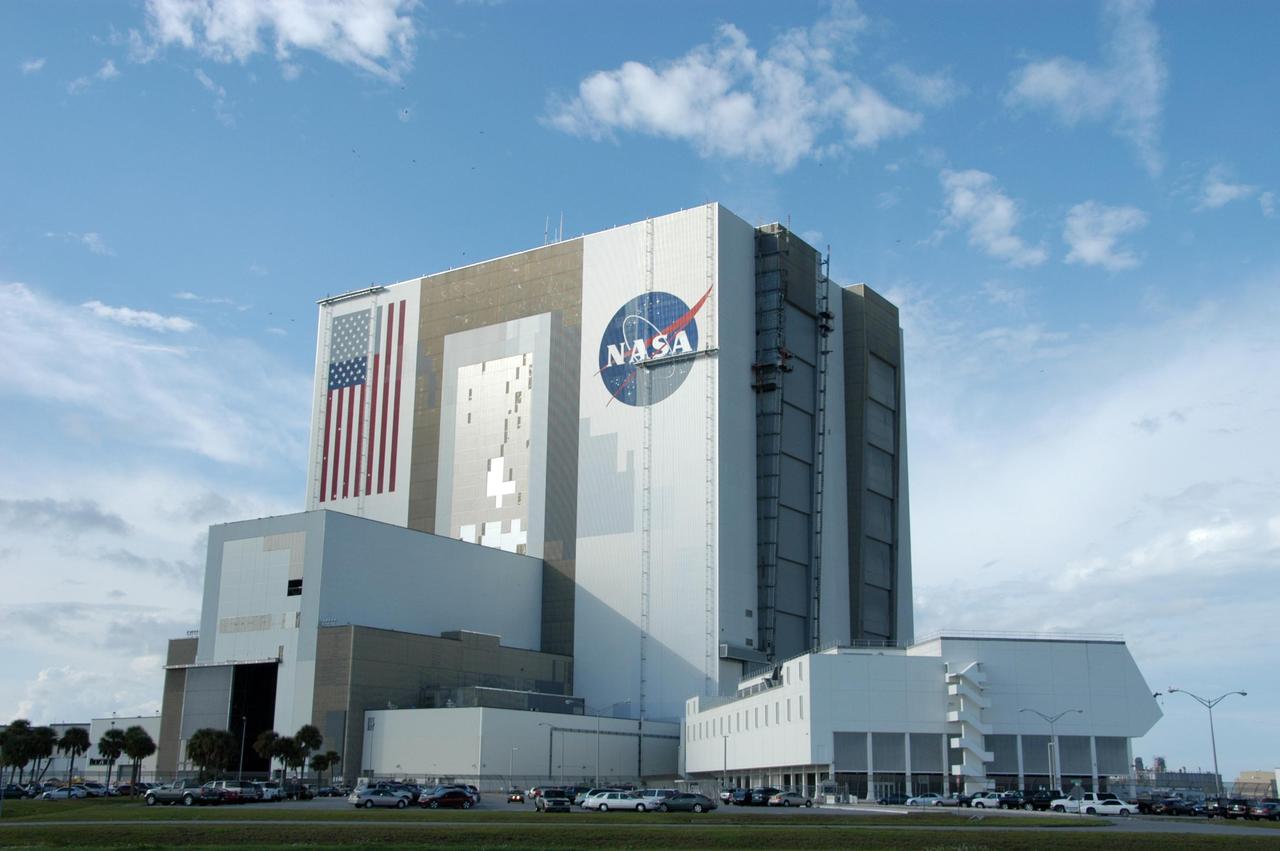
KENNEDY SPACE CENTER, FLA. -- Elevated platforms are seen hanging in front of the NASA Logo on the side of Kennedy Space Center's Vehicle Assembly Building. Also in view on the east side of the building are platforms on the facility's large vertical doors. Workers, suspended on the platforms from the top of the 525-foot-high VAB, use rollers and brushes to do the painting. The flag and logo were last painted in 1998, honoring NASA's 40th anniversary. The flag spans an area 209 feet by 110 feet, or about 23, 437 square feet. Each stripe is 9 feet wide and each star is 6 feet in diameter. The logo, also known as the "meatball," measures 110 feet by 132 feet, or about 12,300 square feet. Photo credit: NASA/George Shelton
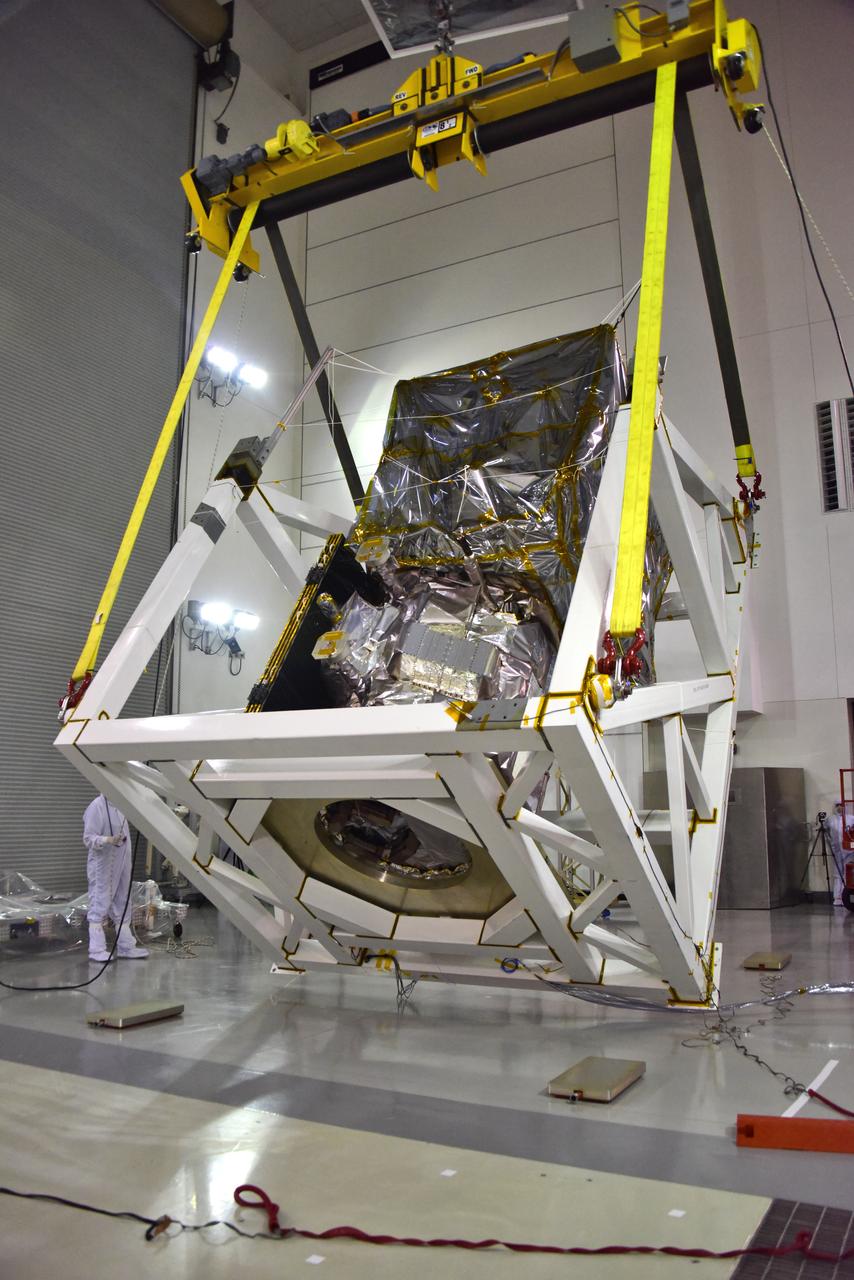
Technicians assist as a crane rotates NASA's Ice, Cloud and land Elevation Satellite-2 (ICESat-2) into position for removal and lift to a work stand in the high bay of the Astrotech Space Operations facility on June 14, 2018, at Vandenberg Air Force Base in California. ICESat-2 was shipped from the Northrop Grumman facility in Gilbert, Arizona, where it was built and tested. The satellite is scheduled to launch from Space Launch Complex-2 at Vandenberg on the final United Launch Alliance Delta II rocket. ICESat-2 will measure the height of a changing Earth, one laser pulse at a time, 10,000 laser pulses a second. The satellite will carry the Advanced Topographic Laser Altimeter System. ICESat-2 will help scientists investigate why, and how much our planet's frozen and icy areas, called the cryosphere, is changing in a warming climate.
Technicians assist as a crane lowers NASA's Ice, Cloud and land Elevation Satellite-2 (ICESat-2) onto a work stand in the high bay of the Astrotech Space Operations facility on June 14, 2018, at Vandenberg Air Force Base in California. ICESat-2 was shipped from the Northrop Grumman facility in Gilbert, Arizona, where it was built and tested. The satellite is scheduled to launch from Space Launch Complex-2 at Vandenberg on the final United Launch Alliance Delta II rocket. ICESat-2 will measure the height of a changing Earth, one laser pulse at a time, 10,000 laser pulses a second. The satellite will carry the Advanced Topographic Laser Altimeter System. ICESat-2 will help scientists investigate why, and how much our planet's frozen and icy areas, called the cryosphere, is changing in a warming climate.

Inside the Astrotech Space Operations high bay at Vandenberg Air Force Base in California, the protective canister is lowered down over NASA's Ice, Cloud and land Elevation Satellite-2 (ICESat-2), on Aug. 25, 2018. The satellite will be transported to Space Launch Complex 2 where it will be hoisted up by crane and attached to the United Launch Alliance Delta II rocket. Launch is scheduled for Sept. 15, 2018. ICESat-2 will measure the height of a changing Earth, one laser pulse at a time, 10,000 laser pulses a second. The satellite will carry the Advanced Topographic Laser Altimeter System (ATLAS). ICESat-2 will help scientists investigate why, and how much our planet's frozen and icy areas, called the cryosphere, are changing in a warming climate.
KENNEDY SPACE CENTER, FLA. -- Elevated platforms are seen hanging on the side of Kennedy Space Center's Vehicle Assembly Building to facilitate the repainting of the American flag and NASA logo. Workers, suspended on the platforms from the top of the 525-foot-high VAB, use rollers and brushes to do the painting. The flag and logo were last painted in 1998, honoring NASA's 40th anniversary. The flag spans an area 209 feet by 110 feet, or about 23, 437 square feet. Each stripe is 9 feet wide and each star is 6 feet in diameter. The logo, also known as the "meatball," measures 110 feet by 132 feet, or about 12,300 square feet. Photo credit: NASA/George Shelton
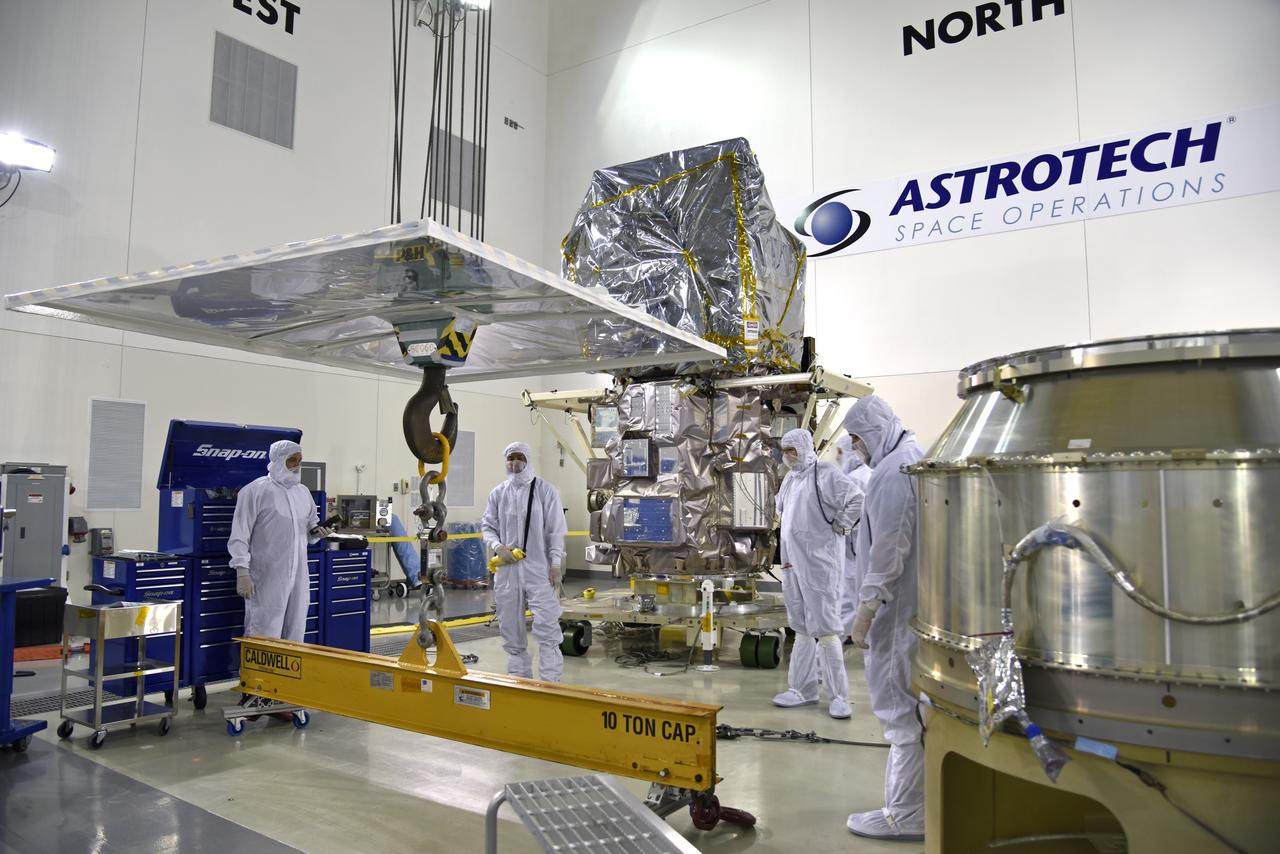
Inside the high bay of the Astrotech Space Operations facility at Vandenberg Air Force Base in California, a crane lifts and moves NASA's Ice, Cloud and land Elevation Satellite-2 (ICESat-2) over the payload adapter on Aug. 30, 2018. The satellite will be attached to the adapter. ICESat-2 is being prepared for its scheduled launch from Space Launch Complex 2 at Vandenberg on the final United Launch Alliance Delta II rocket. ICESat-2 will measure the height of a changing Earth, one laser pulse at a time, 10,000 laser pulses a second. The satellite will carry the Advanced Topographic Laser Altimeter System (ATLAS). ICESat-2 will help scientists investigate why, and how much our planet's frozen and icy areas, called the cryosphere, are changing in a warming climate.
A crane rotates NASA's Ice, Cloud and land Elevation Satellite-2 (ICESat-2) in its fixture inside the high bay of the Astrotech Space Operations facility on June 14, 2018, at Vandenberg Air Force Base in California. ICESat-2 was shipped from the Northrop Grumman facility in Gilbert, Arizona, where it was built and tested. The satellite is scheduled to launch from Space Launch Complex-2 at Vandenberg on the final United Launch Alliance Delta II rocket. ICESat-2 will measure the height of a changing Earth, one laser pulse at a time, 10,000 laser pulses a second. The satellite will carry the Advanced Topographic Laser Altimeter System. ICESat-2 will help scientists investigate why, and how much our planet's frozen and icy areas, called the cryosphere, is changing in a warming climate.
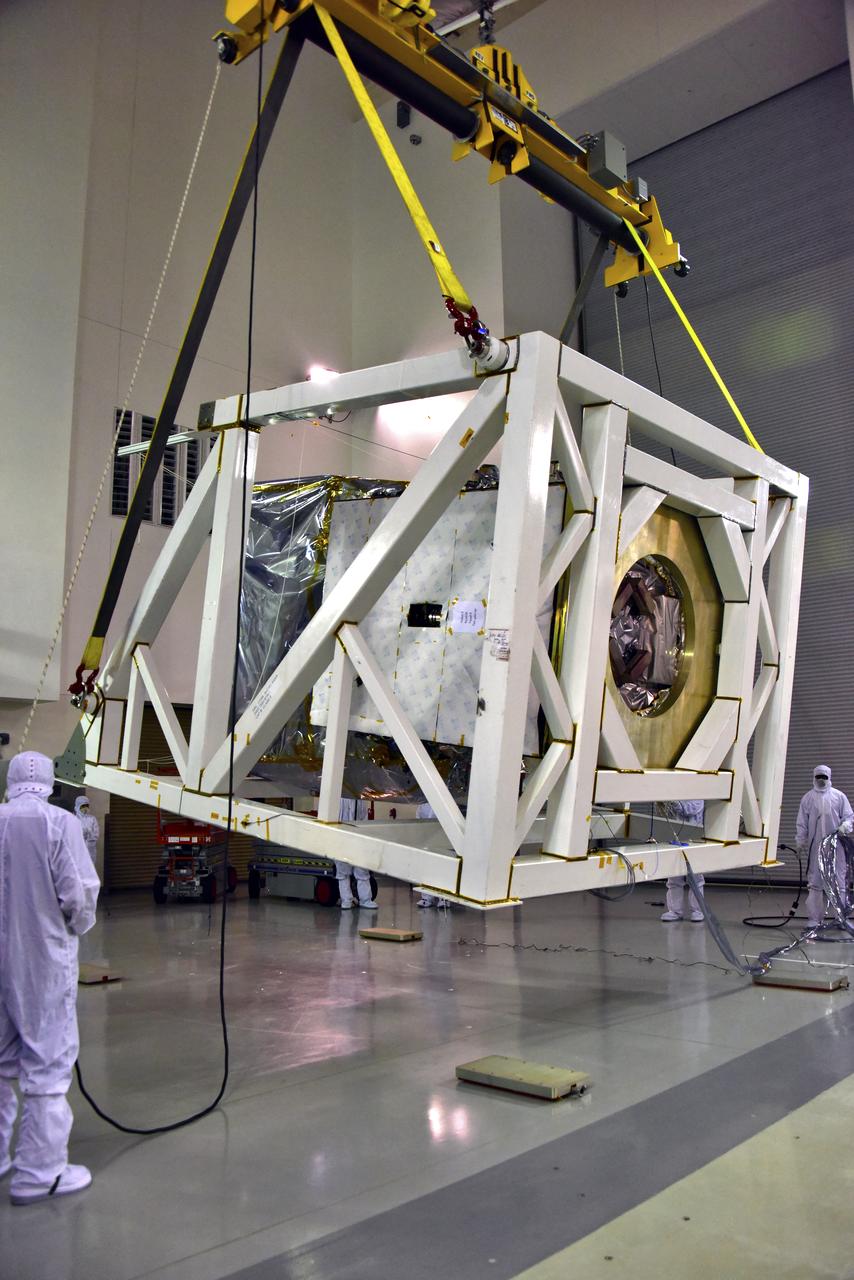
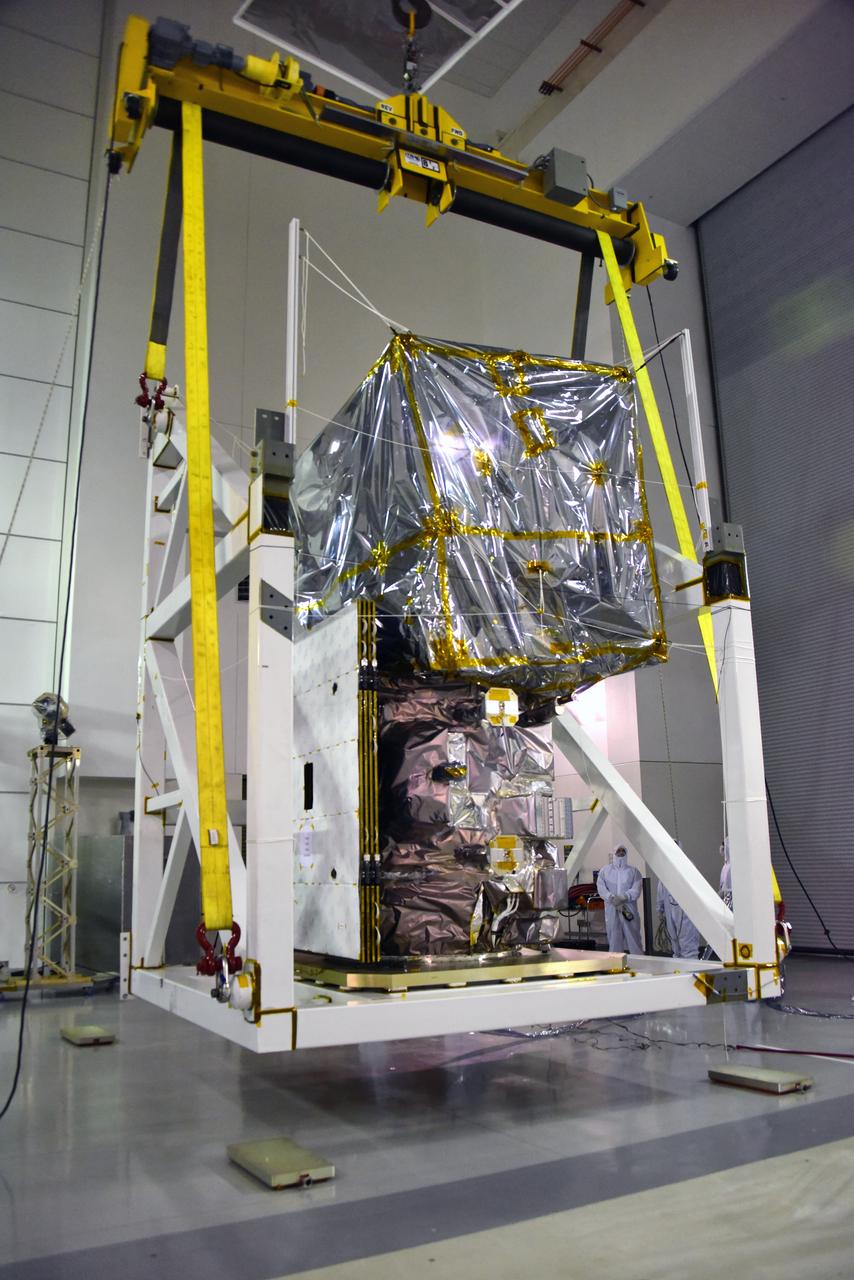
NASA's Ice, Cloud and land Elevation Satellite-2 (ICESat-2) is lifted in its fixture inside the high bay of the Astrotech Space Operations facility on June 14, 2018, at Vandenberg Air Force Base in California. ICESat-2 was shipped from the Northrop Grumman facility in Gilbert, Arizona, where it was built and tested. The satellite is scheduled to launch from Space Launch Complex-2 at Vandenberg on the final United Launch Alliance Delta II rocket. ICESat-2 will measure the height of a changing Earth, one laser pulse at a time, 10,000 laser pulses a second. The satellite will carry the Advanced Topographic Laser Altimeter System. ICESat-2 will help scientists investigate why, and how much our planet's frozen and icy areas, called the cryosphere, is changing in a warming climate.
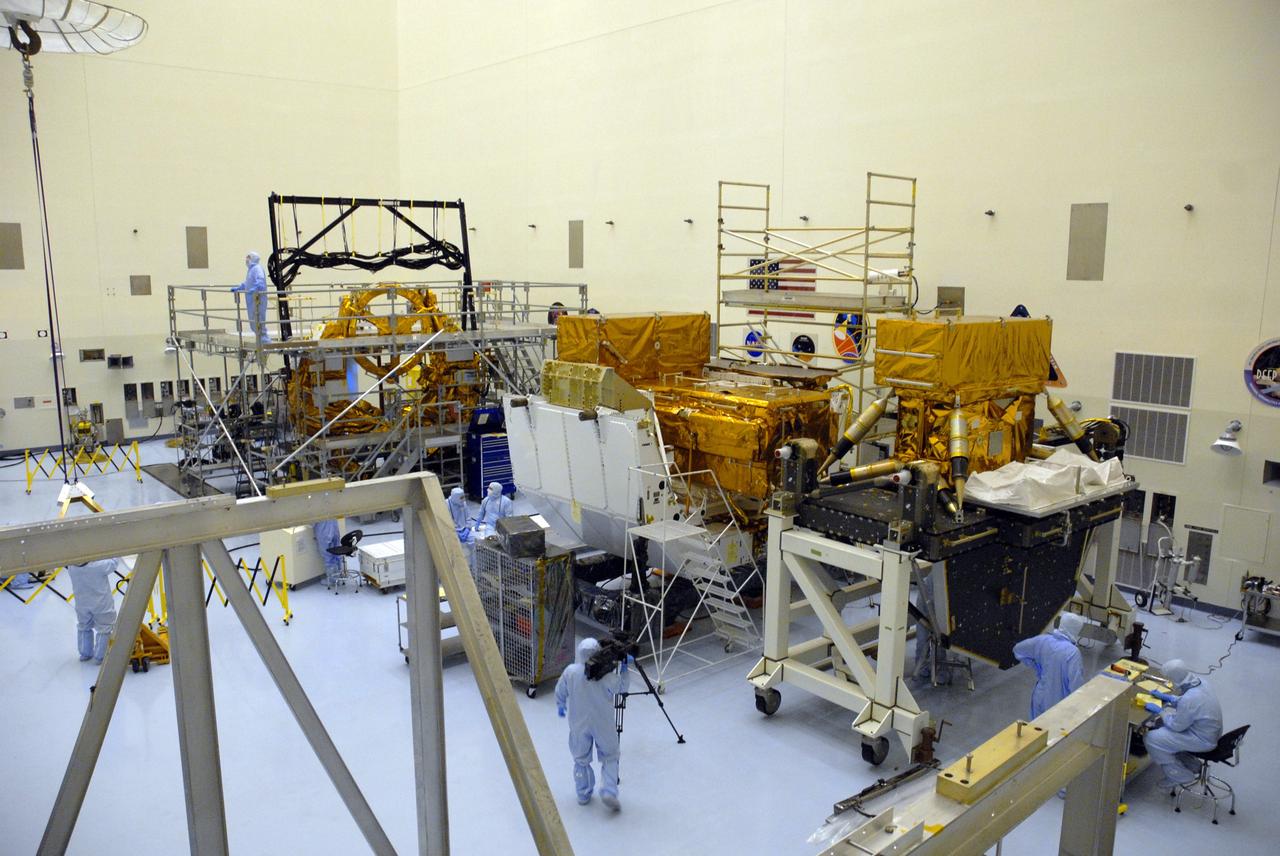
CAPE CANAVERAL, Fla. -- In the high bay of the Payload Hazardous Servicing Facility at NASA's Kennedy Space Center, this elevated view shows three carriers undergoing processing for space shuttle Atlantis' STS-125 mission to service the Hubble Space Telescope. From left are the Flight Support System or FSS, the Orbital Replacement Unit Carrier or ORUC, and the Super Lightweight Interchangeable Carrier or SLIC. The Multi-Use Lightweight Equipment carrier will be delivered in early August. The carriers will be prepared for the integration of telescope science instruments, both internal and external replacement components, as well as the flight support equipment to be used by the astronauts during the Hubble servicing mission, targeted for launch Oct. 8. Photo credit: NASA/Jack Pfaller
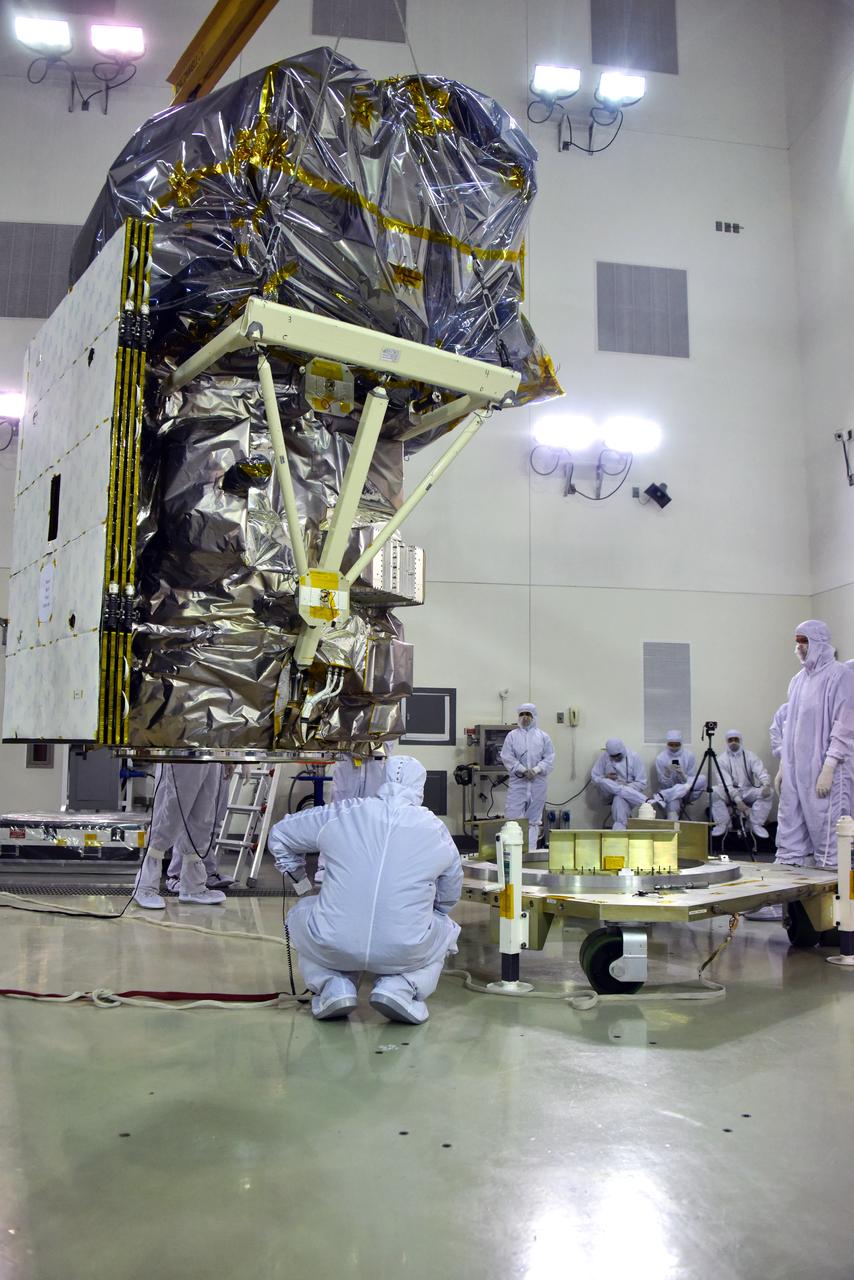
Technicians monitor the progress as NASA's Ice, Cloud and land Elevation Satellite-2 (ICESat-2) is removed from its fixture in the high bay of the Astrotech Space Operations facility on June 14, 2018, at Vandenberg Air Force Base in California. The satellite will be secured on a work stand for processing. ICESat-2 was shipped from the Northrop Grumman facility in Gilbert, Arizona, where it was built and tested. The satellite is scheduled to launch from Space Launch Complex-2 at Vandenberg on the final United Launch Alliance Delta II rocket. ICESat-2 will measure the height of a changing Earth, one laser pulse at a time, 10,000 laser pulses a second. The satellite will carry the Advanced Topographic Laser Altimeter System. ICESat-2 will help scientists investigate why, and how much our planet's frozen and icy areas, called the cryosphere, is changing in a warming climate.
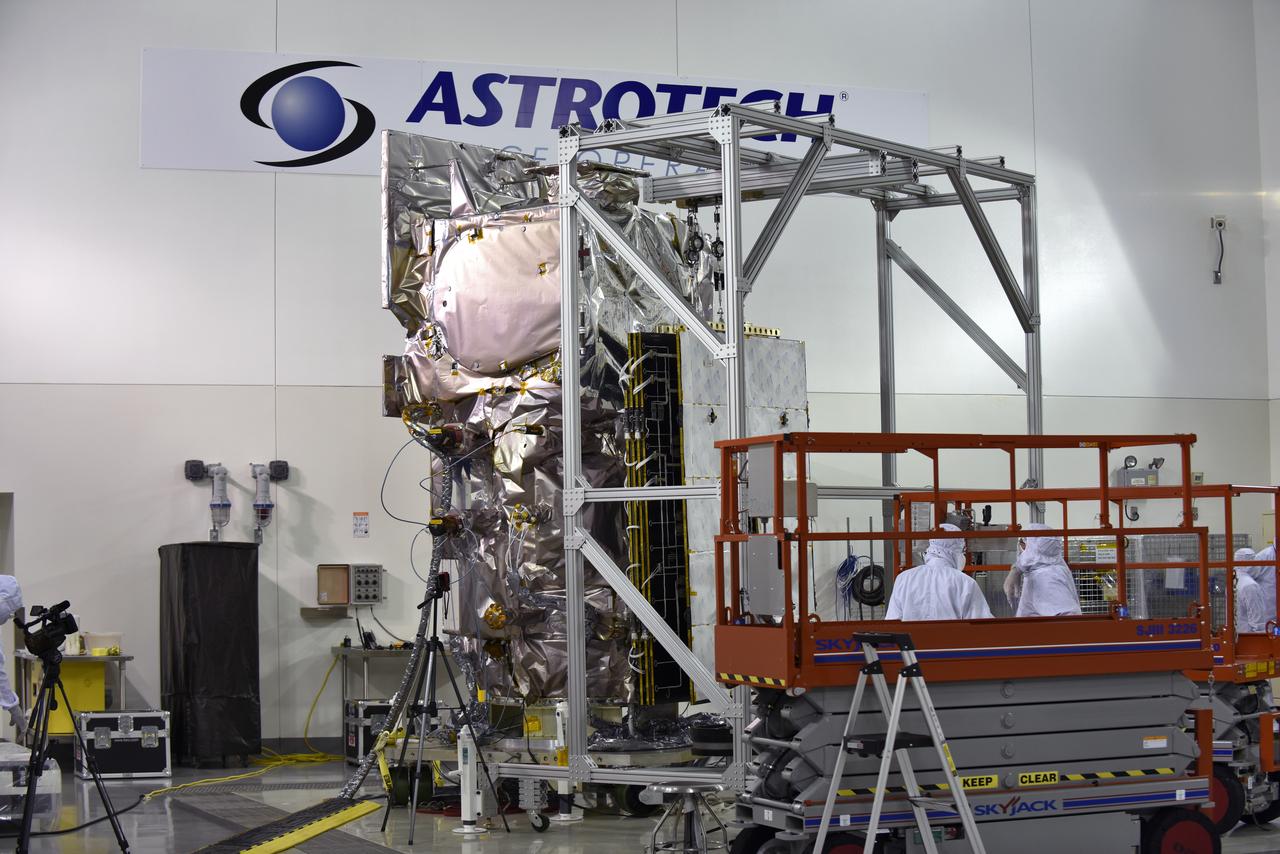
Inside the high bay of the Astrotech Space Operations facility at Vandenberg Air Force Base in California, a solar array first motion test is underway on NASA's Ice, Cloud and land Elevation Satellite-2 (ICESat-2) on June 18, 2018. The satellite is being prepared for its scheduled launch from Space Launch Complex-2 at Vandenberg on the final United Launch Alliance Delta II rocket. ICESat-2 will measure the height of a changing Earth, one laser pulse at a time, 10,000 laser pulses a second. The satellite will carry the Advanced Topographic Laser Altimeter System. ICESat-2 will help scientists investigate why, and how much our planet's frozen and icy areas, called the cryosphere, is changing in a warming climate.
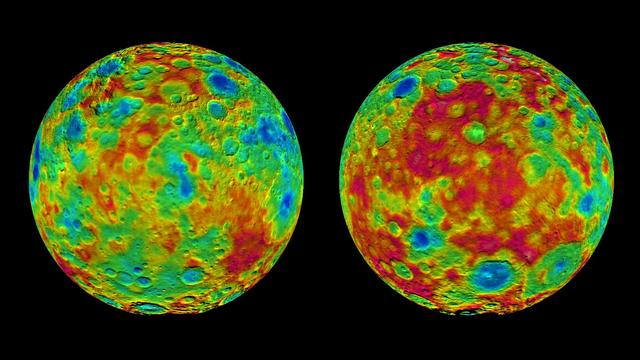
This pair of images shows color-coded maps from NASA's Dawn mission, revealing the highs and lows of topography on the surface of dwarf planet Ceres. The map at left is centered on terrain at 60 degrees east longitude; the map at right is centered on 240 degrees east longitude. The color scale extends about 5 miles (7.5 kilometers) below the surface in indigo to 5 miles (7.5 kilometers) above the surface in white. The topographic map was constructed from analyzing images from Dawn's framing camera taken from varying sun and viewing angles. The map was combined with an image mosaic of Ceres and projected as an orthographic projection. The well-known bright spots in the center of Ceres northern hemisphere in the image at right retain their bright appearance, although they are color-coded in the same green elevation of the crater floor in which they sit. http://photojournal.jpl.nasa.gov/catalog/PIA19607
Inside the high bay of the Astrotech Space Operations facility at Vandenberg Air Force Base in California, a technician prepares NASA's Ice, Cloud and land Elevation Satellite-2 (ICESat-2) to be attached to the payload adapter, on Aug. 20, 2018. The satellite is being prepared for its scheduled launch from Space Launch Complex 2 at Vandenberg on the final United Launch Alliance Delta II rocket. ICESat-2 will measure the height of a changing Earth, one laser pulse at a time, 10,000 laser pulses a second. The satellite will carry the Advanced Topographic Laser Altimeter System (ATLAS). ICESat-2 will help scientists investigate why, and how much our planet's frozen and icy areas, called the cryosphere, are changing in a warming climate.
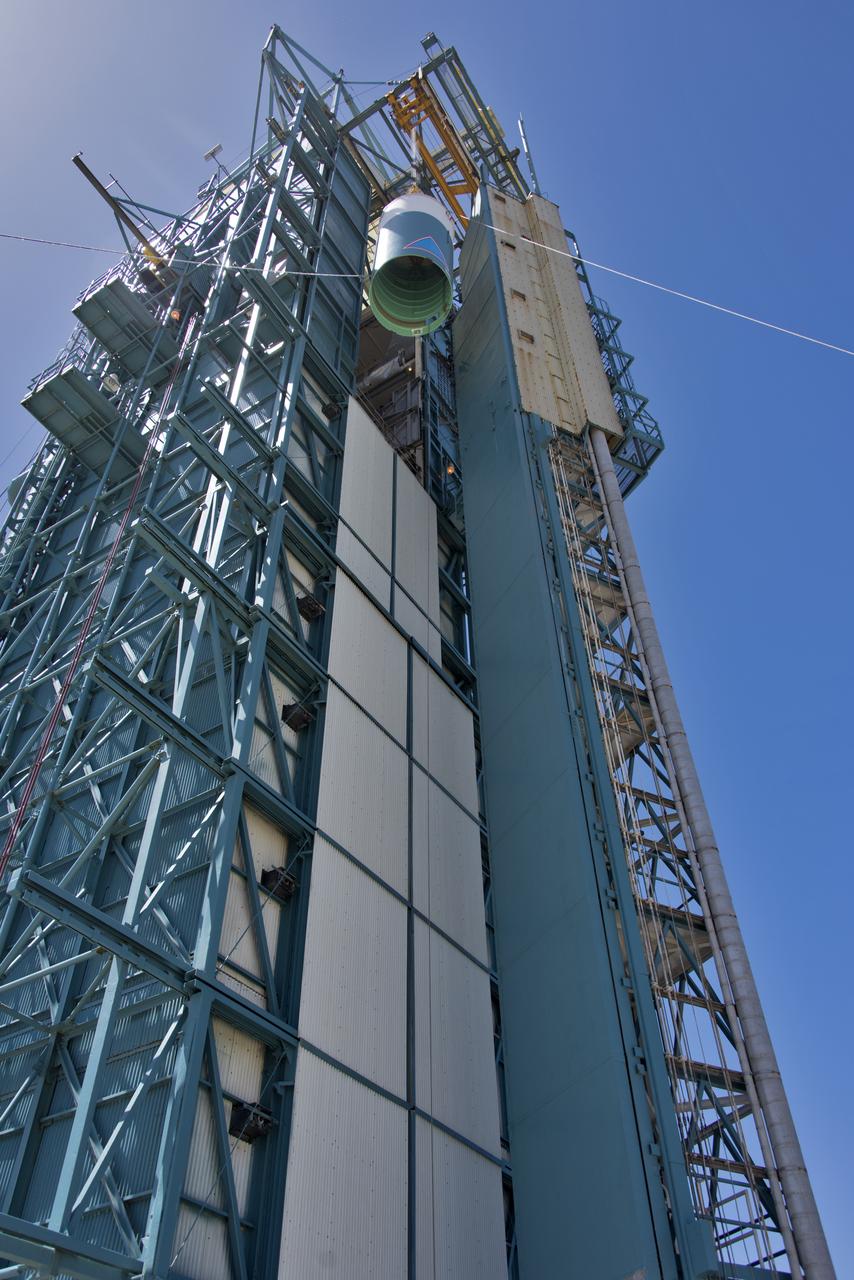
The United Launch Alliance Delta II interstage is lifted high up at the Vertical Integration Facility at Space Launch Complex 2 on June 12, 2018, at Vandenberg Air Force Base in California. The interstage will be moved in and mated to the top of the booster, or first stage of the rocket. NASA's Ice, Cloud and land Elevation Satellite-2 (ICESat-2) will launch on the final Delta II rocket. ICESat-2 will measure the height of a changing Earth, one laser pulse at a time, 10,000 laser pulses a second. The satellite will carry a single instrument, the Advanced Topographic Laser Altimeter System. ICESat-2 will help scientists investigate why, and how much our planet's frozen and icy areas, called the cryosphere, is changing in a warming climate.
Inside the high bay of the Astrotech Space Operations facility at Vandenberg Air Force Base in California, a crane lifts and moves NASA's Ice, Cloud and land Elevation Satellite-2 (ICESat-2) on Aug. 30, 2018. The satellite will be attached to the payload adapter. ICESat-2 is being prepared for its scheduled launch from Space Launch Complex 2 at Vandenberg on the final United Launch Alliance Delta II rocket. ICESat-2 will measure the height of a changing Earth, one laser pulse at a time, 10,000 laser pulses a second. The satellite will carry the Advanced Topographic Laser Altimeter System (ATLAS). ICESat-2 will help scientists investigate why, and how much our planet's frozen and icy areas, called the cryosphere, are changing in a warming climate.
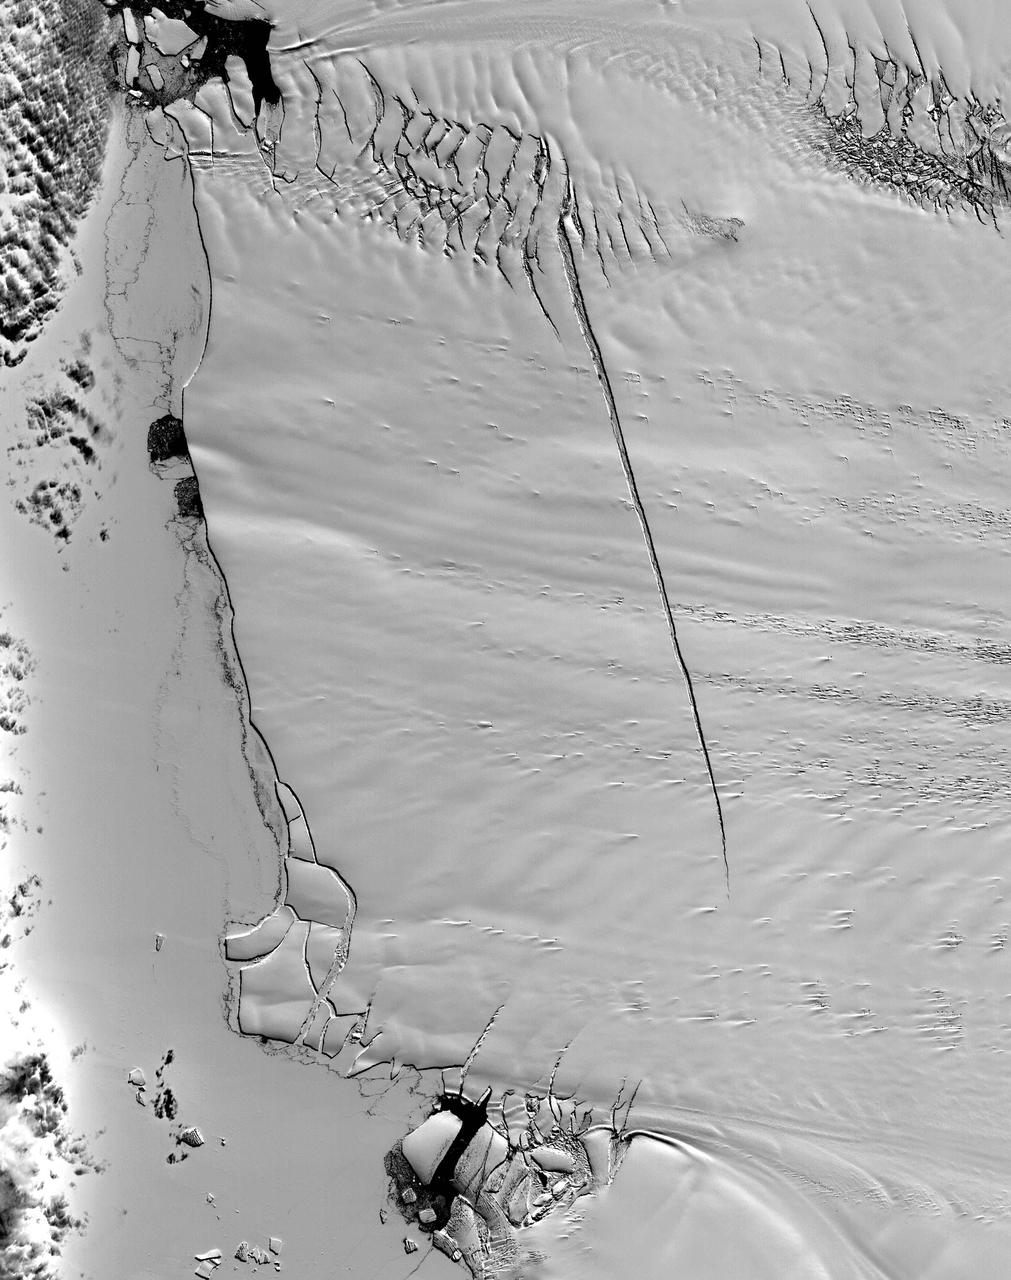
This ASTER image was acquired on December 12, 2000, and covers an area of 38 x 48 km. Pine Island Glacier has undergone a steady loss of elevation with retreat of the grounding line in recent decades. Now, space imagery has revealed a wide new crack that some scientists think will soon result in a calving event. Glaciologist Robert Bindschadler of NASA's Goddard Space Flight Center predicts this crack will result in the calving of a major iceberg, probably in less than 18 months. Discovery of the crack was possible due to multi-year image archives and high resolution imagery. This image is located at 74.1 degrees south latitude and 105.1 degrees west longitude. http://photojournal.jpl.nasa.gov/catalog/PIA11095

Inside the high bay of the Astrotech Space Operations facility at Vandenberg Air Force Base in California, a technician checks the flight door for the Advanced Topographic Laser Altimeter System (ATLAS) on NASA's Ice, Cloud and land Elevation Satellite-2 (ICESat-2) on June 21, 2018. The satellite is being prepared for its scheduled launch from Space Launch Complex-2 at Vandenberg on the final United Launch Alliance Delta II rocket. ICESat-2 will measure the height of a changing Earth, one laser pulse at a time, 10,000 laser pulses a second. The satellite will carry ATLAS. ICESat-2 will help scientists investigate why, and how much our planet's frozen and icy areas, called the cryosphere, is changing in a warming climate.
Inside the high bay of the Astrotech Space Operations facility at Vandenberg Air Force Base in California, a solar array first motion test is underway on NASA's Ice, Cloud and land Elevation Satellite-2 (ICESat-2) on June 18, 2018. The satellite is being prepared for its scheduled launch from Space Launch Complex-2 at Vandenberg on the final United Launch Alliance Delta II rocket. ICESat-2 will measure the height of a changing Earth, one laser pulse at a time, 10,000 laser pulses a second. The satellite will carry the Advanced Topographic Laser Altimeter System. ICESat-2 will help scientists investigate why, and how much our planet's frozen and icy areas, called the cryosphere, is changing in a warming climate.

Inside the high bay of the Astrotech Space Operations facility at Vandenberg Air Force Base in California, a solar array first motion test is in progress on NASA's Ice, Cloud and land Elevation Satellite-2 (ICESat-2) on June 18, 2018. The satellite is being prepared for its scheduled launch from Space Launch Complex-2 at Vandenberg on the final United Launch Alliance Delta II rocket. ICESat-2 will measure the height of a changing Earth, one laser pulse at a time, 10,000 laser pulses a second. The satellite will carry the Advanced Topographic Laser Altimeter System. ICESat-2 will help scientists investigate why, and how much our planet's frozen and icy areas, called the cryosphere, is changing in a warming climate.
Inside the high bay of the Astrotech Space Operations facility at Vandenberg Air Force Base in California, technicians help secure NASA's Ice, Cloud and land Elevation Satellite-2 (ICESat-2) to the payload adapter on Aug. 30, 2018. ICESat-2 is being prepared for its scheduled launch from Space Launch Complex 2 at Vandenberg on the final United Launch Alliance Delta II rocket. ICESat-2 will measure the height of a changing Earth, one laser pulse at a time, 10,000 laser pulses a second. The satellite will carry the Advanced Topographic Laser Altimeter System (ATLAS). ICESat-2 will help scientists investigate why, and how much our planet's frozen and icy areas, called the cryosphere, are changing in a warming climate.
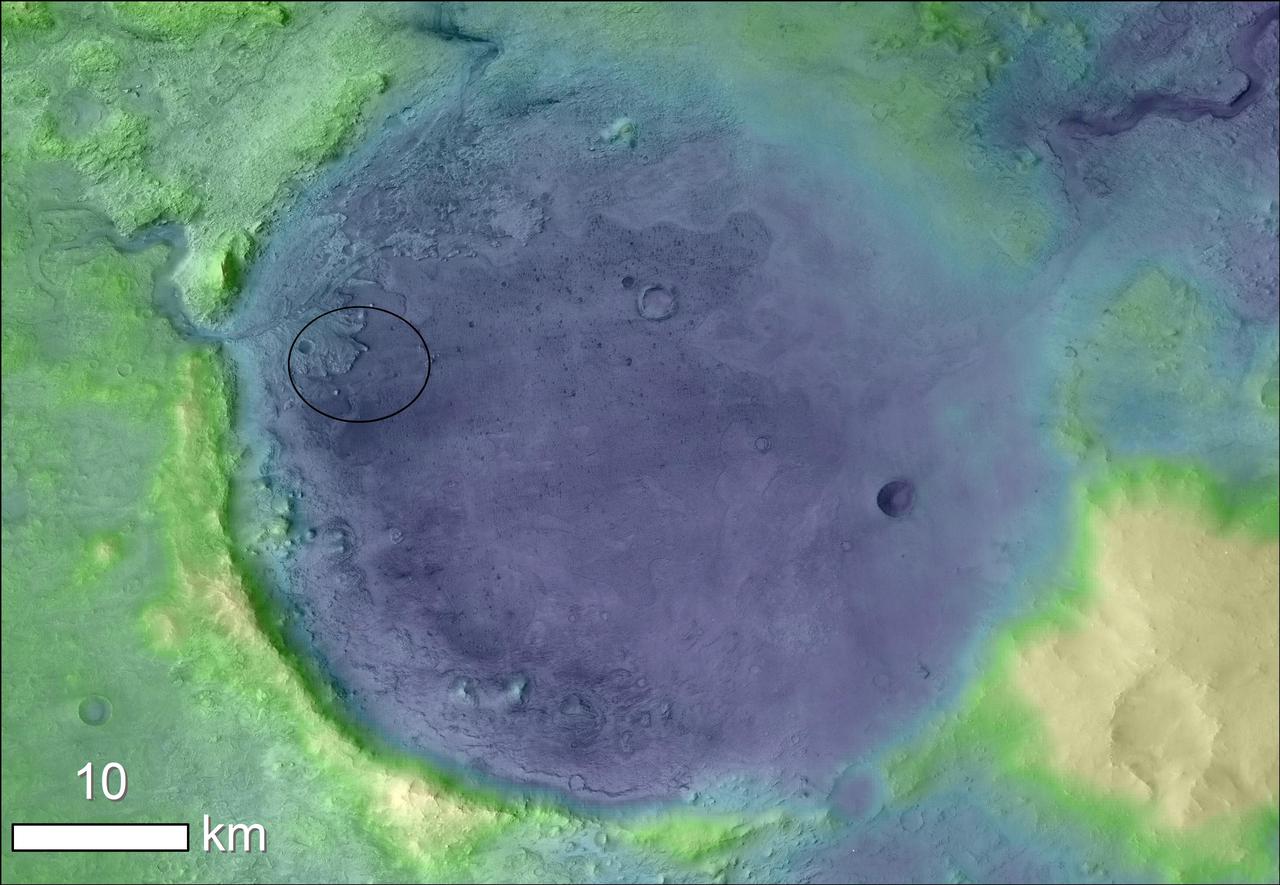
Lighter colors represent higher elevation in this image of Jezero Crater on Mars, the landing site for NASA's Mars 2020 mission. The oval indicates the landing ellipse, where the rover will be touching down on Mars. The color added to this image helps the crater rim stand out clearly, and makes it easier to spot the shoreline of a lake that dried up billions of years ago. Scientists want to visit this shoreline because it may have preserved fossilized microbial life, if any ever formed on Mars. The image was created using data from a combination of instruments and spacecraft: NASA's Mars Global Surveyor and its Mars Orbiter Laser Altimeter (MOLA); NASA's Mars Reconnaissance Orbiter and its Compact Reconnaissance Imaging Spectrometer for Mars (CRISM) and Context Camera (CTX); and the European Space Agency's Mars Express and its High Resolution Stereo Camera (HRSC). https://photojournal.jpl.nasa.gov/catalog/PIA23511
Inside the high bay of the Astrotech Space Operations facility at Vandenberg Air Force Base in California, technicians prepare to attach NASA's Ice, Cloud and land Elevation Satellite-2 (ICESat-2) to the payload adapter, on Aug. 20, 2018. The satellite is being prepared for its scheduled launch from Space Launch Complex 2 at Vandenberg on the final United Launch Alliance Delta II rocket. ICESat-2 will measure the height of a changing Earth, one laser pulse at a time, 10,000 laser pulses a second. The satellite will carry the Advanced Topographic Laser Altimeter System (ATLAS). ICESat-2 will help scientists investigate why, and how much our planet's frozen and icy areas, called the cryosphere, are changing in a warming climate.
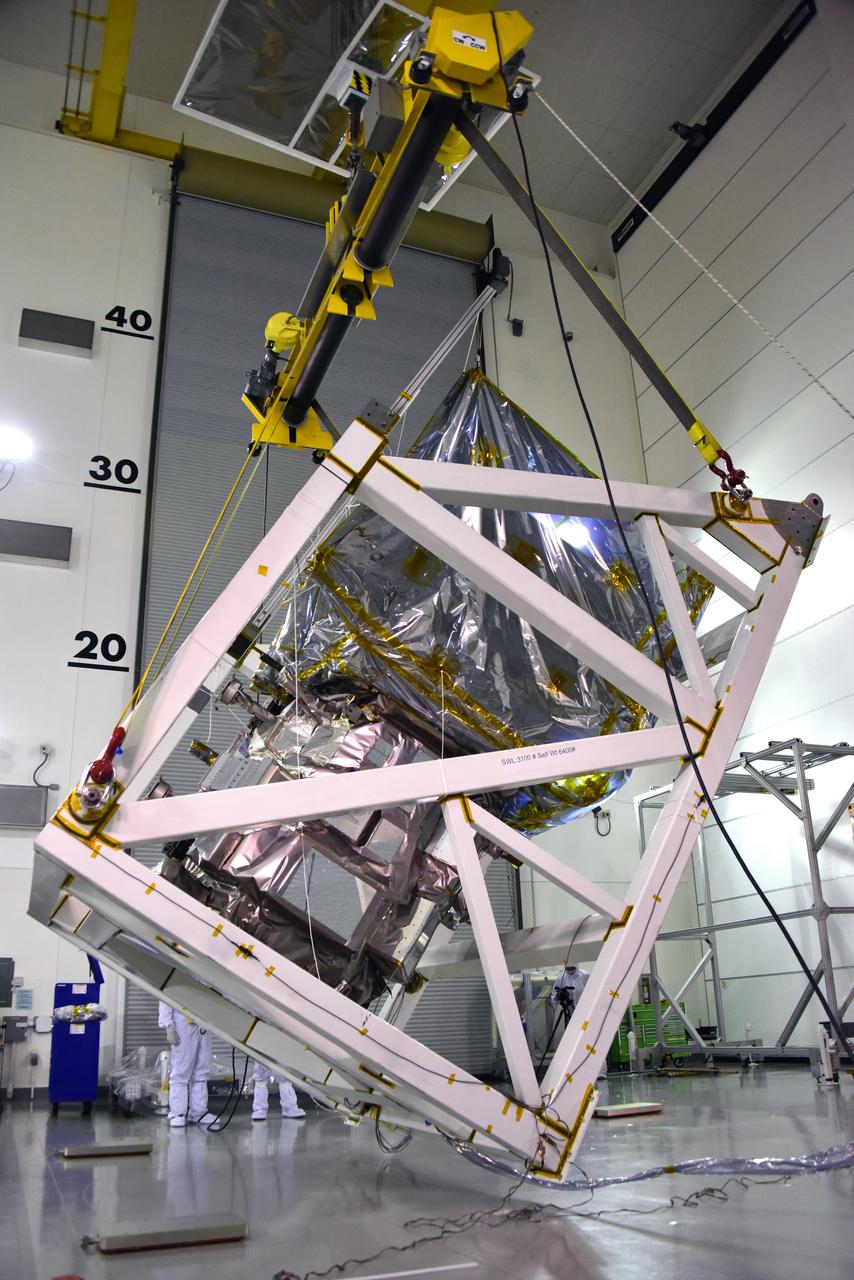
A crane is used to rotate NASA's Ice, Cloud and land Elevation Satellite-2 (ICESat-2) in its fixture inside the high bay of the Astrotech Space Operations facility on June 14, 2018, at Vandenberg Air Force Base in California. ICESat-2 was shipped from the Northrop Grumman facility in Gilbert, Arizona, where it was built and tested. The satellite is scheduled to launch from Space Launch Complex-2 at Vandenberg on the final United Launch Alliance Delta II rocket. ICESat-2 will measure the height of a changing Earth, one laser pulse at a time, 10,000 laser pulses a second. The satellite will carry the Advanced Topographic Laser Altimeter System. ICESat-2 will help scientists investigate why, and how much our planet's frozen and icy areas, called the cryosphere, is changing in a warming climate.
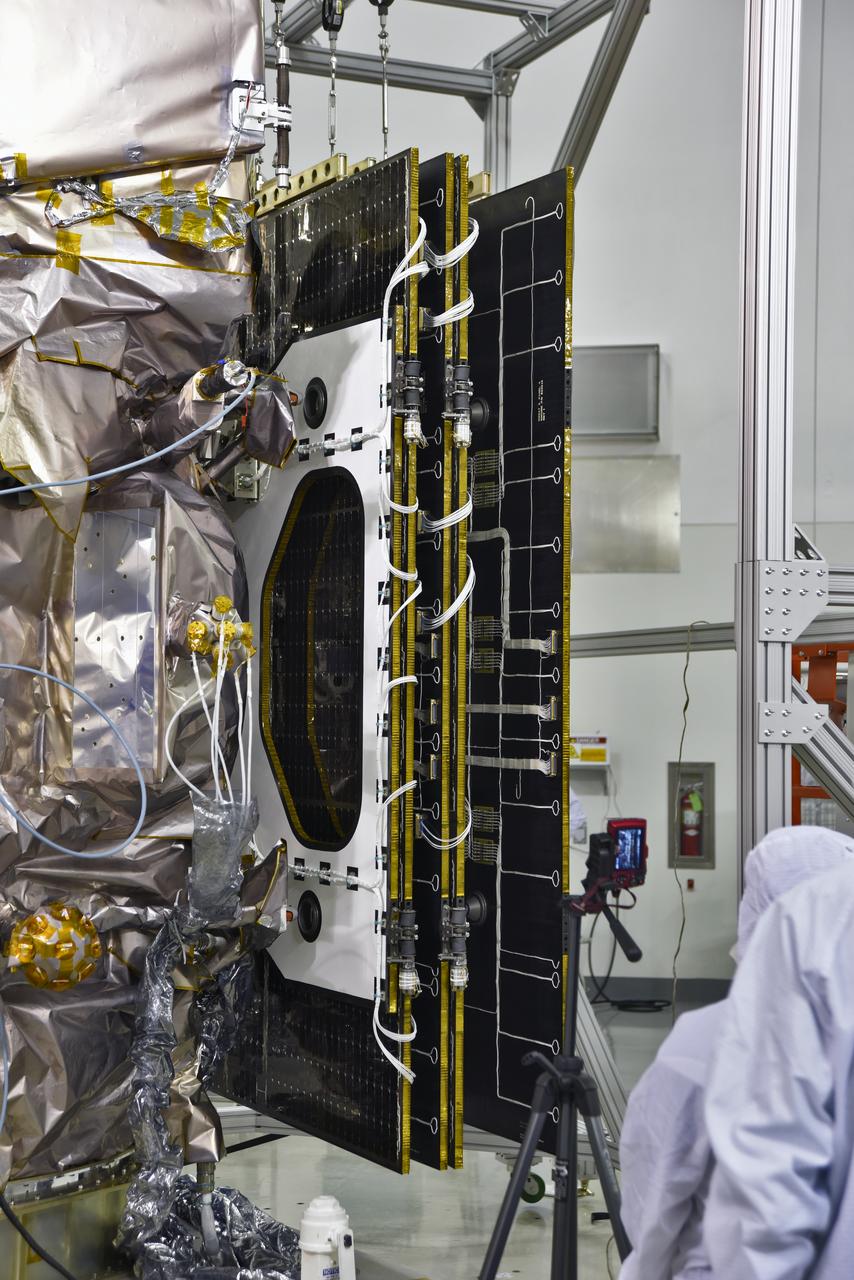
Inside the high bay of the Astrotech Space Operations facility at Vandenberg Air Force Base in California, a solar array first motion test is underway on NASA's Ice, Cloud and land Elevation Satellite-2 (ICESat-2) on June 18, 2018. The satellite is being prepared for its scheduled launch from Space Launch Complex-2 at Vandenberg on the final United Launch Alliance Delta II rocket. ICESat-2 will measure the height of a changing Earth, one laser pulse at a time, 10,000 laser pulses a second. The satellite will carry the Advanced Topographic Laser Altimeter System. ICESat-2 will help scientists investigate why, and how much our planet's frozen and icy areas, called the cryosphere, is changing in a warming climate.
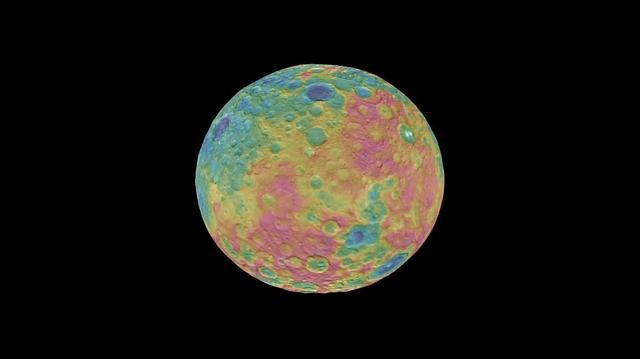
This frame from an animation shows a color-coded map from NASA Dawn mission revealing the highs and lows of topography on the surface of dwarf planet Ceres. The color scale extends 3.7 miles (6 kilometers) below the surface in purple to 3.7 miles (6 kilometers) above the surface in brown. The brightest features (those appearing nearly white) -- including the well-known bright spots within a crater in the northern hemisphere -- are simply reflective areas, and do not represent elevation. The topographic map was constructed from analyzing images from Dawn's framing camera taken from varying sun and viewing angles. The map was combined with an image mosaic of Ceres and projected onto a 3-D shape model of the dwarf planet to create the animation. http://photojournal.jpl.nasa.gov/catalog/PIA19605
Inside the high bay of the Astrotech Space Operations facility at Vandenberg Air Force Base in California, technicians assist as a crane lowers NASA's Ice, Cloud and land Elevation Satellite-2 (ICESat-2) onto the payload adapter on Aug. 30, 2018. ICESat-2 is being prepared for its scheduled launch from Space Launch Complex 2 at Vandenberg on the final United Launch Alliance Delta II rocket. ICESat-2 will measure the height of a changing Earth, one laser pulse at a time, 10,000 laser pulses a second. The satellite will carry the Advanced Topographic Laser Altimeter System (ATLAS). ICESat-2 will help scientists investigate why, and how much our planet's frozen and icy areas, called the cryosphere, are changing in a warming climate.
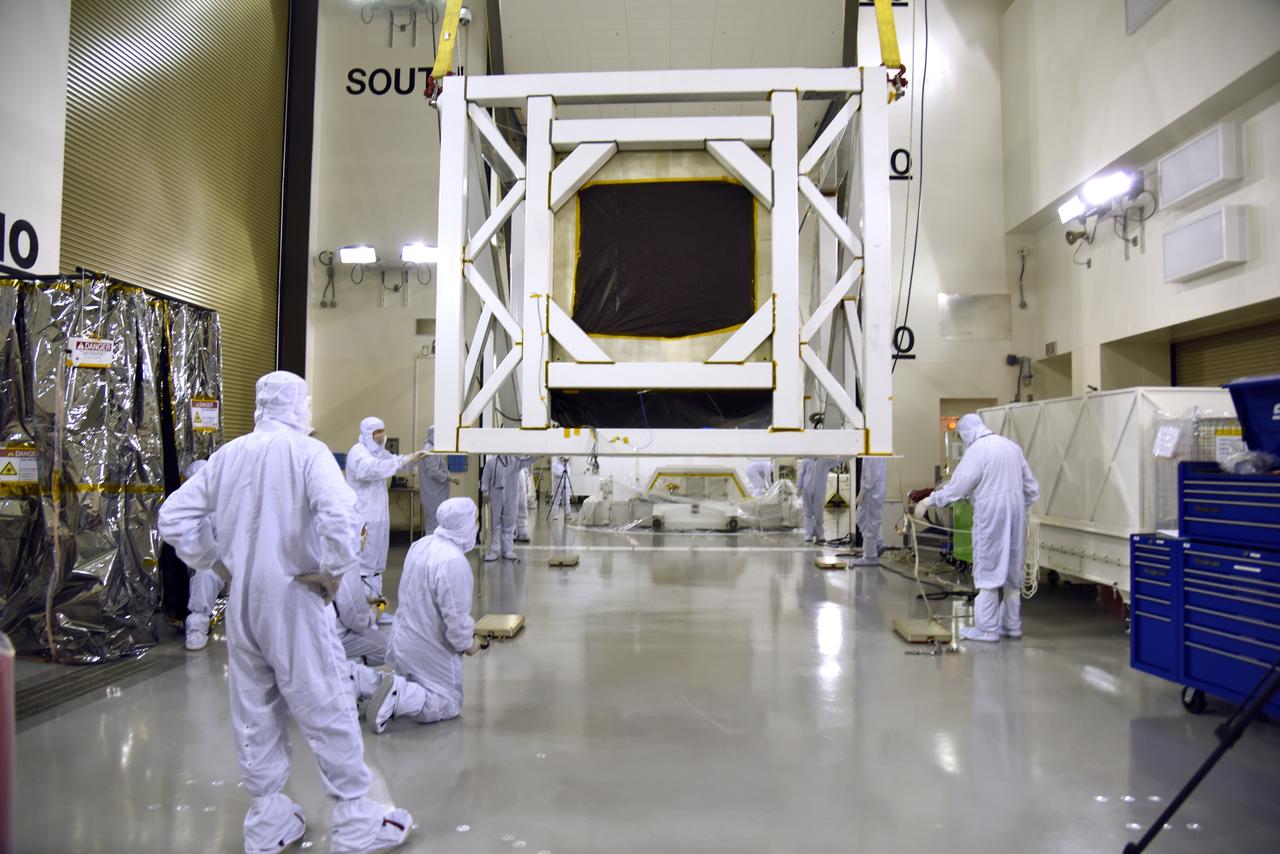
Technicians assist as a crane moves NASA's Ice, Cloud and land Elevation Satellite-2 (ICESat-2) into the high bay of the Astrotech processing facility on June 13, 2018, at Vandenberg Air Force Base in California. ICESat-2 was shipped from the Northrop Grumman facility in Gilbert, Arizona, where it was built and tested. The satellite is scheduled to launch from Space Launch Complex-2 at Vandenberg on the final United Launch Alliance Delta II rocket. ICESat-2 will measure the height of a changing Earth, one laser pulse at a time, 10,000 laser pulses a second. The satellite will carry the Advanced Topographic Laser Altimeter System. ICESat-2 will help scientists investigate why, and how much our planet's frozen and icy areas, called the cryosphere, is changing in a warming climate.

Inside the high bay of the Astrotech Space Operations facility at Vandenberg Air Force Base in California, technicians attach NASA's Ice, Cloud and land Elevation Satellite-2 (ICESat-2) to the payload direct mate adapter, on Aug. 24, 2018. The satellite is being prepared for its scheduled launch from Space Launch Complex 2 at Vandenberg on the final United Launch Alliance Delta II rocket. ICESat-2 will measure the height of a changing Earth, one laser pulse at a time, 10,000 laser pulses a second. The satellite will carry the Advanced Topographic Laser Altimeter System (ATLAS). ICESat-2 will help scientists investigate why, and how much our planet's frozen and icy areas, called the cryosphere, are changing in a warming climate.
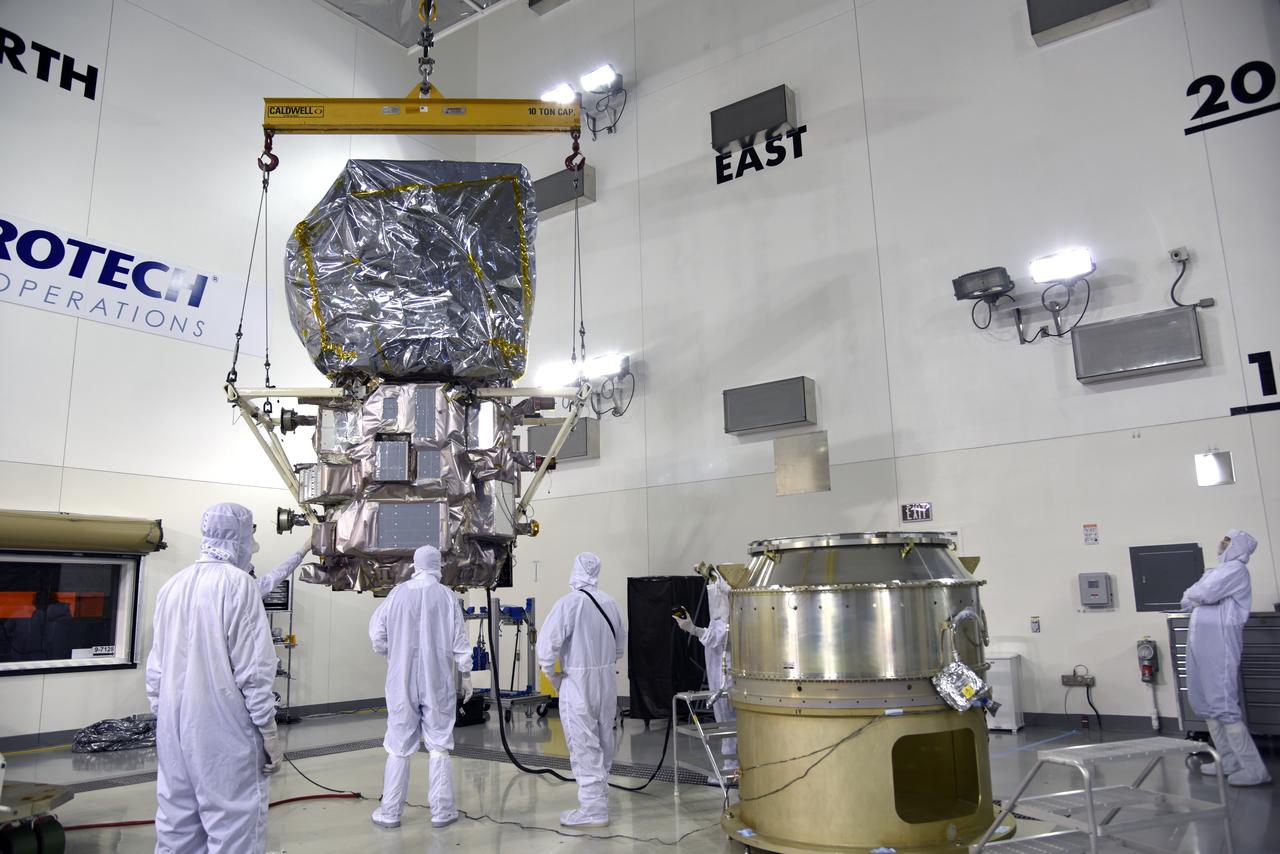
Inside the high bay of the Astrotech Space Operations facility at Vandenberg Air Force Base in California, a crane lifts and moves NASA's Ice, Cloud and land Elevation Satellite-2 (ICESat-2) on Aug. 30, 2018. The satellite will be attached to the payload adapter. ICESat-2 is being prepared for its scheduled launch from Space Launch Complex 2 at Vandenberg on the final United Launch Alliance Delta II rocket. ICESat-2 will measure the height of a changing Earth, one laser pulse at a time, 10,000 laser pulses a second. The satellite will carry the Advanced Topographic Laser Altimeter System (ATLAS). ICESat-2 will help scientists investigate why, and how much our planet's frozen and icy areas, called the cryosphere, are changing in a warming climate.
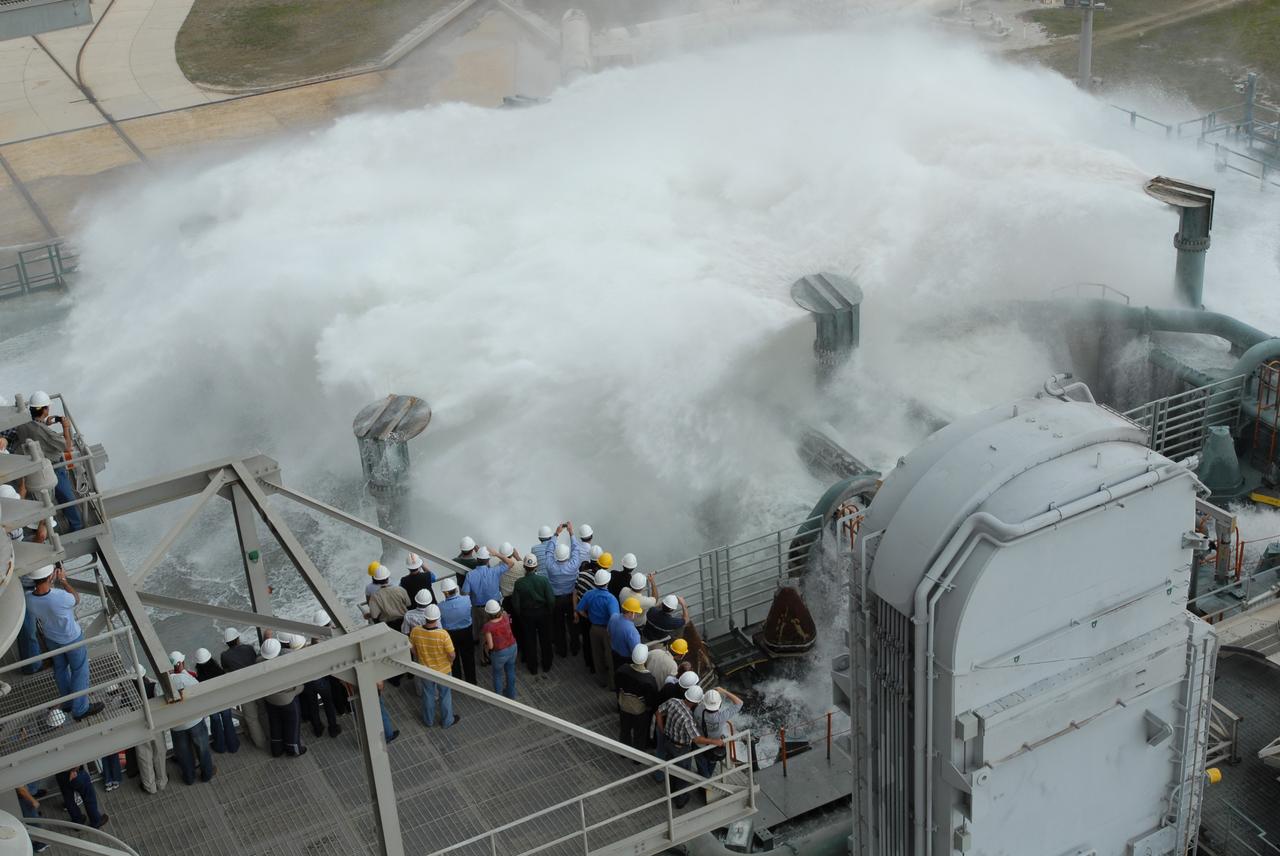
CAPE CANAVERAL, Fla. – The sound suppression system is tested on the mobile launcher platform on Launch Pad 39B at NASA's Kennedy Space Center in Florida. Pad 39B will be the site of the first Ares vehicle launch, including the Ares I-X flight test that is targeted for summer 2009. The mobile launcher platform was handed over to the Constellation Program and modified for the Ares I-X flight test. It is being tested before being moved to the Vehicle Assembly Building for assembly of the Ares I-X rocket. A sound suppression water system is in¬stalled on the pads to protect against damage by acoustical energy and rocket exhaust reflected from the flame trench and mobile launcher plat¬form during a launch. The sound suppression system includes an elevated 290-foot-high water tank with a capacity of 300,000 gallons. The water releases just prior to the ignition of the rocket and flows through 7-foot-diameter pipes for about 20 seconds. A torrent of water will flow onto the mobile launcher platform from six large quench nozzles, or “rainbirds,” mounted on its surface. The rainbirds are 12 feet high. The two in the center are 42 inches in diameter; the other four have a 30-inch diameter. Photo credit: NASA/Jim Grossmann
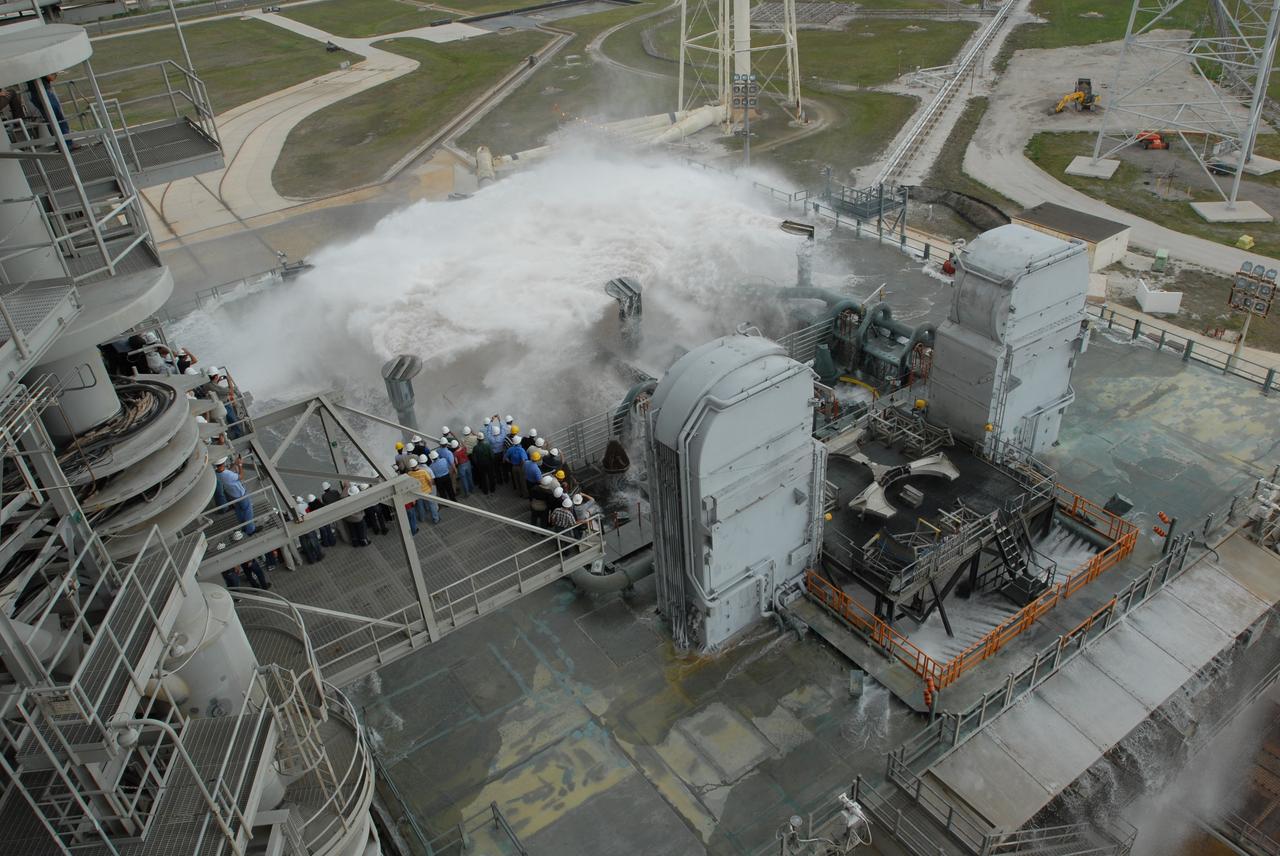
CAPE CANAVERAL, Fla. – The sound suppression system is tested on the mobile launcher platform on Launch Pad 39B at NASA's Kennedy Space Center in Florida. Pad 39B will be the site of the first Ares vehicle launch, including the Ares I-X flight test that is targeted for summer 2009. The mobile launcher platform was handed over to the Constellation Program and modified for the Ares I-X flight test. It is being tested before being moved to the Vehicle Assembly Building for assembly of the Ares I-X rocket. A sound suppression water system is in¬stalled on the pads to protect against damage by acoustical energy and rocket exhaust reflected from the flame trench and mobile launcher plat¬form during a launch. The sound suppression system includes an elevated 290-foot-high water tank with a capacity of 300,000 gallons. The water releases just prior to the ignition of the rocket and flows through 7-foot-diameter pipes for about 20 seconds. A torrent of water will flow onto the mobile launcher platform from six large quench nozzles, or “rainbirds,” mounted on its surface. The rainbirds are 12 feet high. The two in the center are 42 inches in diameter; the other four have a 30-inch diameter. Photo credit: NASA/Jim Grossmann
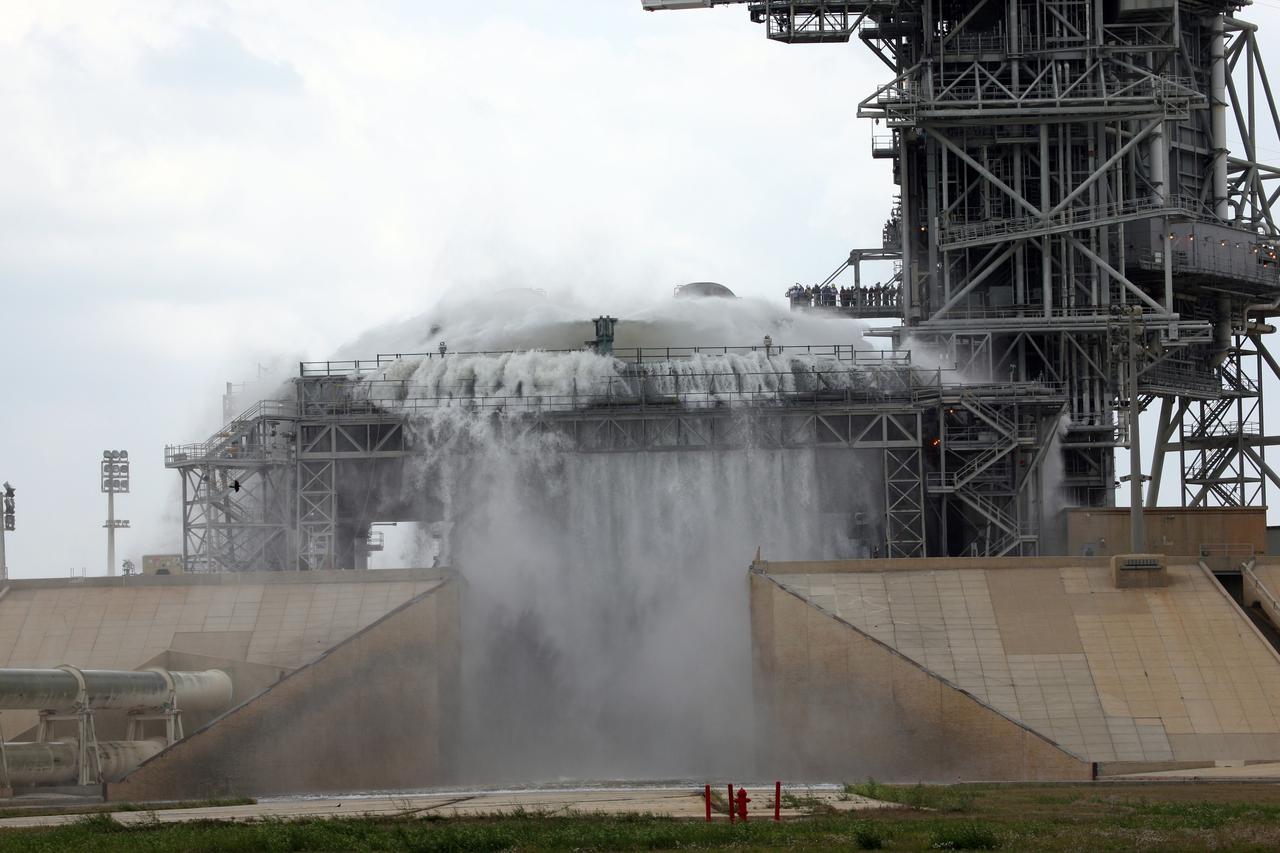
CAPE CANAVERAL, Fla. – Water cascades over the side of the mobile launcher platform on Launch Pad 39B at NASA's Kennedy Space Center in Florida. The sound suppression system is being tested on the platform. Pad 39B will be the site of the first Ares vehicle launch, including the Ares I-X flight test that is targeted for summer 2009. The mobile launcher platform was handed over to the Constellation Program and modified for the Ares I-X flight test. It is being tested before being moved to the Vehicle Assembly Building for assembly of the Ares I-X rocket. A sound suppression water system is in¬stalled on the pads to protect against damage by acoustical energy and rocket exhaust reflected from the flame trench and mobile launcher plat¬form during a launch. The sound suppression system includes an elevated 290-foot-high water tank with a capacity of 300,000 gallons. The water releases just prior to the ignition of the rocket and flows through 7-foot-diameter pipes for about 20 seconds. A torrent of water will flow onto the mobile launcher platform from six large quench nozzles, or “rainbirds,” mounted on its surface. The rainbirds are 12 feet high. The two in the center are 42 inches in diameter; the other four have a 30-inch diameter. Photo credit: NASA/Dimitri Gerondidakis
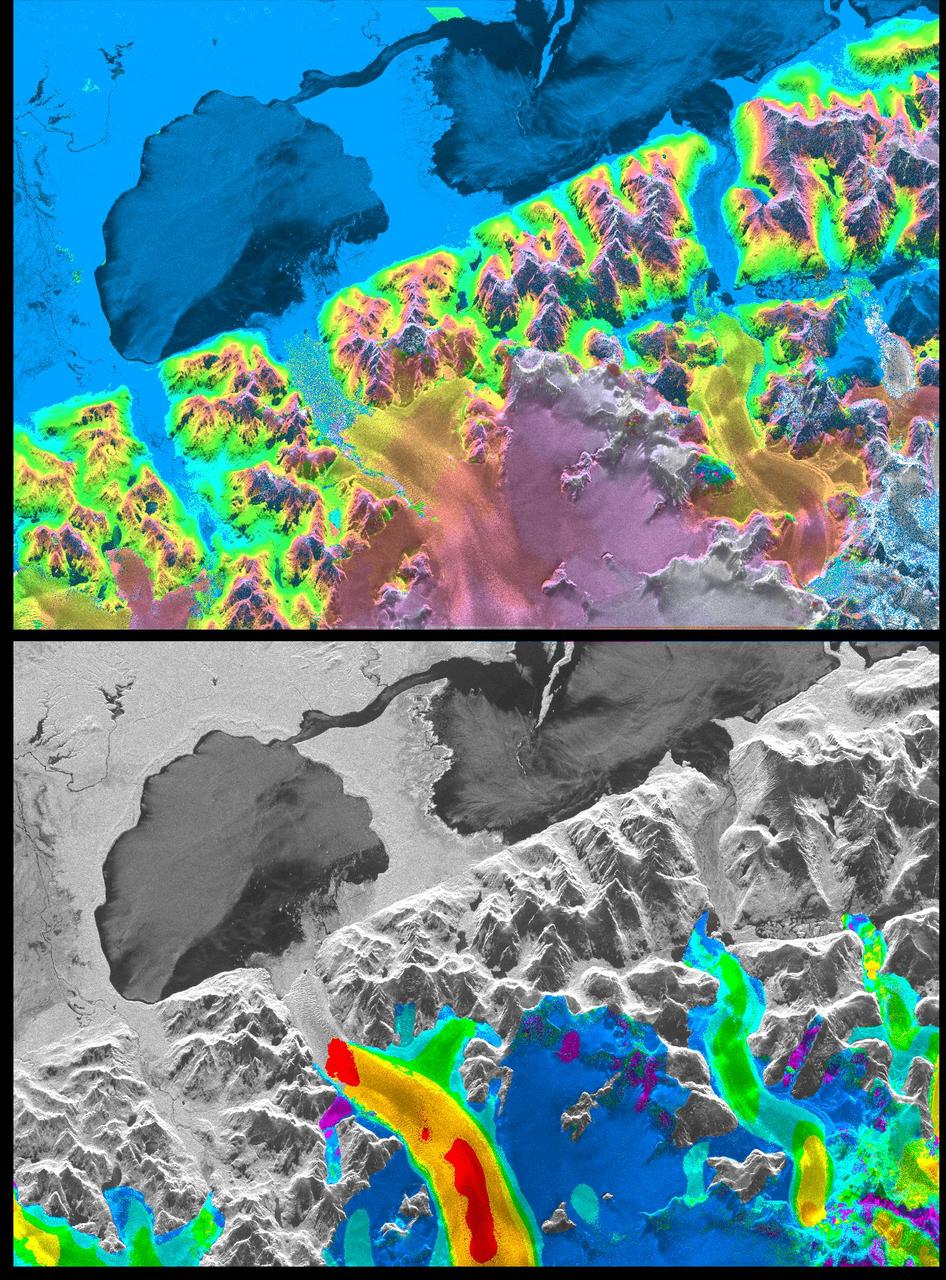
A NASA radar instrument has been successfully used to measure some of the fastest moving and most inaccessible glaciers in the world -- in Chile's huge, remote Patagonia ice fields -- demonstrating a technique that could produce more accurate predictions of glacial response to climate change and corresponding sea level changes. This image, produced with interferometric measurements made by the Spaceborne Imaging Radar-C and X-band Synthetic Aperture Radar (SIR-C/X-SAR) flown on the Space Shuttle last fall, has provided the first detailed measurements of the mass and motion of the San Rafael Glacier. Very few measurements have been made of the Patagonian ice fields, which are the world's largest mid-latitude ice masses and account for more than 60 percent of the Southern Hemisphere's glacial area outside of Antarctica. These features make the area essential for climatologists attempting to understand the response of glaciers on a global scale to changes in climate, but the region's inaccessibility and inhospitable climate have made it nearly impossible for scientists to study its glacial topography, meteorology and changes over time. Currently, topographic data exist for only a few glaciers while no data exist for the vast interior of the ice fields. Velocity has been measured on only five of the more than 100 glaciers, and the data consist of only a few single-point measurements. The interferometry performed by the SIR-C/X-SAR was used to generate both a digital elevation model of the glaciers and a map of their ice motion on a pixel-per-pixel basis at very high resolution for the first time. The data were acquired from nearly the same position in space on October 9, 10 and 11, 1994, at L-band frequency (24-cm wavelength), vertically transmitted and received polarization, as the Space Shuttle Endeavor flew over several Patagonian outlet glaciers of the San Rafael Laguna. The area shown in these two images is 50 kilometers by 30 kilometers (30 miles by 18 miles) in size and is centered at 46.6 degrees south latitude, 73.8 degrees west longitude. North is toward the upper right. The top image is a digital elevation model of the scene, where color and saturation represent terrain height (between 0 meters and 2,000 meters or up to 6,500 feet) and brightness represents radar backscatter. Low elevations are shown in blue and high elevations are shown in pink. The digital elevation map of the glacier surface has a horizontal resolution of 15 meters (50 feet) and a vertical resolution of 10 meters (30 feet). High-resolution maps like these acquired over several years would allow scientists to calculate directly long-term changes in the mass of the glacier. The bottom image is a map of ice motion parallel to the radar look direction only, which is from the top of the image. Purple indicates ice motion away from the radar at more than 6 centimeters per day; dark blue is ice motion toward or away at less than 6 cm per day; light blue is motion toward the radar of 6 cm to 20 cm (about 2 to 8 inches) per day; green is motion toward the radar of 20 cm to 45 cm (about 8 to 18 inches) per day; yellow is 45 cm to 85 cm (about 18 to 33 inches) per day; orange is 85 cm to 180 cm (about 33 to 71 inches) per day; red is greater than 180 cm (71 inches) per day. The velocity estimates are accurate to within 5 millimeters per day. The largest velocities are recorded on the San Rafael Glacier in agreement with previous work. Other outlet glaciers exhibit ice velocities of less than 1 meter per day. Several kilometers before its terminus, (left of center) the velocity of the San Rafael Glacier exceeds 10 meters (32 feet) per day, and ice motion cannot be estimated from the data. There, a revisit time interval of less than 12 hours would have been necessary to estimate ice motion from interferometry data. The results however demonstrate that the radar interferometry technique permits the monitoring of glacier characteristics unattainable by any other means. http://photojournal.jpl.nasa.gov/catalog/PIA01781
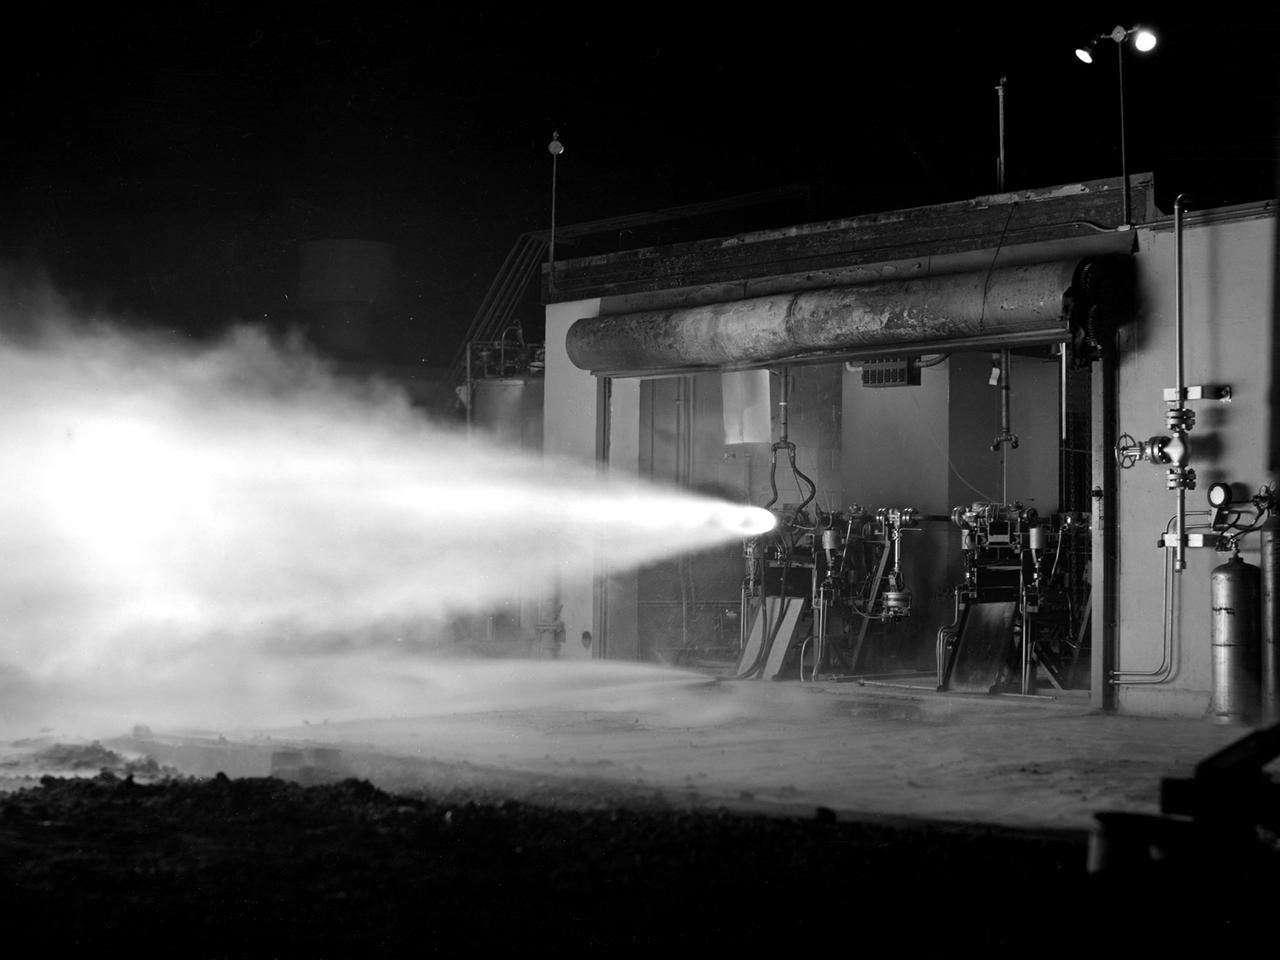
A rocket using high-energy propellant is fired from the Rocket Laboratory at the National Advisory Committee for Aeronautics (NACA) Lewis Flight Propulsion Laboratory. The Rocket Lab was a collection of ten one-story cinderblock test cells located behind earthen barriers at the western edge of the campus. The rocket engines tested there were comparatively small, but the Lewis researchers were able to study different configurations, combustion performance, and injectors and nozzle design. The rockets were generally mounted horizontally and fired, as seen in this photograph of Test Cell No. 22. A group of fuels researchers at Lewis refocused their efforts after World War II in order to explore high energy propellants, combustion, and cooling. Research in these three areas began in 1945 and continued through the 1960s. The group of rocket researches was not elevated to a division branch until 1952. The early NACA Lewis work led to the development of liquid hydrogen as a viable propellant in the late 1950s. Following the 1949 reorganization of the research divisions, the rocket group began working with high-energy propellants such as diborane, pentaborane, and hydrogen. The lightweight fuels offered high levels of energy but were difficult to handle and required large tanks. In late 1954, Lewis researchers studied the combustion characteristics of gaseous hydrogen in a turbojet combustor. Despite poor mixing of the fuel and air, it was found that the hydrogen yielded more than a 90-percent efficiency. Liquid hydrogen became the focus of Lewis researchers for the next 15 years.
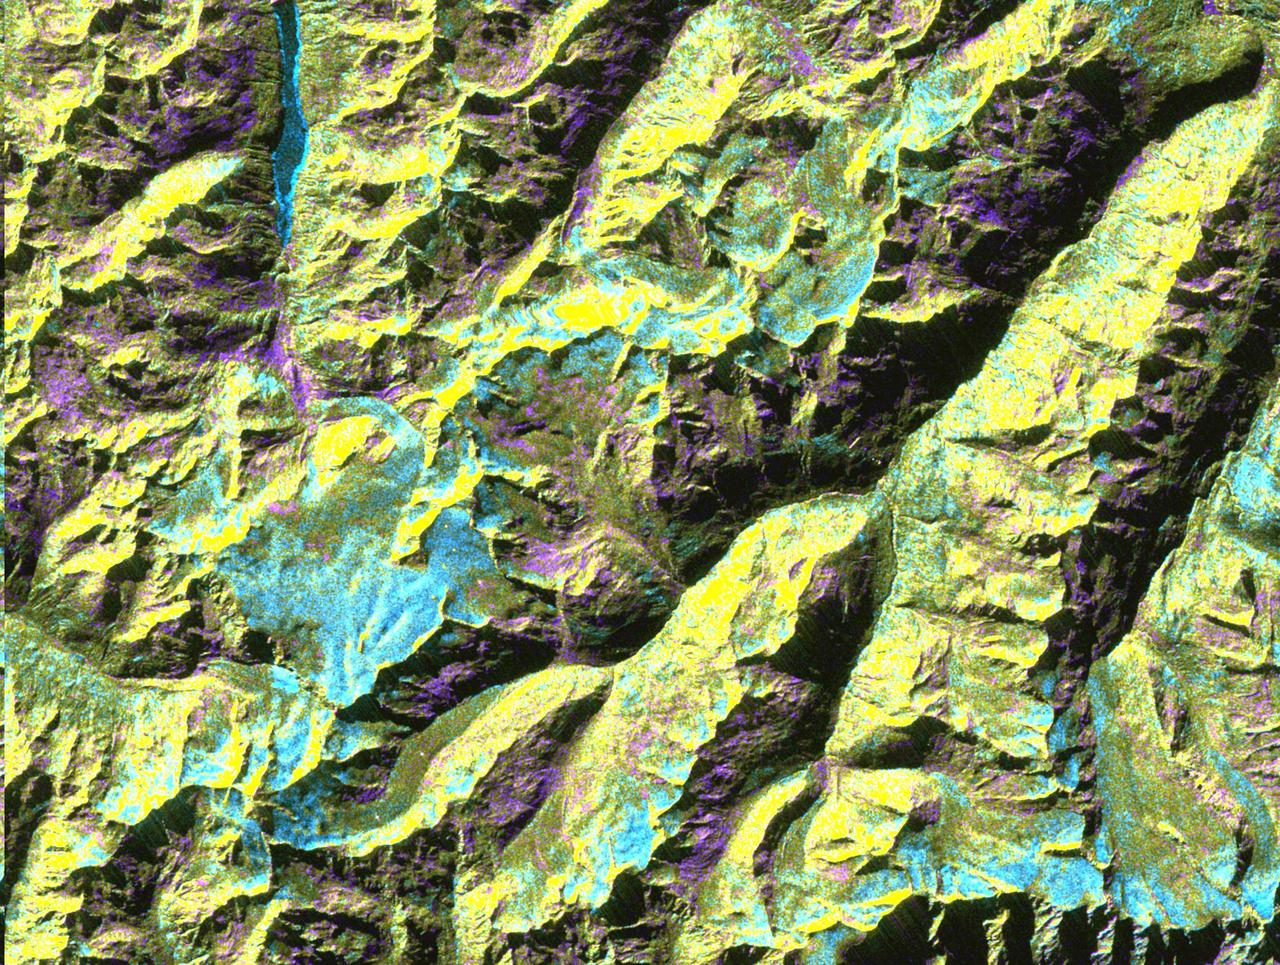
This is a digital elevation model that was geometrically coded directly onto an X-band seasonal change image of the Oetztal supersite in Austria. The image is centered at 46.82 degrees north latitude and 10.79 degrees east longitude. This image is located in the Central Alps at the border between Switzerland, Italy and Austria, 50 kilometers (31 miles) southwest of Innsbruck. It was acquired by the Spaceborne Imaging Radar-C/X-band Synthetic Aperture aboard the space shuttle Endeavour on April 14, 1994 and on October 5, 1994. It was produced by combining data from these two different data sets. Data obtained in April is green; data obtained in October appears in red and blue, and was used as an enhancement based on the ratio of the two data sets. Areas with a decrease in backscatter from April to October appear in light blue (cyan), such as the large Gepatschferner glacier seen at the left of the image center, and most of the other glaciers in this view. A light blue hue is also visible at the east border of the dark blue Lake Reschensee at the upper left side. This shows a significant rise in the water level. Magenta represents areas with an increase of backscatter from April 10 to October 5. Yellow indicates areas with high radar signal response during both passes, such as the mountain slopes facing the radar. Low radar backscatter signals refer to smooth surface (lakes) or radar grazing areas to radar shadow areas, seen in the southeast slopes. The area is approximately 29 kilometers by 21 kilometers (18 miles by 13.5 miles). The summit of the main peaks reaches elevations of 3,500 to 3,768 meters (xx feet to xx feet) above sea level. The test site's core area is the glacier region of Venter Valley, which is one of the most intensively studied areas for glacier research in the world. Research in Venter Valley (below center) includes studies of glacier dynamics, glacier-climate regions, snowpack conditions and glacier hydrology. About 25 percent of the core test site is covered by glaciers. Corner reflectors are set up for calibration. Five corner reflectors can be seen on the Gepatschferner and two can be seen on the Vernagtferner. http://photojournal.jpl.nasa.gov/catalog/PIA01760