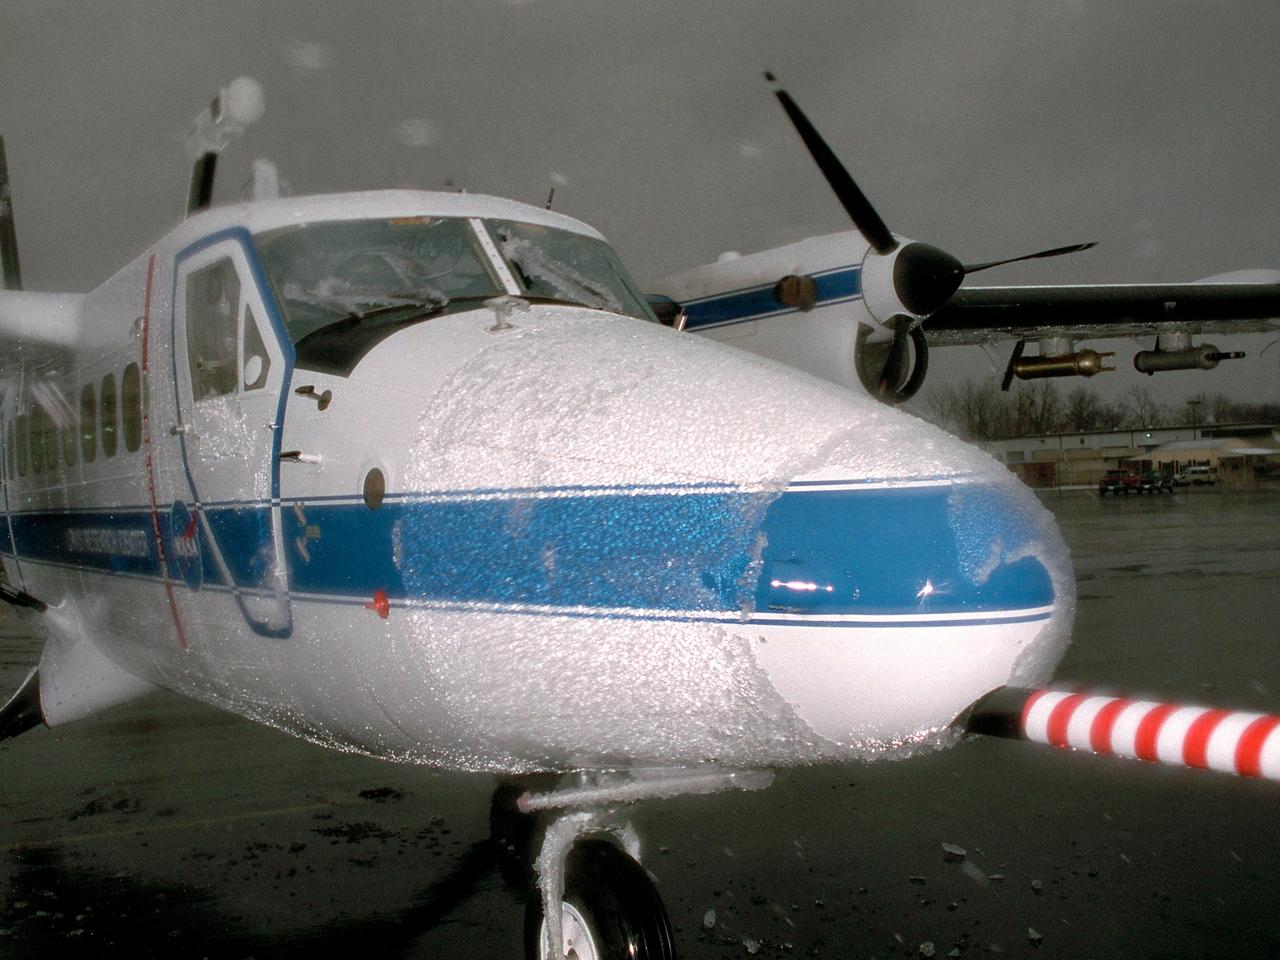
Supercooled Large Droplet (SLD) icing encounter in the Twin Otter icing research aircraft.
Bright Ice, Dirty Ice
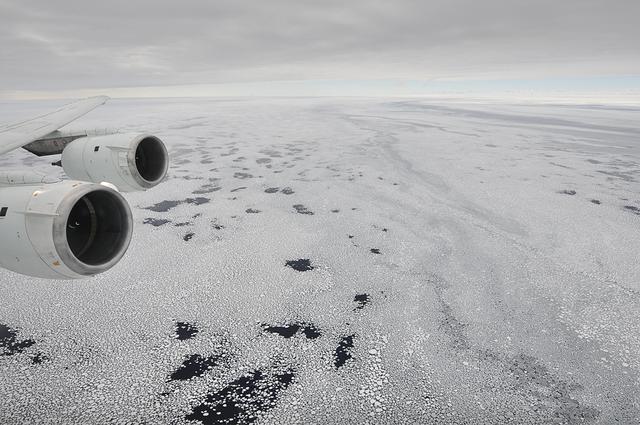
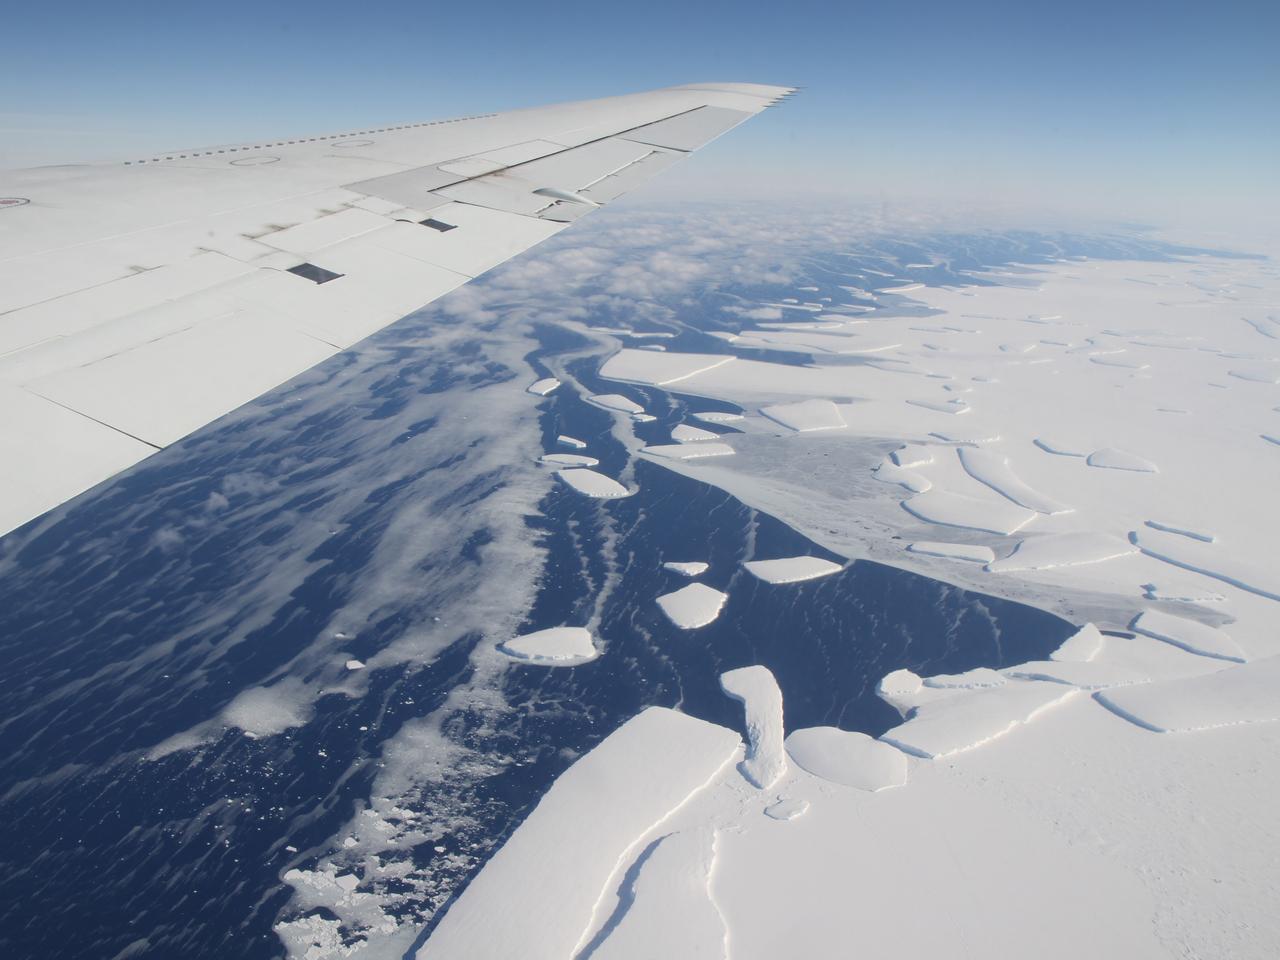
Sea ice is seen out the window of NASA's DC-8 research aircraft as it flies 2,000 feet above the Bellingshausen Sea in West Antarctica on Wednesday, Oct., 21, 2009. This was the fourth science flight of NASA’s Operation Ice Bridge airborne Earth science mission to study Antarctic ice sheets, sea ice, and ice shelves. Photo Credit: (NASA/Jane Peterson)

NASA Glenn’s Propulsion Systems Lab (PSL) is conducting research to characterize ice crystal clouds that can create a hazard to aircraft engines under certain conditions. The isokinetic probe (in gold) samples particles and another series of probes can measure everything from humidity to air pressure.
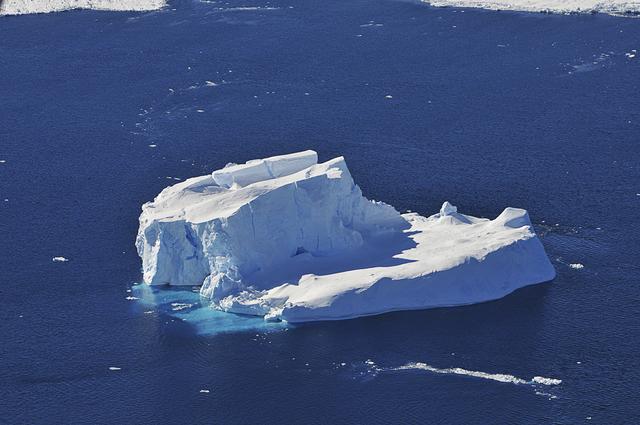
An iceberg is seen out the window of NASA's DC-8 research aircraft as it flies 2,000 feet above the Amundsen Sea in West Antarctica on Wednesday, Oct., 21, 2009. This was the fourth science flight of NASA’s Operation Ice Bridge airborne Earth science mission to study Antarctic ice sheets, sea ice, and ice shelves. Photo Credit: (NASA/Jane Peterson)

Mountain of Ice
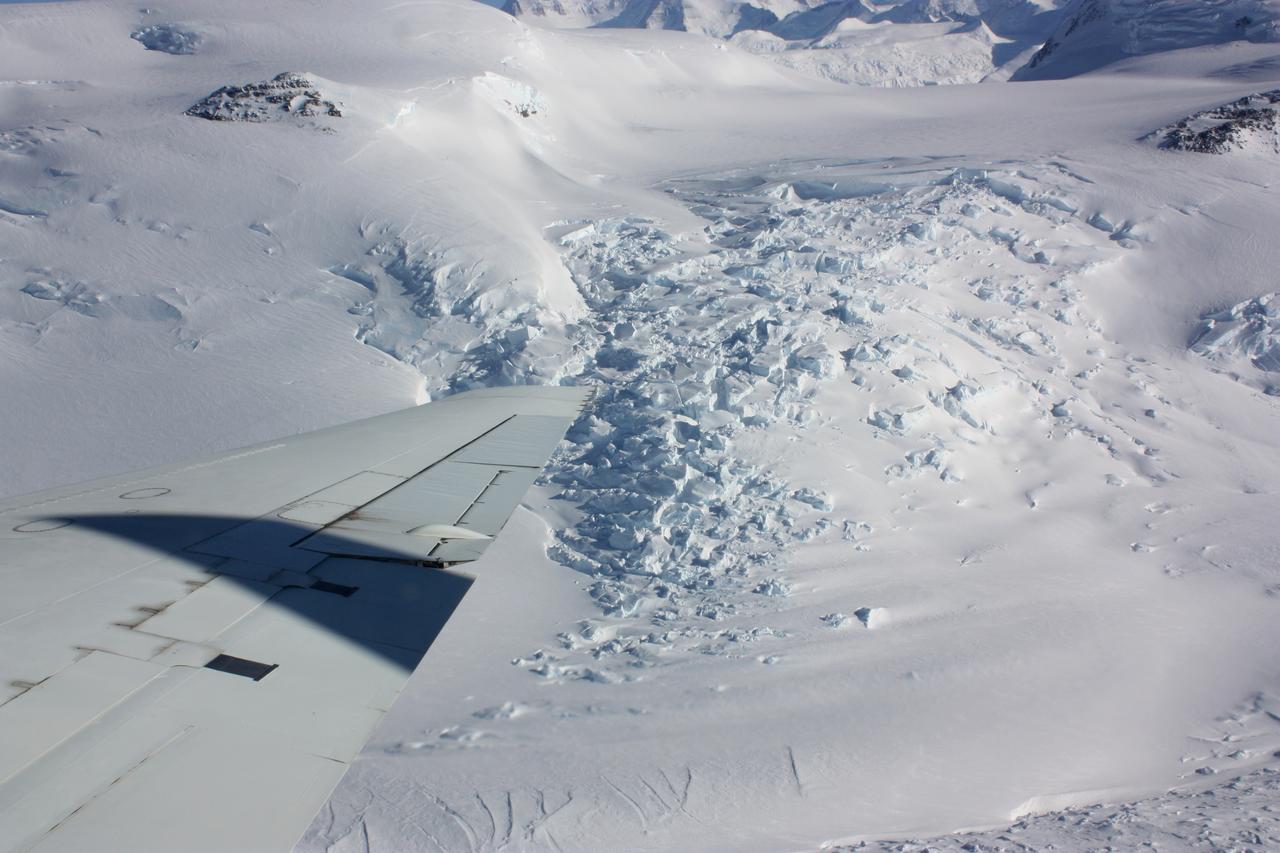
Scrambled Ice

Buried Ice

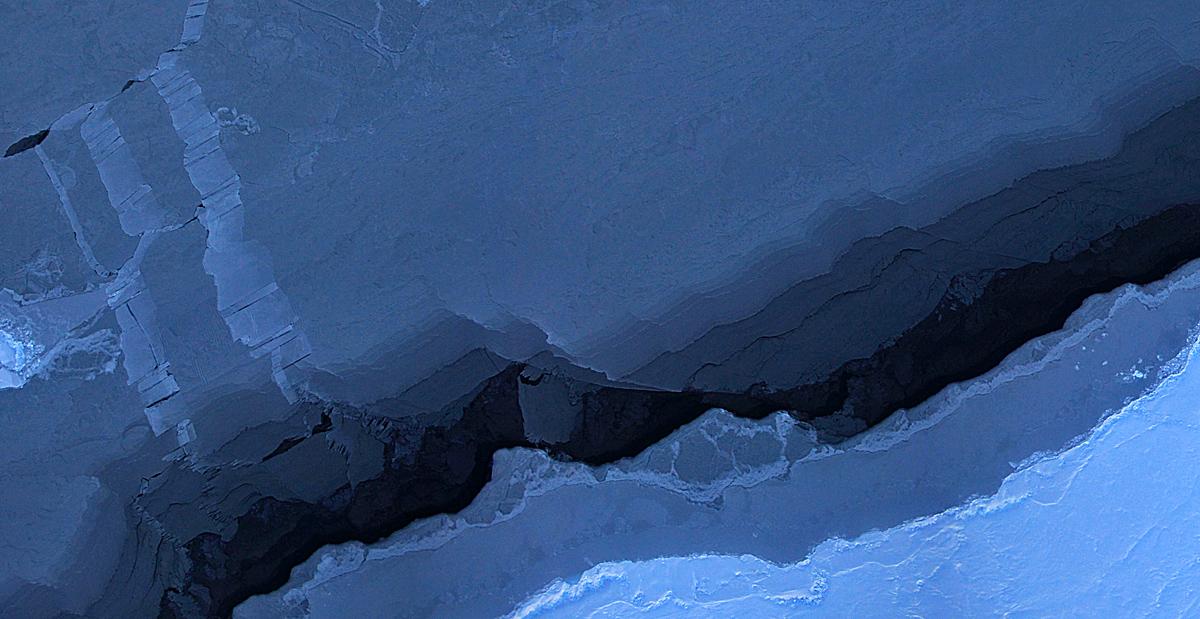
Broken Ice

Dunes on Ice
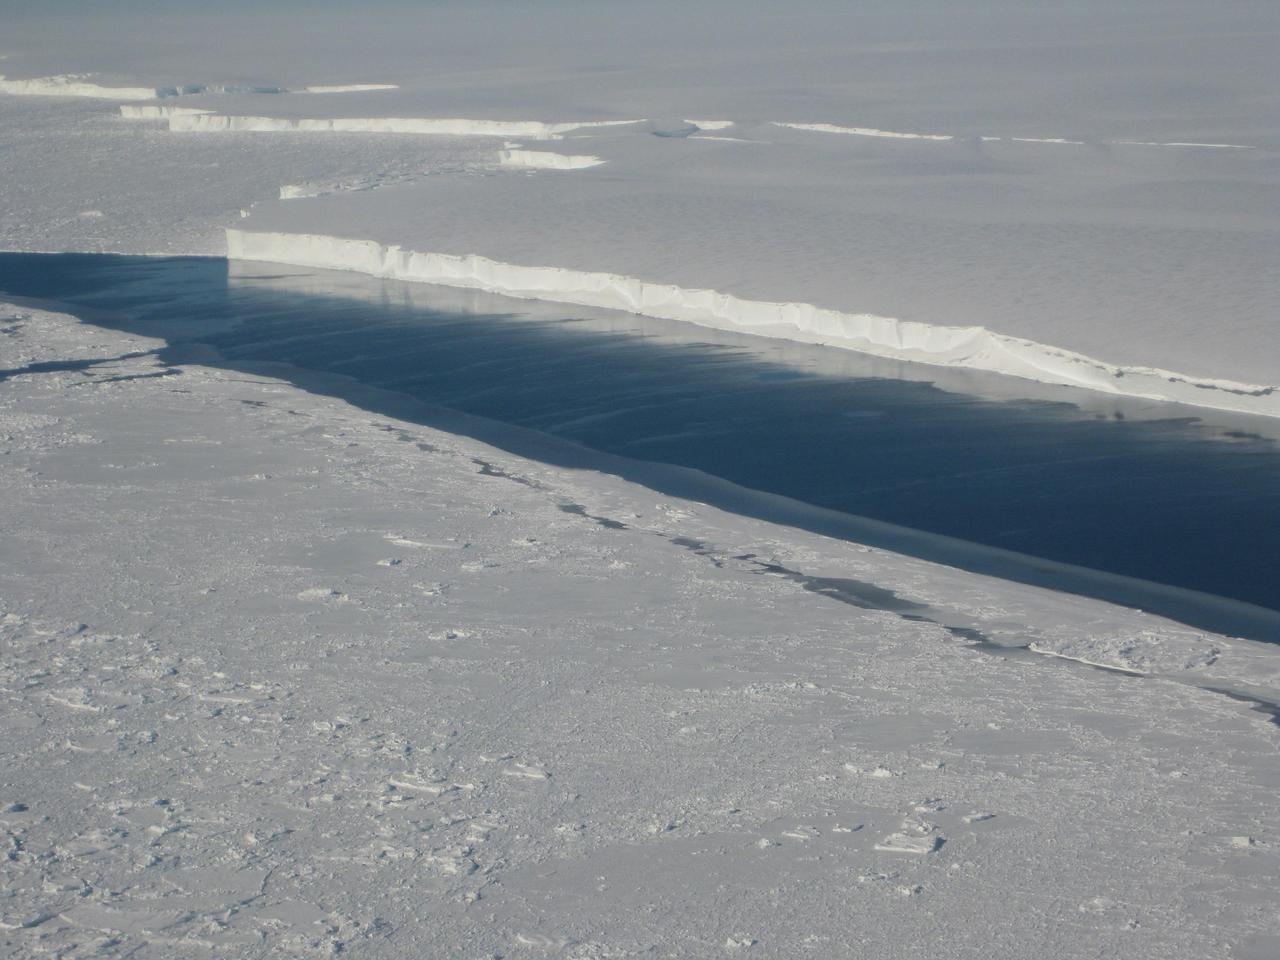
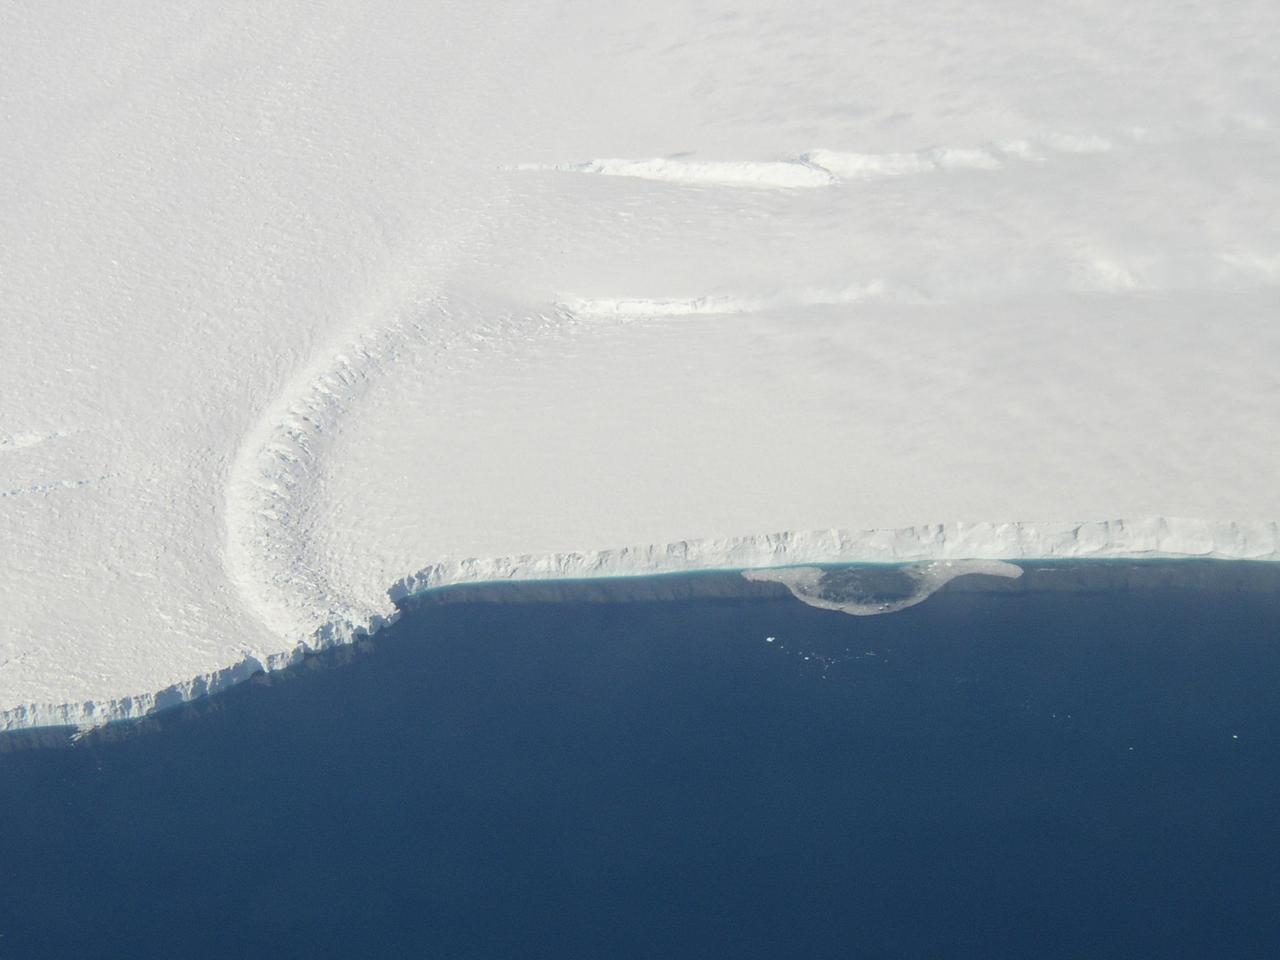
Ice Edge
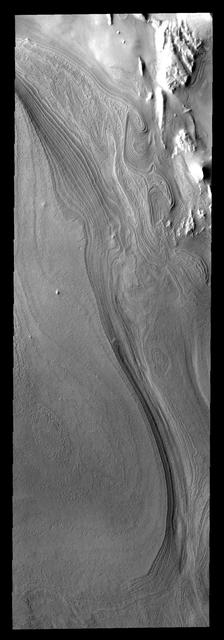
Ice Layers

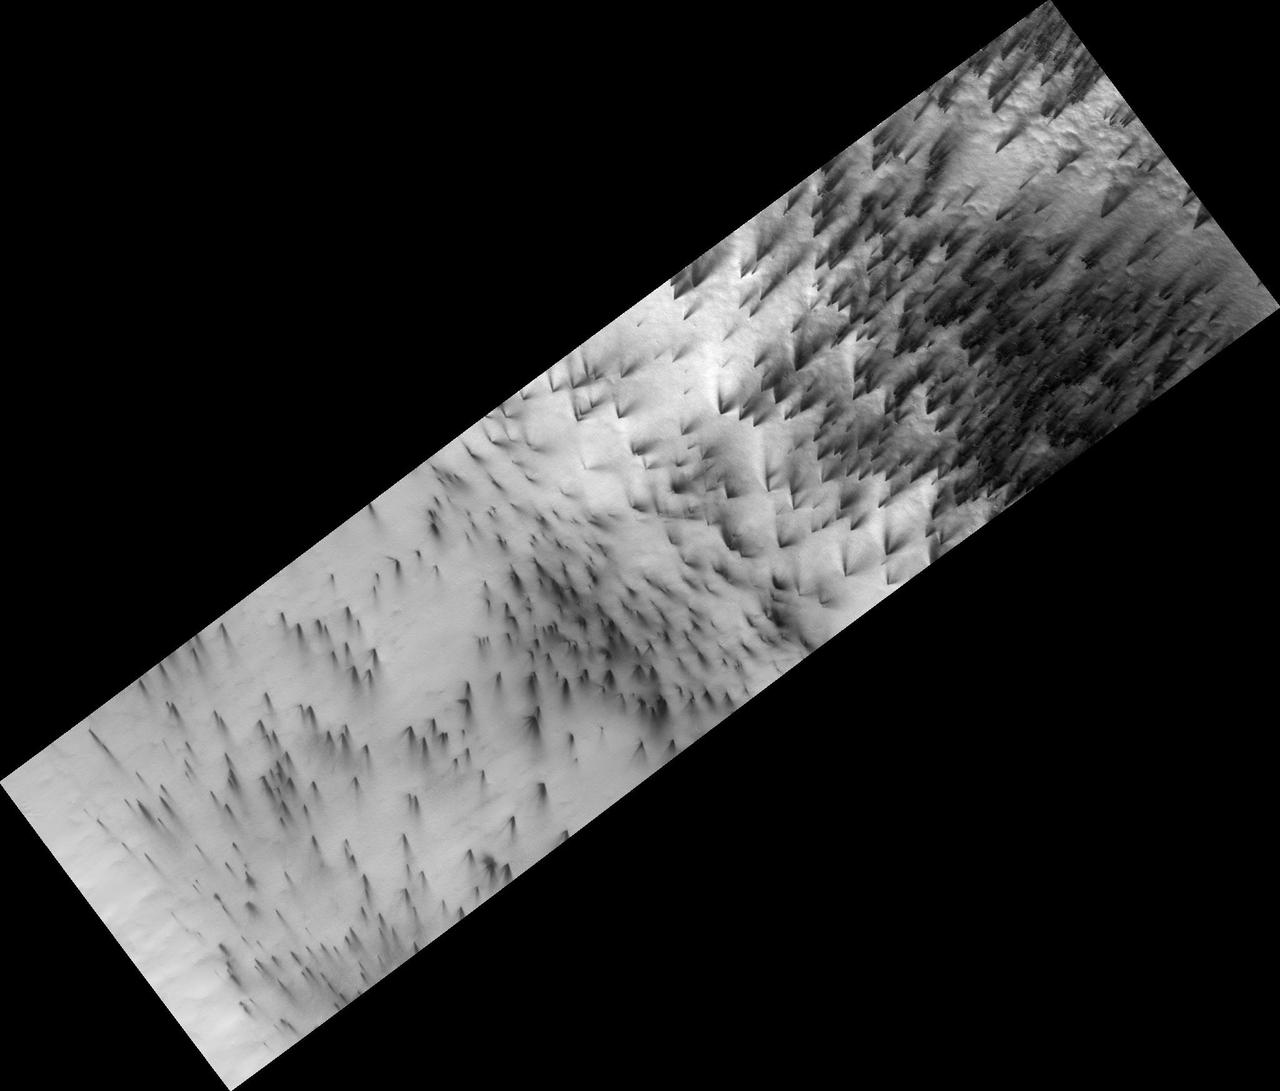
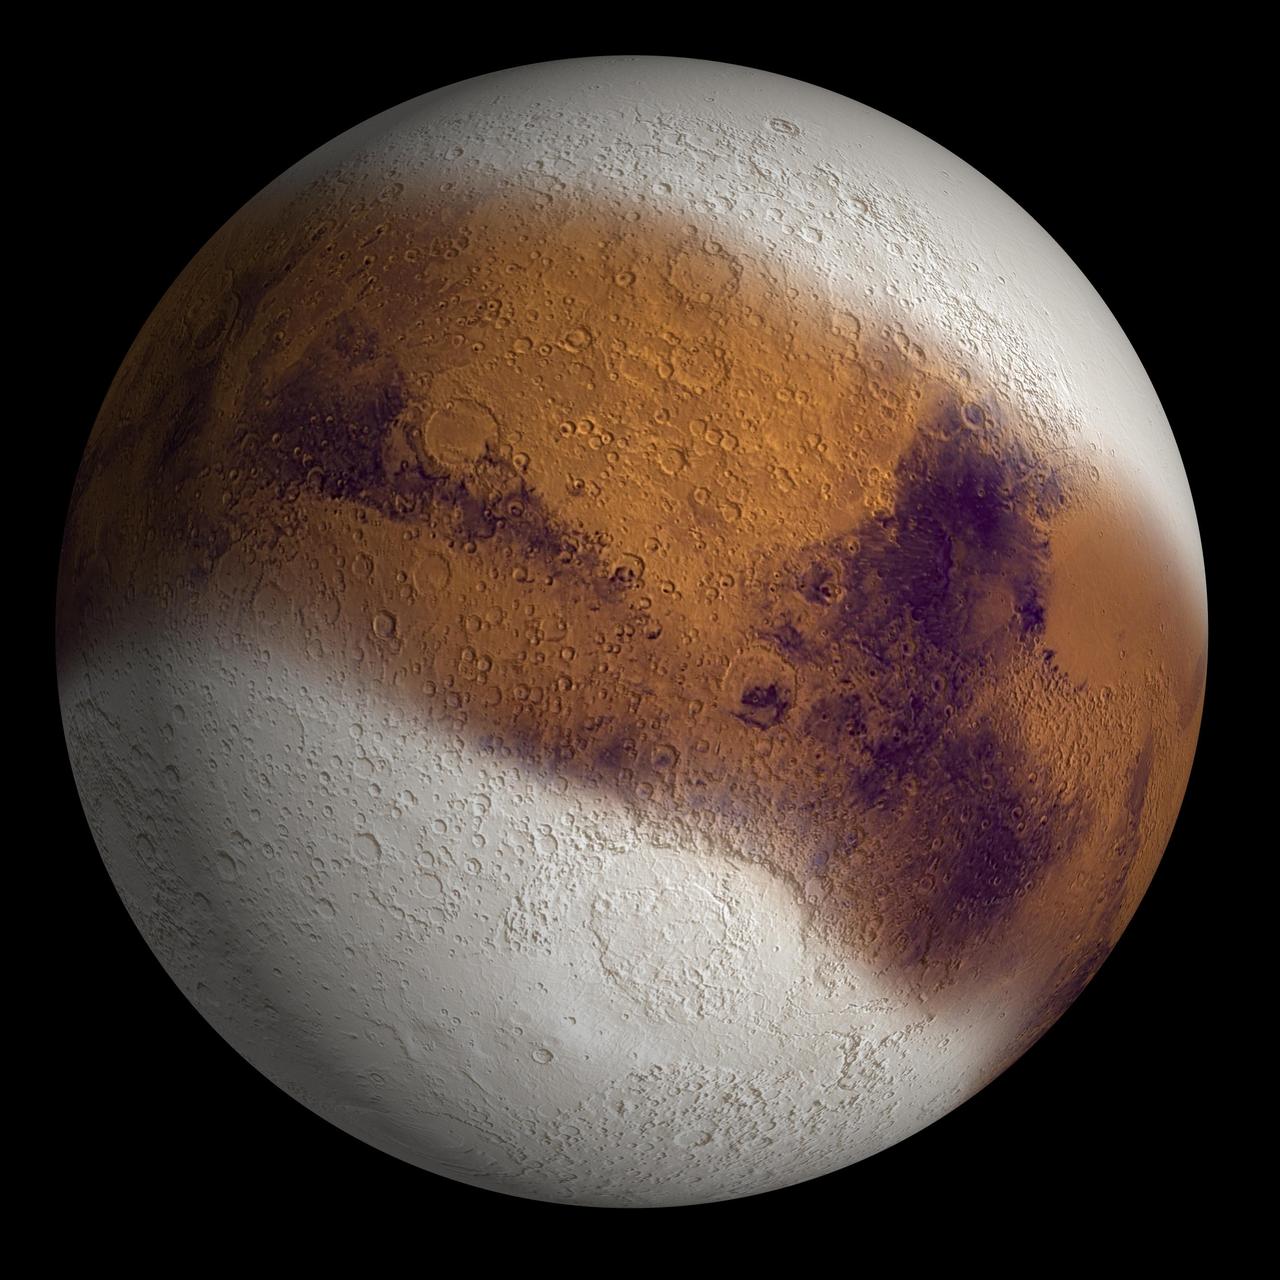
Ice On Mars
Not Only Ice

Expanse of Ice
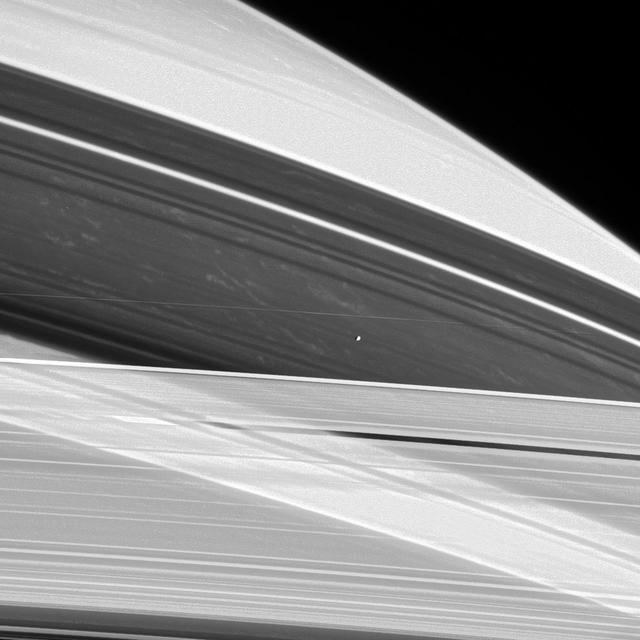
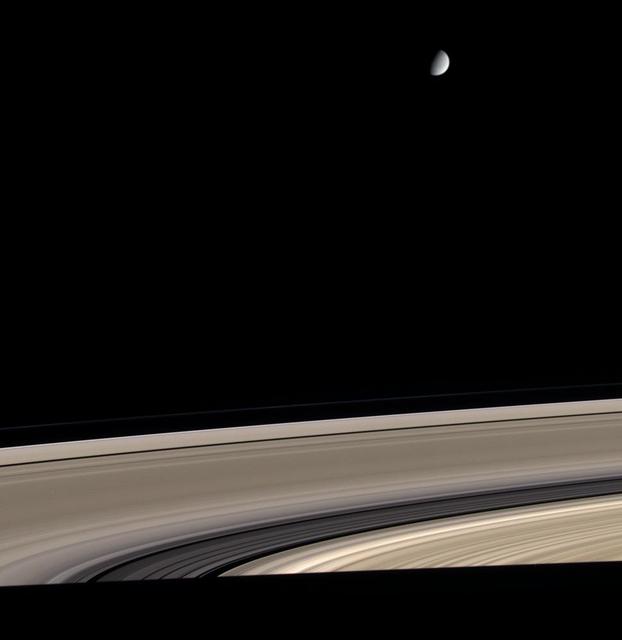
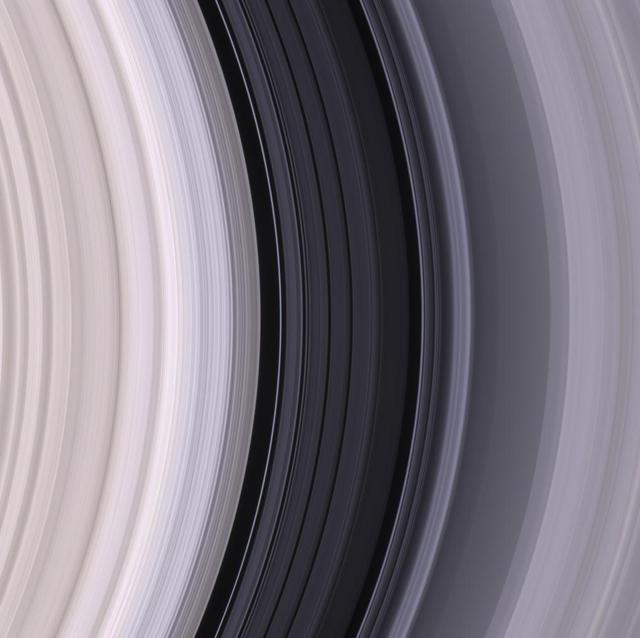
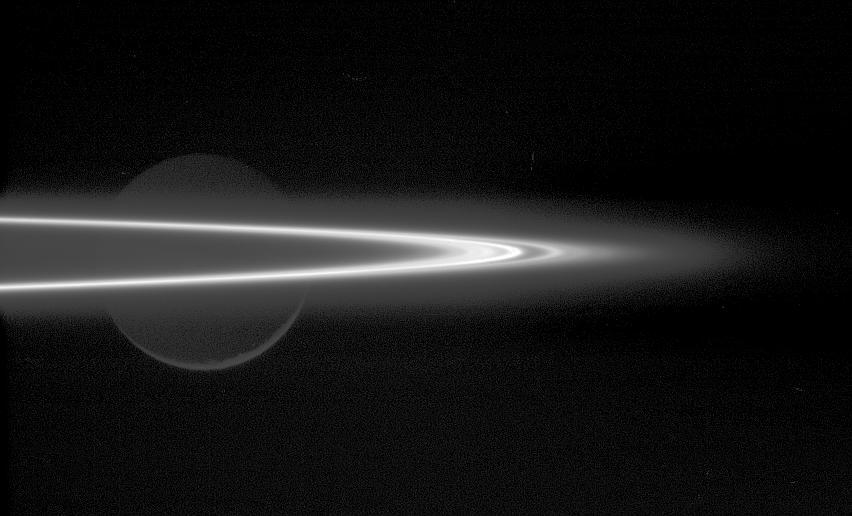
Shepherd of Ice
Ice Orbs
Impact on the Ice
A rift in Antarctica's Larsen C ice shelf has grown to 110 miles (175 km) long, making it inevitable that an iceberg larger than Rhode Island will soon calve from the ice shelf. Larsen C is the fourth largest ice shelf in Antarctica, with an area of almost 20,000 square miles (50,000 square kilometers). The calving event will remove approximately 10 percent of the ice shelf's mass, according to the Project for Impact of Melt on Ice Shelf Dynamics and Stability (MIDAS), a UK-based team studying the ice shelf. Only 12 miles (20 km) of ice now separates the end of the rift from the ocean. The rift has grown at least 30 miles (50 km) in length since August, but appears to be slowing recently as Antarctica returns to polar winter. Project MIDAS reports that the calving event might destabilize the ice shelf, which could result in a collapse similar to what occurred to the Larsen B ice shelf in 2002. The Multi-angle Imaging SpectroRadiometer (MISR) instrument aboard NASA's Terra satellite captured views of Larsen C on August 22, 2016, when the rift was 80 miles (130 km) in length; December 8, 2016, when the rift was approximately 90 miles (145 km) long; and April 6, 2017. The MISR instrument has nine cameras, which view the Earth at different angles. The overview image, from December 8, shows the entire Antarctic Peninsula -- home to Larsen A, B, and C ice shelves -- in natural color (similar to how it would appear to the human eye) from MISR's vertical-viewing camera. Combining information from several MISR cameras pointed at different angles gives information about the texture of the ice. The accompanying GIF depicts the inset area shown on the larger image and displays data from all three dates in false color. These multiangular views -- composited from MISR's 46-degree backward-pointing camera, the nadir (vertical-viewing) camera, and the 46-degree forward-pointing camera -- represent variations in ice texture as changes in color, such that areas of rough ice appear orange and smooth ice appears blue. The Larsen C shelf is on the left in the GIF, bordered by the Weddell Sea on the upper right. The ice within the rift is orange, indicating movement, and the end of the rift can be tracked across the shelf between images. In addition, between December and April, the rift widened, pushing the future iceberg away from the shelf at its southern end. These data were acquired during Terra orbits 88717, 90290 and 92023. https://photojournal.jpl.nasa.gov/catalog/PIA21581
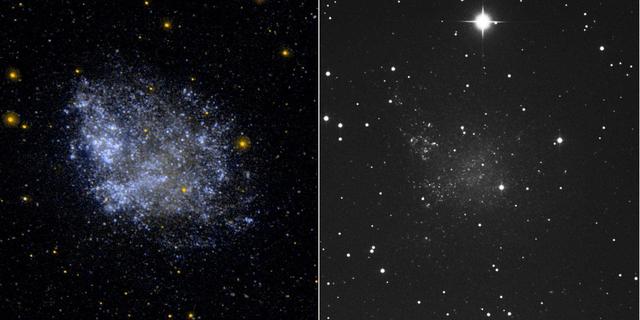
This ultraviolet image left and visual image right from NASA Galaxy Evolution Explorer is of the irregular dwarf galaxy IC 1613.

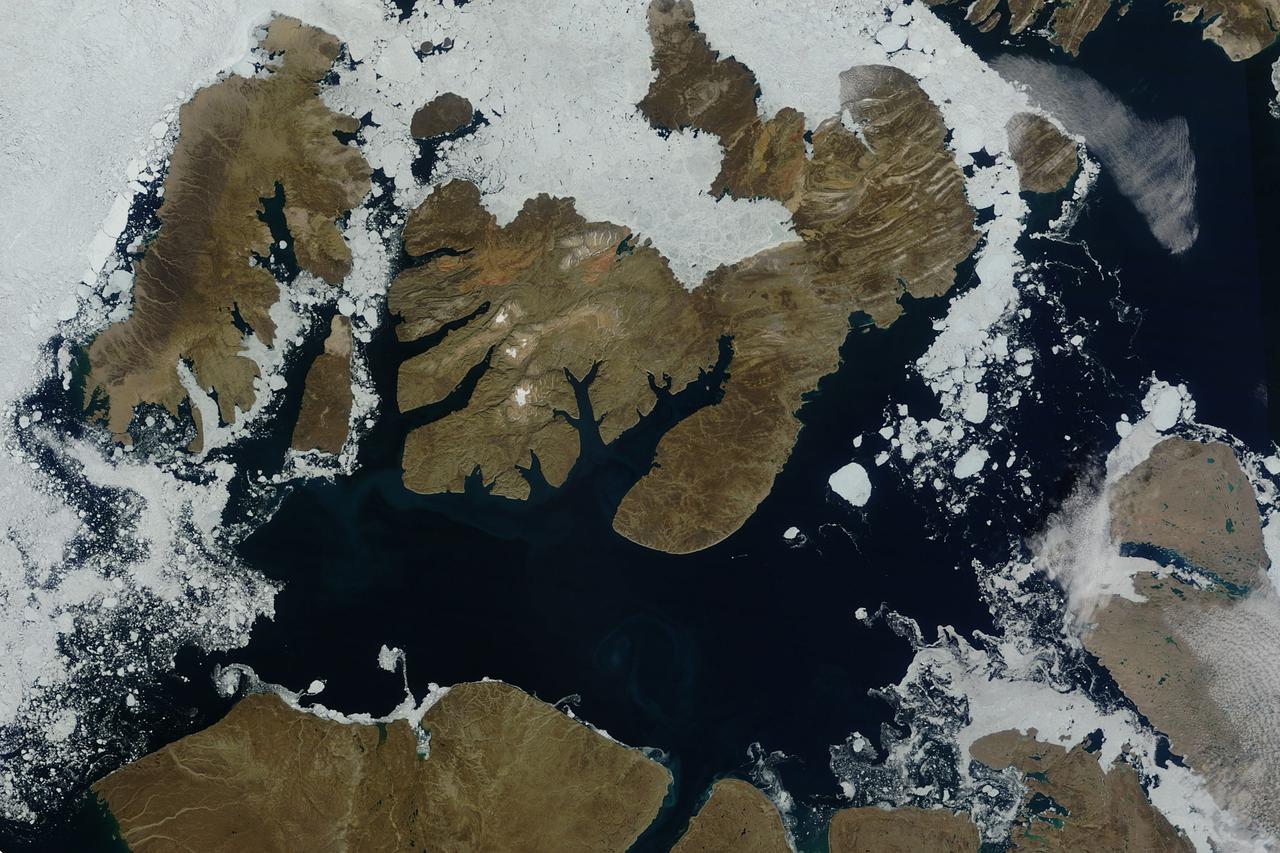
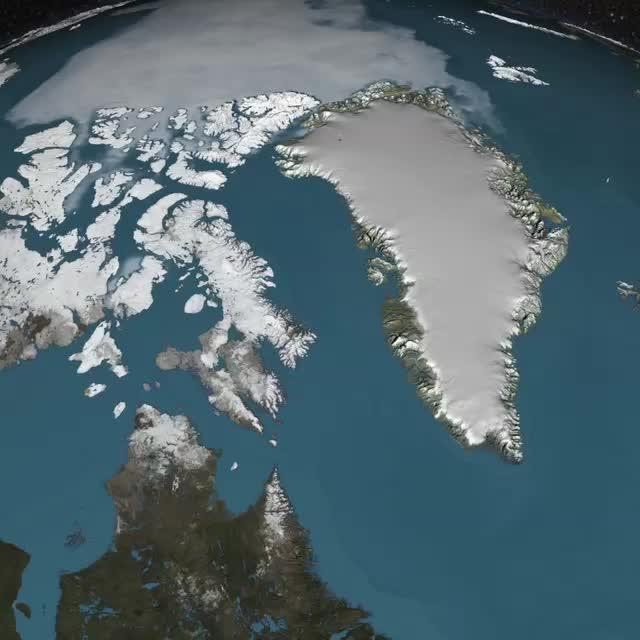
As the northern hemisphere experiences the heat of summer, ice moves and melts in the Arctic waters and the far northern lands surrounding it. The Moderate Resolution Imaging Spectroradiometer (MODIS) aboard NASA’s Aqua satellite captured this true-color image of sea ice off Greenland on July 16, 2015. Large chunks of melting sea ice can be seen in the sea ice off the coast, and to the south spirals of ice have been shaped by the winds and currents that move across the Greenland Sea. Along the Greenland coast, cold, fresh melt water from the glaciers flows out to the sea, as do newly calved icebergs. Frigid air from interior Greenland pushes the ice away from the shoreline, and the mixing of cold water and air allows some sea ice to be sustained even at the height of summer. According to observations from satellites, 2015 is on track to be another low year for arctic summer sea ice cover. The past ten years have included nine of the lowest ice extents on record. The annual minimum typically occurs in late August or early September. The amount of Arctic sea ice cover has been dropping as global temperatures rise. The Arctic is two to three times more sensitive to temperature changes as the Earth as a whole. Credit: NASA/GSFC/Jeff Schmaltz/MODIS Land Rapid Response Team <b><a href="http://www.nasa.gov/audience/formedia/features/MP_Photo_Guidelines.html" rel="nofollow">NASA image use policy.</a></b> <b><a href="http://www.nasa.gov/centers/goddard/home/index.html" rel="nofollow">NASA Goddard Space Flight Center</a></b> enables NASA’s mission through four scientific endeavors: Earth Science, Heliophysics, Solar System Exploration, and Astrophysics. Goddard plays a leading role in NASA’s accomplishments by contributing compelling scientific knowledge to advance the Agency’s mission. <b>Follow us on <a href="http://twitter.com/NASAGoddardPix" rel="nofollow">Twitter</a></b> <b>Like us on <a href="http://www.facebook.com/pages/Greenbelt-MD/NASA-Goddard/395013845897?ref=tsd" rel="nofollow">Facebook</a></b> <b>Find us on <a href="http://instagrid.me/nasagoddard/?vm=grid" rel="nofollow">Instagram</a></b>
Ice built up on a test article at the at the Icing Research Tunnel as researchers study the icing physics that occur when aircraft fly through freezing weather conditions.
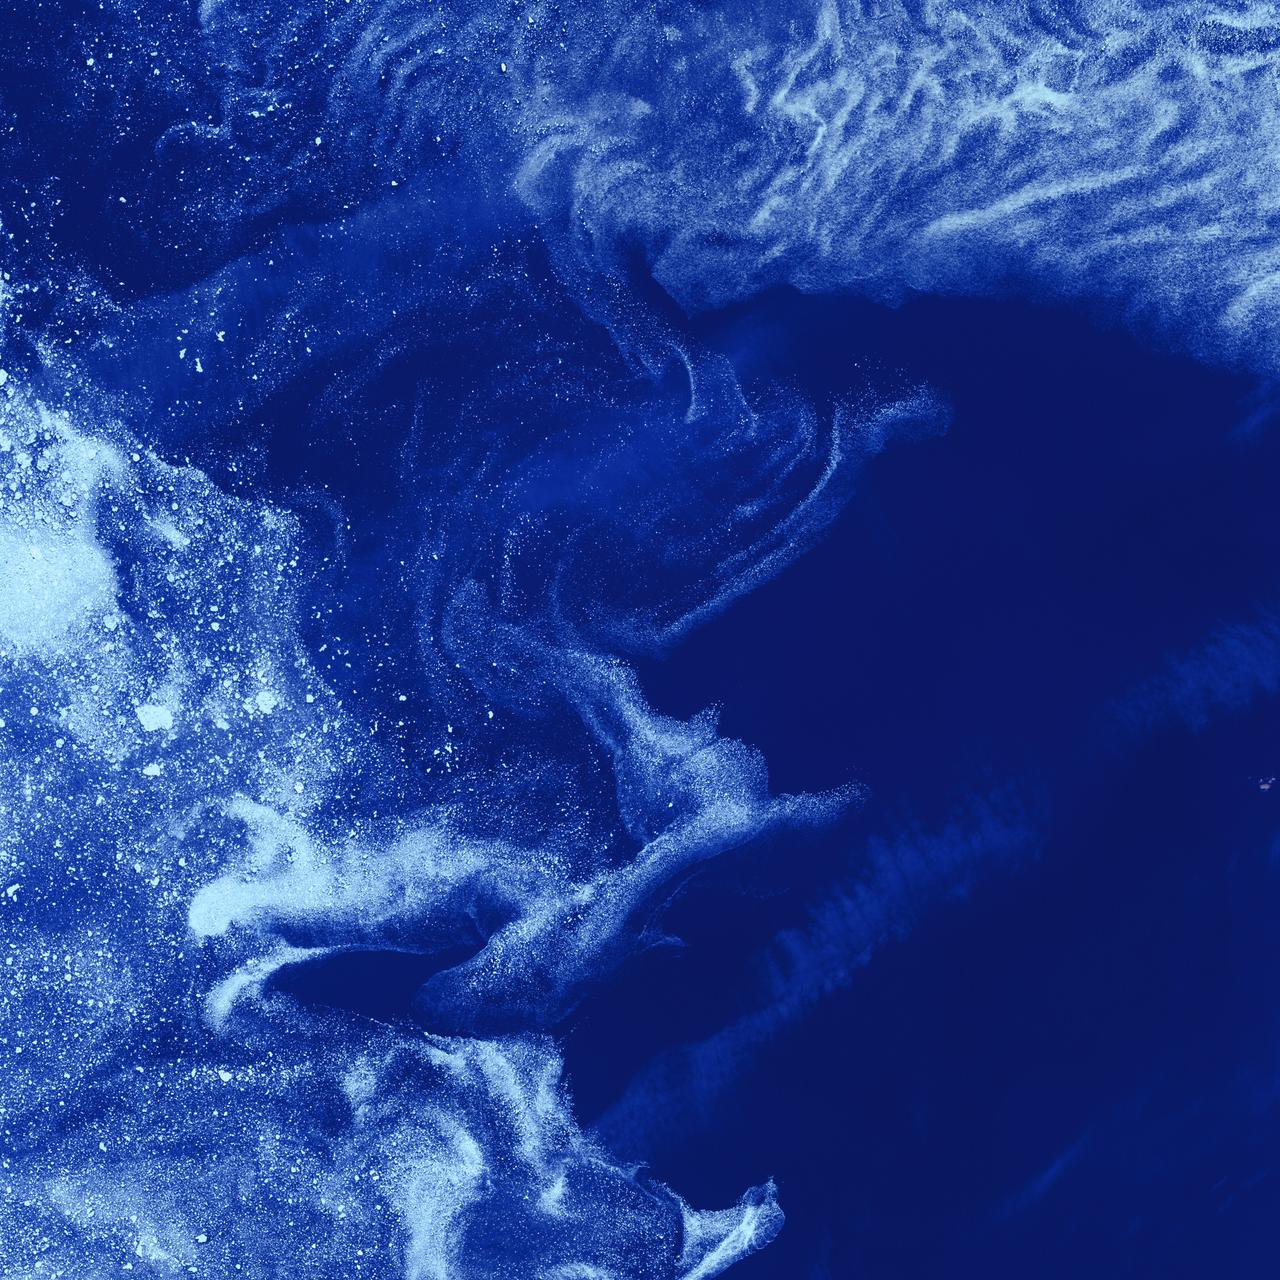
Ice Stars - August 4th, 2002 Description: Like distant galaxies amid clouds of interstellar dust, chunks of sea ice drift through graceful swirls of grease ice in the frigid waters of Foxe Basin near Baffin Island in the Canadian Arctic. Sea ice often begins as grease ice, a soupy slick of tiny ice crystals on the ocean's surface. As the temperature drops, grease ice thickens and coalesces into slabs of more solid ice. Credit: USGS/NASA/Landsat 7 To learn more about the Landsat satellite go to: <a href="http://landsat.gsfc.nasa.gov/" rel="nofollow">landsat.gsfc.nasa.gov/</a> <b><a href="http://www.nasa.gov/centers/goddard/home/index.html" rel="nofollow">NASA Goddard Space Flight Center</a></b> enables NASA’s mission through four scientific endeavors: Earth Science, Heliophysics, Solar System Exploration, and Astrophysics. Goddard plays a leading role in NASA’s accomplishments by contributing compelling scientific knowledge to advance the Agency’s mission. <b>Follow us on <a href="http://twitter.com/NASA_GoddardPix" rel="nofollow">Twitter</a></b> <b>Join us on <a href="http://www.facebook.com/pages/Greenbelt-MD/NASA-Goddard/395013845897?ref=tsd" rel="nofollow">Facebook</a></b>
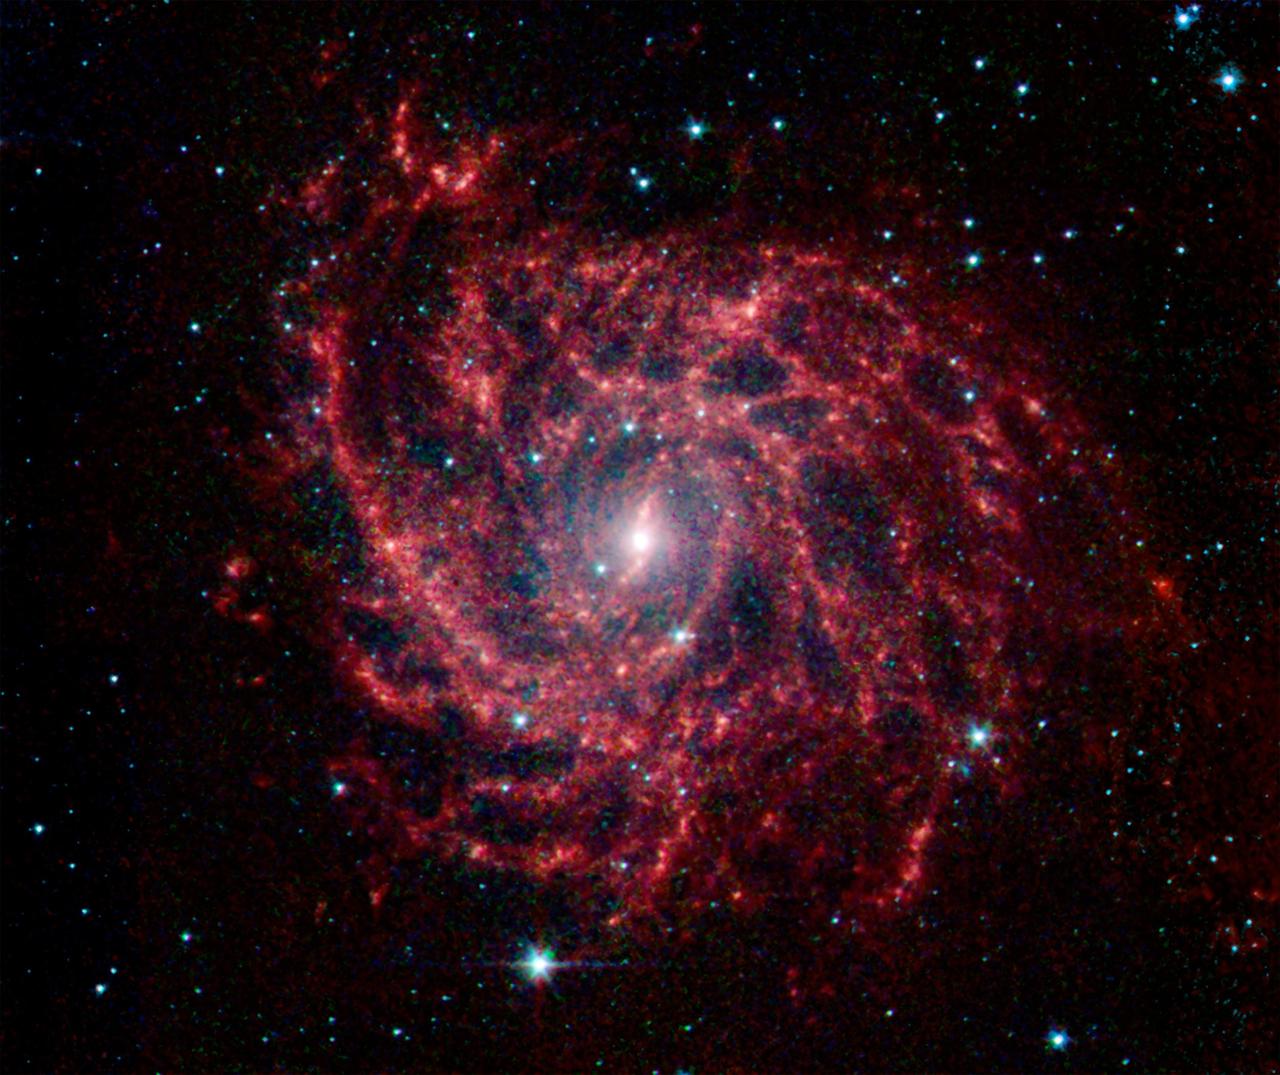
Looking like a spider web swirled into a spiral, galaxy IC 342 presents its delicate pattern of dust in this infrared light image from NASA Spitzer Space Telescope.
This photo, taken onboard the Chilean Navy P3 aircraft, shows the ice front of Venable Ice Shelf, West Antarctica, in October 2008. It is an example of a small-size ice shelf that is a large melt water producer.
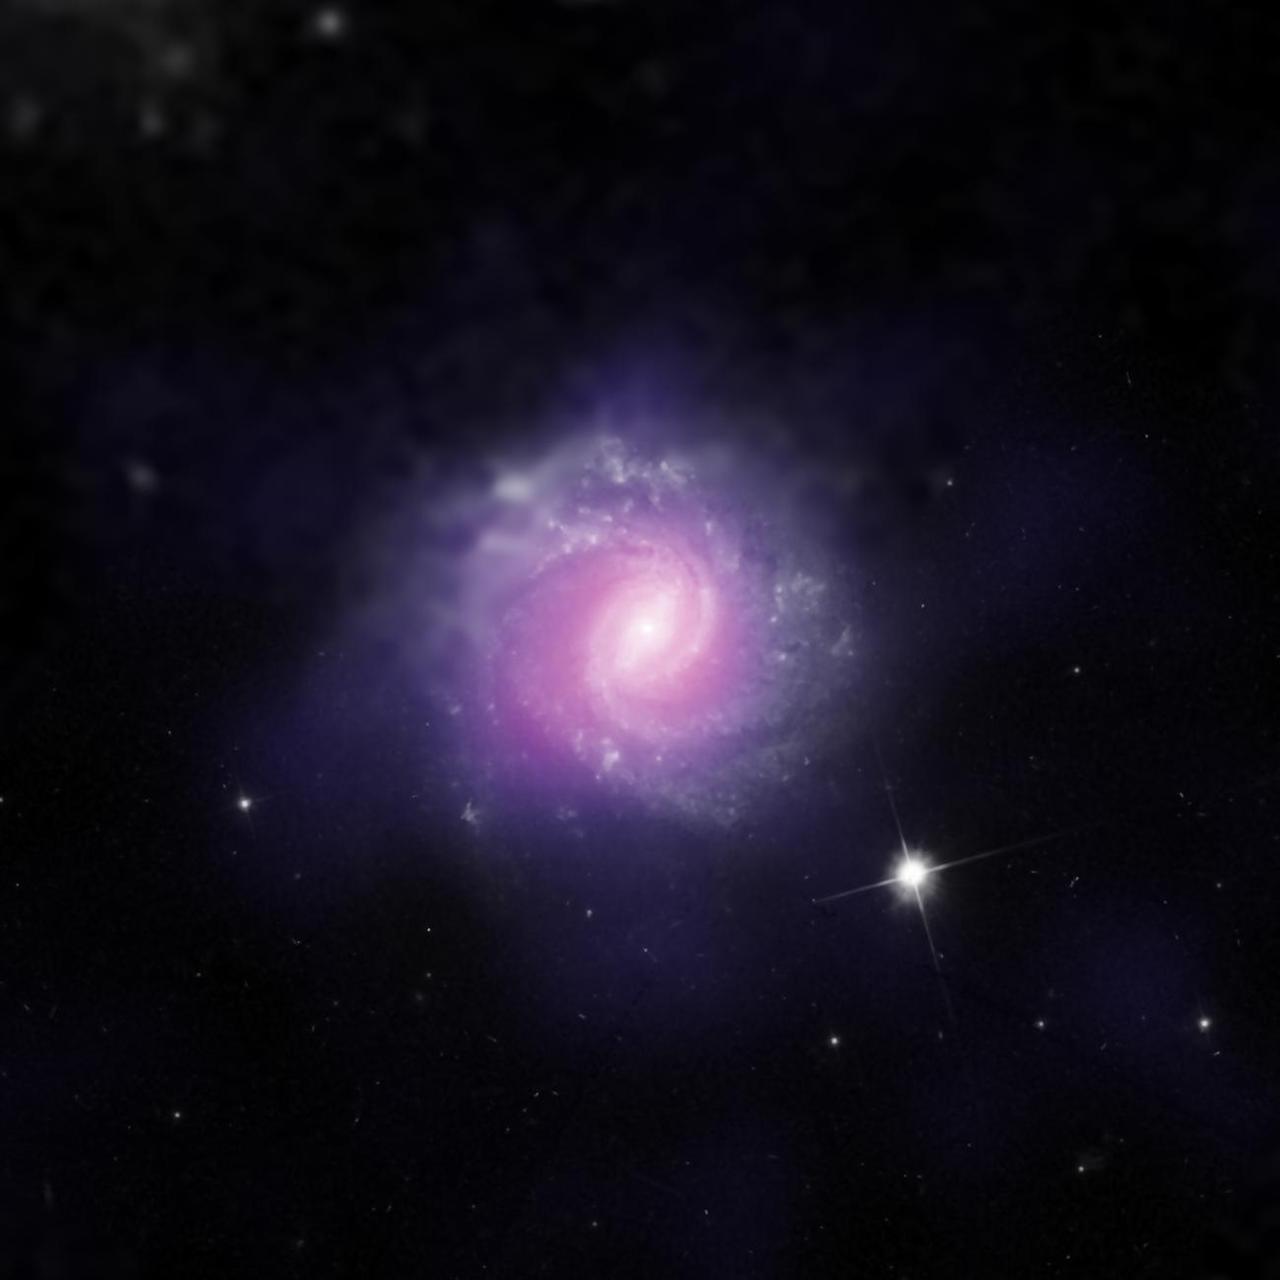
IC 3639, a galaxy with an active galactic nucleus, is seen in this image combining data from the Hubble Space Telescope and the European Southern Observatory. This galaxy contains an example of a supermassive black hole hidden by gas and dust. Researchers analyzed NuSTAR data from this object and compared them with previous observations from NASA's Chandra X-Ray Observatory and the Japanese-led Suzaku satellite. The findings from NuSTAR, which is more sensitive to higher energy X-rays than these observatories, confirm the nature of IC 3639 as an active galactic nucleus that is heavily obscured, and intrinsically much brighter than observed. http://photojournal.jpl.nasa.gov/catalog/PIA21087

Though North America is a full month into astronomical spring, the Great Lakes have been slow to give up on winter. As of April 22, 2014, the Great Lakes were 33.9 percent ice covered. The lake they call Superior dominated the pack. In the early afternoon on April 20, 2014, the Moderate Resolution Imaging Spectroradiometer (MODIS) on NASA’s Aqua satellite captured this natural-color image of Lake Superior, which straddles the United States–Canada border. At the time Aqua passed over, the lake was 63.5 percent ice covered, according to the NOAA Great Lakes Environmental Research Lab (GLERL). Averaged across Lake Superior, ice was 22.6 centimeters (8.9 inches) thick; it was as much as twice that thickness in some locations. GLERL researcher George Leshkevich affirmed that ice cover this spring is significantly above normal. For comparison, Lake Superior had 3.6 percent ice cover on April 20, 2013; in 2012, ice was completely gone by April 12. In the last winter that ice cover grew so thick on Lake Superior (2009), it reached 93.7 percent on March 2 but was down to 6.7 percent by April 21. Average water temperatures on all of the Great Lakes have been rising over the past 30 to 40 years and ice cover has generally been shrinking. (Lake Superior ice was down about 79 percent since the 1970s.) But chilled by persistent polar air masses throughout the 2013-14 winter, ice cover reached 88.4 percent on February 13 and 92.2 percent on March 6, 2014, the second highest level in four decades of record-keeping. Air temperatures in the Great Lakes region were well below normal for March, and the cool pattern is being reinforced along the coasts because the water is absorbing less sunlight and warming less than in typical spring conditions. The graph below, based on data from Environment Canada, shows the 2014 conditions for all of the Great Lakes in mid-April compared to the past 33 years. Lake Superior ice cover got as high as 95.3 percent on March 19. By April 22, it was reported at 59.9 percent; Lake Huron was nearly 30.4 percent. News outlets noted that as many as 70 ships have been backed up in Lakes Michigan, Huron, and Erie, waiting for passage into ports on Lake Superior. The U.S. Coast Guard has been grouping ships together into small convoys after they pass through locks at Sault Ste. Marie, in order to maximize ice-breaking efficiency and to protect ships from damage. Superior is the world’s largest freshwater lake by area (82,100 square kilometers or 31,700 square miles) and the third largest by volume. The waters average 147 meters (483 feet) in depth, and the basin is believed to hold about 10 percent of the world’s liquid fresh water. NASA image courtesy Jeff Schmaltz LANCE/EOSDIS MODIS Rapid Response Team, GSFC. Caption by Mike Carlowicz. Read more: <a href="http://earthobservatory.nasa.gov/IOTD/view.php?id=83541&eocn=home&eoci=iotd_title" rel="nofollow">earthobservatory.nasa.gov/IOTD/view.php?id=83541&eocn...</a> Credit: <b><a href="http://www.earthobservatory.nasa.gov/" rel="nofollow"> NASA Earth Observatory</a></b> <b><a href="http://www.nasa.gov/audience/formedia/features/MP_Photo_Guidelines.html" rel="nofollow">NASA image use policy.</a></b> <b><a href="http://www.nasa.gov/centers/goddard/home/index.html" rel="nofollow">NASA Goddard Space Flight Center</a></b> enables NASA’s mission through four scientific endeavors: Earth Science, Heliophysics, Solar System Exploration, and Astrophysics. Goddard plays a leading role in NASA’s accomplishments by contributing compelling scientific knowledge to advance the Agency’s mission. <b>Follow us on <a href="http://twitter.com/NASAGoddardPix" rel="nofollow">Twitter</a></b> <b>Like us on <a href="http://www.facebook.com/pages/Greenbelt-MD/NASA-Goddard/395013845897?ref=tsd" rel="nofollow">Facebook</a></b> <b>Find us on <a href="http://instagram.com/nasagoddard?vm=grid" rel="nofollow">Instagram</a></b>
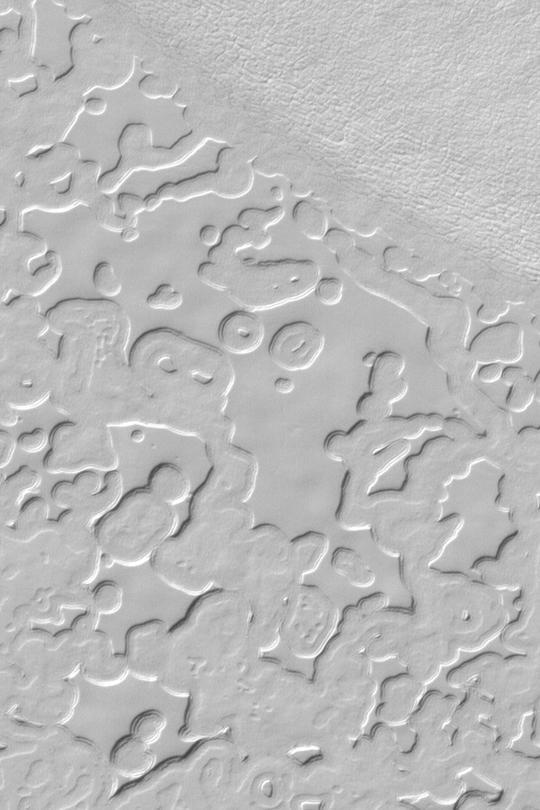
Dry Ice Etches Terrain
Graceful Lanes of Ice
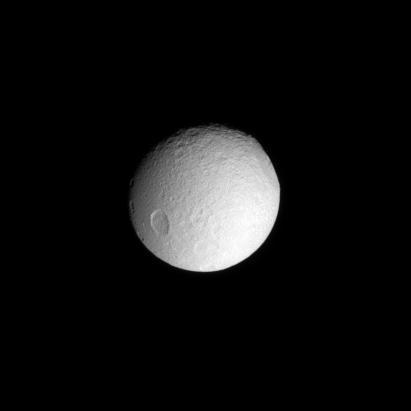
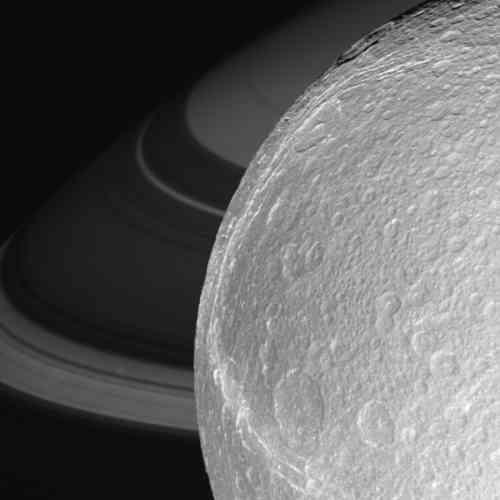
Bright Arc of Ice
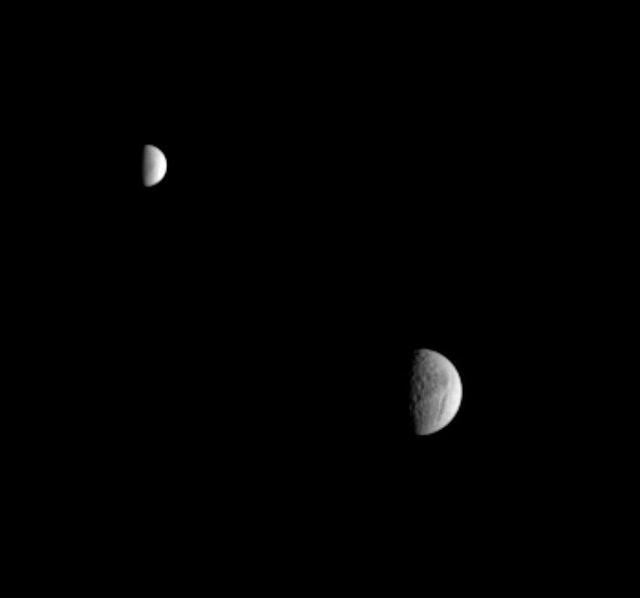
Ice Moon Rendezvous
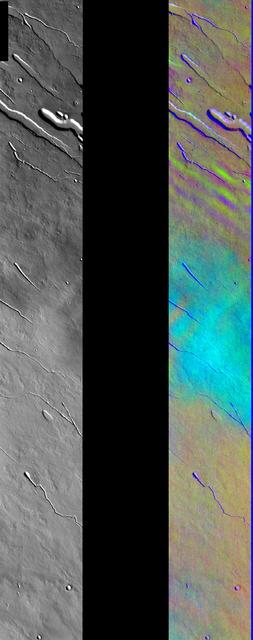
Ice Clouds in Color IR
North Polar Ice
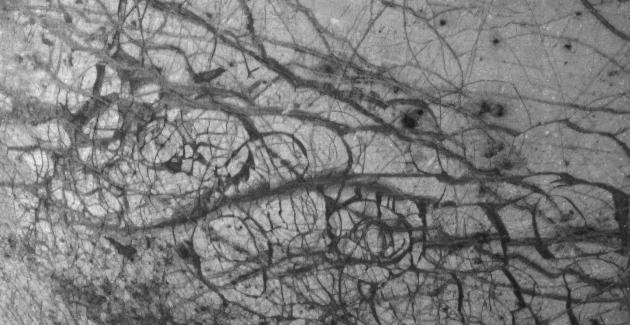
Europa Ice Floes

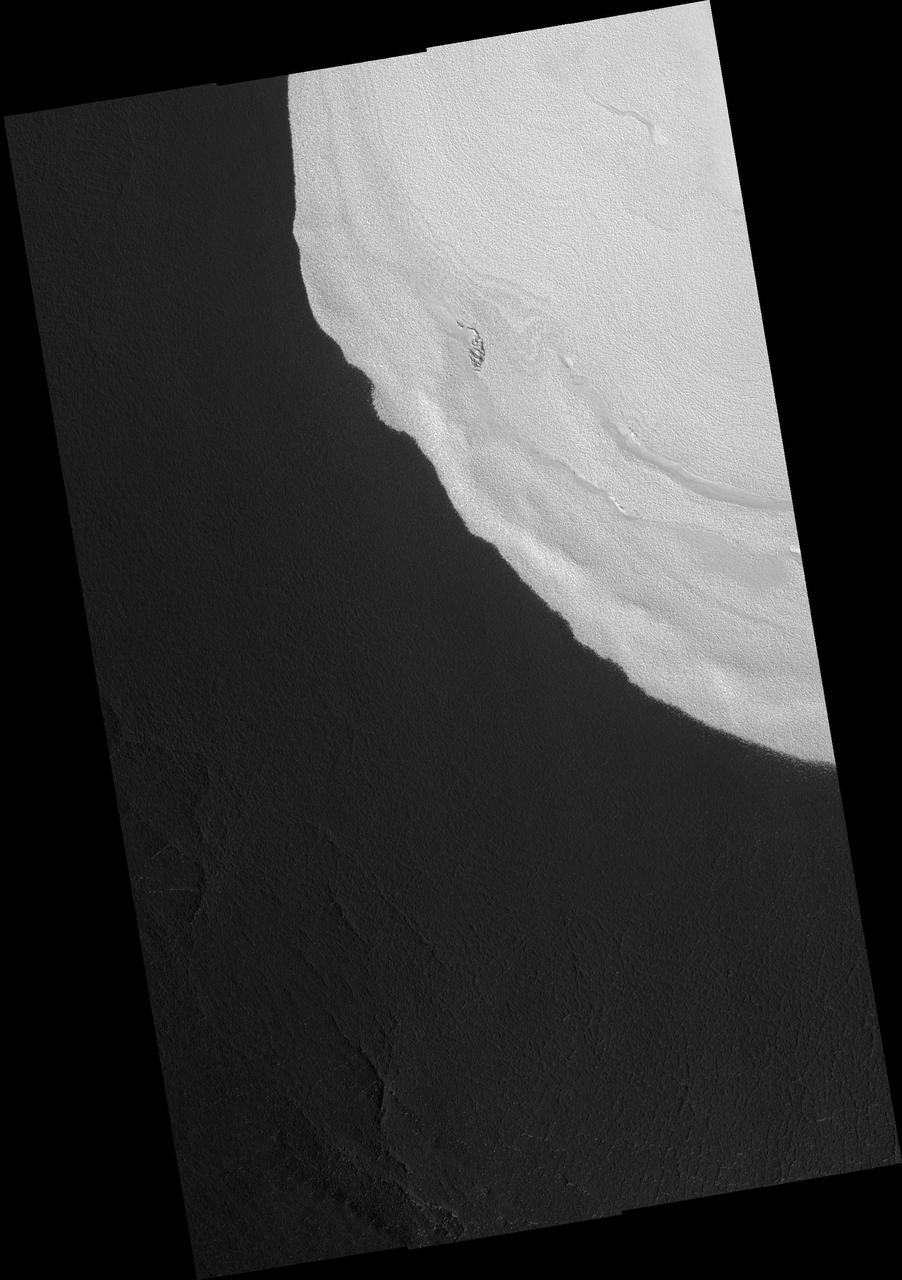
North Polar Ice
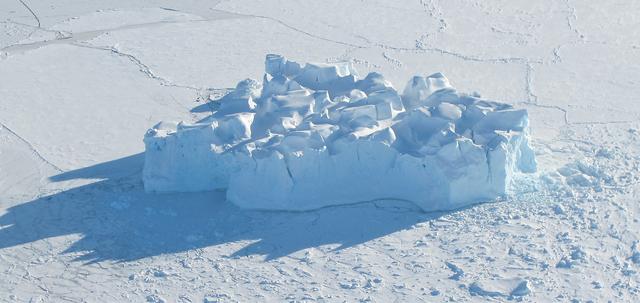
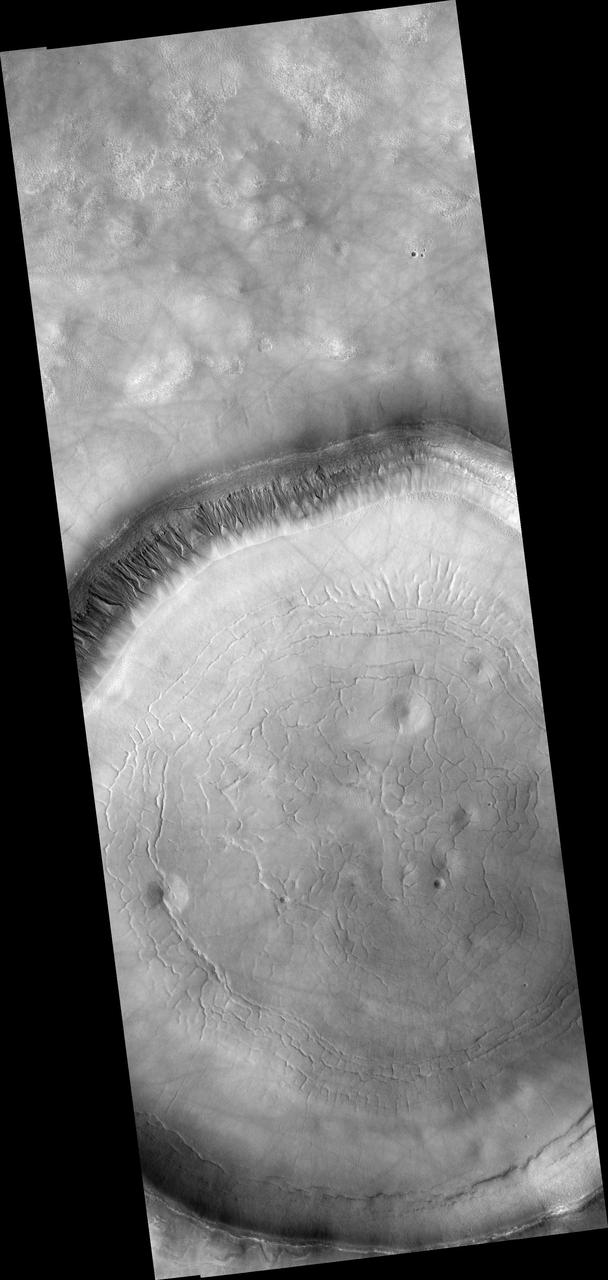
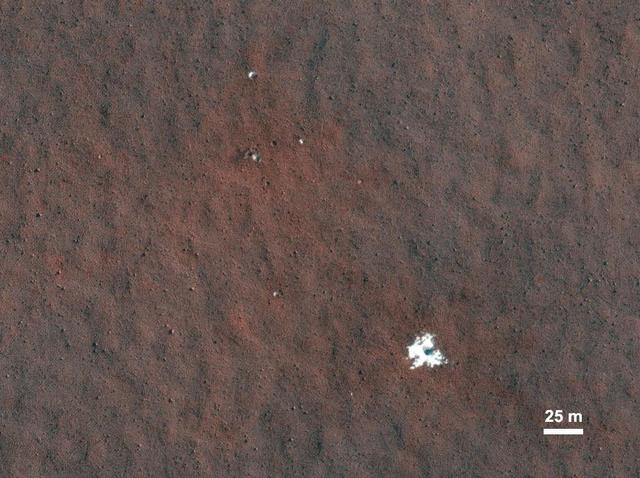
Enigmatic Ice Mound
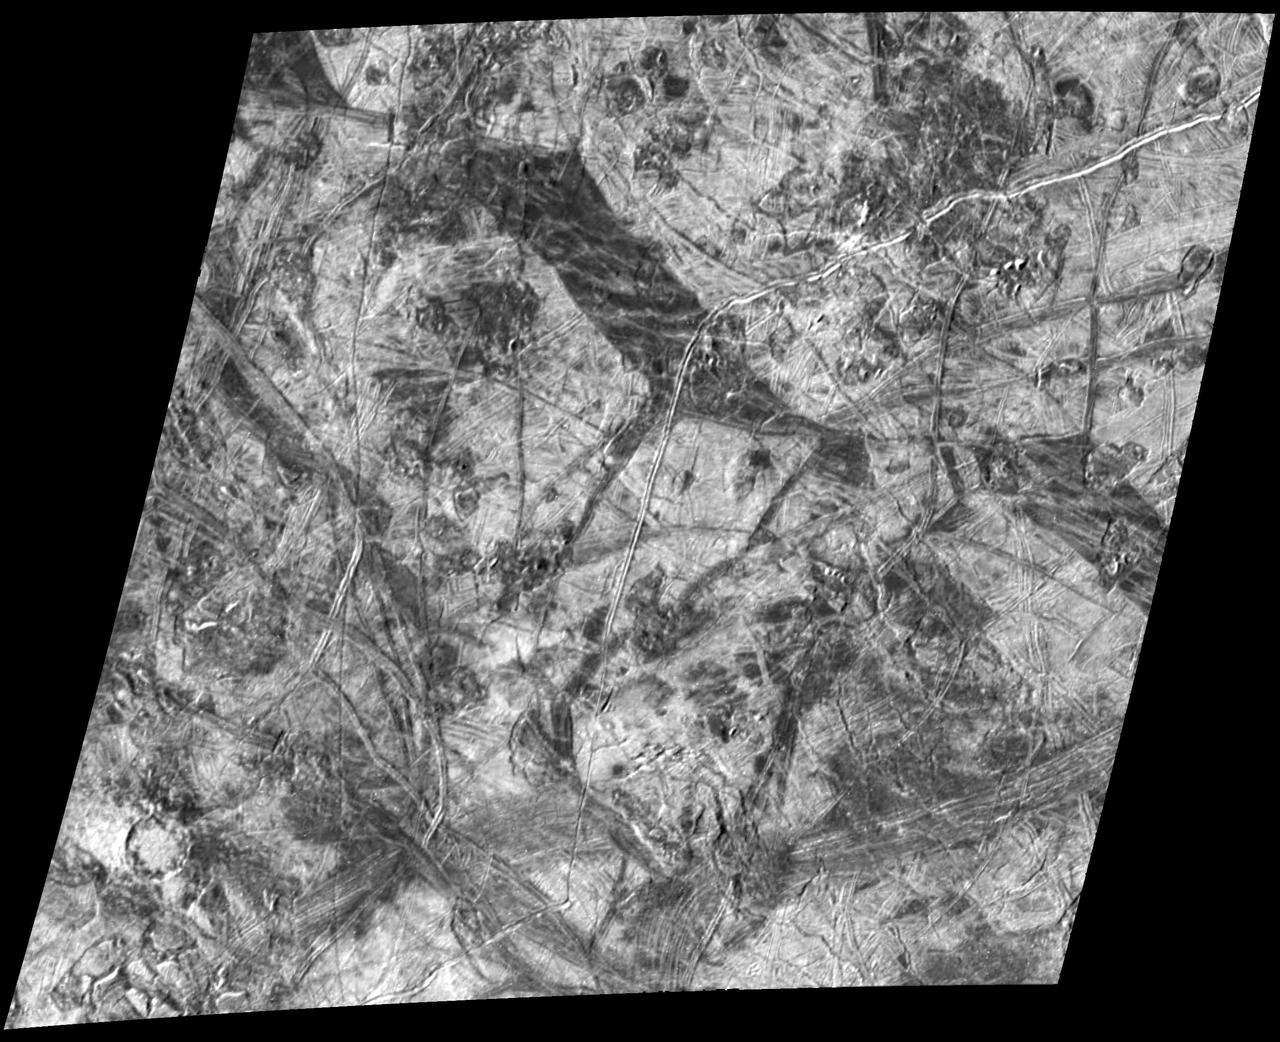
Europa Ice Rafts
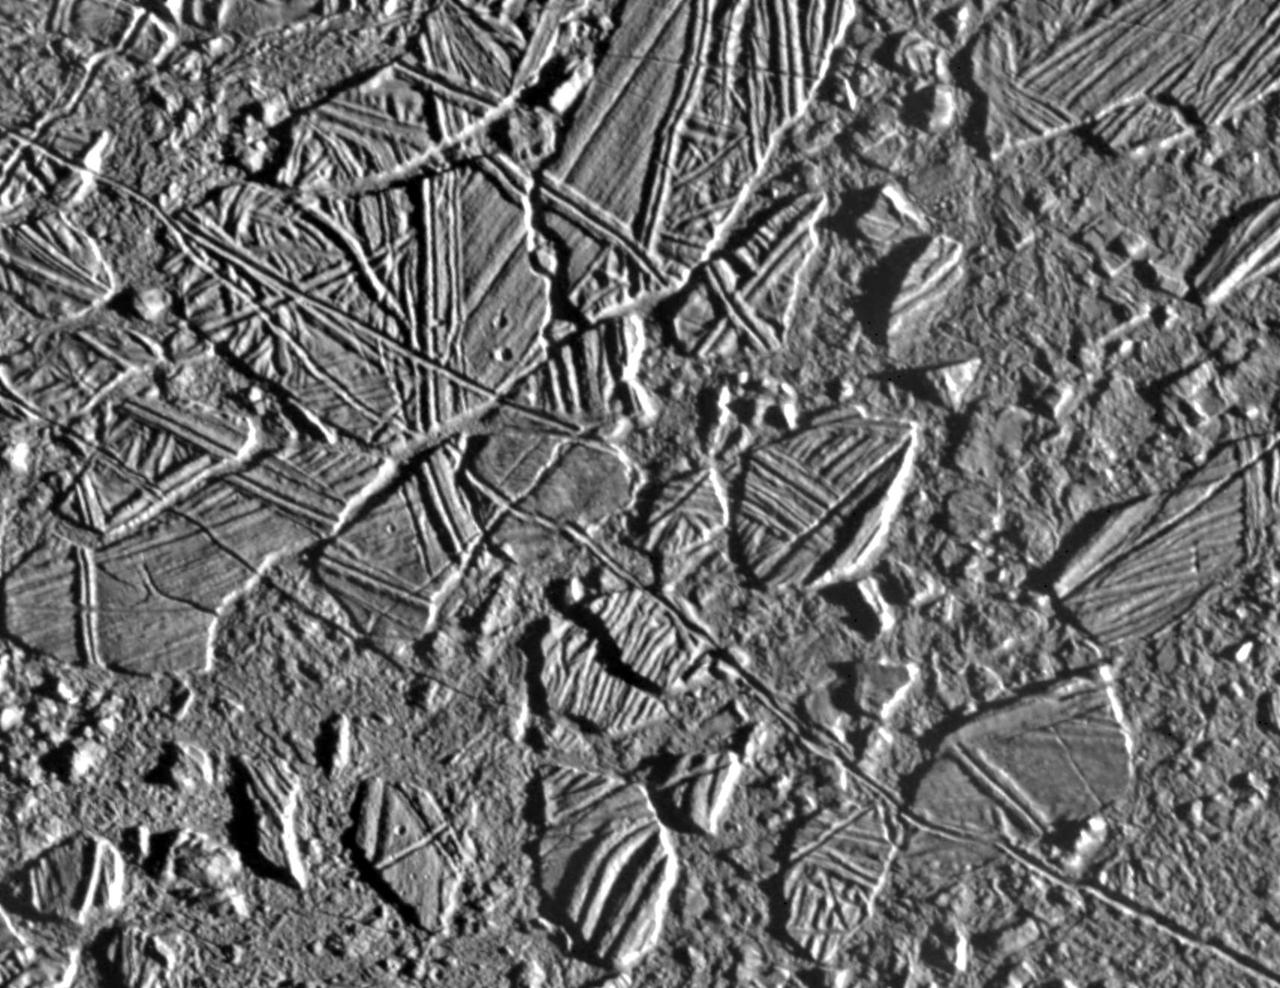
Europa - Ice Rafting View
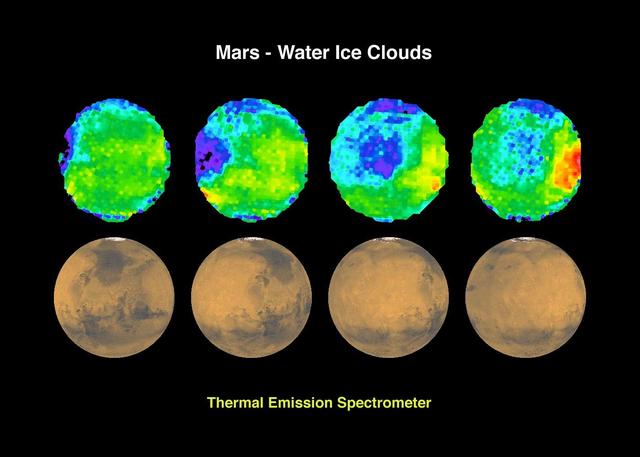
Mars - Water Ice Clouds
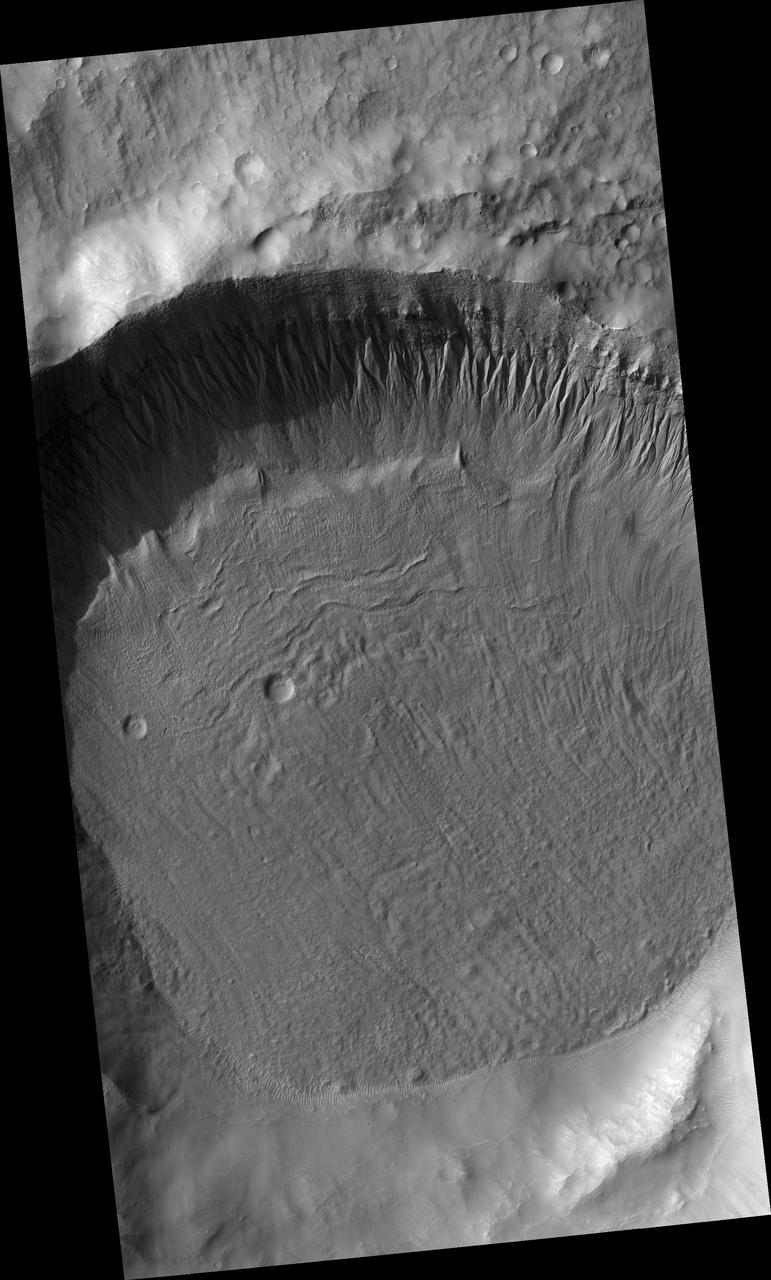
Gullies and Ice-rich Material
Water Ice and Methane Springs
Modeling Ice Stability
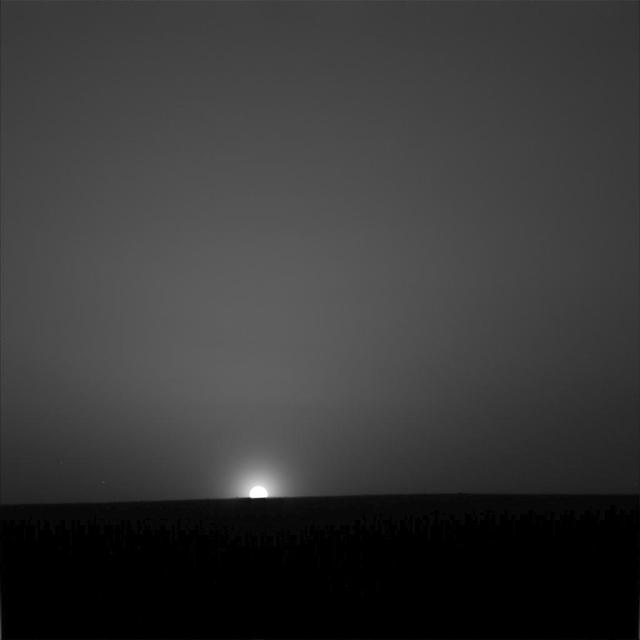
Ice Cold Sunrise on Mars
Mars Ice Age, Simulated

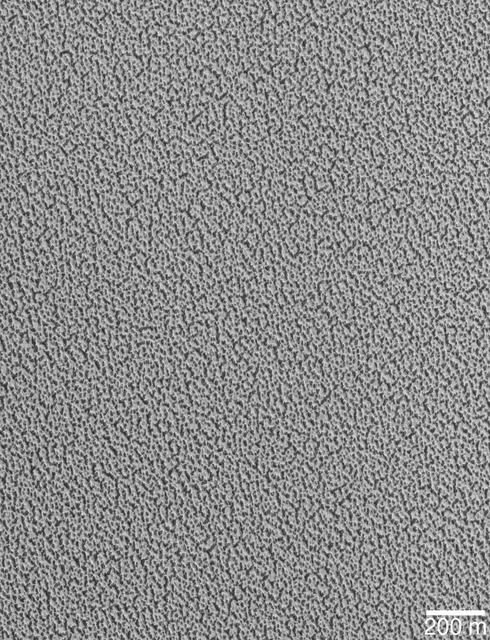
Ice Spread Thin

Narrow Ice Lanes

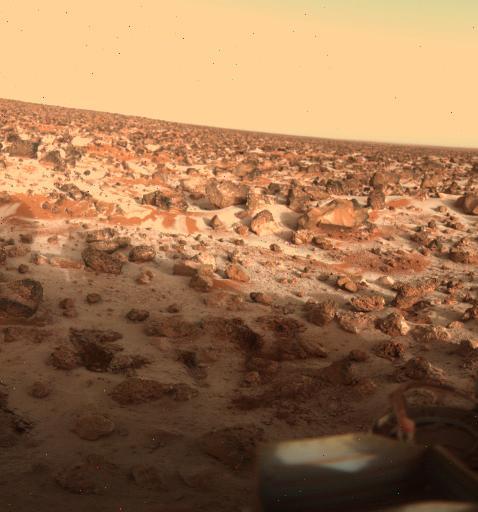
Ice on Mars -- Now it Gone
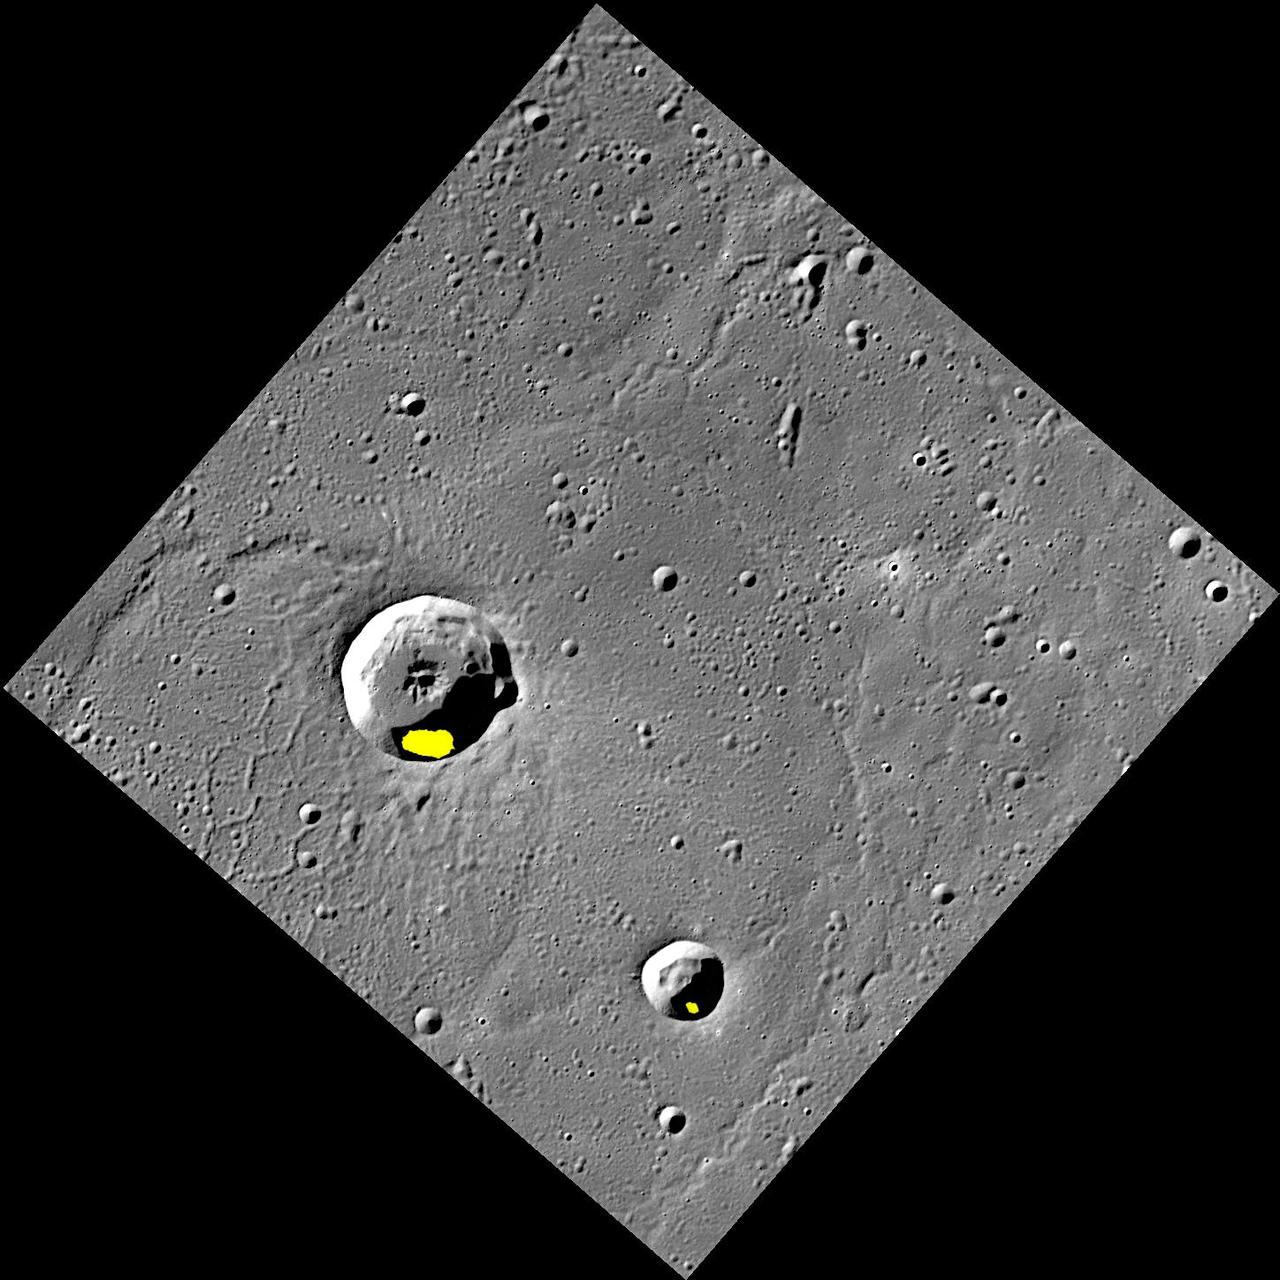
Ice in Egonu and Monk
Craters Modified by Ice
South Polar Ice Cap
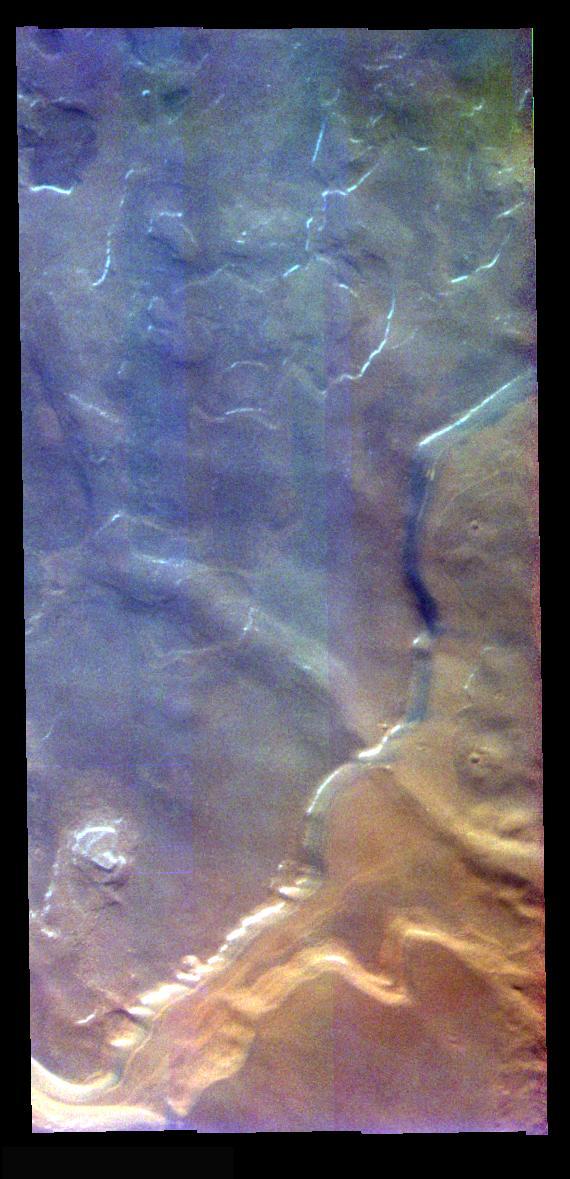
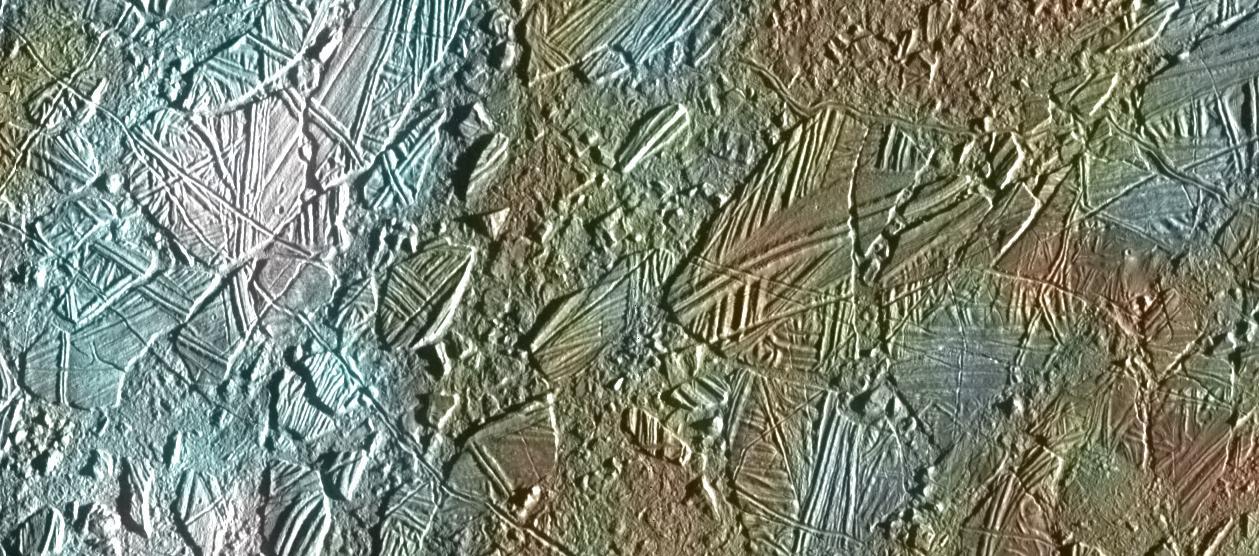
Ice Surfaces In False Color
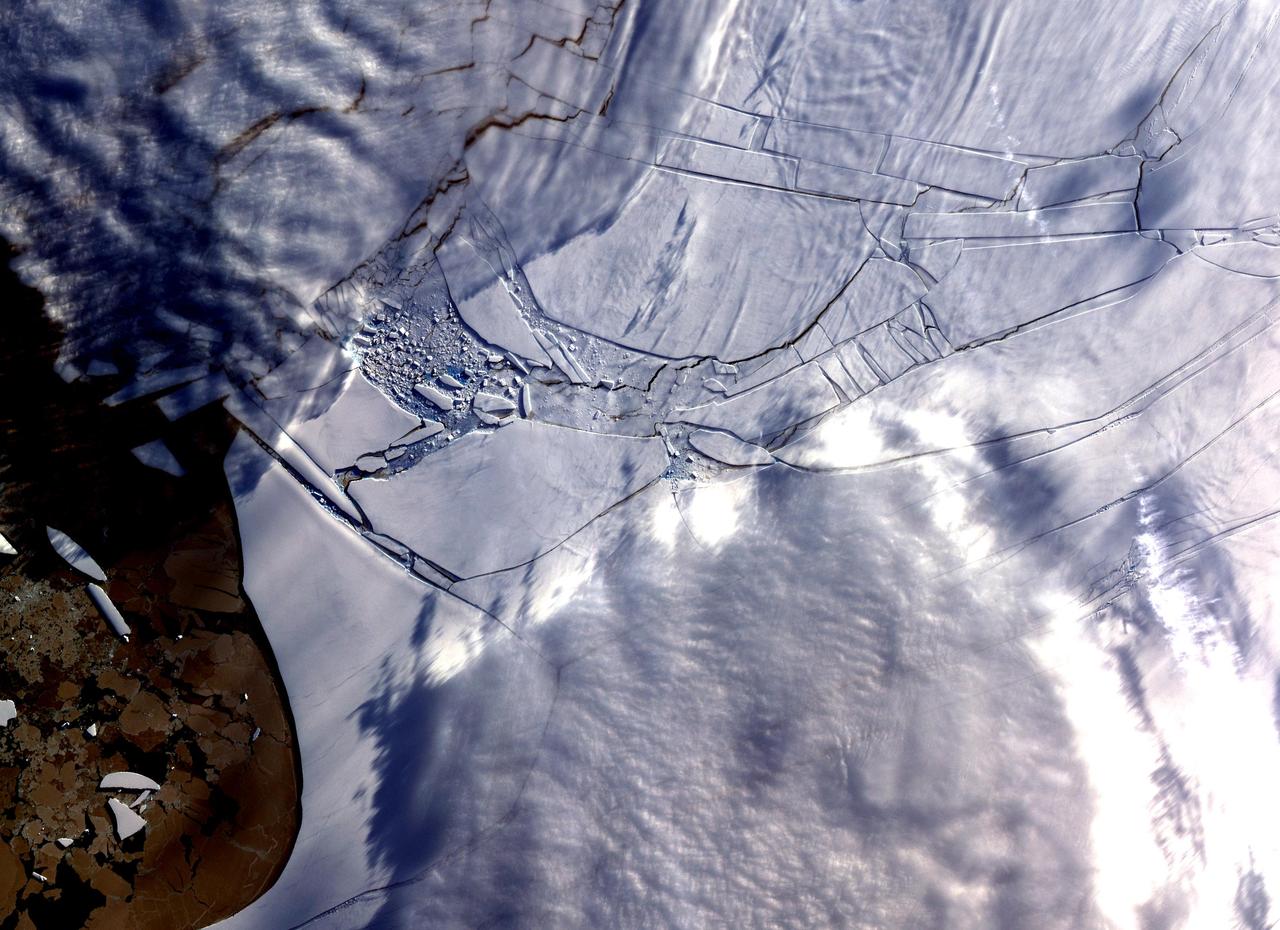
An area of broken glacier ice seen from the IceBridge DC-8 on Oct. 22, 2012. Credit: NASA / George Hale NASA's Operation IceBridge is an airborne science mission to study Earth's polar ice. For more information about IceBridge, visit: <a href="http://www.nasa.gov/icebridge" rel="nofollow">www.nasa.gov/icebridge</a> <b><a href="http://www.nasa.gov/audience/formedia/features/MP_Photo_Guidelines.html" rel="nofollow">NASA image use policy.</a></b> <b><a href="http://www.nasa.gov/centers/goddard/home/index.html" rel="nofollow">NASA Goddard Space Flight Center</a></b> enables NASA’s mission through four scientific endeavors: Earth Science, Heliophysics, Solar System Exploration, and Astrophysics. Goddard plays a leading role in NASA’s accomplishments by contributing compelling scientific knowledge to advance the Agency’s mission. <b>Follow us on <a href="http://twitter.com/NASA_GoddardPix" rel="nofollow">Twitter</a></b> <b>Like us on <a href="http://www.facebook.com/pages/Greenbelt-MD/NASA-Goddard/395013845897?ref=tsd" rel="nofollow">Facebook</a></b> <b>Find us on <a href="http://instagrid.me/nasagoddard/?vm=grid" rel="nofollow">Instagram</a></b>

On February 4, 2014 the Moderate Resolution Imaging Spectroradiometer (MODIS) flying aboard NASA’s Aqua satellite captured a true-color image of sea ice off of western Alaska. In this true-color image, the snow and ice covered land appears bright white while the floating sea ice appears a duller grayish-white. Snow over the land is drier, and reflects more light back to the instrument, accounting for the very bright color. Ice overlying oceans contains more water, and increasing water decreases reflectivity of ice, resulting in duller colors. Thinner ice is also duller. The ocean waters are tinted with green, likely due to a combination of sediment and phytoplankton. Alaska lies to the east in this image, and Russia to the west. The Bering Strait, covered with ice, lies between to two. South of the Bering Strait, the waters are known as the Bering Sea. To the north lies the Chukchi Sea. The bright white island south of the Bering Strait is St. Lawrence Island. Home to just over 1200 people, the windswept island belongs to the United States, but sits closer to Russia than to Alaska. To the southeast of the island a dark area, loosely covered with floating sea ice, marks a persistent polynya – an area of open water surrounded by more frozen sea ice. Due to the prevailing winds, which blow the sea ice away from the coast in this location, the area rarely completely freezes. The ice-covered areas in this image, as well as the Beaufort Sea, to the north, are critical areas for the survival of the ringed seal, a threatened species. The seals use the sea ice, including ice caves, to rear their young, and use the free-floating sea ice for molting, raising the young and breeding. In December 2014, the National Oceanic and Atmospheric Administration (NOAA) proposed that much of this region be set aside as critical, protected habitat for the ringed seal. Credit: NASA/GSFC/Jeff Schmaltz/MODIS Land Rapid Response Team <b><a href="http://www.nasa.gov/audience/formedia/features/MP_Photo_Guidelines.html" rel="nofollow">NASA image use policy.</a></b> <b><a href="http://www.nasa.gov/centers/goddard/home/index.html" rel="nofollow">NASA Goddard Space Flight Center</a></b> enables NASA’s mission through four scientific endeavors: Earth Science, Heliophysics, Solar System Exploration, and Astrophysics. Goddard plays a leading role in NASA’s accomplishments by contributing compelling scientific knowledge to advance the Agency’s mission. <b>Follow us on <a href="http://twitter.com/NASAGoddardPix" rel="nofollow">Twitter</a></b> <b>Like us on <a href="http://www.facebook.com/pages/Greenbelt-MD/NASA-Goddard/395013845897?ref=tsd" rel="nofollow">Facebook</a></b> <b>Find us on <a href="http://instagram.com/nasagoddard?vm=grid" rel="nofollow">Instagram</a></b>
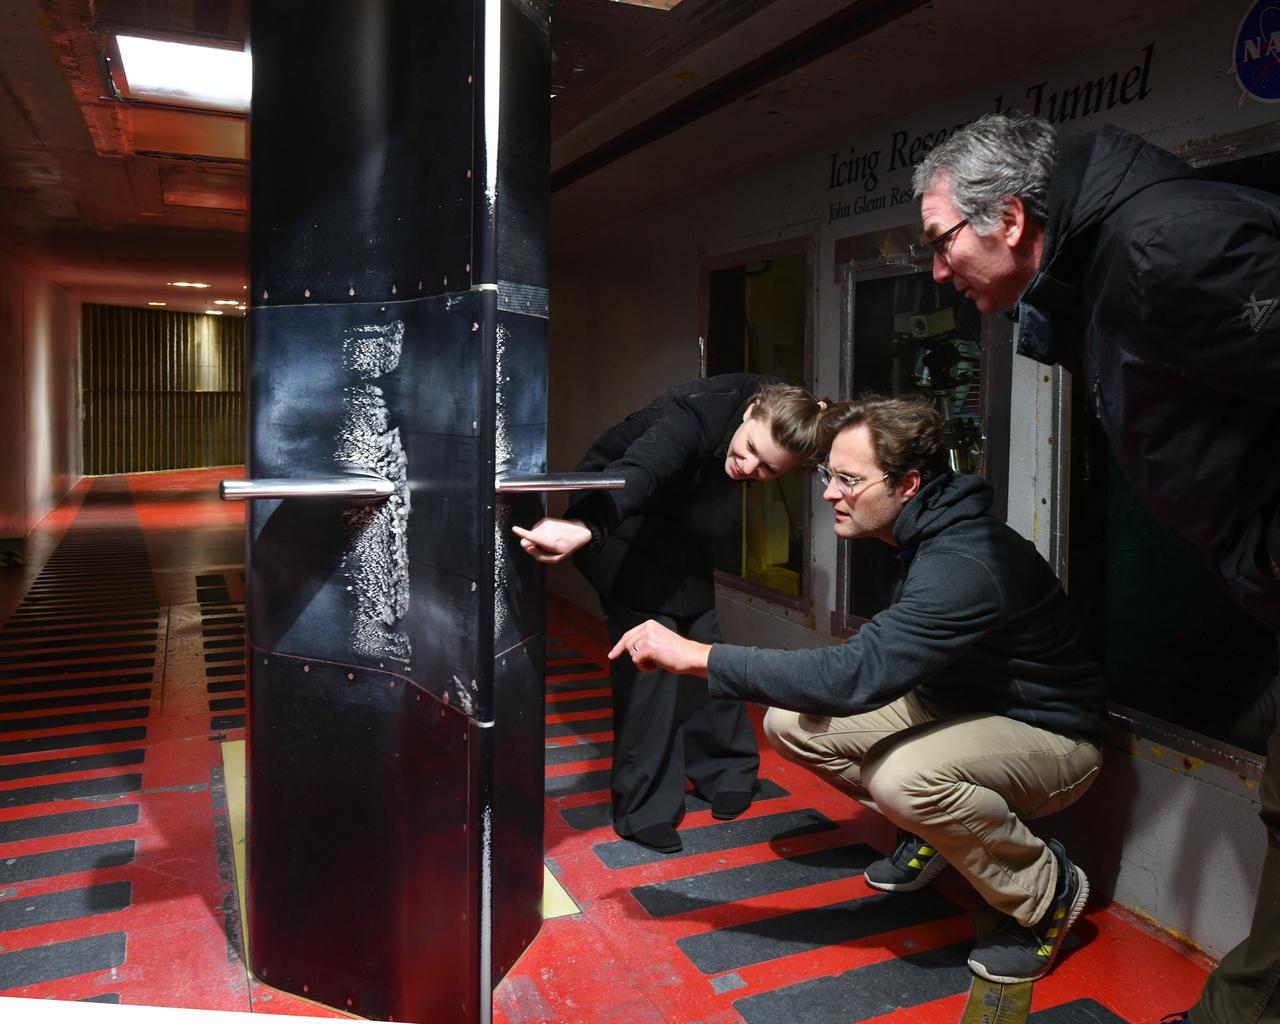
Pictured is a model to study the ice collection on struts in jet engines during flight. Researchers inspect the ice after the model encounters a simulated icing cloud during testing. Super cooled water created from the icing cloud that flows though the wind tunnel. The super cooled water forms ice on contact with the test model. Researchers then inspect the ice formation before laser scanning of the ice formation for further research and analysis.

Looking like a spider web swirled into a spiral, galaxy IC 342 presents its delicate pattern of dust in this infrared light image from NASA Spitzer Space Telescope. The very center glows especially brightly in the infrared.
NASA image acquired August 17, 2010 In mid-August 2010, the Northwest Passage was almost—but not quite—free of ice. The ice content in the northern route through the passage (through the Western Parry Channel) was very light, but ice remained in McClure (or M’Clure) Strait. The Moderate Resolution Imaging Spectroradiometer (MODIS) on NASA’s Terra satellite captured this natural-color image on August 17, 2010. Although most of McClure Strait looks perfectly ice-free, immediately west of Prince Patrick Island, a band of sea ice stretches southward across the strait (left edge of the image). The National Snow and Ice Data Center Sea Ice News and Analysis blog reported that even more ice remained in the southern route (through Amundsen’s Passage) of the Northwest Passage in mid-August 2010. Nevertheless, the ice content in the northern route was not only well below the 1968–2000 average, but also nearly a month ahead of the clearing observed in 2007, when Arctic sea ice set a record low. As of mid-August 2010, however, overall sea ice extent was higher than it had been at the same time of year in 2007. Credit: NASA/GSFC/Jeff Schmaltz/MODIS Land Rapid Response Team Caption by Michon Scott. To learn more go to: <a href="http://earthobservatory.nasa.gov/NaturalHazards/view.php?id=45333" rel="nofollow">earthobservatory.nasa.gov/NaturalHazards/view.php?id=45333</a> Instrument: Terra - MODIS <b><a href="http://www.nasa.gov/centers/goddard/home/index.html" rel="nofollow">NASA Goddard Space Flight Center</a></b> is home to the nation's largest organization of combined scientists, engineers and technologists that build spacecraft, instruments and new technology to study the Earth, the sun, our solar system, and the universe. <b>Follow us on <a href="http://twitter.com/NASA_GoddardPix" rel="nofollow">Twitter</a></b> <b>Join us on <a href="http://www.facebook.com/pages/Greenbelt-MD/NASA-Goddard/395013845897?ref=tsd" rel="nofollow">Facebook</a><b> Click here to see more images from <b><a href="#//earthobservatory.nasa.gov/" rel="nofollow"> NASA Goddard’s Earth Observatory</a></b></b></b>
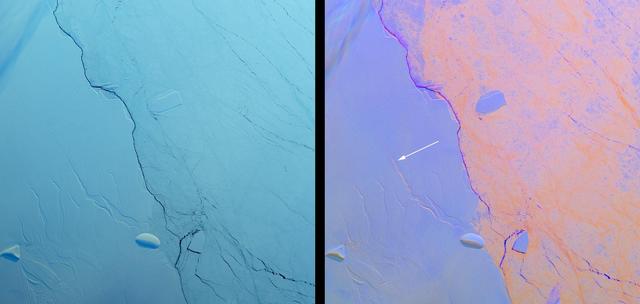
Project MIDAS, a United Kingdom-based group that studies the Larsen Ice Shelf in Antarctica, reported Aug. 18, 2016, that a large crack in the Larsen C shelf has grown by another 13 miles (22 kilometers) in the past six months. The crack is now more than 80 miles (130 kilometers) long. Larsen C is the fourth largest ice shelf in Antarctica, with an area of about 19,300 square miles (50,000 square kilometers), greater than the size of Maryland. Computer modeling by Project MIDAS predicts that the crack will continue to grow and eventually cause between nine and twelve percent of the ice shelf to collapse, resulting in the loss of 2,300 square miles (6,000 square kilometers) of ice -- more than the area of Delaware. This follows the collapse of the Larsen B shelf in 2002 and the Larsen A shelf in 1995, which removed about 1,255 square miles (3,250 square kilometers) and 580 square miles (1,500 square kilometers) of ice, respectively. The Multiangle Imaging SpectroRadiometer (MISR) instrument aboard NASA's Terra satellite flew over Larsen C on Aug. 22, 2016. The MISR instrument views Earth with nine cameras pointed at different angles, which provides information about the texture of the surface. On the left is a natural-color image of the shelf from MISR's vertical-viewing camera. Antarctica is slowly emerging from its polar night, and the low light gives the scene a bluish tint. The Larsen C shelf is on the left, while thinner sea ice is present on the right. A variety of cracks are visible in the Larsen C shelf, all appearing roughly the same. The image is about 130 by 135 miles (210 by 220 kilometers) in size. On the right is a composite image made by combining data from MISR's 46-degree backward-pointing camera (plotted as blue), the vertical-pointing camera (plotted as green), and the 46-degree forward-pointing camera (plotted as red). This has the effect of highlighting surface roughness; smooth surfaces appear as blue-purple, while rough surfaces appear as orange. Clouds near the upper left appear multi-hued because their elevation above the surface causes the different angular views to be slightly displaced. In this composite, the difference between the rough sea ice and the smoother ice shelf is immediately apparent. An examination of the cracks in the ice shelf shows that the large crack Project MIDAS is tracking (indicated by an arrow) is orange in color, demonstrating that it is actively growing. These data were acquired during Terra orbit 88717 http://photojournal.jpl.nasa.gov/catalog/PIA20894
Sunlight reflecting off of ice in the Bellingshausen Sea on Oct. 19, 2012. Credit: NASA / George Hale NASA's Operation IceBridge is an airborne science mission to study Earth's polar ice. For more information about IceBridge, visit: <a href="http://www.nasa.gov/icebridge" rel="nofollow">www.nasa.gov/icebridge</a> <b><a href="http://www.nasa.gov/audience/formedia/features/MP_Photo_Guidelines.html" rel="nofollow">NASA image use policy.</a></b> <b><a href="http://www.nasa.gov/centers/goddard/home/index.html" rel="nofollow">NASA Goddard Space Flight Center</a></b> enables NASA’s mission through four scientific endeavors: Earth Science, Heliophysics, Solar System Exploration, and Astrophysics. Goddard plays a leading role in NASA’s accomplishments by contributing compelling scientific knowledge to advance the Agency’s mission. <b>Follow us on <a href="http://twitter.com/NASA_GoddardPix" rel="nofollow">Twitter</a></b> <b>Like us on <a href="http://www.facebook.com/pages/Greenbelt-MD/NASA-Goddard/395013845897?ref=tsd" rel="nofollow">Facebook</a></b> <b>Find us on <a href="http://instagrid.me/nasagoddard/?vm=grid" rel="nofollow">Instagram</a></b>
Iceberg embedded in sea ice with a lead on one side. This opening was likely caused by winds blowing against the side of the iceberg. Credit: NASA / George Hale NASA's Operation IceBridge is an airborne science mission to study Earth's polar ice. For more information about IceBridge, visit: <a href="http://www.nasa.gov/icebridge" rel="nofollow">www.nasa.gov/icebridge</a> <b><a href="http://www.nasa.gov/audience/formedia/features/MP_Photo_Guidelines.html" rel="nofollow">NASA image use policy.</a></b> <b><a href="http://www.nasa.gov/centers/goddard/home/index.html" rel="nofollow">NASA Goddard Space Flight Center</a></b> enables NASA’s mission through four scientific endeavors: Earth Science, Heliophysics, Solar System Exploration, and Astrophysics. Goddard plays a leading role in NASA’s accomplishments by contributing compelling scientific knowledge to advance the Agency’s mission. <b>Follow us on <a href="http://twitter.com/NASA_GoddardPix" rel="nofollow">Twitter</a></b> <b>Like us on <a href="http://www.facebook.com/pages/Greenbelt-MD/NASA-Goddard/395013845897?ref=tsd" rel="nofollow">Facebook</a></b> <b>Find us on <a href="http://instagrid.me/nasagoddard/?vm=grid" rel="nofollow">Instagram</a></b>

Edge of an ice shelf in Adelaide Island, off the Antarctic Peninsula. Credit: NASA / Maria-Jose Vinas NASA's Operation IceBridge is an airborne science mission to study Earth's polar ice. For more information about IceBridge, visit: <a href="http://www.nasa.gov/icebridge" rel="nofollow">www.nasa.gov/icebridge</a> <b><a href="http://www.nasa.gov/audience/formedia/features/MP_Photo_Guidelines.html" rel="nofollow">NASA image use policy.</a></b> <b><a href="http://www.nasa.gov/centers/goddard/home/index.html" rel="nofollow">NASA Goddard Space Flight Center</a></b> enables NASA’s mission through four scientific endeavors: Earth Science, Heliophysics, Solar System Exploration, and Astrophysics. Goddard plays a leading role in NASA’s accomplishments by contributing compelling scientific knowledge to advance the Agency’s mission. <b>Follow us on <a href="http://twitter.com/NASA_GoddardPix" rel="nofollow">Twitter</a></b> <b>Like us on <a href="http://www.facebook.com/pages/Greenbelt-MD/NASA-Goddard/395013845897?ref=tsd" rel="nofollow">Facebook</a></b> <b>Find us on <a href="http://instagrid.me/nasagoddard/?vm=grid" rel="nofollow">Instagram</a></b>
An iceberg embedded in sea ice as seen from the IceBridge DC-8 over the Bellingshausen Sea on Oct. 19, 2012. Credit: NASA / James Yungel NASA's Operation IceBridge is an airborne science mission to study Earth's polar ice. For more information about IceBridge, visit: <a href="http://www.nasa.gov/icebridge" rel="nofollow">www.nasa.gov/icebridge</a> <b><a href="http://www.nasa.gov/audience/formedia/features/MP_Photo_Guidelines.html" rel="nofollow">NASA image use policy.</a></b> <b><a href="http://www.nasa.gov/centers/goddard/home/index.html" rel="nofollow">NASA Goddard Space Flight Center</a></b> enables NASA’s mission through four scientific endeavors: Earth Science, Heliophysics, Solar System Exploration, and Astrophysics. Goddard plays a leading role in NASA’s accomplishments by contributing compelling scientific knowledge to advance the Agency’s mission. <b>Follow us on <a href="http://twitter.com/NASA_GoddardPix" rel="nofollow">Twitter</a></b> <b>Like us on <a href="http://www.facebook.com/pages/Greenbelt-MD/NASA-Goddard/395013845897?ref=tsd" rel="nofollow">Facebook</a></b> <b>Find us on <a href="http://instagrid.me/nasagoddard/?vm=grid" rel="nofollow">Instagram</a></b>

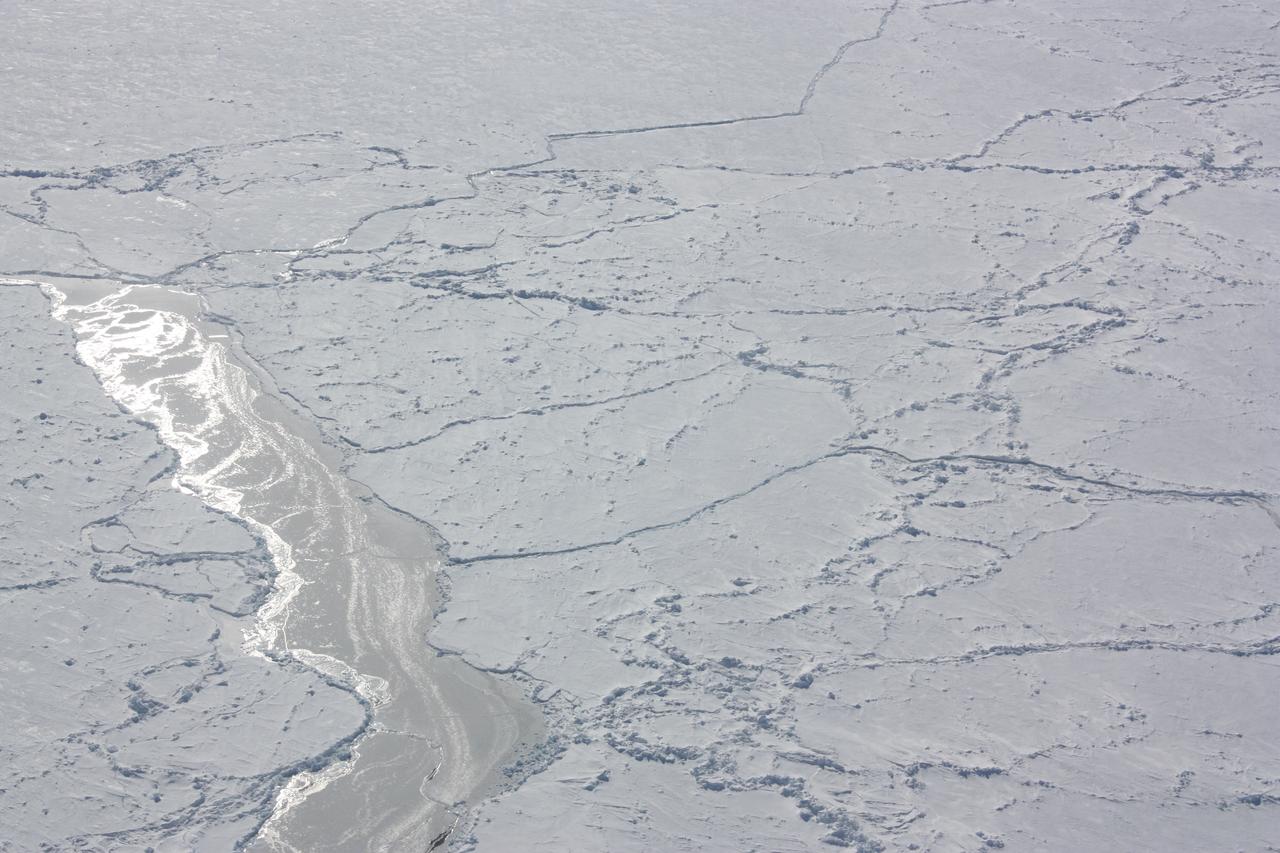
The Visible Infrared Imaging Radiometer Suite (VIIRS) on the Suomi NPP satellite captured this view of extensive sea-ice fracturing off the northern coast of Alaska. The event began in late-January and spread west toward Banks Island throughout February and March 2013. Visualizations of the Arctic often give the impression that the ice cap is a continuous sheet of stationary, floating ice. In fact, it is a collection of smaller pieces that constantly shift, crack, and grind against one another as they are jostled by winds and ocean currents. Especially during the summer—but even during the height of winter—cracks—or leads—open up between pieces of ice. That was what was happening on the left side of the animation (seen here: <a href="http://bit.ly/10kE7sh" rel="nofollow">bit.ly/10kE7sh</a>) in late January. A high-pressure weather system was parked over the region, producing warmer temperatures and winds that flowed in a southwesterly direction. That fueled the Beaufort Gyre, a wind-driven ocean current that flows clockwise. The gyre was the key force pulling pieces of ice west past Point Barrow, the northern nub of Alaska that protrudes into the Beaufort Sea. “A fracturing event in this area is not unusual because the Beaufort Gyre tends to push ice away from Banks Island and the Canadian Archipelago,” explained Walt Meier of the National Snow & Ice Data Center (NSIDC). “Point Barrow can act like a ‘pin point’ where the ice catches and fractures to the north and east.” In February, however, a series of storms passing over central Alaska exacerbated the fracturing. Strong westerly winds prompted several large pieces of ice to break away in an arc-shaped wave that moved progressively east. By the end of February, large pieces of ice had fractured all the way to the western coast of Banks Island, a distance of about 1,000 kilometers (600 miles). The data used to create the animation came from the longwave infrared (thermal) portion of the electromagnetic spectrum, so the animation illustrates how much heat the surface was emitting as VIIRS surveyed the area. Cooler areas (sea ice) appear white, while warmer areas (open water) are dark. The light gray plume near the cracks is warmer, moister air escaping from the ocean and blowing downwind. Clouds do not show up well in the VIIRS thermal band, so the storms that fueled the fracturing are not readily visible. While fracturing events are common, few events sprawl across such a large area or produce cracks as long and wide as those seen here. The age of the sea ice in this area was one of the key reasons this event became so widespread. “The region is covered almost completely by seasonal or first-year ice—ice that has formed since last September,” said Meier. “This ice is thinner and weaker than the older, multi-year ice, so it responds more readily to winds and is more easily broken up.” NASA Earth Observatory images by Jesse Allen using VIIRS day-night band data from the Suomi National Polar-orbiting Partnership. Suomi NPP is the result of a partnership between NASA, the National Oceanic and Atmospheric Administration, and the Department of Defense. Caption by Adam Voiland. Instrument: Suomi NPP - VIIRS For more info go to: <a href="http://earthobservatory.nasa.gov/IOTD/view.php?id=80752" rel="nofollow">earthobservatory.nasa.gov/IOTD/view.php?id=80752</a> Credit: <b><a href="http://www.earthobservatory.nasa.gov/" rel="nofollow"> NASA Earth Observatory</a></b> <b><a href="http://www.nasa.gov/audience/formedia/features/MP_Photo_Guidelines.html" rel="nofollow">NASA image use policy.</a></b> <b><a href="http://www.nasa.gov/centers/goddard/home/index.html" rel="nofollow">NASA Goddard Space Flight Center</a></b> enables NASA’s mission through four scientific endeavors: Earth Science, Heliophysics, Solar System Exploration, and Astrophysics. Goddard plays a leading role in NASA’s accomplishments by contributing compelling scientific knowledge to advance the Agency’s mission. <b>Follow us on <a href="http://twitter.com/NASA_GoddardPix" rel="nofollow">Twitter</a></b> <b>Like us on <a href="http://www.facebook.com/pages/Greenbelt-MD/NASA-Goddard/395013845897?ref=tsd" rel="nofollow">Facebook</a></b> <b>Find us on <a href="http://instagram.com/nasagoddard?vm=grid" rel="nofollow">Instagram</a></b>

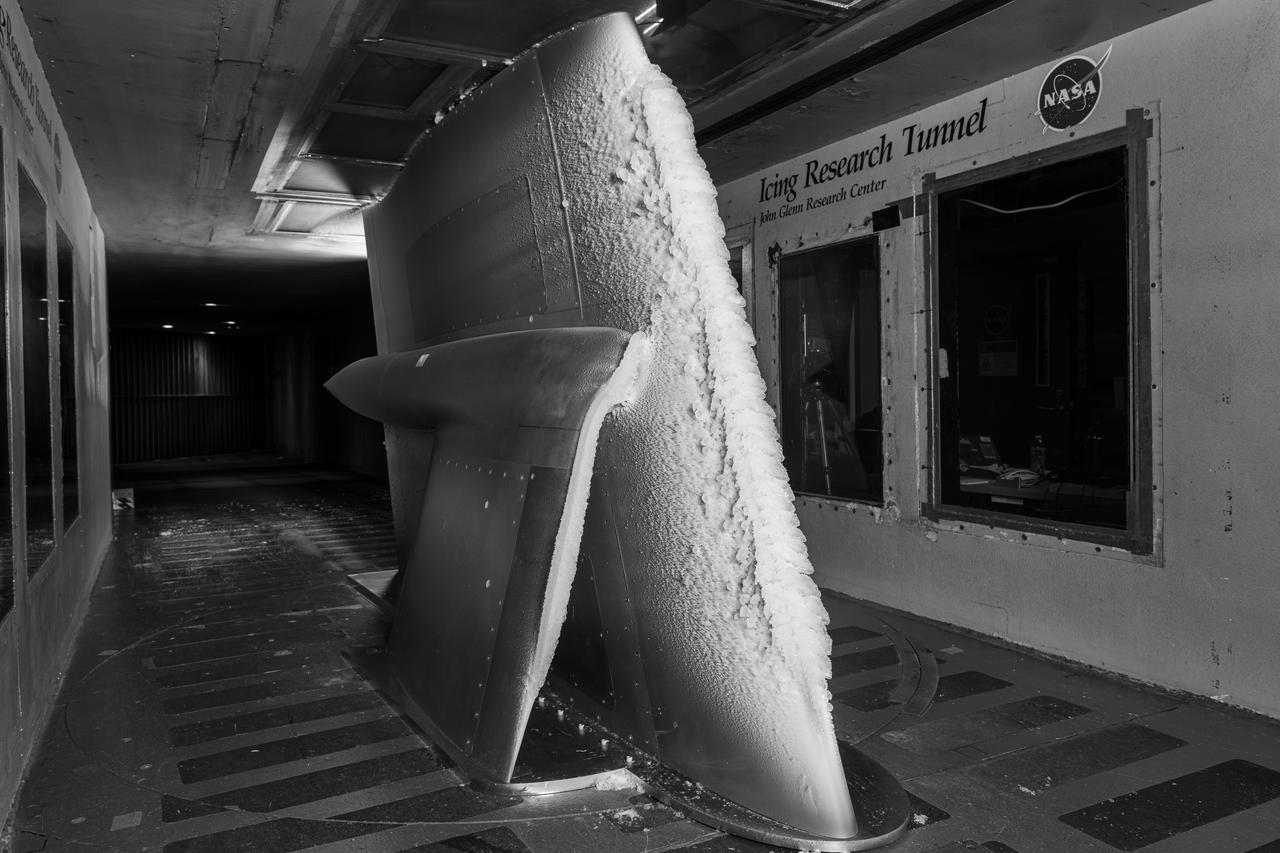
Significant ice build-up on the Simulated Inter-compressor Duct Research Model (SIDRM) at the Icing Research Tunnel. Photo Credit: (NASA/Jordan Salkin)
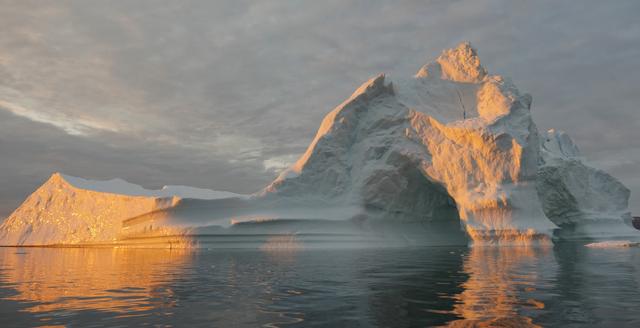
Sea level rise is a natural consequence of the warming of our planet. We know this from basic physics. When water heats up, it expands. So when the ocean warms, sea level rises. When ice is exposed to heat, it melts. And when ice on land melts and water runs into the ocean, sea level rises. For thousands of years, sea level has remained relatively stable and human communities have settled along the planet’s coastlines. But now Earth’s seas are rising. Globally, sea level has risen about eight inches since the beginning of the 20th century and more than two inches in the last 20 years alone. All signs suggest that this rise is accelerating. Read more: <a href="http://go.nasa.gov/1heZn29" rel="nofollow">go.nasa.gov/1heZn29</a> Caption: An iceberg floats in Disko Bay, near Ilulissat, Greenland, on July 24, 2015. The massive Greenland ice sheet is shedding about 300 gigatons of ice a year into the ocean, making it the single largest source of sea level rise from melting ice. Credits: NASA/Saskia Madlener <b><a href="http://www.nasa.gov/audience/formedia/features/MP_Photo_Guidelines.html" rel="nofollow">NASA image use policy.</a></b> <b><a href="http://www.nasa.gov/centers/goddard/home/index.html" rel="nofollow">NASA Goddard Space Flight Center</a></b> enables NASA’s mission through four scientific endeavors: Earth Science, Heliophysics, Solar System Exploration, and Astrophysics. Goddard plays a leading role in NASA’s accomplishments by contributing compelling scientific knowledge to advance the Agency’s mission. <b>Follow us on <a href="http://twitter.com/NASAGoddardPix" rel="nofollow">Twitter</a></b> <b>Like us on <a href="http://www.facebook.com/pages/Greenbelt-MD/NASA-Goddard/395013845897?ref=tsd" rel="nofollow">Facebook</a></b> <b>Find us on <a href="http://instagrid.me/nasagoddard/?vm=grid" rel="nofollow">Instagram</a></b>
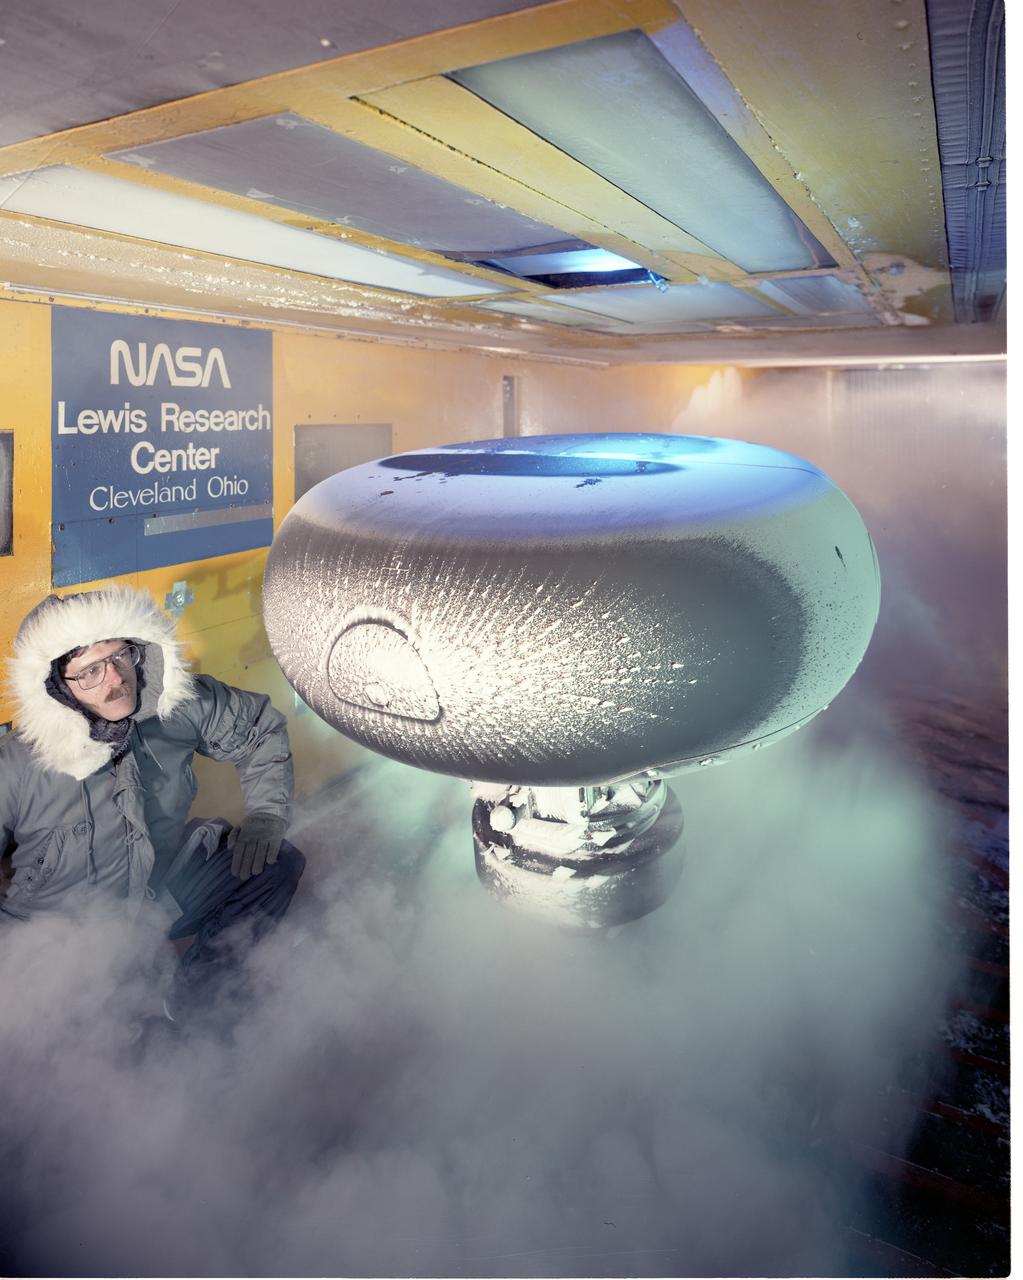
An AH-64 (Apache) Longbow fire control full size radar photographed during icing tests in the Icing Research wind tunnel. Built at the end of World War II, the Icing Research Tunnel is the oldest and largest refrigerated icing wind tunnel in the world. It can produce winds that travel up to 395 miles per hour and reach temperatures as low as -30 degrees Fahrenheit. The facility simulates ice formation during flight by spraying a cloud of super-cooled water droplets onto an aircraft component or model.
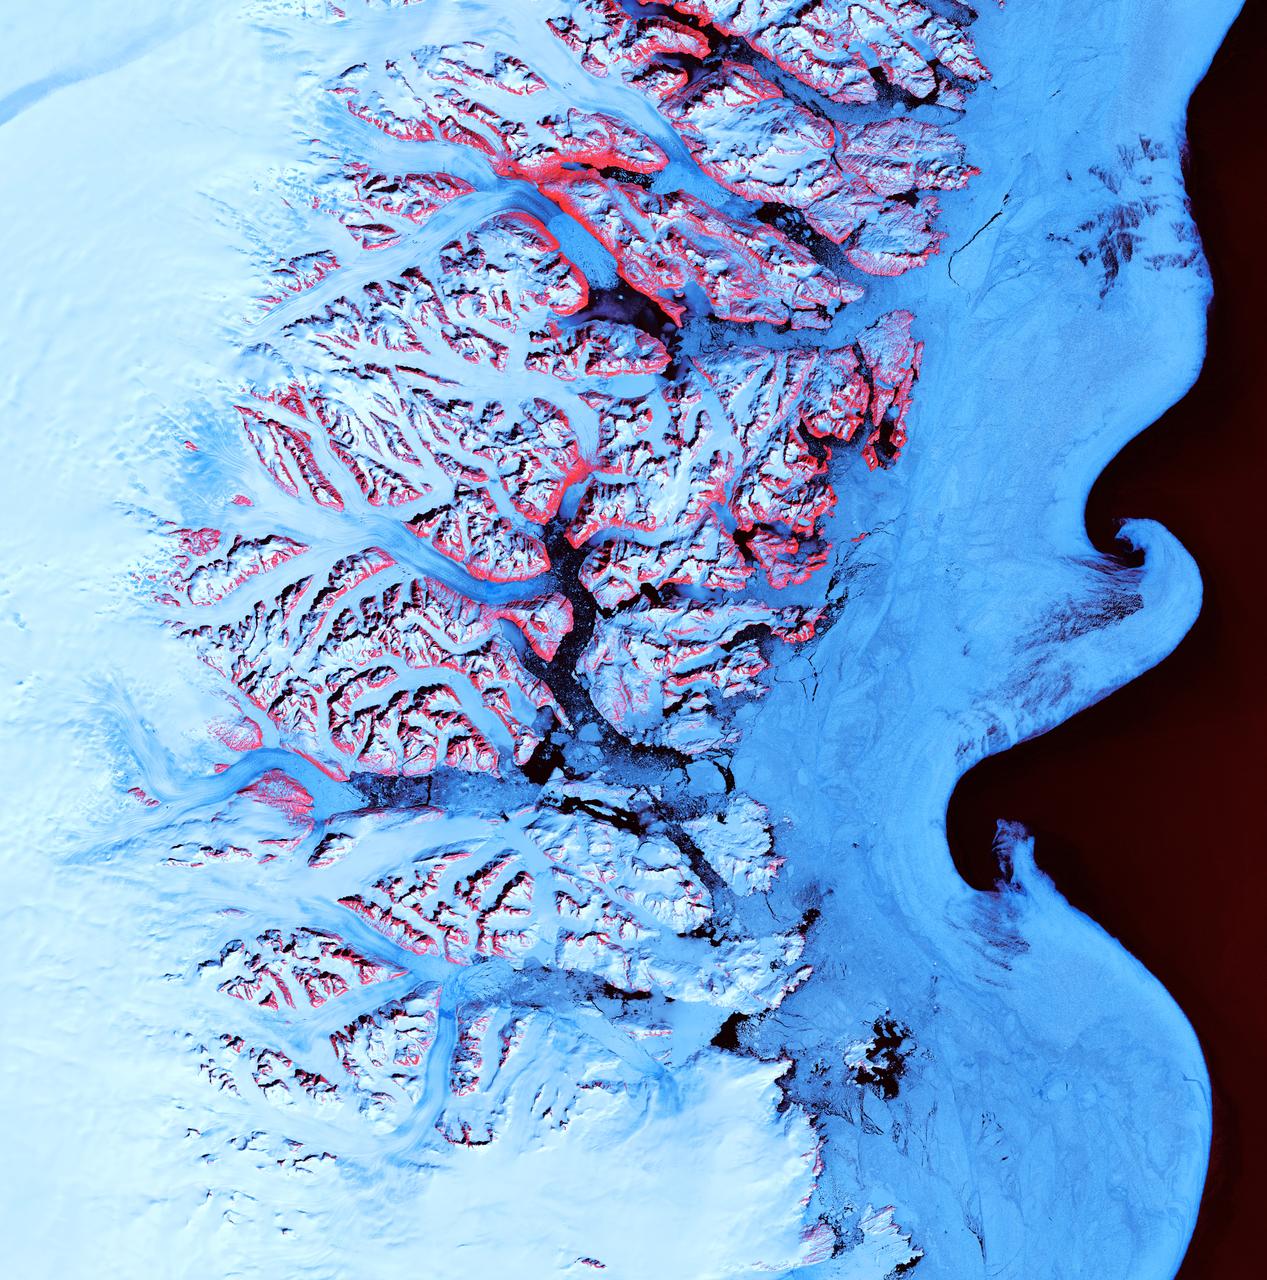
Ice Waves - May 21st, 2001 Description: Along the southeastern coast of Greenland, an intricate network of fjords funnels glacial ice to the Atlantic Ocean. During the summer melting season, newly calved icebergs join slabs of sea ice and older, weathered bergs in an offshore slurry that the southward-flowing East Greenland Current sometimes swirls into stunning shapes. Exposed rock of mountain peaks, tinted red in this image, hints at a hidden landscape. Credit: USGS/NASA/Landsat 7 To learn more about the Landsat satellite go to: <a href="http://landsat.gsfc.nasa.gov/" rel="nofollow">landsat.gsfc.nasa.gov/</a> <b><a href="http://www.nasa.gov/centers/goddard/home/index.html" rel="nofollow">NASA Goddard Space Flight Center</a></b> enables NASA’s mission through four scientific endeavors: Earth Science, Heliophysics, Solar System Exploration, and Astrophysics. Goddard plays a leading role in NASA’s accomplishments by contributing compelling scientific knowledge to advance the Agency’s mission. <b>Follow us on <a href="http://twitter.com/NASA_GoddardPix" rel="nofollow">Twitter</a></b> <b>Join us on <a href="http://www.facebook.com/pages/Greenbelt-MD/NASA-Goddard/395013845897?ref=tsd" rel="nofollow">Facebook</a></b>
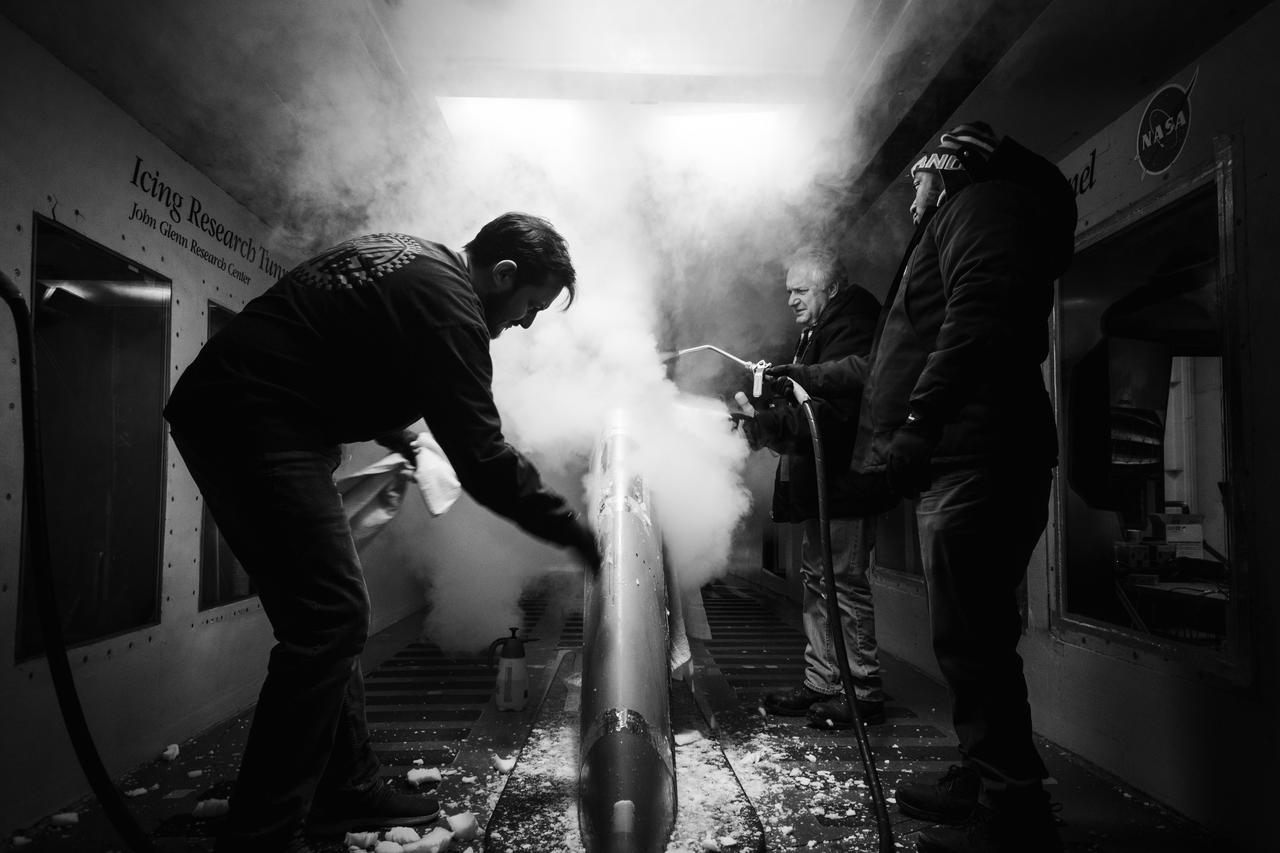
Technicians spray steam to help scrape off ice at the Icing Research Tunnel. The technicians need all the help they can get in sub-zero temperatures. Photo Credit: (NASA/Jordan Salkin)
At a depth of 600 feet beneath the West Antarctic ice sheet, a small shrimp-like creature managed to brighten up an otherwise gray polar day in late November 2009. This critter is a three-inch long Lyssianasid amphipod found beneath the Ross Ice Shelf, about 12.5 miles away from open water. NASA scientists were using a borehole camera to look back up towards the ice surface when they spotted this pinkish-orange creature swimming beneath the ice. Credit: NASA
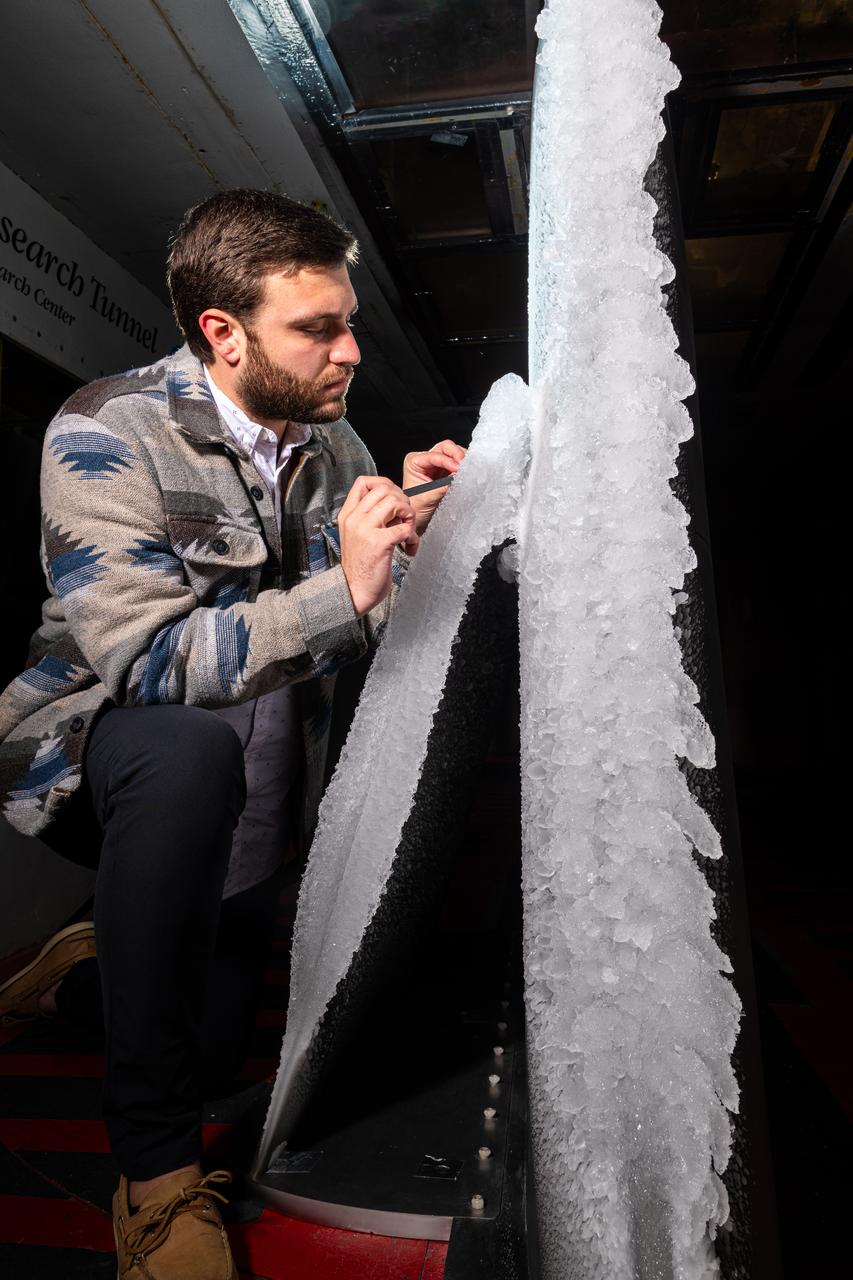
Thomas Ozoroski, an Icing Researcher, is shown documenting ice accretion on the leading edge of the next-generation Transonic Truss-Braced Wing design at NASA Glenn's Icing Research Center. This critical research will help understand icing effects for future, high-lift, ultra-efficient aircraft. Photo Credit: (NASA/Jordan Salkin)
Europa Ice Cliffs-High Resolution
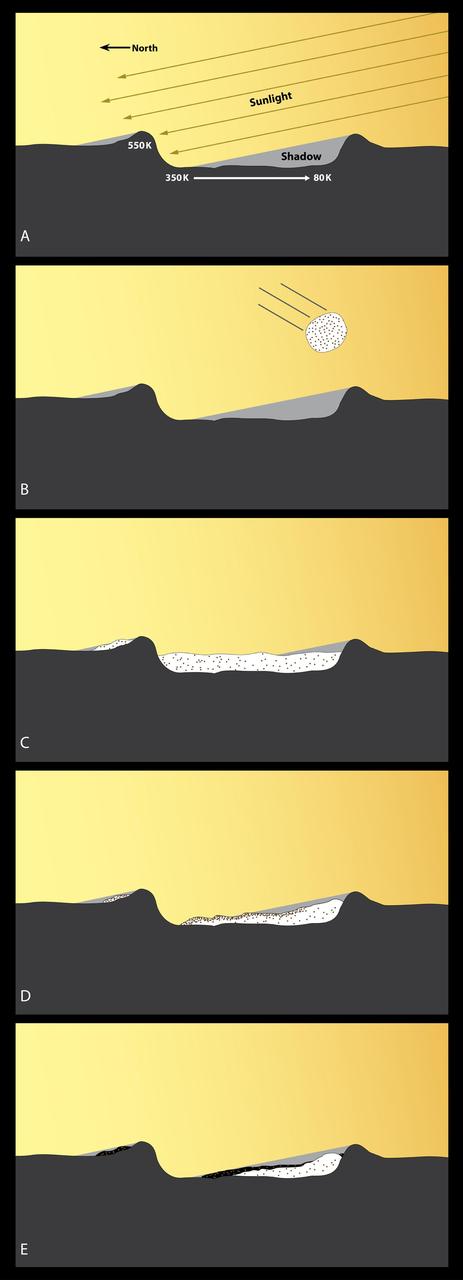
Model of Polar Ice Deposit Formation
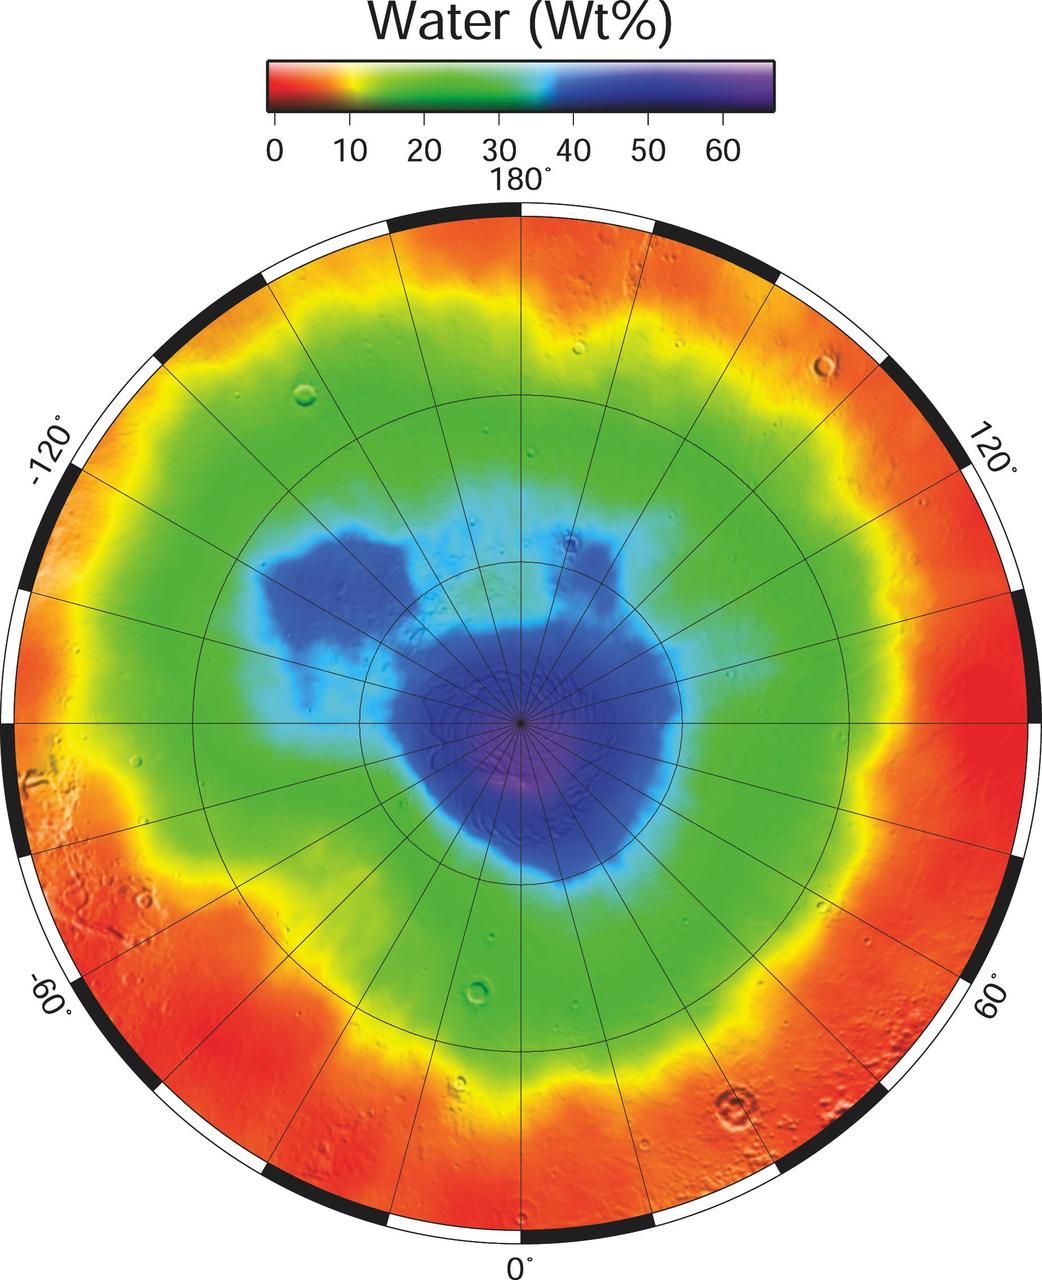
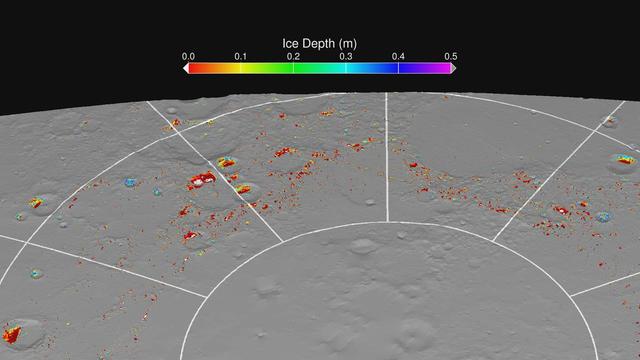
North Polar Water Ice by Weight
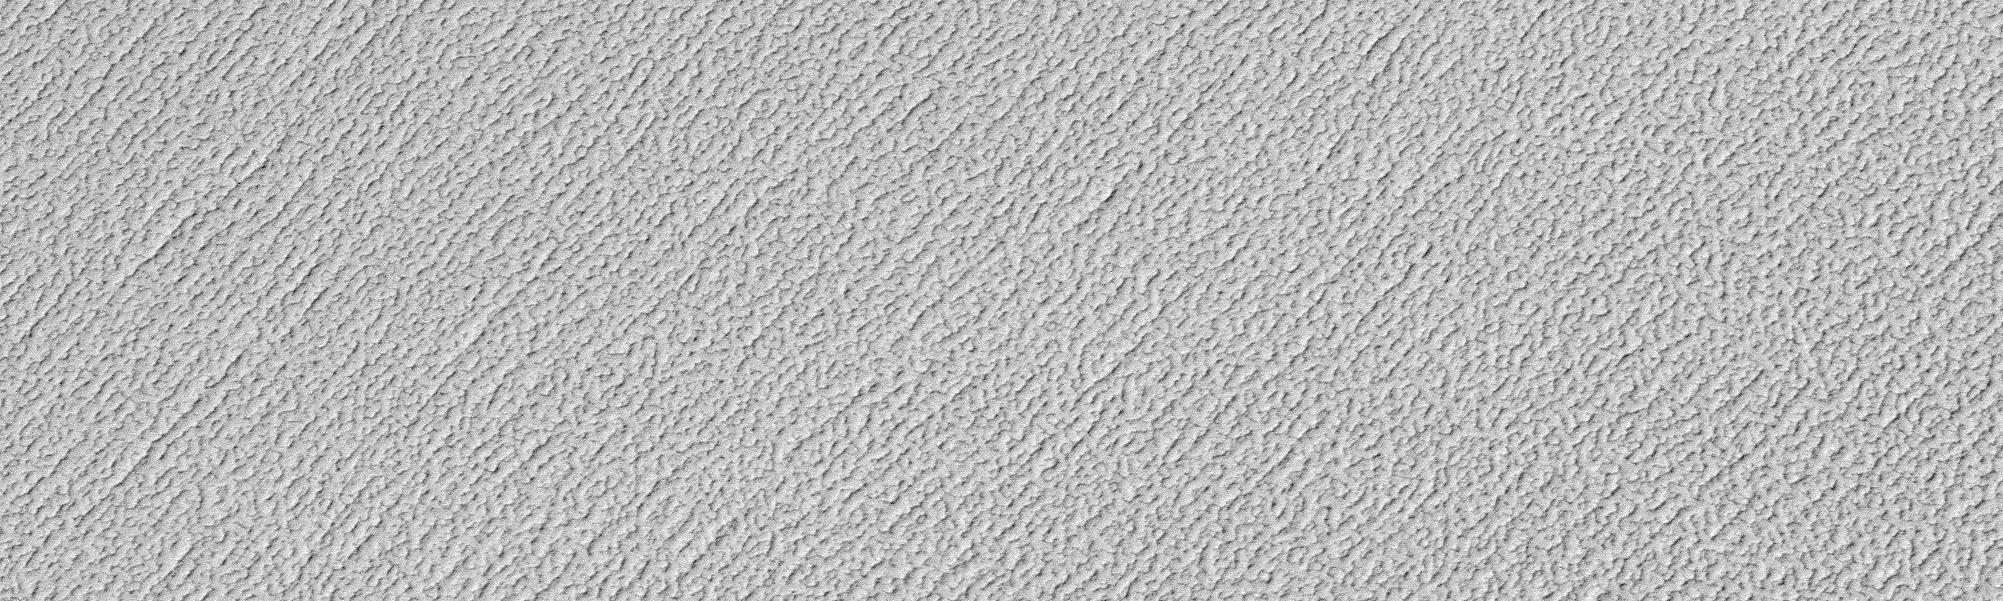
North Polar Ice Cap Surface
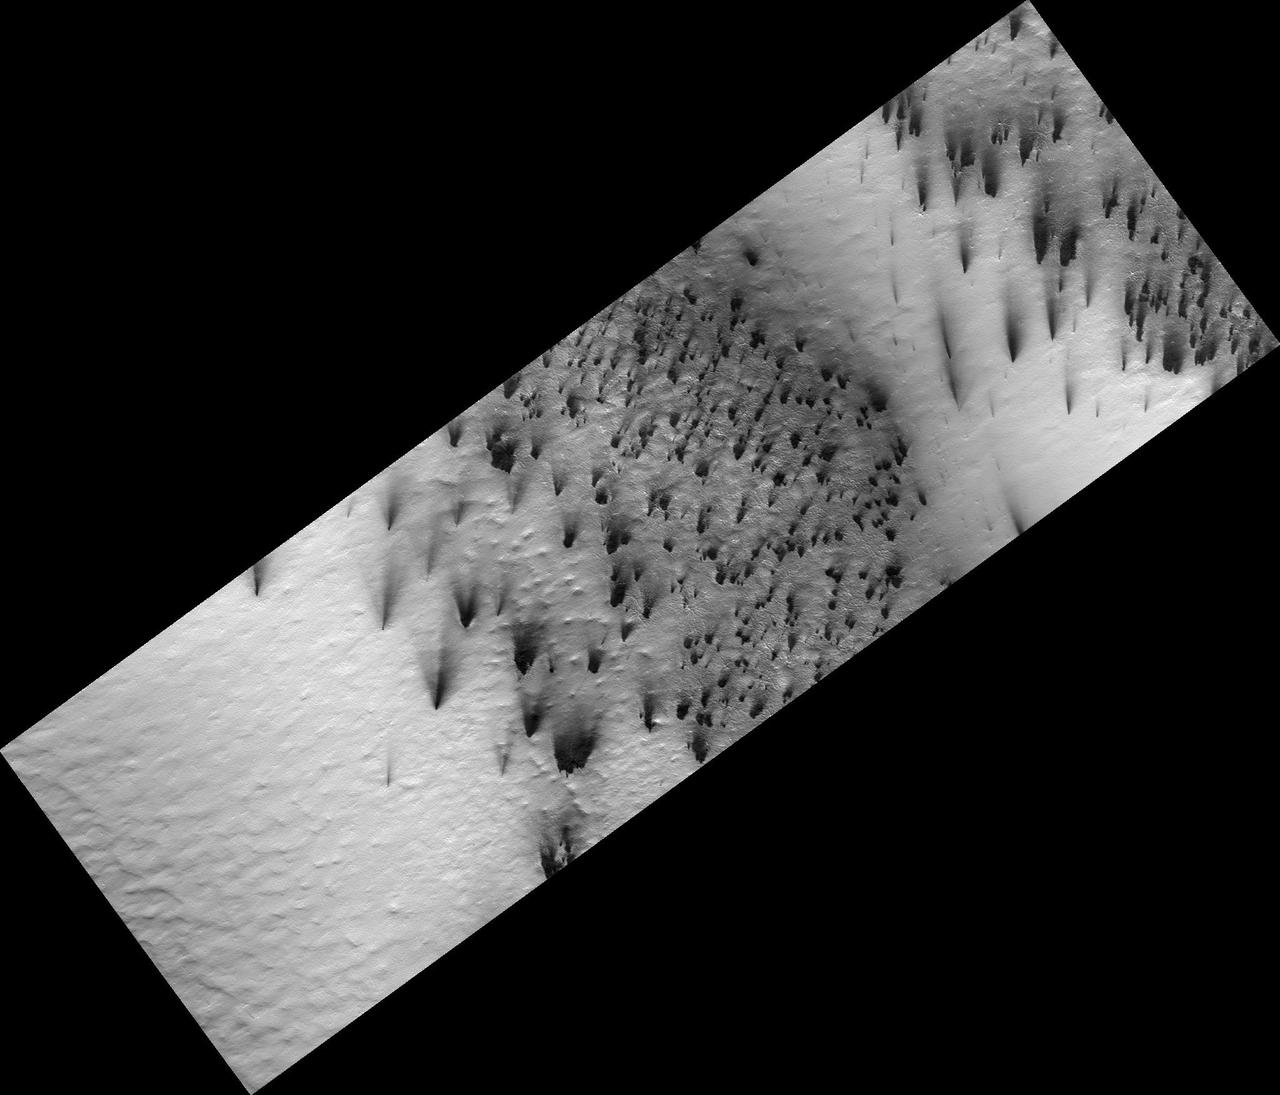
Color Reveals Translucent Seasonal Ice
Signs of Fluids and Ice in Acidalia Planitia
Ice on Mars Utopia Planitia Again
Ice-frosted crater tops on Ganymede

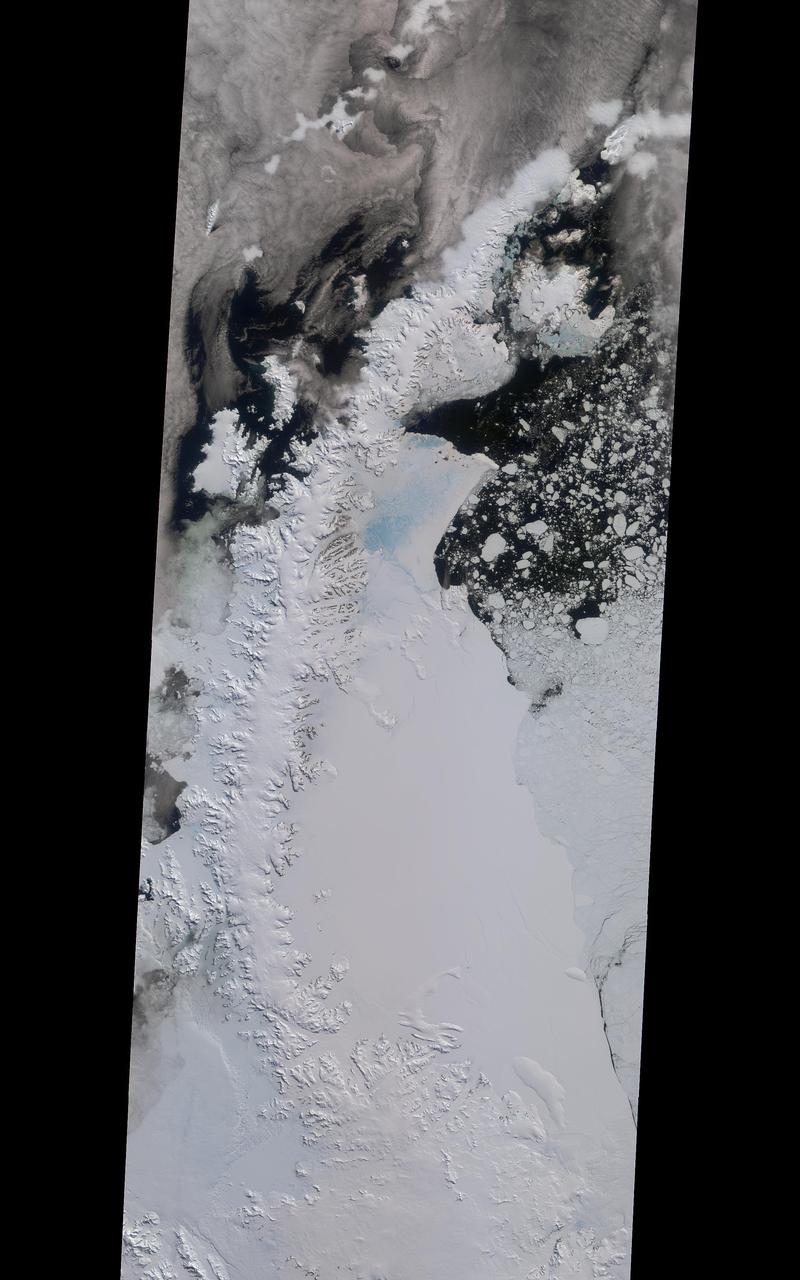
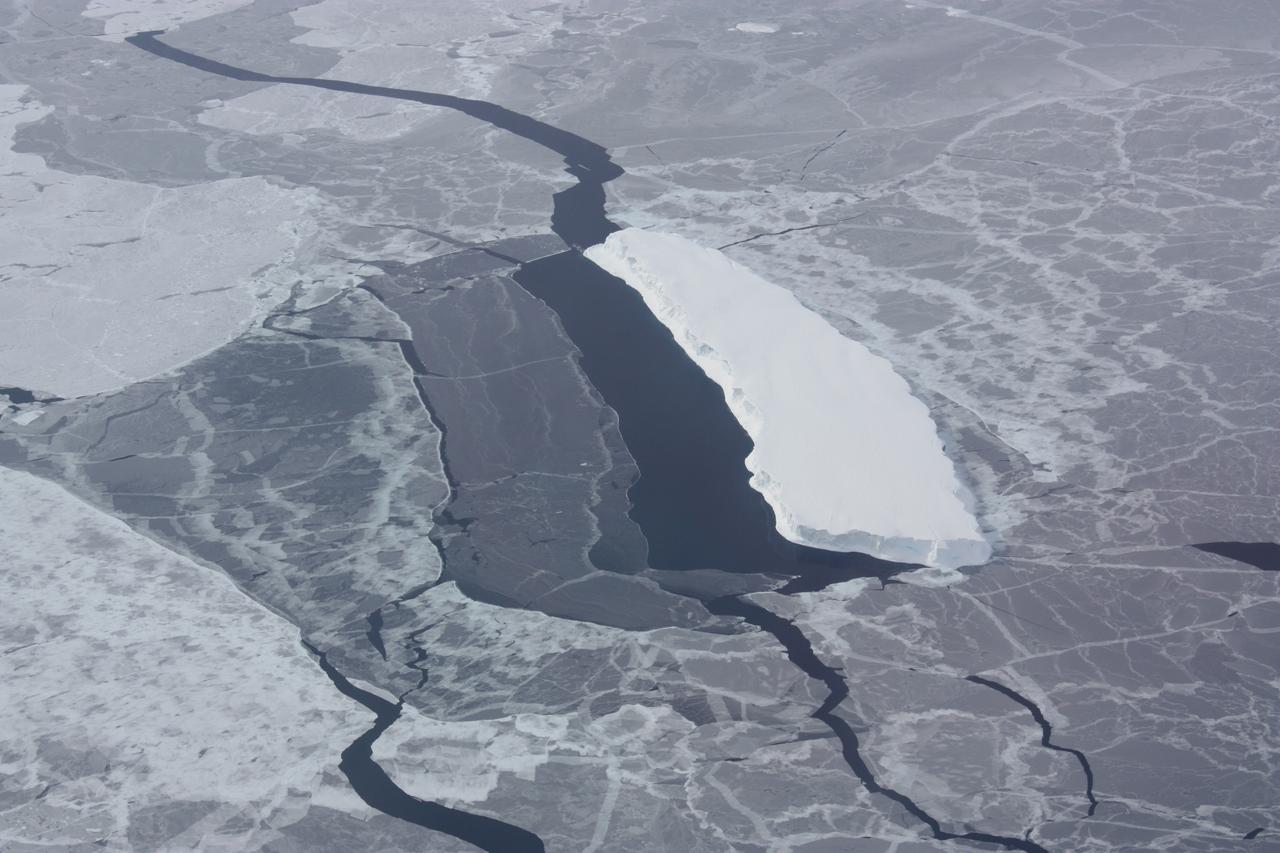
Antarctica—the continent at the southernmost reach of the planet—is fringed by cold, often frozen waters of the Southern Ocean. The extent of sea ice around the continent typically reaches a peak in September and a minimum in February. The photograph above shows Antarctic sea ice on November 5, 2014, during the annual cycle of melt. The image was acquired by the Digital Mapping System (DMS), a digital camera installed in the belly of research aircraft to capture images of terrain below. In this case, the system flew on the DC-8 during a flight as part of NASA’s Operation IceBridge. Most of the view shows first-year sea ice in the Bellingshausen Sea, as it appeared from an altitude of 328 meters (1,076 feet). The block of ice on the right side of the image is older, thicker, and was once attached to the Antarctic Ice Sheet. By the time this image was acquired, however, the ice had broken away to form an iceberg. Given its close proximity to the ice sheet, this could have been a relatively new berg. Read more: <a href="http://earthobservatory.nasa.gov/IOTD/view.php?id=86721" rel="nofollow">earthobservatory.nasa.gov/IOTD/view.php?id=86721</a> Credit: NASA/Goddard/IceBridge DMS L0 Raw Imagery courtesy of the Digital Mapping System (DMS) team and the NASA DAAC at the National Snow and Ice Data Center Credit: <b><a href="http://www.earthobservatory.nasa.gov/" rel="nofollow"> NASA Earth Observatory</a></b> <b><a href="http://www.nasa.gov/audience/formedia/features/MP_Photo_Guidelines.html" rel="nofollow">NASA image use policy.</a></b> <b><a href="http://www.nasa.gov/centers/goddard/home/index.html" rel="nofollow">NASA Goddard Space Flight Center</a></b> enables NASA’s mission through four scientific endeavors: Earth Science, Heliophysics, Solar System Exploration, and Astrophysics. Goddard plays a leading role in NASA’s accomplishments by contributing compelling scientific knowledge to advance the Agency’s mission. <b>Follow us on <a href="http://twitter.com/NASAGoddardPix" rel="nofollow">Twitter</a></b> <b>Like us on <a href="http://www.facebook.com/pages/Greenbelt-MD/NASA-Goddard/395013845897?ref=tsd" rel="nofollow">Facebook</a></b> <b>Find us on <a href="http://instagrid.me/nasagoddard/?vm=grid" rel="nofollow">Instagram</a></b>
This photo shows the ice front of the ice shelf in front of Pine Island Glacier, a major glacier system of West Antarctica.
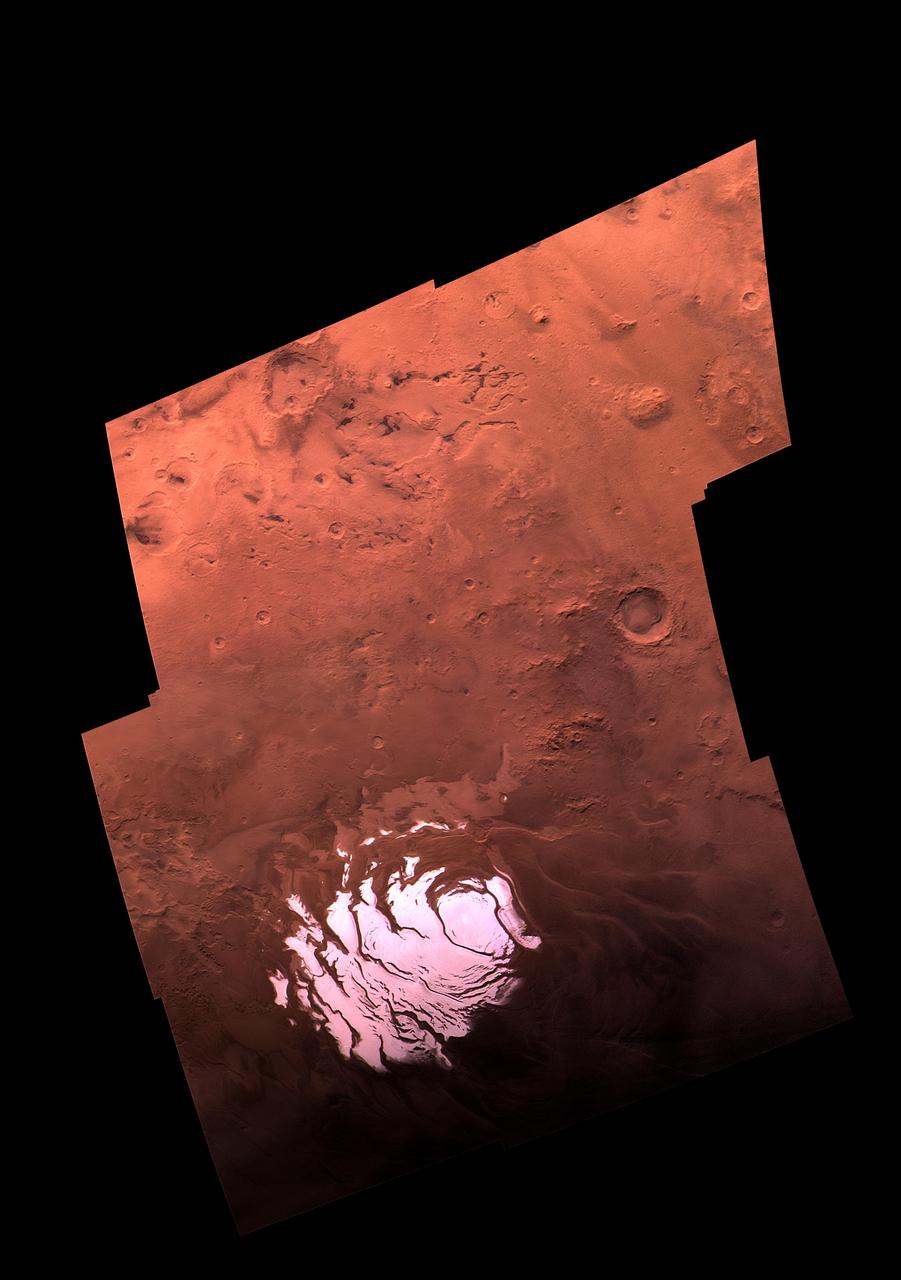
South Polar Residual Ice Cap http://photojournal.jpl.nasa.gov/catalog/PIA00301
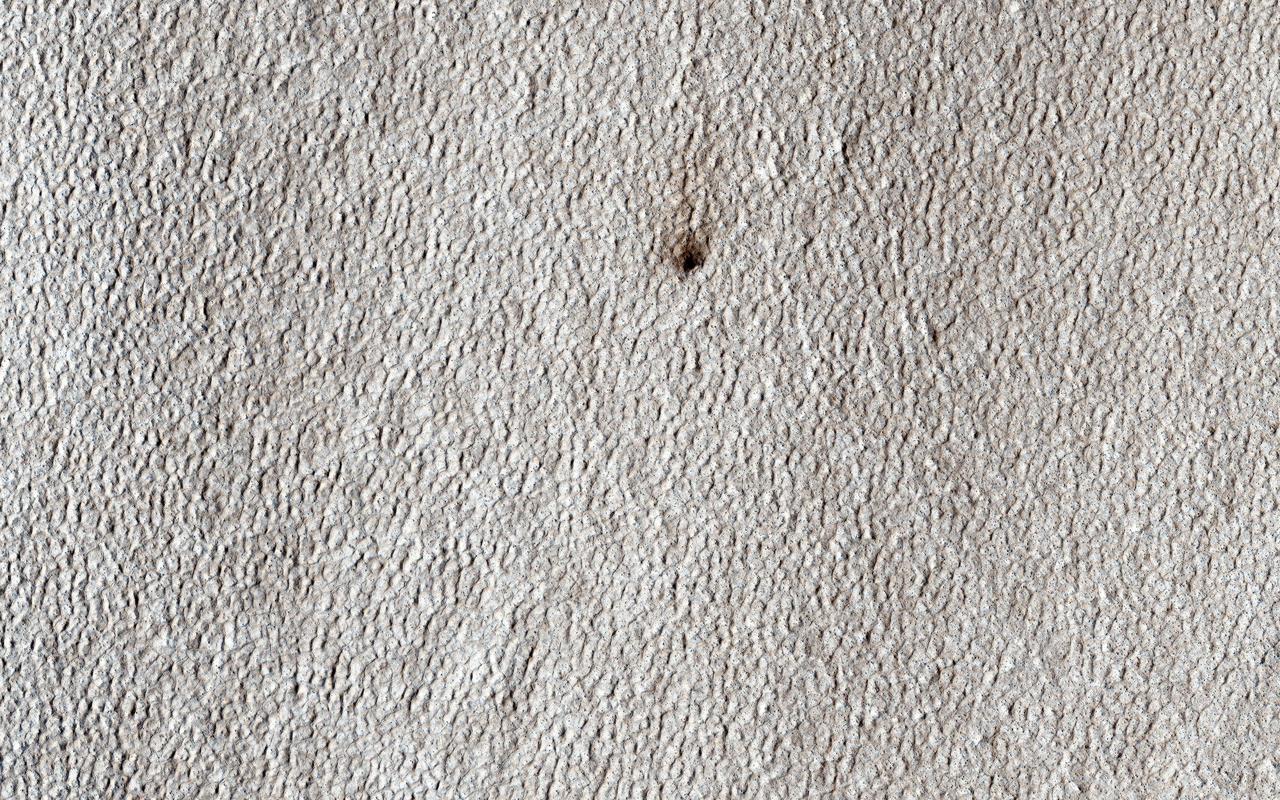
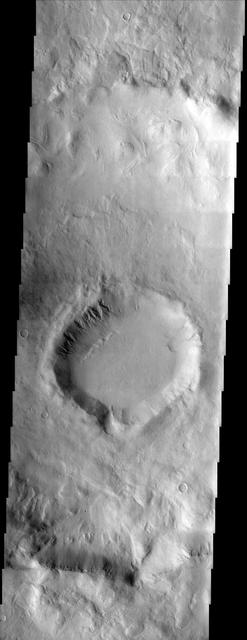
This image was targeted for NASA Mars Reconnaissance Orbiter spacecraft to look at a candidate new crater on a lobate apron. Such aprons are often ice-rich, but the crater shows no bright material that would indicate ice.
Ice accretion is shown on the leading edge of the next-generation Transonic Truss-Braced Wing design at NASA Glenn's Icing Research Center. This critical research will help understand icing effects for future, high-lift, ultra-efficient aircraft. Photo Credit: (NASA/Jordan Salkin)
Zaid Sabri and Thomas Ozoroski, Icing Researchers, are shown documenting ice accretion on the leading edge of the next-generation Transonic Truss-Braced Wing design at NASA Glenn's Icing Research Center. This critical research will help understand icing effects for future, high-lift, ultra-efficient aircraft. Photo Credit: (NASA/Jordan Salkin)

On April 5, 2015, the Moderate Resolution Imaging Spectroradiometer (MODIS) on NASA’s Terra satellite acquired this natural-color image of sea ice off the coast of East Antarctica’s Princess Astrid Coast. White areas close to the continent are sea ice, while white areas in the northeast corner of the image are clouds. One way to better distinguish ice from clouds is with false-color imagery. In the false-color view of the scene here, ice is blue and clouds are white. The image was acquired after Antarctic sea ice had passed its annual minimum extent (reached on February 20, 2015), and had resumed expansion toward its maximum extent (usually reached in September). Credit: NASA image by Jeff Schmaltz, LANCE/EOSDIS Rapid Response. Caption by Kathryn Hansen via NASA's Earth Observatory Read more: <a href="http://www.nasa.gov/content/sea-ice-off-east-antarcticas-princess-astrid-coast/" rel="nofollow">www.nasa.gov/content/sea-ice-off-east-antarcticas-princes...</a> <b><a href="http://www.nasa.gov/audience/formedia/features/MP_Photo_Guidelines.html" rel="nofollow">NASA image use policy.</a></b> <b><a href="http://www.nasa.gov/centers/goddard/home/index.html" rel="nofollow">NASA Goddard Space Flight Center</a></b> enables NASA’s mission through four scientific endeavors: Earth Science, Heliophysics, Solar System Exploration, and Astrophysics. Goddard plays a leading role in NASA’s accomplishments by contributing compelling scientific knowledge to advance the Agency’s mission. <b>Follow us on <a href="http://twitter.com/NASAGoddardPix" rel="nofollow">Twitter</a></b> <b>Like us on <a href="http://www.facebook.com/pages/Greenbelt-MD/NASA-Goddard/395013845897?ref=tsd" rel="nofollow">Facebook</a></b> <b>Find us on <a href="http://instagrid.me/nasagoddard/?vm=grid" rel="nofollow">Instagram</a></b>

The Visible Infrared Imaging Radiometer Suite (VIIRS) on the Suomi NPP satellite captured this view of extensive sea-ice fracturing off the northern coast of Alaska. The event began in late-January and spread west toward Banks Island throughout February and March 2013. Visualizations of the Arctic often give the impression that the ice cap is a continuous sheet of stationary, floating ice. In fact, it is a collection of smaller pieces that constantly shift, crack, and grind against one another as they are jostled by winds and ocean currents. Especially during the summer—but even during the height of winter—cracks—or leads—open up between pieces of ice. That was what was happening on the left side of the animation (seen here: <a href="http://bit.ly/10kE7sh" rel="nofollow">bit.ly/10kE7sh</a>) in late January. A high-pressure weather system was parked over the region, producing warmer temperatures and winds that flowed in a southwesterly direction. That fueled the Beaufort Gyre, a wind-driven ocean current that flows clockwise. The gyre was the key force pulling pieces of ice west past Point Barrow, the northern nub of Alaska that protrudes into the Beaufort Sea. “A fracturing event in this area is not unusual because the Beaufort Gyre tends to push ice away from Banks Island and the Canadian Archipelago,” explained Walt Meier of the National Snow & Ice Data Center (NSIDC). “Point Barrow can act like a ‘pin point’ where the ice catches and fractures to the north and east.” In February, however, a series of storms passing over central Alaska exacerbated the fracturing. Strong westerly winds prompted several large pieces of ice to break away in an arc-shaped wave that moved progressively east. By the end of February, large pieces of ice had fractured all the way to the western coast of Banks Island, a distance of about 1,000 kilometers (600 miles). The data used to create the animation came from the longwave infrared (thermal) portion of the electromagnetic spectrum, so the animation illustrates how much heat the surface was emitting as VIIRS surveyed the area. Cooler areas (sea ice) appear white, while warmer areas (open water) are dark. The light gray plume near the cracks is warmer, moister air escaping from the ocean and blowing downwind. Clouds do not show up well in the VIIRS thermal band, so the storms that fueled the fracturing are not readily visible. While fracturing events are common, few events sprawl across such a large area or produce cracks as long and wide as those seen here. The age of the sea ice in this area was one of the key reasons this event became so widespread. “The region is covered almost completely by seasonal or first-year ice—ice that has formed since last September,” said Meier. “This ice is thinner and weaker than the older, multi-year ice, so it responds more readily to winds and is more easily broken up.” NASA Earth Observatory images by Jesse Allen using VIIRS day-night band data from the Suomi National Polar-orbiting Partnership. Suomi NPP is the result of a partnership between NASA, the National Oceanic and Atmospheric Administration, and the Department of Defense. Caption by Adam Voiland. Instrument: Suomi NPP - VIIRS For more info go to: <a href="http://earthobservatory.nasa.gov/IOTD/view.php?id=80752" rel="nofollow">earthobservatory.nasa.gov/IOTD/view.php?id=80752</a> Credit: <b><a href="http://www.earthobservatory.nasa.gov/" rel="nofollow"> NASA Earth Observatory</a></b> <b><a href="http://www.nasa.gov/audience/formedia/features/MP_Photo_Guidelines.html" rel="nofollow">NASA image use policy.</a></b> <b><a href="http://www.nasa.gov/centers/goddard/home/index.html" rel="nofollow">NASA Goddard Space Flight Center</a></b> enables NASA’s mission through four scientific endeavors: Earth Science, Heliophysics, Solar System Exploration, and Astrophysics. Goddard plays a leading role in NASA’s accomplishments by contributing compelling scientific knowledge to advance the Agency’s mission. <b>Follow us on <a href="http://twitter.com/NASA_GoddardPix" rel="nofollow">Twitter</a></b> <b>Like us on <a href="http://www.facebook.com/pages/Greenbelt-MD/NASA-Goddard/395013845897?ref=tsd" rel="nofollow">Facebook</a></b> <b>Find us on <a href="http://instagram.com/nasagoddard?vm=grid" rel="nofollow">Instagram</a></b>

The Visible Infrared Imaging Radiometer Suite (VIIRS) on the Suomi NPP satellite captured this view of extensive sea-ice fracturing off the northern coast of Alaska. The event began in late-January and spread west toward Banks Island throughout February and March 2013. Visualizations of the Arctic often give the impression that the ice cap is a continuous sheet of stationary, floating ice. In fact, it is a collection of smaller pieces that constantly shift, crack, and grind against one another as they are jostled by winds and ocean currents. Especially during the summer—but even during the height of winter—cracks—or leads—open up between pieces of ice. That was what was happening on the left side of the animation (seen here: <a href="http://bit.ly/10kE7sh" rel="nofollow">bit.ly/10kE7sh</a>) in late January. A high-pressure weather system was parked over the region, producing warmer temperatures and winds that flowed in a southwesterly direction. That fueled the Beaufort Gyre, a wind-driven ocean current that flows clockwise. The gyre was the key force pulling pieces of ice west past Point Barrow, the northern nub of Alaska that protrudes into the Beaufort Sea. “A fracturing event in this area is not unusual because the Beaufort Gyre tends to push ice away from Banks Island and the Canadian Archipelago,” explained Walt Meier of the National Snow & Ice Data Center (NSIDC). “Point Barrow can act like a ‘pin point’ where the ice catches and fractures to the north and east.” In February, however, a series of storms passing over central Alaska exacerbated the fracturing. Strong westerly winds prompted several large pieces of ice to break away in an arc-shaped wave that moved progressively east. By the end of February, large pieces of ice had fractured all the way to the western coast of Banks Island, a distance of about 1,000 kilometers (600 miles). The data used to create the animation came from the longwave infrared (thermal) portion of the electromagnetic spectrum, so the animation illustrates how much heat the surface was emitting as VIIRS surveyed the area. Cooler areas (sea ice) appear white, while warmer areas (open water) are dark. The light gray plume near the cracks is warmer, moister air escaping from the ocean and blowing downwind. Clouds do not show up well in the VIIRS thermal band, so the storms that fueled the fracturing are not readily visible. While fracturing events are common, few events sprawl across such a large area or produce cracks as long and wide as those seen here. The age of the sea ice in this area was one of the key reasons this event became so widespread. “The region is covered almost completely by seasonal or first-year ice—ice that has formed since last September,” said Meier. “This ice is thinner and weaker than the older, multi-year ice, so it responds more readily to winds and is more easily broken up.” NASA Earth Observatory images by Jesse Allen using VIIRS day-night band data from the Suomi National Polar-orbiting Partnership. Suomi NPP is the result of a partnership between NASA, the National Oceanic and Atmospheric Administration, and the Department of Defense. Caption by Adam Voiland. Instrument: Suomi NPP - VIIRS For more info go to: <a href="http://earthobservatory.nasa.gov/IOTD/view.php?id=80752" rel="nofollow">earthobservatory.nasa.gov/IOTD/view.php?id=80752</a> Credit: <b><a href="http://www.earthobservatory.nasa.gov/" rel="nofollow"> NASA Earth Observatory</a></b> <b><a href="http://www.nasa.gov/audience/formedia/features/MP_Photo_Guidelines.html" rel="nofollow">NASA image use policy.</a></b> <b><a href="http://www.nasa.gov/centers/goddard/home/index.html" rel="nofollow">NASA Goddard Space Flight Center</a></b> enables NASA’s mission through four scientific endeavors: Earth Science, Heliophysics, Solar System Exploration, and Astrophysics. Goddard plays a leading role in NASA’s accomplishments by contributing compelling scientific knowledge to advance the Agency’s mission. <b>Follow us on <a href="http://twitter.com/NASA_GoddardPix" rel="nofollow">Twitter</a></b> <b>Like us on <a href="http://www.facebook.com/pages/Greenbelt-MD/NASA-Goddard/395013845897?ref=tsd" rel="nofollow">Facebook</a></b> <b>Find us on <a href="http://instagram.com/nasagoddard?vm=grid" rel="nofollow">Instagram</a></b>
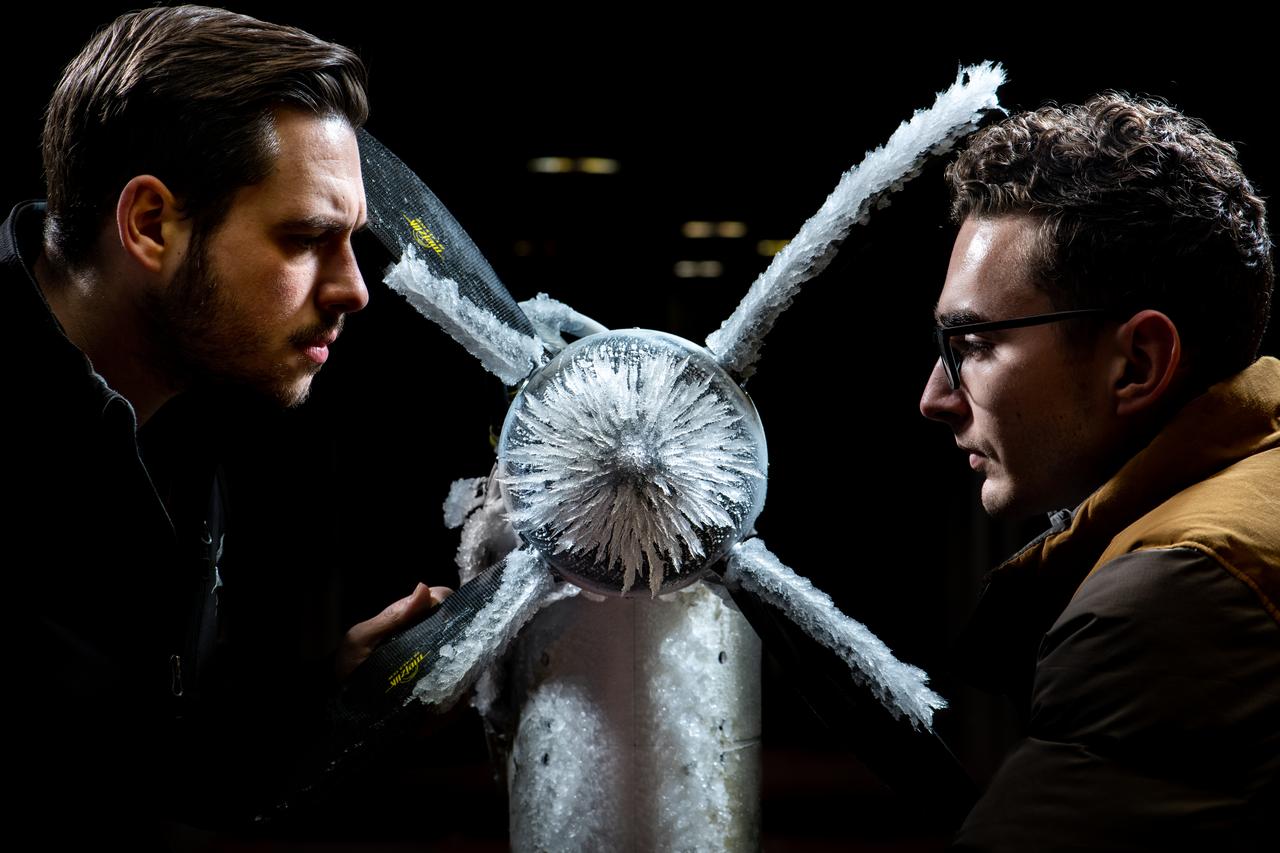
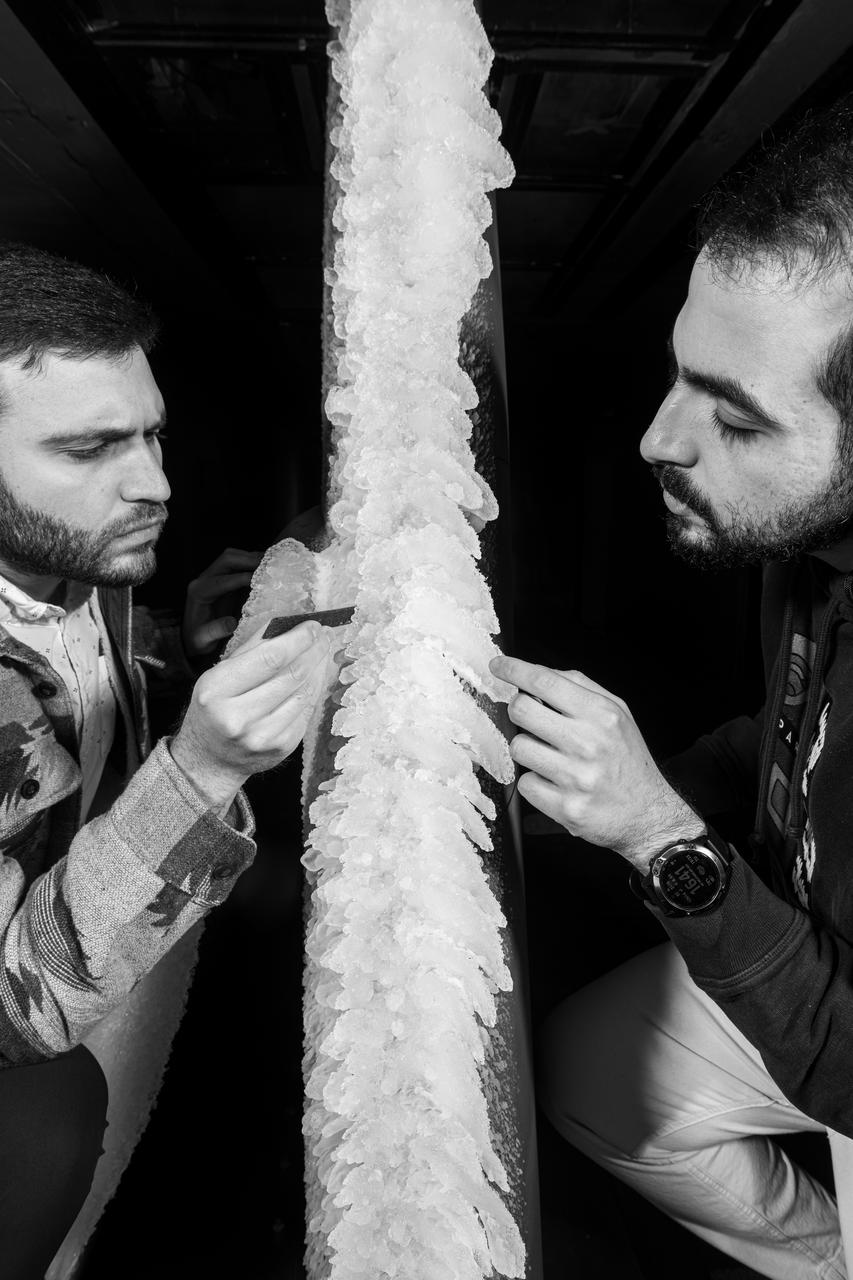
Curtis Flack (left) and Paul von Hardenberg (right) inspect the ice formation on the spinner of an Advanced Air Mobility proprotor model tested in the Icing Research Tunnel. The data from the test will be used by icing researchers to better understand the risks of icing on electric vertical takeoff and landing vehicles which will assist with the design and certification of new aircraft.
Calving front of an ice shelf in West Antarctica. The traditional view on ice shelves, the floating extensions of seaward glaciers, has been that they mostly lose ice by shedding icebergs. A new study by NASA and university researchers has found that warm ocean waters melting the ice sheets from underneath account for 55 percent of all ice shelf mass loss in Antarctica. This image was taken during the 2012 Antarctic campaign of NASA's Operation IceBridge, a mission that provided data for the new ice shelf study. Read more: <a href="http://www.nasa.gov/topics/earth/features/earth20130613.html" rel="nofollow">www.nasa.gov/topics/earth/features/earth20130613.html</a> Credit: NASA/GSFC/Jefferson Beck <b><a href="http://www.nasa.gov/audience/formedia/features/MP_Photo_Guidelines.html" rel="nofollow">NASA image use policy.</a></b> <b><a href="http://www.nasa.gov/centers/goddard/home/index.html" rel="nofollow">NASA Goddard Space Flight Center</a></b> enables NASA’s mission through four scientific endeavors: Earth Science, Heliophysics, Solar System Exploration, and Astrophysics. Goddard plays a leading role in NASA’s accomplishments by contributing compelling scientific knowledge to advance the Agency’s mission. <b>Follow us on <a href="http://twitter.com/NASA_GoddardPix" rel="nofollow">Twitter</a></b> <b>Like us on <a href="http://www.facebook.com/pages/Greenbelt-MD/NASA-Goddard/395013845897?ref=tsd" rel="nofollow">Facebook</a></b> <b>Find us on <a href="http://instagram.com/nasagoddard?vm=grid" rel="nofollow">Instagram</a></b>
The Wilkins Ice Shelf, as seen by NASA Terra spacecraft, on the western side of the Antarctic Peninsula, experienced multiple disintegration events in 2008. By the beginning of 2009, a narrow ice bridge was all that remained to connect the ice shelf to ice fragments fringing nearby Charcot Island. That bridge gave way in early April 2009. Days after the ice bridge rupture, on April 12, 2009, the Advanced Spaceborne Thermal Emission and Reflection Radiometer (ASTER) on NASA's Terra satellite acquired this image of the southern base of the ice bridge, where it connected with the remnant ice shelf. Although the ice bridge has played a role in stabilizing the ice fragments in the region, its rupture doesn't guarantee the ice will immediately move away. http://photojournal.jpl.nasa.gov/catalog/PIA11991
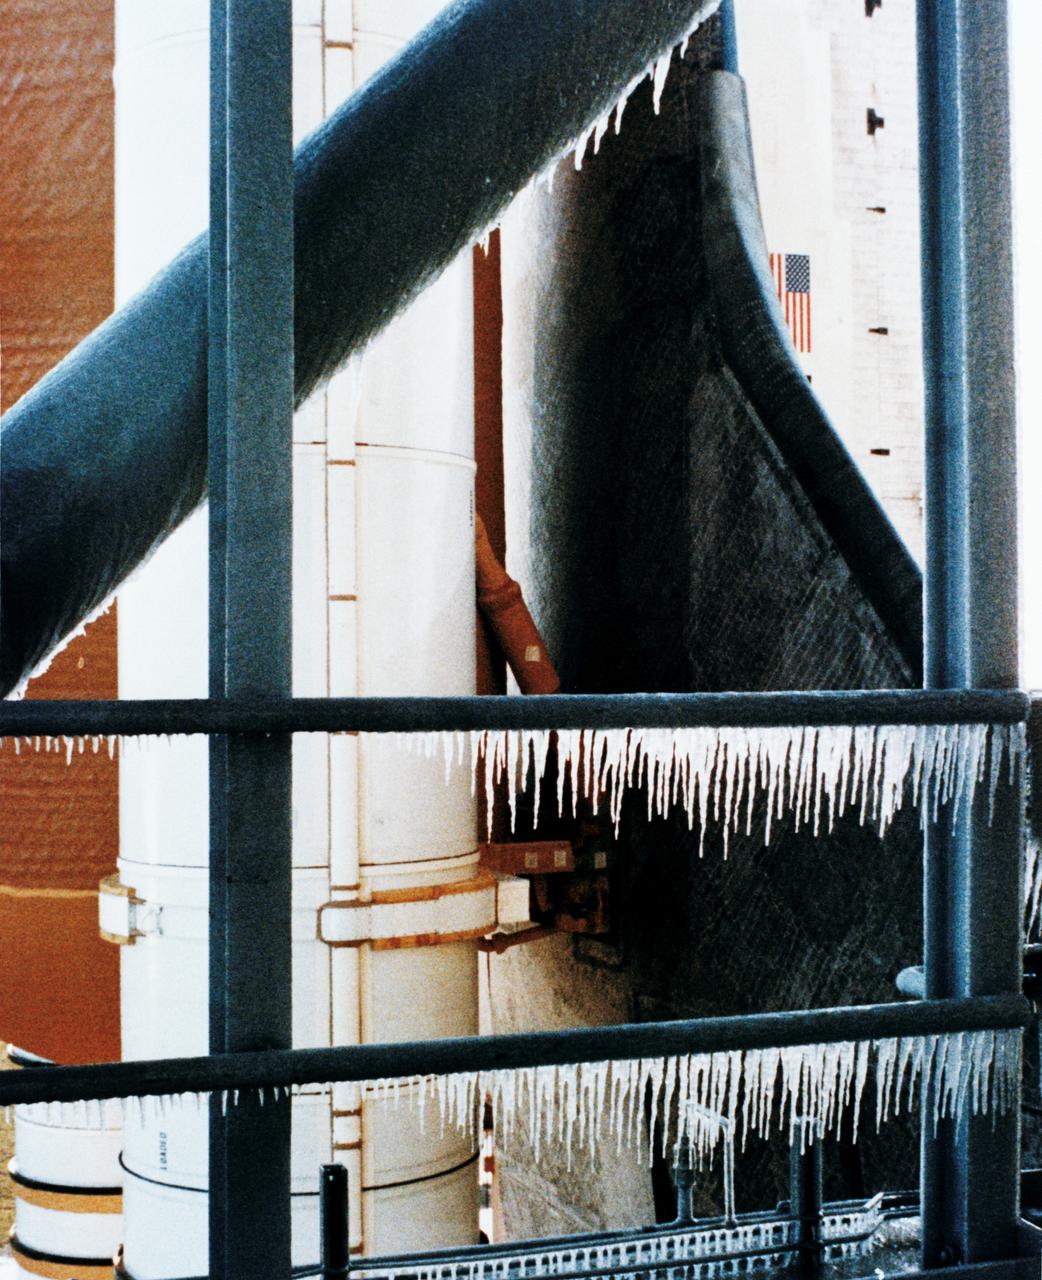
51L-10147 (28 Jan. 1986) --- View of ice on the 51-L launch complex. Photo credit: NASA
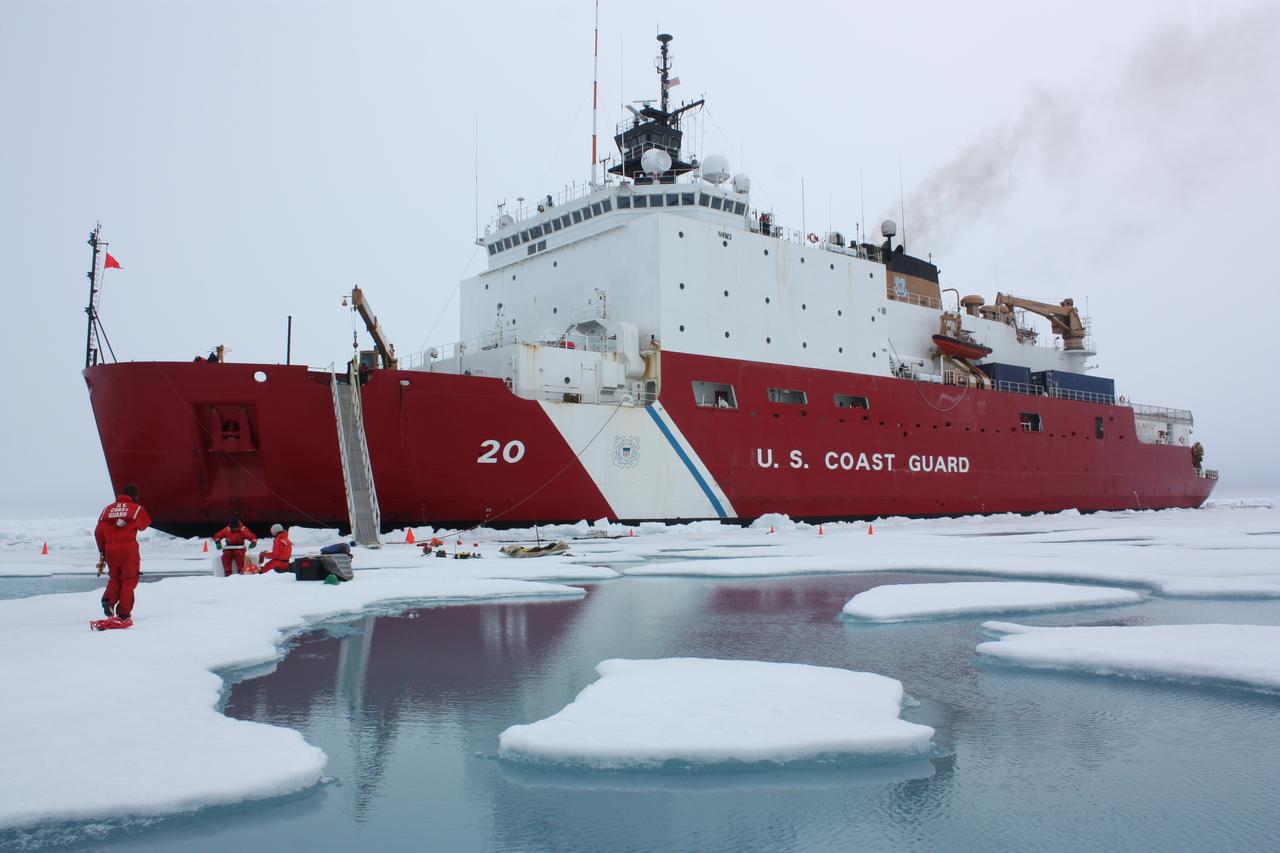
On July 6, 2011, the U.S. Coast Guard Cutter Healy parked in an ice floe for the 2011 ICESCAPE mission's third ice station in the Chukchi Sea. The ICESCAPE mission, or "Impacts of Climate on Ecosystems and Chemistry of the Arctic Pacific Environment," is a NASA shipborne investigation to study how changing conditions in the Arctic affect the ocean's chemistry and ecosystems. The bulk of the research took place in the Beaufort and Chukchi seas in summer 2010 and 2011. Credit: NASA/Kathryn Hansen <b><a href="http://www.nasa.gov/audience/formedia/features/MP_Photo_Guidelines.html" rel="nofollow">NASA image use policy.</a></b> <b><a href="http://www.nasa.gov/centers/goddard/home/index.html" rel="nofollow">NASA Goddard Space Flight Center</a></b> enables NASA’s mission through four scientific endeavors: Earth Science, Heliophysics, Solar System Exploration, and Astrophysics. Goddard plays a leading role in NASA’s accomplishments by contributing compelling scientific knowledge to advance the Agency’s mission. <b>Follow us on <a href="http://twitter.com/NASA_GoddardPix" rel="nofollow">Twitter</a></b> <b>Like us on <a href="http://www.facebook.com/pages/Greenbelt-MD/NASA-Goddard/395013845897?ref=tsd" rel="nofollow">Facebook</a></b> <b>Find us on <a href="http://instagrid.me/nasagoddard/?vm=grid" rel="nofollow">Instagram</a></b>

An iceberg trapped in sea ice in the Amundsen Sea, seen from the IceBridge DC-8 during the Getz 07 mission on Oct. 27. Credit: NASA / Maria-Jose Vinas NASA's Operation IceBridge is an airborne science mission to study Earth's polar ice. For more information about IceBridge, visit: <a href="http://www.nasa.gov/icebridge" rel="nofollow">www.nasa.gov/icebridge</a> <b><a href="http://www.nasa.gov/audience/formedia/features/MP_Photo_Guidelines.html" rel="nofollow">NASA image use policy.</a></b> <b><a href="http://www.nasa.gov/centers/goddard/home/index.html" rel="nofollow">NASA Goddard Space Flight Center</a></b> enables NASA’s mission through four scientific endeavors: Earth Science, Heliophysics, Solar System Exploration, and Astrophysics. Goddard plays a leading role in NASA’s accomplishments by contributing compelling scientific knowledge to advance the Agency’s mission. <b>Follow us on <a href="http://twitter.com/NASA_GoddardPix" rel="nofollow">Twitter</a></b> <b>Like us on <a href="http://www.facebook.com/pages/Greenbelt-MD/NASA-Goddard/395013845897?ref=tsd" rel="nofollow">Facebook</a></b> <b>Find us on <a href="http://instagrid.me/nasagoddard/?vm=grid" rel="nofollow">Instagram</a></b>

Low-lying clouds over sea ice on the Bellingshausen Sea. Credit: NASA / Maria-Jose Vinas NASA's Operation IceBridge is an airborne science mission to study Earth's polar ice. For more information about IceBridge, visit: <a href="http://www.nasa.gov/icebridge" rel="nofollow">www.nasa.gov/icebridge</a> <b><a href="http://www.nasa.gov/audience/formedia/features/MP_Photo_Guidelines.html" rel="nofollow">NASA image use policy.</a></b> <b><a href="http://www.nasa.gov/centers/goddard/home/index.html" rel="nofollow">NASA Goddard Space Flight Center</a></b> enables NASA’s mission through four scientific endeavors: Earth Science, Heliophysics, Solar System Exploration, and Astrophysics. Goddard plays a leading role in NASA’s accomplishments by contributing compelling scientific knowledge to advance the Agency’s mission. <b>Follow us on <a href="http://twitter.com/NASA_GoddardPix" rel="nofollow">Twitter</a></b> <b>Like us on <a href="http://www.facebook.com/pages/Greenbelt-MD/NASA-Goddard/395013845897?ref=tsd" rel="nofollow">Facebook</a></b> <b>Find us on <a href="http://instagrid.me/nasagoddard/?vm=grid" rel="nofollow">Instagram</a></b>
Peering into the thousands of frozen layers inside Greenland’s ice sheet is like looking back in time. Each layer provides a record of what Earth’s climate was like at the dawn of civilization, or during the last ice age, or during an ancient period of warmth similar to the one we experience today. Scientists using ice-penetrating radar data collected by NASA’s Operation IceBridge and earlier airborne campaigns have built the first-ever comprehensive map of layers deep inside the Greenland Ice Sheet. View the full video: <a href="http://youtu.be/u0VbPE0TOtQ" rel="nofollow">youtu.be/u0VbPE0TOtQ</a> Credit: NASA’s Goddard Space Flight Center <b><a href="http://www.nasa.gov/audience/formedia/features/MP_Photo_Guidelines.html" rel="nofollow">NASA image use policy.</a></b> <b><a href="http://www.nasa.gov/centers/goddard/home/index.html" rel="nofollow">NASA Goddard Space Flight Center</a></b> enables NASA’s mission through four scientific endeavors: Earth Science, Heliophysics, Solar System Exploration, and Astrophysics. Goddard plays a leading role in NASA’s accomplishments by contributing compelling scientific knowledge to advance the Agency’s mission. <b>Follow us on <a href="http://twitter.com/NASAGoddardPix" rel="nofollow">Twitter</a></b> <b>Like us on <a href="http://www.facebook.com/pages/Greenbelt-MD/NASA-Goddard/395013845897?ref=tsd" rel="nofollow">Facebook</a></b> <b>Find us on <a href="http://instagram.com/nasagoddard?vm=grid" rel="nofollow">Instagram</a></b>
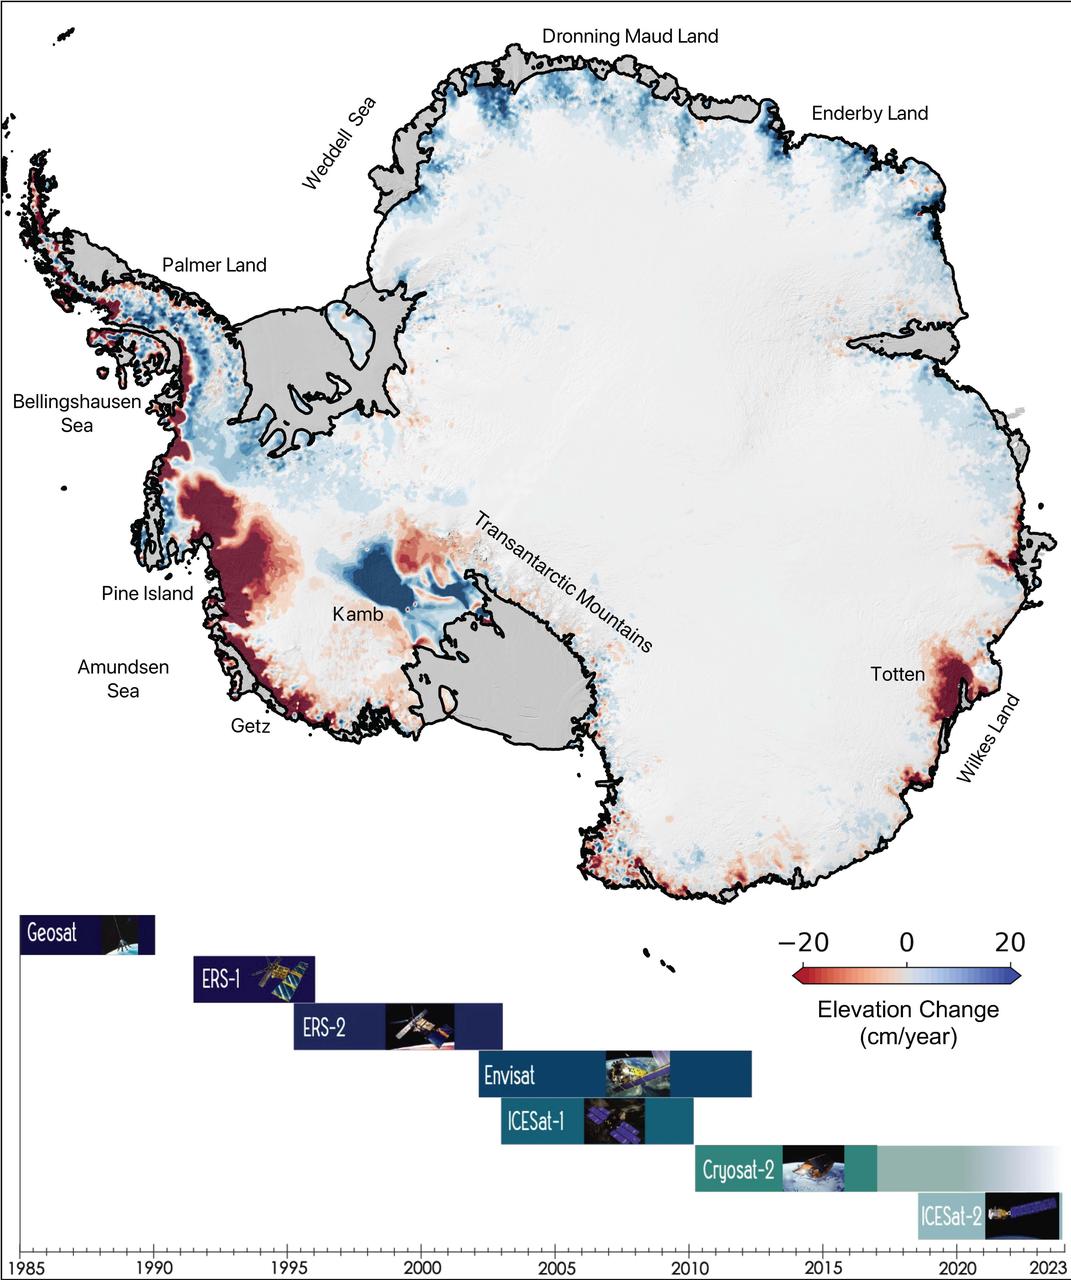
This map of Antarctica shows the changes in the elevation of the Antarctic ice sheet from 1985 through 2021. The map is part of a study, published in Earth System Science Data, conducted by researchers at NASA's Jet Propulsion Laboratory in Southern California. Ice height diminishes (shown in red) as the ice sheet melts by contact with ocean water; ice height rises (shown in blue) where accumulation exceeds ice loss. Ice shelves are shown in gray. The Pine Island and Thwaites glaciers in West Antarctica (the dark red spots on the left side of the map) are the largest areas of rapid ice loss. The stagnant Kamb Ice Stream (the dark blue area at middle-left) is the only major site of rapid accumulation as ice continues to push in from the interior but no longer flows out to an ice shelf. The image summarizes a new data set of monthly high-resolution "snapshots" of ice change. The satellite altimetry missions that supplied data for the study are listed in the timeline at the bottom of the image: Geosat (U.S. Navy), ERS-1 and ERS-2 (ESA, or European Space Agency), Envisat (ESA), ICESat-1 (NASA), Cryosat-2 (ESA), and ICESat-2 (NASA). https://photojournal.jpl.nasa.gov/catalog/PIA24990
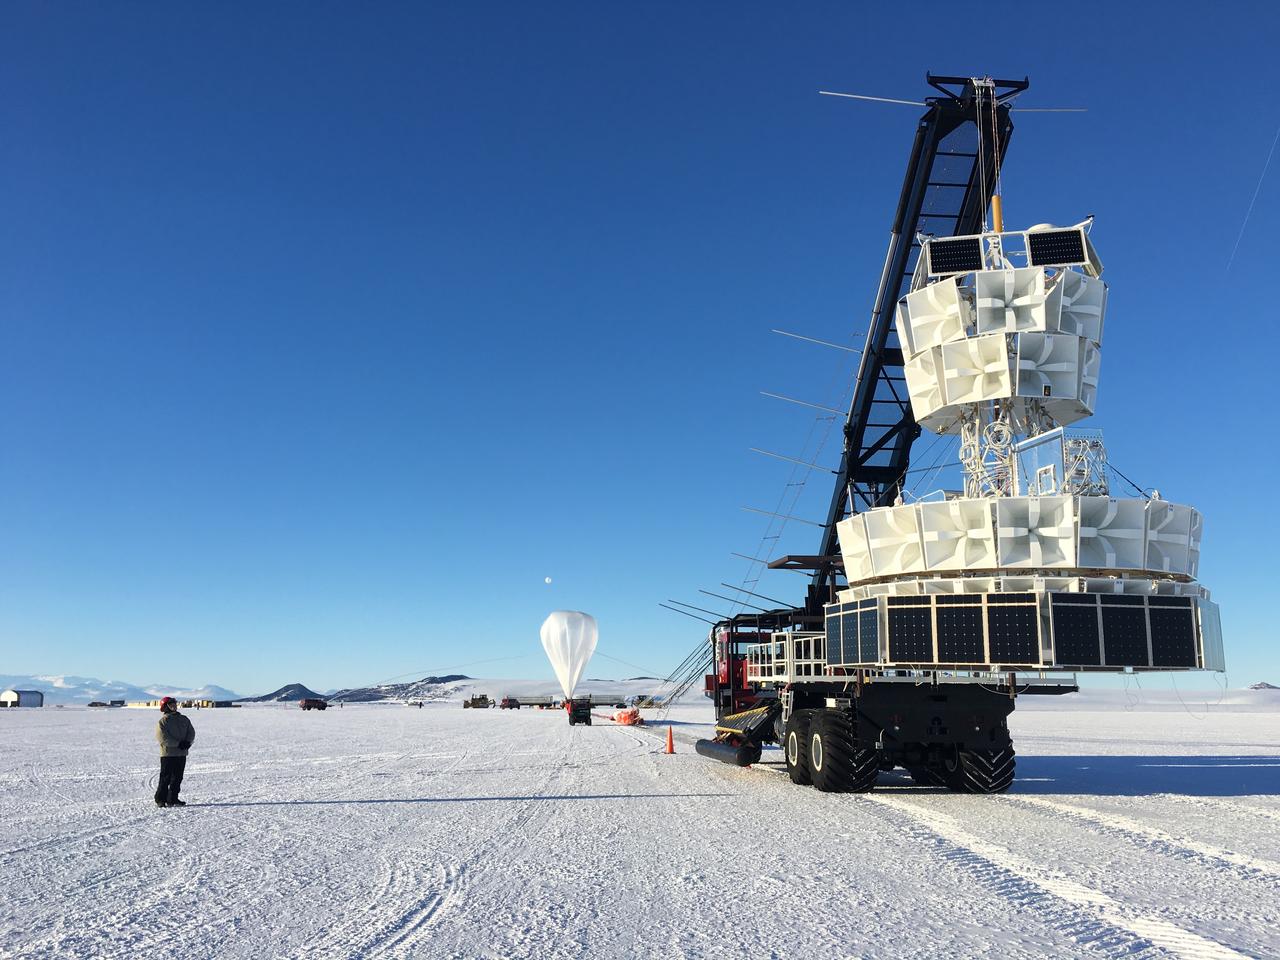
The second of three missions as part of NASA’s Antarctica Long Duration Balloon Flight Campaign was successfully launched at 8:10 a.m. EDT, Dec. 2. The Antarctic Impulsive Transient Antenna (ANITA) from the University of Hawaii at Manoa was launched from Antarctica’s Ross Ice Shelf near McMurdo Station with support from the National Science Foundation’s United States Antarctic Program. Scientists will use ANITA’s instruments to study the reactions in the core of stars and as they explode via the release of neutrinos that travel to Earth and interact with the Antarctica ice. More: <a href="http://go.nasa.gov/2ghR6Le" rel="nofollow">go.nasa.gov/2ghR6Le</a>

Located off the east coast of Russia, the Sea of Okhotsk stretches down to 45 degrees North latitude, and sea ice forms regularly in the basin. In fact, it is the lowest latitude for seasonal sea ice formation in the world. On January 4, 2015, the Moderate Resolution Imaging Spectroradiometer (MODIS) on NASA’s Terra satellite captured this true-color image of the ice-covered Sea of Okhotsk. Every winter, winds from East Siberia, frigid air temperatures, and a large amount of freshwater flowing out from rivers promote the formation of sea ice in the region. Much of the freshwater comes from the Amur River, one of the ten longest rivers in the world. From year to year, variations in temperature and wind speed can cause large fluctuations in sea ice extent. The sea spans more than 1,500,000 square kilometers (600,000 square miles), and ice cover can spread across 50 to 90 percent of it at its annual peak. On average, that ice persists for 180 days. According to research published in 2014, the region's sea ice has been decreasing over a 34-year period. Annual ice production in the Sea of Okhotsk dropped by more than 11 percent from 1974 to 2008. The researchers suggest that this decline has, at least in part, "led to weakening of the overturning in the North Pacific." Water with less sea ice is fresher, less dense, and unable to sink and circulate as well as salty, dense water. A weakened circulation in the North Pacific has implications for the supply of nutrients, such as iron, that affect biological productivity. Credit: NASA/GSFC/Jeff Schmaltz/MODIS Land Rapid Response Team <b><a href="http://www.nasa.gov/audience/formedia/features/MP_Photo_Guidelines.html" rel="nofollow">NASA image use policy.</a></b> <b><a href="http://www.nasa.gov/centers/goddard/home/index.html" rel="nofollow">NASA Goddard Space Flight Center</a></b> enables NASA’s mission through four scientific endeavors: Earth Science, Heliophysics, Solar System Exploration, and Astrophysics. Goddard plays a leading role in NASA’s accomplishments by contributing compelling scientific knowledge to advance the Agency’s mission. <b>Follow us on <a href="http://twitter.com/NASAGoddardPix" rel="nofollow">Twitter</a></b> <b>Like us on <a href="http://www.facebook.com/pages/Greenbelt-MD/NASA-Goddard/395013845897?ref=tsd" rel="nofollow">Facebook</a></b> <b>Find us on <a href="http://instagram.com/nasagoddard?vm=grid" rel="nofollow">Instagram</a></b>
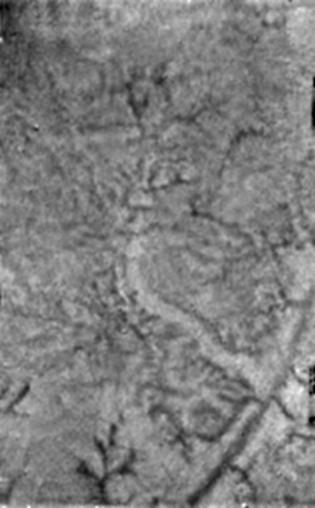
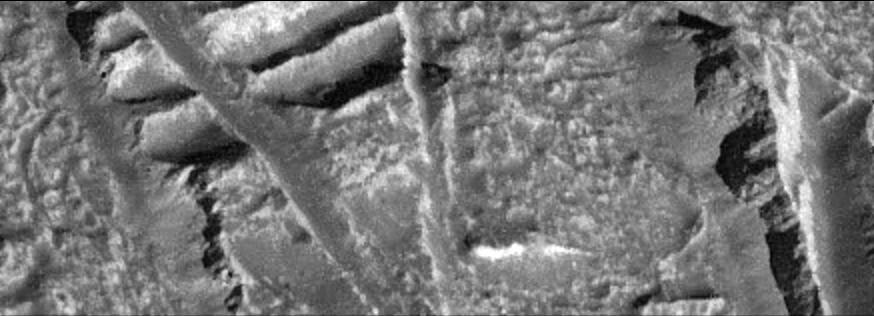
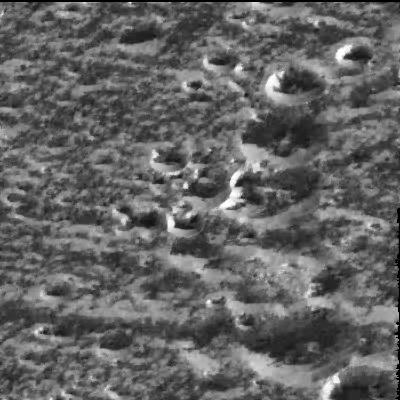
Recent small craters discovered by NASA Mars Reconnaissance Orbiter expose buried ice in the middle latitudes of Mars. This ice is a record of past climate change.
Mosaic image of sea ice in the Beaufort Sea created by the Digital Mapping System (DMS) instrument aboard the IceBridge P-3B. The dark area in the middle of the image is open water seen through a lead, or opening, in the ice. Light blue areas are thick sea ice and dark blue areas are thinner ice formed as water in the lead refreezes. Leads are formed when cracks develop in sea ice as it moves in response to wind and ocean currents. DMS uses a modified digital SLR camera that points down through a window in the underside of the plane, capturing roughly one frame per second. These images are then combined into an image mosaic using specialized computer software. Credit: NASA/DMS <b><a href="http://www.nasa.gov/audience/formedia/features/MP_Photo_Guidelines.html" rel="nofollow">NASA image use policy.</a></b> <b><a href="http://www.nasa.gov/centers/goddard/home/index.html" rel="nofollow">NASA Goddard Space Flight Center</a></b> enables NASA’s mission through four scientific endeavors: Earth Science, Heliophysics, Solar System Exploration, and Astrophysics. Goddard plays a leading role in NASA’s accomplishments by contributing compelling scientific knowledge to advance the Agency’s mission. <b>Follow us on <a href="http://twitter.com/NASA_GoddardPix" rel="nofollow">Twitter</a></b> <b>Like us on <a href="http://www.facebook.com/pages/Greenbelt-MD/NASA-Goddard/395013845897?ref=tsd" rel="nofollow">Facebook</a></b> <b>Find us on <a href="http://instagram.com/nasagoddard?vm=grid" rel="nofollow">Instagram</a></b>
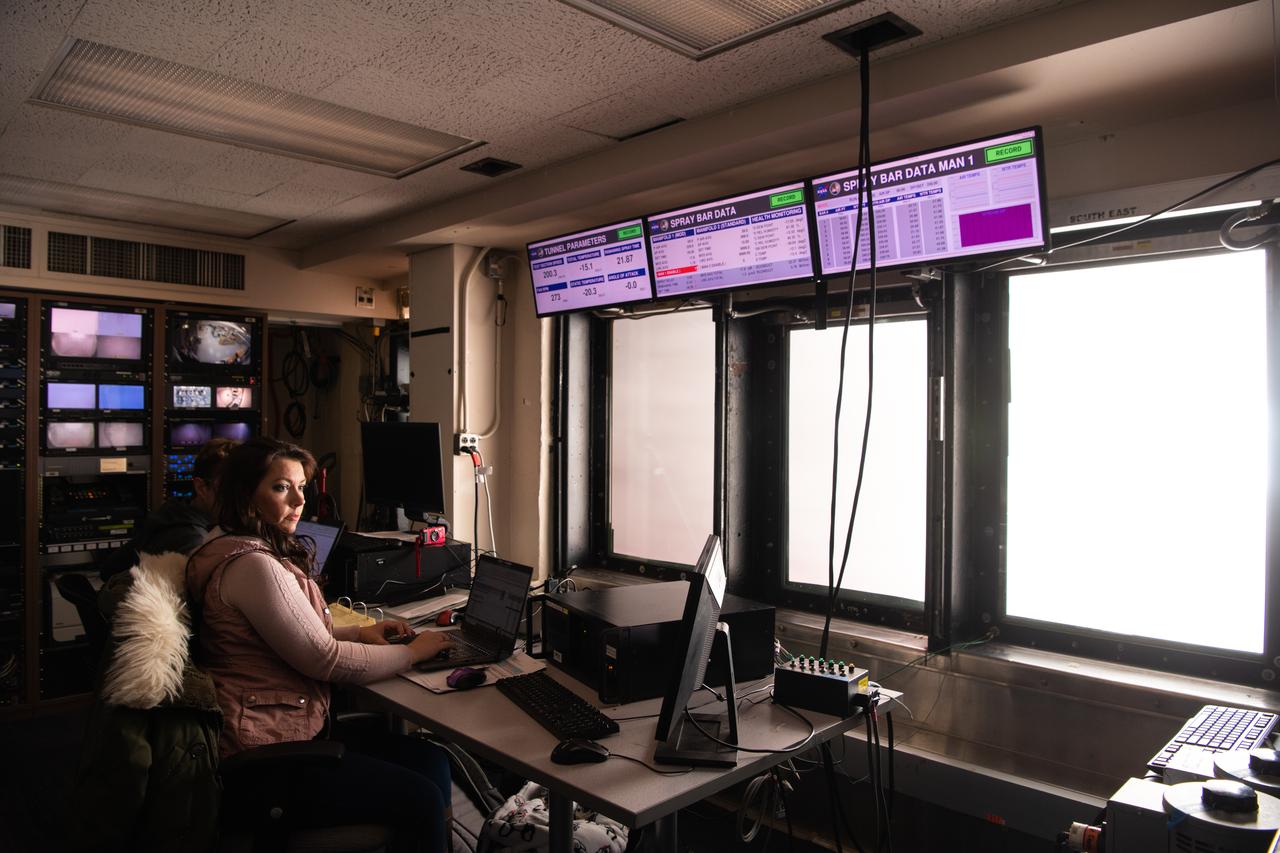
The Icing Research Tunnel (IRT) is the longest running, icing facility in the world and has been in operation since 1944. Most ice protection technologies in use today were largely developed at this facility. In this facility, natural icing conditions, such as the clouds being created here, are produced to test the effects of icing conditions on aircraft components such as wings tails and engine inlets.