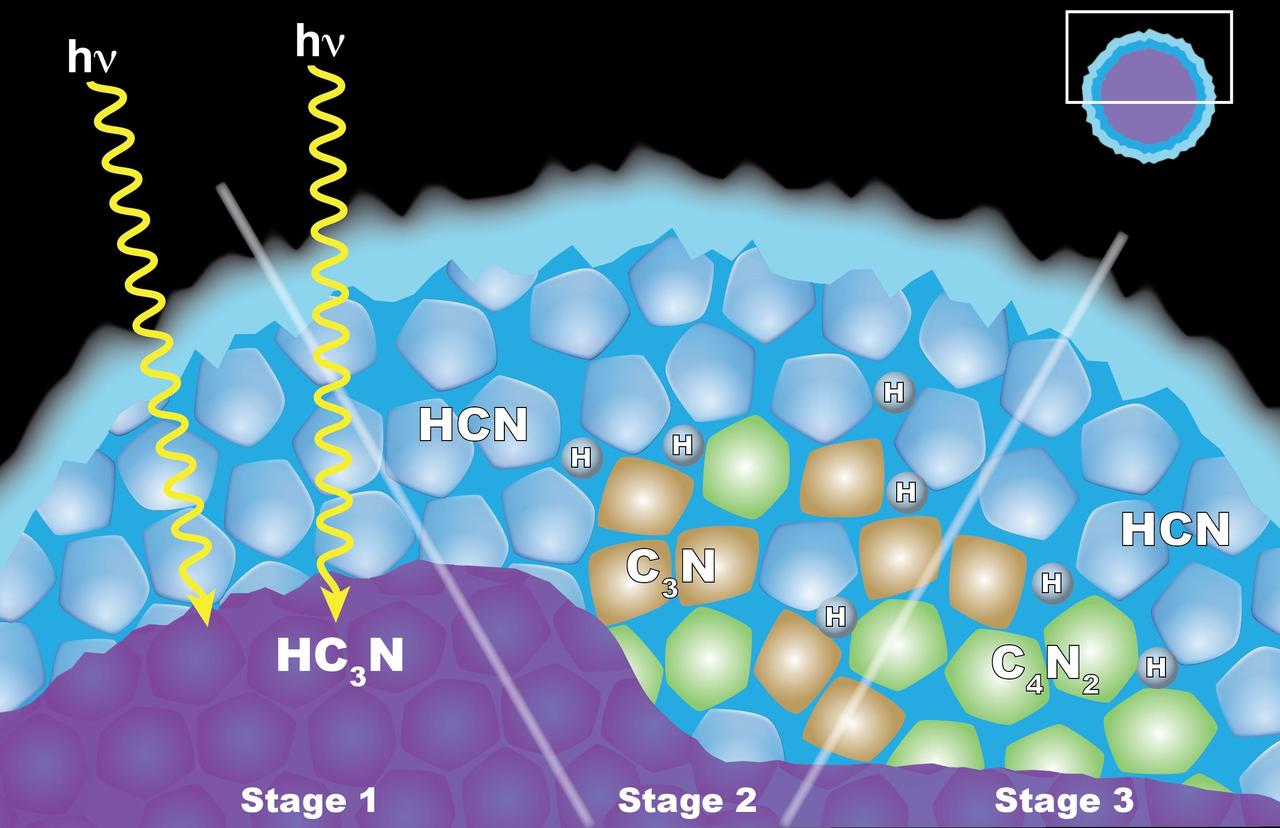
Scientists from NASA's Cassini mission suggested in a 2016 paper that the appearance of a cloud of dicyanoacetylene (C4N2) ice in Titan's stratosphere may be explained by "solid-state" chemistry taking place inside ice particles. The particles have an inner layer of cyanoacetylene (HC3N) ice coated with an outer layer of hydrogen cyanide (HCN) ice. Left: When a photon of light penetrates the outer shell, it can interact with the HC3N, producing C3N and H. Center: The C3N then reacts with HCN to yield C4N2 and H (shown at right). Another reaction that also yields C4N2 ice and H also is possible, but the researchers think it is less likely. http://photojournal.jpl.nasa.gov/catalog/PIA20715

Particle-image velocimetry (PIV) is performed on the upper surface of a pitching airfoil in the NASA Glenn Icing Research Tunnel. PIV is a laser-based flow velocity measurement technique used widely in wind tunnels. These experiments were conducted as part of a research project focused on enhancing rotorcraft speed, efficiency and maneuverability by suppressing dynamic stall.

How do you measure a cloud? Tim Bencic does it with lasers. The NASA Glenn engineer invented a tomography system for our Propulsion Systems Lab to help understand the dangers of ice crystal icing on airplanes. Bencic’s system, affectionally called “Tim-ography” is like a CAT Scan. The laser light within its circular geometry bounces off the surface of ice particles in the cloud and fiber optic detectors map out its properties. This tool is helping NASA’s researchers make aircraft safer in challenging weather conditions.
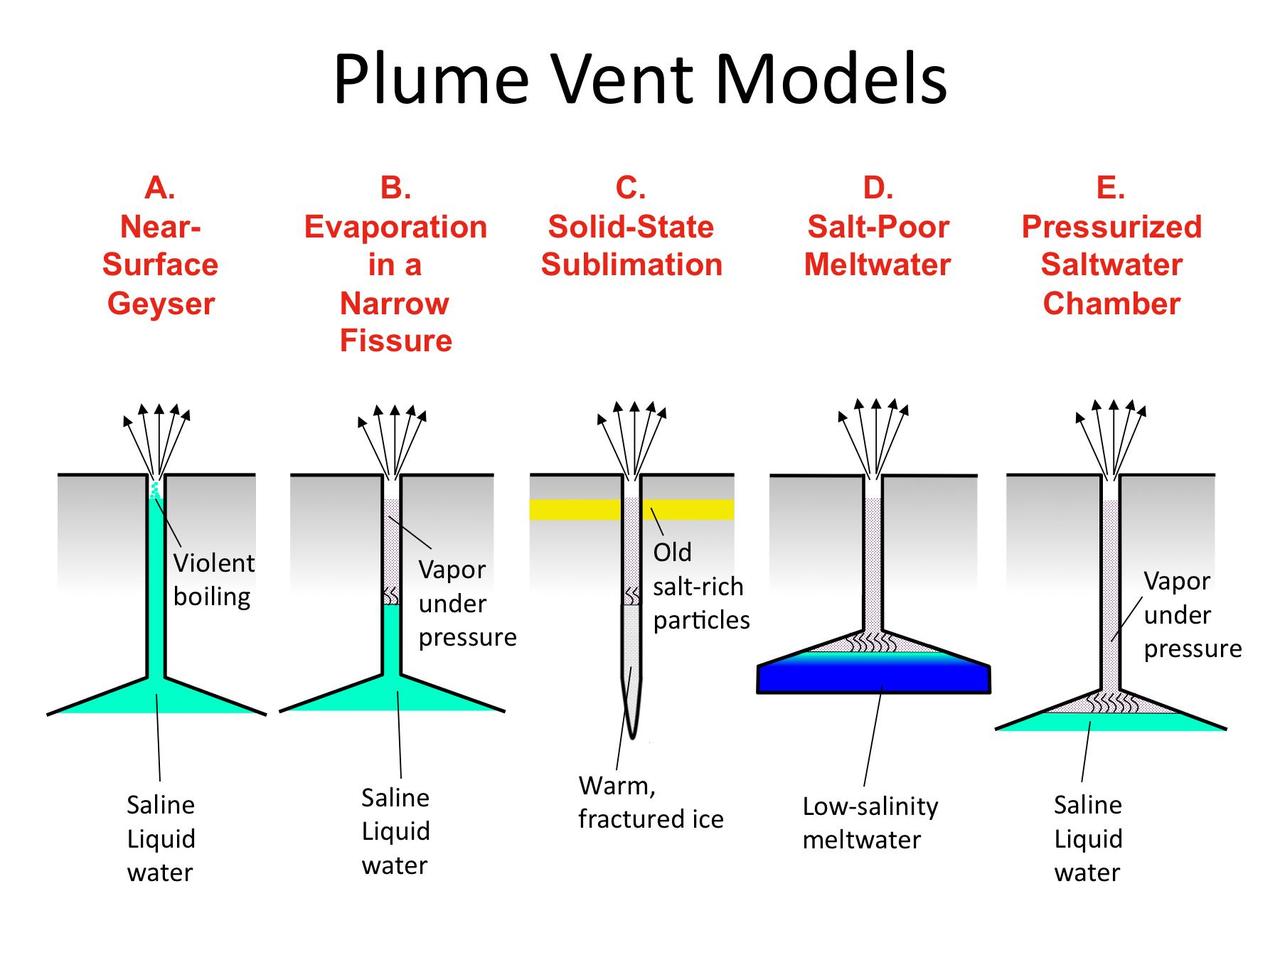
These illustrations indicate possible ways in which the water vapor and ice particles in the plume of Enceladus may be formed.
Enceladus continues to exhale water ice into Saturn orbit, keeping the E ring topped off with tiny particles
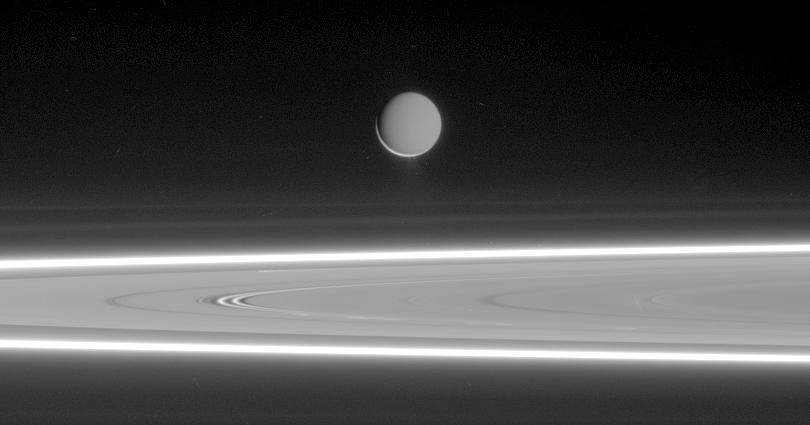
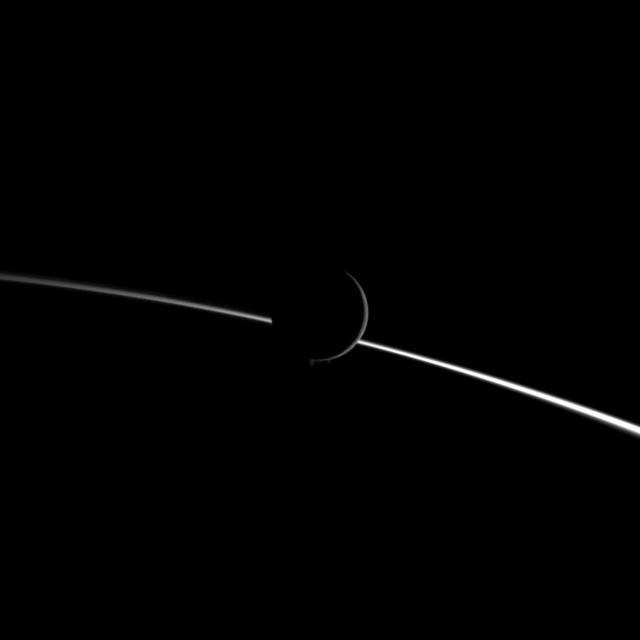
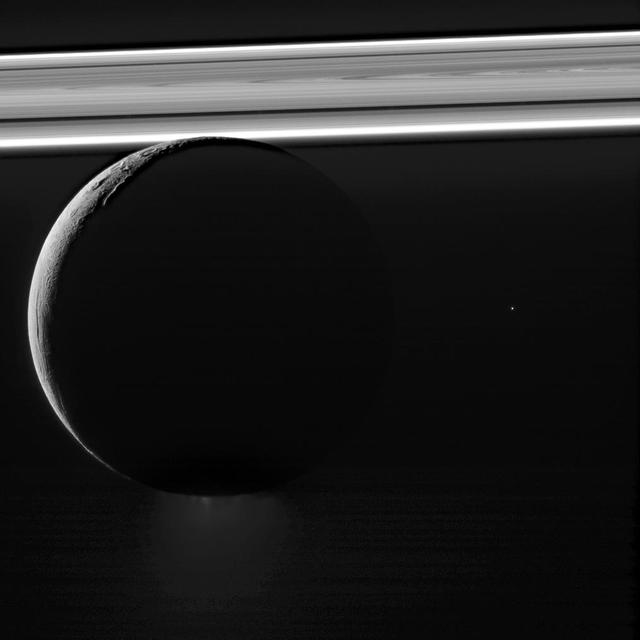
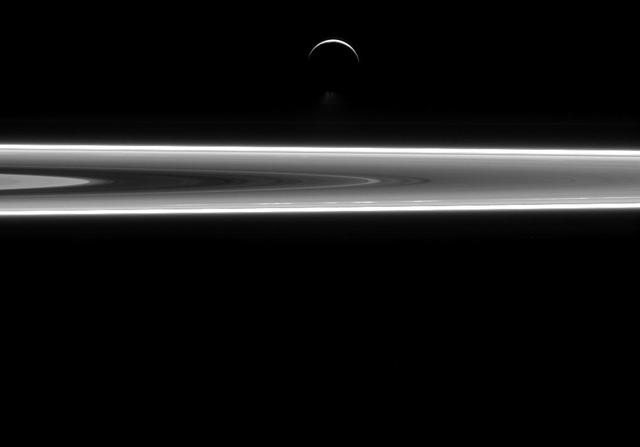
Lit by reflected light from Saturn, Enceladus appears to hover above the gleaming rings, its well-defined ice particle jets spraying a continuous hail of tiny ice grains
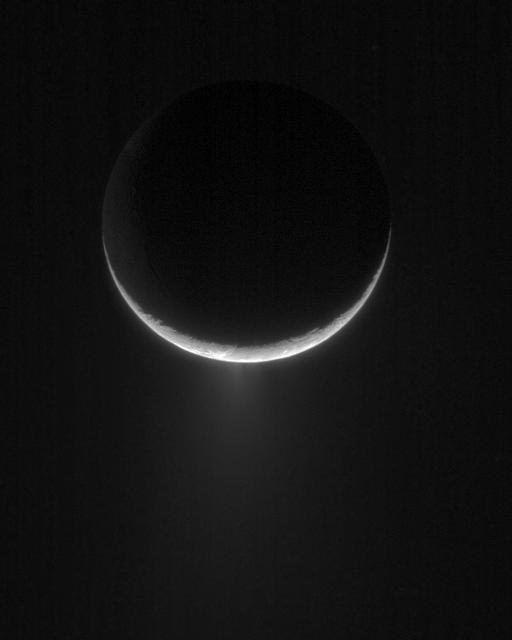
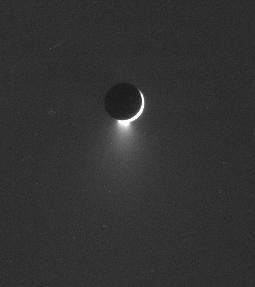
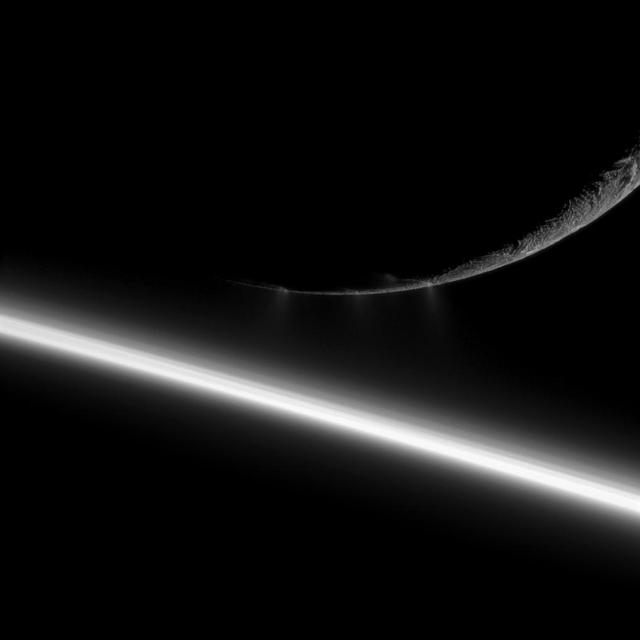
Peeking over the crescent of Enceladus, the Cassini spacecraft views the towering plume of ice particles erupting from the moon south polar region
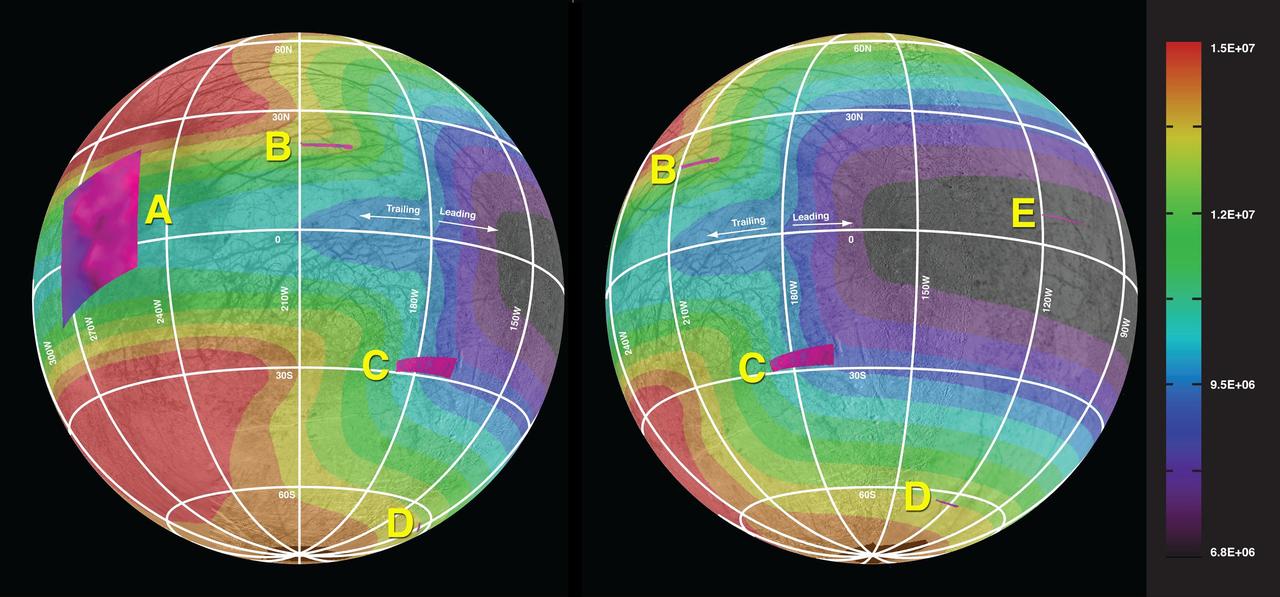
This graphic of Jupiter moon Europa maps a relationship between the amount of energy deposited onto the moon from charged-particle bombardment and chemical contents of ice deposits.
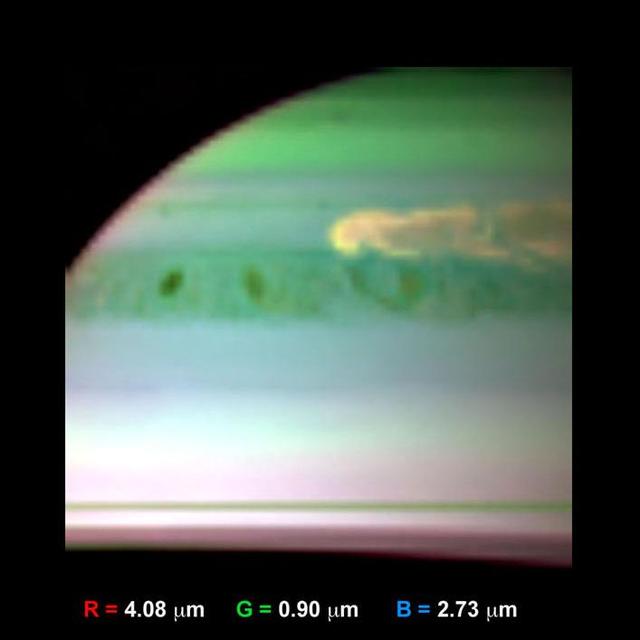
This false-color infrared image, obtained by NASA Cassini spacecraft, shows clouds of large ammonia ice particles dredged up by a powerful storm in Saturn northern hemisphere.
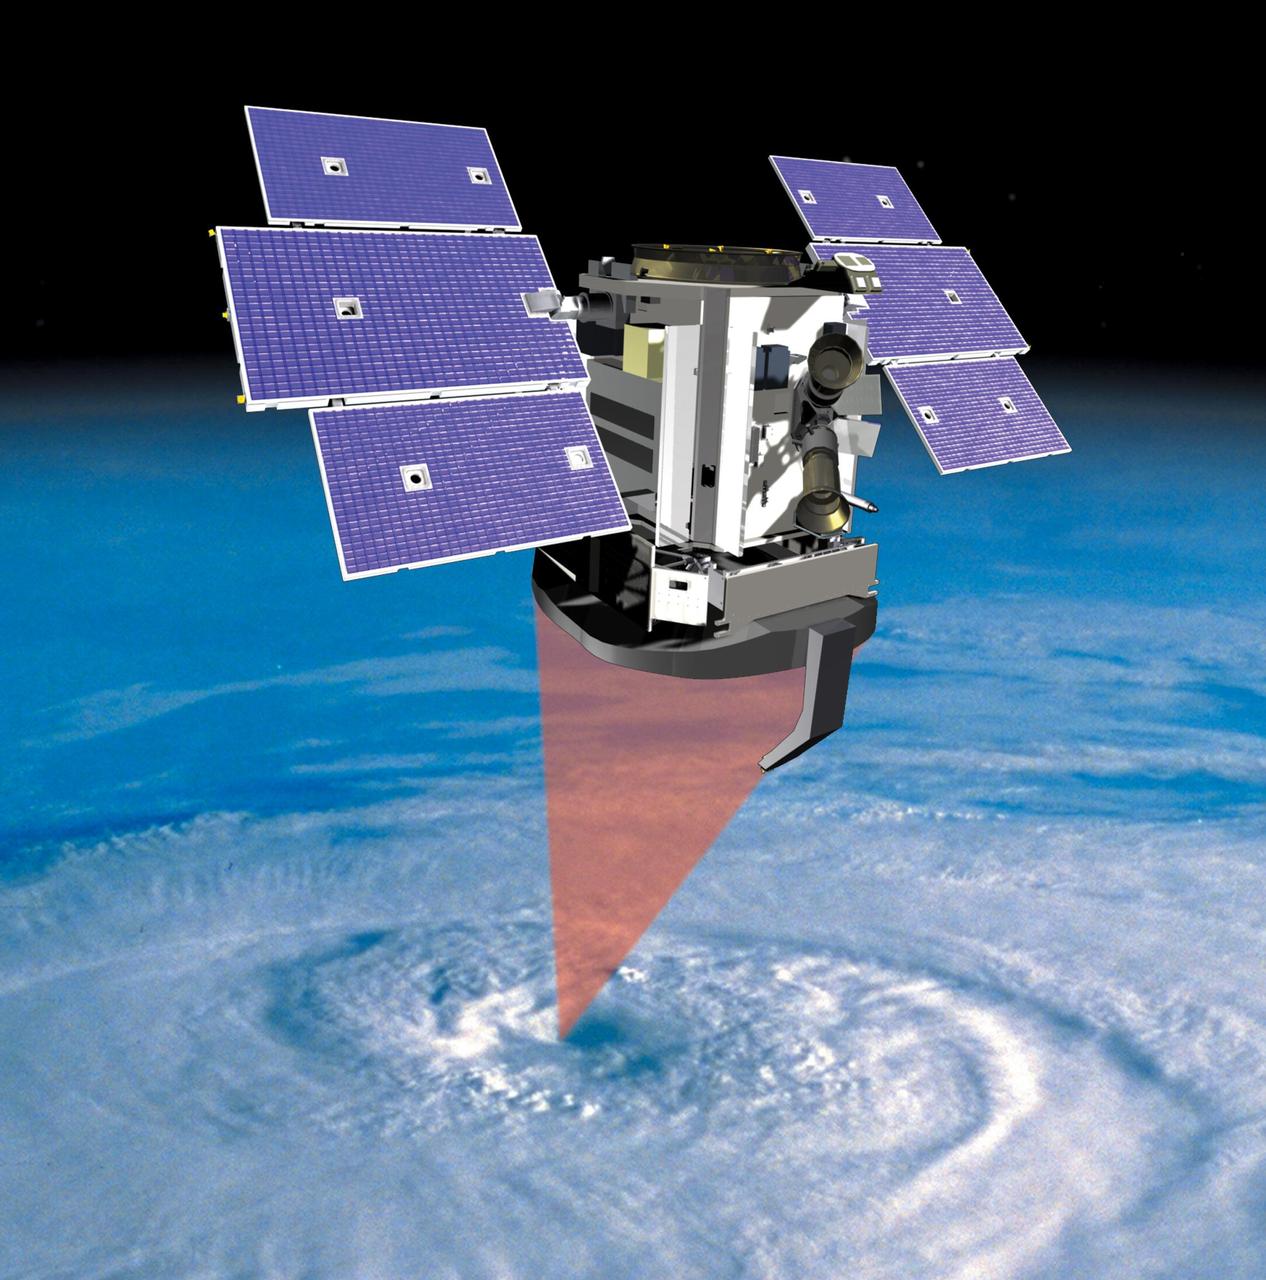
This artist concept shows NASA CloudSat spacecraft and its Cloud Profiling Radar using microwave energy to observe cloud particles and determine the mass of water and ice within clouds.
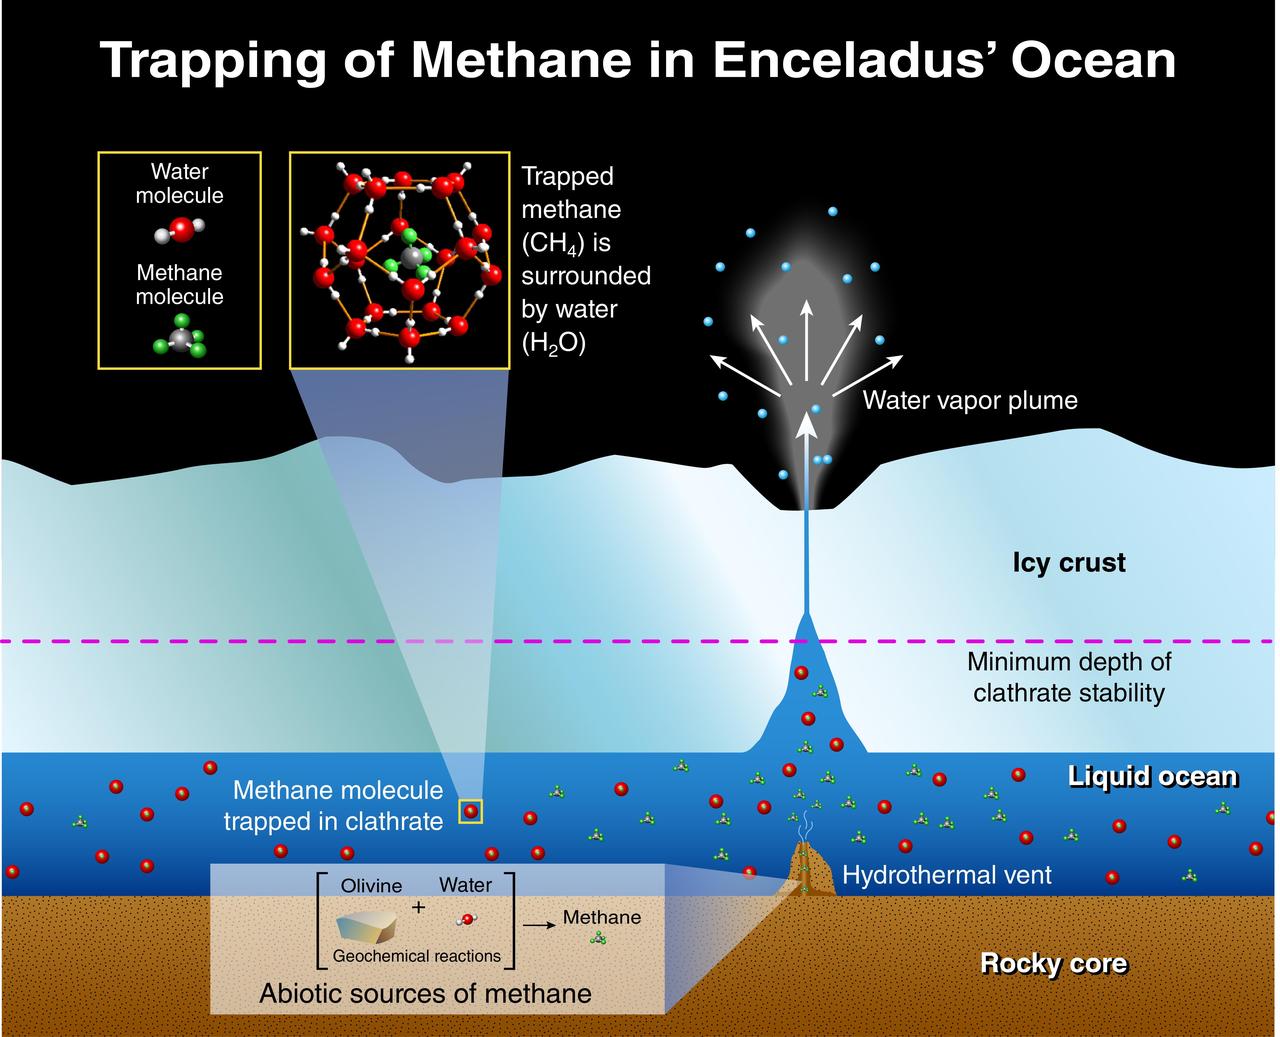
This illustration depicts potential origins of methane found in the plume of gas and ice particles that sprays from Saturn moon, Enceladus, based on research by scientists working with the Ion and Neutral Mass Spectrometer on NASA Cassini mission.
Jets of water ice particles spew from Saturn moon Enceladus in this image obtained by NASA Cassini spacecraft on Aug. 13, 2010. A crescent of the moon appears dimly illuminated in front of the bright limb of Saturn.
Small water ice particles fly from fissures in the south polar region of Saturn moon Enceladus in this image taken during the Aug. 13, 2010, flyby of the moon by NASA Cassini spacecraft.
NASA Cassini spacecraft examines old and new terrain on Saturn fascinating Enceladus, a moon where jets of water ice particles and vapor spew from the south pole. Newly created terrain is at the bottom, in the center and on the left of this view.
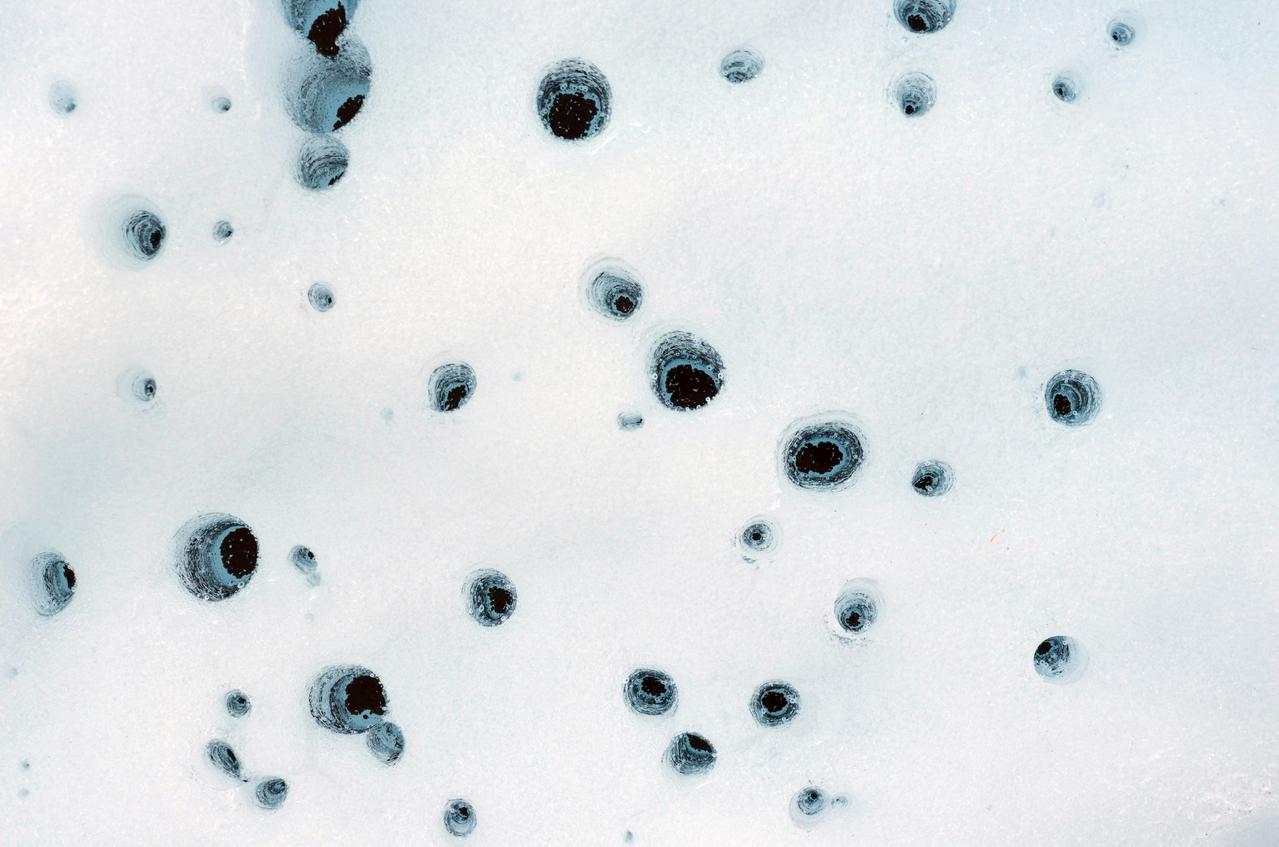
These holes, captured on Alaska's Matanuska Glacier in July 2012, are formed by cryoconite – dust particles that melt into the ice over time, eventually forming small pockets of water below the glacier's surface. Scientists believe similar pockets of water – called cryoconite holes on Earth – could form within dusty water ice on Mars. https://photojournal.jpl.nasa.gov/catalog/PIA26409
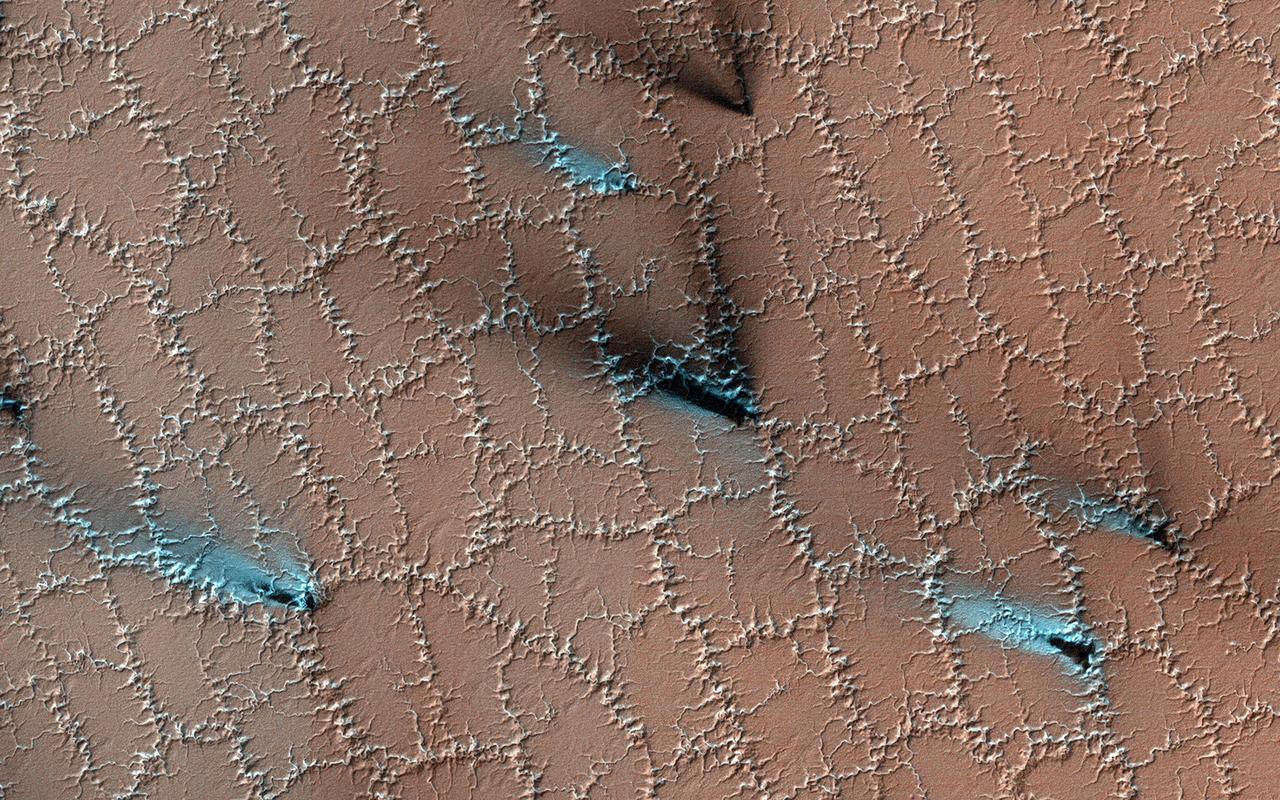
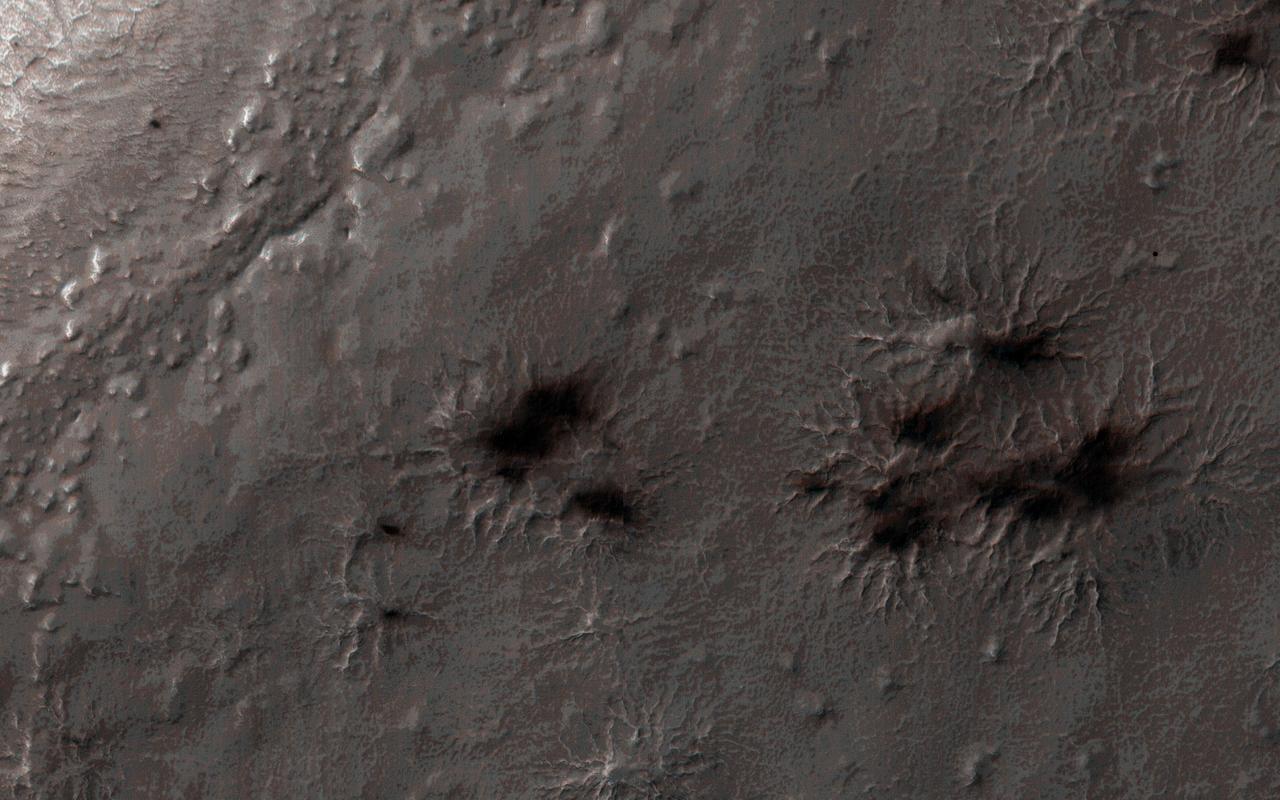
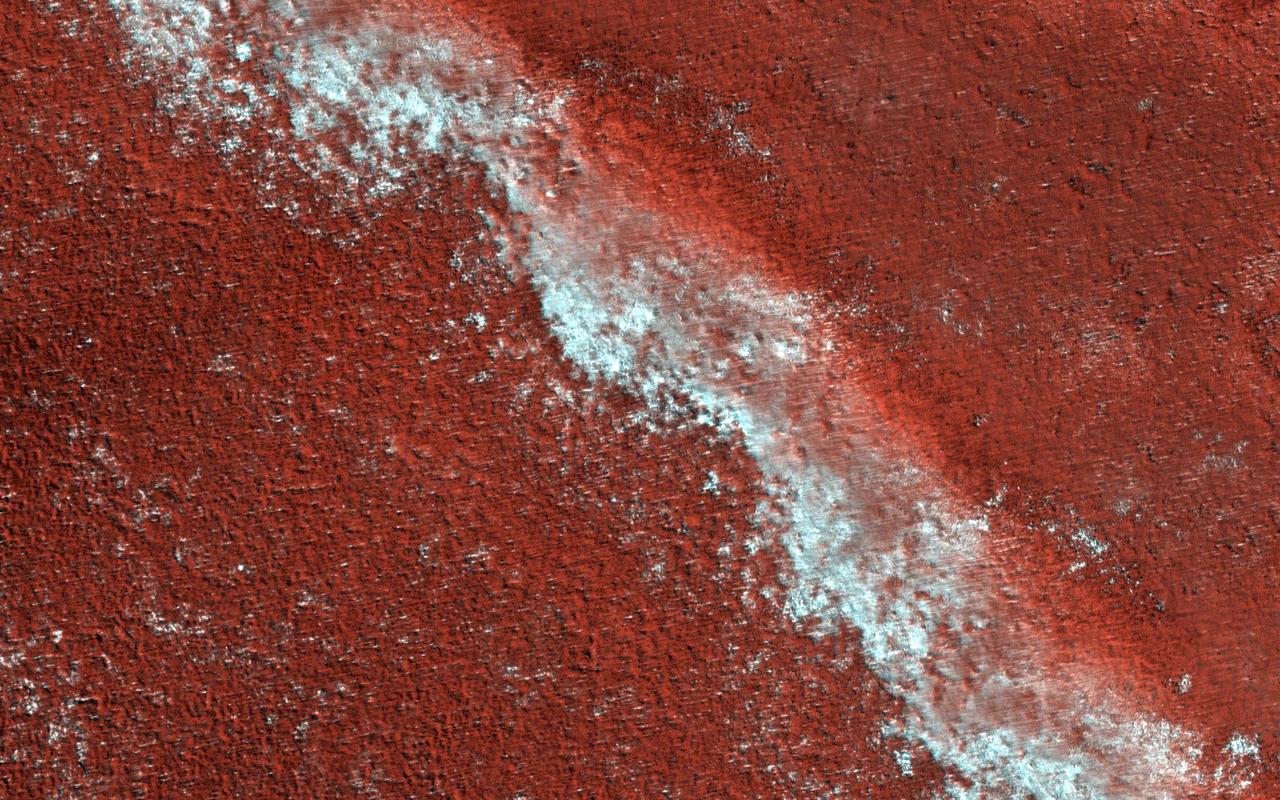
Both water and dry ice have a major role in sculpting Mars' surface at high latitudes. Water ice frozen in the soil splits the ground into polygons. Erosion of the channels forming the boundaries of the polygons by dry ice sublimating in the spring adds plenty of twists and turns to them. Spring activity is visible as the layer of translucent dry ice coating the surface develops vents that allow gas to escape. The gas carries along fine particles of material from the surface further eroding the channels. The particles drop to the surface in dark fan-shaped deposits. Sometimes the dark particles sink into the dry ice, leaving bright marks where the fans were originally deposited. Often the vent closes, then opens again, so we see two or more fans originating from the same spot but oriented in different directions as the wind changes. https://photojournal.jpl.nasa.gov/catalog/PIA25357
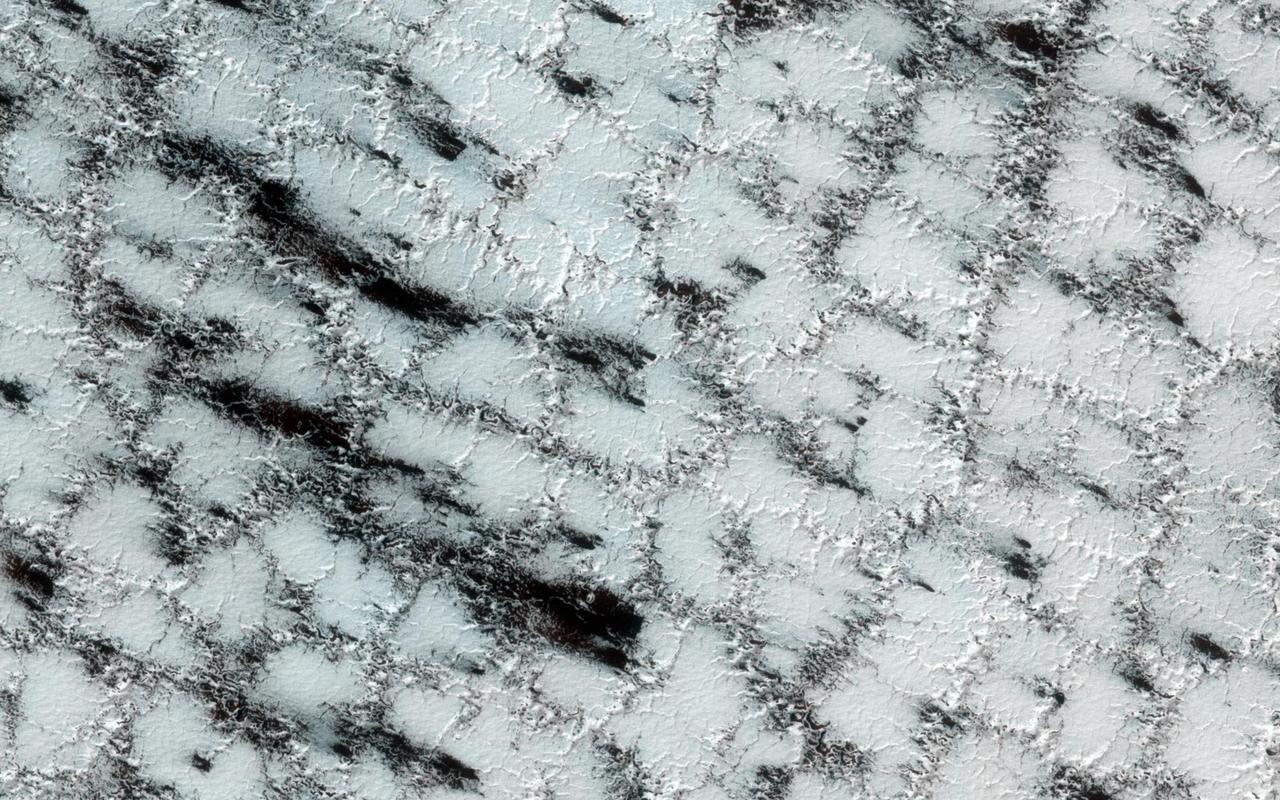
Although the season is late spring, carbon dioxide ice still covers much of the surface at this high latitude site. It is still a chilly -128 degrees Celsius. The weak boundaries of the polygonal structure of the surface have been eroded by spring sublimation of carbon dioxide as energy from the Sun turns ice to gas. The larger troughs in this image accentuate the surface polygonal structure, while the narrow cracks show the erosion caused when carbon dioxide gas escapes from under the seasonal ice layer carrying fine material from the surface. The dark fans in this image are made up of small particles from the surface deposited on top of the seasonal layer of ice. The fans originate at a crack, a weak spot that allows the gas to escape. The material is deposited in a direction determined by the direction of the wind as the gas was escaping. http://photojournal.jpl.nasa.gov/catalog/PIA19292
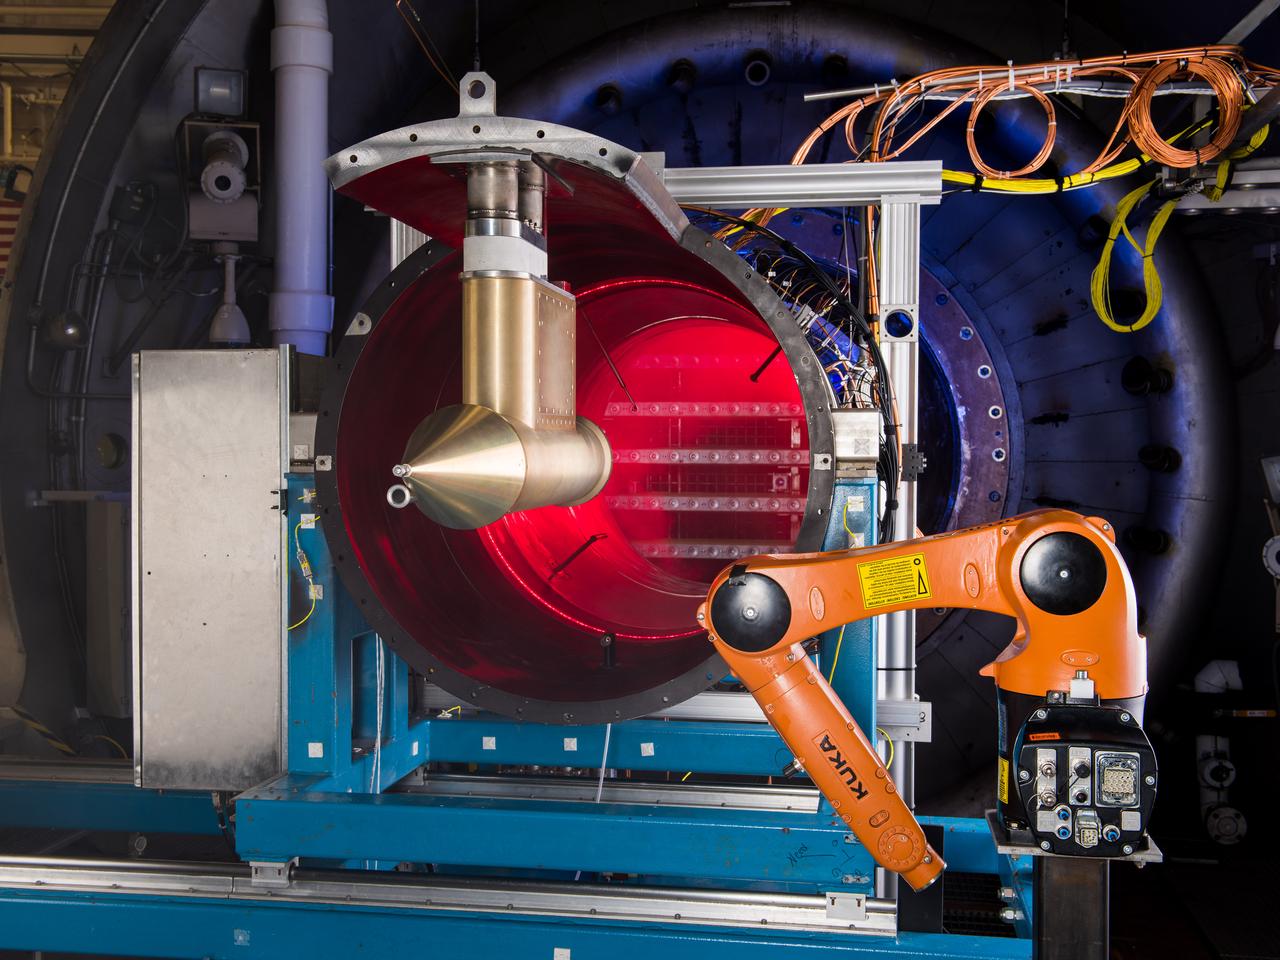
NASA Glenn’s Propulsion Systems Lab (PSL) is conducting research to characterize ice crystal clouds that can create a hazard to aircraft engines in certain conditions. With specialized equipment, scientists can create a simulated ice crystal cloud with the set of bars in the back spraying out a mist. The red area includes lasers, which measure the intensity of the cloud and a series of probes to measure everything from humidity to air pressure. The isokinetic probe (in gold) samples particles and the robotic arm (in orange) has a test tube on the end that catches ice particles for further measuring. NASA Glenn’s PSL is the only place in the world which can create these kind of ice crystal cloud conditions.
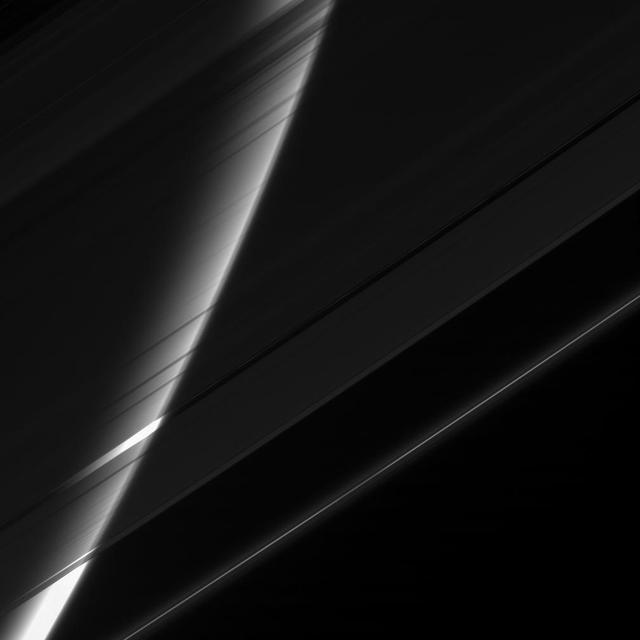
The Cassini spacecraft stares toward Saturn through its gauzy veil of rings. The great ice-particle screen acts like a filter here, attenuating the glare from the planet and making its high altitude haze easy to see
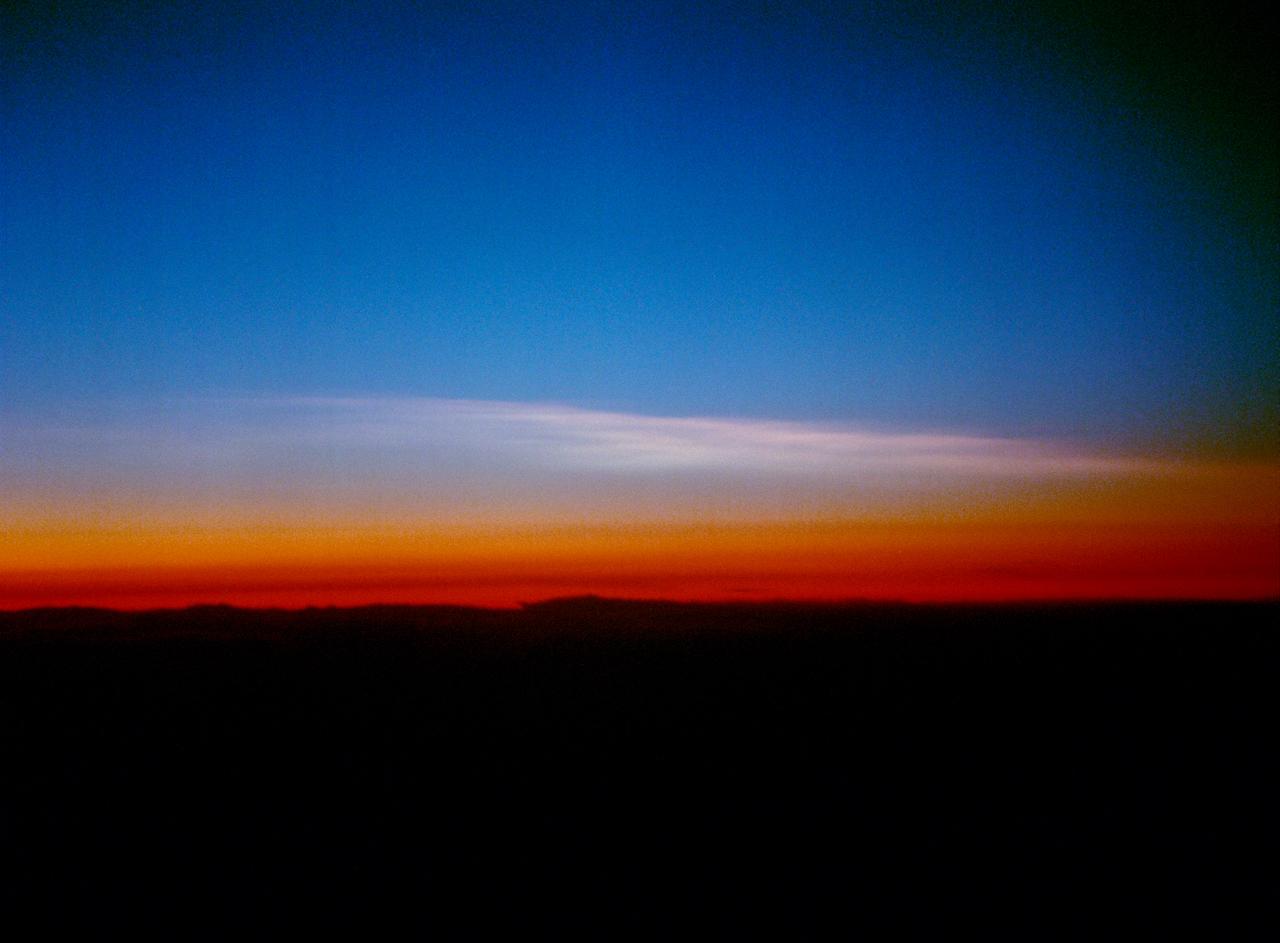
Arctic Ozone Expedition Stavanger Norway These clouds in the polar regions north of Stravanger, Norway are representative of what are called 'Type 1' and Type 2' polar stratospheric clouds. Type 1 are seen in the lower portion and consist of cloud particles comprised of nitrogen trihydrates. Seen edge-on as in this view, they appear as a thin dark orange or brown layer. Multiple layering can be seen. The Type 2 clouds are above and consist mostly of water molecules frozen as ice. The size of the particles in Type 2 clouds, the water-ice clouds, are much larger than the particle size of the Type 1 clouds - which are on the order of the wavelength of light.
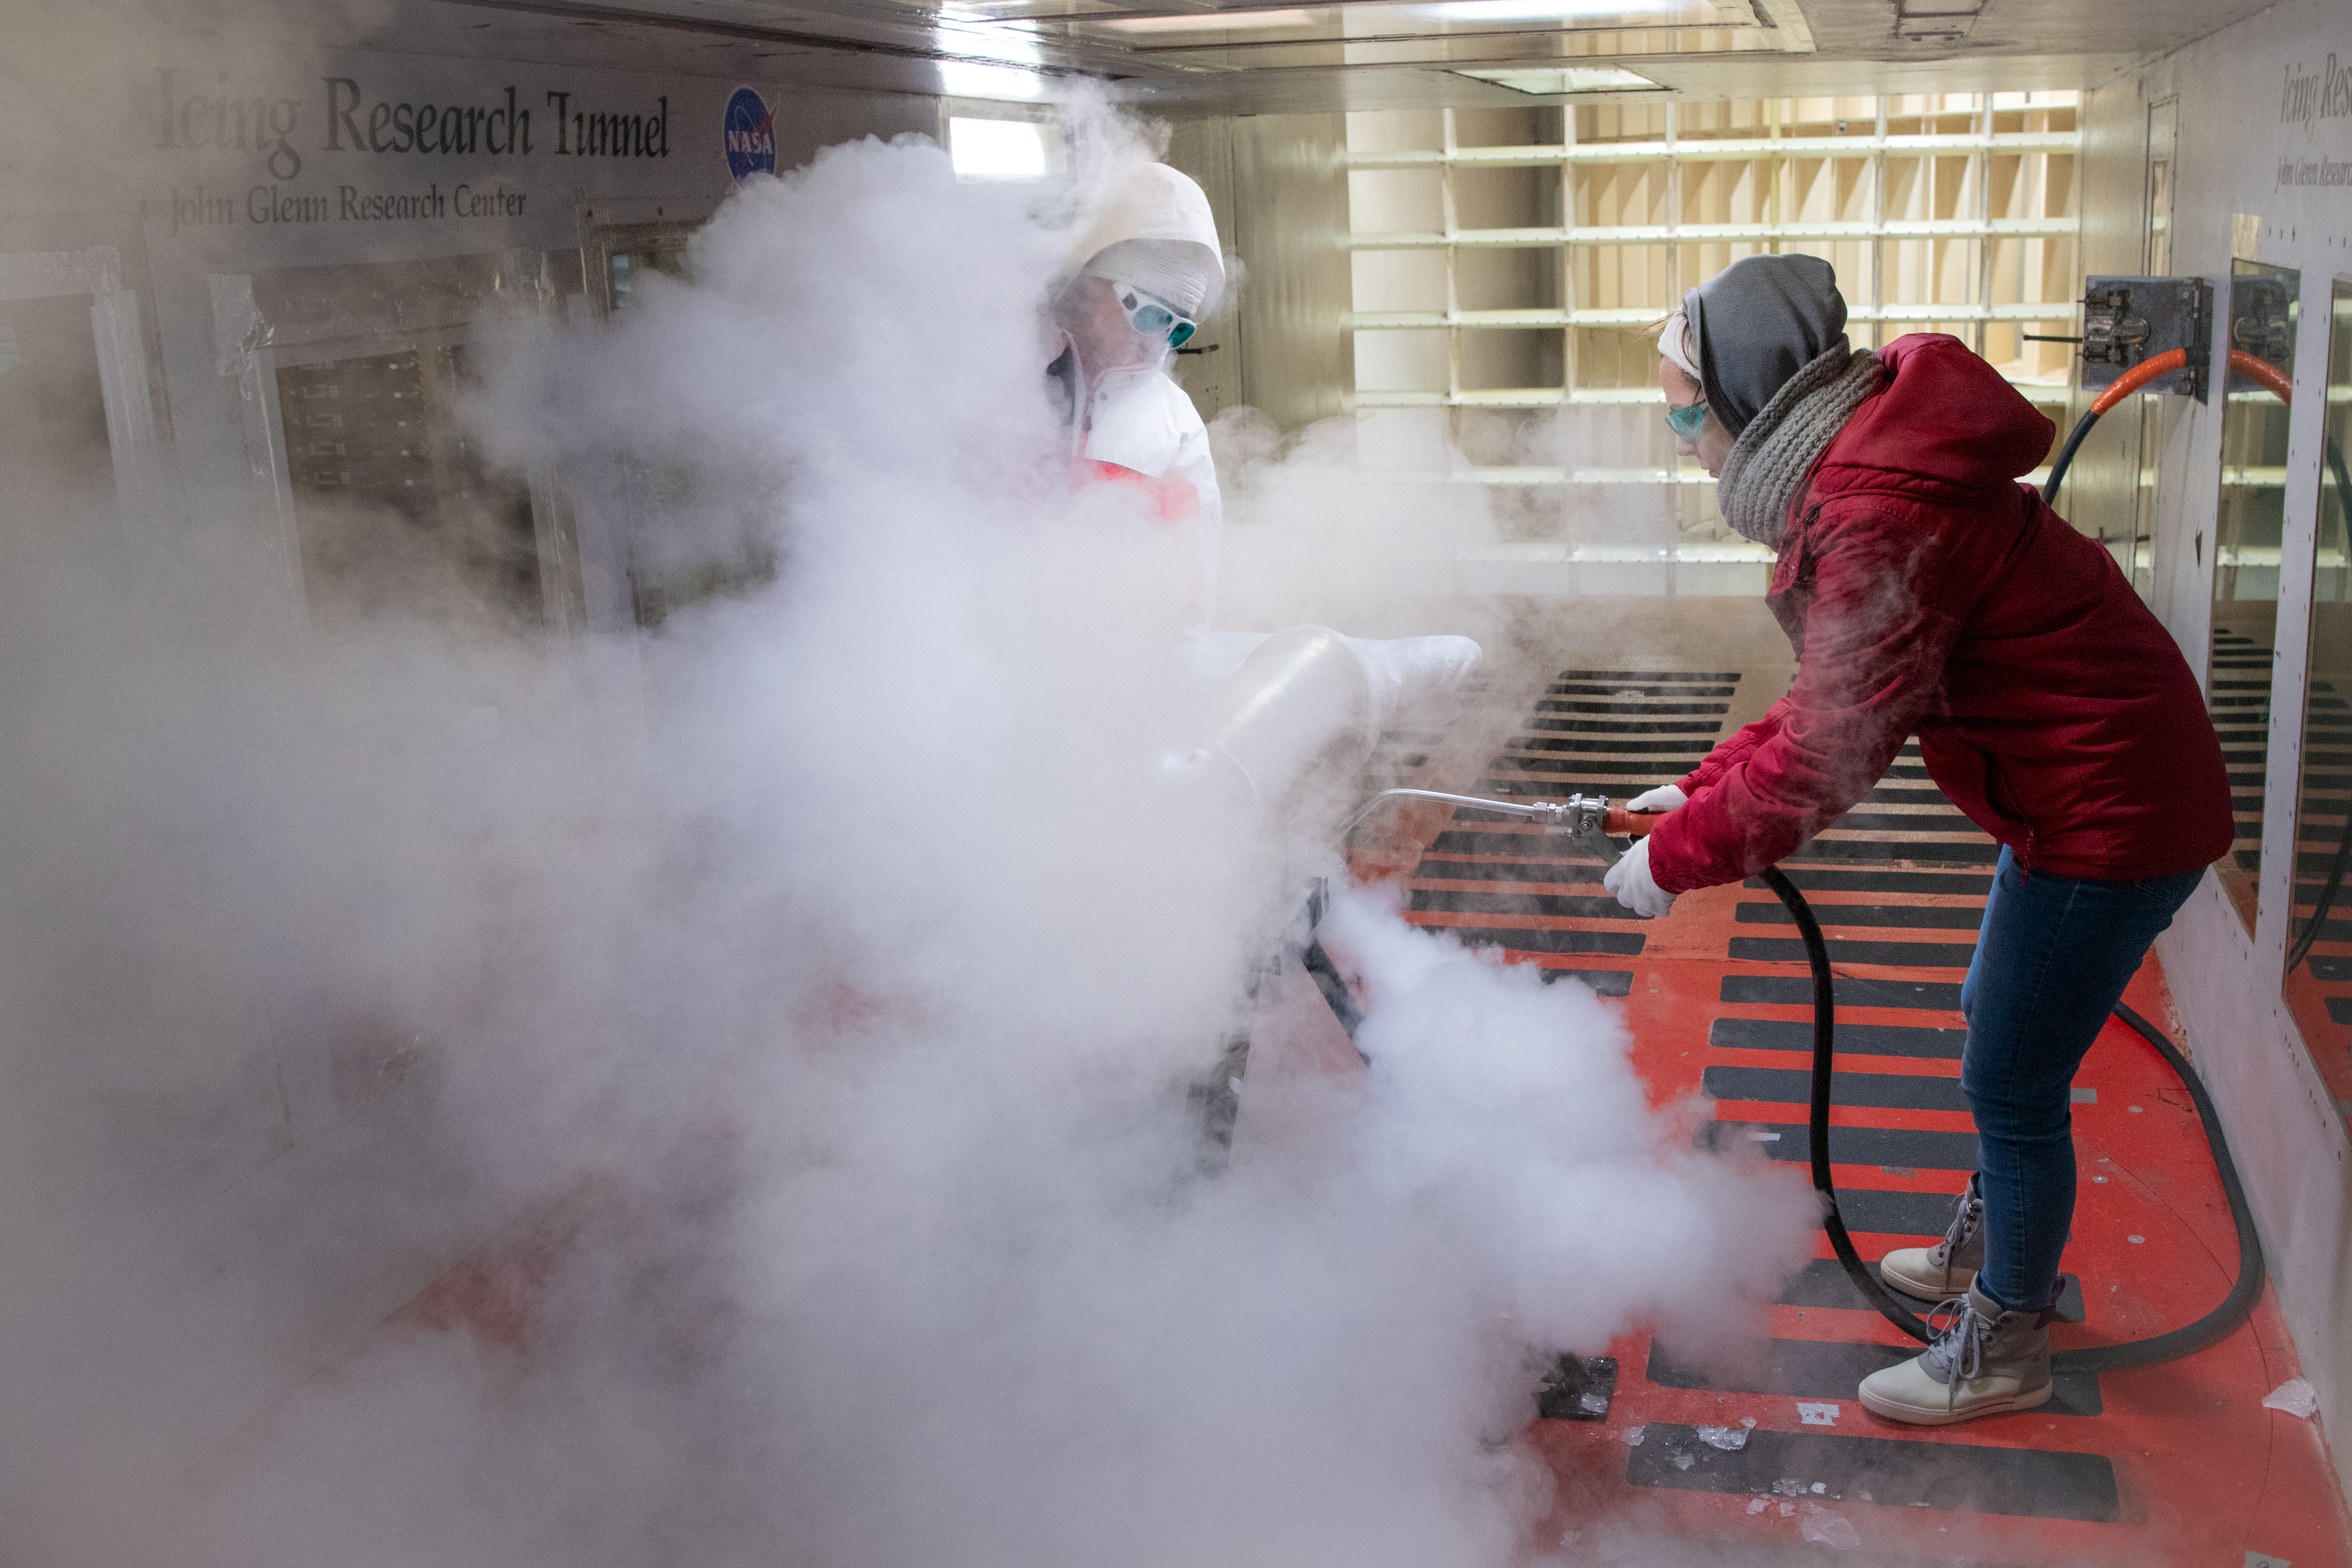
Test engineers clean the ice cloud detection probe in the Icing Research Tunnel in between test runs. Steam is used to melt the accumulated ice on the detection probe. The test engineers need to wear goggles to protect them from the laser light that the probe emits. The laser detects water content and ice particles in the cloud that the wind tunnel produces. This process is done to calibrate the tunnel for research by characterizing the cloud flow.
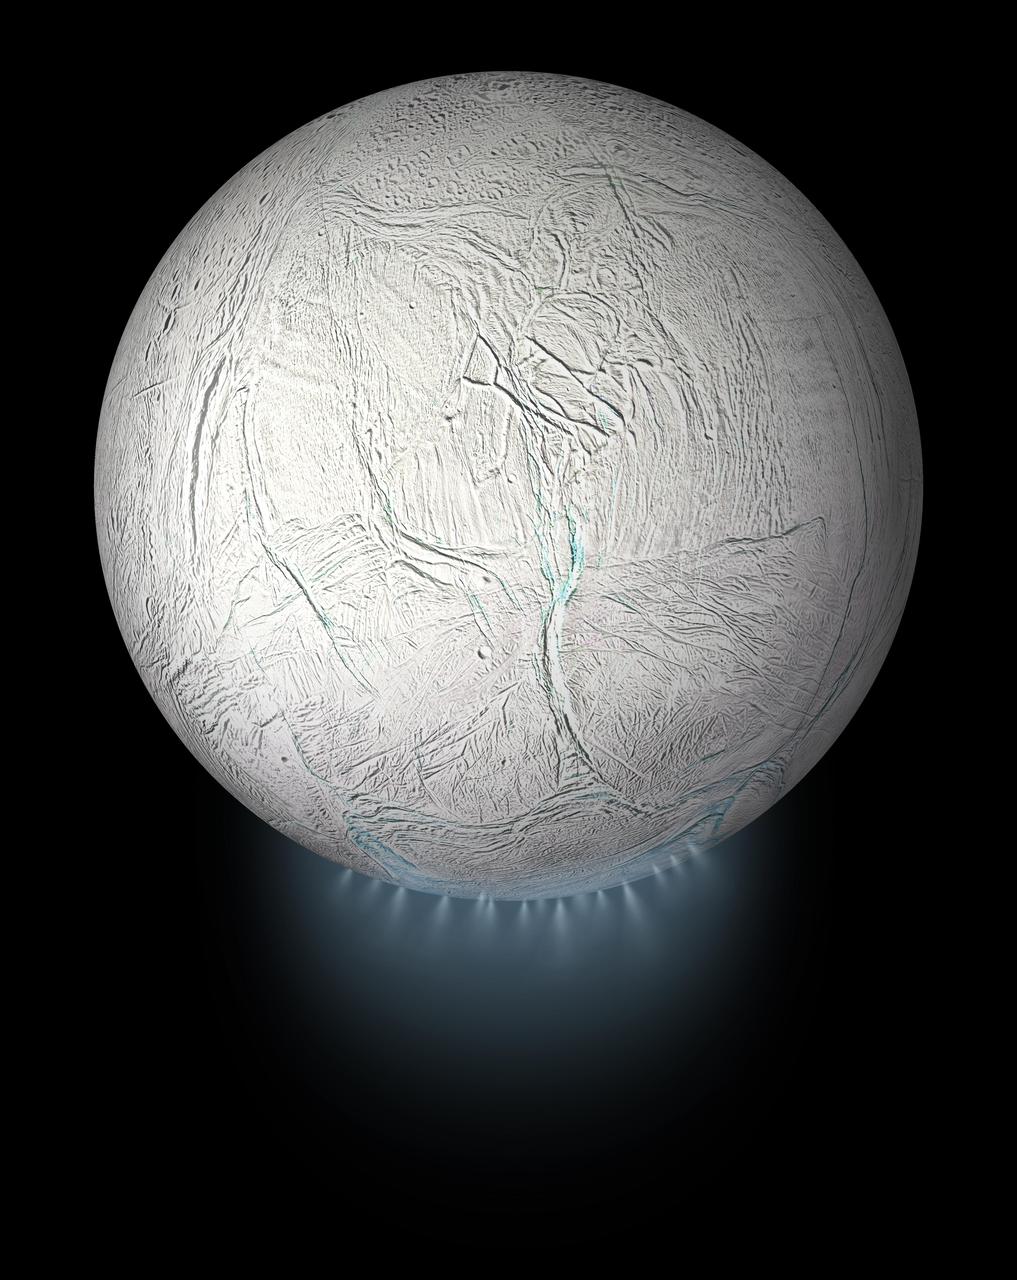
This illustration shows Saturn's icy moon Enceladus with the plume of ice particles, water vapor and organic molecules that sprays from fractures in the moon's south polar region. A cutaway version of this graphic is also available, showing the moon's interior ocean and hydrothermal activity — both of which were discovered by NASA's Cassini mission (see PIA20013). This global view was created using a Cassini-derived map of Enceladus (see PIA18435). More information about Enceladus is available at https://solarsystem.nasa.gov/moons/saturn-moons/enceladus/in-depth/. For more information about the Cassini-Huygens mission visit https://solarsystem.nasa.gov/missions/cassini/overview/. https://photojournal.jpl.nasa.gov/catalog/PIA23175
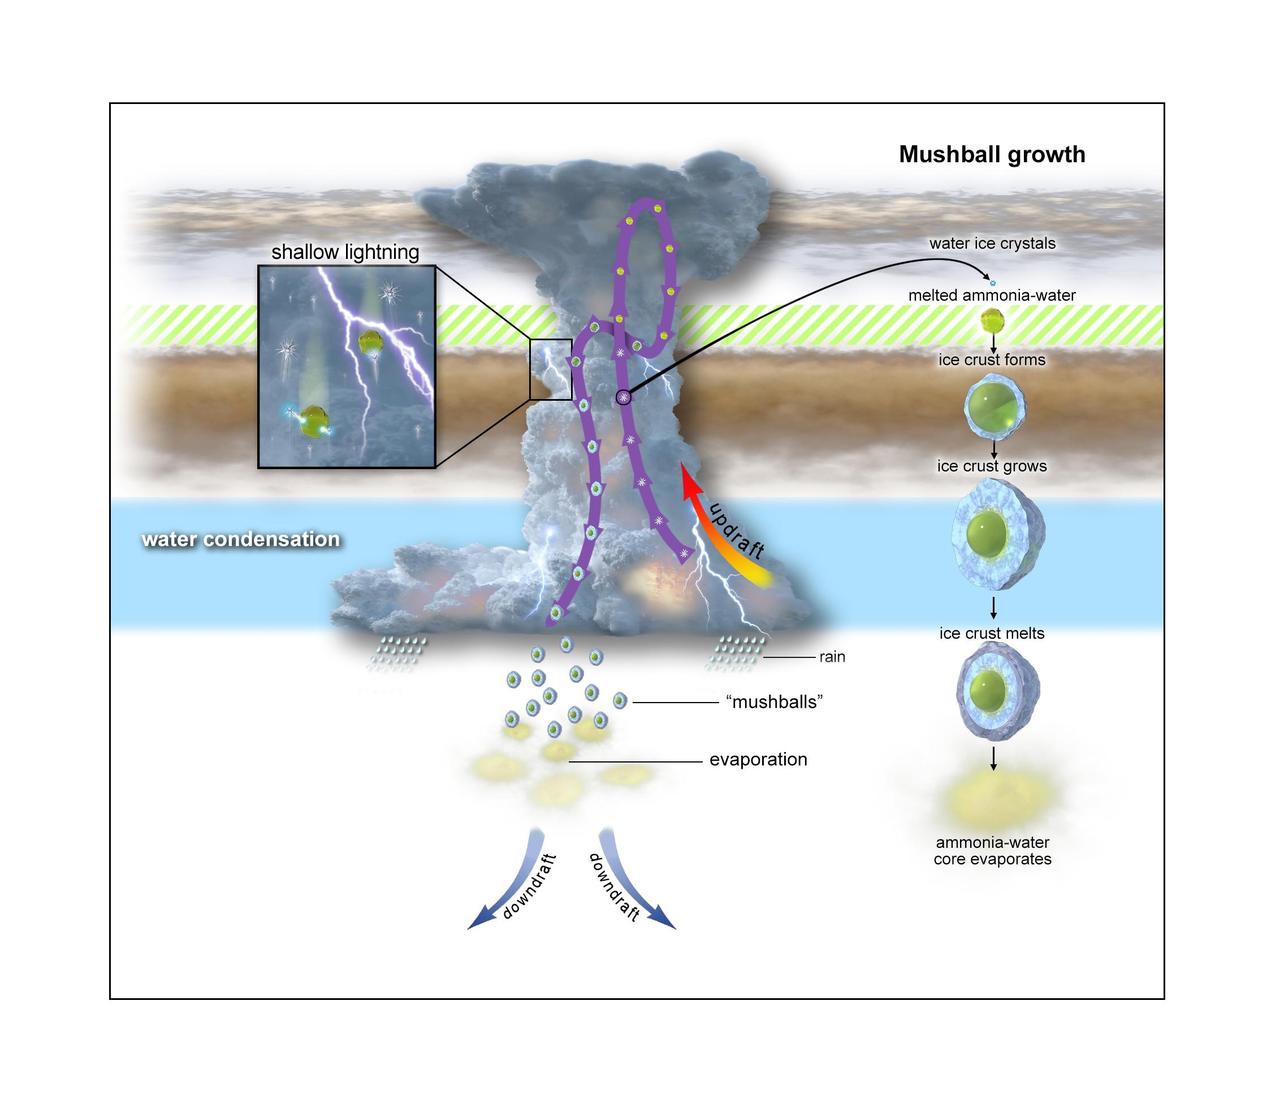
This graphic depicts the evolutionary process of "shallow lightning" and ammonia-water hailstones called "mushballs." An anvil-shaped thunderstorm cloud originates about 40 miles (65 kilometers) below Jupiter's visible cloud deck. Powered by water-based moist convection, the cloud generates strong updrafts that move liquid water and water ice particles upward. About 12 miles (19 kilometers) up, temperatures are so low that all of the water particles turn to ice. Still climbing, the ice particles cross a region located about 14 miles (23 kilometers) below the upper clouds, where temperatures are between minus 121 degrees Fahrenheit (minus 85 degrees Celsius) and minus 150 degrees Fahrenheit (minus 100 degrees Celsius), (depicted as green-hashed layer). At that point, ammonia vapor in the atmosphere acts like an antifreeze, melting the water-ice crystals, transforming them into ammonia-water liquid droplets which then grow and gather a solid icy shell to become mushballs. Once big enough, these slushy hailstones fall down, transporting both ammonia and water into Jupiter's deep atmosphere where the mushballs eventually evaporate. https://photojournal.jpl.nasa.gov/catalog/PIA24042
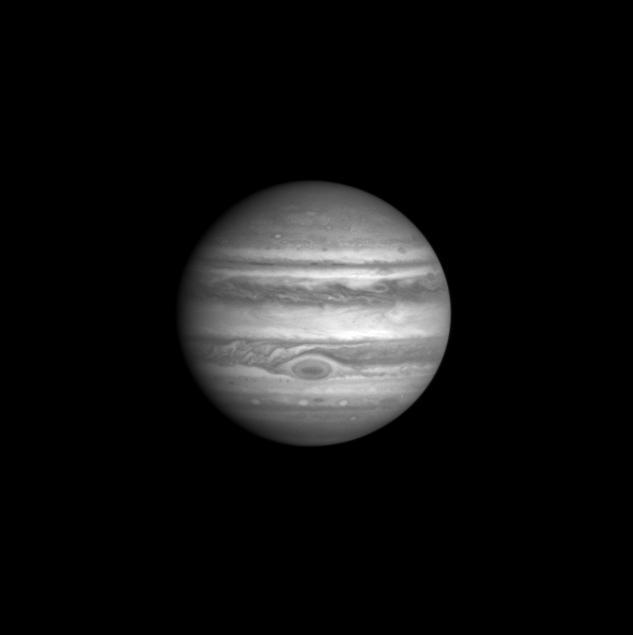
This image of Jupiter was taken by the Cassini Imaging Science narrow angle camera through the blue filter (centered at 445 nanometers) on October 1, 2000, 15:26 UTC at a distance of 84.1million km from Jupiter. The smallest features that can be seen are 500 kilometers across. The contrast between bright and dark features in this region of the spectrum is determined by the different light absorbing properties of the particles composing Jupiter's clouds. Ammonia ice particles are white, reflecting all light that falls on them. But some particles are red, and absorb mostly blue light. The composition of these red particles and the processes which determine their distribution are two of the long-standing mysteries of Jovian meteorology and chemistry. Note that the Great Red Spot contains a dark core of absorbing particles. http://photojournal.jpl.nasa.gov/catalog/PIA02666

This artist's rendering showing a cutaway view into the interior of Saturn's moon Enceladus. NASA's Cassini spacecraft discovered the moon has a global ocean and likely hydrothermal activity. A plume of ice particles, water vapor and organic molecules sprays from fractures in the moon's south polar region. This graphic is an update to a previously published version (see PIA19656) that did not show the ice and ocean layers to scale. The revised graphic more accurately represents scientists' current understanding of the thickness of the layers. http://photojournal.jpl.nasa.gov/catalog/PIA20013

NASA Glenn’s Propulsion Systems Lab (PSL) is conducting research to characterize ice crystal clouds that can create a hazard to aircraft engines under certain conditions. The isokinetic probe (in gold) samples particles and another series of probes can measure everything from humidity to air pressure.
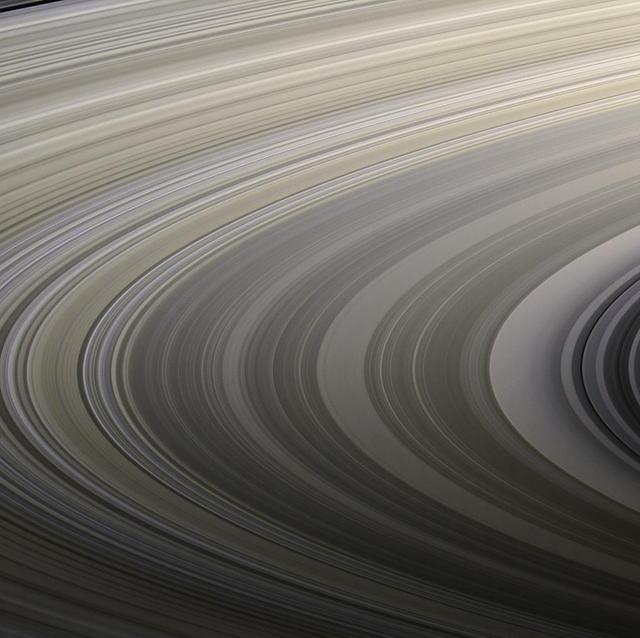
Saturn's rings display their subtle colors in this view captured on Aug. 22, 2009, by NASA's Cassini spacecraft. The particles that make up the rings range in size from smaller than a grain of sand to as large as mountains, and are mostly made of water ice. The exact nature of the material responsible for bestowing color on the rings remains a matter of intense debate among scientists. Images taken using red, green and blue spectral filters were combined to create this natural color view. Cassini's narrow-angle camera took the images at a distance of approximately 1.27 million miles (2.05 million kilometers) from the center of the rings. The Cassini spacecraft ended its mission on Sept. 15, 2017 https://photojournal.jpl.nasa.gov/catalog/PIA22418
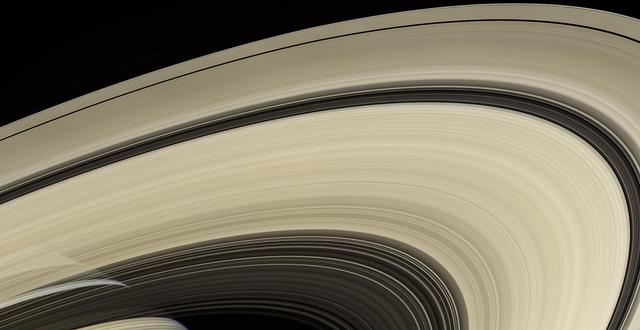
Saturn's rings are perhaps the most recognized feature of any world in our solar system. Cassini spent more than a decade examining them more closely than any spacecraft before it. The rings are made mostly of particles of water ice that range in size from smaller than a grain of sand to as large as mountains. The ring system extends up to 175,000 miles (282,000 kilometers) from the planet, but for all their immense width, the rings are razor-thin, about 30 feet (10 meters) thick in most places. From the right angle you can see straight through the rings, as in this natural-color view that looks from south to north. Cassini obtained the images that comprise this mosaic on April 25, 2007, at a distance of approximately 450,000 miles (725,000 kilometers) from Saturn. The Cassini spacecraft ended its mission on Sept. 15, 2017. https://photojournal.jpl.nasa.gov/catalog/PIA14943
Every winter a layer of carbon dioxide ice-or, dry ice-condenses in the Southern polar region, forming a seasonal polar cap less than 1 meter deep. Early in the spring the ice layer begins to sublimate (going directly from a solid to gas) from the top and bottom of the ice layer. Under the ice gas pressure builds up until a weak spot in the ice layer ruptures. The gas rushes out and as it escapes it erodes a bit of the surface. Fine particles are carried by the gas to the top of the ice and then fall out in fan-shaped deposits. The direction of the fan shows the direction either of the wind or down the slope. If the wind is not blowing a dark blotch settles around the spot the gas escaped. This region is known informally as Inca City, and it has a series of distinctive ridges. On the floor between the ridges are radially organized channels, known colloquially as spiders, more formally called "araneiforms." The channels have been carved in the surface over many years by the escaping pressurized gas. Every spring they widen just a bit. This was the first image to be acquired by NASA Mars Reconnaissance Orbiter after the sun rose on Inca City, marking the end to polar night. A few fans are visible emerging from the araneiforms. http://photojournal.jpl.nasa.gov/catalog/PIA18892
Saturn's moon Enceladus drifts before the rings, which glow brightly in the sunlight. Beneath its icy exterior shell, Enceladus hides a global ocean of liquid water. Just visible at the moon's south pole (at bottom here) is the plume of water ice particles and other material that constantly spews from that ocean via fractures in the ice. The bright speck to the right of Enceladus is a distant star. This image was taken in visible light with the Cassini spacecraft narrow-angle camera on Nov. 6, 2011, at a distance of approximately 90,000 miles (145,000 kilometers) from Enceladus. The Cassini spacecraft ended its mission on Sept. 15, 2017. https://photojournal.jpl.nasa.gov/catalog/PIA21900
At certain times in spring, fans take on a gray or blue appearance. This is the time in Inca City when this phenomenon happens, as seen in this image acquired by NASA Mars Reconnaissance Orbiter. On the ridge at the top of the image fans have lengthened and now look more gray than the blotches on the araneiforms. At the bottom of the image they are distinctly blue in color. Two theories have been suggested: perhaps fine particles sink into the seasonal layer of ice so they no longer appear dark. Or, maybe the gas that is released from under the ice condenses and falls to the surface as a bright fresh layer of frost. It is quite likely that both of these theories are correct. http://photojournal.jpl.nasa.gov/catalog/PIA18895
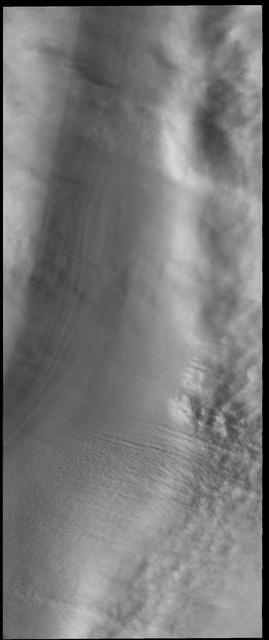
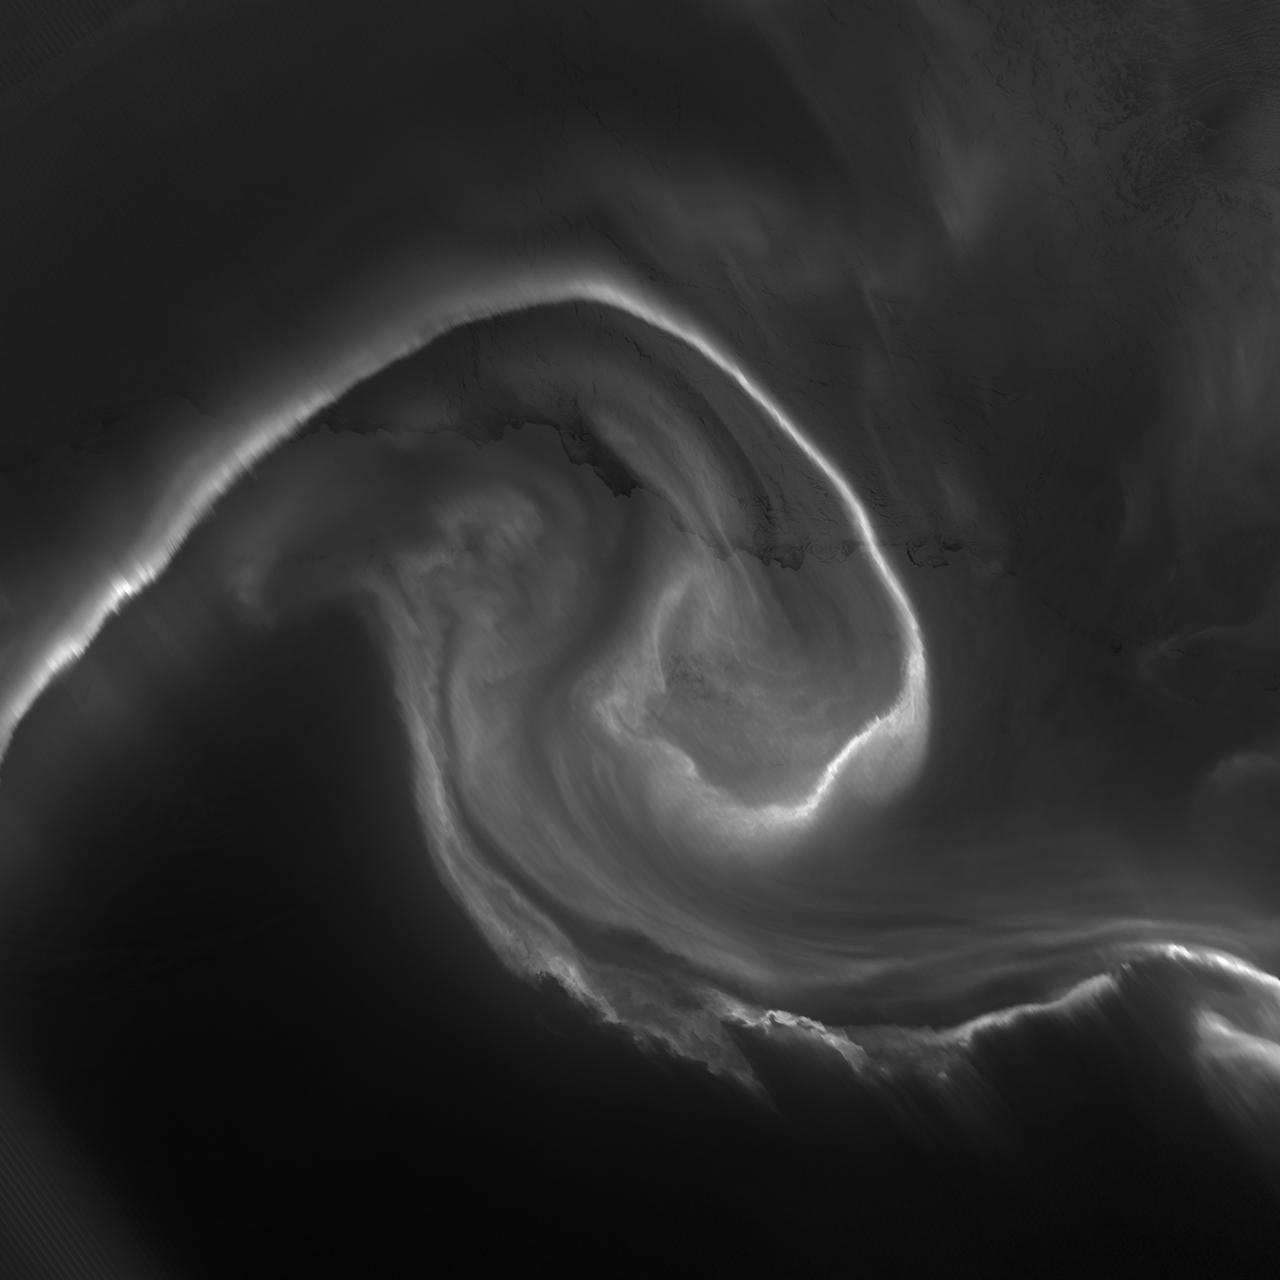
This VIS image shows 'streamers' of clouds created by katabatic winds at the north polar cap. Katabatic winds are created by cold air sinking at the pole and then speeding along the ice surface towards the edge of the polar cap. When the winds enter troughs the wind regime changes from laminar flow to choatic and clouds of ice particles and/or dust are visible. This wind activity peaks at the start of northern hemisphere summer. Orbit Number: 53942 Latitude: 86.8433 Longitude: 99.3149 Instrument: VIS Captured: 2014-02-10 10:50 https://photojournal.jpl.nasa.gov/catalog/PIA22362
The Martian ice cap is like a cake with every layer telling a story. In this case, the story is one of climate change on Mars. In this image is an exposed section of the north polar layered deposits (NPLD). Like a delicious slice of layered tiramisu, the NPLD is made up of water-ice and dust particles stacked one on top of the other. However, instead of icing, layers are topped with seasonal carbon dioxide frost. We can observe lingering frost adhering to one of the layers. The high-resolution and color capabilities of HiRISE provide details on the variations in the layers. Scientists are also using radar data, which show us that they have continuity in the subsurface. During deposition, these complex layers might encapsulate tiny air pockets from the atmosphere which, if sampled, could be studied to understand linkages to previous climates. https://photojournal.jpl.nasa.gov/catalog/PIA23740
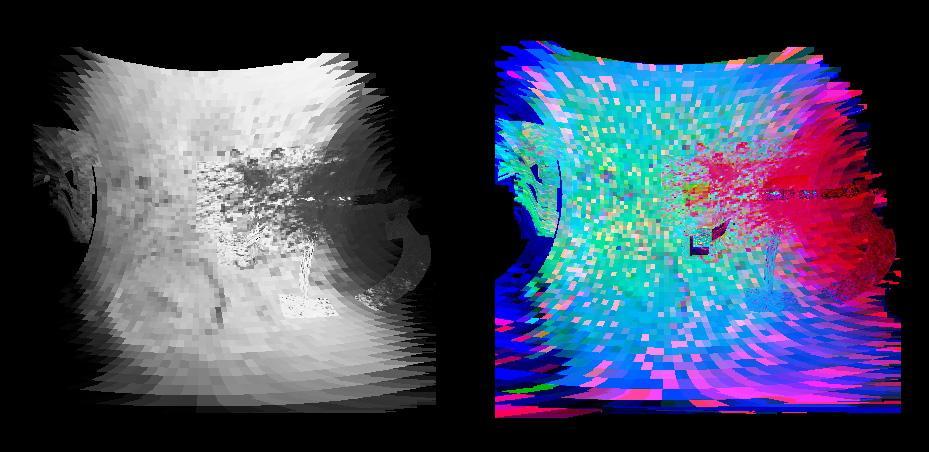
Cassini made a close flyby of Saturn's moon Iapetus on Sept. 10, 2007, and the visual and infrared mapping spectrometer obtained these images during that event. These two images show a higher resolution version of the equatorial region shown in PIA10010. The equatorial region includes the equatorial bulge which shows no differences in these compositions compared to surrounding regions. The color image on the right shows the results of mapping for three components of Iapetus' surface: carbon dioxide that is trapped or adsorbed in the surface (red), water in the form of ice (green), and a newly-discovered effect due to trace amount of dark particles in the ice creating what scientists call Rayleigh scattering (blue). The Rayleigh scattering effect is the main reason why the Earth's sky appears blue. There is a complex transition zone from the dark region, on the right, which is high in carbon dioxide, to the more ice-rich region on the left. Some crater floors are filled with carbon dioxide-rich dark material. As the ice becomes cleaner to the left, the small dark particles become more scattered and increase the Rayleigh scattering effect, again indicative of less than 2 percent dark sub-0.5-micron particles. The visual and infrared mapping spectrometer is like a digital camera, but instead of using three colors, it makes images in 352 colors, or wavelengths, from the ultraviolet to the near-infrared. The many wavelengths produce a continuous spectrum in each pixel, and these spectra measure how light is absorbed by different materials. By analyzing the absorptions expressed in each pixel, a map of the composition at each location on the moon can be constructed. http://photojournal.jpl.nasa.gov/catalog/PIA10011
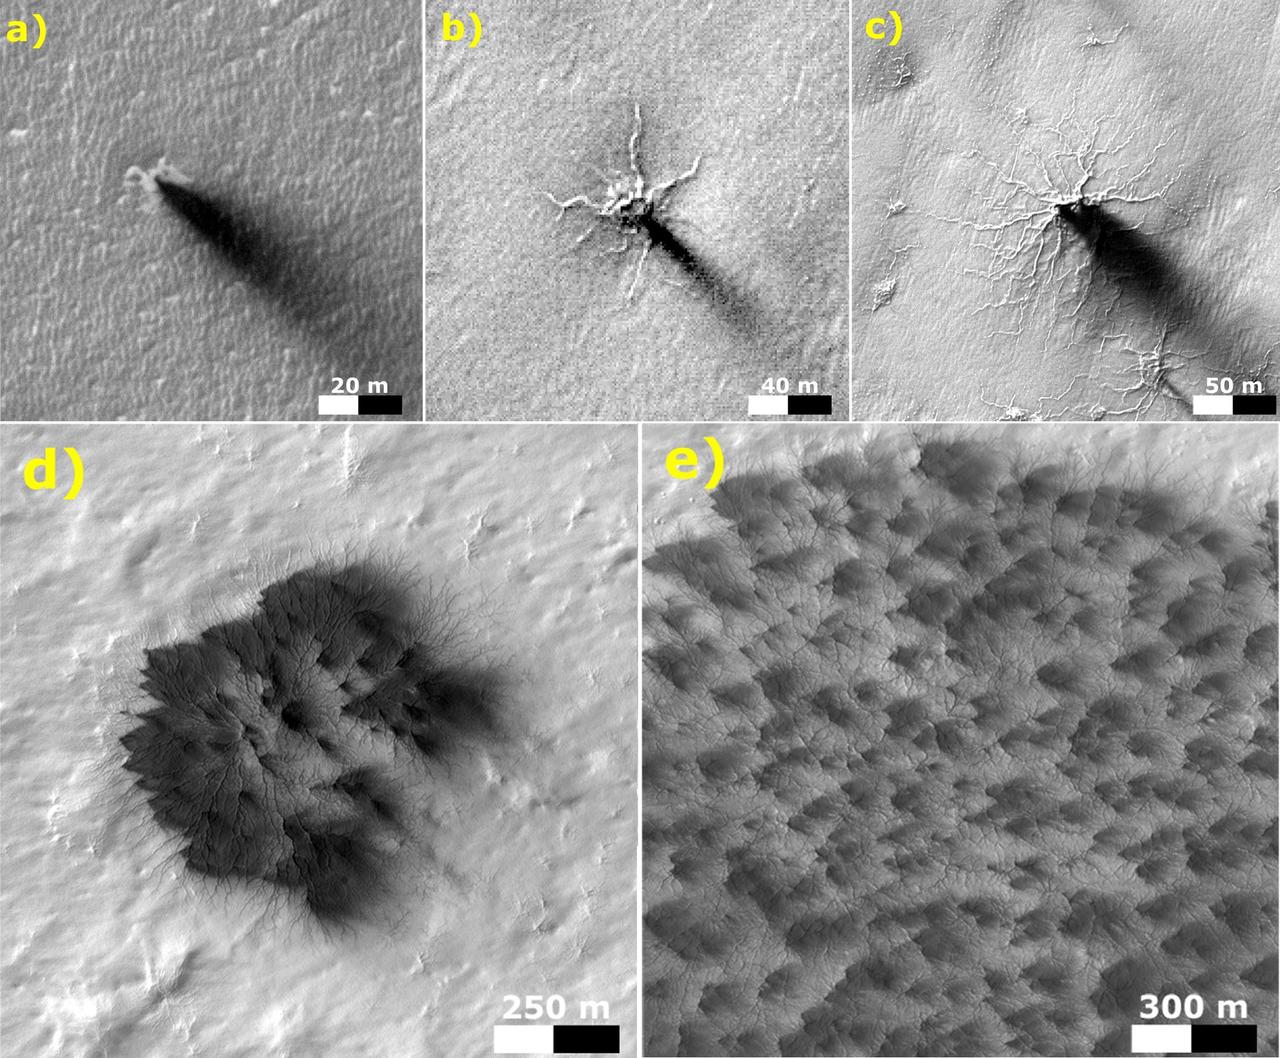
These five images from the High Resolution Imaging Science Experiment (HiRISE) camera on NASA's Mars Reconnaissance Orbiter show different Martian features of progressively greater size and complexity, all thought to result from thawing of seasonal carbon-dioxide ice that covers large areas near Mars' south pole during winter. The sequence illustrates possible stages in development of a type of Martian terrain called "araneiform," from Latin for spider-shaped. They range from a depression with one trough (upper left) to a broad network of "spiders" (lower right). Each image has a scale bar in meters, from 20 meters (66 feet) in the upper-left image to 300 meters (984 feet) in the lower-right one. Each image also includes dark "fans" that result from the same thawing process. Carbon-dioxide ice, better known as "dry ice," does not occur naturally on Earth. On Mars, sheets of it cover the ground during winter in areas near both poles, including the south-polar regions with spidery terrain. The dark fans appear in these areas each spring. Spring sunshine penetrates the ice to warm the ground underneath, causing some carbon dioxide on the bottom of the sheet to thaw into gas. The trapped gas builds pressure until a crack forms in the ice sheet. Gas erupts out, and gas beneath the ice rushes toward the vent, picking up particles of sand and dust. This erodes the ground and also supplies the geyser with particles that fall back to the surface, downwind, and appear as the dark spring fans. These five images are excerpts from HiRISE observations PSP_002718_0950, taken Feb. 24, 2007, at 85 degrees south latitude, 82 degrees east longitude, and ESP_011842_0980, taken Feb. 4, 2009, at 81 degrees south latitude, 76 degrees east longitude. http://photojournal.jpl.nasa.gov/catalog/PIA21258

These are more wispy blue clouds from Sol 39 as seen by the Imager for Mars Pathfinder. The bright clouds near the bottom are about 30 degrees above the horizon. The clouds are believed to be at an altitude of 10 to 15 km, and are thought to be made of small water ice particles. The picture was taken about 35 minutes before sunrise. Sojourner spent 83 days of a planned seven-day mission exploring the Martian terrain, acquiring images, and taking chemical, atmospheric and other measurements. The final data transmission received from Pathfinder was at 10:23 UTC on September 27, 1997. Although mission managers tried to restore full communications during the following five months, the successful mission was terminated on March 10, 1998. http://photojournal.jpl.nasa.gov/catalog/PIA00919
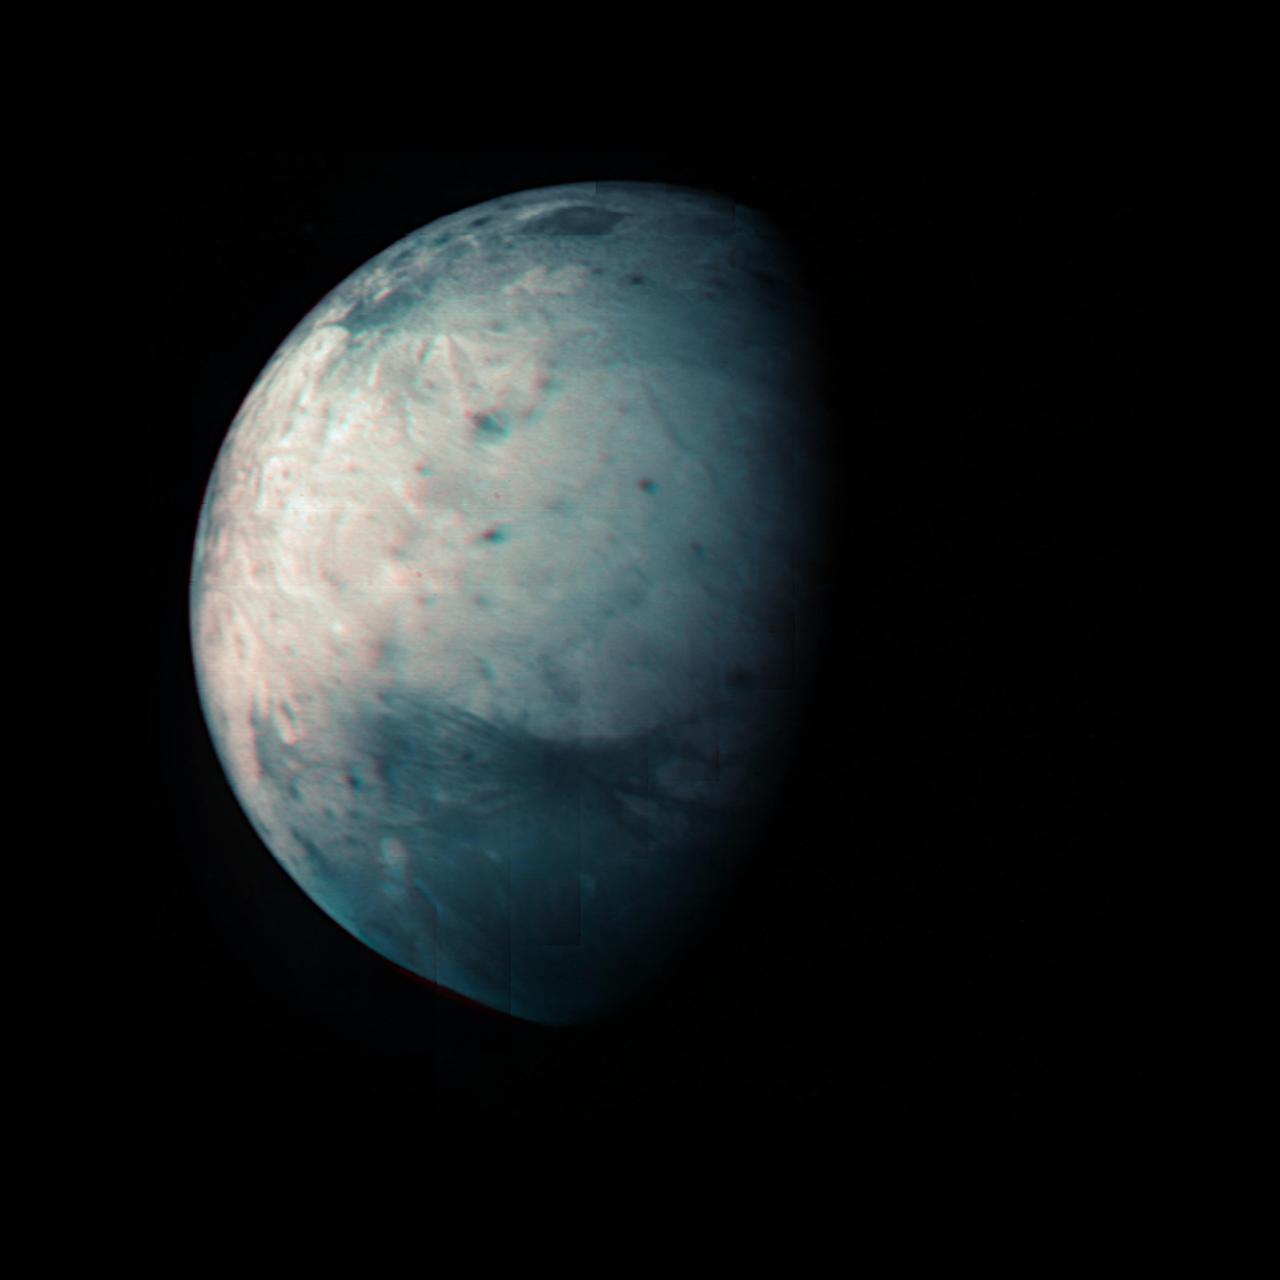
This infrared view of Ganymede was obtained by the Jovian Infrared Auroral Mapper (JIRAM) instrument aboard NASA's Juno spacecraft during its July 20th, 2021, flyby. JIRAM "sees" in infrared light not visible to the human eye, providing information on Ganymede's icy shell and the composition of the ocean of liquid water beneath. It was designed to capture the infrared light emerging from deep inside Jupiter, probing the weather layer down to 30 to 45 miles (50 to 70 kilometers) below Jupiter's cloud tops. During the flyby, Juno came within 31,136 miles (50,109 kilometers) of the icy orb. Together with the previous observational geometries provided, this data gives the opportunity for JIRAM to see different regions for the first time, as well as to compare the diversity in composition between the low and high latitudes. Because Ganymede has no atmosphere to impede the solar wind, or progress of charged particles from the Sun, the surface at its poles is constantly being bombarded by plasma from Jupiter's gigantic magnetosphere. The bombardment has a dramatic effect on Ganymede's ice: Ice is crystallized by heating at the equator and amorphized by particle radiation at the polar regions. https://photojournal.jpl.nasa.gov/catalog/PIA24791
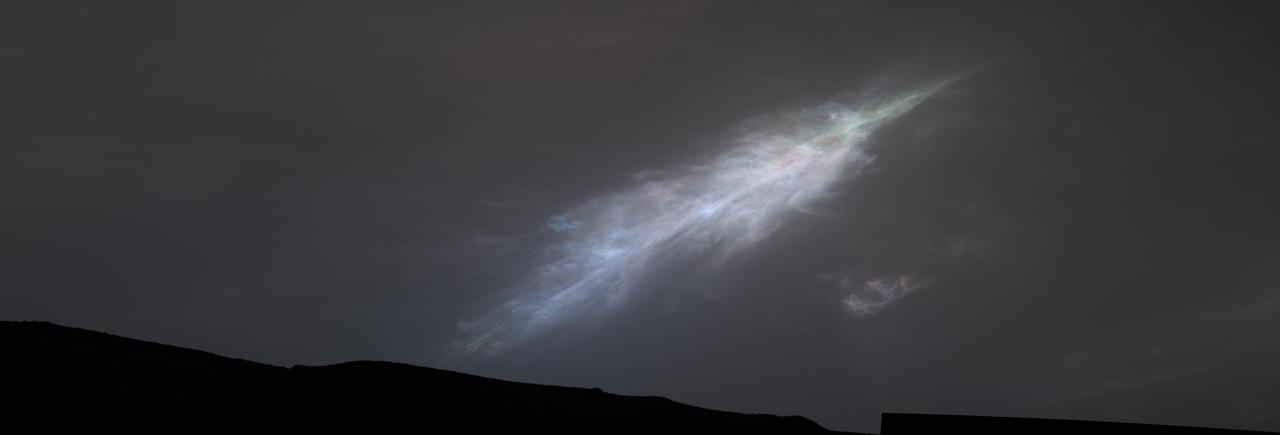
NASA's Curiosity Mars rover captured this feather-shaped iridescent cloud just after sunset on Jan. 27, 2023, the 3,724th Martian day, or sol, of the mission. Studying the colors in iridescent clouds tells scientists something about particle size within the clouds and how they grow over time. These clouds were captured as part of a follow-on imaging campaign to study noctilucent, or "night-shining" clouds, which started in 2021. While most Martian clouds hover no more than 37 miles (60 kilometers) above the ground and are composed of water ice, these clouds appear to be higher in elevation, where it's very cold. That suggests these clouds are made of carbon dioxide, or dry ice. This scene made up of 28 individual images captured by the rover's Mast Camera, or Mastcam. The images have been processed to emphasize the highlights. https://photojournal.jpl.nasa.gov/catalog/PIA25740

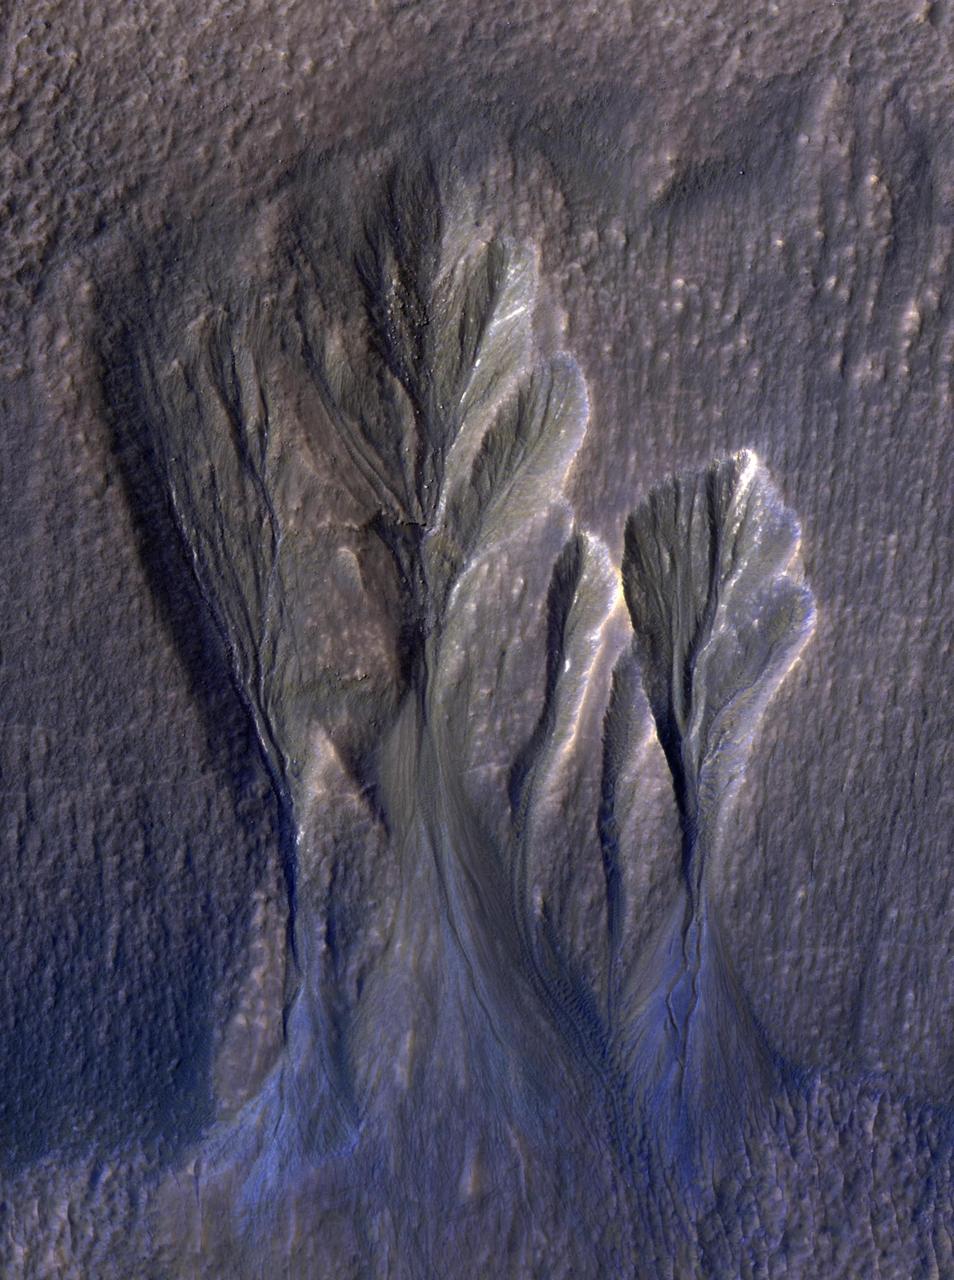
The white material seen within this gully is believed to be dusty water ice in a Martian region called Dao Vallis, captured by NASA's Mars Reconnaissance Orbiter (MRO). Scientists believe dust particles within this ice act similarly to dust that falls on to glaciers on Earth, warming up in sunlight and causing subsurface pockets of meltwater to form. On Earth, the dust that forms these pockets are called cryoconite, and the pockets are called cryoconite holes. These Earth-based pockets of water are often teeming with simple life, including algae, fungi and cyanobacteria. Scientists believe similar shallow pools of water could exist on Mars, and may also be excellent places to search for life on the Red Planet today. This black-and-white image was captured by MRO using its HiRISE (High-Resolution Imaging Science Experiment) camera on May 10, 2009. https://photojournal.jpl.nasa.gov/catalog/PIA26408

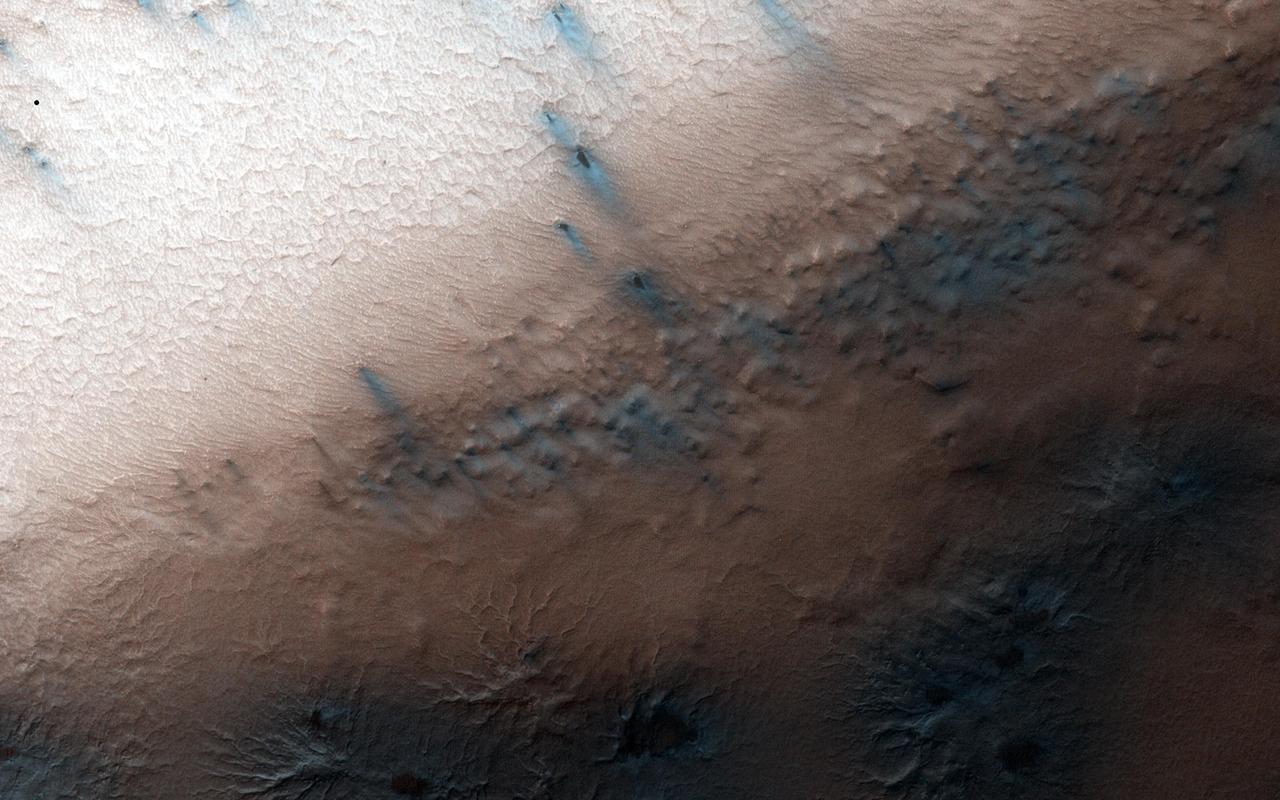
This image from NASA's Voyager 2 of the south polar terrain of Triton, taken on Aug. 25, 1989 reveals about 50 dark plumes or 'wind streaks' on the icy surface. The plumes originate at very dark spots generally a few miles in diameter and some are more than 100 miles long. The spots which clearly mark the source of the dark material may be vents where gas has erupted from beneath the surface and carried dark particles into Triton's nitrogen atmosphere. Southwesterly winds then transported the erupted particles, which formed gradually thinning deposits to the northeast of most vents. It is possible that the eruptions have been driven by seasonal heating of very shallow subsurface deposits of volatiles, and the winds transporting particles similarly may be seasonal winds. The polar terrain, upon which the dark streaks have been deposited, is a region of bright materials mottled with irregular, somewhat dark patches. The pattern of irregular patches suggests that they may correspond to lag deposits of moderately dark material that cap the bright ice over the polar terrain. http://photojournal.jpl.nasa.gov/catalog/PIA00059
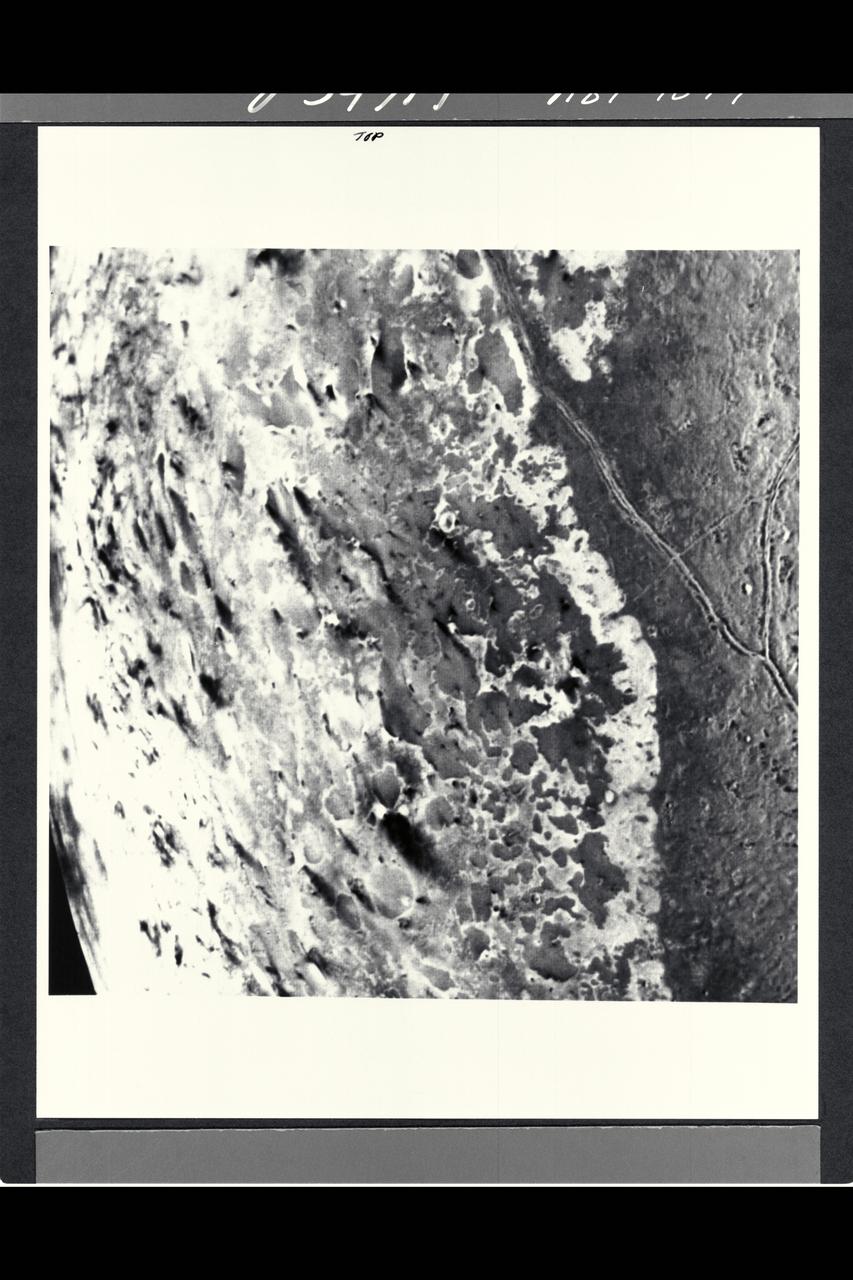
P-34714 This image of the south polar terrain of Triton reveals about 50 dark plumes or 'wind streaks' on the icy surface. The plumes originate at very dark spots generally a few miles in diameter and some are more than 100 miles long. The spots which clearly mark the source of the dark material may be vents where gas has erupted from beneath the surface and carried dark particles into Triton's nitrogen atmosphere. Southwesterly winds then transported the erupted particles, which formed gradually thinning deposits to the northeast of most vents. It is possible that the eruptions have been driven by seasonal heating of very shallow subsurface deposits of volatiles, and the winds transporting particles similiarly may be seasonal winds. The polar terrain, upon which the dark streaks have been deposited, is a region of bright materials mottled with irregular, somewhat dark patches. The pattern of irregular patches suggests that they may correspond to lag deposits of moderately dark material that cap the bright ice over the polar terrain.
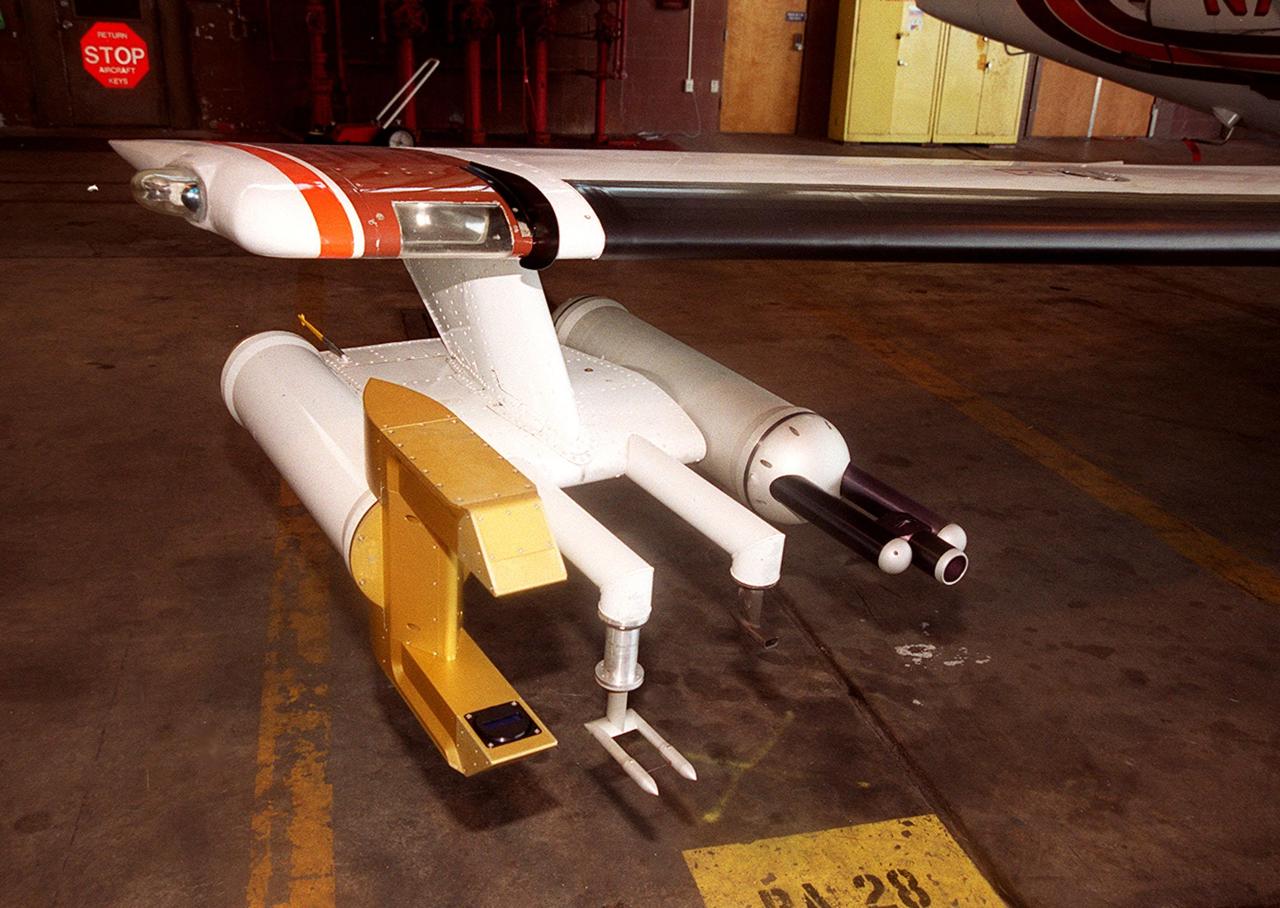
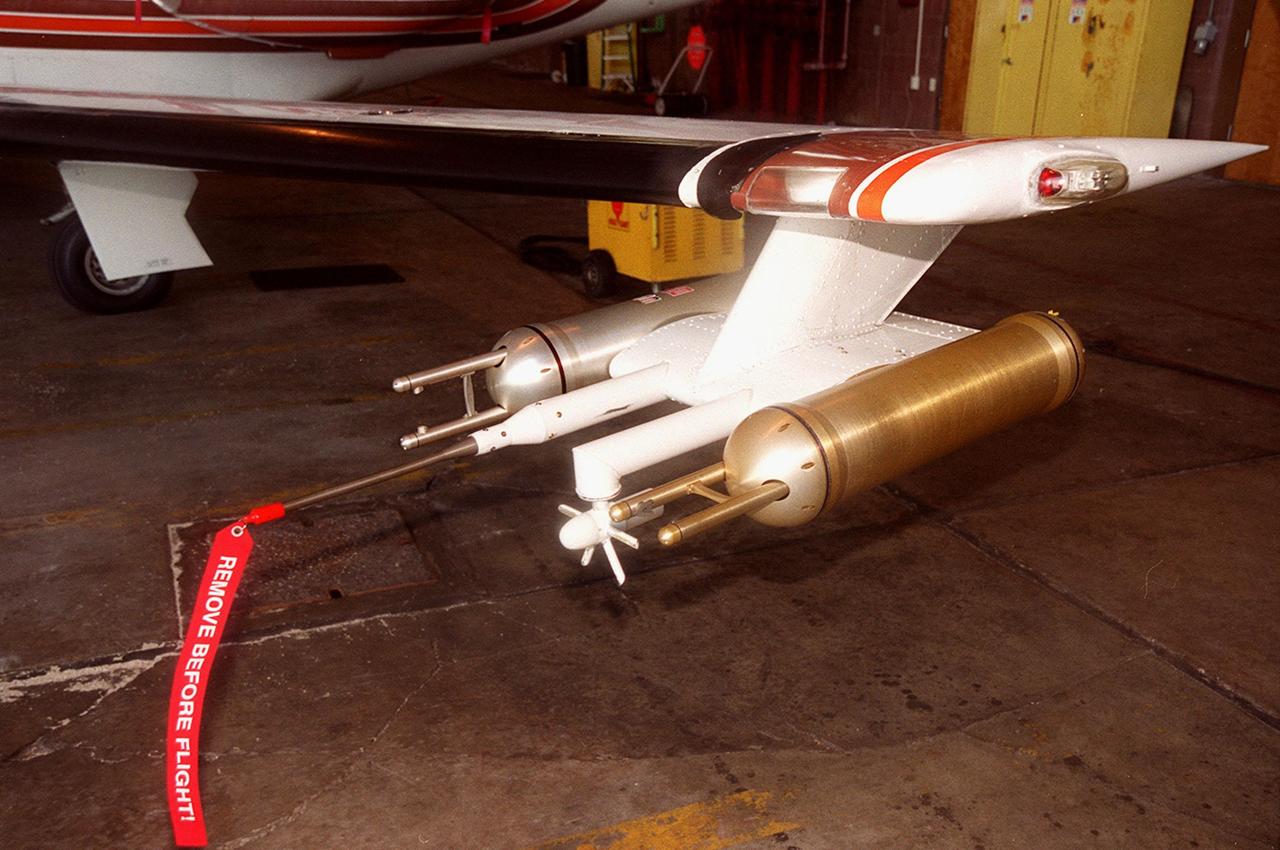
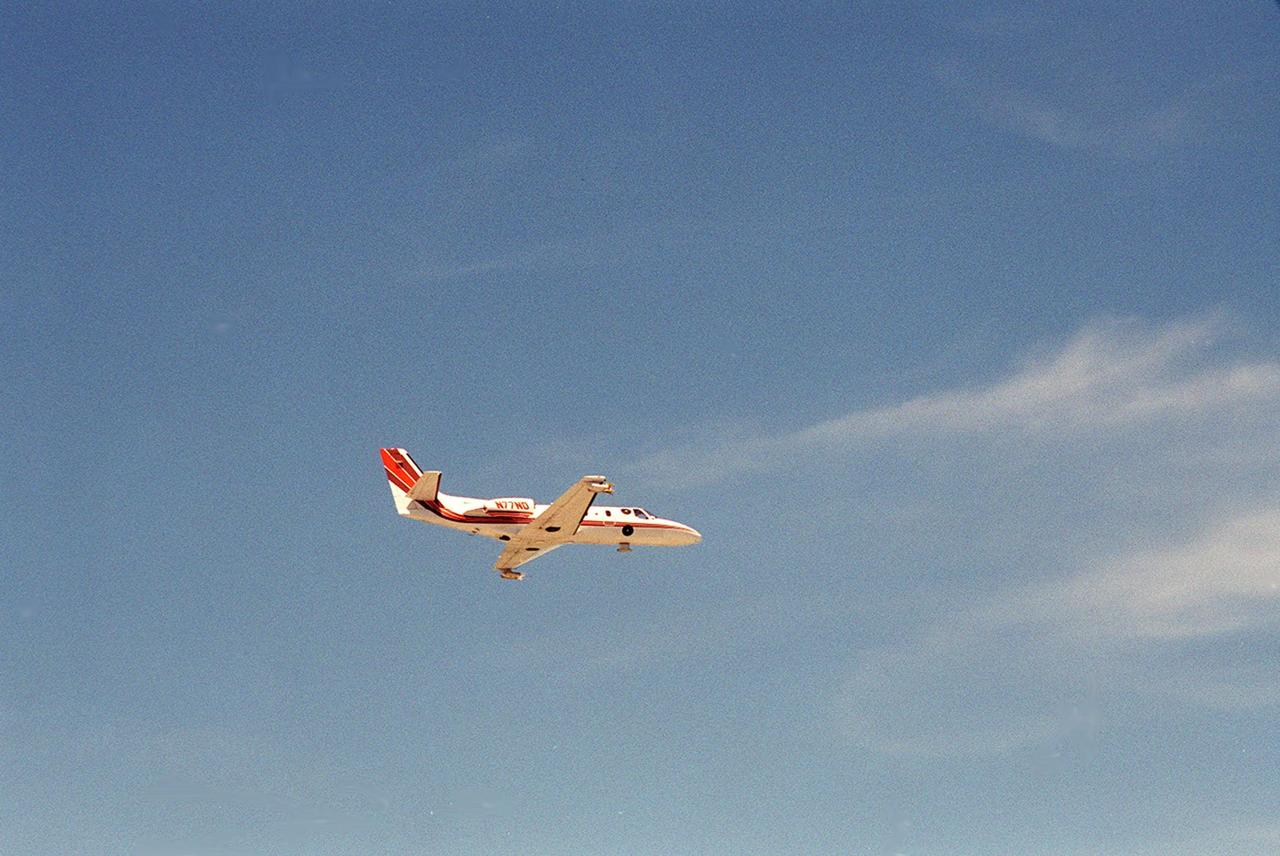
Attached to the wing of a Cessna Citation aircraft are cloud physics probes that measure the size, shape and number of ice and water particles in clouds. The plane is also equipped with field mills, used to measure electric fields. The plane is being flown into anvil clouds in the KSC area as part of a study to review and possibly modify lightning launch commit criteria. The weather study could lead to improved lightning avoidance rules and fewer launch scrubs for the Space Shuttle and other launch vehicles on the Eastern and Western ranges.; More information about the study can be found in <a href="http://www-pao.ksc.nasa.gov/kscpao/release/2000/56-00.htm">Release No. 56-00</a>

KENNEDY SPACE CENTER, FLA. -- At KSC's Shuttle Landing Facility, a specially equipped Cessna Citation aircraft flies over the runway to calibrate the Cesna's field mills with field mills on the ground (on the tripod at left) and on the car parked nearby (at center). Field mills measure electric fields. The aircraft is also equipped with cloud physics probes that measure the size, shape and number of ice and water particles in clouds. The plane is being flown into anvil clouds in the KSC area as part of a study to review and possibly modify lightning launch commit criteria. The weather study could lead to improved lightning avoidance rules and fewer launch scrubs for the Space Shuttle and other launch vehicles on the Eastern and Western ranges.
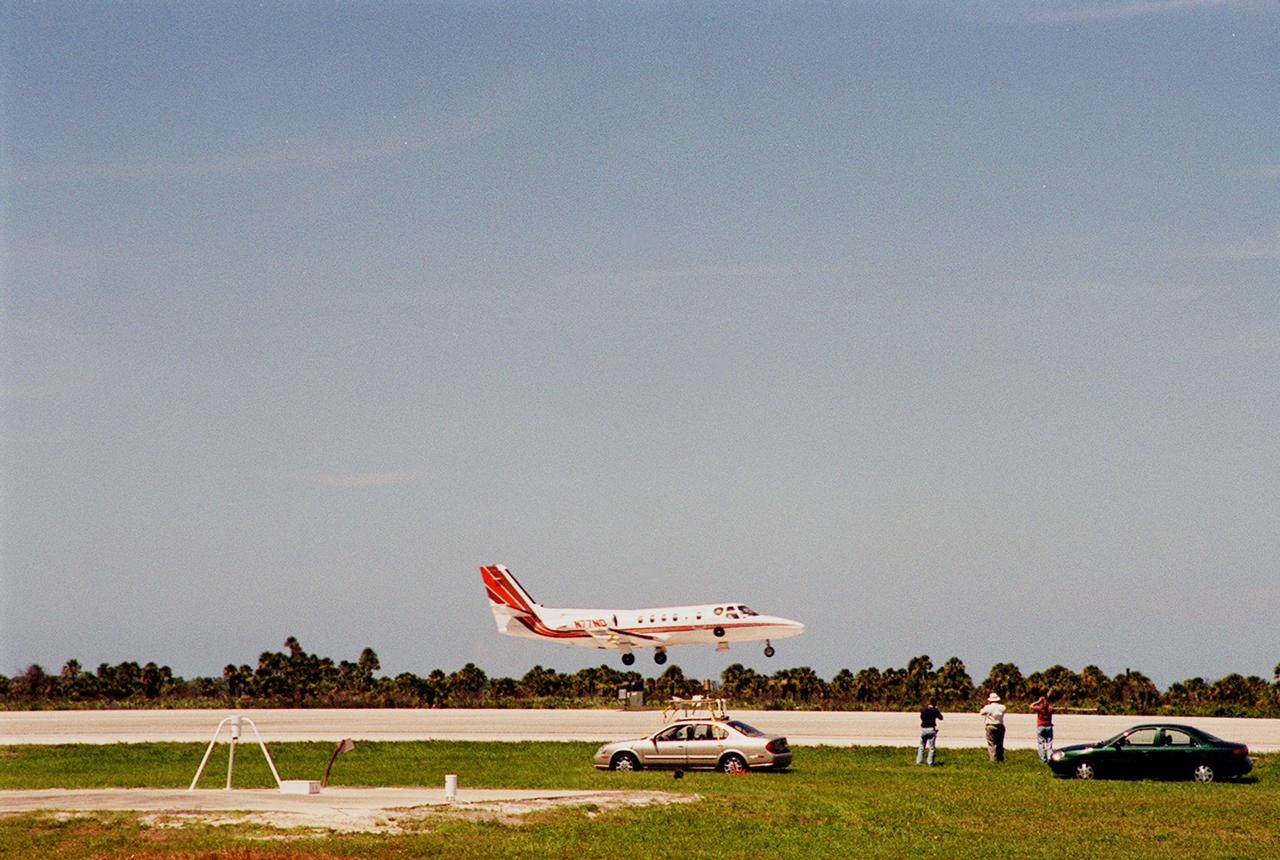
KENNEDY SPACE CENTER, FLA. -- At KSC's Shuttle Landing Facility, a specially equipped Cessna Citation aircraft flies over the runway to calibrate the Cesna's field mills with field mills on the ground (on the tripod at left) and on the car parked nearby (at center). Field mills measure electric fields. The aircraft is also equipped with cloud physics probes that measure the size, shape and number of ice and water particles in clouds. The plane is being flown into anvil clouds in the KSC area as part of a study to review and possibly modify lightning launch commit criteria. The weather study could lead to improved lightning avoidance rules and fewer launch scrubs for the Space Shuttle and other launch vehicles on the Eastern and Western ranges.

Attached to the wing of a Cessna Citation aircraft are cloud physics probes that measure the size, shape and number of ice and water particles in clouds. The plane is also equipped with field mills, used to measure electric fields. The plane is being flown into anvil clouds in the KSC area as part of a study to review and possibly modify lightning launch commit criteria. The weather study could lead to improved lightning avoidance rules and fewer launch scrubs for the Space Shuttle and other launch vehicles on the Eastern and Western ranges.; More information about the study can be found in <a href="http://www-pao.ksc.nasa.gov/kscpao/release/2000/56-00.htm">Release No. 56-00</a>
Attached to the wing of a Cessna Citation aircraft are cloud physics probes that measure the size, shape and number of ice and water particles in clouds. The plane is also equipped with field mills, used to measure electric fields. The plane is being flown into anvil clouds in the KSC area as part of a study to review and possibly modify lightning launch commit criteria. The weather study could lead to improved lightning avoidance rules and fewer launch scrubs for the Space Shuttle and other launch vehicles on the Eastern and Western ranges.; More information about the study can be found in <a href="http://www-pao.ksc.nasa.gov/kscpao/release/2000/56-00.htm">Release No. 56-00</a>

Attached to the wing of a Cessna Citation aircraft are cloud physics probes that measure the size, shape and number of ice and water particles in clouds. The plane is also equipped with field mills, used to measure electric fields. The plane is being flown into anvil clouds in the KSC area as part of a study to review and possibly modify lightning launch commit criteria. The weather study could lead to improved lightning avoidance rules and fewer launch scrubs for the Space Shuttle and other launch vehicles on the Eastern and Western ranges.; More information about the study can be found in <a href="http://www-pao.ksc.nasa.gov/kscpao/release/2000/56-00.htm">Release No. 56-00</a>
This image from NASA's Mars Reconnaissance Orbiter (MRO) shows white material believed to be dusty water ice lining the edges of Martian gullies in a region named Terra Sirenum. Scientists believe dust particles within this ice act similarly to dust that falls onto glaciers on Earth, warming up in sunlight and causing subsurface pockets of meltwater to form. On Earth, the dust that builds up on glaciers is called cryoconite, and the pockets it forms are called cryoconite holes. These pockets of water on our planet are often teeming with simple life, including algae, fungi, and cyanobacteria. Scientists believe similar shallow pools of water could exist on Mars, and may also be excellent places to search for life on the Red Planet today. This enhanced-color image was captured by MRO's HiRISE (High-Resolution Imaging Science Experiment) camera on Dec. 25, 2016. The blue color at the bottom of the gullies is likely coarse sand (not ice); the hue would not actually be perceptible to the human eye. HiRISE is able to detect this color by looking at the scene in far-infrared wavelengths. https://photojournal.jpl.nasa.gov/catalog/PIA26407
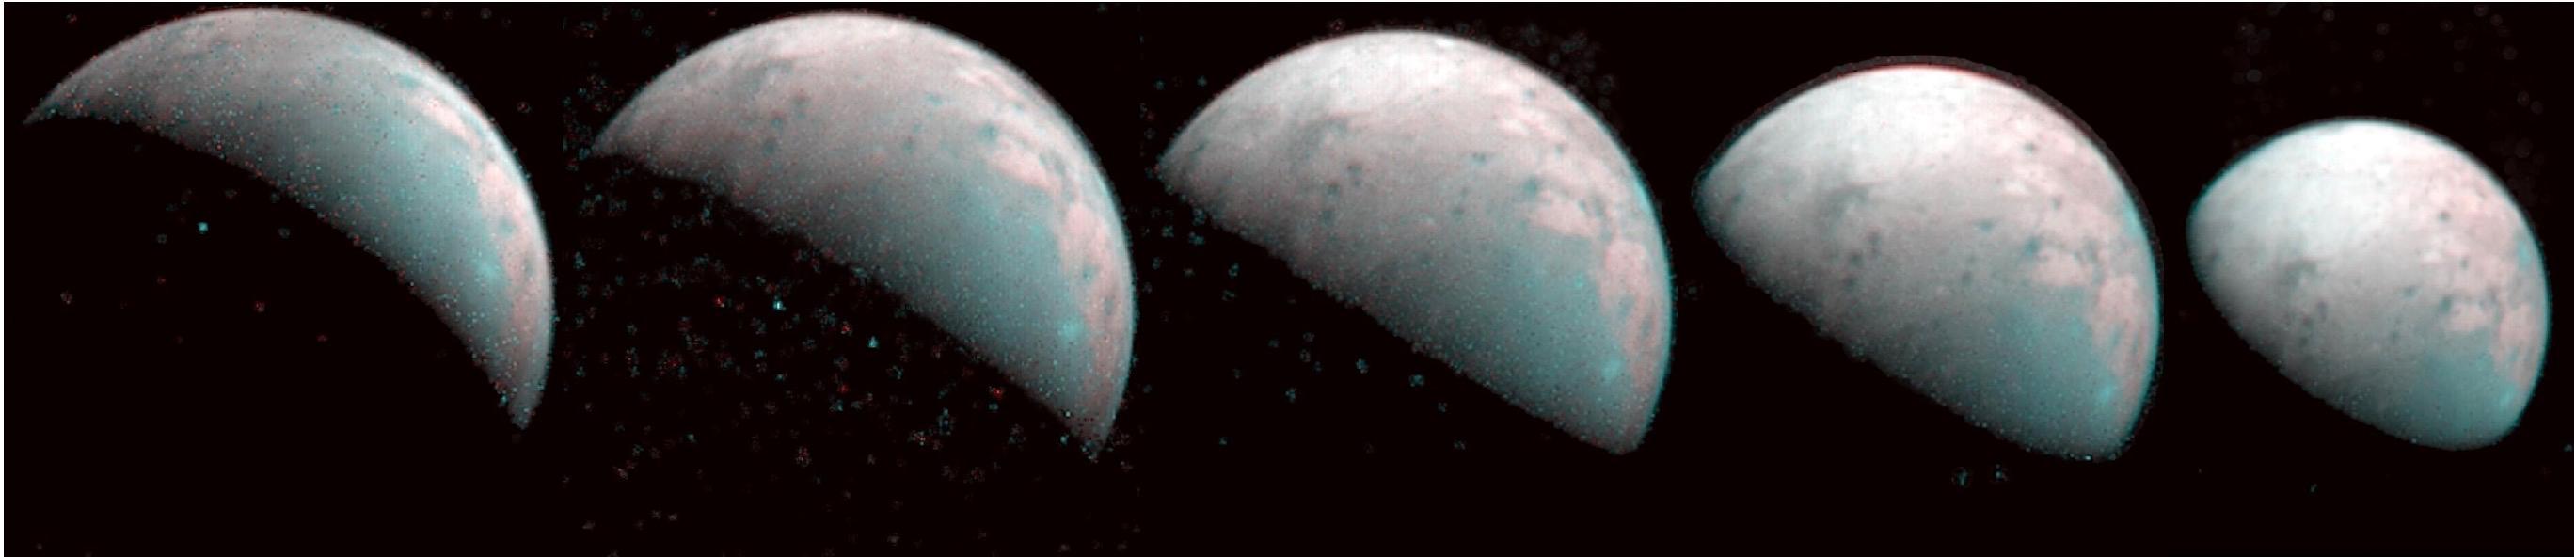
The north pole of Jupiter's giant moon Ganymede can be seen in this composite image of infrared data from the Jovian Infrared Auroral Mapper (JIRAM) instrument aboard NASA's Juno spacecraft. Five infrared images were taken every 20 minutes, beginning at time of closest approach (far left) on Dec. 26, 2019, when Juno was about 62,000 miles (100,000 kilometers) distant. The infrared imagery provides the first infrared mapping of the massive moon's northern frontier. As Ganymede has no atmosphere to impede the progress of charged particles from the Sun, the surface at its poles is constantly being bombarded by plasma from Jupiter's gigantic magnetosphere. The bombardment has a dramatic effect on Ganymede's ice. Frozen water molecules detected at both poles have no appreciable order to their arrangement, and the amorphous ice has a different infrared signature than the crystalline ice found at Ganymede's equator. JIRAM was designed to capture the infrared light emerging from deep inside Jupiter, probing the weather layer down to 30 to 45 miles (50 to 70 kilometers) below Jupiter's cloud tops. https://photojournal.jpl.nasa.gov/catalog/PIA23988
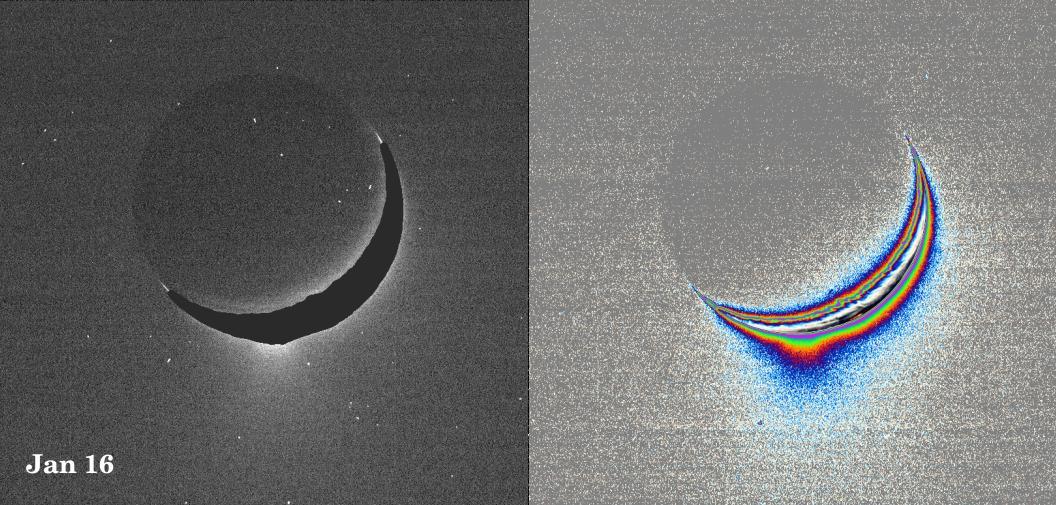
A fine spray of small, icy particles emanating from the warm, geologically unique province surrounding the south pole of Saturn’s moon Enceladus was observed in a Cassini narrow-angle camera image of the crescent moon taken on Jan. 16, 2005. Taken from a high-phase angle of 148 degrees -- a viewing geometry in which small particles become much easier to see -- the plume of material becomes more apparent in images processed to enhance faint signals. Imaging scientists have measured the light scattered by the plume's particles to determine their abundance and fall-off with height. Though the measurements of particle abundance are more certain within 100 kilometers (60 miles) of the surface, the values measured there are roughly consistent with the abundance of water ice particles measured by other Cassini instruments (reported in September, 2005) at altitudes as high as 400 kilometers (250 miles) above the surface. Imaging scientists, as reported in the journal Science on March 10, 2006, believe that the jets are geysers erupting from pressurized subsurface reservoirs of liquid water above 273 degrees Kelvin (0 degrees Celsius). The image at the left was taken in visible green light. A dark mask was applied to the moon's bright limb in order to make the plume feature easier to see. The image at the right has been color-coded to make faint signals in the plume more apparent. Images of other satellites (such as Tethys and Mimas) taken in the last 10 months from similar lighting and viewing geometries, and with identical camera parameters as this one, were closely examined to demonstrate that the plume towering above Enceladus' south pole is real and not a camera artifact. The images were acquired at a distance of about 209,400 kilometers (130,100 miles) from Enceladus. Image scale is about 1 kilometer (0.6 mile) per pixel. http://photojournal.jpl.nasa.gov/catalog/PIA07760
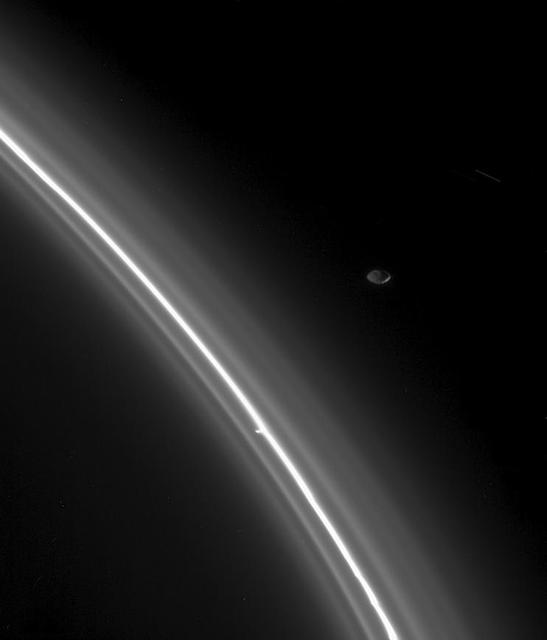
From just outside the faint edge of Saturn's F ring, the moon Pandora keeps watch over her fine-grained flock. The outer flanks of the F ring region are populated by ice particles approaching the size of the particles comprising smoke. As a shepherd moon, Pandora helps her cohort Prometheus confine and shape the main F ring. Pandora is 84 kilometers (52 miles) across. Prometheus is 102 kilometers (63 miles) wide and orbits interior to the F ring. The small knot seen attached to the core is one of several that Cassini scientists are eyeing as they attempt to distinguish embedded moons from transient clumps of material (see PIA07716). The image was taken with the Cassini spacecraft narrow-angle camera on Aug. 2, 2005, using a filter sensitive to wavelengths of infrared light centered at 930 nanometers at a distance of approximately 610,000 kilometers (379,000 miles) from Pandora and at a Sun-Pandora-spacecraft, or phase, angle of 146 degrees. Image scale is 4 kilometers (2 miles) per pixel. http://photojournal.jpl.nasa.gov/catalog/PIA07579
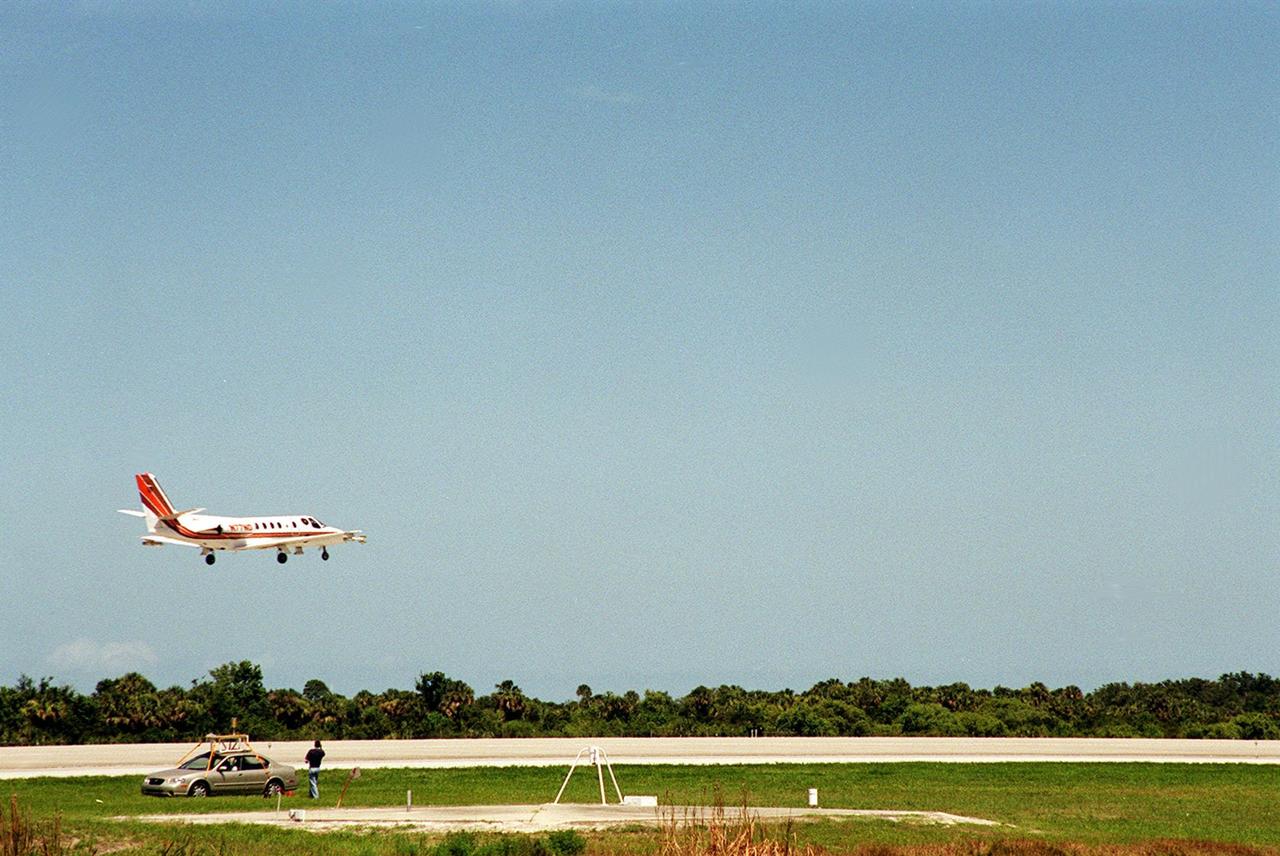
At KSC’s Shuttle Landing Facility, a specially equipped Cessna Citation aircraft approaches the runway to calibrate the Cessna’s field mills with field mills on the ground (on the tripod at left) and on the car parked nearby (at right). Field mills measure electric fields. The aircraft is also equipped with cloud physics probes that measure the size, shape and number of ice and water particles in clouds. The plane is being flown into anvil clouds in the KSC area as part of a study to review and possibly modify lightning launch commit criteria. The weather study could lead to improved lightning avoidance rules and fewer launch scrubs for the Space Shuttle and other launch vehicles on the Eastern and Western ranges.; More information on this study can be found in <a href="http://www-pao.ksc.nasa.gov/kscpao/release/2000/56-00.htm">Release No. 56-00</a>

In a hangar at Cape Canaveral Air Force Station, a weather researcher checks a field mill measuring device on the Cessna Citation. The aircraft is being used for NASA’s airborne field mill study. The plane also carries cloud physics probes (under the body and wings) that measure the size, shape and number of ice and water particles in clouds. The plane is being flown into anvil clouds in the KSC area as part of a study to review and possibly modify lightning launch commit criteria. The weather study could lead to improved lightning avoidance rules and fewer launch scrubs for the Space Shuttle and other launch vehicles on the Eastern and Western ranges.; More information about the study can be found in <a href="http://www-pao.ksc.nasa.gov/kscpao/release/2000/56-00.htm">Release No. 56-00</a>

Lightning field study devices are visible on a Cessna Citation aircraft during flight over Central Florida. The center of the black circle contains one of six field mills, used to measure electric fields, located on the body of the plane. Below the circle is one of several cloud physics probes attached to the plane that measure the size, shape and number of ice and water particles in clouds. The Cessna is being flown into anvil clouds in the KSC area as part of a study to review and possibly modify lightning launch commit criteria. The weather study could lead to improved lightning avoidance rules and fewer launch scrubs for the Space Shuttle and other launch vehicles on the Eastern and Western ranges.; More information about the study can be found in <a href="http://www-pao.ksc.nasa.gov/kscpao/release/2000/56-00.htm">Release No. 56-00</a>

At KSC’s Shuttle Landing Facility, a specially equipped Cessna Citation aircraft flies over the runway to calibrate the Cessna’s field mills with field mills on the ground (on the tripod at left) and on the car parked nearby (at right). Field mills measure electric fields. The aircraft is also equipped with cloud physics probes that measure the size, shape and number of ice and water particles in clouds. The plane is being flown into anvil clouds in the KSC area as part of a study to review and possibly modify lightning launch commit criteria. The weather study could lead to improved lightning avoidance rules and fewer launch scrubs for the Space Shuttle and other launch vehicles on the Eastern and Western ranges.; More information about this study can be found in <a href="http://www-pao.ksc.nasa.gov/kscpao/release/2000/56-00.htm">Release No. 56-00</a>

Seen shortly after local Martian sunrise, clouds gather in the summit pit, or caldera, of Pavonis Mons, a giant volcano on Mars, in this image from the Thermal Emission Imaging System (THEMIS) on NASA's Mars Odyssey orbiter. The clouds are mostly made of ice crystals. They appear blue in the image because the cloud particles scatter blue light more strongly than other colors. Pavonis Mons stands about nine miles (14 kilometers) high, and the caldera spans about 29 miles (47 kilometers) wide. This image was made by THEMIS through three of its visual-light filters plus a near-infrared filter, and it is approximately true in color. THEMIS and other instruments on Mars Odyssey have been studying Mars from orbit since 2001. http://photojournal.jpl.nasa.gov/catalog/PIA19675

At KSC’s Shuttle Landing Facility, a specially equipped Cessna Citation aircraft approaches the runway to calibrate the Cessna’s field mills with field mills on the ground (on the tripod at left) and on the car parked nearby (at right). Field mills measure electric fields. The aircraft is also equipped with cloud physics probes that measure the size, shape and number of ice and water particles in clouds. The plane is being flown into anvil clouds in the KSC area as part of a study to review and possibly modify lightning launch commit criteria. The weather study could lead to improved lightning avoidance rules and fewer launch scrubs for the Space Shuttle and other launch vehicles on the Eastern and Western ranges.; More information on this study can be found in <a href="http://www-pao.ksc.nasa.gov/kscpao/release/2000/56-00.htm">Release No. 56-00</a>
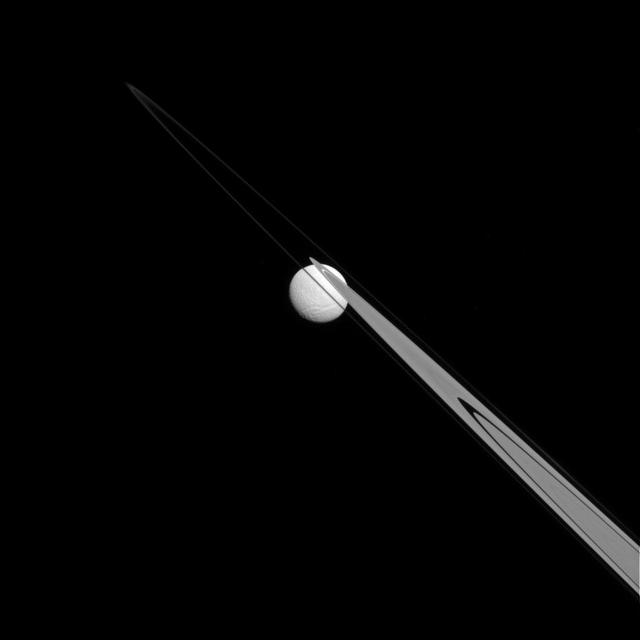
Like a drop of dew hanging on a leaf, Tethys appears to be stuck to the A and F rings from this perspective. Tethys (660 miles, or 1,062 kilometers across), like the ring particles, is composed primarily of ice. The gap in the A ring through which Tethys is visible is the Keeler gap, which is kept clear by the small moon Daphnis (not visible here). This view looks toward the Saturn-facing hemisphere of Tethys. North on Tethys is up and rotated 43 degrees to the right. The image was taken in visible light with the Cassini spacecraft narrow-angle camera on July 14, 2014. The view was acquired at a distance of approximately 1.1 million miles (1.8 million kilometers) from Tethys and at a Sun-Tethys-spacecraft, or phase, angle of 22 degrees. Image scale is 7 miles (11 kilometers) per pixel. http://photojournal.jpl.nasa.gov/catalog/PIA18284
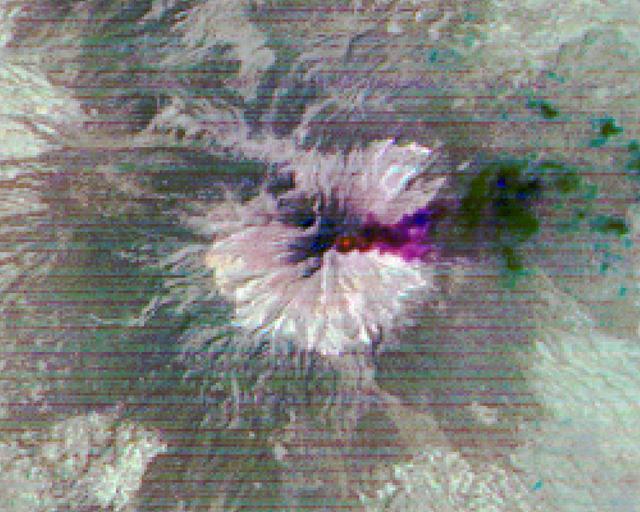
Popocatepetl, Mexico's most active volcano, erupted on February 23, sending blocks and bombs down the volcano's flanks, and emitting an ash column 1 km above the summit. Two days later, an ash cloud was still seen coming from the volcano. The thermal infrared color composite reveals a hot spot (red) at the summit crater. The dark red color near the vent of the east-blowing ash cloud suggests that its composition is dominantly ash material; further downwind, the color changes to purple, suggesting that some of the ash particles may be ice-covered. The images were acquired February 25, 2020, cover an area of 18 by 22.5 km, and are located at 19 degrees north, 98.6 degrees west. https://photojournal.jpl.nasa.gov/catalog/PIA23680

In a hangar at Cape Canaveral Air Force Station, a Cessna Citation aircraft has been fitted on the wings with devices that measure electric fields (black circles shown behind the open door) and with cloud physics probes (under the body and wings) that measure the size, shape and number of ice and water particles in clouds. The plane is being flown into anvil clouds in the KSC area as part of a study to review and possibly modify lightning launch commit criteria. The weather study could lead to improved lightning avoidance rules and fewer launch scrubs for the Space Shuttle and other launch vehicles on the Eastern and Western ranges.; More information about the study can be found in <a href="http://www-pao.ksc.nasa.gov/kscpao/release/2000/56-00.htm">Release No. 56-00</a>

A specially equipped Cessna Citation aircraft flies over KSC during a calibration test of field mills used to measure electric fields. The aircraft is also equipped with cloud physics probes that measure the size, shape and number of ice and water particles in clouds. The plane is being flown into anvil clouds in the KSC area as part of a study to review and possibly modify lightning launch commit criteria. The weather study could lead to improved lightning avoidance rules and fewer launch scrubs for the Space Shuttle and other launch vehicles on the Eastern and Western ranges.; More information on this study can be found in <a href="http://www-pao.ksc.nasa.gov/kscpao/release/2000/56-00.htm">Release No. 56-00</a>

In a hangar at Cape Canaveral Air Force Station, a weather researcher checks a field mill measuring device on the Cessna Citation. The aircraft is being used for NASA’s airborne field mill study. The plane also carries cloud physics probes (under the body and wings) that measure the size, shape and number of ice and water particles in clouds. The plane is being flown into anvil clouds in the KSC area as part of a study to review and possibly modify lightning launch commit criteria. The weather study could lead to improved lightning avoidance rules and fewer launch scrubs for the Space Shuttle and other launch vehicles on the Eastern and Western ranges.; More information about the study can be found in <a href="http://www-pao.ksc.nasa.gov/kscpao/release/2000/56-00.htm">Release No. 56-00</a>

In a hangar at Cape Canaveral Air Force Station, a Cessna Citation aircraft has been fitted on the wings with devices that measure electric fields (black circles shown behind the open door) and with cloud physics probes (under the body and wings) that measure the size, shape and number of ice and water particles in clouds. The plane is being flown into anvil clouds in the KSC area as part of a study to review and possibly modify lightning launch commit criteria. The weather study could lead to improved lightning avoidance rules and fewer launch scrubs for the Space Shuttle and other launch vehicles on the Eastern and Western ranges.; More information about the study can be found in <a href="http://www-pao.ksc.nasa.gov/kscpao/release/2000/56-00.htm">Release No. 56-00</a>
A specially equipped Cessna Citation aircraft flies over KSC during a calibration test of field mills used to measure electric fields. The aircraft is also equipped with cloud physics probes that measure the size, shape and number of ice and water particles in clouds. The plane is being flown into anvil clouds in the KSC area as part of a study to review and possibly modify lightning launch commit criteria. The weather study could lead to improved lightning avoidance rules and fewer launch scrubs for the Space Shuttle and other launch vehicles on the Eastern and Western ranges.; More information on this study can be found in <a href="http://www-pao.ksc.nasa.gov/kscpao/release/2000/56-00.htm">Release No. 56-00</a>

At KSC’s Shuttle Landing Facility, a specially equipped Cessna Citation aircraft flies over the runway to calibrate the Cessna’s field mills with field mills on the ground (on the tripod at left) and on the car parked nearby (at right). Field mills measure electric fields. The aircraft is also equipped with cloud physics probes that measure the size, shape and number of ice and water particles in clouds. The plane is being flown into anvil clouds in the KSC area as part of a study to review and possibly modify lightning launch commit criteria. The weather study could lead to improved lightning avoidance rules and fewer launch scrubs for the Space Shuttle and other launch vehicles on the Eastern and Western ranges.; More information about this study can be found in <a href="http://www-pao.ksc.nasa.gov/kscpao/release/2000/56-00.htm">Release No. 56-00</a>
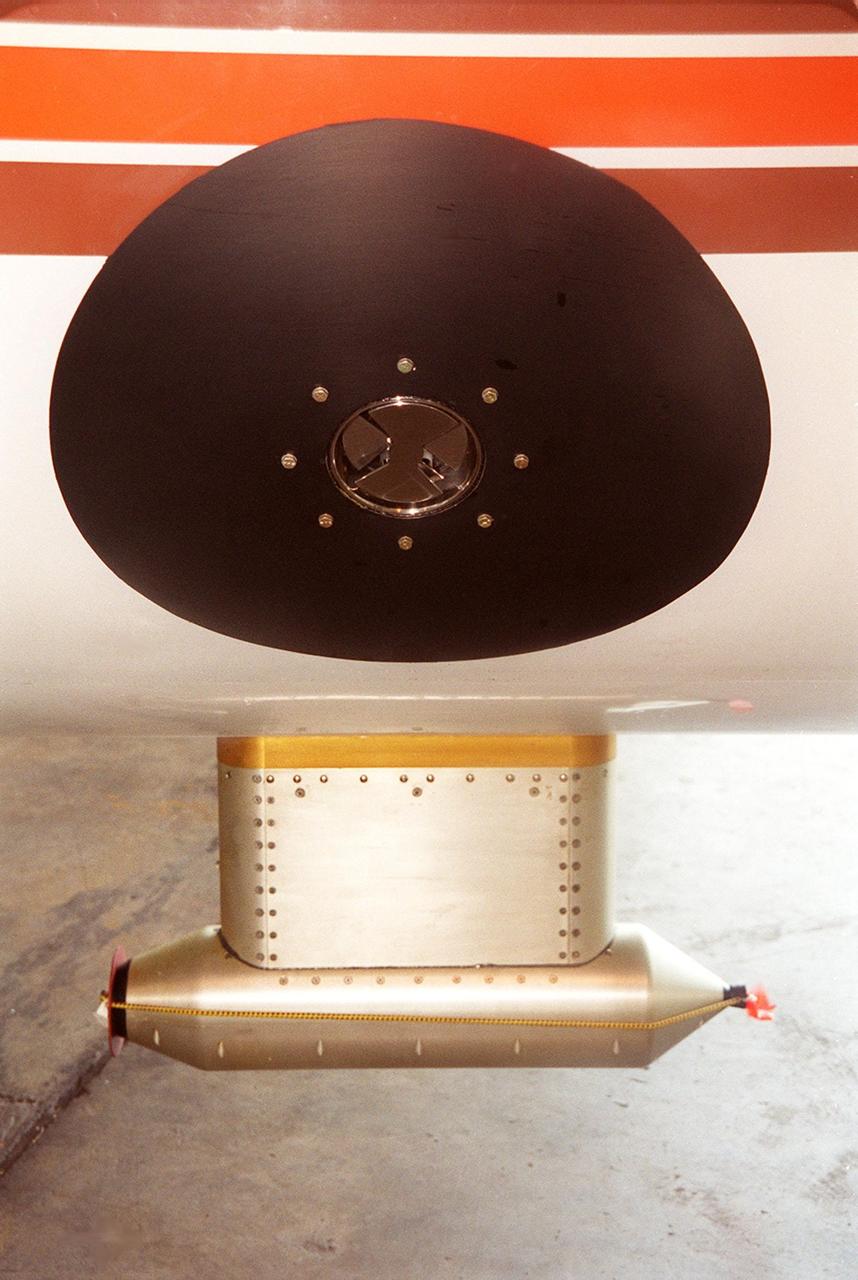
Lightning field study devices are visible on a Cessna Citation aircraft during flight over Central Florida. The center of the black circle contains one of six field mills, used to measure electric fields, located on the body of the plane. Below the circle is one of several cloud physics probes attached to the plane that measure the size, shape and number of ice and water particles in clouds. The Cessna is being flown into anvil clouds in the KSC area as part of a study to review and possibly modify lightning launch commit criteria. The weather study could lead to improved lightning avoidance rules and fewer launch scrubs for the Space Shuttle and other launch vehicles on the Eastern and Western ranges.; More information about the study can be found in <a href="http://www-pao.ksc.nasa.gov/kscpao/release/2000/56-00.htm">Release No. 56-00</a>

The NASA C-140 JetStar research aircraft (top) is followed by a NASA Learjet equipped with acoustic sensors during one of several tests of advanced propellors mounted on the vertical pylon atop the JetStar's fuselage. Several advanced prop designs were tested on the JetStar in 1982 by NASA's Dryden Flight Research Facility (DFRF), Edwards, California, to study the effects of noise created by propellors on aircraft structures and cabin interiors. To assess possible noise problems with the subscale turbofan, DFRF technicians mounted microphones on both the JetStar and the Learjet chase plane. DFRF then made measurements at close range and at longer distances. The data enabled structural changes and flightpath modifications.
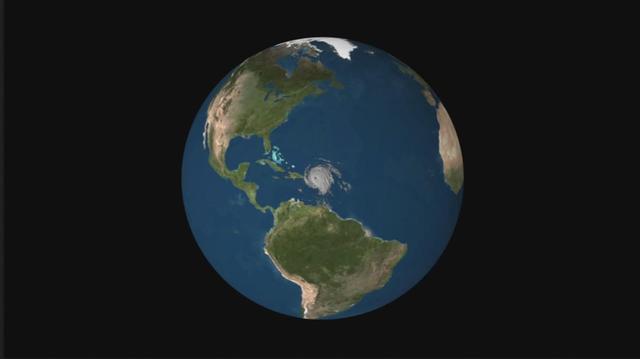
NASA's CloudSat satellite flew over Hurricane Irma on Sept. 6, 2017 at 1:45 p.m. EDT (17:45 UTC) as the storm was approaching Puerto Rico in the Atlantic Ocean. Hurricane Irma contained estimated maximum sustained winds of 185 miles per hour (160 knots) with a minimum pressure of 918 millibars. CloudSat transected the eastern edge of Hurricane Irma's eyewall, revealing details of the storm's cloud structure beneath its thick canopy of cirrus clouds. The CloudSat Cloud Profiling Radar excels in detecting the organization and placement of cloud layers beneath a storm's cirrus canopy, which are not readily detected by other satellite sensors. The CloudSat overpass reveals the inner details beneath the cloud tops of this large system; intense areas of convection with moderate to heavy rainfall (deep red and pink colors), cloud-free areas (moats) in between the inner and outer cloud bands of Hurricane Irma and cloud top heights averaging around 9 to 10 miles (15 to 16 kilometers). Lower values of reflectivity (areas of green and blue) denote smaller-sized ice and water particle sizes typically located at the top of a storm system (in the anvil area). The Cloud Profiling Radar loses signal at around 3 miles (5 kilometers) in height (in the melting layer) due to water (ice) particles larger than 0.12 inches (3 millimeters) in diameter. Moderate to heavy rainfall occurs in these areas where signal weakening is detectable. Smaller cumulus and cumulonimbus cloud types are evident as CloudSat moves farther south, beneath the thick cirrus canopy. An animation is available at https://photojournal.jpl.nasa.gov/catalog/PIA21947
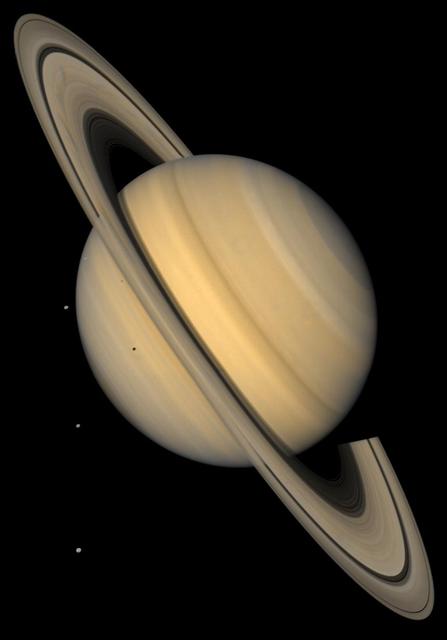
This approximate natural-color image shows Saturn, its rings, and four of its icy satellites. Three satellites (Tethys, Dione, and Rhea) are visible against the darkness of space, and another smaller satellite (Mimas) is visible against Saturn's cloud tops very near the left horizon and just below the rings. The dark shadows of Mimas and Tethys are also visible on Saturn's cloud tops, and the shadow of Saturn is seen across part of the rings. Saturn, second in size only to Jupiter in our Solar System, is 120,660 km (75,000 mi) in diameter at its equator (the ring plane) but, because of its rapid spin, Saturn is 10% smaller measured through its poles. Saturn's rings are composed mostly of ice particles ranging from microscopic dust to boulders in size. These particles orbit Saturn in a vast disk that is a mere 100 meters (330 feet) or so thick. The rings' thinness contrasts with their huge diameter--for instance 272,400 km (169,000 mi) for the outer part of the bright A ring, the outermost ring visible here. The pronounced concentric gap in the rings, the Cassini Division (named after its discoverer), is a 3500-km wide region (2200 mi, almost the width of the United States) that is much less populated with ring particles than the brighter B and A rings to either side of the gap. The rings also show some enigmatic radial structure ('spokes'), particularly at left. This image was synthesized from images taken in Voyager's blue and violet filters and was processed to recreate an approximately natural color and contrast. http://photojournal.jpl.nasa.gov/catalog/PIA00400
NASA acquired July 15, 2012 On July 15, 2012, the Visible Infrared Imaging Radiometer Suite (VIIRS) on the Suomi NPP satellite captured this nighttime view of the aurora australis, or “southern lights,” over Antartica’s Queen Maud Land and the Princess Ragnhild Coast. The image was captured by the VIIRS “day-night band,” which detects light in a range of wavelengths from green to near-infrared and uses filtering techniques to observe signals such as city lights, auroras, wildfires, and reflected moonlight. In the case of the image above, the sensor detected the visible auroral light emissions as energetic particles rained down from Earth’s magnetosphere and into the gases of the upper atmosphere. The slightly jagged appearance of the auroral lines is a function of the rapid dance of the energetic particles at the same time that the satellite is moving and the VIIRS sensor is scanning. The yellow box in the top image depicts the area shown in the lower close-up image. Light from the aurora was bright enough to illuminate the ice edge between the ice shelf and the Southern Ocean. At the time, Antarctica was locked in midwinter darkness and the Moon was a waning crescent that provided little light. NASA Earth Observatory image by Jesse Allen and Robert Simmon, using VIIRS Day-Night Band data from the Suomi National Polar-orbiting Partnership. Suomi NPP is the result of a partnership between NASA, the National Oceanic and Atmospheric Administration, and the Department of Defense. Caption by Mike Carlowicz. Instrument: Suomi NPP - VIIRS Credit: <b><a href="http://www.earthobservatory.nasa.gov/" rel="nofollow"> NASA Earth Observatory</a></b> <b>Click here to view all of the <a href="http://earthobservatory.nasa.gov/Features/NightLights/" rel="nofollow"> Earth at Night 2012 images </a></b> <b>Click here to <a href="http://earthobservatory.nasa.gov/NaturalHazards/view.php?id=79750" rel="nofollow"> read more </a> about this image </b> <b><a href="http://www.nasa.gov/audience/formedia/features/MP_Photo_Guidelines.html" rel="nofollow">NASA image use policy.</a></b> <b><a href="http://www.nasa.gov/centers/goddard/home/index.html" rel="nofollow">NASA Goddard Space Flight Center</a></b> enables NASA’s mission through four scientific endeavors: Earth Science, Heliophysics, Solar System Exploration, and Astrophysics. Goddard plays a leading role in NASA’s accomplishments by contributing compelling scientific knowledge to advance the Agency’s mission. <b>Follow us on <a href="http://twitter.com/NASA_GoddardPix" rel="nofollow">Twitter</a></b> <b>Like us on <a href="http://www.facebook.com/pages/Greenbelt-MD/NASA-Goddard/395013845897?ref=tsd" rel="nofollow">Facebook</a></b> <b>Find us on <a href="http://instagram.com/nasagoddard?vm=grid" rel="nofollow">Instagram</a></b>
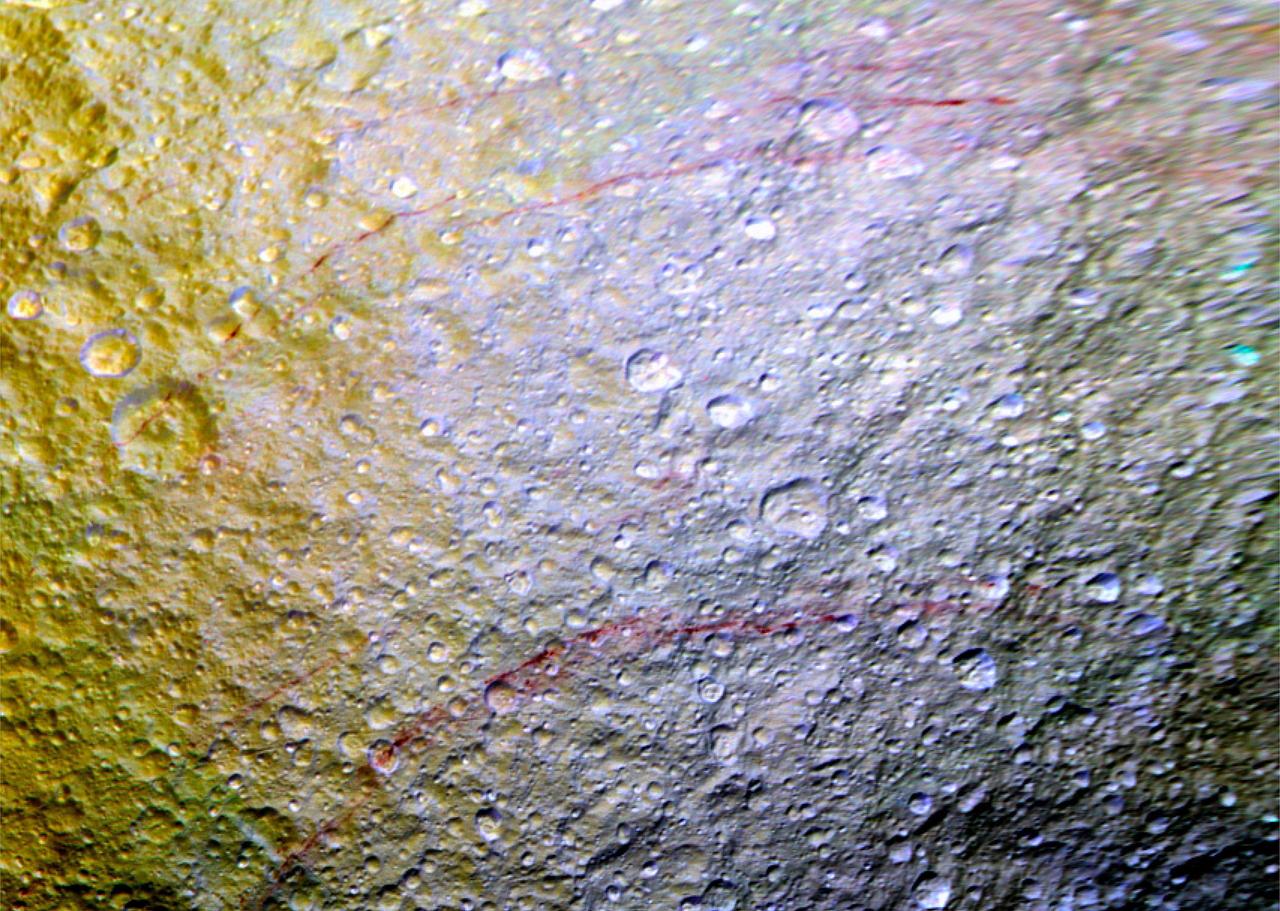
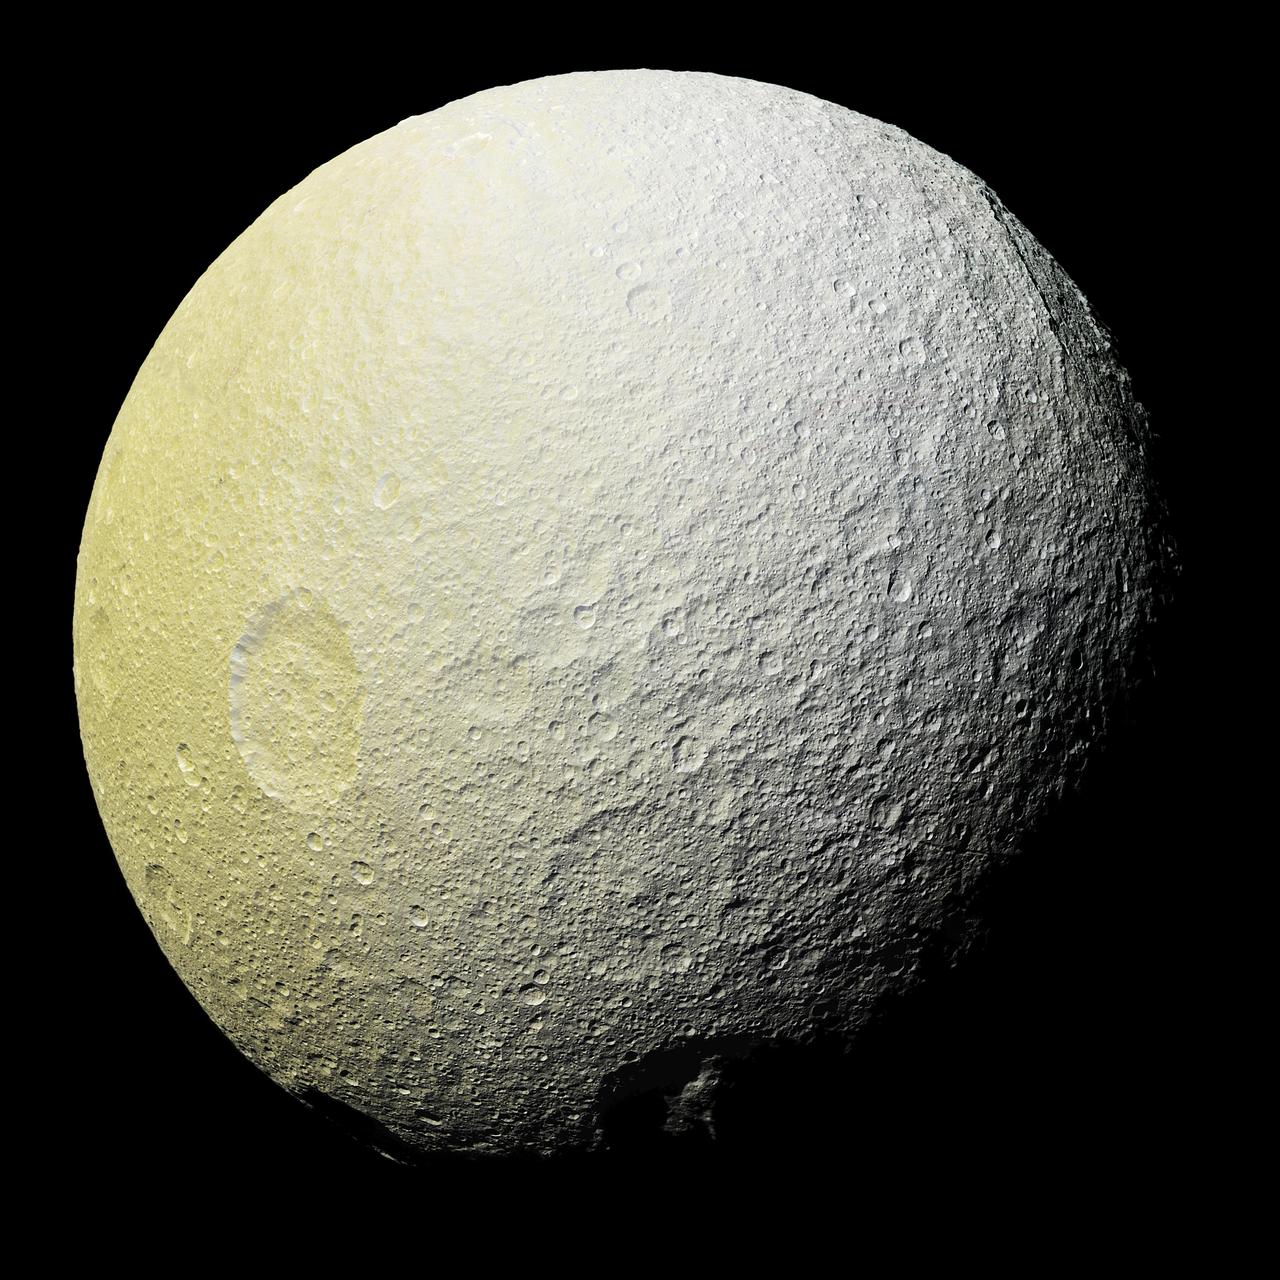
Unusual arc-shaped, reddish streaks cut across the surface of Saturn's ice-rich moon Tethys in this enhanced-color mosaic. The red streaks are narrow, curved lines on the moon's surface, only a few miles (or kilometers) wide but several hundred miles (or kilometers) long. The red streaks are among the most unusual color features on Saturn's moons to be revealed by Cassini's cameras. A few of the red arcs can be faintly seen in Cassini imaging observations made earlier in the mission, but the color images for this observation, which were obtained in April 2015, were the first to show large northern areas of Tethys under the illumination and viewing conditions necessary to see the features clearly. As the Saturn system moved into its northern hemisphere summer over the past few years, northern latitudes have become increasingly well illuminated. As a result, the red arc features have become clearly visible for the first time. The origin of the features and their reddish color is currently a mystery to Cassini scientists. Possibilities being studied include ideas that the reddish material is exposed ice with chemical impurities, or the result of outgassing from inside Tethys. The streaks could also be associated with features like fractures that are below the resolution of the available images. Except for a few small craters on Dione, reddish tinted features are rare on other moons of Saturn. However, many reddish features are observed on the geologically young surface of Jupiter's moon Europa. Images taken using clear, green, infrared and ultraviolet spectral filters were combined to create the view, which highlights subtle color differences across Tethys' surface at wavelengths not visible to human eyes. The moon's surface is fairly uniform in natural color. The yellowish tones on the left side of the view are a result of alteration of the moon's surface by high-energy particles from Saturn's magnetosphere. This particle radiation slams into the moon's trailing hemisphere, modifying it chemically and changing its appearance in enhanced-color views like this one. The area of Tethys shown here is centered on 30 degrees north latitude, 187 degrees west longitude, and measures 305 by 258 miles (490 by 415 kilometers) across. The original color images were obtained at a resolution of about 2,300 feet (700 meters) per pixel on April 11, 2015. This is a cropped close-up of an area visible in PIA19636. This is a mosaic of images that have been photometrically calibrated and map-projected. http://photojournal.jpl.nasa.gov/catalog/PIA19637
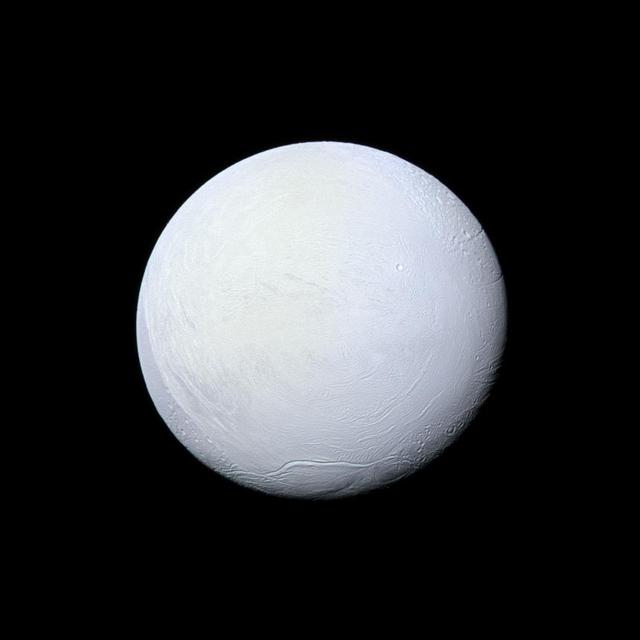
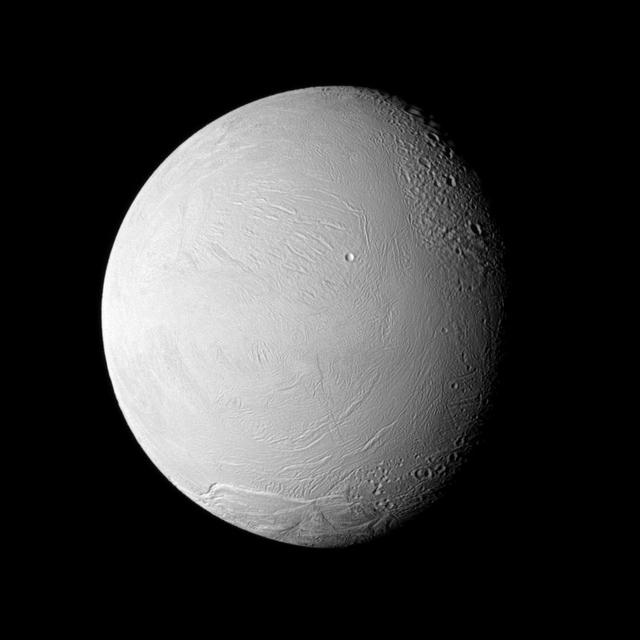
Saturn's moon Enceladus, covered in snow and ice, resembles a perfectly packed snowball in this image from NASA's Cassini mission. Cassini has imaged Enceladus many times throughout its mission, discovering a fractured surface and the now-famous geysers that erupt icy particles and water vapor from fractures crossing the moons' 200-mile-wide (300-kilometer-wide) south polar terrain. The mountain ridge seen in the south in this image is part of the undulating mountain belt that circumscribes this region. This view looks toward the leading side of Enceladus (313 miles, 504 kilometers across). North on Enceladus is up and rotated 6 degrees to the left. The image was taken with the Cassini spacecraft narrow-angle camera on March 10, 2012, using filters sensitive to ultraviolet, visible and infrared light (spanning wavelengths from 338 to 750 nanometers). The view was acquired at a distance of approximately 106,000 miles (170,000 kilometers) from Enceladus. Image scale is 3,336 feet (1 kilometer) per pixel. http://photojournal.jpl.nasa.gov/catalog/PIA17182
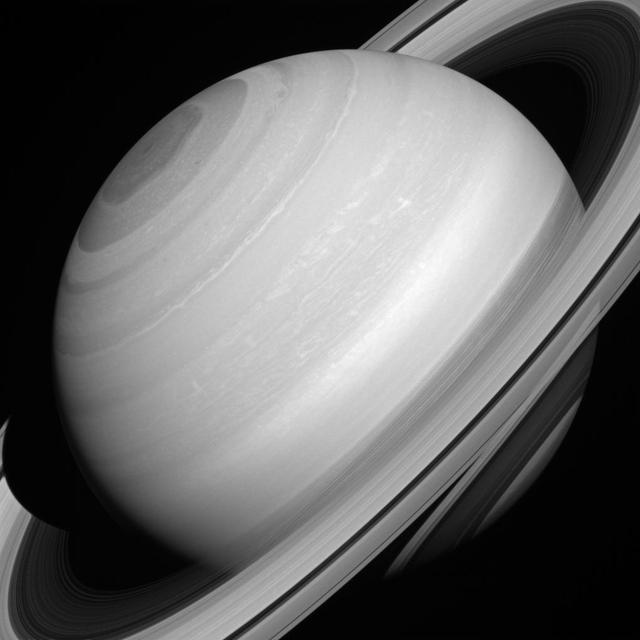
Although solid-looking in many images, Saturn's rings are actually translucent. In this picture, we can glimpse the shadow of the rings on the planet through (and below) the A and C rings themselves, towards the lower right hand corner. For centuries people have studied Saturn's rings, but questions about the structure and composition of the rings lingered. It was only in 1857 when the physicist James Clerk Maxwell demonstrated that the rings must be composed of many small particles and not solid rings around the planet, and not until the 1970s that spectroscopic evidence definitively showed that the rings are composed mostly of water ice. This view looks toward the sunlit side of the rings from about 17 degrees above the ringplane. The image was taken with the Cassini spacecraft wide-angle camera on Aug. 12, 2014 in near-infrared light centered at 752 nanometers. The view was obtained at a distance of approximately 1.4 million miles (2.3 million kilometers) from Saturn and at a Sun-Saturn-spacecraft, or phase, angle of 24 degrees. Image scale is 85 miles (136 kilometers) per pixel. http://photojournal.jpl.nasa.gov/catalog/PIA18295
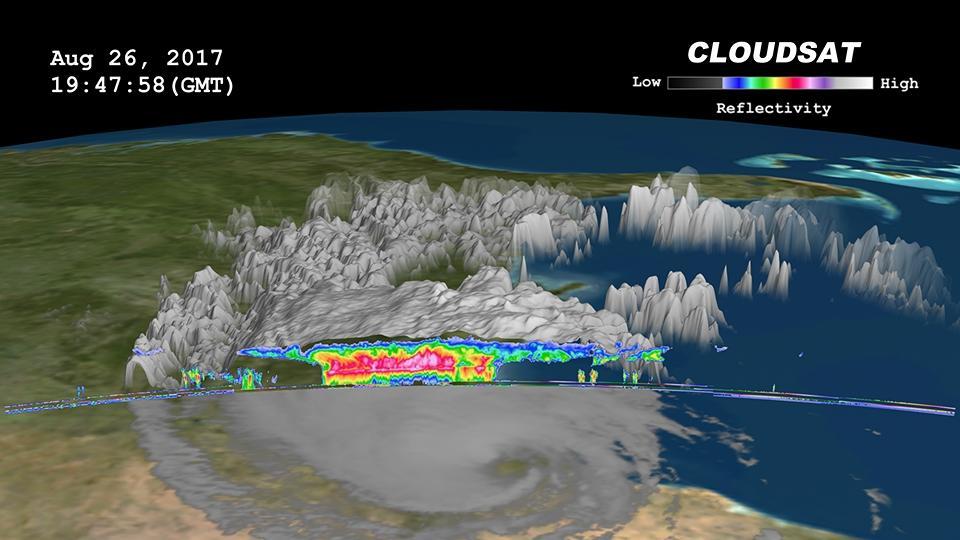
Click on the image for larger animation NASA's CloudSat satellite flew over then-Tropical Storm Harvey on Aug. 26, 2017, at 2:45 p.m. CDT (19:45 UTC) as the storm was nearly stationary over south Texas. At that time, Harvey contained estimated maximum sustained winds of 69 miles per hour (60 knots). CloudSat flew over Harvey northeast of the storm center through an area of moderate to heavy rainfall in the outer rainbands. As seen in the image and animation, large amounts of liquid and ice water (denoted by the red and pink colors) are visible beneath the cloud tops. The lack of a radar signal (attenuation) beneath the melting layer (located around 3 miles, or 5 kilometers, above ground) can be seen in the heavier areas of precipitation, since CloudSat's cloud profiling radar (CPR) signal dampens when precipitation particles are larger than 0.12 inches (3 millimeters) in size. Smaller cumulus and cumulonimbus clouds are seen north of the area of moderate to heavy precipitation. The cirrus canopy (anvil clouds) extends outward from the storm system (shown in blue and green colors). An animation is available at https://photojournal.jpl.nasa.gov/catalog/PIA17392
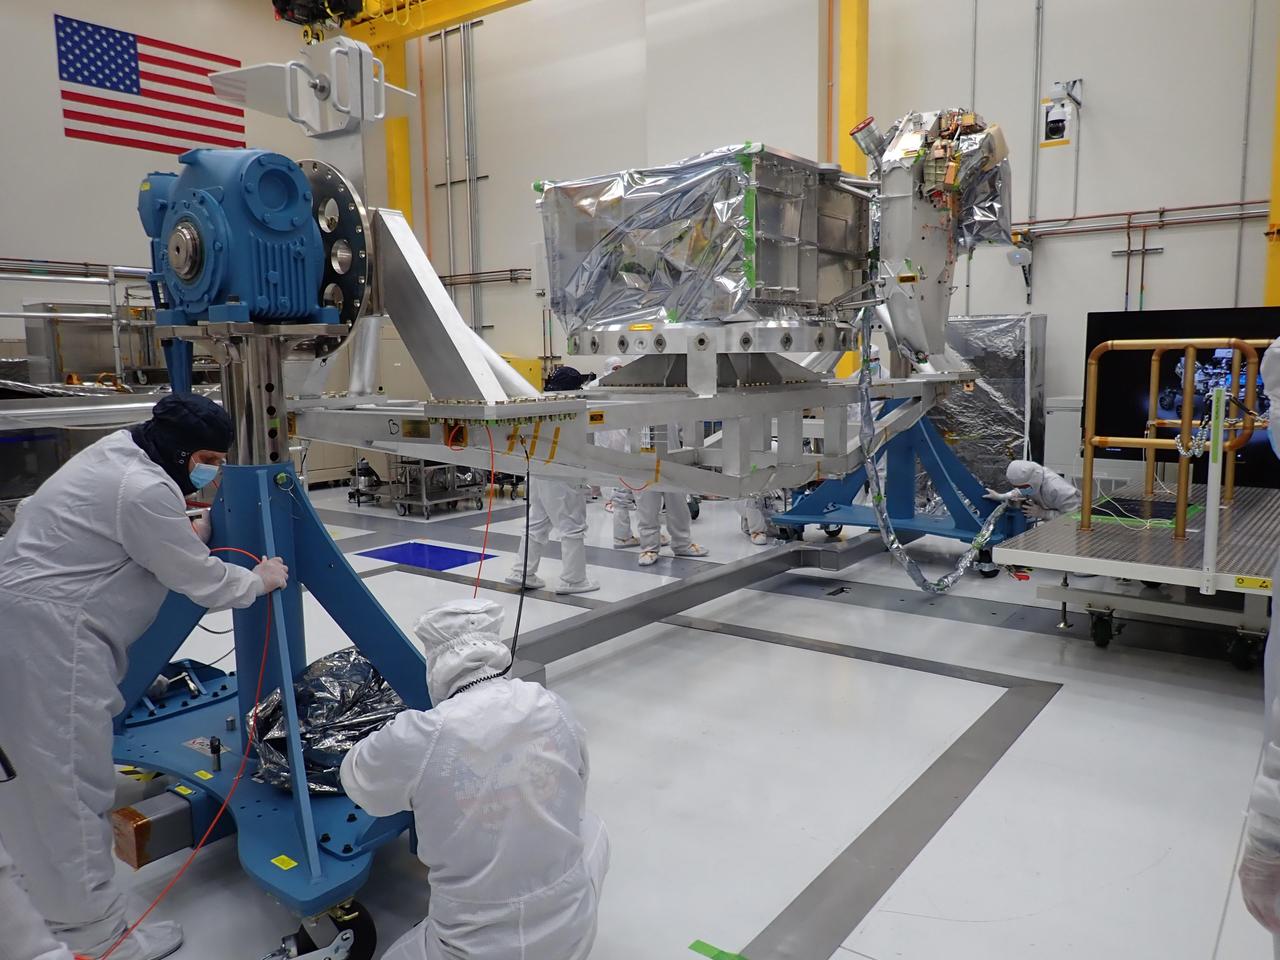
The vault, with nadir deck attached, of NASA's Europa Clipper is prepared to be moved to the High Bay 1 clean room of the Spacecraft Assembly Facility at NASA's Jet Propulsion Laboratory in Southern California. Made of aluminum, the vault will house and protect the spacecraft's electronics from Jupiter's intense radiation and high-energy particles. The nadir deck will support many of the spacecraft's science-instrument sensors by stabilizing them and ensuring they are oriented correctly. The vault and nadir deck soon will join other Europa Clipper hardware in High Bay 1, including the spacecraft's main body. Engineers and technicians will be working through the phase known as assembly, test, and launch operations to prepare the spacecraft for its launch to Jupiter's moon Europa in October 2024. Europa Clipper will conduct nearly 50 flybys of the icy Jovian moon Europa, which scientists are confident harbors an internal ocean containing twice as much water as Earth's oceans combined. The moon may currently have conditions suitable for supporting life. The spacecraft's nine science instruments, plus a gravity science investigation, will gather data on the moon's atmosphere, surface, and interior – information that scientists will use to gauge the depth and salinity of the ocean, the thickness of the ice crust, and potential plumes that may be venting subsurface water into space. https://photojournal.jpl.nasa.gov/catalog/PIA25493
Although Enceladus and Saturn's rings are largely made up of water ice, they show very different characteristics. The small ring particles are too tiny to retain internal heat and have no way to get warm, so they are frozen and geologically dead. Enceladus, on the other hand, is subject to forces that heat its interior to this very day. This results in its famous south polar water jets, which are just visible above the moon's dark, southern limb, along with a sub-surface ocean. Recent work by Cassini scientists suggests that Enceladus (313 miles or 504 kilometers across) has a global ocean of liquid water under its surface. This discovery increases scientists' interest in Enceladus and the quest to understand the role of water in the development of life in the solar system. (For more on the sub-surface ocean, see this story.) This view looks toward the unilluminated side of the rings from about 0.3 degrees below the ring plane. The image was taken in visible light with the Cassini spacecraft narrow-angle camera on July 29, 2015. The view was acquired at a distance of approximately 630,000 miles (1.0 million kilometers) from Enceladus and at a Sun-Enceladus-spacecraft, or phase angle of 155 degrees. Image scale is 4 miles (6 kilometers) per pixel. http://photojournal.jpl.nasa.gov/catalog/PIA18343
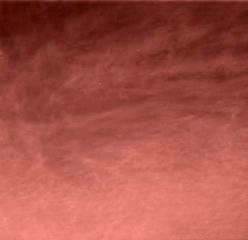
This is the first color image ever taken from the surface of Mars of an overcast sky. Featured are pink stratus clouds coming from the northeast at about 15 miles per hour (6.7 meters/second) at an approximate height of ten miles (16 kilometers) above the surface. The clouds consist of water ice condensed on reddish dust particles suspended in the atmosphere. Clouds on Mars are sometimes localized and can sometimes cover entire regions, but have not yet been observed to cover the entire planet. The image was taken about an hour and forty minutes before sunrise by the Imager for Mars Pathfinder (IMP) on Sol 16 at about ten degrees up from the eastern Martian horizon. Sojourner spent 83 days of a planned seven-day mission exploring the Martian terrain, acquiring images, and taking chemical, atmospheric and other measurements. The final data transmission received from Pathfinder was at 10:23 UTC on September 27, 1997. Although mission managers tried to restore full communications during the following five months, the successful mission was terminated on March 10, 1998. http://photojournal.jpl.nasa.gov/catalog/PIA00796
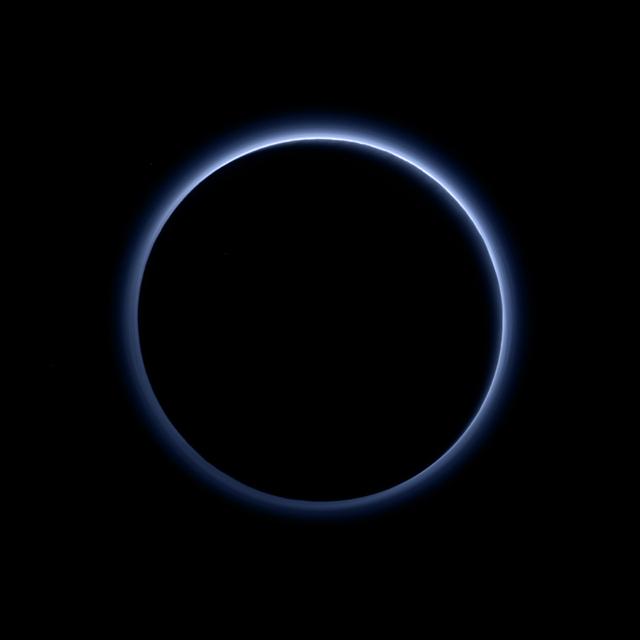
Pluto’s Blue Sky: Pluto’s haze layer shows its blue color in this picture taken by the New Horizons Ralph/Multispectral Visible Imaging Camera (MVIC). The high-altitude haze is thought to be similar in nature to that seen at Saturn’s moon Titan. The source of both hazes likely involves sunlight-initiated chemical reactions of nitrogen and methane, leading to relatively small, soot-like particles (called tholins) that grow as they settle toward the surface. This image was generated by software that combines information from blue, red and near-infrared images to replicate the color a human eye would perceive as closely as possible. Credits: NASA/JHUAPL/SwRI Read more: <a href="http://www.nasa.gov/nh/nh-finds-blue-skies-and-water-ice-on-pluto" rel="nofollow">www.nasa.gov/nh/nh-finds-blue-skies-and-water-ice-on-pluto</a> <b><a href="http://www.nasa.gov/audience/formedia/features/MP_Photo_Guidelines.html" rel="nofollow">NASA image use policy.</a></b> <b><a href="http://www.nasa.gov/centers/goddard/home/index.html" rel="nofollow">NASA Goddard Space Flight Center</a></b> enables NASA’s mission through four scientific endeavors: Earth Science, Heliophysics, Solar System Exploration, and Astrophysics. Goddard plays a leading role in NASA’s accomplishments by contributing compelling scientific knowledge to advance the Agency’s mission. <b>Follow us on <a href="http://twitter.com/NASAGoddardPix" rel="nofollow">Twitter</a></b> <b>Like us on <a href="http://www.facebook.com/pages/Greenbelt-MD/NASA-Goddard/395013845897?ref=tsd" rel="nofollow">Facebook</a></b> <b>Find us on <a href="http://instagrid.me/nasagoddard/?vm=grid" rel="nofollow">Instagram</a></b>
This enhanced-color mosaic of Saturn's icy moon Tethys shows a range of features on the moon's trailing hemisphere. Tethys is tidally locked to Saturn, so the trailing hemisphere is the side of the moon that always faces opposite its direction of motion as it orbits the planet. Images taken using clear, green, infrared and ultraviolet spectral filters were combined to create the view, which highlights subtle color differences across Tethys' surface at wavelengths not visible to human eyes. The moon's surface is fairly uniform in natural color. The color of the surface changes conspicuously across the disk, from yellowish hues to nearly white. These broad color changes are affected by a number of external processes. First, Saturn's diffuse E-ring preferentially bombards Tethys' leading hemisphere, toward the right side of this image, with ice bright ice grains. At the same time, charged particles from Saturn's radiation belt bombard the surface on the trailing side, causing color changes due to chemical alteration of the materials there. The albedo -- a measure of the surface's reflectivity -- drops by 10 to 15 percent from the moon's leading side to the trailing side. Similar global color patterns exist on other Saturnian moons. On a much smaller scale, enigmatic, arc-shaped, reddish streaks also are faintly visible across the heavily-cratered surface, particularly if one enhances color saturation in the image (see PIA19637 for a close-up view of these features). The origin of this localized color contrast is not yet understood. Mountains on the floor of the 280 mile- (450 kilometer-) wide Odysseus impact basin are visible at upper right, around the two o'clock position. This mosaic is an orthographic projection constructed from 52 Cassini images obtained on April 11, 2015 with the Cassini spacecraft narrow-angle camera. Resolution is about 1,000 feet (300 meters) per pixel. The images were obtained at a distance of approximately 33,000 miles (53,000 kilometers) from Tethys. http://photojournal.jpl.nasa.gov/catalog/PIA19636
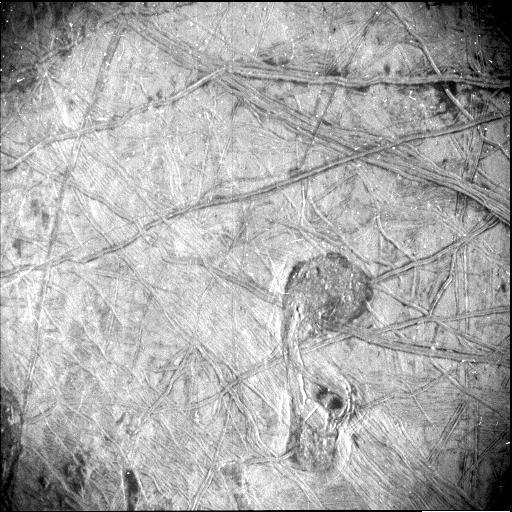
Taken by NASA's Juno spacecraft, this black-and-white photo of the surface of Jupiter's icy moon Europa reveals a curious feature – shaped somewhat like the musical symbol for a quarter note – surrounded by a vast network of linear ridges and dark blotches. It was obtained by Juno's Stellar Reference Unit (SRU) during the spacecraft's Sept. 29, 2022, flyby of Europa. The image shows a region crisscrossed with a network of fine grooves and sets of complicated double ridges (pairs of long parallel lines indicating elevated features in the ice). In the upper right corner are dark stains possibly linked to seepage or the bubbling up of liquid from beneath the ice. Just below center and to the right is the surface feature that takes a form like a musical quarter note. The feature measures 42 miles (67 kilometers) north-south and 23 miles (37 kilometers) east-west. The white dots in the image are signatures of penetrating high energy particles from the severe radiation environment around the moon. The image was taken at a distance of about 256 miles (412 kilometers) over the darkened hemisphere of Europa. It covers about 93 miles (150 kilometers) by 125 miles (200 kilometers) of the moon's surface. The SRU is designed to provide images of starfields used for attitude determination. The camera, designed for low-light conditions, has proved itself a valuable science tool, discovering shallow lightning in Jupiter's atmosphere, imaging Jupiter's enigmatic ring system, and now providing a glimpse of Europa's most fascinating geologic formations. https://photojournal.jpl.nasa.gov/catalog/PIA25332
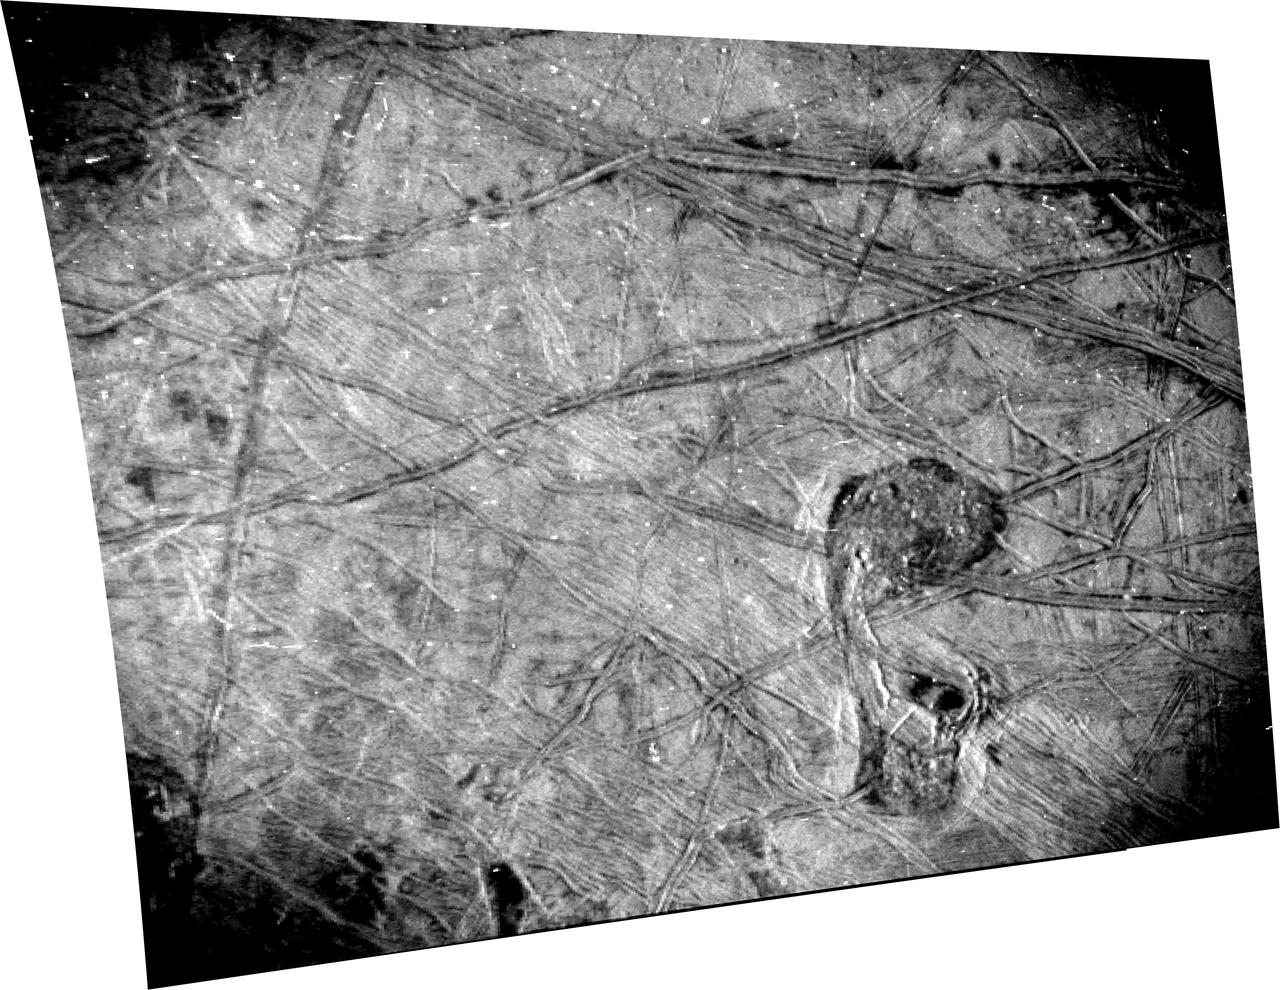
This black-and-white image of Europa's surface was taken by the Stellar Reference Unit (SRU) aboard NASA's Juno spacecraft during a Sept. 29, 2022, flyby of the Jovian moon. The image shows a region crisscrossed with a network of fine grooves and sets of complicated double ridges (pairs of long parallel lines indicating elevated features in the ice). In the upper right corner are dark stains possibly linked to cryovolcanic plume activity (the bubbling up of liquid from beneath the ice). Just below center and to the right is a surface feature that members of the Juno science team refer to as "the Platypus." This location of surface disruption (called "chaos" in the field of planetary science) measures 42 miles (67 kilometers) north-south and 23 miles (37 kilometers) east-west. (The feature's shape has previously been compared to a musical symbol for a quarter note.) The small white dots that pepper the image are signatures of penetrating high-energy particles from the severe radiation environment around the moon. The image was taken at a distance of about 256 miles (412 kilometers) over the night side of Europa in a region dimly illuminated by Jupiter-shine. It is Juno's highest resolution image of the moon, at 840 to 1,115 feet per pixel (256 to 340 meters per pixel) and covers about 93 by 125 miles (150 by 200 kilometers) of Europa's surface. The SRU collects images of star fields to provide star positions used for attitude determination. Designed for low-light conditions, the camera has proved itself a valuable science tool, discovering shallow lightning in Jupiter's atmosphere, imaging the planet's enigmatic ring system, and now providing a glimpse of Europa's most fascinating geologic formations. https://photojournal.jpl.nasa.gov/catalog/PIA26332
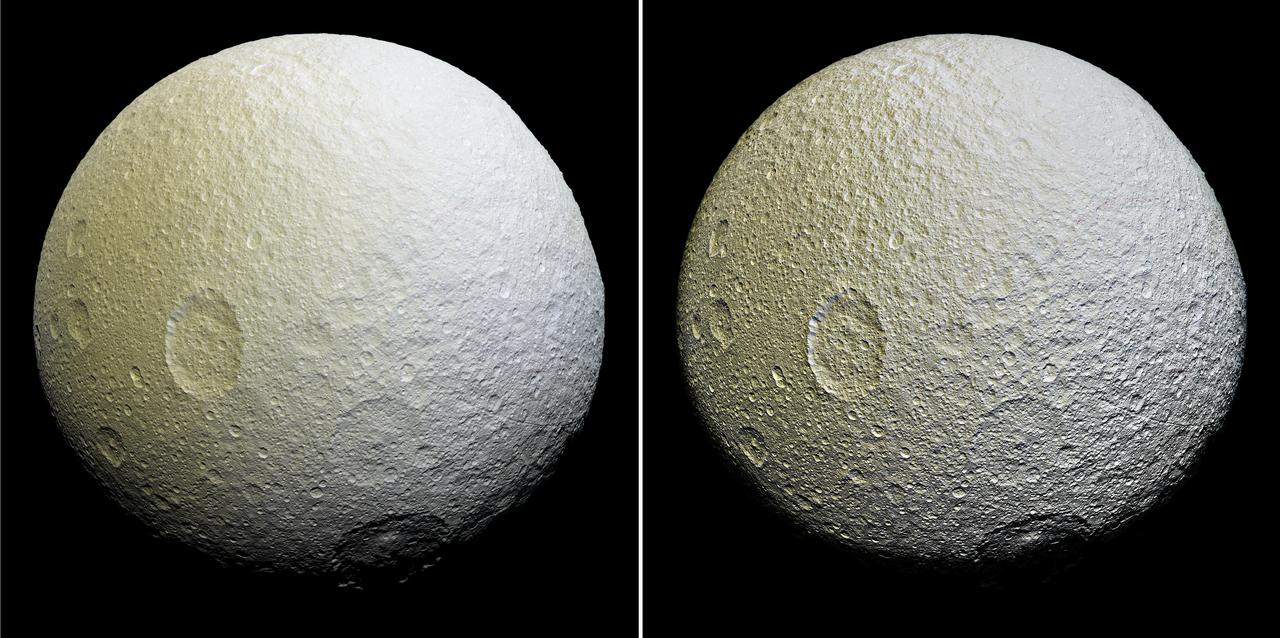
This enhanced-color mosaic of Saturn's icy moon Tethys shows a range of features on the moon's trailing hemisphere. Tethys is tidally locked to Saturn, so the trailing hemisphere is the side of the moon that always faces opposite its direction of motion as it orbits the planet. This view was obtained about two and a half hours earlier than PIA19636 and shows terrain slightly farther to the west and south of that view. Two versions of the mosaic are presented here: one with standard image processing (Figure 1), and one that strongly enhances the relief of craters and other surface features (Figure 2). Images taken using clear, green, infrared and ultraviolet spectral filters were combined to create the view, which highlights subtle color differences across Tethys' surface at wavelengths not visible to human eyes. The moon's surface is fairly uniform in natural color. The color of the surface can be seen to change across the disk, from yellowish hues to nearly white. These broad color changes are affected by a number of external processes. First, Saturn's diffuse E-ring preferentially bombards Tethys' leading hemisphere, toward the right side in this image, with ice bright ice grains. At the same time, charged particles from Saturn's radiation belt bombard the surface on the trailing side, causing color changes due to chemical alteration of the materials there. The albedo -- a measure of the surface's reflectivity -- drops by 10 to 15 percent from the moon's leading side to the trailing side. Similar global color patterns exist on other Saturnian moons. On a much smaller scale, enigmatic, arc-shaped reddish streaks are faintly visible across the heavily-cratered surface, particularly in the upper right quarter of the image (see PIA19637 for a close-up view of these features). The origin of this localized color contrast is not yet understood. This mosaic is an orthographic projection constructed from 52 Cassini images obtained on April 11, 2015 with the Cassini spacecraft narrow-angle camera. Image scale is about 1,000 feet (300 meters) per pixel. The images were obtained at a distance of approximately 33,000 miles (53,000 kilometers) from Tethys. http://photojournal.jpl.nasa.gov/catalog/PIA19638

These are the highest-resolution color images of any part of Saturn's rings, to date, showing a portion of the inner-central part of the planet's B Ring. The view is a mosaic of two images that show a region that lies between 61,300 and 65,600 miles (98,600 and 105,500 kilometers) from Saturn's center. This image is a natural color composite, created using images taken with red, green and blue spectral filters. The pale tan color is generally not perceptible with the naked eye in telescope views, especially given that Saturn has a similar hue. The material responsible for bestowing this color on the rings -- which are mostly water ice and would otherwise appear white -- is a matter of intense debate among ring scientists that will hopefully be settled by new in-situ observations before the end of Cassini's mission. The different ringlets seen here are part of what is called the "irregular structure" of the B ring. Cassini radio occultations of the rings have shown that these features have extremely sharp boundaries on even smaller scales (radially, or along the direction outward from Saturn) than the camera can resolve here. Closer to Saturn, the irregular structures become fuzzier and more rounded, less opaque, and their color contrast diminishes. The narrow ringlets in the middle of this scene are each about 25 miles (40 kilometers) wide, and the broader bands at right are about 200 to 300 miles (300 to 500 kilometers) across. It remains unclear exactly what causes the variable brightness of these ringlets and bands -- the basic brightness of the ring particles themselves, shadowing on their surfaces, their absolute abundance, and how densely the particles are packed, may all play a role. The second image (Figure 1) is a color-enhanced version. Blue colors represent areas where the spectrum at visible wavelengths is less reddish (meaning the spectrum is flatter toward red wavelengths), while red colors represent areas that are spectrally redder (meaning the spectrum has a steeper spectrum toward red wavelengths). Observations from the Voyager mission and Cassini's visual and infrared mapping spectrometer previously showed these color variations at lower resolution, but it was not known that such well-defined color contrasts would be this sharply defined down to the scale (radial scale) of a couple of miles or kilometers, as seen here. Analysis of additional images from this observation, taken using infrared spectral filters sensitive to absorption of light by water ice, indicates that the areas that appear more visibly reddish in the color-enhanced version are also richer in water ice. The third image (Figure 2) is a composite of the "true" and "enhanced" color images for easy comparison. This image was taken on July 6, 2017, with the Cassini spacecraft narrow-angle camera. The image was acquired on the sunlit side of the rings from a distance of 47,000 miles (76,000 kilometers) away from the area pictured. The image scale is about 2 miles (3 kilometers) per pixel. The phase angle, or sun-ring-spacecraft angle, is 90 degrees. https://photojournal.jpl.nasa.gov/catalog/PIA21628

This is a composite image of Uranus by Voyager 2 and two different observations made by Hubble — one for the ring and one for the auroras. Ever since Voyager 2 beamed home spectacular images of the planets in the 1980s, planet-lovers have been hooked on auroras on other planets. Auroras are caused by streams of charged particles like electrons that come from various origins such as solar winds, the planetary ionosphere, and moon volcanism. They become caught in powerful magnetic fields and are channeled into the upper atmosphere, where their interactions with gas particles, such as oxygen or nitrogen, set off spectacular bursts of light. The auroras on Jupiter and Saturn are well-studied, but not much is known about the auroras of the giant ice planet Uranus. In 2011, the NASA/ESA Hubble Space Telescope became the first Earth-based telescope to snap an image of the auroras on Uranus. In 2012 and 2014 a team led by an astronomer from Paris Observatory took a second look at the auroras using the ultraviolet capabilities of the Space Telescope Imaging Spectrograph (STIS) installed on Hubble. They tracked the interplanetary shocks caused by two powerful bursts of solar wind traveling from the sun to Uranus, then used Hubble to capture their effect on Uranus’ auroras — and found themselves observing the most intense auroras ever seen on the planet. By watching the auroras over time, they collected the first direct evidence that these powerful shimmering regions rotate with the planet. They also re-discovered Uranus’ long-lost magnetic poles, which were lost shortly after their discovery by Voyager 2 in 1986 due to uncertainties in measurements and the featureless planet surface. Credit: ESA/Hubble & NASA, L. Lamy / Observatoire de Paris <b><a href="http://www.nasa.gov/audience/formedia/features/MP_Photo_Guidelines.html" rel="nofollow">NASA image use policy.</a></b> <b><a href="http://www.nasa.gov/centers/goddard/home/index.html" rel="nofollow">NASA Goddard Space Flight Center</a></b> enables NASA’s mission through four scientific endeavors: Earth Science, Heliophysics, Solar System Exploration, and Astrophysics. Goddard plays a leading role in NASA’s accomplishments by contributing compelling scientific knowledge to advance the Agency’s mission. <b>Follow us on <a href="http://twitter.com/NASAGoddardPix" rel="nofollow">Twitter</a></b> <b>Like us on <a href="http://www.facebook.com/pages/Greenbelt-MD/NASA-Goddard/395013845897?ref=tsd" rel="nofollow">Facebook</a></b> <b>Find us on <a href="http://instagrid.me/nasagoddard/?vm=grid" rel="nofollow">Instagram</a></b>

In this artist's conception, a possible newfound planet spins through a clearing in a nearby star's dusty, planet-forming disc. This clearing was detected around the star CoKu Tau 4 by NASA's Spitzer Space Telescope. Astronomers believe that an orbiting massive body, like a planet, may have swept away the star's disc material, leaving a central hole. The possible planet is theorized to be at least as massive as Jupiter, and may have a similar appearance to what the giant planets in our own solar system looked like billions of years ago. A graceful ring, much like Saturn's, spins high above the planet's cloudy atmosphere. The ring is formed from countless small orbiting particles of dust and ice, leftovers from the initial gravitational collapse that formed the possible giant planet. If we were to visit a planet like this, we would have a very different view of the universe. The sky, instead of being the familiar dark expanse lit by distant stars, would be dominated by the thick disc of dust that fills this young planetary system. The view looking toward CoKu Tau 4 would be relatively clear, as the dust in the interior of the disc has fallen into the accreting star. A bright band would seem to surround the central star, caused by light scattered back by the dust in the disc. Looking away from CoKu Tau 4, the dusty disc would appear dark, blotting out light from all the stars in the sky except those which lie well above the plane of the disc. http://photojournal.jpl.nasa.gov/catalog/PIA05988
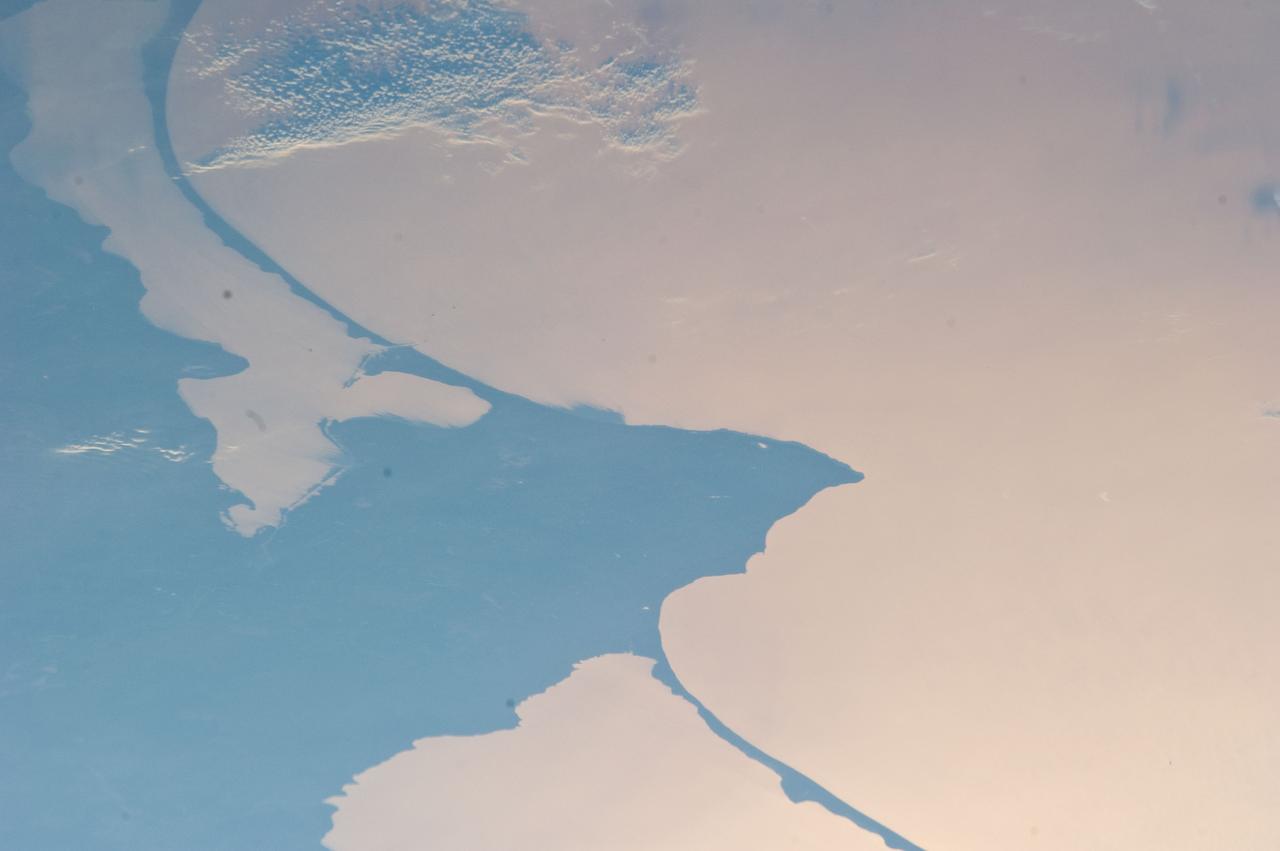
ISS028-E-024146 (2 Aug. 2011) --- Kaliningrad and Baltic Sea, Russia are featured in this image photographed by an Expedition 28 crew member on the International Space Station. This striking photograph reveals detail of the two great lagoons to the north and south of Kaliningrad, each protected from the open waters of the Baltic Sea by the thin perfect curves of current-generated sand spits. A broad arm of agricultural country separates the freshwater lagoons?known as Kurshsky Bay (or the Curonian Lagoon further north in Lithuania, just outside the top of the image) and the Vistula Lagoon. From the crew member perspective in low Earth orbit, land surfaces usually appear brighter than water, which normally appears darker and often black. Reflected sunlight, or sunglint, inverts this pattern. The reflected light in this image is a pink or coppery hue, indicating the likely existence of smog in the air since smog particles enhance the red part of the light spectrum. Camera settings used to acquire sunglint images result in high contrast that reveals excellent detail of coastlines and surface features of waterbodies, but masks land surface detail. The thin, 50 kilometer-long barge canal leading from the Baltic Sea to Kaliningrad is visible but the great port of Kaliningrad itself is not. Other human patterns on this intensively developed landscape such as towns, highways and farm boundaries are likewise masked in the image. The area has a long human history. The growth of the Vistula spit finally cut off the north Polish city of Elblag (just outside the bottom of the image) from the Baltic Sea in the 13th century. To reconnect Elblag directly with the Baltic Sea, the EU is considering funding the digging of another canal through the spit at lower right, despite ecological concerns. Kaliningrad was heavily damaged during WWII and then annexed by Russia and cleared of its German population. As the only Russian port on the Baltic Sea to be ice-free year-round, Kaliningrad then gained importance strategically as home of the Baltic Fleet.
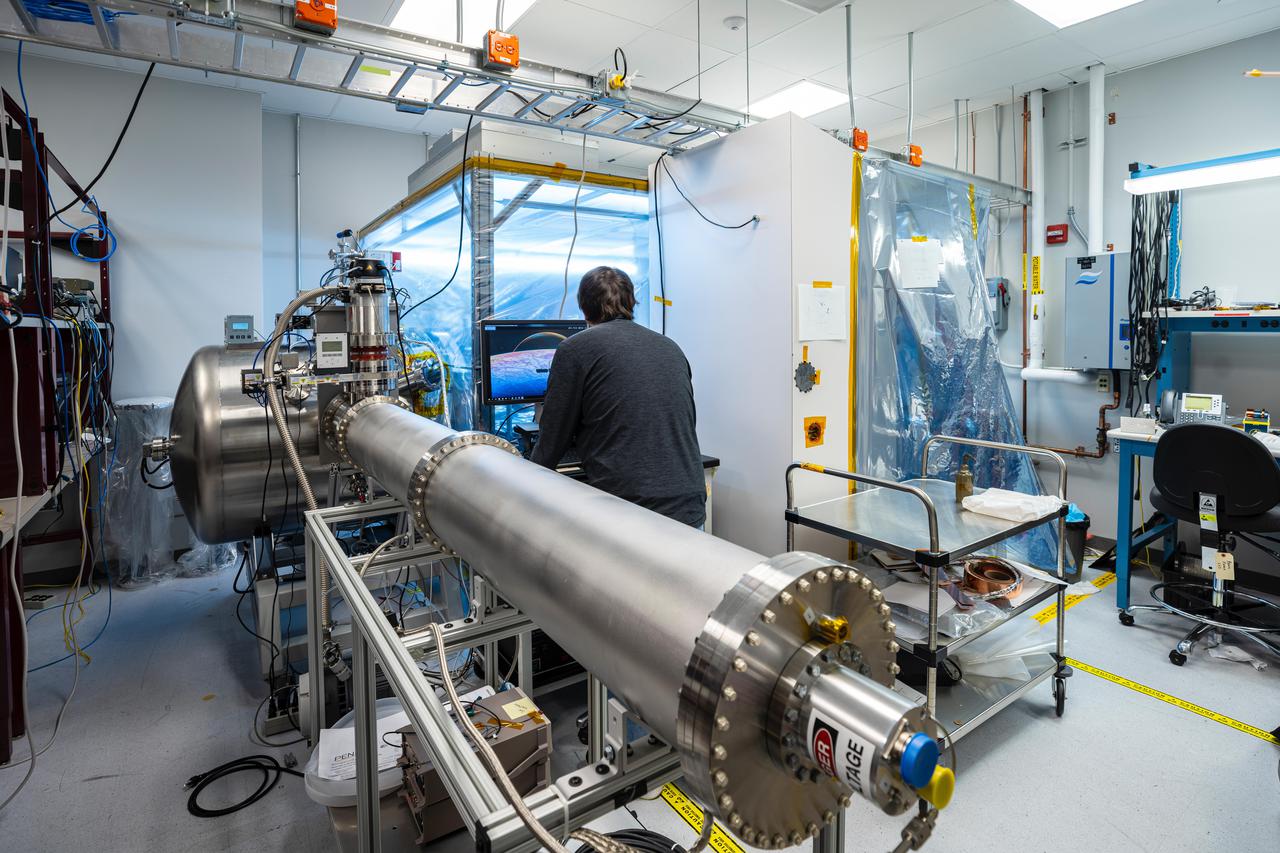
Included in the payload of science instruments for NASA's Europa Clipper is the Plasma Instrument for Magnetic Sounding (PIMS). Scientists will use PIMS to study the characteristics of plasma around Europa to better understand the moon's ice-shell thickness, ocean depth, and ocean salinity. PIMS will have four sensors, called Faraday cups, to measure the electrical current produced by charged particles (or plasma) as they strike a detector plate inside each sensor. In this photo, the Plasma Instrument Calibration Chamber at the Johns Hopkins Applied Physics Laboratory (APL) in Laurel, Maryland, recreates the plasma environments that PIMS and other instruments will encounter in space. The equipment in this lab simulates these environments with ion beams that reproduce plasma energy ranges found at Jupiter and Europa. Once PIMS is fully assembled in the clean room attached to the chamber, the team will direct these ion and electron beams into the Faraday cup sensors for calibration. This will be used specifically to simulate the plasma in Europa's ionosphere and Jupiter's magnetosphere, which PIMS will later measure directly. With an internal global ocean twice the size of Earth's oceans combined, Europa may have the potential to harbor life. NASA's Europa Clipper spacecraft will swoop around Jupiter on an elliptical path, dipping close to the moon on each flyby to collect data. Understanding Europa's habitability will help scientists better understand how life developed on Earth and the potential for finding life beyond our planet. https://photojournal.jpl.nasa.gov/catalog/PIA24330
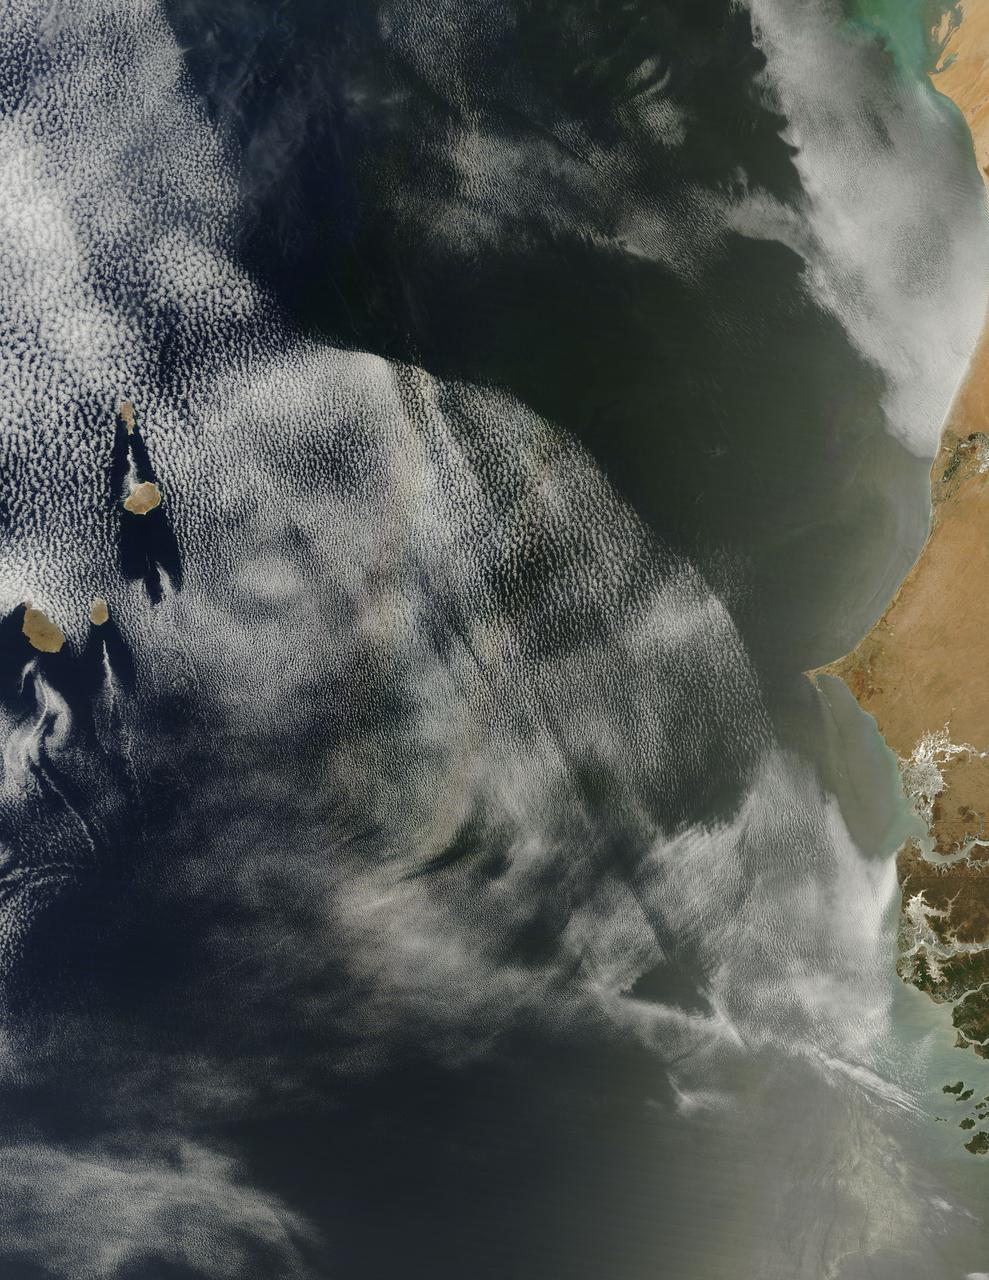
On April 23, 2013 NASA’s Terra satellite passed off the coast of West Africa, allowing the Moderate Resolution Imaging Spectroradiometer (MODIS) flying aboard to capture a curious phenomenon over the cloud deck below. The rainbow-like discoloration that can be seen streaking across the bank of marine cumulus clouds near the center of this image is known as a “glory”. A glory is caused by the scattering of sunlight by a cloud made of water droplets that are all roughly the same size, and is only produced when the light is just right. In order for a glory to be viewed, the observer’s anti-solar point must fall on the cloud deck below. In this case the observer is the Terra satellite, and the anti-solar point is where the sun is directly behind you – 180° from the MODIS line of sight. Water and ice particles in the cloud bend the light, breaking it into all its wavelengths, and the result is colorful flare, which may contain all of the colors of the rainbow. Credit: NASA/GSFC/Jeff Schmaltz/MODIS Land Rapid Response Team <b><a href="http://www.nasa.gov/audience/formedia/features/MP_Photo_Guidelines.html" rel="nofollow">NASA image use policy.</a></b> <b><a href="http://www.nasa.gov/centers/goddard/home/index.html" rel="nofollow">NASA Goddard Space Flight Center</a></b> enables NASA’s mission through four scientific endeavors: Earth Science, Heliophysics, Solar System Exploration, and Astrophysics. Goddard plays a leading role in NASA’s accomplishments by contributing compelling scientific knowledge to advance the Agency’s mission. <b>Follow us on <a href="http://twitter.com/NASA_GoddardPix" rel="nofollow">Twitter</a></b> <b>Like us on <a href="http://www.facebook.com/pages/Greenbelt-MD/NASA-Goddard/395013845897?ref=tsd" rel="nofollow">Facebook</a></b> <b>Find us on <a href="http://instagram.com/nasagoddard?vm=grid" rel="nofollow">Instagram</a></b>

As it sped away from Venus, NASA's Mariner 10 spacecraft captured this seemingly peaceful view of a planet the size of Earth, wrapped in a dense, global cloud layer. But, contrary to its serene appearance, the clouded globe of Venus is a world of intense heat, crushing atmospheric pressure and clouds of corrosive acid. This newly processed image revisits the original data with modern image processing software. A contrast-enhanced version of this view, also provided here, makes features in the planet's thick cloud cover visible in greater detail. The clouds seen here are located about 40 miles (60 kilometers) above the planet's surface, at altitudes where Earth-like atmospheric pressures and temperatures exist. They are comprised of sulfuric acid particles, as opposed to water droplets or ice crystals, as on Earth. These cloud particles are mostly white in appearance; however, patches of red-tinted clouds also can be seen. This is due to the presence of a mysterious material that absorbs light at blue and ultraviolet wavelengths. Many chemicals have been suggested for this mystery component, from sulfur compounds to even biological materials, but a consensus has yet to be reached among researchers. The clouds of Venus whip around the planet at nearly over 200 miles per hour (100 meters per second), circling the globe in about four and a half days. That these hurricane-force winds cover nearly the entire planet is another unexplained mystery, especially given that the solid planet itself rotates at a very slow 4 mph (less than 2 meters per second) — much slower than Earth's rotation rate of about 1,000 mph (450 meters per second). The winds and clouds also blow to the west, not to the east as on the Earth. This is because the planet itself rotates to the west, backward compared to Earth and most of the other planets. As the clouds travel westward, they also typically progress toward the poles; this can be seen in the Mariner 10 view as a curved spiral pattern at mid latitudes. Near the equator, instead of long streaks, areas of more clumpy, discrete clouds can be seen, indicating enhanced upwelling and cloud formation in the equatorial region, spurred on by the enhanced power of sunlight there. This view is a false color composite created by combining images taken using orange and ultraviolet spectral filters on the spacecraft's imaging camera. These were used for the red and blue channels of the color image, respectively, with the green channel synthesized by combining the other two images. Flying past Venus en route to the first-ever flyby of Mercury, Mariner 10 became the first spacecraft to use a gravity assist to change its flight path in order to reach another planet. The images used to create this view were acquired by Mariner 10 on Feb. 7 and 8, 1974, a couple of days after the spacecraft's closest approach to Venus on Feb. 5. Despite their many differences, comparisons between Earth and Venus are valuable for helping to understand their distinct climate histories. Nearly 50 years after this view was obtained, many fundamental questions about Venus remain unanswered. Did Venus have oceans long ago? How has its atmosphere evolved over time, and when did its runaway greenhouse effect begin? How does Venus lose its heat? How volcanically and tectonically active has Venus been over the last billion years? This image was processed from archived Mariner 10 data by JPL engineer Kevin M. Gill. The Mariner 10 mission was managed by NASA's Jet Propulsion Laboratory. https://photojournal.jpl.nasa.gov/catalog/PIA23791
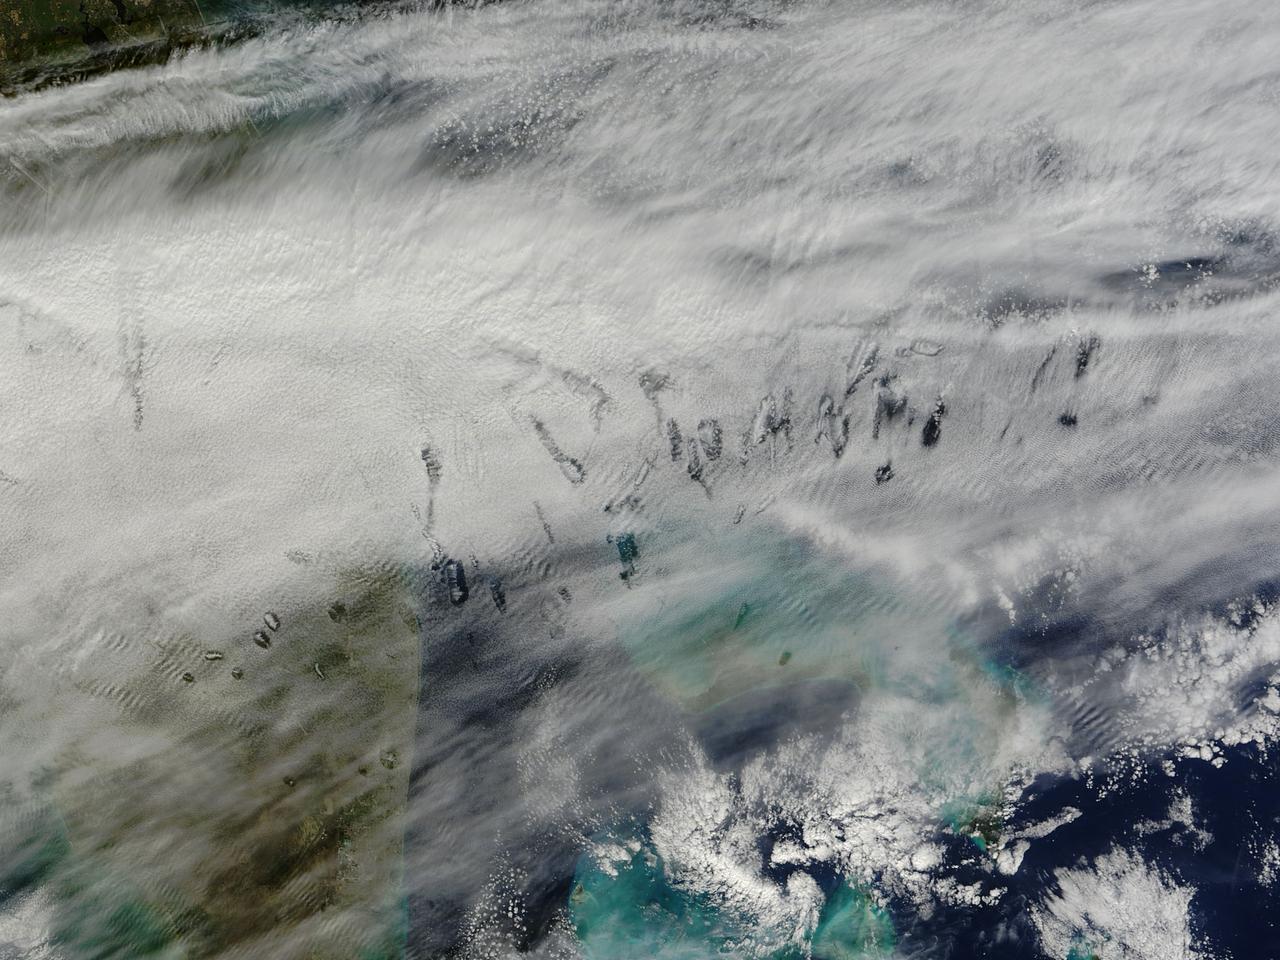
In elementary school, students learn that water freezes at 0 degrees Celsius (32 degrees Fahrenheit). That is true most of the time, but there are exceptions to the rule. For instance, water with very few impurities (such as dust or pollution particles, fungal spores, bacteria) can be chilled to much cooler temperatures and still remain liquid—a process known as supercooling. Supercooling may sound exotic, but it occurs pretty routinely in Earth’s atmosphere. Altocumulus clouds, a common type of mid-altitude cloud, are mostly composed of water droplets supercooled to a temperature of about -15 degrees C. Altocumulus clouds with supercooled tops cover about 8 percent of Earth’s surface at any given time. Supercooled water droplets play a key role in the formation of hole-punch and canal clouds, the distinctive clouds shown in these satellite images. Hole-punch clouds usually appear as circular gaps in decks of altocumulus clouds; canal clouds look similar but the gaps are longer and thinner. This true-color image shows hole-punch and canal clouds off the coast of Florida, as observed on December 12, 2014, by the Moderate Resolution Imaging Spectroradiometer (MODIS) on NASA’s Terra satellite. Both types of cloud form when aircraft fly through cloud decks rich with supercooled water droplets and produce aerodynamic contrails. Air expands and cools as it moves around the wings and past the propeller, a process known as adiabatic cooling. Air temperatures over jet wings often cool by as much as 20 degrees Celsius, pushing supercooled water droplets to the point of freezing. As ice crystals form, they absorb nearby water droplets. Since ice crystals are relatively heavy, they tend to sink. This triggers tiny bursts of snow or rain that leave gaps in the cloud cover. Whether a cloud formation becomes a hole-punch or canal depends on the thickness of the cloud layer, the air temperature, and the degree of horizontal wind shear. Both descending and ascending aircraft—including jets and propeller planes—can trigger hole-punch and canal clouds. The nearest major airports in the images above include Miami International, Fort Lauderdale International, Grand Bahama International, and Palm Beach International. Credit: NASA/GSFC/Jeff Schmaltz/MODIS Land Rapid Response Team <b><a href="http://www.nasa.gov/audience/formedia/features/MP_Photo_Guidelines.html" rel="nofollow">NASA image use policy.</a></b> <b><a href="http://www.nasa.gov/centers/goddard/home/index.html" rel="nofollow">NASA Goddard Space Flight Center</a></b> enables NASA’s mission through four scientific endeavors: Earth Science, Heliophysics, Solar System Exploration, and Astrophysics. Goddard plays a leading role in NASA’s accomplishments by contributing compelling scientific knowledge to advance the Agency’s mission. <b>Follow us on <a href="http://twitter.com/NASAGoddardPix" rel="nofollow">Twitter</a></b> <b>Like us on <a href="http://www.facebook.com/pages/Greenbelt-MD/NASA-Goddard/395013845897?ref=tsd" rel="nofollow">Facebook</a></b> <b>Find us on <a href="http://instagram.com/nasagoddard?vm=grid" rel="nofollow">Instagram</a></b>
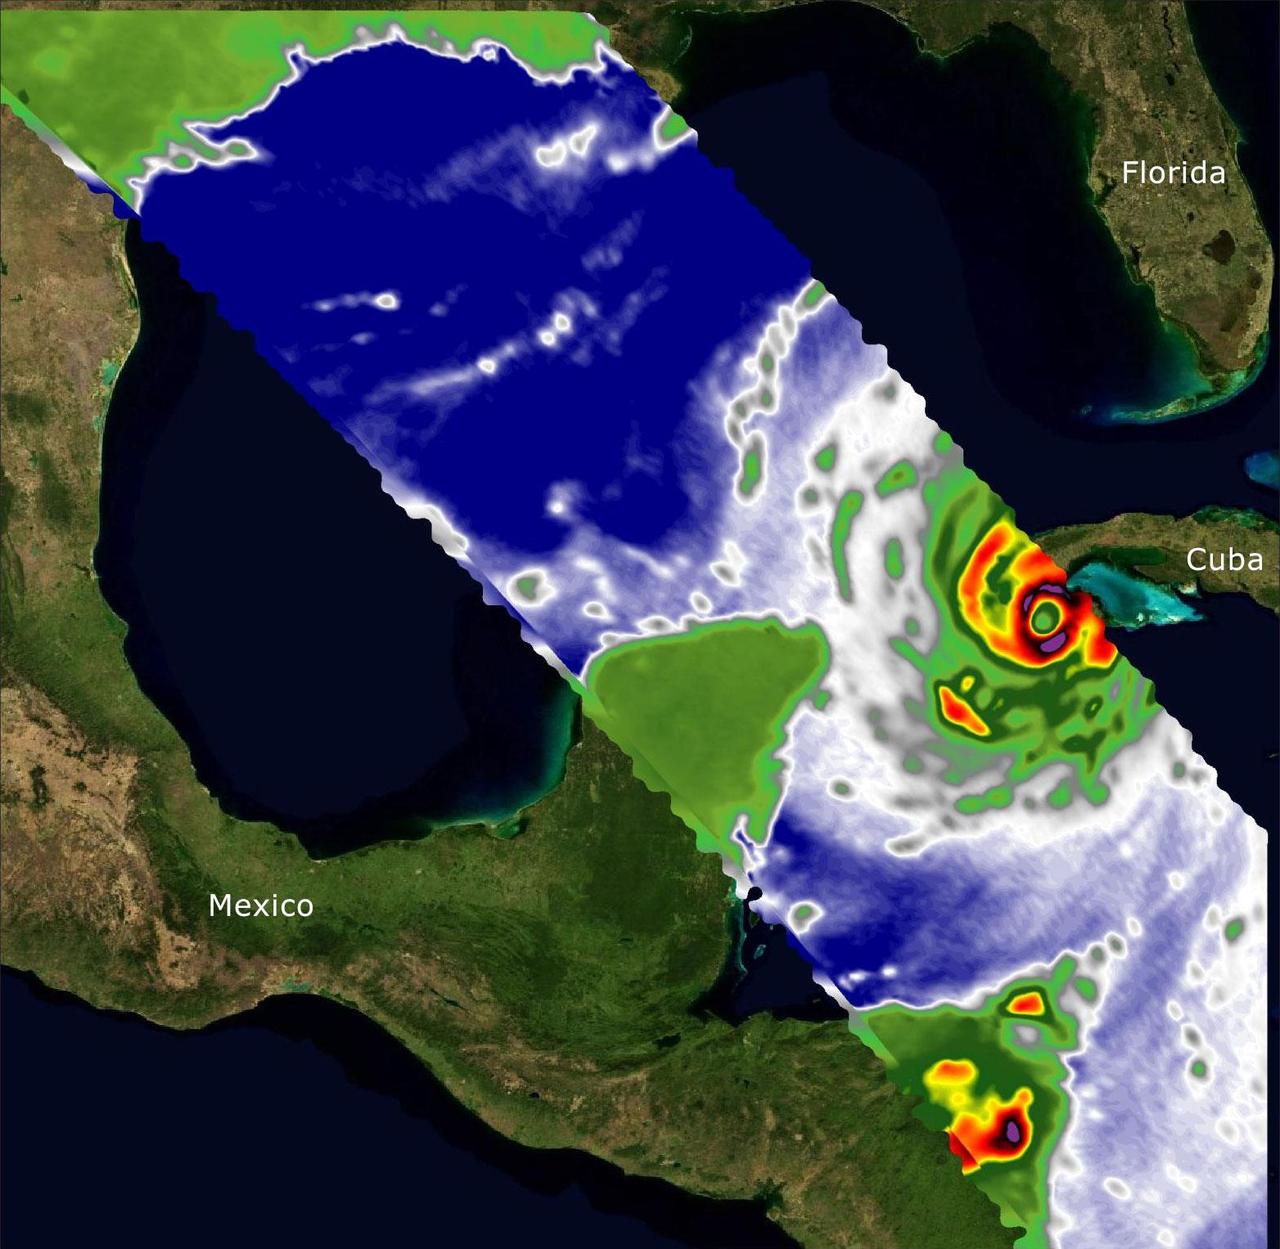
Two recently launched instruments that were designed and built at NASA's Jet Propulsion Laboratory in Southern California to provide forecasters data on weather over the open ocean captured images of Hurricane Ian on Sept. 27, 2022, as the storm approached Cuba on its way north toward the U.S. mainland. The instruments, Compact Ocean Wind Vector Radiometer (COWVR) and Temporal Experiment for Storms and Tropical Systems (TEMPEST), observe the planet's atmosphere and surface from aboard the International Space Station, which passed in low-Earth orbit over the Caribbean Sea at about 12:30 a.m. EDT. Ian made landfall in Cuba's Pinar del Rio province at 4:30 a.m. EDT, according to the National Hurricane Center. At that time, it was a Category 3 hurricane, with estimated wind speeds of 125 mph (205 kph). The image above combines microwave emissions measurements from both COWVR and TEMPEST. White sections indicate the presence of clouds. Green portions indicate rain. Yellow, red, and black indicate where air and water vapor were moving most swiftly. Ian's center is seen just off of Cuba's southern coast, and the storm is shown covering the island with rain and wind. COWVR and TEMPEST sent the data for this image back to Earth in a direct stream via NASA's tracking and data relay satellite (TDRS) constellation. The data were processed at JPL and made available to forecasters less than two hours after collection. About the size of a minifridge, COWVR measures natural microwave emissions over the ocean. The magnitude of the emissions increases with the amount of rain in the atmosphere, and the strongest rain produces the strongest microwave emissions. TEMPEST – comparable in size to a cereal box – tracks microwaves at a much shorter wavelength, allowing it to see ice particles within the hurricane's cloudy regions that are thrust into the upper atmosphere by the storm. Both microwave radiometers were conceived to demonstrate that smaller, more energy-efficient, more simply designed sensors can perform most of the same measurements as current space-based weather instruments that are heavier, consume more power, and cost much more to construct. COWVR's development was funded by the U.S. Space Force, and TEMPEST was developed with NASA funding. The U.S. Space Test Program-Houston 8 (STP-H8) is responsible for hosting the instruments on the space station under Space Force funding in partnership with NASA. Data from the instruments are being used by government and university weather forecasters and scientists. The mission will inform development of future space-based weather sensors, and scientists are working on mission concepts that would take advantage of the low-cost microwave sensor technologies to study long-standing questions, such as how heat from the ocean fuels global weather patterns. https://photojournal.jpl.nasa.gov/catalog/PIA25425
![These six infrared images of Saturn's moon Titan represent some of the clearest, most seamless-looking global views of the icy moon's surface produced so far. The views were created using 13 years of data acquired by the Visual and Infrared Mapping Spectrometer (VIMS) instrument on board NASA's Cassini spacecraft. The images are the result of a focused effort to smoothly combine data from the multitude of different observations VIMS made under a wide variety of lighting and viewing conditions over the course of Cassini's mission. Previous VIMS maps of Titan (for example, PIA02145) display great variation in imaging resolution and lighting conditions, resulting in obvious seams between different areas of the surface. With the seams now gone, this new collection of images is by far the best representation of how the globe of Titan might appear to the casual observer if it weren't for the moon's hazy atmosphere, and it likely will not be superseded for some time to come. Observing the surface of Titan in the visible region of the spectrum is difficult, due to the globe enshrouding haze that envelops the moon. This is primarily because small particles called aerosols in Titan's upper atmosphere strongly scatter visible light. But Titan's surface can be more readily imaged in a few infrared "windows" -- infrared wavelengths where scattering and absorption is much weaker. This is where the VIMS instrument excelled, parting the haze to obtain clear images of Titan's surface. (For comparison, Figure 1 shows Titan as it appears in visible light, as does PIA11603.) Making mosaics of VIMS images of Titan has always been a challenge because the data were obtained over many different flybys with different observing geometries and atmospheric conditions. One result is that very prominent seams appear in the mosaics that are quite difficult for imaging scientists to remove. But, through laborious and detailed analyses of the data, along with time consuming hand processing of the mosaics, the seams have been mostly removed. This is an update to the work previously discussed in PIA20022. Any full color image is comprised of three color channels: red, green and blue. Each of the three color channels combined to create these views was produced using a ratio between the brightness of Titan's surface at two different wavelengths (1.59/1.27 microns [red], 2.03/1.27 microns [green] and 1.27/1.08 microns [blue]). This technique (called a "band-ratio" technique) reduces the prominence of seams, as well as emphasizing subtle spectral variations in the materials on Titan's surface. For example, the moon's equatorial dune fields appear a consistent brown color here. There are also bluish and purplish areas that may have different compositions from the other bright areas, and may be enriched in water ice. For a map of Titan with latitudes, longitudes and labeled surface features, see PIA20713. It is quite clear from this unique set of images that Titan has a complex surface, sporting myriad geologic features and compositional units. The VIMS instrument has paved the way for future infrared instruments that could image Titan at much higher resolution, revealing features that were not detectable by any of Cassini's instruments. https://photojournal.jpl.nasa.gov/catalog/PIA21923](https://images-assets.nasa.gov/image/PIA21923/PIA21923~medium.jpg)
These six infrared images of Saturn's moon Titan represent some of the clearest, most seamless-looking global views of the icy moon's surface produced so far. The views were created using 13 years of data acquired by the Visual and Infrared Mapping Spectrometer (VIMS) instrument on board NASA's Cassini spacecraft. The images are the result of a focused effort to smoothly combine data from the multitude of different observations VIMS made under a wide variety of lighting and viewing conditions over the course of Cassini's mission. Previous VIMS maps of Titan (for example, PIA02145) display great variation in imaging resolution and lighting conditions, resulting in obvious seams between different areas of the surface. With the seams now gone, this new collection of images is by far the best representation of how the globe of Titan might appear to the casual observer if it weren't for the moon's hazy atmosphere, and it likely will not be superseded for some time to come. Observing the surface of Titan in the visible region of the spectrum is difficult, due to the globe enshrouding haze that envelops the moon. This is primarily because small particles called aerosols in Titan's upper atmosphere strongly scatter visible light. But Titan's surface can be more readily imaged in a few infrared "windows" -- infrared wavelengths where scattering and absorption is much weaker. This is where the VIMS instrument excelled, parting the haze to obtain clear images of Titan's surface. (For comparison, Figure 1 shows Titan as it appears in visible light, as does PIA11603.) Making mosaics of VIMS images of Titan has always been a challenge because the data were obtained over many different flybys with different observing geometries and atmospheric conditions. One result is that very prominent seams appear in the mosaics that are quite difficult for imaging scientists to remove. But, through laborious and detailed analyses of the data, along with time consuming hand processing of the mosaics, the seams have been mostly removed. This is an update to the work previously discussed in PIA20022. Any full color image is comprised of three color channels: red, green and blue. Each of the three color channels combined to create these views was produced using a ratio between the brightness of Titan's surface at two different wavelengths (1.59/1.27 microns [red], 2.03/1.27 microns [green] and 1.27/1.08 microns [blue]). This technique (called a "band-ratio" technique) reduces the prominence of seams, as well as emphasizing subtle spectral variations in the materials on Titan's surface. For example, the moon's equatorial dune fields appear a consistent brown color here. There are also bluish and purplish areas that may have different compositions from the other bright areas, and may be enriched in water ice. For a map of Titan with latitudes, longitudes and labeled surface features, see PIA20713. It is quite clear from this unique set of images that Titan has a complex surface, sporting myriad geologic features and compositional units. The VIMS instrument has paved the way for future infrared instruments that could image Titan at much higher resolution, revealing features that were not detectable by any of Cassini's instruments. https://photojournal.jpl.nasa.gov/catalog/PIA21923