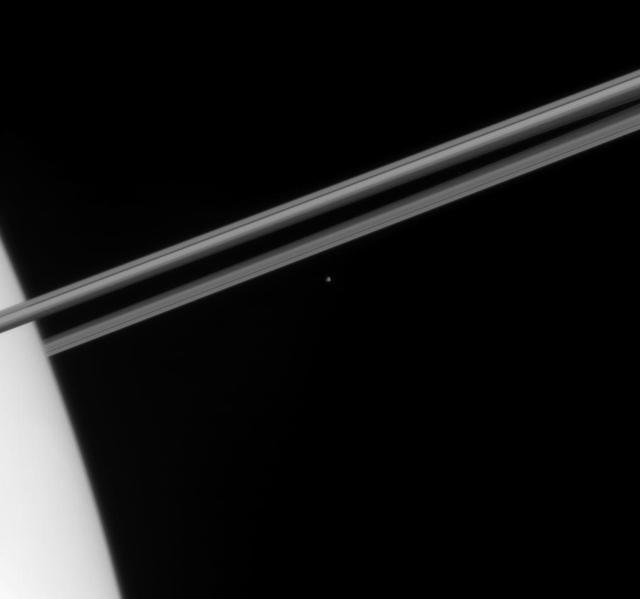
Iceberg Beyond the Rings
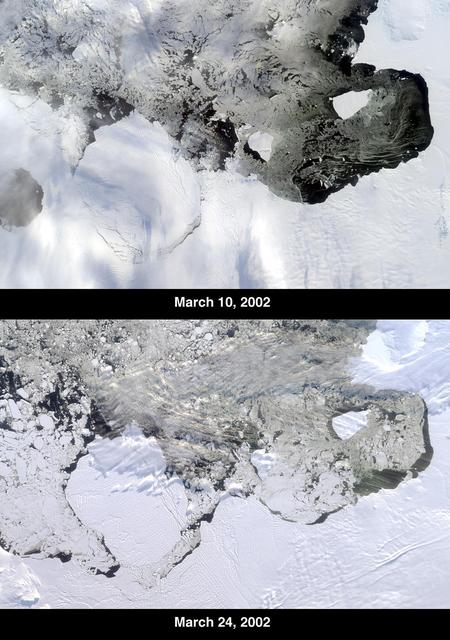
The Thwaites Ice Tongue is a large sheet of glacial ice extending from the West Antarctic mainland into the southern Amundsen Sea. A large crack in the Thwaites Tongue was discovered in imagery from Terra's Moderate Resolution Imaging SpectroRadiometer (MODIS). Subsequent widening of the crack led to the calving of a large iceberg. The development of this berg, designated B-22 by the National Ice Center, can be observed in these images from the Multi-angle Imaging SpectroRadiometer, also aboard Terra. The two views were acquired by MISR's nadir (vertical-viewing) camera on March 10 and 24, 2002. The B-22 iceberg, located below and to the left of image center, measures approximately 82 kilometers long x 62 kilometers wide. Comparison of the two images shows the berg to have drifted away from the ice shelf edge. The breakup of ice near the shelf edge, in the area surrounding B-22, is also visible in the later image. These natural-color images were acquired during Terra orbits 11843 and 12047, respectively. At the right-hand edge is Pine Island Bay, where the calving of another large iceberg (B-21) occurred in November 2001. B-21 subsequently split into two smaller bergs, both of which are visible to the right of B-22. http://photojournal.jpl.nasa.gov/catalog/PIA03700

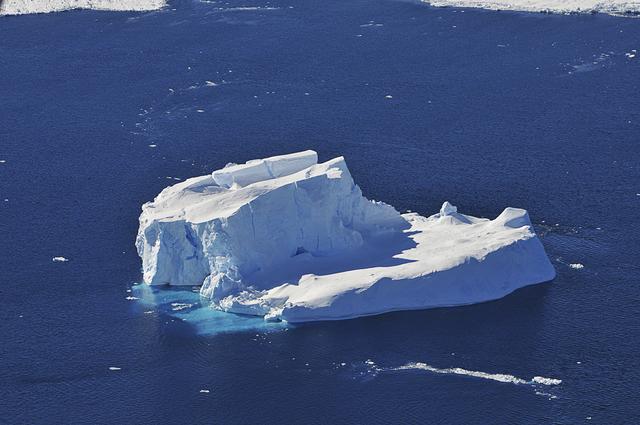
This large tabular iceberg, broken off from the Antarctic Ice Sheet, was spotted in the South Atlantic Ocean (57.0S, 57.0W) southeast of the tip of South America as it was slowly being moved north and east by wind, current and tidal influences. This type of iceberg, never to be seen in the northern hemisphere, is typical for Antarctica. Although some such icebergs are as large as 100 km in length, this one measures about 35 by 69 km.
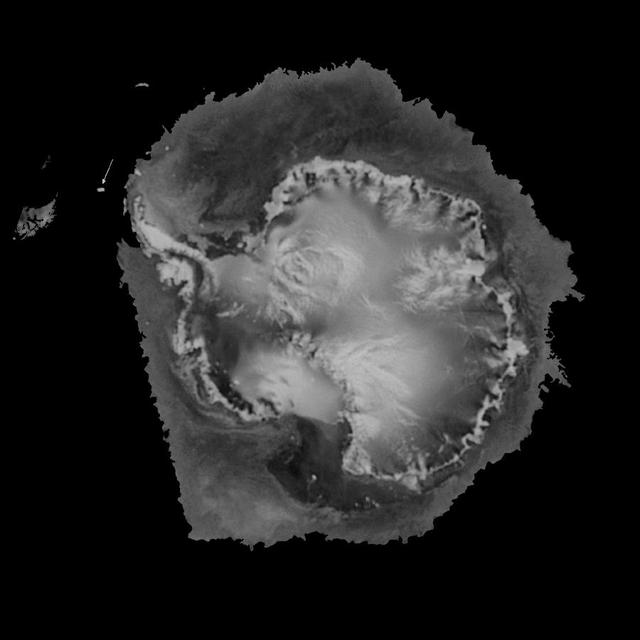
NASA Terra spacecraft imaged Iceberg B-15A, the largest iceberg in the world measuring about 11,000 square kilometers when it broke away from Western Antarctica Ross Ice Shelf in March 2000.
The voyage of Iceberg B-31 continued in January, 2014 as the giant iceberg drifted over the frigid waters of Pine Island Bay and widened the gap between the newly-calved iceberg and the “mother” glacier. Between November 9 and 11, 20143 a giant crack in the Pine Island Glacier gave completely away, liberating Iceberg B-31 from the end of the glacial tongue. The new iceberg was estimated to be 35 km by 20 km (21 mi by 12 mi) in size – or roughly the size of Singapore. On January 5, 2014 the Moderate Resolution Imaging Spectroradiometer (MODIS) aboard NASA’s Terra satellite captured this true-color image of B-31 floating in the center of Pine Island Bay on an approach to the Amundsen Sea. Pine Island Glacier can be seen on the upper right coast of the bay, and is marked by parallel lines in the ice. According to measurements reported by the National U.S. Ice Center, on January 10, B-31 was maintaining its size, and was located at 74°24'S and 104°33'W. Credit: NASA/GSFC/Jeff Schmaltz/MODIS Land Rapid Response Team <b><a href="http://www.nasa.gov/audience/formedia/features/MP_Photo_Guidelines.html" rel="nofollow">NASA image use policy.</a></b> <b><a href="http://www.nasa.gov/centers/goddard/home/index.html" rel="nofollow">NASA Goddard Space Flight Center</a></b> enables NASA’s mission through four scientific endeavors: Earth Science, Heliophysics, Solar System Exploration, and Astrophysics. Goddard plays a leading role in NASA’s accomplishments by contributing compelling scientific knowledge to advance the Agency’s mission. <b>Follow us on <a href="http://twitter.com/NASA_GoddardPix" rel="nofollow">Twitter</a></b> <b>Like us on <a href="http://www.facebook.com/pages/Greenbelt-MD/NASA-Goddard/395013845897?ref=tsd" rel="nofollow">Facebook</a></b> <b>Find us on <a href="http://instagrid.me/nasagoddard/?vm=grid" rel="nofollow">Instagram</a></b>
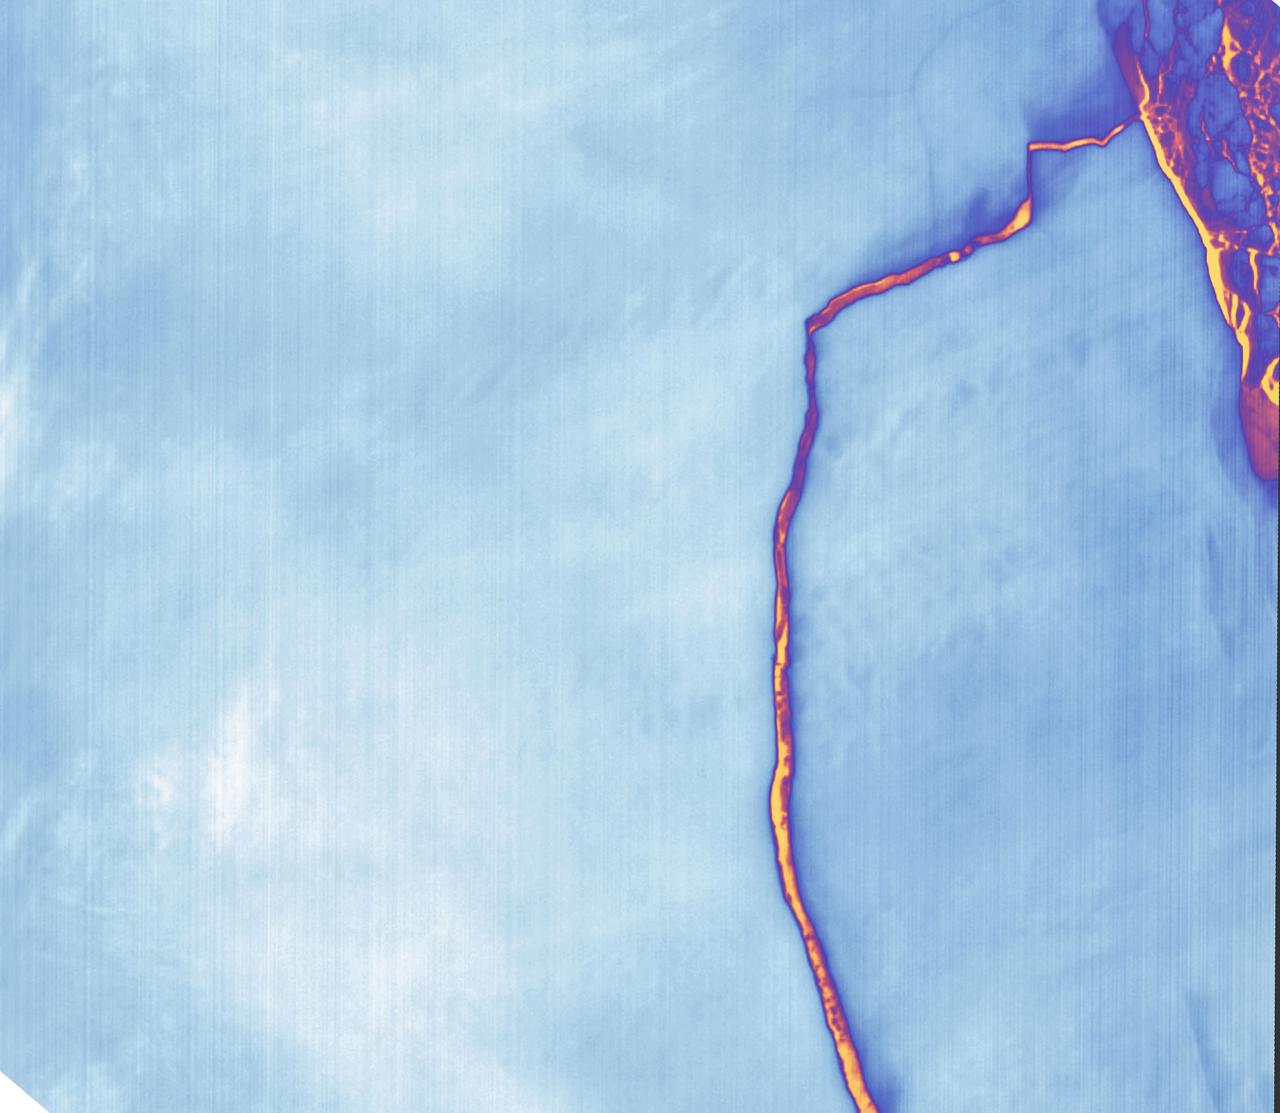
Sometime between July 10 and July 12, an iceberg about the size of Delaware split off from Antarctica’s Larsen C ice shelf. Now that nearly 5,800 square kilometers (2,200 square miles) of ice has broken away, the Larsen C shelf area has shrunk by approximately 10 percent. This false-color image was captured by Landsat’s Thermal Infrared Sensor (TIRS). It shows the relative warmth or coolness of the landscape. Orange indicates where the surface is the warmest, most notably the mélange between the new berg and the ice shelf. Light blues and whites are the coldest areas, including the ice shelf and the iceberg. On July 13, the U.S. National Ice Center issued a press release confirming the new iceberg and officially naming it A-68. Credit: NASA Earth Observatory images by Joshua Stevens, using Landsat data from the U.S. Geological Survey <b><a href="http://www.nasa.gov/audience/formedia/features/MP_Photo_Guidelines.html" rel="nofollow">NASA image use policy.</a></b> <b><a href="http://www.nasa.gov/centers/goddard/home/index.html" rel="nofollow">NASA Goddard Space Flight Center</a></b> enables NASA’s mission through four scientific endeavors: Earth Science, Heliophysics, Solar System Exploration, and Astrophysics. Goddard plays a leading role in NASA’s accomplishments by contributing compelling scientific knowledge to advance the Agency’s mission. <b>Follow us on <a href="http://twitter.com/NASAGoddardPix" rel="nofollow">Twitter</a></b> <b>Like us on <a href="http://www.facebook.com/pages/Greenbelt-MD/NASA-Goddard/395013845897?ref=tsd" rel="nofollow">Facebook</a></b> <b>Find us on <a href="http://instagrid.me/nasagoddard/?vm=grid" rel="nofollow">Instagram</a></b>
As Antarctica remains shrouded in darkness during the Southern Hemisphere winter, the Thermal Infrared Sensor (TIRS) on Landsat 8 captured a new snap of the 2,240-square-mile iceberg that split off from the Antarctic Peninsula’s Larsen C ice shelf on July 10-12. The satellite imagery is a composite of Landsat 8 as it past on July 14 and July 21 and shows that the main berg, A-68, has already lost several smaller pieces. The A-68 iceberg is being carried by currents northward out of its embayment on the Larsen C ice shelf. The latest imagery also details a group of three small, not yet released icebergs at the north end of the embayment. Credits: NASA Goddard/UMBC JCET, Christopher A. Shuman <b><a href="http://www.nasa.gov/audience/formedia/features/MP_Photo_Guidelines.html" rel="nofollow">NASA image use policy.</a></b> <b><a href="http://www.nasa.gov/centers/goddard/home/index.html" rel="nofollow">NASA Goddard Space Flight Center</a></b> enables NASA’s mission through four scientific endeavors: Earth Science, Heliophysics, Solar System Exploration, and Astrophysics. Goddard plays a leading role in NASA’s accomplishments by contributing compelling scientific knowledge to advance the Agency’s mission. <b>Follow us on <a href="http://twitter.com/NASAGoddardPix" rel="nofollow">Twitter</a></b> <b>Like us on <a href="http://www.facebook.com/pages/Greenbelt-MD/NASA-Goddard/395013845897?ref=tsd" rel="nofollow">Facebook</a></b> <b>Find us on <a href="http://instagrid.me/nasagoddard/?vm=grid" rel="nofollow">Instagram</a></b>
An iceberg embedded in sea ice as seen from the IceBridge DC-8 over the Bellingshausen Sea on Oct. 19, 2012. Credit: NASA / James Yungel NASA's Operation IceBridge is an airborne science mission to study Earth's polar ice. For more information about IceBridge, visit: <a href="http://www.nasa.gov/icebridge" rel="nofollow">www.nasa.gov/icebridge</a> <b><a href="http://www.nasa.gov/audience/formedia/features/MP_Photo_Guidelines.html" rel="nofollow">NASA image use policy.</a></b> <b><a href="http://www.nasa.gov/centers/goddard/home/index.html" rel="nofollow">NASA Goddard Space Flight Center</a></b> enables NASA’s mission through four scientific endeavors: Earth Science, Heliophysics, Solar System Exploration, and Astrophysics. Goddard plays a leading role in NASA’s accomplishments by contributing compelling scientific knowledge to advance the Agency’s mission. <b>Follow us on <a href="http://twitter.com/NASA_GoddardPix" rel="nofollow">Twitter</a></b> <b>Like us on <a href="http://www.facebook.com/pages/Greenbelt-MD/NASA-Goddard/395013845897?ref=tsd" rel="nofollow">Facebook</a></b> <b>Find us on <a href="http://instagrid.me/nasagoddard/?vm=grid" rel="nofollow">Instagram</a></b>
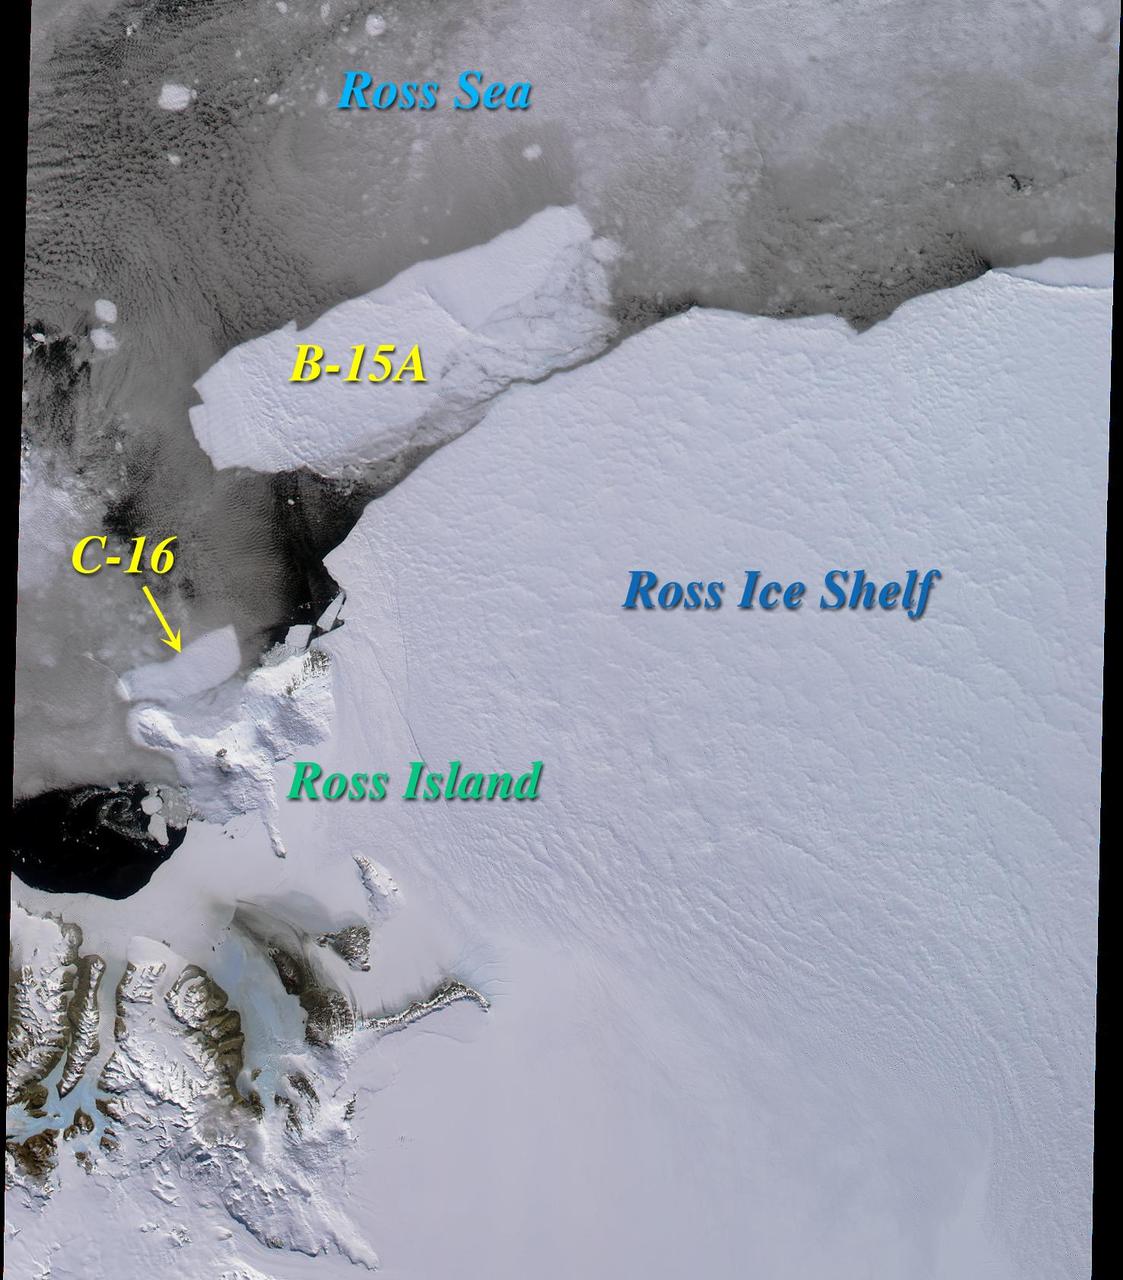
Two large icebergs, designated B-15A and C-16, captured by NASA Terra satellite, are of the Ross Ice Shelf and Ross Sea in Antarctica, acquired on December 10, 2000 during Terra orbit 5220, show

For five years, Jeremy Harbeck has worked as a support scientist for NASA’s Operation IceBridge, an airborne mission to study polar ice. The data processing that he does typically takes place in an office at NASA’s Goddard Space Flight Center in Maryland. However, to speed the process of delivering data to the Arctic sea ice forecasting community, Harbeck traveled to Greenland for the first time in spring 2015. He had just arrived at Greenland’s Thule Air Base on March 20 when a mechanical issue grounded the aircraft. No science flight could happen for a few days. As teams in the United States and Greenland scrambled to locate and deliver a replacement part, researchers on the ground waited. Some of them hiked to what was locally known as “the iceberg.” The unnamed berg pictured above has been frozen in place by sea ice in North Star Bay. Harbeck shot the photograph—a composite of four 49-second images—on March 21 at about 2:30 a.m. local time. The sun never fully sets at this time of year in the Arctic, so sunlight appears on the left side of the image. Lights from Thule are visible on the right side. Look for the Milky Way (top left) and a few very faint meteors visible in the early morning sky. Harbeck left the dock at Thule with sea ice scientist (and current IceBridge project scientist) Nathan Kurtz and a local recreation officer at about 10 p.m. From there, the group hiked 2.4 kilometers (1.5 miles) across the still-thick sea ice in weather that Harbeck called a “pleasant” minus 18 degrees Celsius (0 degrees Fahrenheit). They paused frequently on the way, and they even circled the berg to check for polar bears. “You don’t have a sense of scale of this berg until you get up to it,” Harbeck said. “It’s about the size of my apartment building, and that’s only the part protruding from the water.” Assuming the berg is ungrounded (which is uncertain), about one-tenth of its mass is above water. Photograph by Jeremy Harbeck, support scientist for NASA's Operation IceBridge mission. Caption by Kathryn Hansen. Credit: <b><a href="http://www.earthobservatory.nasa.gov/" rel="nofollow"> NASA Earth Observatory</a></b> <b><a href="http://www.nasa.gov/audience/formedia/features/MP_Photo_Guidelines.html" rel="nofollow">NASA image use policy.</a></b> <b><a href="http://www.nasa.gov/centers/goddard/home/index.html" rel="nofollow">NASA Goddard Space Flight Center</a></b> enables NASA’s mission through four scientific endeavors: Earth Science, Heliophysics, Solar System Exploration, and Astrophysics. Goddard plays a leading role in NASA’s accomplishments by contributing compelling scientific knowledge to advance the Agency’s mission. <b>Follow us on <a href="http://twitter.com/NASAGoddardPix" rel="nofollow">Twitter</a></b> <b>Like us on <a href="http://www.facebook.com/pages/Greenbelt-MD/NASA-Goddard/395013845897?ref=tsd" rel="nofollow">Facebook</a></b> <b>Find us on <a href="http://instagrid.me/nasagoddard/?vm=grid" rel="nofollow">Instagram</a></b>

jsc2019e053370 (9/17/2019) --- A CAD rendering of the Iceberg freezer as designed by the University of Alabama Birmingham. Iceberg is a Double Locker equivalent designed for EXPRESS Rack operation and provides additional cold stowage resources aboard the International Space Station (ISS). The units provide an operating range of +4°C to -95°C.

An iceberg trapped in sea ice in the Amundsen Sea, seen from the IceBridge DC-8 during the Getz 07 mission on Oct. 27. Credit: NASA / Maria-Jose Vinas NASA's Operation IceBridge is an airborne science mission to study Earth's polar ice. For more information about IceBridge, visit: <a href="http://www.nasa.gov/icebridge" rel="nofollow">www.nasa.gov/icebridge</a> <b><a href="http://www.nasa.gov/audience/formedia/features/MP_Photo_Guidelines.html" rel="nofollow">NASA image use policy.</a></b> <b><a href="http://www.nasa.gov/centers/goddard/home/index.html" rel="nofollow">NASA Goddard Space Flight Center</a></b> enables NASA’s mission through four scientific endeavors: Earth Science, Heliophysics, Solar System Exploration, and Astrophysics. Goddard plays a leading role in NASA’s accomplishments by contributing compelling scientific knowledge to advance the Agency’s mission. <b>Follow us on <a href="http://twitter.com/NASA_GoddardPix" rel="nofollow">Twitter</a></b> <b>Like us on <a href="http://www.facebook.com/pages/Greenbelt-MD/NASA-Goddard/395013845897?ref=tsd" rel="nofollow">Facebook</a></b> <b>Find us on <a href="http://instagrid.me/nasagoddard/?vm=grid" rel="nofollow">Instagram</a></b>
NASA QuikScat satellite instrument kept an eye on an iceberg the size of Rhode Island, the first time this space technology had been used to track a potential threat to international shipping.

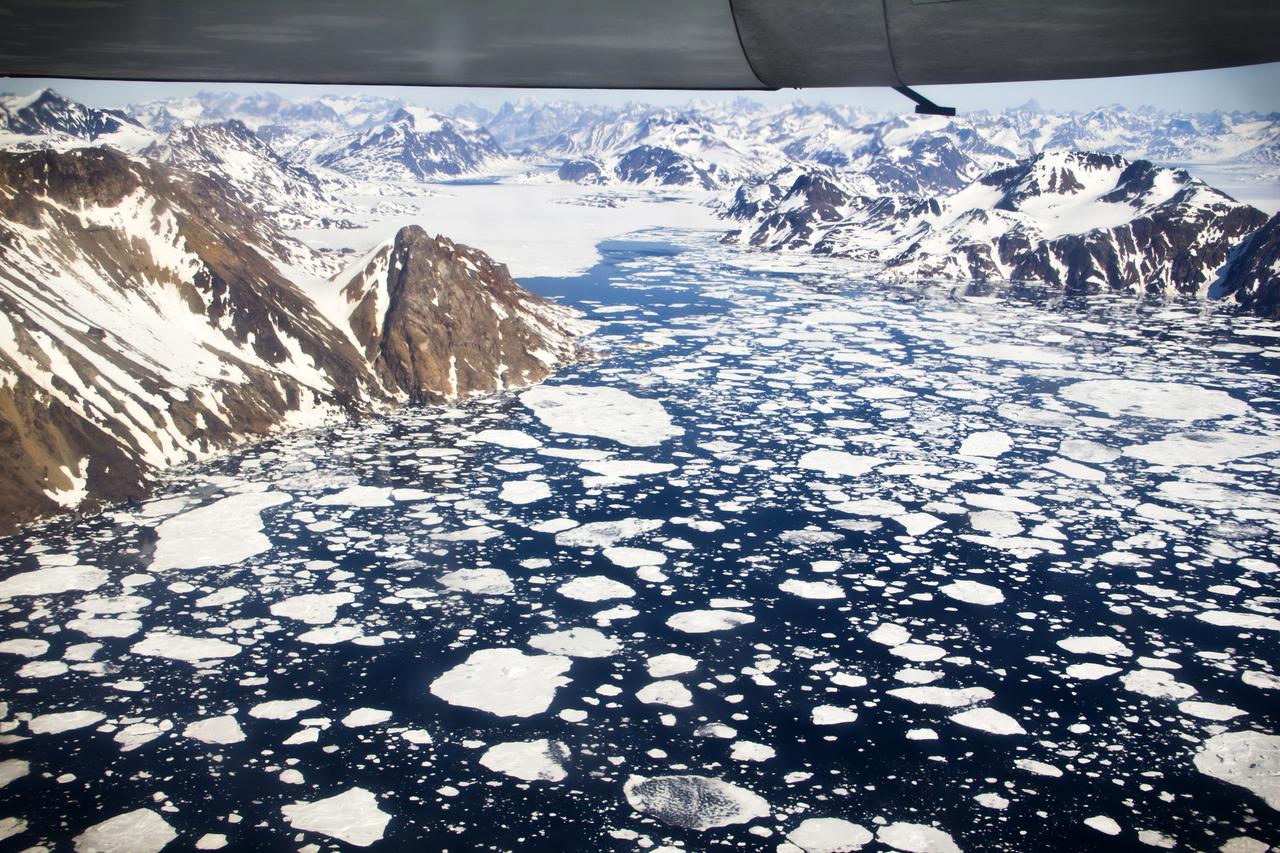
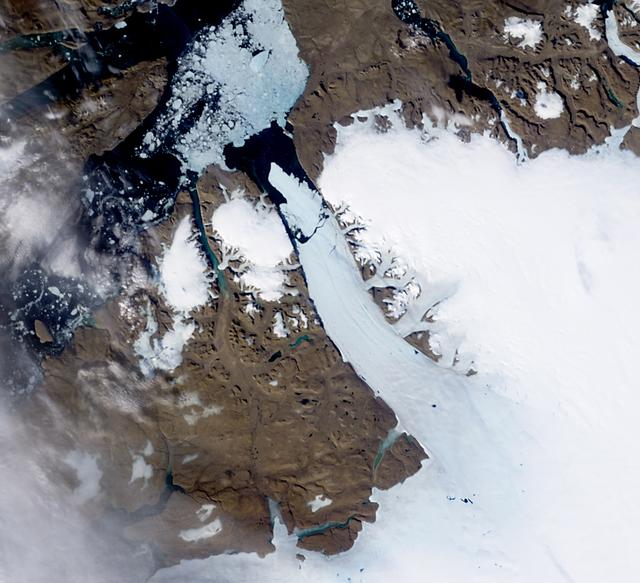
Acquired by NASA Terra spacecraft, this image shows the west coast of Greenland, one of Earth premiere incubators for icebergs -- large blocks of land ice that break off from glaciers or ice shelves and float in the ocean.
GPM "Let it Snow" Photo Contest Winners The Global Precipitation Measurement mission is happy to announce the top ten winners of the "Let It Snow" photo competition. Thank you to everyone who submitted their best pictures of winter. From January 7th through February 4th 2013, over 1,000 photos were submitted via Flickr and Instagram (see the Flickr submissions here: <a href="http://bit.ly/VVEubh" rel="nofollow">bit.ly/VVEubh</a>). We loved all of your entries and thoroughly appreciate your participation. About this image: Kulusuk Icebergs, by Andrew Bossi Location: On approach to the airstrip at Kulusuk, Greenland, located on the east coast. The flight departed out of Reykjavík, Iceland. How this Photo Was Taken: "My write-up of the day covers things in decent detail. Basically my vacation was focused on Scandinavia and hadn't even considered Greenland, but while traveling around Iceland I'd become aware that day trips were offered and I leapt at the opportunity. This approach was my first sight of Greenland. While I've seen plenty of glaciers and mountains, I'd never seen anything like this - it started with endless fields of ice amid the deep blue sea, and some minutes later a wall of frozen rock rose up from the horizon. I'd never seen anything so beautiful. I think my camera's shutter was snapping almost endlessly right up until we landed. The landing itself was an experience, as our tiny plane descended between the mountains -- rockfaces just outside each window -- and set down on a gravel runway." About Photographer Steven Sandner: More info about this photo: <a href="http://intentionallylost.blogspot.com/2011/06/gl-kulusuk.htm" rel="nofollow">intentionallylost.blogspot.com/2011/06/gl-kulusuk.htm</a> <a href="http://www.flickr.com/photos/thisisbossi/">www.flickr.com/photos/thisisbossi/</a> <a href="http://twitter.com/thisisbossi" rel="nofollow">twitter.com/thisisbossi</a> <b><a href="http://www.nasa.gov/audience/formedia/features/MP_Photo_Guidelines.html" rel="nofollow">NASA image use policy.</a></b> <b><a href="http://www.nasa.gov/centers/goddard/home/index.html" rel="nofollow">NASA Goddard Space Flight Center</a></b> enables NASA’s mission through four scientific endeavors: Earth Science, Heliophysics, Solar System Exploration, and Astrophysics. Goddard plays a leading role in NASA’s accomplishments by contributing compelling scientific knowledge to advance the Agency’s mission. <b>Follow us on <a href="http://twitter.com/NASA_GoddardPix" rel="nofollow">Twitter</a></b> <b>Like us on <a href="http://www.facebook.com/pages/Greenbelt-MD/NASA-Goddard/395013845897?ref=tsd" rel="nofollow">Facebook</a></b> <b>Find us on <a href="http://instagram.com/nasagoddard?vm=grid" rel="nofollow">Instagram</a></b>
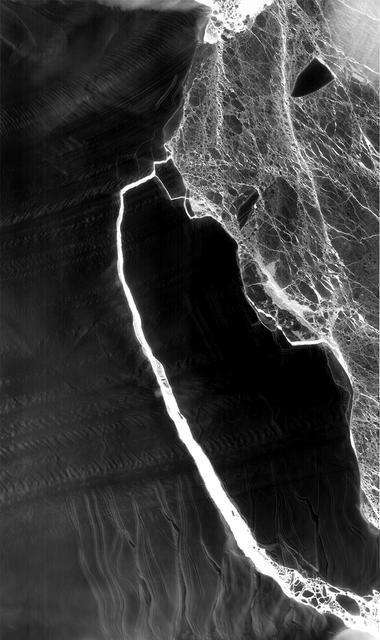
Between July 10 and 12, 2017, the Larsen C Ice Shelf in West Antarctica calved one of the largest icebergs in history (named "A-68"), weighing approximately one trillion tons. The rift in the ice shelf that spawned the iceberg has been present on the shelf since at least the beginning of the Landsat era (approximately the 1970s), but remained relatively dormant until around 2012, when it was observed actively moving through a suture zone in the ice shelf (Jansen et al., 2015). Suture zones are wide bands of ice that extend from glacier grounding lines (the boundary between a floating ice shelf and ice resting on bedrock) to the sea comprised of a frozen mixture of glacial ice and sea water, traditionally considered to be stabilizing features in ice shelves. When the Antarctic entered its annual dark period in late April, scientists knew the rift only had a few more miles to go before it completely calved the large iceberg. However, due to the lack of sunlight during the Antarctic winter, visible imagery is generally not available each year between May and August. This frame is from an animation that shows the ice shelf as imaged by the NASA/NOAA satellite Suomi NPP, which features the VIIRS (Visible Infrared Imaging Radiometer Suite) instrument. VIIRS has a day/night panchromatic band capable of collecting nighttime imagery of Earth with a spatial resolution of 2,460 feet (750 meters). An image from the Moderate Resolution Imaging Spectroradiometer (MODIS) instrument on NASA's Terra satellite shows the last cloud-free, daytime image of the ice shelf on April 6; the MODIS thermal imagery band is shown on April 29. The images from May 9 to July 14 show available cloud-free imagery from Suomi NPP. Luckily, despite several cloudy days leading up to the break, the weather mostly cleared on July 11, allowing scientists to see the newly formed iceberg on July 12. The animation is available at https://photojournal.jpl.nasa.gov/catalog/PIA21785
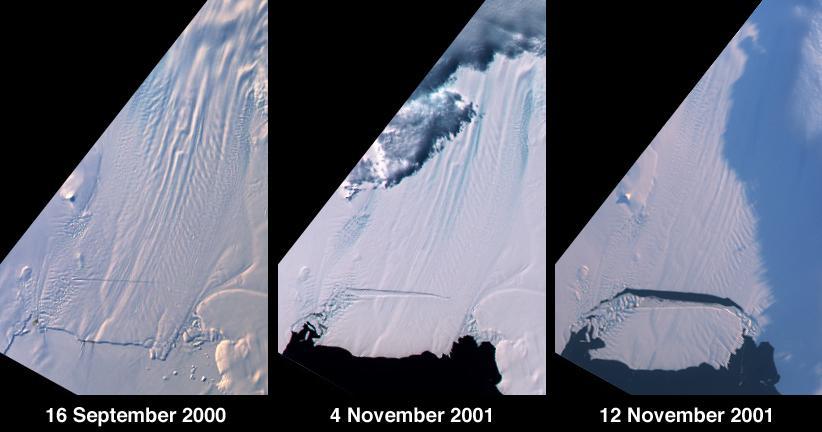
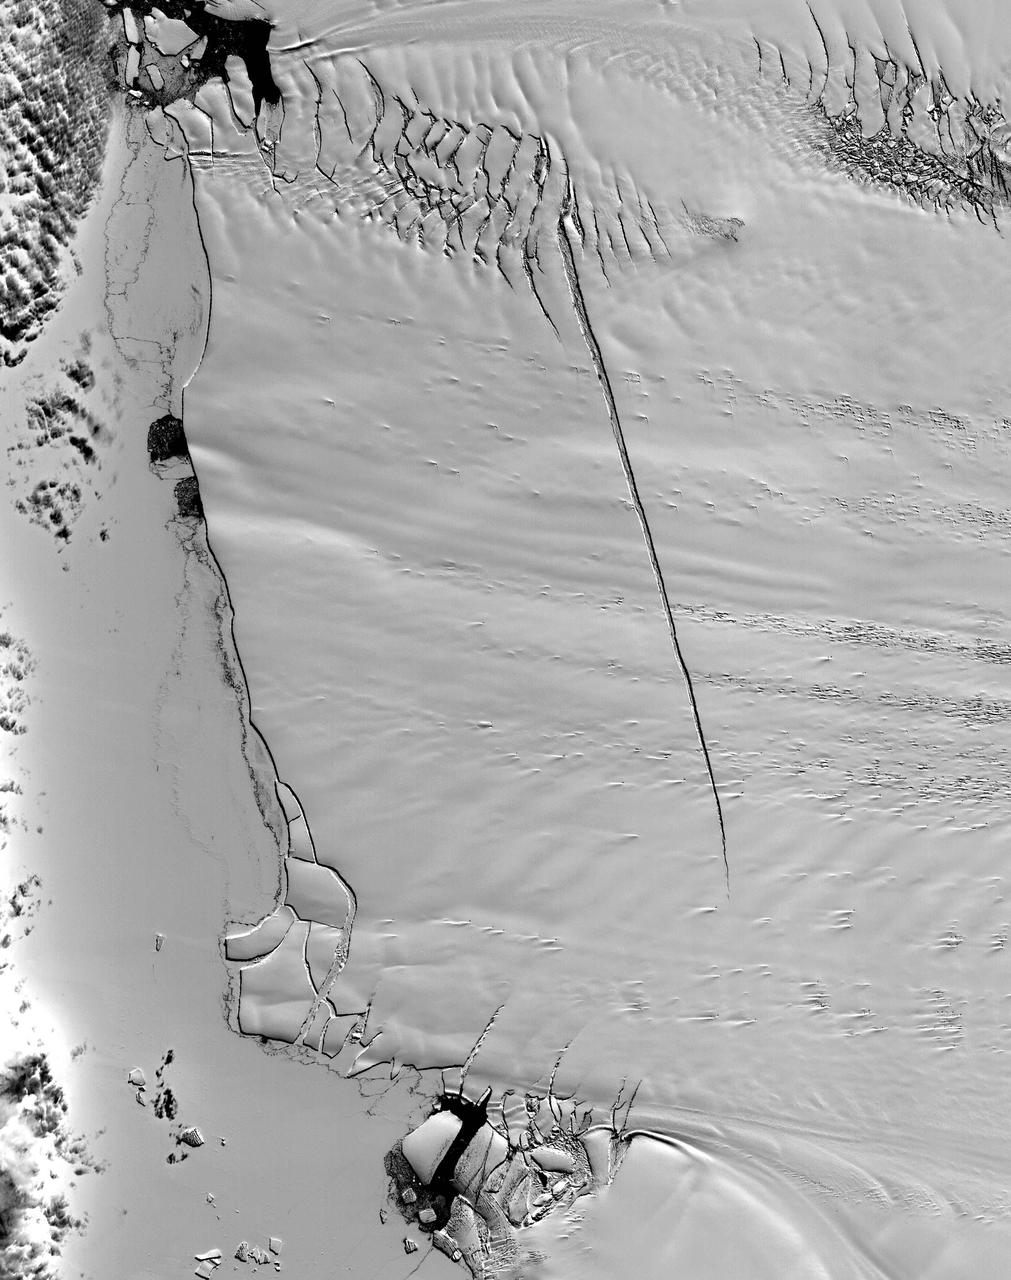
A large tabular iceberg (42 kilometers x 17 kilometers) broke off Pine Island Glacier, West Antarctica (75ºS latitude, 102ºW longitude) sometime between November 4 and 12, 2001. Images of the glacier were acquired by the Multi-angle Imaging SpectroRadiometer (MISR) instrument aboard NASA's Terra spacecraft. This event was preceded by the formation of a large crack across the glacier in mid 2000. Data gathered by other imaging instruments revealed the crack to be propagating through the shelf ice at a rate averaging 15 meters per day, accompanied by a slight rotation of about one percent per year at the seaward margin of the rift. The image set shows three views of Pine Island Glacier acquired by MISR's vertical-viewing (nadir) camera. The first was captured in late 2000, early in the development of the crack. The second and third views were acquired in November 2001, just before and just after the new iceberg broke off. The existence of the crack took the glaciological community by surprise, and the rapid rate at which the crack propagated was also not anticipated. Glaciologists predicted that the rift would reach the other side of the glacier sometime in 2002. However, the iceberg detached much sooner than anticipated, and the last 10-kilometer segment that was still attached to the ice shelf snapped off in a matter of days. http://photojournal.jpl.nasa.gov/catalog/PIA03431
An iceberg is seen out the window of NASA's DC-8 research aircraft as it flies 2,000 feet above the Amundsen Sea in West Antarctica on Wednesday, Oct., 21, 2009. This was the fourth science flight of NASA’s Operation Ice Bridge airborne Earth science mission to study Antarctic ice sheets, sea ice, and ice shelves. Photo Credit: (NASA/Jane Peterson)
NASA Terra satellite passed over the Pine Island Glacier in Antarctica around Oct. 27, 2013, just days before iceberg B-31 broke completely free. B-31 is finally moving away from the coast, with open water between the iceberg and the glacier.
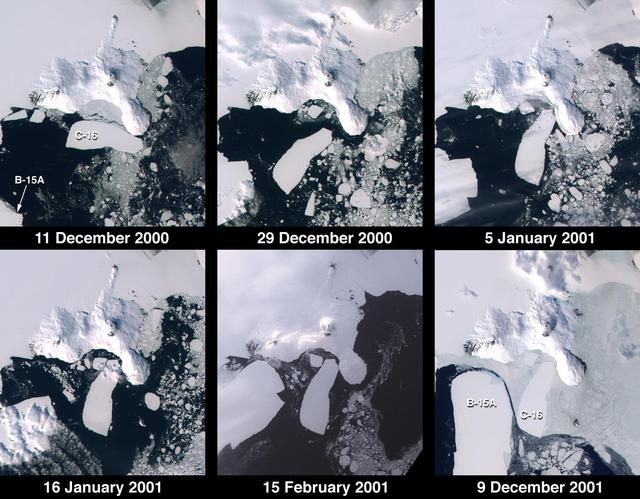
These images from NASA Terra satellite documented iceberg movements and changes in sea ice between December 11, 2000 and December 9, 2001.
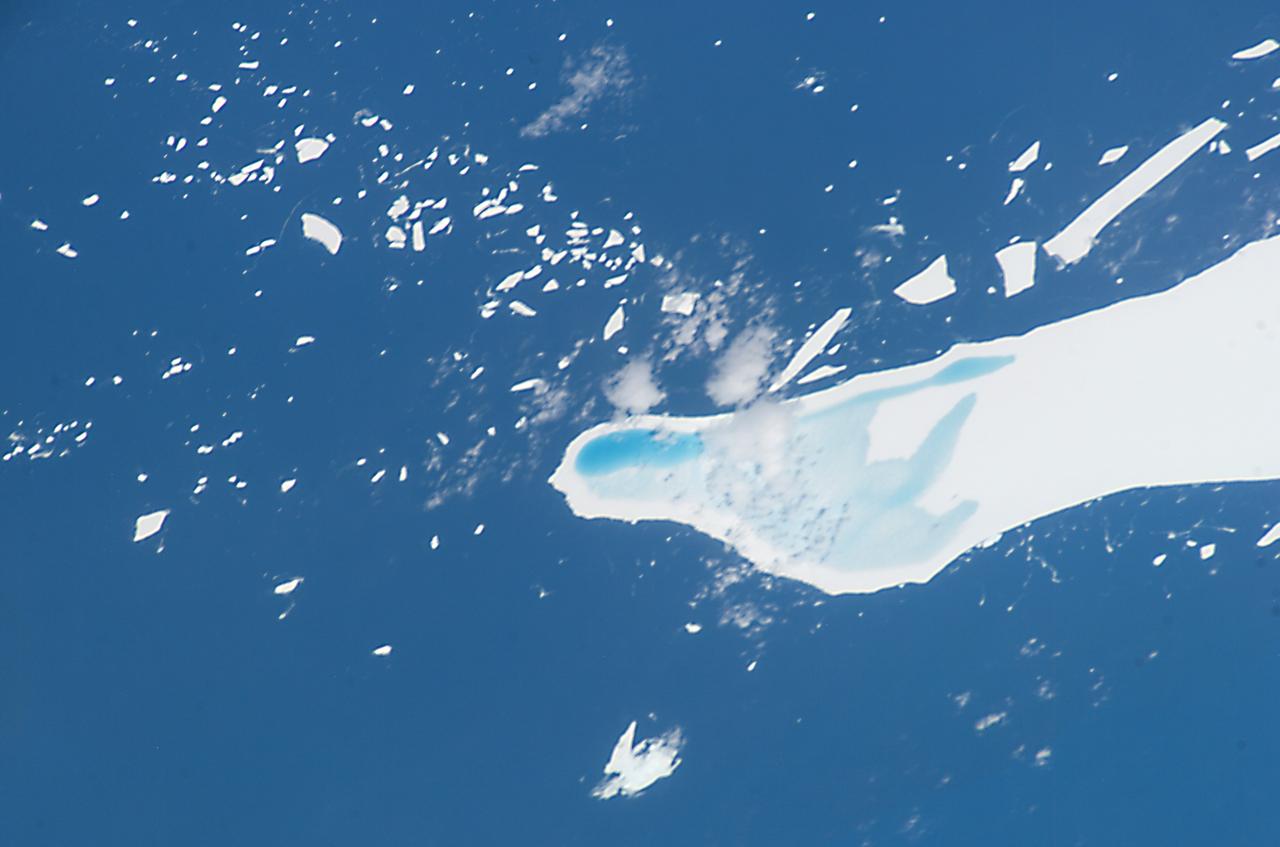
ISS008-E-12555 (22 January 2004) --- This photo of melt-water pooled on the surface of iceberg A-39D, a 2 x 11 kilometers iceberg currently located near South Georgia Island, was taken by an Expedition 8 crewmember on the International Space Station (ISS). The different intensities of blue are interpreted as different water depths. From the orientation of the iceberg, the deepest water (darkest blue) lies at the westernmost end of the iceberg. The water pools have formed from snowmelt – late January is the peak of the southern summer. This iceberg was part of the original A-38 iceberg that calved from the Ronne Ice Shelf in October 1998. Originally the ice was between 200 and 350 meters thick. This piece of that iceberg is now probably about 150 meters thick, with around 15 meters sticking up above the surface of the water.
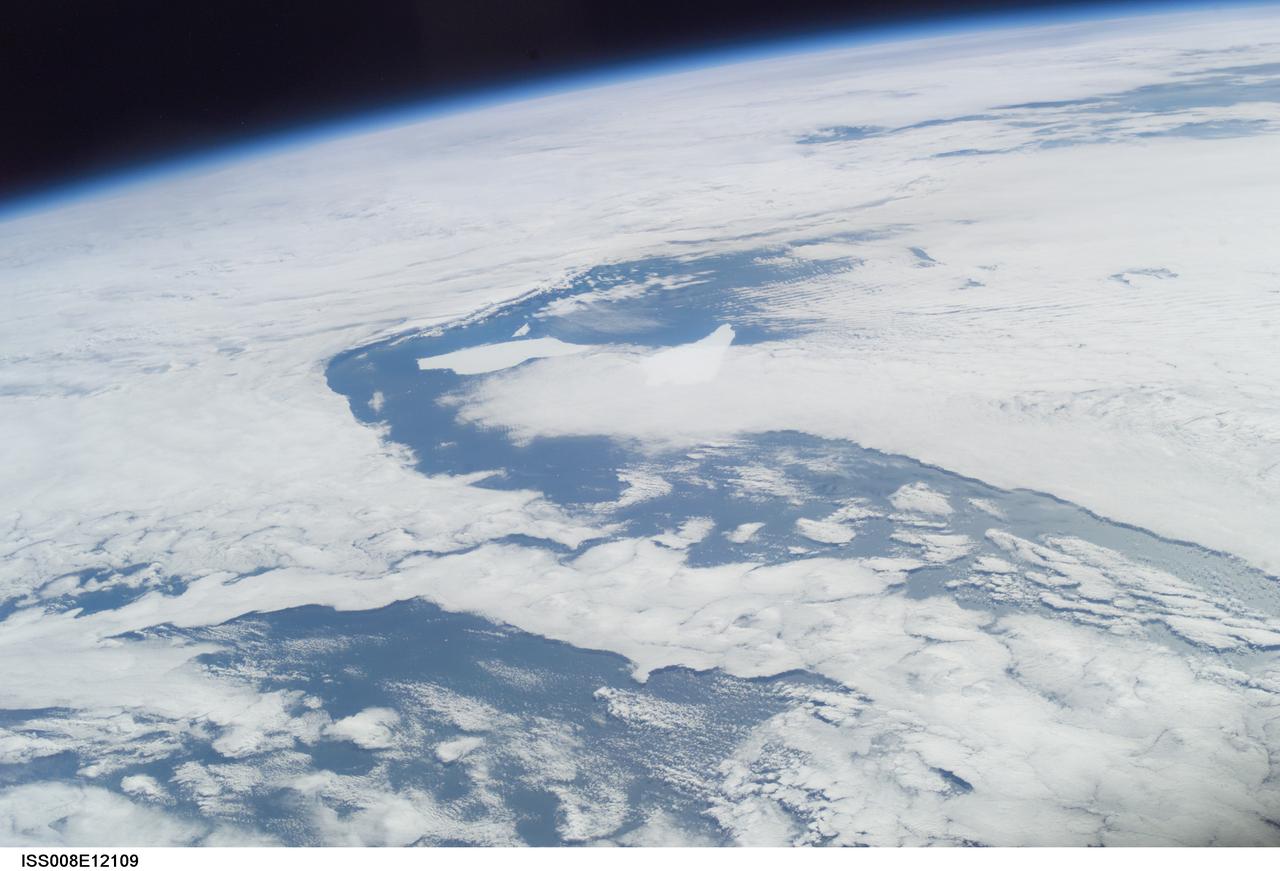
ISS008-E-12109 (6 January 2004) --- Five year old icebergs near South Georgia Island are featured in this image photographed by an Expedition 8 crewmember onboard the International Space Station (ISS). This oblique image shows two pieces of a massive iceberg that broke off from the Antarctica Ronne Ice Shelf in October 1998. The pieces of iceberg A-38 have floated relatively close to South Georgia Island. After five years and 3 months, they are approximately 1500 nautical miles from their origin. The cloud pattern is indicative of the impact of the mountainous islands on the local wind field. At the time this image was taken, the icebergs were sheltered in the lee side of the island.
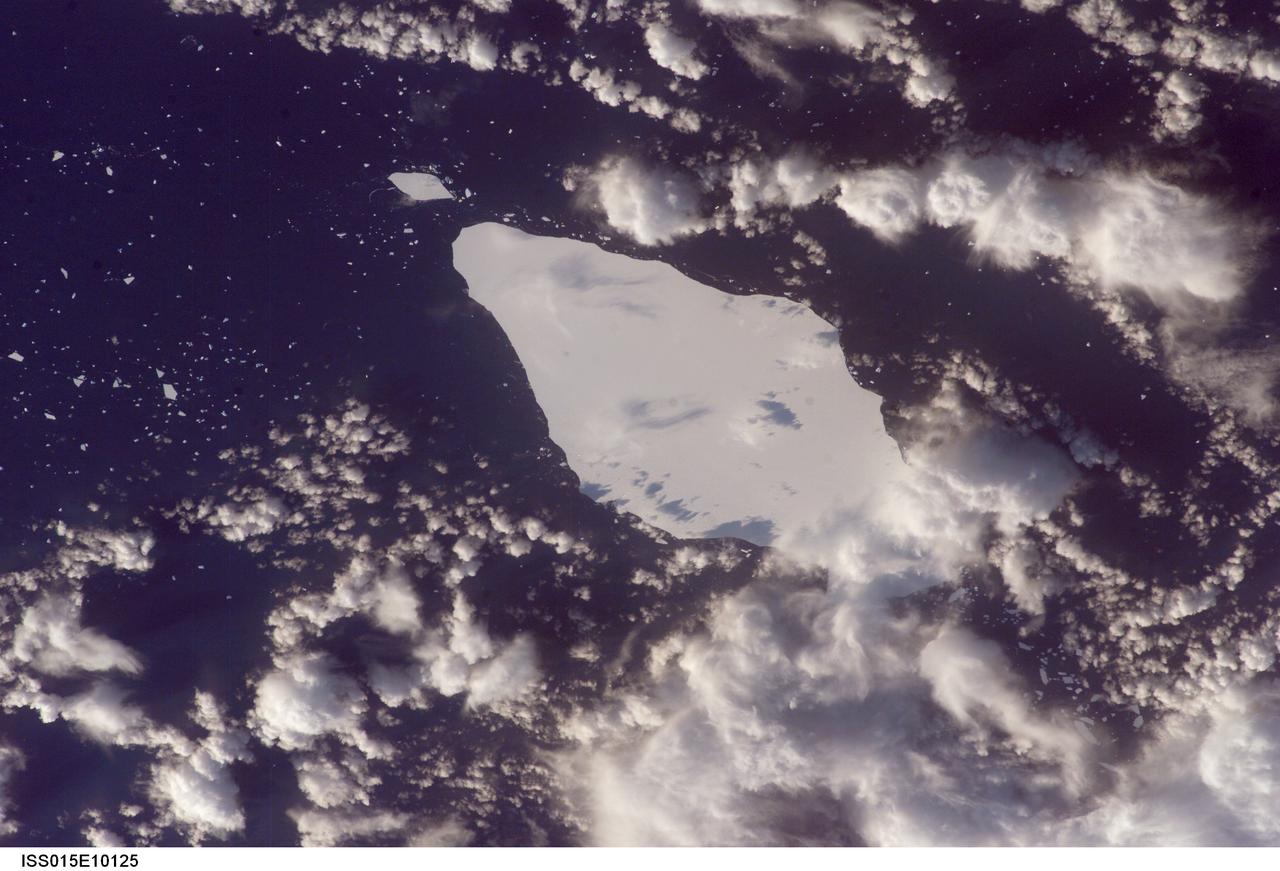
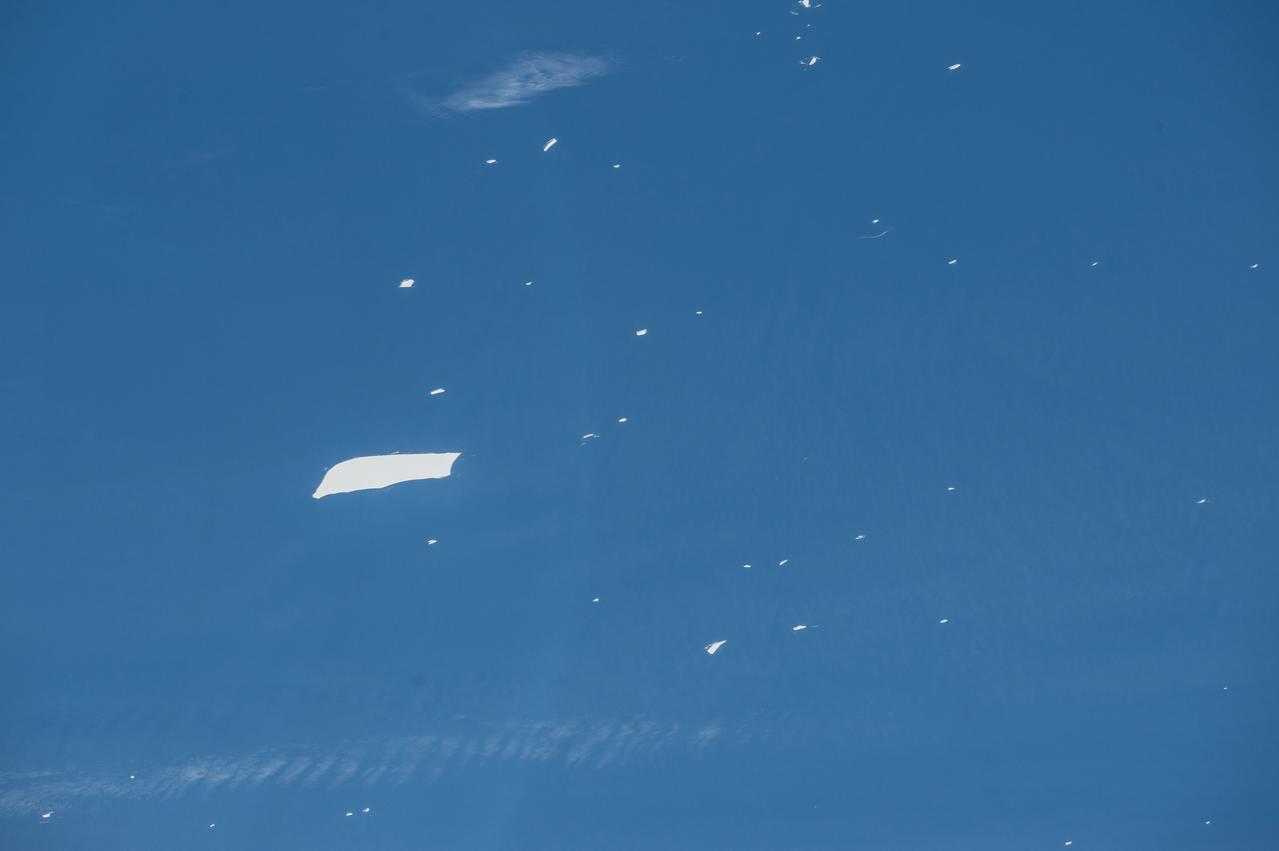
ISS015-E-10125 (30 May 2007) --- An iceberg in the South Atlantic Ocean is featured in this image photographed by an Expedition 15 crewmember on the International Space Station. This iceberg illustrates the remains of a giant iceberg -- designated A22A that broke off Antarctica in 2002. This is one of the largest icebergs to drift as far north as 50 degrees south latitude, bringing it beneath the daylight path of the station. Crewmembers aboard the orbital complex were able to locate the ice mass and photograph it, despite great cloud masses of winter storms in the Southern Ocean. Dimensions of A22A in early June were 49.9 x 23.4 kilometers, giving it an area of 622 square kilometers, or seven times the area of Manhattan Island.
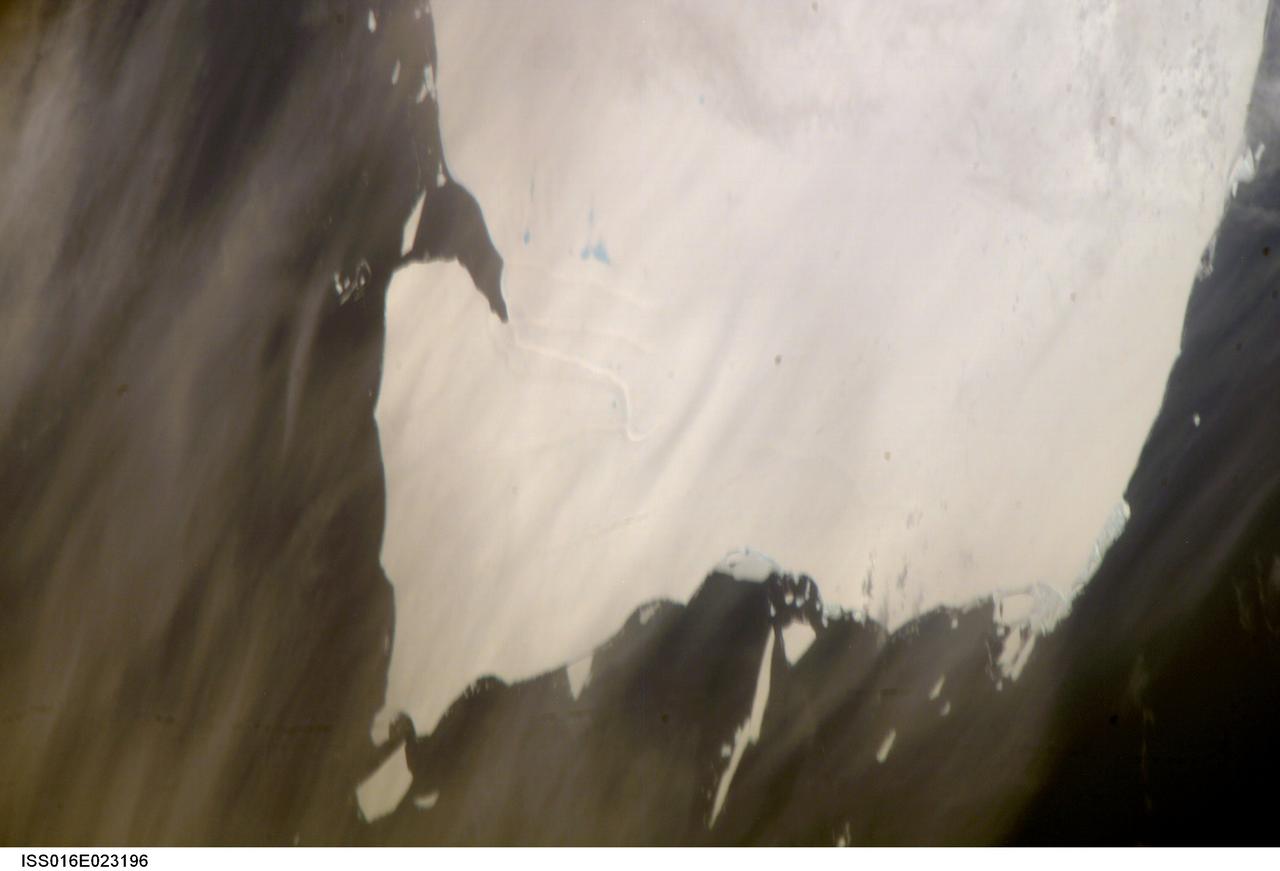
ISS016-E-023196 (15 Jan. 2008) --- A portion of Mega-iceberg A53a in the South Atlantic Ocean is featured in this image photographed by an Expedition 16 crewmember on the International Space Station. At the time this image was taken in mid-January 2008, the entire iceberg measured close to 50 kilometers x 22 kilometers, about seven times the area of Manhattan Island. Icebergs of the Southern Atlantic Ocean contain rock material from Antarctica, eroded by the moving ice and also as wind-borne dust from deserts in Africa, South America and Australia. According to NASA scientists, the finest powdery rock material acts as nutrient for sea organisms. As icebergs melt, the surrounding seawater is enriched. The area of enrichment is significantly enlarged when a mega-iceberg disintegrates into many small pieces.
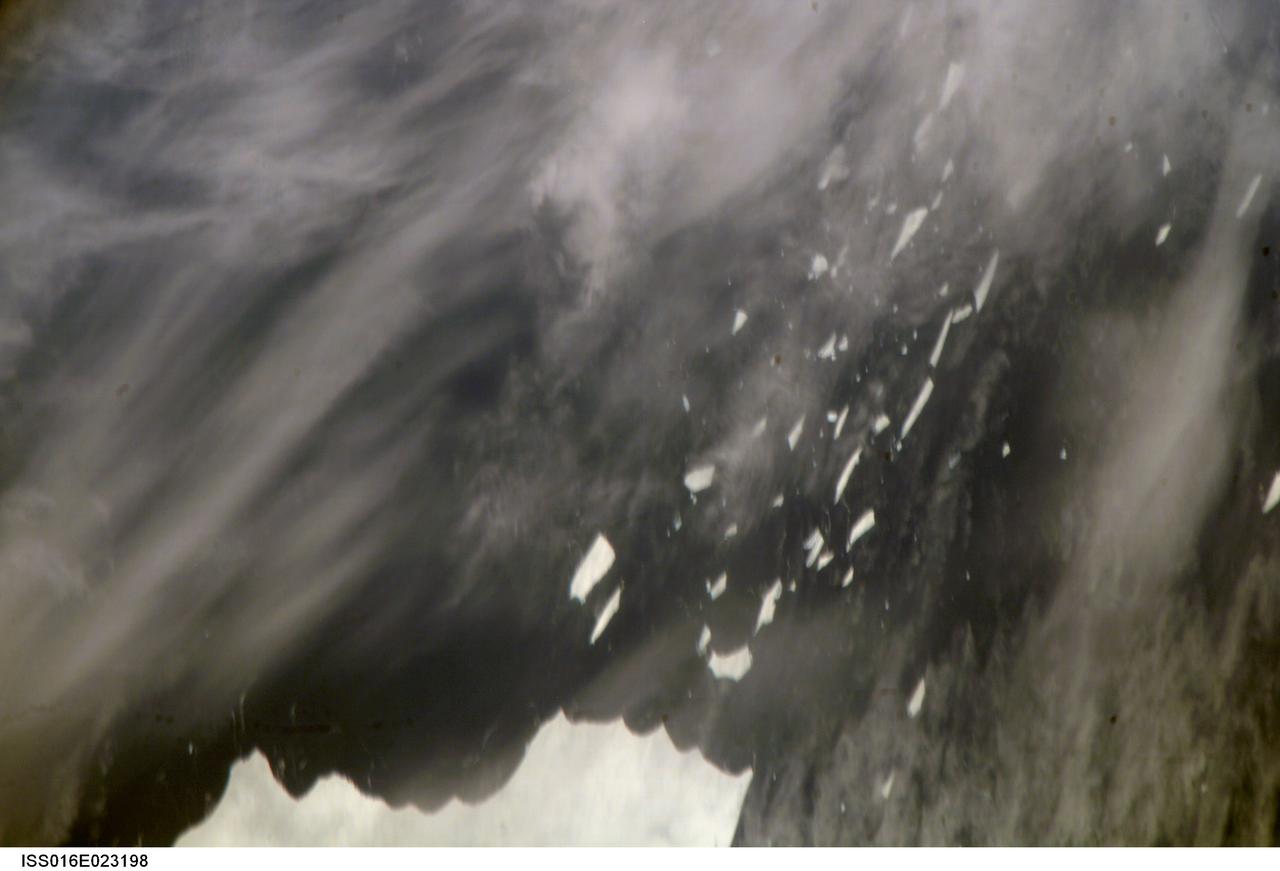
ISS016-E-023198 (15 Jan. 2008) --- A portion of Mega-iceberg A53a in the South Atlantic Ocean is featured in this image photographed by an Expedition 16 crewmember on the International Space Station. At the time this image was taken in mid-January 2008, the entire iceberg measured close to 50 kilometers x 22 kilometers, about seven times the area of Manhattan Island. Icebergs of the Southern Atlantic Ocean contain rock material from Antarctica, eroded by the moving ice and also as wind-borne dust from deserts in Africa, South America and Australia. According to NASA scientists, the finest powdery rock material acts as nutrient for sea organisms. As icebergs melt, the surrounding seawater is enriched. The area of enrichment is significantly enlarged when a mega-iceberg disintegrates into many small pieces.
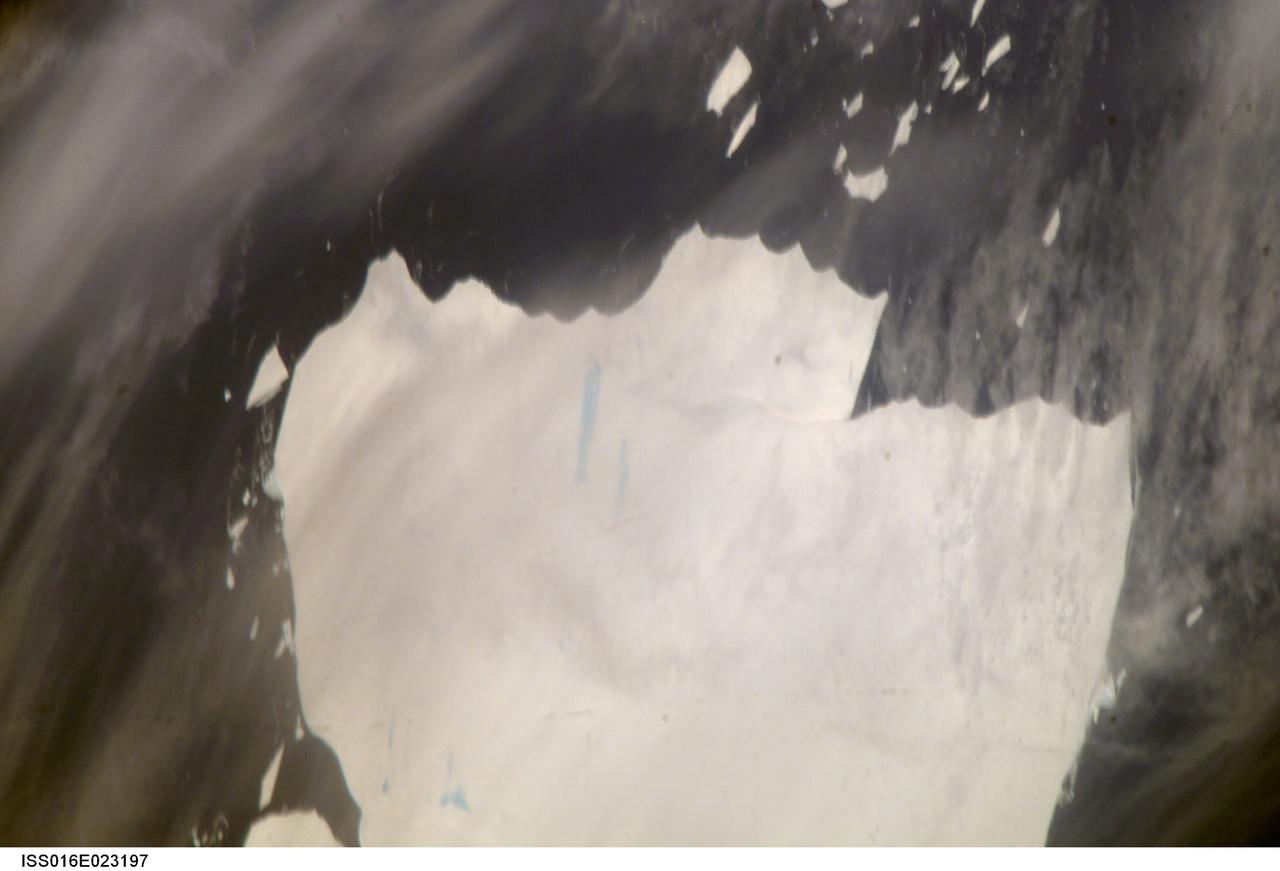
ISS016-E-023197 (15 Jan. 2008) --- A portion of Mega-iceberg A53a in the South Atlantic Ocean is featured in this image photographed by an Expedition 16 crewmember on the International Space Station. At the time this image was taken in mid-January 2008, the entire iceberg measured close to 50 kilometers x 22 kilometers, about seven times the area of Manhattan Island. Icebergs of the Southern Atlantic Ocean contain rock material from Antarctica, eroded by the moving ice and also as wind-borne dust from deserts in Africa, South America and Australia. According to NASA scientists, the finest powdery rock material acts as nutrient for sea organisms. As icebergs melt, the surrounding seawater is enriched. The area of enrichment is significantly enlarged when a mega-iceberg disintegrates into many small pieces.
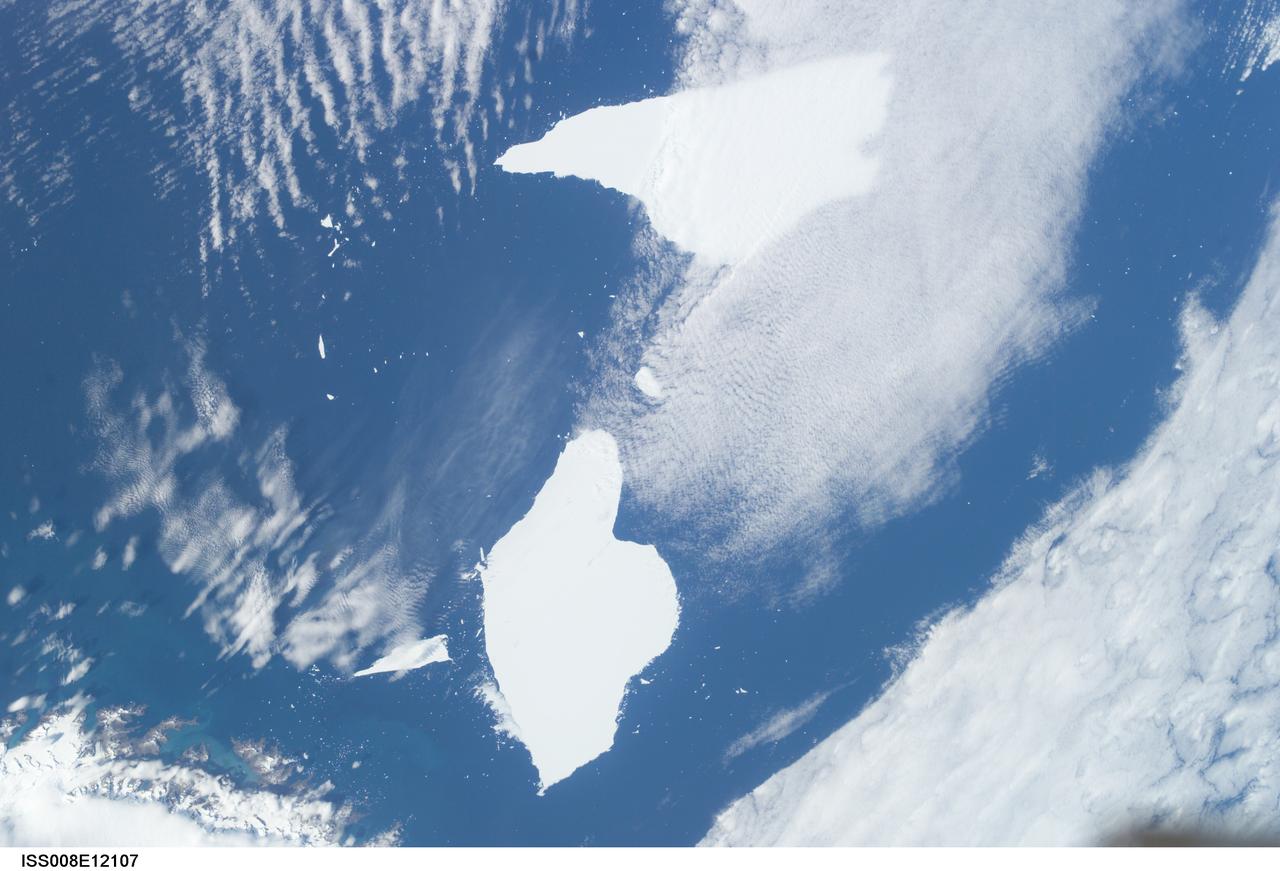
ISS008-E-12107 (6 January 2004) --- Five year old icebergs near South Georgia Island are featured in this image photographed by an Expedition 8 crewmember onboard the International Space Station (ISS). This photo shows two pieces of a massive iceberg that broke off from the Antarctica Ronne Ice Shelf in October 1998. The pieces of iceberg A-38 have floated relatively close to South Georgia Island. After five years and 3 months, they are approximately 1500 nautical miles from their origin.
This image of Petermann Glacier and the new iceberg was acquired from NASA Terra spacecraft on Aug. 12, 2010. On Aug. 5, 2010, an enormous chunk of ice broke off the Petermann Glacier along the northwestern coast of Greenland.
November 21, 2013 - NASA's Operation IceBridge P-3 landed a few minutes ago after a successful survey of sea ice in the Ross Sea. In this photo taken by project scientist Michael Studinger we see icebergs in Sulzberger Bay off of the eastern portion of the Ross Sea. NASA's Operation IceBridge is an airborne science mission to study Earth's polar ice. In 2013, IceBridge is conducting its first field campaign directly from Antarctica. For more information about IceBridge, visit: <a href="http://www.nasa.gov/icebridge" rel="nofollow">www.nasa.gov/icebridge</a> Credit: NASA/GSFC/Michael Studinger <b><a href="http://www.nasa.gov/audience/formedia/features/MP_Photo_Guidelines.html" rel="nofollow">NASA image use policy.</a></b> <b><a href="http://www.nasa.gov/centers/goddard/home/index.html" rel="nofollow">NASA Goddard Space Flight Center</a></b> enables NASA’s mission through four scientific endeavors: Earth Science, Heliophysics, Solar System Exploration, and Astrophysics. Goddard plays a leading role in NASA’s accomplishments by contributing compelling scientific knowledge to advance the Agency’s mission. <b>Follow us on <a href="http://twitter.com/NASA_GoddardPix" rel="nofollow">Twitter</a></b> <b>Like us on <a href="http://www.facebook.com/pages/Greenbelt-MD/NASA-Goddard/395013845897?ref=tsd" rel="nofollow">Facebook</a></b> <b>Find us on <a href="http://instagram.com/nasagoddard?vm=grid" rel="nofollow">Instagram</a></b>
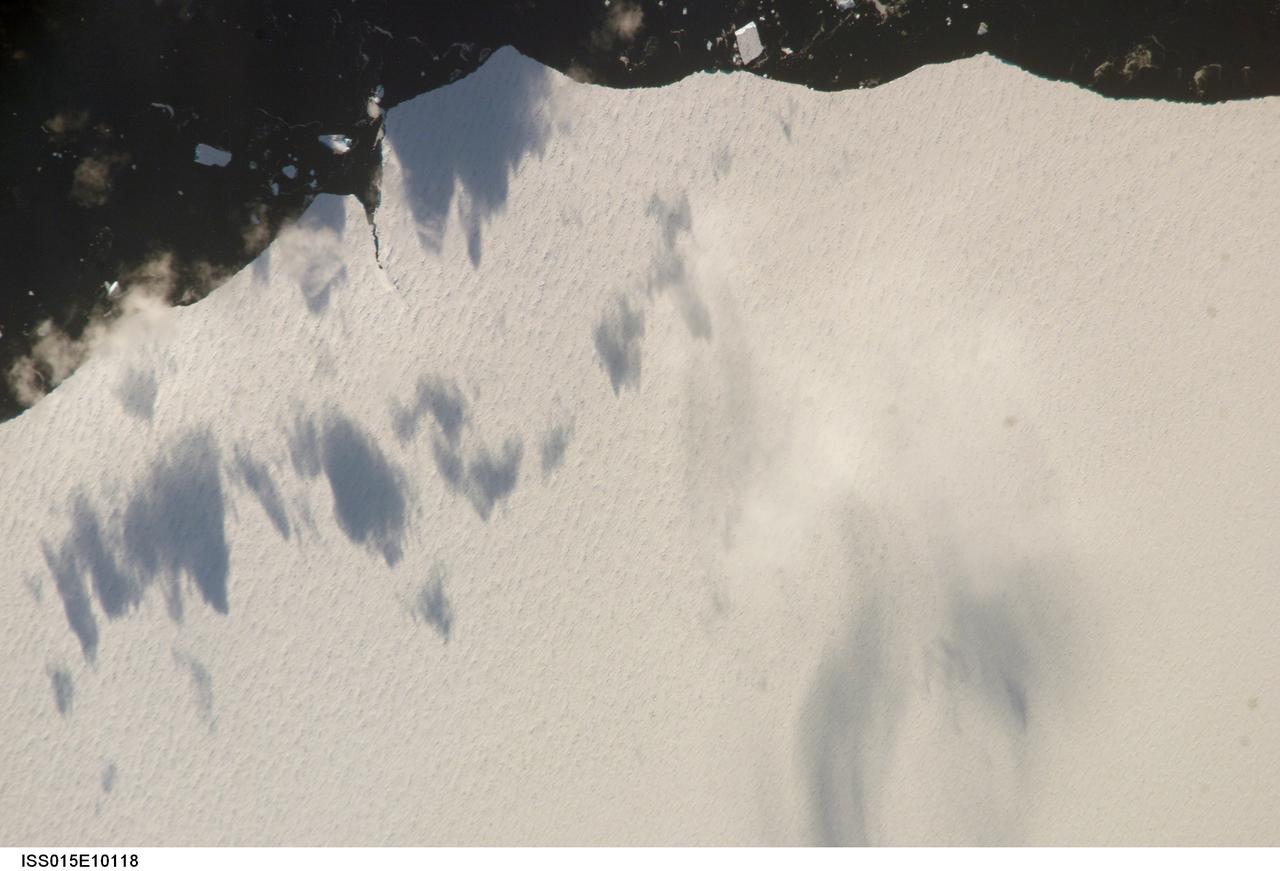
ISS015-E-10118 (30 May 2007) --- A close-up view of an area of an iceberg in the South Atlantic Ocean is featured in this image photographed by an Expedition 15 crewmember on the International Space Station. This iceberg illustrates the remains of a giant iceberg -- designated A22A that broke off Antarctica in 2002. This is one of the largest icebergs to drift as far north as 50 degrees south latitude, bringing it beneath the daylight path of the station. Crewmembers aboard the orbital complex were able to locate the ice mass and photograph it, despite great cloud masses of winter storms in the Southern Ocean. Dimensions of A22A in early June were 49.9 x 23.4 kilometers, giving it an area of 622 square kilometers, or seven times the area of Manhattan Island. Once the station crew had located the iceberg, they managed to image it successfully with the "long" 800-mm lens. Handling the longer lens requires practice: with the speed of movement of the spacecraft and the length of the lens, it is necessary to "track" the target, which is, swinging the camera slowly to keep the target in the middle of the view finder. If you track too slowly or too fast, the image looks smeared. As in this image, the long lens only shows a small part of the iceberg. A series of parallel lines, termed "hummocks", can be seen. These hummocks are probably dunes of snow that have become solidified, and date back to the time when the iceberg was connected to Antarctica. A developing fracture in the ice is also visible at upper left.
ISS047e22133 (03/27/2016) ---The crew of Expedition 47 aboard the International Space Station captured this image of a massive iceberg causing shipping to pay close attention. It is floating in the southern Atlantic Ocean, near the South Georgia and South Sandwich Islands. Smaller pieces cluster around the main iceberg. causing further shipping concern. The closest continent is the bottom tip of South America (Argentina) and the Falkland Islands.
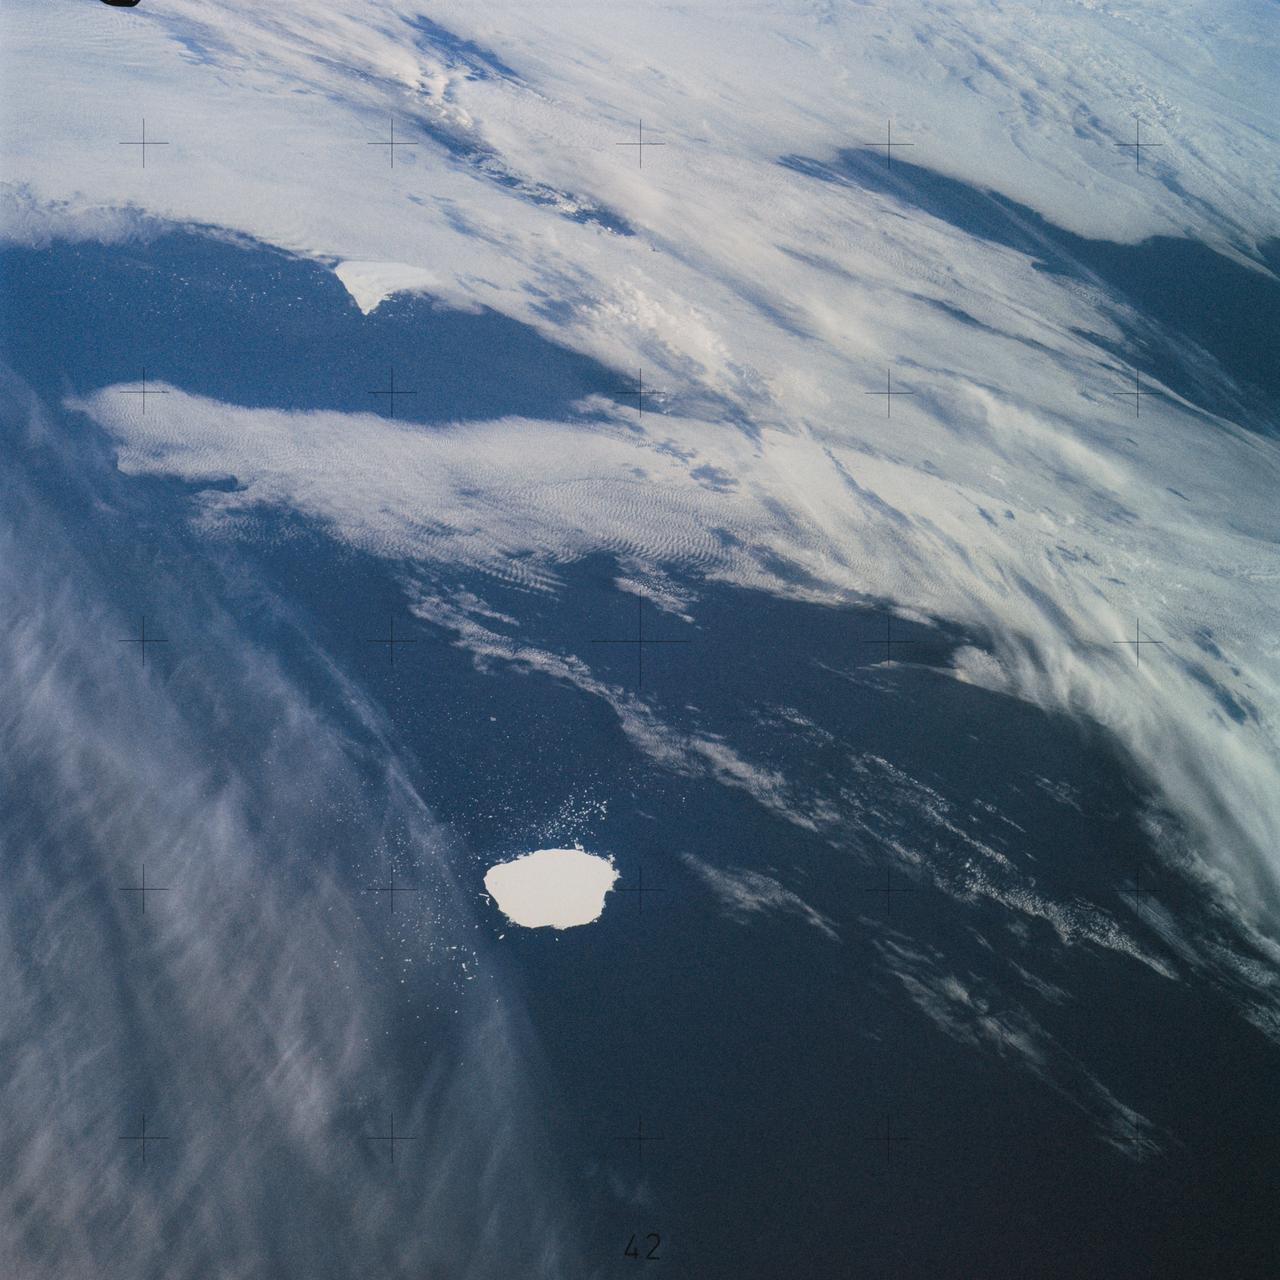
SL4-142-4577 (28 Jan. 1974) --- Two large ice islands in the vicinity of South Georgia Island in the South Atlantic Ocean, as photographed from the Skylab space station in Earth orbit by one of the Skylab 4 crewmen. The camera used was a hand-held 70mm Hasselblad, with SO-368 medium-speed Ektachrome. One of the ice islands is partially obscured by clouds. Ice islands were observed as large as 45 by 60 kilometers (27 x 37 miles) and as far north as 45 degrees south latitude. The size and distribution of the "small" icebergs (to a ship they would look very large) can be used to study the local winds and currents. Recent research has suggested the possibility of towing such Antarctic icebergs to selected areas and using them as water supplies. One such iceberg would contain many times the water as in Lake Powell. Photo credit: NASA
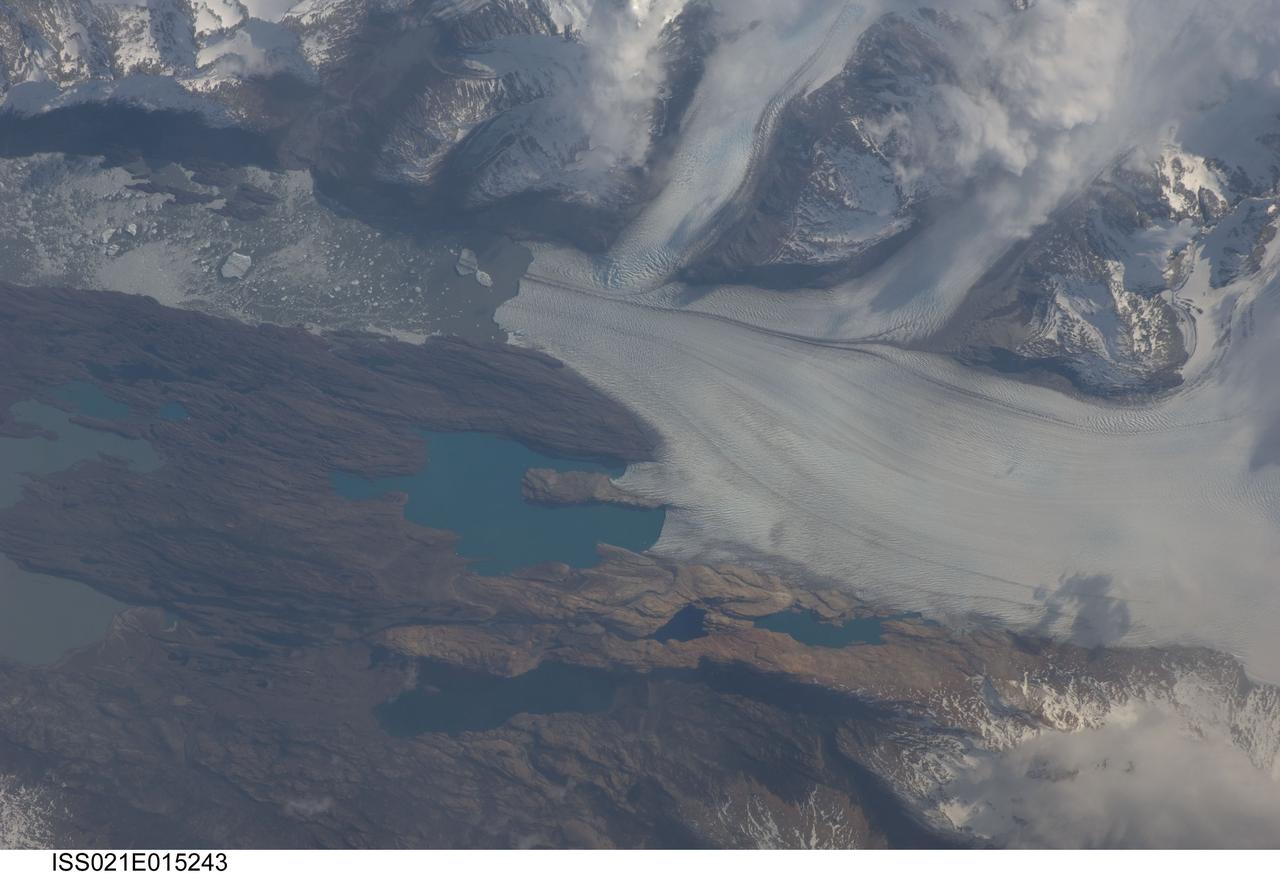
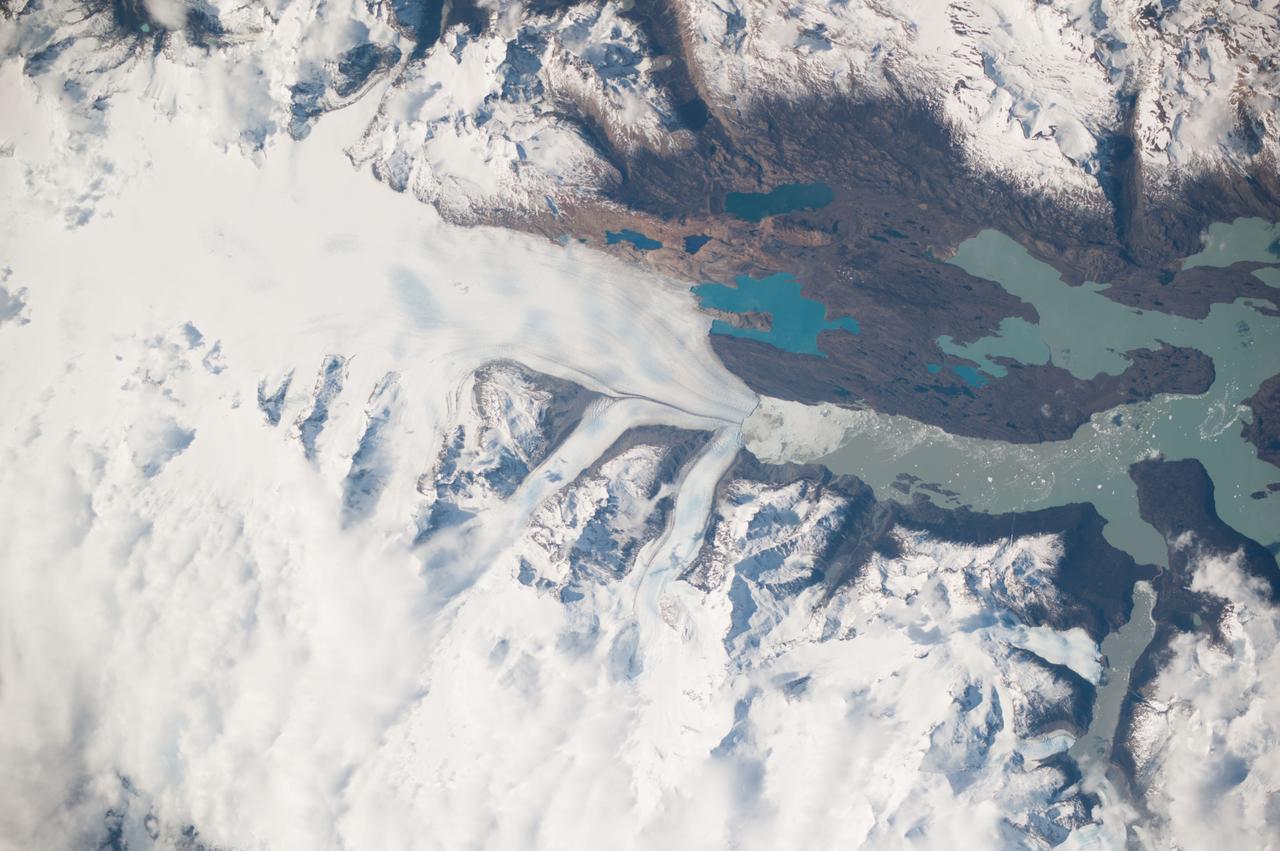
ISS021-E-015243 (25 Oct. 2009) --- Upsala Glacier, Argentina is featured in this image photographed by an Expedition 21 crew member on the International Space Station. The Southern Patagonian Ice Field of Argentina and Chile hosts some of the most spectacular glaciers in the world, and is second only to Antarctica in size. This detailed photograph illustrates the terminus of Upsala Glacier, located on the eastern side of the ice field. This glacier is the third largest in the Southern Patagonian Ice Field and, like most other glaciers in the region, has experienced significant retreat over the past century. This image was taken during spring in the Southern Hemisphere, and calving of icebergs ? release of chunks of ice from the glacier terminus as it enters the waters of Lake Argentina - is visible at left. Two icebergs are of particular interest, as they retain fragments of the moraine that forms a dark line along the upper surface of the glacier. Moraines of the type visible in this image are formed from coarse rock and soil debris that accumulates along the front and sides of a flowing glacier; much like a bulldozer blade pushes material in front of it. When two glaciers merge together (center), debris in moraines along their edges can now form a medial moraine that is drawn out along the upper surface of the new ice mass. These moraines can be carried intact to the terminus and included in icebergs that then float away, dropping the coarse debris as the iceberg melts. While the icebergs produced by Upsala Glacier do not reach an ocean, there are many current glaciers ? as well as glaciers and ice sheets that existed in the geologic past ? capable of producing ocean-going icebergs. This process is thought to be recorded in the geologic record as layers or lenses of coarse, land-derived sediments within finer grained sea floor sediments that are located far from any current (or former) coastline.

Observations from NASA Cosmic Infrared Background Experiment, or CIBER, have shown a surprising surplus of infrared light filling the spaces between galaxies.
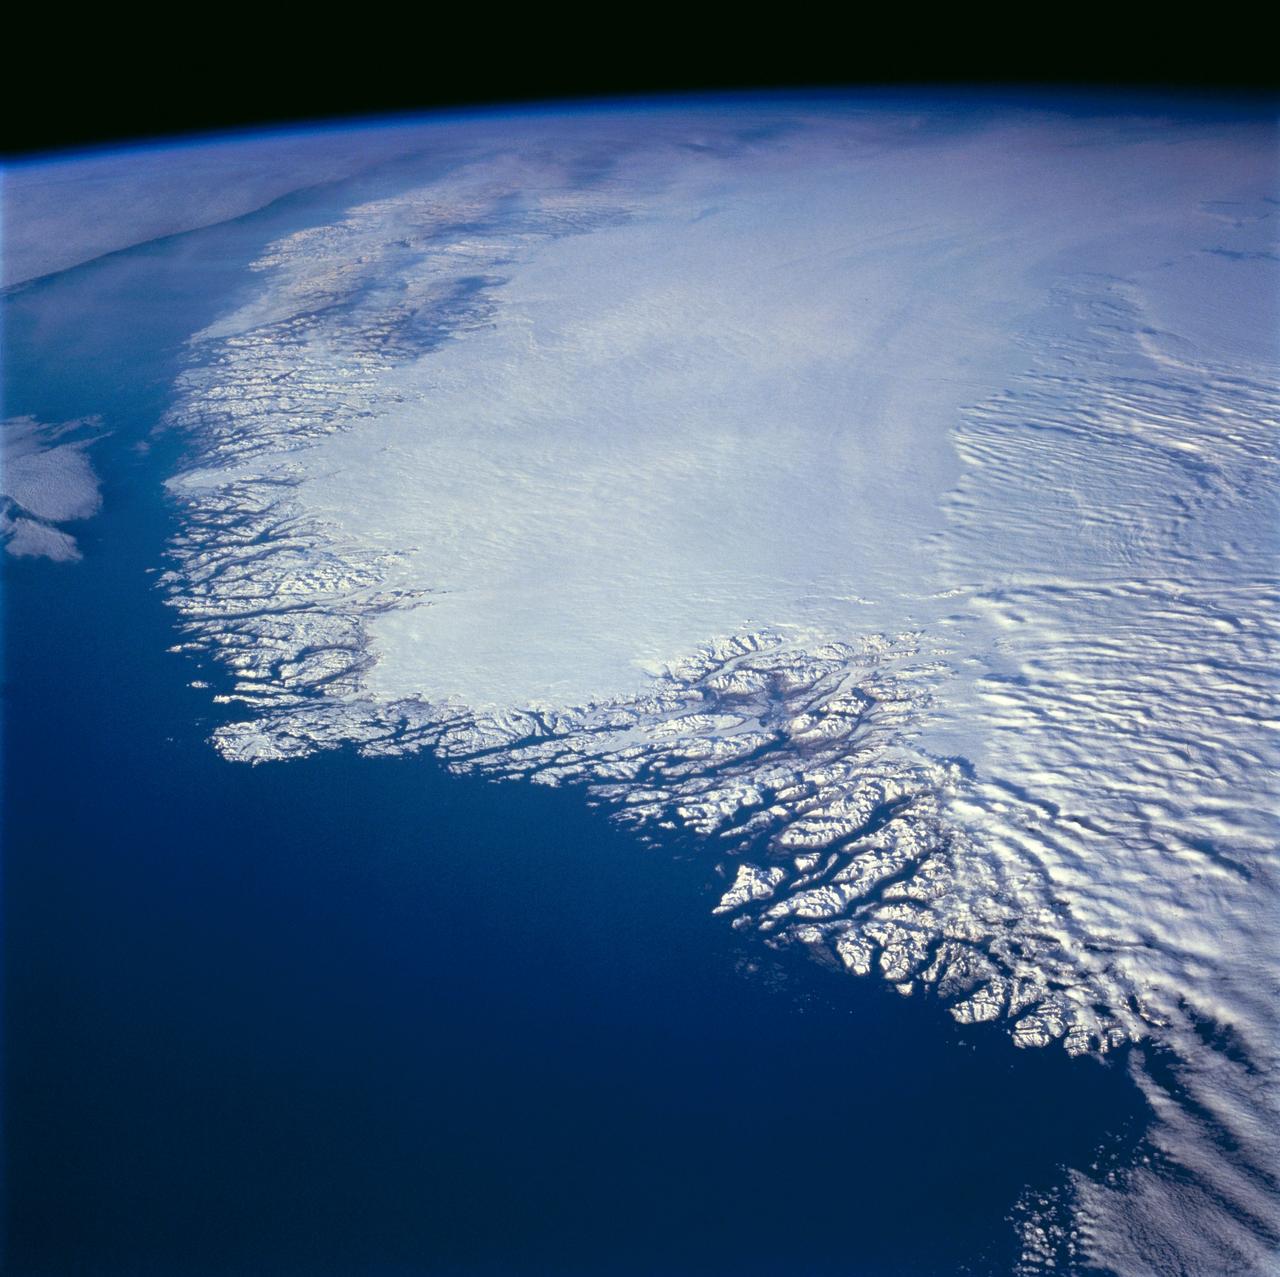
This north-looking view of southwestern Greenland was taken in November, 1994, and shows numerous indentations, many of which contain small settlements. These fjords were carved by the glaciers of the last ice age 10,000 years ago. Even today, the ice in the center of Greenland is nearly 3,500 meters (11,000 feet) thick and great rivers of ice continuously flow down toward the sea, where they melt or break off as icebergs. Some Icebergs exceed the size of small islands, weigh several million tons, and rise several hundred feet above the sea surface. Cape Farewell is visible toward the bottom right of the view. Julianehab Bay and the Bredev fjord can be seen toward the center of the photograph. Godthab, the main settlement on Greenland, is barely visible to the north of the Frederikeshabs Icefield near the left center of the view.
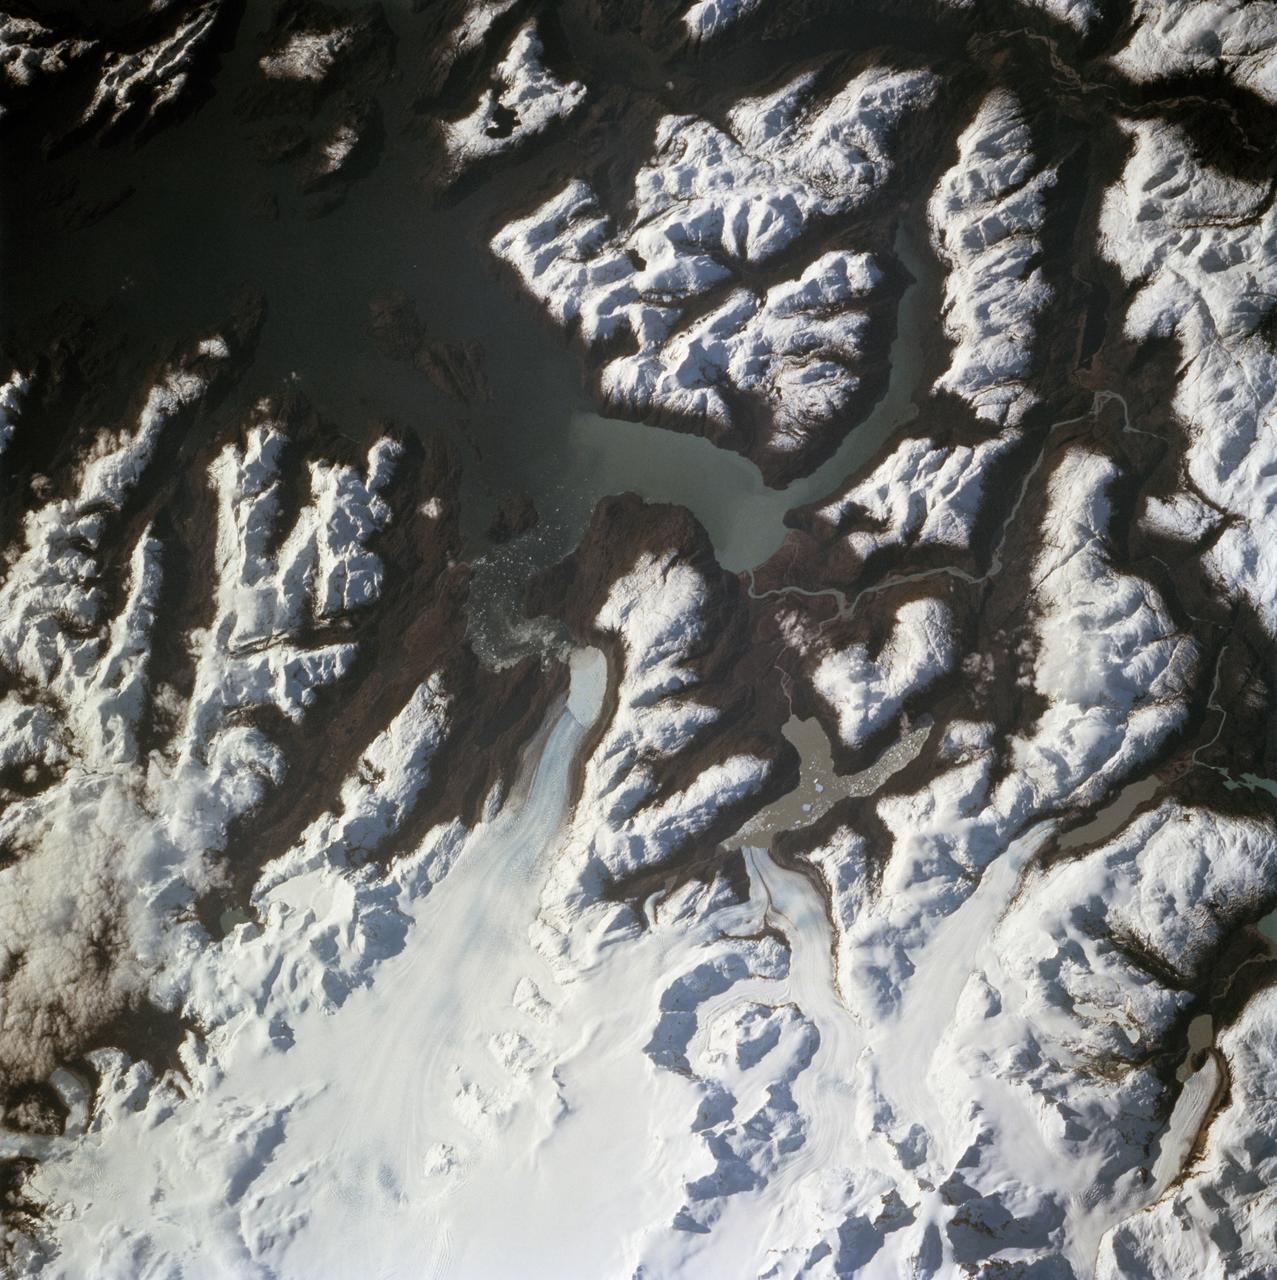
STS068-260-078 (30 September-11 October 1994) --- The ice visible along the bottom of this view is the north end of the larger (southern) of two great remaining ice field of the Andes Mountains in Chile. The longest glacier visible here flows down into the Calen Fjord (an arm of the Pacific Ocean known as Canal Baker) where numerous calved icebergs can be seen floating. The other three glaciers end in glacier-cut valleys with small lakes - the bigger lake has numerous icebergs as well. the river snaking through the mountains to the fjord drains water from the great Lake O'Higgins, which lies out of the picture to the right. Glacial mud can be seen emptying into the fjord and discoloring the water with its milky color.
STS048-152-007 (12-18 Sept 1991) --- The periphery of the Antarctic ice shelf and the Antarctic Peninsula were photographed by the STS 48 crew members. Strong offshore winds, probably associated with katabatic winds from the interior of the continent, are peeling off the edges of the ice shelf into ribbons of sea ice, icebergs, bergy bits and growlers into the cold waters of the circum-Antarctic southern ocean.
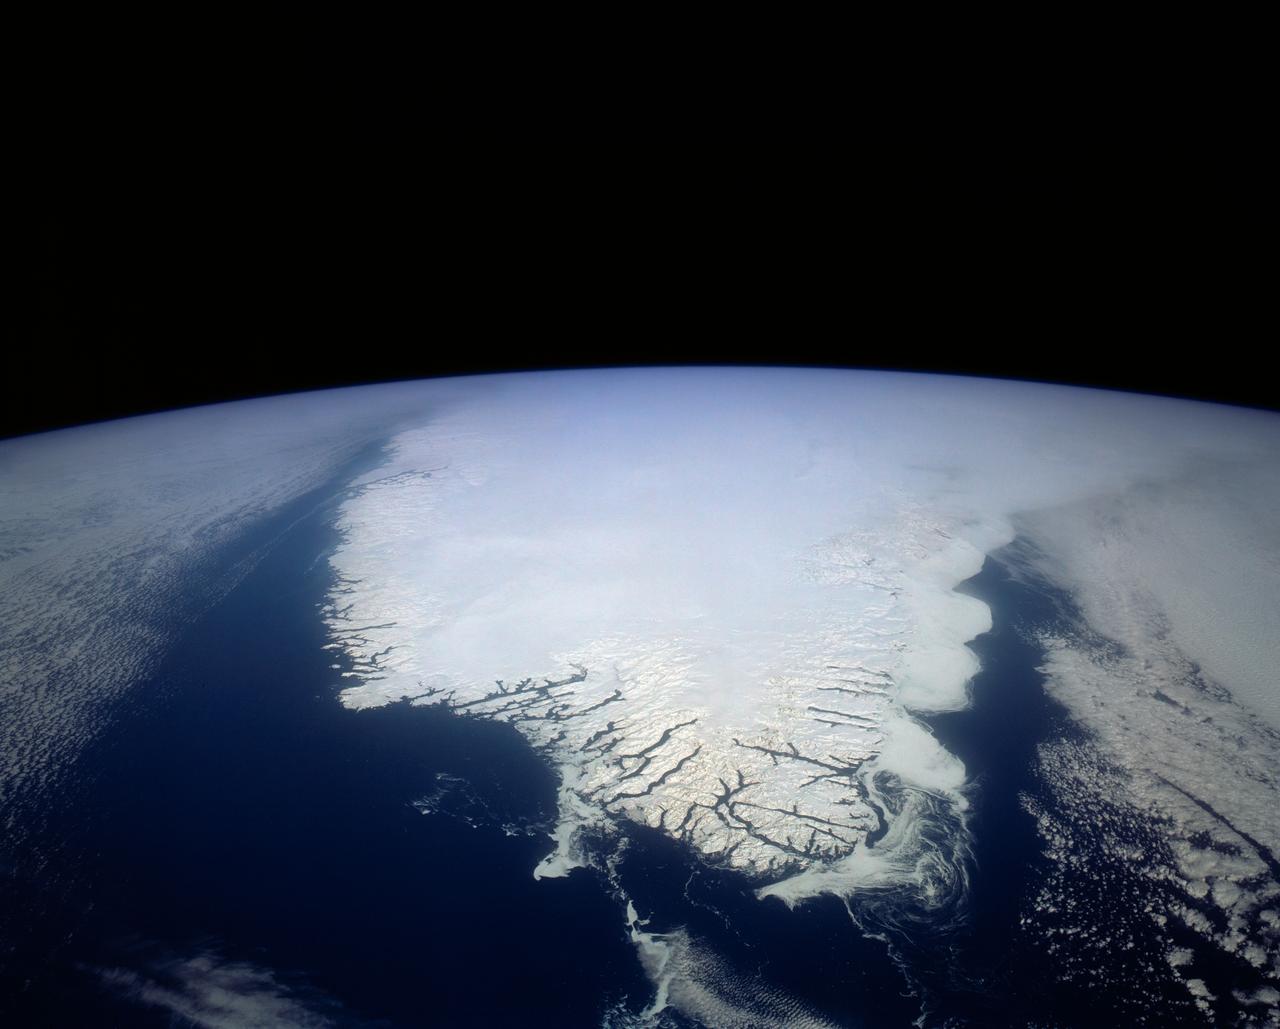
This spectacular north looking view of south Greenland (62.0N, 46.0W) shows numerous indentations along the coastline, many of which contain small settlements. These indentations are fiords carved by glaciers of the last ice age. Even today, ice in the center of Greenland is as much as 10,000 ft. thick and great rivers of ice continuously flow toward the sea, where they melt or break off as icebergs - some of which may be seen floating offshore.
NASA image acquired August 5, 2010 On August 5, 2010, an enormous chunk of ice, roughly 97 square miles (251 square kilometers) in size, broke off the Petermann Glacier, along the northwestern coast of Greenland. The Canadian Ice Service detected the remote event within hours in near real-time data from the Moderate Resolution Imaging Spectroradiometer (MODIS) on NASA’s Aqua satellite. The Peterman Glacier lost about one-quarter of its 70-kilometer (40-mile) long floating ice shelf, said researchers who analyzed the satellite data at the University of Delaware. The Moderate Resolution Imaging Spectroradiometer (MODIS) on NASA’s Terra satellite captured these natural-color images of Petermann Glacier 18:05 UTC on August 5, 2010 (top), and 17:15 UTC on July 28, 2010 (bottom). The Terra image of the Petermann Glacier on August 5 was acquired almost 10 hours after the Aqua observation that first recorded the event. By the time Terra took this image, skies were less cloudy than they had been earlier in the day, and the oblong iceberg had broken free of the glacier and moved a short distance down the fjord. Icebergs calving off the Petermann Glacier are not unusual. Petermann Glacier’s floating ice tongue is the Northern Hemisphere’s largest, and it has occasionally calved large icebergs. The recently calved iceberg is the largest to form in the Arctic since 1962, said the University of Delaware. To read more and or to download the high res go here: <a href="http://www.nasa.gov/topics/earth/features/petermann-calve.html" rel="nofollow">www.nasa.gov/topics/earth/features/petermann-calve.html</a> or Click here to see more images from <b><a href="#//earthobservatory.nasa.gov/" rel="nofollow"> NASA Goddard’s Earth Observatory</a></b> NASA Earth Observatory image created by Jesse Allen and Robert Simmon, using data obtained from the Goddard Level 1 and Atmospheric Archive and Distribution System (LAADS). Caption by Holli Riebeek and Michon Scott. Instrument: Terra - MODIS <b><a href="http://www.nasa.gov/centers/goddard/home/index.html" rel="nofollow">NASA Goddard Space Flight Center</a></b> is home to the nation's largest organization of combined scientists, engineers and technologists that build spacecraft, instruments and new technology to study the Earth, the sun, our solar system, and the universe. <b>Follow us on <a href="http://twitter.com/NASA_GoddardPix" rel="nofollow">Twitter</a></b> <b>Join us on <a href="http://www.facebook.com/pages/Greenbelt-MD/NASA-Goddard/395013845897?ref=tsd" rel="nofollow">Facebook</a><b></b></b>
Iceberg embedded in sea ice with a lead on one side. This opening was likely caused by winds blowing against the side of the iceberg. Credit: NASA / George Hale NASA's Operation IceBridge is an airborne science mission to study Earth's polar ice. For more information about IceBridge, visit: <a href="http://www.nasa.gov/icebridge" rel="nofollow">www.nasa.gov/icebridge</a> <b><a href="http://www.nasa.gov/audience/formedia/features/MP_Photo_Guidelines.html" rel="nofollow">NASA image use policy.</a></b> <b><a href="http://www.nasa.gov/centers/goddard/home/index.html" rel="nofollow">NASA Goddard Space Flight Center</a></b> enables NASA’s mission through four scientific endeavors: Earth Science, Heliophysics, Solar System Exploration, and Astrophysics. Goddard plays a leading role in NASA’s accomplishments by contributing compelling scientific knowledge to advance the Agency’s mission. <b>Follow us on <a href="http://twitter.com/NASA_GoddardPix" rel="nofollow">Twitter</a></b> <b>Like us on <a href="http://www.facebook.com/pages/Greenbelt-MD/NASA-Goddard/395013845897?ref=tsd" rel="nofollow">Facebook</a></b> <b>Find us on <a href="http://instagrid.me/nasagoddard/?vm=grid" rel="nofollow">Instagram</a></b>
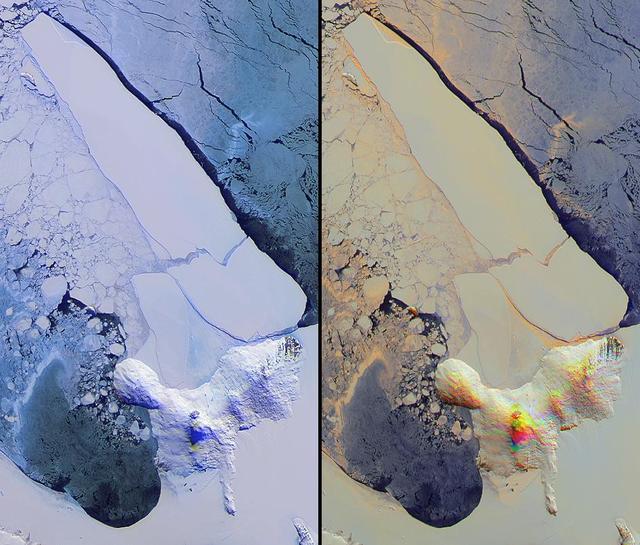
A rift in Antarctica's Larsen C ice shelf has grown to 110 miles (175 km) long, making it inevitable that an iceberg larger than Rhode Island will soon calve from the ice shelf. Larsen C is the fourth largest ice shelf in Antarctica, with an area of almost 20,000 square miles (50,000 square kilometers). The calving event will remove approximately 10 percent of the ice shelf's mass, according to the Project for Impact of Melt on Ice Shelf Dynamics and Stability (MIDAS), a UK-based team studying the ice shelf. Only 12 miles (20 km) of ice now separates the end of the rift from the ocean. The rift has grown at least 30 miles (50 km) in length since August, but appears to be slowing recently as Antarctica returns to polar winter. Project MIDAS reports that the calving event might destabilize the ice shelf, which could result in a collapse similar to what occurred to the Larsen B ice shelf in 2002. The Multi-angle Imaging SpectroRadiometer (MISR) instrument aboard NASA's Terra satellite captured views of Larsen C on August 22, 2016, when the rift was 80 miles (130 km) in length; December 8, 2016, when the rift was approximately 90 miles (145 km) long; and April 6, 2017. The MISR instrument has nine cameras, which view the Earth at different angles. The overview image, from December 8, shows the entire Antarctic Peninsula -- home to Larsen A, B, and C ice shelves -- in natural color (similar to how it would appear to the human eye) from MISR's vertical-viewing camera. Combining information from several MISR cameras pointed at different angles gives information about the texture of the ice. The accompanying GIF depicts the inset area shown on the larger image and displays data from all three dates in false color. These multiangular views -- composited from MISR's 46-degree backward-pointing camera, the nadir (vertical-viewing) camera, and the 46-degree forward-pointing camera -- represent variations in ice texture as changes in color, such that areas of rough ice appear orange and smooth ice appears blue. The Larsen C shelf is on the left in the GIF, bordered by the Weddell Sea on the upper right. The ice within the rift is orange, indicating movement, and the end of the rift can be tracked across the shelf between images. In addition, between December and April, the rift widened, pushing the future iceberg away from the shelf at its southern end. These data were acquired during Terra orbits 88717, 90290 and 92023. https://photojournal.jpl.nasa.gov/catalog/PIA21581
Cape Horn is the southernmost point of the Tierra Del Fuego archipelago of Southern Chile, and marks the northern boundary of the Drake Passage where the Atlantic and Pacific Oceans meet. For decades after its 1616 discovery, it was a milestone for the clipper route by which sailing ships carried trade around the world (Wikipedia). Unfortunately, it was also a graveyard for sailing ships due to strong winds, large waves, strong currents, and icebergs. The 1914 opening of the Panama Canal greatly reduced the need for ships to traverse this dangerous passage. The image was acquired December 20, 2009, covers an area of 28.3 by 36.0 kilometers, and is located at 56 degrees south, 67.3 degrees west. https://photojournal.jpl.nasa.gov/catalog/PIA23118

A sea of icebergs float near the Thurston Island calving front off of western Antarctica as seen on the IceBridge flight on Nov. 5, 2014. Image Credit: NASA/Jim Yungel NASA’s Operation IceBridge collected some rare images on a flight out of Punta Arenas, Chile on Nov. 5, 2014, on a science flight over western Antarctica dubbed Ferrigno-Alison-Abbott 01. The crew snapped a few shots of a calving front of the Antarctic ice sheet. This particular flight plan was designed to collect data on changes in ice elevation along the coast near the Ferrigno and Alison ice streams, on the Abbot Ice Shelf, and grounded ice along the Eights Coast.

NASA image acquired September 6, 2010 The Matusevich Glacier flows toward the coast of East Antarctica, pushing through a channel between the Lazarev Mountains and the northwestern tip of the Wilson Hills. Constrained by surrounding rocks, the river of ice holds together. But stresses resulting from the glacier’s movement make deep crevasses, or cracks, in the ice. After passing through the channel, the glacier has room to spread out as it floats on the ocean. The expanded area and the jostling of ocean waves prompts the ice to break apart, which it often does along existing crevasses. On September 6, 2010, the Advanced Land Imager (ALI) on NASA’s Earth Observing-1 (EO-1) satellite captured this natural-color image of the margin of Matusevich Glacier. Shown here just past the rock-lined channel, the glacier is calving large icebergs. Low-angled sunlight illuminates north-facing surfaces and casts long shadows to the south. Fast ice anchored to the shore surrounds both the glacier tongue and the icebergs it has calved. Compared to the glacier and icebergs, the fast ice is thinner with a smoother surface. Out to sea (image left), the sea ice is even thinner and moves with winds and currents. Matusevich Glacier does not drain a significant amount of ice off of the Antarctic continent, so the glacier’s advances and retreats lack global significance. Like other Antarctic glaciers, however, Matusevich helps glaciologists form a larger picture of Antarctica’s glacial health and ice sheet volume. NASA Earth Observatory image created by Jesse Allen and Robert Simmon, using EO-1 ALI data provided courtesy of the NASA EO-1 team. Caption by Michon Scott based on image interpretation by Robert Bindschadler, NASA Goddard Space Flight Center, and Walt Meier, National Snow and Ice Data Center. Instrument: EO-1 - ALI Credit: <b><a href="http://www.earthobservatory.nasa.gov/" rel="nofollow"> NASA Earth Observatory</a></b> <b><a href="http://www.nasa.gov/centers/goddard/home/index.html" rel="nofollow">NASA Goddard Space Flight Center</a></b> enables NASA’s mission through four scientific endeavors: Earth Science, Heliophysics, Solar System Exploration, and Astrophysics. Goddard plays a leading role in NASA’s accomplishments by contributing compelling scientific knowledge to advance the Agency’s mission. <b>Follow us on <a href="http://twitter.com/NASA_GoddardPix" rel="nofollow">Twitter</a></b> <b>Join us on <a href="http://www.facebook.com/pages/Greenbelt-MD/NASA-Goddard/395013845897?ref=tsd" rel="nofollow">Facebook</a></b> To download the full resolution image go to: <a href="http://earthobservatory.nasa.gov/IOTD/view.php?id=46840" rel="nofollow">earthobservatory.nasa.gov/IOTD/view.php?id=46840</a>
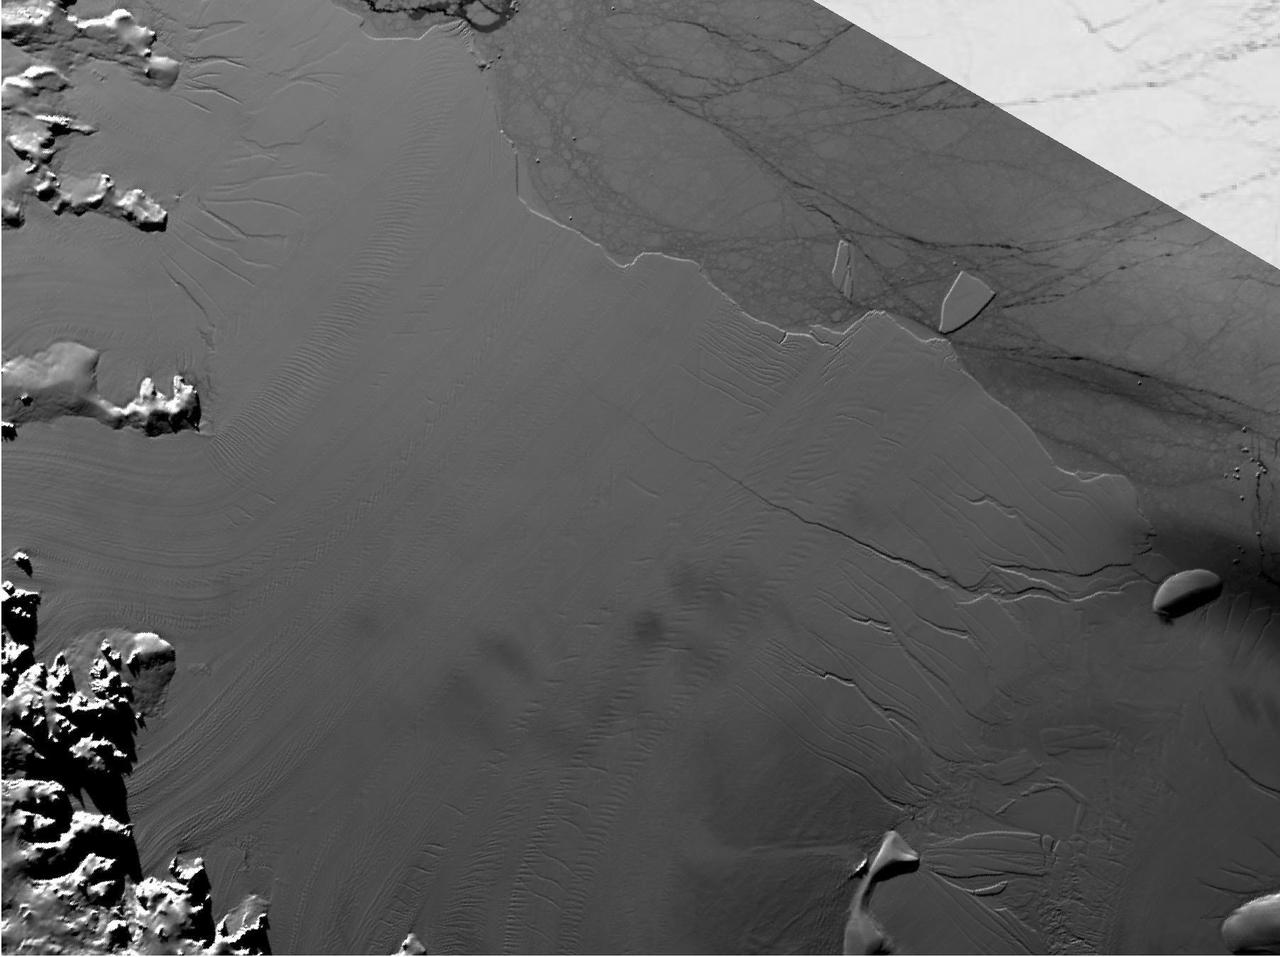
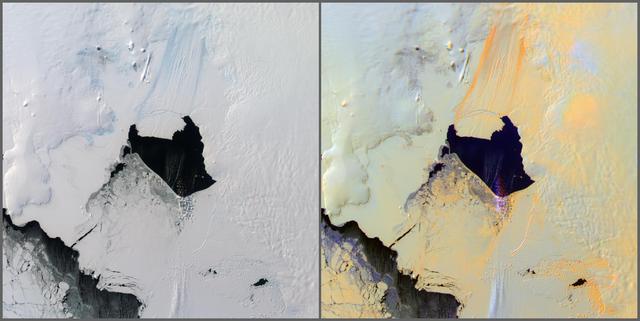
This ASTER image was acquired on December 12, 2000, and covers an area of 38 x 48 km. Pine Island Glacier has undergone a steady loss of elevation with retreat of the grounding line in recent decades. Now, space imagery has revealed a wide new crack that some scientists think will soon result in a calving event. Glaciologist Robert Bindschadler of NASA's Goddard Space Flight Center predicts this crack will result in the calving of a major iceberg, probably in less than 18 months. Discovery of the crack was possible due to multi-year image archives and high resolution imagery. This image is located at 74.1 degrees south latitude and 105.1 degrees west longitude. http://photojournal.jpl.nasa.gov/catalog/PIA11095
Satellite images from 2022 (Main image) and 1999 (Figure A) capture the retreat of Zachariae Isstrom, a glacier in northeast Greenland, as icebergs broke off its edge over the course of 23 years. In a recent study in Nature, researchers from NASA's Jet Propulsion Laboratory in Southern California calculated that Zachariae lost an estimated 176 billion tons (160 billion metric tons) of ice in the period between 1985 and 2022. That was the greatest mass lost for the period of any of the 207 glaciers analyzed in the paper. The earlier image was taken by the Enhanced Thematic Mapper Plus on the Landsat 7 satellite on Aug. 5, 1999, while the later image was captured by the Operational Land Imager on the Landsat 8 satellite on Aug. 22, 2022. The study took a comprehensive look at glacial retreat around the edges of the entire Greenland Ice Sheet from 1985 to 2022 and found that 179 glaciers retreated significantly since 1985, 27 held steady, and just one advanced slightly. The study found that overall the ice sheet shed about 1,140 billion tons (1,034 billion metric tons) of ice from 1985 to 2022, one-fifth more mass than previously estimated, as icebergs fell into the ocean at an accelerating rate. Most of the ice loss came from below sea level, in fjords on Greenland's periphery. Once occupied by ancient glacial ice, many of these deep coastal valleys have filled with seawater – meaning the ice that broke off made little net contribution to sea level. But the loss likely accelerated the movement of ice flowing down from higher elevations, which in turn added to sea level rise. It also added previously unaccounted-for fresh water to the North Atlantic Ocean, which could have impacts on global ocean currents. https://photojournal.jpl.nasa.gov/catalog/PIA26118
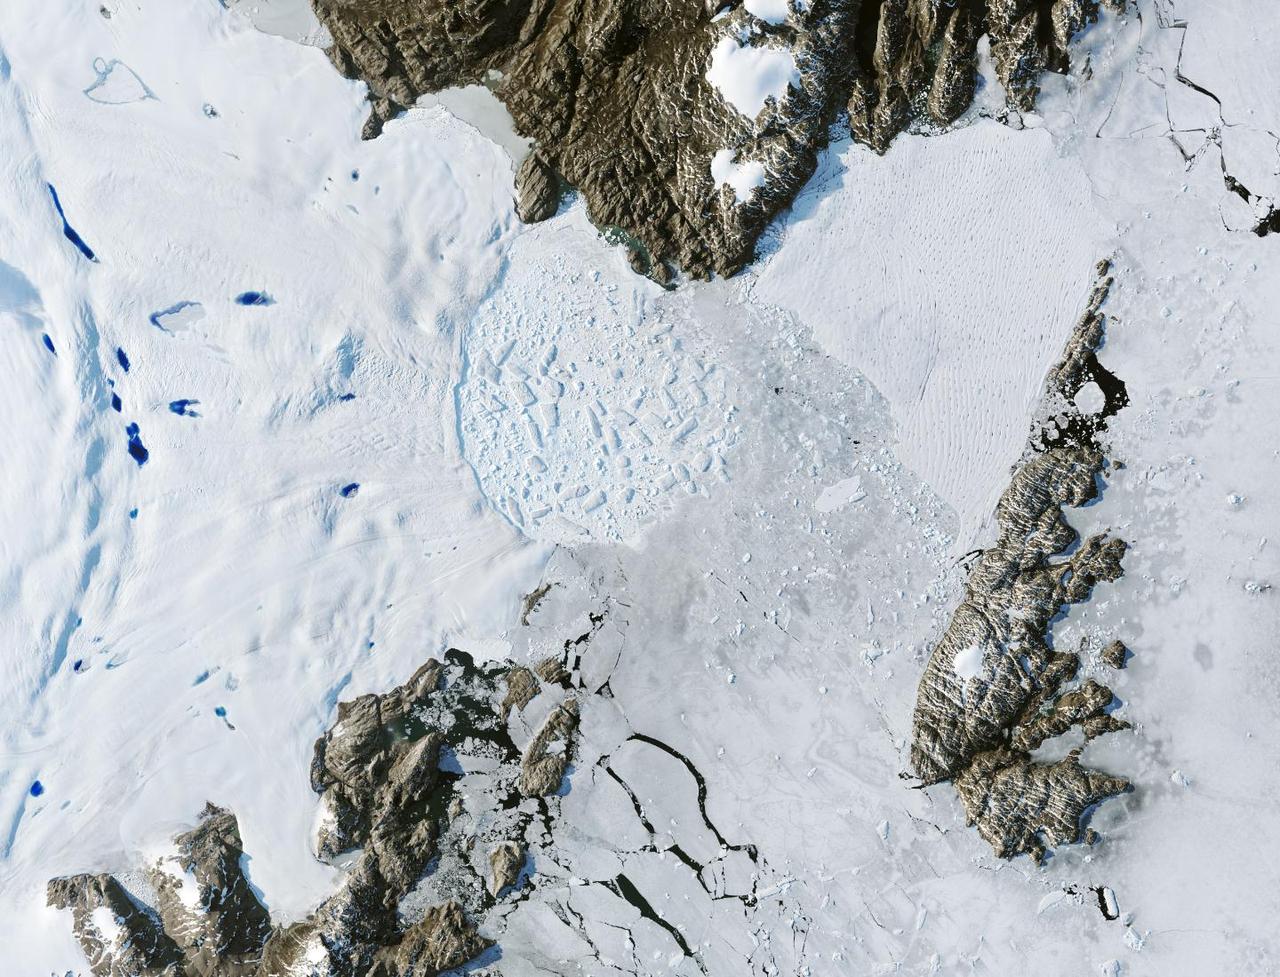
Satellite images from 2022 (Main image) and 1985 (Figure A) capture the retreat of Jakobshavn Isbrae, a glacier on Greenland's western coast, as icebergs broke off its edge over nearly four decades. In a recent study in Nature, researchers from NASA's Jet Propulsion Laboratory in Southern California calculated that Jakobshavn lost an estimated 97 billion tons (88 billion metric tons) of ice in the period between the two images. The earlier image was taken by the Thematic Mapper instrument on the Landsat 5 satellite on Sept. 5, 1985, while the later image was captured by the Operational Land Imager on the Landsat 8 satellite on Sept. 4, 2022. Of the 207 glaciers analyzed in the study, Jakobshavn lost the second most ice mass, trailing only Zachariae Isstrom, a glacier in northeast Greenland. The study took a comprehensive look at glacial retreat around the edges of the entire Greenland Ice Sheet from 1985 to 2022 and found that 179 glaciers retreated significantly since 1985, 27 held steady, and just one advanced slightly. The study found that overall the ice sheet shed about 1,140 billion tons (1,034 billion metric tons) of ice from 1985 to 2022, one-fifth more mass than previously estimated, as icebergs fell into the ocean at an accelerating rate. Most of the ice loss came from below sea level, in fjords on Greenland's periphery. Once occupied by ancient glacial ice, many of these deep coastal valleys have filled with seawater – meaning the ice that broke off made little net contribution to sea level. But the loss likely accelerated the movement of ice flowing down from higher elevations, which in turn added to sea level rise. It also added previously unaccounted-for fresh water to the North Atlantic Ocean, which could have impacts on global ocean currents. https://photojournal.jpl.nasa.gov/catalog/PIA26117
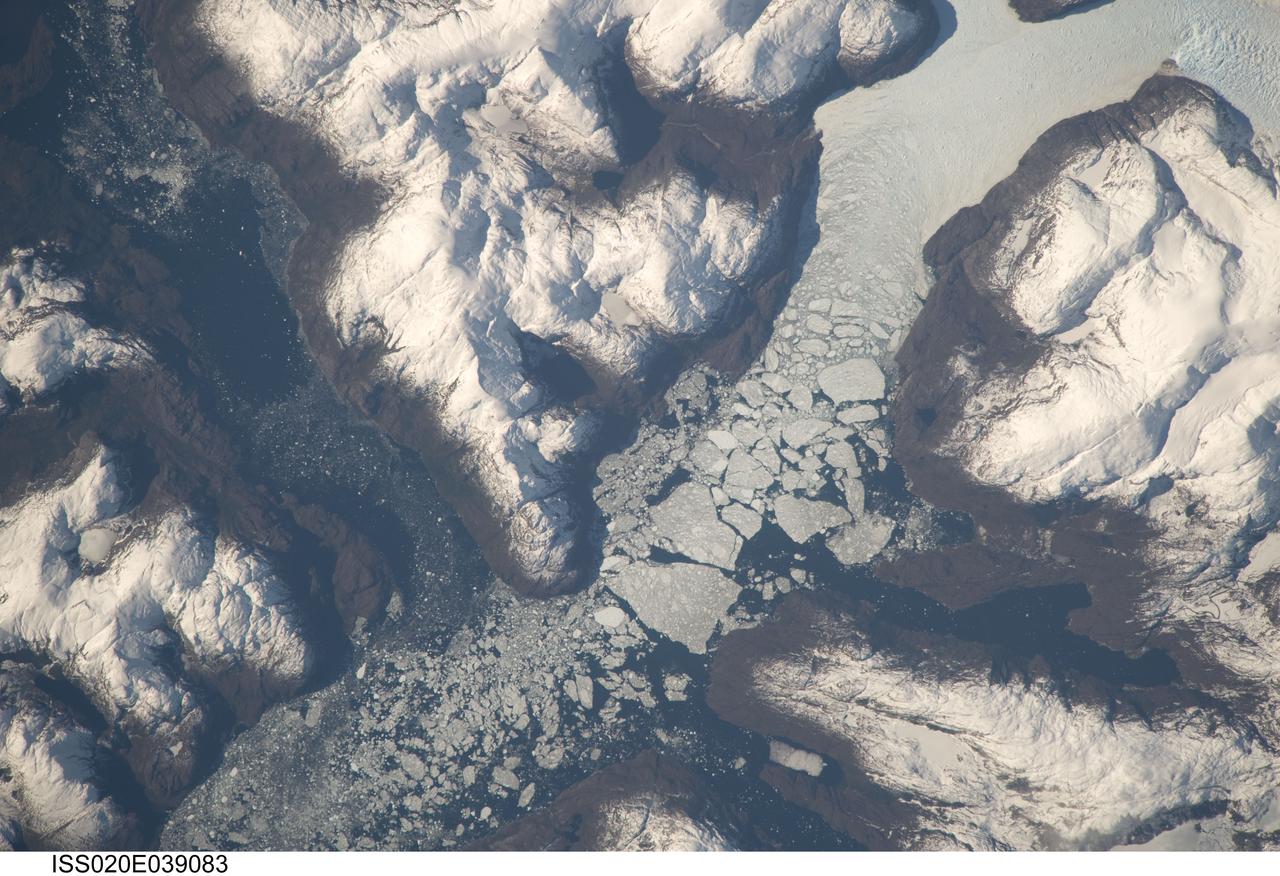
ISS020-E-039083 (6 Sept. 2009) --- Glacier outlet in the Southern Patagonian Ice Field of Chile is featured in this image photographed by an Expedition 20 crew member on the International Space Station. The Southern Patagonian Ice Field of Chile and Argentina hosts a spectacular array of glaciers and associated glacial features within the southern Andes Mountains. Glaciers flowing downhill on the eastern side of the mountains have outlets into several large freshwater lakes. On the western side of the mountains, glaciers release ice into the Pacific Ocean via an intricate network of fjords. Fjords are steep valleys originally cut by glaciers during periods of lower sea level that are now inundated. As glaciers flow into the fjord, ice at the front of the glacier begins to break off and form icebergs that can float out to sea ? a process known as calving. This detailed photograph shows the merged outlet of Penguin Glacier and HPS 19 into a fjord carved into the snow-covered mountains of the southern Andes. The designation HPS stands for Hielo Patagonico Sur (e.g. Southern Patagonian Ice field) and is used to identify glaciers that have no other geographic name. Ice flowing into the fjord begins to break up at center, forming numerous icebergs ? the largest visible in this image is approximately 2 kilometers in width. The large ice masses visible at center have a coarse granular appearance due to variable snow cover, and mixing and refreezing of ice fragments prior to floating free.
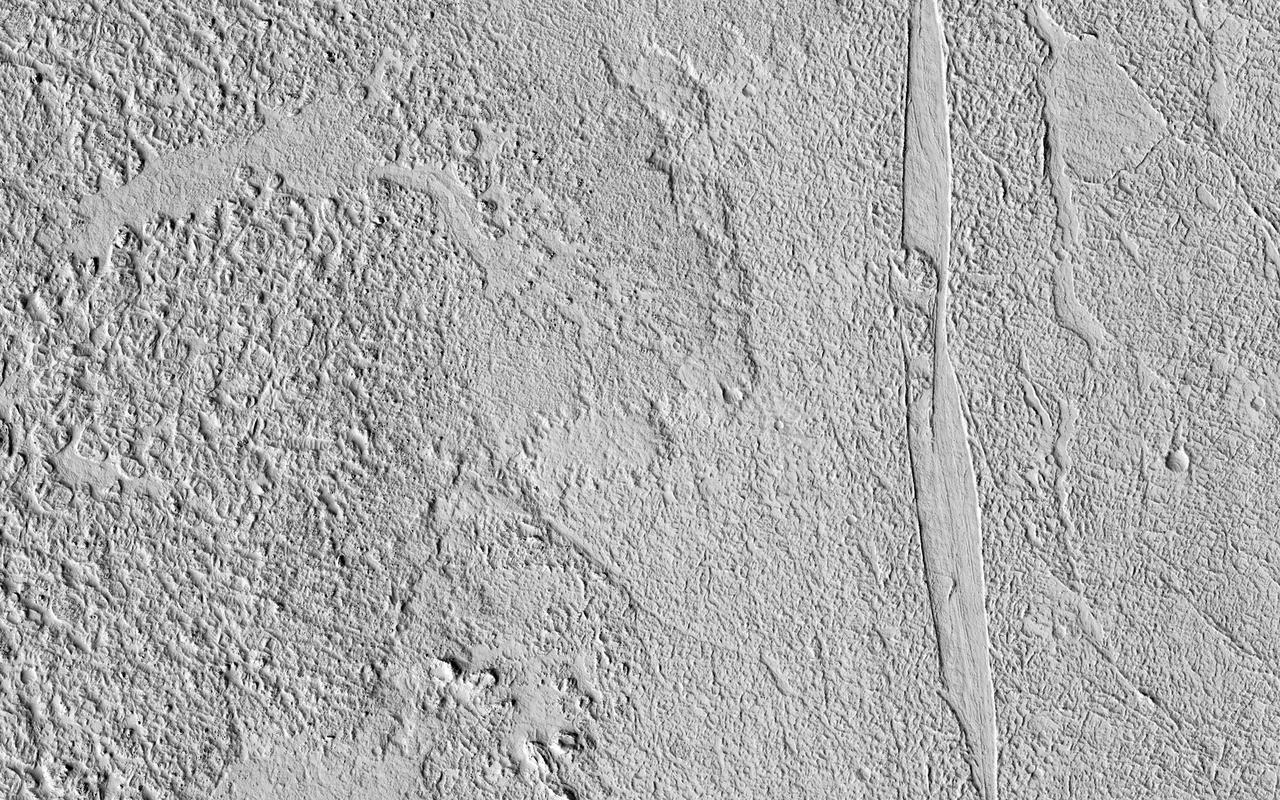
This image shows some beautiful lava flows in Amazonis Planitia. Lava isn't moving around on Mars today, but it certainly once did, and images like this one are evidence of that. A thick lava flow came in from the west, and you can see the cooled flow lobes and wrinkled upper surface. East of the flow margin, this most recent flow also coursed over an older lava surface which shows some long, north-south breaks, and in the southeast corner, an arrowhead-shaped set of ridges. These textures are most likely from rafted slabs of lava. Under certain conditions, a large piece of lava can cool, but then detach and move like an iceberg over a cushion of still-molten lava. The long, narrow north-south smooth areas are probably where two of these plates rafted away from one another exposing the lava below. The arrowhead-shaped ridges are probably from when one of these plates pushed up against another one and caused a pile-up before cooling. http://photojournal.jpl.nasa.gov/catalog/PIA21113

ISS017-E-012583 (4 Aug. 2008) --- Cape Farewell, Greenland is featured in this image photographed by an Expedition 17 crewmember on the International Space Station (ISS). This view illustrates the southernmost tip of Greenland, known as Kap Farvel in Danish and Nunap Isua in Inuit. The viewing direction is towards the northeast; the image was taken when the space station was located near its most northerly orbital latitude of 52 degrees, off the northern coast of the Island of Newfoundland approximately 1160 kilometers to the southwest. Greenland is the world's largest island with an area of over 2 million square kilometers; however much of the island is covered by an ice cap that can reach thicknesses of 3 kilometers. The image is highly oblique -- taken from an angle looking outwards from the ISS, rather than straight down towards the Earth -- and this provides a sense of topography along the southern edge of Greenland. The exposed dark grey bedrock along the southwestern coastline has been carved by glaciers into numerous fjords -- steep-sided valleys that drain directly into the ocean; the white cloud cover surrounding the island doubtless contains some sea ice and icebergs calved from glaciers. A band of high-altitude cirrus clouds (light grey) cast shadows on the lower stratus cloud deck in the lower third of the image. The thin blue layer of Earth's atmosphere is visible.
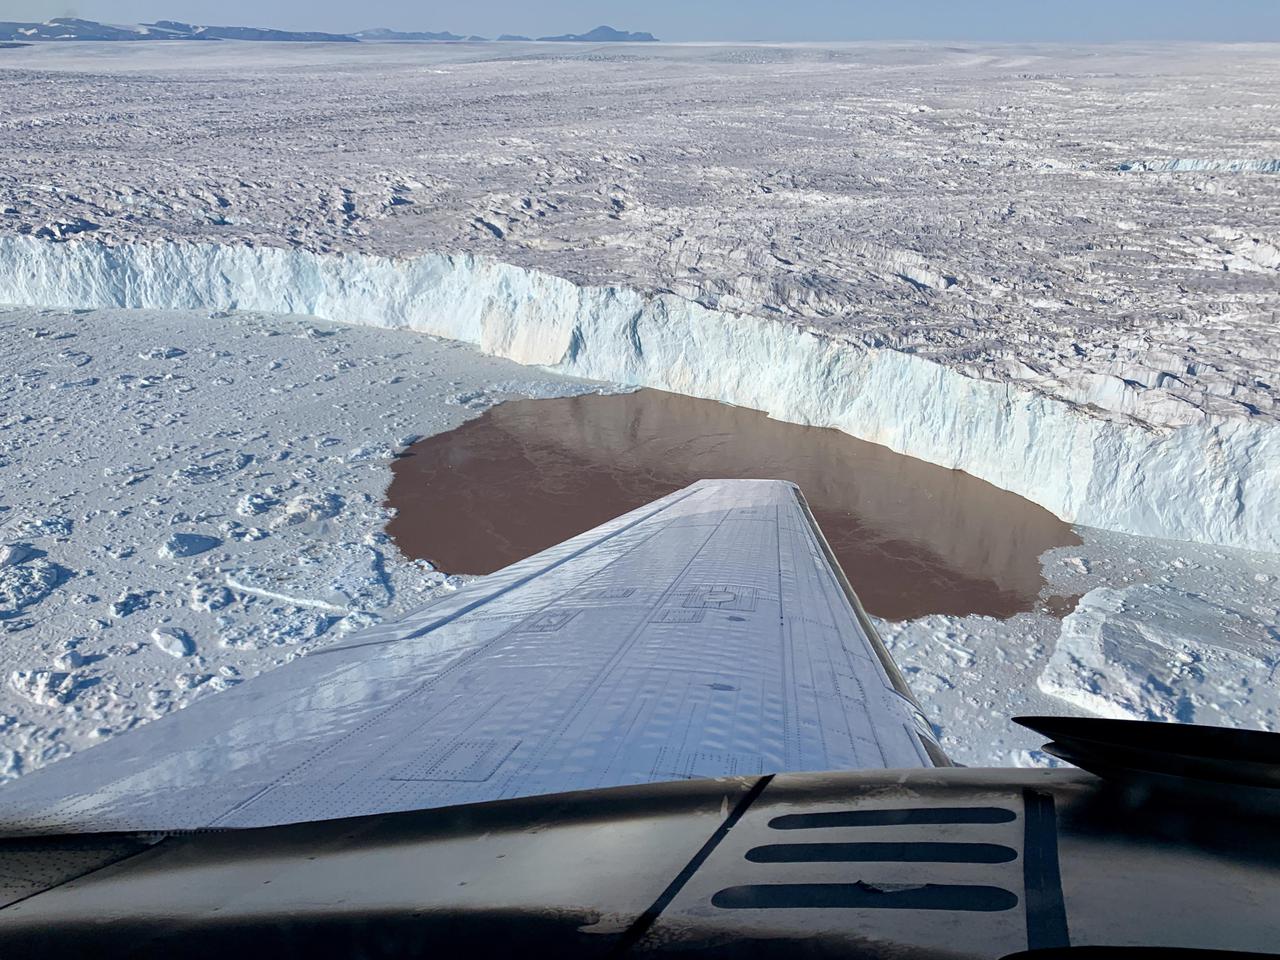
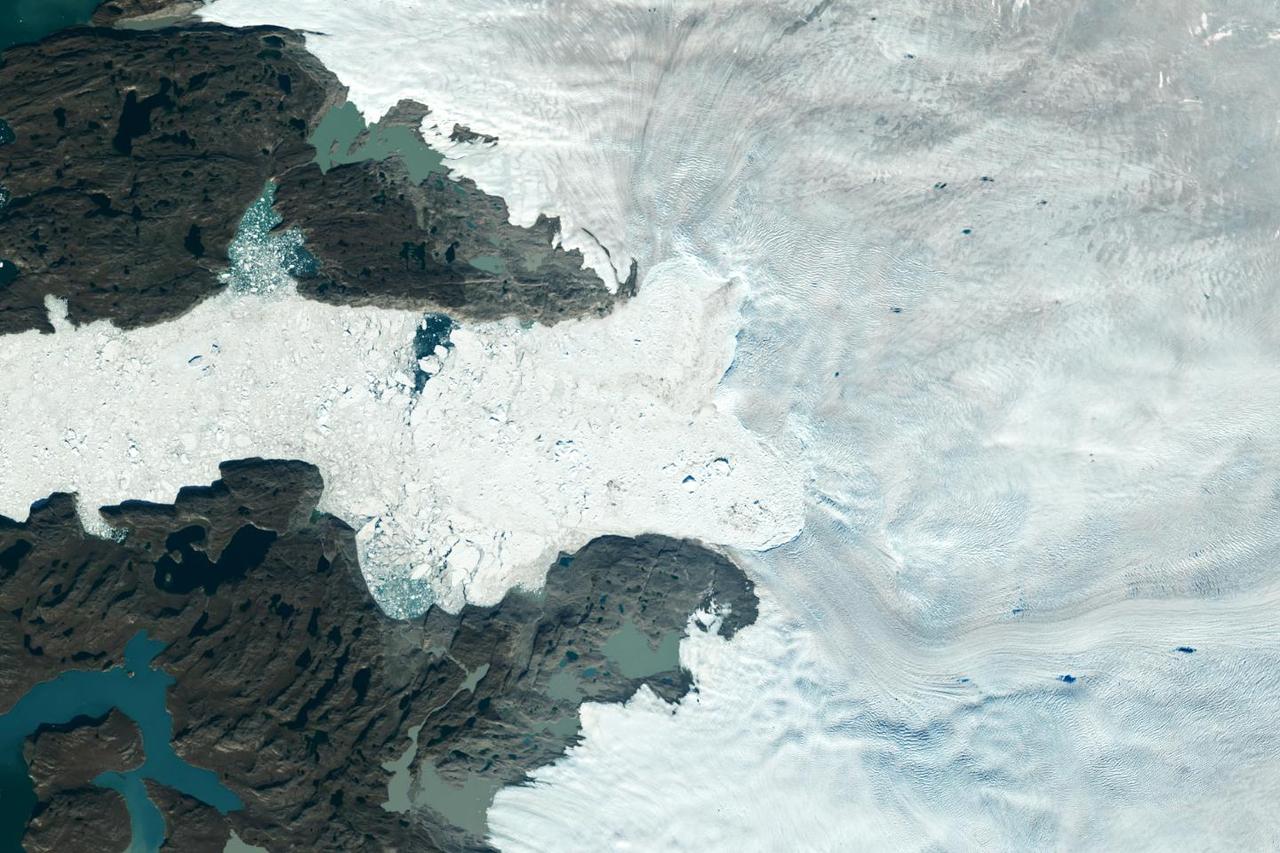
In this aerial view, a glacier along Greenland's craggy coastline is actively undergoing undercutting, a process in which meltwater flowing out from the bottom of the glacier enters the fjord. The brown water in front of the glacier is caused by sediment being dredged up from the base of the glacier by meltwater plumes reaching the surface of the fjord. Because the meltwater contains no salt, it is lighter and rises through the saltier ocean water, dragging the warm ocean water into contact with the ice at the glacier's base. The result is increased melting at the bottom of the glacier, which creates and overhanging layer of ice that breaks off (or calves) as icebergs. As the climate warms, the ocean water temperature and the amount of meltwater both increase, combining to hasten this undercutting process and speed up the ice loss from Greenland's Ice Sheet. The image was taken on Aug. 25, 2019 by a probe-dropping airplane as part of the Oceans Melting Greenland (OMG) mission. OMG has been studying glaciers that plunge into Greenland's steep-sided inlets, or fjords, for the past five years, gathering precise measurements of fjord depth and water salinity from probes dropped by plane, supplemented by measurements made by boat. The aim is to better understand how the warming ocean water around Greenland is hastening ice melt and calving of these marine-terminating glaciers. https://photojournal.jpl.nasa.gov/catalog/PIA24162
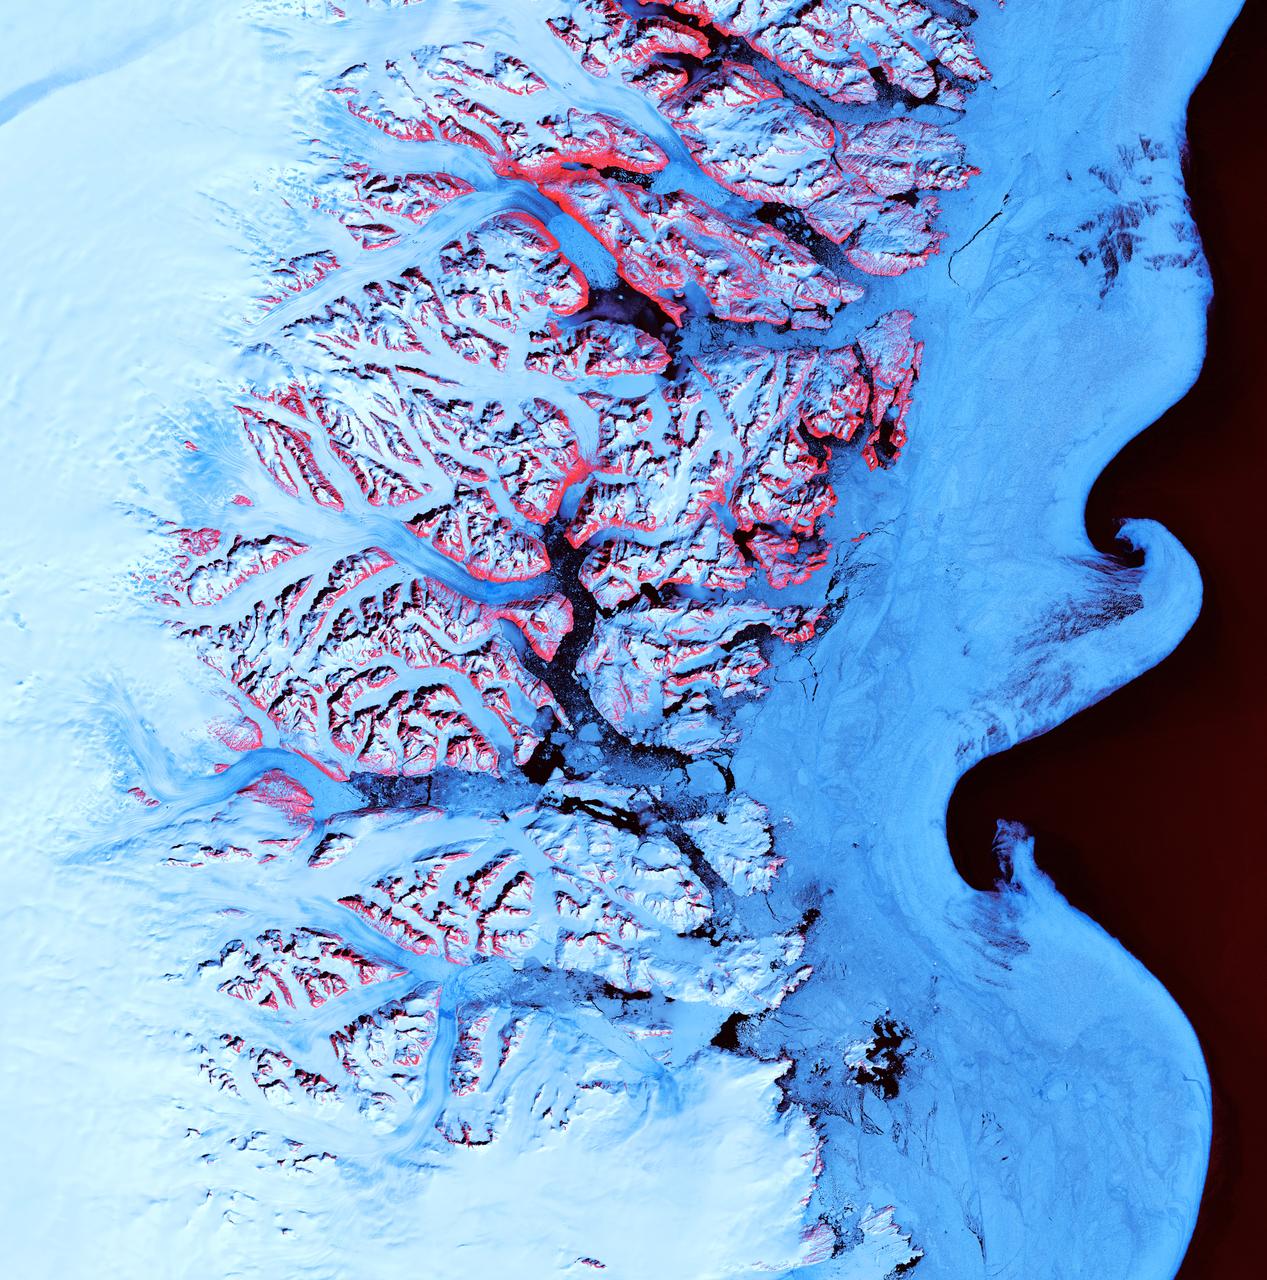
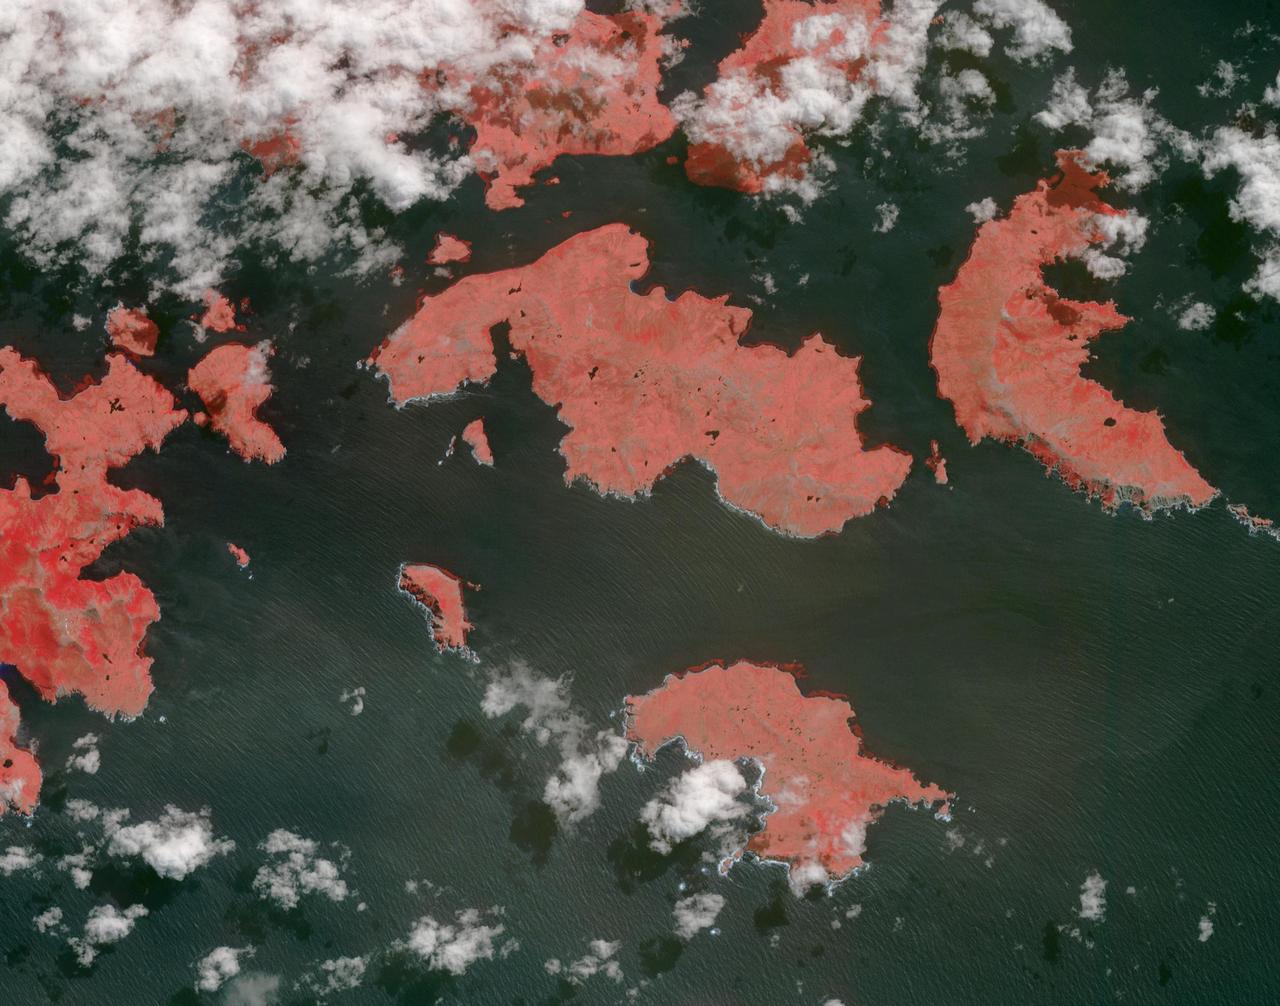
Ice Waves - May 21st, 2001 Description: Along the southeastern coast of Greenland, an intricate network of fjords funnels glacial ice to the Atlantic Ocean. During the summer melting season, newly calved icebergs join slabs of sea ice and older, weathered bergs in an offshore slurry that the southward-flowing East Greenland Current sometimes swirls into stunning shapes. Exposed rock of mountain peaks, tinted red in this image, hints at a hidden landscape. Credit: USGS/NASA/Landsat 7 To learn more about the Landsat satellite go to: <a href="http://landsat.gsfc.nasa.gov/" rel="nofollow">landsat.gsfc.nasa.gov/</a> <b><a href="http://www.nasa.gov/centers/goddard/home/index.html" rel="nofollow">NASA Goddard Space Flight Center</a></b> enables NASA’s mission through four scientific endeavors: Earth Science, Heliophysics, Solar System Exploration, and Astrophysics. Goddard plays a leading role in NASA’s accomplishments by contributing compelling scientific knowledge to advance the Agency’s mission. <b>Follow us on <a href="http://twitter.com/NASA_GoddardPix" rel="nofollow">Twitter</a></b> <b>Join us on <a href="http://www.facebook.com/pages/Greenbelt-MD/NASA-Goddard/395013845897?ref=tsd" rel="nofollow">Facebook</a></b>
ISS037-E-005104 (2 Oct. 2013) --- Upsala Glacier Retreat and Patagonia Icefield are featured in this image photographed by an Expedition 37 crew member on the International Space Station. This photograph highlights the snout of the Upsala Glacier (49.88S 73.3W) on the Argentine side of the North Patagonian Icefield. Ice flow in this glacier (white mass, left) is from the north (left). Dark lines of rocky moraine within the ice give a sense of the slow ice flow from left to right. A smaller side glacier joins Upsala at the present-day ice front—the wall from which masses of ice periodically collapse into Lake Argentino. In this image the 2.75-kilometer-long wall casts a thin, dark shadow. The surface of Lake Argentino is whitened by a mass of ice debris from a recent collapse of the ice wall. Larger icebergs that have calved appear as white dots on the lake surface at right. Remotely sensed data, including detailed astronaut images such as this, have recorded the position of the ice front over the years. Even though the ice actually flows slowly southward, comparison of this October 2013 image with older data (not shown) indicates that the ice wall of the glacier has moved backwards—upstream—an average of 3.6 kilometers since early 2002. This so-called “retreat” is believed by scientists to indicate local climatic warming in this part of South America. The warming not only causes the ice front to retreat but more importantly, causes overall thinning of the glacier ice mass, as a study of 63 glaciers in Patagonia has shown is now a general trend (Rignot et al. 2003). Ice-front retreat is now known to be related to volumetric loss due to melting. Water color is related to glacier flow. Lake Argentino receives most of the ice from the glacier and thus also receives most of the “rock flour” (rocks ground to white powder by the ice scraping against the rock floor of the valley) from underneath the glacier. Glacial flour turns the lake water a gray-green hue in this image. The darker blue of the smaller lakes (top) indicates that they are receiving much less rock flour.
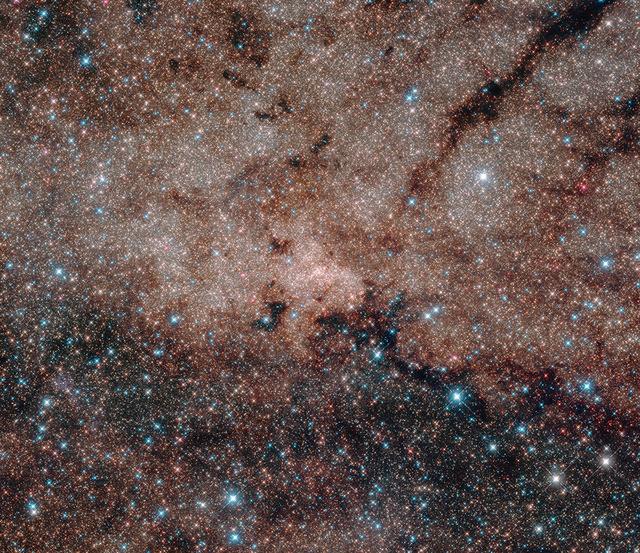
This picture, spanning 50 light-years across, is a mosaic stitched from nine separate images from Hubble’s Wide Field Camera 3. The center of the Milky Way is located 27,000 light-years away. The “snowstorm” of stars in the image is just the tip of the iceberg: Astronomers estimate that about 10 million stars in this cluster are too faint to be captured in this image. Read more: <a href="http://www.nasa.gov/feature/goddard/2016/hubble-s-journey-to-the-center-of-our-galaxy" rel="nofollow">www.nasa.gov/feature/goddard/2016/hubble-s-journey-to-the...</a> <b><a href="http://www.nasa.gov/audience/formedia/features/MP_Photo_Guidelines.html" rel="nofollow">NASA image use policy.</a></b> <b><a href="http://www.nasa.gov/centers/goddard/home/index.html" rel="nofollow">NASA Goddard Space Flight Center</a></b> enables NASA’s mission through four scientific endeavors: Earth Science, Heliophysics, Solar System Exploration, and Astrophysics. Goddard plays a leading role in NASA’s accomplishments by contributing compelling scientific knowledge to advance the Agency’s mission. <b>Follow us on <a href="http://twitter.com/NASAGoddardPix" rel="nofollow">Twitter</a></b> <b>Like us on <a href="http://www.facebook.com/pages/Greenbelt-MD/NASA-Goddard/395013845897?ref=tsd" rel="nofollow">Facebook</a></b> <b>Find us on <a href="http://instagrid.me/nasagoddard/?vm=grid" rel="nofollow">Instagram</a></b>
Calving front of an ice shelf in West Antarctica. The traditional view on ice shelves, the floating extensions of seaward glaciers, has been that they mostly lose ice by shedding icebergs. A new study by NASA and university researchers has found that warm ocean waters melting the ice sheets from underneath account for 55 percent of all ice shelf mass loss in Antarctica. This image was taken during the 2012 Antarctic campaign of NASA's Operation IceBridge, a mission that provided data for the new ice shelf study. Read more: <a href="http://www.nasa.gov/topics/earth/features/earth20130613.html" rel="nofollow">www.nasa.gov/topics/earth/features/earth20130613.html</a> Credit: NASA/GSFC/Jefferson Beck <b><a href="http://www.nasa.gov/audience/formedia/features/MP_Photo_Guidelines.html" rel="nofollow">NASA image use policy.</a></b> <b><a href="http://www.nasa.gov/centers/goddard/home/index.html" rel="nofollow">NASA Goddard Space Flight Center</a></b> enables NASA’s mission through four scientific endeavors: Earth Science, Heliophysics, Solar System Exploration, and Astrophysics. Goddard plays a leading role in NASA’s accomplishments by contributing compelling scientific knowledge to advance the Agency’s mission. <b>Follow us on <a href="http://twitter.com/NASA_GoddardPix" rel="nofollow">Twitter</a></b> <b>Like us on <a href="http://www.facebook.com/pages/Greenbelt-MD/NASA-Goddard/395013845897?ref=tsd" rel="nofollow">Facebook</a></b> <b>Find us on <a href="http://instagram.com/nasagoddard?vm=grid" rel="nofollow">Instagram</a></b>
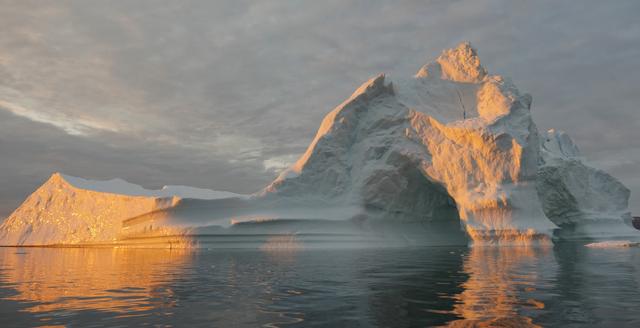
Sea level rise is a natural consequence of the warming of our planet. We know this from basic physics. When water heats up, it expands. So when the ocean warms, sea level rises. When ice is exposed to heat, it melts. And when ice on land melts and water runs into the ocean, sea level rises. For thousands of years, sea level has remained relatively stable and human communities have settled along the planet’s coastlines. But now Earth’s seas are rising. Globally, sea level has risen about eight inches since the beginning of the 20th century and more than two inches in the last 20 years alone. All signs suggest that this rise is accelerating. Read more: <a href="http://go.nasa.gov/1heZn29" rel="nofollow">go.nasa.gov/1heZn29</a> Caption: An iceberg floats in Disko Bay, near Ilulissat, Greenland, on July 24, 2015. The massive Greenland ice sheet is shedding about 300 gigatons of ice a year into the ocean, making it the single largest source of sea level rise from melting ice. Credits: NASA/Saskia Madlener <b><a href="http://www.nasa.gov/audience/formedia/features/MP_Photo_Guidelines.html" rel="nofollow">NASA image use policy.</a></b> <b><a href="http://www.nasa.gov/centers/goddard/home/index.html" rel="nofollow">NASA Goddard Space Flight Center</a></b> enables NASA’s mission through four scientific endeavors: Earth Science, Heliophysics, Solar System Exploration, and Astrophysics. Goddard plays a leading role in NASA’s accomplishments by contributing compelling scientific knowledge to advance the Agency’s mission. <b>Follow us on <a href="http://twitter.com/NASAGoddardPix" rel="nofollow">Twitter</a></b> <b>Like us on <a href="http://www.facebook.com/pages/Greenbelt-MD/NASA-Goddard/395013845897?ref=tsd" rel="nofollow">Facebook</a></b> <b>Find us on <a href="http://instagrid.me/nasagoddard/?vm=grid" rel="nofollow">Instagram</a></b>
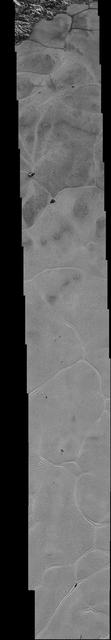
NASA's New Horizons spacecraft continues to transmit the sharpest views of Pluto that it obtained (and recorded) during its flyby of the distant planet on July 14, 2015. The newest image, returned on Dec. 24, 2015, extends New Horizons' highest-resolution swath of Pluto to the very center of the informally named Sputnik Planum, and nearly completes the set of highest-resolution images taken by New Horizons last July. The pictures are part of a sequence taken near New Horizons' closest approach to Pluto, with resolutions of about 250-280 feet (77-85 meters) per pixel -- revealing features smaller than half a city block on Pluto's surface. The images shown here form a strip 50 miles (80 kilometers) wide and more than 400 miles (700 kilometers) long, trending from the northwestern shoreline of Sputnik Planum and out across its icy plains. The images illustrate the polygonal or cellular pattern of the plains, which are thought to result from the convective churning of a deep layer solid, but mobile, nitrogen ice. The surface of Sputnik Planum appears darker toward the shore (at top), possibly implying a change in composition or surface texture. The occasional raised, darker blocks at the cell edges are probably dirty water "icebergs" floating in denser solid nitrogen. The pictures were taken with the telescopic Long Range Reconnaissance Imager (LORRI) aboard New Horizons, from a range of approximately 10,000 miles (17,000 kilometers) over a timespan of about a minute centered on 11:36 UT on July 14 -- just about 15 minutes before New Horizons' closest approach to Pluto. http://photojournal.jpl.nasa.gov/catalog/PIA20336
![“I found it amazing that this world was covered in ice and had an ocean underneath. I was mapping this area on Europa called Conamara Chaos, where we believe that the surface is locally heated. Because of this, there are ginormous icebergs that broke off and floated around in this slushy ice, so I learned to map [that part of the surface]. Having my physics and math background and thinking about a world with a subsurface ocean, I was like, 'OK, this is a good marriage of fluid mechanics and heat transfer. Europa is a nice world to study that will combine my background with this new planetary science thing that I love.’ “What happened with Europa Clipper was I decided to do my dissertation topic on [the moon]. We'd seen images of these beautiful south polar plumes on Enceladus, these geyser-like plumes, but Europa is much bigger. It has much more water and receives much more tidal heating. Why didn't the Galileo spacecraft see plumes on Europa? Why don't we see geysers? “My dissertation focused on what it would take to have this geyser activity on Europa and for spacecraft cameras to image it. I remember defending my dissertation well but sitting there thinking, ‘People will think I'm a quack because we've never seen geysers on Europa.’ That was in May, and by December, Lorenz Roth's paper came out that Hubble may have detected geysers on Europa. That's when I was like, 'Oh yes, I might actually have a career!' “Shortly after that, the call came out for instrument proposals. Zibi Turtle [Principal Investigator for the Europa Imaging System] met me at a conference and said, 'We're writing a proposal for a camera for the Europa mission. Would you want to be on it?' At that point, I was a year out of my Ph.D. and was like, ‘Are you kidding me?’ Because that usually never happens. Usually, the people on these instrument teams are more senior. They've been around longer, so it’s very rare to be just finishing up your Ph.D. and someone asks you. I](https://images-assets.nasa.gov/image/NHQ202402070010/NHQ202402070010~medium.jpg)
“I found it amazing that this world was covered in ice and had an ocean underneath. I was mapping this area on Europa called Conamara Chaos, where we believe that the surface is locally heated. Because of this, there are ginormous icebergs that broke off and floated around in this slushy ice, so I learned to map [that part of the surface]. Having my physics and math background and thinking about a world with a subsurface ocean, I was like, 'OK, this is a good marriage of fluid mechanics and heat transfer. Europa is a nice world to study that will combine my background with this new planetary science thing that I love.’ “What happened with Europa Clipper was I decided to do my dissertation topic on [the moon]. We'd seen images of these beautiful south polar plumes on Enceladus, these geyser-like plumes, but Europa is much bigger. It has much more water and receives much more tidal heating. Why didn't the Galileo spacecraft see plumes on Europa? Why don't we see geysers? “My dissertation focused on what it would take to have this geyser activity on Europa and for spacecraft cameras to image it. I remember defending my dissertation well but sitting there thinking, ‘People will think I'm a quack because we've never seen geysers on Europa.’ That was in May, and by December, Lorenz Roth's paper came out that Hubble may have detected geysers on Europa. That's when I was like, 'Oh yes, I might actually have a career!' “Shortly after that, the call came out for instrument proposals. Zibi Turtle [Principal Investigator for the Europa Imaging System] met me at a conference and said, 'We're writing a proposal for a camera for the Europa mission. Would you want to be on it?' At that point, I was a year out of my Ph.D. and was like, ‘Are you kidding me?’ Because that usually never happens. Usually, the people on these instrument teams are more senior. They've been around longer, so it’s very rare to be just finishing up your Ph.D. and someone asks you. I

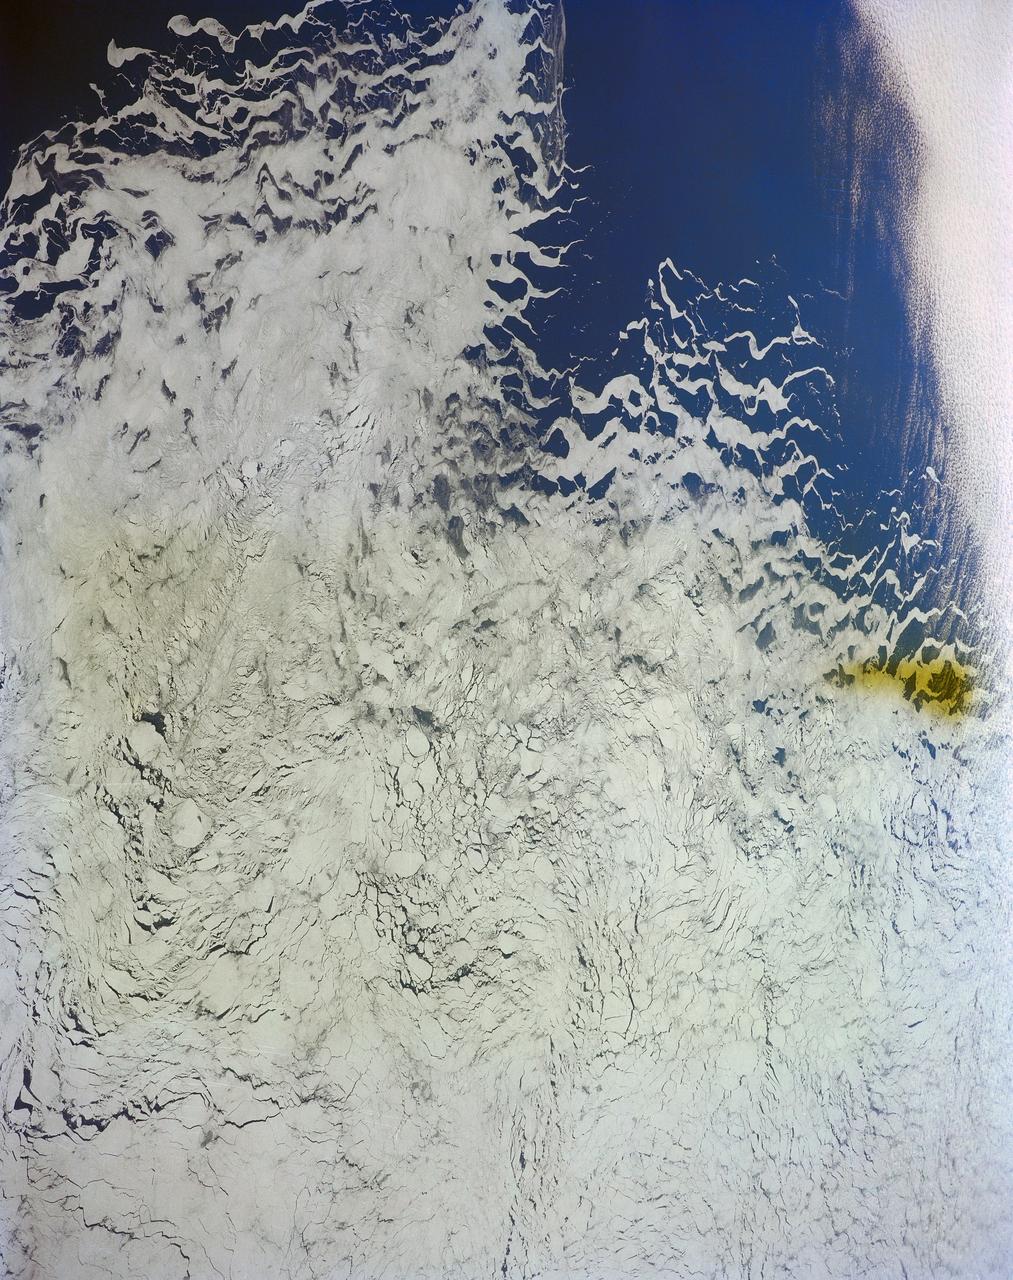
As the northern hemisphere experiences the heat of summer, ice moves and melts in the Arctic waters and the far northern lands surrounding it. The Moderate Resolution Imaging Spectroradiometer (MODIS) aboard NASA’s Aqua satellite captured this true-color image of sea ice off Greenland on July 16, 2015. Large chunks of melting sea ice can be seen in the sea ice off the coast, and to the south spirals of ice have been shaped by the winds and currents that move across the Greenland Sea. Along the Greenland coast, cold, fresh melt water from the glaciers flows out to the sea, as do newly calved icebergs. Frigid air from interior Greenland pushes the ice away from the shoreline, and the mixing of cold water and air allows some sea ice to be sustained even at the height of summer. According to observations from satellites, 2015 is on track to be another low year for arctic summer sea ice cover. The past ten years have included nine of the lowest ice extents on record. The annual minimum typically occurs in late August or early September. The amount of Arctic sea ice cover has been dropping as global temperatures rise. The Arctic is two to three times more sensitive to temperature changes as the Earth as a whole. Credit: NASA/GSFC/Jeff Schmaltz/MODIS Land Rapid Response Team <b><a href="http://www.nasa.gov/audience/formedia/features/MP_Photo_Guidelines.html" rel="nofollow">NASA image use policy.</a></b> <b><a href="http://www.nasa.gov/centers/goddard/home/index.html" rel="nofollow">NASA Goddard Space Flight Center</a></b> enables NASA’s mission through four scientific endeavors: Earth Science, Heliophysics, Solar System Exploration, and Astrophysics. Goddard plays a leading role in NASA’s accomplishments by contributing compelling scientific knowledge to advance the Agency’s mission. <b>Follow us on <a href="http://twitter.com/NASAGoddardPix" rel="nofollow">Twitter</a></b> <b>Like us on <a href="http://www.facebook.com/pages/Greenbelt-MD/NASA-Goddard/395013845897?ref=tsd" rel="nofollow">Facebook</a></b> <b>Find us on <a href="http://instagrid.me/nasagoddard/?vm=grid" rel="nofollow">Instagram</a></b>

In May 2014, two new studies concluded that a section of the land-based West Antarctic ice sheet had reached a point of inevitable collapse. Meanwhile, fresh observations from September 2014 showed sea ice around Antarctica had reached its greatest extent since the late 1970s. To better understand such dynamic and dramatic differences in the region's land and sea ice, researchers are travelling south to Antarctica this month for the sixth campaign of NASA’s Operation IceBridge. The airborne campaign, which also flies each year over Greenland, makes annual surveys of the ice with instrumented research aircraft. Instruments range from lasers that map the elevation of the ice surface, radars that "see" below it, and downward looking cameras to provide a natural-color perspective. The Digital Mapping System (DMS) camera acquired the above photo during the mission’s first science flight on October 16, 2009. At the time of the image, the DC-8 aircraft was flying at an altitude of 515 meters (1,700 feet) over heavily compacted first-year sea ice along the edge of the Amundsen Sea. Since that first flight, much has been gleaned from IceBridge data. For example, images from an IceBridge flight in October 2011 revealed a massive crack running about 29 kilometers (18 miles) across the floating tongue of Antarctica's Pine Island Glacier. The crack ultimately led to a 725-square-kilometer (280-square-mile) iceberg. In 2012, IceBridge data was a key part of a new map of Antarctica called Bedmap2. By combining surface elevation, ice thickness, and bedrock topography, Bedmap2 gives a clearer picture of Antarctica from the ice surface down to the land surface. Discoveries have been made in Greenland, too, including the identification of a 740-kilometer-long (460-mile-long) mega canyon below the ice sheet. Repeated measurements of land and sea ice from aircraft extend the record of observations once made by NASA’s Ice, Cloud, and Land Elevation Satellite, or ICESat, which stopped functioning in 2009. In addition to extending the ICESat record, IceBridge also sets the stage for ICESat-2, which is scheduled for launch in 2017. Credit: IceBridge DMS L0 Raw Imagery courtesy of the Digital Mapping System (DMS) team/NASA DAAC at the National Snow and Ice Data Center More info: <a href="http://earthobservatory.nasa.gov/IOTD/view.php?id=84549" rel="nofollow">earthobservatory.nasa.gov/IOTD/view.php?id=84549</a> <a href="http://earthobservatory.nasa.gov/IOTD/view.php?id=84549" rel="nofollow">earthobservatory.nasa.gov/IOTD/view.php?id=84549</a>

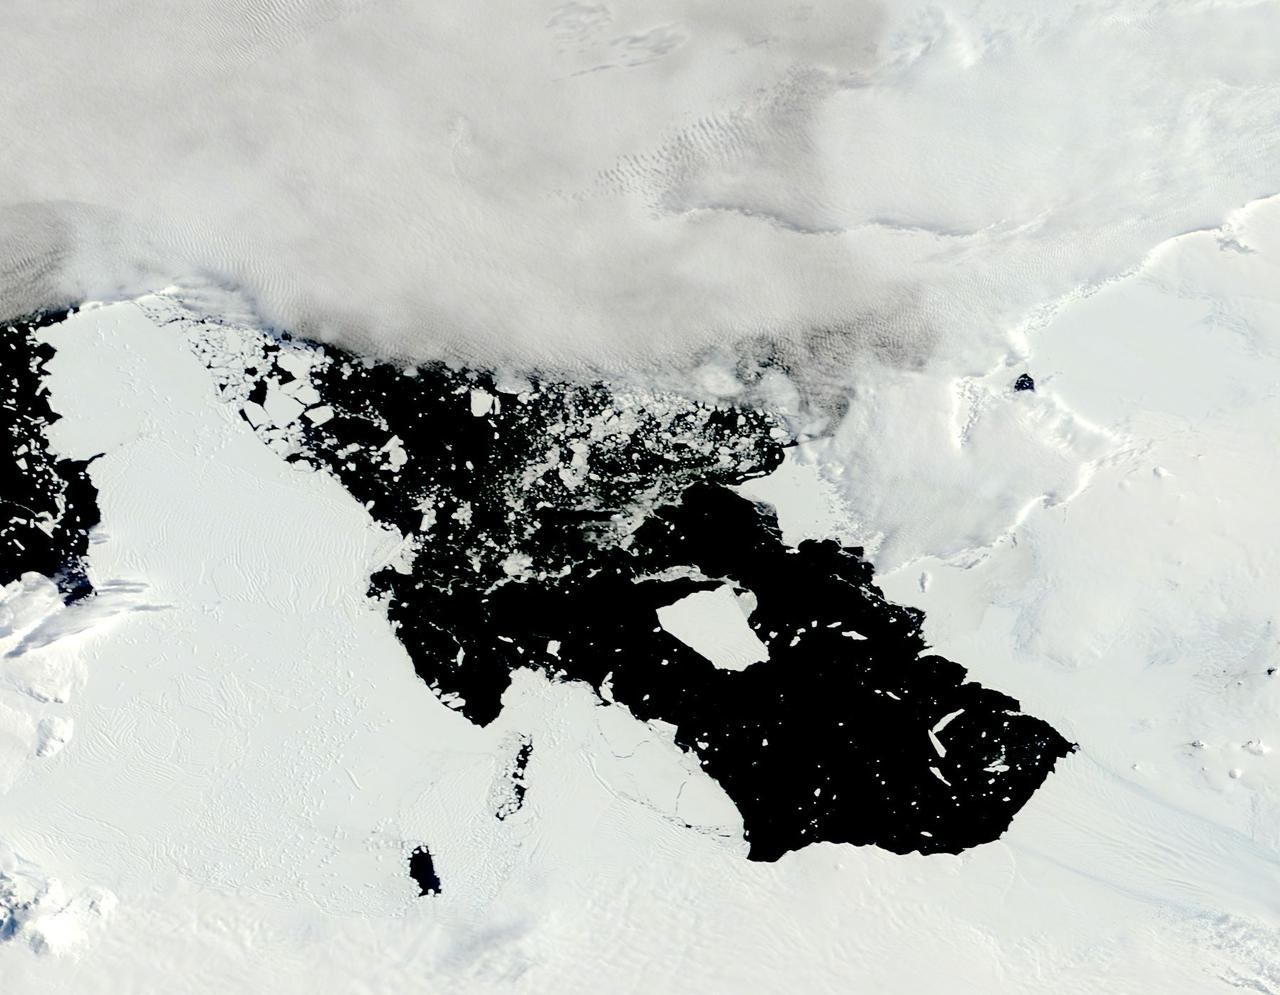
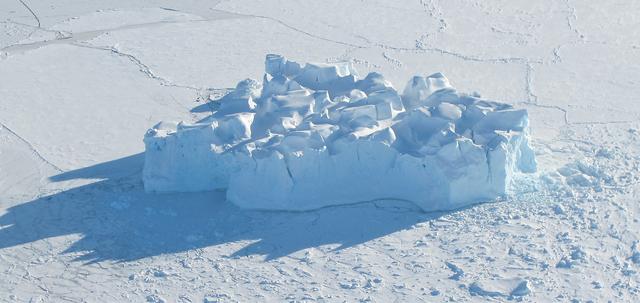
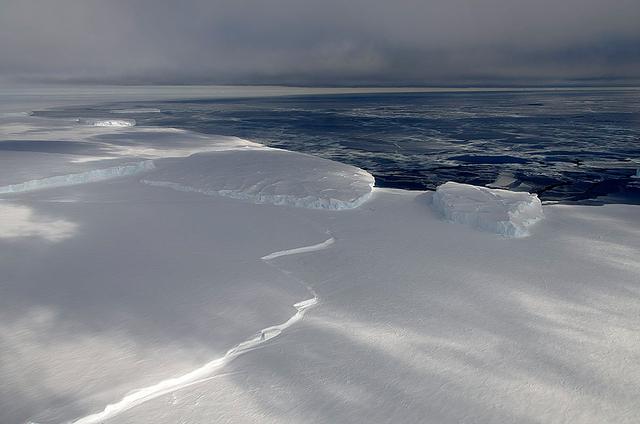
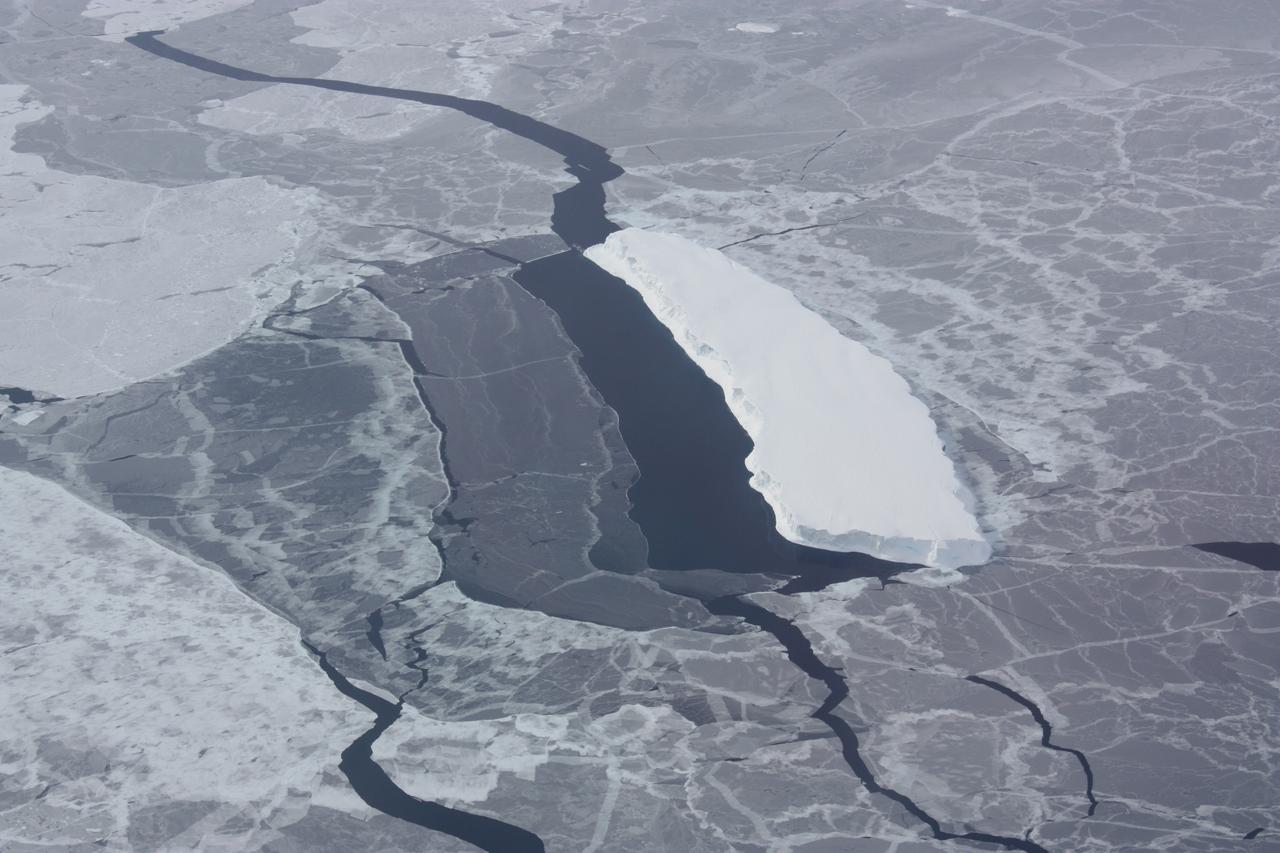
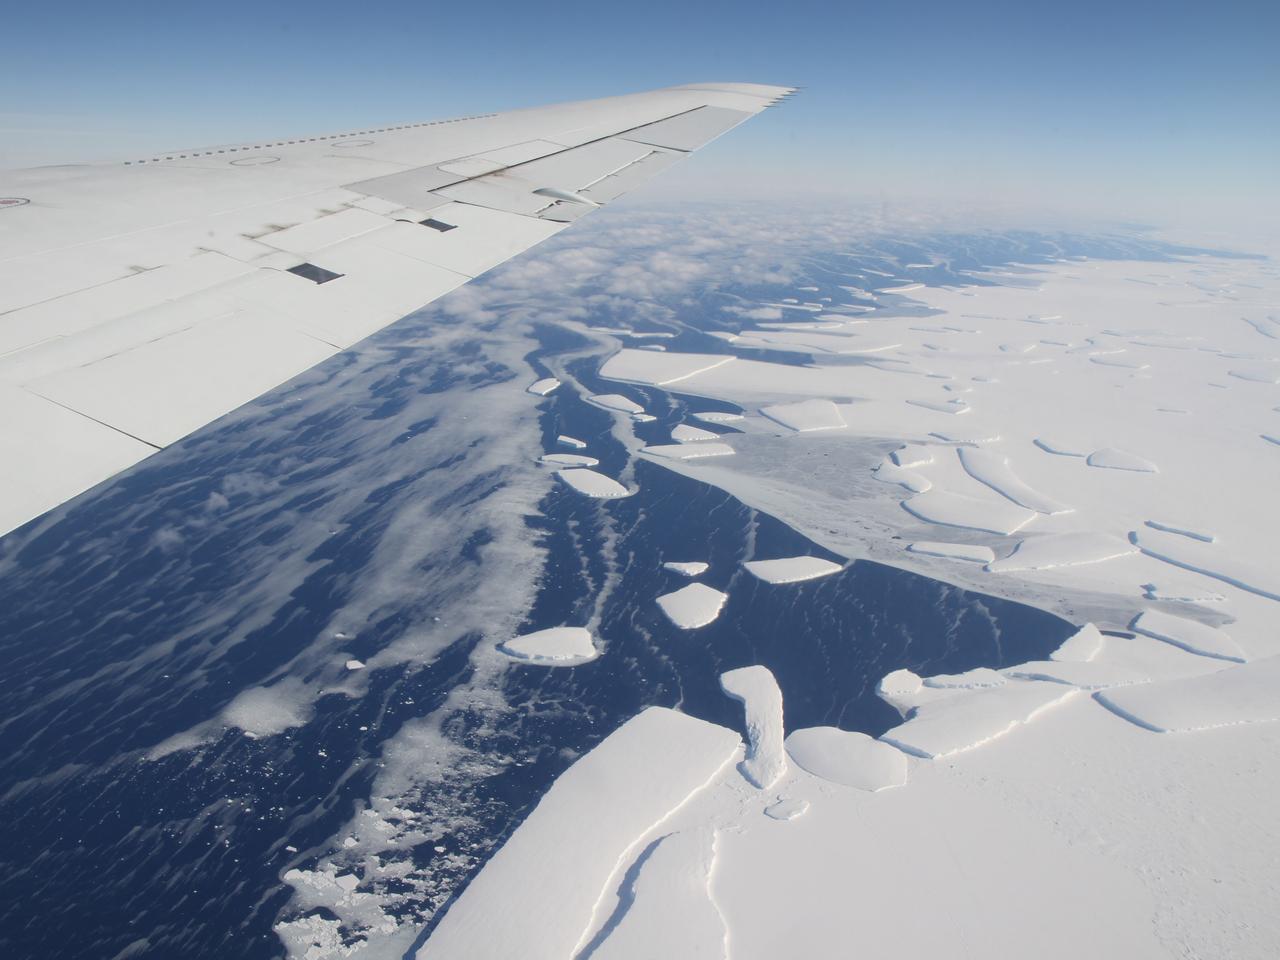
Antarctica—the continent at the southernmost reach of the planet—is fringed by cold, often frozen waters of the Southern Ocean. The extent of sea ice around the continent typically reaches a peak in September and a minimum in February. The photograph above shows Antarctic sea ice on November 5, 2014, during the annual cycle of melt. The image was acquired by the Digital Mapping System (DMS), a digital camera installed in the belly of research aircraft to capture images of terrain below. In this case, the system flew on the DC-8 during a flight as part of NASA’s Operation IceBridge. Most of the view shows first-year sea ice in the Bellingshausen Sea, as it appeared from an altitude of 328 meters (1,076 feet). The block of ice on the right side of the image is older, thicker, and was once attached to the Antarctic Ice Sheet. By the time this image was acquired, however, the ice had broken away to form an iceberg. Given its close proximity to the ice sheet, this could have been a relatively new berg. Read more: <a href="http://earthobservatory.nasa.gov/IOTD/view.php?id=86721" rel="nofollow">earthobservatory.nasa.gov/IOTD/view.php?id=86721</a> Credit: NASA/Goddard/IceBridge DMS L0 Raw Imagery courtesy of the Digital Mapping System (DMS) team and the NASA DAAC at the National Snow and Ice Data Center Credit: <b><a href="http://www.earthobservatory.nasa.gov/" rel="nofollow"> NASA Earth Observatory</a></b> <b><a href="http://www.nasa.gov/audience/formedia/features/MP_Photo_Guidelines.html" rel="nofollow">NASA image use policy.</a></b> <b><a href="http://www.nasa.gov/centers/goddard/home/index.html" rel="nofollow">NASA Goddard Space Flight Center</a></b> enables NASA’s mission through four scientific endeavors: Earth Science, Heliophysics, Solar System Exploration, and Astrophysics. Goddard plays a leading role in NASA’s accomplishments by contributing compelling scientific knowledge to advance the Agency’s mission. <b>Follow us on <a href="http://twitter.com/NASAGoddardPix" rel="nofollow">Twitter</a></b> <b>Like us on <a href="http://www.facebook.com/pages/Greenbelt-MD/NASA-Goddard/395013845897?ref=tsd" rel="nofollow">Facebook</a></b> <b>Find us on <a href="http://instagrid.me/nasagoddard/?vm=grid" rel="nofollow">Instagram</a></b>
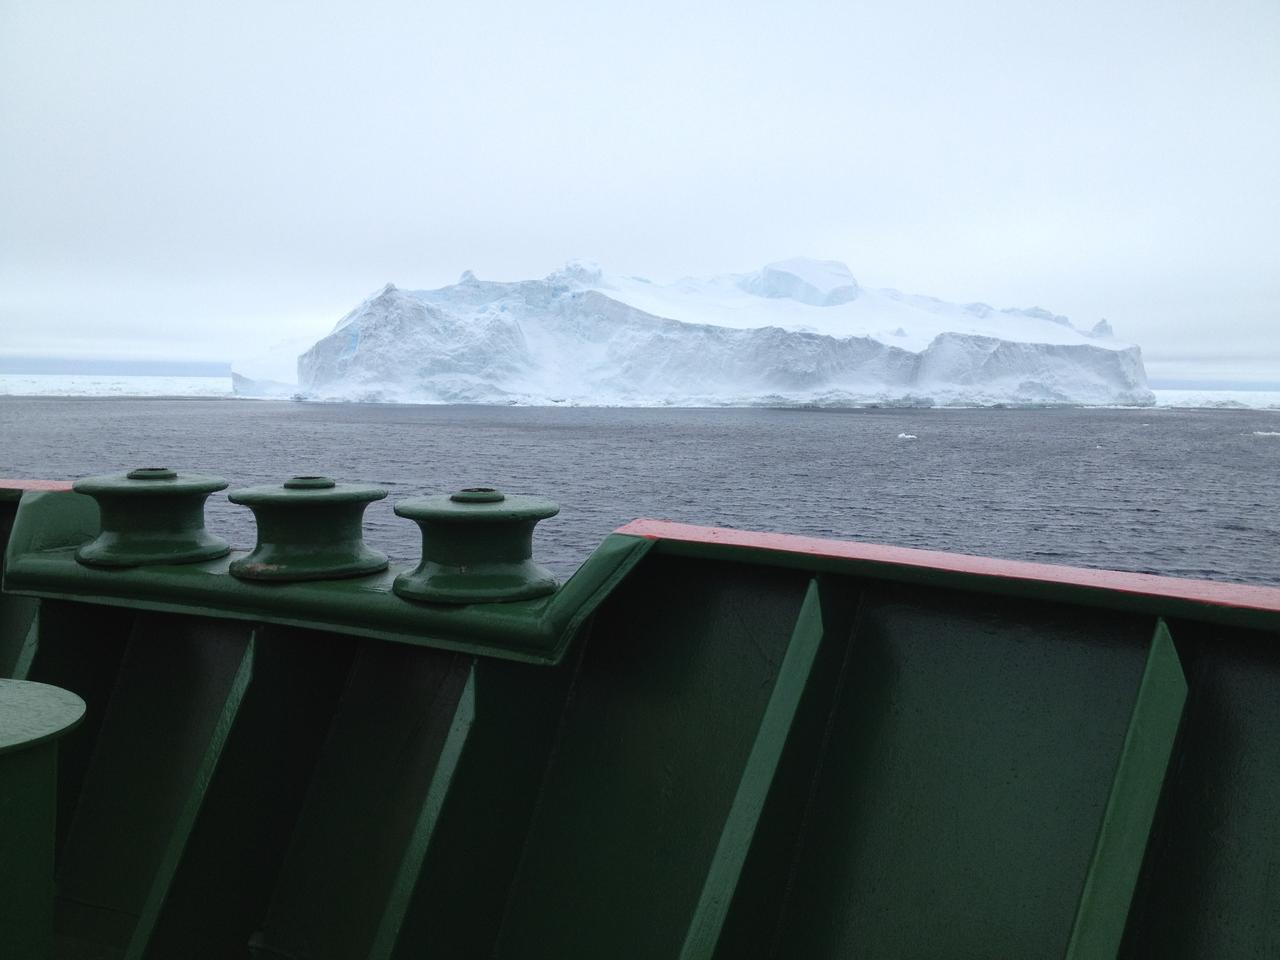
An iceberg as viewed from the bow of the RRS Ernest Shackleton a few days before the BARREL team reached Halley Research Station in Antarctica. This research vessel regularly carries scientists and supplies to Halley. Credit: NASA --- In Antarctica in January, 2013 – the summer at the South Pole – scientists launched 20 balloons up into the air to study an enduring mystery of space weather: when the giant radiation belts surrounding Earth lose material, where do the extra particles actually go? The mission is called BARREL (Balloon Array for Radiation belt Relativistic Electron Losses) and it is led by physicist Robyn Millan of Dartmouth College in Hanover, NH. Millan provided photographs from the team’s time in Antarctica. The team launched a balloon every day or two into the circumpolar winds that circulate around the pole. Each balloon floated for anywhere from 3 to 40 days, measuring X-rays produced by fast-moving electrons high up in the atmosphere. BARREL works hand in hand with another NASA mission called the Van Allen Probes, which travels through the Van Allen radiation belts surrounding Earth. The belts wax and wane over time in response to incoming energy and material from the sun, sometimes intensifying the radiation through which satellites must travel. Scientists wish to understand this process better, and even provide forecasts of this space weather, in order to protect our spacecraft. As the Van Allen Probes were observing what was happening in the belts, BARREL tracked electrons that precipitated out of the belts and hurtled down Earth’s magnetic field lines toward the poles. By comparing data, scientists will be able to track how what’s happening in the belts correlates to the loss of particles – information that can help us understand this mysterious, dynamic region that can impact spacecraft. Having launched balloons in early 2013, the team is back at home building the next set of payloads. They will launch 20 more balloons in 2014. <b><a href="http://www.nasa.gov/audience/formedia/features/MP_Photo_Guidelines.html" rel="nofollow">NASA image use policy.</a></b> <b><a href="http://www.nasa.gov/centers/goddard/home/index.html" rel="nofollow">NASA Goddard Space Flight Center</a></b> enables NASA’s mission through four scientific endeavors: Earth Science, Heliophysics, Solar System Exploration, and Astrophysics. Goddard plays a leading role in NASA’s accomplishments by contributing compelling scientific knowledge to advance the Agency’s mission. <b>Follow us on <a href="http://twitter.com/NASA_GoddardPix" rel="nofollow">Twitter</a></b> <b>Like us on <a href="http://www.facebook.com/pages/Greenbelt-MD/NASA-Goddard/395013845897?ref=tsd" rel="nofollow">Facebook</a></b> <b>Find us on <a href="http://instagram.com/nasagoddard?vm=grid" rel="nofollow">Instagram</a></b>
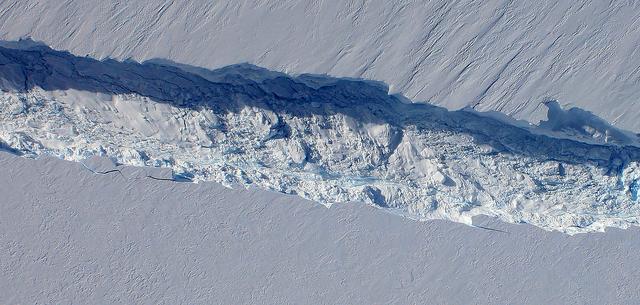
A close-up image of the crack spreading across the ice shelf of Pine Island Glacier shows the details of the boulder-like blocks of ice that fell into the rift when it split. For most of the 18-mile stretch of the crack that NASA’s DC-8 flew over on Oct. 26, 2011, it stretched about 240 feet wide, as roughly seen here. The deepest points ranged from about 165 to 190 feet, roughly equal to the top of the ice shelf down to sea level. Scientists expect the crack to propagate and the ice shelf to calve an iceberg of more than 300 square miles in the coming months. This image was captured by the Digital Mapping System (DMS) aboard the DC-8. Credit: NASA/DMS NASA's Operation IceBridge returns to a base camp of Punta Arenas, Chile for the third year of flights over Antarctica's changing sea ice, glaciers and ice sheets. NASA's DC-8, outfitted with seven remote-sensing instruments, and a Gulfstream 5 operated by the National Science Foundation and National Center for Atmospheric Research and outfitted with a high-altitude laser-ranging mapper, will fly from Chile over Antarctica in October and November. The mission is designed to record changes to Antarctica's ice sheets and give scientists insight into what is driving those changes. Follow the progress of the mission: Campaign News site: <a href="http://www.nasa.gov/mission_pages/icebridge/index.html" rel="nofollow">www.nasa.gov/mission_pages/icebridge/index.html</a> IceBridge blog: <a href="http://blogs.nasa.gov/cm/newui/blog/viewpostlist.jsp?blogname=icebridge" rel="nofollow">blogs.nasa.gov/cm/newui/blog/viewpostlist.jsp?blogname=ic...</a> Twitter: @nasa_ice <b><a href="http://www.nasa.gov/audience/formedia/features/MP_Photo_Guidelines.html" rel="nofollow">NASA image use policy.</a></b> <b><a href="http://www.nasa.gov/centers/goddard/home/index.html" rel="nofollow">NASA Goddard Space Flight Center</a></b> enables NASA’s mission through four scientific endeavors: Earth Science, Heliophysics, Solar System Exploration, and Astrophysics. Goddard plays a leading role in NASA’s accomplishments by contributing compelling scientific knowledge to advance the Agency’s mission. <b>Follow us on <a href="http://twitter.com/NASA_GoddardPix" rel="nofollow">Twitter</a></b> <b>Like us on <a href="http://www.facebook.com/pages/Greenbelt-MD/NASA-Goddard/395013845897?ref=tsd" rel="nofollow">Facebook</a></b> <b>Find us on <a href="http://instagrid.me/nasagoddard/?vm=grid" rel="nofollow">Instagram</a></b>
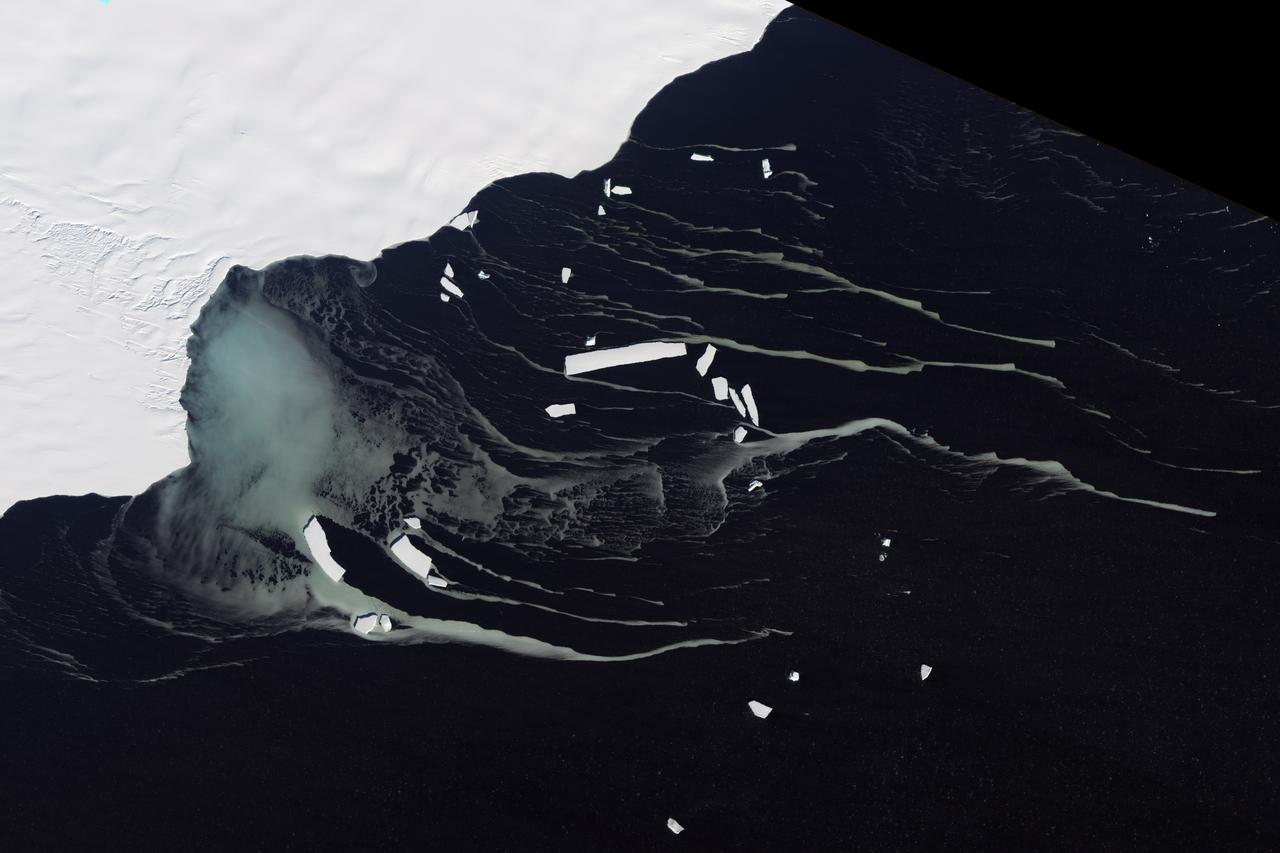
Off the northeastern edge of Antarctica’s Amery Ice Shelf lies Mackenzie Bay, which was painted with a ghostly blue-green mass in early February 2012. Similarly colored tendrils also streamed northward across the ocean, their flow sometimes interrupted by icebergs. Multiple factors might account for the ghostly shapes, including low-lying clouds or katabatic winds—downslope winds blowing toward the coast, which can freeze the water at the ocean surface. But an intriguing and perhaps more likely explanation involves processes occurring below the ice shelf. An ice shelf is a thick slab of ice often fed by glaciers attached to the coastline. The shelf floats on the ocean surface, with seawater circulating underneath. Like most ice shelves, the Amery is very thick in the upstream area near the shore. It thins significantly as it stretches northward away from the continent. Water at depth is subject to much greater pressure than water at the surface, and one effect of this intense pressure is that it effectively lowers the freezing point. So water circulating at depth beneath the Amery Ice Shelf may be slightly below the temperature at which it would normally begin to freeze. As some that water wells up along the underbelly of the shelf, the pressure is reduced and the water begins to freeze even though the temperature may not change. As it freezes, this deep-ocean water forms needle-like crystals known as frazil. The crystals are only 3 to 4 millimeters (0.12 to 0.16 inches) wide, but a sufficient concentration of frazil can change the appearance of the water. A frazil-rich plume probably accounts for the blue-green waters off the Amery Ice Shelf in the image above. Modeling of ocean circulation beneath the shelf indicates just such a plume emerging in that location. Frazil-rich water explains the plume, and wind transport of the surface water explains the long streams extending northward. As the sub-iceshelf water mixes with surface water around the Antarctic coastline, the frazil is gradually melted and the streams disappear. The Advanced Land Imager (ALI) on NASA’s Earth Observing-1 (EO-1) satellite captured this natural-color image of Mackenzie Bay and the ice shelf on February 12, 2012. NASA Earth Observatory image created by Jesse Allen and Robert Simmon, using EO-1 ALI data provided courtesy of the NASA EO-1 team. Caption by Michon Scott with information from Helen A. Fricker, Scripps Institution of Oceanography; Robert Massom, Australian Antarctic Division; Ben Galton-Fenzi, University of Tasmania, Australia; and Florence Fetterer, Walt Meier, and Ted Scambos, National Snow and Ice Data Center. Credit: <b><a href="http://www.earthobservatory.nasa.gov/" rel="nofollow"> NASA Earth Observatory</a></b> <b><a href="http://www.nasa.gov/audience/formedia/features/MP_Photo_Guidelines.html" rel="nofollow">NASA image use policy.</a></b> <b><a href="http://www.nasa.gov/centers/goddard/home/index.html" rel="nofollow">NASA Goddard Space Flight Center</a></b> enables NASA’s mission through four scientific endeavors: Earth Science, Heliophysics, Solar System Exploration, and Astrophysics. Goddard plays a leading role in NASA’s accomplishments by contributing compelling scientific knowledge to advance the Agency’s mission. <b>Follow us on <a href="http://twitter.com/NASA_GoddardPix" rel="nofollow">Twitter</a></b> <b>Like us on <a href="http://www.facebook.com/pages/Greenbelt-MD/NASA-Goddard/395013845897?ref=tsd" rel="nofollow">Facebook</a></b> <b>Find us on <a href="http://instagrid.me/nasagoddard/?vm=grid" rel="nofollow">Instagram</a></b> Instrument: EO-1 - ALI