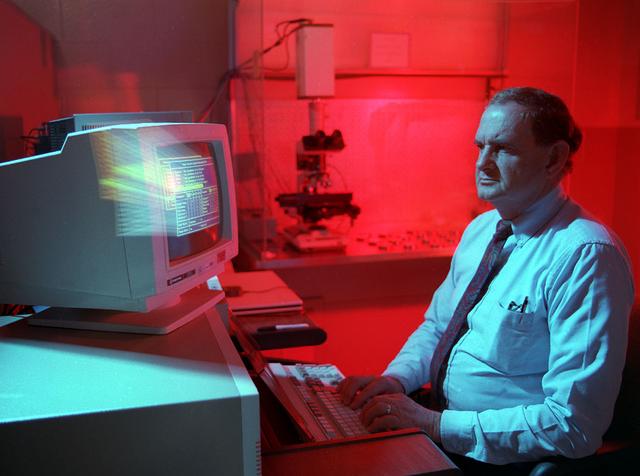
A NASA scientist operates the image analyzer to determine if telescope mirrors have become contaminated in the Materials and Processes lab at Marshall.
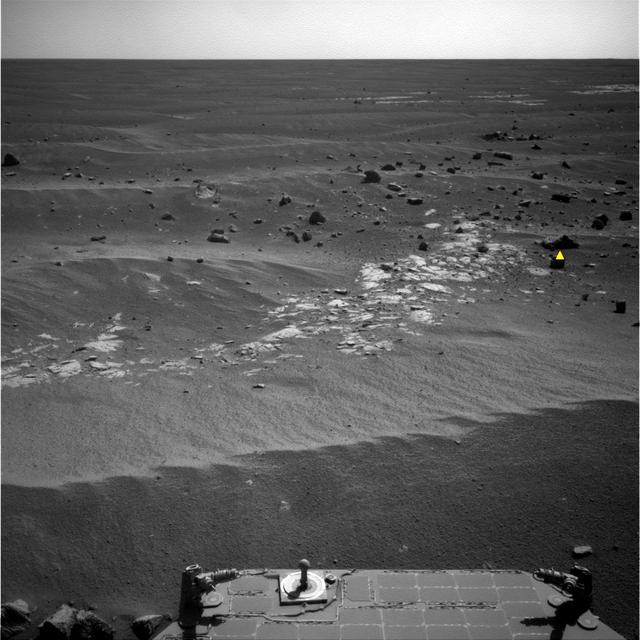
NASA Opportunity used newly developed and uploaded software called AEGIS, to analyze images to identify features that best matched criteria for selecting an observation target; the criteria in this image -- rocks that are larger and darker than others.
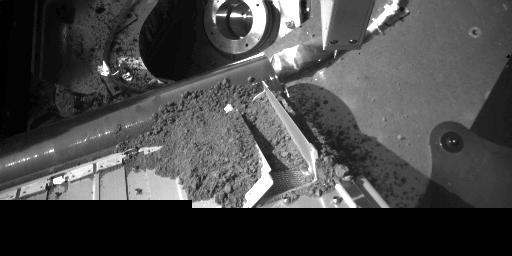
Robotic Arm Camera Image of the South Side of the Thermal and Evolved-Gas Analyzer Door TA4 receiving sample
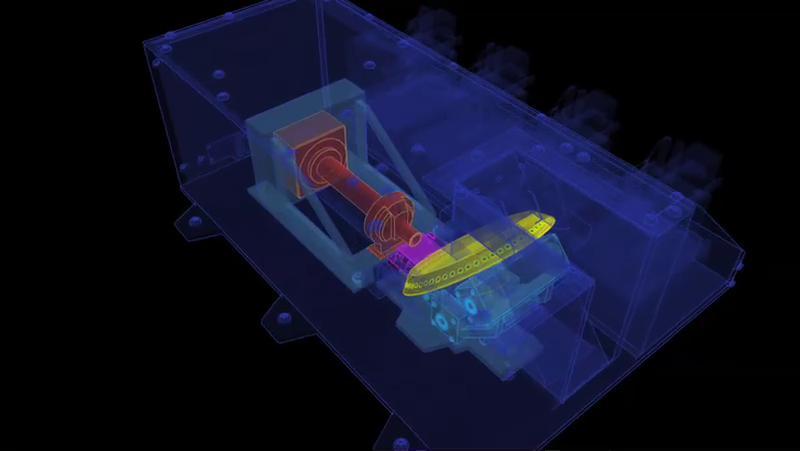
This image shows NASA Phoenix Lander Robotic Arm scoop delivering a sample to the Thermal and Evolved-Gas Analyzer TEGA and how samples are analyzed within the instrument.
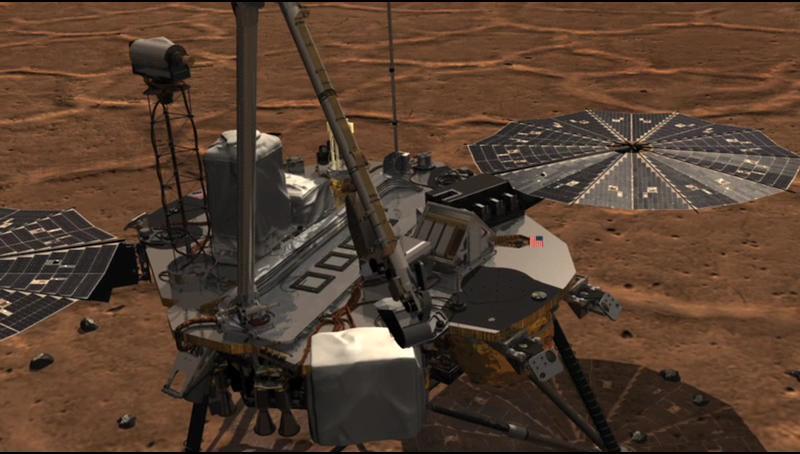
This image shows the workings of the microscope station of the Microscopy, Electrochemistry and Conductivity Analyzer MECA instrument suite of NASA Phoenix Mars Lander.
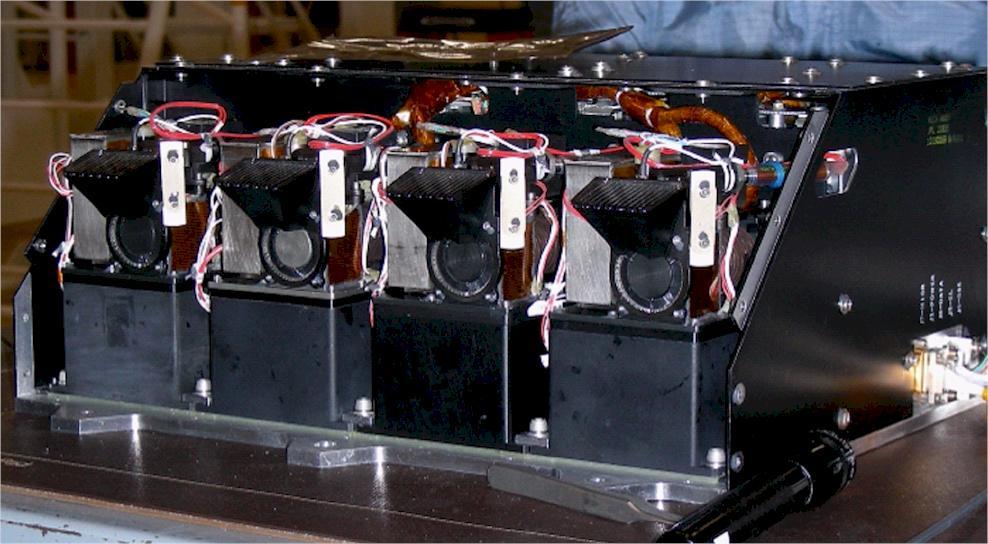
This image shows four Wet Chemistry Laboratory units, part of the Microscopy, Electrochemistry, and Conductivity Analyzer MECA instrument on board NASA Phoenix Mars Lander. This image was taken before Phoenix launch on August 4, 2007.
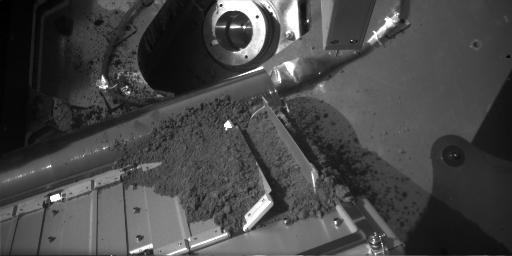
This image shows a sample of Martian soil resting on a screen over the opening to one of the eight ovens of the Thermal and Evolved-Gas Analyzer instrument TEGA on NASA Phoenix Mars Lander.
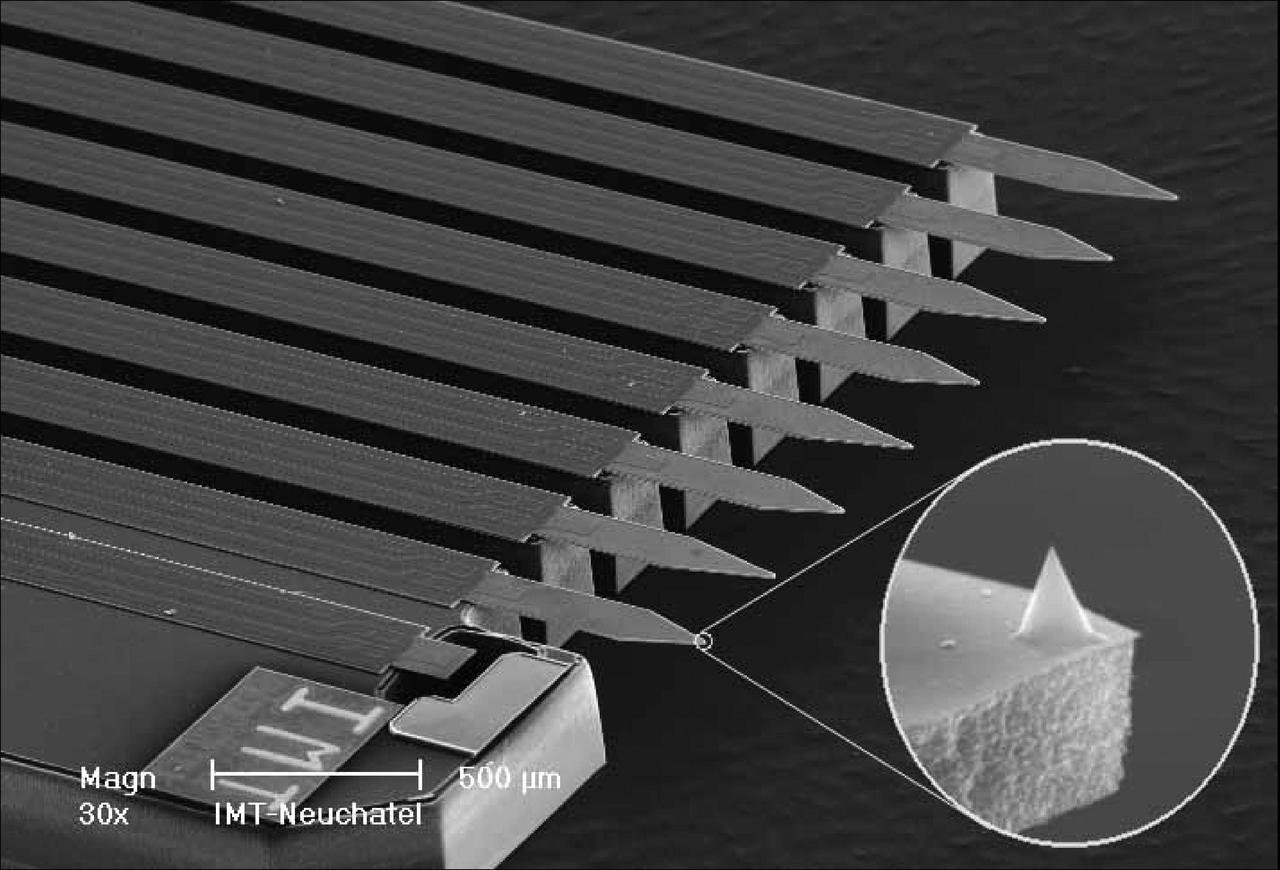
This image shows the eight sharp tips of the NASA Phoenix Mars Lander Atomic Force Microscope, or AFM. The AFM is part of Phoenix Microscopy, Electrochemistry, and Conductivity Analyzer, or MECA.
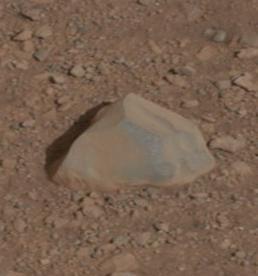
This close-up image shows the first target NASA Curiosity rover aims to zap with its Chemistry and Camera ChemCam instrument. The instrument will analyze that spark with a telescope and identify the chemical elements in the target.
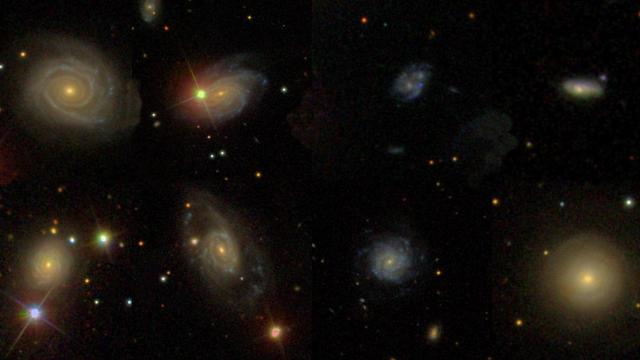
A new study analyzes several sites where dead stars once exploded. The explosions, called Type Ia supernovae, occurred within galaxies, six of which are shown in these images from the Sloan Digital Sky Survey.
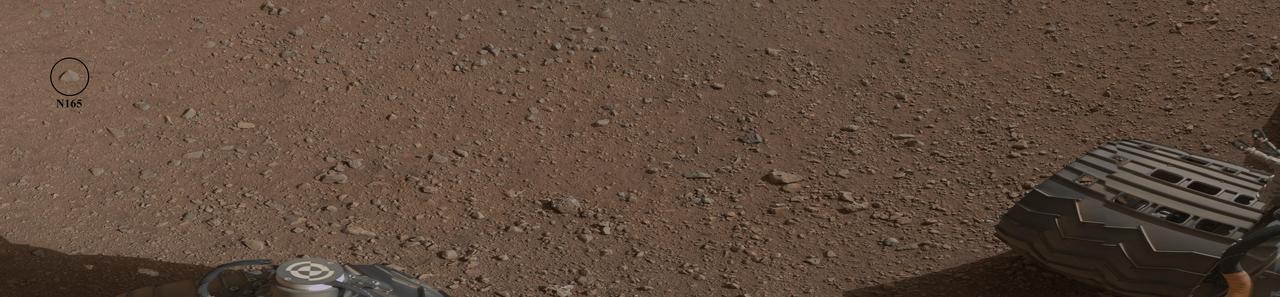
This mosaic image shows the first target NASA Curiosity rover aims to zap ChemCam instrument. ChemCam will be firing a laser at this rock, provisionally named N165, and analyzing the glowing, ionized gas, called plasma, that the laser excites.
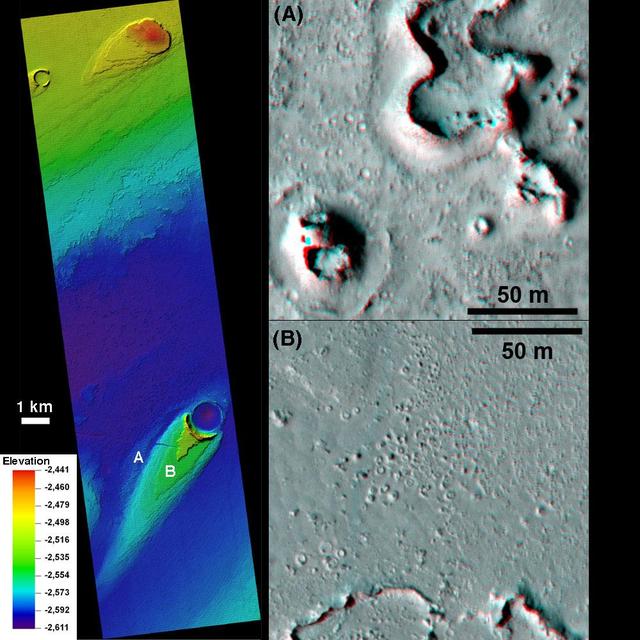
This combination of images, taken by NASA Mars Reconnaissance Orbiter, helped researchers analyze the youngest flood lava on Mars, which is in Athabasca Valles, in the Elysium Planitia region of equatorial Mars.
![KENNEDY SPACE CENTER, FLA. - These towers are part of one of the world’s highest performing visual film analysis systems, developed to review and analyze previous shuttle flight data in preparation for the shuttle fleet’s return to flight. The system is being used today for another purpose. NASA has permitted its use in helping to analyze a film that shows a recent kidnapping in progress in Florida. Developed by NASA, United Space Alliance (USA) and Silicon Graphics Inc., the system allows multiple-person collaboration, highly detailed manipulation and evaluation of specific imagery. The system is housed in the Image Analysis Facility inside the Vehicle Assembly Building. [Photo taken Aug. 15, 2003, courtesy of Terry Wallace, SGI ]](https://images-assets.nasa.gov/image/KSC-04pd0152/KSC-04pd0152~medium.jpg)
KENNEDY SPACE CENTER, FLA. - These towers are part of one of the world’s highest performing visual film analysis systems, developed to review and analyze previous shuttle flight data in preparation for the shuttle fleet’s return to flight. The system is being used today for another purpose. NASA has permitted its use in helping to analyze a film that shows a recent kidnapping in progress in Florida. Developed by NASA, United Space Alliance (USA) and Silicon Graphics Inc., the system allows multiple-person collaboration, highly detailed manipulation and evaluation of specific imagery. The system is housed in the Image Analysis Facility inside the Vehicle Assembly Building. [Photo taken Aug. 15, 2003, courtesy of Terry Wallace, SGI ]
![KENNEDY SPACE CENTER, FLA. - One of the world’s highest performing visual film analysis systems, developed to review and analyze previous shuttle flight data (shown here) in preparation for the shuttle fleet’s return to flight, is being used today for another purpose. NASA has permitted its use in helping to analyze a film that shows a recent kidnapping in progress in Florida. The system, developed by NASA, United Space Alliance (USA) and Silicon Graphics Inc., allows multiple-person collaboration, highly detailed manipulation and evaluation of specific imagery. The system is housed in the Image Analysis Facility inside the Vehicle Assembly Building. [Photo taken Aug. 15, 2003, courtesy of Terry Wallace, SGI ]](https://images-assets.nasa.gov/image/KSC-04pd0150/KSC-04pd0150~medium.jpg)
KENNEDY SPACE CENTER, FLA. - One of the world’s highest performing visual film analysis systems, developed to review and analyze previous shuttle flight data (shown here) in preparation for the shuttle fleet’s return to flight, is being used today for another purpose. NASA has permitted its use in helping to analyze a film that shows a recent kidnapping in progress in Florida. The system, developed by NASA, United Space Alliance (USA) and Silicon Graphics Inc., allows multiple-person collaboration, highly detailed manipulation and evaluation of specific imagery. The system is housed in the Image Analysis Facility inside the Vehicle Assembly Building. [Photo taken Aug. 15, 2003, courtesy of Terry Wallace, SGI ]
![KENNEDY SPACE CENTER, FLA. - One of the world’s highest performing visual film analysis systems, developed to review and analyze previous shuttle flight data (shown here) in preparation for the shuttle fleet’s return to flight, is being used today for another purpose. NASA has permitted its use in helping to analyze a film that shows a recent kidnapping in progress in Florida. The system, developed by NASA, United Space Alliance (USA) and Silicon Graphics Inc., allows multiple-person collaboration, highly detailed manipulation and evaluation of specific imagery. The system is housed in the Image Analysis Facility inside the Vehicle Assembly Building. [Photo taken Aug. 15, 2003, courtesy of Terry Wallace, SGI ]](https://images-assets.nasa.gov/image/KSC-04pd0151/KSC-04pd0151~medium.jpg)
KENNEDY SPACE CENTER, FLA. - One of the world’s highest performing visual film analysis systems, developed to review and analyze previous shuttle flight data (shown here) in preparation for the shuttle fleet’s return to flight, is being used today for another purpose. NASA has permitted its use in helping to analyze a film that shows a recent kidnapping in progress in Florida. The system, developed by NASA, United Space Alliance (USA) and Silicon Graphics Inc., allows multiple-person collaboration, highly detailed manipulation and evaluation of specific imagery. The system is housed in the Image Analysis Facility inside the Vehicle Assembly Building. [Photo taken Aug. 15, 2003, courtesy of Terry Wallace, SGI ]
![KENNEDY SPACE CENTER, FLA. - One of the world’s highest performing visual film analysis systems, developed to review and analyze previous shuttle flight data (shown here) in preparation for the shuttle fleet’s return to flight, is being used today for another purpose. NASA has permitted its use in helping to analyze a film that shows a recent kidnapping in progress in Florida. The system, developed by NASA, United Space Alliance (USA) and Silicon Graphics Inc., allows multiple-person collaboration, highly detailed manipulation and evaluation of specific imagery. The system is housed in the Image Analysis Facility inside the Vehicle Assembly Building. [Photo taken Aug. 15, 2003, courtesy of Terry Wallace, SGI ]](https://images-assets.nasa.gov/image/KSC-04pd0154/KSC-04pd0154~medium.jpg)
KENNEDY SPACE CENTER, FLA. - One of the world’s highest performing visual film analysis systems, developed to review and analyze previous shuttle flight data (shown here) in preparation for the shuttle fleet’s return to flight, is being used today for another purpose. NASA has permitted its use in helping to analyze a film that shows a recent kidnapping in progress in Florida. The system, developed by NASA, United Space Alliance (USA) and Silicon Graphics Inc., allows multiple-person collaboration, highly detailed manipulation and evaluation of specific imagery. The system is housed in the Image Analysis Facility inside the Vehicle Assembly Building. [Photo taken Aug. 15, 2003, courtesy of Terry Wallace, SGI ]
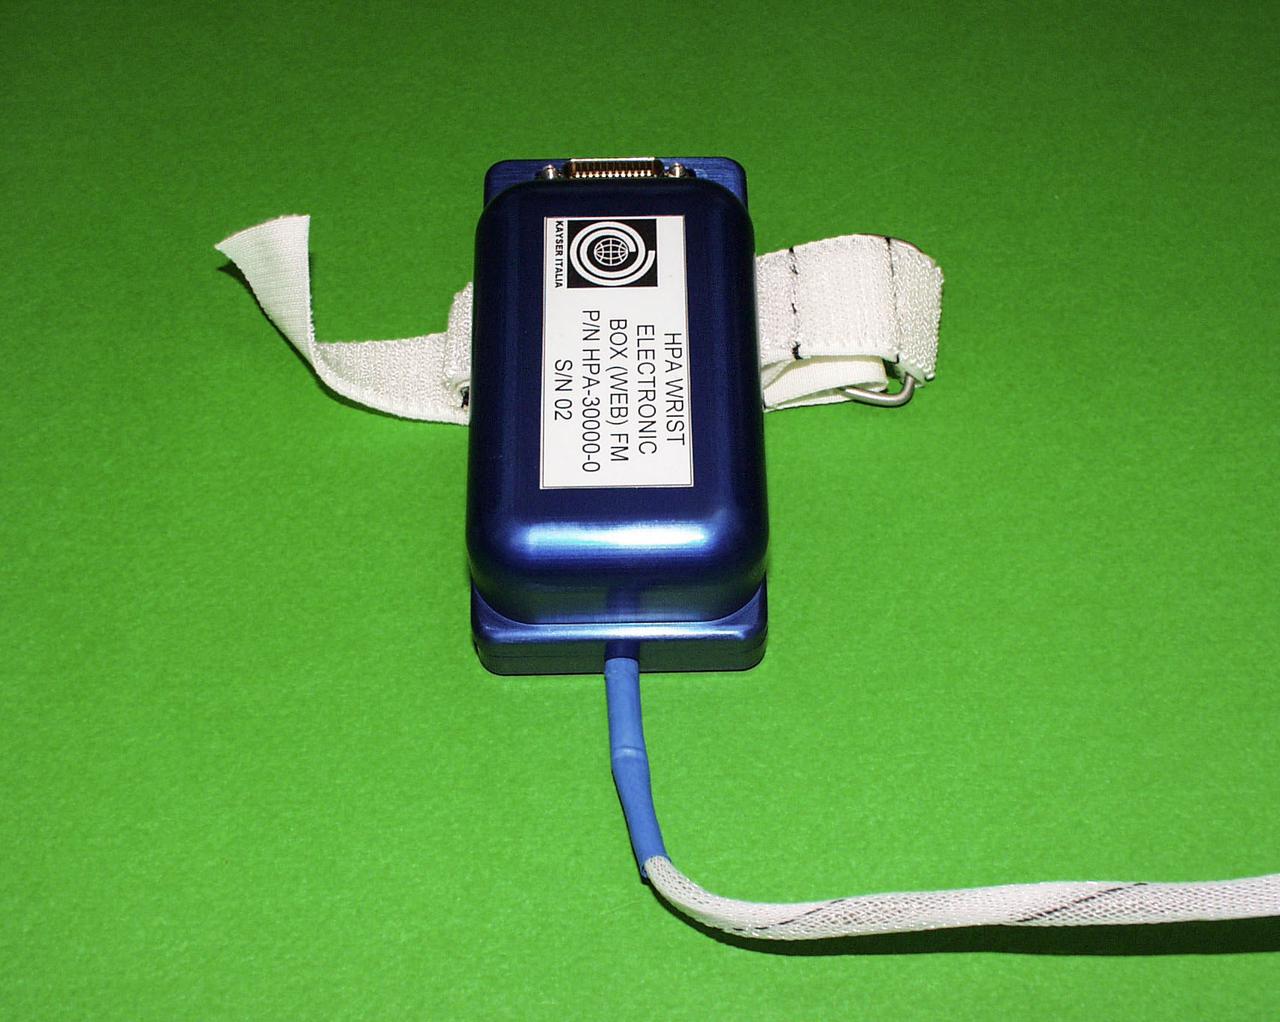
jsc2021e009418 (8/12/2002) --- A preflight view of theHand Posture Analyzer (HPA) Wrist Electronic Box (WEB). The Hand Posture Analyzer (HPA) facility helps to examine the way hand and arm muscles are used differently aboard the International Space Station (ISS). Image courtesy of the Italian Space Agency (ASI).
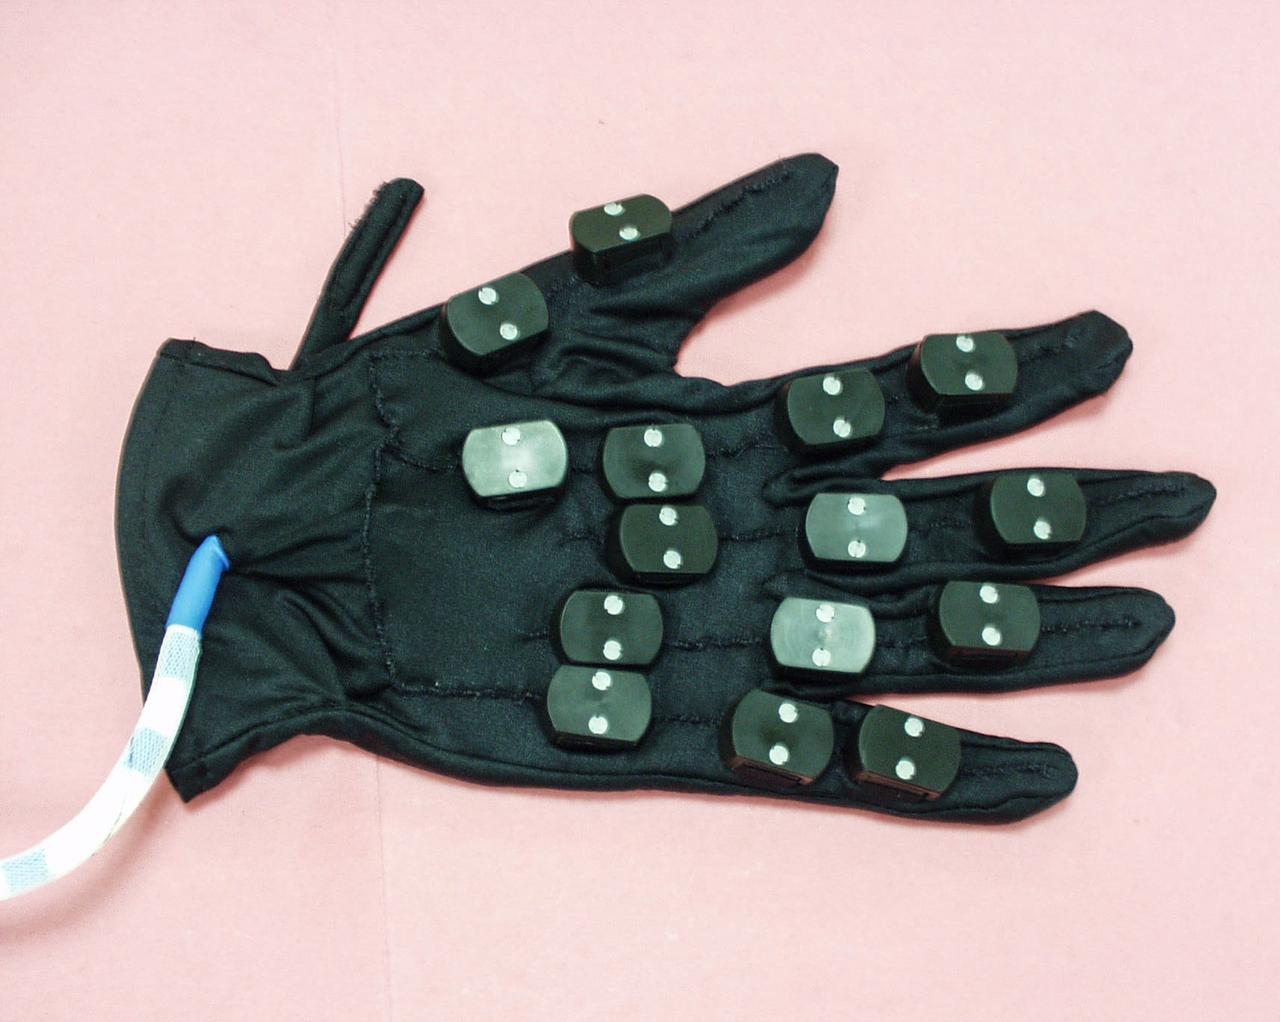
jsc2021e009416 (7/15/2002) --- A preflight view of the Hand Posture Analyzer (HPA) Posture Acquisition Glove (PAG). The Hand Posture Analyzer (HPA) facility helps to examine the way hand and arm muscles are used differently aboard the International Space Station (ISS). Image courtesy of the Italian Space Agency (ASI).
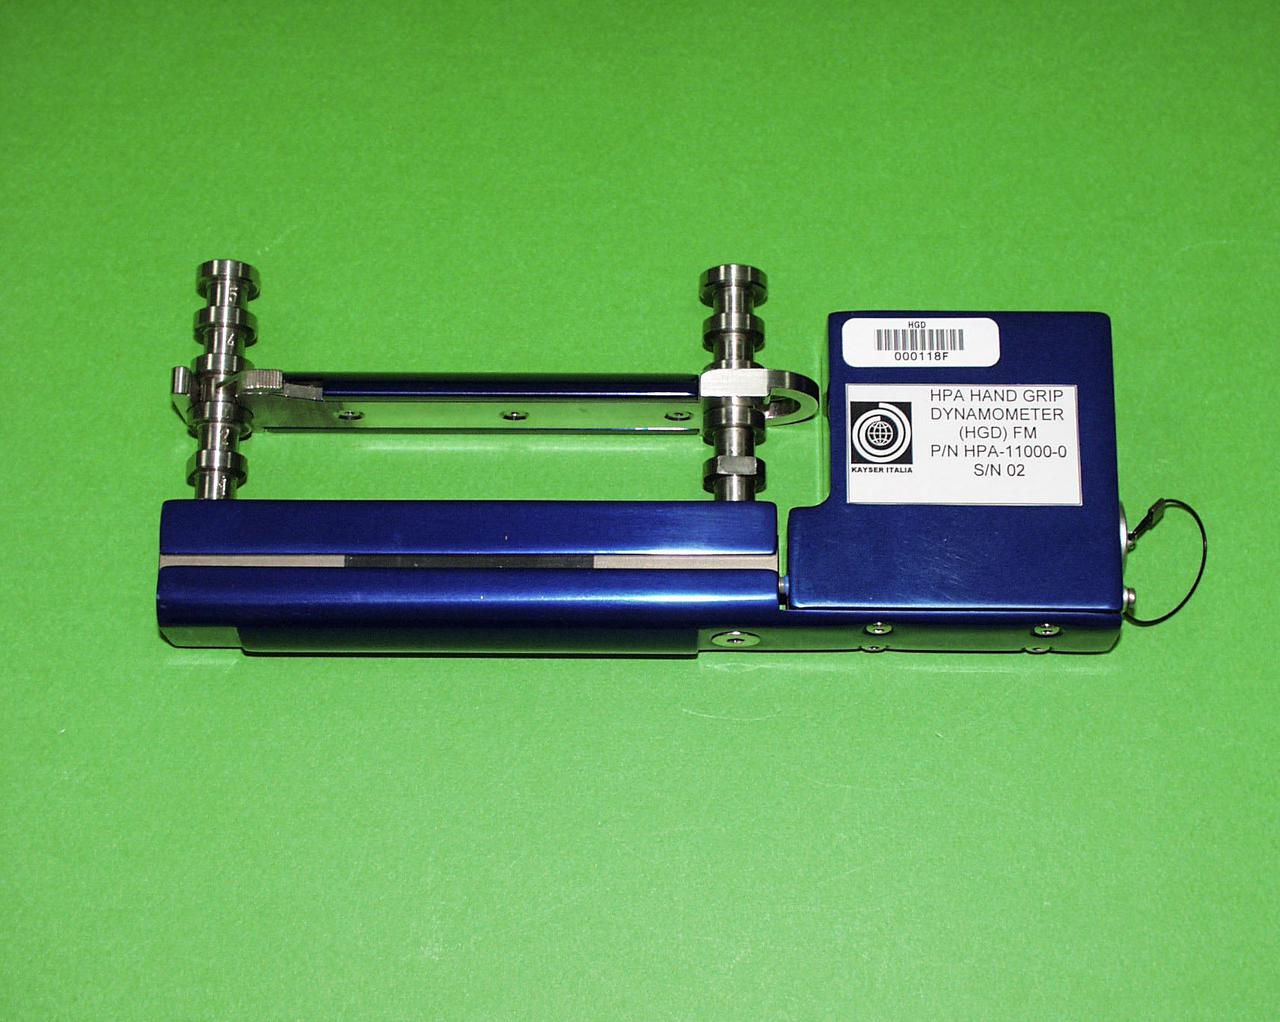
jsc2021e009414 (8/12/20020 --- A preflight view of theHand Posture Analyzer (HPA) Hand Grip Dynamometer (HGD). The Hand Posture Analyzer (HPA) facility helps to examine the way hand and arm muscles are used differently aboard the International Space Station (ISS). Image courtesy of the Italian Space Agency (ASI).
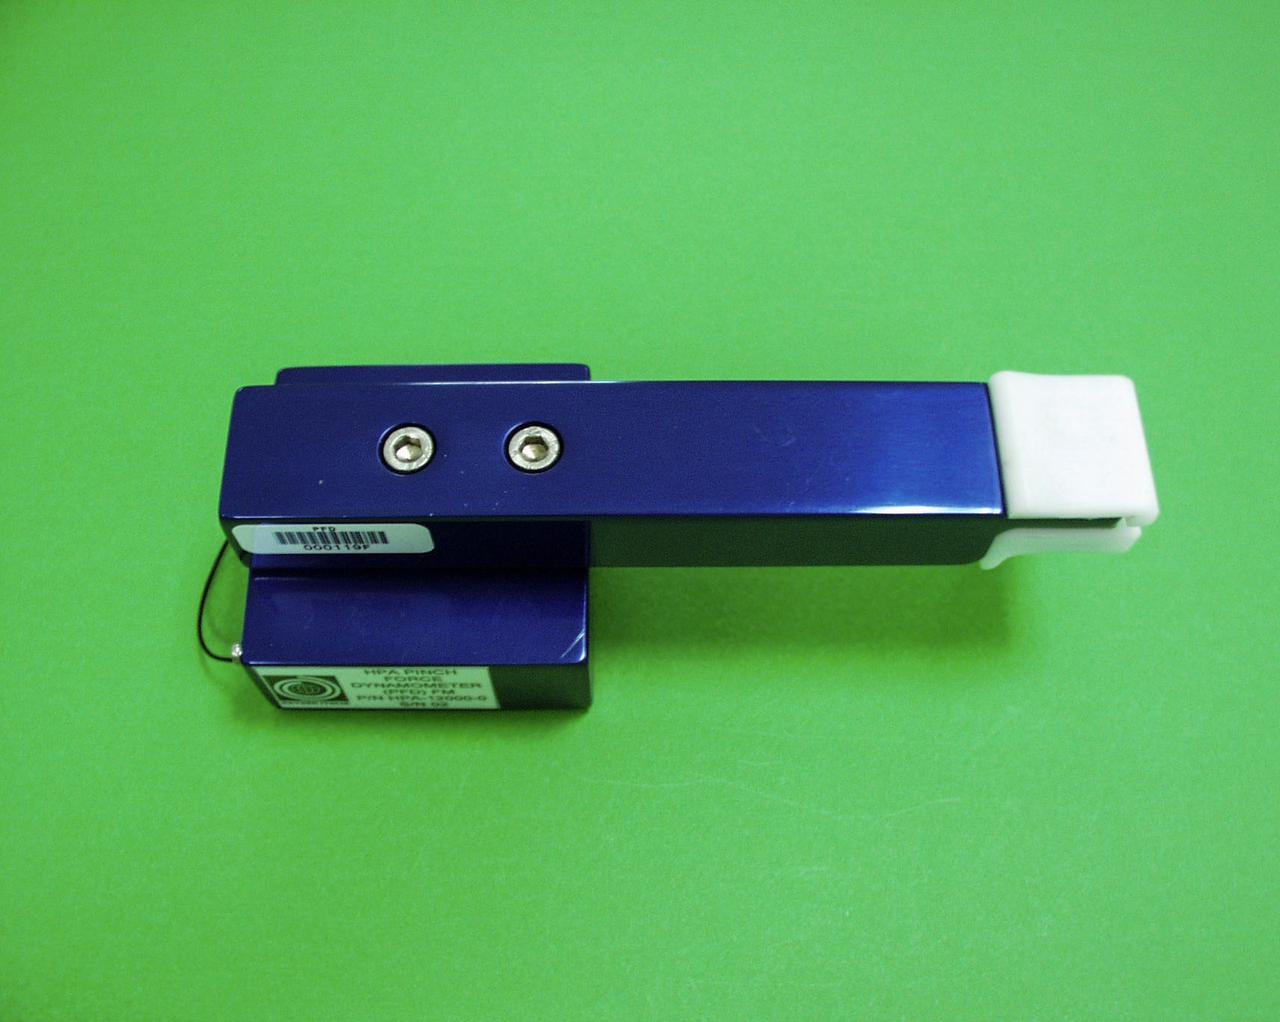
jsc2021e009417 (8/12/2002) --- A preflight view of the Hand Posture Analyzer (HPA) Pinch Force Dynamometer (PFD). The Hand Posture Analyzer (HPA) facility helps to examine the way hand and arm muscles are used differently aboard the International Space Station (ISS). Image courtesy of the Italian Space Agency (ASI).
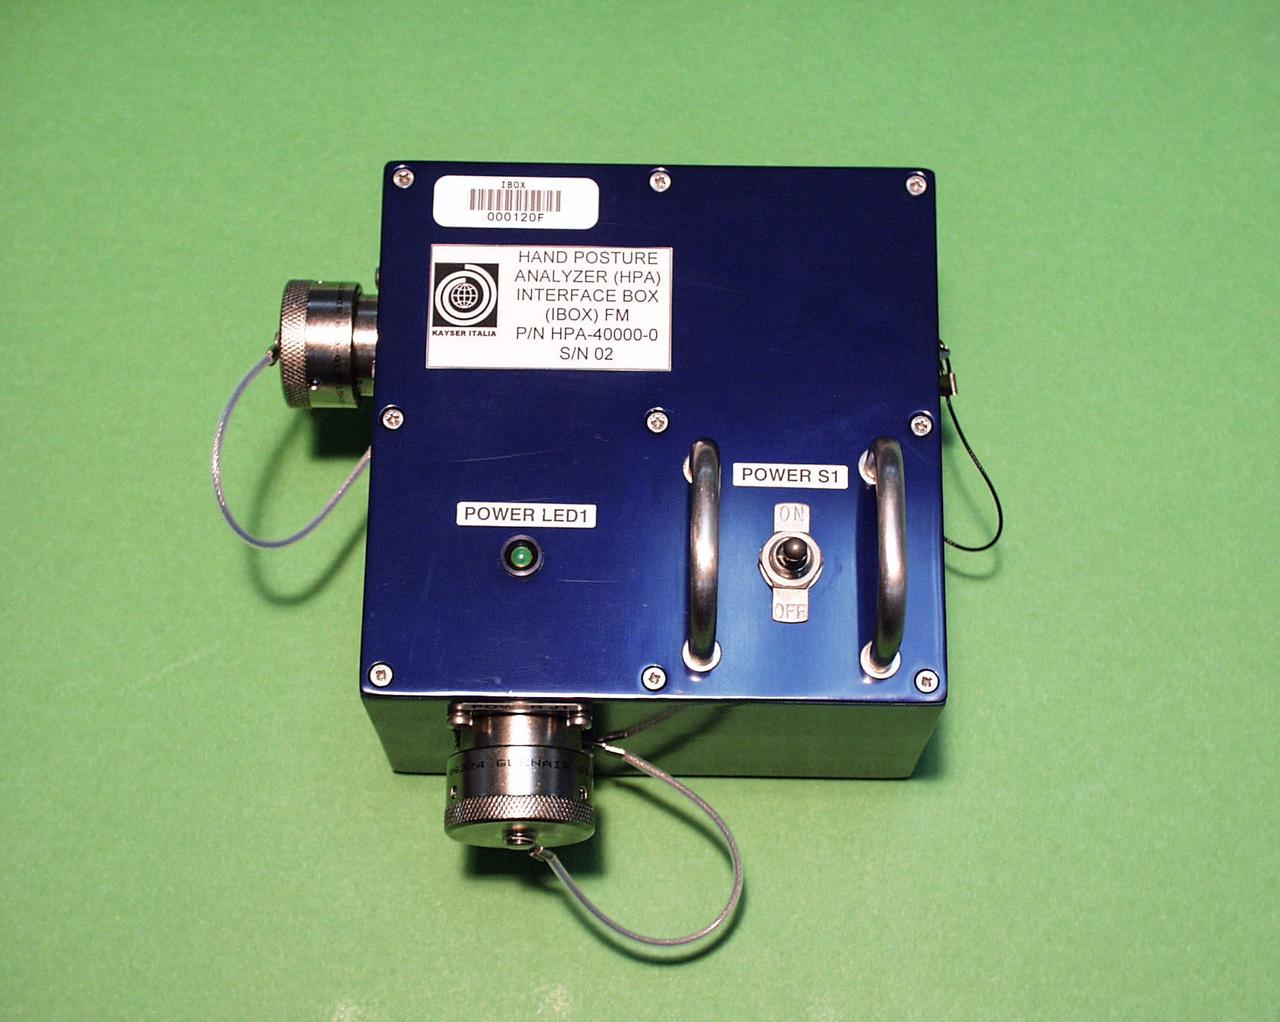
jsc2021e009415 (8/13/2002) --- A preflight view of the Hand Posture Analyzer (HPA) Interface Box (IBOX). The Hand Posture Analyzer (HPA) facility helps to examine the way hand and arm muscles are used differently aboard the International Space Station (ISS). Image courtesy of the Italian Space Agency (ASI).
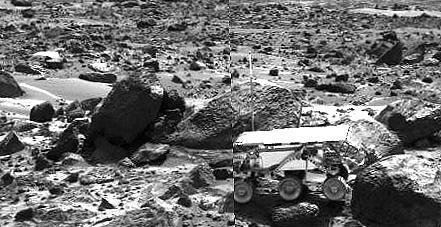
This image shows the Sojourner rover's Alpha Proton X-ray Spectrometer (APXS) deployed against the rock "Stimpy" on the afternoon of Sol 68 (September 11). The two rocks behind the rover were previously analyzed by the APXS. Sojourner spent 83 days of a planned seven-day mission exploring the Martian terrain, acquiring images, and taking chemical, atmospheric and other measurements. The final data transmission received from Pathfinder was at 10:23 UTC on September 27, 1997. Although mission managers tried to restore full communications during the following five months, the successful mission was terminated on March 10, 1998. http://photojournal.jpl.nasa.gov/catalog/PIA01563
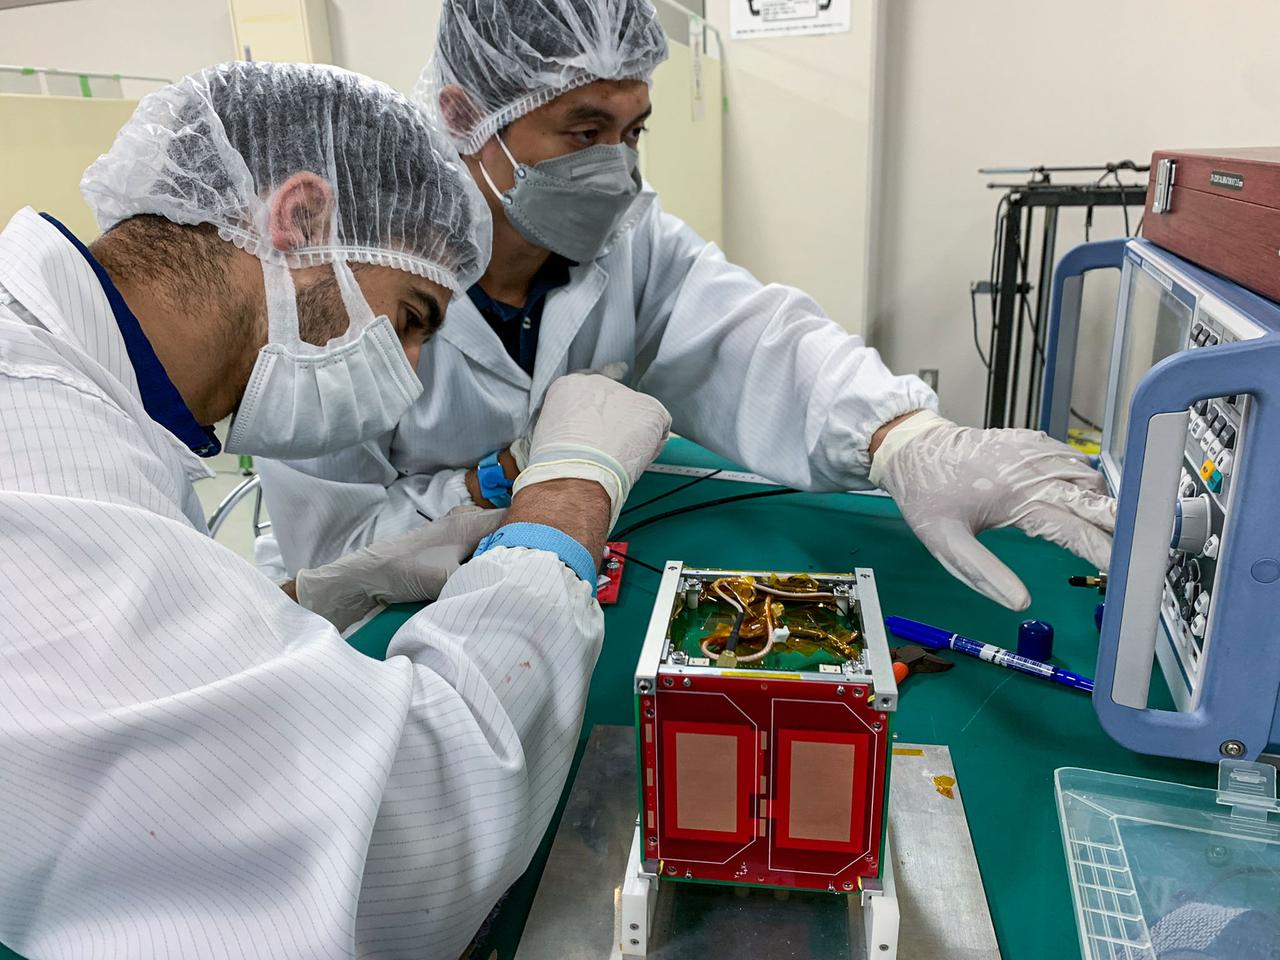
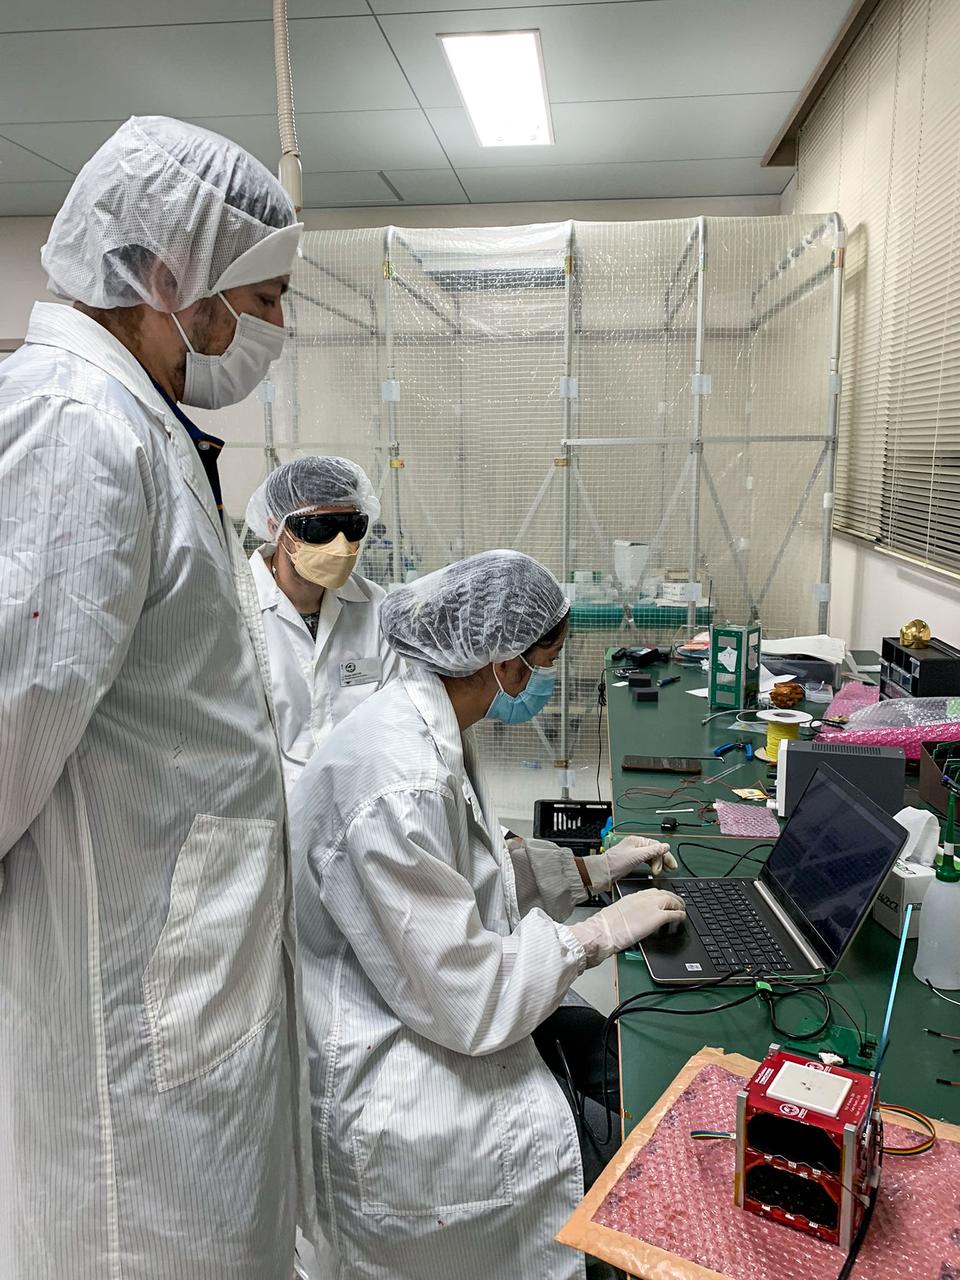
jsc2024e006084 (7/13/2022) --- The dipole antennas are being tuned using a spectrum analyzer in the clean room. From left to right : MOUMNI Fahd, ALMONTE John-Paul..Image Credit: MOUMNI Fahd.
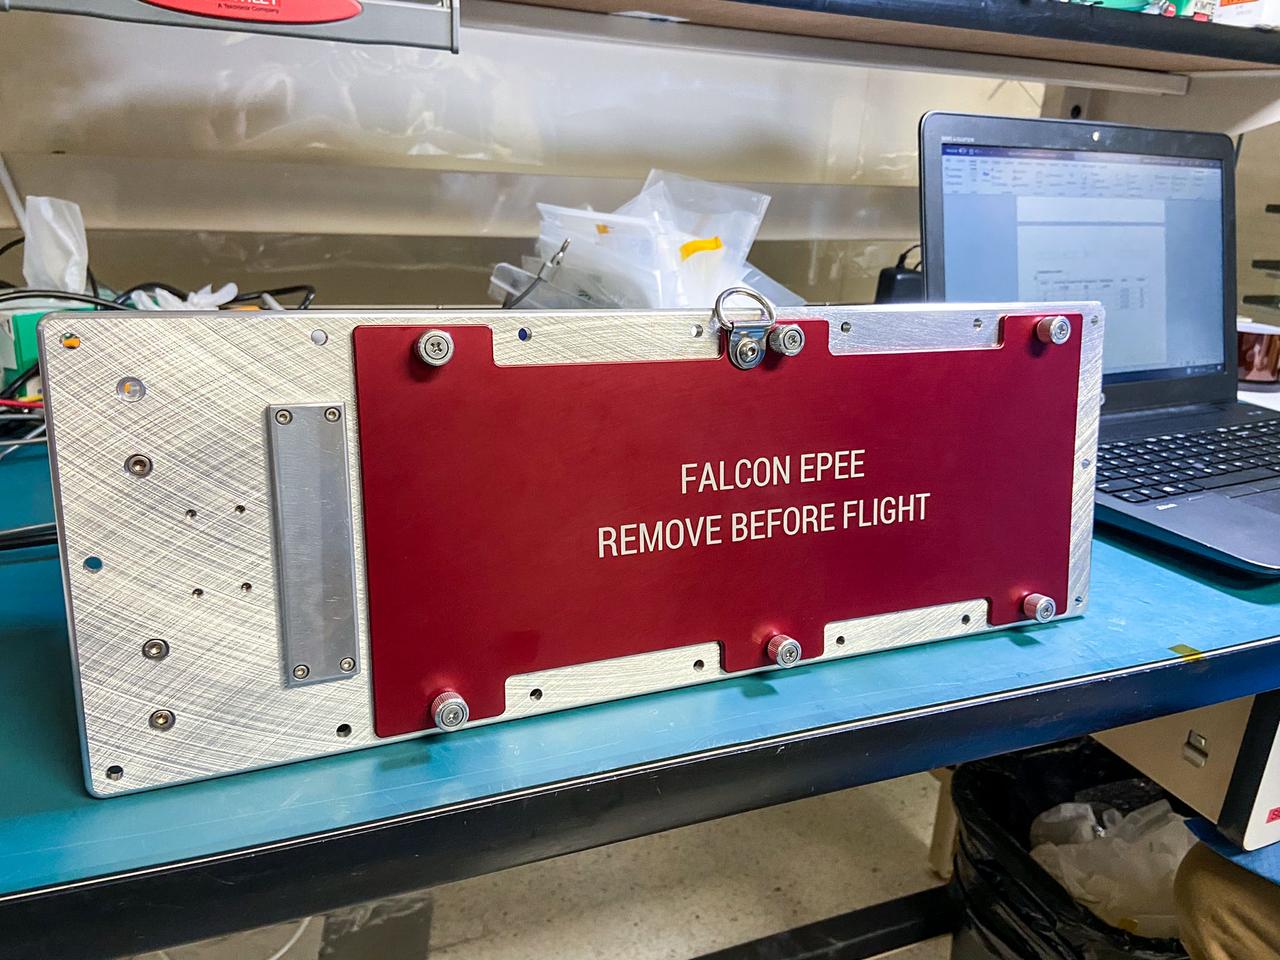
jsc2023e010197 (3/1/2023) --- Space Test Program - Houston 9 - Falcon Electric Propulsion Electrostatic Analyzer Experiment (STP-H9-Falcon-EPEE) with Remove Before Flight Cover upon completion of assembly. Image courtesy of the United States Air Force Academy.
jsc2024e006086 (9/9/2024) --- Some MicroOrbiter-1 team members were analyzing the results from exposing the satellite solar panels to the sun simulator to confirm their generation of power.From left to right : SHRESTHA Hari Ram, MATTEI Giulio, ZANGMO Pema...Image Credit: MOUMNI Fahd.
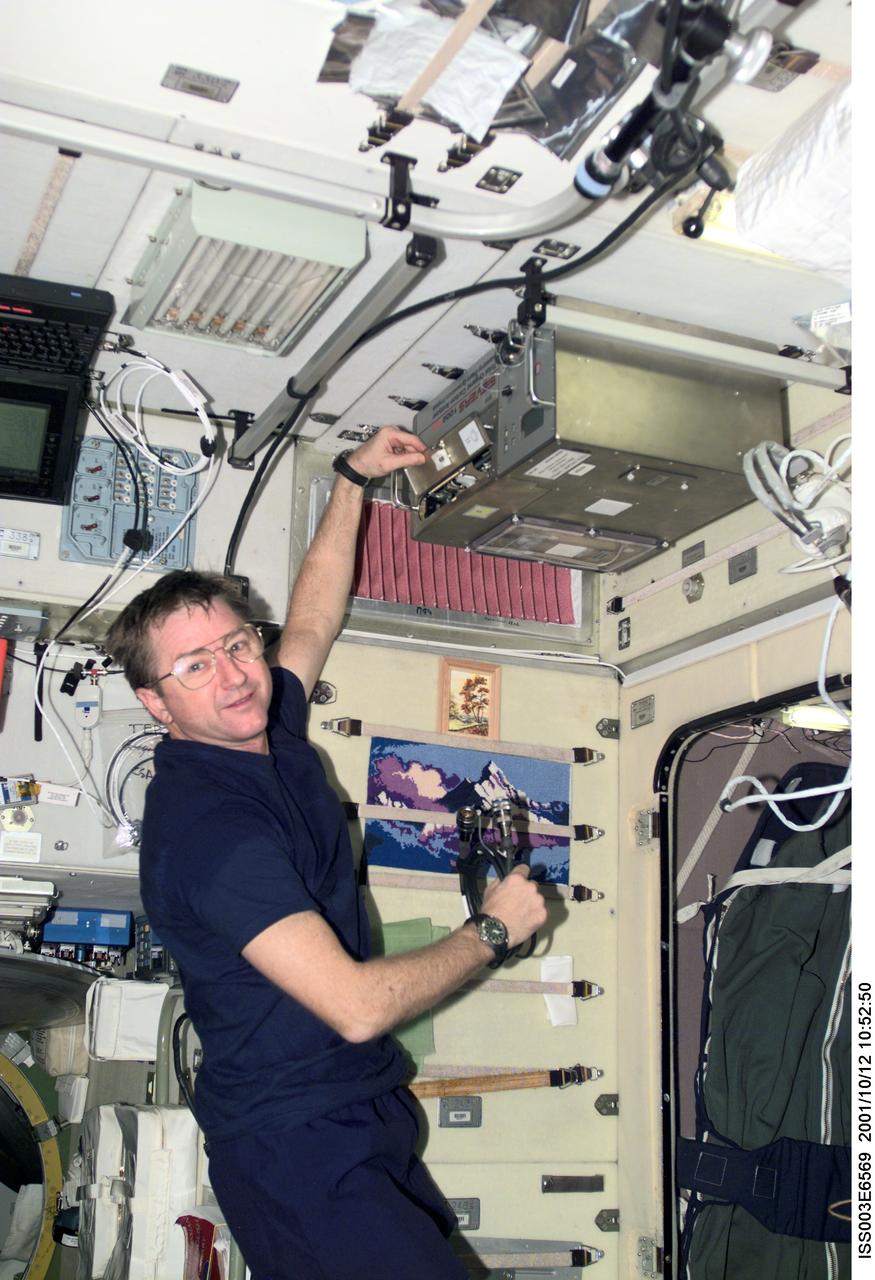
ISS003-E-6569 (12 October 2001) --- Astronaut Frank L. Culbertson, Jr., Expedition Three mission commander, works with the Total Organic Carbon Analyzer (TOCA) in the Zvezda Service Module on the International Space Station (ISS). This image was taken with a digital still camera.
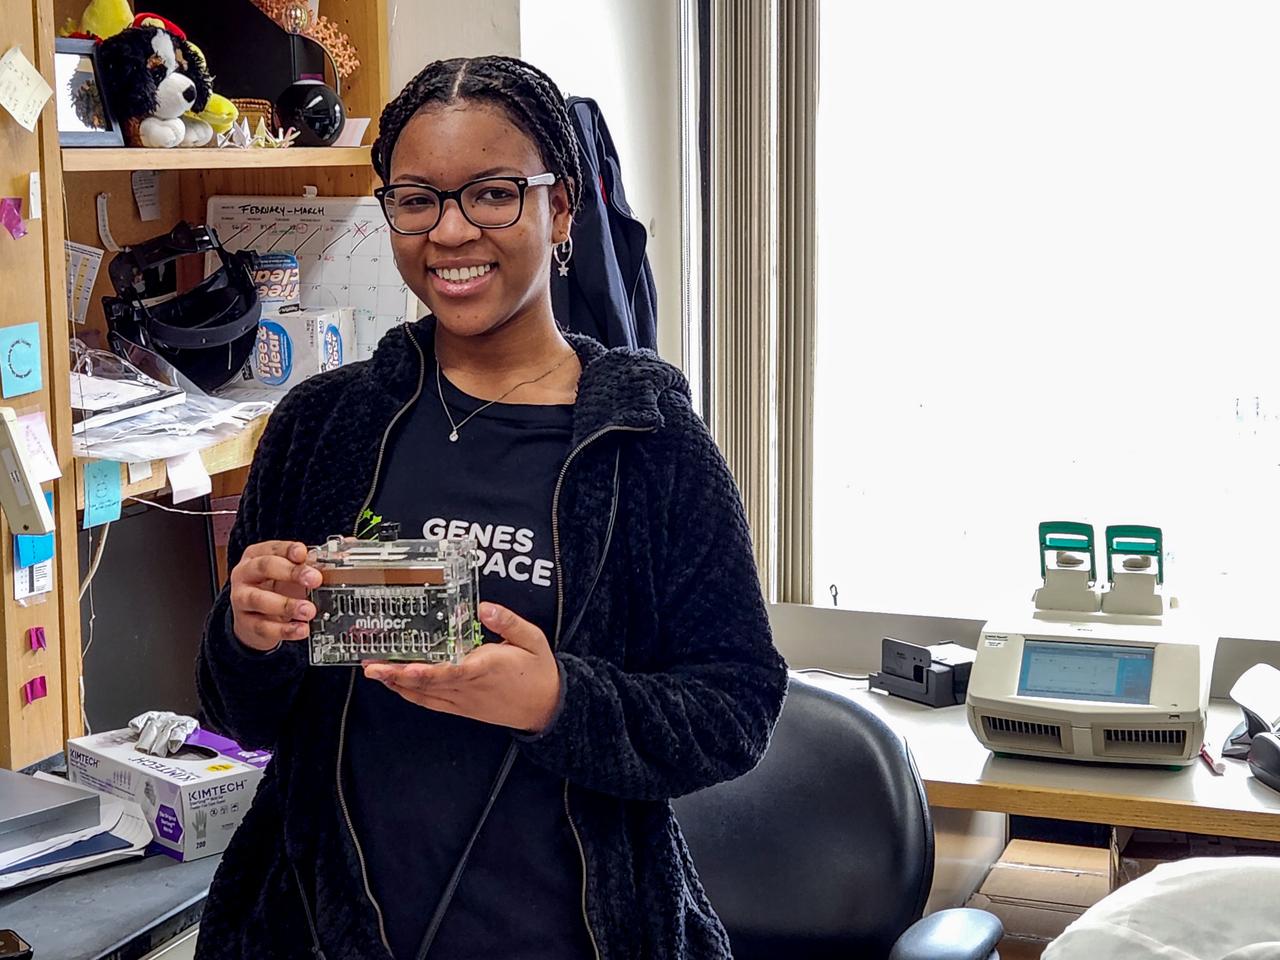
jsc2023e031076 (3/13/2023) --- Genes in Space-10 winner, student Pristine Onuoha, holds the miniPCR device, one of the tools astronauts will use to perform her investigation on the International Space Station. Onuoha’s investigation tests a method of measuring and analyzing DNA length in microgravity. Image courtesy of Genes in Space.
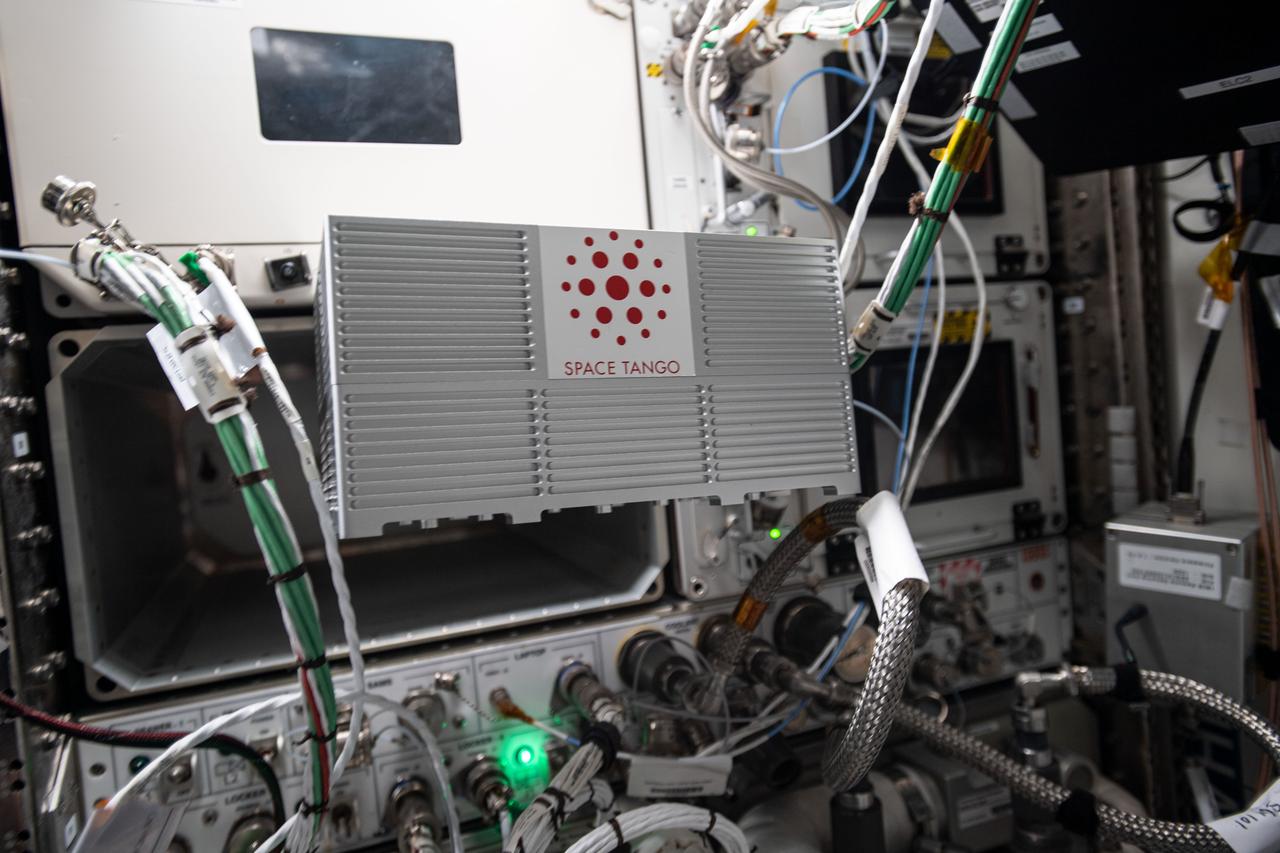
iss063e113776 (10/20/2020) --- A view of the CubeLab Microscope Imagery Tech Demo aboard the International Space Station (ISS). The CubeLab Microscope Imagery Technology Demonstration (CubeLab Microscope Imagery Tech Demo) tests enhanced microscope imagery capabilities for experiments aboard the space station. Images provide a primary way to document and analyze many microgravity investigations, and better quality images could lead to better results.

This set of images shows part of the deployment of the Mars Environmental Dynamics Analyzer (MEDA) wind sensors on NASA's Perseverance Mars rover. MEDA is a set of weather sensors, with the wind sensor components on the rover's remote sensing mast. These images were taken by Perseverance's Navigation Cameras on Feb. 28, 2021. A key objective for Perseverance's mission on Mars is astrobiology, including the search for signs of ancient microbial life. The rover will characterize the planet's geology and past climate, pave the way for human exploration of the Red Planet, and be the first mission to collect and cache Martian rock and regolith (broken rock and dust). Subsequent NASA missions, in cooperation with ESA (European Space Agency), would send spacecraft to Mars to collect these sealed samples from the surface and return them to Earth for in-depth analysis. The Mars 2020 Perseverance mission is part of NASA's Moon to Mars exploration approach, which includes Artemis missions to the Moon that will help prepare for human exploration of the Red Planet. Movie available at https://photojournal.jpl.nasa.gov/catalog/PIA24339
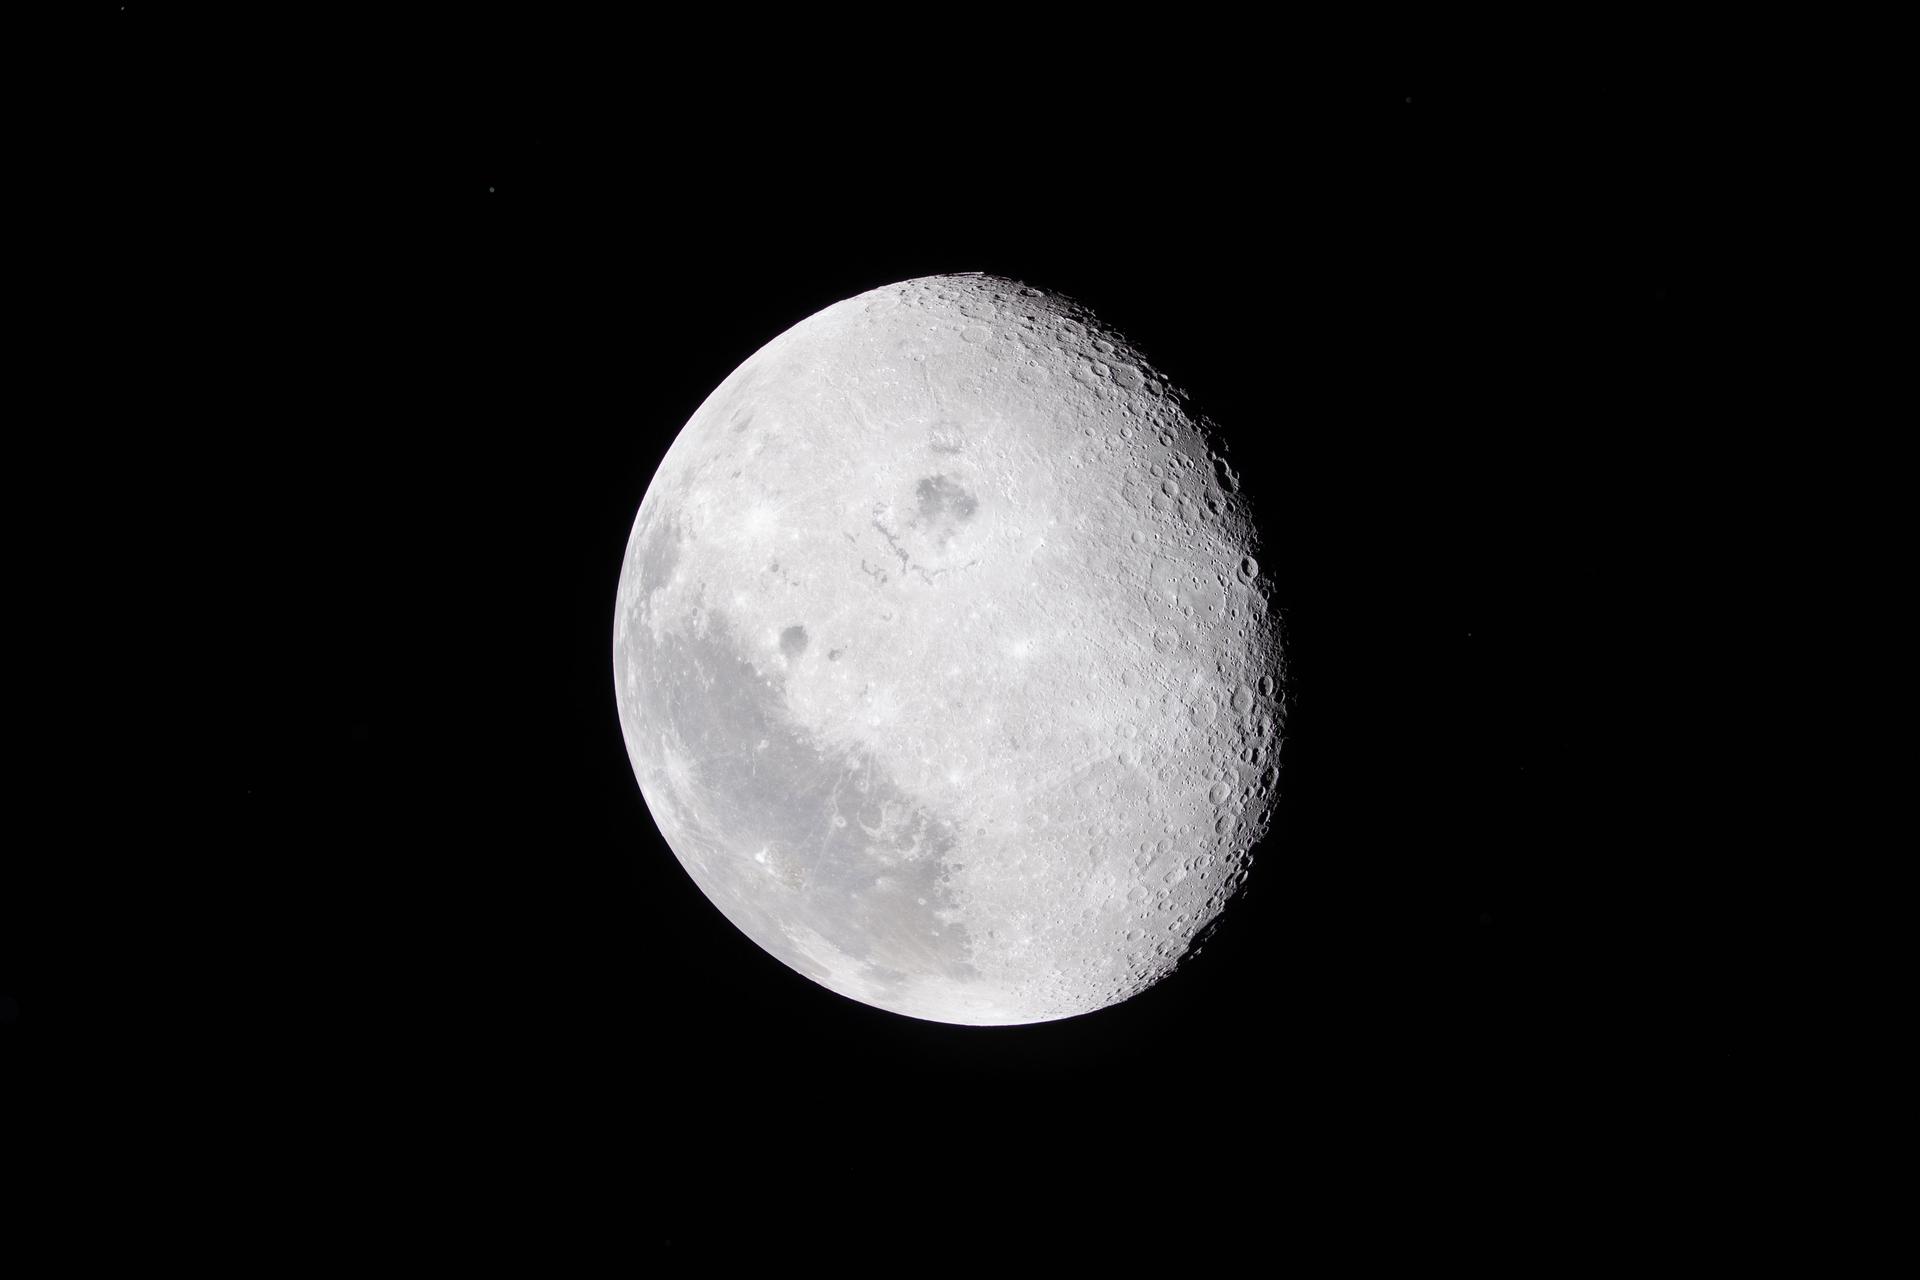
art002e009582 (April 6, 2026) – In this view, most of the Moon’s surface is illuminated as captured by the Artemis II crew during their flyby. To support scientific analysis, the lunar science team requested a series of images of the same scene using different exposure settings—including overexposed, underexposed, and standard images. Each variation highlights different aspects of the surface: brighter exposures can reveal faint features in shadowed regions, while darker exposures help preserve detail in highly reflective areas. Together, these images provide complementary data that allow scientists to better analyze the Moon’s surface composition, texture, and geologic features.
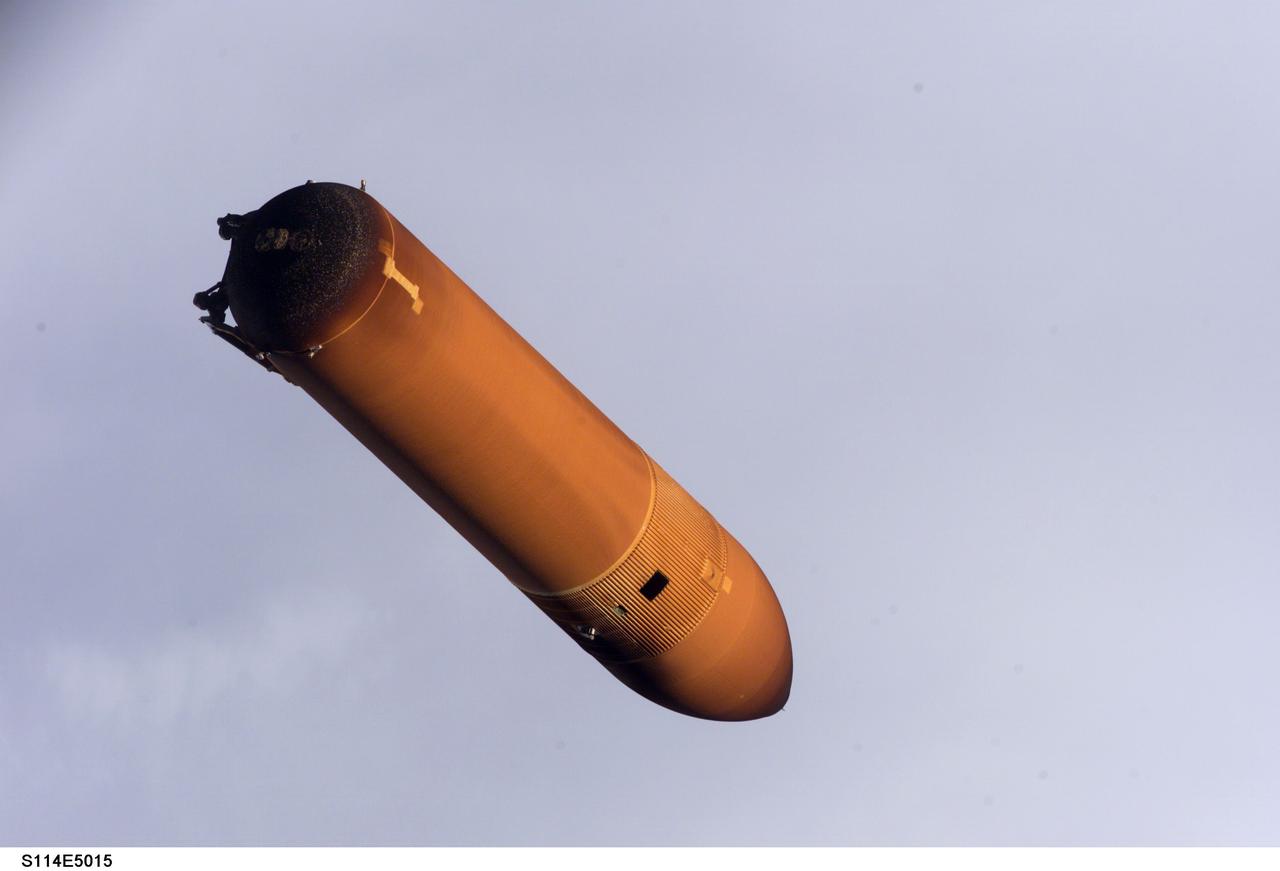
STS114-E-5015 (26 July 2005) ---- Handheld still images taken by Discovery's crew of the external fuel tank as it was jettisoned after launch on July 26 were transmitted to the ground early July 27. Engineers are analyzing these photos as part of the extensive imagery data being gathered to understand debris during the Shuttle's ascent during STS-114. These images of the external tank were taken with the tank closer to the Shuttle than on any past missions due to an earlier maneuver performed by the spacecraft shortly after main engine cutoff.
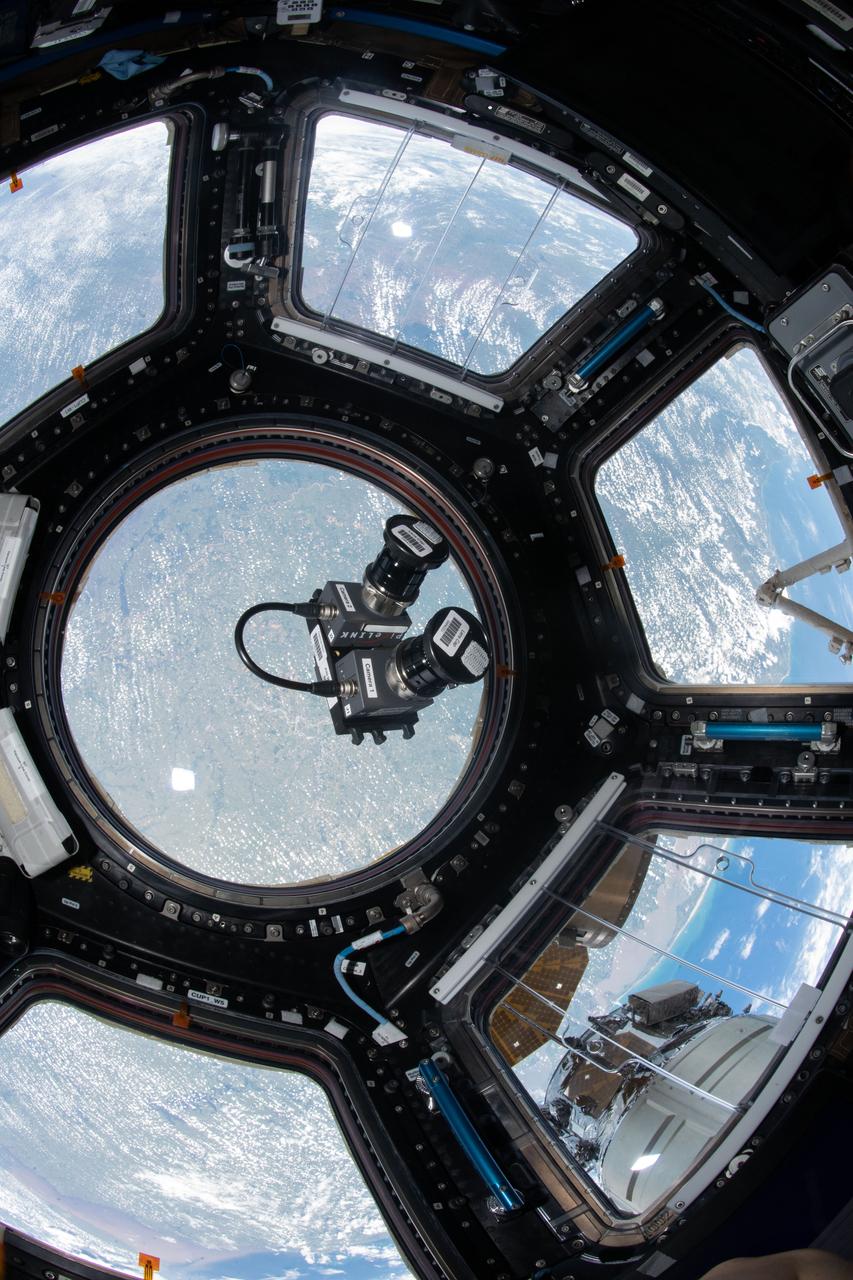
iss058e007453 (1/29/2019) --- A camera assembly containing two cameras similar to that used by the Orion Optical Navigation System is shown in the cupola onboard the International Space Station (ISS). The Optical Navigation (Optical Nav) investigation is a technology demonstration used to validate the backup navigation system for the Orion Multi-Purpose Crew Vehicle. Images of the Moon and adjacent star fields are being collected by these two cameras from the ISS cupola. The images are then analyzed on the ground using the same algorithms that will fly onboard Orion to determine vehicle position. These derived position measurements will be compared to the known position of the ISS at the moment each photo was taken. This will help validate the optical navigation performance using ISS as the test vehicle.
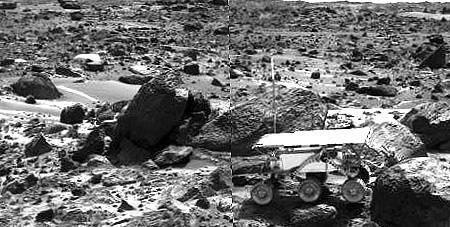
This image shows the Sojourner rover's Alpha Proton X-ray Spectrometer (APXS) deployed against the rock "Stimpy" on the afternoon of Sol 68 (September 11). The two rocks behind the rover were previously analyzed by the APXS. Sojourner spent 83 days of a planned seven-day mission exploring the Martian terrain, acquiring images, and taking chemical, atmospheric and other measurements. The final data transmission received from Pathfinder was at 10:23 UTC on September 27, 1997. Although mission managers tried to restore full communications during the following five months, the successful mission was terminated on March 10, 1998. http://photojournal.jpl.nasa.gov/catalog/PIA00968
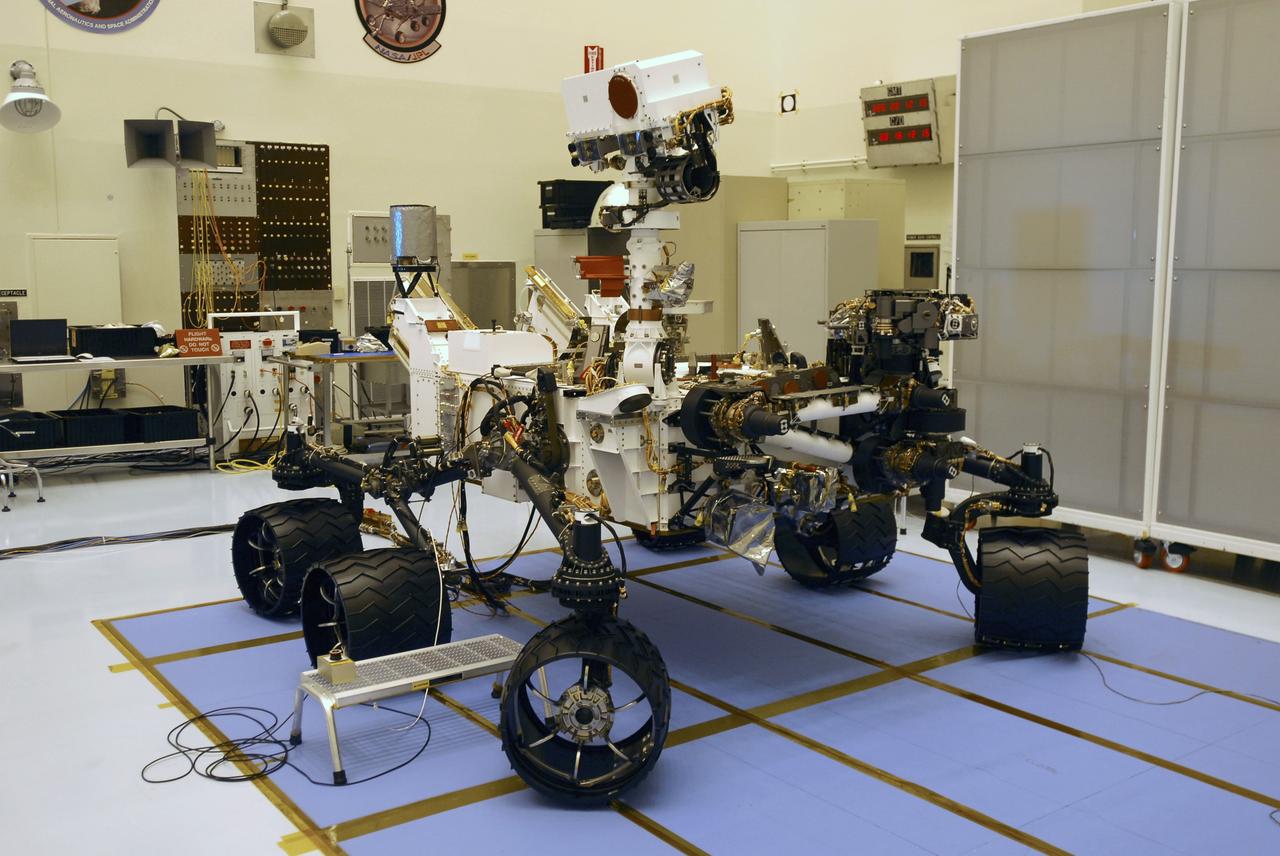
CAPE CANAVERAL, Fla. -- In the Payload Hazardous Servicing Facility at NASA's Kennedy Space Center in Florida, the robotic arm of the Mars Science Laboratory (MSL) rover, Curiosity, has been stowed against the body of the spacecraft. The arm will hold and maneuver instruments that will help scientists analyze Martian rocks and soil. Much like a human arm, the robotic arm has flexibility through shoulder, elbow, and wrist joints that permit the arm to extend, bend, and angle precisely against rocks and soil to grind away layers, take microscopic images and analyze their elemental composition. At the end of the arm is a hand-like structure, the turret, for holding various tools that can spin through a 350-degree turning range. A United Launch Alliance Atlas V-541 configuration will be used to loft MSL into space. Curiosity’s 10 science instruments are designed to search for evidence on whether Mars has had environments favorable to microbial life, including chemical ingredients for life. The unique rover will use a laser to look inside rocks and release its gasses so that the rover’s spectrometer can analyze and send the data back to Earth. MSL is scheduled to launch Nov. 25 from Space Launch Complex 41 on Cape Canaveral Air Force Station in Florida. For more information, visit http://www.nasa.gov/msl. Photo credit: NASA/Charisse Nahser
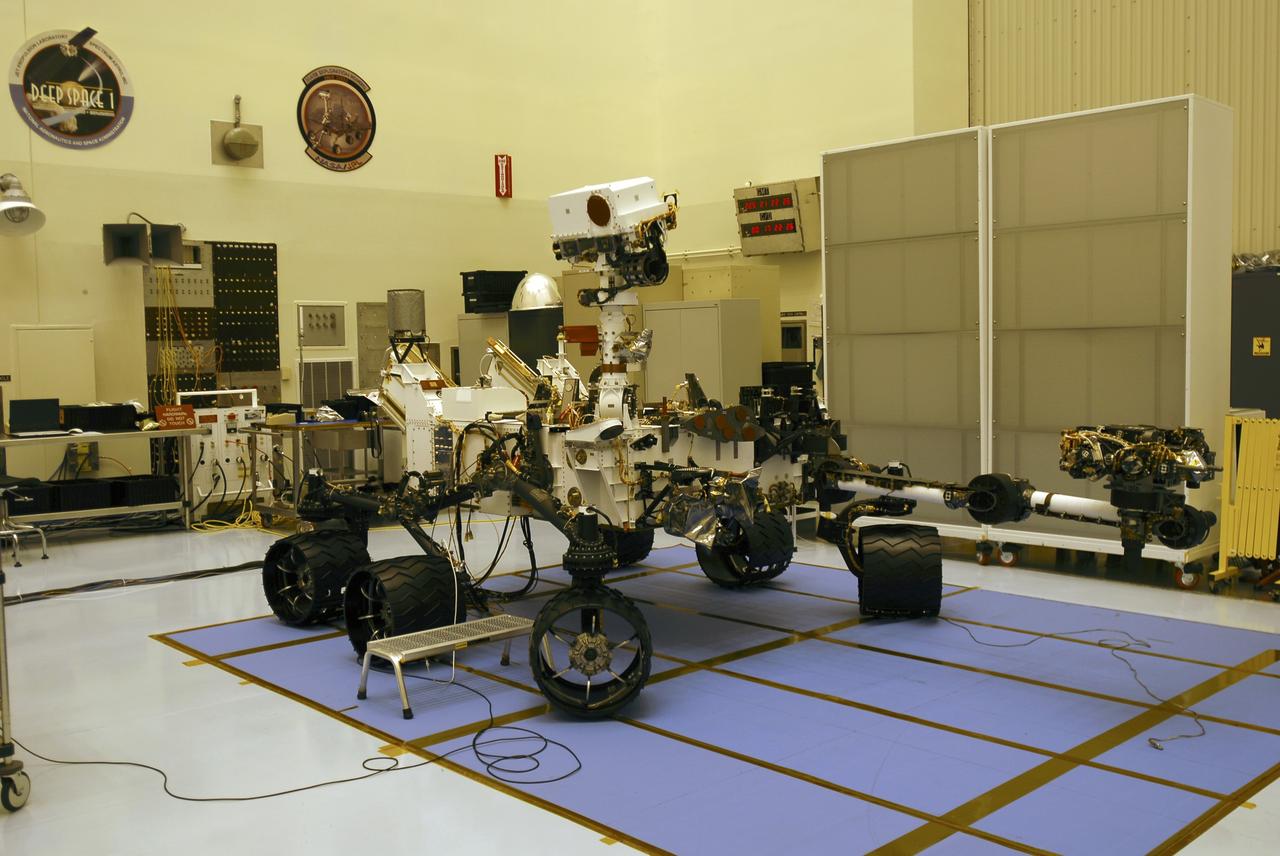
CAPE CANAVERAL, Fla. -- In the Payload Hazardous Servicing Facility at NASA's Kennedy Space Center in Florida, preparations are under way to stow the robotic arm on the Mars Science Laboratory (MSL) rover, Curiosity. The arm will hold and maneuver instruments that will help scientists analyze Martian rocks and soil. Much like a human arm, the robotic arm has flexibility through shoulder, elbow, and wrist joints that permit the arm to extend, bend, and angle precisely against rocks and soil to grind away layers, take microscopic images and analyze their elemental composition. At the end of the arm is a hand-like structure, the turret, for holding various tools that can spin through a 350-degree turning range. A United Launch Alliance Atlas V-541 configuration will be used to loft MSL into space. Curiosity’s 10 science instruments are designed to search for evidence on whether Mars has had environments favorable to microbial life, including chemical ingredients for life. The unique rover will use a laser to look inside rocks and release its gasses so that the rover’s spectrometer can analyze and send the data back to Earth. MSL is scheduled to launch Nov. 25 from Space Launch Complex 41 on Cape Canaveral Air Force Station in Florida. For more information, visit http://www.nasa.gov/msl. Photo credit: NASA/Charisse Nahser
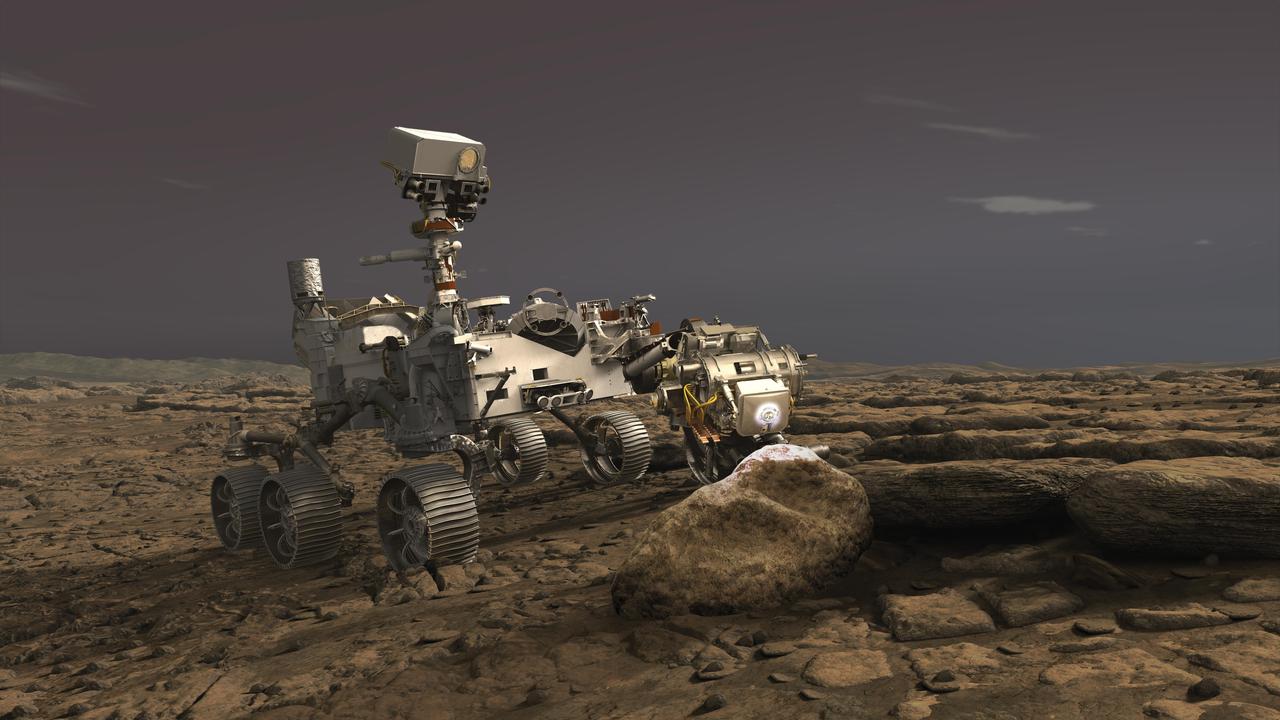
In this illustration, NASA's Perseverance rover uses its Planetary Instrument for X-ray Lithochemistry (PIXL) instrument to analyze a rock on the surface of Mars. PIXL uses a focused X-ray beam to analyze the chemistry of features as small as a grain of sand. The tiny but powerful beam causes rocks to fluoresce, or produce a glow. While the glow is invisible to the human eye, it is detectable by the instrument and varies according to the rock's elemental chemistry. PIXL scan the beam across the surface of the rock to produce a postage-stamp-sized map of the rock's chemistry at the end of an overnight scan. PIXL also has an optical fiducial system (OFS) that includes white "flood lights" — seen on the rock in this artist's concept — that is used together with a pattern of red lasers to illuminate the rock while its camera captures images of the mapped area. The pictures are used for multiple purposes: PIXL analyzes them on board to work out where the target is — in 3D — and move itself into the right position for science collection and the safety of the instrument. The pictures are also downlinked to Earth so scientists can see exactly where each measurement was taken. This allows scientists to tie chemistry accurately to rock texture, which helps them to determine how these features formed and whether they were biological in nature. https://photojournal.jpl.nasa.gov/catalog/PIA23719

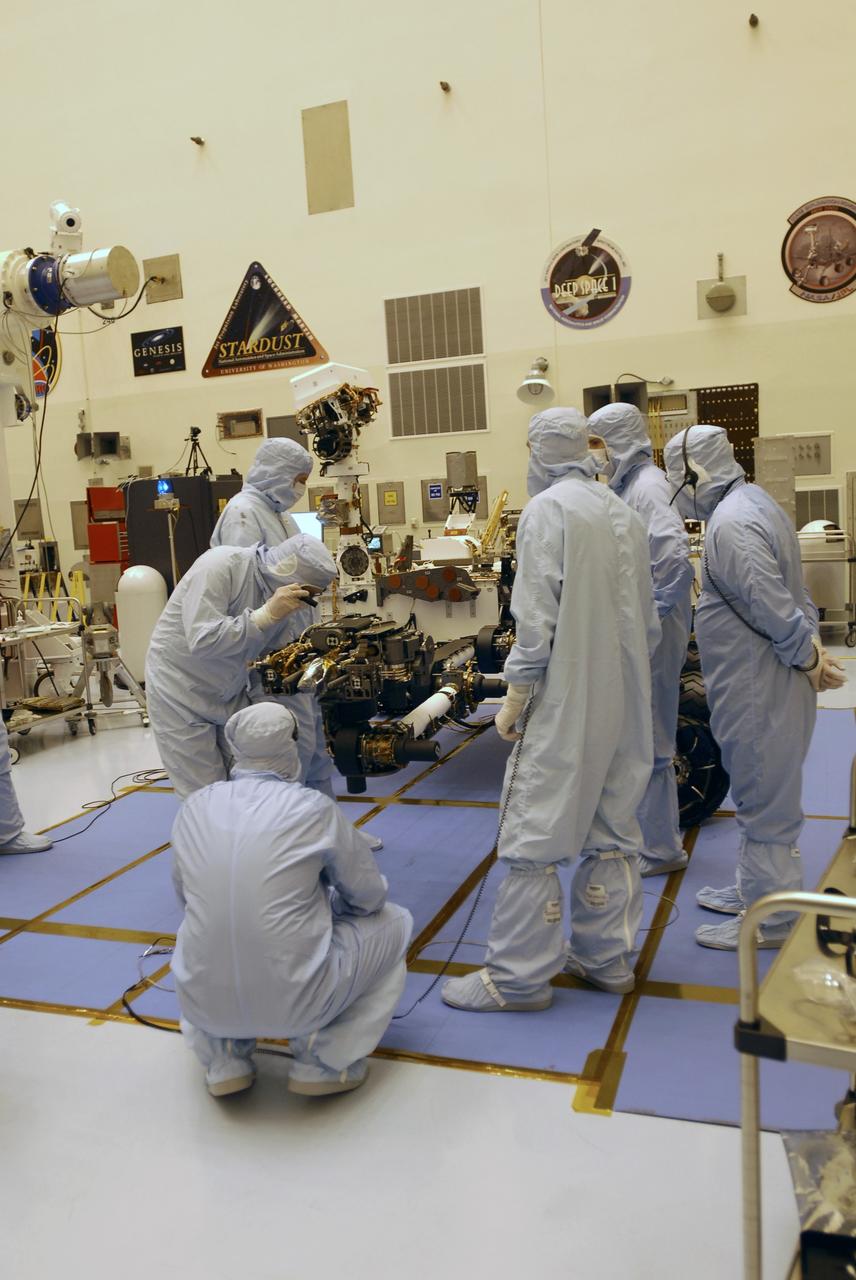
CAPE CANAVERAL, Fla. -- In the Payload Hazardous Servicing Facility at NASA's Kennedy Space Center in Florida, spacecraft technicians discuss their readiness to stow the robotic arm on the Mars Science Laboratory (MSL) rover, Curiosity. The arm will hold and maneuver instruments that will help scientists analyze Martian rocks and soil. Much like a human arm, the robotic arm has flexibility through shoulder, elbow, and wrist joints that permit the arm to extend, bend, and angle precisely against rocks and soil to grind away layers, take microscopic images and analyze their elemental composition. At the end of the arm is a hand-like structure, the turret, for holding various tools that can spin through a 350-degree turning range. A United Launch Alliance Atlas V-541 configuration will be used to loft MSL into space. Curiosity’s 10 science instruments are designed to search for evidence on whether Mars has had environments favorable to microbial life, including chemical ingredients for life. The unique rover will use a laser to look inside rocks and release its gasses so that the rover’s spectrometer can analyze and send the data back to Earth. MSL is scheduled to launch Nov. 25 from Space Launch Complex 41 on Cape Canaveral Air Force Station in Florida. For more information, visit http://www.nasa.gov/msl. Photo credit: NASA/Charisse Nahser
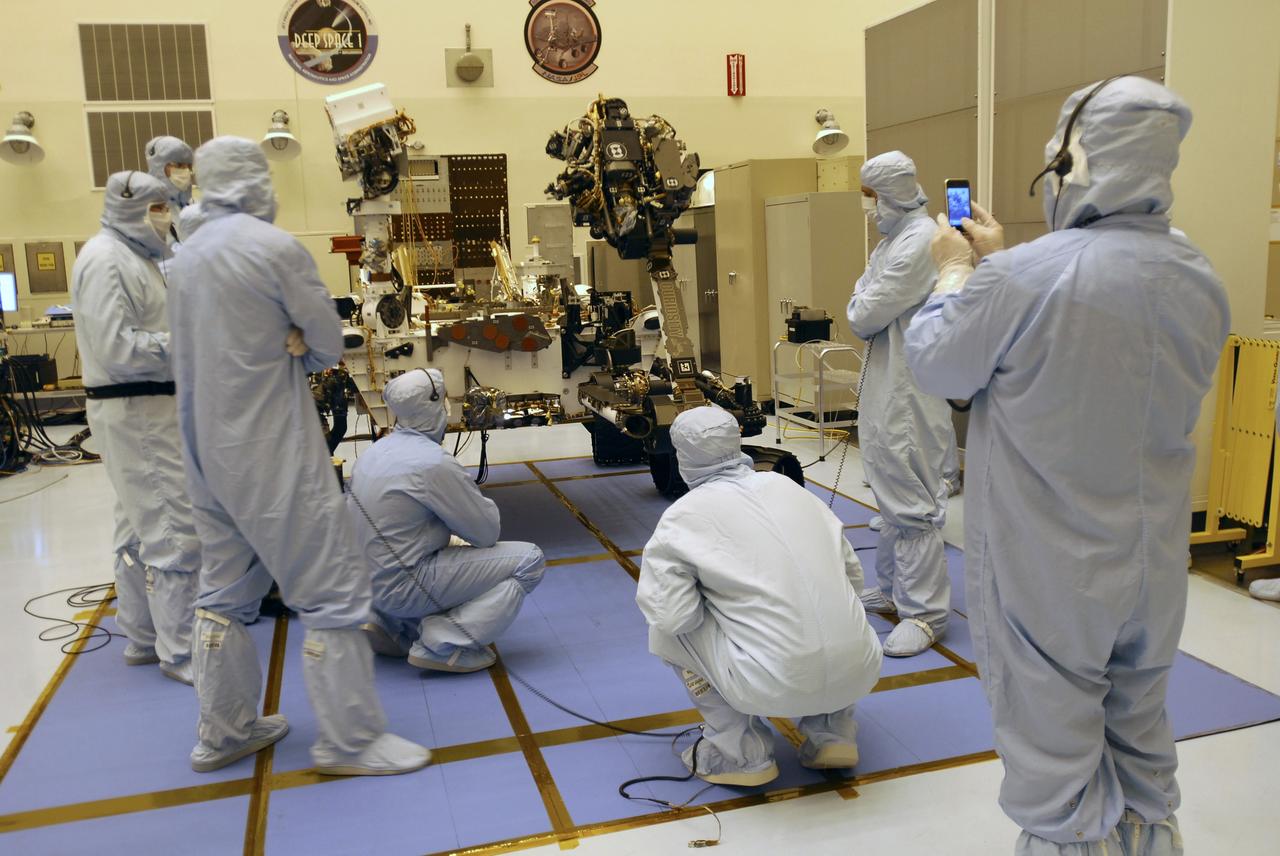
CAPE CANAVERAL, Fla. -- Under the watchful eyes of the spacecraft technicians in the Payload Hazardous Servicing Facility at NASA's Kennedy Space Center in Florida, the robotic arm of the Mars Science Laboratory (MSL) rover, Curiosity, moves into place against the body of the spacecraft. The arm will hold and maneuver instruments that will help scientists analyze Martian rocks and soil. Much like a human arm, the robotic arm has flexibility through shoulder, elbow, and wrist joints that permit the arm to extend, bend, and angle precisely against rocks and soil to grind away layers, take microscopic images and analyze their elemental composition. At the end of the arm is a hand-like structure, the turret, for holding various tools that can spin through a 350-degree turning range. A United Launch Alliance Atlas V-541 configuration will be used to loft MSL into space. Curiosity’s 10 science instruments are designed to search for evidence on whether Mars has had environments favorable to microbial life, including chemical ingredients for life. The unique rover will use a laser to look inside rocks and release its gasses so that the rover’s spectrometer can analyze and send the data back to Earth. MSL is scheduled to launch Nov. 25 from Space Launch Complex 41 on Cape Canaveral Air Force Station in Florida. For more information, visit http://www.nasa.gov/msl. Photo credit: NASA/Charisse Nahser
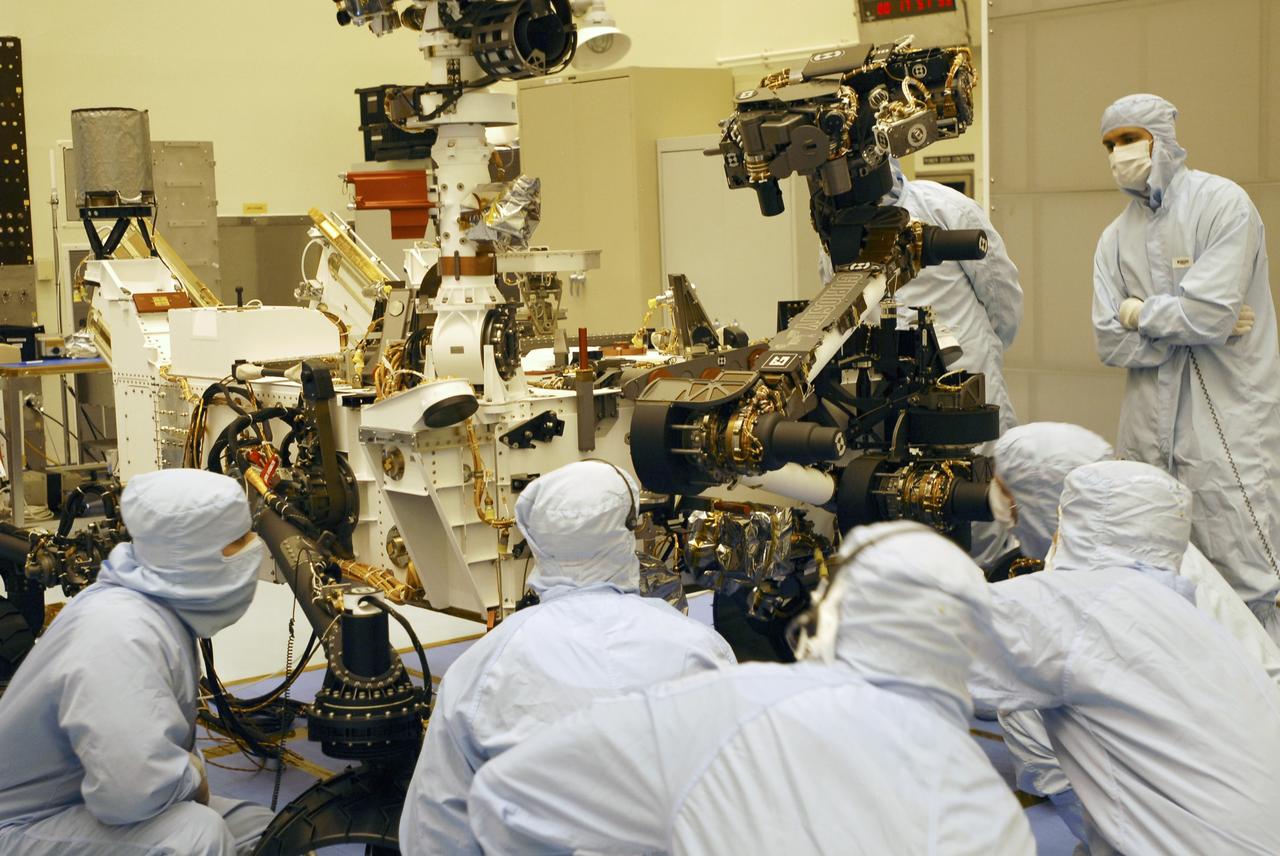
CAPE CANAVERAL, Fla. -- In the Payload Hazardous Servicing Facility at Kennedy Space Center in Florida, spacecraft technicians monitor the movement of the robotic arm of the Mars Science Laboratory (MSL) rover, Curiosity, as it is stowed against the body of the spacecraft. The arm will hold and maneuver instruments that will help scientists analyze Martian rocks and soil. Much like a human arm, the robotic arm has flexibility through shoulder, elbow, and wrist joints that permit the arm to extend, bend, and angle precisely against rocks and soil to grind away layers, take microscopic images and analyze their elemental composition. At the end of the arm is a hand-like structure, the turret, for holding various tools that can spin through a 350-degree turning range. A United Launch Alliance Atlas V-541 configuration will be used to loft MSL into space. Curiosity’s 10 science instruments are designed to search for evidence on whether Mars has had environments favorable to microbial life, including chemical ingredients for life. The unique rover will use a laser to look inside rocks and release its gasses so that the rover’s spectrometer can analyze and send the data back to Earth. MSL is scheduled to launch Nov. 25 from Space Launch Complex 41 on Cape Canaveral Air Force Station in Florida. For more information, visit http://www.nasa.gov/msl. Photo credit: NASA/Charisse Nahser
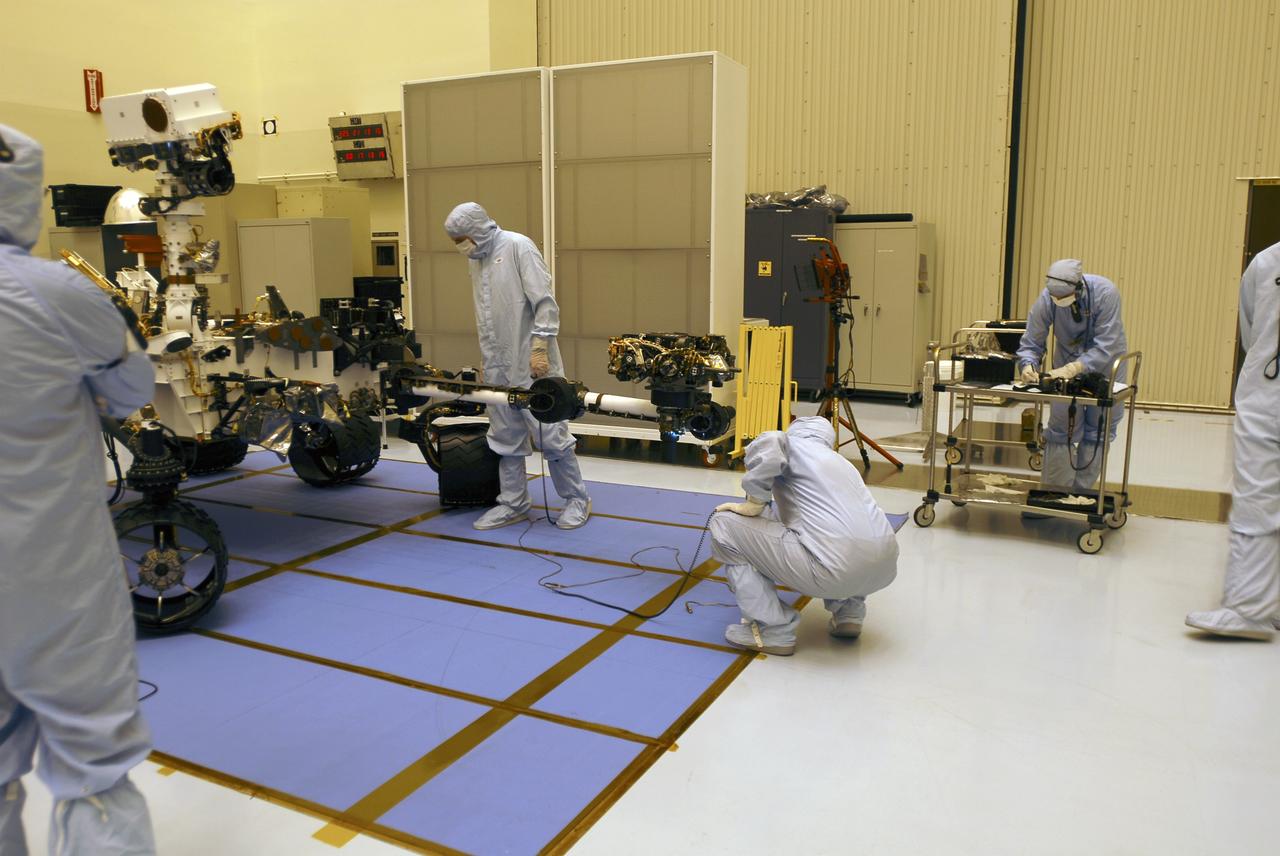
CAPE CANAVERAL, Fla. -- In the Payload Hazardous Servicing Facility at NASA's Kennedy Space Center in Florida, spacecraft technicians prepare to stow the robotic arm on the Mars Science Laboratory (MSL) rover, Curiosity. The arm will hold and maneuver instruments that will help scientists analyze Martian rocks and soil. Much like a human arm, the robotic arm has flexibility through shoulder, elbow, and wrist joints that permit the arm to extend, bend, and angle precisely against rocks and soil to grind away layers, take microscopic images and analyze their elemental composition. At the end of the arm is a hand-like structure, the turret, for holding various tools that can spin through a 350-degree turning range. A United Launch Alliance Atlas V-541 configuration will be used to loft MSL into space. Curiosity’s 10 science instruments are designed to search for evidence on whether Mars has had environments favorable to microbial life, including chemical ingredients for life. The unique rover will use a laser to look inside rocks and release its gasses so that the rover’s spectrometer can analyze and send the data back to Earth. MSL is scheduled to launch Nov. 25 from Space Launch Complex 41 on Cape Canaveral Air Force Station in Florida. For more information, visit http://www.nasa.gov/msl. Photo credit: NASA/Charisse Nahser
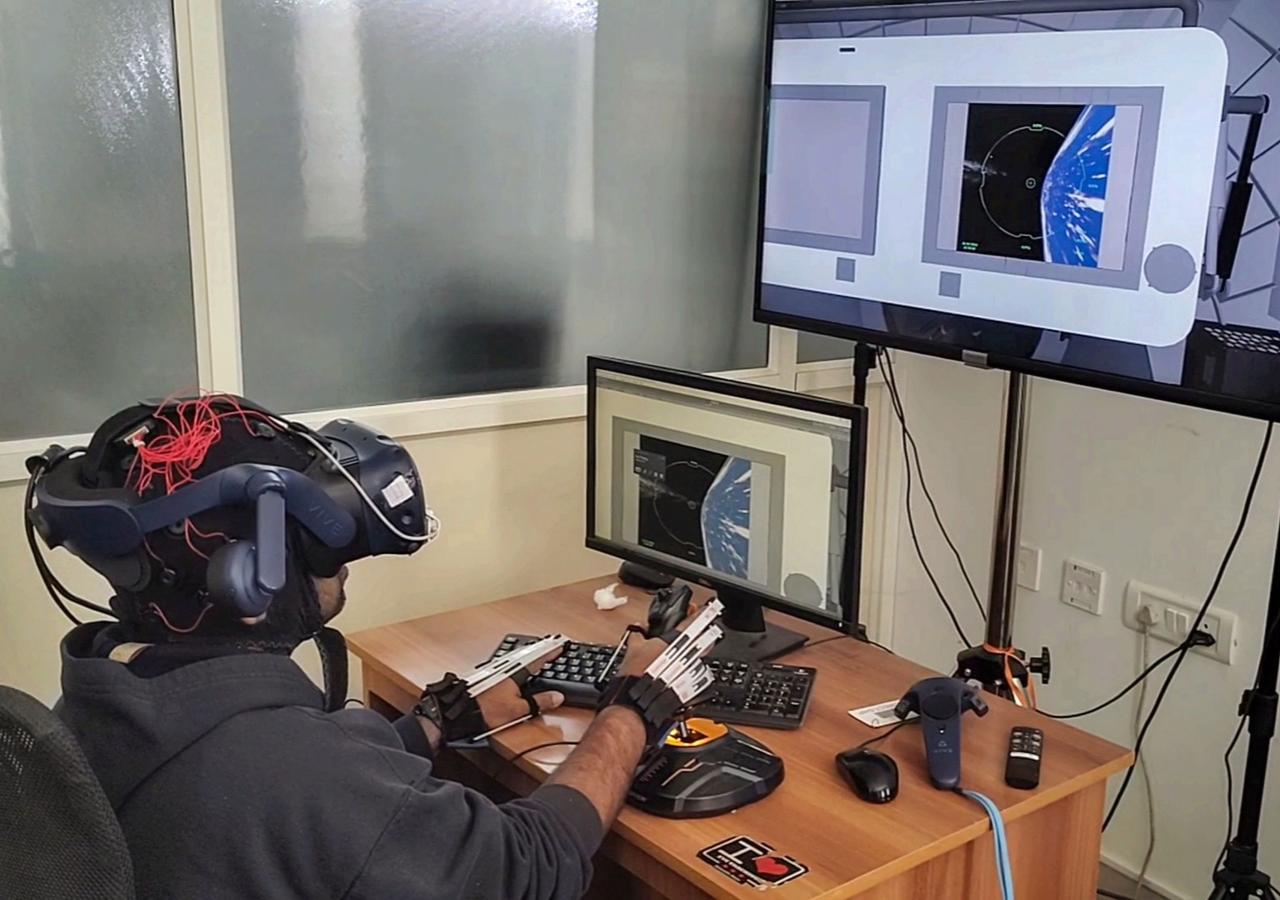
jsc2025e047406 (5/27/2025) --- A demonstration is shown of Analyzing HMI in Microgravity (Voyager Displays-ISRO). This investigation studies how humans interact with electronic displays in microgravity aboard the International Space Station using crew iPads. Results could improve the design of human-machine interfaces in spacecraft and other settings. Image courtesy of Dr. Pradipta Biswas.

jsc2023e031075 (3/13/2023) --- Genes in Space-10 winner, student Pristine Onuoha (right), and miniPCR biology team member Dr. Ally Huang (left) analyze data in preparation for launch of the Genes in Space-10 investigation to the International Space Station. The Genes in Space program enables students to learn about biotechnology and its potential applications. Image courtesy of Genes in Space.
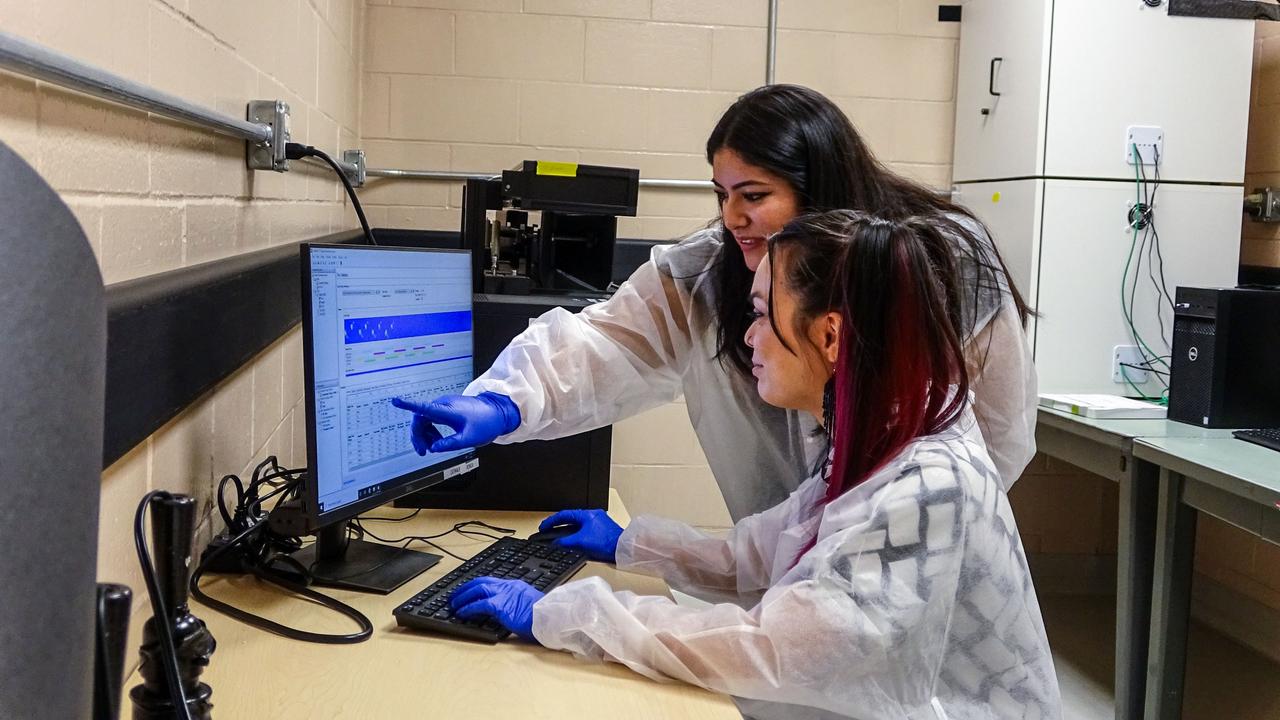
jsc2023e069280 (10/4/2023) --- Steffy Tabares Ruiz and Jade Nguyen analyze behavioral data that are informative for quantifying the effects of the space environment on neurobehavioral function. Rodent Research-20 (RR-20) evaluates ovarian function in female mice in microgravity, fertility following return to Earth, and the effect of spaceflight on the next generation. Image courtesy of the University of Kansas Medical Center.
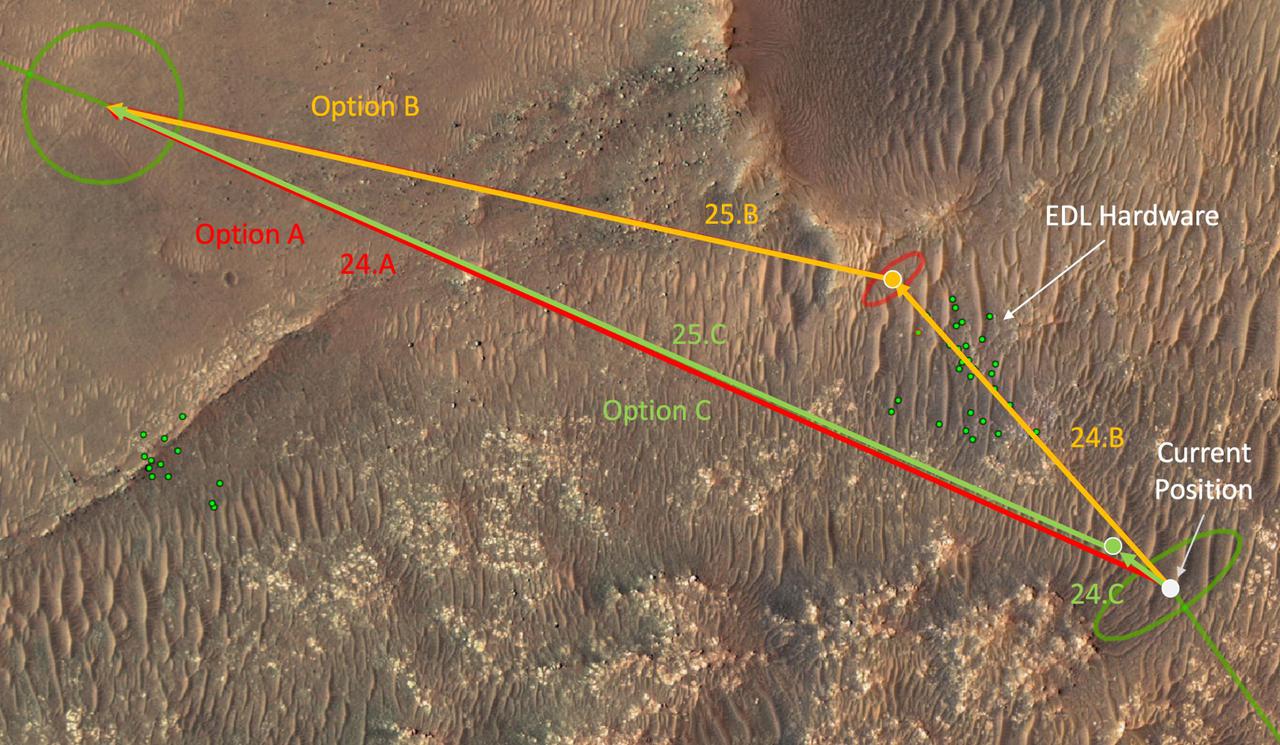
This annotated overhead image from the HiRISE camera aboard NASA's Mars Reconnaissance Orbiter (MRO) depicts three options for the agency's Mars Ingenuity Helicopter to take on flights out of the "Séítah" region, as well as the location of the entry, descent, and landing (EDL) hardware. The size and location of the landing ellipses have been analyzed to be safe for landing – free of hazards such as rocks, dunes, and large slopes. See an interactive map with Perseverance and Ingenuity location updates here: https://mars.nasa.gov/mars2020/mission/where-is-the-rover/ https://photojournal.jpl.nasa.gov/catalog/PIA25029
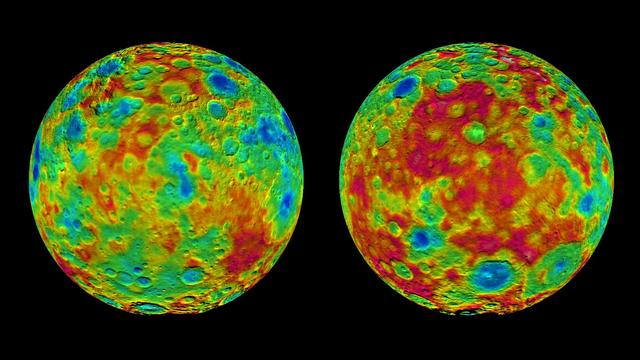
This pair of images shows color-coded maps from NASA's Dawn mission, revealing the highs and lows of topography on the surface of dwarf planet Ceres. The map at left is centered on terrain at 60 degrees east longitude; the map at right is centered on 240 degrees east longitude. The color scale extends about 5 miles (7.5 kilometers) below the surface in indigo to 5 miles (7.5 kilometers) above the surface in white. The topographic map was constructed from analyzing images from Dawn's framing camera taken from varying sun and viewing angles. The map was combined with an image mosaic of Ceres and projected as an orthographic projection. The well-known bright spots in the center of Ceres northern hemisphere in the image at right retain their bright appearance, although they are color-coded in the same green elevation of the crater floor in which they sit. http://photojournal.jpl.nasa.gov/catalog/PIA19607
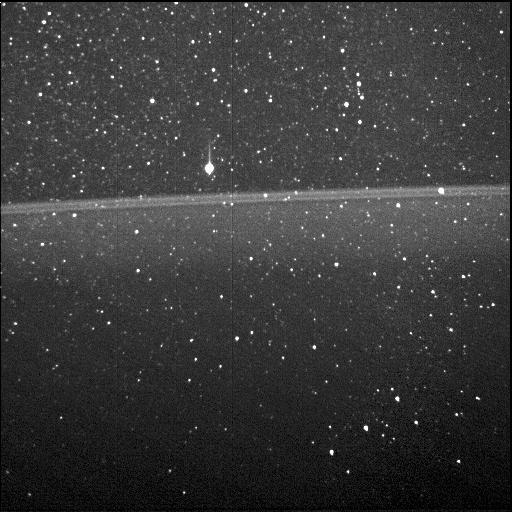
As NASA's Juno spacecraft flew through the narrow gap between Jupiter's radiation belts and the planet during its first science flyby, Perijove 1, on August 27, 2016, the Stellar Reference Unit (SRU-1) star camera collected the first image of Jupiter's ring taken from the inside looking out. The bright bands in the center of the image are the main ring of Jupiter's ring system. While taking the ring image, the SRU was viewing the constellation Orion. The bright star above the main ring is Betelgeuse, and Orion's belt can be seen in the lower right. Juno's Radiation Monitoring Investigation actively retrieves and analyzes the noise signatures from penetrating radiation in the images of the spacecraft's star cameras and science instruments at Jupiter. https://photojournal.jpl.nasa.gov/catalog/PIA21644
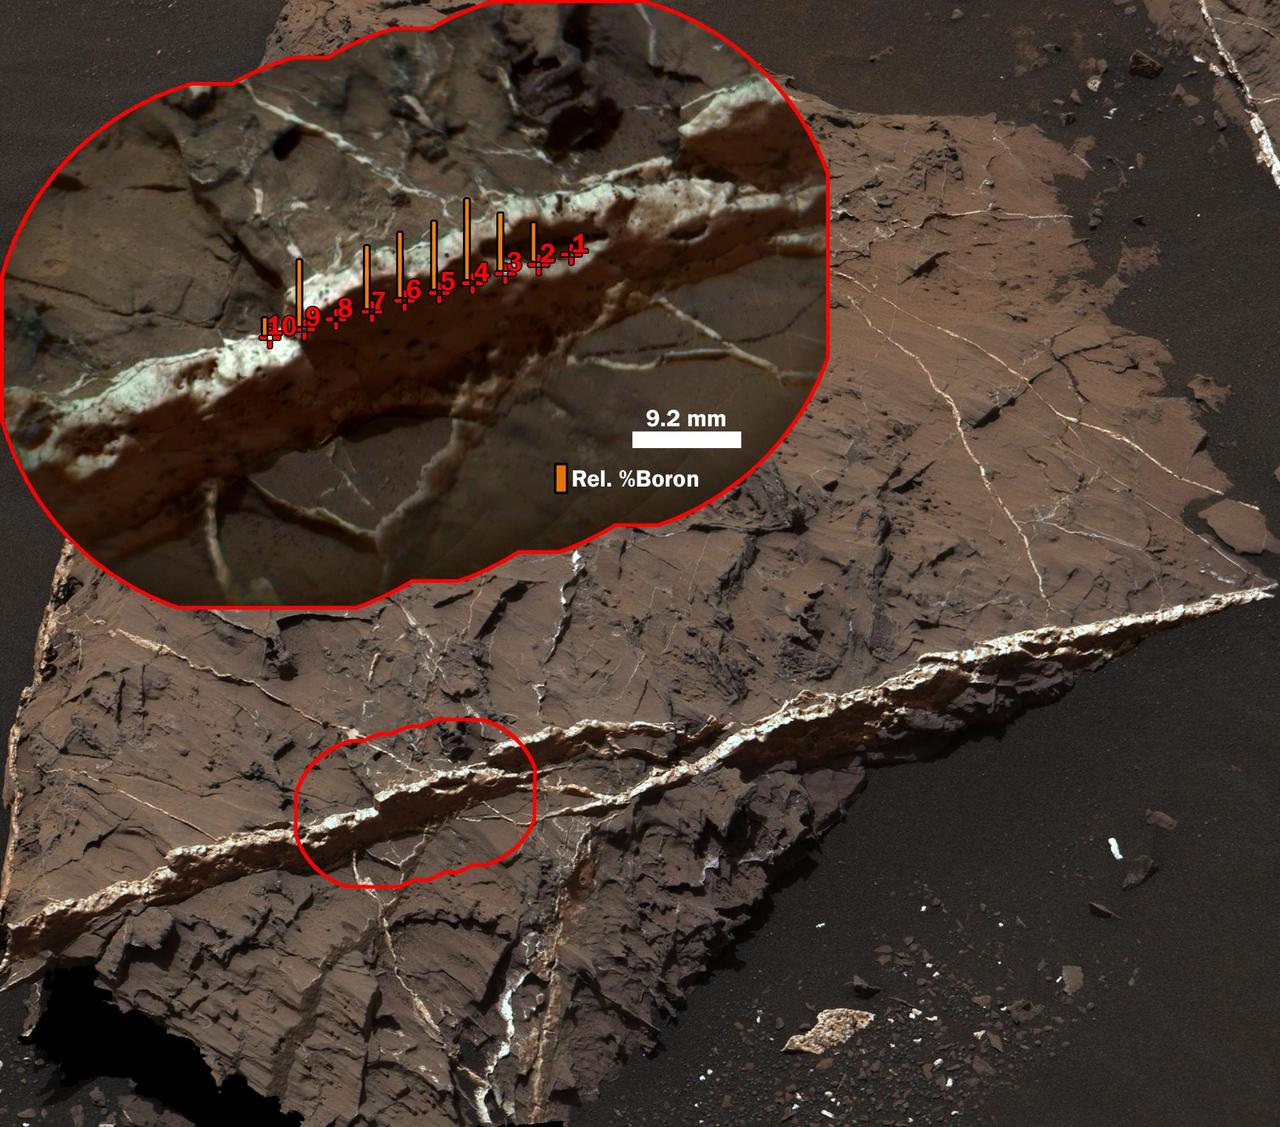
The highest concentration of boron measured on Mars, as of late 2016, is in this mineral vein, called "Catabola," examined with the Chemistry and Camera (ChemCam) instrument on NASA's Curiosity rover on Aug, 25, 2016, during Sol 1441 of the mission. This two-part illustration shows the context of the erosion-resistant, raised vein, in an image from Curiosity's Mast Camera (Mastcam), and a detailed inset image from ChemCam's remote micro-imager. The inset includes indicators of the boron content measured at 10 points along the vein that were analyzed with ChemCam's laser-firing spectrometer. The vein's main component is calcium sulfate. The highest boron content identified is less than one-tenth of one percent. The heights of the orange bars at each point indicate relative abundance of boron, compared with boron content at other points. The scale bar for the inset is 9.2 millimeters, or about 0.36 inch. The ChemCam image is enhanced with color information from Mastcam. http://photojournal.jpl.nasa.gov/catalog/PIA21251

STS059-09-012 (9-20 April 1994) --- On the Space Shuttle Endeavour's aft flight deck, astronaut Michael R. (Rich) Clifford, mission specialist, inserts a tape in the payload high rate recorder. Three of these state-of-the-art recorders captured four times the amount of data that could be radioed to the ground. The 183 tapes, each containing 40 megabytes of data, will be turned into images over the next year, and analyzed over the next decade. Clifford was joined in space by five other NASA astronauts for a week and a half of support to the Space Radar Laboratory (SRL-1)/STS-59 mission.
ISS007-E-06886 (12 June 2003) --- This image was taken by Expedition 7 NASA ISS Science Officer Ed Lu from the U.S. Destiny Laboratory window. Lu noticed the object floating away from the Station and described it as a 5 centimeter long piece of metal. Station managers and flight controllers estimate that the mass of the object will cause it to de-orbit rapidly and will not cause damage to the Station. Engineers are analyzing the imagery to determine what the object is and where it might have originated. It is likely the object came from the Station because of its similar speed and orbit relative to the Station.
CAPE CANAVERAL, Fla. -- A backscatter device continues to give engineers data on the intertank region of space shuttle Discovery's external fuel tank while it is in the Vehicle Assembly Building at NASA's Kennedy Space Center in Florida. Engineers at various NASA centers are analyzing, testing and imaging the intertank's support beams, called stringers, to make sure the tank is structurally sound for flight. Discovery's next launch opportunity to the International Space Station on the STS-133 mission is no earlier than Feb. 3, 2011. For more information on STS-133, visit www.nasa.gov/mission_pages/shuttle/shuttlemissions/sts133/. Photo credit: NASA/Jack Pfaller
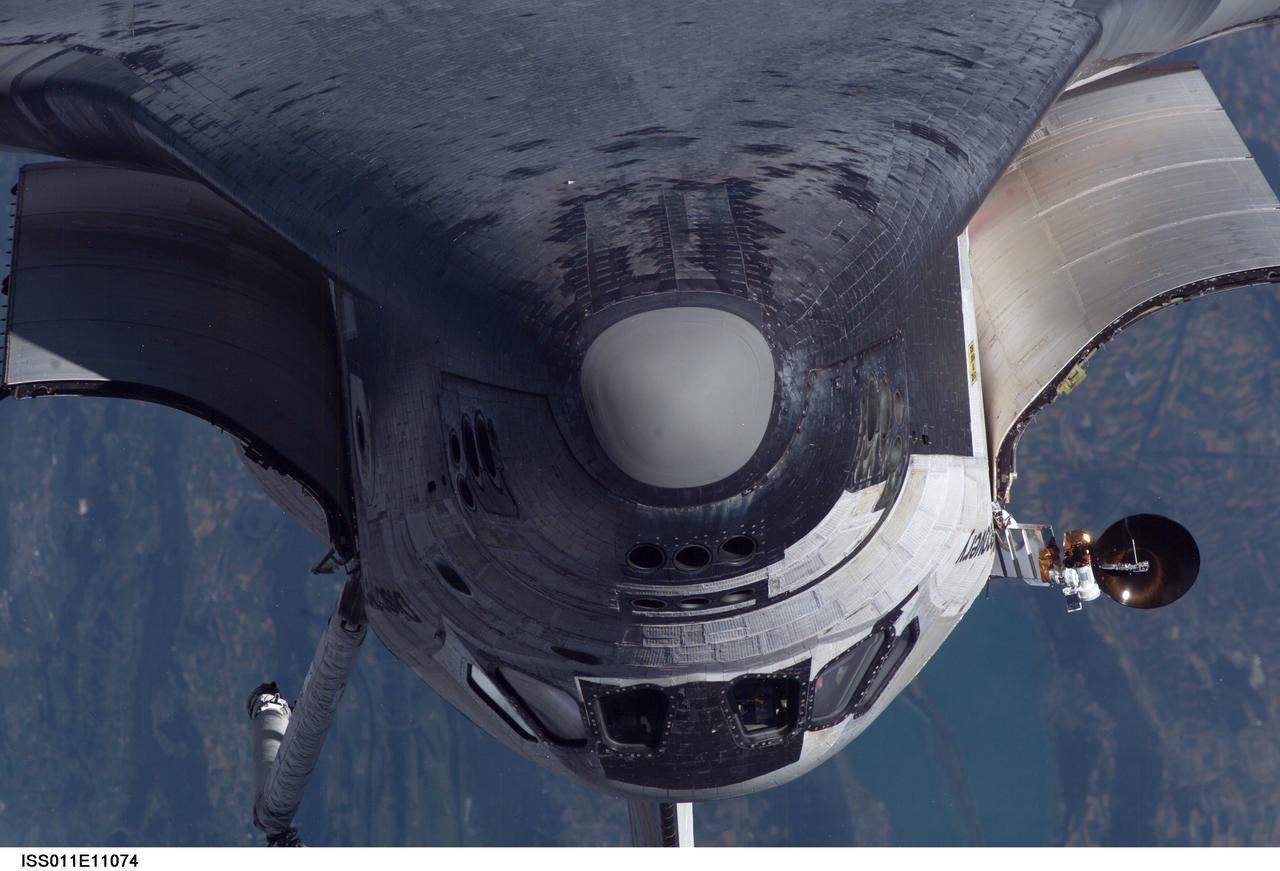
ISS011-E-11074 (28 July 2005) --- This is an image taken by International Space Station (ISS) NASA Science Officer and Flight Engineer John Phillips of the Space Shuttle Discovery as it approached the Station and peformed a backflip to allow photography of its heat shield. Phillips used a 400 mm lens for this photo. Discovery was about 600 feet from the Station. Station Commander Sergei Krikalev and Phillips took photos for about a minute and a half as Discovery Commander Eileen Collins guided the spacecraft through the flip. Krikalvev used an 800 mm lens. The photos will be analyzed by engineers on the ground as additional data to evaluate the condition of Discovery's heat shield.
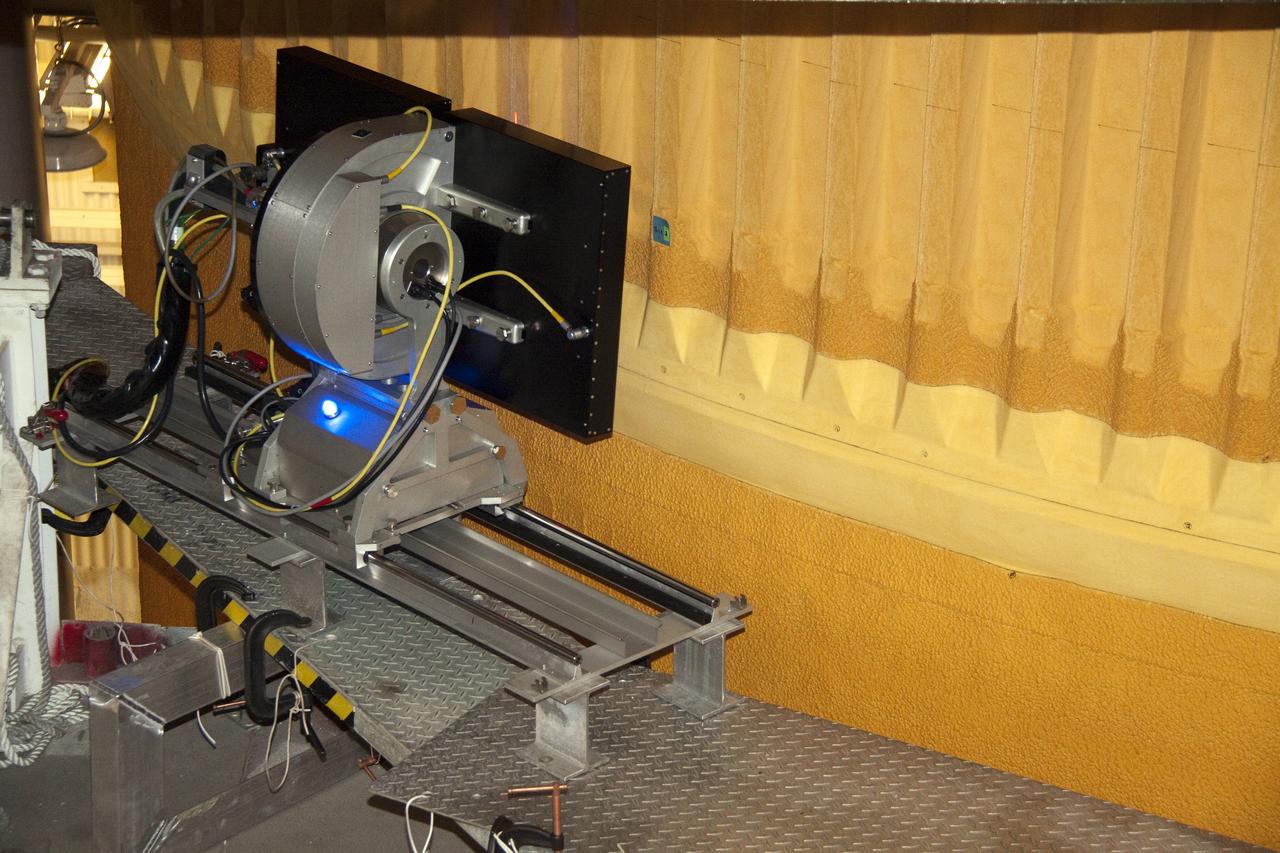
CAPE CANAVERAL, Fla. – An engineer analyzes data from NASA's C-band Debris Radar antenna at a site on North Merritt Island in Florida. One of the largest of its kind in the world, the C-band radar provided critical support to pinpoint debris during the launch of space shuttle Atlantis on the STS-125 mission. The need for this radar was identified after the Columbia tragedy. It worked together with smaller X-band radars placed on the solid rocket booster ship Liberty Star and the U.S. Army landing craft utility ship Brandy Station. Together they provided extremely high resolution images of any debris that created by Atlantis during launch. Photo credit: NASA/Troy Cryder
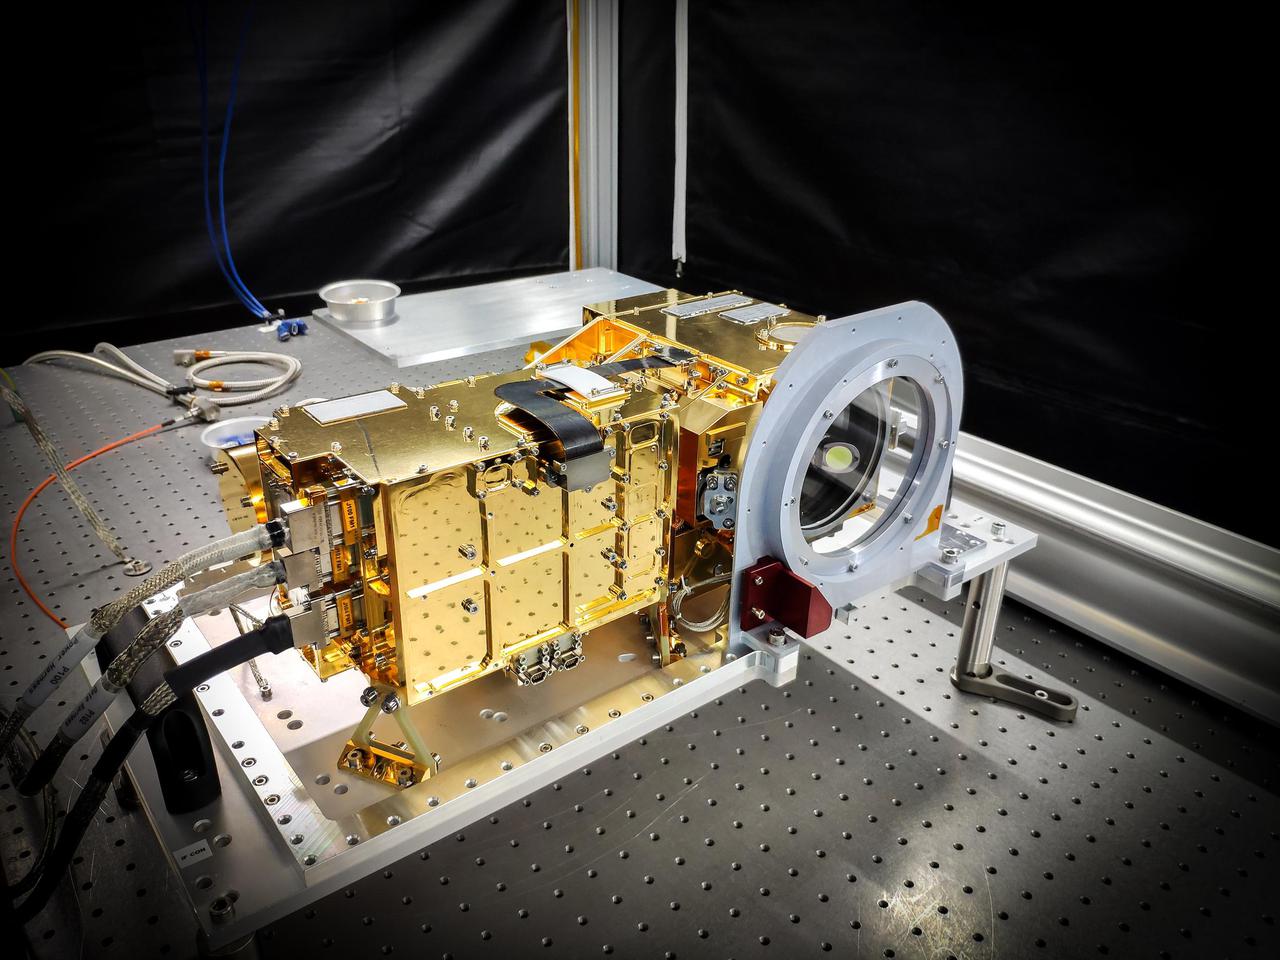
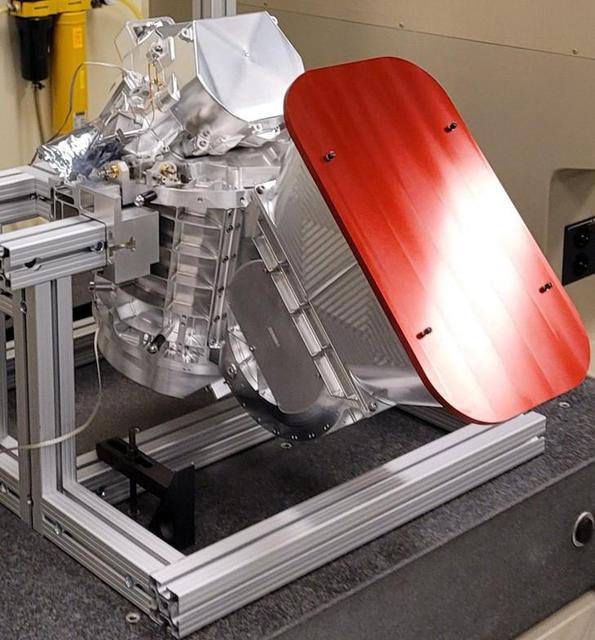
SuperCam's mast unit before being installed atop the Perseverance rover's remote sensing mast. SuperCam fires a laser at rock or soil targets up to 20 feet (7 meters) away, and then analyzes the vaporized rock to reveal the composition. SuperCam's telescope peers out through a window seen on the right side of the unit, above a microphone (hidden by a red protective cover in this image), which will pick up the sounds of rocks being vaporized by the laser. The electronics are inside the gold-plated box on the left. The end of the laser peeks out from behind the left side of the electronics. https://photojournal.jpl.nasa.gov/catalog/PIA24208

NASA's Aqua satellite and RapidScat instrument analyzed Super typhoon Soudelor's extent and winds as it reached Category Five typhoon status on the Saffir-Simpson Wind Scale. On Aug. 4, 2015, at 4:10 UTC (12:10 a.m. EDT) the MODIS instrument aboard NASA's Aqua satellite captured this visible-light image of Super typhoon Soudelor. Read more: <a href="http://www.nasa.gov/feature/goddard/2015/soudelor-northwestern-pacific-ocean" rel="nofollow">www.nasa.gov/feature/goddard/2015/soudelor-northwestern-p...</a> Credits: NASA Goddard's MODIS Rapid Response Team
CAPE CANAVERAL, Fla. -- A backscatter device continues to give engineers data on the intertank region of space shuttle Discovery's external fuel tank while it is in the Vehicle Assembly Building at NASA's Kennedy Space Center in Florida. Engineers at various NASA centers are analyzing, testing and imaging the intertank's support beams, called stringers, to make sure the tank is structurally sound for flight. Discovery's next launch opportunity to the International Space Station on the STS-133 mission is no earlier than Feb. 3, 2011. For more information on STS-133, visit www.nasa.gov/mission_pages/shuttle/shuttlemissions/sts133/. Photo credit: NASA/Jack Pfaller
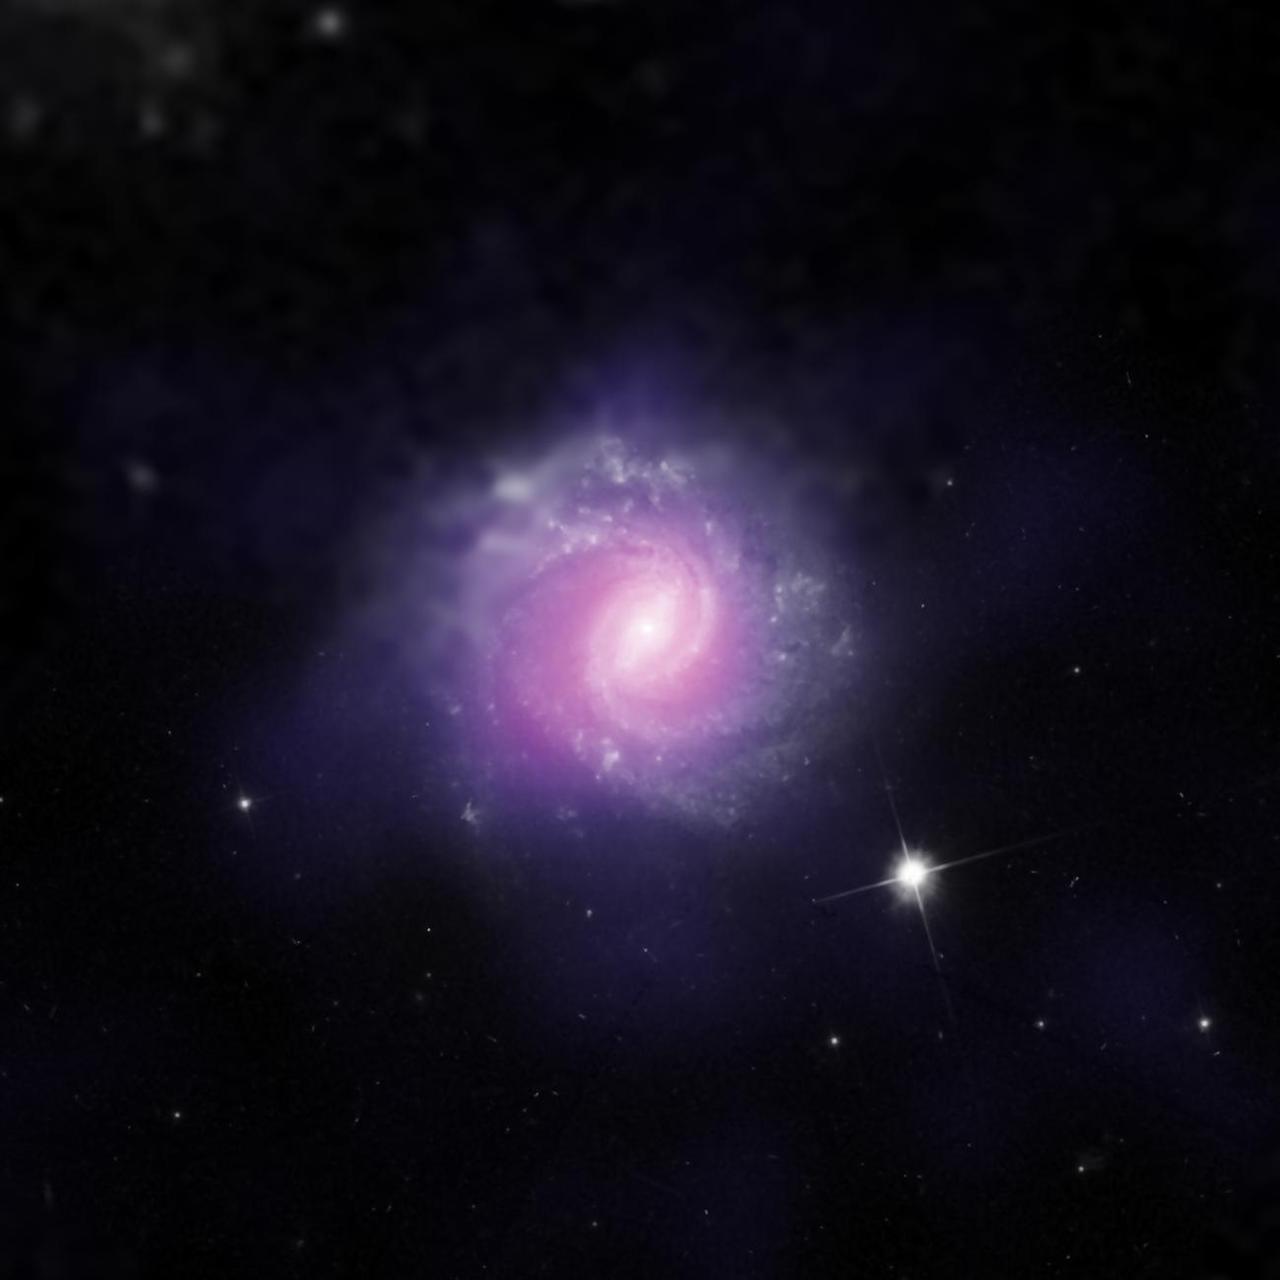
IC 3639, a galaxy with an active galactic nucleus, is seen in this image combining data from the Hubble Space Telescope and the European Southern Observatory. This galaxy contains an example of a supermassive black hole hidden by gas and dust. Researchers analyzed NuSTAR data from this object and compared them with previous observations from NASA's Chandra X-Ray Observatory and the Japanese-led Suzaku satellite. The findings from NuSTAR, which is more sensitive to higher energy X-rays than these observatories, confirm the nature of IC 3639 as an active galactic nucleus that is heavily obscured, and intrinsically much brighter than observed. http://photojournal.jpl.nasa.gov/catalog/PIA21087

This artist's concept depicts the 140-mile-wide (226-kilometer-wide) asteroid Psyche, which lies in the main asteroid belt between Mars and Jupiter. Psyche is the focal point of NASA's mission of the same name. The Psyche spacecraft is set to launch in August 2022 and arrive at the asteroid in 2026, where it will orbit for 21 months and investigate its composition. Scientists think that Psyche, unlike most other asteroids that are rocky or icy bodies, is made up of mostly iron and nickel — similar to the Earth's core. Exploring the asteroid could give valuable insight into how our own planet and others formed. The Psyche team will use a magnetometer to measure the asteroid's magnetic field. A multispectral imager will capture images of the surface, as well as data about the Psyche's composition and topography. Spectrometers will analyze the neutrons and gamma rays coming from the surface to reveal the elements that make up the asteroid itself. https://photojournal.jpl.nasa.gov/catalog/PIA23876
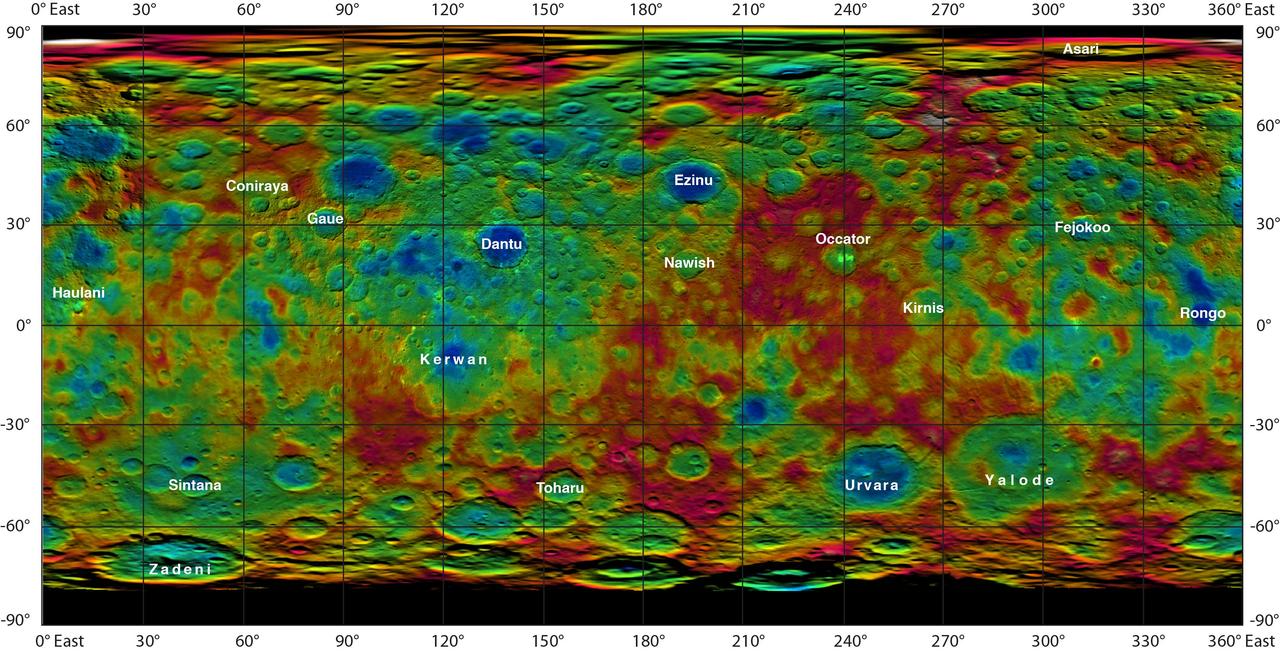
This color-coded map from NASA Dawn mission shows the highs and lows of topography on the surface of dwarf planet Ceres. It is labeled with names of features approved by the International Astronomical Union. Occator, the mysterious crater containing Ceres' mysterious bright spots, is named after the Roman agriculture deity of harrowing, a method of leveling soil. They retain their bright appearance in this map, although they are color-coded in the same green elevation of the crater floor in which they sit. The color scale extends about 5 miles (7.5 kilometers) below the surface in indigo to 5 miles (7.5 kilometers) above the surface in white. The topographic map was constructed from analyzing images from Dawn's framing camera taken from varying sun and viewing angles. The map was combined with an image mosaic of Ceres and projected as an simple cylindrical projection. http://photojournal.jpl.nasa.gov/catalog/PIA19606
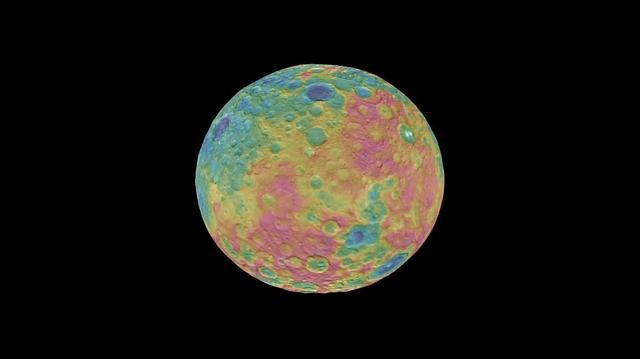
This frame from an animation shows a color-coded map from NASA Dawn mission revealing the highs and lows of topography on the surface of dwarf planet Ceres. The color scale extends 3.7 miles (6 kilometers) below the surface in purple to 3.7 miles (6 kilometers) above the surface in brown. The brightest features (those appearing nearly white) -- including the well-known bright spots within a crater in the northern hemisphere -- are simply reflective areas, and do not represent elevation. The topographic map was constructed from analyzing images from Dawn's framing camera taken from varying sun and viewing angles. The map was combined with an image mosaic of Ceres and projected onto a 3-D shape model of the dwarf planet to create the animation. http://photojournal.jpl.nasa.gov/catalog/PIA19605
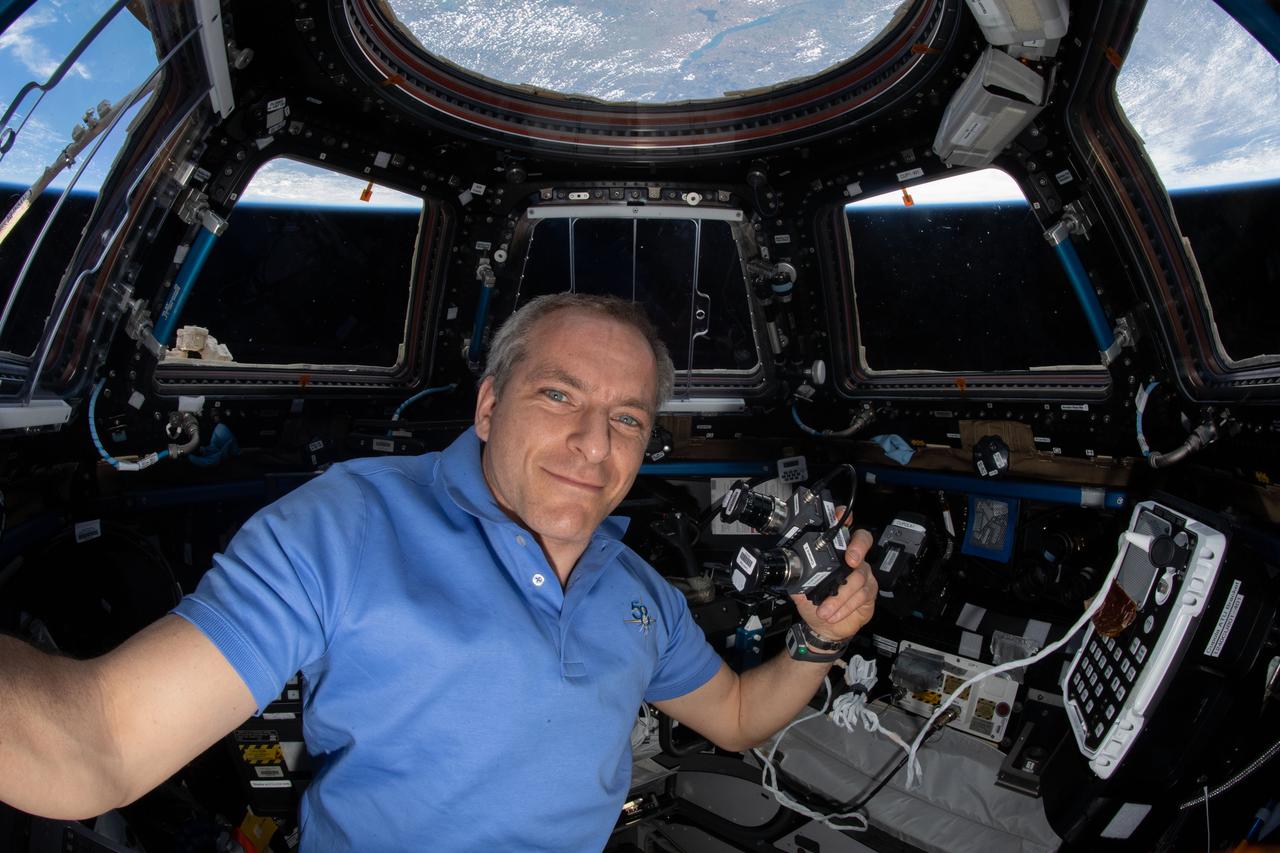
iss058e007457 (1/29/2019) --- Canadian Space Agency astronaut David Saint-Jacques is shown in the cupola onboard the International Space Station (ISS) with a camera assembly similar to that used by the Orion Optical Navigation System. The Optical Navigation (Optical Nav) investigation is a technology demonstration used to validate the backup navigation system for the Orion Multi-Purpose Crew Vehicle. Images of the Moon and adjacent star fields are being collected by these two cameras from the ISS cupola. The images are then analyzed on the ground using the same algorithms that will fly onboard Orion to determine vehicle position. These derived position measurements will be compared to the known position of the ISS at the moment each photo was taken. This will help validate the optical navigation performance using ISS as the test vehicle.
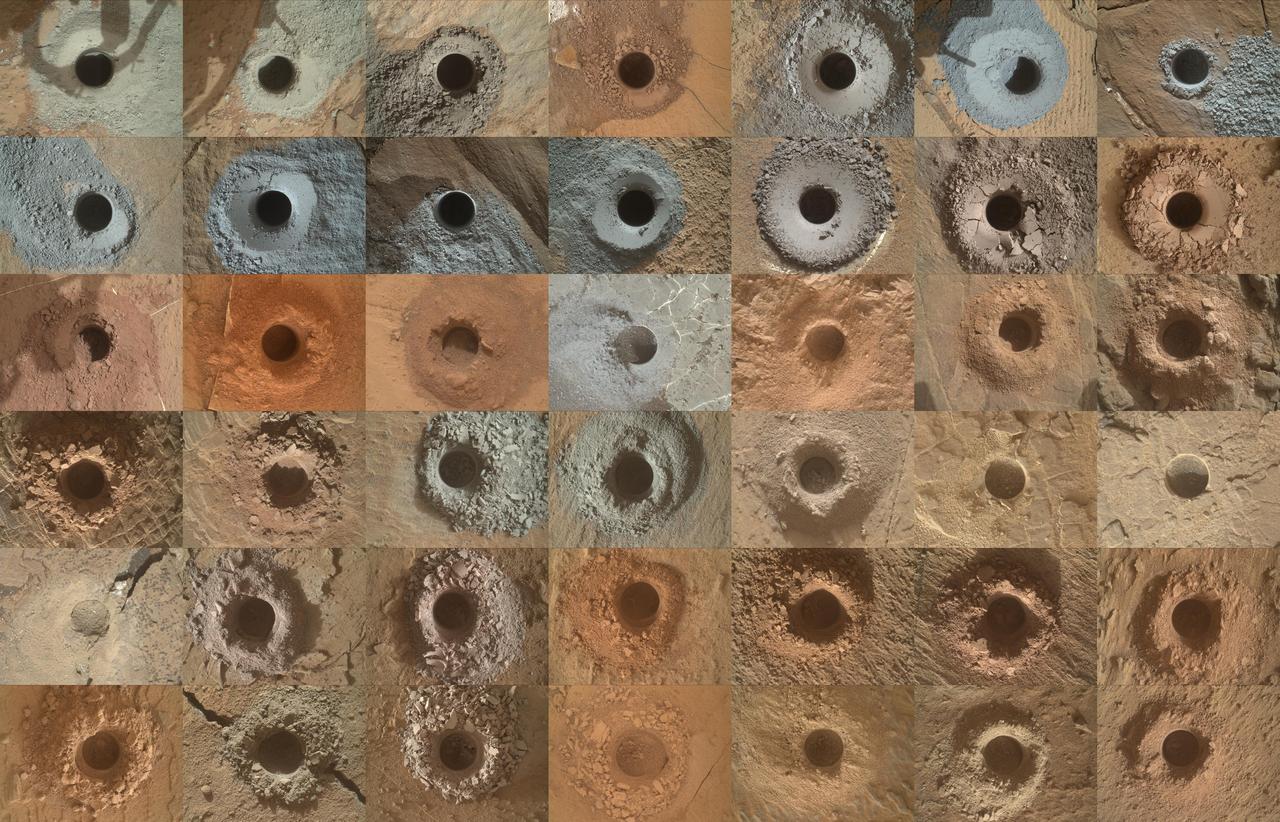
NASA's Curiosity Mars rover has collected 42 powderized rock samples with the drill on the end of its robotic arm. This grid shows all 42 holes made by the drill when collecting the samples, from "John Klein" (drilled on Feb. 9, 2013, the 182nd Martian day, or sol, of the mission) in the upper left, to "Kings Canyon" (drilled on Aug. 3, 2024, the 4,263rd Martian day, or sol, of the mission) in the lower right. Each hole is a little over a half-inch (16 millimeters) wide. The images were captured by the Mars Hand Lens Imager (MAHLI), a camera on the end of the rover's arm. After drilling a sample, the powderized rock is trickled into instruments inside of Curiosity's belly that can analyze the composition of the rocks. Those instruments include Sample Analysis at Mars (SAM) and Chemistry & Mineralogy (CheMin). https://photojournal.jpl.nasa.gov/catalog/PIA26403
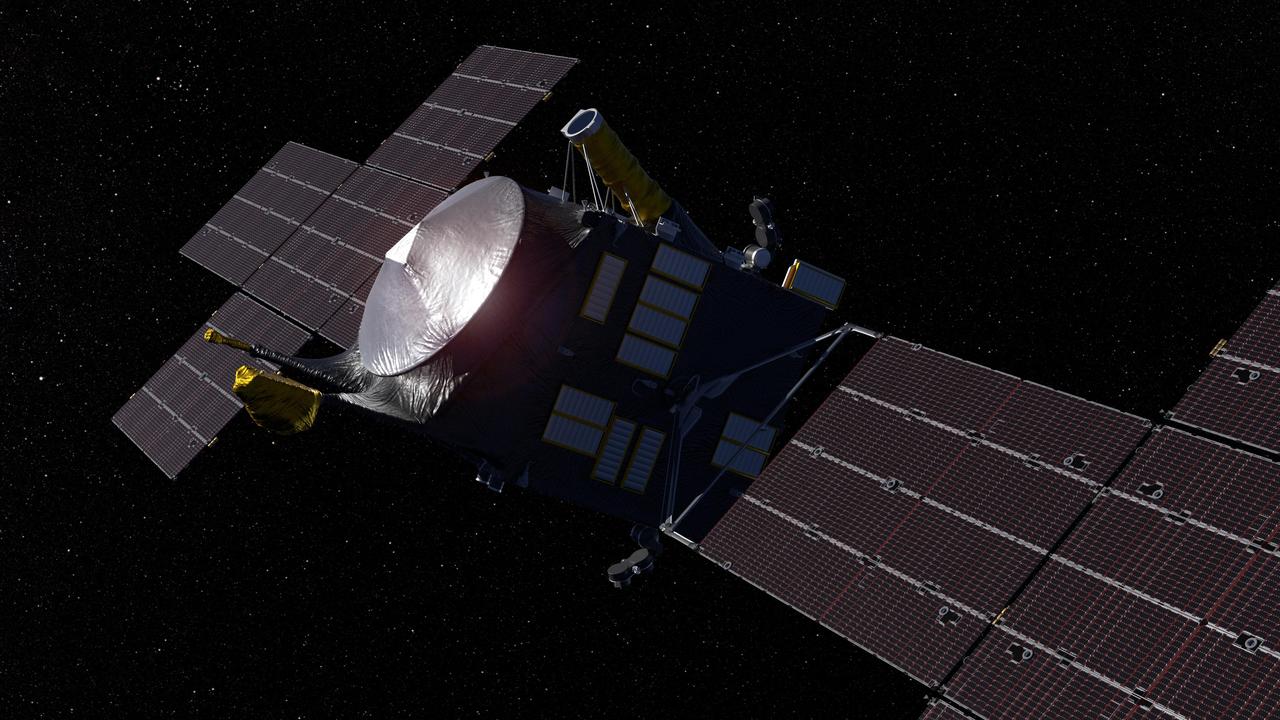
This artist's concept, updated as of June 2020, depicts NASA's Psyche spacecraft. Set to launch in August 2022, the Psyche mission will explore a metal-rich asteroid of the same name that lies in the main asteroid belt between Mars and Jupiter. The spacecraft will arrive in early 2026 and orbit the asteroid for nearly two years to investigate its composition. Scientists think that Psyche, unlike most other asteroids that are rocky or icy bodies, is made up of mostly iron and nickel — similar to the Earth's core. The Psyche team will use a magnetometer to measure the asteroid's magnetic field. A multispectral imager will capture images of the surface, as well as data about the Psyche's composition and topography. Spectrometers will analyze the neutrons and gamma rays coming from the surface to reveal the elements that make up the asteroid itself. https://photojournal.jpl.nasa.gov/catalog/PIA23875
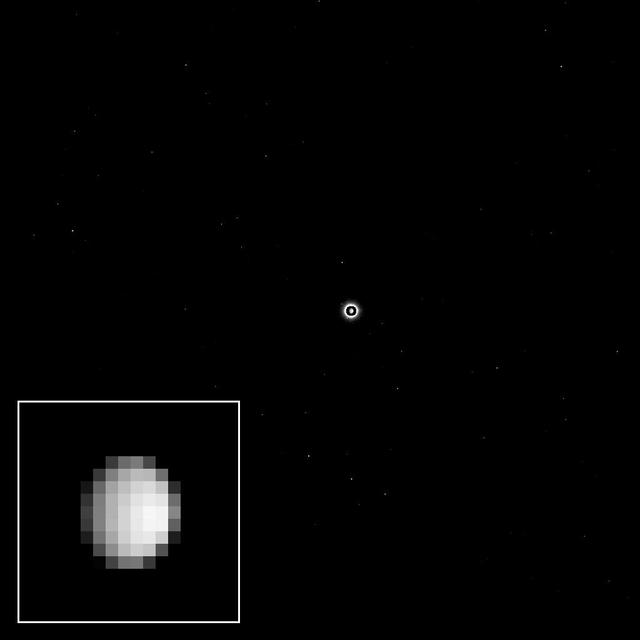
As the Dawn spacecraft flies through space toward the dwarf planet Ceres, the unexplored world appears to its camera as a bright light in the distance, full of possibility for scientific discovery. This view was acquired as part of a final calibration of the science camera before Dawn's arrival at Ceres. To accomplish this, the camera needed to take pictures of a target that appears just a few pixels across. On Dec. 1, 2014, Ceres was about nine pixels in diameter, nearly perfect for this calibration. The images provide data on very subtle optical properties of the camera that scientists will use when they analyze and interpret the details of some of the pictures returned from orbit. Ceres is the bright spot in the center of the image. Because the dwarf planet is much brighter than the stars in the background, the camera team selected a long exposure time to make the stars visible. The long exposure made Ceres appear overexposed, and exaggerated its size; this was corrected by superimposing a shorter exposure of the dwarf planet in the center of the image. A cropped, magnified view of Ceres appears in the inset image at lower left. The image was taken on Dec. 1, 2014 with the Dawn spacecraft's framing camera, using a clear spectral filter. Dawn was about 740,000 miles (1.2 million kilometers) from Ceres at the time. Ceres is 590 miles (950 kilometers) across and was discovered in 1801. http://photojournal.jpl.nasa.gov/catalog/PIA19050
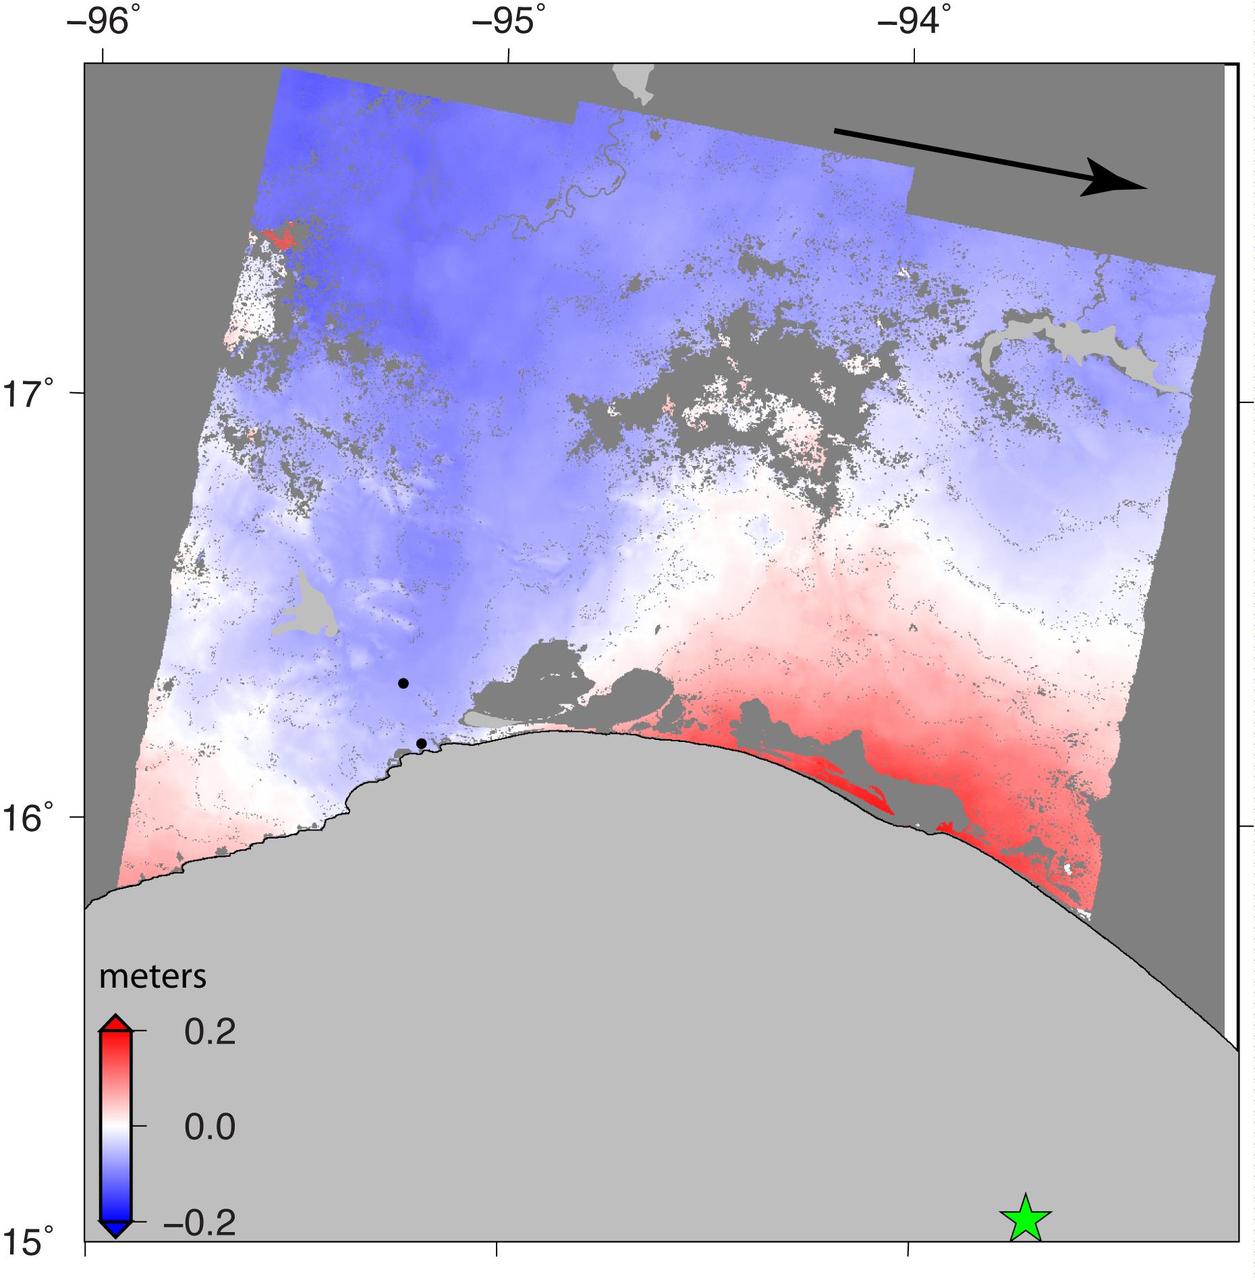
NASA and its partners are contributing important observations and expertise to the ongoing response to the Sept. 7, 2017 (local time), magnitude 8.1 Oaxaca-Chiapas earthquake in Mexico. This earthquake was the strongest in more than a century in Mexico. It has caused a significant humanitarian crisis, with widespread building damage and triggered landslides throughout the region. Scientists with the Advanced Rapid Imaging and Analysis project (ARIA), a collaboration between NASA's Jet Propulsion Laboratory in Pasadena, California; and Caltech, also in Pasadena, analyzed interferometric synthetic aperture radar images from the radar instrument on the Copernicus Sentinel-1A and Sentinel-1B satellites operated by the European Space Agency (ESA) to calculate a map of the deformation of Earth's surface caused by the quake. This false-color map shows the amount of permanent surface movement caused almost entirely by the earthquake, as viewed by the satellite, during a six-day interval between radar images acquired by the two Sentinel-1 satellites on Sept. 7 and Sept. 13, 2017. In this map, the colors of the surface displacements are proportional to the surface motion. The red tones show the areas along the coast of Chiapas and Oaxaca have moved toward the satellite by as much as 9 inches (22 centimeters) in a combination of up and eastward motion. The area in between and farther north with various shades of blue moved away from the satellite, mostly downward or westward, by as much as 6 inches (15 centimeters). Areas without color are open water or heavy vegetation, which prevent the radar from measuring change between the satellite images. Scientists use these maps to build detailed models of the fault slip at depth and associated land movements to better understand the impact on future earthquake activity. The green star shows the location of the earthquake epicenter estimated by the United States Geological Survey (USGS) National Earthquake Information Center. Map contains modified Copernicus Sentinel data 2017, processed by ESA and analyzed by the NASA-JPL/Caltech ARIA team. This research was carried out at JPL under a contract with NASA. Sentinel-1 data were accessed through the Copernicus Open Access Hub. An annotated figures is available at https://photojournal.jpl.nasa.gov/catalog/PIA21962
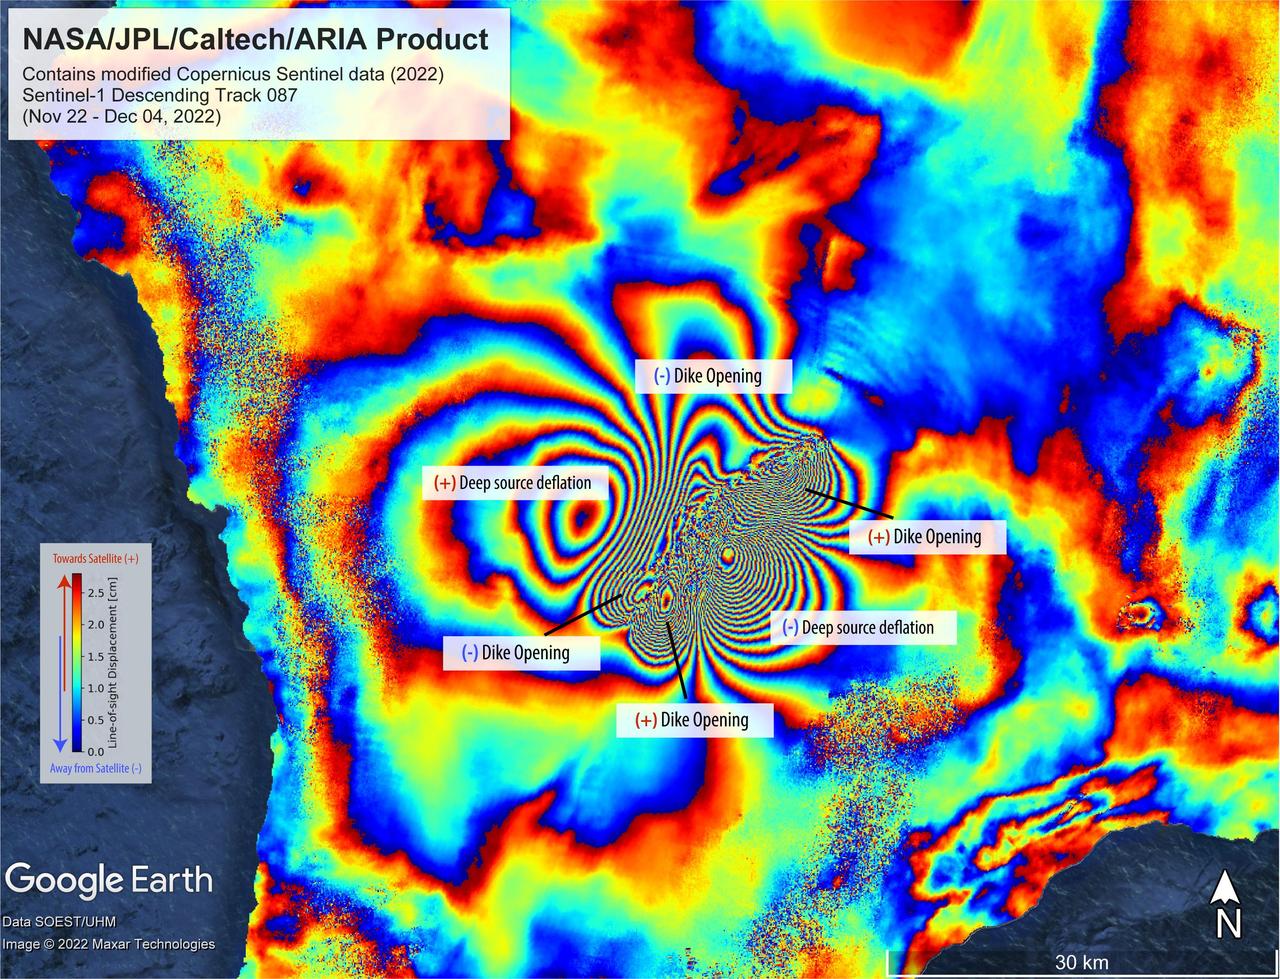
On Nov. 27, 2022, Mauna Loa, Earth's largest active volcano, began erupting from the summit caldera inside Hawaii Volcanoes National Park. Scientists with the Advanced Rapid Imaging and Analysis project (ARIA), a collaboration between NASA's Jet Propulsion Laboratory and the California Institute of Technology, which manages JPL for the agency, analyzed synthetic aperture radar images from the Copernicus Sentinel-1 satellites operated by ESA (European Space Agency) to calculate a map of the Earth's ground movement as a result of the eruption. Using images acquired before and after the start of the eruption – Nov. 22 and Dec. 4, 2022, respectively – scientists produced this false-color map showing the amount of ground surface movement, or displacement, the eruption caused. In the map, surface displacements are seen as color contours, or "fringes," where each color cycle represents about 2.8 centimeters of surface motion. The direction of the ground movement (whether toward or away from the satellite) is indicated by the color cycle (from outer to inner direction). A positive (+) indication, meaning "ground moved towards satellite," has a color cycle of blue-green-yellow-orange-red. A negative (-) indication, meaning "ground moved away from the satellite," has a color cycle of red-orange-yellow-green-blue. The broader fringes are representative of deep source processes within the volcano. In this case, a broad tabular source of magma deflated and fed the eruption as magma or lava was being supplied, somewhat like a deflating balloon (only tabular in shape) that shrank because pressure was relieved. The dense fringes marked as "dike opening" are a signature of the ground rupturing (or opening) as the magma made its way towards the Earth's surface. Scientists use these maps to build detailed models of subsurface volcanic processes to better forecast and understand the impact of future volcanic activity. The Sentinel-1 data were provided by ESA. The image contains modified Copernicus 2022 data, processed by ESA and analyzed by NASA-JPL. https://photojournal.jpl.nasa.gov/catalog/PIA25525
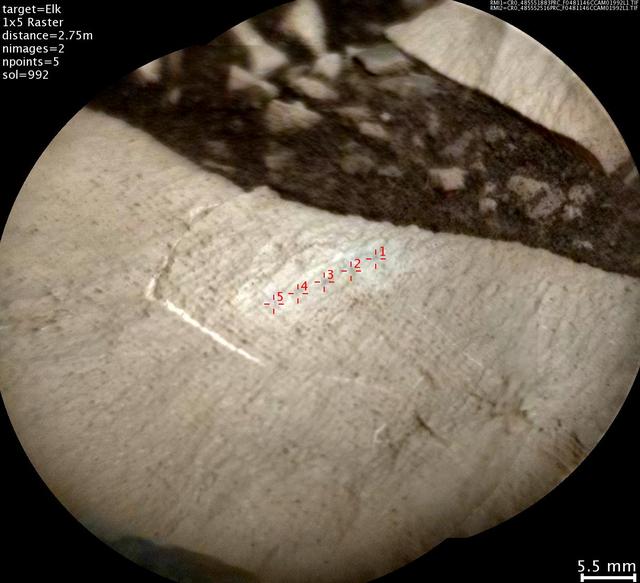
This image from the Chemistry and Camera (ChemCam) instrument on NASA's Curiosity Mars rover shows detailed texture of a rock target called "Elk" on Mars' Mount Sharp, revealing laminations that are present in much of the Murray Formation geological unit of lower Mount Sharp. Researchers also used ChemCam's laser and spectrometers to assess Elk's composition and found it to be rich in silica. The image covers a patch of rock surface about 2.8 inches (7 centimeters) across. It was taken on May 22, 2015, during the mission's 992nd Martian day, or sol. ChemCam's Remote Micro-Imager camera, on top of Curiosity's mast, captured the image from a distance of about 9 feet (2.75 meters). Annotations in red identify five points on Elk that were hit with ChemCam's laser. Each of the highlighted points is a location where ChemCam fired its laser 30 times to ablate a tiny amount of target material. By analyzing the light emitted from this laser-ablation, researchers can deduce the composition of that point. For some purposes, composition is presented as a combination of the information from multiple points on the same rock. However, using the points individually can track fine-scale variations in targets. http://photojournal.jpl.nasa.gov/catalog/PIA20267
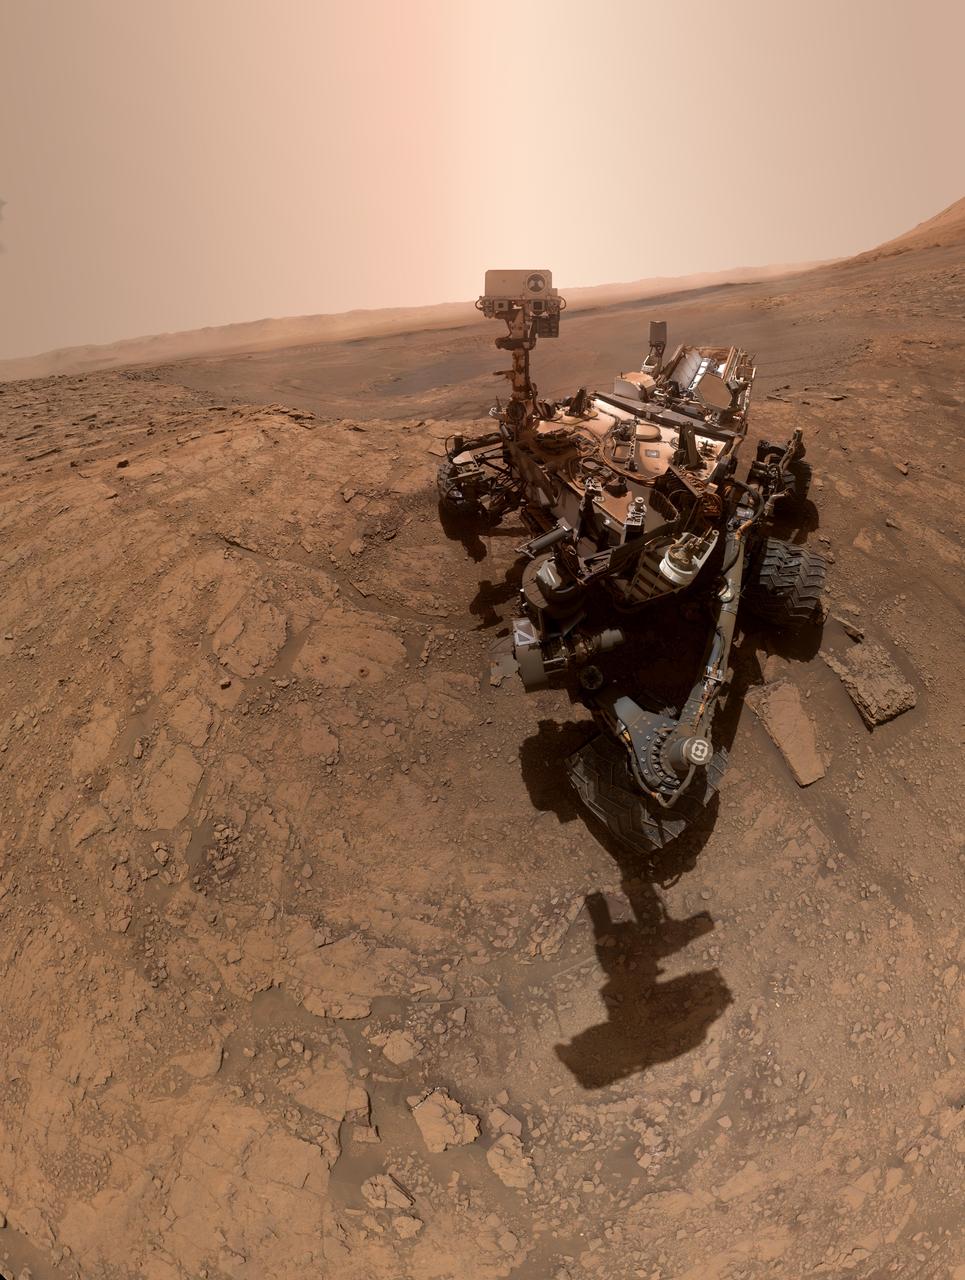
NASA's Curiosity rover took this selfie on Oct. 11, 2019, the 2,553rd Martian day, or sol, of its mission. The rover drilled twice in this location, nicknamed "Glen Etive" (pronounced "glen EH-tiv"). About 984 feet (300 meters) behind the rover, Vera Rubin Ridge rises up. Behind it lies the floor of Gale Crater, which Curiosity is exploring, and the northern rim of the crater. Just left of the rover are the two drill holes, called "Glen Etive 1" (right) and "Glen Etive 2" (left). Curiosity performed its first wet-chemistry experiment on a drilled sample at this location. The rover can analyze the chemical composition of rock samples by powderizing them with the drill, then dropping the samples into a portable lab in its belly called Sample Analysis at Mars (SAM). This panorama is made up of 57 individual images taken by the Mars Hand Lens Imager (MAHLI), a camera on the end of the rover's robotic arm. The images are stitched together into a panorama; the robotic arm isn't visible in the parts of the images used in the composite. https://photojournal.jpl.nasa.gov/catalog/PIA23378
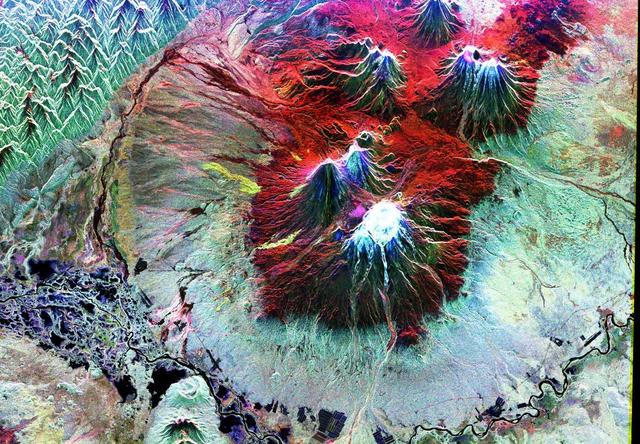
This is an image of the area of Kliuchevskoi volcano, Kamchatka, Russia, which began to erupt on September 30, 1994. Kliuchevskoi is the blue triangular peak in the center of the image, towards the left edge of the bright red area that delineates bare snow cover. The image was acquired by the Spaceborne Imaging Radar-C/X-band Synthetic Aperture Radar (SIR-C/X-SAR) aboard the space shuttle Endeavour on its 88th orbit on October 5, 1994. The image shows an area approximately 75 kilometers by 100 kilometers (46 miles by 62 miles) that is centered at 56.07 degrees north latitude and 160.84 degrees east longitude. North is toward the bottom of the image. The radar illumination is from the top of the image. The Kamchatka volcanoes are among the most active volcanoes in the world. The volcanic zone sits above a tectonic plate boundary, where the Pacific plate is sinking beneath the northeast edge of the Eurasian plate. The Endeavour crew obtained dramatic video and photographic images of this region during the eruption, which will assist scientists in analyzing the dynamics of the recent activity. The colors in this image were obtained using the following radar channels: red represents the L-band (horizontally transmitted and received); green represents the L-band (horizontally transmitted and vertically received); blue represents the C-band (horizontally transmitted and vertically received). In addition to Kliuchevskoi, two other active volcanoes are visible in the image. Bezymianny, the circular crater above and to the right of Kliuchevskoi, contains a slowly growing lava dome. Tolbachik is the large volcano with a dark summit crater near the upper right edge of the red snow covered area. The Kamchatka River runs from right to left across the bottom of the image. The current eruption of Kliuchevskoi included massive ejections of gas, vapor and ash, which reached altitudes of 15,000 meters (50,000 feet). Melting snow mixed with volcanic ash triggered mud flows on the flanks of the volcano. Paths of these flows can be seen as thin lines in various shades of blue and green on the north flank in the center of the image. http://photojournal.jpl.nasa.gov/catalog/PIA01765
CAPE CANAVERAL, Fla. -- In the Payload Hazardous Servicing Facility at NASA's Kennedy Space Center in Florida, spacecraft technicians examine the Mars Science Laboratory (MSL) rover, Curiosity, to ensure that the proper steps have been taken to stow the spacecraft's robotic arm. The arm will hold and maneuver instruments that will help scientists analyze Martian rocks and soil. Much like a human arm, the robotic arm has flexibility through shoulder, elbow, and wrist joints that permit the arm to extend, bend, and angle precisely against rocks and soil to grind away layers, take microscopic images and analyze their elemental composition. At the end of the arm is a hand-like structure, the turret, for holding various tools that can spin through a 350-degree turning range. A United Launch Alliance Atlas V-541 configuration will be used to loft MSL into space. Curiosity’s 10 science instruments are designed to search for evidence on whether Mars has had environments favorable to microbial life, including chemical ingredients for life. The unique rover will use a laser to look inside rocks and release its gasses so that the rover’s spectrometer can analyze and send the data back to Earth. MSL is scheduled to launch Nov. 25 from Space Launch Complex 41 on Cape Canaveral Air Force Station in Florida. For more information, visit http://www.nasa.gov/msl. Photo credit: NASA/Charisse Nahser
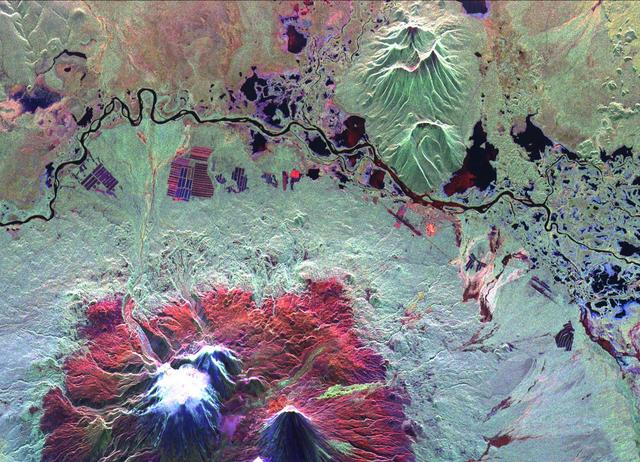
This is an image of the Kliuchevskoi volcano, Kamchatka, Russia, which began to erupt on September 30, 1994. Kliuchevskoi is the bright white peak surrounded by red slopes in the lower left portion of the image. The image was acquired by the Spaceborne Imaging Radar-C and X-band Synthetic Aperture Radar aboard the space shuttle Endeavour on its 25th orbit on October 1, 1994. The image shows an area approximately 30 kilometers by 60 kilometers (18.5 miles by 37 miles) that is centered at 56.18 degrees north latitude and 160.78 degrees east longitude. North is toward the top of the image. The Kamchatka volcanoes are among the most active volcanoes in the world. The volcanic zone sits above a tectonic plate boundary, where the Pacific plate is sinking beneath the northeast edge of the Eurasian plate. The Endeavour crew obtained dramatic video and photographic images of this region during the eruption, which will assist scientists in analyzing the dynamics of the current activity. The colors in this image were obtained using the following radar channels: red represents the L-band (horizontally transmitted and received); green represents the L-band (horizontally transmitted and vertically received); blue represents the C-band (horizontally transmitted and vertically received). The Kamchatka River runs from left to right across the image. An older, dormant volcanic region appears in green on the north side of the river. The current eruption included massive ejections of gas, vapor and ash, which reached altitudes of 20,000 meters (65,000 feet). New lava flows are visible on the flanks of Kliuchevskoi, appearing yellow/green in the image, superimposed on the red surfaces in the lower center. Melting snow triggered mudflows on the north flank of the volcano, which may threaten agricultural zones and other settlements in the valley to the north. http://photojournal.jpl.nasa.gov/catalog/PIA01731

NASA's Airborne Visible Infrared Imaging Spectrometer instrument (AVIRIS), flying aboard a NASA Armstrong Flight Research Center high-altitude ER-2 aircraft, observed wildfires burning in Southern California on Dec. 5-7, 2017. AVIRIS is an imaging spectrometer that observes light in visible and infrared wavelengths, measuring the full spectrum of radiated energy. Unlike regular cameras with three colors, AVIRIS has 224 spectral channels, measuring contiguously from the visible through the shortwave infrared. Data from these flights, compared against measurements acquired earlier in the year, show many ways this one instrument can improve both our understanding of fire risk and the response to fires in progress. The top row in this image compilation shows pre-fire data acquired from June 2017. At top left is a visible-wavelength image similar to what our own eyes would see. The top middle image is a map of surface composition based on analyzing the full electromagnetic spectrum, revealing green vegetated areas and non-photosynthetic vegetation that is potential fuel as well as non-vegetated surfaces that may slow an advancing fire. The image at top right is a remote measurement of the water in tree canopies, a proxy for how much moisture is in the vegetation. The bottom row in the compilation shows data acquired from the Thomas fire in progress in December 2017. At bottom left is a visible wavelength image. The bottom middle image is an infrared image, with red at 2,250 nanometers showing fire energy, green at 1,650 nanometers showing the surface through the smoke, and blue at 1,000 nanometers showing the smoke itself. The image at bottom right is a fire temperature map using spectroscopic analysis to measure fire thermal emission recorded in the AVIRIS spectra. https://photojournal.jpl.nasa.gov/catalog/PIA22194
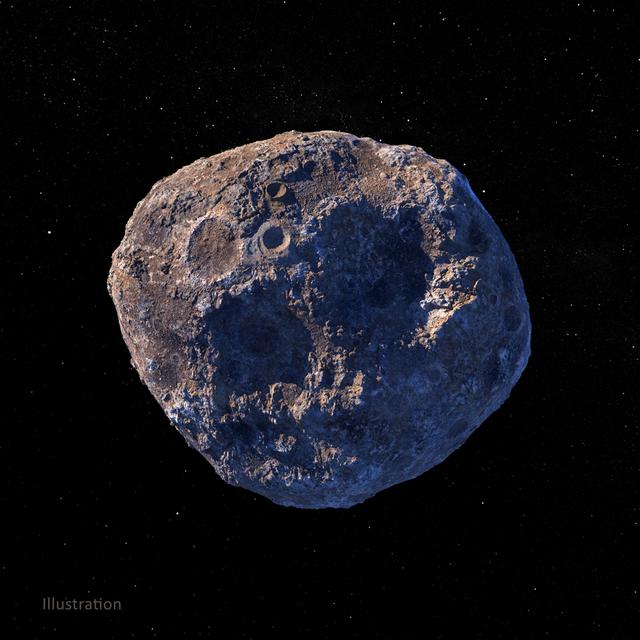
This illustration, created in March 2021, depicts the 140-mile-wide (226-kilometer-wide) asteroid Psyche, which lies in the main asteroid belt between Mars and Jupiter. Psyche is the focal point of NASA's mission of the same name. The Psyche spacecraft is set to launch in August 2022 and arrive at the asteroid in 2026, where it will orbit for 21 months and investigate its composition. Based on data obtained from Earth, scientists believe Psyche is a mixture of metal and rock. The rock and metal may be in large provinces, or areas, on the asteroid — as depicted in an illustration here: PIA24471. Another possibility is that rock and metal may be intimately mixed on a scale too small to detect from orbit — as depicted in the illustration above. Observing and measuring how the metal and rock are mixed will help scientists determine how Psyche formed. Exploring the asteroid could also give valuable insight into how our own planet and others formed. The Psyche team will use a magnetometer to measure the asteroid's magnetic field. A multispectral imager will capture images of the surface, as well as data about the Psyche's composition and topography. Spectrometers will analyze the neutrons and gamma rays coming from the surface to reveal the elements that make up the asteroid itself. The image was created by Peter Rubin. https://photojournal.jpl.nasa.gov/catalog/PIA24472
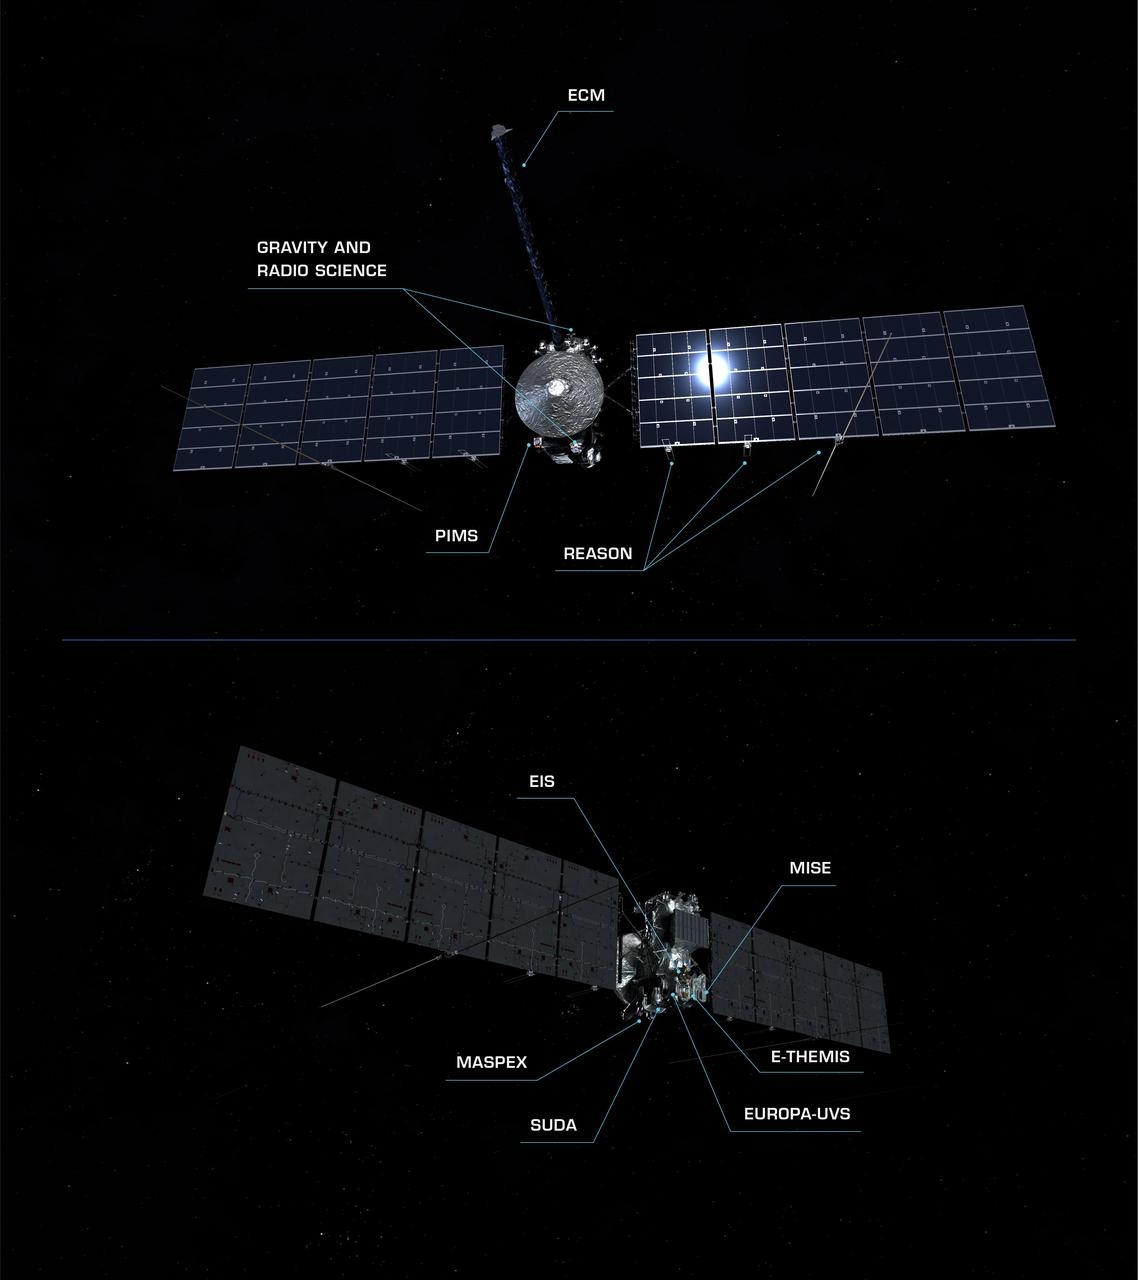
To conduct its detailed investigations of Jupiter's icy moon Europa, NASA's Europa Clipper spacecraft carries a suite of nine science instruments and a gravity experiment that uses its telecommunications system. These components are depicted in this pair of artist's concepts showing each side of the spacecraft, and include: Europa Imaging System (EIS) Europa Thermal Emission Imaging System (E-THEMIS) Europa Ultraviolet Spectrograph (Europa-UVS) Mapping Imaging Spectrometer for Europa (MISE) Europa Clipper Magnetometer (ECM) Plasma Instrument for Magnetic Sounding (PIMS) Radar for Europa Assessment and Sounding: Ocean to Near-surface (REASON) MAss Spectrometer for Planetary EXploration/Europa (MASPEX) Surface Dust Analyzer (SUDA) Gravity and Radio Science Experiment (G/RS) Europa Clipper's three main science objectives are to determine the thickness of the moon's icy shell and its interactions with the ocean below, to investigate its composition, and to characterize its geology. The mission's detailed exploration of Europa will help scientists better understand the astrobiological potential for habitable worlds beyond our planet. https://photojournal.jpl.nasa.gov/catalog/PIA26439
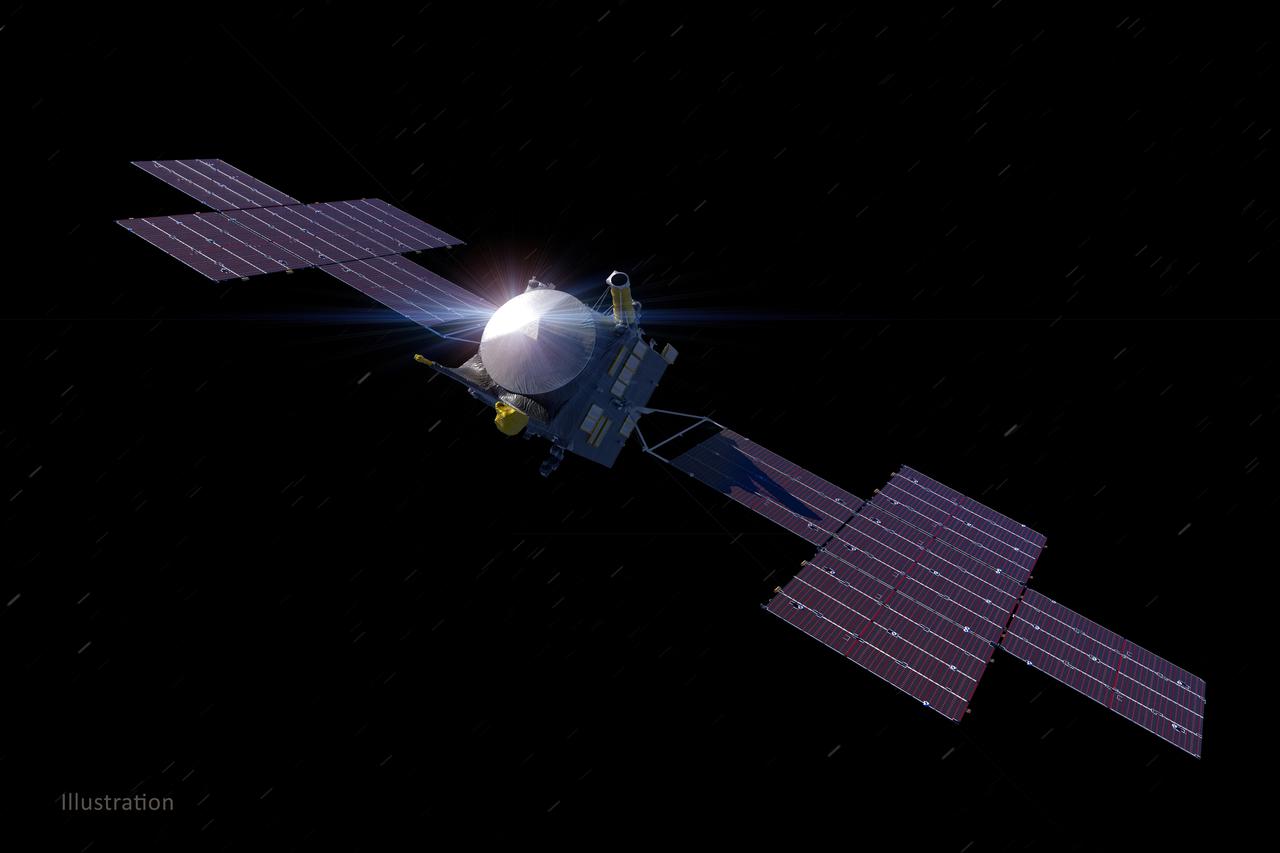
This illustration, updated as of March 2021, depicts NASA's Psyche spacecraft. Set to launch in August 2022, the Psyche mission will explore a metal-rich asteroid of the same name that lies in the main asteroid belt between Mars and Jupiter. The spacecraft will arrive in early 2026 and orbit the asteroid for nearly two years to investigate its composition. Scientists think that Psyche, unlike most other asteroids that are rocky or icy bodies, is made up of mostly iron and nickel — similar to Earth's core. The Psyche team will use a magnetometer to measure the asteroid's magnetic field. A multispectral imager will capture images of the surface, as well as data about Psyche's composition and topography. Spectrometers will analyze the neutrons and gamma rays coming from the surface to reveal the elements that make up the asteroid. Maxar Technologies in Palo Alto, California, built the main body of the spacecraft, called the Solar Electric Propulsion (SEP) Chassis. Maxar also will deliver the five-panel solar arrays, shown here, that will provide the power for the spacecraft systems. The image was created by Peter Rubin. https://photojournal.jpl.nasa.gov/catalog/PIA24473
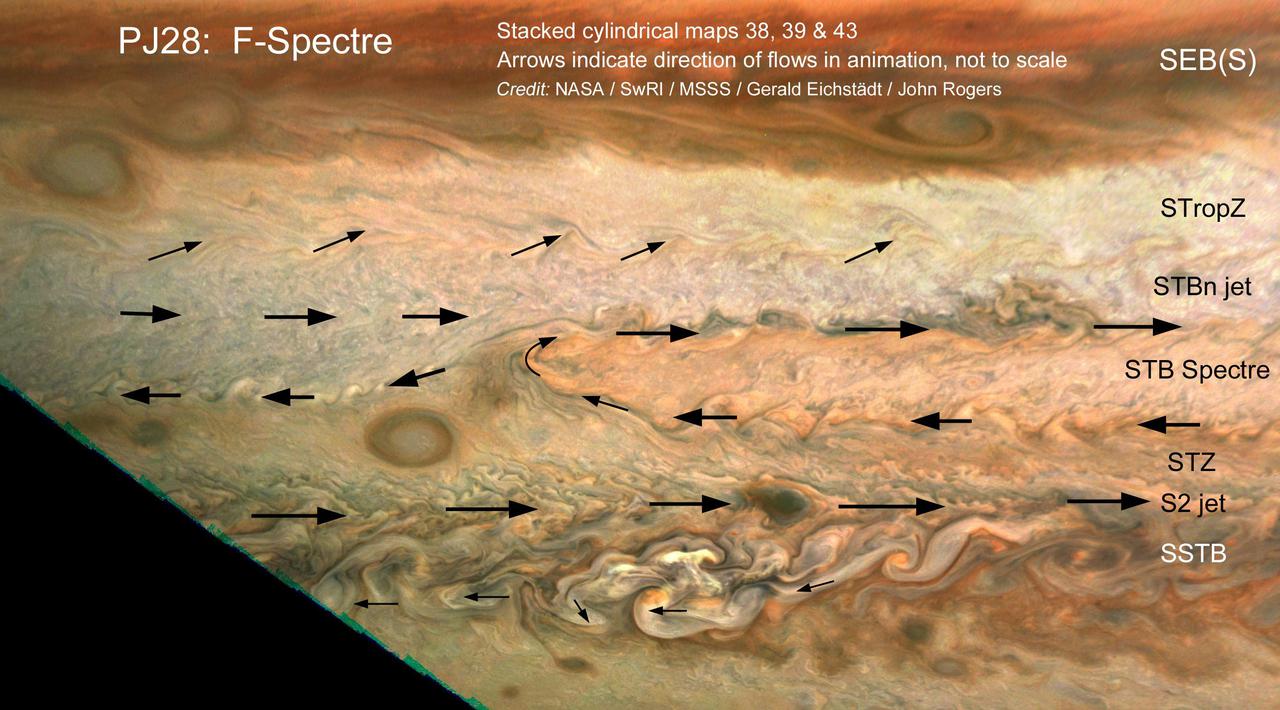
The motion of small clouds on Jupiter is used to determine wind direction (indicated with arrows) in this work by citizen scientists John Rogers and Gerald Eichstädt. Using multiple images to track the motion of clouds was enabled by the Juno spacecraft's slow departure from Jupiter's southern hemisphere on perijove pass 28, on July 25, 2020. Zonal winds are a well-known phenomenon on Jupiter, correlating with its familiar belts and zones. Within a latitudinal band there can be regional circulation, such as the South Temperate Belt (STB) Spectre shown in this image. The STB Spectre is cyclonic (winds rotating in clockwise direction), spread out in latitude but confined in longitude. This work is representative of an ongoing and fruitful collaboration of amateur astronomers with the Juno project. John Rogers analyzed cloud movement in three JunoCam images processed by citizen scientist Gerald Eichstädt to identify winds. Latitudinal belts and zones ( labeled with the conventions used by the amateur astronomy community and professional observers), are: SEB(S): South Equatorial Belt (south); STropZ: South Tropical Zone; STBn jet: South Temperate Belt (north) jet; STZ: South Temperate Zone; and SSTB: South South Temperate Belt. https://photojournal.jpl.nasa.gov/catalog/PIA24235
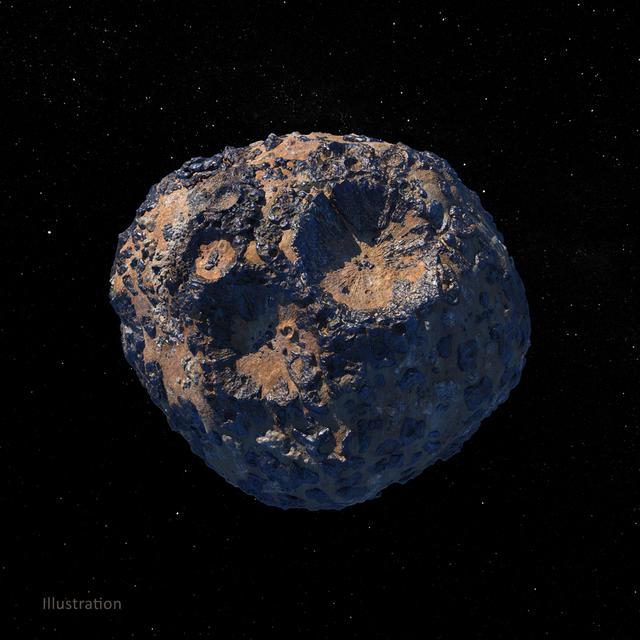
This illustration, created in March 2021, depicts the 140-mile-wide (226-kilometer-wide) asteroid Psyche, which lies in the main asteroid belt between Mars and Jupiter. Psyche is the focal point of NASA's mission of the same name. The Psyche spacecraft is set to launch in August 2022 and arrive at the asteroid in 2026, where it will orbit for 21 months and investigate its composition. Based on data obtained from Earth, scientists believe Psyche is a mixture of metal and rock. The rock and metal may be in large provinces, or areas, on the asteroid — as illustrated in this rendering. Another possibility is that rock and metal may be intimately mixed on a scale too small to detect from orbit — as depicted in an illustration here: PIA24472. Observing and measuring how the metal and rock are mixed will help scientists determine how Psyche formed. Exploring the asteroid could also give valuable insight into how our own planet and others formed. The Psyche team will use a magnetometer to measure the asteroid's magnetic field. A multispectral imager will capture images of the surface, as well as data about the Psyche's composition and topography. Spectrometers will analyze the neutrons and gamma rays coming from the surface to reveal the elements that make up the asteroid itself. The image was created by Peter Rubin. https://photojournal.jpl.nasa.gov/catalog/PIA24471
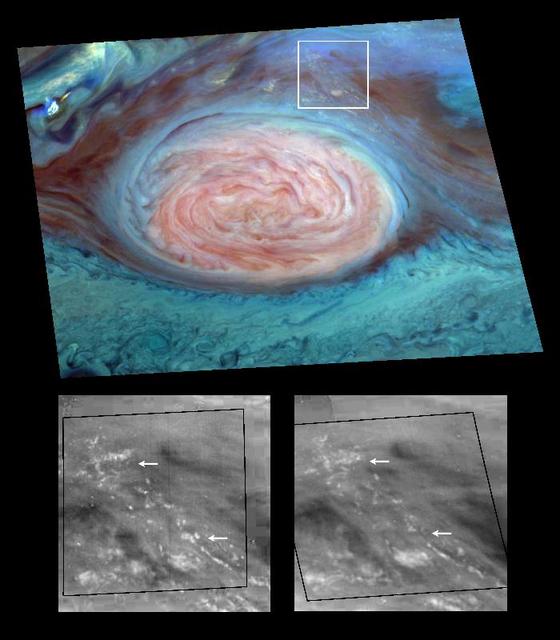
Scientists have spotted what appear to be thunderheads on Jupiter bright white cumulus clouds similar to those that bring thunderstorms on Earth - at the outer edges of Jupiter's Great Red Spot. Images from NASA's Galileo spacecraft now in orbit around Jupiter are providing new evidence that thunderstorms may be an important source of energy for Jupiter's winds that blow at more than 500 kilometers per hour (about 300 miles per hour). The photos were taken by Galileo's solid state imager camera on June 26, 1996 at a range of about 1.4 million kilometers (about 860,000 miles). The image at top is a mosaic of multiple images taken through near-infrared filters. False coloring in the image reveals cloud-top heights. High, thick clouds are white and high, thin clouds are pink. Low-altitude clouds are blue. The two black-and-white images at bottom are enlargements of the boxed area; the one on the right was taken 70 minutes after the image on the left. The arrows show where clouds have formed or dissipated in the short time between the images. The smallest clouds are tens of kilometers across. On Earth, moist convection in thunderstorms is a pathway through which solar energy, deposited at the surface, is transported and delivered to the atmosphere. Scientists at the California Institute of Technology analyzing data from Galileo believe that water, the most likely candidate for what composes these clouds on Jupiter, may be more abundant at the site seen here than at the Galileo Probe entry site, which was found to be unexpectedly dry. http://photojournal.jpl.nasa.gov/catalog/PIA00506
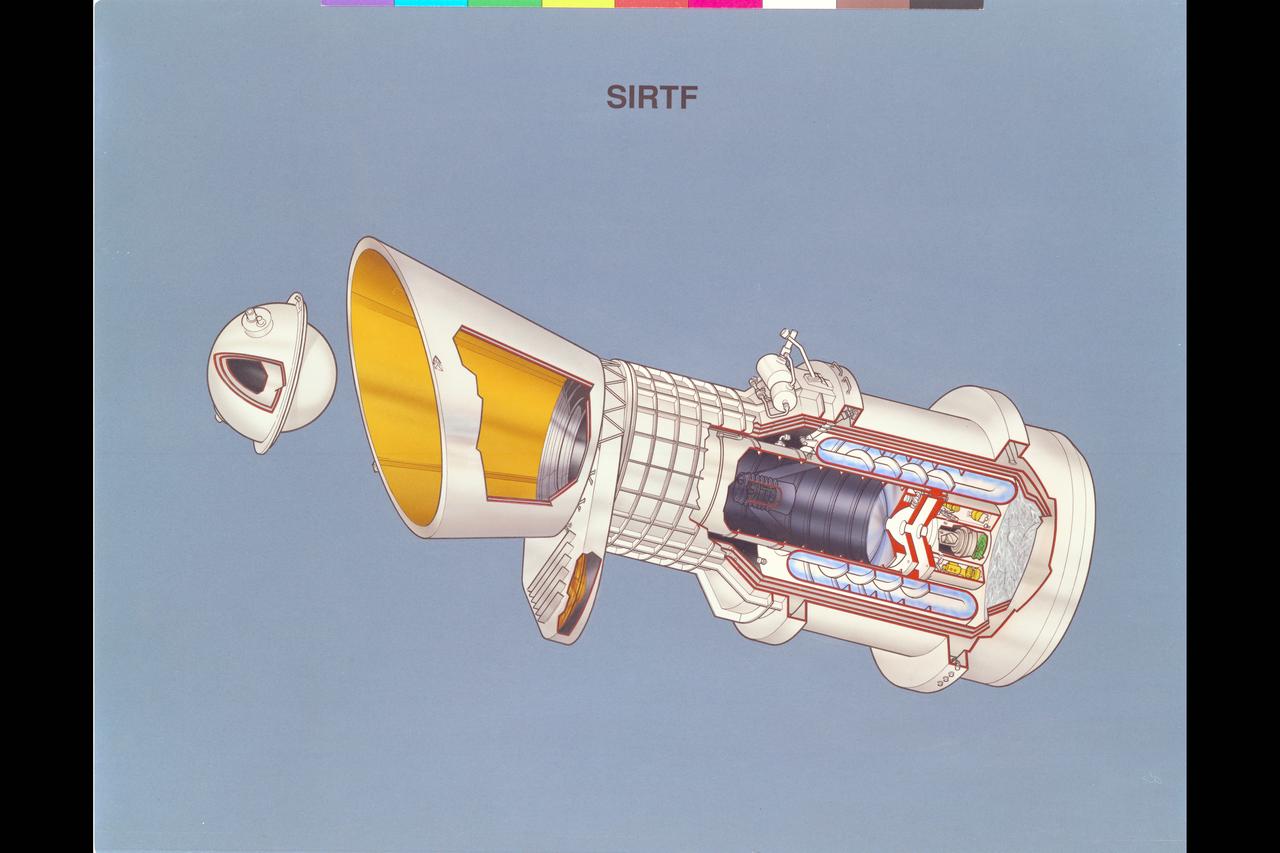
Artist: Rick Guidice SIRTF Artwork update - cutaway Space Infrared Telescope Facility's will orbit at 900 kilometers aboard a platform-type spacecraft, providing power, pointing, and communications to Earth. The telescope and its infrared instruments, will reside within a cylindrical cryogen tank. The hollow walls of the tank will contain the superfluid helium that cools the telescope to its operating temperature, a few degrees above absolute zero. SIRTF will carry three versatile instruments to analyze the radiation it collects, the Multiband Imaging Photometer, the Infrared Array Camera, and the Infrared Spectrograph. SIRTF long lifetime - 5 years or more - will permit astronomers of all disciplines to use the facililty to carry out a wide variety of astrophysical programs. It will provide ongoing coverage of variable objects, such as quasars, as well as the capability to study rare and transient events such as comets and supernovae. SIRTF's long lifetime will also allow it to distinguish nearby objects by detecting their gradual motions relative to the more distant background stars.
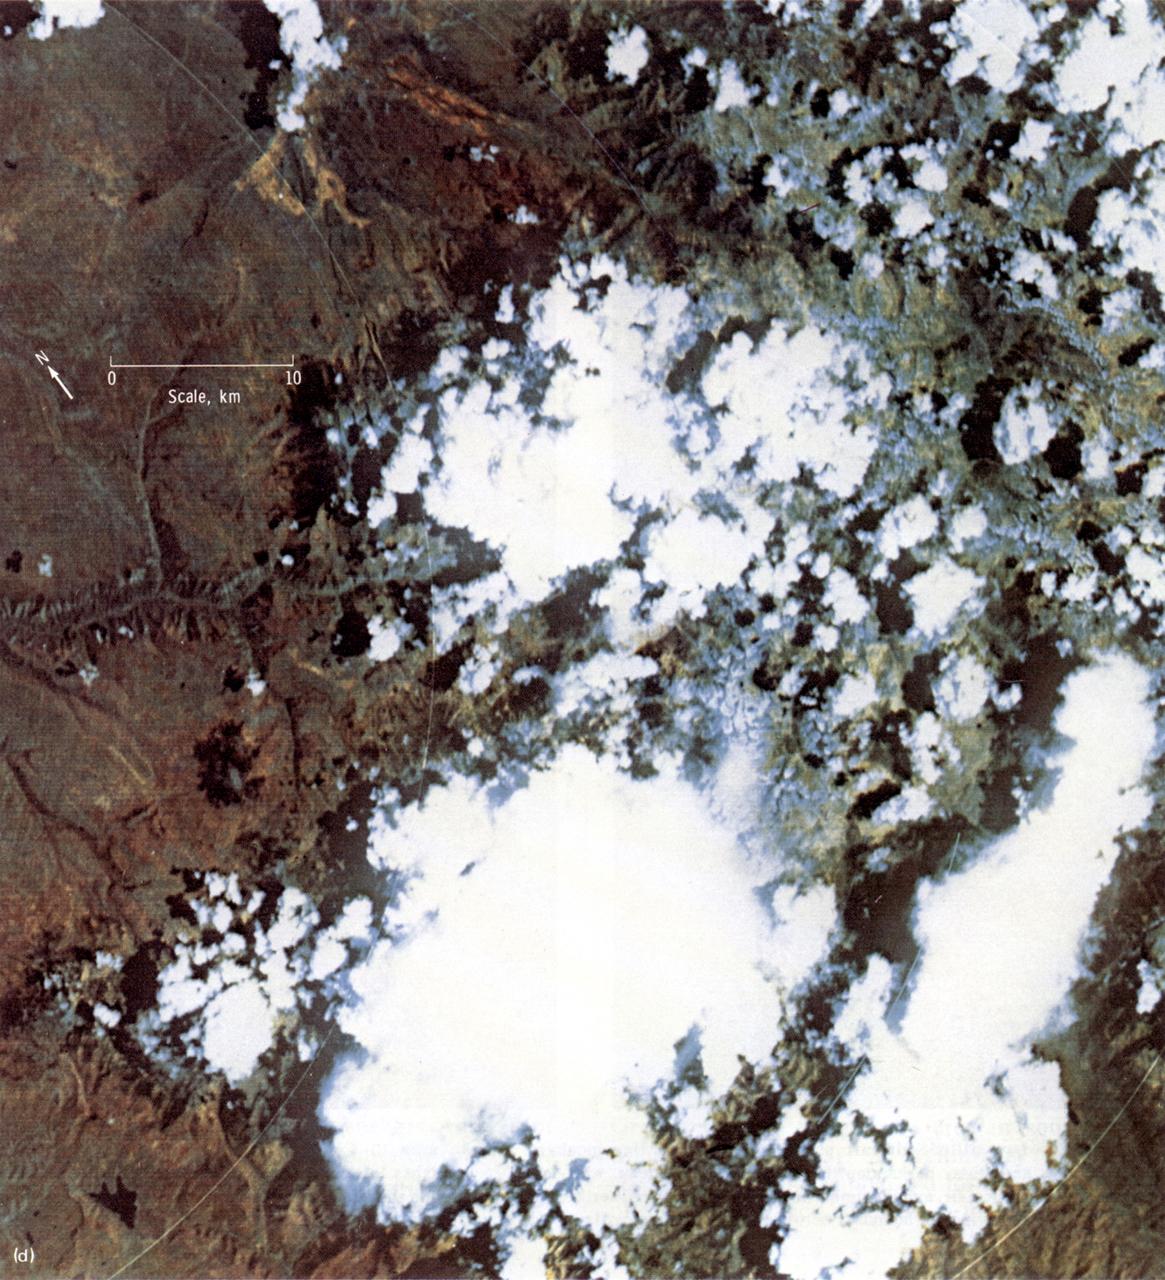
This Earth Resource Experiment Package (EREP) photograph of the Uncompahgre area of Colorado was electronically acquired in September of 1973 by the Multi-spectral Scarner, Skylab Experiment S192. EREP images were used to analyze the vegetation conditions and landscape characteristic of this area. Skylab's Earth sensors played the dual roles of gathering information about the planet and perfecting instruments and techniques for future satellites and manned stations. An array of six fixed cameras, another for high resolution, and the astronauts' handheld cameras photographed surface features. Other instruments, recording on magnetic tape, measured the reflectivity of plants, soils, and water. Radar measured the altitude of land and water surfaces. The sensors' objectives were to survey croplands and forests, identify soils and rock types, map natural features and urban developments, detect sediments and the spread of pollutants, study clouds and the sea, and determine the extent of snow and ice cover.
iss066e114158 (Jan. 15, 2022) --- NASA astronaut and expedition 66 Flight Engineer Kayla Barron snaps pictures of a sample “pit” aboard the International Space Station as part of the SQuARE experiment. This study is adapted from the standard archaeological technique on Earth called the “shovel test pit” and tracks the use and movement of objects in several sample sites throughout the orbiting laboratory. Crew members marked off the sample sites and took pictures at approximately the same every day, and then at randomly selected times. Scientists on the ground will analyze the images to understand how astronauts use objects and spaces over an extended period of time. What we learn could inform design of future space habitats. Credits: International Space Station Archeological Project/NASA
NASA's Jet Propulsion Laboratory in Southern California is building the spectrometer for the agency's Europa Clipper mission. Called the Mapping Imaging Spectrometer for Europa (MISE), it is seen in the midst of assembly in a clean room at JPL. Pronounced "mize," the instrument will analyze infrared light reflected from Jupiter's moon Europa and will map the distribution of organics and salts on the surface to help scientists understand if the moon's global ocean – which lies beneath a thick layer of ice – is habitable. Because of its internal ocean, scientists believe Jupiter's moon Europa may have the potential to harbor existing life. Europa Clipper will swoop around Jupiter on an elliptical path, dipping close to the moon on each flyby. Understanding Europa's habitability will help scientists better understand how life developed on Earth and the potential for finding life beyond our planet. Europa Clipper is set to launch in 2024. https://photojournal.jpl.nasa.gov/catalog/PIA24781
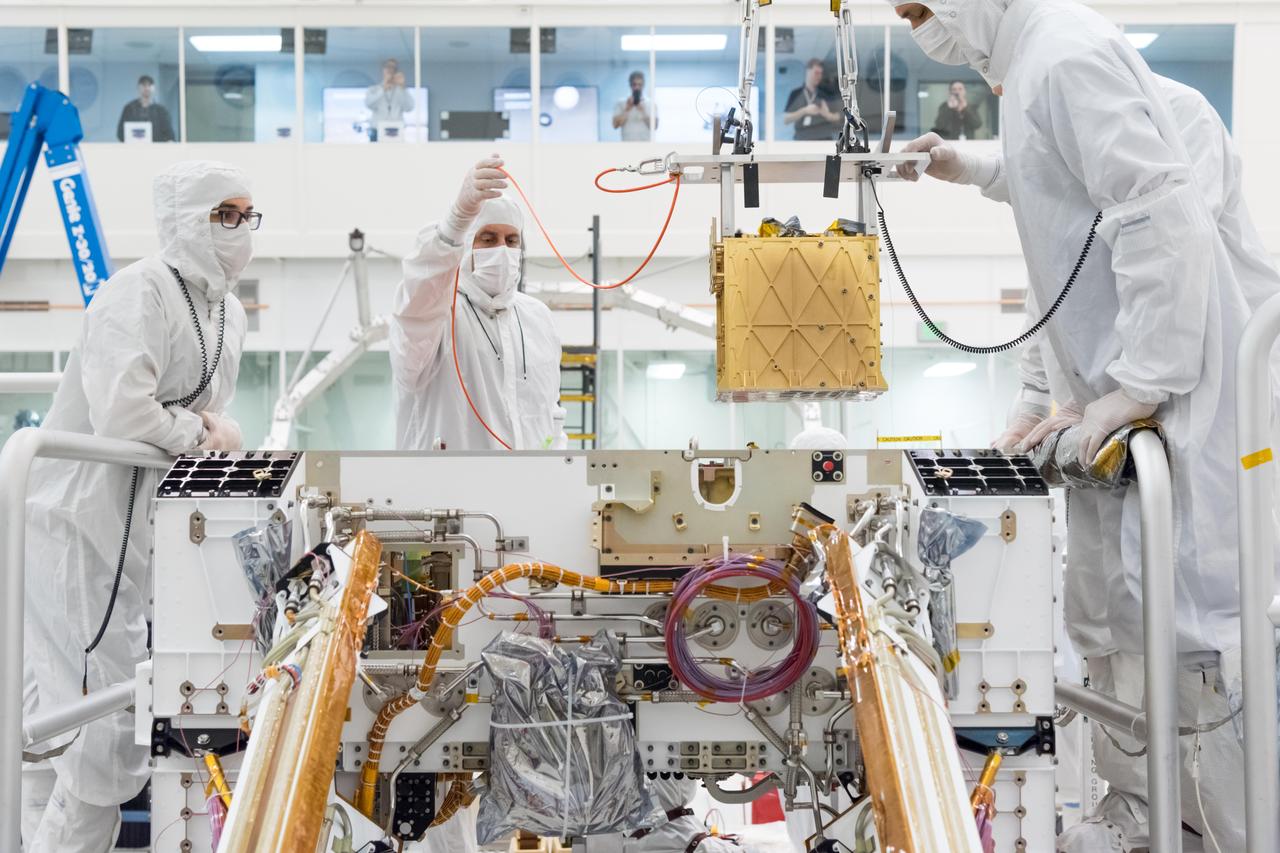
Members of NASA's Mars 2020 project install the Mars Oxygen In-Situ Resource Utilization Experiment (MOXIE) into the chassis of NASA's next Mars rover. MOXIE will demonstrate a way that future explorers might produce oxygen from the Martian atmosphere for propellant and for breathing. The car-battery-sized instrument does this by collecting carbon dioxide (CO2) from the Martian atmosphere and electrochemically splitting the carbon dioxide molecules into oxygen and carbon monoxide molecules. The oxygen is then analyzed for purity before being vented back out to the Martian atmosphere along with the carbon monoxide and other exhaust products. The image was taken on March 20, 2019, in the Spacecraft Assembly Facility's High Bay 1 Cleanroom at NASA's Jet Propulsion Laboratory, in Pasadena, California. https://photojournal.jpl.nasa.gov/catalog/PIA23154
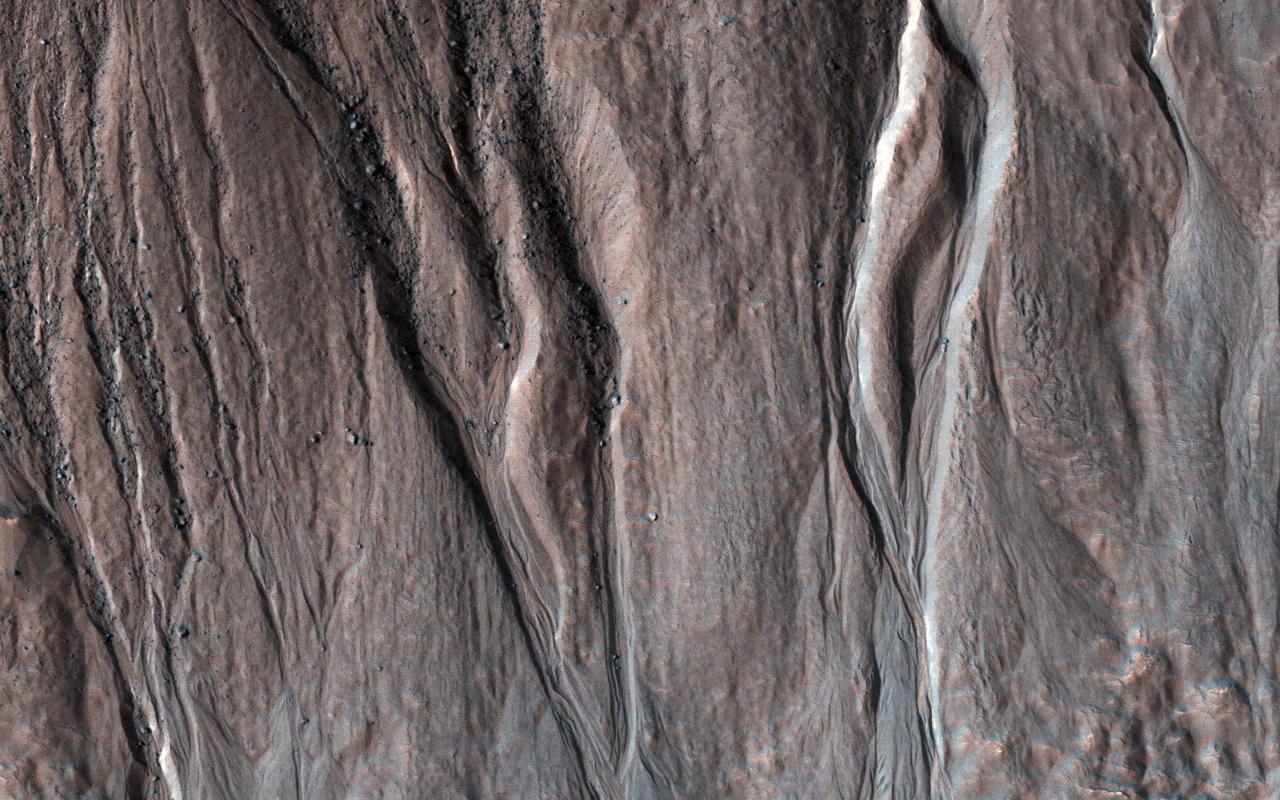
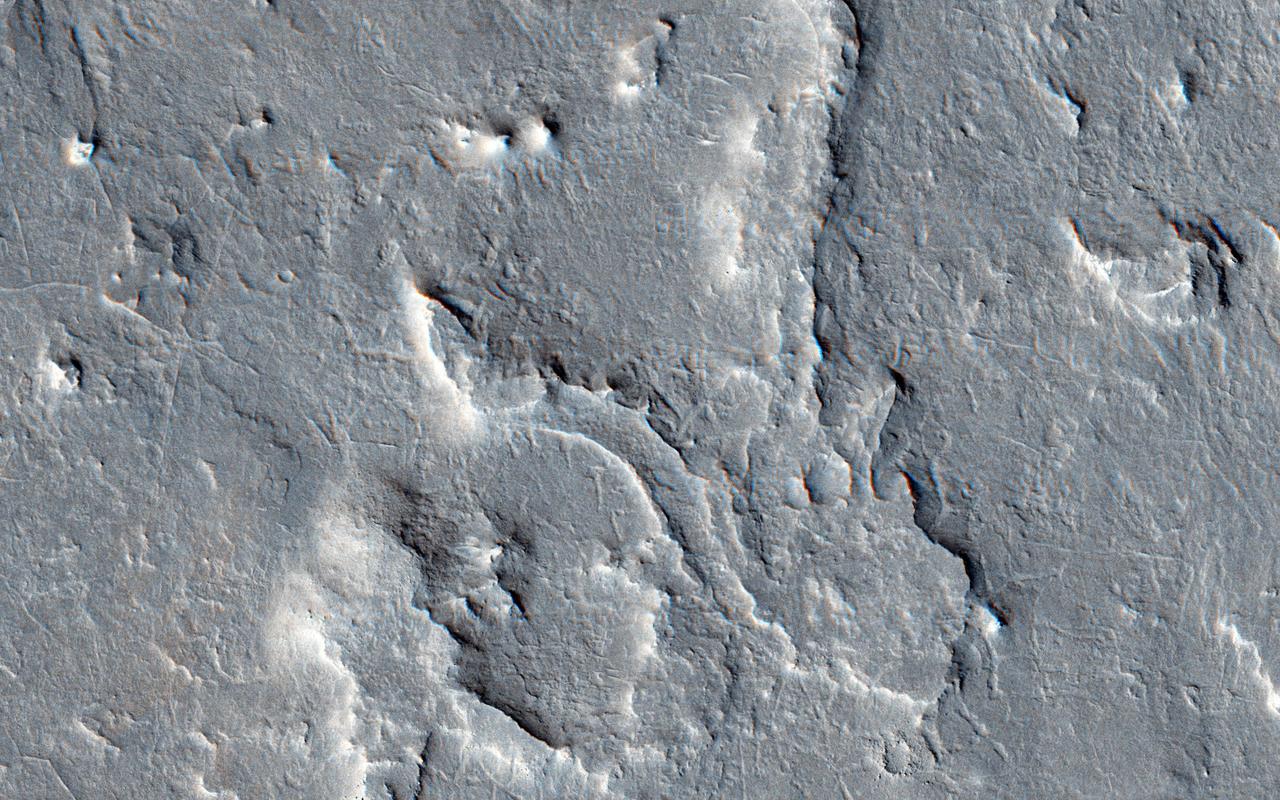
This image shows (part of) a 6-kilometer crater located on the northern slope of Bond Crater. Pole-facing gullies have eroded the northern slope of this small crater, located just west of where Uzboi Valles emanates from Bond and continues in a northerly direction. However, Hale Crater to the south has numerous gullies on its slopes and even on its central peak region. Researchers have analyzed both Bond and Hale Craters to try to determine why Bond has no gullies on its slopes, except for a small 7-km crater on the floor in its central area. (Reiss et al., 2009, PSS). The gullies in this observation have eroded into bedrock layers forming tributaries in the upper slope region and distributary channels further downslope on the debris fans. Research attributes these features to fluvial processes. (Gulick et al., 2018, Geol. Soc. London.) https://photojournal.jpl.nasa.gov/catalog/PIA25504
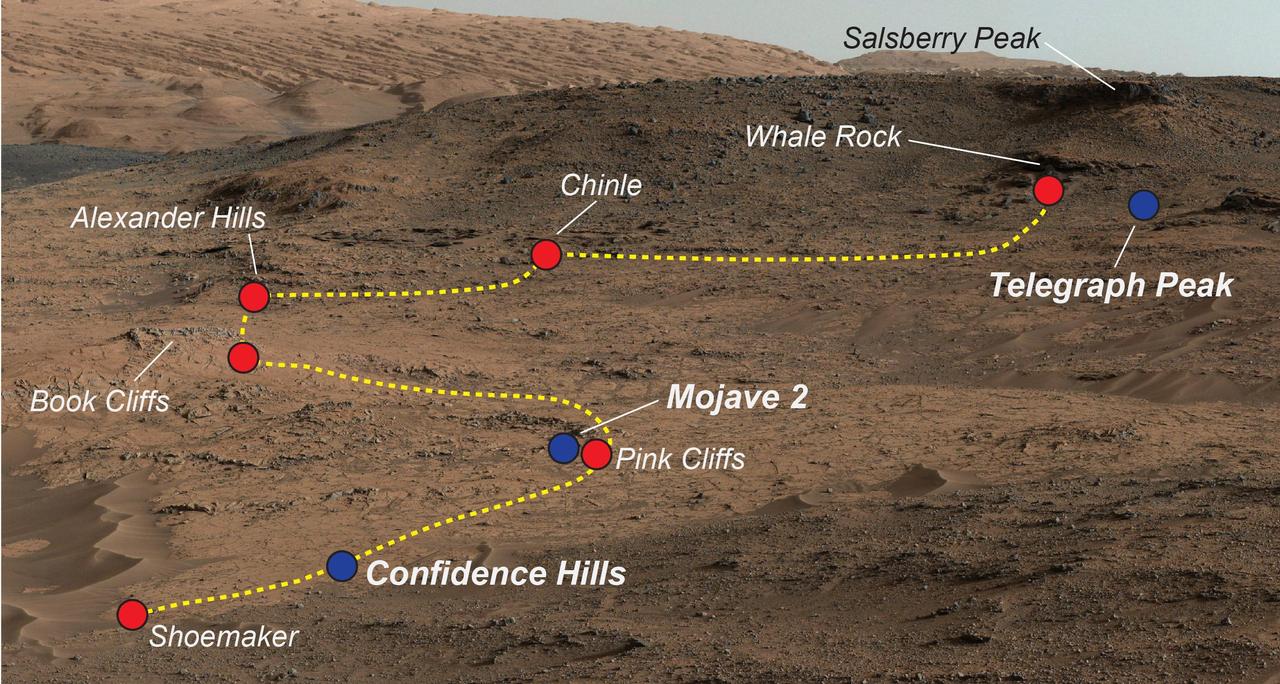
NASA's Curiosity Mars rover examined a mudstone outcrop area called "Pahrump Hills" on lower Mount Sharp, in 2014 and 2015. This view shows locations of some targets the rover studied there. The blue dots indicate where drilled samples of powdered rock were collected for analysis. The rover drilled a sample of rock powder at "Confidence Hills" in September 2014 and analyzed it with internal laboratory instruments. Then the mission conducted a walkabout survey up the slope, along the route indicated in yellow, stopping for close inspection at the red-dot locations. Observations from the walkabout were used to choose where to take additional drilled samples for analysis during a second pass up the slope. The "Mojave 2" sample was collected in January 2015 and the "Telegraph Peak" one in February 2015. This view of the outcrop and other portions of Mount Sharp beyond is a mosaic of images taken by the rover's Mast Camera (Mastcam) in September 2014. https://photojournal.jpl.nasa.gov/catalog/PIA21709
This image from NASA Mars Reconnaissance Orbiter is part of a proposed landing site in Aram Dorsum for the ExoMars Rover, planned for launch in 2018. Upper layers of light toned sediments have been eroded, leaving a lower surface which appears dark. The retreating sediment scarp slopes would be an important target for the rover if it ends up going to Aram Dorsum. The retreating scarps will be relatively recent compared to the ancient age of the terrain. That means that organic compounds-which is what ExoMars is designed to drill to 2 meters depth and analyze-will not have been exposed to the full effects of solar and galactic radiation for their entire history. Such radiation can break down organic compounds. Prior to this later erosion, the rocks formed in the ancient, Noachian era as alluvial deposits of fine grained sediment. http://photojournal.jpl.nasa.gov/catalog/PIA19859
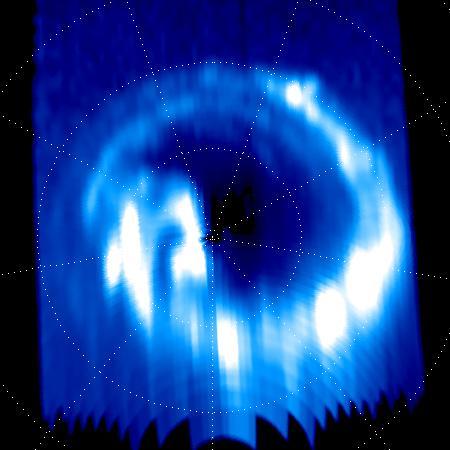
On Sept. 14, 2017, one day before making its final plunge into Saturn's atmosphere, NASA's Cassini spacecraft used its Ultraviolet Imaging Spectrograph, or UVIS, instrument to capture this final view of ultraviolet auroral emissions in the planet's north polar region. The view is centered on the north pole of Saturn, with lines of latitude visible for 80, 70 and 60 degrees. Lines of longitude are spaced 40 degrees apart. The planet's day side is at bottom, while the night side is at top. A sequence of images from this observation has also been assembled into a movie sequence. The last image in the movie was taken about an hour before the still image, which was the actual final UVIS auroral image. Auroral emissions are generated by charged particles traveling along the invisible lines of Saturn's magnetic field. These particles precipitate into the atmosphere, releasing light when they strike gas molecules there. Several individual auroral structures are visible here, despite that this UVIS view was acquired at a fairly large distance from the planet (about 424,000 miles or 683,000 kilometers). Each of these features is connected to a particular phenomenon in Saturn's magnetosphere. For instance, it is possible to identify auroral signatures here that are related to the injection of hot plasma from the dayside magnetosphere, as well as auroral features associated with a change in the magnetic field's shape on the magnetosphere's night side. Several possible scenarios have been postulated over the years to explain Saturn's changing auroral emissions, but researchers are still far from a complete understanding of this complicated puzzle. Researchers will continue to analyze the hundreds of image sequences UVIS obtained of Saturn's auroras during Cassini's 13-year mission, with many new discoveries likely to be made. This image and movie sequence were produced by the Laboratory for Planetary and Atmospheric Physics (LPAP) of the STAR Institute of the University of Liege in Belgium, in collaboration with the UVIS Team. The animation is available at https://photojournal.jpl.nasa.gov/catalog/PIA21899

This artist's concept represents the "Follow the Water" theme of NASA's Mars Reconnaissance Orbiter mission. The orbiter's science instruments monitor the present water cycle in the Mars atmosphere and the associated deposition and sublimation of water ice on the surface, while probing the subsurface to see how deep the water-ice reservoir detected by Mars Odyssey extends. At the same time, Mars Reconnaissance Orbiter will search for surface features and minerals (such as carbonates and sulfates) that record the extended presence of liquid water on the surface earlier in the planet's history. The instruments involved are the Shallow Subsurface Radar, the Compact Reconnaissance Imaging Spectrometer for Mars, the Mars Color Imager, the High Resolution Imaging Science Experiment, the Context Camera and the Mars Climate Sounder. To the far left, the radar antenna beams down and "sees" into the first few hundred feet (up to 1 kilometer) of Mars' crust. Just to the right of that, the next beam highlights the data received from the imaging spectrometer, which identifies minerals on the surface. The next beam represents the high-resolution camera, which can "zoom in" on local targets, providing the highest-resolution orbital images yet of features such as craters and gullies and rocks. The beam that shines almost horizontally is that of the Mars Climate Sounder. This instrument is critical to analyzing the current climate of Mars since it observes the temperature, humidity, and dust content of the martian atmosphere, and their seasonal and year-to-year variations. Meanwhile, the Mars Color Imager observes ice clouds, dust clouds and hazes, and the ozone distribution, producing daily global maps in multiple colors to monitor daily weather and seasonal changes. The electromagnetic spectrum is represented on the top right and individual instruments are placed where their capability lies. http://photojournal.jpl.nasa.gov/catalog/PIA07241

Satellite images from 2022 (Main image) and 1985 (Figure A) capture the retreat of Jakobshavn Isbrae, a glacier on Greenland's western coast, as icebergs broke off its edge over nearly four decades. In a recent study in Nature, researchers from NASA's Jet Propulsion Laboratory in Southern California calculated that Jakobshavn lost an estimated 97 billion tons (88 billion metric tons) of ice in the period between the two images. The earlier image was taken by the Thematic Mapper instrument on the Landsat 5 satellite on Sept. 5, 1985, while the later image was captured by the Operational Land Imager on the Landsat 8 satellite on Sept. 4, 2022. Of the 207 glaciers analyzed in the study, Jakobshavn lost the second most ice mass, trailing only Zachariae Isstrom, a glacier in northeast Greenland. The study took a comprehensive look at glacial retreat around the edges of the entire Greenland Ice Sheet from 1985 to 2022 and found that 179 glaciers retreated significantly since 1985, 27 held steady, and just one advanced slightly. The study found that overall the ice sheet shed about 1,140 billion tons (1,034 billion metric tons) of ice from 1985 to 2022, one-fifth more mass than previously estimated, as icebergs fell into the ocean at an accelerating rate. Most of the ice loss came from below sea level, in fjords on Greenland's periphery. Once occupied by ancient glacial ice, many of these deep coastal valleys have filled with seawater – meaning the ice that broke off made little net contribution to sea level. But the loss likely accelerated the movement of ice flowing down from higher elevations, which in turn added to sea level rise. It also added previously unaccounted-for fresh water to the North Atlantic Ocean, which could have impacts on global ocean currents. https://photojournal.jpl.nasa.gov/catalog/PIA26117
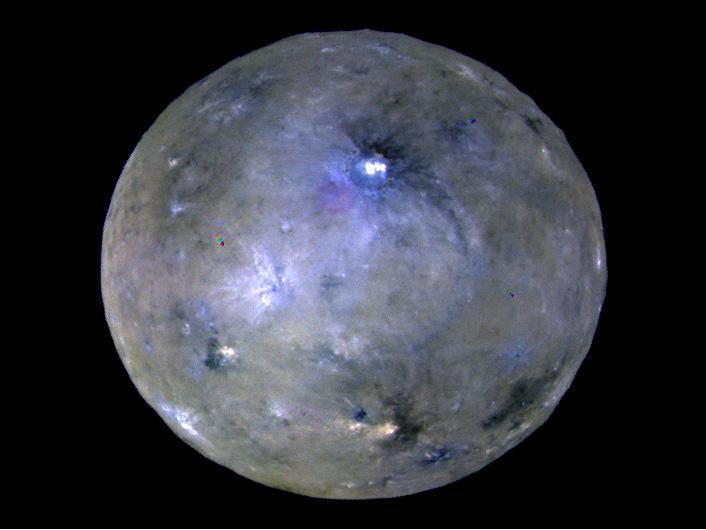
This enhanced color image of Ceres' surface was made from data obtained on April 29, 2017, when NASA's Dawn spacecraft was exactly between the sun and Ceres. Dawn's framing cameras took images of Ceres with a clear filter as well as five different color filters. Images combining these different color filter perspectives reveal fine details of Ceres' surface. For example, they emphasize the distinct compositions and textures of the material ejected from craters. The brightest region on Ceres, called Cerealia Facula, is highlighted in Occator Crater in the center of this image. Vinalia Faculae, the set of secondary bright spots in the same crater, are located to the right of Cerealia Facula. One of the darkest regions on Ceres is next to Occator, and represents ejected material from the impact that formed the crater. The ejected material forms a large arc that extends over several hundred kilometers, below the center of Ceres in this image. That material's distribution is partly determined by Ceres' rotation. Other craters also show a mixture of bright and dark regions. While the bright areas are generally identified as salt-rich material excavated from Ceres' crust, the origin of the dark material remains to be explained. It may have been excavated from a different layer within Ceres' subsurface than the rest of the ejecta blanket. Scientists will continue analyzing the color data to look for clues about the nature of the different materials on Ceres. The blueish color is generally found in association with young craters. Scientists believe the color relates to processes that occur when an impact ejects and redistributes material on the surface. The continuous bombardment of Ceres' surface by micrometeorites alters the texture of the exposed material, leading to its reddening. This image was taken altitude of about 12,000 miles (20,000 kilometers). https://photojournal.jpl.nasa.gov/catalog/PIA21406
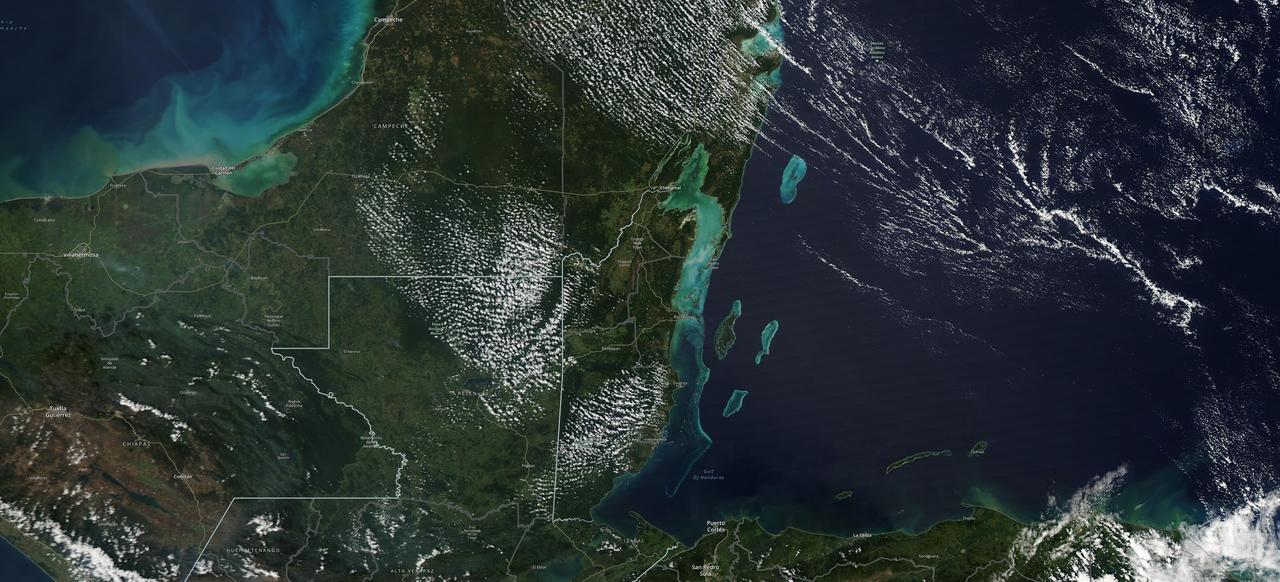
The Moderate Resolution Imaging Spectroradiometer (MODIS) instrument aboard NASA's Aqua satellite captured this image of the Yucatán Peninsula on Feb. 3, 2022. At the center is Belize, a country whose Caribbean coast is home to the Belize Barrier Reef Reserve System, which encompasses a vibrant network of marine environments that supports thousands of animal and plant species and drives Belize's largest industry, tourism. The barrier reef system is among about 1,200 UNESCO World Heritage sites around the world. In a paper published in November 2022 in Frontiers in Remote Sensing, researchers used data from Aqua MODIS to rank 24 protected marine areas off the Belizean coast based on the risks coral face from murky water and rising temperatures. The research also outlined how researchers at NASA's Jet Propulsion Laboratory in Southern California and counterparts in Belize used free, cloud-based data on Google Earth Engine in their analysis. Analyzing imagery from 2002 to 2022, researchers developed a coral vulnerability index – a score between 2 and 12 that characterizes the risk to coral, with higher scores signifying greater risk. Their findings could help management authorities protect the reefs from human impacts such as development, overfishing, pollution, and climate change. https://photojournal.jpl.nasa.gov/catalog/PIA25861
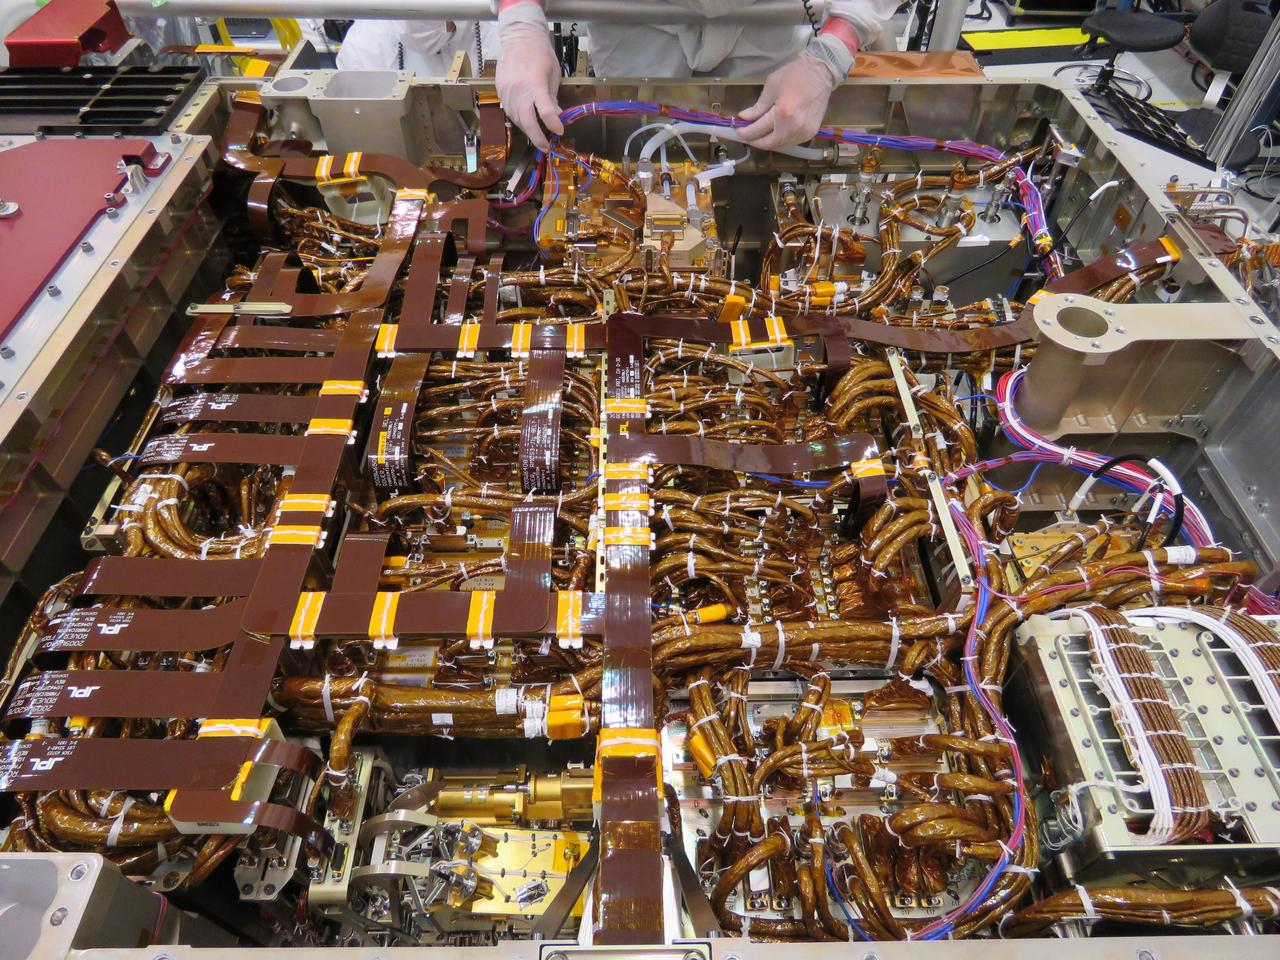
In the image, taken on June 1, 2019, an engineer in the Spacecraft Assembly Facility's High Bay 1 at NASA's Jet Propulsion Laboratory in Pasadena, California, can be seen working on the exposed belly of the Mars 2020 rover. It has been inverted to allow the 2020 engineers and technicians easier access. The front of the rover is on camera left. The engineer is inspecting wiring directly above the Mars Oxygen In-Situ Resource Utilization Experiment (MOXIE) instrument. MOXIE will demonstrate a way that future explorers might produce oxygen from the Martian atmosphere for propellant and for breathing. In the foreground, just to the left of center and distinctive because of the relative lack of wiring, is the body unit for the SuperCam instrument. The mast unit for SuperCam instrument, which will provide imaging, chemical composition analysis, and mineralogy from its high perch at the top of the rover's remote sensing mast was installed June 25. To the far left, covered by a red-colored shield, is the bay where the Adaptive Caching Assembly (ACA) will document, analyze and process for storage samples of Mars rock and soil for future return to Earth. https://photojournal.jpl.nasa.gov/catalog/PIA23312
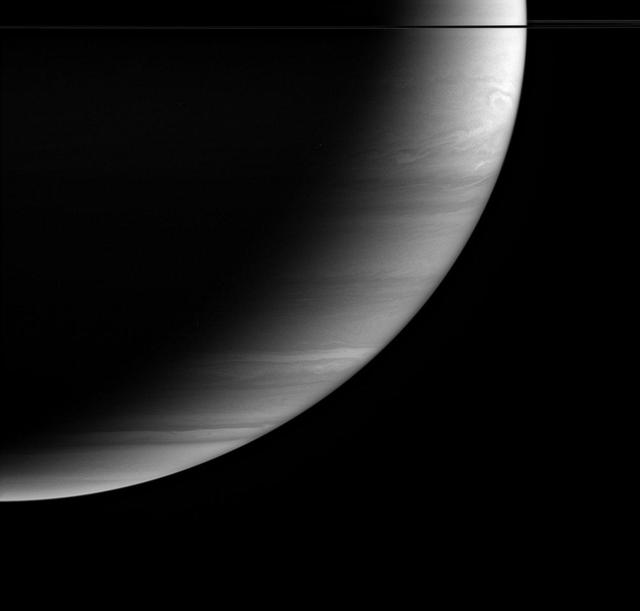
This microscopic imager mosaic of the rock called "Diamond Jenness" was snapped on sol 177 before NASA's Mars Exploration Rover Opportunity ground into the surface with its rock abrasion tool, or "Rat." Opportunity has bored nearly a dozen holes into the inner walls of "Endurance Crater." On sols 177 and 178 (July 23 and July 24, 2004), the rover worked double-duty on Diamond Jenness. Surface debris and the bumpy shape of the rock resulted in a shallow and irregular hole, only about 2 millimeters (0.08 inch) deep. The final depth was not enough to remove all the bumps and leave a neat hole with a smooth floor. This extremely shallow depression was then examined by the rover's alpha particle X-ray spectrometer. On Sol 178, Opportunity's "robotic rodent" dined on Diamond Jenness once again, grinding almost an additional 5 millimeters (about 0.2 inch). The rover then applied its Moessbauer spectrometer to the deepened hole. This double dose of Diamond Jenness enabled the science team to examine the rock at varying layers. Results from those grindings are currently being analyzed. The image mosaic is about 6 centimeters (2.4 inches) across. http://photojournal.jpl.nasa.gov/catalog/PIA06748

NASA scientists will venture into an isolated part of the Bolivian Amazon to try and uncover the origin of a 5 mile (8 kilometer) diameter crater there known as the Iturralde Crater. Traveling to this inhospitable forest setting, the Iturralde Crater Expedition 2002 will seek to determine if the unusual circular crater was created by a meteor or comet. Organized by Dr. Peter Wasilewski of NASA's Goddard Space Flight Center, Greenbelt, Md., the Iturralde Crater Expedition 2002 will be led by Dr. Tim Killeen of Conservation International, which is based in Bolivia. Killeen will be assisted by Dr. Compton Tucker of Goddard. The team intends to collect and analyze rocks and soil, look for glass particles that develop from meteor impacts and study magnetic properties in the area to determine if the Iturralde site was indeed created by a meteor. This image was acquired on June 29, 2001 by the Advanced Spaceborne Thermal Emission and Reflection Radiometer (ASTER) on NASA's Terra satellite. With its 14 spectral bands from the visible to the thermal infrared wavelength region, and its high spatial resolution of 15 to 90 meters (about 50 to 300 feet), ASTER will image Earth for the next 6 years to map and monitor the changing surface of our planet. http://photojournal.jpl.nasa.gov/catalog/PIA03859
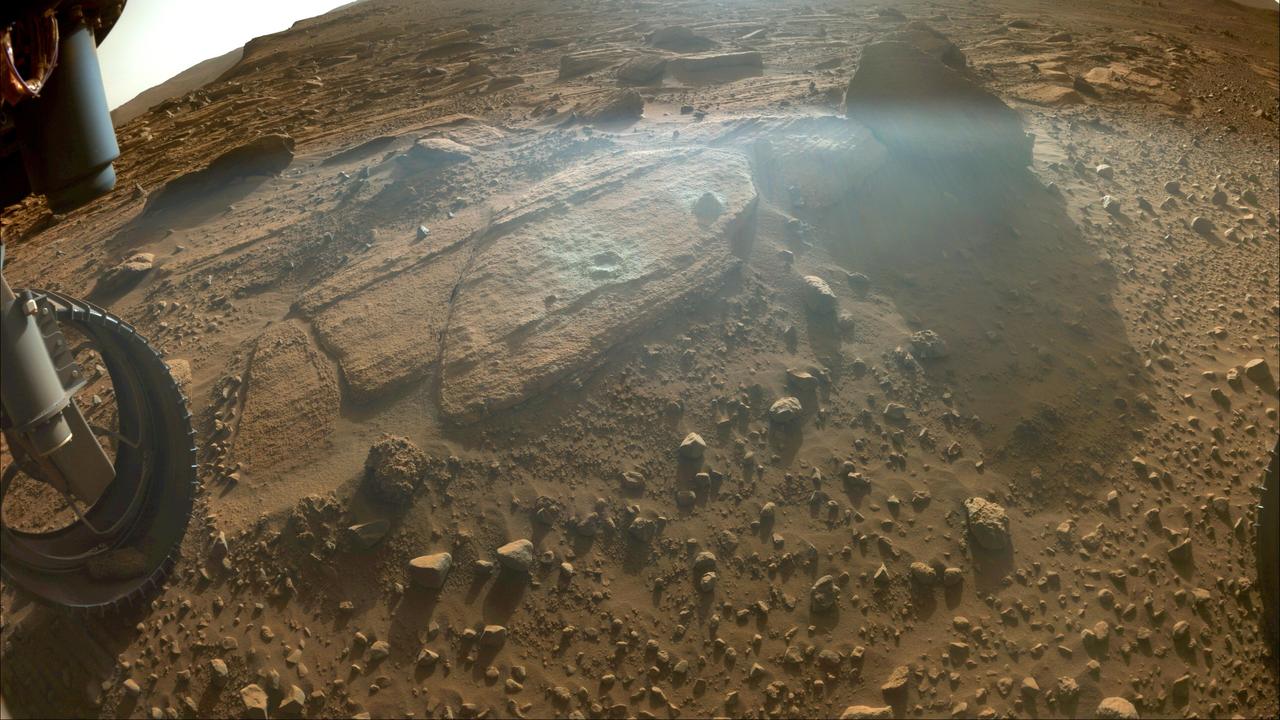
This image shows the rocky outcrop the Perseverance science team calls "Berea" after the NASA Mars rover extracted a rock core (right) and abraded a circular patch (left). The image was taken by one of the rover's front hazard cameras on March 30, 2023, the 749th Martian day, or sol, of the mission. Perseverance grinds, or abrades, circular patches into rocks so its science instruments can analyze the rocks' composition. The rock core it obtained, about the size of a piece of classroom chalk, was sealed in an ultra-clean sample tube. It is currently being stored in the rover's Sampling and Caching System. A key objective for Perseverance's mission on Mars is astrobiology, including the search for signs of ancient microbial life. The rover will characterize the planet's geology and past climate, pave the way for human exploration of the Red Planet, and be the first mission to collect and cache Martian rock and regolith (broken rock and dust). Subsequent NASA missions, in cooperation with ESA (European Space Agency), would send spacecraft to Mars to collect these sealed samples from the surface and return them to Earth for in-depth analysis. The Mars 2020 Perseverance mission is part of NASA's Moon to Mars exploration approach, which includes Artemis missions to the Moon that will help prepare for human exploration of the Red Planet. https://photojournal.jpl.nasa.gov/catalog/PIA25688

The Advanced Rapid Imaging and Analysis (ARIA) team at NASA's Jet Propulsion Laboratory in Pasadena, California, in collaboration with the Earth Observatory of Singapore (EOS), created this flood map depicting areas of the Bahamas that are likely flooded (shown by light blue pixels) as a result of Hurricane Dorian. The map was derived from synthetic aperture radar (SAR) data acquired on Sept. 2, 2019, by the European Union's Copernicus Sentinel-1 satellites operated by the European Space Agency (ESA). The map covers an area of 109 miles by 106 miles (176 kilometers by 170 kilometers) shown by the large red polygon. Each pixel measures about 32 yards (30 meters) across. This map can be used as guidance to identify areas that are likely flooded, and may be less reliable over urban and vegetated areas. The image contains modified Copernicus Sentinel data (2019) processed by ESA and analyzed by NASA, JPL-Caltech, ARIA, and EOS. This work was funded by NASA along with the Earth Observatory of Singapore and a Singapore National Research Foundation Investigatorship. https://photojournal.jpl.nasa.gov/catalog/PIA23360
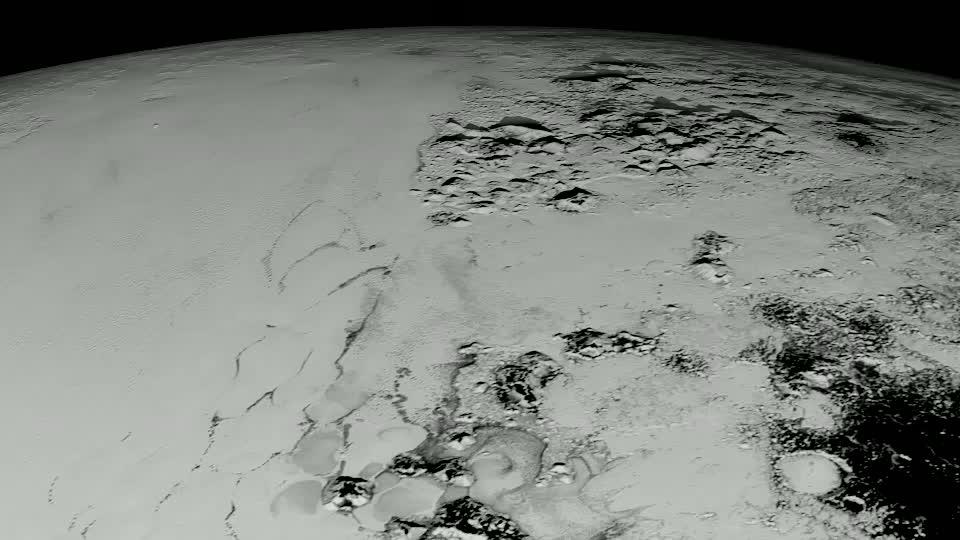
Pluto has long been a mystery, a dot at our solar system’s margins. The best images, even with NASA’s Hubble Space Telescope, were fuzzy and pixelated. In July 2015, NASA’s New Horizons spacecraft flew past Pluto and captured the sharpest views of the dwarf planet to date. One of the most striking areas, informally named "Sputnik Planum," is a sweeping, frozen plain the size of Texas and ringed by mountains of ice. Its smooth deposits are unmarred by impact craters, a stark contrast to the rest of Pluto’s battered surface. As a result, scientists believe the region formed recently, within the last few hundred million years. This contradicts past depictions of Pluto as an unchanging world. By analyzing images taken during the flyby, scientists hope to unravel more of the dwarf planet’s history. Watch the video for an up-close look at Pluto. Credit: NASA's Goddard Space Flight Center Video courtesy of NASA/Johns Hopkins University Applied Physics Laboratory/Southwest Research Institute/S. Robbins
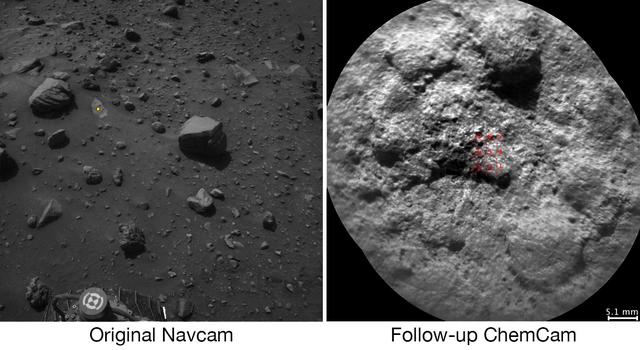
NASA's Curiosity Mars rover autonomously selects some of the targets for the laser and telescopic camera of the rover's Chemistry and Camera (ChemCam) instrument. For example, on-board software analyzed the image on the left, chose the target highlighted with the yellow dot, and pointed ChemCam to acquire laser analysis and the image on the right. Most ChemCam targets are still selected by scientists discussing rocks or soil seen in images the rover has sent to Earth, but the autonomous targeting provides an added capability. It can offer a head start on acquiring composition information at a location just reached by a drive. The software for target selection and instrument pointing is called AEGIS, for Autonomous Exploration for Gathering Increased Science. The image on the left was taken by the left eye of Curiosity's stereo Navigation Camera (Navcam) a few minutes after the rover completed a drive of about 43 feet (13 meters) on July 14, 2016, during the 1,400th Martian day, or sol, of the rover's work on Mars. Using AEGIS for target selection and pointing based on the Navcam imagery, Curiosity's ChemCam zapped a grid of nine points on a rock chosen for meeting criteria set by the science team. In this run, parameters were set to find bright-toned outcrop rock rather than darker rocks, which in this area tend to be loose on the surface. Within less than 30 minutes after the Navcam image was taken, ChemCam had used its laser on all nine points and had taken before-and-after images of the target area with its remote micro-imager (RMI) camera. The image at right combines those two RMI exposures. The nine laser targets are marked in red at the center. On the Navcam image at left, the yellow dot identifies the selected target area, which is about 2.2 inches (5.6 centimeters) in diameter. An unannotated version of this Sol 1400 Navcam image is available. ChemCam records spectra of glowing plasma generated when the laser hits a target point. These spectra provide information about the chemical elements present in the target. The light-toned patch of bedrock identified by AEGIS on Sol 1400 appears, geochemically, to belong to the "Stimson" sandstone unit of lower Mount Sharp. In mid-2016, Curiosity typically uses AEGIS for selecting a ChemCam target more than once per week. http://photojournal.jpl.nasa.gov/catalog/PIA20762
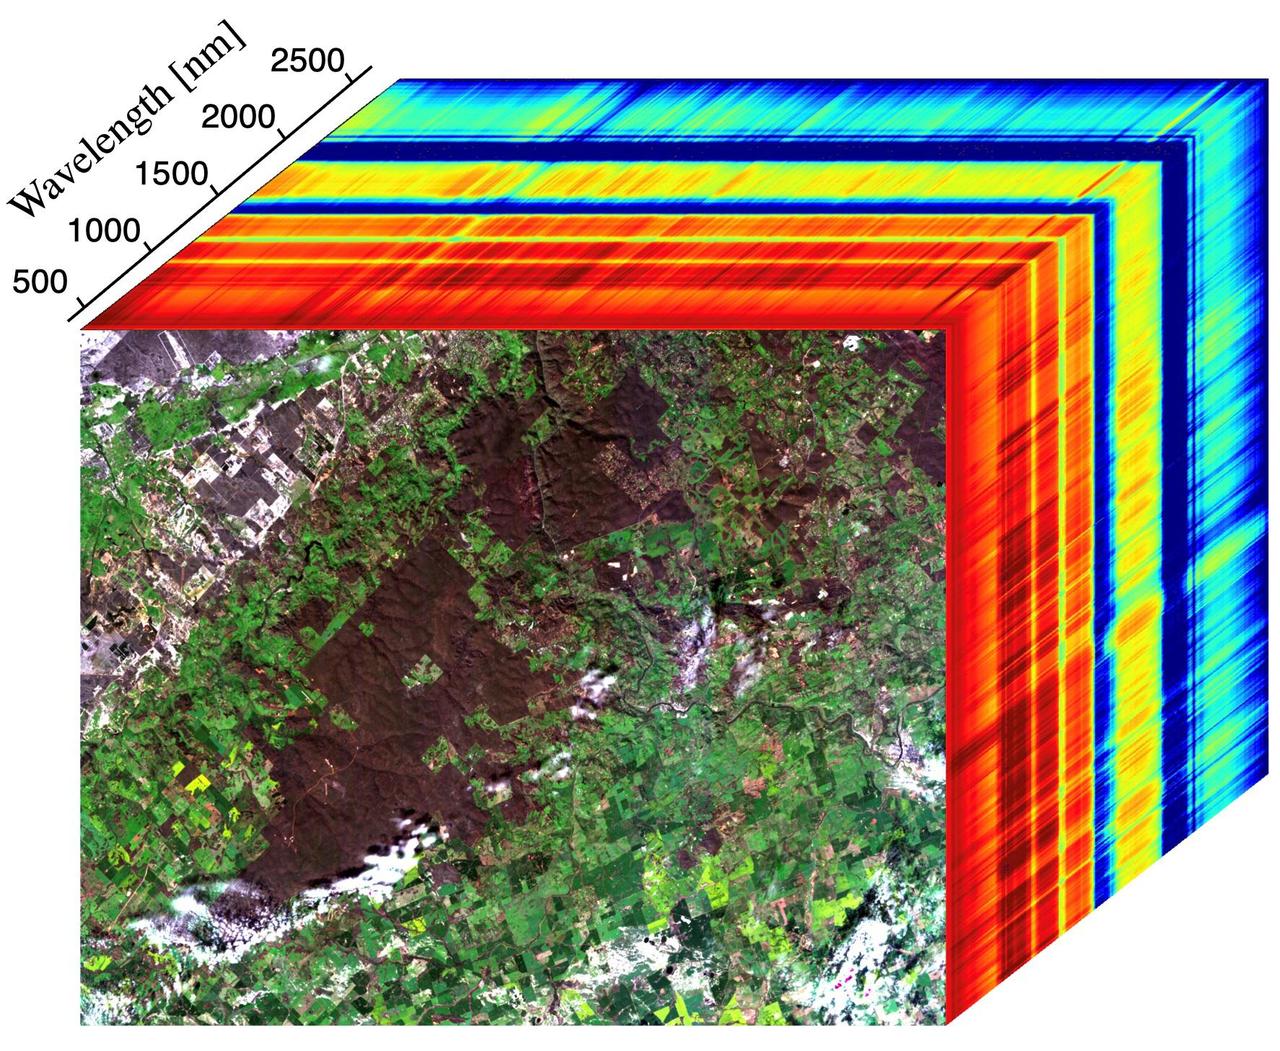
This image shows the first measurements taken by NASA's Earth Surface Mineral Dust Source Investigation (EMIT) from aboard the International Space Station at 7:51 p.m. PDT (10:51 p.m. EDT) on July 27, 2022, as it passed over western Australia. The image at the front of the cube shows a mix of materials in western Australia, including exposed soil (brown), vegetation (dark green), agricultural fields (light green), a small river, and clouds. The rainbow colors extending through the main part of the cube are the wavelengths of light (in nanometers), or spectral fingerprints, from corresponding spots in the front image. The line graph (Figure 1) shows spectral fingerprints for a sample of soil, vegetation, and a river from the image cube. Radiance indicates the amount of each wavelength of light reflected from a substance. Researchers use the combination of radiance and wavelength to determine a substance's spectral fingerprint. Developed by NASA's Jet Propulsion Laboratory in Southern California, EMIT works by measuring the hundreds of wavelengths of light reflected from materials on Earth. Different substances reflect different wavelengths of light, producing a kind of spectral fingerprint that, when collected by an imaging spectrometer and analyzed by researchers, reveal what they are made of. When science operations begin later in August 2022, EMIT's primary mission will be to collect measurements of 10 important surface minerals in regions between 50-degrees south and north latitudes in Africa, Asia, North and South America, and Australia. The minerals include hematite, goethite, illite, vermiculite, calcite, dolomite, montmorillonite, kaolinite, chlorite, and gypsum. The compositional data EMIT collects will help scientists study the role of airborne dust particles in heating and cooling Earth's atmosphere on global and regional scales. Data from EMIT will be delivered to the NASA Land Processes Distributed Active Archive Center (DAAC) for use by other researchers and the public. https://photojournal.jpl.nasa.gov/catalog/PIA24529
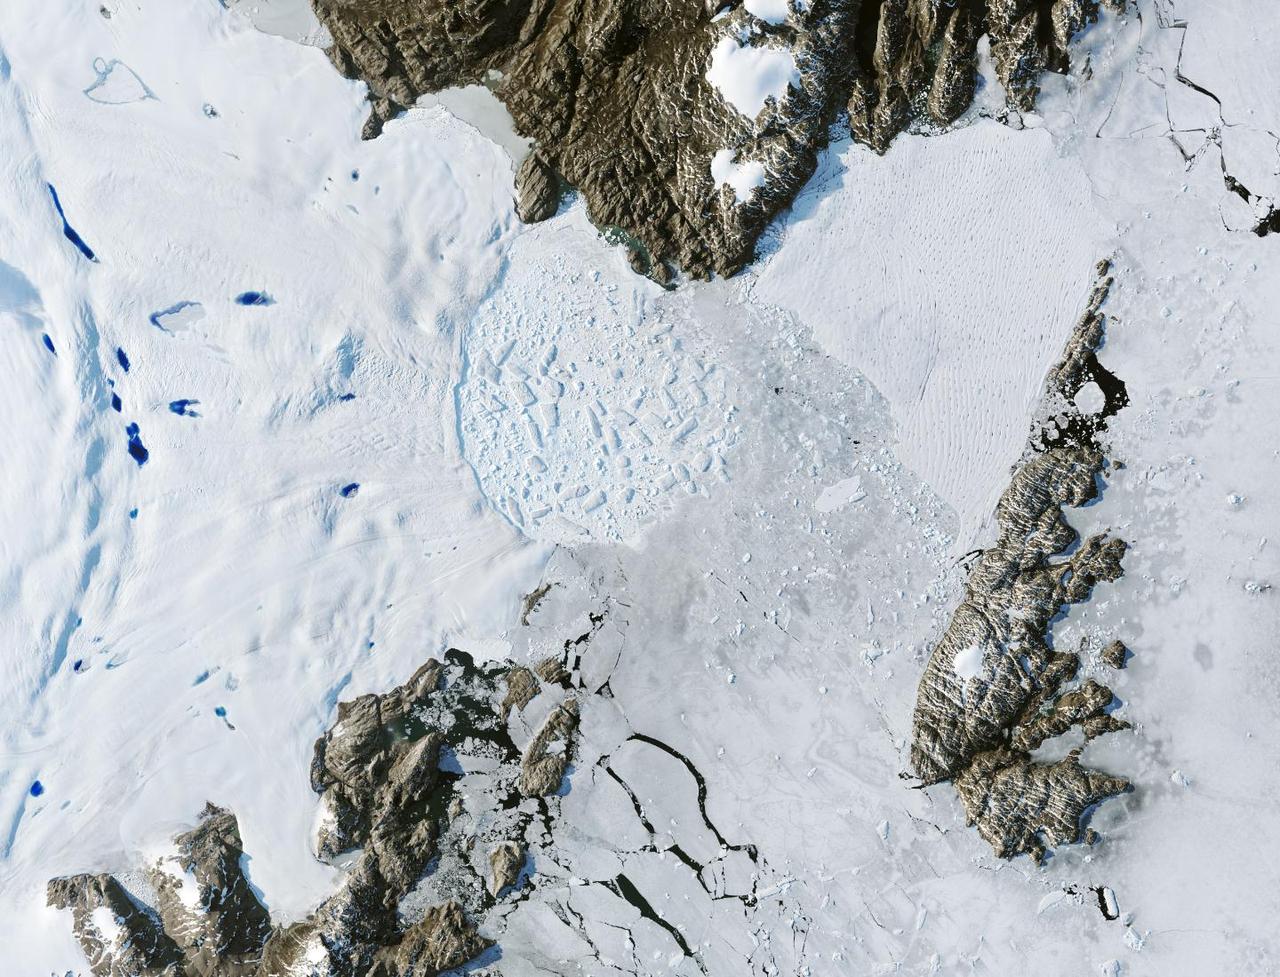
Satellite images from 2022 (Main image) and 1999 (Figure A) capture the retreat of Zachariae Isstrom, a glacier in northeast Greenland, as icebergs broke off its edge over the course of 23 years. In a recent study in Nature, researchers from NASA's Jet Propulsion Laboratory in Southern California calculated that Zachariae lost an estimated 176 billion tons (160 billion metric tons) of ice in the period between 1985 and 2022. That was the greatest mass lost for the period of any of the 207 glaciers analyzed in the paper. The earlier image was taken by the Enhanced Thematic Mapper Plus on the Landsat 7 satellite on Aug. 5, 1999, while the later image was captured by the Operational Land Imager on the Landsat 8 satellite on Aug. 22, 2022. The study took a comprehensive look at glacial retreat around the edges of the entire Greenland Ice Sheet from 1985 to 2022 and found that 179 glaciers retreated significantly since 1985, 27 held steady, and just one advanced slightly. The study found that overall the ice sheet shed about 1,140 billion tons (1,034 billion metric tons) of ice from 1985 to 2022, one-fifth more mass than previously estimated, as icebergs fell into the ocean at an accelerating rate. Most of the ice loss came from below sea level, in fjords on Greenland's periphery. Once occupied by ancient glacial ice, many of these deep coastal valleys have filled with seawater – meaning the ice that broke off made little net contribution to sea level. But the loss likely accelerated the movement of ice flowing down from higher elevations, which in turn added to sea level rise. It also added previously unaccounted-for fresh water to the North Atlantic Ocean, which could have impacts on global ocean currents. https://photojournal.jpl.nasa.gov/catalog/PIA26118
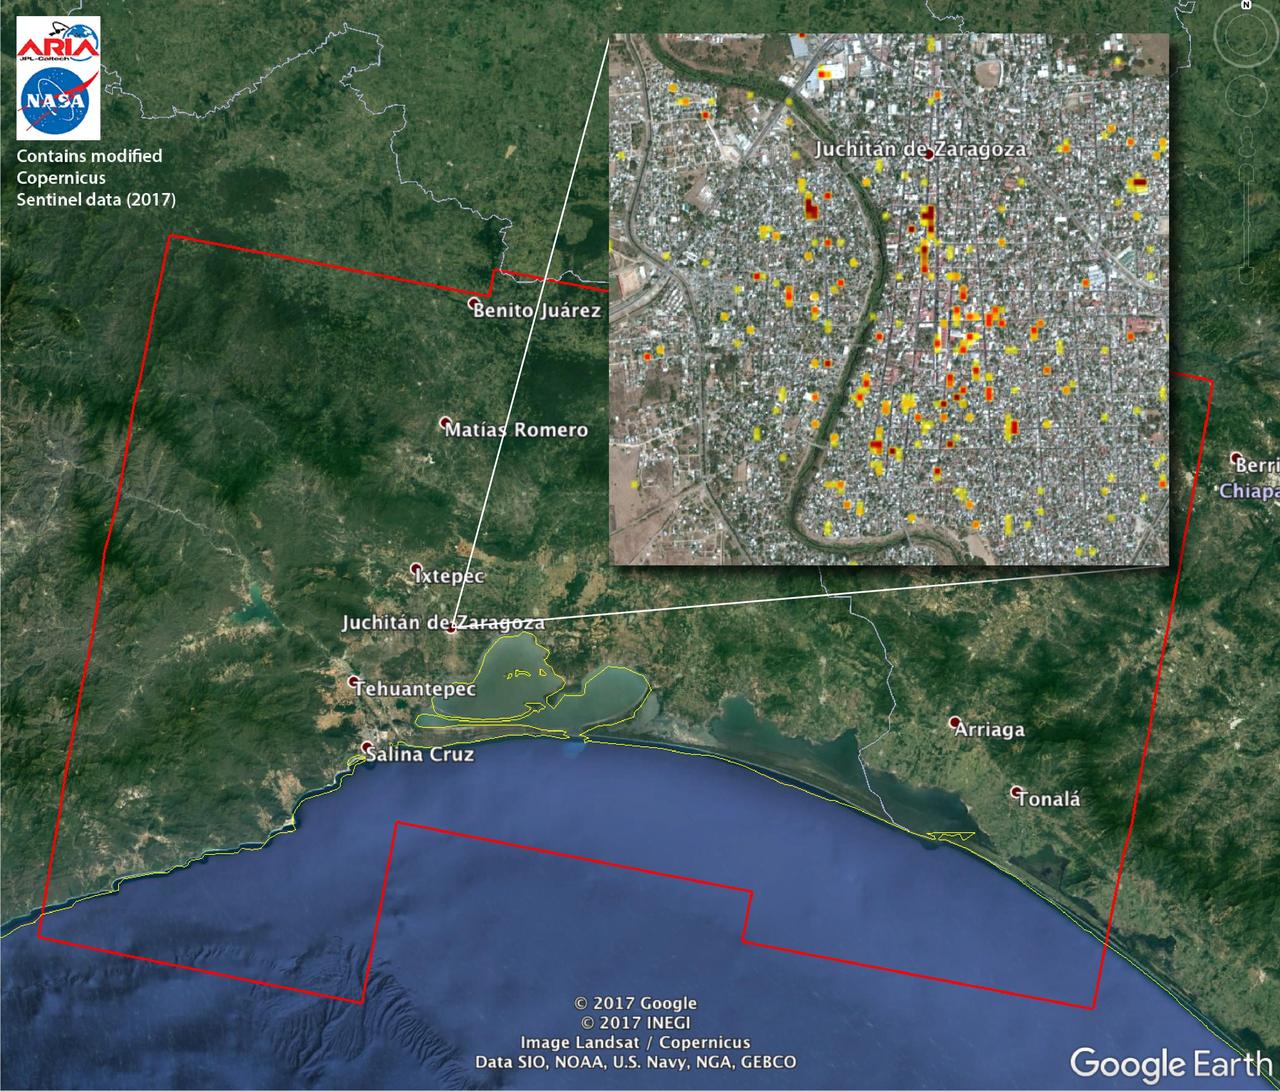
The Advanced Rapid Imaging and Analysis (ARIA) team at NASA's Jet Propulsion Laboratory in Pasadena, California, and Caltech, also in Pasadena, created this Damage Proxy Map (DPM) depicting areas of Southern Mexico that are likely damaged (shown by red and yellow pixels) from the magnitude 8.1 Chiapas earthquake of Sept. 7, 2017 (near midnight local time, early morning on Sept. 8 UTC). The map is derived from synthetic aperture radar (SAR) images from the Copernicus Sentinel-1A and Sentinel-1B satellites, operated by the European Space Agency (ESA). The images were taken before (Sept. 7, 2017 UTC) and after (Sept. 13, 2017 UTC) the earthquake. The map covers an area of 155 by 106 miles (250 by 170 kilometers). Each pixel measures about 33 yards (30 meters) across. The color variation from yellow to red indicates increasingly more significant ground surface change. Preliminary validation was done by comparing the SAR images to optical satellite imagery from DigitalGlobe. This damage proxy map should be used as guidance to identify damaged areas, and may be less reliable over vegetated areas. Sentinel-1 data were accessed through the Copernicus Open Access Hub. The image contains modified Copernicus Sentinel data (2017), processed by ESA and analyzed by the NASA-JPL/Caltech ARIA team. This research was carried out at JPL under a contract with NASA. https://photojournal.jpl.nasa.gov/catalog/PIA21956