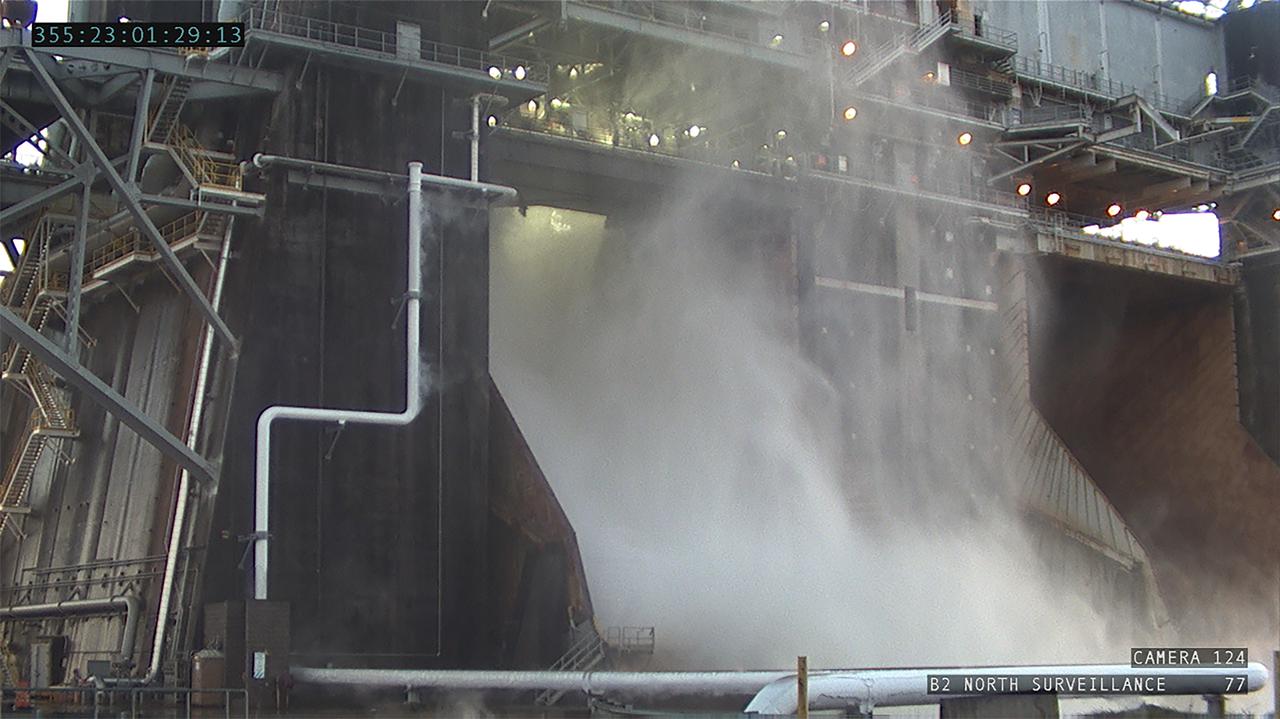
Operators at the B-2 Test Stand at Stennis Space Center near Bay St. Louis, Mississippi, conducted a wet dress rehearsal for the hot fire test of the core stage of NASA’s Space Launch System on Dec. 21, 2020. In this image, water flows from the B-2 Test Stand flame deflector, just as it will during an actual hot fire test. The hot fire will conclude a series of eight Green Run tests of all core stage systems before it is transported to Kennedy Space Center for launch on the Artemis I mission.
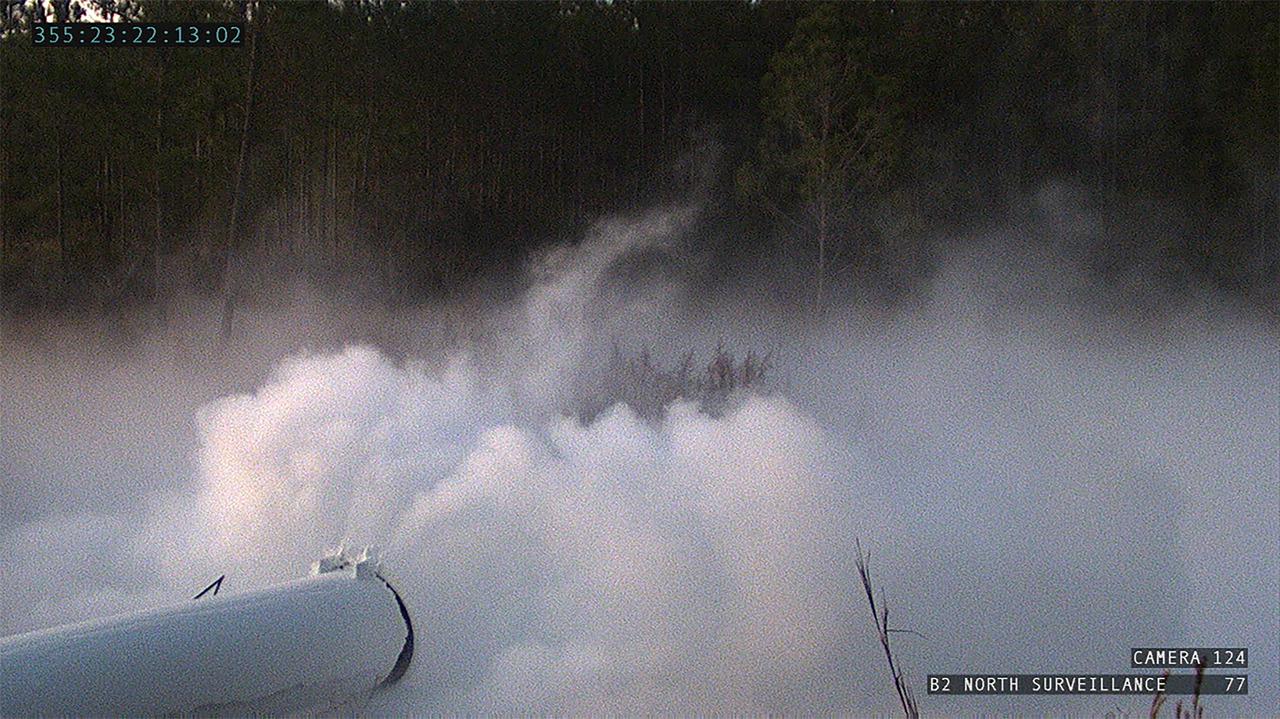
Operators at the B-2 Test Stand at Stennis Space Center near Bay St. Louis, Mississippi, conducted a wet dress rehearsal for the hot fire test of the core stage of NASA’s Space Launch System on Dec. 21, 2020. In this image, liquid oxygen vents from the four RS-25 engines that will ignite during the final hot fire test of the core stage. The hot fire will conclude a series of eight Green Run tests of all core stage systems before it is transported to Kennedy Space Center for launch on the Artemis I mission.
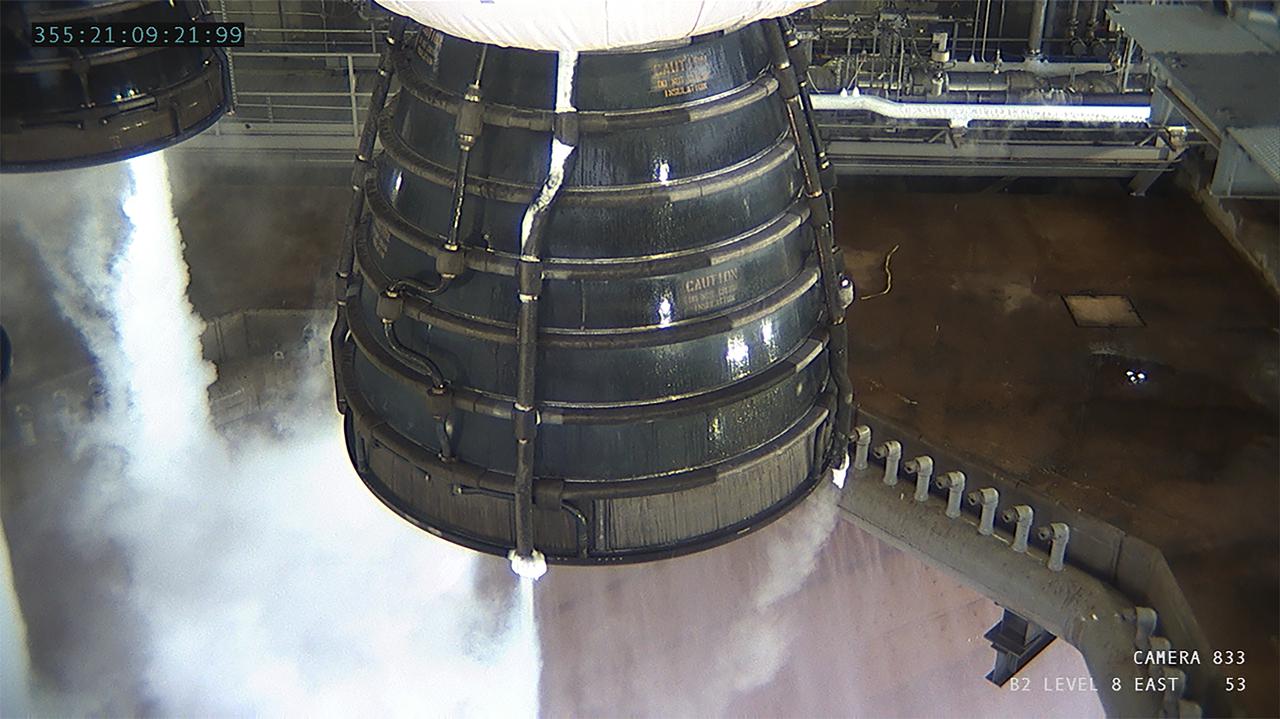
Operators at the B-2 Test Stand at Stennis Space Center near Bay St. Louis, Mississippi, conducted a wet dress rehearsal for the hot fire test of the core stage of NASA’s Space Launch System on Dec. 21, 2020. In this image, liquid oxygen can be seen venting near the top of the installed core stage. Following the wet dress rehearsal, operators will conduct a full hot fire test of the core stage and its four RS-25 engines. The hot fire will conclude a series of eight Green Run tests of all core stage systems before it is transported to Kennedy Space Center for launch on the Artemis I mission.
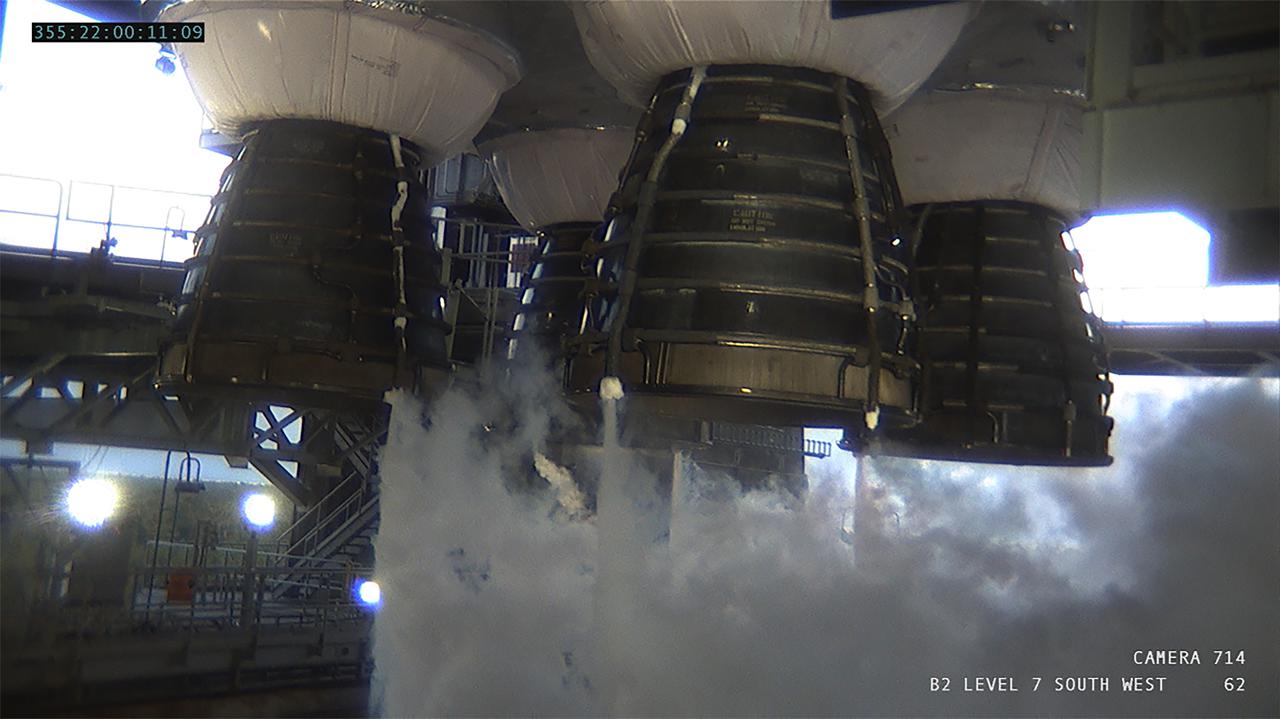
Operators at the B-2 Test Stand at Stennis Space Center near Bay St. Louis, Mississippi, conducted a wet dress rehearsal for the hot fire test of the core stage of NASA’s Space Launch System on Dec. 21, 2020. In this image, liquid oxygen vents from the four RS-25 engines that will ignite during the final hot fire test of the core stage. The hot fire will conclude a series of eight Green Run tests of all core stage systems before it is transported to Kennedy Space Center for launch on the Artemis I mission.
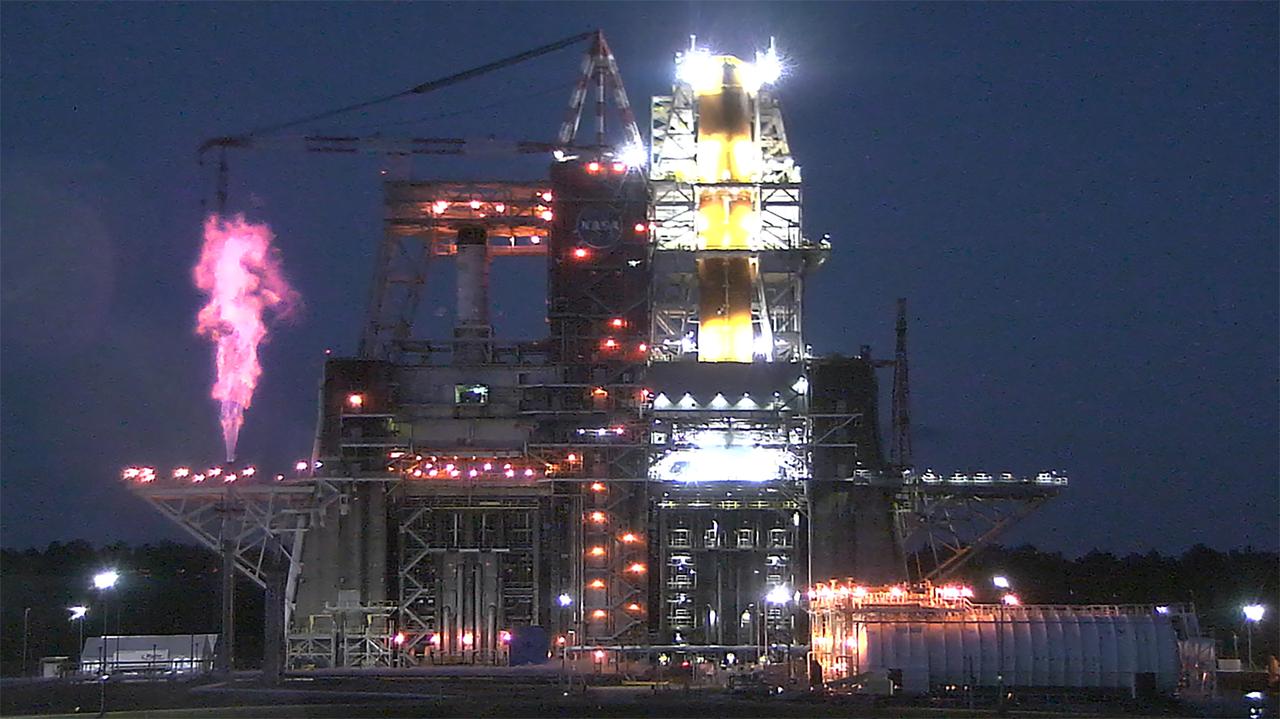
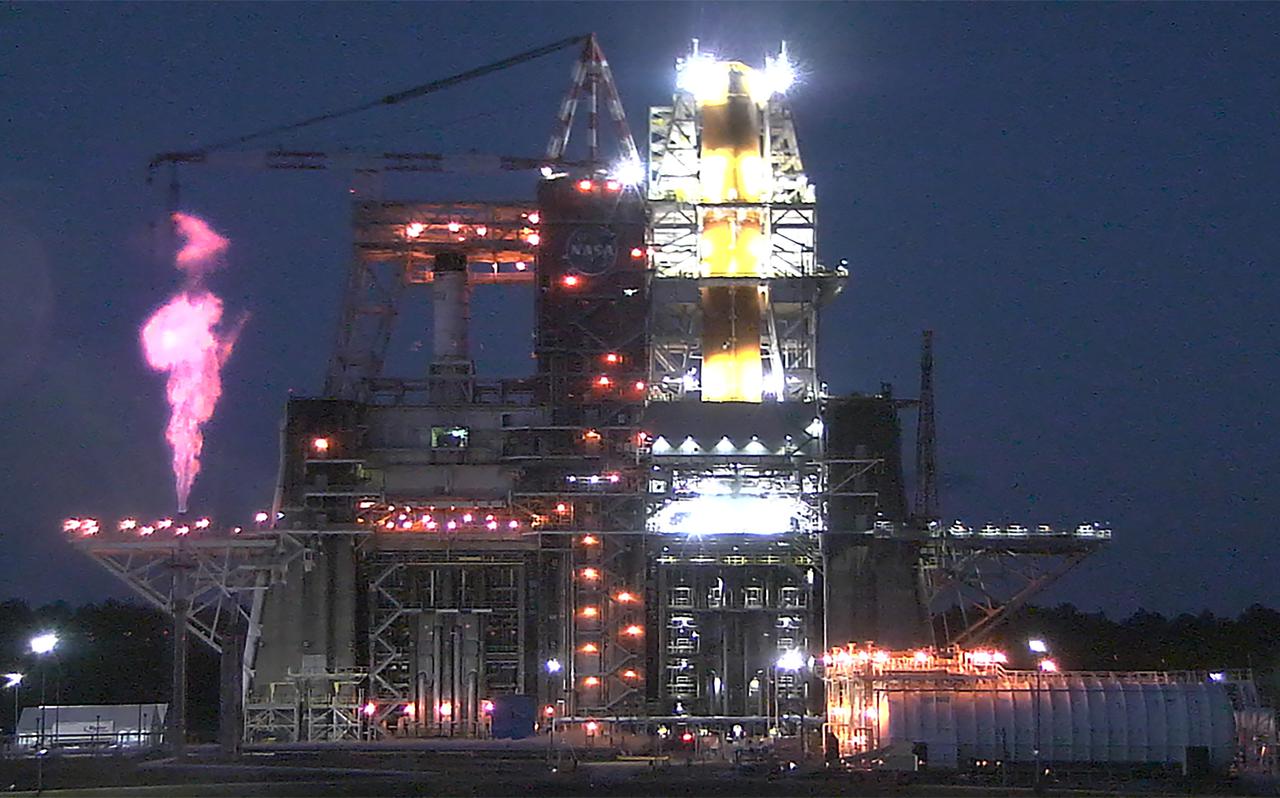
Operators at the B-2 Test Stand at Stennis Space Center near Bay St. Louis, Mississippi, conducted a wet dress rehearsal for the hot fire test of the core stage of NASA’s Space Launch System on Dec. 21, 2020. In this image, liquid oxygen can be seen venting from B-2 Test Stand piping. Following the wet dress rehearsal, operators will conduct a full hot fire test of the core stage and its four RS-25 engines. The hot fire will conclude a series of eight Green Run tests of all core stage systems before it is transported to Kennedy Space Center for launch on the Artemis I mission.
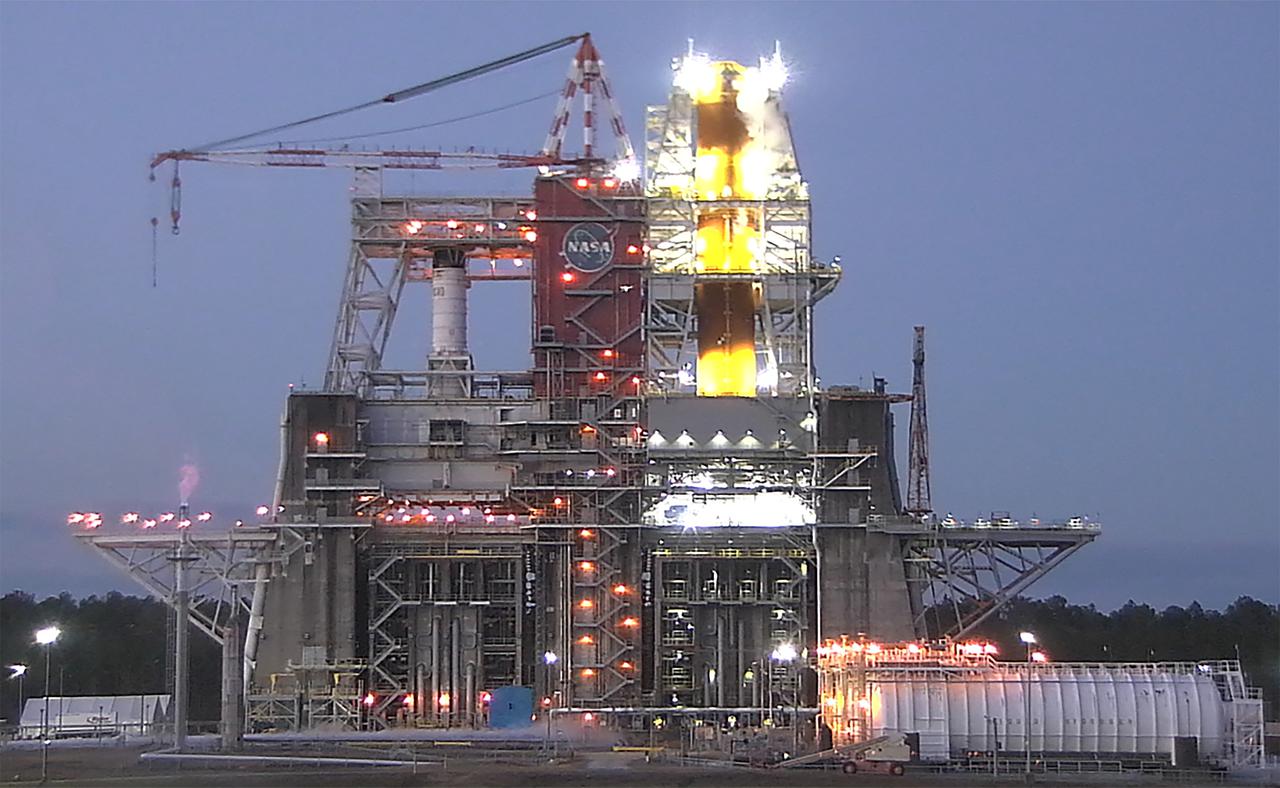
Operators at the B-2 Test Stand at Stennis Space Center near Bay St. Louis, Mississippi, conducted a wet dress rehearsal for the hot fire test of the core stage of NASA’s Space Launch System on Dec. 21, 2020. In this image, liquid oxygen can be seen venting near the top of the installed core stage. Following the wet dress rehearsal, operators will conduct a full hot fire test of the core stage and its four RS-25 engines. The hot fire will conclude a series of eight Green Run tests of all core stage systems before it is transported to Kennedy Space Center for launch on the Artemis I mission.
Operators at the B-2 Test Stand at Stennis Space Center near Bay St. Louis, Mississippi, conducted a wet dress rehearsal for the hot fire test of the core stage of NASA’s Space Launch System on Dec. 21, 2020. In this image, liquid oxygen can be seen venting near the top of the installed core stage. Following the wet dress rehearsal, operators will conduct a full hot fire test of the core stage and its four RS-25 engines. The hot fire will conclude a series of eight Green Run tests of all core stage systems before it is transported to Kennedy Space Center for launch on the Artemis I mission.
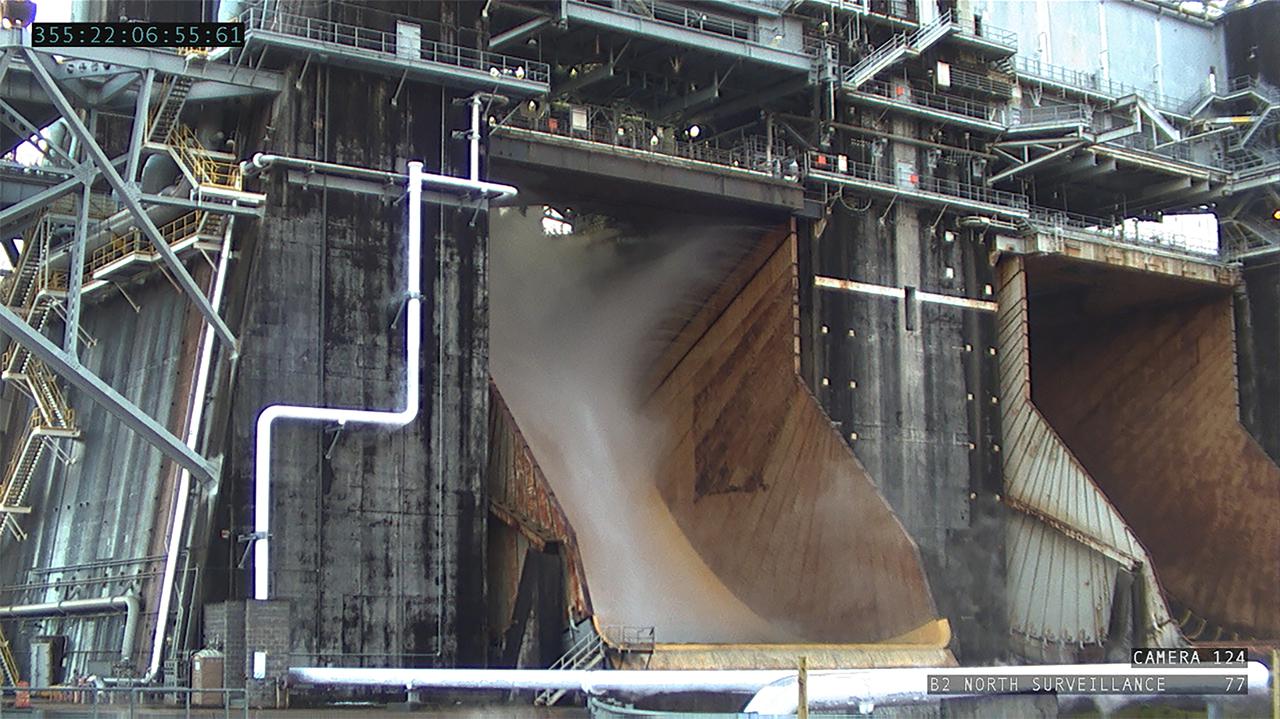
Operators at the B-2 Test Stand at Stennis Space Center near Bay St. Louis, Mississippi, conducted a wet dress rehearsal for the hot fire test of the core stage of NASA’s Space Launch System on Dec. 21, 2020. In this image, water flows from the B-2 Test Stand flame deflector, just as it will during an actual hot fire test. The hot fire will conclude a series of eight Green Run tests of all core stage systems before it is transported to Kennedy Space Center for launch on the Artemis I mission.
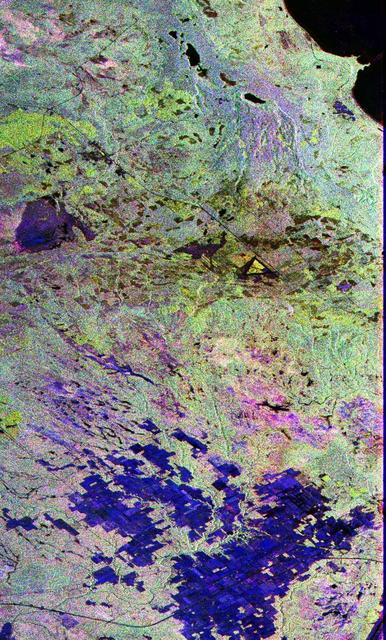
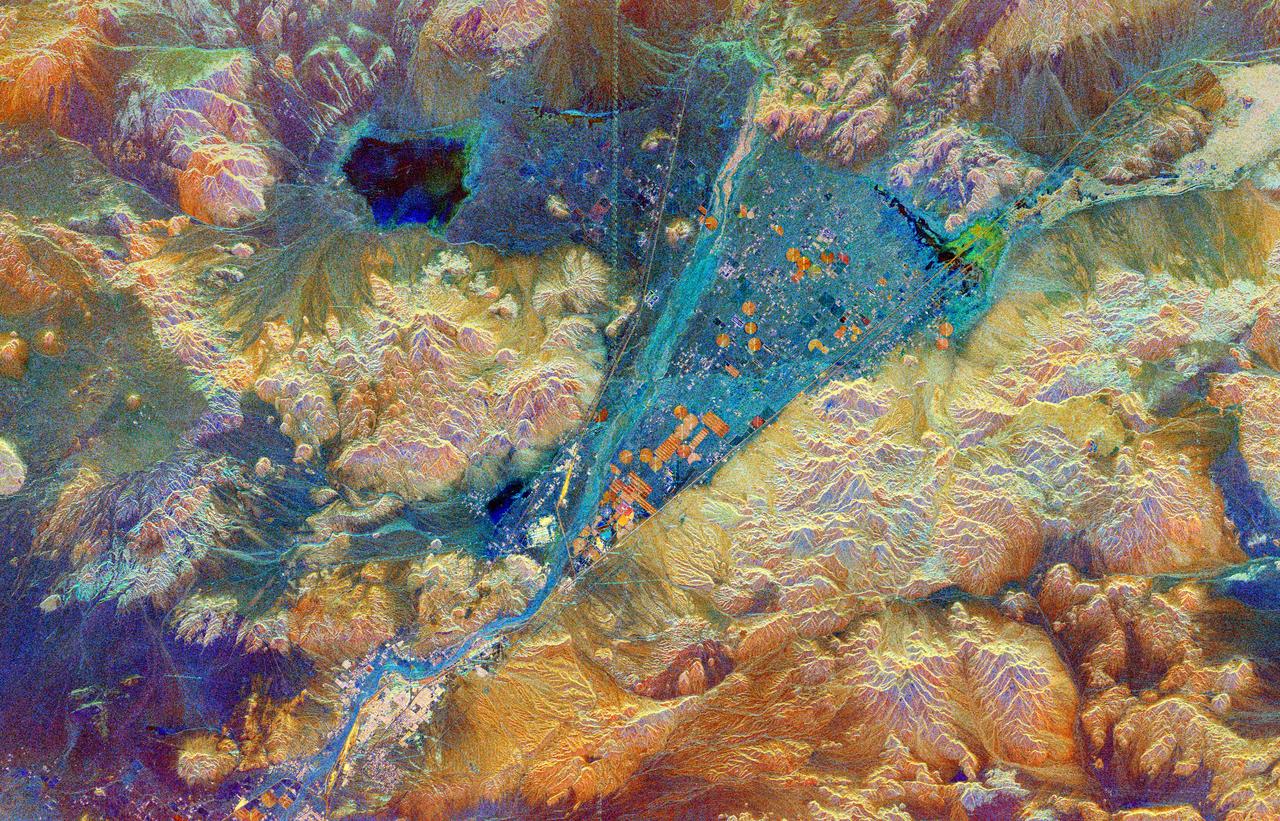
Two radar images are shown in this composite to compare the size of a standard spaceborne radar image small inset to the image that is created when the radar instrument is used in the ScanSAR mode large image.

Particle-image velocimetry (PIV) is performed on the upper surface of a pitching airfoil in the NASA Glenn Icing Research Tunnel. PIV is a laser-based flow velocity measurement technique used widely in wind tunnels. These experiments were conducted as part of a research project focused on enhancing rotorcraft speed, efficiency and maneuverability by suppressing dynamic stall.
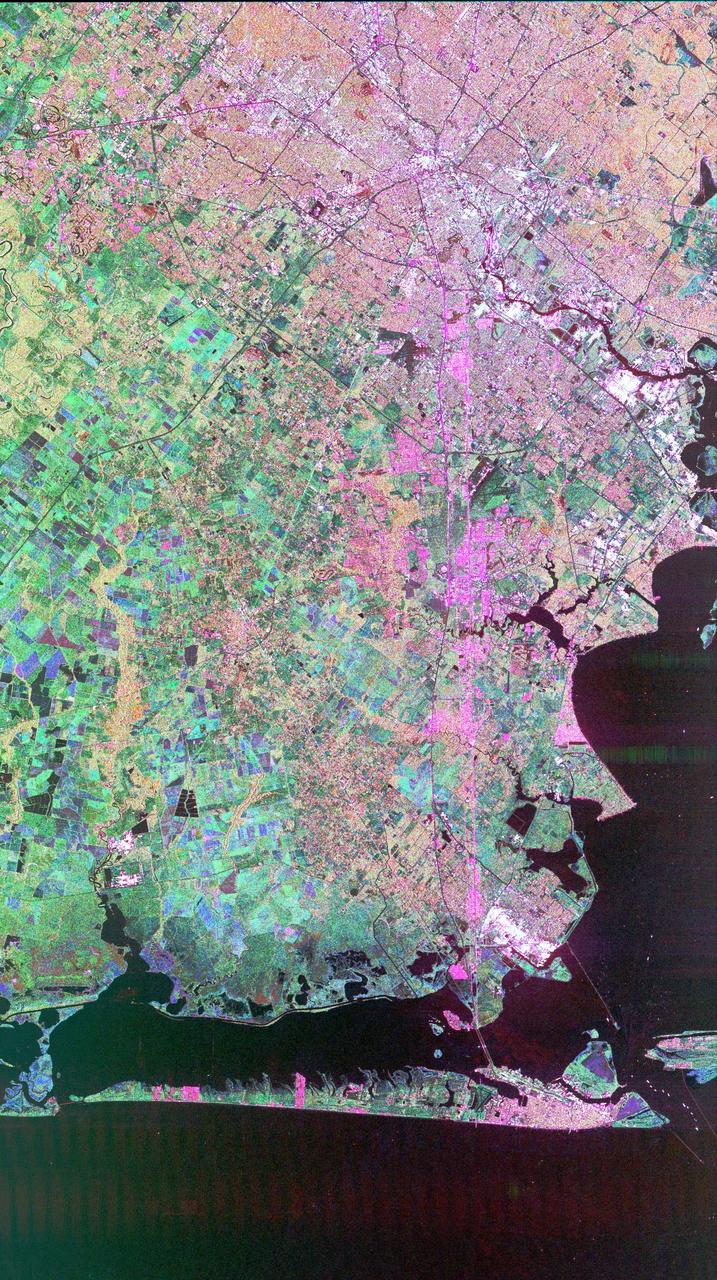
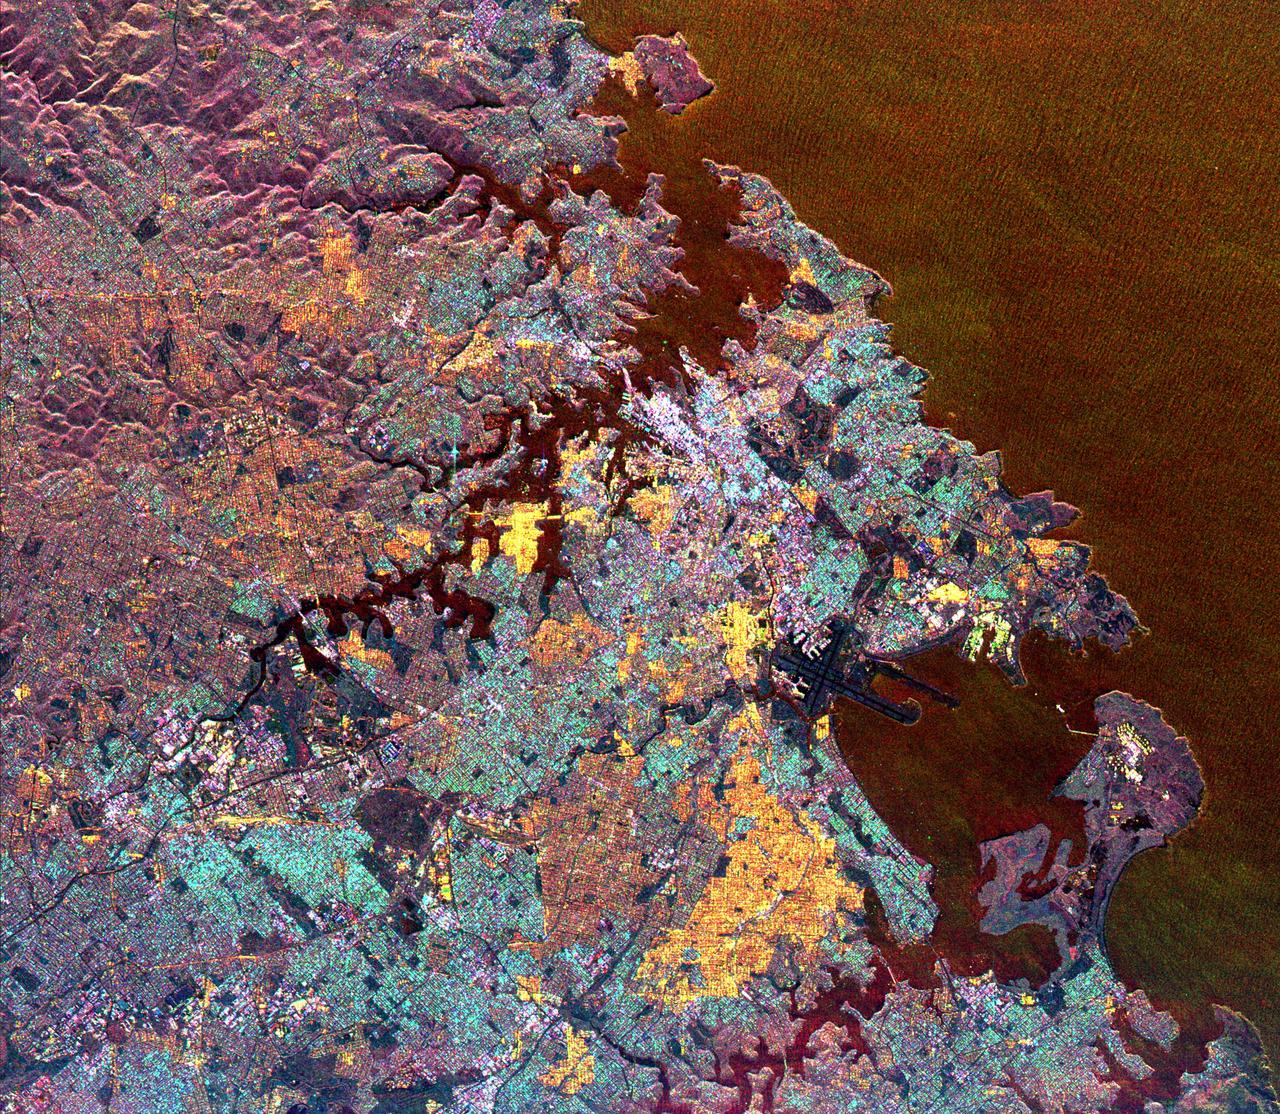
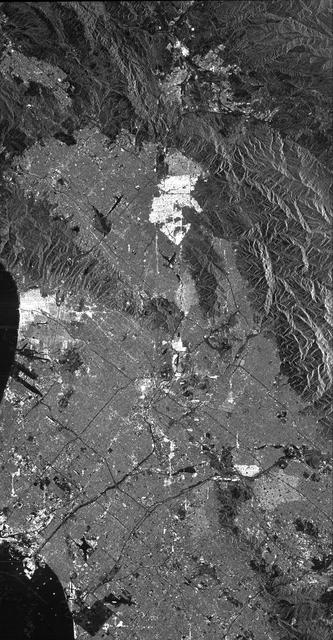
This image of Houston, Texas, shows the amount of detail that is possible to obtain using spaceborne radar imaging. Images such as this -- obtained by the Spaceborne Imaging Radar-C/X-band Synthetic Aperture Radar (SIR-C/X-SAR) flying aboard the space shuttle Endeavor last fall -- can become an effective tool for urban planners who map and monitor land use patterns in urban, agricultural and wetland areas. Central Houston appears pink and white in the upper portion of the image, outlined and crisscrossed by freeways. The image was obtained on October 10, 1994, during the space shuttle's 167th orbit. The area shown is 100 kilometers by 60 kilometers (62 miles by 38 miles) and is centered at 29.38 degrees north latitude, 95.1 degrees west longitude. North is toward the upper left. The pink areas designate urban development while the green-and blue-patterned areas are agricultural fields. Black areas are bodies of water, including Galveston Bay along the right edge and the Gulf of Mexico at the bottom of the image. Interstate 45 runs from top to bottom through the image. The narrow island at the bottom of the image is Galveston Island, with the city of Galveston at its northeast (right) end. The dark cross in the upper center of the image is Hobby Airport. Ellington Air Force Base is visible below Hobby on the other side of Interstate 45. Clear Lake is the dark body of water in the middle right of the image. The green square just north of Clear Lake is Johnson Space Center, home of Mission Control and the astronaut training facilities. The black rectangle with a white center that appears to the left of the city center is the Houston Astrodome. The colors in this image were obtained using the follow radar channels: red represents the L-band (horizontally transmitted, vertically received); green represents the C-band (horizontally transmitted, vertically received); blue represents the C-band (horizontally transmitted and received). http://photojournal.jpl.nasa.gov/catalog/PIA01783

A NASA camera on the Deep Space Climate Observatory satellite has returned its first view of the entire sunlit side of Earth from one million miles away. This color image of Earth was taken by NASA’s Earth Polychromatic Imaging Camera (EPIC), a four megapixel CCD camera and telescope. The image was generated by combining three separate images to create a photographic-quality image. The camera takes a series of 10 images using different narrowband filters -- from ultraviolet to near infrared -- to produce a variety of science products. The red, green and blue channel images are used in these color images. The image was taken July 6, 2015, showing North and Central America. The central turquoise areas are shallow seas around the Caribbean islands. This Earth image shows the effects of sunlight scattered by air molecules, giving the image a characteristic bluish tint. The EPIC team is working to remove this atmospheric effect from subsequent images. Once the instrument begins regular data acquisition, EPIC will provide a daily series of Earth images allowing for the first time study of daily variations over the entire globe. These images, available 12 to 36 hours after they are acquired, will be posted to a dedicated web page by September 2015. The primary objective of DSCOVR, a partnership between NASA, the National Oceanic and Atmospheric Administration (NOAA) and the U.S. Air Force, is to maintain the nation’s real-time solar wind monitoring capabilities, which are critical to the accuracy and lead time of space weather alerts and forecasts from NOAA. For more information about DSCOVR, visit: <a href="http://www.nesdis.noaa.gov/DSCOVR/" rel="nofollow">www.nesdis.noaa.gov/DSCOVR/</a>
This spaceborne radar image shows part of the British territory of Hong Kong, adjacent to mainland China. The South China Sea is shown in dark blue and red on the image.
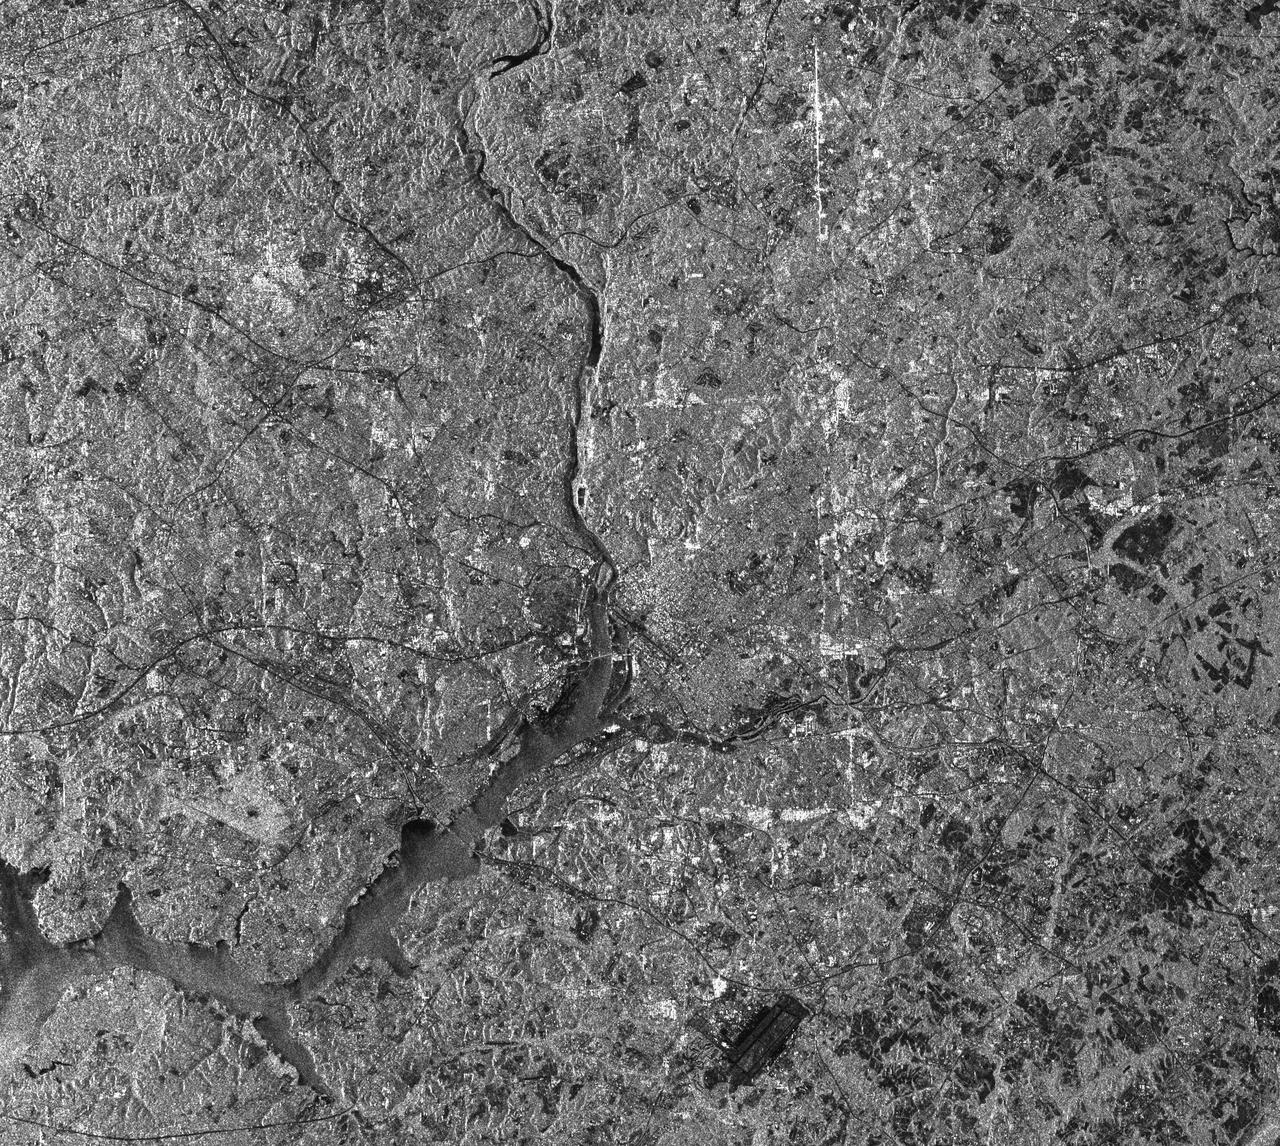
This radar image of the Washington, D.C. area demonstrates the capability of imaging radar as a useful tool for urban planners and managers to map and monitor land use patterns.
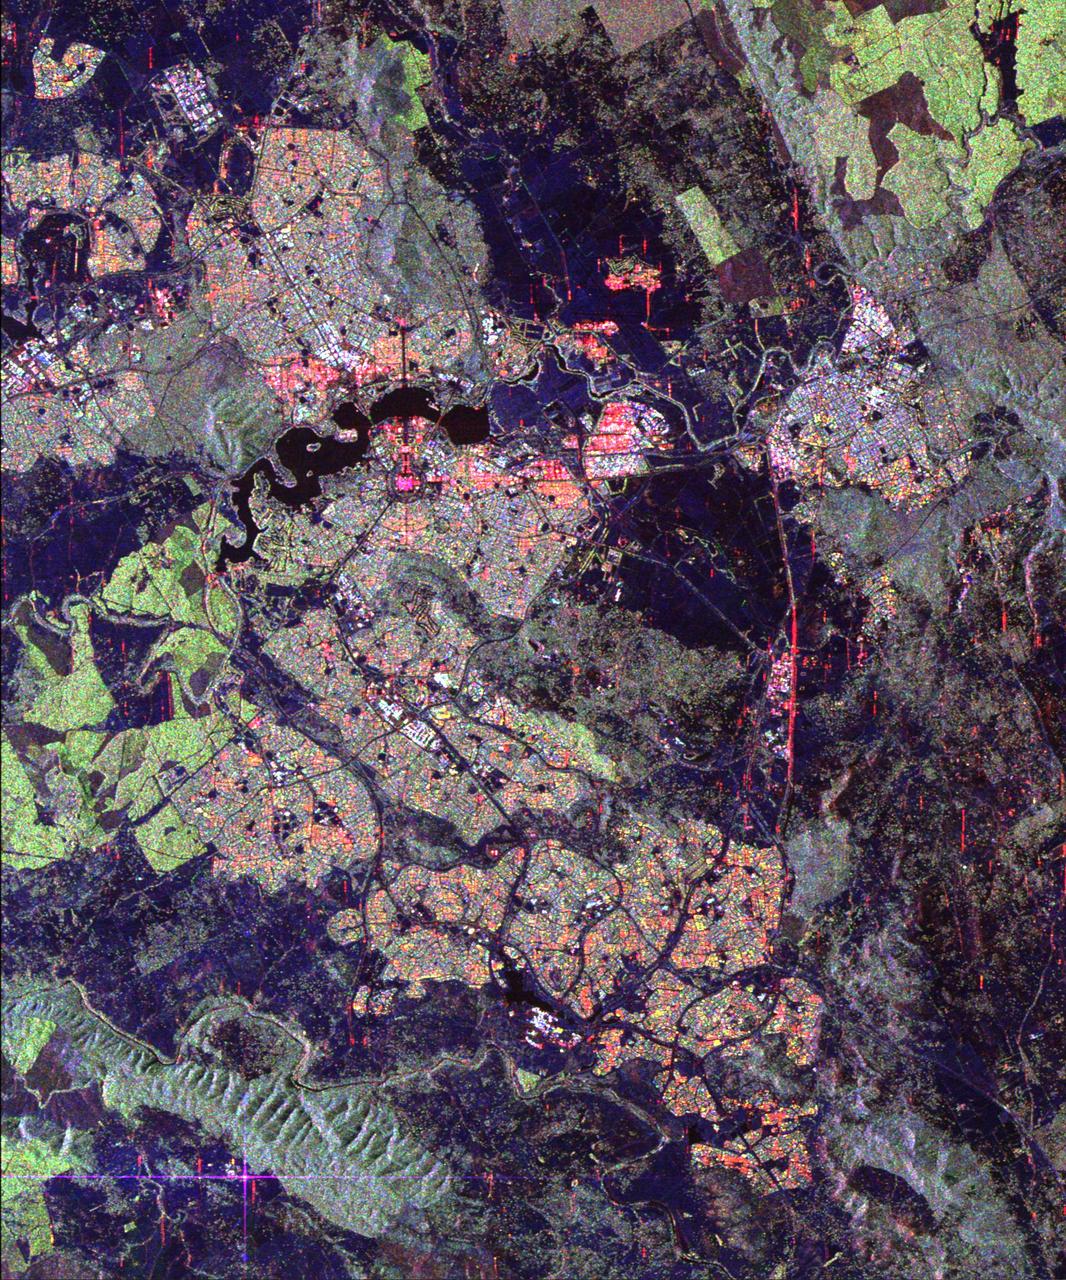
Australia capital city, Canberra, is shown in the center of this spaceborne radar image. Images like this can help urban planners assess land use patterns.
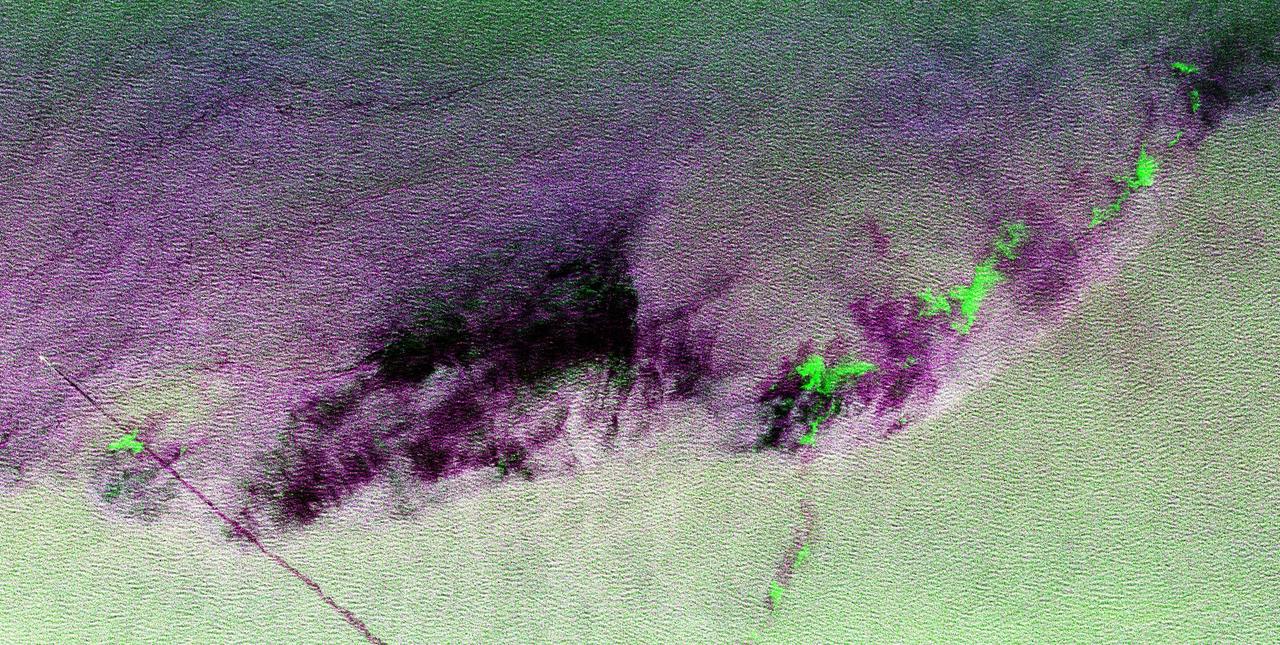
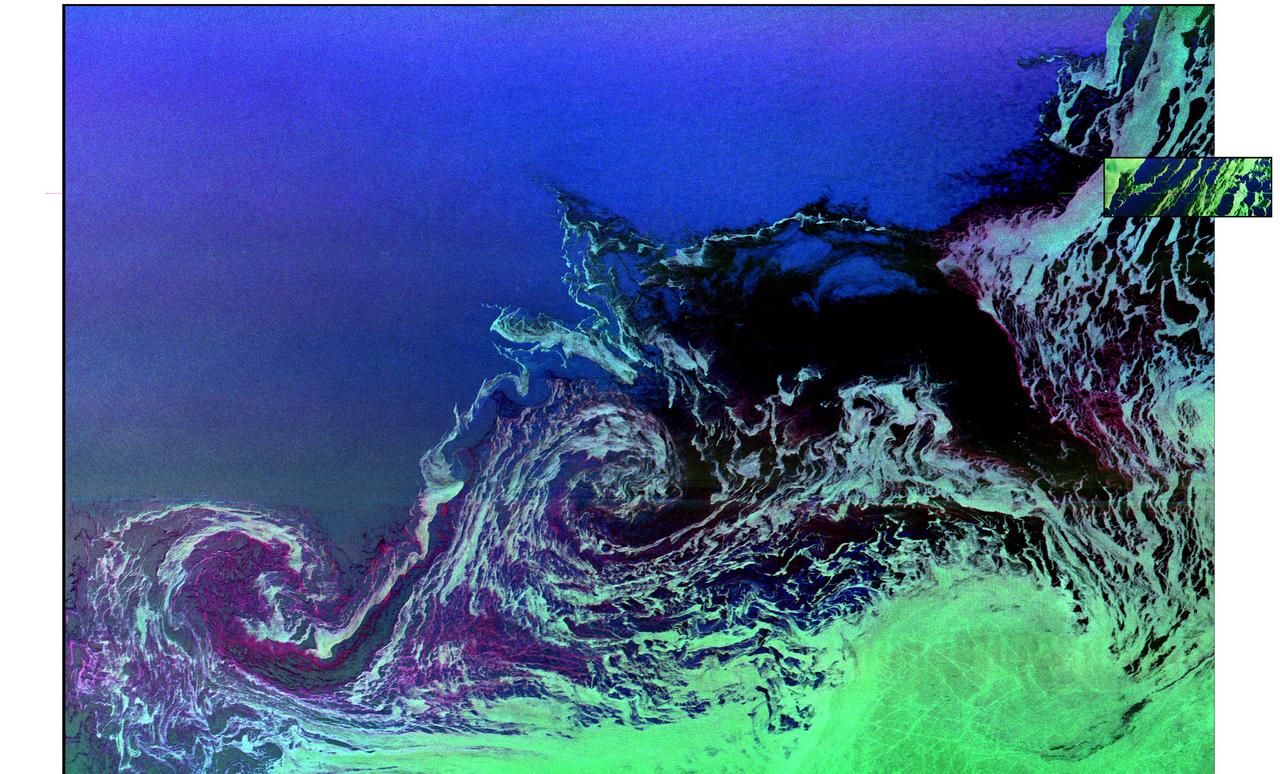
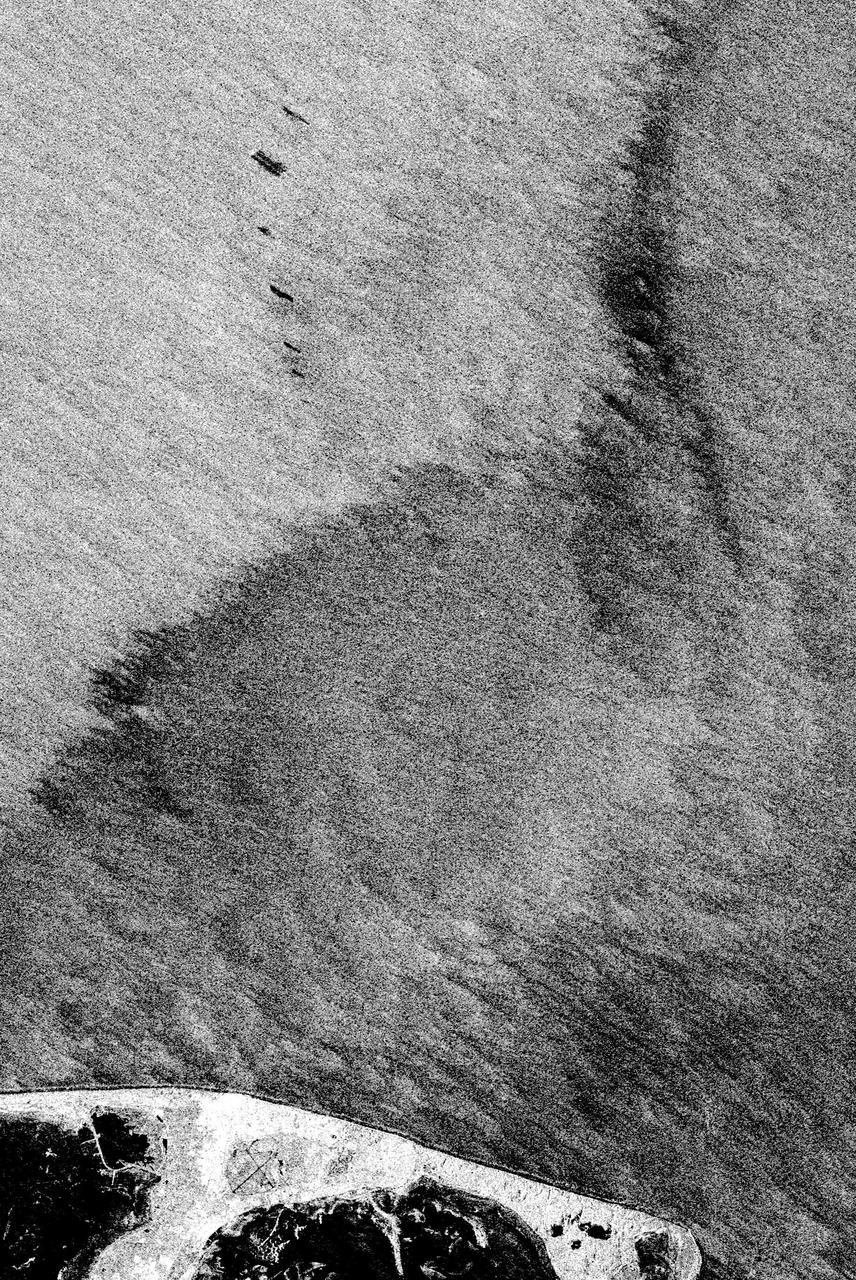
This is a radar image showing surface features on the open ocean in the northeast Atlantic Ocean. There is no land mass in this image. The purple line in the lower left of the image is the stern wake of a ship. The ship creating the wake is the bright white spot on the middle, left side of the image. The ship's wake is about 28 kilometers (17 miles) long in this image and investigators believe that is because the ship may be discharging oil. The oil makes the wake last longer and causes it to stand out in this radar image. A fairly sharp boundary or front extends from the lower left to the upper right corner of the image and separates two distinct water masses that have different temperatures. The different water temperature affects the wind patterns on the ocean. In this image, the light green area depicts rougher water with more wind, while the purple area is calmer water with less wind. The dark patches are smooth areas of low wind, probably related to clouds along the front, and the bright green patches are likely due to ice crystals in the clouds that scatter the radar waves. The overall "fuzzy" look of this image is caused by long ocean waves, also called swells. Ocean radar imagery allows the fine detail of ocean features and interactions to be seen, such as the wake, swell, ocean front and cloud effects, which can then be used to enhance the understanding of ocean dynamics on smaller and smaller scales. The image is centered at 42.8 degrees north latitude, 26.2 degrees west longitude and shows an area approximately 35 kilometers by 65 kilometers (22 by 40 miles). The colors in the image are assigned to different frequencies and polarizations of the radar as follows: red is L-band horizontally transmitted, horizontally received; green is C-band horizontally transmitted, horizontally received; blue is L-band vertically transmitted, vertically received. This image was acquired by the Spaceborne Imaging Radar-C/X-band Synthetic Aperture Radar (SIR-C/X-SAR) imaging radar when it flew aboard the space shuttle Endeavour on April 11, 1994. SIR-C/X-SAR, a joint mission of the German, Italian and United States space agencies, is part of NASA's Mission to Planet Earth. http://photojournal.jpl.nasa.gov/catalog/PIA01799
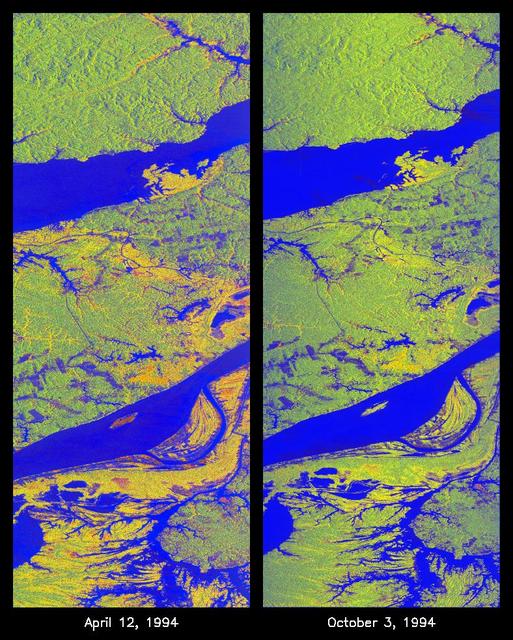
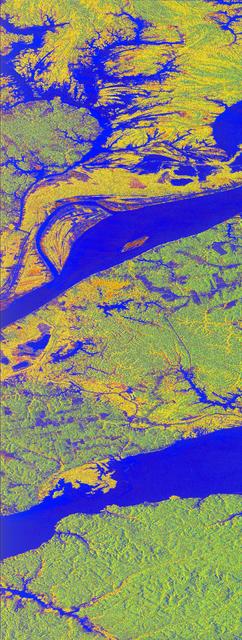
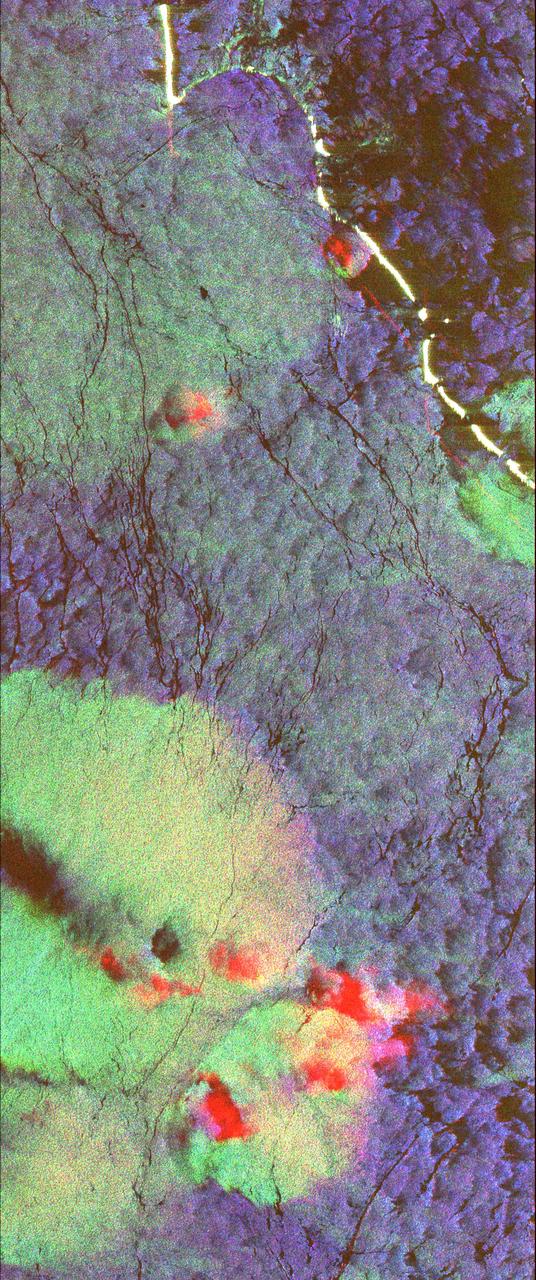
These two false-color images of the Manaus region of Brazil in South America were acquired by the Spaceborne Imaging Radar-C and X-band Synthetic Aperture Radar on board the space shuttle Endeavour. The image at left was acquired on April 12, 1994, and the image at right was acquired on October 3, 1994. The area shown is approximately 8 kilometers by 40 kilometers (5 miles by 25 miles). The two large rivers in this image, the Rio Negro (at top) and the Rio Solimoes (at bottom), combine at Manaus (west of the image) to form the Amazon River. The image is centered at about 3 degrees south latitude and 61 degrees west longitude. North is toward the top left of the images. The false colors were created by displaying three L-band polarization channels: red areas correspond to high backscatter, horizontally transmitted and received, while green areas correspond to high backscatter, horizontally transmitted and vertically received. Blue areas show low returns at vertical transmit/receive polarization; hence the bright blue colors of the smooth river surfaces can be seen. Using this color scheme, green areas in the image are heavily forested, while blue areas are either cleared forest or open water. The yellow and red areas are flooded forest or floating meadows. The extent of the flooding is much greater in the April image than in the October image and appears to follow the 10-meter (33-foot) annual rise and fall of the Amazon River. The flooded forest is a vital habitat for fish, and floating meadows are an important source of atmospheric methane. These images demonstrate the capability of SIR-C/X-SAR to study important environmental changes that are impossible to see with optical sensors over regions such as the Amazon, where frequent cloud cover and dense forest canopies block monitoring of flooding. Field studies by boat, on foot and in low-flying aircraft by the University of California at Santa Barbara, in collaboration with Brazil's Instituto Nacional de Pesguisas Estaciais, during the first and second flights of the SIR-C/X-SAR system have validated the interpretation of the radar images. http://photojournal.jpl.nasa.gov/catalog/PIA01735
This spaceborne radar image is dominated by the metropolitan area of Australia largest city, Sydney.
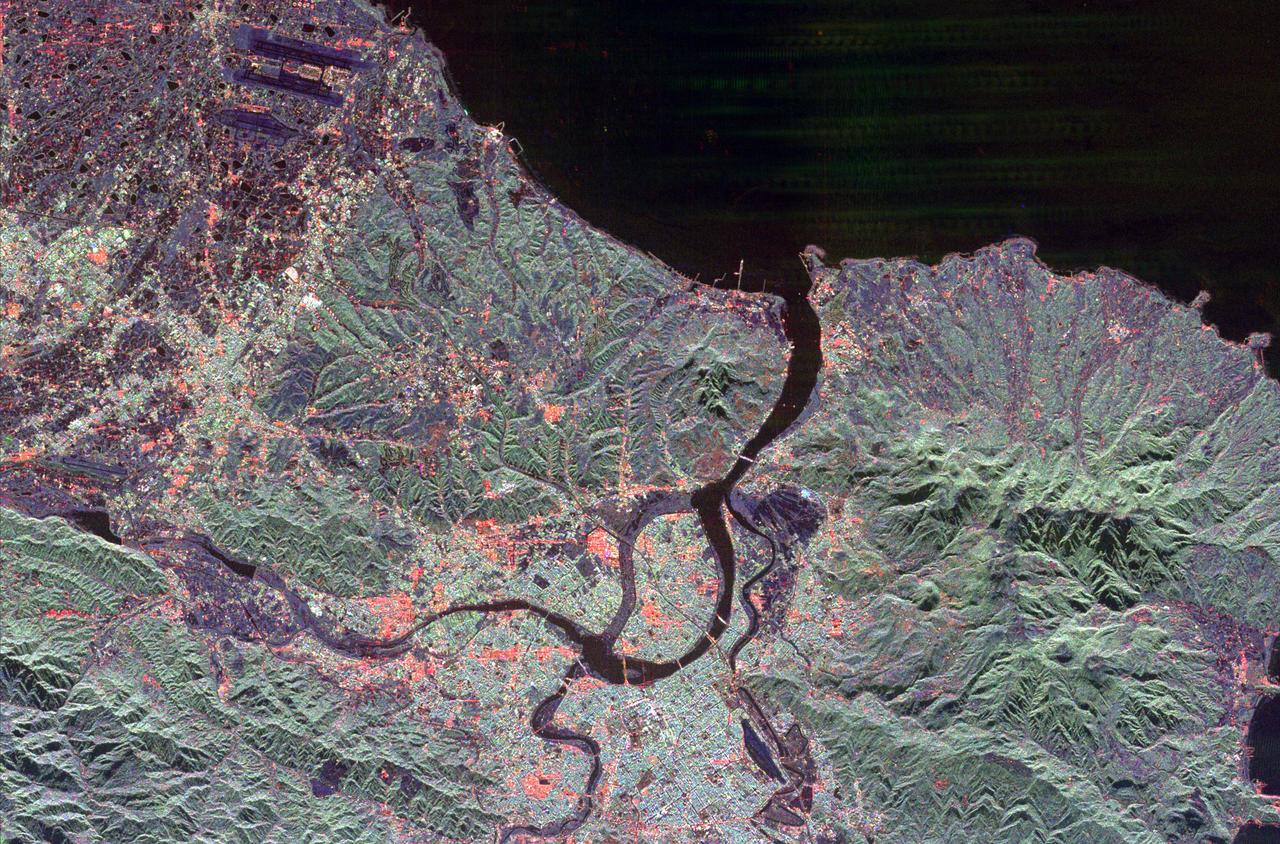
The northern end of the island country of Taiwan, including the capital city of Taipei, is shown in this spaceborne radar image. Taipei is the bright blue and red area in the lower center of the image.
This radar image of Dublin, Ireland, shows how the radar distinguishes between densely populated urban areas and nearby areas that are relatively unsettled. In the center of the image is the city natural harbor along the Irish Sea.
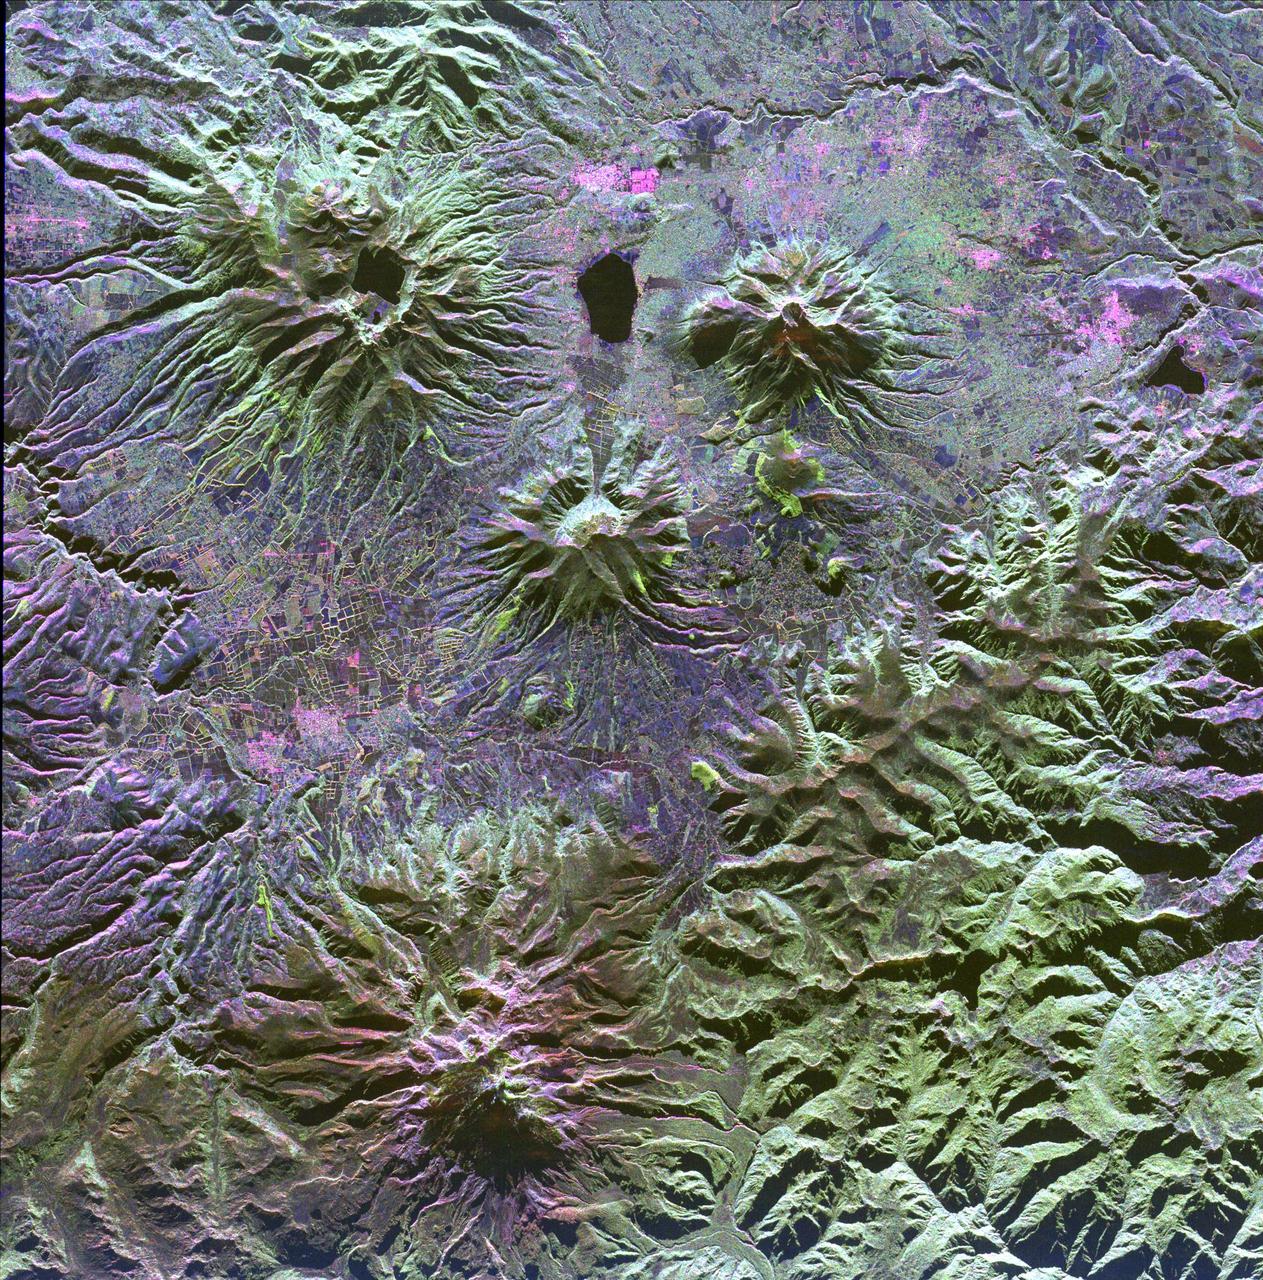
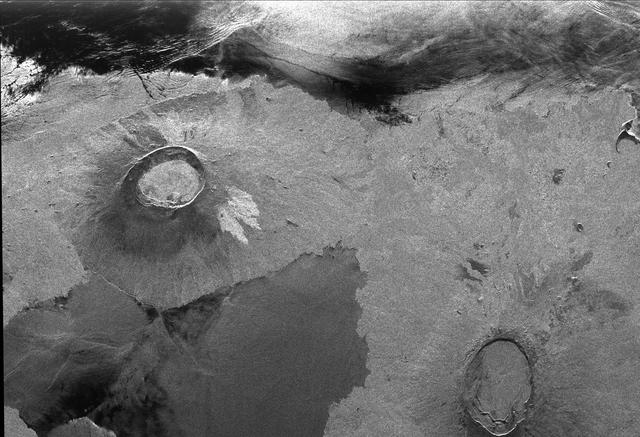
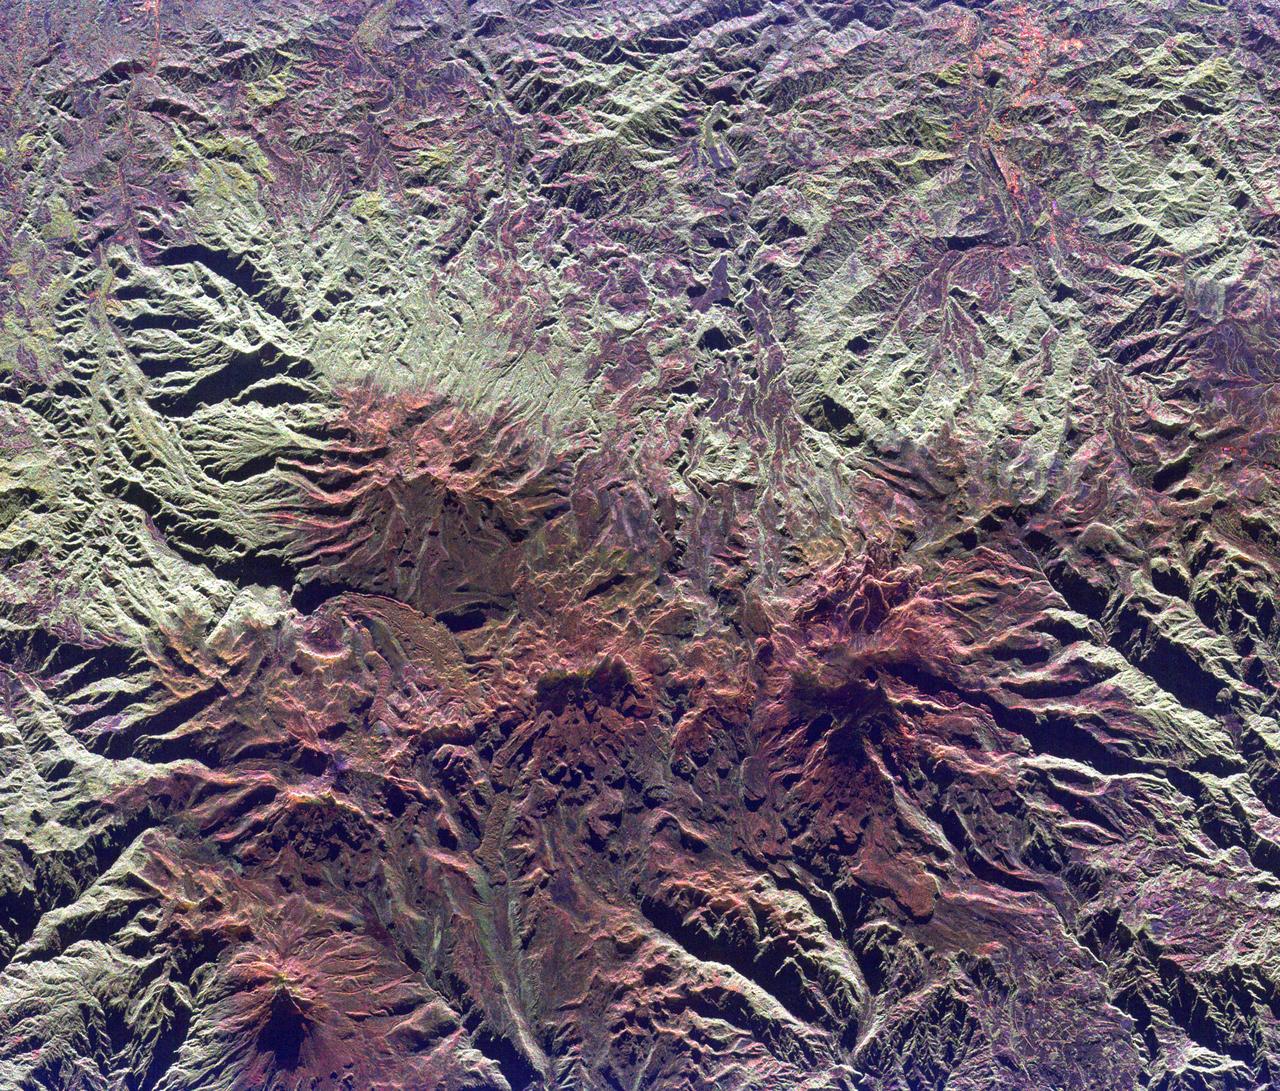
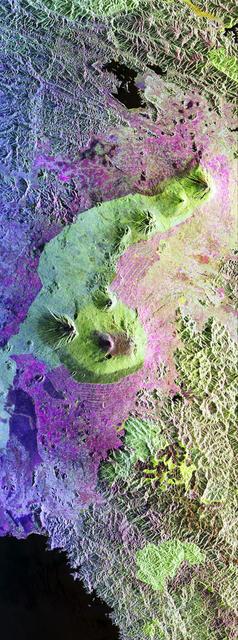
A family of dormant volcanoes dominates the landscape in this radar image of the Andes Mountains in northern Ecuador. The city of Otavalo, shown in pink, and Lake Otavalo lie within the triangle formed by three volcanoes in the upper part of the image.
This image is a false-color composite of the Mammoth Mountain area in the Sierra Nevada Mountains, California. The image is centered at 37.6 degrees north latitude and 119.0 degrees west longitude.
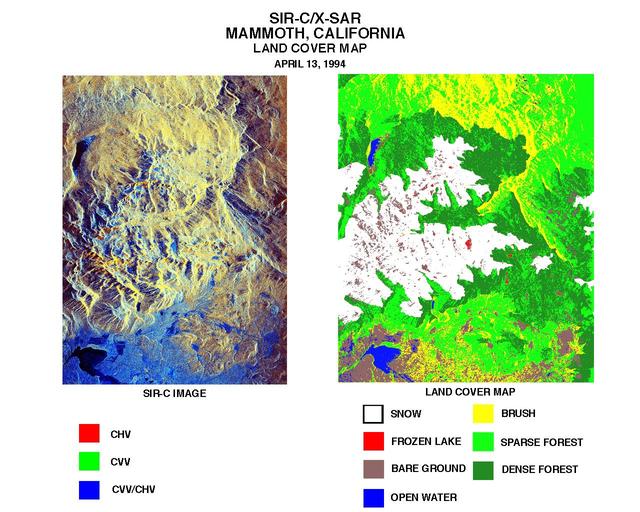
These two images were created using data from NASA Spaceborne Imaging Radar C/X-Band Synthetic Aperture Radar SIR-C/X-SAR.
This space radar image illustrates the recent rapid urban development occurring along the lower Colorado River at the Nevada/Arizona state line. Lake Mojave is the dark feature that occupies the river valley in the upper half of the image.
This is an image showing part of Isla Isabella in the western Galapagos Islands. It was taken by the L-band radar in HH polarization from the Spaceborne Imaging Radar C/X-Band Synthetic Aperture Radar on the 40th orbit of NASA’s space shuttle Endeavour.
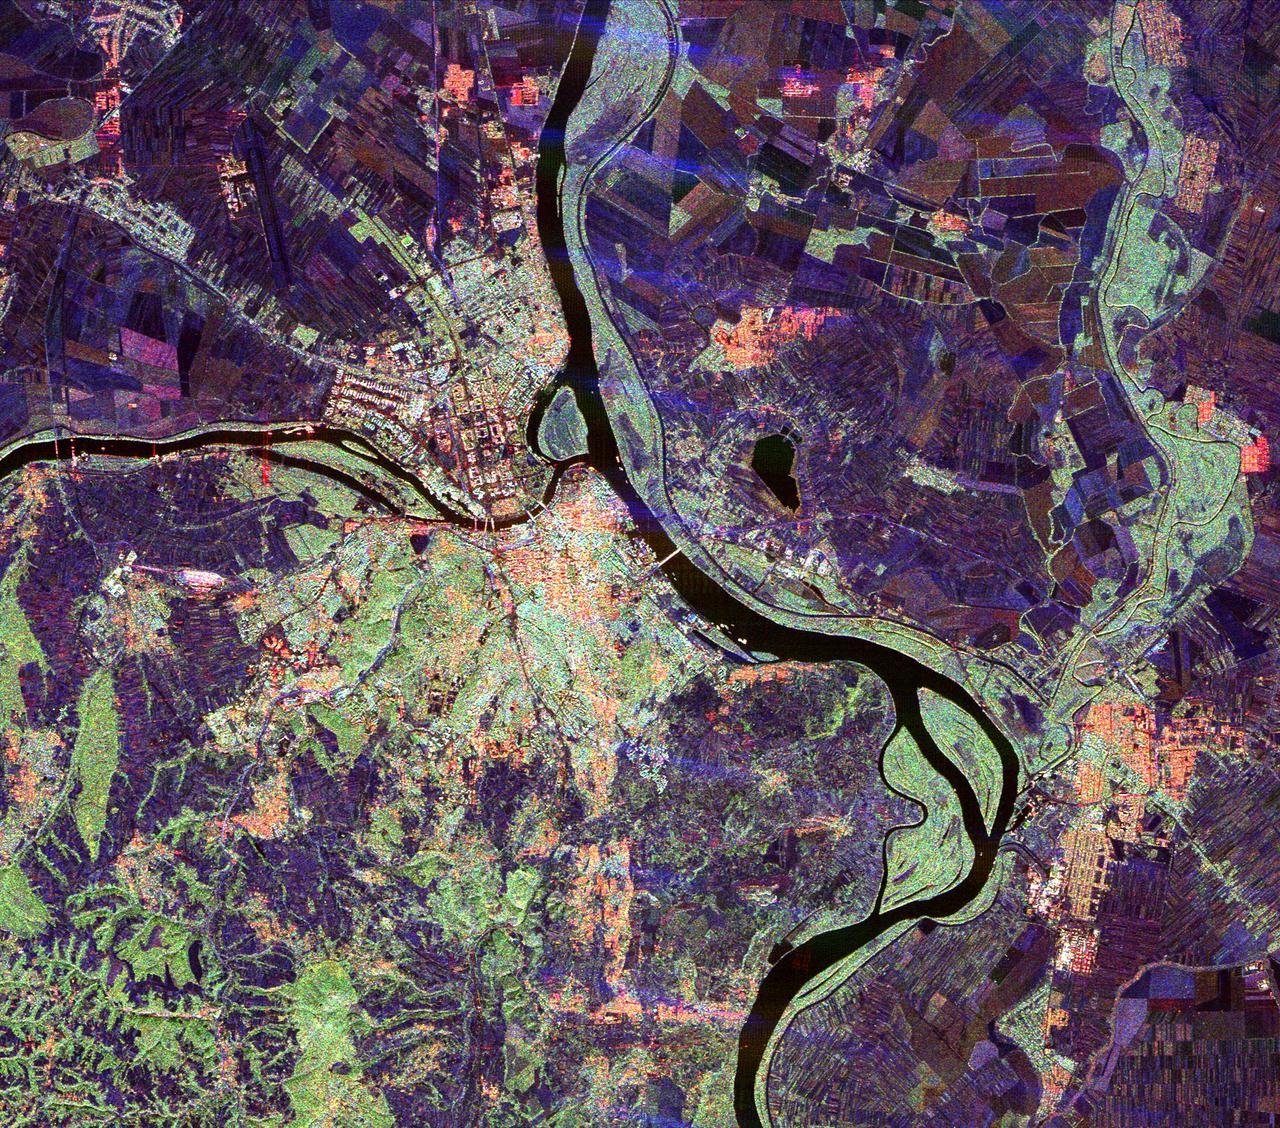
This is an image of the Chernobyl nuclear power plant and its surroundings, centered at 51.17 north latitude and 30.15 west longitude.
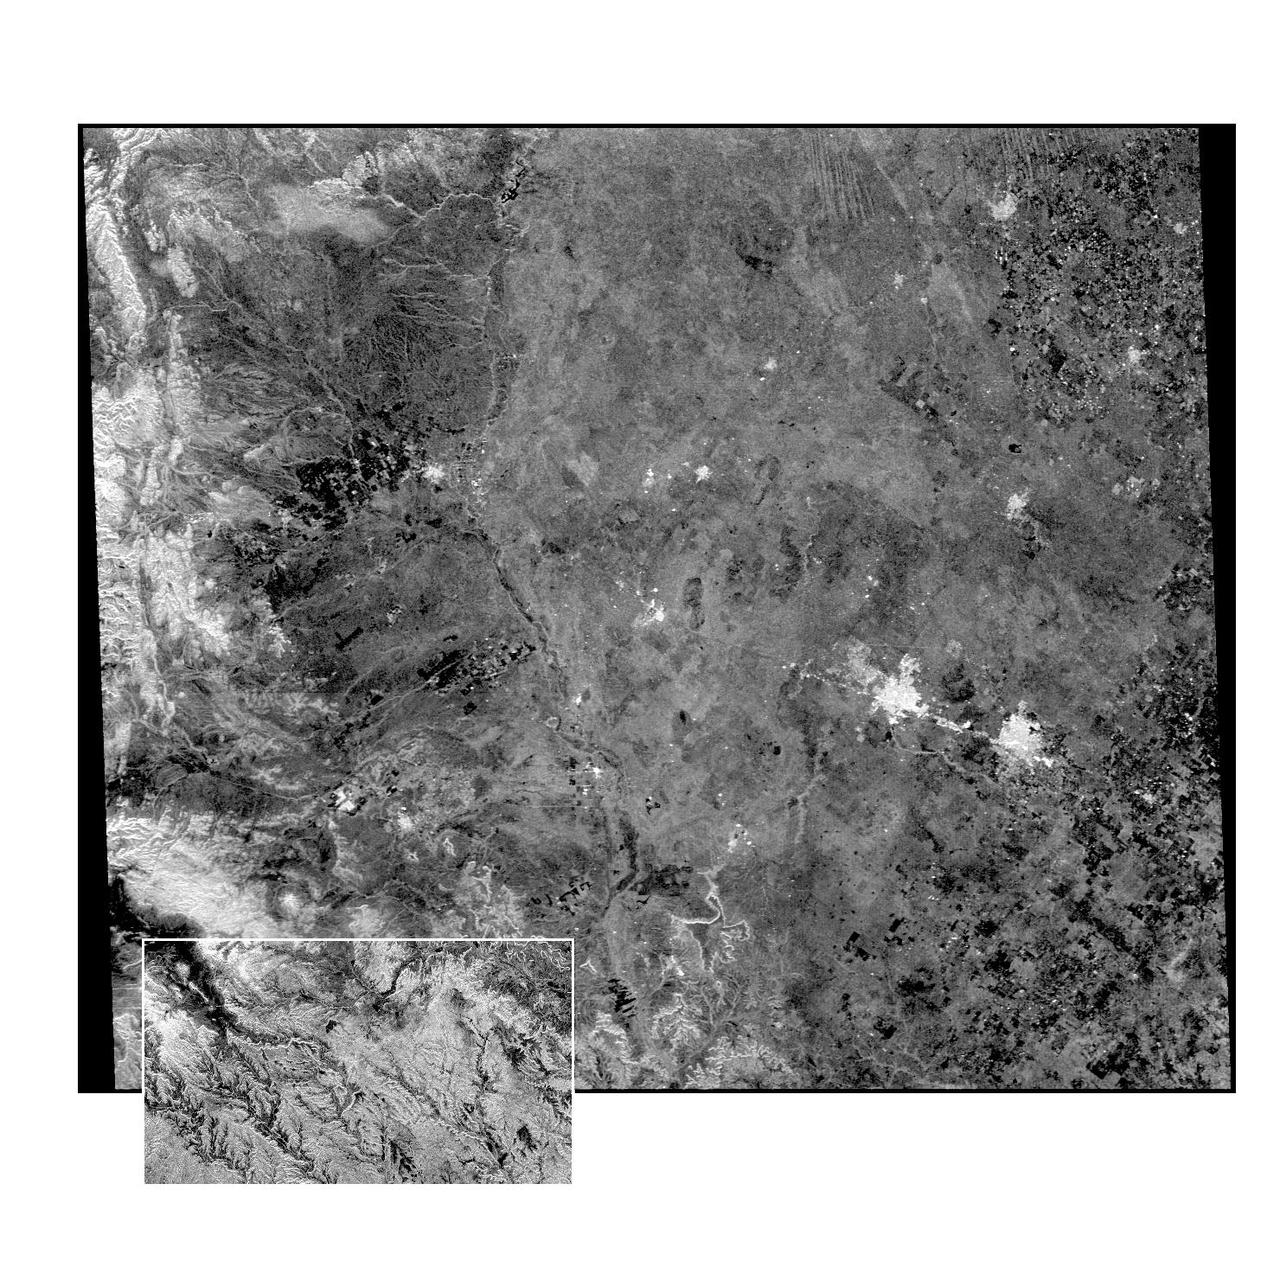
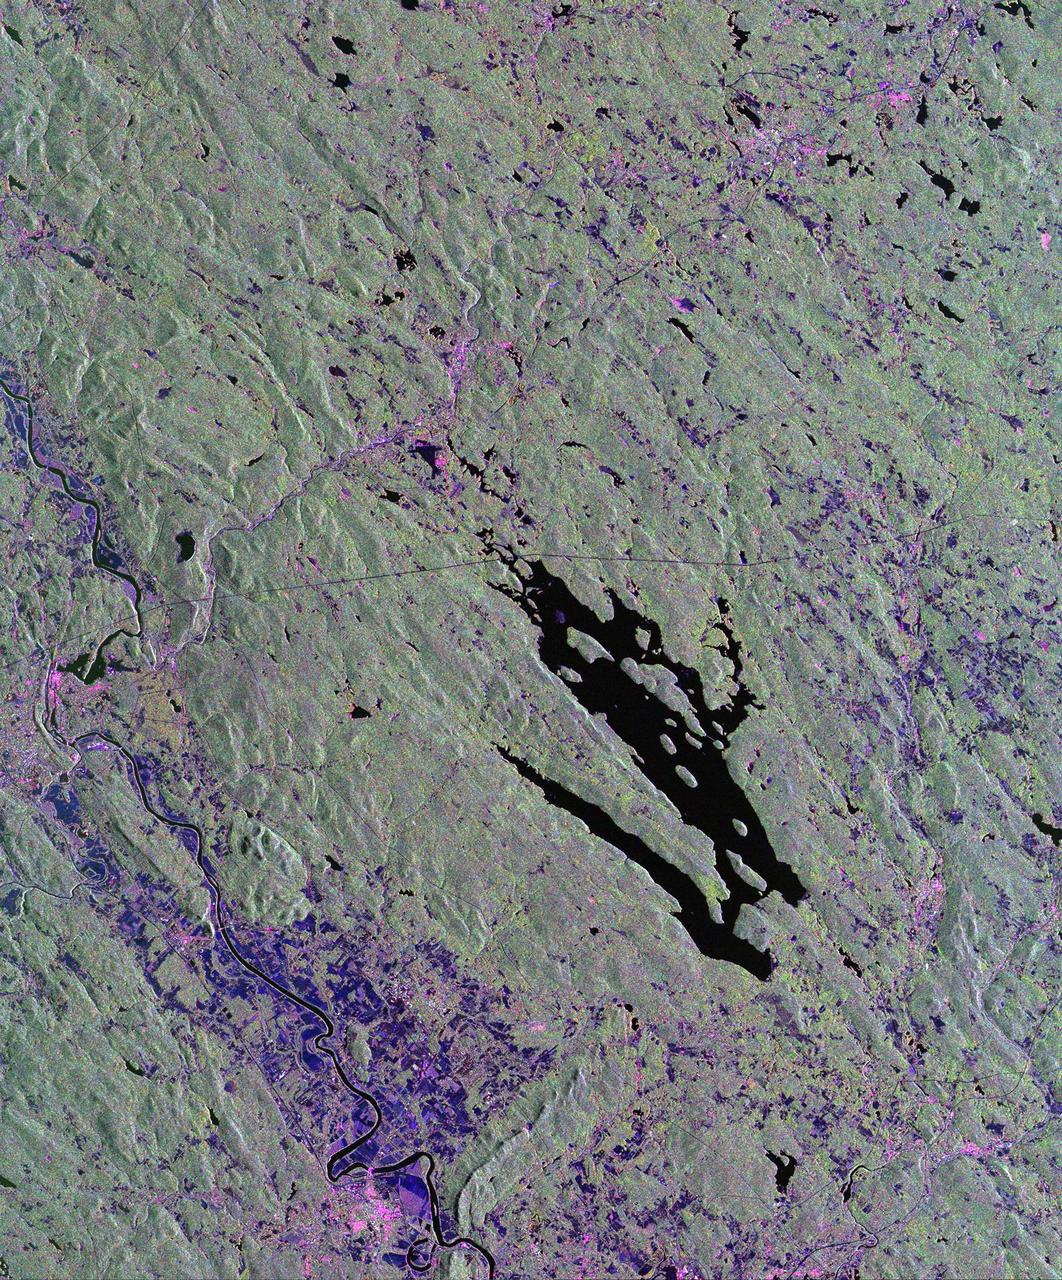
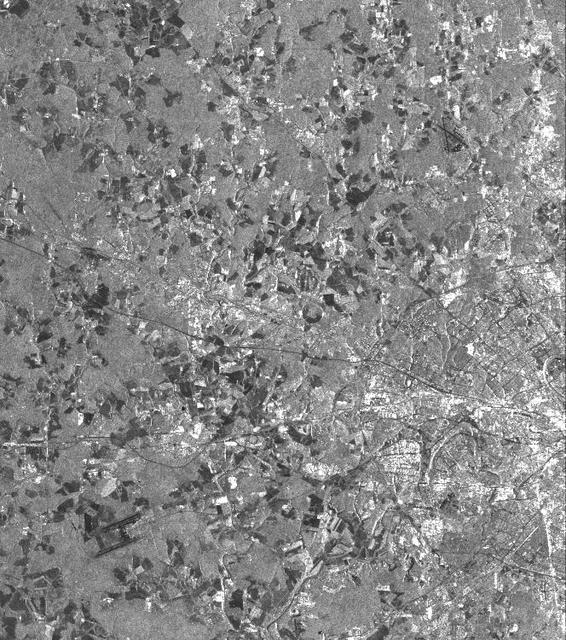
This radar image of the Midland/Odessa region of West Texas, demonstrates an experimental technique, called ScanSAR, that allows scientists to rapidly image large areas of the Earth's surface. The large image covers an area 245 kilometers by 225 kilometers (152 miles by 139 miles). It was obtained by the Spaceborne Imaging Radar-C/X-Band Synthetic Aperture Radar (SIR-C/X-SAR) flying aboard the space shuttle Endeavour on October 5, 1994. The smaller inset image is a standard SIR-C image showing a portion of the same area, 100 kilometers by 57 kilometers (62 miles by 35 miles) and was taken during the first flight of SIR-C on April 14, 1994. The bright spots on the right side of the image are the cities of Odessa (left) and Midland (right), Texas. The Pecos River runs from the top center to the bottom center of the image. Along the left side of the image are, from top to bottom, parts of the Guadalupe, Davis and Santiago Mountains. North is toward the upper right. Unlike conventional radar imaging, in which a radar continuously illuminates a single ground swath as the space shuttle passes over the terrain, a Scansar radar illuminates several adjacent ground swaths almost simultaneously, by "scanning" the radar beam across a large area in a rapid sequence. The adjacent swaths, typically about 50 km (31 miles) wide, are then merged during ground processing to produce a single large scene. Illumination for this L-band scene is from the top of the image. The beams were scanned from the top of the scene to the bottom, as the shuttle flew from left to right. This scene was acquired in about 30 seconds. A normal SIR-C image is acquired in about 13 seconds. The ScanSAR mode will likely be used on future radar sensors to construct regional and possibly global radar images and topographic maps. The ScanSAR processor is being designed for 1996 implementation at NASA's Alaska SAR Facility, located at the University of Alaska Fairbanks, and will produce digital images from the forthcoming Canadian RADARSAT satellite. http://photojournal.jpl.nasa.gov/catalog/PIA01787
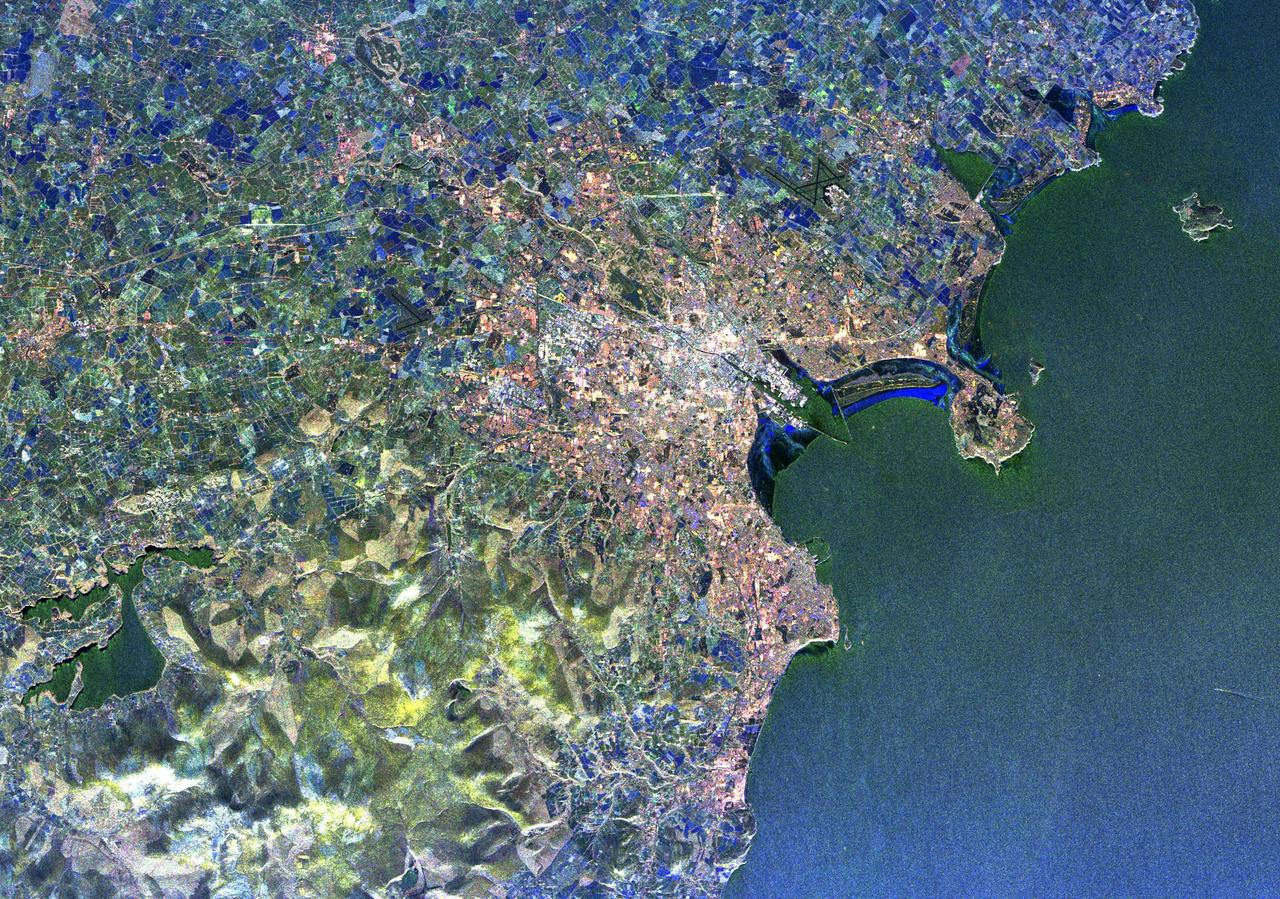
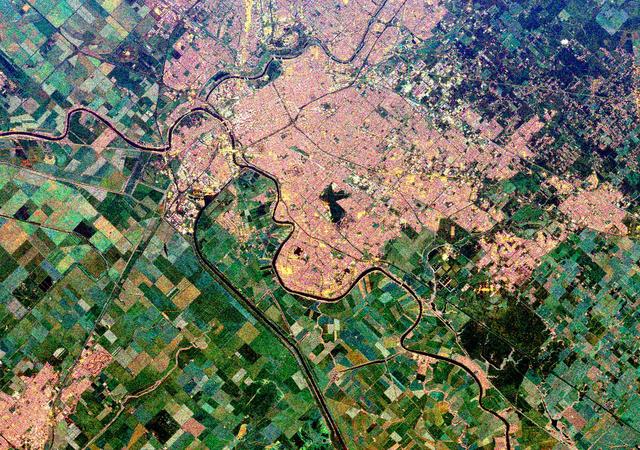
This radar image shows land use patterns in and around the city of Florence, Italy, shown here in the center of the image. Florence is situated on a plain in the Chianti Hill region of Central Italy. The Arno River flows through town and is visible as the dark line running from the upper right to the bottom center of the image. The city is home to some of the world's most famous art museums. The bridges seen crossing the Arno, shown as faint red lines in the upper right portion of the image, were all sacked during World War II with the exception of the Ponte Vecchio, which remains as Florence's only covered bridge. The large, black V-shaped feature near the center of the image is the Florence Railroad Station. This image was acquired by the Spaceborne Imaging Radar-C/X-band Synthetic Aperture Radar (SIR-C/X-SAR) onboard the Space Shuttle Endeavour on April 14, 1994. SIR-C/X-SAR, a joint mission of the German, Italian, and United States space agencies, is part of NASA's Mission to Planet Earth. This image is centered at 43.7 degrees north latitude and 11.15 degrees east longitude with North toward the upper left of the image. The area shown measures 20 kilometers by 17 kilometers (12.4 miles by 10.6 miles). The colors in the image are assigned to different frequencies and polarizations of the radar as follows: red is L-band horizontally transmitted, horizontally received; green is L-band horizontally transmitted, vertically received; blue is C-band horizontally transmitted, vertically received. http://photojournal.jpl.nasa.gov/catalog/PIA01795
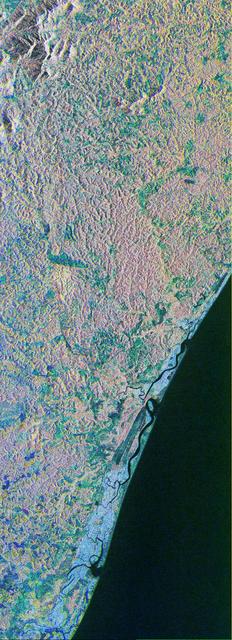
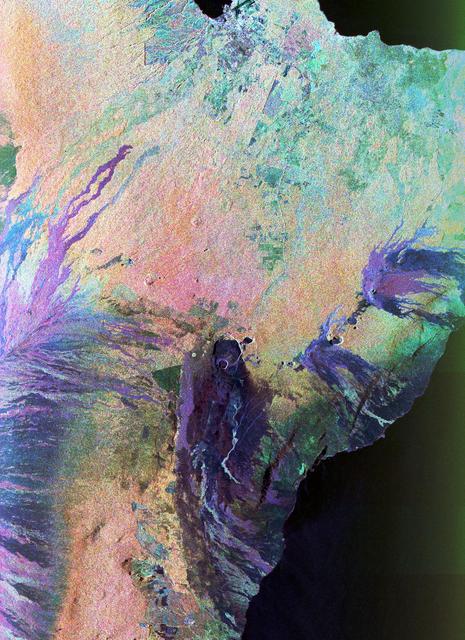
This is a color composite image of southern Bahia, Brazil, centered at 15.22 degree south latitude and 39.07 degrees west longitude. The image was acquired by the Spaceborne Imaging Radar-C/X-band Synthetic Aperture Radar aboard the space shuttle Endeavour on its 38th orbit of Earth on October 2, 1994. The image covers an area centered over the Una Biological Reserve, one the largest protected areas in northeastern Brazil. The 7,000-hectare reserve is administered by the Brazilian Institute for the Environment and is part of the larger Atlantic coastal forest, a narrow band of rain forest extending along the eastern coast of Brazil. The Atlantic coastal forest of southern Bahia is one of the world's most threatened and diverse ecosystems. Due to widespread settlement, only 2 to 5 percent of the original forest cover remains. Yet the region still contains an astounding variety of plants and animals, including a large number of endemic species. More than half of the region's tree species and 80 percent of its animal species are indigenous and found nowhere else on Earth. The Una Reserve is also the only federally protected habitat for the golden-headed lion tamarin, the yellow-breasted capuchin monkey and many other endangered species. In the past few years, scientists from Brazilian and international conservation organizations have coordinated efforts to study the biological diversity of this region and to develop practical and economically viable options for preserving the remaining primary forests in southern Bahia. The shuttle imaging radar is used in this study to identify various land uses and vegetation types, including remaining patches of primary forest, cabruca forest (cacao planted in the understory of the native forest), secondary forest, pasture and coastal mangrove. Standard remote-sensing technology that relies on light reflected from the forest canopy cannot accurately distinguish between cabruca and undisturbed forest. Optical remote sensing is also limited by the nearly continuous cloud cover in the region and heavy rainfall, which occurs more than 150 days each year. The ability of the shuttle radars to "see" through the forest canopy to the cultivated cacao below -- independent of weather or sunlight conditions --will allow researchers to distinguish forest from cabruca in unprecedented detail. This SIR-C/X-SAR image was produced by assigning red to the L-band, green to the C-band and blue to the X-band. The Una Reserve is located in the middle of the image west of the coastline and slightly northwest of Comandatuba River. The reserve's primary forests are easily detected by the pink areas in the image. The intensity of red in these areas is due to the high density of forest vegetation (biomass) detected by the radar's L-band (horizontally transmitted and vertically received) channel. Secondary forest is visible along the reserve's eastern border. The Serrado Mar mountain range is located in the top left portion of the image. Cabruca forest to the west of Una Reserve has a different texture and a yellow color. The removal of understory in cabruca forest reduces its biomass relative to primary forest, which changes the L-band and C-band penetration depth and returns, and produces a different texture and color in the image. The region along the Atlantic is mainly mangrove swamp, agricultural fields and urban areas. The high intensity of blue in this region is a result of increasing X-band return in areas covered with swamp and low vegetation. The image clearly separates the mangrove region (east of coastal Highway 001, shown in blue) from the taller and dryer forest west of the highway. The high resolution capability of SIR-C/X-SAR imaging and the sensitivity of its frequency and polarization channels to various land covers will be used for monitoring and mapping areas of importance for conservation. http://photojournal.jpl.nasa.gov/catalog/PIA01764
This radar image shows the massive urbanization of Los Angeles, California. The image extends from the Santa Monica Bay at the left to the San Gabriel Mountains at the right. Downtown Los Angeles is in the center of the image. The runways of the Los Angeles International Airport appear as black strips at the left center of the image. The waterways of Marina del Rey are seen just above the airport. The San Gabriel Mountains and the city of Pasadena are at the right center of the image. Black areas on the mountains on the right are fire scars from the 1993 Altadena fire. The Rose Bowl is shown as a small circle near the right center. The complex freeway system is visible as dark lines throughout the image. Some city areas, such as Santa Monica in the upper left, appear red due to the alignment of streets and buildings to the incoming radar beam. The image was acquired by the Spaceborne Imaging Radar-C/X-band Synthetic Aperture Radar (SIR-C/X-SAR) onboard the space shuttle Endeavour on October 3, 1994. SIR-C/X-SAR, a joint mission of the German, Italian and the United States space agencies, is part of NASA's Mission to Planet Earth. This image is centered at 34.04 degrees North latitude and 118.2 degrees West longitude with North pointing toward the upper right. The area shown measures 40 kilometers by 50 kilometers (25 miles by 31 miles). http://photojournal.jpl.nasa.gov/catalog/PIA01789
The Iveragh Peninsula, one of the four peninsulas in southwestern Ireland, is shown in this spaceborne radar image. The lakes of Killarney National Park are the green patches on the left side of the image.
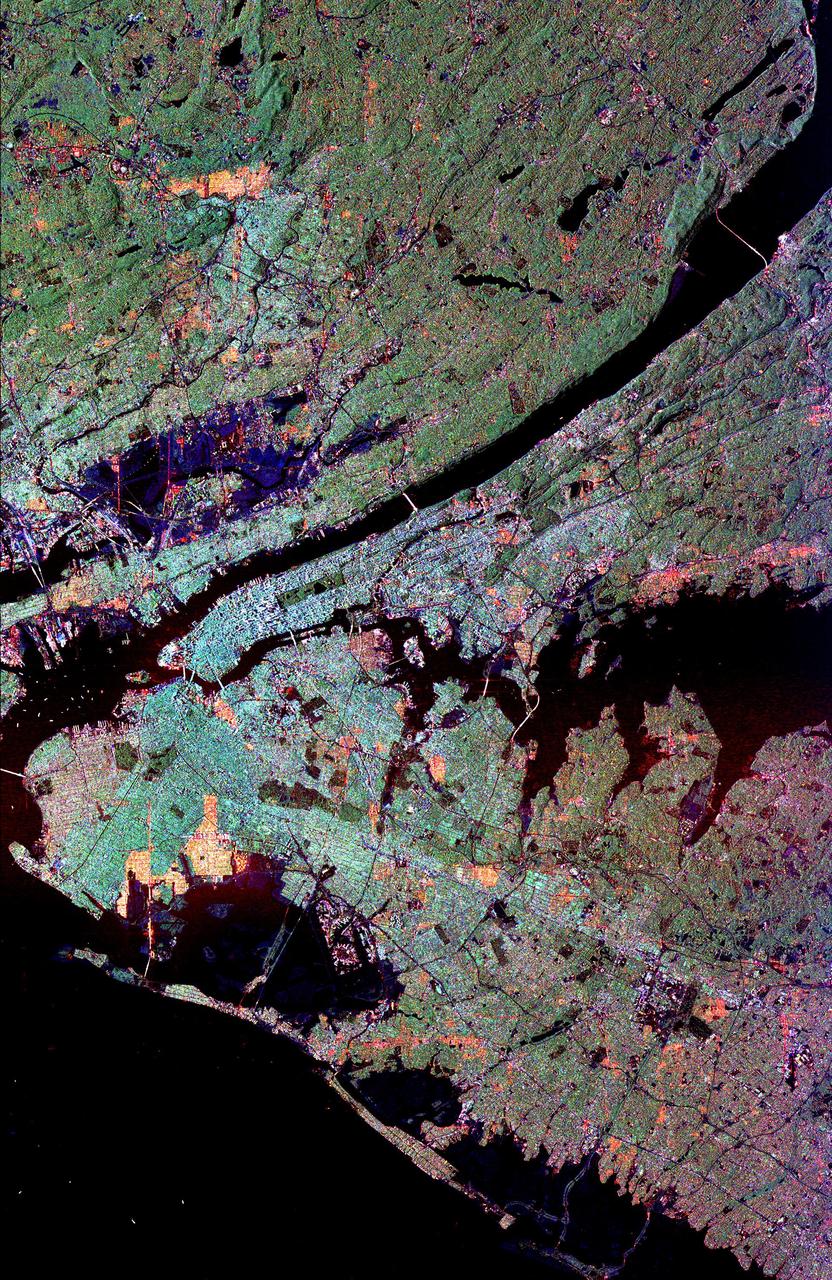
This radar image of the New York city metropolitan area. The island of Manhattan appears in the center of the image. The green-colored rectangle on Manhattan is Central Park.
This image of the Mauna Loa volcano on the Big Island of Hawaii shows the capability of imaging radar to map lava flows and other volcanic structures.
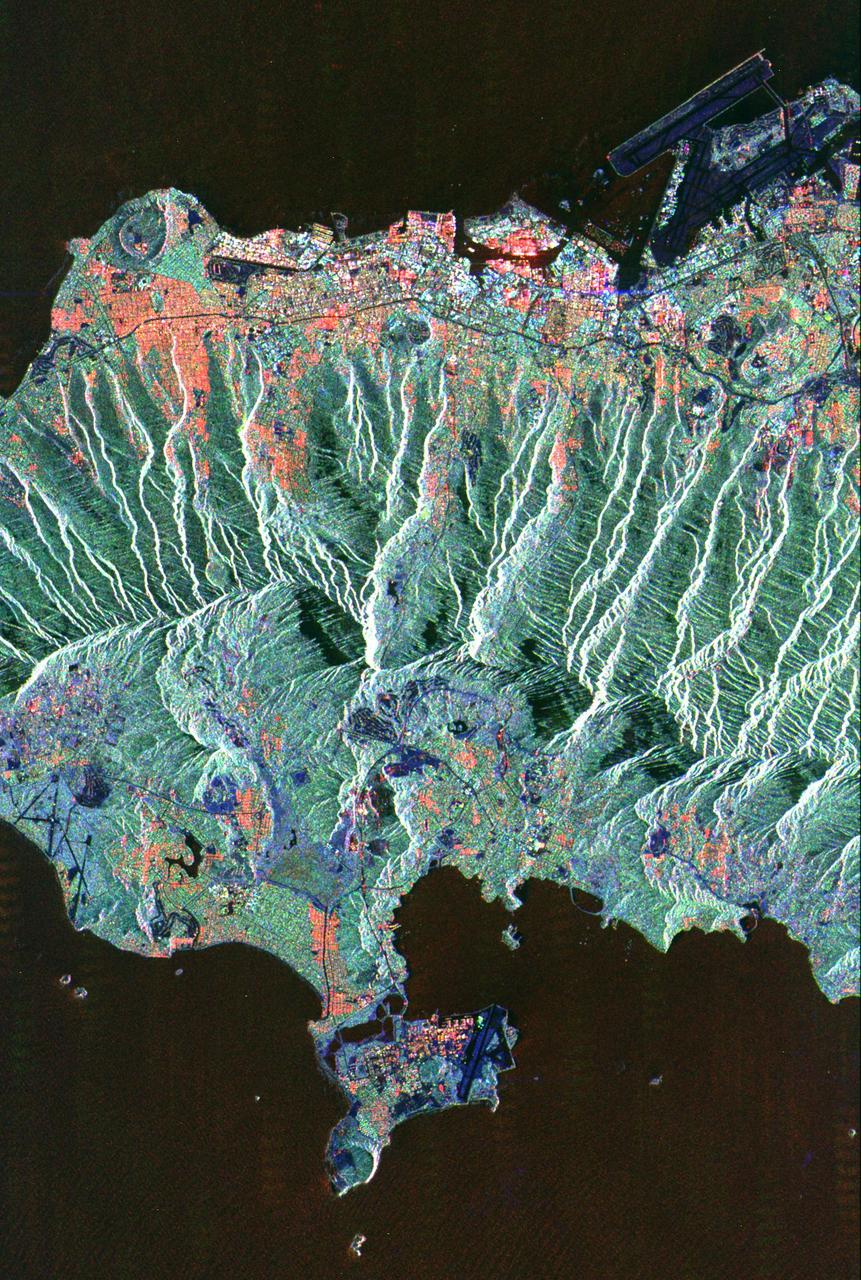
This spaceborne radar image shows the city of Honolulu, Hawaii and adjacent areas on the island of Oahu. Honolulu lies on the south shore of the island, along the bottom of this image.
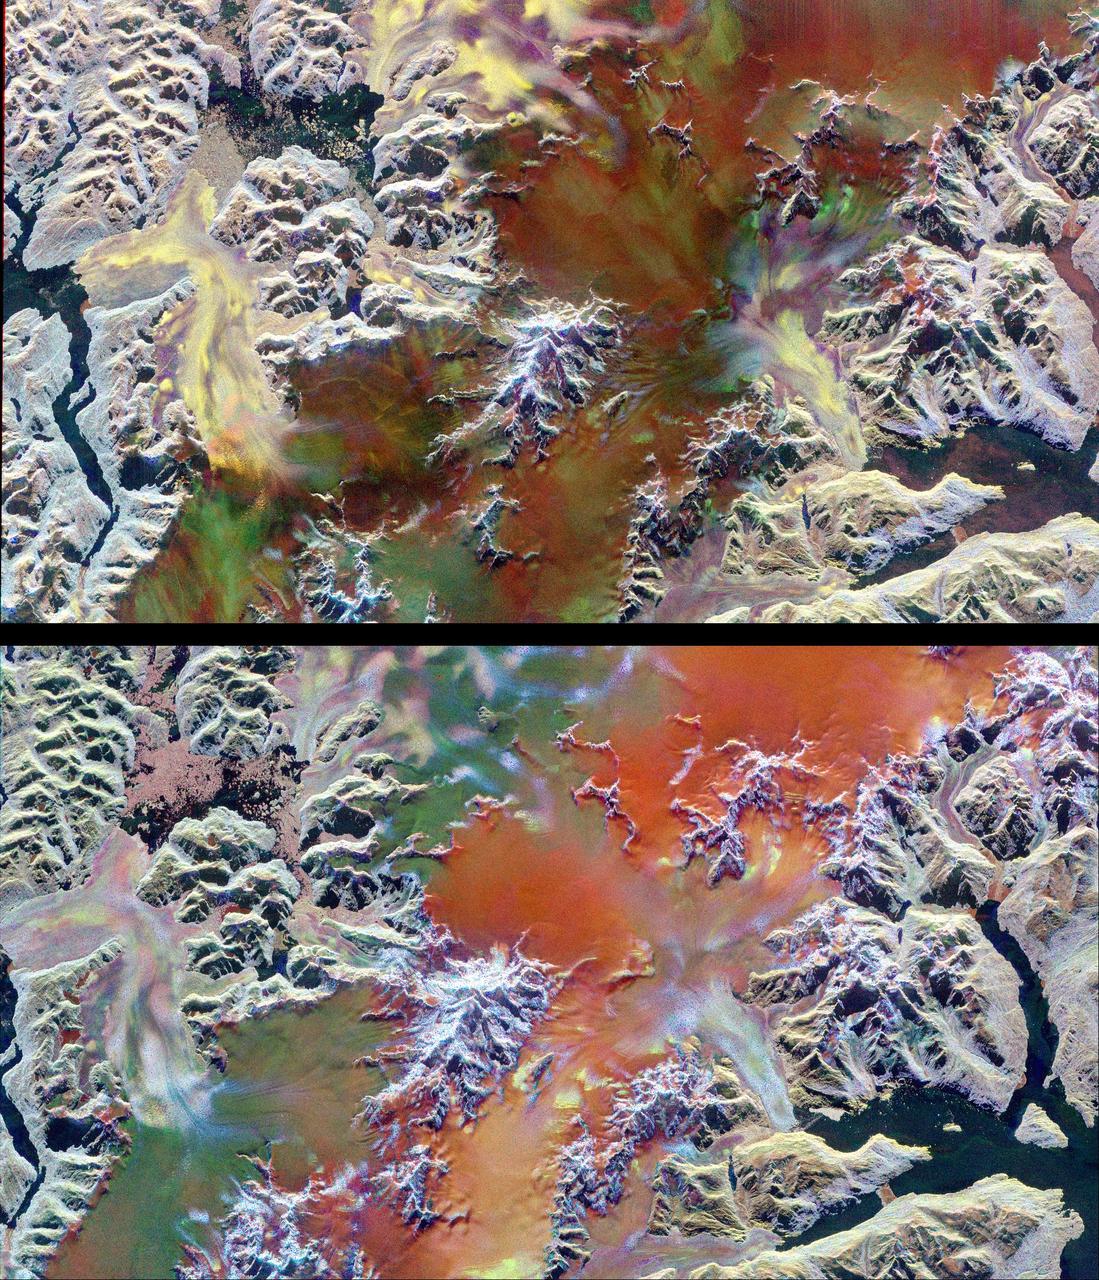
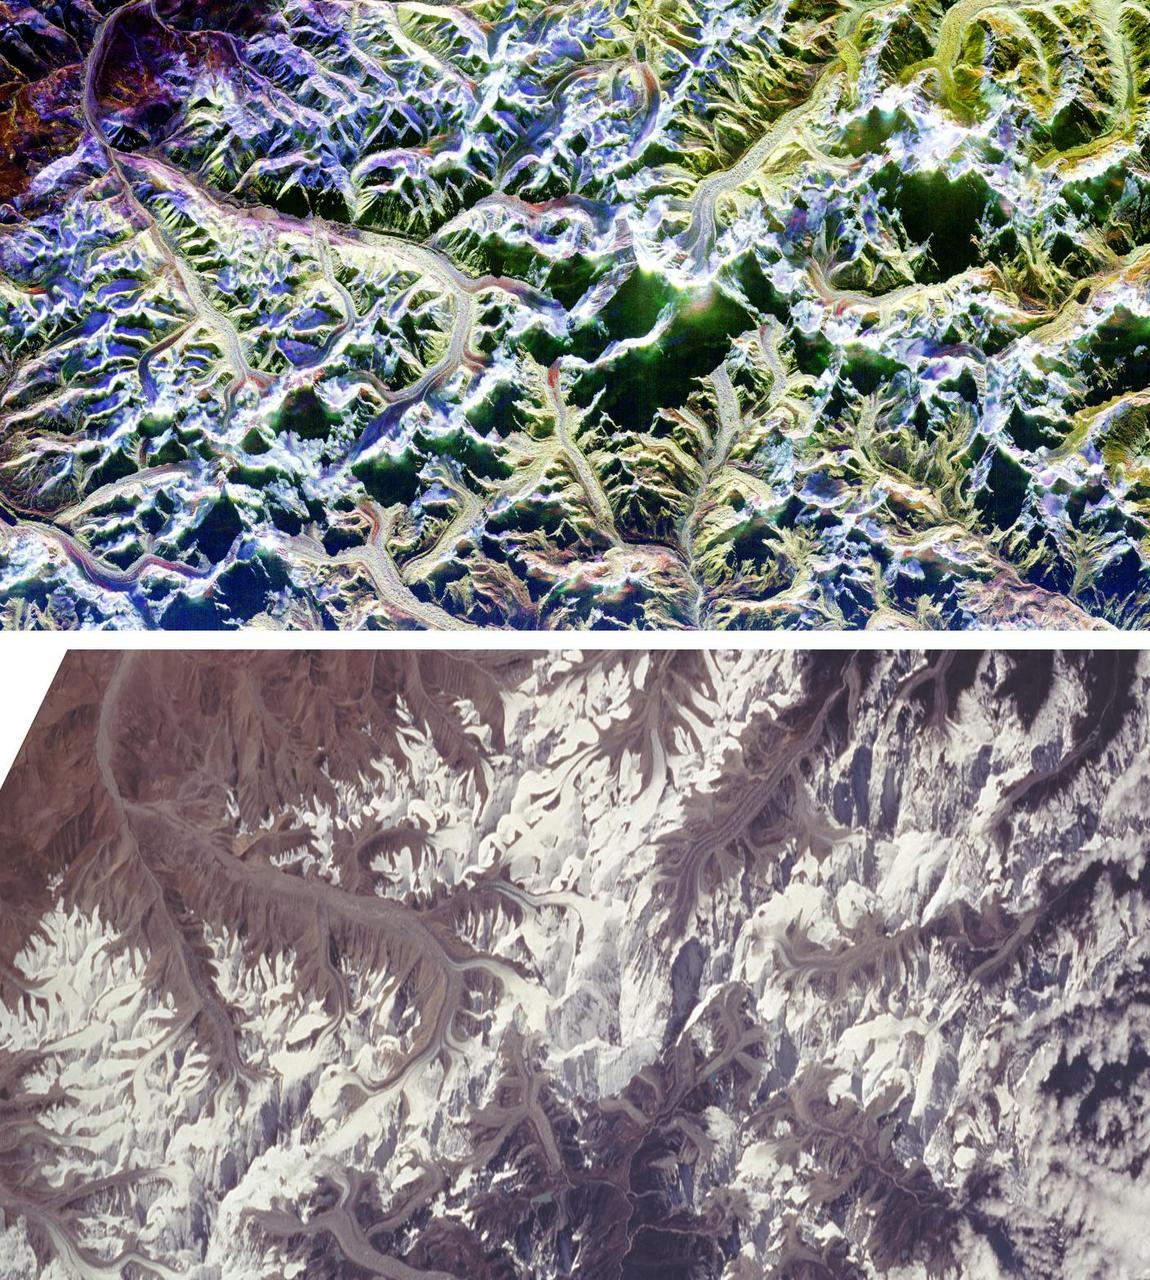
This pair of images illustrates the ability of multi-parameter radar imaging sensors such as the Spaceborne Imaging Radar-C/X-band Synthetic Aperture radar to detect climate-related changes on the Patagonian ice fields in the Andes Mountains of Chile and Argentina. The images show nearly the same area of the south Patagonian ice field as it was imaged during two space shuttle flights in 1994 that were conducted five-and-a-half months apart. The images, centered at 49.0 degrees south latitude and 73.5degrees west longitude, include several large outlet glaciers. The images were acquired by SIR-C/X-SAR on board the space shuttle Endeavour during April and October 1994. The top image was acquired on April 14, 1994, at 10:46 p.m. local time, while the bottom image was acquired on October 5,1994, at 10:57 p.m. local time. Both were acquired during the 77th orbit of the space shuttle. The area shown is approximately 100 kilometers by 58 kilometers (62 miles by 36 miles) with north toward the upper right. The colors in the images were obtained using the following radar channels: red represents the C-band (horizontally transmitted and received); green represents the L-band (horizontally transmitted and received); blue represents the L-band (horizontally transmitted and vertically received). The overall dark tone of the colors in the central portion of the April image indicates that the interior of the ice field is covered with thick wet snow. The outlet glaciers, consisting of rough bare ice, are the brightly colored yellow and purple lobes which terminate at calving fronts into the dark waters of lakes and fiords. During the second mission the temperatures were colder and the corresponding change in snow and ice conditions is readily apparent by comparing the images. The interior of the ice field is brighter because of increased radar return from the dryer snow. The distinct green/orange boundary on the ice field indicates an abrupt change in the structure of the snowcap, a direct indication of the steep meteorological gradients known to exist in this region. The bluer color of the outlet glaciers is probably due to a thin snow cover. A portion of the terminus of the outlet glacier at the top left center of the images has advanced approximately 600 meters (1,970 feet) in the five-and-a-half months between the two missions. Because of the persistent cloud cover this observation was only possible by using the orbiting, remote imaging radar system. http://photojournal.jpl.nasa.gov/catalog/PIA01778
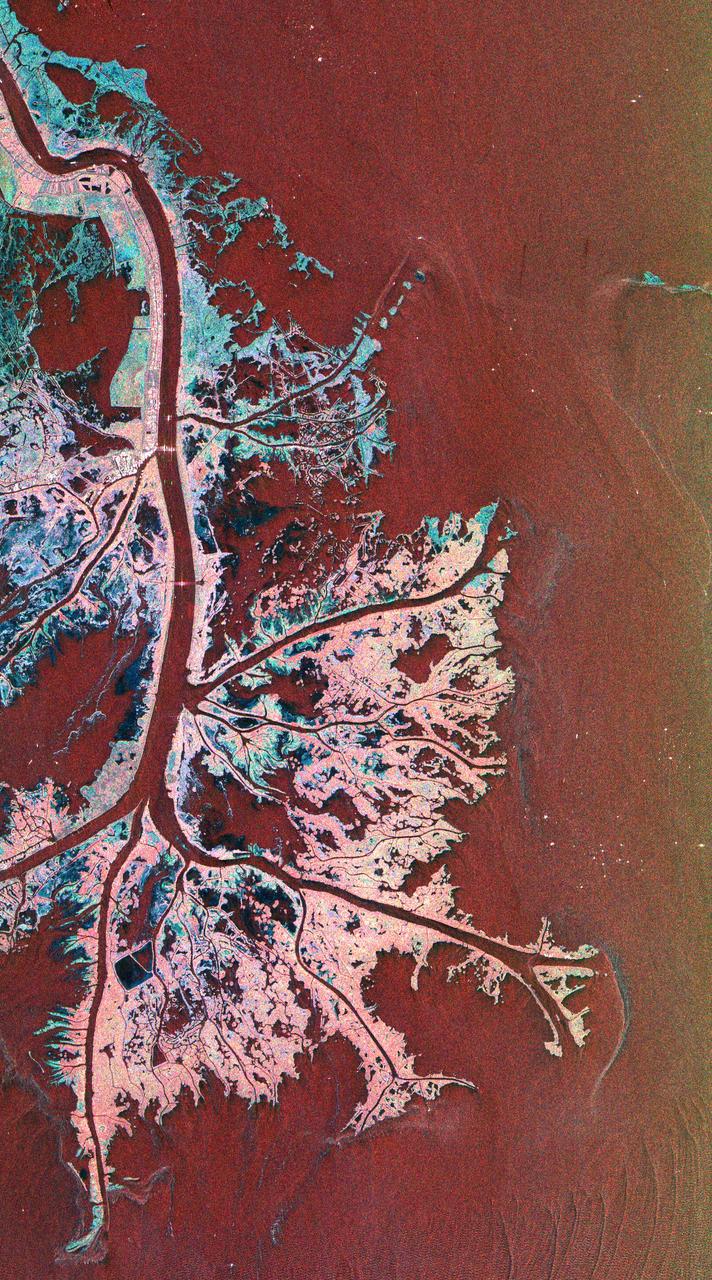
This is a radar image of the Mississippi River Delta where the river enters into the Gulf of Mexico along the coast of Louisiana. This multi-frequency image demonstrates the capability of the radar to distinguish different types of wetlands surfaces in river deltas. This image was acquired by the Spaceborne Imaging Radar-C/X-Band Synthetic Aperture Radar (SIR-C/X-SAR) aboard the space shuttle Endeavour on October 2, 1995. The image is centered on latitude 29.3 degrees North latitude and 89.28 degrees West longitude. The area shown is approximately 63 kilometers by 43 kilometers (39 miles by 26 miles). North is towards the upper right of the image. As the river enters the Gulf of Mexico, it loses energy and dumps its load of sediment that it has carried on its journey through the mid-continent. This pile of sediment, or mud, accumulates over the years building up the delta front. As one part of the delta becomes clogged with sediment, the delta front will migrate in search of new areas to grow. The area shown on this image is the currently active delta front of the Mississippi. The migratory nature of the delta forms natural traps for oil and the numerous bright spots along the outside of the delta are drilling platforms. Most of the land in the image consists of mud flats and marsh lands. There is little human settlement in this area due to the instability of the sediments. The main shipping channel of the Mississippi River is the broad red stripe running northwest to southeast down the left side of the image. The bright spots within the channel are ships. The colors in the image are assigned to different frequencies and polarizations of the radar as follows: red is L-band vertically transmitted, vertically received; green is C-band vertically transmitted, vertically received; blue is X-band vertically transmitted, vertically received. http://photojournal.jpl.nasa.gov/catalog/PIA01784
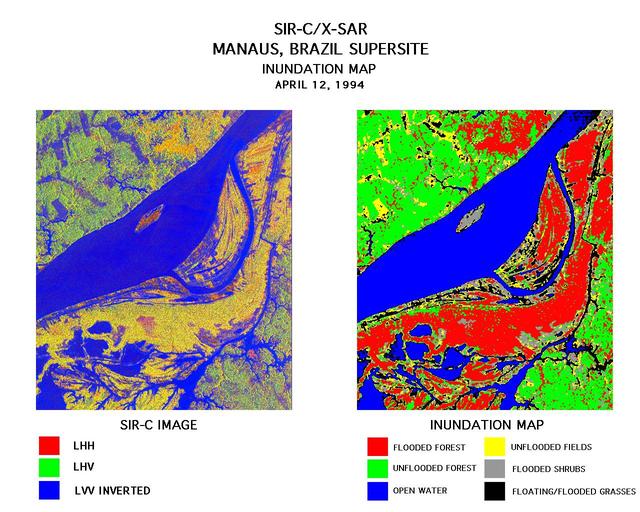
These two images were created using data from the Spaceborne Imaging Radar-C/X-Band Synthetic Aperture Radar (SIR-C/X-SAR). On the left is a false-color image of Manaus, Brazil acquired April 12, 1994, onboard space shuttle Endeavour. In the center of this image is the Solimoes River just west of Manaus before it combines with the Rio Negro to form the Amazon River. The scene is around 8 by 8 kilometers (5 by 5 miles) with north toward the top. The radar image was produced in L-band where red areas correspond to high backscatter at HH polarization, while green areas exhibit high backscatter at HV polarization. Blue areas show low backscatter at VV polarization. The image on the right is a classification map showing the extent of flooding beneath the forest canopy. The classification map was developed by SIR-C/X-SAR science team members at the University of California,Santa Barbara. The map uses the L-HH, L-HV, and L-VV images to classify the radar image into six categories: Red flooded forest Green unflooded tropical rain forest Blue open water, Amazon river Yellow unflooded fields, some floating grasses Gray flooded shrubs Black floating and flooded grasses Data like these help scientists evaluate flood damage on a global scale. Floods are highly episodic and much of the area inundated is often tree-covered. http://photojournal.jpl.nasa.gov/catalog/PIA01712
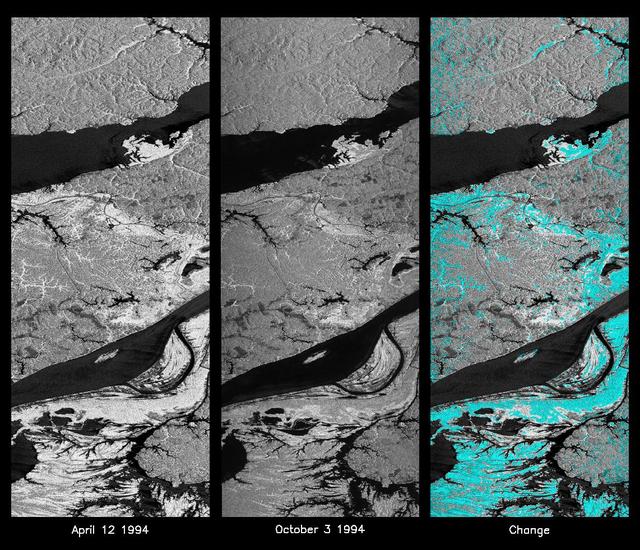
These L-band images of the Manaus region of Brazil were acquired by the Spaceborne Imaging Radar-C and X-band Synthetic Aperture Radar (SIR-C/X-SAR) aboard the space shuttle Endeavour. The left image was acquired on April 12, 1994, and the middle image was acquired on October 3, 1994. The area shown is approximately 8 kilometers by 40 kilometers (5 miles by 25 miles). The two large rivers in this image, the Rio Negro (top) and the Rio Solimoes (bottom), combine at Manaus (west of the image) to form the Amazon River. The image is centered at about 3 degrees south latitude and 61 degrees west longitude. North is toward the top left of the images. The differences in brightness between the images reflect changes in the scattering of the radar channel. In this case, the changes are indicative of flooding. A flooded forest has a higher backscatter at L-band (horizontally transmitted and received) than an unflooded river. The extent of the flooding is much greater in the April image than in the October image, and corresponds to the annual, 10-meter (33-foot) rise and fall of the Amazon River. A third image at right shows the change in the April and October images and was created by determining which areas had significant decreases in the intensity of radar returns. These areas, which appear blue on the third image at right, show the dramatic decrease in the extent of flooded forest, as the level of the Amazon River falls. The flooded forest is a vital habitat for fish and floating meadows are an important source of atmospheric methane. This demonstrates the capability of SIR-C/X-SAR to study important environmental changes that are impossible to see with optical sensors over regions such as the Amazon, where frequent cloud cover and dense forest canopies obscure monitoring of floods. Field studies by boat, on foot and in low-flying aircraft by the University of California at Santa Barbara, in collaboration with Brazil's Instituto Nacional de Pesguisas Estaciais, during the first and second flights of the SIR-C/X-SAR system have validated the interpretation of the radar images. http://photojournal.jpl.nasa.gov/catalog/PIA01740
This image is a false-color composite of Raco, Michigan, centered at 46.39 degrees north latitude, 84.88 degrees west longitude. This image was acquired by the Spaceborne Imaging Radar-C and X-Band Synthetic Aperture Radar (SIR-C/X-SAR) aboard the space shuttle Endeavour on its sixth orbit and during the first full-capability test of the instrument on April 9, 1994. This image was produced using both L-band and C-band data. The area shown is approximately 20 kilometers by 50 kilometers (12 by 30 miles). Raco is located at the eastern end of Michigan's upper peninsula, west of Sault Ste. Marie and south of Whitefish Bay on Lake Superior. The site is located at the boundary between the boreal forests and the northern temperate forests, a transitional zone that is expected to be ecologically sensitive to anticipated global changes resulting from climatic warming. On any given day, there is a 60 percent chance that this area will be obscured to some extent by cloud clover which makes it difficult to image using optical sensors. http://photojournal.jpl.nasa.gov/catalog/PIA01700
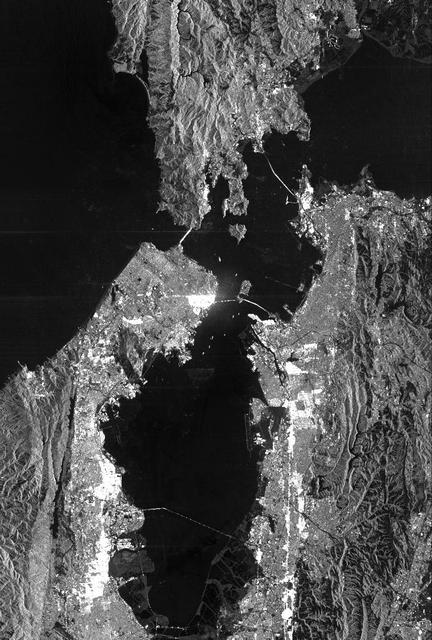
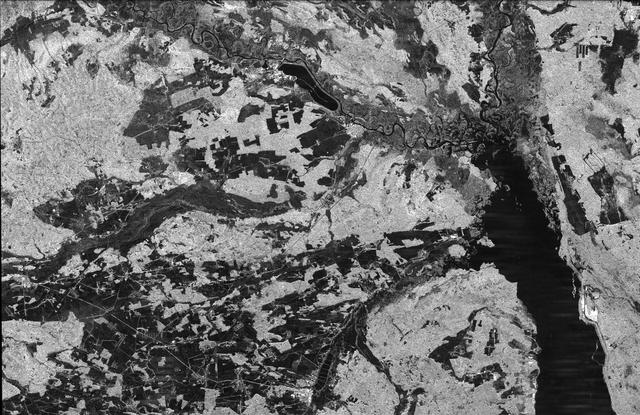
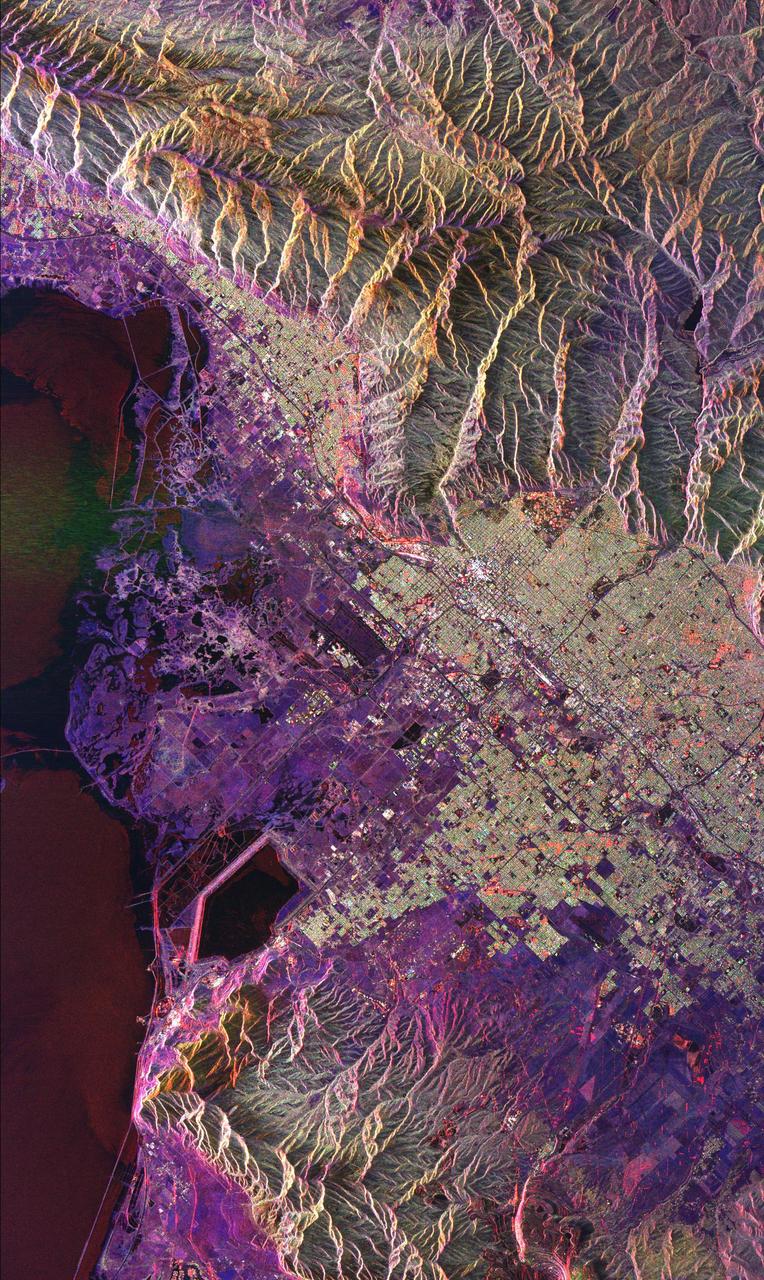
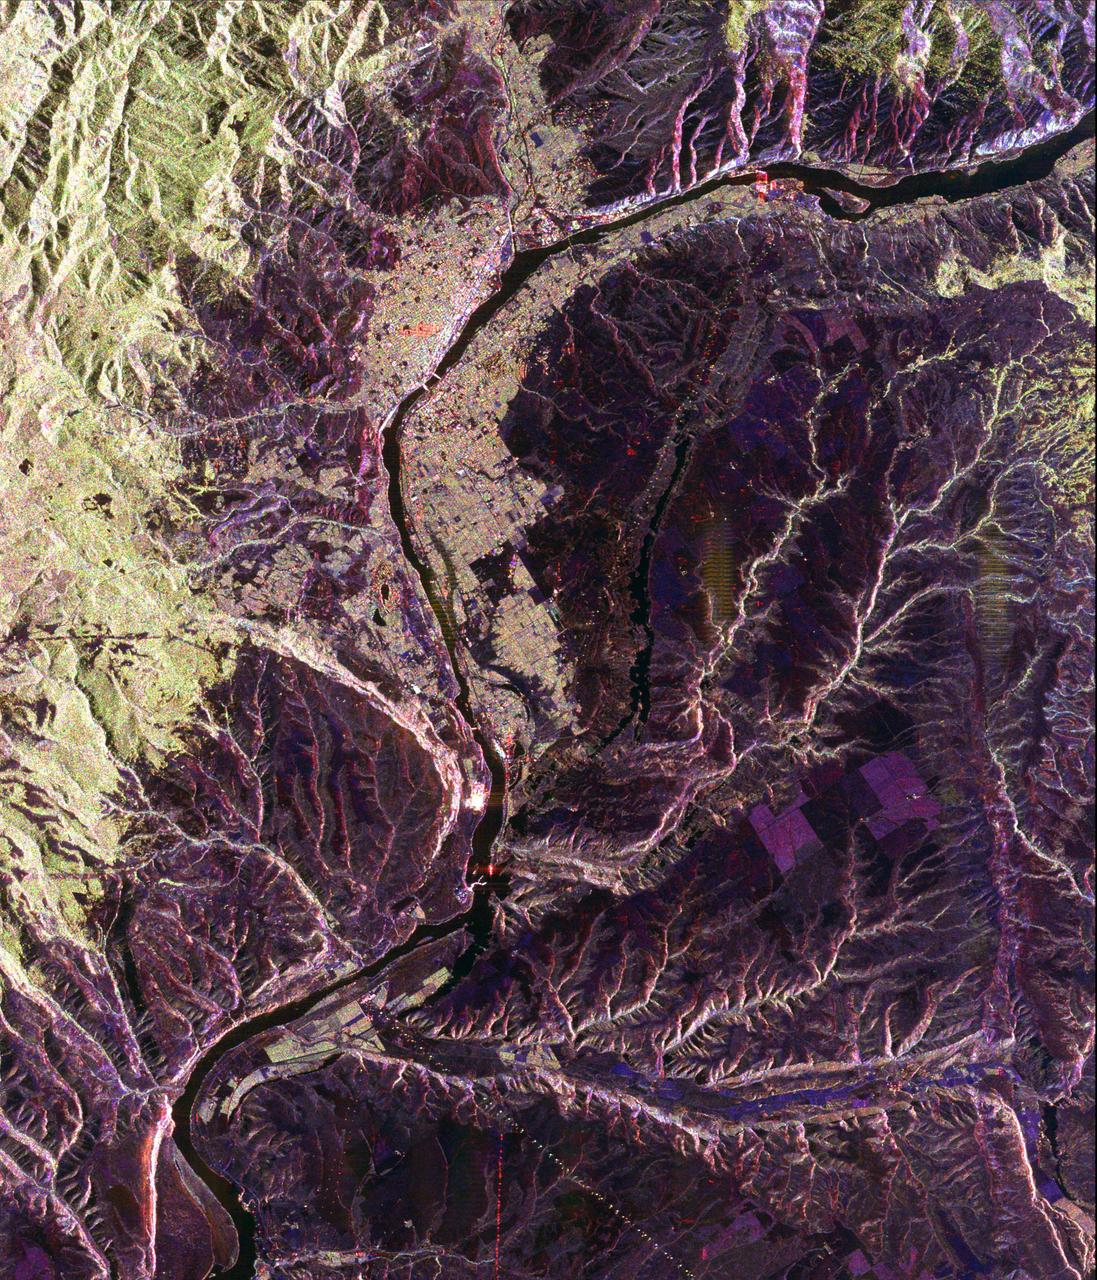
This is a radar image of San Francisco, California, taken on October 3,1994. The image is about 40 kilometers by 55 kilometers (25 miles by 34 miles) with north toward the upper right. Downtown San Francisco is visible in the center of the image with the city of Oakland east (to the right) across San Francisco Bay. Also visible in the image is the Golden Gate Bridge (left center) and the Bay Bridge connecting San Francisco and Oakland. North of the Bay Bridge is Treasure Island. Alcatraz Island appears as a small dot northwest of Treasure Island. This image was acquired by the Spaceborne Imaging Radar-C and X-band Synthetic Aperture Radar (SIR-C/X-SAR) aboard the space shuttle Endeavour on orbit 56. The image is centered at 37 degrees north latitude, 122degrees west longitude. This single-frequency SIR-C image was obtained by the L-band (24 cm) radar channel, horizontally transmitted and received. Portions of the Pacific Ocean visible in this image appear very dark as do other smooth surfaces such as airport runways. Suburban areas, with the low-density housing and tree-lined streets that are typical of San Francisco, appear as lighter gray. Areas with high-rise buildings, such as those seen in the downtown areas, appear in very bright white, showing a higher density of housing and streets which run parallel to the radar flight track. http://photojournal.jpl.nasa.gov/catalog/PIA01751
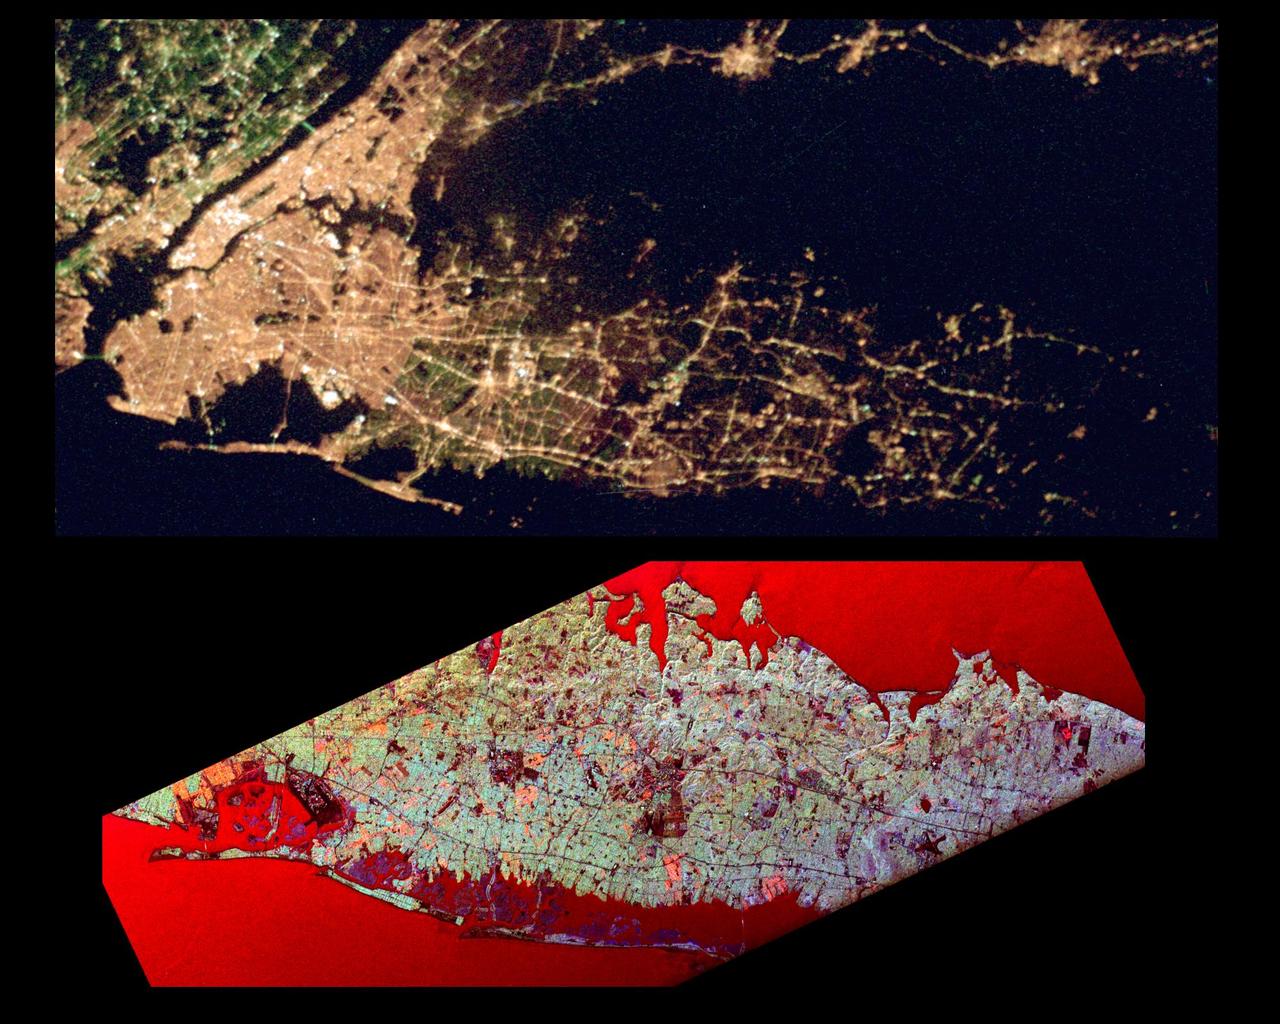
This pair of images of the Long Island, New York region is a comparison of an optical photograph (top) and a radar image (bottom), both taken in darkness in April 1994. The photograph at the top was taken by the Endeavour astronauts at about 3 a.m. Eastern time on April 20, 1994. The image at the bottom was acquired at about the same time four days earlier on April 16,1994 by the Spaceborne Imaging Radar-C/X-Band Synthetic Aperture Radar (SIR-C/X-SAR) system aboard the space shuttle Endeavour. Both images show an area approximately 100 kilometers by 40 kilometers (62 miles by 25 miles) that is centered at 40.7 degrees North latitude and 73.5 degrees West longitude. North is toward the upper right. The optical image is dominated by city lights, which are particularly bright in the densely developed urban areas of New York City located on the left half of the photo. The brightest white zones appear on the island of Manhattan in the left center, and Central Park can be seen as a darker area in the middle of Manhattan. To the northeast (right) of the city, suburban Long Island appears as a less densely illuminated area, with the brightest zones occurring along major transportation and development corridors. Since radar is an active sensing system that provides its own illumination, the radar image shows a great amount of surface detail, despite the night-time acquisition. The colors in the radar image were obtained using the following radar channels: red represents the L-band (horizontally transmitted and received); green represents the L-band (horizontally transmitted and vertically received); blue represents the C-band (horizontally transmitted and vertically received). In this image, the water surface - the Atlantic Ocean along the bottom edge and Long Island Sound shown at the top edge - appears red because small waves at the surface strongly reflect the horizontally transmitted and received L-band radar signal. Networks of highways and railroad lines are clearly visible in the radar image; many of them can also be seen as bright lines i the optical image. The runways of John F. Kennedy International Airport appear as a dark rectangle in Jamaica Bay on the left side of the image. Developed areas appear generally as bright green and orange, while agricultural, protected and undeveloped areas appear darker blue or purple. This contrast can be seen on the barrier islands along the south coast of Long Island, which are heavily developed in the Rockaway and Long Beach areas south and east of Jamaica Bay, but further to the east, the islands are protected and undeveloped. http://photojournal.jpl.nasa.gov/catalog/PIA01785
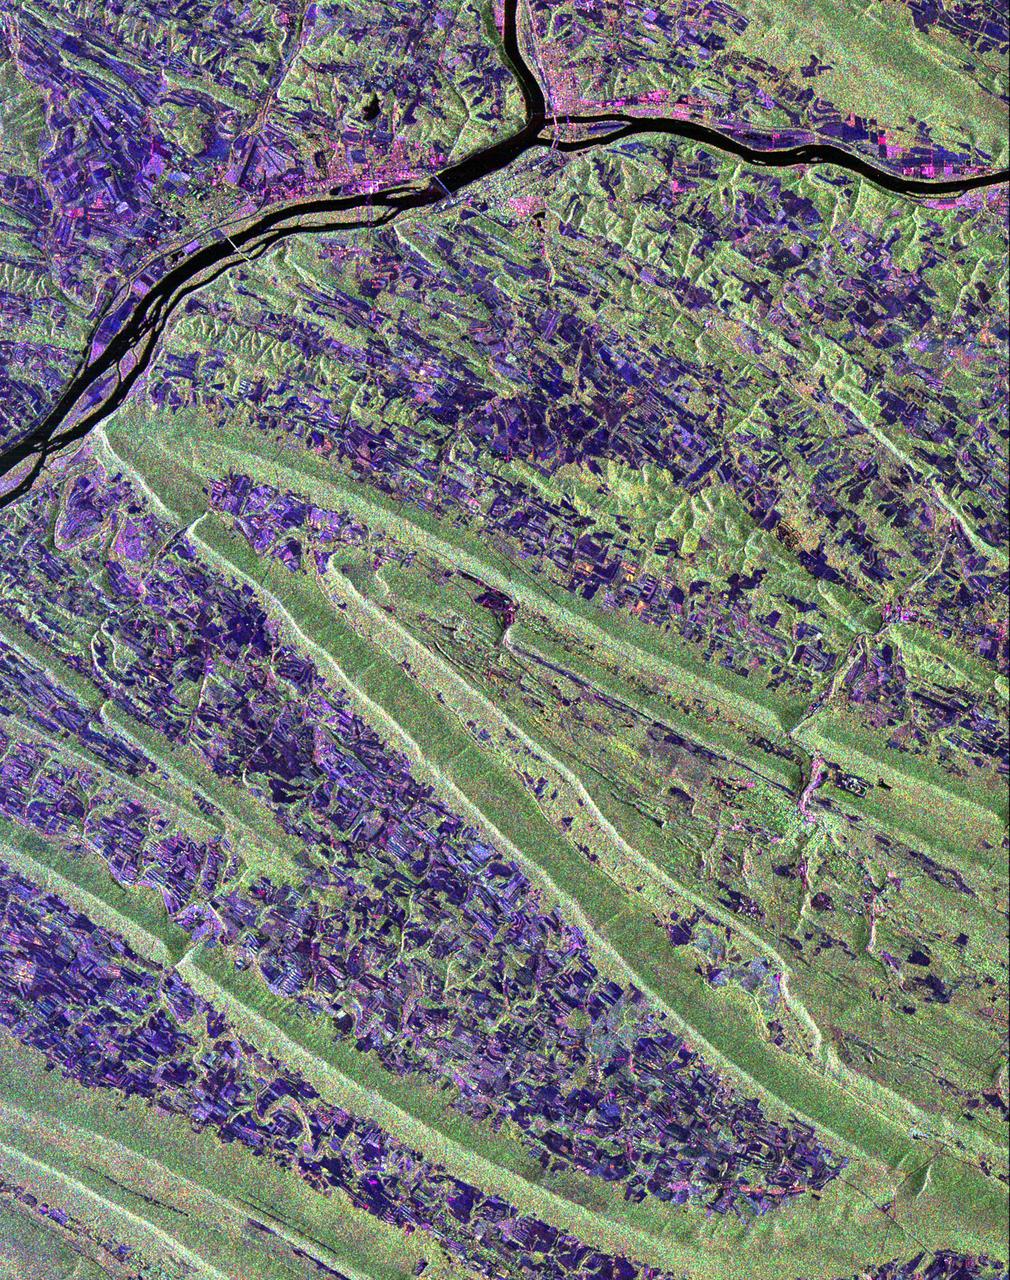
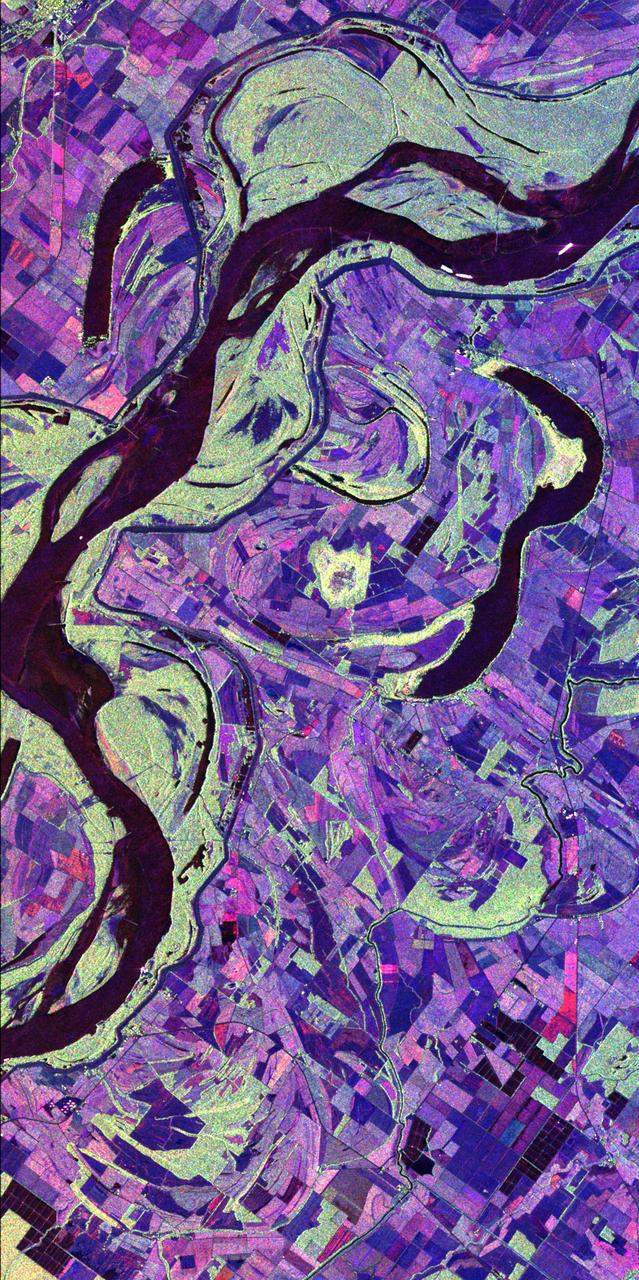
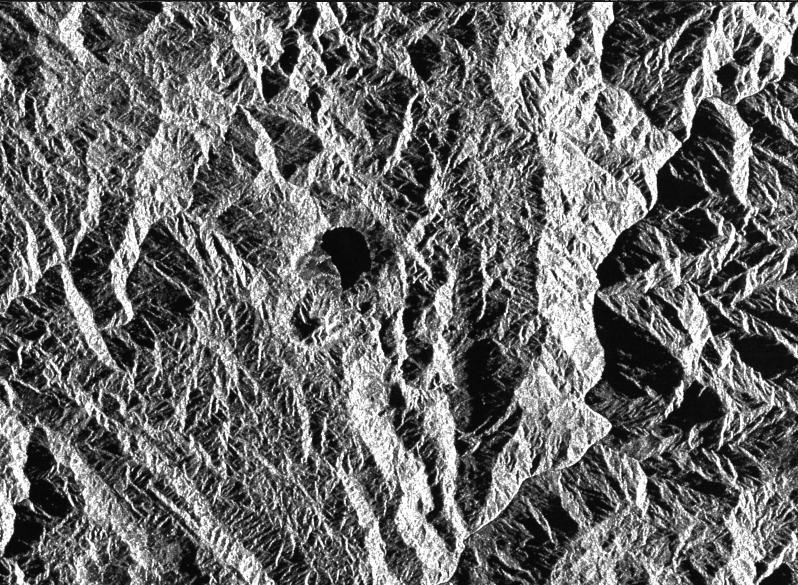
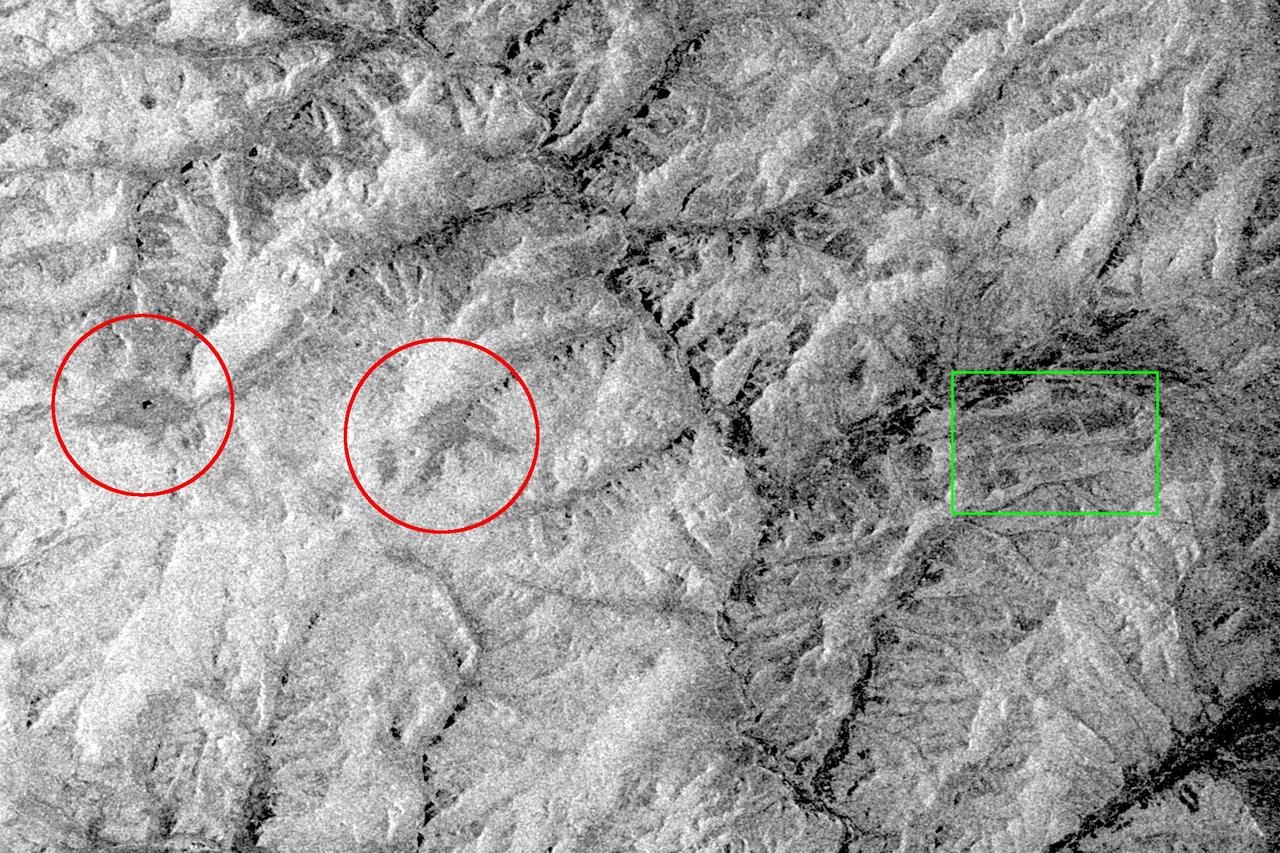
Scientists are using this radar image of the area surrounding Sunbury, Pennsylvania to study the geologic structure and land use patterns in the Appalachian Valley and Ridge province. This image was collected on October 6, 1994 by the Spaceborne Imaging Radar-C/ X-Band Synthetic Aperture Radar (SIR-C/X-SAR) on orbit 102 of the space shuttle Endeavour. The image is centered on latitude 40.85 degrees North latitude and 76.79 degrees West longitude. The area shown is approximately 30.5 km by 38 km. (19 miles by 24 miles). North is towards the upper right of the image. The Valley and Ridge province occurs in the north-central Appalachians, primarily in Pennsylvania, Maryland, and Virginia. It is an area of adjacent valleys and ridges that formed when the Appalachian mountain were created some 370 to 390 million years ago. During the continental collision that formed the Appalachians, the rocks in this area were pushed from the side and buckled much like a rug when pushed from one end. Subsequent erosion has produced the landscape we see in this image. The more resistant rocks, such as sandstone, form the tops of the ridges which appear as forested greenish areas on this image. The less resistant rocks, such as limestone, form the lower valleys which are cleared land and farm fields and are purple in this image. Smaller rivers and streams in the area flow along the valleys and in places cut across the ridges in "water gaps." In addition to defining the geography of this region, the Valley and Ridge province also provides this area with natural resources. The valleys provide fertile farmland and the folded mountains form natural traps for oil and gas accumulation; coal deposits are also found in the mountains. The colors in the image are assigned to different frequencies and polarizations of the SIR-C radar as follows: red is L-band horizontally transmitted, horizontally received; green is L-band horizontally transmitted, vertically received; blue is C-band horizontally transmitted, horizontally received. The river junction near the top of the image is where the West Branch River flows into the Susquehanna River, which then flows to the south-southwest past the state capitol of Harrisburg, 70 km (43 miles) to the south and not visible in this image. The town of Sunbury is shown along the Susquehanna on the east just to the southeast of the junction with West Branch. Three structures that cross the Susquehanna; the northern and southern of these structures are bridges and middle structure is the Shamokin Dam which confines the Susquehanna just south of the junction with West Branch. The prominent S-shaped mountain ridge in the center of the image is, from north to south, Little Mountain (the top of the S), Line Mountain (the middle of the S), and Mahantango Mountain (the bottom of the S). http://photojournal.jpl.nasa.gov/catalog/PIA01306
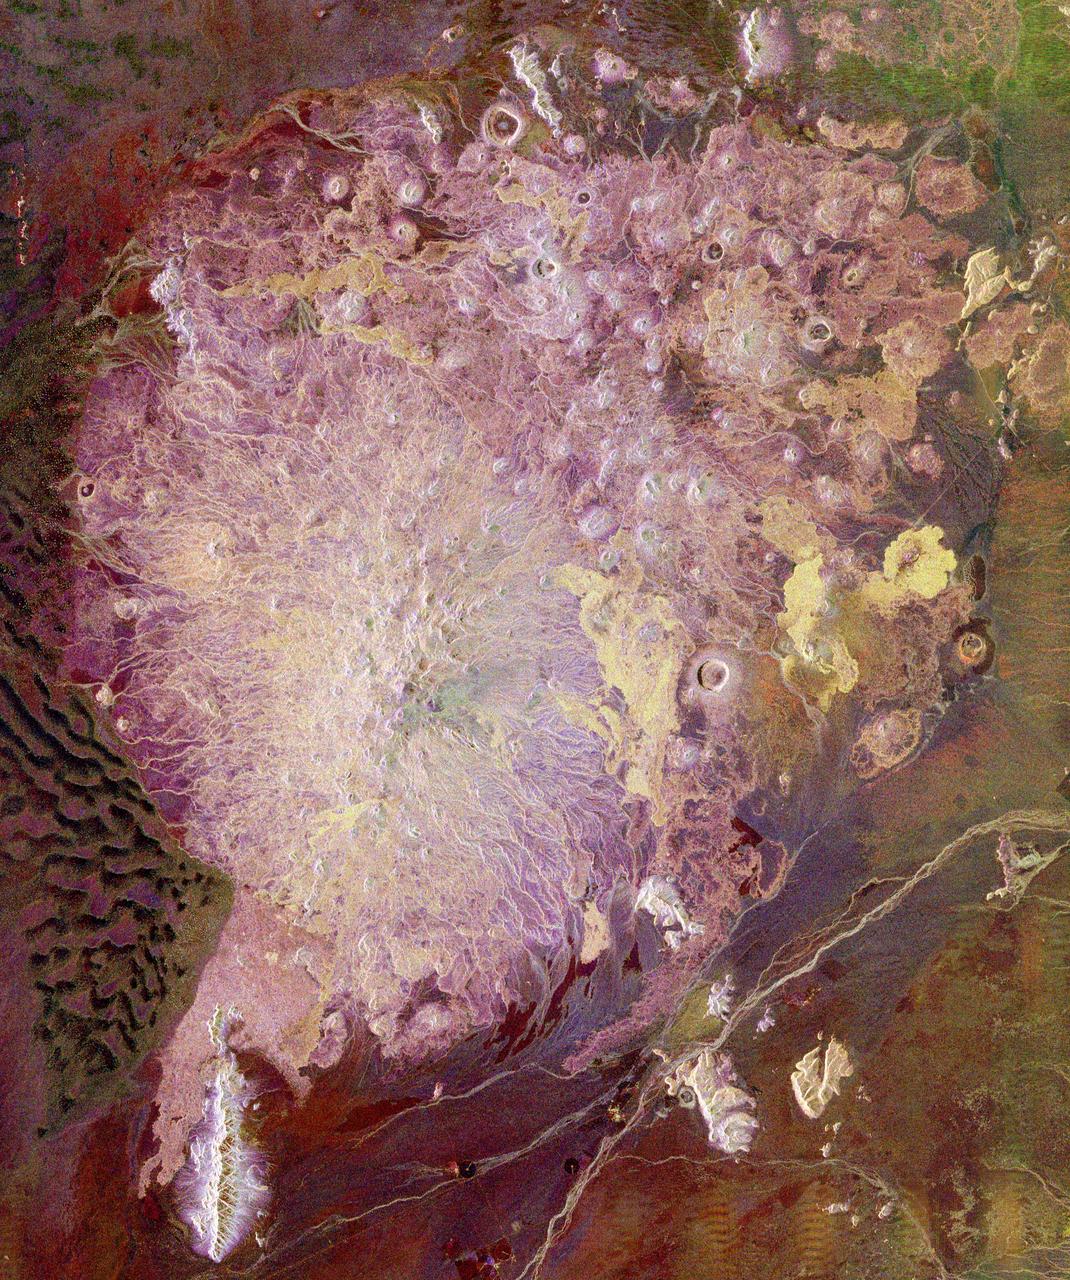
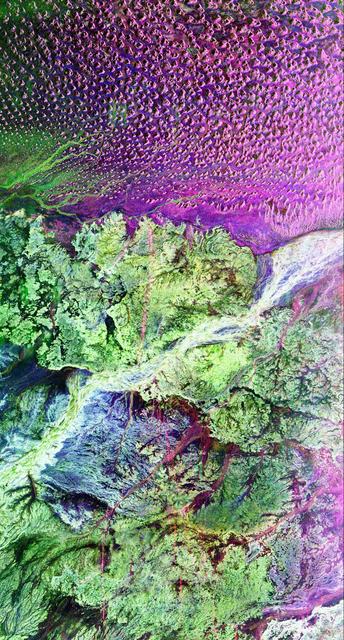
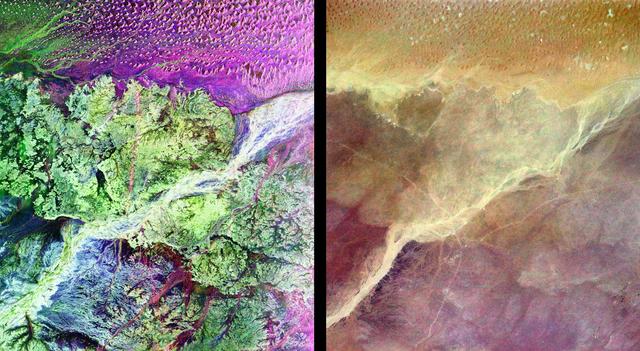
The ability of a sophisticated radar instrument to image large regions of the world from space, using different frequencies that can penetrate dry sand cover, produced the discovery in this image: a previously unknown branch of an ancient river, buried under thousands of years of windblown sand in a region of the Sahara Desert in North Africa. This area is near the Kufra Oasis in southeast Libya, centered at 23.3 degrees north latitude, 22.9 degrees east longitude. The image was acquired by the Spaceborne Imaging Radar-C/X-band Synthetic Aperture (SIR-C/X-SAR) imaging radar when it flew aboard the space shuttle Endeavour on its 60th orbit on October 4, 1994. This SIR-C image reveals a system of old, now inactive stream valleys, called "paleodrainage systems, http://photojournal.jpl.nasa.gov/catalog/PIA01310
This false-color L-band image of the Manaus region of Brazil was acquired by NASA Spaceborne Imaging Radar-C and X-Band Synthetic Aperture Radar SIR-C/X-SAR aboard the space shuttle Endeavour on orbit 46 of the mission.
This color composite C-band and L-band image of the Kilauea volcano on the Big Island of Hawaii was acquired by NASA Spaceborne Imaging Radar-C/X-band Synthetic Aperture Radar SIR-C/X-SAR flying on space shuttle Endeavour.
This spaceborne radar image of Belgrade, Serbia, illustrates the variety of land use patterns that can be observed with a multiple wavelength radar system.
This image of the Mississippi River in Mississippi, Arkansas, and Louisiana shows regions of the southern United States that are prone to flooding.
This is a three-frequency false color image of Flevoland, The Netherlands, centered at 52.4 degrees north latitude, 5.4 degrees east longitude.
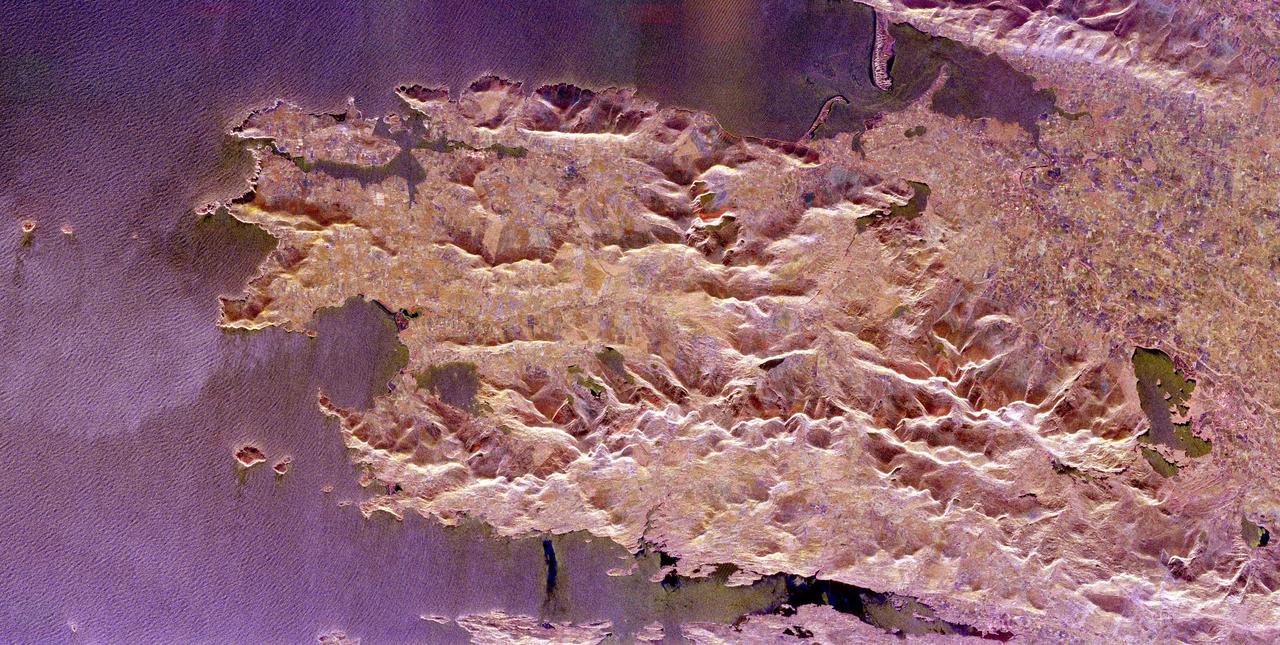
This spaceborne radar image shows how the Atlas Mountains in northwestern Africa dominate the geography of Morocco.
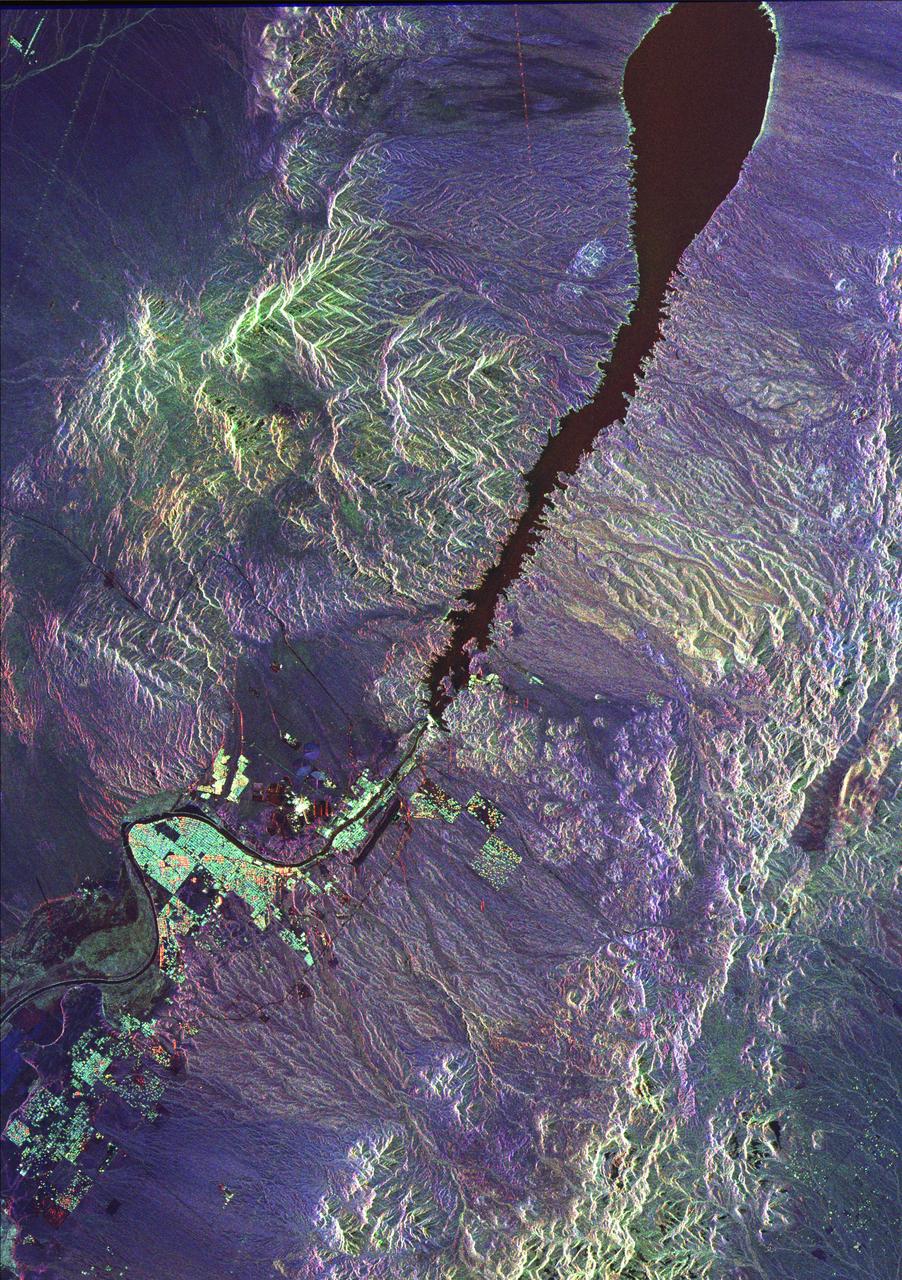
This is a spaceborne radar image of the city of Sacramento, the capital of California. Urban areas appear pink and the surrounding agricultural areas are green and blue.
These are two comparison images of Mount Everest and its surroundings, along the border of Nepal and Tibet.
This radar image shows the ocean surface in a portion of the Western Pacific Ocean.
This is a radar image of Los Angeles, California, taken on October 2, 1994.
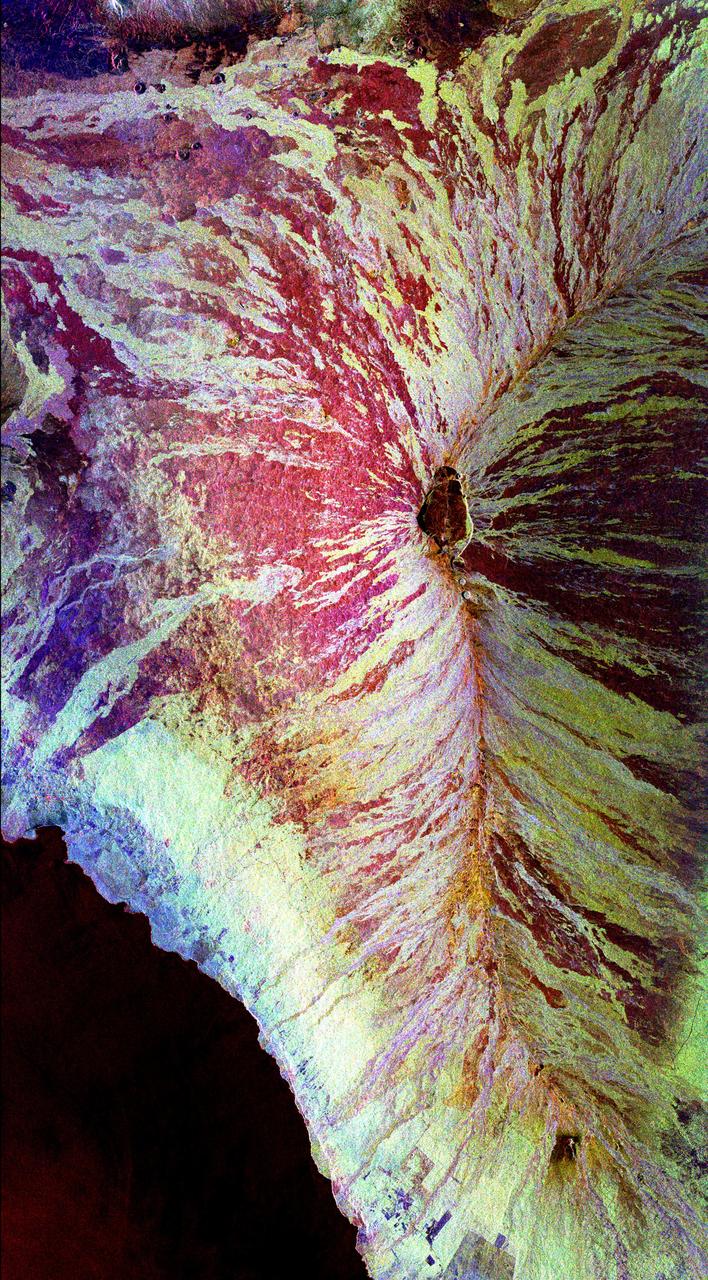
This is a radar image of a little known volcano in northern Colombia. The image was acquired on orbit 80 of space shuttle Endeavour on April 14, 1994, by NASA Spaceborne Imaging Radar C/X-Band Synthetic Aperture Radar SIR-C/X-SAR. The volcano near the center of the image is located at 5.6 degrees north latitude, 75.0 degrees west longitude, about 100 kilometers (65 miles) southeast of Medellin, Colombia. The conspicuous dark spot is a lake at the bottom of an approximately 3-kilometer-wide (1.9-mile) volcanic collapse depression or caldera. A cone-shaped peak on the bottom left (northeast rim) of the caldera appears to have been the source for a flow of material into the caldera. This is the northern-most known volcano in South America and because of its youthful appearance, should be considered dormant rather than extinct. The volcano's existence confirms a fracture zone proposed in 1985 as the northern boundary of volcanism in the Andes. The SIR-C/X-SAR image reveals another, older caldera further south in Colombia, along another proposed fracture zone. Although relatively conspicuous, these volcanoes have escaped widespread recognition because of frequent cloud cover that hinders remote sensing imaging in visible wavelengths. Four separate volcanoes in the Northern Andes nations of Colombia and Ecuador have been active during the last 10 years, killing more than 25,000 people, including scientists who were monitoring the volcanic activity. Detection and monitoring of volcanoes from space provides a safe way to investigate volcanism. The recognition of previously unknown volcanoes is important for hazard evaluations because a number of major eruptions this century have occurred at mountains that were not previously recognized as volcanoes. http://photojournal.jpl.nasa.gov/catalog/PIA01722
This spaceborne radar image shows the Pinacate Volcanic Field in the state of Sonora, Mexico, about 150 kilometers 93 miles southeast of Yuma, Arizona. The United States/Mexico border runs across the upper right corner of the image.

This three-frequency space radar image of south-central Egypt demonstrates the unique capability of imaging radar to penetrate thin sand cover in arid regions to reveal hidden details below the surface.
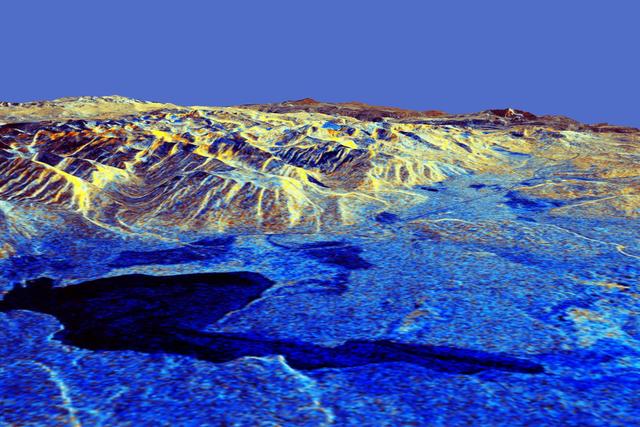
This is a three-dimensional perspective of Mammoth Mountain, California. This view was constructed by overlaying a NASA Spaceborne Imaging Radar-C SIR-C radar image on a U.S. Geological Survey digital elevation map.
This spaceborne radar image shows the Ruiz-Tolima volcanic region in central Colombia, about 150 kilometers 93 miles west of Bogata. The town of Manizales, Colombia, is the pinkish area in the upper right of the image.
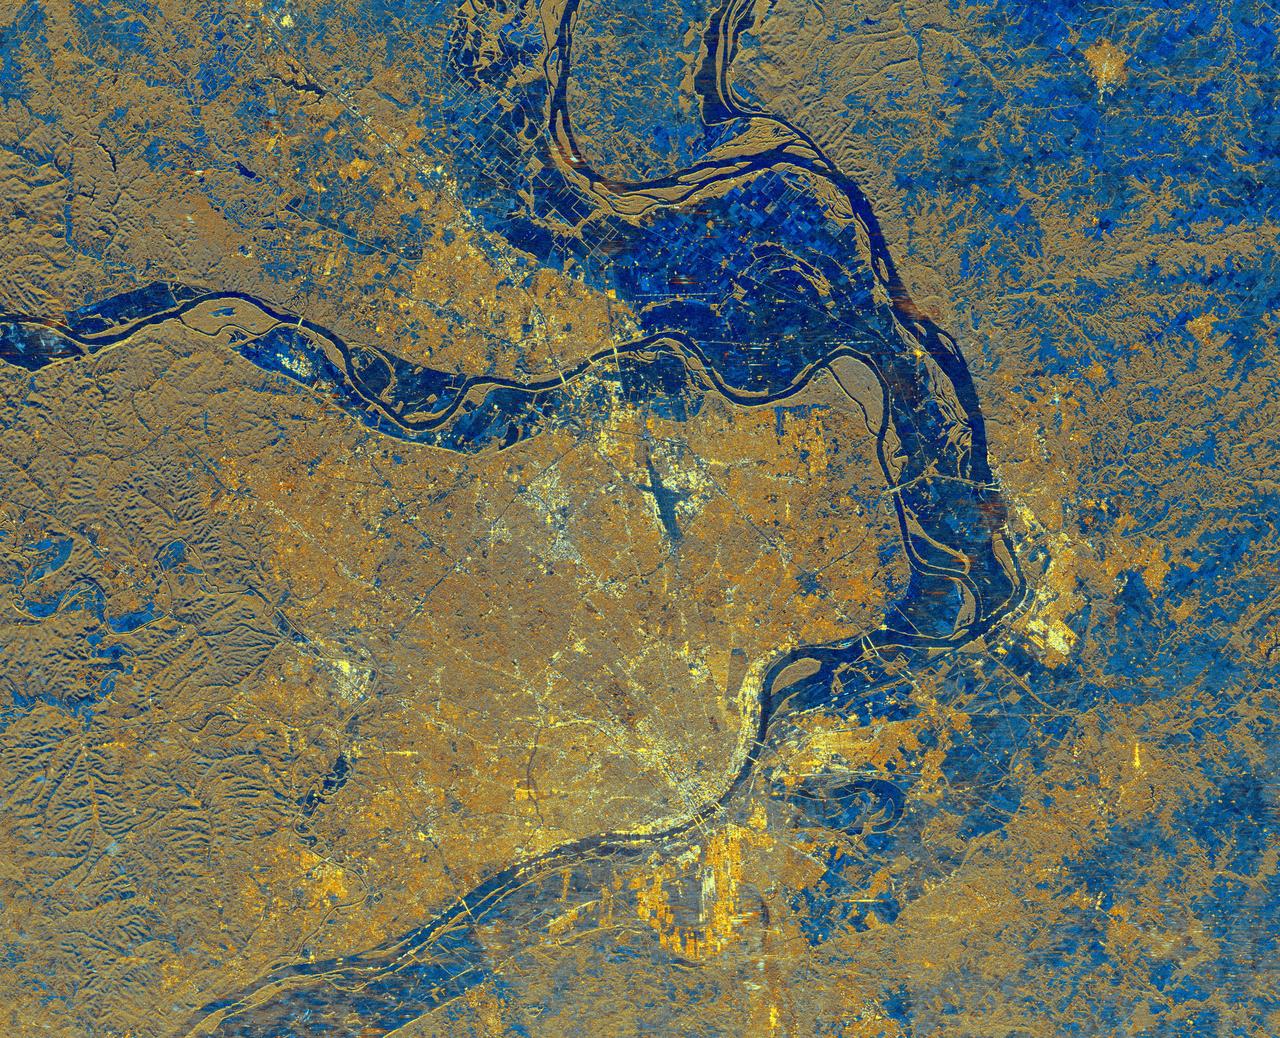
This is a spaceborne radar image of the area surrounding St. Louis, Missouri, where the Mississippi and Missouri Rivers come together. The city of St. Louis is the bright gold area within a bend in the Mississippi River at the lower center of the image.
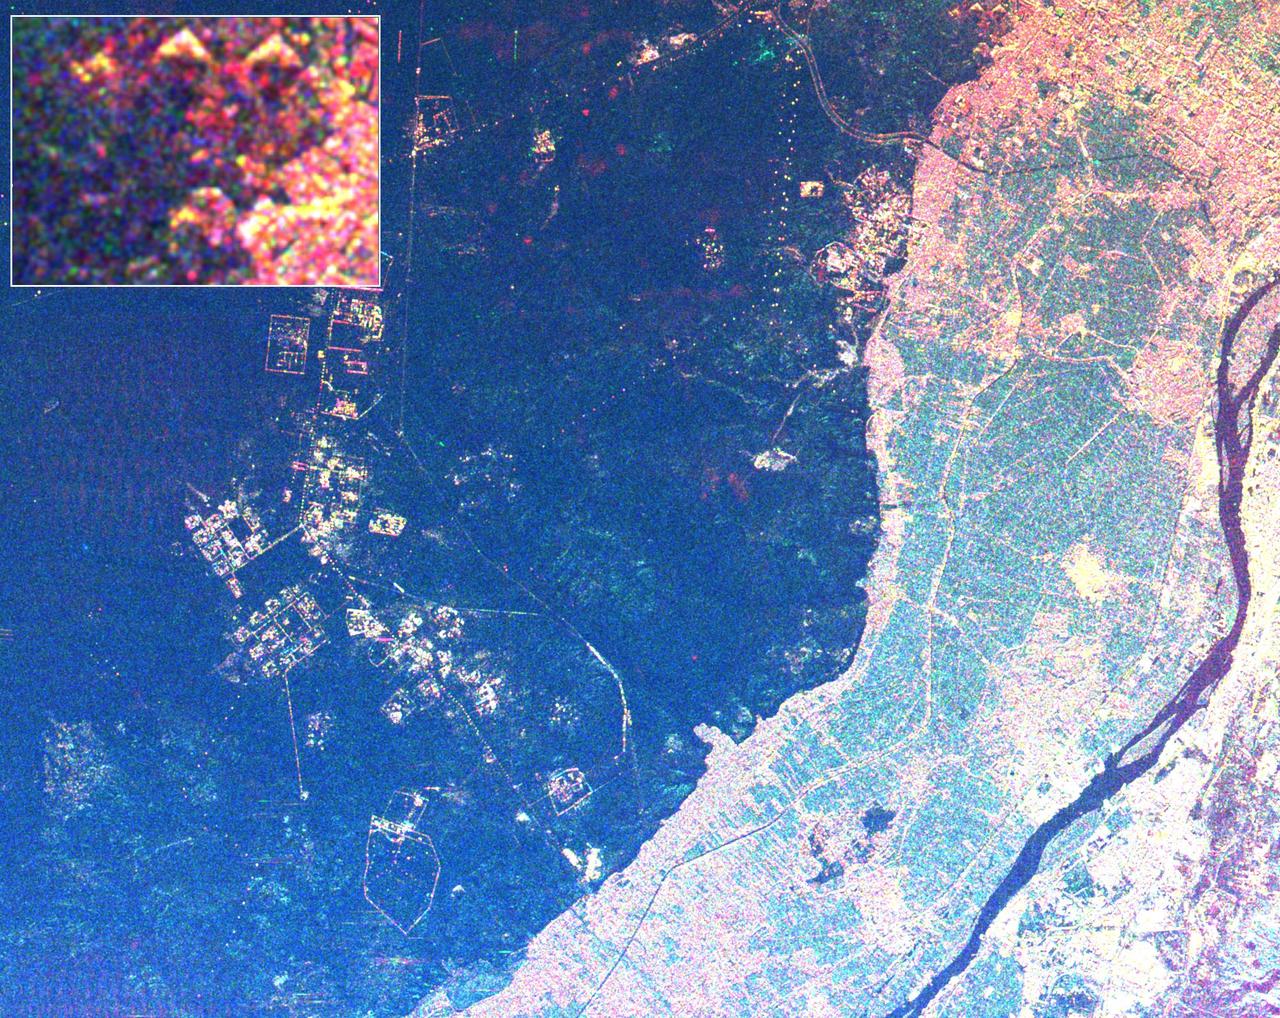
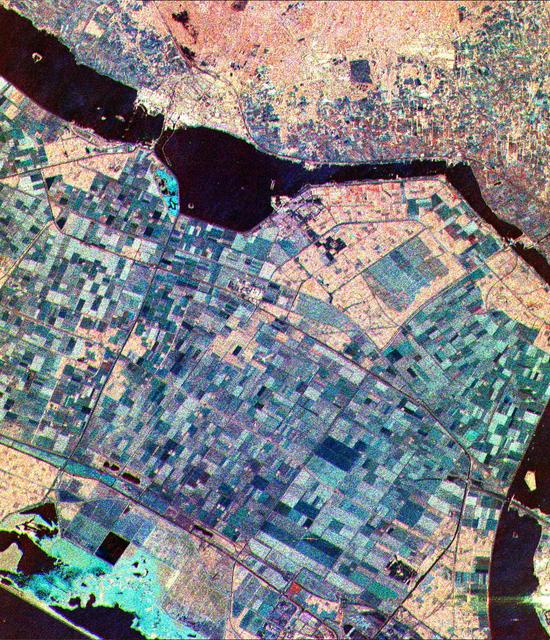
This radar image shows the area west of the Nile River near Cairo, Egypt. The Nile River is the dark band along the right side of the image and it flows approximately due North from the bottom to the right. The boundary between dense urbanization and the desert can be clearly seen between the bright and dark areas in the center of the image. This boundary represents the approximate extent of yearly Nile flooding which played an important part in determining where people lived in ancient Egypt. This land usage pattern persists to this day. The pyramids at Giza appear as three bright triangles aligned with the image top just at the boundary of the urbanized area. They are also shown enlarged in the inset box in the top left of the image. The Great Pyramid of Khufu (Cheops in Greek) is the northern most of the three Giza pyramids. The side-looking radar illuminates the scene from the top, the two sides of the pyramids facing the radar reflect most of the energy back to the antenna and appear radar bright; the two sides away from the radar reflect less energy back and appear dark Two additional pyramids can be seen left of center in the lower portion of the image. The modern development in the desert on the left side of the image is the Sixth of October City, an area of factories and residences started by Anwar Sadat to relieve urban crowding. The image was taken on April 19, 1994 by the Spaceborne Imaging Radar-C/X-Band Synthetic Aperture Radar (SIR-C/X-SAR) aboard the shuttle Endeavour. SIR-C/X-SAR, a joint mission of the German, Italian and the United States space agencies, is part of NASA's Mission to Planet Earth. The image is centered on latitude 29.72 degrees North latitude and 30.83 degrees East longitude. The area shown is approximately 20 kilometers by 30 kilometers. The colors in the image are assigned to different frequencies and polarizations of the radar as follows: red is L-band horizontally transmitted, horizontally received; green is C-band horizontally transmitted, horizontally received; blue is C-band horizontally transmitted, vertically received. http://photojournal.jpl.nasa.gov/catalog/PIA01793
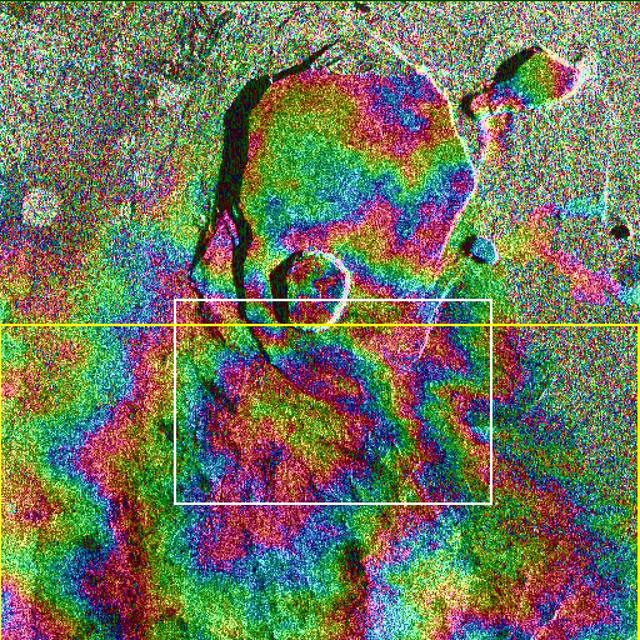
Data acquired on April 13, 1994 and on October 4, 1994 from the X-band Synthetic Aperture Radar on board the space shuttle Endeavour were used to generate interferometric fringes, which were overlaid on the X-SAR image of Kilauea. The volcano is centered in this image at 19.58 degrees north latitude and 155.55 degrees west longitude. The image covers about 9 kilometers by 13 kilometers (5.6 miles by 8 miles). The X-band fringes correspond clearly to the expected topographic image. The yellow line indicates the area below which was used for the three-dimensional image using altitude lines. The yellow rectangular frame fences the area for the final topographic image. http://photojournal.jpl.nasa.gov/catalog/PIA01762
This is an X-band black-and-white image of the forests east of the Baikal Forest in the Jablonowy Mountains of Russia. The image is centered at 52.5 degrees north latitude and 116 degrees east longitude near the mining town of Bukatschatscha. This image was acquired by the Spaceborne Imaging Radar-C/X-band Synthetic Aperture Radar aboard the space shuttle Endeavour on October 4, 1994, during the second flight of the spaceborne radar. This area is part of an international research project known as the Taiga Aerospace Investigation using Geographic Information System Applications. http://photojournal.jpl.nasa.gov/catalog/PIA01754
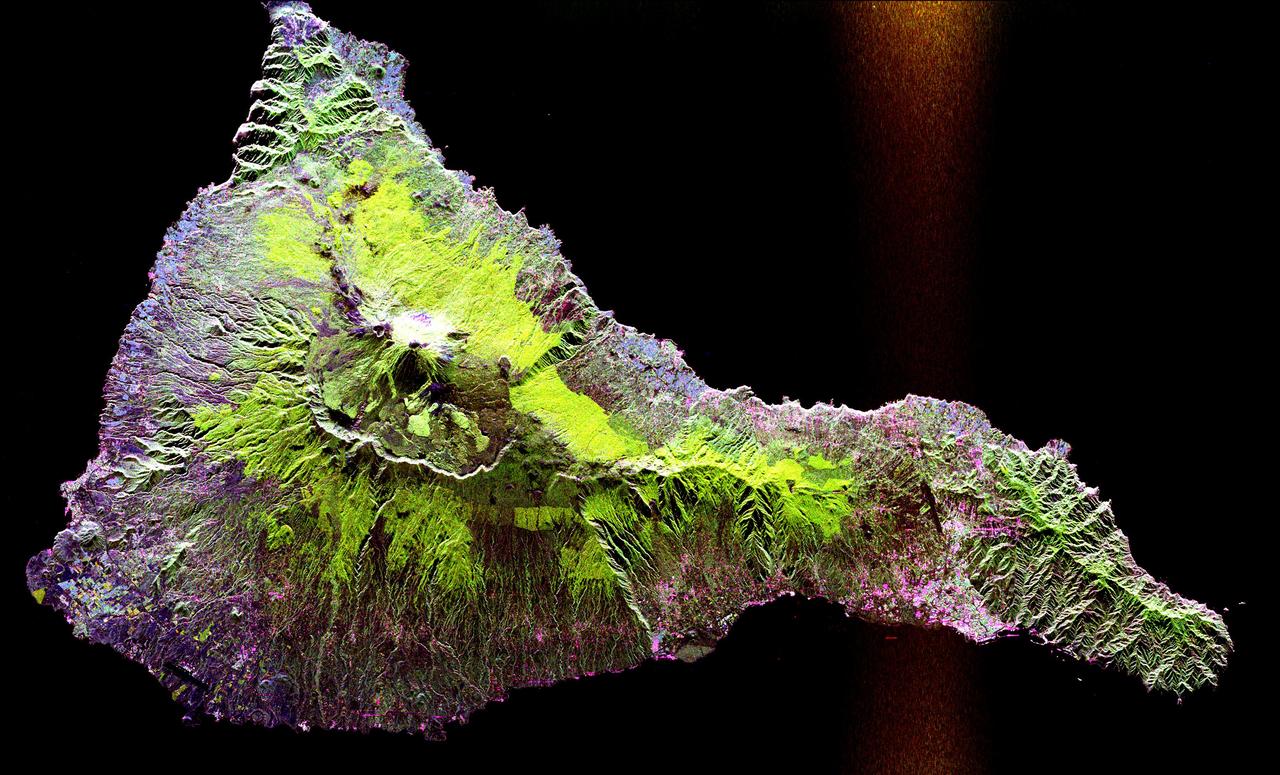
This radar image shows the Teide volcano on the island of Tenerife in the Canary Islands. The Canary Islands, part of Spain, are located in the eastern Atlantic Ocean off the coast of Morocco. Teide has erupted only once in the 20th Century, in 1909, but is considered a potentially threatening volcano due to its proximity to the city of Santa Cruz de Tenerife, shown in this image as the purple and white area on the lower right edge of the island. The summit crater of Teide, clearly visible in the left center of the image, contains lava flows of various ages and roughnesses that appear in shades of green and brown. Different vegetation zones, both natural and agricultural, are detected by the radar as areas of purple, green and yellow on the volcano's flanks. Scientists are using images such as this to understand the evolution of the structure of Teide, especially the formation of the summit caldera and the potential for collapse of the flanks. The volcano is one of 15 identified by scientists as potentially hazardous to local populations, as part of the international The image was acquired by the Spaceborne Imaging Radar-C/X-Band Synthetic Aperture Radar (SIR-C/X-SAR) onboard the space shuttle Endeavour on October 11, 1994. SIR-C/X-SAR, a joint mission of the German, Italian and the United States space agencies, is part of NASA's Mission to Planet Earth. The image is centered at 28.3 degrees North latitude and 16.6 degrees West longitude. North is toward the upper right. The area shown measures 90 kilometers by 54.5 kilometers (55.8 miles by 33.8 miles). The colors in the image are assigned to different frequencies and polarizations of the radar as follows: red is L-band horizontally transmitted, horizontally received; green is L-band horizontally transmitted, vertically received; blue is C-band horizontally transmitted, vertically received. http://photojournal.jpl.nasa.gov/catalog/PIA01779
This is a radar image of the area surrounding the Harvard Forest in north-central Massachusetts that has been operated as a ecological research facility by Harvard University since 1907. At the center of the image is the Quabbin Reservoir, and the Connecticut River is at the lower left of the image. The Harvard Forest itself is just above the reservoir. Researchers are comparing the naturally occurring physical disturbances in the forest and the recent and projected chemical disturbances and their effects on the forest ecosystem. Agricultural land appears dark blue/purple, along with low shrub vegetation and some wetlands. Urban development is bright pink; the yellow to green tints are conifer-dominated vegetation with the pitch pine sand plain at the middle left edge of the image appearing very distinctive. The green tint may indicate pure pine plantation stands, and deciduous broadleaf trees appear gray/pink with perhaps wetter sites being pinker. This image was acquired by the Spaceborne Imaging Radar-C/X-Band Synthetic Aperture Radar (SIR-C/X-SAR) aboard the space shuttle Endeavour. SIR-C/X-SAR, a joint mission of the German, Italian and the United States space agencies, is part of NASA's Mission to Planet Earth. The image is centered at 42.50 degrees North latitude and 72.33 degrees West longitude and covers an area of 53 kilometers 63 by kilometers (33 miles by 39 miles). The colors in the image are assigned to different frequencies and polarizations of the radar as follows: red is L-band horizontally transmitted and horizontally received; green is L-band horizontally transmitted and vertically received; and blue is C-band horizontally transmitted and horizontally received. http://photojournal.jpl.nasa.gov/catalog/PIA01788
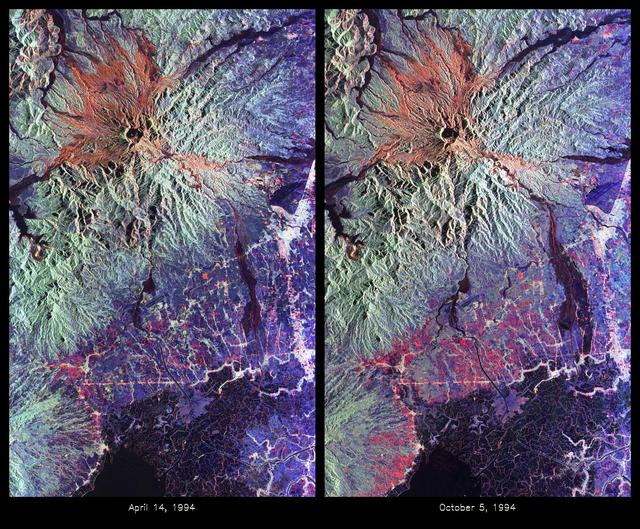
These are color composite radar images showing the area around Mount Pinatubo in the Philippines. The images were acquired by the Spaceborne Imaging Radar-C and X-band Synthetic Aperture Radar (SIR-C/X-SAR) aboard the space shuttle Endeavour on April 14, 1994 (left image) and October 5,1994 (right image). The images are centered at about 15 degrees north latitude and 120.5 degrees east longitude. Both images were obtained with the same viewing geometry. The color composites were made by displaying the L-band (horizontally transmitted and received) in red; the L-band (horizontally transmitted and vertically received) in green; and the C-band (horizontally transmitted and vertically received) in blue. The area shown is approximately 40 kilometers by 65 kilometers (25 miles by 40 miles). The main volcanic crater on Mount Pinatubo produced by the June 1991 eruptions and the steep slopes on the upper flanks of the volcano are easily seen in these images. Red on the high slopes shows the distribution of the ash deposited during the 1991 eruption, which appears red because of the low cross-polarized radar returns at C and L bands. The dark drainages radiating away from the summit are the smooth mudflows, which even three years after the eruptions continue to flood the river valleys after heavy rain. Comparing the two images shows that significant changes have occurred in the intervening five months along the Pasig-Potrero rivers (the dark area in the lower right of the images). Mudflows, called "lahars," that occurred during the 1994 monsoon season filled the river valleys, allowing the lahars to spread over the surrounding countryside. Three weeks before the second image was obtained, devastating lahars more than doubled the area affected in the Pasig-Potrero rivers, which is clearly visible as the increase in dark area on the lower right of the images. Migration of deposition to the east (right) has affected many communities. Newly affected areas included the community of Bacolor, Pampanga, where thousands of homes were buried in meters of hot mud and rock as 80,000 people fled the lahar-stricken area. Scientists are closely monitoring the westward migration ( toward the left in this image) of the lahars as the Pasig-Potrero rivers seek to join with the Porac River, an area that has not seen laharic activity since the eruption. This could be devastating because the Pasig-Potrero rivers might be permanently redirected to lower elevations along the Porac River where communities are located. Ground saturation with water during the rainy season reveals inactive channels that were dry in the April image. A small lake has turned into a pond in the lower reaches of the Potrero River because the channels are full of lahar deposits and the surface runoff has no where to flow. Changes in the degree of erosion in ash and pumice deposits from the 1991 eruption can also be seen in the channels that deliver the mudflow material to the Pasig-Potrero rivers. The 1991 Mount Pinatubo eruption is well known for its near-global effects on the atmosphere and short-term climate due to the large amount of sulfur dioxide that was injected into the upper atmosphere. Locally, however, the effects will most likely continue to impact surrounding areas for as long as the next 10 to 15 years. Mudflows, quite certainly, will continue to pose severe hazards to adjacent areas. Radar observations like those obtained by SIR-C/X-SAR will play a key role in monitoring these changes because of the radar's ability to see in daylight or darkness and even in the worst weather conditions. Radar imaging will be particularly useful, for example, during the monsoon season, when the lahars form. Frequent imaging of these lahar fields will allow scientists to better predict when they are likely to begin flowing again and which communities might be at risk. http://photojournal.jpl.nasa.gov/catalog/PIA01743
This is a radar image of the region around the site of the lost city of Ubar in southern Oman, on the Arabian Peninsula. The ancient city was discovered in 1992 with the aid of remote sensing data. Archeologists believe Ubar existed from about 2800 B.C. to about 300 A.D. and was a remote desert outpost where caravans were assembled for the transport of frankincense across the desert. This image was acquired on orbit 65 of space shuttle Endeavour on April 13, 1994 by the Spaceborne Imaging Radar C/X-Band Synthetic Aperture Radar (SIR-C/X-SAR). The SIR-C image shown is centered at 18.4 degrees north latitude and 53.6 degrees east longitude. The image covers an area about 50 by 100 kilometers (31 miles by 62 miles). The image is constructed from three of the available SIR-C channels and displays L-band, HH (horizontal transmit and receive) data as red, C-band HH as blue, and L-band HV (horizontal transmit, vertical receive) as green. The prominent magenta colored area is a region of large sand dunes, which are bright reflectors at both L-and C-band. The prominent green areas (L-HV) are rough limestone rocks, which form a rocky desert floor. A major wadi, or dry stream bed, runs across the middle of the image and is shown largely in white due to strong radar scattering in all channels displayed (L and C HH, L-HV). The actual site of the fortress of the lost city of Ubar, currently under excavation, is near the Wadi close to the center of the image. The fortress is too small to be detected in this image. However, tracks leading to the site, and surrounding tracks, appear as prominent, but diffuse, reddish streaks. These tracks have been used in modern times, but field investigations show many of these tracks were in use in ancient times as well. Mapping of these tracks on regional remote sensing images was a key to recognizing the site as Ubar in 1992. This image, and ongoing field investigations, will help shed light on a little known early civilization. http://photojournal.jpl.nasa.gov/catalog/PIA01721
This pair of images from space shows a portion of the southern Empty Quarter of the Arabian Peninsula in the country of Oman. On the left is a radar image of the region around the site of the fabled Lost City of Ubar, discovered in 1992 with the aid of remote sensing data. On the right is an enhanced optical image taken by the shuttle astronauts. Ubar existed from about 2800 BC to about 300 AD. and was a remote desert outpost where caravans were assembled for the transport of frankincense across the desert. The actual site of the fortress of the Lost City of Ubar, currently under excavation, is too small to show in either image. However, tracks leading to the site, and surrounding tracks, show as prominent, but diffuse, reddish streaks in the radar image. Although used in modern times, field investigations show many of these tracks were in use in ancient times as well. Mapping of these tracks on regional remote sensing images provided by the Landsat satellite was a key to recognizing the site as Ubar. The prominent magenta colored area is a region of large sand dunes. The green areas are limestone rocks, which form a rocky desert floor. A major wadi, or dry stream bed, runs across the scene and appears as a white line. The radar images, and ongoing field investigations, will help shed light on an early civilization about which little in known. The radar image was taken by the Spaceborne Imaging Radar C/X-Band Synthetic Aperture Radar (SIR-C/X-SAR) and is centered at 18 degrees North latitude and 53 degrees East longitude. The image covers an area about 50 kilometers by 100 kilometers (31 miles by 62 miles). The colors in the image are assigned to different frequencies and polarizations of the radar as follows: red is L-band, horizontally transmitted, horizontally received; blue is C-band horizontally transmitted, horizontally received; green is L-band horizontally transmitted, vertically received. SIR-C/X-SAR, a joint mission of the German, Italian and the United States space agencies, is part of NASA's Mission to Planet Earth. http://photojournal.jpl.nasa.gov/catalog/PIA01302
This is an X-band image of an oil slick experiment conducted in the North Sea, Germany. The image is centered at 54.58 degrees north latitude and 7.48 degrees east longitude. This image was acquired by the Spaceborne Imaging Radar-C and X-band Synthetic Aperture Radar (SIR-C/X-SAR) aboard the space shuttle Endeavour on October 6, 1994, during the second flight of the spaceborne radar. The experiment was designed to differentiate between petroleum oil spills and natural slicks floating on the sea surface. Two types of petroleum oil and six types of oils resembling natural sea surface slicks were poured on the sea surface from ships and a helicopter just before the space shuttle flew over the region. At the bottom of the image is the Sylt peninsula, a famous holiday resort. Twenty-six gallons (100 liters) of diesel oil was dissipated due to wave action before the shuttle reached the site. The oil spill seen at the uppermost part of the image is about 105 gallons (400 liters) of heavy heating oil and the largest spill is about 58 gallons (220 liters) of oleyl alcohol, resembling a "natural oil" like the remaining five spills used to imitate natural slicks that have occurred offshore from various states. The volume of these other oils spilled on the ocean surface during the five experimental spills varied from 16 gallons to 21 gallons (60 liters to 80 liters). The distance between neighboring spills was about half a mile (800 meters) at the most. The largest slick later thinned out to monomolecular sheets of about 10 microns, which is the dimension of a molecule. Oceanographers found that SIR-C/X-SAR was able to clearly distinguish the oil slicks from algae products dumped nearby. Preliminary indications are that various types of slicks may be distinguished, especially when other radar wavelengths are included in the analysis. Radar imaging of the world's oceans on a continuing basis may allow oceanographers in the future to detect and clean up oil spills much more swiftly than is currently possible. http://photojournal.jpl.nasa.gov/catalog/PIA01748
This is a vertically polarized L-band image of the southern half of Moscow, an area which has been inhabited for 2,000 years. The image covers a diameter of approximately 50 kilometers (31 miles) and was taken on September 30, 1994 by the Spaceborne Imaging Radar-C/X-band Synthetic Aperture Radar aboard the space shuttle Endeavour. The city of Moscow was founded about 750 years ago and today is home to about 8 million residents. The southern half of the circular highway (a road that looks like a ring) can easily be identified as well as the roads and railways radiating out from the center of the city. The city was named after the Moskwa River and replaced Russia's former capital, St. Petersburg, after the Russian Revolution in 1917. The river winding through Moscow shows up in various gray shades. The circular structure of many city roads can easily be identified, although subway connections covering several hundred kilometers are not visible in this image. The white areas within the ring road and outside of it are buildings of the city itself and it suburban towns. Two of many airports are located in the west and southeast of Moscow, near the corners of the image. The Kremlin is located north just outside of the imaged city center. It was actually built in the 16th century, when Ivan III was czar, and is famous for its various churches. In the surrounding area, light gray indicates forests, while the dark patches are agricultural areas. The various shades from middle gray to dark gray indicate different stages of harvesting, ploughing and grassland. http://photojournal.jpl.nasa.gov/catalog/PIA01752
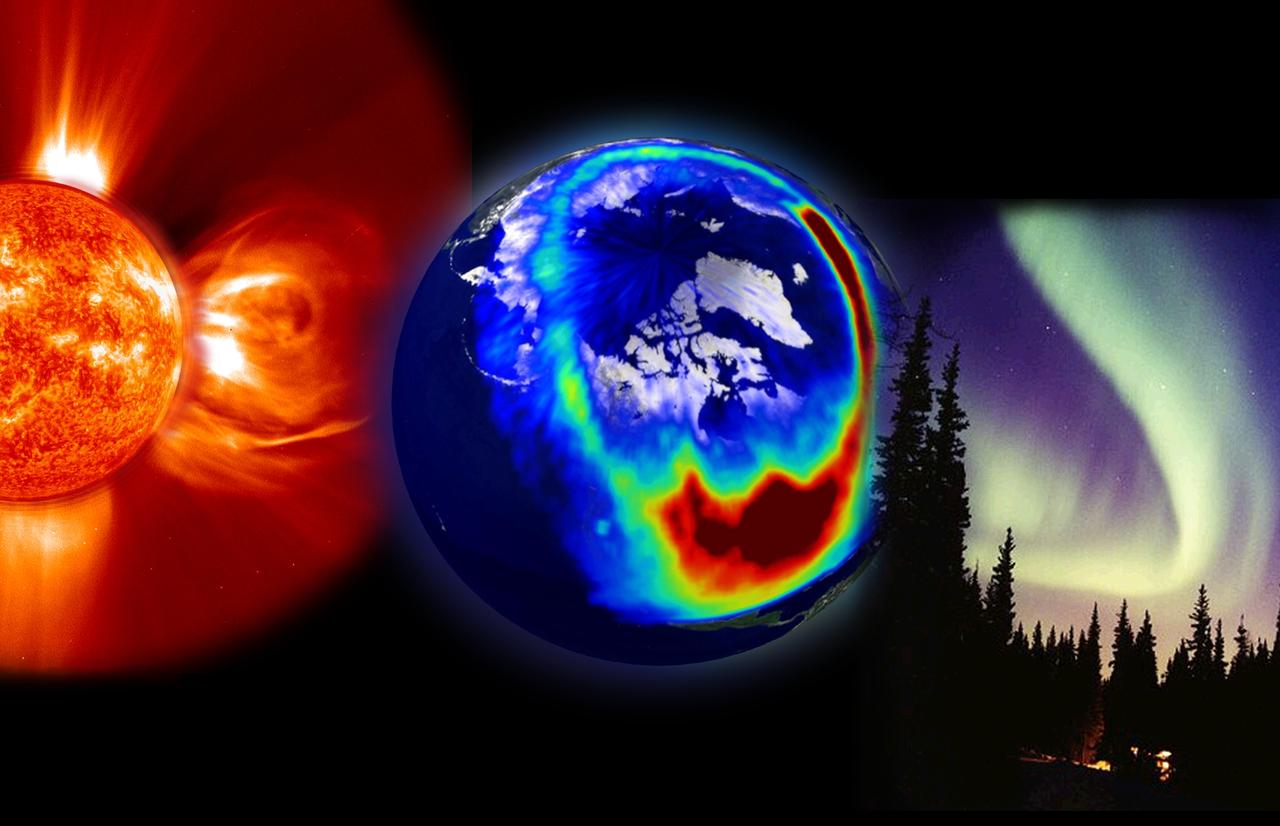
This composite image presents the three most visible elements of space weather: a storm from the Sun, aurora as seen from space, and aurora as seen from the Earth. The solar storm is a corona mass ejection (CME) composite from EIT 304Å superimposed on a LASCO C2 image, both from SOHO. The middle image from Polar’s VIS imager shows charged particles as they spread down across the U.S. during a large solar storm event on July 14, 2000. Lastly, Jan Curtis took this image of an aurora display in Alaska, the visible evidence of space weather that we see here on Earth. Credit: NASA/GSFC/SOHO/ESA To learn more go to the SOHO website: <a href="http://sohowww.nascom.nasa.gov/home.html" rel="nofollow">sohowww.nascom.nasa.gov/home.html</a> To learn more about NASA's Sun Earth Day go here: <a href="http://sunearthday.nasa.gov/2010/index.php" rel="nofollow">sunearthday.nasa.gov/2010/index.php</a>
This radar image of Salt Lake City, Utah, illustrates the different land use patterns that are present in the Utah Valley. Salt Lake City lies between the shores of the Great Salt Lake (the dark area on the left side of the image) and the Wasatch Front Range (the mountains in the upper half of the image). The Salt Lake City area is of great interest to urban planners because of the combination of lake, valley and alpine environments that coexist in the region. Much of the southern shore of the Great Salt Lake is a waterfowl management area. The green grid pattern in the right center of the image is Salt Lake City and its surrounding communities. The Salt Lake City airport is visible as the brown rectangle near the center of the image. Interstate Highway 15 runs from the middle right edge to the upper left of the image. The bright white patch east of Interstate 15 is the downtown area, including Temple Square and the state capitol. The University of Utah campus is the yellowish area that lies at the base of the mountains, east of Temple Square. The large reservoir in the lower left center is a mine tailings pond. The semi-circular feature in the mountains at the bottom edge of the image is the Kennecott Copper Mine. The area shown is 60 kilometers by 40 kilometers (37 miles by 25 miles) and is centered at 40.6 degrees north latitude, 112.0 degrees west longitude. North is toward the upper left. This image was acquired by the Spaceborne Imaging Radar-C/X-Band Synthetic Aperture Radar (SIR-C/X-SAR) aboard the space shuttle Endeavour on April 10, 1994. The colors in this image represent the following radar channels and polarizations: red is L-band, horizontally transmitted and received; green is L-band, horizontally transmitted and vertically received; and blue is C-band, horizontally transmitted and vertically received. SIR-C/X-SAR, a joint mission of the German, Italian and United States space agencies, is part of NASA's Mission to Planet Earth program. http://photojournal.jpl.nasa.gov/catalog/PIA01798

This satellite interferometric synthetic aperture radar image using COSMO-SkyMed radar data, depicts the relative deformation of Earth surface at Kilauea between Feb. 11, 2011 and March 7, 2011 two days following the start of the current eruption.
This spaceborne radar image shows part of the Mojave Desert in the vicinity of Barstow, California and reveals evidence of human activities in the arid environment of the southern California deserts.
This spaceborne radar image shows a segment of the Columbia River as it passes through the area of Wenatchee, Washington, about 220 kilometers 136 miles east of Seattle.
This is a false-color radar image of Central Africa, showing the Virunga Volcano chain along the borders of Rwanda, Zaire and Uganda. This area is home to the endangered mountain gorillas. This C-band L-band image was acquired on April 12, 1994, on orbit 58 of space shuttle Endeavour by the Spaceborne Imaging Radar-C/X-band Synthetic Aperture Radar (SIR-C/X-SAR). The area is centered at about 1.75 degrees south latitude and 29.5 degrees east longitude. The image covers an area 58 kilometers by 178 kilometers (48 miles by 178 miles). The false-color composite is created by displaying the L-band HH return in red, the L-band HV return in green and the C-band HH return in blue. The dark area in the bottom of the image is Lake Kivu, which forms the border between Zaire (to the left) and Rwanda (to the right). The airport at Goma, Zaire is shown as a dark line just above the lake in the bottom left corner of the image. Volcanic flows from the 1977 eruption of Mt. Nyiragongo are shown just north of the airport. Mt. Nyiragongo is not visible in this image because it is located just to the left of the image swath. Very fluid lava flows from the 1977 eruption killed 70 people. http://photojournal.jpl.nasa.gov/catalog/PIA01724
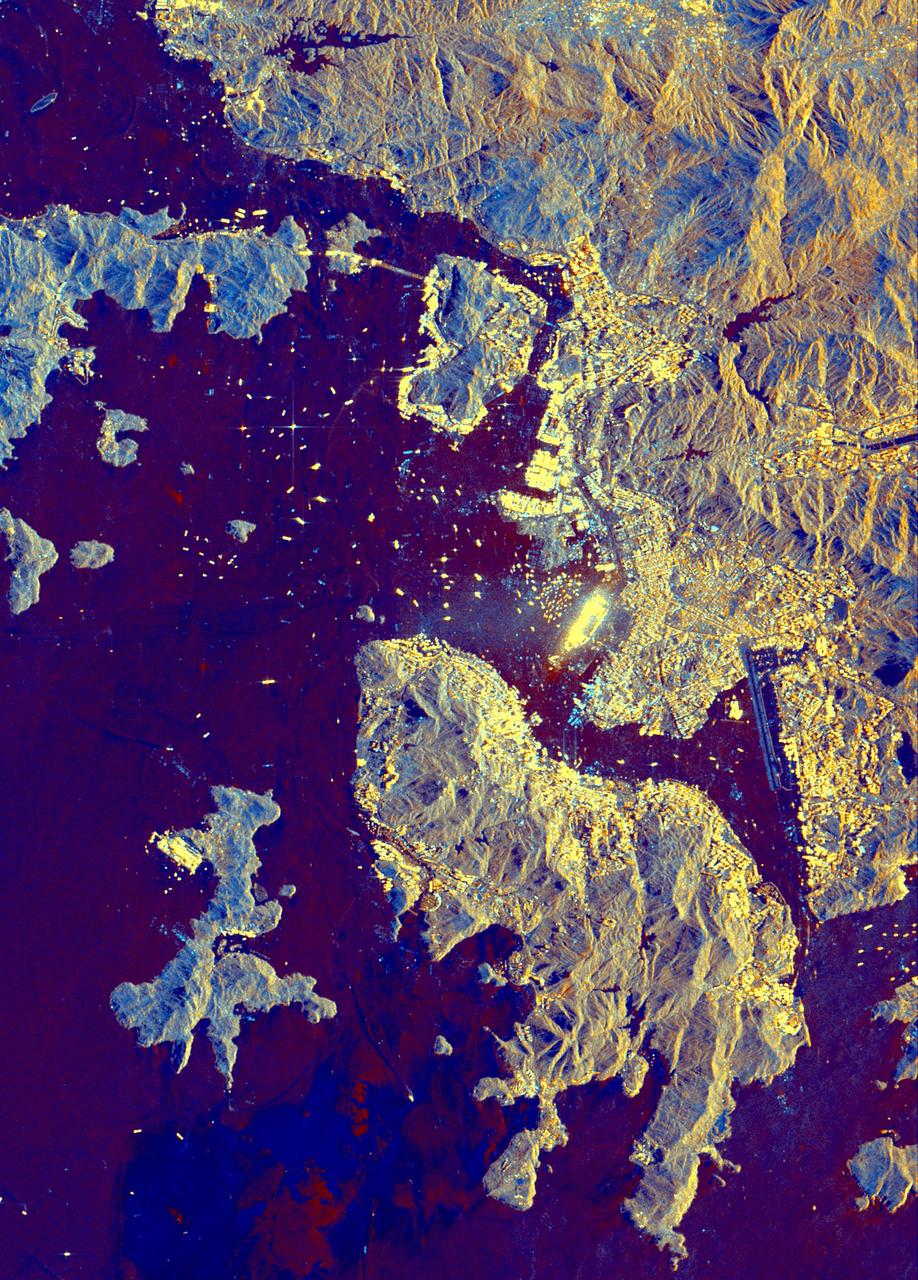
This is an X-SAR image spanning an area of approximately 20 kilometers by 40 kilometers (12 miles by 25 miles) of the island of Hong Kong, the Kowloon Peninsula and the new territories in southern China, taken by the imaging radar on board the space shuttle Endeavour on October 4, 1994. North is toward the top left corner of the image. The Kaitak Airport runway on Kowloon Peninsula (center right of image) was built on reclaimed land and extends almost 3 kilometers (nearly 2 miles) into Victoria Harbor. To the south of the harbor lies the island of Hong Kong. The bright areas around the harbor are the major residential and business districts. Housing more than six million residents, Hong Kong is the most densely populated area in the world. The large number of objects visible in the harbor and surrounding waters are a variety of sea-going vessels, anchored in one of the busiest seaports in the Far East. http://photojournal.jpl.nasa.gov/catalog/PIA01750
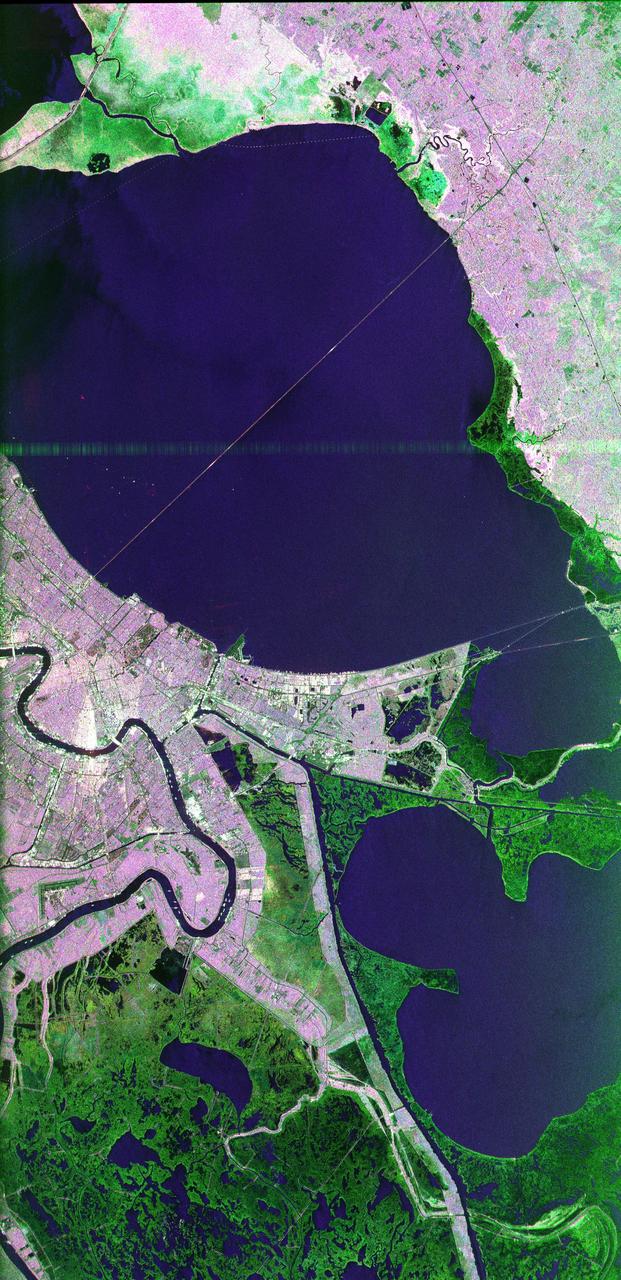
This image of the area surrounding the city of New Orleans, Louisiana in the southeastern United States demonstrates the ability of multi-frequency imaging radar to distinguish different types of land cover. The dark area in the center is Lake Pontchartrain. The thin line running across the lake is a causeway connecting New Orleans to the city of Mandeville. Lake Borgne is the dark area in the lower right of the image. The Mississippi River appears as a dark, wavy line in the lower left. The white dots on the Mississippi are ships. The French Quarter is the brownish square near the left center of the image. Lakefront Airport, a field used mostly for general aviation, is the bright spot near the center, jutting out into Lake Pontchartrain. The image was acquired by the Spaceborne Imaging Radar C/X-Band Synthetic Aperture Radar (SIR-C/X-SAR) during orbit 39 of space shuttle Endeavour on October 2, 1994. The area is located at 30.10 degrees north latitude and 89.1 degrees west longitude. The area shown is approximately 100 kilometers (60 miles) by 50 kilometers (30 miles). The colors in this image were obtained using the following radar channels: red represents the L-band (horizontally transmitted and received); green represents the C-band (horizontally transmitted and received); blue represents the L-band (vertically transmitted and received). The green areas are primarily vegetation consisting of swamp land and swamp forest (bayou) growing on sandy soil, while the pink areas are associated with reflections from buildings in urban and suburban areas. Different tones and colors in the vegetation areas will be studied by scientists to see how effective imaging radar data is in discriminating between different types of wetlands. Accurate maps of coastal wetland areas are important to ecologists studying wild fowl and the coastal environment. http://photojournal.jpl.nasa.gov/catalog/PIA01300
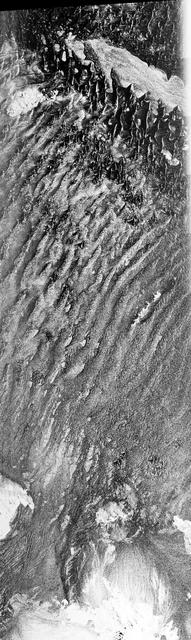
This is a C-band, VV polarization radar image of the Namib desert in southern Namibia, near the coast of South West Africa. The image is centered at about 25 degrees South latitude, 15.5 degrees East longitude. This image was one of the first acquired by the Spaceborne Imaging Radar-C/X-Band Synthetic Aperture Radar (SIR-C/X-SAR) when it was taken on orbit 4 from the shuttle Endeavour on April 9, 1994. The area shown is approximately 78 kilometers by 20 kilometers. The dominant features in the image are complex sand dune patterns formed by the prevailing winds in this part of the Namib desert. The Namib desert is an extremely dry area formed largely because of the influence of the cold Benguela ocean current that flows northward along the coast of Namibia. The bright areas at the bottom of the image are exposed outcrops of Precambrian rocks. This extremely barren area is a region rich in diamonds that through the centuries have washed down from the mountains. The town of Luderitz is located just to the south of the area shown. http://photojournal.jpl.nasa.gov/catalog/PIA01720
This is a digital elevation model that was geometrically coded directly onto an X-band seasonal change image of the Oetztal supersite in Austria. The image is centered at 46.82 degrees north latitude and 10.79 degrees east longitude. This image is located in the Central Alps at the border between Switzerland, Italy and Austria, 50 kilometers (31 miles) southwest of Innsbruck. It was acquired by the Spaceborne Imaging Radar-C/X-band Synthetic Aperture aboard the space shuttle Endeavour on April 14, 1994 and on October 5, 1994. It was produced by combining data from these two different data sets. Data obtained in April is green; data obtained in October appears in red and blue, and was used as an enhancement based on the ratio of the two data sets. Areas with a decrease in backscatter from April to October appear in light blue (cyan), such as the large Gepatschferner glacier seen at the left of the image center, and most of the other glaciers in this view. A light blue hue is also visible at the east border of the dark blue Lake Reschensee at the upper left side. This shows a significant rise in the water level. Magenta represents areas with an increase of backscatter from April 10 to October 5. Yellow indicates areas with high radar signal response during both passes, such as the mountain slopes facing the radar. Low radar backscatter signals refer to smooth surface (lakes) or radar grazing areas to radar shadow areas, seen in the southeast slopes. The area is approximately 29 kilometers by 21 kilometers (18 miles by 13.5 miles). The summit of the main peaks reaches elevations of 3,500 to 3,768 meters (xx feet to xx feet) above sea level. The test site's core area is the glacier region of Venter Valley, which is one of the most intensively studied areas for glacier research in the world. Research in Venter Valley (below center) includes studies of glacier dynamics, glacier-climate regions, snowpack conditions and glacier hydrology. About 25 percent of the core test site is covered by glaciers. Corner reflectors are set up for calibration. Five corner reflectors can be seen on the Gepatschferner and two can be seen on the Vernagtferner. http://photojournal.jpl.nasa.gov/catalog/PIA01760
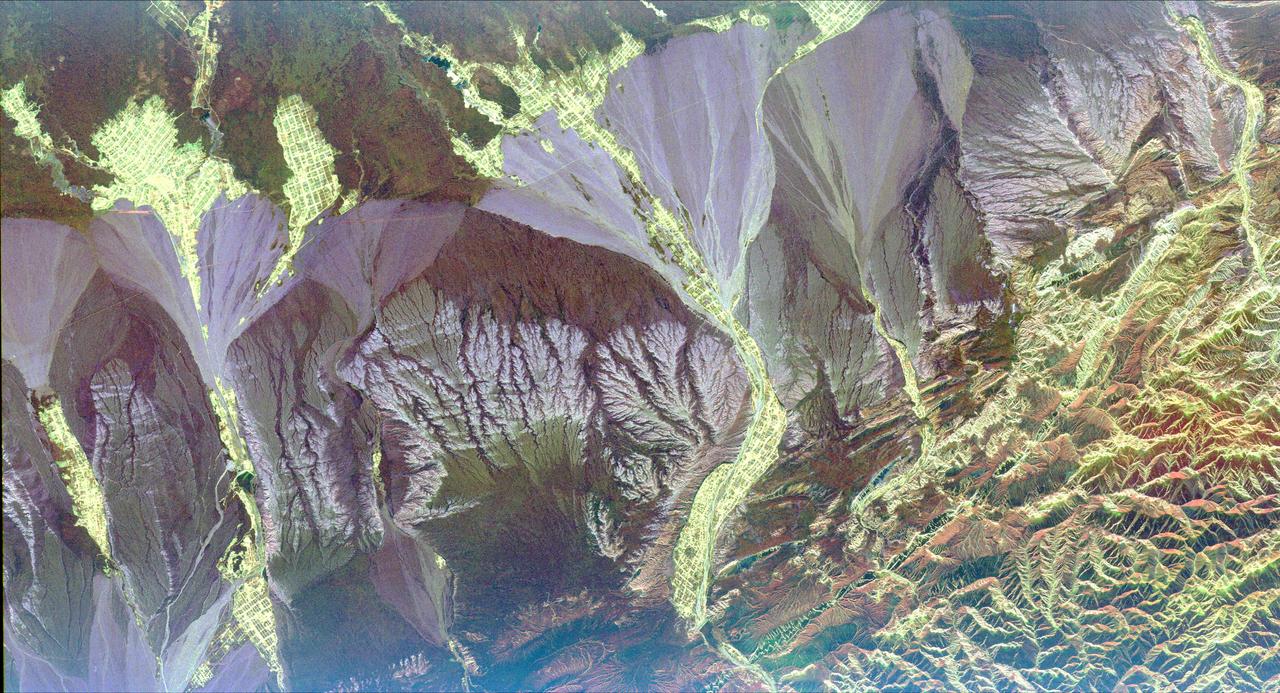
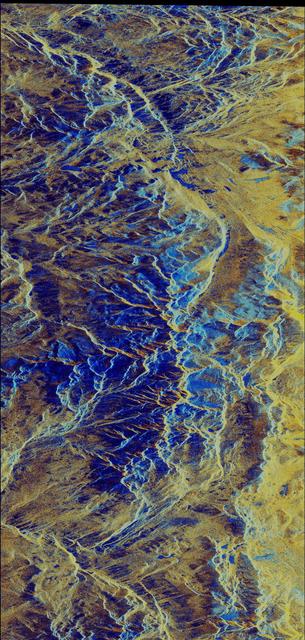
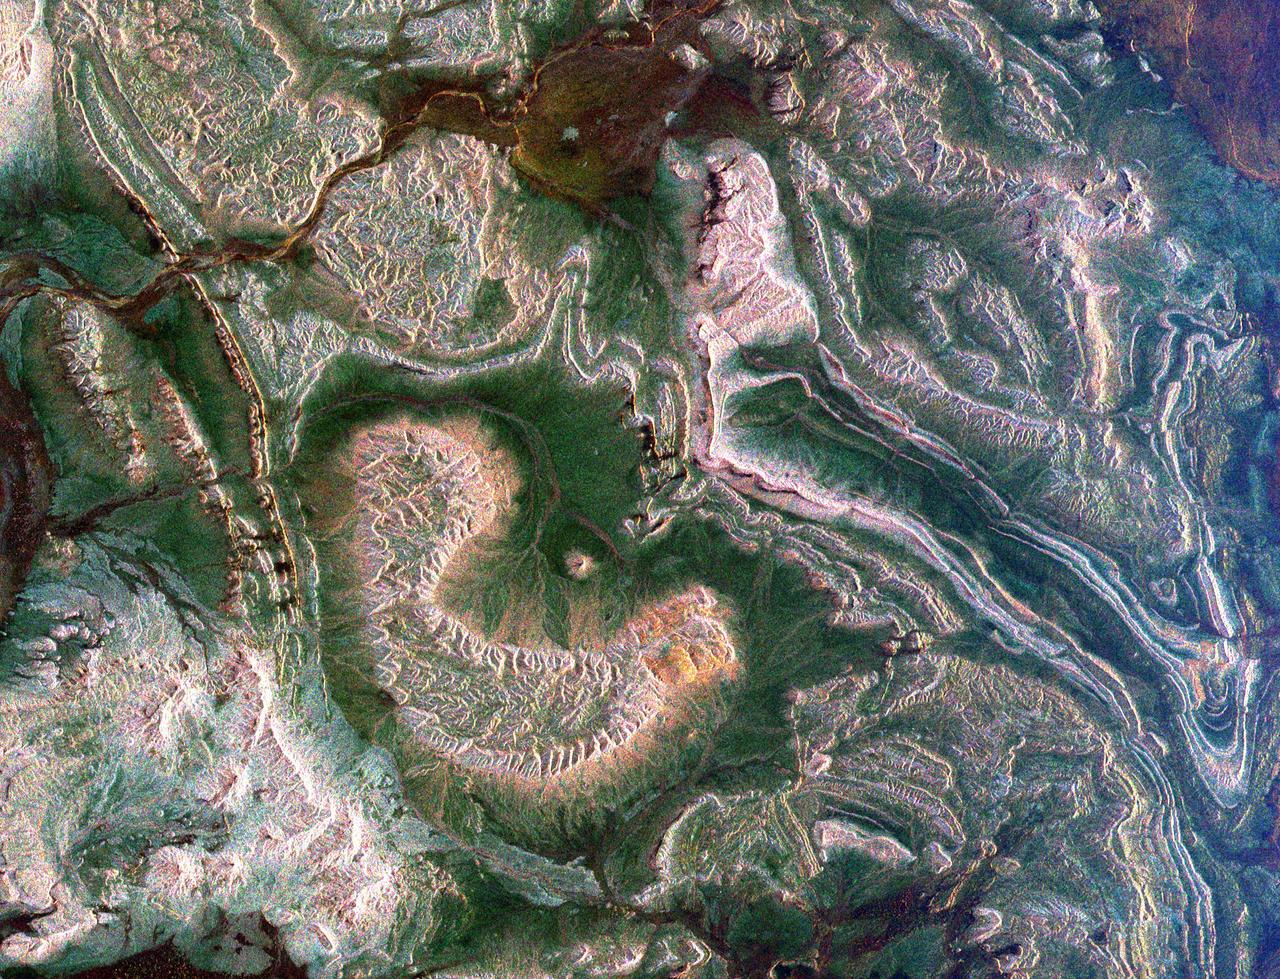
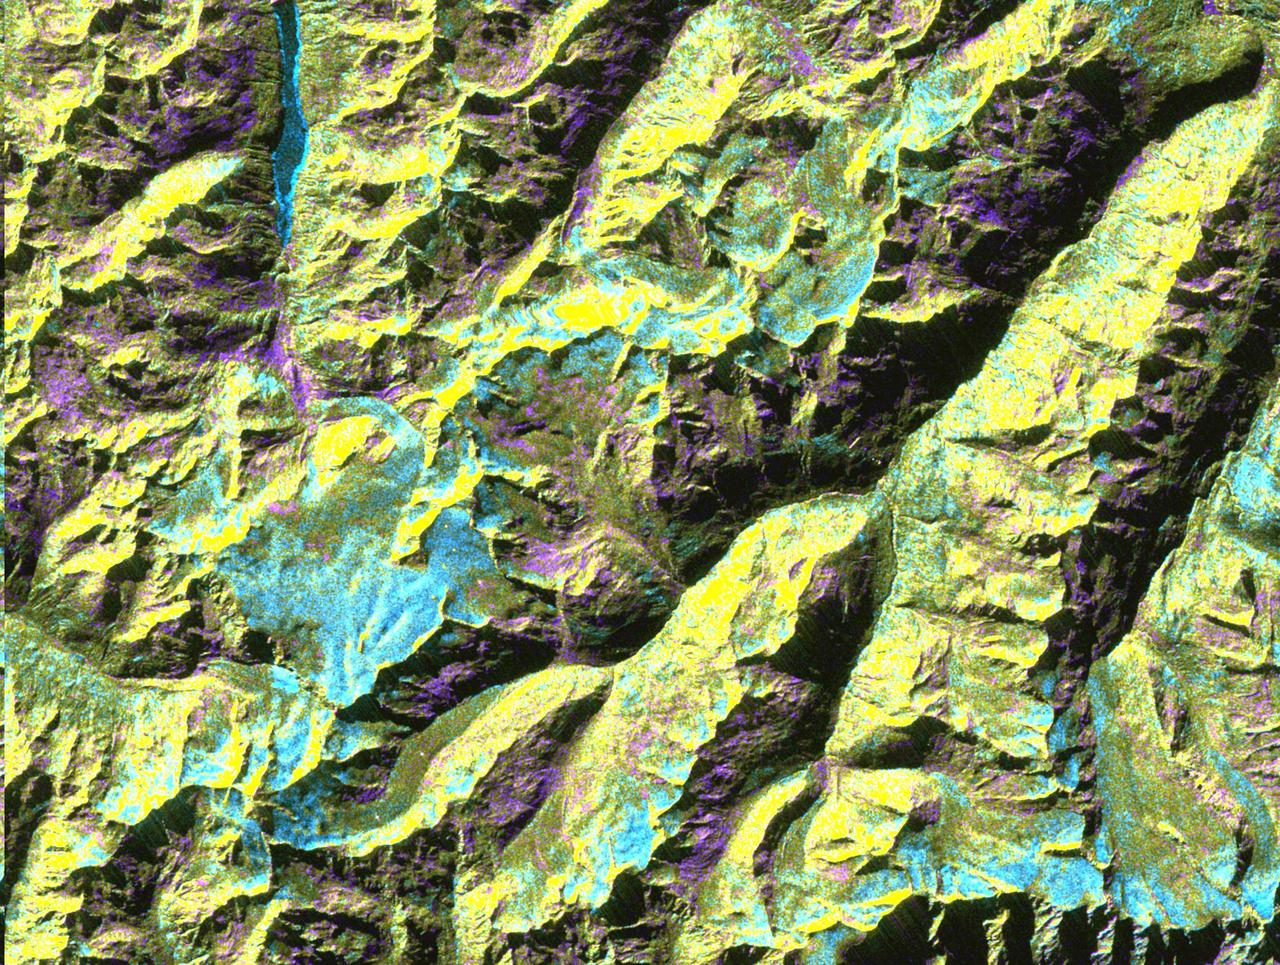
This radar image is centered near the small town of Pishan in northwest China, about 280 km (174 miles) southeast of the city of Kashgar along the ancient Silk Route in the Taklamakan desert of the Xinjiang Province. Geologists are using this radar image as a map to study past climate changes and tectonics of the area. The irregular lavender branching patterns in the center of the image are the remains of ancient alluvial fans, gravel deposits that have accumulated at the base of the mountains during times of wetter climate. The subtle striped pattern cutting across the ancient fans are caused by thrusting of the Kun Lun Mountains north. This motion is caused by the continuing plate-tectonic collision of India with Asia. Modern fans show up as large lavender triangles above the ancient fan deposits. Yellow areas on the modern fans are vegetated oases. The gridded pattern results from the alignment of poplar trees that have been planted as wind breaks. The reservoir at the top of the image is part of a sophisticated irrigation system that supplies water to the oases. This image was acquired by the Spaceborne Imaging Radar-C/X-band Synthetic Aperture Radar (SIR-C/X-SAR) aboard the space shuttle Endeavour in April 1994. This image is centered at 37.4 degrees north latitude, 78.3 degrees east longitude and shows an area approximately 50 km by 100 km (31 miles by 62 miles). The colors are assigned to different frequencies and polarizations of the radar as follows: Red is L-band horizontally transmitted, horizontally received; green is L-band horizontally transmitted, vertically received; and blue is C-band horizontally transmitted and vertically received. SIR-C/X-SAR, a joint mission of the German, Italian, and the United States space agencies, is part of NASA's Mission to Planet Earth. http://photojournal.jpl.nasa.gov/catalog/PIA01796
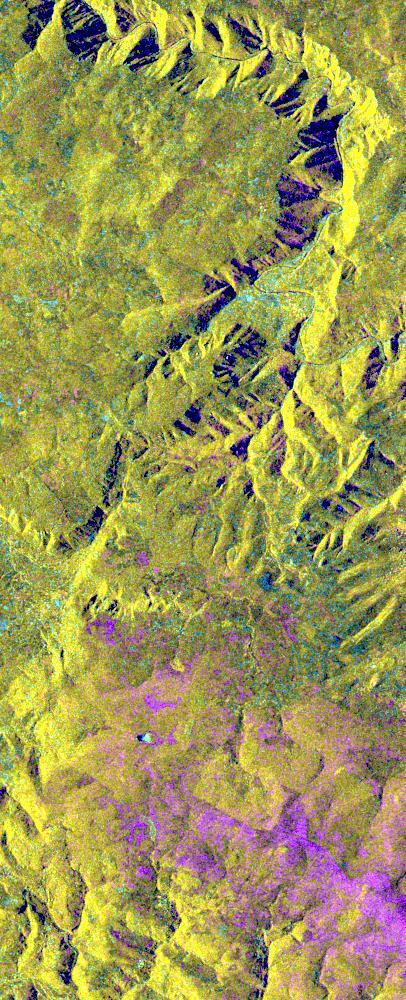
This is an X-band seasonal image of the central part of Lozere Departement situated south of the Massif Central in France. The image is 10 kilometers by 25 kilometers (6 miles by 15.5 miles) and is centered at approximately 44.3 degrees north latitude and 3 degrees east longitude. This image was acquired by the Spaceborne Imaging Radar-C/X-band Synthetic Aperture Radar aboard the space shuttle Endeavour on April 15, 1994 and on October 6, 1994. The image channels have the following color assignments: red was acquired in April; green was acquired in October; and blue is the ratio of the two data sets combined. Seasonal differences in the vegetation are visible in pink, which are heaths growing in the spring. This research area features two large limestone plateaus cut by the famous Gorges du Tarn, standing in parallel with the granite mountain range known as the Cevennes Mountains nearby. Land-use consists mainly of grasslands, heaths and forests. Forest types seen in the images are Austrian pines,Scots pines, spruce, fir and beech trees. Most forests were planted at the end of the 19th century through a national reforestation program aimed at reducing the strong erosion risks in these areas. This program was so successful that today the forests are exploited for forest pulpwood and sawlogs, but also remain protected as conservation regions. The study being performed in this area will assess the potential of spaceborne radar remote sensing for temperate forest type mapping and forest resource monitoring. The combination of X-band SAR data with lower frequency data (such as the SIR-C L-band data) allows scientists to distinguish forest tree species and biomass, or areas of ground vegetation. The lessons learned from the radar images of these controlled forest regions can be applied to larger areas and naturally grown forests to help ecologists protect and maintain them. The SIR-C/X-SAR images will be investigated by scientists from the remote sensing laboratory Cemagref in Montpellier and the National Forestry Board in Mende, France. http://photojournal.jpl.nasa.gov/catalog/PIA01755
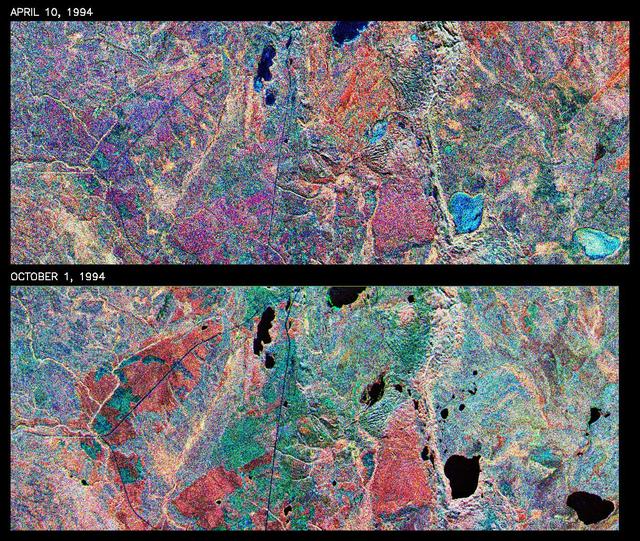
This is a comparison of images over Prince Albert, produced by NASA Spaceborne Imaging Radar-C and X-band Synthetic Aperture Radar aboard the space shuttle Endeavour on its 20th orbit on April 10, 1994. The area is centered at 53.91 degrees north latitude and 104.69 degrees west longitude and is located 40 kilometers (25 miles) north and 30 kilometers (18.5 miles) east of the town of Prince Albert in the Saskatchewan province of Canada. The image covers the area east of Candle Lake, between the gravel highway of 120 and west of highway 106. The area imaged is near the southern limit of the boreal forest. The boreal forest of North America is a continuous vegetation belt at high latitudes stretching across the continent from the Atlantic shoreline of central Labrador and then westward across Canada to the interior mountains and central coastal plains of Alaska. The forest is also part of a larger northern hemisphere circumpolar boreal forest belt. Coniferous trees dominate the entire forest but deciduous trees are also present. During the month of April, the forest experiences seasonal changes from a frozen condition to a thawed condition. The trees are completely frozen over the winter season and the forest floor is covered by snow. As the average temperature rises in the spring, the trees are thawed and the snow melts. This transition has an impact on the rate of moisture evaporation and release of carbon dioxide into the atmosphere. In late September and early October, the boreal forest experiences a relatively different seasonal change. At this time, the leaves on deciduous trees start changing color and dropping off. The soil and trees are quite often moist due to frequent rainfall and cloud cover. The evaporation of moisture and carbon dioxide into the atmosphere also diminishes at this time. SIR-C/X-SAR is sensitive to the moisture of soil and vegetation and can sense this freeze-thaw cycle and the summer-fall seasonal transition over forested areas in particular. Optical sensors, by contrast, are blind to these regions, which are perpetually obscured by thick cloud cover. These changes were detected by comparing the April and October color composite images of L-band data in red, C-band data in green and X-band (vertically received and transmitted) in blue. The changes in intensity of each color over lakes, various forest stands and clear cuts in the two images is striking. Lakes such as Lake Heiberg, Crabtree Lake and Williams Lake, in the right middle part of the image, are frozen in April (appearing in bright blue) and melted (appearing in black) in October. The higher intensity of blue over lakes in April is due to low penetration of the X-band (vertically received and transmitted) and the radar's high sensitivity to surface features. Forest stands also exhibit major changes between the two images. The red areas in the October image are old jack pine canopies that cause higher return at L-band because of their moist condition in late summer compared to their partially frozen condition in April (in purple). Similarly, in the areas near the middle of the image, where black spruce and mixed aspen and jack pine trees dominate, the contrast between blue in October and red and green in April is an indication that the top of the canopy (needles and branches) were frozen in April and moist in October. The changes due to deforestation by logging companies or natural fires can also be detected by comparing the images. For example, the small blue area near the intersection of Harding Road and Highway 120 is the result of logging which occurred after the April data was acquired. The surface area of clear cut is approximately 4 hectares, which is calculated from the high-resolution capability of the radar images and verified by scientists participating in field work during the mission. http://photojournal.jpl.nasa.gov/catalog/PIA01732
On May 9, 2016, Mercury passed directly between the sun and Earth. This event – which happens about 13 times each century – is called a transit. NASA’s Solar Dynamics Observatory, or SDO, studies the sun 24/7 and captured the entire seven-and-a-half-hour event. This composite image of Mercury’s journey across the sun was created with visible-light images from the Helioseismic and Magnetic Imager on SDO. Image Credit: NASA's Goddard Space Flight Center/SDO/Genna Duberstein <b><a href="http://www.nasa.gov/audience/formedia/features/MP_Photo_Guidelines.html" rel="nofollow">NASA image use policy.</a></b> <b><a href="http://www.nasa.gov/centers/goddard/home/index.html" rel="nofollow">NASA Goddard Space Flight Center</a></b> enables NASA’s mission through four scientific endeavors: Earth Science, Heliophysics, Solar System Exploration, and Astrophysics. Goddard plays a leading role in NASA’s accomplishments by contributing compelling scientific knowledge to advance the Agency’s mission. <b>Follow us on <a href="http://twitter.com/NASAGoddardPix" rel="nofollow">Twitter</a></b> <b>Like us on <a href="http://www.facebook.com/pages/Greenbelt-MD/NASA-Goddard/395013845897?ref=tsd" rel="nofollow">Facebook</a></b> <b>Find us on <a href="http://instagrid.me/nasagoddard/?vm=grid" rel="nofollow">Instagram</a></b>
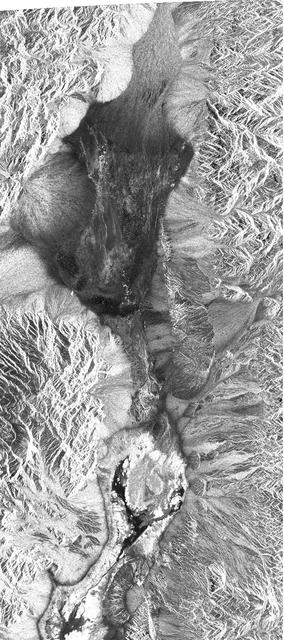
This image shows Death Valley, California, centered at 36.629 degrees north latitude, 117.069 degrees west longitude.
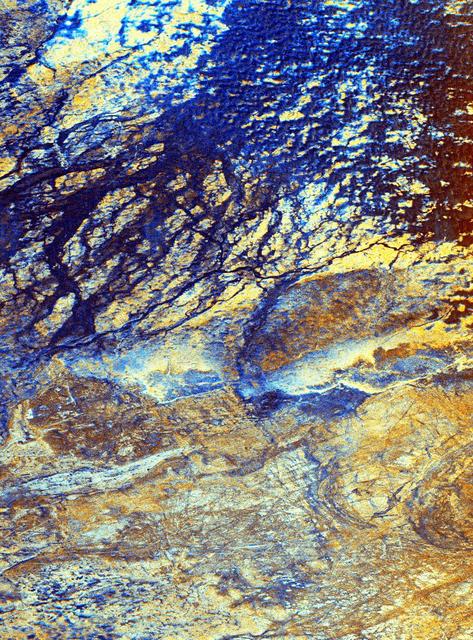
This is a false-color image of the uninhabited Safsaf Oasis in southern Egypt near the Egypt/Sudan border.
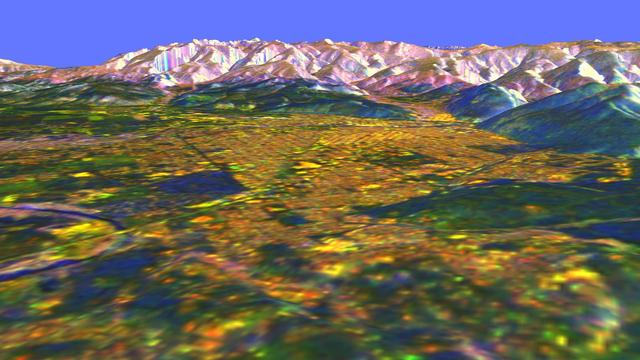
This is a three-dimensional perspective view of Missoula, Montana, created by combining two spaceborne radar images using a technique known as interferometry.
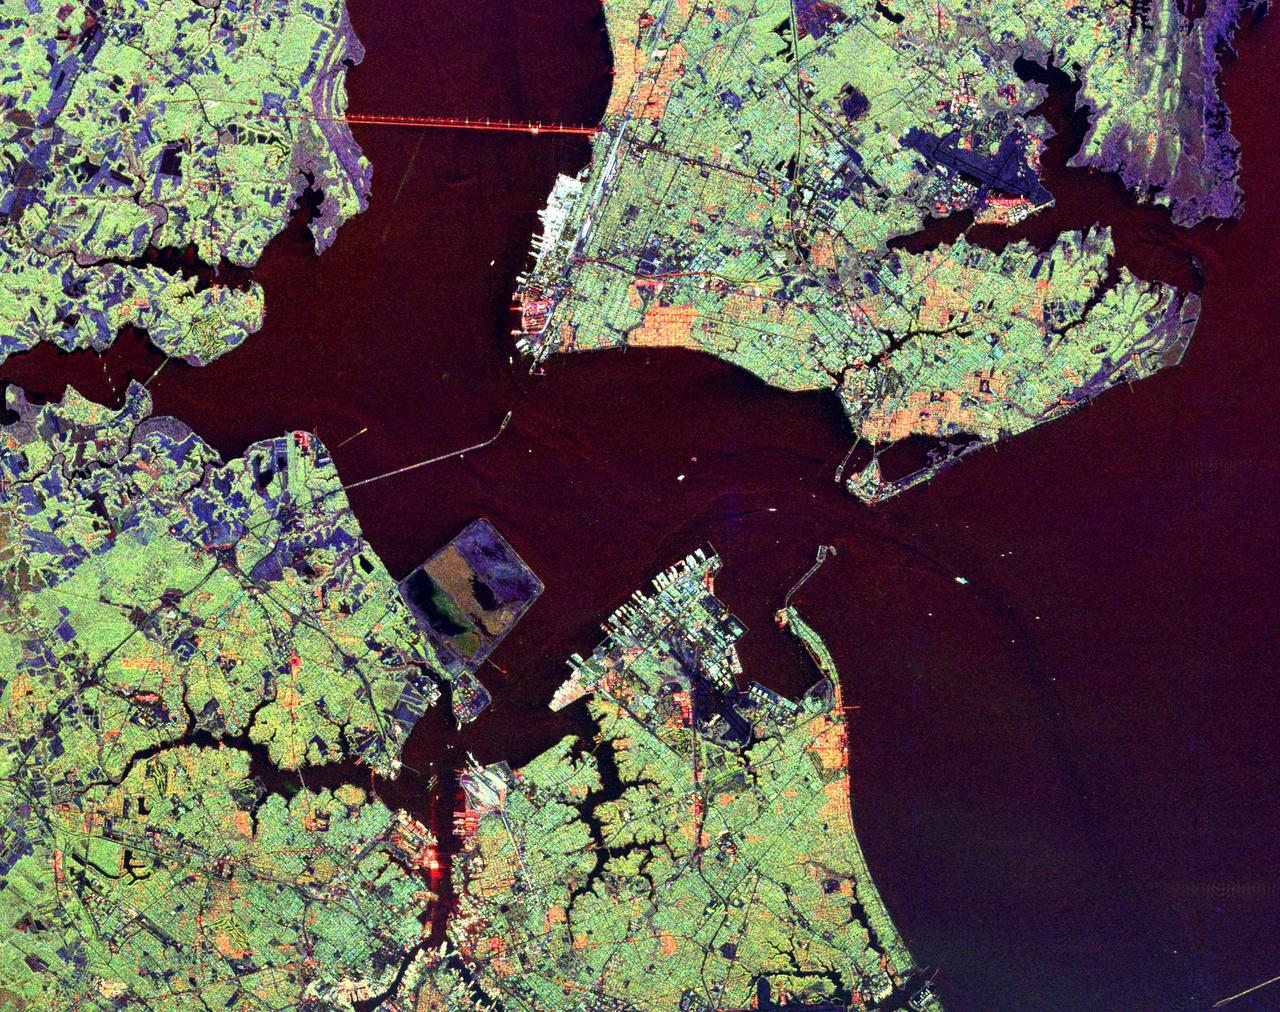
This radar image shows the Hampton Roads, Virginia region, where the James River upper left center flows into the Chesapeake Bay.
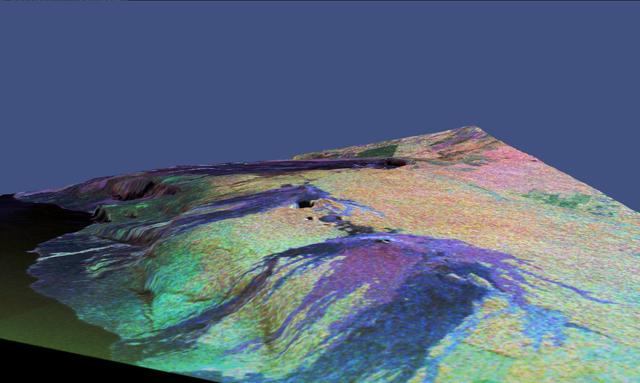
This is a three-dimensional perspective view of a false-color image of the eastern part of the Big Island of Hawaii.
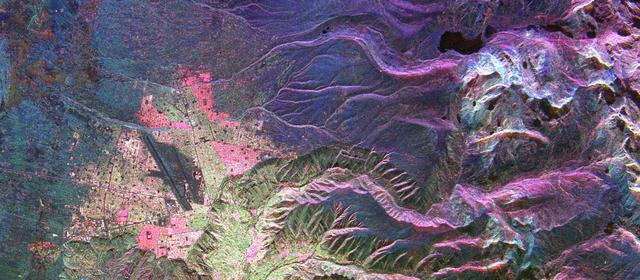
This is an image of the Bolivian capital city of La Paz that was created using three radar frequencies.
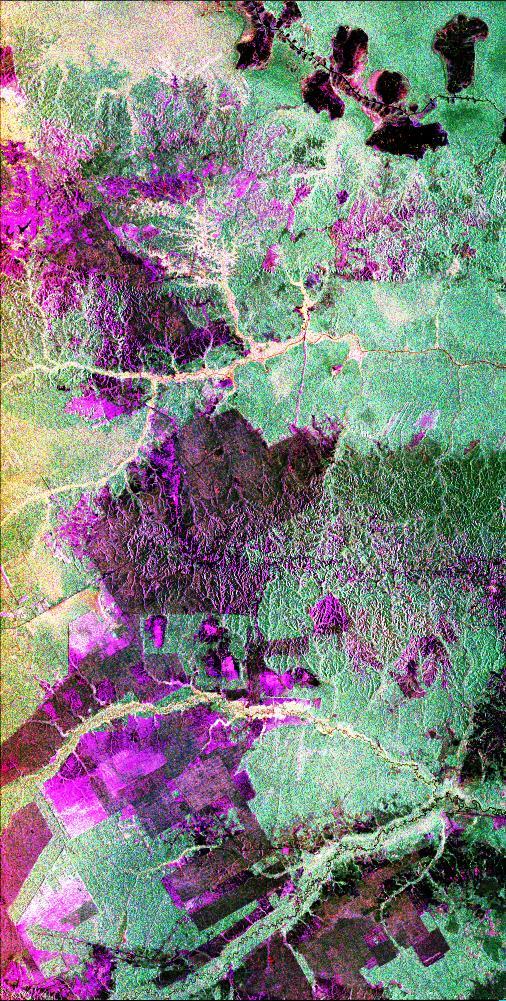
This is a radar image of the central part of the island of Sumatra in Indonesia that shows how the tropical rainforest typical of this country is being impacted by human activity. Native forest appears in green in this image, while prominent pink areas represent places where the native forest has been cleared. The large rectangular areas have been cleared for palm oil plantations. The bright pink zones are areas that have been cleared since 1989, while the dark pink zones are areas that were cleared before 1989. These radar data were processed as part of an effort to assist oil and gas companies working in the area to assess the environmental impact of both their drilling operations and the activities of the local population. Radar images are useful in these areas because heavy cloud cover and the persistent smoke and haze associated with deforestation have prevented usable visible-light imagery from being acquired since 1989. The dark shapes in the upper right (northeast) corner of the image are a chain of lakes in flat coastal marshes. This image was acquired in October 1994 by the Spaceborne Imaging Radar C/X-Band Synthetic Aperture Radar (SIR-C/X-SAR) onboard the space shuttle Endeavour. Environmental changes can be easily documented by comparing this image with visible-light data that were acquired in previous years by the Landsat satellite. The image is centered at 0.9 degrees north latitude and 101.3 degrees east longitude. The area shown is 50 kilometers by 100 kilometers (31 miles by 62 miles). The colors in the image are assigned to different frequencies and polarizations of the radar as follows: red is L-band horizontally transmitted, horizontally received; green is L-band horizontally transmitted, vertically received; blue is L-band vertically transmitted, vertically received. SIR-C/X-SAR, a joint mission of the German, Italian and United States space agencies, is part of NASA's Mission to Planet Earth program. http://photojournal.jpl.nasa.gov/catalog/PIA01797
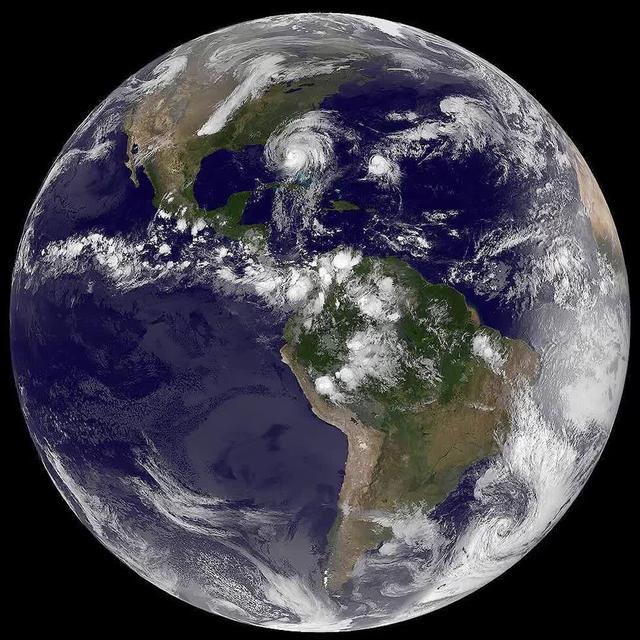
Here are a few of our top images from 2016. To see more great NASA Goddard images be sure to follow us on Instagram at <a href="http://www.instagram.com/nasagoddard" rel="nofollow">www.instagram.com/nasagoddard</a> and also on Twitter at <a href="https://twitter.com/NASAGoddardPix" rel="nofollow">twitter.com/NASAGoddardPix</a>.
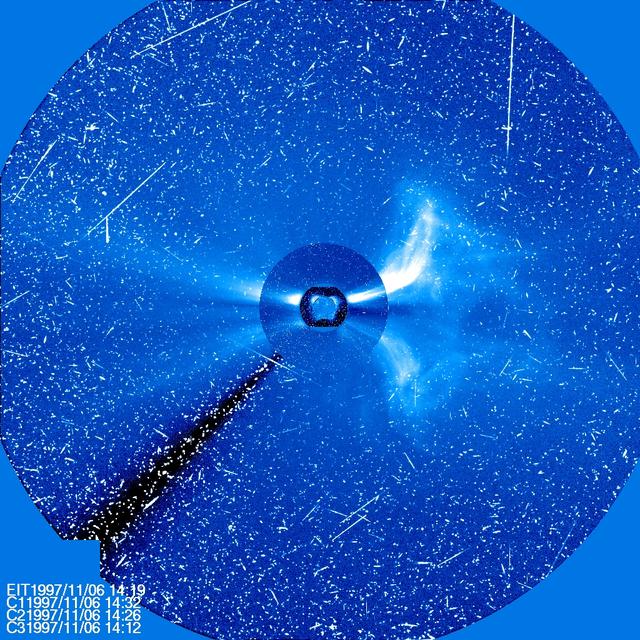
Four different instruments on SOHO show a large CME on Nov. 6, 1997. The sun is at the center, with three coronagraph images of different sizes around it. The streaks of white light are from protons hitting the SOHO cameras producing a snowy effect typical of a significant flare. ..Credit: NASA/SOHO..---..CME WEEK: What To See in CME Images Two main types of explosions occur on the sun: solar flares and coronal mass ejections. Unlike the energy and x-rays produced in a solar flare – which can reach Earth at the speed of light in eight minutes – coronal mass ejections are giant, expanding clouds of solar material that take one to three days to reach Earth. Once at Earth, these ejections, also called CMEs, can impact satellites in space or interfere with radio communications. During CME WEEK from Sept. 22 to 26, 2014, we explore different aspects of these giant eruptions that surge out from the star we live with. When a coronal mass ejection blasts off the sun, scientists rely on instruments called coronagraphs to track their progress. Coronagraphs block out the bright light of the sun, so that the much fainter material in the solar atmosphere -- including CMEs -- can be seen in the surrounding space. CMEs appear in these images as expanding shells of material from the sun's atmosphere -- sometimes a core of colder, solar material (called a filament) from near the sun's surface moves in the center. But mapping out such three-dimensional components from a two-dimensional image isn't easy. Watch the slideshow to find out how scientists interpret what they see in CME pictures. The images in the slideshow are from the three sets of coronagraphs NASA currently has in space. One is on the joint European Space Agency and NASA Solar and Heliospheric Observatory, or SOHO. SOHO launched in 1995, and sits between Earth and the sun about a million miles away from Earth. The other two coronagraphs are on the two spacecraft of the NASA Solar Terrestrial Relations Observatory, or STEREO, mission, which launched in 2006. The two STEREO spacecraft are both currently viewing the far side of the sun. Together these instruments help scientists create a three-dimensional model of any CME as its journey unfolds through interplanetary space. Such information can show why a given characteristic of a CME close to the sun might lead to a given effect near Earth, or any other planet in the solar system...<b><a href="http://www.nasa.gov/audience/formedia/features/MP_Photo_Guidelines.html" rel="nofollow">NASA image use policy.</a></b> <b><a href="http://www.nasa.gov/centers/goddard/home/index.html" rel="nofollow">NASA Goddard Space Flight Center</a></b> enables NASA’s mission through four scientific endeavors: Earth Science, Heliophysics, Solar System Exploration, and Astrophysics. Goddard plays a leading role in NASA’s accomplishments by contributing compelling scientific knowledge to advance the Agency’s mission. <b>Follow us on <a href="http://twitter.com/NASAGoddardPix" rel="nofollow">Twitter</a></b> <b>Like us on <a href="http://www.facebook.com/pages/Greenbelt-MD/NASA-Goddard/395013845897?ref=tsd" rel="nofollow">Facebook</a></b> <b>Find us on <a href="http://instagram.com/nasagoddard?vm=grid" rel="nofollow">Instagram</a></b>
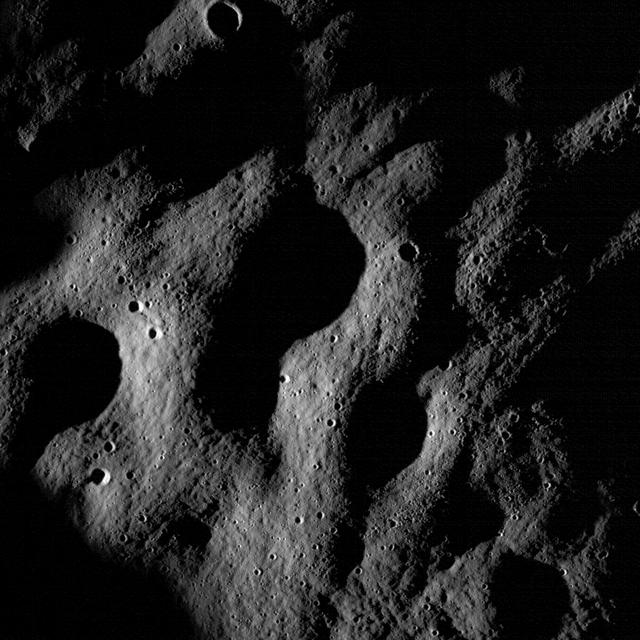
These images show cratered regions near the moon's Mare Nubium region, as photographed by the Lunar Reconnaissance Orbiter's LROC instrument. Each image shows a region 1,400 meters (0.87 miles) wide. the bottoms of both images face lunar north. The image below shows the location of these two images in relation to each other. Credit: NASA/Goddard Space Flight Center/Arizona State University
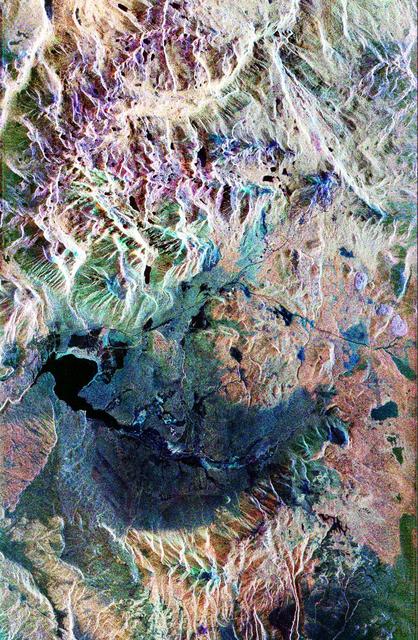
This false-color composite radar image of the Mammoth Mountain area in the Sierra Nevada Mountains, California, was acquired by the Spaceborne Imaging Radar-C and X-band Synthetic Aperture Radar aboard the space shuttle Endeavour on its 67th orbit on October 3, 1994. The image is centered at 37.6 degrees north latitude and 119.0 degrees west longitude. The area is about 39 kilometers by 51 kilometers (24 miles by 31 miles). North is toward the bottom, about 45 degrees to the right. In this image, red was created using L-band (horizontally transmitted/vertically received) polarization data; green was created using C-band (horizontally transmitted/vertically received) polarization data; and blue was created using C-band (horizontally transmitted and received) polarization data. Crawley Lake appears dark at the center left of the image, just above or south of Long Valley. The Mammoth Mountain ski area is visible at the top right of the scene. The red areas correspond to forests, the dark blue areas are bare surfaces and the green areas are short vegetation, mainly brush. The purple areas at the higher elevations in the upper part of the scene are discontinuous patches of snow cover from a September 28 storm. New, very thin snow was falling before and during the second space shuttle pass. In parallel with the operational SIR-C data processing, an experimental effort is being conducted to test SAR data processing using the Jet Propulsion Laboratory's massively parallel supercomputing facility, centered around the Cray Research T3D. These experiments will assess the abilities of large supercomputers to produce high throughput Synthetic Aperture Radar processing in preparation for upcoming data-intensive SAR missions. The image released here was produced as part of this experimental effort. http://photojournal.jpl.nasa.gov/catalog/PIA01746
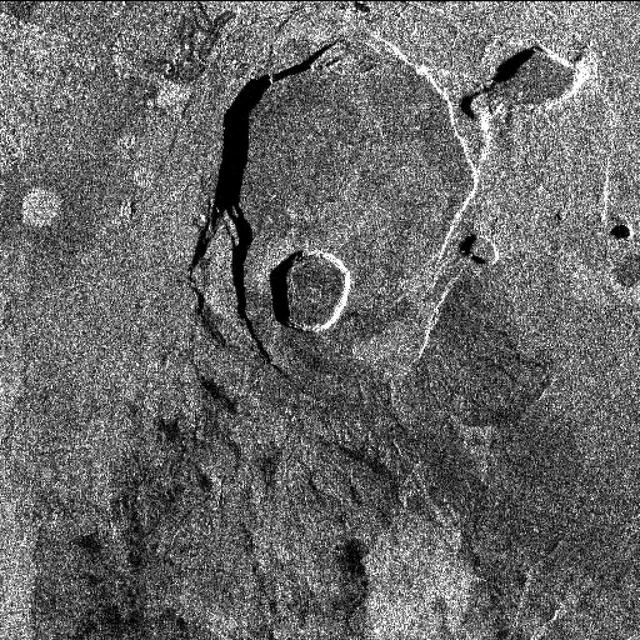
This X-band image of the volcano Kilauea was taken on October 4, 1994, by the Spaceborne Imaging Radar-C/X-band Synthetic Aperture Radar. The area shown is about 9 kilometers by 13 kilometers (5.5 miles by 8 miles) and is centered at about 19.58 degrees north latitude and 155.55 degrees west longitude. This image and a similar image taken during the first flight of the radar instrument on April 13, 1994 were combined to produce the topographic information by means of an interferometric process. This is a process by which radar data acquired on different passes of the space shuttle is overlaid to obtain elevation information. Three additional images are provided showing an overlay of radar data with interferometric fringes; a three-dimensional image based on altitude lines; and, finally, a topographic view of the region. http://photojournal.jpl.nasa.gov/catalog/PIA01763
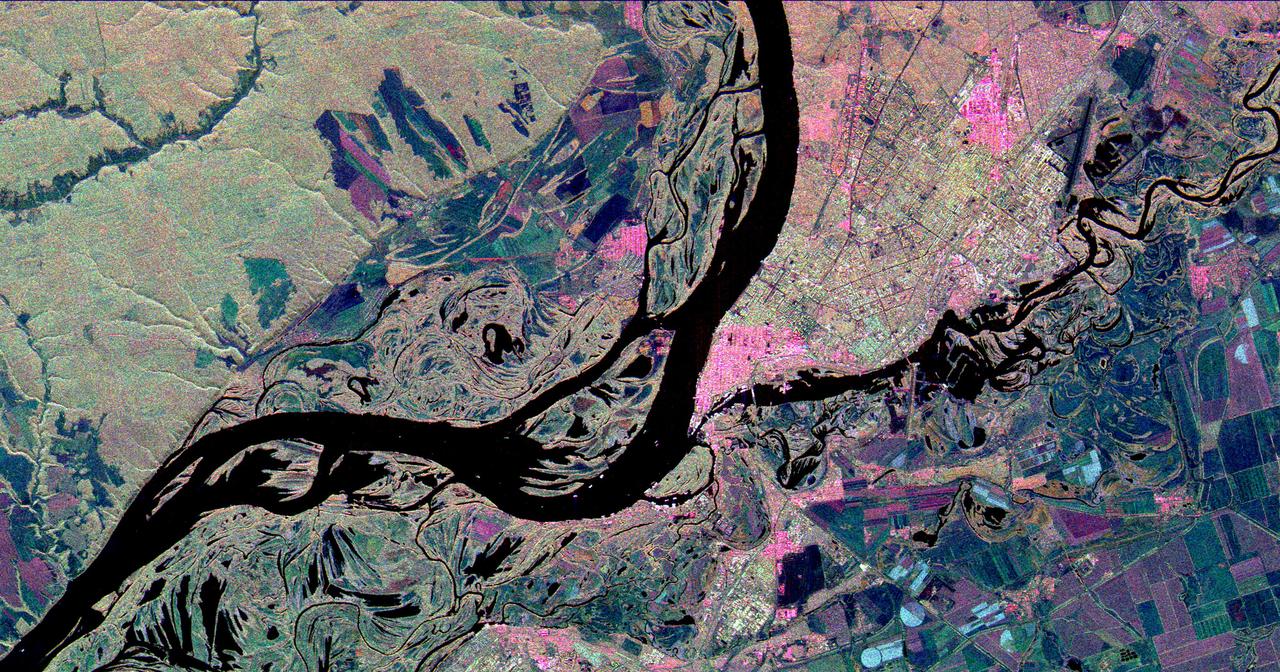
This three-frequency space radar image shows the city of Samara, Russia in pink and light green right of center. Samara is at the junction of the Volga and Samara Rivers approximately 800 kilometers 500 miles southeast of Moscow.
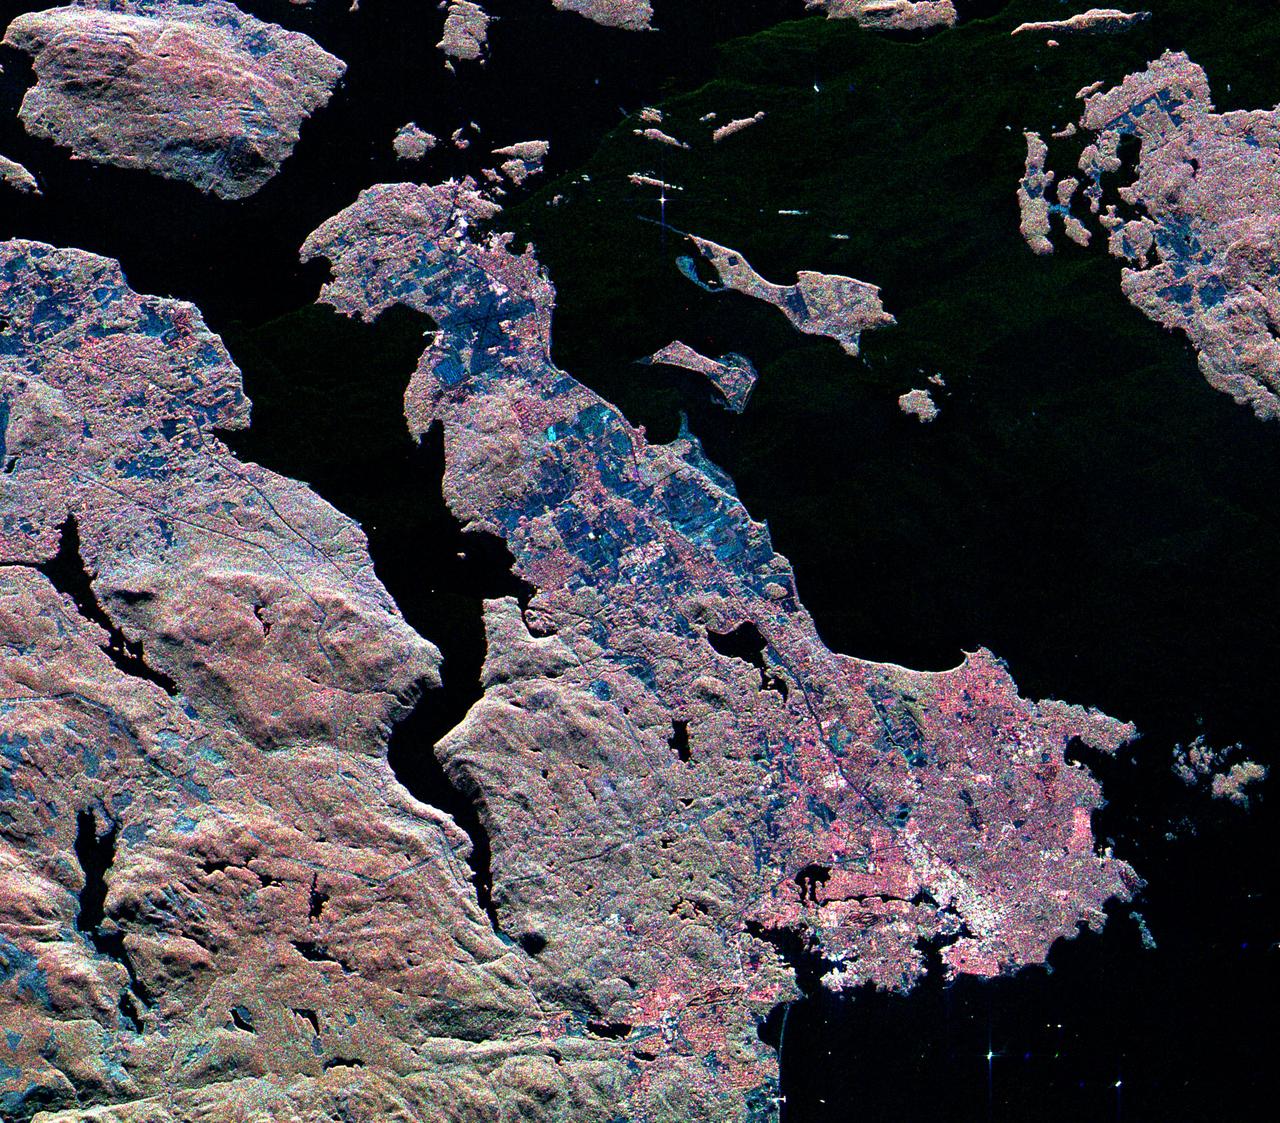
This three-frequency spaceborne radar image shows the southern end of Vancouver Island on the west coast of Canada. The white area in the lower right is the city of Victoria, the capital of the province of British Columbia.
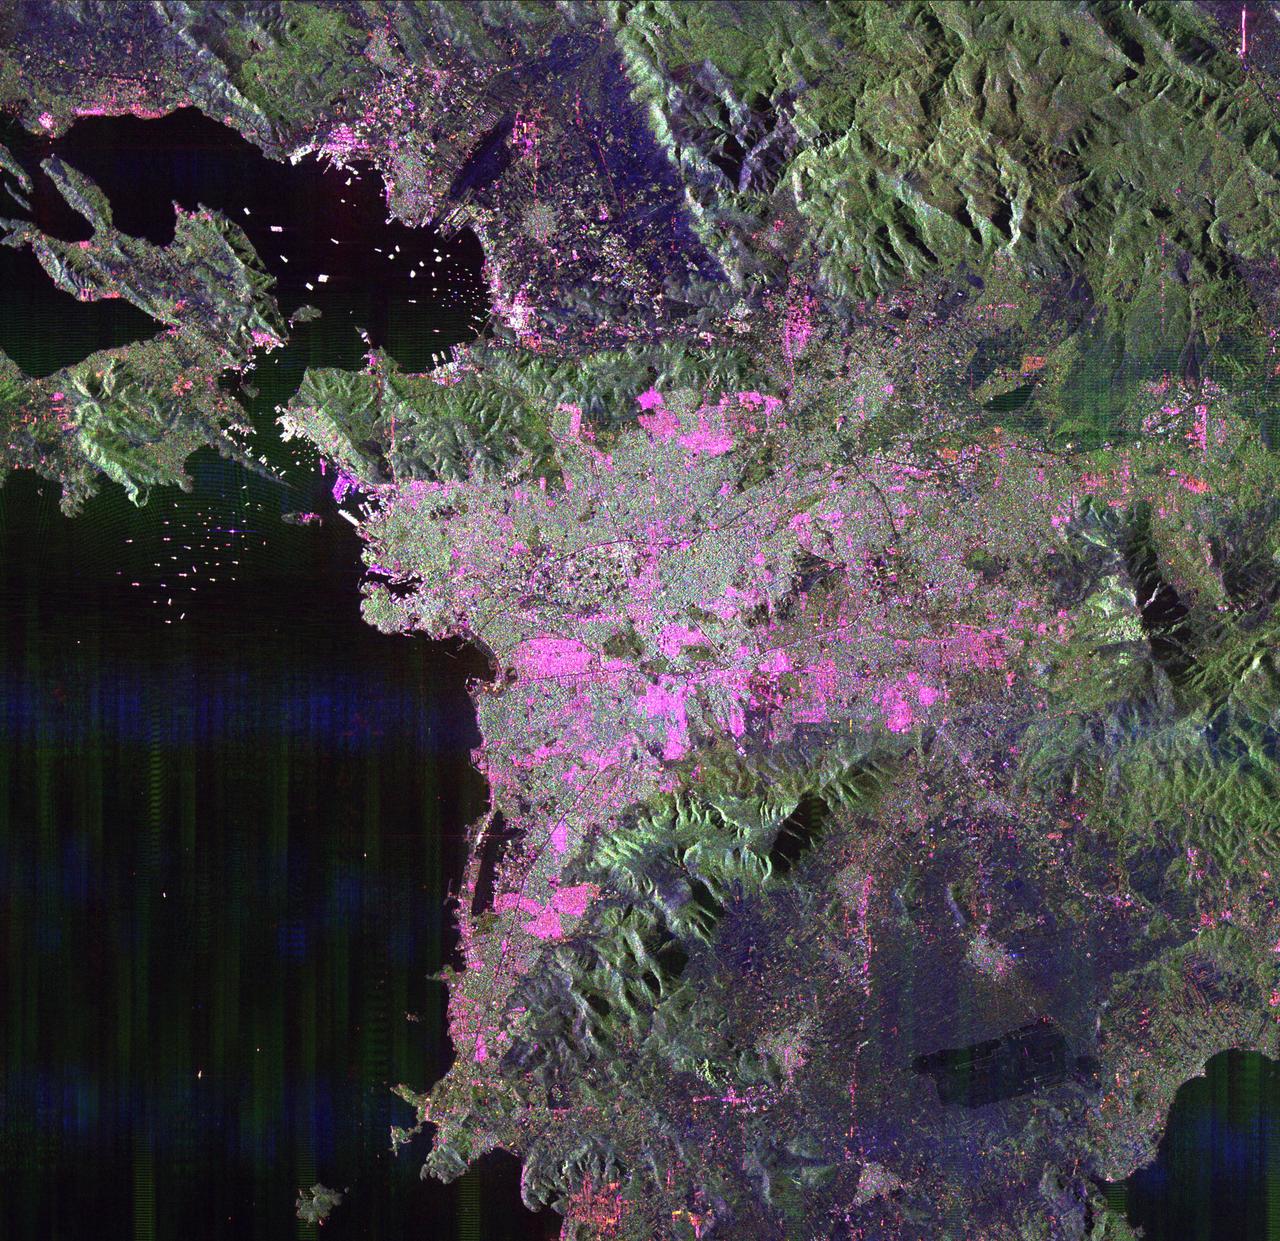
This space radar image of Athens, Greece, shows the sprawling, modern development of this ancient capital city. Densely populated urban areas appear in shades of pink and light green.
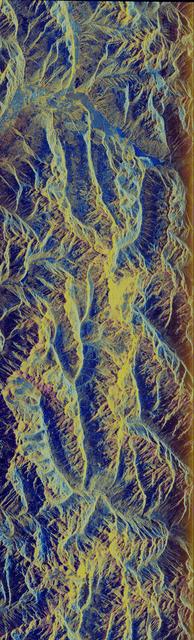
This image is a false-color composite of Oetzal, Austria located in the Central Alps centered at 46.8 degrees north latitude, 10.70 degrees east longitude, at the border between Switzerland top, Italy left and Austria right and bottom.
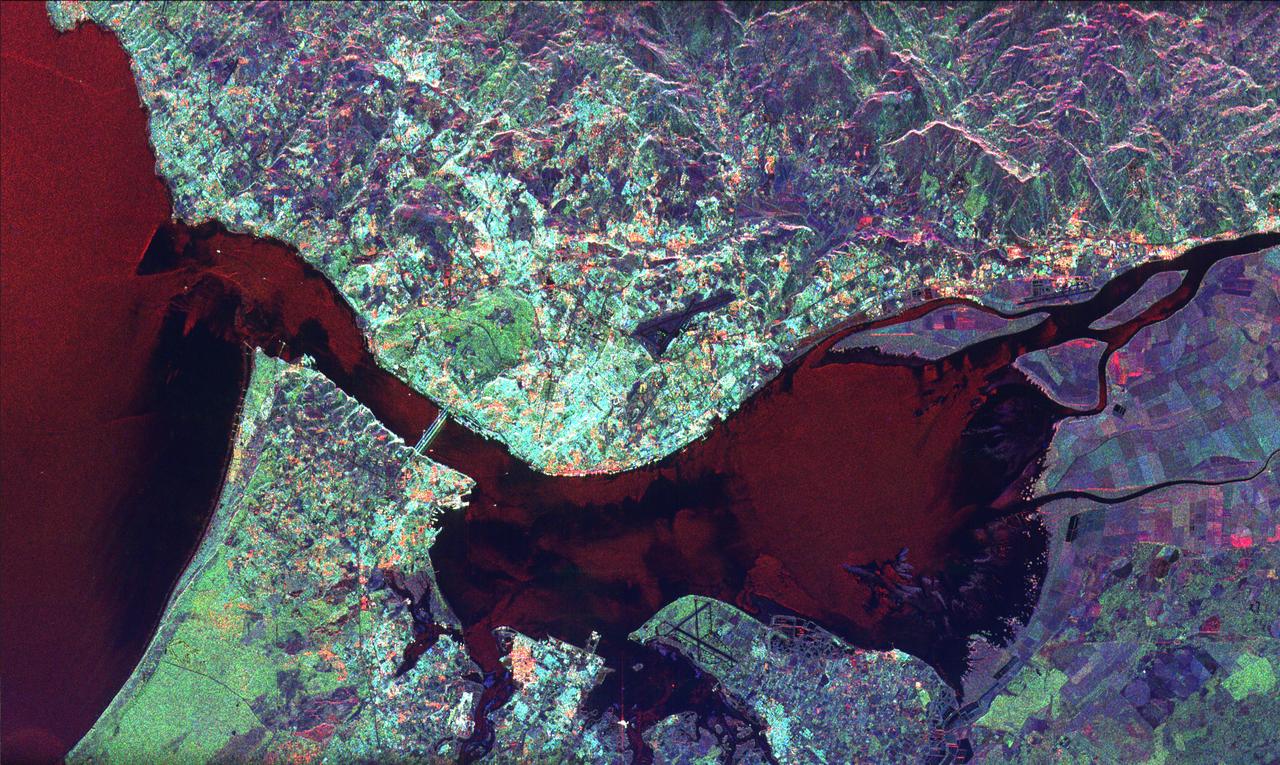
This radar image of Lisbon, Portugal illustrates the different land use patterns that are present in coastal Portugal. Lisbon, the national capital, lies on the north bank of the Rio Tejo where the river enters the Atlantic Ocean.